UNITED STATES
SECURITIES AND EXCHANGE COMMISSION
Washington, D.C. 20549
________________________________________
FORM 10-K
________________________________________ | | | | | |
| ☒ | Annual Report Pursuant to Section 13 or 15(d) of the Securities Exchange Act of 1934 |
For the fiscal year ended December 31, 2024
or | | | | | |
| ☐ | Transition Report Pursuant to Section 13 or 15(d) of the Securities Exchange Act of 1934 |
For the transition period from to
Commission file number 001-12658
ALBEMARLE CORPORATION
(Exact name of registrant as specified in its charter) | | | | | | | | |
| Virginia | | 54-1692118 |
(State or other jurisdiction of
incorporation or organization) | | (I.R.S. Employer
Identification No.) |
4250 Congress Street, Suite 900
Charlotte, North Carolina 28209
(Address of principal executive offices) (Zip Code)
Registrant’s telephone number, including area code: (980) - 299-5700
Securities registered pursuant to Section 12(b) of the Act: | | | | | | | | | | | | | | |
| Title of each class | | Trading Symbol | | Name of each exchange on which registered |
| COMMON STOCK, $.01 Par Value | | ALB | | New York Stock Exchange |
| DEPOSITARY SHARES, each representing a 1/20th interest in a share of 7.25% Series A Mandatory Convertible Preferred Stock | | ALB PR A | | New York Stock Exchange |
Indicate by check mark if the registrant is a well-known seasoned issuer, as defined in Rule 405 of the Securities Act. Yes ☒ No ☐
Indicate by check mark if the registrant is not required to file reports pursuant to Section 13 or Section 15(d) of the Act. Yes ☐ No ☒
Indicate by check mark whether the registrant (1) has filed all reports required to be filed by Section 13 or 15(d) of the Securities Exchange Act of 1934 during the preceding 12 months (or for such shorter period that the registrant was required to file such reports), and (2) has been subject to such filing requirements for at least the past 90 days. Yes ☒ No ☐
Indicate by check mark whether the registrant has submitted electronically every Interactive Data File required to be submitted pursuant to Rule 405 of Regulation S-T (§232.405 of this chapter) during the preceding 12 months (or for such shorter period that the registrant was required to submit and post such files). Yes ☒ No ☐
Indicate by check mark whether the registrant is a large accelerated filer, an accelerated filer, a non-accelerated filer, smaller reporting company, or an emerging growth company. See the definitions of “large accelerated filer,” “accelerated filer,” “smaller reporting company,” and “emerging growth company” in Rule 12b-2 of the Exchange Act. (Check one): | | | | | | | | | | | | | | | | | | | | |
| Large accelerated filer | | ☒ | | Accelerated filer | | ☐ |
| Non-accelerated filer | | ☐ | | Smaller reporting company | | ☐ |
| | | | Emerging growth company | | ☐ |
If an emerging growth company, indicate by check mark if the registrant has elected not to use the extended transition period for complying with any new or revised financial accounting standards provided pursuant to Section 13(a) of the Exchange Act. ☐
Indicate by check mark whether the registrant has filed a report on and attestation to its management’s assessment of the effectiveness of its internal control over financial reporting under Section 404(b) of the Sarbanes-Oxley Act (15 U.S.C.7262(b)) by the registered public accounting firm that prepared or issued its audit report. ☒
If securities are registered pursuant to Section 12(b) of the Act, indicate by check mark whether the financial statements of the registrant included in the filing reflect the correction of an error to previously issued financial statements. ☐
Indicate by check mark whether any of those error corrections are restatements that required a recovery analysis of incentive-based compensation received by any of the registrant’s executive officers during the relevant recovery period pursuant to §240.10D-1(b). ☐
Indicate by check mark whether the registrant is a shell company (as defined in Rule 12b-2 of the Exchange Act). Yes ☐ No ☒
The aggregate market value of the voting and non-voting common equity stock held by non-affiliates of the registrant was approximately $11.2 billion based on the last reported sale price of common stock on June 28, 2024, the last business day of the registrant’s most recently completed second quarter.
Number of shares of common stock outstanding as of February 5, 2025: 117,573,461
Documents Incorporated by Reference
Portions of Albemarle Corporation’s definitive Proxy Statement for its 2025 Annual Meeting of Shareholders to be filed with the U.S. Securities and Exchange Commission pursuant to Regulation 14A under the Securities Exchange Act of 1934, as amended, are incorporated by reference into Part III of this Annual Report on Form 10-K.
| | | | | | | | |
| Albemarle Corporation and Subsidiaries |
|
Index to Form 10-K
Year Ended December 31, 2024
| | | | | | | | |
| Albemarle Corporation and Subsidiaries |
|
PART I
Albemarle Corporation was incorporated in Virginia in 1993. Our principal executive offices are located at 4250 Congress Street, Suite 900, Charlotte, North Carolina 28209. Unless the context otherwise indicates, the terms “Albemarle,” “we,” “us,” “our” or “the Company” mean Albemarle Corporation and its consolidated subsidiaries.
Albemarle is a world leader in transforming essential resources into critical ingredients for mobility, energy, connectivity, and health. Our purpose is to enable a more resilient world. We partner to pioneer new ways to move, power, connect, and protect. The end markets we serve include grid storage, automotive, aerospace, conventional energy, electronics, construction, agriculture and food, pharmaceuticals and medical devices. We believe that our world-class resources with reliable and consistent supply, our leading process chemistry, high-impact innovation, customer centricity and focus on people and planet will enable us to maintain a leading position in the industries in which we operate.
We and our joint ventures currently operate more than 25 production and research and development (“R&D”) facilities, as well as a number of administrative and sales offices, around the world. As of December 31, 2024, we served approximately 1,900 customers in approximately 70 countries. For information regarding our unconsolidated joint ventures, see Note 8, “Investments,” to our consolidated financial statements included in Part II, Item 8 of this report.
Effective November 1, 2024, we transitioned our operating structure from two core global business units - Energy Storage and Specialties - to a fully integrated functional model designed to increase agility, deliver significant cost savings and maintain long-term competitiveness. In addition, our Ketjen business continues to be operated under a separate, wholly-owned subsidiary. We will continue to report results across three existing operating segments: Energy Storage, Specialties and Ketjen.
Business Segments
During 2024, we managed and reported our operations under three reportable segments: Energy Storage, Specialties and Ketjen. The segments are organized based on their similar markets, customers, economic characteristics and production processes. Financial results and discussion about our segments included in this report are organized according to these categories except where noted.
For financial information regarding our reportable segments and geographic area information, see Note 25, “Segment and Geographic Area Information,” to our consolidated financial statements included in Part II, Item 8 of this report.
Energy Storage Segment
Our Energy Storage business enables better lithium use through reliable supply and consistent quality. We develop and manufacture a broad range of basic lithium compounds, including lithium carbonate, lithium hydroxide, and lithium chloride. Lithium is a key component in products and processes used in a variety of applications and industries, which include lithium batteries used in consumer electronics and electric vehicles, power grids and solar panels, high performance greases, specialty glass used in consumer appliances and electronics, organic synthesis processes in the areas of steroid chemistry and vitamins, various life science applications, as well as intermediates in the pharmaceutical industry, among other applications.
In addition to developing and supplying lithium compounds, we provide technical services, including the handling and use of reactive lithium products. We also offer our customers recycling services for lithium-containing by-products resulting from synthesis with organolithium products, lithium metal and other reagents. We plan to continue to focus on the development of new products and applications.
Competition
The global lithium market is highly competitive and growing very rapidly. It is characterized by aggressive expansion and entry from existing and new players, including automotive OEMs, commodity traders, junior miners, and large, well-capitalized diversified miners. Producers are primarily located in the Americas, Africa, Asia and Australia. Major competitors in lithium compounds include Sociedad Quimica y Minera de Chile S.A., Sichuan Tianqi Lithium, Jiangxi Ganfeng Lithium, Rio Tinto plc, Pilbara Minerals, Arcadium Lithium, Tesla and a large number of additional Chinese companies. Competition in the global lithium market is increasingly based on index-based market pricing and differentiated via product quality, product diversity, reliability of supply and customer service.
| | | | | | | | |
| Albemarle Corporation and Subsidiaries |
|
Raw Materials and Significant Supply Sources
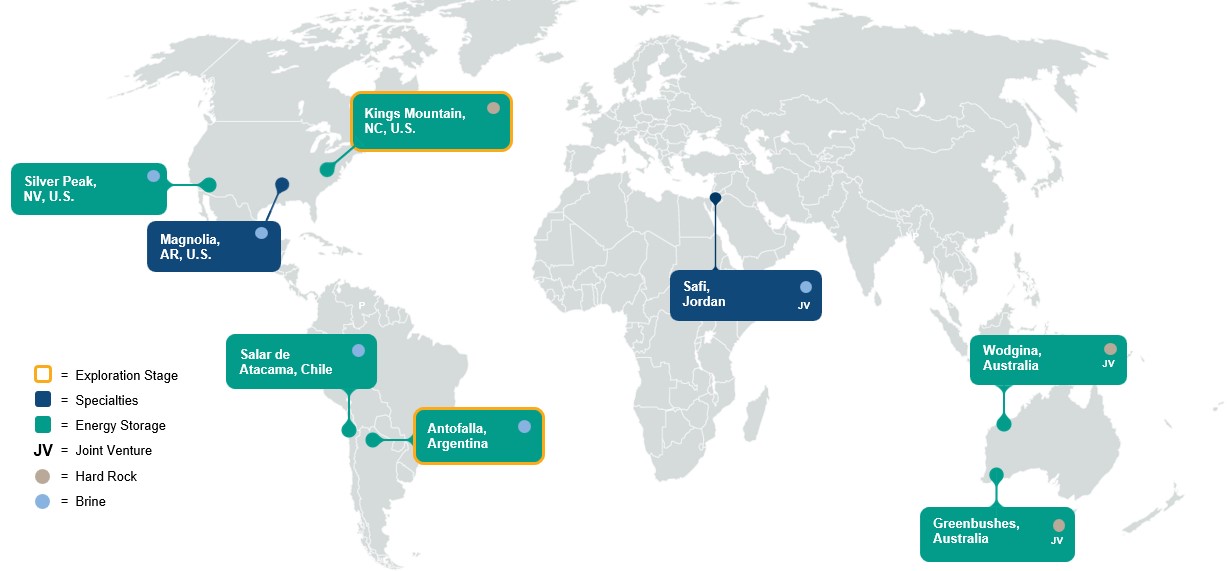
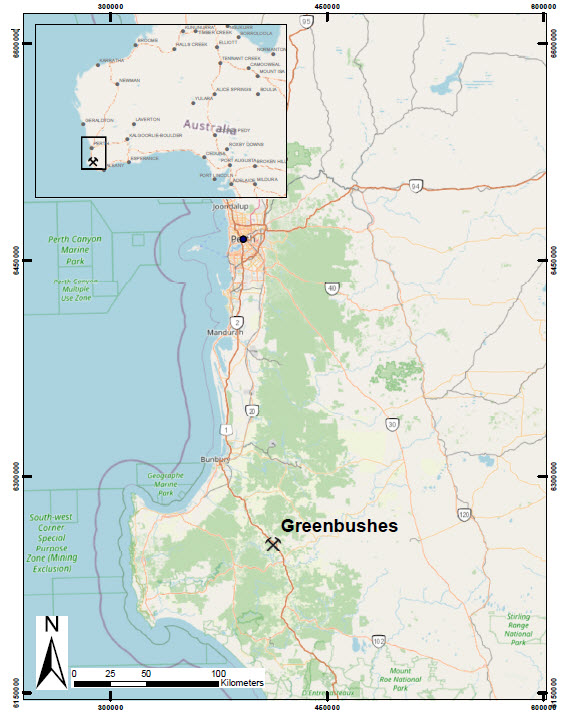
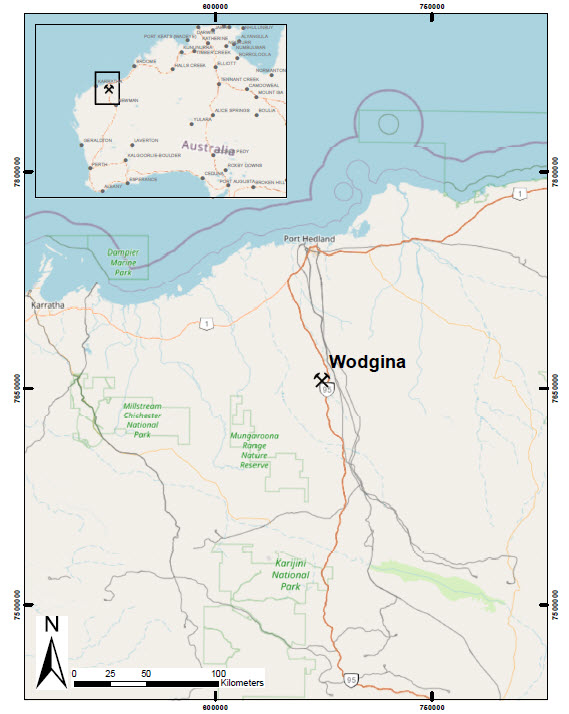
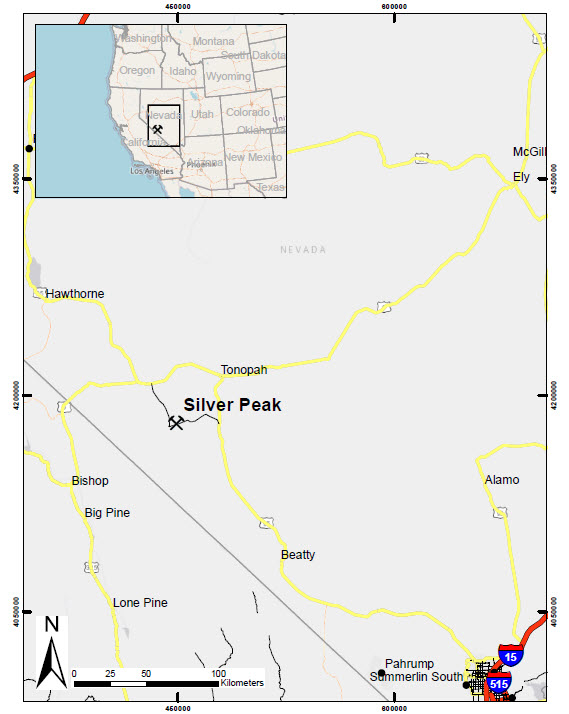
We obtain lithium: (a) by purchasing lithium concentrate from our 49%-owned joint venture, Windfield Holdings Pty. Ltd. (“Windfield”), which directly owns 100% of the equity of Talison Lithium Pty. Ltd., a company incorporated in Australia (“Talison”) that owns the Greenbushes mine, and from our 50%-owned unincorporated joint venture, MARBL Lithium Joint Venture (“MARBL”) in Western Australia, which owns the Wodgina hard rock lithium mine project (“Wodgina”); and (b) through solar evaporation of our ponds at the Salar de Atacama, in Chile, and in Silver Peak, Nevada. In addition, we hold mineral rights in defined areas of Kings Mountain, North Carolina with available lithium resources and we own undeveloped land with access to a lithium resource in Antofalla, within the Catamarca Province of Argentina. See Item 2. Properties, for additional disclosures of our lithium mineral properties.
Specialties Segment
Our Specialties business optimizes our portfolio of bromine and highly specialized lithium solutions. Our Specialties business serves a variety of industries, including energy, mobility, connectivity, and health. Specialty products are essential in both internal combustion and electric vehicles, from high-voltage cables and powertrains to airbags and tires. We enable digital innovation focused on safety and reliability, including fire safety compounds. Our fire safety technology enables the use of plastics in high performance, high heat applications by enhancing the flame resistant properties of these materials. End market products that benefit from our fire safety technology include plastic enclosures for consumer electronics, printed circuit boards, wire and cable products, electrical connectors, textiles and foam insulation. In energy, infrastructure for renewable grid and electrified transport is enabled by our fire safety solutions. In health, our lithium specialties products are precursors for many pharmaceuticals, while bromine specialties are used to help ensure safer food and water supplies. Other bromine-based specialty chemicals products include elemental bromine, alkyl bromides, inorganic bromides, brominated powdered activated carbon and a number of bromine fine chemicals. Our value-added lithium specialties products include butyllithium and lithium aluminum hydride. We also develop and manufacture cesium products for the chemical and pharmaceutical industries, and zirconium, barium and titanium products for various pyrotechnical applications, including airbag initiators. A number of customers of our Specialties business operate in cyclical industries, including the consumer electronics and oil field industries. As a result, demand from our customers in such industries is also cyclical.
Competition
Our Specialties business serves markets in the Americas, Asia, Europe and the Middle East, each of which is highly competitive. Product performance and quality, price and contract terms are the primary factors in determining which qualified supplier is awarded a contract. R&D, product and process improvements, specialized customer services, the ability to attract and retain skilled personnel and maintenance of a good safety record have also been important factors to compete effectively in the marketplace. Our most significant competitors are Lanxess AG, Israel Chemicals Ltd and Arcadium Lithium, as well as producers in India and China.
Raw Materials and Significant Supply Sources
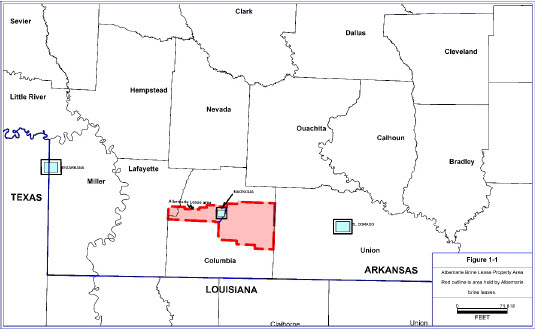
The bromine we use is originally sourced from two locations: Arkansas and the Dead Sea. Our bromine production operations in Arkansas are supported by an active brine rights leasing program. In addition, through our 50% interest in Jordan Bromine Company Limited (“JBC”), a consolidated joint venture established in 1999 with operations in Safi, Jordan, we acquire bromine that is originally sourced from the Dead Sea. JBC processes the bromine at its facilities into a variety of end products. See Item 2. Properties, for additional disclosures for our mineral properties. The lithium concentrate used in our lithium specialties products are originally sourced from the same sources as the Energy Storage lithium concentrate noted above.
Ketjen Segment
Our three main product lines in this segment are (i) Clean Fuels Technologies (“CFT”), which is primarily composed of hydroprocessing catalysts (“HPC”) together with isomerization and alkylation catalysts; (ii) fluidized catalytic cracking (“FCC”) catalysts and additives; and (iii) performance catalyst solutions (“PCS”), which is primarily composed of organometallics and curatives.
We offer a wide range of HPC products, which are applied throughout the oil refining industry. Their application enables the upgrading of oil fractions to clean fuels and other usable oil feedstocks and products by removing sulfur, nitrogen and other impurities from the feedstock. In addition, they improve product properties by adding hydrogen and in some cases improve the performance of downstream catalysts and processes. We continuously seek to add more value to refinery operations by offering HPC products that meet our customers’ requirements for profitability and performance in the very demanding refining market.
| | | | | | | | |
| Albemarle Corporation and Subsidiaries |
|
We provide our customers with customized FCC catalyst systems, which assist in the high yield cracking of refinery petroleum streams into derivative, higher-value products such as transportation fuels and petrochemical feedstocks like propylene. Our FCC additives are used to reduce emissions of sulfur dioxide and nitrogen oxide in FCC units and to increase liquefied petroleum gas olefins yield, such as propylene, and to boost octane in gasoline. Ketjen offers unique refinery catalysts to crack and treat the lightest to the heaviest feedstocks while meeting refinery yield and product needs.
Within our PCS product line, we manufacture organometallic co-catalysts (e.g., aluminum, magnesium, and zinc alkyls) used in the manufacture of alpha-olefins (e.g., hexene, octene, decene), polyolefins (e.g., polyethylene and polypropylene), and electronics. Our curatives include a range of curing agents used in polyurethanes, epoxies and other engineered resins.
There were more than 700 refineries world-wide as of December 31, 2024. We expect to continue to see some less profitable, typically smaller, refineries shutting down and, over the long-term, being replaced by larger scale and more complex refineries, with growth concentrated in the Middle East, India and South-East Asia. Advances in sustainable aviation fuels, petroleum products and renewable diesel are expected to continue. We estimate that there are currently approximately 600 FCC units being operated globally, each of which requires a constant supply of FCC catalysts. In addition, we estimate that there are approximately 4,000 HPC units being operated globally, each of which typically requires replacement HPC catalysts once every one to four years.
Competition
Our Ketjen segment serves the global market including the Americas, Asia, Europe and the Middle East, each of which is highly competitive. Competition in these markets is driven by a variety of factors. Product performance, quality, price, contract terms, product and process improvements, specialized customer services, the ability to attract and retain skilled technical support, and the maintenance of a good safety record are the primary factors to compete effectively in the catalysts marketplace. In addition, through our research and development programs, we strive to differentiate our business by developing value-added products based on proprietary technologies.
Our major competitors in the CFT catalysts market include Shell Catalysts & Technologies, Advanced Refining Technologies and Haldor Topsoe. Our major competitors in the FCC catalysts market include W.R. Grace & Co. and BASF Corporation. In the PCS market, our major competitors include Nouryon, Lanxess AG and Arxada.
Raw Materials and Significant Supply Sources
The major raw materials we use in our Ketjen operations include sodium silicate, sodium aluminate, kaolin, aluminum, ethylene, alpha-olefins, isobutylene, toluene and metals, such as lanthanum, molybdenum, nickel and cobalt, most of which are readily available from numerous independent suppliers and are purchased or provided under contracts at prices we believe are competitive. The cost of raw materials is generally based on market prices, although we may use contracts with price caps or other tools, as appropriate, to mitigate price volatility.
Human Capital
Our main human capital management objectives are to attract, retain and develop the highest quality talent and ensure they feel safe, supported and empowered to do the best work they can do. We believe providing an inclusive workplace facilitates opportunities for innovation, fosters good decision-making practices, and promotes employee engagement and high productivity across our organization.
As of December 31, 2024, we had approximately 8,300 employees, including employees of our consolidated joint ventures, of whom 3,300, or 39%, are employed in the U.S. and the Americas; 2,900, or 35%, are employed in Asia Pacific; 1,500, or 19%, are employed in Europe; and 600, or 7%, are employed in the Middle East or other areas. Approximately 28% of these employees are represented by unions or works councils. We strive to foster positive relationships with our employees and their representatives.
Health and Safety
The health and safety of our employees is a part of our core values at Albemarle and is integral to how we conduct business. Our employees, contractors, and visitors are instructed to follow a comprehensive set of written health and safety policies and procedures at both corporate and local sites. Our internal incident and issues management system gives all employees the ability to report incidents anonymously without fear of retaliation, and allow us to be more proactive in developing safety programs that address at-risk conditions or behaviors, which could lead to an incident. We routinely audit ourselves against our policies, procedures and standards, using internal and third-party resources. We also include health and safety metrics in our annual incentive plan to further incentivize our employees’ commitment to safety. In 2024, we maintained
| | | | | | | | |
| Albemarle Corporation and Subsidiaries |
|
our Occupational Safety and Health Act (“OSHA”) occupational injury and illness incident rate of 0.13 for our employees and nested contractors, compared to 0.14 in 2023. In addition, we provide all employees and their dependents with access to our Employee Assistance Program, which provides free mental and behavioral health resources.
Talent and Culture
Investing in talent is a critical process for Albemarle because it allows us to be proactive and anticipate key organizational needs for talent and capabilities. This enables us to efficiently and effectively ensure that we have the right talent pipeline to drive Albemarle’s success into the future. We also provide leadership development through performance coaching, comprehensive feedback, plant training including health, safety and environmental topics, and experiential development and mentoring. Our leadership development is a cornerstone to our talent management strategy. We also invest in our people through enhanced training and development opportunities and by seeking to foster an equitable workplace and an inclusive culture that enables employees to feel a sense of belonging and reach their full potential.
It is important for us to have a workforce of highly engaged employees who understand how their work connects to Albemarle’s purpose and values. We have measured employee engagement through an empowerment survey, which tracks job satisfaction and how likely an employee is to recommend Albemarle to people they know. In addition, we are committed to empowering and supporting the next generation of talent in their career development by engaging in various initiatives to attract people from all backgrounds to our internship, co-op and rotational development programs.
Our incentive program is designed to provide incentives and rewards for achieving Albemarle’s annual goals and objectives. The Executive Compensation and Talent Development Committee of the Board has the overall responsibility of evaluating the performance of the CEO and approving the compensation structure for senior management and other key employees. The Executive Compensation and Talent Development Committee determines performance goals under our incentive program annually to ensure our executive officers execute on short-term financial and strategic initiatives that drive our business strategy and long-term shareholder value.
We develop holistic inclusion and belonging initiatives to foster a values-driven workplace where all individuals feel a sense of belonging as they grow in their professions. We continue to pursue strategies and partnerships to attract highly qualified applicants from all backgrounds, offer cross-cultural learning sessions for our employees, and assess promotion, retention, and turnover data to identify potential opportunities for greater inclusion efforts.
We seek to provide employees with a desirable workplace that will enable us to attract and retain top talent. We believe employees should be fairly compensated through wages and benefits, based on experience, expertise, performance, and the criticality of their roles in the Company. We also perform an annual review of our pay practices to ensure that they are fair and equitable. In addition, we have established employee resource groups, known as Connect groups, to promote an atmosphere of inclusion and encouragement in which every employee’s voice can be heard. These Connect groups provide opportunities for employees to share their backgrounds and experiences, and to use them to benefit others through mentoring and volunteering in the local community, among other activities.
Human Rights
Albemarle is guided by its Code of Conduct, which sets forth the high ethical standards we have for all employees and encourages a ‘Speak Up’ culture. We understand our responsibility to uphold the human rights of our employees, workers in our supply chain, members of our communities and other stakeholders. We recognize the human rights of our stakeholders as expressed in the International Bill of Human Rights and the International Labor Organization’s (ILO) Declaration on Fundamental Principles and Rights at Work. We acknowledge the human rights of Indigenous Peoples in culturally sensitive locations, such as Chile and Western Australia, where our sites are located on Indigenous Peoples’ lands through clear policy commitments, due diligence initiatives, formal community agreements and accessible grievance mechanisms for reporting concerns.
Albemarle offers multiple avenues for employees and stakeholders to raise concerns. We maintain internal investigation standards to thoroughly review and address concerns that may arise. We take measures to maintain confidentiality, protect the integrity of all investigations, and prevent retaliation against those who speak up in good faith. In conducting investigations, we are committed to the U.N. Guiding Principles on Business and Human Rights.
Sales, Marketing and Distribution
We have an international strategic account program that uses cross-functional teams to serve large global customers. This program emphasizes creative strategies to improve and strengthen strategic customer relationships with emphasis on creating
| | | | | | | | |
| Albemarle Corporation and Subsidiaries |
|
value for customers and promoting post-sale service. Complementing this program are regional Albemarle sales and technical personnel who serve our global customer base. We also utilize sales representatives and specialists in specific market areas when necessary or required by law.
Research and Development
We believe that in order to generate revenue growth, maintain our margins and remain competitive, we must continually invest in research and development, product and process improvements and specialized customer services. Our research and development efforts support each of our business segments. The objective of our research and development efforts is to develop innovative chemistries and technologies with applications relevant within targeted key markets through both process and new product development. Through research and development, we continue to seek increased margins by introducing value-added products and proprietary processes and innovative green chemistry technologies. Our green chemistry efforts focus on the development of products in a manner that minimizes waste and the use of raw materials and energy, avoids the use of toxic reagents and solvents and utilizes safe, environmentally friendly manufacturing processes. Green chemistry is encouraged with our researchers through periodic focus group discussions and special rewards and recognition for outstanding new green developments.
Intellectual Property
Our intellectual property, including our patents, licenses and trade names, is an important component of our business. As of December 31, 2024, we owned more than 1,650 active patents and more than 400 pending patent applications in key strategic markets worldwide. We also have acquired rights under patents and inventions of others through licenses, and we license certain patents and inventions to third parties. The Company believes the duration of its intellectual property rights is adequate relative to the expected lives of its products and services.
Regulation
Our business is subject to a broad array of employee health and safety laws and regulations, including those under the OSHA. We also are subject to similar state laws and regulations as well as local laws and regulations for our non-U.S. operations. We devote significant resources and have developed and implemented comprehensive programs to promote the health and safety of our employees, and we maintain an active health, safety and environmental program. We finished 2024 with an OSHA occupational injury and illness incident rate of 0.13 for Albemarle employees and nested contractors, compared to 0.14 in 2023.
Our business and our customers are subject to significant requirements under the European Community Regulation for the Registration, Evaluation, Authorization and Restriction of Chemicals (“REACH”). REACH imposes obligations on European Union manufacturers and importers of chemicals and other products into the European Union to compile and file comprehensive reports, including testing data, on each chemical substance, and perform chemical safety assessments. Additionally, substances of high concern, as defined under REACH, are subject to an authorization process. Authorization may result in restrictions in the use of products by application or even banning the product. REACH regulations impose significant additional responsibilities on chemical producers, importers, downstream users of chemical substances and preparations, and the entire supply chain. Our significant manufacturing presence and sales activities in the European Union require significant compliance costs and may result in increases in the costs of raw materials we purchase and the products we sell. Increases in the costs of our products could result in a decrease in their overall demand; additionally, customers may seek products with lower regulatory compliance requirements, which could also result in a decrease in the demand of certain products subject to the REACH regulations.
The Toxic Substances Control Act (“TSCA”), as amended in June 2016, requires chemicals to be assessed against a risk-based safety standard and calls for the elimination of unreasonable risks identified during risk evaluation. This regulation and other pending initiatives at the U.S. state level, as well as initiatives in Canada, Asia and other regions, will potentially require toxicological testing and risk assessments of a wide variety of chemicals, including chemicals used or produced by us. These assessments may result in heightened concerns about the chemicals involved and additional requirements being placed on the production, handling, labeling or use of the subject chemicals. Such concerns and additional requirements could also increase the cost incurred by our customers to use our chemical products and otherwise limit the use of these products, which could lead to a decrease in demand for these products.
Historically, there has been scrutiny of certain brominated fire safety solutions by regulatory authorities, legislative bodies and environmental interest groups in various countries. We manufacture a broad range of brominated fire safety solution products, which are used in a variety of applications. Concern about the impact of some of our products on human health or the environment may lead to regulation or reaction in our markets independent of regulation.
| | | | | | | | |
| Albemarle Corporation and Subsidiaries |
|
Environmental Regulation
We are subject to numerous foreign, federal, state and local environmental laws and regulations, including those governing the discharge of pollutants into the air and water, the management and disposal of hazardous substances and wastes and the cleanup of contaminated properties. Ongoing compliance with such laws and regulations is an important consideration for us. Key aspects of our operations are subject to these laws and regulations. In addition, we incur substantial capital and operating costs in our efforts to comply with them.
We use and generate hazardous substances and wastes in our operations and may become subject to claims for personal injury and/or property damage relating to the release of such substances into the environment. In addition, some of our current properties are, or have been, used for industrial purposes, which could contain currently unknown contamination that could expose us to governmental requirements or claims relating to environmental remediation, personal injury and/or property damage. Liabilities associated with the investigation and cleanup of hazardous substances, as well as personal injury, property damages or natural resource damages arising from the release of, or exposure to, such hazardous substances, may be imposed in many situations without regard to violations of laws or regulations or other fault, and may also be imposed jointly and severally (so that a responsible party may be held liable for more than its share of the losses involved, or even the entire loss). Such liabilities also may be imposed on many different entities with a relationship to the hazardous substances at issue, including, for example, entities that formerly owned or operated the property affected by the hazardous substances and entities that arranged for the disposal of the hazardous substances at the affected property, as well as entities that currently own or operate such property. We are subject to such laws, including the federal Comprehensive Environmental Response, Compensation and Liability Act, commonly known as CERCLA or Superfund, in the U.S., and similar foreign and state laws. We may have liability as a potentially responsible party (“PRP”) with respect to active off-site locations under CERCLA or state equivalents. We have sought to resolve our liability as a PRP at these sites through indemnification by third parties and settlements, which would provide for payment of our allocable share of remediation costs. Because the cleanup costs are estimates and are subject to revision as more information becomes available about the extent of remediation required, and in some cases we have asserted a defense to any liability, our estimates could change. Moreover, liability under CERCLA and equivalent state statutes may be joint and several, which could require us to pay in excess of our pro rata share of remediation costs. Our understanding of the financial strength of other PRPs has been considered, where appropriate, in estimating our liabilities. Accruals for these matters are included in the environmental reserve. Our management is actively involved in evaluating environmental matters and, based on information currently available to us, we have concluded that our outstanding environmental liabilities for unresolved waste sites currently known to us should not have a material effect on our operations.
See “Safety and Environmental Matters” in Item 7. Management’s Discussion and Analysis of Financial Condition and Results of Operations for further details.
Climate Change and Natural Resources
The growing concerns about climate change and the related increasingly stringent regulations may provide us with new or expanded business opportunities. We provide solutions to companies pursuing alternative fuel products and technologies (such as renewable fuels), pollution control technologies (including mercury emissions), alternative transportation vehicles and energy storage technologies and other similar solutions. As demand for, and legislation mandating or incentivizing the use of, alternative fuel technologies that limit or eliminate greenhouse gas emissions increase, we continue to monitor the market and offer solutions where we have appropriate technology and believe we are well positioned to take advantage of opportunities that may arise from such demand or legislation.
In addition to potential business opportunities, we acknowledge our responsibility to address the impact of our operations on the environment. We are investing in technology and people to reduce energy consumption, greenhouse gas emissions and air emissions. Albemarle supports the goals of the Paris Agreement to avoid climate change by limiting global warming. Our ambition is to achieve net-zero carbon emissions by 2050. We have established greenhouse gas emission targets for each of our businesses, including reducing the scope 1 and 2 carbon-intensity of our Specialties and Ketjen businesses by 35% by 2030 (from a 2019 baseline), and growing our Energy Storage business in a carbon-intensity neutral manner through 2030.
Water is a critical input to Albemarle’s production operations. As water is a scarce resource, we understand the need to responsibly manage our water consumption not only for the preservation of the environment, but also for the viability of our local communities. We are investing in new process technologies to reduce our water footprint and expand capacity sustainably in locations with high water risk. Our goal is to reduce our intensity of freshwater usage by 25% by 2030 (from a 2019 baseline) in areas of high or extremely high water risk, such as Chile and Jordan, as defined by the World Resources Institute.
Our businesses are dependent on the availability and responsible management of natural resources. We manage our natural resources to operate efficiently and preserve the environment for our local communities and the world. Our natural
| | | | | | | | |
| Albemarle Corporation and Subsidiaries |
|
resource management includes mineral resource transparency with local communities, governments, regulators and other key stakeholders, as well as leveraging industry best practices in lithium production for the assurance of responsible mining. We attempt to maximize the recovery of our extracted minerals and recycle or reuse by-products where possible. In addition, we work with local communities, regulatory agencies and wildlife organizations to preserve and restore land and biodiversity before, during and after all operations commence.
Recent Acquisitions, Joint Ventures and Divestitures
The following is a summary of our significant acquisitions and joint venture agreement restructurings over the last three years.
On October 18, 2023, the Company closed on the restructuring of the MARBL joint venture with Mineral Resources Limited (“MRL”). Under the amended agreements, Albemarle acquired the remaining 40% ownership of the Kemerton lithium hydroxide processing facility in Australia that was jointly owned with MRL through the MARBL joint venture. Following this restructuring, Albemarle and MRL each own 50% of Wodgina, and MRL operates the Wodgina mine on behalf of the joint venture. During the fourth quarter of 2023, Albemarle paid MRL approximately $380 million in cash, which includes $180 million of consideration for the remaining ownership of Kemerton as well as a payment for the economic effective date of the transaction being retroactive to April 1, 2022.
On October 25, 2022, the Company completed the acquisition of all of the outstanding equity of Guangxi Tianyuan New Energy Materials Co., Ltd. (“Qinzhou”), for approximately $200 million in cash. Qinzhou’s operations include a recently constructed lithium processing plant strategically positioned near the Port of Qinzhou in Guangxi, which began commercial production in the first half of 2022. The plant has a designed annual conversion capacity of up to 25,000 metric tons of lithium carbonate equivalent (“LCE”) and produces battery-grade lithium carbonate and lithium hydroxide.
These transactions reflect our commitment to investing in future growth of our high priority businesses.
Available Information
Our website address is www.albemarle.com. We make available free of charge through our website our Annual Report on Form 10-K, Quarterly Reports on Form 10-Q, Current Reports on Form 8-K and amendments to those reports filed or furnished pursuant to Section 13(a) or 15(d) of the Securities Exchange Act of 1934, as amended (“Exchange Act”), as well as beneficial ownership reports on Forms 3, 4 and 5 filed pursuant to Section 16 of the Exchange Act, as soon as reasonably practicable after such documents are electronically filed with, or furnished to, the Securities and Exchange Commission (“SEC”). The information on our website is not, and shall not be deemed to be, a part of this report or incorporated into any other filings we make with the SEC. The SEC also maintains a website at www.sec.gov that contains reports, proxy statements and other information regarding SEC registrants, including Albemarle.
Our Corporate Governance Guidelines, Code of Conduct and the charters of the Audit and Finance, Capital Investment, Sustainability, Safety and Public Policy, Executive Compensation and Talent Development, and Nominating and Governance Committees of our Board of Directors are also available on our website and are available in print to any shareholder upon request by writing to Investor Relations, 4250 Congress Street, Suite 900, Charlotte, North Carolina 28209, or by calling (980) 299-5700.
Risk Factor Summary
The following is a summary of some of the principal risks that could adversely affect our business, financial condition or results of operations. This summary should be read together with the more detailed description of each risk contained below.
Risks Related to Our Business
•Our substantial international operations subject us to risks of doing business in foreign countries, which could adversely affect our business, financial condition and results of operations.
•Our inability to secure key raw materials, or to pass through increases in costs and expenses for other raw materials and energy, on a timely basis or at all, including due to climate change, could have an adverse effect on the margins of our products and our results of operations.
•Competition within our industry may place downward pressure on the prices and margins of our products and may adversely affect our businesses and results of operations.
| | | | | | | | |
| Albemarle Corporation and Subsidiaries |
|
•Our research and development efforts may not succeed in addressing changes in our customers’ needs, and our competitors may develop more effective or successful products.
•The development of non-lithium battery technologies could adversely affect us.
•Development projects are inherently risky and may require more capital than anticipated, which could adversely affect our business. The development of our mines and operations are also subject to other project specific risks.
•Downturns in our customers’ industries, which may be cyclical or affected by changes in governing administrations, could adversely affect our sales and profitability.
•Our results are subject to fluctuation because of irregularities in the demand for our HPC catalysts and certain of our agrichemicals.
•Regulation, or the threat of regulation, of some of our products could have an adverse effect on our sales and profitability.
•We could be subject to damages based on claims brought against us by our customers or lose customers as a result of the failure of our products to meet certain quality specifications.
•Our business is subject to hazards common to chemical and natural resource extraction businesses, any of which could injure our employees or other persons, damage our facilities or other properties, interrupt our production and adversely affect our reputation and results of operations.
•Our business could be adversely affected by environmental, health and safety laws and regulations.
•Our operations could be adversely affected by local communities and/or other stakeholders.
•We may be subject to indemnity claims and liable for other payments relating to properties or businesses we have divested.
•We could be adversely affected by violations of the U.S. Foreign Corrupt Practices Act and similar foreign anti-corruption laws, and in the past have paid fines in order to resolve self-reported potential violations of such laws.
•We are subject to extensive foreign government regulation that can negatively impact our business.
•Our inability to protect our intellectual property rights, or being accused of infringing on intellectual property rights of third parties, could have a material adverse effect on our business, financial condition and results of operations.
•Our inability to acquire or develop additional lithium reserves that are economically viable could have a material adverse effect on our future profitability.
•There is risk to the growth of lithium markets.
•Demand and market prices for lithium will greatly affect the value of our investment in our lithium resources and conversion plants and our revenues and profitability generally.
•If we are unable to retain key personnel or attract new skilled personnel, it could have an adverse effect on our business.
•Some of our employees are unionized, represented by works councils or are employed subject to local laws that are less favorable to employers than the laws of the U.S.
•Our joint ventures may not operate according to their business plans if our partners fail to fulfill their obligations, which may adversely affect our results of operations and may force us to dedicate additional resources to these joint ventures.
Risks Related to Our Financial Condition
•Our required capital expenditures can be complex, may experience delays or other difficulties, and the costs may exceed our estimates.
•We will need a significant amount of cash to service our indebtedness and our ability to generate cash depends on many factors beyond our control.
•Because a significant portion of our operations is conducted through our subsidiaries and joint ventures, our ability to service our debt may be dependent on our receipt of distributions or other payments from our subsidiaries and joint ventures.
•Restrictive covenants in our debt instruments may adversely affect our business.
•Changes in credit ratings issued by nationally recognized statistical rating organizations could adversely affect our cost of financing, the market price of our securities and our debt service obligations.
•Write-offs or impairment of our goodwill, intangible assets or long-lived assets can result in significant charges to earnings.
| | | | | | | | |
| Albemarle Corporation and Subsidiaries |
|
•Our business could suffer if we are not successful in executing our strategy and initiatives in connection with our comprehensive review of our cost and operating structure.
•We are exposed to fluctuations in currency exchange rates, which may adversely affect our operating results and net income.
•Significant or prolonged periods of higher interest rates may have an adverse effect on our results of operations, financial condition and cash flows.
•Inflationary trends in the price of our input costs, such as raw materials, transportation and energy, could adversely affect our business and financial results.
•Changes in, or the interpretation of, tax legislation or rates throughout the world could materially impact our results.
•Future events may impact our deferred tax asset position and U.S. deferred federal income taxes on undistributed earnings of international affiliates that are considered to be indefinitely reinvested.
•Our business and financial results may be adversely affected by various legal and regulatory proceedings.
•Although our pension plans currently meet minimum funding requirements, events could occur that would require us to make significant contributions to the plans and reduce the cash available for our business.
•We may not be able to consummate future acquisitions or integrate acquisitions into our business, which could result in unanticipated expenses and losses.
•We may continue to expand our business through acquisitions and we may incur additional indebtedness, including indebtedness related to acquisitions.
General Risk Factors
•Adverse conditions in the economy, and volatility and disruption of financial markets can negatively impact our customers, suppliers and other business partners and therefore have a material adverse effect on our business and results of operations.
•Our business and operations could suffer in the event of cybersecurity breaches, information technology system failures, or network disruptions.
•The occurrence or threat of extraordinary events, including domestic and international terrorist attacks, may disrupt our operations and decrease demand for our products.
•National or international disputes, political instability, terrorism war or armed hostilities, could impact our results of operations.
•Natural disasters or other unanticipated catastrophes could impact our operations and could have a material adverse effect on our results of operations, financial position, and cash flows.
•Our insurance may not fully cover all potential exposures.
•We may be exposed to certain regulatory and financial risks related to climate change.
•Failure to meet sustainability expectations or standards or achieve our sustainability goals could adversely affect our business, results of operations, financial condition, or stock price.
Risk Factors
You should consider carefully the following risks when reading the information, including the financial information, contained in this Annual Report on Form 10-K.
Risks Related to Our Business
Our substantial international operations subject us to risks of doing business in foreign countries, which could adversely affect our business, financial condition and results of operations.
We conduct a substantial portion of our business outside the U.S., with approximately 83% of our net sales to foreign countries. We operate in, and/or sell our products to customers in, approximately 70 countries. We currently have many production, research and development and administrative facilities as well as sales offices located outside the U.S., as detailed in Item 2. Properties. Accordingly, our business is subject to risks related to the differing legal, political, social and regulatory requirements and economic conditions of many jurisdictions. Risks inherent in international operations include the following:
•fluctuations in foreign currency exchange rates may affect product demand and may adversely affect the profitability in U.S. dollars of products and services we provide in international markets where payment for our products and services is made in the local currency;
| | | | | | | | |
| Albemarle Corporation and Subsidiaries |
|
•transportation and other shipping costs may increase, or transportation may be inhibited;
•increased cost or decreased availability of raw materials;
•increased regulations on, or reduced access to, scarce resources, such as freshwater;
•changes in foreign laws and tax rates or U.S. laws and tax rates with respect to foreign income may unexpectedly increase the rate at which our income is taxed, impose new and additional taxes on remittances, repatriation or other payments by subsidiaries, or cause the loss of previously recorded tax benefits;
•delays in obtaining or renewing, or the inability to obtain, maintain or renew, or the renegotiation, cancellation, revocation or forced modification of existing contracts, leases, licenses, permits or other agreements and/or approvals;
•trade sanctions by or against foreign countries in which we do business could result in our losing access to customers and suppliers in those countries;
•unexpected adverse changes in foreign laws or regulatory requirements may occur;
•our agreements with counterparties in foreign countries may be difficult for us to enforce and related receivables may be difficult for us to collect;
•compliance with the variety of foreign laws and regulations may be unduly burdensome;
•compliance with anti-bribery and anti-corruption laws (such as the Foreign Corrupt Practices Act) as well as anti-money-laundering laws may be costly;
•compliance with changing cybersecurity rules and evolving data privacy rules and regulation, such as the European Union’s General Data Protection Regulation, could increase our cost of doing business;
•unexpected adverse changes in export regulations, duties, quotas and tariffs and difficulties in obtaining export licenses may occur;
•general economic conditions in the countries in which we operate could have an adverse effect on our earnings from operations in those countries;
•changes in the strength of our relationships with local communities and indigenous populations in the areas in which we operate may impact our community support;
•our foreign operations may experience staffing difficulties and labor disputes;
•termination or substantial modification of international trade agreements may adversely affect our access to raw materials and to markets for our products outside the U.S.;
•foreign governments may nationalize or expropriate private enterprises;
•increased sovereign risk (such as default by or deterioration in the economies and credit worthiness of local governments) may occur; and
•political or economic repercussions from terrorist activities, including the possibility of hyperinflationary conditions and political instability, may occur in certain countries in which we do business.
The U.S. and foreign countries may also adopt or increase restrictions on foreign trade or investment, including currency exchange controls, tariffs or other taxes, or limitations on imports or exports (including recent and proposed changes in U.S. trade policy and resulting retaliatory actions by other countries).
In addition, certain of our operations and ongoing capital projects are in regions of the world such as Asia, the Middle East and South America that are of high risk due to significant civil, political and security instability. Unanticipated events, such as geopolitical changes, could result in a write-down of our investment in the affected joint venture or a delay or cause cancellation of those capital projects, which could negatively impact our future growth and profitability. Our success as a global business will depend, in part, upon our ability to succeed in differing legal, regulatory, economic, social and political conditions by developing, implementing and maintaining policies and strategies that are effective in each location where we and our joint ventures do business.
Furthermore, we are subject to rules and regulations related to anti-bribery and antitrust prohibitions of the U.S. and other countries, as well as export controls and economic embargoes, violations of which may carry substantial penalties. For example, export control and economic embargo regulations limit the ability of our subsidiaries to market, sell, distribute or otherwise transfer their products or technology to prohibited countries or persons. Failure to comply with these regulations could subject us or our subsidiaries to fines and enforcement actions and/or have an adverse effect on our reputation and the value of our common stock. Relating to anti-bribery prohibitions, in September 2023, we finalized agreements with regulatory agencies to resolve self-reported potential violations of the U.S. Foreign Corrupt Practices Act; see “We could be adversely affected by violations of the U.S. Foreign Corrupt Practices Act and similar foreign anti-corruption laws.” below.
| | | | | | | | |
| Albemarle Corporation and Subsidiaries |
|
Because we conduct substantial operations in China, risks associated with regulatory activity and political and social events in China could negatively affect our business and operating results.
In 2024, net sales shipped to China represented 36% of our total net sales. Additionally, we own four production facilities located in China, including the lithium conversion plant in Meishan, China, which began production in 2024. In addition to the risks described above under “Our substantial international operations subject us to risks of doing business in foreign countries, which could adversely affect our business, financial condition and results of operations.”, our operations in China expose us to risks particular to conducting business in that country. For example, over the past several years the U.S. and China have applied tariffs to certain of each other’s exports, including tariffs on Chinese electric vehicles and lithium-ion batteries announced by the U.S. presidential administration in 2024, which have resulted in, and may continue to cause, shifting trade flows and restrictions on certain sales of goods into China and domestic demand for products manufactured in China. The current U.S. presidential administration has indicated that it may impose additional tariffs on China and other countries. Additionally, geopolitical disputes (including as a result of China-Taiwan and U.S.-Taiwan relations) between the U.S. and China may lead to further restrictions on trade and/or obstacles to conducting business in China. Recently, Australia and China have improved relations and resolved trade disputes. However, as we ship a significant portion of our lithium from Australia into China for further processing, any tensions or a regression in relations between the countries could have a material impact on our operations. Furthermore, the Chinese government has, from time to time, curtailed manufacturing operations, with little or no notice, in industrial regions out of growing concern over air quality and in response to COVID-19 outbreaks. The Chinese government has also instituted energy intensity and energy consumption targets in a number of provinces in its efforts to reduce energy consumption, resulting in energy quotas and shortages in energy supply that can be disruptive to construction and manufacturing operations. These and other risks may have an adverse effect on our sales to Chinese customers and/or result in our not realizing a return on, or losing some, or all, of our strategic investments in China.
In December 2021, the United States adopted the Uyghur Forced Labor Prevention Act (“UFLPA”) which creates a rebuttable presumption that any goods, wares, articles, and merchandise mined, produced, or manufactured in whole or in part in the Xinjiang Uyghur Administrative Region of China or that are produced by certain entities are prohibited from importation into the United States and are not entitled to entry. These import restrictions came into effect on June 21, 2022. While we are not presently aware of any direct impacts these restrictions will have on its supply chain, the UFLPA may materially and negatively impact our ability to import the goods and products we rely on to manufacture our products and operate our business.
Our inability to secure key raw materials, or to pass through increases in costs and expenses for other raw materials and energy, on a timely basis or at all, including due to climate change, could have an adverse effect on the margins of our products and our results of operations.
The long-term profitability of our operations will, in part, depend on our ability to continue to economically obtain resources, including energy and raw materials. For example, our lithium and bromine businesses rely upon our continued ability to produce, or otherwise obtain, lithium and bromine of sufficient quality and in adequate amounts to meet our customers’ demand. If we fail to secure and retain the rights to continue to access these key raw materials, we may have to restrict or suspend our operations that rely upon these key resources, which could harm our business, results of operations and financial condition. In addition, in some cases access to these raw materials by us and our competitors is subject to decisions or actions by governmental authorities, which could adversely impact us. Furthermore, other raw material and energy costs account for a significant percentage of our total costs of products sold, even if they can be obtained on commercially reasonable terms. Our raw material and energy costs can be volatile and may increase significantly. Increases are primarily driven by tightening of market conditions and major increases in the pricing of key constituent materials for our products such as crude oil, chlorine and metals (including molybdenum and rare earths, which are used in the refinery catalysts business). We generally attempt to pass through changes in the prices of raw materials and energy to our customers, but we may be unable to do so (or may be delayed in doing so). In addition, raising prices we charge to our customers in order to offset increases in the prices we pay for raw materials could cause us to suffer a loss of sales volumes. Our inability to efficiently and effectively pass through price increases, or inventory impacts resulting from price volatility, could adversely affect our margins.
Competition within our industry may place downward pressure on the prices and margins of our products and may adversely affect our businesses and results of operations.
We compete against a number of highly competitive global specialty chemical producers. Competition is based on several key criteria, including product performance and quality, product price, product availability and security of supply, climate-related performance and responsiveness of product development in cooperation with customers and customer service. Some of our competitors are larger than us and may have greater financial resources. These competitors may also be able to maintain significantly greater operating and financial flexibility. As a result, these competitors may be better able to withstand changes in
| | | | | | | | |
| Albemarle Corporation and Subsidiaries |
|
conditions within our industry. Competitors’ pricing decisions could compel us to decrease our prices, which could negatively affect our margins and profitability. Our ability to maintain or increase our profitability is, and will continue to be, dependent upon our ability to offset decreases in the prices and margins of our products by improving production efficiency and volume and other productivity enhancements, shifting to production of higher margin chemical products and improving existing products through innovation and research and development. If we are unable to do so or to otherwise maintain our competitive position, we could lose market share to our competitors.
In addition, Albemarle’s brands, product image and trademarks represent the unique product identity of each of our products and are important symbols of the Company’s reputation. Accordingly, the performance of our business could be adversely affected by any marketing and promotional materials used by our competitors that make adverse claims, whether with or without merit, against our Company or its products, imply or assert immoral or improper conduct by us, or are otherwise disparaging of our Company or its products. Further, our own actions could hurt such brands, product image and trademarks if our products underperform or we otherwise draw negative publicity.
Our research and development efforts may not succeed in addressing changes in our customers’ needs, and our competitors may develop more effective or successful products.
Our industries and the end markets into which we sell our products experience technological change and product improvement. Manufacturers periodically introduce new products or require new technological capacity to develop customized products. Our future growth depends on our ability to gauge the direction of the commercial and technological progress in all key end markets in which we sell our products and upon our ability to fund and successfully develop, manufacture and market products in such changing end markets. As a result, we must commit substantial resources each year to research and development. There is no assurance that we will be able to continue to identify, develop, market and, in certain cases, secure regulatory approval for innovative products in a timely manner or at all, as may be required to replace or enhance existing products, and any such inability could have a material adverse effect on our profit margins and our competitive position.
In addition, our customers use our specialty chemicals for a broad range of applications. Changes in our customers’ products or processes may enable our customers to reduce consumption of the specialty chemicals that we produce or make our specialty chemicals unnecessary. Customers may also find alternative materials or processes that do not require our products. Should a customer decide to use a different material due to price, performance or other considerations, we may not be able to supply a product that meets the customer’s new requirements. Consequently, it is important that we develop new products to replace the sales of products that mature and decline in use. Our business, results of operations, cash flows and margins could be materially adversely affected if we are unable to manage successfully the maturation of our existing products and the introduction of new products.
Despite our efforts, we may not be successful in developing new products and/or technology, either alone or with third parties, or licensing intellectual property rights from third parties on a commercially competitive basis. Our new products may not be accepted by our customers or may fail to receive regulatory approval. Moreover, new products may have lower margins than the products they replace. Furthermore, ongoing investments in research and development for the future do not yield an immediate beneficial impact on our operating results and therefore could result in higher costs without a proportional increase in revenues.
The development of non-lithium battery technologies could adversely affect us.
The development and adoption of new battery technologies that rely on inputs other than lithium compounds could significantly impact our prospects and future revenues. Current and next generation high energy density batteries for use in electric vehicles rely on lithium compounds as a critical input. Alternative materials and technologies are being researched with the goal of making batteries lighter, more efficient, faster charging and less expensive, and some of these could be less reliant on lithium compounds. We cannot predict which new technologies may ultimately prove to be commercially viable and on what time horizon. Commercialized battery technologies that use no, or significantly less, lithium could materially and adversely impact our prospects and future revenues.
Development projects are inherently risky and may require more capital than anticipated, which could adversely affect our business. The development of our mines and operations are also subject to other unique risks.
Mine development projects typically require a number of years and significant expenditures during the development phase before production is possible. There are many risks and uncertainties inherent in all development projects including, but not limited to, unexpected or difficult geological formations or conditions, potential delays, cost overruns, lower levels of production during ramp-up periods, shortages of material or labor, construction defects, breakdowns and injuries to persons and property. The development of our mines and operations are also subject to other unique risks including, but not limited to,
| | | | | | | | |
| Albemarle Corporation and Subsidiaries |
|
underground fires or floods, ventilating harmful gases, fall-of-ground accidents, and seismic activity resulting from unexpected or difficult geological formations or conditions. While we anticipate taking all measures that we deem reasonable and prudent in connection with the development of our mines to safely manage production, there is no assurance that these risks will not cause schedule delays, revised mine plans, injuries to persons and property, or increased capital costs, any of which may have a material adverse impact on our cash flows, results of operations and financial condition. Additionally, although we devote significant time and resources to our project planning, approval and review processes, many of our development projects are highly complex and rely on factors that are outside of our control, which may cause us to underestimate the time and capital required to complete a development project.
Our decision to develop a project is typically based on the results of feasibility studies, which estimate the anticipated economic returns of a project. In addition, the economic feasibility of development projects is based on many factors, including the accuracy of estimated mineral resources and reserves, estimated capital and operating costs, and estimated future prices of lithium and bromine.
New development projects have no operating history upon which to base estimates of future cash flow. The actual costs, production rates and economic returns of our development projects may differ materially from our estimates, which may have a material adverse impact on our cash flows, results of operations and financial condition.
Downturns in our customers’ industries, which may be cyclical or affected by changes in governing administrations, could adversely affect our sales and profitability.
Downturns in the businesses that use our specialty chemicals may adversely affect our sales. Many of our customers are in industries, including the electronics, building and construction, oilfield and automotive industries, that are cyclical in nature, or which are subject to secular market downturns or may face adverse effects of evolving regulatory regimes. Historically, cyclical or secular industry downturns have resulted in diminished demand for our products, excess manufacturing capacity and lower average selling prices, and we may experience similar problems in the future.
Additionally, certain of these industries are subject to regulatory schemes that may shift with changes in the political climate. The results of elections in the United States or other countries in which our customers are located and changes in governing administrations and legislative bodies may result in consequent changes to these regulatory regimes that could cause a decline within these industries, leading to a diminished demand for our products. For example, the new U.S. presidential administration has indicated that it may halt government infrastructure spending to establish charging points for EV users, eliminate certain tax cuts available in connection with EV purchases, and rescind requirements pertaining to reducing greenhouse gas emissions, all or any of which measures may have a detrimental affect on the U.S. EV industry. A decline in our customers’ industries may have a material adverse effect on our sales and profitability.
Our results are subject to fluctuation because of irregularities in the demand for our HPC catalysts and certain of our agrichemicals.
Our HPC catalysts are used by petroleum refiners in their processing units to reduce the quantity of sulfur and other impurities in petroleum products. The effectiveness of HPC catalysts diminishes with use, requiring the HPC catalysts to be replaced, on average, once every one to four years. The sales of our HPC catalysts, therefore, are largely dependent on the useful life cycle of the HPC catalysts in the processing units and may vary materially by quarter. In addition, the timing and profitability of HPC catalysts sales can have a significant impact on revenue and profit in any one quarter. Sales of our agrichemicals are also subject to fluctuation as demand varies depending on climate and other environmental conditions, which may prevent or reduce farming for extended periods. In addition, crop pricing and the timing of when farms alternate from one crop to another crop in a particular year can also alter sales of agrichemicals.
Regulation, or the threat of regulation, of some of our products could have an adverse effect on our sales and profitability.
We manufacture or market a number of products that are or have been the subject of attention by regulatory authorities and environmental interest groups. For example, there has been scrutiny of certain brominated fire safety solutions by regulatory authorities, legislative bodies and environmental interest groups in various countries. We manufacture a broad range of brominated fire safety solution products, which are used in a variety of applications to protect people, property and the environment from injury and damage caused by fire. Concern about the impact of some of our products on human health or the environment may lead to regulation, or reaction in our markets independent of regulation, that could reduce or eliminate markets for such products.
Agencies in the European Union (“E.U.”) continue to evaluate the risks to human health and the environment associated with certain brominated fire safety solutions such as tetrabromobisphenol A and decabromodiphenyl ethane, both of which we
| | | | | | | | |
| Albemarle Corporation and Subsidiaries |
|
manufacture. Additional government regulations, including limitations or bans on the use of brominated flame retardants, could result in a decline in our net sales of brominated fire safety solutions and have an adverse effect on our sales and profitability. In addition, the threat of additional regulation or concern about the impact of brominated fire safety solutions on human health or the environment could lead to a negative reaction in our markets that could reduce or eliminate our markets for these products, which could have an adverse effect on our sales and profitability.
Our business and our customers are subject to significant requirements under REACH, which imposes obligations on E.U. manufacturers and importers of chemicals and other products into the E.U. to compile and file comprehensive reports, including testing data, on each chemical substance, and perform chemical safety assessments. Additionally, substances of high concern, as defined under REACH, are subject to an authorization process, which may result in restrictions in the use of products by application or even banning the product. REACH regulations impose significant additional burdens on chemical producers, importers, downstream users of chemical substances and preparations, and the entire supply chain. See “Regulation” in Item 1. Business. Our significant manufacturing presence and sales activities in the E.U. require significant compliance costs and may result in increases in the costs of raw materials we purchase and the products we sell. Increases in the costs of our products could result in a decrease in their overall demand; additionally, customers may seek products with lower regulatory compliance requirements, which could also result in a decrease in the demand of certain products subject to the REACH regulations.
The U.S. Toxic Substances Control Act (TSCA) requires chemicals to be assessed against a risk-based safety standard and calls for the elimination of unreasonable risks identified during risk evaluation. This regulation and other pending initiatives at the U.S. state level, as well as initiatives in Canada, Asia and other regions, could potentially require toxicological testing and risk assessments of a wide variety of chemicals, including chemicals used or produced by us. These assessments may result in heightened concerns about the chemicals involved and additional requirements being placed on the production, handling, labeling or use of the subject chemicals. Such concerns and additional requirements could also increase the cost incurred by our customers to use our chemical products and otherwise limit the use of these products, which could lead to a decrease in demand for these products. Such a decrease in demand could have an adverse impact on our business and results of operations.
We could be subject to damages based on claims brought against us by our customers or lose customers as a result of the failure of our products to meet certain quality specifications.
Our products enable important performance attributes of our customers’ products. If a product fails to perform in a manner consistent with quality specifications or has a shorter useful life than guaranteed, a customer of ours could seek the replacement of the product or damages for costs incurred as a result of the product failing to perform as guaranteed. These risks apply to our refinery catalysts in particular because, in certain instances, we sell our refinery catalysts under agreements that contain limited performance and life cycle guarantees. Also, because many of our products are integrated into our customers’ products, we may be requested to participate in, or fund in whole or in part the costs of, a product recall conducted by a customer. For example, some of our businesses supply products to customers in the automotive industry. In the event one of these customers conducts a product recall that it believes is related to one of our products, we may be asked to participate in, or fund in whole or in part, such a recall.
Our customers often require our subsidiaries to represent that our products conform to certain product specifications provided by our customers. Any failure to comply with such specifications could result in claims or legal action against us.
A successful claim or series of claims against us could have a material adverse effect on our financial condition and results of operations and could result in our loss of one or more customers.
Our business is subject to hazards common to chemical and natural resource extraction businesses, any of which could injure our employees or other persons, damage our facilities or other properties, interrupt our production and adversely affect our reputation and results of operations.
Our business is subject to hazards common to chemical manufacturing, storage, handling and transportation, as well as natural resource extraction, including explosions, fires, severe weather, natural disasters, mechanical failure, unscheduled downtime, transportation interruptions, remediation, chemical spills, discharges or releases of toxic or hazardous substances or gases and other risks. These hazards can cause personal injury and loss of life to our employees and other persons, severe damage to, or destruction of, property and equipment and environmental contamination. In addition, the occurrence of disruptions, shutdowns or other material operating problems at our facilities due to any of these hazards may diminish our ability to meet our output goals. Accordingly, these hazards and their consequences could adversely affect our reputation and have a material adverse effect on our operations as a whole, including our results of operations and cash flows, both during and after the period of operational difficulties.
| | | | | | | | |
| Albemarle Corporation and Subsidiaries |
|
Our business could be adversely affected by environmental, health and safety laws and regulations.
The nature of our business, including historical operations at our current and former facilities, exposes us to risks of liability under environmental laws and regulations due to the production, storage, use, transportation and sale of materials that can cause contamination or personal injury if released into the environment. In the jurisdictions in which we operate, we are subject to numerous U.S. and non-U.S. national, federal, state and local environmental, health and safety laws and regulations, including those governing the discharge of pollutants into the air and water, the management and disposal of hazardous substances and wastes and the cleanup of contaminated properties. We currently use, and in the past have used, hazardous substances at many of our facilities, and we have in the past been, and may in the future be, subject to claims relating to exposure to hazardous materials. We also have generated, and continue to generate, hazardous wastes at a number of our facilities. Some of our facilities also have lengthy histories of manufacturing or other activities that may have resulted in site contamination. Liabilities associated with the investigation and cleanup of hazardous substances, as well as personal injury, property damages or natural resource damages arising from the release of, or exposure to, such hazardous substances, may be imposed in many situations without regard to violations of laws or regulations or other fault, and may also be imposed jointly and severally (so that a responsible party may be held liable for more than its share of the losses involved, or even the entire loss). Such liabilities may also be imposed on many different entities, including, for example, current and prior property owners or operators, as well as entities that arranged for the disposal of the hazardous substances. Such liabilities may be material and can be difficult to identify or quantify.
Further, some of the raw materials we handle are subject to government regulation. These regulations affect the manufacturing processes, handling, uses and applications of our products. In addition, our production facilities and a number of our distribution centers require numerous operating permits. Due to the nature of these requirements and changes in our operations, our operations may exceed limits under permits or we may not have the proper permits to conduct our operations. Ongoing compliance with such laws, regulations and permits is an important consideration for us and we incur substantial capital and operating costs in our compliance efforts.
Compliance with environmental laws generally increases the costs of manufacturing, registration/approval requirements, transportation and storage of raw materials and finished products, and storage and disposal of wastes, and could have a material adverse effect on our results of operations. For example, we may be subject to carbon pricing or taxation proposals in some jurisdictions where we operate. We may incur substantial costs, including fines, damages, criminal or civil sanctions and remediation costs, or experience interruptions in our operations, for violations arising under these laws or permit requirements. Additional information may arise in the future concerning the nature or extent of our liability with respect to identified sites, and additional sites may be identified for which we are alleged to be liable, that could cause us to materially increase our environmental accrual or the upper range of the costs we believe we could reasonably incur for such matters. Furthermore, environmental laws are subject to change and have become increasingly stringent in recent years. We expect this trend to continue and to require materially increased capital expenditures and operating and compliance costs.
Certain of our operations could be adversely affected by local communities and/or other stakeholders.
Relationships with local communities and other stakeholders may impact our operations, particularly in Chile and Western Australia. We may become impacted by the interests of local communities and other stakeholders, including in some cases, indigenous peoples. Certain of these communities or other stakeholders may have or may develop interests or objectives which are different from, or even in conflict with, our objectives, including the use of our lands and waterways near our operations. Our relationships with the communities near our sites and other stakeholders are critical to the future success of our sites, as well as at any future development. There is an increasing level of public concern relating to the perceived effect of mining activities on the environment and on communities impacted by such activities. Publicity adverse to our operations, or the mining industry generally, could have an adverse effect on our development plans or future operations and may impact relationships with the communities in which we ultimately operate and other associated stakeholders.
We may in the future, be subject to disputes with local communities, including indigenous peoples, regarding the use of certain aspects of our assets, facilities and land and may in the future, be required to enter into settlement agreements providing for such use, on terms that include, among others, lump sum payments, royalty payments or restrictions on our business.
In addition, disputes surrounding indigenous land claims regarding lands on or near our operations could interfere with future operations and/or result in additional operating costs or restrictions, as well as adversely impact the use and enjoyment of our real property rights with respect to our assets.
While we are committed to operating in a socially responsible manner, there can be no assurance that our efforts in this respect will mitigate this potential risk. All the foregoing could have a material adverse effect on our business, financial
| | | | | | | | |
| Albemarle Corporation and Subsidiaries |
|
condition and results of operations, including, but not limited to, as a result of increased costs, reduced revenues, diversion of management attention, reputational harm, disruptions to our operations and other reasons.
We may be subject to indemnity claims and liable for other payments relating to properties or businesses we have divested.
In connection with the sale of certain properties and businesses, we have agreed to indemnify the purchasers of such properties for certain types of matters, such as certain breaches of representations and warranties, taxes and certain environmental matters. With respect to environmental matters, the discovery of contamination arising from properties that we have divested may expose us to indemnity obligations under the sale agreements with the buyers of such properties or cleanup obligations and other damages under applicable environmental laws. We may not have insurance coverage for such indemnity obligations or cash flows to make such indemnity or other payments. Further, we cannot predict the nature of and the amount of any indemnity or other obligations we may have to the applicable purchaser. Such payments may be costly and may adversely affect our financial condition and results of operations. For example, in 2021, we agreed to pay $665 million to settle claims related to a legacy Rockwood Holdings, Inc. (“Rockwood”) business sold to a third party prior to our acquisition of Rockwood in 2015.
At several of our properties where hazardous substances are known to exist (including some sites where hazardous substances are being investigated or remediated), we believe we are entitled to contractual indemnification from one or more former owners or operators; however, in the event we make a claim, the indemnifier may disagree with us regarding, or not have the financial capacity to fulfill, its indemnity obligation. If our contractual indemnity is not upheld or effective, our accrual and/or our costs for the investigation and cleanup of hazardous substances could increase materially.
We could be adversely affected by violations of the U.S. Foreign Corrupt Practices Act and similar foreign anti-corruption laws, and in the past have paid fines in order to resolve self-reported potential violations of such laws.
The U.S. Foreign Corrupt Practices Act (the “FCPA”) and similar foreign anti-corruption laws in other jurisdictions around the world generally prohibit companies and their intermediaries from making improper payments or providing anything of value to non-U.S. government officials for the purpose of obtaining or retaining business or securing an unfair advantage. We operate in some parts of the world that have experienced governmental corruption to some degree, and, in certain circumstances, strict compliance with anti-bribery laws may conflict with local customs and practices. Although we have established formal policies or procedures for prohibiting or monitoring this conduct, we cannot assure you that our employees or other agents will not engage in such conduct for which we might be held responsible. In the event that we believe or have reason to believe that our employees, agents or distributors have or may have violated applicable anti-corruption laws, including the FCPA, we may be required to investigate or have outside counsel investigate the relevant facts and circumstances, which can be expensive and require significant time and attention from senior management. If we are found to be liable for violations of the FCPA or other applicable anti-corruption laws (either due to our own acts or our inadvertence, or due to the acts or inadvertence of others, including employees of our joint ventures), we could suffer from civil and criminal penalties or other sanctions, which could have a material adverse effect on our business and results of operations.
In September 2023, following an internal investigation and voluntary self-reporting of potential violations of the FCPA, we finalized agreements with the U.S. Department of Justice (“DOJ”) and the SEC relative to improper payments made, prior to 2018, by third-party sales representatives of our Refining Solutions business (now Ketjen). In connection with this resolution, we entered into a non-prosecution agreement with the DOJ and an administrative resolution with the SEC, pursuant to which we paid a total of $218.5 million in aggregate fines, disgorgement, and prejudgment interest. We also agreed to certain ongoing compliance reporting obligations.
We are subject to extensive foreign government regulation that can negatively impact our business.
We are subject to government regulation in non-U.S. jurisdictions in which we conduct our business. The requirements for compliance with these laws and regulations may be unclear or indeterminate and may involve significant costs, including additional capital expenditures or increased operating expenses, or require changes in business practice, in each case that could result in reduced profitability for our business. Our having to comply with these foreign laws or regulations may provide a competitive advantage to competitors who are not subject to comparable restrictions or prevent us from taking advantage of growth opportunities. Determination of noncompliance can result in penalties or sanctions that could also adversely impact our operating results and financial condition.
Our inability to protect our intellectual property rights, or being accused of infringing on intellectual property rights of third parties, could have a material adverse effect on our business, financial condition and results of operations.
Protection of our proprietary processes, methods and compounds and other technology is important to our business. We generally rely on patent, trade secret, trademark and copyright laws of the U.S. and certain other countries in which our
| | | | | | | | |
| Albemarle Corporation and Subsidiaries |
|
products are produced or sold, as well as licenses and nondisclosure and confidentiality agreements, to protect our intellectual property rights. The patent, trade secret, trademark and copyright laws of some countries, or their enforcement, may not protect our intellectual property rights to the same extent as the laws of the U.S. Failure to protect our intellectual property rights may result in the loss of valuable proprietary technologies. Additionally, some of our technologies are not covered by any patent or patent application and, even if a patent application has been filed, it may not result in an issued patent. If patents are issued to us, those patents may not provide meaningful protection against competitors or against competitive technologies. We cannot assure you that our intellectual property rights will not be challenged, invalidated, circumvented or rendered unenforceable.
We also conduct research and development activities with third parties and license certain intellectual property rights from third parties and we plan to continue to do so in the future. We endeavor to license or otherwise obtain intellectual property rights on terms favorable to us. However, we may not be able to license or otherwise obtain intellectual property rights on such terms or at all. Our inability to license or otherwise obtain such intellectual property rights could have a material adverse effect on our ability to create a competitive advantage and create innovative solutions for our customers, which will adversely affect our net sales and our relationships with our customers.
We could face patent infringement claims from our competitors or others alleging that our processes or products infringe on their proprietary technologies. If we are found to be infringing on the proprietary technology of others, we may be liable for damages and we may be required to change our processes, redesign our products partially or completely, pay to use the technology of others, stop using certain technologies or stop producing the infringing product entirely. Even if we ultimately prevail in an infringement suit, the existence of the suit could prompt customers to switch to products that are not the subject of infringement suits. We may not prevail in intellectual property litigation and such litigation may result in significant legal costs or otherwise impede our ability to produce and distribute key products.
We also rely upon unpatented proprietary manufacturing expertise, continuing technological innovation and other trade secrets to develop and maintain our competitive position. While we generally enter into confidentiality agreements with our employees and third parties to protect our intellectual property, we cannot assure you that our confidentiality agreements will not be breached, that they will provide meaningful protection for our trade secrets and proprietary manufacturing expertise or that adequate remedies will be available in the event of an unauthorized use or disclosure of our trade secrets or manufacturing expertise. In addition, our trade secrets and know-how may be improperly obtained by other means, such as a breach of our information technologies security systems or direct theft.
Our inability to acquire or develop additional lithium reserves that are economically viable could have a material adverse effect on our future profitability.
Our lithium reserves will, without acquiring or developing additional reserves, decline as we continue to extract these raw materials. Accordingly, our future profitability depends upon our ability to operate in a way that optimizes extraction of raw materials from the reserves we have and acquire additional lithium reserves that are economically viable to replace the reserves we will extract. Exploration and development of lithium resources are highly speculative in nature. Exploration projects involve many risks, require substantial expenditures and may not result in the discovery of sufficient additional resources that can be extracted profitably. Once a site with potential resources is discovered, it may take several years of development until production is possible, during which time the economic viability of production may change. Substantial expenditures are required to establish recoverable proven and probable reserves and to construct extraction and production facilities. As a result, there is no assurance that current or future exploration programs will be successful and there is a risk that depletion of reserves will not be offset by discoveries or acquisitions.
We utilize feasibility studies to estimate the anticipated economic returns of an exploration project. The actual project profitability or economic feasibility may differ from such estimates as a result of factors such as, but not limited to, changes in volumes, grades and characteristics of resources to be mined and processed; changes in labor costs or availability of adequate and skilled labor force; the quality of the data on which engineering assumptions were made; adverse geotechnical conditions; availability, supply and cost of water and power; fluctuations in inflation and currency exchange rates; delays in obtaining environmental or other government permits or approvals or changes in the laws and regulations related to our operations or project development; changes in royalty agreements, laws and/or regulations around royalties and other taxes; and weather or severe climate impacts.
For our existing operations, we utilize geological, hydrogeological and metallurgical assumptions, financial projections and price estimates. These estimates are periodically updated to reflect changes in our operations, including modifications to our proven and probable reserves and mineralized material, revisions to environmental obligations, changes in legislation and/or social, political or economic environment, and other significant events associated with natural resource extraction operations. There are numerous uncertainties inherent in estimating quantities and qualities of lithium and costs to extract recoverable
| | | | | | | | |
| Albemarle Corporation and Subsidiaries |
|
reserves, including many factors beyond our control, that could cause results to differ materially from expected financial and operating results or result in future impairment charges. In addition, it cannot be assumed that any part or all of the inferred mineral resources will ever be converted into mineral reserves, as defined by the SEC. See Item 2. Properties, for a discussion and quantification of our current mineral resources and reserves.
There is risk to the growth of lithium markets.
Our lithium business is significantly dependent on the development and adoption of new applications for lithium batteries and the growth in demand for plug-in hybrid electric vehicles and battery electric vehicles. As such, our business results inherently depend on decarbonization of the global economy. To the extent that such development, adoption, decarbonization and growth do not occur in the volume and/or manner that we contemplate, including for reasons described under the heading “The development of non-lithium battery technologies could adversely affect us,” above, the long-term growth in the markets for lithium products may be adversely affected, which would have a material adverse effect on our business, financial condition and operating results.
Demand and market prices for lithium will greatly affect the value of our investment in our lithium resources and our revenues and profitability generally.
Our ability to successfully develop our lithium resources and generate a return on investment will be affected by changes in the demand for and market price of lithium-based end products, such as lithium hydroxide. The market price of these products can fluctuate and is affected by numerous factors beyond our control, primarily world supply and demand. Such external economic factors are influenced by changes in international investment patterns, various political developments and macro-economic circumstances.
In addition, the price of lithium products is impacted by their purity and performance. We may not be able to effectively mitigate against such fluctuations; although some of our long-term agreements include higher pricing, we are also party to index-referenced and variable-priced contracts. Lithium prices significantly decreased by approximately 85% to 95% from their high in January 2023 and remained at that lower level throughout 2024, which adversely impacted our financial results. High volatility or further declines in the lithium prices could have a material and adverse effect on the revenues and profitability of our Energy Storage business and on our company generally. In addition, a further decrease in lithium prices may lead to additional inventory valuation charges in the valuation period prior to when the goods are sold. For example, As a result of the decline in lithium market pricing, the Company recorded charges to reduce the value of certain finished goods and spodumene to their net realizable value, including a charge of $604.1 million during the year ended December 31, 2023. The balance of these adjustments to inventories was $104.0 million as of December 31, 2024.
Following the Wodgina acquisition in 2019, the Wodgina mine idled production of spodumene until market demand supported bringing the mine back into production in 2022. Additionally, in 2024, the Company announced that it was placing portions of its Kemerton project into care and maintenance and stopping construction on other portions, in an effort to optimize its cost structure in light of the depressed levels of lithium prices. Depending on market conditions and the Company’s cost structure, the Company may take additional actions in the future to idle production or halt construction activities at its mines or processing facilities due to lack of market demand or for other reasons.
If we are unable to retain key personnel or attract new skilled personnel, it could have an adverse effect on our business.
Our success depends on our ability to attract and retain key personnel including our management team. In light of the specialized and technical nature of our business, our performance is dependent on the continued service of, and on our ability to attract and retain, qualified management, scientific, technical, marketing and support personnel. Competition for such personnel is intense, and we may be unable to continue to attract or retain such personnel. In addition, because of our reliance on our senior management team, the unanticipated departure, death or disability of any key member of our management team could have an adverse effect on our business. Our future success depends, in part, on our ability to identify and develop or recruit talent to succeed our senior management and other key positions throughout the organization. If we fail to identify and develop or recruit successors, we are at risk of being harmed by the departures of these key employees. Effective succession planning is also important to our long-term success. Failure to ensure effective transfer of knowledge and smooth transitions involving key employees could hinder our strategic planning and execution. In addition, the U.S. and other regions in which we operate are experiencing an acute workforce shortage for skilled workers, which in turn has created a hyper-competitive wage environment that may impact our ability to attract and retain employees.
| | | | | | | | |
| Albemarle Corporation and Subsidiaries |
|
Some of our employees are unionized, represented by works councils or are employed subject to local laws that are less favorable to employers than the laws of the U.S.
As of December 31, 2024, we had approximately 8,300 employees, including employees of our consolidated joint ventures. Approximately 28% of these employees are represented by unions or works councils. In addition, a large number of our employees are employed in countries in which employment laws provide greater bargaining or other rights to employees than the laws of the U.S. Such employment rights require us to work collaboratively with the legal representatives of those employees to effect any changes to labor arrangements. For example, most of our employees in Europe are represented by works councils that must approve any changes in conditions of employment, including salaries and benefits and staff changes, and may impede efforts to restructure our workforce. Although we believe that we have a good working relationship with our employees, a strike, work stoppage, slowdown or significant dispute with our employees could result in a significant disruption of our operations or higher labor costs.
Our joint ventures may not operate according to their business plans if our partners fail to fulfill their obligations, which may adversely affect our results of operations and may force us to dedicate additional resources to these joint ventures.
We currently participate in a number of joint ventures and may enter into additional joint ventures in the future. The nature of a joint venture requires us to share control with unaffiliated third parties. We apply the equity method of accounting to joint ventures when we have the ability to exercise significant influence over the operational decision-making authority and financial policies of the investee but we do not exercise control. Our equity method investees are governed by their own board of directors, whose members have fiduciary duties to the investees’' shareholders. While we have certain rights to appoint representatives to the investees’ boards of directors, the interests of the investees’ shareholders may not align with our interests or the interests of our shareholders and strategic and contractual disputes may arise.
We are generally dependent on the management team of our equity method investees to operate and control such projects or businesses. While we may exert influence pursuant to our positions, as applicable, on the boards of directors and through certain limited governance or oversight roles, such influence may be limited. If our joint venture partners do not fulfill their obligations, the affected joint venture may not be able to operate according to its business plan. In that case, our results of operations may be adversely affected and we may be required to materially change the level of our commitment to the joint venture. Also, differences in views among joint venture participants may result in delayed decisions or failures to agree on major issues. If these differences cause the joint ventures to deviate from their business plans, our results of operations could be adversely affected.
Risks Related to Our Financial Condition
Our required capital expenditures can be complex, may experience delays or other difficulties, and the costs may exceed our estimates.
Our capital expenditures generally consist of expenditures to maintain and improve existing equipment, facilities and properties, and substantial investments in new or expanded equipment, facilities and properties. Execution of these capital expenditures can be complex, and commencement of production requires start-up, commission and certification of product quality by our customers, which may impact the expected output and timing of sales of product from such facilities. Construction of large chemical operations is subject to numerous risks and uncertainties, including, among others, the ability to complete a project on a timely basis and in accordance with the estimated budget for such projects and our ability to estimate future demand for our products. In addition, our returns on these capital expenditures may not meet our expectations. Budgets for certain projects can include government funding, which help support a portion of the anticipated construction costs. Any change to the government budgetary priorities could adversely affect the funding for these projects or our ability to apply for funding.
Future capital expenditures may be significantly higher, depending on the investment requirements of each of our business lines, and may also vary substantially if we are required to undertake actions to compete with new technologies in our industry. We may not have the capital necessary to undertake these capital investments. If we are unable to do so, we may not be able to effectively compete in some of our markets.
Our indebtedness could adversely affect our financial health and our ability to execute our business strategy, and we will need a significant amount of cash to service our indebtedness.
As of December 31, 2024, our aggregate long-term debt was $3.5 billion, primarily related to senior notes. We expect to maintain significant levels of indebtedness going forward. Our indebtedness could have important consequences including:
| | | | | | | | |
| Albemarle Corporation and Subsidiaries |
|
•making it more difficult for us to satisfy our obligations with respect to our debt, and any failure to comply with the obligations under our debt instruments, including restrictive covenants, could result in an event of default under the indenture governing our senior notes, the 2022 Credit Agreement or agreements governing future indebtedness;
•increasing the risk of a credit ratings downgrade of our debt, which could increase future debt costs and limit the future availability of debt financing;
•increasing our vulnerability to adverse general economic and industry conditions;
•reducing the cash flow available to fund capital expenditures and other corporate purposes and to grow our business;
•limiting our flexibility in planning for, or reacting to, changes in our business, the economy and our industry;
•placing us at a competitive disadvantage compared to our competitors with less indebtedness;
•making it more difficult to borrow additional funds in the future to fund growth, acquisitions, working capital, capital expenditures and other purposes; and
•potentially requiring us to dedicate a substantial portion of our cash flow from operations to payments on our indebtedness, thereby reducing the availability of our cash flow to fund our other business needs.
Our ability to generate sufficient cash flow from operations or use existing cash balances to make scheduled payments on our debt depends on our future performance, which is subject to a range of economic, competitive and business factors, many of which are outside our control. Our business may not generate sufficient cash flow from operations to service our debt obligations. If we are unable to service our debt obligations, we may need to refinance all or a portion of our indebtedness on or before maturity, reduce or delay capital expenditures, sell assets or raise additional equity. We may not be able to refinance any of our indebtedness, sell assets or raise additional equity on commercially reasonable terms or at all, which could cause us to default on our obligations and impair our liquidity. Our inability to generate sufficient cash flow or use existing cash balances to satisfy our debt obligations, or to refinance our obligations on commercially reasonable terms, could have a material adverse effect on our business and financial condition.
Because a significant portion of our operations is conducted through our subsidiaries and joint ventures, our ability to service our debt may be dependent on our receipt of distributions or other payments from our subsidiaries and joint ventures.
A significant portion of our operations is conducted through our subsidiaries and joint ventures. As a result, our ability to service our debt may be partially dependent on the earnings of our subsidiaries and joint ventures and the payment of those earnings to us in the form of dividends, loans or advances and through repayment of loans or advances from us. Payments to us by our subsidiaries and joint ventures are contingent upon our subsidiaries’ or joint ventures’ earnings and other business considerations and may be subject to statutory or contractual restrictions. In addition, there may be significant tax and other legal restrictions on the ability of our non-U.S. subsidiaries or joint ventures to remit money to us.
Restrictive covenants in our debt instruments may adversely affect our business.
Our senior credit facilities and the indentures governing our senior notes contain select restrictive covenants. These covenants provide constraints on our financial flexibility. The 2022 Credit Agreement requires the Company to maintain (i) a certain ratio of consolidated net funded debt (plus a proportionate amount of Windfield’s net funded debt) to Windfield-Adjusted EBITDA (as defined in the agreement) and (ii) a certain ratio of consolidated EBITDA to consolidated interest charges. In the past, we have been able to renegotiate and amend the covenants in 2022 Credit Agreement in order to maintain compliance, but there can be no assurance that in the future we would be able to further amend them if needed. The failure to comply with these or other covenants governing other indebtedness, including indebtedness incurred in the future, could result in an event of default, which, if not cured or waived, could have a material adverse effect on our business, financial condition and results of operations, including cross-defaults to other debt facilities. See “Financial Condition and Liquidity—Long-Term Debt” in Item 7. Management’s Discussion and Analysis of Financial Condition and Results of Operations for further descriptions of our 2022 Credit Agreement covenants.
Changes in credit ratings issued by nationally recognized statistical rating organizations could adversely affect our cost of financing, the market price of our securities and our debt service obligations.
Credit rating agencies rate our debt securities on factors that include our operating results, actions that we take, their view of the general outlook for our industry and their view of the general outlook for the economy. Actions taken by the rating agencies can include maintaining, upgrading or downgrading the current rating or placing us on a watch list for possible future downgrades. During 2024, the Company’s ratings were downgraded by two of the three main credit ratings agencies, resulting in the increase of the applicable margin for borrowings under the 2022 Credit Agreement to 1.20%. Further watches, reviews or downgrades could occur. Downgrading the credit rating of our debt securities or placing us on a watch list for possible future downgrades would likely increase our cost of future financing, including under our 2022 Credit Agreement and our commercial paper program, limits our access to the capital markets and has an adverse effect on the market price of our securities.
| | | | | | | | |
| Albemarle Corporation and Subsidiaries |
|
Borrowings under a portion of our debt facilities bear interest at floating rates, and are subject to adjustment based on the ratings of our senior unsecured long-term debt. The downgrading of any of our ratings or an increase in any of the benchmark interest rates would result in an increase of the interest expense on our variable rate borrowings.
Write-offs or impairment of our goodwill, intangible assets or long-lived assets can result in significant charges to earnings.
Under U.S. Generally Accepted Accounting Principles (“GAAP”), we review our intangible assets and long-lived assets for impairment when events or changes in circumstances indicate the carrying value may not be recoverable. Goodwill is tested for impairment on October 31 of each year, or more frequently if required. Factors that may be considered a change in circumstances, indicating that the carrying value of our goodwill, intangible assets or long-lived assets may not be recoverable, include, but are not limited to, a decline in our stock price and market capitalization, reduced future cash flow estimates, and slower growth rates in our industry. During 2024, we made the decision to stop construction of Kemerton conversion plant Trains 3 and 4, and put Kemerton Train 2 into care and maintenance. We determined these actions to be a triggering event for a review of impairment of our Energy Storage reporting unit goodwill and associated long-lived asset groups. Although this review did not result in any impairment to goodwill or long-lived assets, the write-off of the assets with no future economic value resulted in charges of $1.0 billion in 2024. As we continue our review of our cost and operating structure, we may be required to record additional charges in our financial statements during the period in which any impairment of our goodwill, intangible assets or long-lived assets is determined, negatively impacting our results of operations and financial condition.
Our business could suffer if we are not successful in executing our strategy and initiatives in connection with our comprehensive review of our cost and operating structure.
In January 2024, we announced that we were undertaking proactive measures to optimize our cost structure in response to changing end-market conditions, particularly in the lithium value chain. These measures have included an ongoing comprehensive review of our cost and operating structure, in connection with which we placed Kemerton Train 2 in care and maintenance and stopped construction on Kemerton Trains 3 and 4, and initiated a global workforce reduction that impacted 6-7% of total headcount. These actions are intended to deliver significant cost savings and enhance our long-term competitiveness. However, there are no assurances that we will achieve these aims to the extent we expect, within the anticipated timeframes or at all. In addition, any cost savings that we realize may be offset, in whole or in part, by reductions in net sales or through increases in other expenses. Failure to realize the expected cost savings from our cost optimization efforts could have an adverse effect on our business, financial condition, and results of operations.
We are exposed to fluctuations in currency exchange rates, which may adversely affect our operating results and net income.
We conduct our business and incur costs in the local currency of most of the countries in which we operate. Changes in exchange rates between foreign currencies and the U.S. Dollar will affect the recorded levels of our assets, liabilities, net sales, cost of goods sold and operating margins and could result in exchange losses. The primary currencies to which we have exposure are the Chinese Renminbi, Euro and Australian Dollar. Exchange rates between these currencies and the U.S. Dollar in recent years have fluctuated significantly and may do so in the future. With respect to our potential exposure to foreign currency fluctuations and devaluations, for the year ended December 31, 2024, approximately 39% of our net sales were denominated in currencies other than the U.S. Dollar. Significant changes in these foreign currencies relative to the U.S. Dollar could also have an adverse effect on our ability to meet interest and principal payments on any foreign currency-denominated debt outstanding. In addition to currency translation risks, we incur currency transaction risks whenever one of our operating subsidiaries or joint ventures enters into either a purchase or a sales transaction using a different currency from its functional currency. Our operating results and net income may be affected by any volatility in currency exchange rates and our ability to manage effectively our currency transaction and translation risks.
Significant or prolonged periods of higher interest rates may have an adverse effect on our results of operations, financial condition and cash flows.
Interest rates may have a direct impact on our business to the extent we borrow under our unsecured credit facility, utilize our commercial paper program, or incur other forms of variable rate indebtedness or new indebtedness based on current interest rates. Borrowings under our unsecured credit facility bear interest at variable rates based on a benchmark rate depending on the currency in which the loans are denominated, plus an applicable margin, which ranges from 0.910% to 1.375%, depending on the Company’s credit rating. In May 2013, we entered into agreements to initiate a commercial paper program under which we may issue unsecured commercial paper notes from time-to-time in a maximum aggregate principal amount outstanding at any time of up to $1.5 billion (up from $750 million prior to the May 2023 increase).
| | | | | | | | |
| Albemarle Corporation and Subsidiaries |
|
In a rising interest rate environment, debt financing will become more expensive and may have higher transactional and servicing costs. Although we may take steps to limit our exposure to variable rate debt, if interest rates remain relatively high or increase in the future, we could see increases in our borrowing costs which could have a material adverse effect on our results of operations, financial condition and cash flows.
Inflationary trends in the price of our input costs, such as raw materials, transportation and energy, could adversely affect our business and financial results.
We have experienced, and may continue to experience, volatility and increases in the price of certain raw materials and in transportation and energy costs as a result of global market and supply chain disruptions and the broader inflationary environment.
If we are unable to increase the prices to our customers of our products to offset inflationary cost trends, or if we are unable to achieve cost savings to offset such cost increases, we could fail to meet our cost expectations, and our profits and operating results could be adversely affected. Our ability to price our products competitively to timely reflect higher input costs is critical to maintain and grow our sales. Increases in prices of our products to customers or the impact of the broader inflationary environment on our customers and may lead to declines in demand and sales volumes. Further, we may not be able to accurately predict the volume impact of price increases, especially if our competitors are able to more successfully adjust to such input cost volatility. Increasing our prices to our customers could result in long-term sales declines or loss of market share if our customers find alternative suppliers or purchase less of our products, which could have an adverse long-term impact on our results of operations.
Changes in, or the interpretation of, tax legislation or rates throughout the world could materially impact our results.
Our effective tax rate and related tax balance sheet attributes could be impacted by changes in tax legislation throughout the world. For example, the Inflation Reduction Act of 2022 (the “Inflation Reduction Act”), enacted August 16, 2022, among other items, imposed a 15% alternative minimum tax on corporations with three-year average annual adjusted financial statement income exceeding $1 billion and introduces or extends a number of tax credits to promote clean energy development. We continue to monitor the effects of the Inflation Reduction Act and other regulatory developments on our financial condition, operating results, and income tax rate. Currently, the majority of our net sales are generated from customers located outside the U.S., and a substantial portion of our assets and employees are located outside of the U.S.
We have not accrued income taxes or foreign withholding taxes on undistributed earnings for most non-U.S. subsidiaries, because those earnings are intended to be indefinitely reinvested in the operations of those subsidiaries. Certain tax proposals with respect to such earnings could substantially increase our tax expense, which would substantially reduce our income and have a material adverse effect on our results of operations and cash flows from operating activities.
Our future effective tax rates could be affected by changes in the mix of earnings in countries with differing statutory tax rates, expirations of tax holidays or rulings, changes in the assessment regarding the realization of the valuation of deferred tax assets, or changes in tax laws and regulations or their interpretation. Recent developments, including the European Commission’s investigations on illegal state aid, as well as the Organisation for Economic Co-operation and Development (“OECD”) project on Base Erosion and Profit Shifting may result in changes to long-standing tax principles, which could adversely affect our effective tax rates or result in higher cash tax liabilities. The OECD developed a global tax framework inclusive of a 15% global minimum tax under the Pillar Two Global Anti-Base Erosion Rules (“Pillar Two”). The E.U.’s Pillar Two Directive was effective as of January 1, 2024 for certain aspects of the directive, with the remaining aspects effective on January 1, 2025. Other major jurisdictions are actively considering and implementing changes to their tax laws to adopt certain parts of the OECD’s proposals. We have assessed this framework and determined, based upon available guidance, that these changes could have a material impact to our results of operations, but it is dependent on our ongoing mix of earnings. Any future changes in OECD guidance or interpretations, including local country tax legislative changes thereof could impact our initial assessment; therefore, we will continue to monitor and refine our assessment as further guidance is made available.
We are subject to the regular examination of our income tax returns by various tax authorities. Examinations in material jurisdictions or changes in laws, rules, regulations or interpretations by local taxing authorities could result in impacts to tax years open under statute or to foreign operating structures currently in place. We regularly assess the likelihood of adverse outcomes resulting from these examinations or changes in laws, rules, regulations or interpretations to determine the adequacy of our provision for taxes. It is possible the outcomes from these examinations will have a material adverse effect on our financial condition and operating results.
| | | | | | | | |
| Albemarle Corporation and Subsidiaries |
|
Future events may impact our deferred tax asset position and U.S. deferred federal income taxes on undistributed earnings of international affiliates that are considered to be indefinitely reinvested.
We evaluate our ability to utilize deferred tax assets and our need for valuation allowances based on available evidence. This process involves significant management judgment about assumptions that are subject to change from period to period based on changes in tax laws or variances between future projected operating performance and actual results. We are required to establish a valuation allowance for deferred tax assets if we determine, based on available evidence at the time the determination is made, that it is more likely than not that some portion or all of the deferred tax assets will not be utilized. In making this determination, we evaluate all positive and negative evidence as of the end of each reporting period. Future adjustments (either increases or decreases) to the deferred tax asset valuation allowance are determined based upon changes in the expected realization of the net deferred tax assets. The utilization of our deferred tax assets ultimately depends on the existence of sufficient taxable income in either the carry-back or carry-forward periods under the applicable tax law. Due to significant estimates used to establish the valuation allowance and the potential for changes in facts and circumstances, it is reasonably possible that we will be required to record adjustments to the valuation allowance in future reporting periods. Changes to the valuation allowance or the amount of deferred tax liabilities could have a materially adverse effect on our business, financial condition and results of operations. Further, should we change our assertion regarding the permanent reinvestment of the undistributed earnings in foreign operations, a deferred tax liability may need to be established.
Our business and financial results may be adversely affected by various legal and regulatory proceedings.
We are involved from time to time in legal and regulatory proceedings, which may be material in the future. The outcome of proceedings, lawsuits and claims may differ from our expectations, leading us to change estimates of liabilities and related insurance receivables.
Legal and regulatory proceedings, whether with or without merit, and associated internal investigations, may be time-consuming and expensive to prosecute, defend or conduct, may divert management’s attention and other resources, inhibit our ability to sell our products, result in adverse judgments for damages, injunctive relief, penalties and fines, and otherwise negatively affect our business.
Although our pension plans currently meet minimum funding requirements, events could occur that would require us to make significant contributions to the plans and reduce the cash available for our business.
We have several defined benefit pension plans around the world, including in the U.S., U.K., Germany, Belgium and Japan. We are required to make cash contributions to our pension plans to the extent necessary to comply with minimum funding requirements imposed by the various countries’ benefit and tax laws. The amount of any such required contributions will be determined annually based on an actuarial valuation of the plans as performed by the plans’ actuaries.
In previous years, we have made voluntary contributions to our U.S. qualified defined benefit pension plans. We anticipate approximately $9 million of required cash contributions during 2025 for our defined benefit pension plans. Additional voluntary pension contributions in and after 2025 may vary depending on factors such as asset returns, interest rates, and legislative changes. The amounts we may elect or be required to contribute to our pension plans in the future may increase significantly. These contributions could be substantial and would reduce the cash available for our business.
Further, an economic downturn or recession or market disruption in the capital and credit markets may adversely impact the value of our pension plan assets, our results of operations, our statement of changes in stockholders’ equity and our liquidity. Our funding obligations could change significantly based on the investment performance of the pension plan assets and changes in actuarial assumptions for local statutory funding valuations. Any deterioration of the capital markets or returns available in such markets may negatively impact our pension plan assets and increase our funding obligations for one or more of these plans and negatively impact our liquidity. We cannot predict the impact of this or any further market disruption on our pension funding obligations.
We may not be able to consummate future acquisitions or integrate acquisitions into our business, which could result in unanticipated expenses and losses.
We believe that our customers are increasingly looking for strong, long-term relationships with a few key suppliers that help them improve product performance, reduce costs, and support new product development. To satisfy these growing customer requirements, our competitors have been consolidating within product lines through mergers and acquisitions.
As part of our business growth strategy, we have acquired businesses and entered into joint ventures in the past and intend to pursue acquisitions and joint venture opportunities in the future. Our ability to implement this component of our growth strategy will be limited by our ability to identify appropriate acquisition or joint venture candidates and our financial
| | | | | | | | |
| Albemarle Corporation and Subsidiaries |
|
resources, including available cash and borrowing capacity. The expense incurred in consummating acquisitions or entering into joint ventures, the time it takes to integrate an acquisition or our failure to integrate businesses successfully, could result in unanticipated expenses and losses. Furthermore, we may not be able to realize any of the anticipated benefits from acquisitions or joint ventures.
The process of integrating acquired operations into our existing operations may result in unforeseen operating difficulties and may require significant financial resources that would otherwise be available for the ongoing development or expansion of existing operations. Some of the risks associated with the integration of acquisitions include:
•potential disruption of our ongoing business and distraction of management;
•unforeseen claims and liabilities, including unexpected environmental exposures and litigation arising from acquisitions;
•unforeseen adjustments, charges and write-offs;
•problems enforcing the indemnification obligations of sellers of businesses or joint venture partners for claims and liabilities;
•unexpected losses of customers of, or suppliers to, the acquired business;
•difficulty in conforming the acquired businesses’ standards, processes, procedures and controls with our operations;
•in the case of foreign acquisitions, the need to integrate operations across different cultures and languages and to address the particular economic, currency, political and regulatory risks associated with specific countries;
•variability in financial information arising from the implementation of purchase price accounting;
•inability to coordinate new product and process development;
•loss of senior managers and other critical personnel and problems with new labor unions and cultural challenges associated with integrating employees from the acquired company into our organization;
•diversion of management’s attention from other business matters; and
•challenges arising from the increased scope, geographic diversity and complexity of our operations.
Any such integration failure could disrupt our business and have a material adverse effect on our consolidated financial condition and results of operations. Moreover, from time to time, we may enter into negotiations for a proposed acquisition, but be unable or unwilling to consummate the acquisition under consideration. This could cause significant diversion of management’s attention and out-of-pocket expenses.
We may continue to expand our business through acquisitions and we may incur additional indebtedness, including indebtedness related to acquisitions.
We have historically expanded our business primarily through acquisitions. A part of our business strategy is to continue to grow through acquisitions that complement our existing technologies and accelerate our growth. Our credit facilities have limited financial maintenance covenants. In addition, the indenture and other agreements governing our senior notes do not limit our ability to incur additional indebtedness in connection with acquisitions or otherwise. As a result, we may incur substantial additional indebtedness in connection with acquisitions.
Any such additional indebtedness and the related debt service obligations (whether or not arising from acquisitions) could have important consequences and risks for us, including:
•reducing flexibility in planning for, or reacting to, changes in our businesses, the competitive environment and the industries in which we operate, and to technological and other changes;
•lowering credit ratings;
•reducing access to capital and increasing borrowing costs generally or for any additional indebtedness to finance future operating and capital expenses and for general corporate purposes;
•to the extent that our debt is subject to floating interest rates, increasing our vulnerability to fluctuations in market interest rates;
•reducing funds available for operations, capital expenditures, share repurchases, dividends and other activities; and
•creating competitive disadvantages relative to other companies with lower debt level.
| | | | | | | | |
| Albemarle Corporation and Subsidiaries |
|
General Risk Factors
Adverse conditions in the economy, and volatility and disruption of financial markets can negatively impact our customers, suppliers and other business partners and therefore have a material adverse effect on our business and results of operations.
A global, regional or localized economic downturn may reduce customer demand or inhibit our ability to produce our products, negatively impacting our operating results. Our business and operating results have been and will continue to be sensitive to the many challenges that can affect national, regional and global economies, including economic downturns (including credit market tightness, which can impact our liquidity as well as that of our customers, suppliers and other business partners), declining consumer and business confidence, fluctuating commodity prices and volatile exchange rates. Our customers may experience deterioration of their businesses, cash flow shortages and difficulty obtaining financing, leading them to delay or cancel plans to purchase products, and they may not be able to fulfill their obligations in a timely fashion or may seek to renegotiate current arrangements to suit their circumstances. Further, suppliers and other business partners may experience similar conditions, which could impact their ability to fulfill their obligations to us. Also, it could be difficult to find replacements for business partners without incurring significant delays or cost increases. Finally, any such adverse conditions in the economy and financial markets could make it difficult for us to raise debt or equity capital on favorable terms.
Our business and operations could suffer in the event of cybersecurity breaches, information technology system failures, or network disruptions.
We and our third-party service providers have been and will continue to be subject to advanced and persistent threats in the areas of information and operational technology security and fraud, which may become more sophisticated over time. These attempts, which might be related to industrial or other espionage, include covertly introducing malware to computers and networks and impersonating authorized users, among others. We seek to detect and investigate all security incidents and to prevent their recurrence, as well as work with third-party service providers on detection of, and alerting us to, any incidents affecting us, but in some cases we might be unaware of an incident or its magnitude and effects. The theft, unauthorized use or publication of our intellectual property and/or confidential business information could harm our competitive position, reduce the value of our investment in research and development and other strategic initiatives or otherwise adversely affect our business. To the extent that a cybersecurity breach results in inappropriate disclosure of our employees’, customers’ or licensees’ confidential or personal information, we may incur liability as a result. The devotion of additional resources to the security of our information technology systems in the future could significantly increase the cost of doing business or otherwise adversely impact our financial results.
In addition, risks associated with information technology systems failures or network disruptions, including risks associated with upgrading our systems or in successfully integrating information technology and other systems in connection with the integration of businesses we acquire, or vulnerabilities in our third-party service providers’ systems, could disrupt our operations by impeding our processing of transactions, financial reporting and our ability to protect our customer or company information, which could adversely affect our business and results of operations. Additionally, we face increased information technology security and fraud risks due to our increased reliance on working remotely during the COVID-19 pandemic and beyond, which may create additional information security vulnerabilities and/or magnify the impact of any disruption in information technology systems. Finally, we can provide no assurance that the networks and systems that our third-party service providers have established or use will be effective.
Although we have implemented certain processes, procedures and internal controls to help mitigate cybersecurity risks and cyber intrusions, these measures, as well as our increased awareness of the nature and extent of a risk of a cyber incident, do not guarantee that our financial results, operations or confidential information will not be negatively impacted by such an incident.
The occurrence or threat of extraordinary events, including domestic and international terrorist attacks, may disrupt our operations and decrease demand for our products.
Chemical-related assets may be at greater risk of future terrorist attacks than other possible targets in the U.S. and around the world. As a result, we are subject to existing federal rules and regulations (and may be subject to additional legislation or regulations in the future) that impose site security requirements on chemical manufacturing facilities, which increase our overhead expenses.
We are also subject to federal regulations that have heightened security requirements for the transportation of hazardous chemicals in the U.S. We believe we have met these requirements but additional federal and local regulations that limit the distribution of hazardous materials are being considered. We ship and receive materials that are classified as hazardous. Bans on movement of hazardous materials through cities, like Washington, D.C., could affect the efficiency of our logistical
| | | | | | | | |
| Albemarle Corporation and Subsidiaries |
|
operations. Broader restrictions on hazardous material movements could lead to additional investment to produce hazardous raw materials and change where and what products we manufacture.
The Chemical Facility Anti-Terrorism Standards program (“CFATS Program”), which is administered by the Department of Homeland Security (“DHS”), identifies and regulates chemical facilities to ensure that they have security measures in place to reduce the risks associated with potential terrorist attacks on chemical plants located in the U.S. DHS has enacted rules under the CFATS Program that impose comprehensive federal security regulations for high-risk chemical facilities in possession of specified quantities of chemicals of interest. These rules establish risk-based performance standards for the security of the U.S.’s chemical facilities. They require covered chemical facilities to prepare Security Vulnerability Assessments, which identify facility security vulnerabilities, and to develop and implement Site Security Plans, which include measures that satisfy the identified risk-based performance standards. We have implemented all necessary changes to comply with the rules under the CFATS Program to date, however, we cannot determine with certainty any future costs associated with any additional security measures that DHS may require.
The occurrence of extraordinary events, including future terrorist attacks and the outbreak or escalation of hostilities, cannot be predicted, and their occurrence can be expected to continue to negatively affect the economy in general, and the markets for our products in particular. The resulting damage from a direct attack on our assets, or assets used by us, could include loss of life and property damage. In addition, available insurance coverage may not be sufficient to cover all of the damage incurred or, if available, may be prohibitively expensive.
National or international disputes, political instability, terrorism war or armed hostilities, could impact our results of operations.
Geo-political events, national or international disputes, political instability, terrorism or other acts of violence, war or armed hostilities may cause damage or disruption to our operations, international commerce and the global economy. Such geo-political instability and uncertainty could have a negative impact on our ability to conduct business in certain regions based on trade restrictions, embargoes and export control law restrictions, and logistics restrictions, and could increase the costs, risks and adverse impacts from these new challenges. We may also be the subject of increased cybersecurity breaches arising from geo-political instability. Any such events may also have the effect of heightening many of the other risks described herein, such as those relating to capital markets, raw materials, energy and freight costs, our supply chain, information security and market conditions, any of which could negatively affect our businesses, financial condition, results of operations and cash flows.
The U.S. government and other nations have imposed significant restrictions on most companies’ ability to do business in Russia as a result of the military conflict between Russia and Ukraine. It is not possible to predict the broader or longer-term consequences of this conflict, which could include further sanctions, embargoes, regional instability, energy shortages, geopolitical shifts and adverse effects on macroeconomic conditions, security conditions, currency exchange rates and financial markets. We currently do not sell our products into Russia nor have assets or any operations in the country, however, a significant escalation or expansion of economic disruption or the conflict’s current scope could have a material adverse effect on our results of operations due to its impact in the countries in which we do conduct business.
At this time, the current situation in the Middle East has resulted in our business operations continuing as normal with some shipping and raw material delays. However, the geo-political climate remains volatile and a disruption could occur at any time, potentially causing a financial impact to our business.
Natural disasters or other unanticipated catastrophes could impact our operations and could have a material adverse effect on our results of operations, financial position, and cash flows.
The occurrence of natural disasters, such as hurricanes, floods, droughts, extreme heat, storms or earthquakes; pandemics, such as the COVID-19 pandemic; or other unanticipated catastrophes at any of the locations in which we or our key partners, suppliers, or customers do business could cause interruptions in our operations. Historically, major hurricanes have caused significant disruption to the operations on the U.S. Gulf Coast for many of our customers and certain of our suppliers of raw materials, which has had an adverse impact on volume and cost for some of our products. Our operations in Chile could be subject to significant rain events and earthquakes, and our operations in Asia could be subject to weather events such as typhoons. A global or regional pandemic or similar outbreak in a region in which we or our key partners, customers, or suppliers operate could disrupt business, depending on factors including, but not limited to, the duration and severity of the pandemic, government restrictions on businesses and individuals, impact on demand for our products, impact on the supply chain network, and the health and safety of our employees and the communities in which we do business. If similar or other weather events, natural disasters, or other catastrophic events occur in the future, they could negatively affect the results of operations at our sites in the affected regions as well as have adverse impacts on the global economy.
| | | | | | | | |
| Albemarle Corporation and Subsidiaries |
|
Our insurance may not fully cover all potential exposures.
We maintain property, business interruption, casualty, and other insurance, but such insurance may not cover all risks associated with the hazards of our business and is subject to limitations, including deductibles and coverage limits. We may incur losses beyond the limits, or outside the coverage, of our insurance policies, including liabilities for environmental remediation. In addition, from time to time, various types of insurance for companies in the specialty chemical industry have not been available on commercially acceptable terms or, in some cases, have not been available at all. We are potentially at additional risk if one or more of our insurance carriers fail. Additionally, severe disruptions in the domestic and global financial markets could adversely impact the ratings and survival of some insurers. Future downgrades in the ratings of enough insurers could adversely impact both the availability of appropriate insurance coverage and its cost. In the future, we may not be able to obtain coverage at current levels, if at all, and our premiums may increase significantly on coverage that we maintain.
We may be exposed to certain physical, transitional, regulatory and financial risks related to climate change.
Impacts of climate change include changes in rainfall and in storm patterns and intensities, water shortages, significantly changing sea levels and increasing atmospheric and water temperatures, among others. For example, there have been concerns regarding the declining water level of the Dead Sea, from which our joint venture, JBC, produces bromine. Climate changes and unprecedented weather events may pose a risk to business operations in vulnerable areas. In some regions including China, extreme heat and drought conditions could also impact the availability of hydropower resulting in decreased production and/or increased costs. Storms could cause business interruptions, incur additional restoration costs, and impact product availability and pricing. Disruptions to the global supply chain due to climate related impacts or geopolitical events are possible and exist as external risk factors that we can respond to but not control. These events could limit the supply of key raw materials to us, or could have significant impacts to pricing. We work with numerous independent suppliers to mitigate lack of availability from a single supplier, however in some cases products with limited numbers of suppliers may become difficult to obtain.
Potential transition risks related to climate change include increased battery regulation, potential loss of customers due to climate-related performance, and increased costs related to carbon pricing. Growing concerns about climate change may result in the imposition of additional regulations or restrictions to which we may become subject. A number of governments or governmental bodies have introduced or are contemplating regulatory changes in response to climate change, including regulating greenhouse gas emissions. Potentially, additional U.S. federal regulation will be forthcoming with respect to greenhouse gas emissions (including carbon dioxide) and/or “cap and trade” legislation that could impact our operations. In addition, we have operations in the E.U., Brazil, China, Japan, Jordan, Saudi Arabia, Singapore and the United Arab Emirates, which have implemented, or may implement, measures to achieve objectives under the 2015 Paris Climate Agreement, an international agreement linked to the United Nations Framework Convention on Climate Change (“UNFCC”), which set targets for reducing greenhouse gas emissions. Significant regional or national differences in approaches to environmental laws and regulations could affect us disproportionately compared to our competitors and result in a competitive disadvantage to us.
The outcome of new legislation or regulation in the U.S. and other jurisdictions in which we operate may result in new or additional requirements, additional charges to fund energy efficiency activities, and fees or restrictions on certain activities. We may have heightened credit risk due to our exposure to climate risks. While certain climate change initiatives may result in new business opportunities for us in the area of alternative fuel technologies and emissions control, compliance with these initiatives may also result in additional costs to us, including, among other things, increased production costs, additional taxes, reduced emission allowances or additional restrictions on production or operations. Any adopted future climate change regulations could also negatively impact our ability to compete with companies situated in areas not subject to such limitations. Even without such regulation, increased public awareness and adverse publicity about potential impacts on climate change emanating from us or our industry could harm us. We may not be able to recover the cost of compliance with new or more stringent laws and regulations, which could adversely affect our business and negatively impact our growth. Furthermore, the potential impact of climate change and related regulation, market trends or litigation on the Company is highly uncertain and there can be no assurance that it will not have an adverse effect on our financial condition and results of operations.
Failure to meet sustainability expectations or standards or achieve our sustainability goals could adversely affect our business, results of operations, financial condition, or stock price.
In recent years, there has been an increased focus from stakeholders, regulators and the public in general on sustainability matters, including greenhouse gas emissions and climate-related risks, renewable energy, water stewardship, waste management, diversity, equality and inclusion, responsible sourcing and supply chain, human rights, and social responsibility. Given our commitment to sustainability, we actively manage these issues and have established and publicly announced certain goals, commitments, and targets which we may refine further in the future. These goals, commitments, and targets reflect our current plans and aspirations and are not guarantees that we will be able to achieve them. Evolving stakeholder expectations, regulatory obligations, economic conditions and our efforts to manage these issues, report on them, and accomplish our goals
| | | | | | | | |
| Albemarle Corporation and Subsidiaries |
|
present numerous operational, regulatory, reputational, financial, legal, and other risks, any of which could have a material adverse impact, including on our reputation and stock price.
Meeting the sustainability goals we have set and publicly disclosed will require significant resources and expenditures, and we may face pressure to make commitments, establish additional goals, and take actions to meet them beyond our current plans. If customers and potential customers are dissatisfied with our sustainability goals or our progress towards meeting them, then they may choose not to buy our products and services, which could lead to reduced revenue, and our reputation could be harmed. In addition, we could experience reduced revenue and reputational harm if we are targeted by anti-sustainability groups or influential individuals who disagree with our public positions on social or environmental issues. Additionally, lawsuits or regulatory actions based on allegations that certain public statements regarding sustainability-related matters by companies are false and misleading “greenwashing” campaigns could adversely impact our operations and could have an adverse impact on our financial condition.
We may be unable to satisfactorily meet evolving standards, regulations and disclosure requirements related to sustainability. Such matters can affect the willingness or ability of investors to make an investment in our Company, as well as our ability to meet regulatory requirements, including proposed rules related to greenhouse gas emissions. Any failure, or perceived failure, to meet evolving stakeholder expectations, additional regulations and industry standards or achieve our sustainability goals, commitments, and targets could have an adverse effect on our business, results of operations, financial condition, or stock price.
| | | | | |
| Item 1B. | Unresolved Staff Comments. |
NONE
Albemarle recognizes the importance of maintaining the security and integrity of our information systems and the data we collect, process, and store. We have implemented a comprehensive cybersecurity program based on the National Institute of Standards and Technology Cybersecurity Framework (“CSF”). As such, we map the CSF to corresponding legal, regulatory, and industry security practices, which guide our global policies and procedures to prevent, identify, protect, detect, respond, and recover from cybersecurity threats and incidents. Our cybersecurity program is managed by our Cybersecurity Director and is overseen by our Chief Information Officer (“CIO”), who assumes responsibility for the Chief Information Security Officer (“CISO”) role. The cybersecurity program is integrated into our overall enterprise risk management framework and thus is factored into our long-term strategy and business continuity plans. Our Cybersecurity Director brings extensive experience in cybersecurity, including service in U.S. Army Cyber Operations, and has led initiatives in threat management, risk mitigation, and security architecture to strengthen enterprise resilience. His expertise in incident response and security strategy ensures our cybersecurity program remains aligned with industry best practices and evolving cyber threats.
The Audit and Finance Committee (“AFC”) of our Board of Directors oversees information security matters and the Company’s cybersecurity program. Our CIO reports on cybersecurity related matters, including the status of ongoing initiatives, incident reporting, compliance with regulatory requirements and industry standards, and emerging threats in global cybersecurity, on an as needed basis, but at least annually, to the AFC and executive leadership. The AFC and executive leadership offer guidance on certain matters and approval for material initiatives. In addition, the full Board of Directors is updated on cybersecurity matters as needed depending on the nature and materiality of a cybersecurity matter.
All information assets are inventoried, classified, prioritized, and protected based on the respective risk, with appropriate cybersecurity controls applied to each. We have also implemented and maintain a documents management program which governs the classification, protection, and use of sensitive company data within the Albemarle environment.
All business-requested technologies and third-party service providers must successfully complete a thorough cybersecurity and contract review before being approved for use, after which they are continuously monitored as part of our supply chain risk management program. Cybersecurity risks and potential costs are evaluated as a part of business operations, and the respective business impacts are continuously assessed to address evolving threats and vulnerabilities. We engage a third-party global firm to conduct an annual cyber assessment using the CSF, and we engage external vendors to validate our security controls and procedures through periodic penetration tests.
| | | | | | | | |
| Albemarle Corporation and Subsidiaries |
|
We follow a zero-trust architecture approach and enforce the use of multi-factor authentication and virtual private network technologies for all external access to provide secure support for our remote workers. Information security training is part of our compliance program, and includes mandatory security training for new hires, mandatory yearly security training for all staff, and periodic phishing tests to raise awareness and response actions.
Our team of cybersecurity professionals are responsible for maintaining a global information systems environment that focuses on least privilege, least functionality, and network segmentation throughout the landscape using a layered approach (i.e. a defense-in-depth strategy). This includes a security operations center and cybersecurity analysts who provide 24/7 network monitoring.
As further discussed in Item 1A. Risk Factors, a material cybersecurity incident could significantly increase the cost of doing business or otherwise adversely impact our financial results and condition. To date we have not had a cybersecurity incident that has had, or is reasonably likely to have, a material effect on our financial results or business operations; however, we monitor and work to continuously improve our cybersecurity program as threats become more frequent and sophisticated.
Our manufacturing sites have formal business continuity plans that address site-specific priority responses, each determined through business impact analyses that integrate within our overall corporate crisis management response plan and enterprise risk management program. We conduct an annual incident response tabletop exercise as well as periodic exercises of formalized site business continuity plans. Lessons learned from the outcomes of these exercises are then assessed and used to inform and improve our formal cyber response procedures and business continuity plans.
In the event of, or the reasonably likely threat of, a cybersecurity incident, our cyber response procedures outline the tasks and timeline for the escalation of the incident to key members of the organization, including the information technology team, business unit management, and Albemarle executives and other key management. These individuals would participate in a special event management plan activation meeting to gain an understanding as to how the incident was detected and analysis of the incident. Each member of management involved would be responsible for assessing the risks, impact, and necessary response as determined by their role. The procedures include key considerations each manager should consider in their assessment as well as their responsibility for involvement in remediation efforts and post-incident strategic reviews. Specific legal and executive role procedures include the assessment of necessary internal communication and external reporting. The Chief Executive Officer, with the support of other executive officers, is responsible for approval of incident reporting and informing and updating the Board of Directors.
We operate globally, with our principal executive offices located in Charlotte, North Carolina and regional shared services offices located in Budapest, Hungary and Dalian, China. Each of these properties are leased. We and our affiliates also operate regional sales and administrative offices in various locations throughout the world, which are generally leased.
We believe that our production facilities, research and development facilities, and sales and administrative offices are generally well maintained, effectively used and are adequate to operate our business. During 2024, the Company’s manufacturing plants operated at approximately 78% capacity, in the aggregate.
Set forth below is information regarding our production facilities operated by us and our affiliates. Additional details regarding our significant mineral properties can be found below the table.
| | | | | | | | | | | | | | | | |
| Location | | | | Principal Use | | Owned/Leased |
| Energy Storage | | | | | | |
| Chengdu, China | | | | Production of technical and battery-grade lithium hydroxide | | Owned |
Greenbushes, Australia(a) | | | | Production of lithium spodumene minerals and lithium concentrate | | Owned(c) |
| Kemerton, Australia | | | | Production of technical and battery-grade lithium hydroxide | | Owned |
| Kings Mountain, NC | | | | Production of technical and battery-grade lithium hydroxide, lithium salts and battery-grade lithium metal products | | Owned |
| La Negra, Chile | | | | Production of technical and battery-grade lithium carbonate | | Owned |
| Meishan, China | | | | Production of technical and battery-grade lithium hydroxide | | Owned |
| Qinzhou, China | | | | Production of lithium carbonate and technical and battery-grade lithium hydroxide | | Owned |
| | | | | | | | |
| Albemarle Corporation and Subsidiaries |
|
| | | | | | | | | | | | | | | | |
| Location | | | | Principal Use | | Owned/Leased |
Salar de Atacama, Chile(a) | | | | Production of lithium brine and potash | | Owned(d) |
Silver Peak, NV(a) | | | | Production of lithium brine, technical-grade lithium carbonate and lithium hydroxide | | Owned |
Wodgina, Australia(a) | | | | Production of lithium spodumene minerals and lithium concentrate | | Owned and leased(c) |
| Xinyu, China | | | | Production of technical and battery-grade lithium hydroxide | | Owned |
| Specialties | | | | | | |
| Baton Rouge, LA | | | | Research and product development activities, and production of fire safety solutions | | Leased |
| Langelsheim, Germany | | | | Production of butyllithium, lithium chloride, specialty products, lithium hydrides, cesium and special metals | | Owned |
Magnolia, AR(a) | | | | Production of fire safety solutions, bromine, inorganic bromides, agricultural intermediates and tertiary amines | | Owned |
| New Johnsonville, TN | | | | Production of butyllithium and specialty products | | Owned |
Safi, Jordan(a) | | | | Production of bromine and derivatives and fire safety solutions | | Owned and leased(c) |
| Taichung, Taiwan | | | | Production of butyllithium | | Owned |
| Twinsburg, OH | | | | Production of bromine-activated carbon | | Leased |
Ketjen(b) | | | | | | |
| Amsterdam, the Netherlands | | | | Production of refinery catalysts, research and product development activities | | Owned |
| Bayport, TX | | | | Production of refinery catalysts, research and product development activities | | Owned |
| | | | | | |
| | | | | | |
| | | | | | |
| Niihama, Japan | | | | Production of refinery catalysts | | Leased(c) |
| Pasadena, TX | | | | Production of variety of chemical products, including aluminum and magnesium alkyls and alkyltes | | Owned |
| Santa Cruz, Brazil | | | | Production of catalysts, research and product development activities | | Owned(c) |
| | | | | | |
(a) See below for further discussion of these significant mineral extraction facilities.
(b) Immaterial production facilities owned by unconsolidated joint ventures are not listed.
(c) Owned or leased by joint venture.
(d) Ownership will revert to the Chilean government once we have sold all remaining amounts under our contract with the Chilean government pursuant to which we obtain lithium brine in Chile.
Mineral Properties
Set forth below are details regarding our mineral properties operated by us and our affiliates, which have been prepared in accordance with the requirements of subpart 1300 of Regulation S-K issued by the SEC. The following terms used in this Annual Report on Form 10-K are defined and used in accordance with subpart 1300 of Regulation S-K:
Mineral resource - a concentration or occurrence of material of economic interest in or on the Earth's crust in such form, grade or quality, and quantity that there are reasonable prospects for economic extraction.
Measured mineral resource - that part of a mineral resource for which quantity and grade or quality are estimated on the basis of conclusive geological evidence and sampling. The level of geological certainty associated with a measured mineral resource is sufficient to allow a qualified person to apply modifying factors in sufficient detail to support detailed mine planning and final evaluation of the economic viability of the deposit.
Indicated mineral resource - that part of a mineral resource for which quantity and grade or quality are estimated on the basis of adequate geological evidence and sampling. The level of geological certainty associated with an indicated mineral resource is sufficient to allow a qualified person to apply modifying factors in sufficient detail to support mine planning and evaluation of the economic viability of the deposit.
Inferred mineral resource - that part of a mineral resource for which quantity and grade or quality are estimated on the basis of limited geological evidence and sampling. The level of geological uncertainty associated with an inferred mineral resource is too high to apply relevant technical and economic factors likely to influence the prospects of economic extraction in a manner useful for evaluation of economic viability.
Mineral reserve - an estimate of tonnage and grade or quality of indicated and measured mineral resources that, in the opinion of the qualified person, can be the basis of an economically viable project.
| | | | | | | | |
| Albemarle Corporation and Subsidiaries |
|
Proven mineral reserve - the economically mineable part of a measured mineral resource and can only result from conversion of a measured mineral resource.
Probable mineral reserve – the economically mineable part of an indicated and, in some cases, a measured mineral resource.
Cut-off grade - the grade (i.e., the concentration of metal or mineral in rock) that determines the destination of the material during mining. For purposes of establishing “prospects of economic extraction,” the cut-off grade is the grade that distinguishes material deemed to have no economic value from material deemed to have economic value.
Under subpart 1300 of Regulation S-K, mineral resources may not be classified as “mineral reserves” unless the determination has been made by a qualified person (“QP”) that the mineral resources can be the basis of an economically viable project.
Except for that portion of mineral resources classified as mineral reserves, mineral resources do not have demonstrated economic value. Inferred mineral resources are estimates based on limited geological evidence and sampling and have a too high of a degree of uncertainty as to their existence to apply relevant technical and economic factors likely to influence the prospects of economic extraction in a manner useful for evaluation of economic viability. Estimates of inferred mineral resources may not be converted to a mineral reserve. It cannot be assumed that all or any part of an inferred mineral resource will ever be upgraded to a higher category. A significant amount of exploration must be completed in order to determine whether an inferred mineral resource may be upgraded to a higher category. Therefore, it cannot be assumed that all or any part of an inferred mineral resource exists, that it can be the basis of an economically viable project, that it will ever be upgraded to a higher category, or that all or any part of the mineral resources will ever be converted into mineral reserves. See risk factor - “Our inability to acquire or develop additional reserves that are economically viable could have a material adverse effect on our future profitability,” in Item 1A. Risk Factors.
Overview
| | | | | | | | |
| Albemarle Corporation and Subsidiaries |
|
At December 31, 2024, we had the following mineral extraction sites:
| | | | | | | | | | | | | | | | | | | | | | | |
| Location | Business Segment | | Ownership % | | Extraction Type | | Stage |
| Argentina | | | | | | | |
| Antofalla | Energy Storage | | 100% | | Brine | | Exploration |
| Australia | | | | | | | |
| Greenbushes | Energy Storage | | 49% | | Hard rock | | Production |
Wodgina(a) | Energy Storage | | 50% | | Hard rock | | Production |
| Chile | | | | | | | |
Salar de Atacama(b) | Energy Storage | | 100% | | Brine | | Production |
| Jordan | | | | | | | |
Safi(b) | Specialties | | 50% | | Brine | | Production |
| United States | | | | | | | |
| Kings Mountain, NC | Energy Storage | | 100% | | Hard rock | | Exploration |
Magnolia, AR(b) | Specialties | | 100% | | Brine | | Production |
Silver Peak, NV(b) | Energy Storage | | 100% | | Brine | | Production |
(a) Production of spodumene concentrate at the Wodgina mine resumed in the second quarter of 2022 after it had been idled in 2019, following the acquisition of our interest in Wodgina. On October 18, 2023, we completed the restructuring of our MARBL joint venture, which reduced our ownership percentage of Wodgina from 60% to 50%.
(b) Site includes on-site, or otherwise near-by, exclusive conversion facilities. See individual property disclosure below for further details.
Aggregate annual production from our mineral extraction facilities is shown in the below table. Amounts represent Albemarle’s attributable portion based on ownership percentages noted above and are shown in thousands of metric tonnes of lithium metal and bromine production. Lithium and bromine are extracted as brine or hard rock concentrate at the extraction facilities. These are then further converted into various compounds and products at on-site processing facilities or other conversion facilities owned by Albemarle around the world. In addition, the brine or concentrate can be used by tolling entities for further processing.
| | | | | | | | | | | | | | | | | |
| Aggregate Annual Production (metric tonnes in thousands) |
| Year Ended December 31, |
| 2024 | | 2023 | | 2022 |
Lithium (lithium metal)(a) | | | | | |
| Australia | | | | | |
Greenbushes(b) | 19 | | | 21 | | | 19 | |
Wodgina(c) | 6 | | | 7 | | | 3 | |
| Chile | | | | | |
Salar de Atacama(d) | 13 | | | 10 | | | 10 | |
| United States | | | | | |
| Silver Peak, NV | 1 | | | 1 | | | 1 | |
| Total lithium metal | 39 | | | 39 | | | 33 | |
| Bromine | | | | | |
| Jordan | | | | | |
Safi(e)(f) | 56 | | | 58 | | | 60 | |
| United States | | | | | |
Magnolia, AR(g) | 65 | | | 82 | | | 73 | |
| Total bromine | 121 | | | 140 | | | 133 | |
| | | | | | | | |
| Albemarle Corporation and Subsidiaries |
|
(a) Lithium production amounts shown as lithium metal. Conversion to LCE is 0.1878 metric tonne of lithium metal to 1 metric tonne of LCE.
(b) Production from Greenbushes represents 49% of production of the Greenbushes mine, which is attributable to the Company’s interest in the Windfield joint venture.
(c) Production of spodumene concentrate at the Wodgina mine resumed in the second quarter of 2022 after it had been idled in 2019. Production amounts presented from Wodgina represent 60% of production of the Wodgina mine which is attributable to the Company’s interest in the MARBL joint venture until October 18, 2023, when we reduced our ownership percentage to 50% following the restructuring of the MARBL joint venture with MRL. The above production amounts reflect that change in ownership percentage beginning on October 18, 2023.
(d) The Salar de Atacama operation also produces potash (potassium chloride), bischofite, halite and sylvinite as byproducts. However, the Company does not consider production of these byproducts as material to the economics of the operation.
(e) Production from Safi represents the 50% production by the Jordan Bromine Project, which is attributable to the Company’s interest in the JBC joint venture.
(f) The Safi operation also produces potassium hydroxide (“KOH”) as a byproduct. However, the Company does not consider production of this byproduct as material to the economics of the operation.
(g) In addition, elemental sulfur and sodium hydrosulfide solution (“NaHS”) are manufactured from the sour gas produced by the Magnolia operation. However, the Company does not consider these products as material to the economics of the operation.
See individual property disclosure below for further details regarding mineral rights, titles, property size, permits and other information for our significant mineral extraction properties. The extracted brine or hard rock is processed at facilities on location (as described below) or processed, or further processed, at other facilities throughout the world.
The following table provides a summary of our mineral resources, exclusive of reserves, at December 31, 2024. The below mineral resource amounts are rounded and shown in thousands of metric tonnes. Where applicable, the amounts represent Albemarle’s attributable portion based on ownership percentages noted. The relevant technical information supporting mineral resources for each material property is included in the “Material Individual Properties” section below, as well as in the technical report summaries filed as Exhibits 96.1 to 96.6 to this report.
| | | | | | | | | | | | | | | | | | | | | | | | | | | | | | | | | | | | | | | | | | | | | | | |
| Measured Mineral Resources | | Indicated Mineral Resources | | Measured and Indicated Mineral Resources | | Inferred Mineral Resources |
| Amount (‘000s metric tonnes) | | Grade (Li2O%) | | Amount (‘000s metric tonnes) | | Grade (Li2O%) | | Amount (‘000s metric tonnes) | | Grade (Li2O%) | | Amount (‘000s metric tonnes) | | Grade (Li2O%) |
| Lithium - Hard Rock: | | | | | | | | | | | | | | |
| Australia | | | | | | | | | | | | | | | |
Greenbushes(a) | — | | — | | 37,500 | | 1.5% | | 37,600 | | 1.5% | | 8,200 | | 1.7% |
Wodgina(b) | — | | — | | 23,300 | | 0.8% | | 23,300 | | 0.8% | | 14,500 | | 1.1% |
| United States | | | | | | | | | | | | | | | |
| Kings Mountain, NC | — | | — | | 63,860 | | 1.4% | | 63,860 | | 1.4% | | 27,610 | | 1.2% |
| Amount (‘000s metric tonnes) | | Concentration (mg/L) | | Amount (‘000s metric tonnes) | | Concentration (mg/L) | | Amount (‘000s metric tonnes) | | Concentration (mg/L) | | Amount (‘000s metric tonnes) | | Concentration (mg/L) |
| Lithium - Brine: | | | | | | | | | | | | | | | |
| Argentina | | | | | | | | | | | | | | | |
| Antofalla | 521 | | 427 | | 382 | | 381 | | 903 | | 406 | | 888 | | 364 |
| Chile | | | | | | | | | | | | | | | |
| Salar de Atacama | 618 | | 2,176 | | 481 | | 1,868 | | 1,099 | | 2,041 | | 166 | | 1,558 |
| United States | | | | | | | | | | | | | | | |
| Silver Peak, NV | 7 | | 169 | | 11 | | 155 | | 17 | | 160 | | 102 | | 130 |
| | | | | | | | | | | | | | | |
| | | | | | | | | | | | | | | |
| | | | | | | | | | | | | | | |
| | | | | | | | | | | | | | | |
| | | | | | | | | | | | | | | |
(a) Through our Windfield joint venture, we own a 49% interest in the Greenbushes mine. We are therefore reporting 49% of Greenbushes’ mineral resources.
(b) Through our MARBL joint venture, we own a 50% interest in Wodgina. We are therefore reporting 50% of Wodgina’s mineral resources.
The feedstock for the Safi, Jordan site, owned 50% by Albemarle through its JBC joint venture, is drawn from the Dead Sea, a nonconventional reservoir owned by the nations of Israel and Jordan. As such, there are no specific resources owned by JBC, but Albemarle’s joint venture partner, Arab Potash Company (“APC”) has exclusive rights granted by the Hashemite
| | | | | | | | |
| Albemarle Corporation and Subsidiaries |
|
Kingdom of Jordan to withdraw brine from the Dead Sea and process it to extract minerals. The measured resource of bromide ion attributable to Albemarle’s 50% interest in its JBC joint venture is estimated to be approximately 173.93 million metric tonnes. JBC is extracting approximately 1 percent of the bromine available in Jordan’s share of the Dead Sea. Bromide concentration in the Dead Sea is estimated to average approximately 5,037 parts per million (“ppm”).
There are no mineral resource estimates at the Magnolia, AR bromine extraction site. All bromine mineral accumulations of economic interest and with reasonable prospects for eventual economic extraction within the Magnolia production lease area are either currently on production or subject to an economically viable future development plan and are classified as mineral reserves.
The following table provides a summary of our mineral reserves at December 31, 2024. The below mineral reserve amounts are rounded and shown in thousands of metric tonnes. The amounts represent Albemarle’s attributable portion based on ownership percentages noted above. The relevant technical information supporting mineral reserves for each material property is included in the “Material Individual Properties” section below, as well as the in the technical report summaries referenced in Exhibits 96.1 to 96.6 to this report.
| | | | | | | | | | | | | | | | | | | | | | | | | | | | | | | | | | | |
| Proven Mineral Reserves | | Probable Mineral Reserves | | Total Mineral Reserves |
| Amount (‘000s metric tonnes) | | Grade (Li2O%) | | Amount (‘000s metric tonnes) | | Grade (Li2O%) | | Amount (‘000s metric tonnes) | | Grade (Li2O%) |
| Lithium - Hard Rock: | | | | | | | | | | | |
| Australia | | | | | | | | | | | |
Greenbushes(a) | — | | — | | 74,500 | | 1.8% | | 74,500 | | 1.8% |
Wodgina(b) | — | | — | | 55,950 | | 1.3% | | 55,950 | | 1.3% |
| Amount (‘000s metric tonnes) | | Concentration (mg/L) | | Amount (‘000s metric tonnes) | | Concentration (mg/L) | | Amount (‘000s metric tonnes) | | Concentration (mg/L) |
| Lithium - Brine: | | | | | | | | | | | |
| Chile | | | | | | | | | | | |
| Salar de Atacama | 311 | | 2,405 | | 147 | | 2,023 | | 458 | | 2,270 |
| United States | | | | | | | | | | | |
| Silver Peak, NV | 14 | | 97 | | 66 | | 119 | | 79 | | 115 |
| Bromine: | | | | | | | | | | | |
| | | | | | | | | | | |
| | | | | | | | | | | |
| United States | | | | | | | | | | | |
Magnolia, AR(c) | 2,468 | | | | 467 | | | | 2,935 | | |
(a) Through our Windfield joint venture, we own a 49% interest in the Greenbushes mine. We are therefore reporting 49% of Greenbushes’ mineral reserves.
(b) Through our MARBL joint venture, we own a 50% interest in Wodgina. We are therefore reporting 50% of Wodgina’s mineral resources.
(c) The concentration of bromine at the Magnolia site varies based on the physical location of the field and can range over 6,600 mg/L.
All bromine reserves reported by Albemarle for the JBC project are classified as proven mineral reserves. The mineral reserve estimate for the Safi, Jordan bromine site attributable to Albemarle’s 50% interest in its JBC joint venture is approximately 2.0 million metric tonnes of bromine from the Dead Sea. This estimate is based on the time available under the concession agreement with the Hashemite Kingdom of Jordan and the processing capability of the JBC plant. As only approximately one percent of the available resource is consumed from the Dead Sea, as noted above, the reserve estimate is based on the amount the JBC plant can produce over until the end of 2058, when the APC concession agreement ends. Bromide ion concentration of concentrated bromide-enriched brine from the APC evaporation pond used to estimate the reserve from the Dead Sea was approximately 8,742 ppm based on historical pumping.
Mineral resource and reserve estimates were prepared by a QP with an effective date provided in the individual technical report summaries referenced in Exhibits 96.1 to 96.6 to this report. Differences between the amounts in the table above and those amounts in the technical report summaries represent estimated depletion from the effective date of the report until December 31, 2024. Our mineral resource and reserve estimates are based on many factors, including the area and volume
| | | | | | | | |
| Albemarle Corporation and Subsidiaries |
|
covered by our mining rights, assumptions regarding our extraction rates based upon an expectation of operating the mines on a long-term basis and the quality of in-place reserves.
Internal Controls
The modeling and analysis of our mineral resources and reserves was developed by our site personnel and reviewed by several levels of internal management, as well as the QP for each site. The development of such resources and reserves estimates, including related assumptions, were prepared by a QP.
When determining resources and reserves, as well as the differences between resources and reserves, management developed specific criteria, each of which must be met to qualify as a resource or reserve, respectively. These criteria, such as demonstration of economic viability, points of reference and grade, are specific and attainable. The QP and management agree on the reasonableness of the criteria for the purposes of estimating resources and reserves. Calculations using these criteria are reviewed and validated by the QP.
Estimations and assumptions were developed independently for each significant mineral location. All estimates require a combination of historical data and key assumptions and parameters. When possible, resources and data from public information and generally accepted industry sources, such as governmental resource agencies, were used to develop these estimations.
Each site has developed quality control and quality assurance (“QC/QA”) procedures, which were reviewed by the QP, to ensure the process for developing mineral resource and reserve estimates were sufficiently accurate. QC/QA procedures include independent checks (duplicates) on samples by third party laboratories, blind blank/standard insertion into sample streams, duplicate sampling, among others. In addition, the QPs reviewed the consistency of historical production at each site as part of their analysis of the QC/QA procedures. See details of the controls for each site in the technical summary reports filed as Exhibits 96.1 to 96.6 to this report.
We recognize the risks inherent in mineral resource and reserve estimates, such as the geological complexity, the interpretation and extrapolation of field and well data, changes in operating approach, macroeconomic conditions and new data, among others. The capital, operating and economic analysis estimates rely on a range of assumptions and forecasts that are subject to change. In addition, certain estimates are based on mineral rights agreements with local and foreign governments. Any changes to these access rights could impact the estimates of mineral resources and reserves calculated in these reports. Overestimated resources and reserves resulting from these risks could have a material effect on future profitability.
| | | | | | | | |
| Albemarle Corporation and Subsidiaries |
|
Material Individual Properties
Greenbushes, Australia
The Greenbushes mine is a hard rock, open pit mine (latitude 33° 52´S, longitude 116° 04´ E) located approximately 250km south of Perth, Western Australia, 90km southeast of the port of Bunbury, a major bulk-handling port in the southwest of Western Australia. The lithium mining operation is near the Greenbushes townsite located in the Shire of Bridgetown-Greenbushes. Access to the Greenbushes Mine is via the paved South Western Highway between Bunbury and Bridgetown to Greenbushes Township and via the paved Maranup Ford Road to the Greenbushes Mine.
Lithium production from the Greenbushes Mine has been undertaken continuously for more than 20 years. Modern exploration has been undertaken on the property since the mid-1980s, first by Greenbushes Limited, then by Lithium Australia Ltd and in turn by Sons of Gwalia prior to the acquisition of Greenbushes by Talison in 2007. Initial exploration focused largely on tantalum, with the emphasis changing to lithium from around 2000. In 2014, Rockwood acquired a 49% ownership interest in Windfield, which owns 100% of Talison, from Sichuan Tianqi Lithium Industries Inc. This 49% ownership in Windfield was assumed by Albemarle in 2015 as part of the acquisition of Rockwood. We purchase lithium concentrate from Windfield, and our investment in the joint venture is reported as an unconsolidated equity investment on our balance sheet.
About 55% of the tenements held by Talison are covered by Western Australia’s State Forest, which is under the authority of the Western Australia Department of Biodiversity, Conservation and Attractions. The majority of the remaining land is private land that covers about 40% of the surface rights. The remaining ground comprises crown land, road reserves and other miscellaneous reserves. The tenements cover a total area of approximately 10,000 hectares and include the historic Greenbushes tin, tantalum and current lithium mining areas. See section 3 of the Greenbushes technical report summary, filed as Exhibit 96.1 to this report, for a listing of tenements held by the Greenbushes site. Talison holds the mining rights for all lithium minerals on these tenements. The operating open pit lithium mining and processing plant area covers approximately 3,500 hectares comprising three mining leases. All lithium mining activities, including tailings storage, processing plant operations, open pits
| | | | | | | | |
| Albemarle Corporation and Subsidiaries |
|
and waste rock dumps, are currently carried out within the boundaries of the three mining leases plus two general purpose leases. In order to keep the granted tenements in good standing, Talison is required to maintain permits, make an annual contribution to the statutory Mining Rehabilitation Fund and pay a royalty on concentrate sales for lithium mineral production as prescribed under the Mining Act 1978 in Western Australia. There are no private royalties that apply to the Greenbushes property. Talison continues to review all tenements on an annual basis and ensures compliance with relevant regulatory requirements and fees for maintenance of these tenements.
The Greenbushes pegmatite deposit consists of a primary pegmatite intrusion (Central Lode) with a smaller, sub-parallel pegmatite to the east (Kapanga). The primary intrusion and its subsidiary dikes and pods are concentrated within shear zones within a metamorphic belt consisting of granofels, ultramafic schists and amphibolites. The pegmatites are crosscut by mafic dolerite dikes. The Central Lode pegmatite is over 3 kilometers long (north by northwest), up to 300 meters wide (normal to dip), strikes north to north-west and dips moderately to steeply west to south-west. The Kapanga deposit sits approximately 300 m to the east of the Central Lode deposit with strike length of 1.8 km, thickness averaging 150 meters and dips between 40o and 60o toward the west. Current drilling has defined the Kapanga deposit to approximately 450 meters depth below surface. The major minerals from the Greenbushes pegmatite are quartz, spodumene, albite and K-feldspar.
The main lithium-bearing minerals are spodumene (containing approximately 8% lithium oxide) and varieties kunzite and hiddenite. Minor to trace lithium minerals include lepidolite mica, amblygonite and lithiophilite. Lithium is readily leached in the weathering environment and thus is virtually non-existent in weathered pegmatite. Exploration drilling at Greenbushes has been ongoing for over 40 years using reverse circulation and diamond drill holes.
Three lithium mineral processing plants are currently operating on the Greenbushes site, two chemical grade plants and a technical grade plant. Tailings are discharged to the tailings storage facility without the need for any neutralization process. Additional infrastructure on site includes power and water supply facilities, a laboratory, administrative offices, occupational health/safety/training offices, dedicated mines rescue area, stores, storage sheds, workshops and engineering offices. The Greenbushes site also leases production drills, excavators, trucks and various support equipment to extract the ore deposit by open pit methods. Talison’s power is delivered by a local distribution system and reticulated and metered within the site. Water is sourced from rainfall and stored in several process dams located on site. We consider the condition of all of our plants, facilities and equipment to be suitable and adequate for the businesses we conduct, and we maintain them regularly. As of December 31, 2024, our 49% ownership interest of the gross asset value of the facilities at the Greenbushes site was approximately $843.8 million. Greenbushes is currently constructing a new chemical grade plant with a target completion in 2025 and is developing plans for a fourth chemical grade plant to be constructed in 2027. Other planned upgrades to the infrastructure include a new mine service area, a new mine access road, expansions of warehouse and laboratories and the expansion of tailings facilities.
Talison ships the chemical-grade lithium concentrate in vessels to our facilities in Meishan, Qinzhou and Xinyu, China, and by land transport to our Kemerton, Australia facility, to process into battery-grade lithium hydroxide. In addition, the output from Talison can be used by tolling entities in China to produce both lithium carbonate and lithium hydroxide.
A summary of the Greenbushes facility’s lithium mineral resources, exclusive of reserves, and reserves as of December 31, 2024 is shown in the following tables. RPM Global USA Inc. (“RPM”), a third-party firm comprising mining experts in accordance with Item 1302(b)(1) of Regulation S-K, served as the QP and prepared the estimates of lithium mineral resources and reserves at the Greenbushes facility, with an effective date of June 30, 2024. A copy of the QP’s most recent technical report summary with respect to the lithium mineral resource and reserve estimates at the Greenbushes facility, dated February 10, 2025, with an effective date of June 30, 2024, is filed as Exhibit 96.1 to this report. The amounts represent Albemarle’s attributable portion based on a 49% ownership percentage, and are presented as metric tonnes of lithium ore in thousands.
The Greenbushes mineral resources, exclusive of reserves, estimates with depletion from production from the effective date of the report through December 31, 2024 are summarized in the following table:
| | | | | | | | | | | | |
| Amount (‘000s metric tonnes) | | Grade (Li2O%) | |
| | | | |
| Indicated mineral resources | 37,500 | | 1.5% | |
| | | | |
| | | | |
| Inferred mineral resources | 8,200 | | 1.7% | |
| | | | |
| | | | |
•Amounts represent Albemarle’s attributable portion of mineral resources of 49%.
•Mineral resources are reported exclusive of mineral reserves. Mineral resources are not mineral reserves and do not have demonstrated economic viability.
| | | | | | | | |
| Albemarle Corporation and Subsidiaries |
|
•Mineral resources have been reported as in situ (hard rock within an optimized pit shell and above the effective cut-off grade), with reasonable prospects for eventual economic extraction remaining available.
•Classification of the Mineral Resource has taken into account varying confidence levels and assessment, and whether the appropriate account has been taken for all relevant factors, i.e., relative confidence in tonnage/grade, computations, confidence in the continuity of geology and grade, quantity and distribution of the data and the results reflect the view of the QP.
•The cut-off grade of 0.55% Li2O is based on estimated mining and processing costs and recovery factors.
•The long-term price of $1,500/metric tonne of product over a timeline of 7 to 10 years is above the current spot price and was selected based on the reasonable long-term prospect rather than the short-term viability (0.5 to 2 years).
•Mineral resources tonnage and contained metal have been rounded to reflect the accuracy of the estimate, and numbers may not add due to rounding.
The Greenbushes indicated mineral resources of 37.6 million metric tonnes at December 31, 2024 increased by 1% from 37.1 million metric tonnes at December 31, 2023. The Greenbushes inferred mineral resources of 8.2 million metric tonnes at December 31, 2024 increased by 41% from 5.8 million metric tonnes at December 31, 2023. The overall increase in mineral resources was primarily driven by changes in the reporting cut-off grade, as well as the pit shell used to report the mineral resources.
The Greenbushes mineral reserve estimates with depletion from production from the effective date of the report through December 31, 2024 are summarized in the following table:
| | | | | | | | | | | | |
| Amount (‘000s metric tonnes) | | Grade (Li2O%) | |
| Probable mineral reserves: | | | | |
| Open Pit | 72,000 | | 1.8% | |
| Stockpiles | 900 | | 2.4% | |
| Tailings Storage Facilities | 1,600 | | 1.4% | |
•Amounts represent Albemarle’s attributable portion of mineral resources and mineral reserves of 49%.
•Mineral reserves are reported exclusive of mineral resources.
•Mineral reserves are reported on a dry basis
•Mineral reserves are reported considering a nominal set of assumptions for reporting purposes:
•Based on a selling price of $1,300/metric tonne cost, insurance and freight (“CIF”) China/Korea/Japan (“CKJ”) of chemical grade concentrate (6% Li2O) and concentrate transport and selling cost of $9.75/metric tonne.
•Assumes a 98% global grade factor.
•Diluted by approximately 13.0% through the removal of non-pegmatite blocks and ore blocks contaminated with iron oxide.
•Assumes variable mining recoveries based on grade, oxidation, thickness, and search distance, sourced from the Company. The total mining recoveries are 91.1% for the open cut pit and 100% for the tailings storage facilities.
•The economic cut-off grade calculation is based on $2.67/metric tonne-ore incremental ore mining cost, $35.77/metric tonne-ore processing cost, $10.03/metric tonne-ore general and administrative cost and $3.54/metric tonne sustaining capital cost.
•The price, cost and mass yield parameters produce a calculated economic cut-off grade of 0.62% Li2O. However, due to the internal constraints of the current operations, an elevated mineral reserves cut-off grade of 0.7% Li2O has been applied.
•Where a mining block with Li2O grade greater than or equal to 0.7% and less than or equal to 1.9%, and with iron oxide (Fe₂O₃) content greater than or equal to 2.9%, the block is reallocated as contaminated ore and is treated as stockpiled for future processing for the purposes of reporting mineral reserves. Material above 1.9% is treated as direct ore feed.
•The mass yield for ore processed through the Chemical and Technical plants is estimated based on formulas that vary depending on the Li2O% grade of the plant feed. For chemical grade plant 1, the formula is mass yield % = 9.362 × Feed Li2O%^1.319. For chemical grade plant 2 and chemical grade plant 3, the formula is mass yield % = (9.362 × Feed Li2O%^1.319) + (Feed Li2O% × 0.82). The tailings storage facility formula is mass yield % = 41.4 and the TRP formula is mass yield % = 13.6.
•Costs estimated in Australian Dollars were converted to U.S. dollars based on an exchange rate of AUD 1.00:$0.68.
•Waste tonnage within the Mineral Reserve pit is 748.9 million metric tonnes at a strip ratio of 6.3:1 (waste to ore – not including stockpiles).
•Mineral reserve tonnage, grade and mass yield have been rounded to reflect the accuracy of the estimate, and numbers may not add due to rounding. Mineral reserves metric tonnes are rounded to the nearest hundred thousand tonnes.
The Greenbushes total mineral reserves of 74.5 million metric tonnes at December 31, 2024 increased by 4% from 71.8 million metric tonnes at December 31, 2023. The increase in total mineral reserves was primarily driven by changes in pit design and changes in the modifying factors to align with operational practices, partially offset by mine depletion from 2024 production.
The life of mine sustaining capital cost of $2.35/metric tonne of ore was used only for the purposes of pit optimization and cut-off grade calculation. This sustaining capital cost was based on estimates of life of mine annual
| | | | | | | | |
| Albemarle Corporation and Subsidiaries |
|
sustaining capital costs for Greenbushes that were included in the 2025 budget. Subsequent to pit optimization, design and scheduling, a detailed estimate of life of mine sustaining capital costs was prepared.
Additional information about key assumptions and parameters relating to the lithium mineral resources and reserves at the Greenbushes facility is discussed in sections 11 and 12, respectively, of the Greenbushes technical report summary.
Wodgina, Australia
The Wodgina property, which includes a hard rock, open pit mine (latitude -21° 11' 25"S, longitude 118° 40' 25"E) is located approximately 110 km south-southeast of Port Hedland, Western Australia between the Turner and Yule Rivers. The area includes multiple prominent greenstone ridges up to 180 m above mean sea level surrounded by granitic plains and lowlands. The property is accessible via National Highway 1 to National highway 95 to the Wodgina camp road. All roads to site are paved. The nearest large regional airport is in Port Hedland which also hosts an international deep-water port facility. In addition, a site dedicated all-weather airstrip is located near to site, capable of landing certain aircrafts.
The Wodgina pegmatite deposits were discovered in 1902. Since then, the pegmatite-hosted deposits have been mined for tin, tantalum, beryl, and lithium by various companies. Mining occurred sporadically until Goldrim Mining formed a new partnership with Pan West Tantalum Pty Ltd., who opened open pit mining at the site in 1989 and progressively expanded during the 1990s. Active mining at the Mt. Cassiterite pit has been started and stopped regularly between 2008 and the present. The mine was placed on care and maintenance in 2008, 2012, and most recently in 2019. In 2016, MRL acquired the mine and upgraded the processing facilities and site infrastructure to 750ktpa spodumene plant producing 6% spodumene concentrate, completed in 2019. On October 31, 2019, we completed the acquisition of a 60% interest in this hard rock lithium mine project and formed an unincorporated joint venture with MRL, named MARBL. We formed MARBL for the exploration, development, mining, processing and production of lithium and other minerals (other than iron ore and tantalum) from Wodgina. On October 18, 2023, we closed on the restructuring of the MARBL joint venture with MRL, which resulted in the reduction of our ownership interest in Wodgina to 50% from 60%.
| | | | | | | | |
| Albemarle Corporation and Subsidiaries |
|
Wodgina holds mining tenements within the Karriyarra native title claim and are subject to the Land Use Agreement dated March 2001 between the Karriyarra People and Gwalia Tantalum Ltd (now Wodgina Lithium, a 100% subsidiary of MRL, our MARBL joint venture partner). See section 3 of the Wodgina technical report summary, filed as Exhibit 96.2 to this report, for a listing of all mining and exploration land tenements, which are in good standing and without any known impediments. Certain tenements are due for renewal in 2026 and another in 2030. Drilling and exploration activities have been conducted throughout the mining life of the Wodgina property.
The Wodgina mine is a pegmatite lithium deposit with spodumene the dominant mineral. The lithium mineralization occurs as 10 - 30 cm long grey-white spodumene crystals within medium grained pegmatites comprising primarily of quartz, feldspar, spodumene, and muscovite. Typically, the spodumene crystals are oriented orthogonal to the pegmatite contacts.
The facilities at Wodgina consist of a three stage crushing plant, the spodumene concentration plant, administrative offices, an accommodation camp, a power station, gas pipeline, three mature and reliable water bore fields, extension for future tailing storage and a fleet of owned and leased mine production equipment. The gas pipeline feeds the site power station to provide the power to the facilities. Water is obtained from the dedicated water bore fields. We consider the condition of all of our plants, facilities and equipment to be suitable and adequate for the businesses we conduct, and we maintain them regularly. As of December 31, 2024, our 50% ownership interest of the gross asset value of the facilities at our Wodgina site was approximately $338.3 million.
A summary of the Wodgina facility’s lithium mineral resources as of December 31, 2024 is shown in the following table. RPM served as the QP and prepared the estimates of lithium mineral resources and reserves at the Wodgina facility, with an effective date of December 31, 2024. A copy of the QP’s most recent technical report summary with respect to the lithium mineral resource estimates at the Wodgina facility, dated February 10, 2025, with an effective date of June 30, 2024, is filed as Exhibit 96.2 to this report. The mineral resource economic assumptions remain unchanged from June 30, 2024. The June 30, 2024 resource has been depleted for actual production and adjusted for the new 50% ownership percentage noted above, and is reported as of December 31, 2024 in the below table. Mineral resources reported below represent a 50% interest in Wodgina, which is attributable to the Company’s interest in the MARBL joint venture. Amounts are presented as metric tonnes of lithium ore in thousands.
The Wodgina mineral resources, exclusive of reserves, estimates with depletion from production from the effective date of the report through December 31, 2024 are summarized in the following table:
| | | | | | | | | | | | |
| Amount (‘000s metric tonnes) | | Grade (Li2O%) | |
| | | | |
| Indicated mineral resources | 23,300 | | 0.8% | |
| | | | |
| Inferred mineral resources | 14,500 | | 1.1% | |
•Amounts represent Albemarle’s attributable portion of mineral resources of 50%.
•Mineral resources are reported exclusive of mineral reserves. Mineral resources are not mineral reserves and do not have demonstrated economic viability.
•Mineral resources have been reported as in situ (hard rock within an optimized pit shell and above the effective cut-off grade), with reasonable prospects for eventual economic extraction remaining available.
•Classification of the Mineral Resource has taken into account varying confidence levels and assessment, and whether the appropriate account has been taken for all relevant factors, i.e., relative confidence in tonnage/grade, computations, confidence in the continuity of geology and grade, quantity and distribution of the data and the results reflect the view of the QP.
•The cut-off grade of 0.5% Li2O is based on estimated mining and processing costs and recovery factors.
•The long-term price of $1,500/metric tonne of product over a timeline of 7 to 10 years is above the current spot price and was selected based on the reasonable long-term prospect rather than the short-term viability (0.5 to 2 years).
•Mineral resources tonnage and contained metal have been rounded to reflect the accuracy of the estimate, and numbers may not add due to rounding.
The Wodgina indicated mineral resources of 23.3 million metric tonnes at December 31, 2024 increased by 165% from 8.8 million metric tonnes at December 31, 2023. The Wodgina inferred mineral resources of 14.5 million metric tonnes at December 31, 2024 decreased by 82% from 81.7 million metric tonnes at December 31, 2023. The net decrease in total mineral resources was driven by new modeling completed in development of the current technical report summary, including the establishment of mineral reserves, as well as depletion during the year,
This is the first period reporting mineral reserves at the Wodgina mine as it had previously been at an initial assessment level. The Wodgina mineral reserve estimates with depletion from production from the effective date of the report through December 31, 2024 are summarized in the following table:
| | | | | | | | |
| Albemarle Corporation and Subsidiaries |
|
| | | | | | | | | | | | |
| Amount (‘000s metric tonnes) | | Grade (Li2O%) | |
| Probable mineral reserves: | | | | |
| Open Cut | 48,500 | | 1.4% | |
| Stockpiles | 50 | | 1.5% | |
| Tailings Storage Facilities | 7,400 | | 1.0% | |
•Amounts represent Albemarle’s attributable portion of mineral resources and mineral reserves of 50%.
•Mineral reserves are reported exclusive of mineral resources.
•Mineral reserves are reported on a dry basis
•Mineral reserves are reported considering a nominal set of assumptions for reporting purposes:
•Based on a selling price of $1,300/metric tonne CIF CKJ of chemical grade concentrate (benchmark 6% Li2O) and concentrate transport and selling cost of $6.80/metric tonne.
•Assumes a 98% global grade factor.
•Assumes variable mining recoveries based on grade, oxidation, thickness, and search distance, sourced from the Company. The total mining recoveries are 91.1% for the open cut pit and 100% for the tailings storage facilities.
•Mineral resources were converted to mineral reserves using plant recovery equations, sourced from the Company and based on plant data. The plant processing recovery equations depend on the material type, weathering, and in some circumstances, the Li2O% grade of the plant feed.
•Costs estimated in Australian Dollars were converted to U.S. dollars based on an exchange rate of AUD 1.00:$0.68.
•The economic cut-off grade calculation is based on $2.80/metric tonne-ore incremental ore mining cost, $33.57/metric tonne-ore processing cost, $15.66/metric tonne-ore general and administrative cost and $3.64/metric tonne sustaining capital cost. Incremental ore mining costs are the costs associated with the run-of-mine loader, stockpile rehandling, grade control assays and rockbreaker.
•The price, cost and mass yield parameters produce a calculated economic cut-off grade of 0.75% Li2O.
•Waste tonnage within the Mineral Reserve pit is 748.9 million metric tonnes at a strip ratio of 6.3:1 (waste to ore – not including stockpiles).
•Mineral reserve tonnage, grade and mass yield have been rounded to reflect the accuracy of the estimate, and numbers may not add due to rounding. Mineral reserves metric tonnes are rounded to the nearest hundred thousand tonnes.
Additional information about key assumptions and parameters relating to the lithium mineral resources and reserves at the Wodgina facility is discussed in sections 11 and 12, respectively, of the Wodgina technical report summary.
| | | | | | | | |
| Albemarle Corporation and Subsidiaries |
|
Salar de Atacama/La Negra, Chile
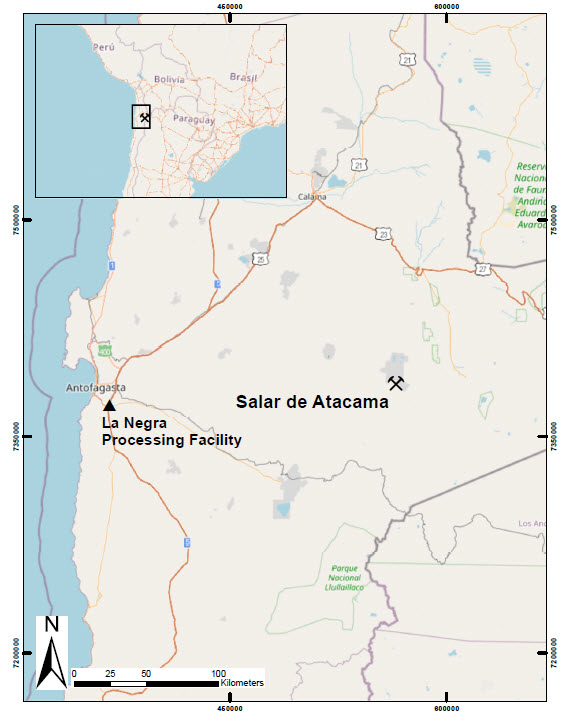
The Salar de Atacama is located in the commune of San Pedro de Atacama, with the operations approximately 100 kilometers to the south of this commune, in the extreme east of the Antofagasta Region and close to the border with the republics of Argentina and Bolivia. Access to the property is on the major four-lane paved Panamericana Route 5 north from Antofagasta, Chile approximately 60 km northeast to B-385. On B-385, a two-lane paved highway, the Albemarle Salar de Atacama project (latitude 23°38'31.52"S, longitude 68°19'30.31"W) is approximately 175 km to the east. The site has a small private airport that serves the project. A small paved runway airport is also located near San Pedro de Atacama and a large international airport is located in Antofagasta. The La Negra plant (latitude 23°45'20.31"S, longitude 70°18'36.92"W) has direct access roads and is located approximately 20 km by paved four lane highway Route 28 southeast of Antofagasta turning north approximately 3 km on Route 5.
In the early 1960s, water with high concentrations of salts was discovered in the Salar de Atacama Basin. In January 1975, one of our predecessors, Foote Mineral Company, signed a long-term contract with the Chilean government for mineral rights with respect to the Salar de Atacama consisting exclusively of the right to access lithium brine, covering an area of approximately 16,700 hectares. See section 3 of the Salar de Atacama technical report summary, filed as Exhibit 96.3 to this report, for a listing of mining concessions at the Salar de Atacama site. The contract originally permitted the production and sale of up to 200,000 metric tons of lithium metal equivalent (“LME”), a calculated percentage of LCE. In 1981, the first construction of evaporation ponds in the Salar de Atacama began. The following year, the construction of the lithium carbonate plant in La Negra began. In 1990, the facilities at the Salar de Atacama were expanded with a new well system and the capacity of the lithium carbonate plant in the La Negra plant was expanded. In 1998, the lithium chloride plant in La Negra began operating, the same year that Chemetall purchased Foote Mineral Company. Subsequently, in 2004, Chemetall was acquired by Rockwood, and in 2015, Rockwood was acquired by Albemarle. Effective January 1, 2017, the Chilean government and Albemarle entered into an annex to the original agreement through which its duration was modified, extending it until the balance of: (a) the original 200,000 metric tons of LME and an additional 262,132 metric tons of LME granted through this
| | | | | | | | |
| Albemarle Corporation and Subsidiaries |
|
annex have been exploited, processed, and sold, or (b) on January 1, 2044, whichever comes first. In addition, the amended agreement provides for commission payments to the Chilean government based on sales price/metric ton on the amounts sold under the additional quota granted, our support of research and development in Chile of lithium applications and solar energy, and our support of local communities in Northern Chile. Albemarle currently operates its extraction and production facilities in Chile under this mineral rights agreement with the Chilean government.
The Salar de Atacama is a salt flat, the largest in Chile, located in the Atacama Desert in northern Chile, which is the driest non-polar place on the planet and thus has an extremely high annual rate of evaporation and extremely low annual rainfall. Our extraction through evaporation process works as follows: snow in the Andes Mountains melts and flows into underground pools of water containing brine, which generally have high concentrations of lithium. We then pump the water containing brine above ground through a series of pumps and wells into a network of large evaporation ponds. Over the course of approximately 18-24 months, the desert sun evaporates the water causing other salts to precipitate and leaving behind concentrated lithium brine. If weather conditions are not favorable, the evaporation process may be prolonged. After we obtain the lithium brine from the Salar de Atacama, we process it into lithium carbonate and lithium chloride at our manufacturing facilities in nearby La Negra, Chile.
The filling materials of the Salar de Atacama Basin are dominated by the Vilama Formation and the more recently, in geologic time, by evaporitic and clastic materials that are currently being deposited in the basin. These units house the basin's aquifer system and are composed of evaporitic chemical sediments that include carbonate, gypsum and halite intervals interrupted by volcanic deposits of large sheets of ignimbrite, volcanic ash and smaller classical deposits. Lithium-rich brines are extracted from the halite aquifer that is located within the nucleus of the salt flat. The Salar de Atacama basin contains a continental system of lithium-rich brine. These types of systems have six common (global) characteristics: arid climate; closed basin that contains a salt flat (salt crust), a salt lake, or both; igneous and/or hydrothermal activity; tectonic subsidence; suitable sources of lithium; and sufficient time to concentrate the lithium in the brine.
In the Salar de Atacama basin, lithium-rich brines are found in a halite aquifer. Carbonate and sulfates are found near the edges of the basin. The concentrations of lithium in the Salar de Atacama basin range from approximately 1,000 mg/L to 7,700 mg/L, but are primarily contained between 1,500 mg/L and 6,000 mg/L. From 2017 through 2023, at least five drilling campaigns were carried out in order to obtain geological and hydrogeological information at the Albemarle mining concession.
The facilities at the Salar de Atacama consist of extraction wells, evaporation and concentration ponds, leaching plants, a potash plant, a drying plant, a salar yield improvement plant, services and general areas, including salt stockpiles, as well as a fleet of owned and leased equipment. In addition, the site includes administrative offices, an operations building and a laboratory. The extracted concentrated lithium brine is sent to the La Negra plant by truck for processing. The Salar de Atacama has its own powerhouse that generates the energy necessary for the entire operation of the facilities. We also have permanent and continuous groundwater exploitation rights for two wells that are for industrial use and to supply the Salar de Atacama facilities. The La Negra facilities consist of three boron removal plants, three calcium and magnesium removal plants, three lithium carbonate conversion plants, a lithium chloride plant, evaporation-sedimentation ponds, an offsite area where the raw materials are housed and the inputs that are used in the process are prepared, a dry area where the various products are prepared, as well as a fleet of owned and leased equipment. La Negra is supplied electricity from a local company and has rights to a well in the Peine community for its water supply. We consider the condition of all of our plants, facilities and equipment to be suitable and adequate for the businesses we conduct, and we maintain them regularly. As of December 31, 2024, the combined gross asset value of our facilities at the Salar de Atacama and in La Negra, Chile (not inclusive of construction in process) was approximately $2.1 billion.
A summary of the Salar de Atacama facility’s lithium mineral resources, exclusive of reserves, and reserves as of December 31, 2024 are shown in the following tables. SRK Consulting (U.S.) Inc. (“SRK”) served as the QP and prepared the estimates of lithium mineral resources (exclusive of reserves) and reserves at the Salar de Atacama facility. A copy of the QP’s most recent technical report summary with respect to the lithium mineral resource and reserve estimates at the Salar de Atacama facility, dated February 8, 2025, with an effective date of June 30, 2024, is filed as Exhibit 96.3 to this report. The mineral resource economic assumptions remain unchanged from June 30, 2024. The June 30, 2024 resource has been depleted for actual production and is reported as of December 31, 2024 in the below table. The amounts represent Albemarle’s attributable portion based on a 100% ownership percentage, and are presented as metric tonnes of lithium metal in thousands.
The Salar de Atacama mineral resource, exclusive of reserves, estimates with depletion from production from the effective date of the report to December 31, 2024 are summarized in the following table:
| | | | | | | | |
| Albemarle Corporation and Subsidiaries |
|
| | | | | | | | | | | | |
| Amount (‘000s metric tonnes) | | Li Concentration (mg/L) | |
| Measured mineral resources | 618 | | 2,176 | |
| Indicated mineral resources | 481 | | 1,868 | |
| Measured and Indicated mineral resources | 1,099 | | 2,041 | |
| Inferred mineral resources | 166 | | 1,558 | |
•Mineral resources are reported exclusive of mineral reserves. Mineral resources are not mineral reserves and do not have demonstrated economic viability.
•Given the dynamic reserve versus the static resource, a direct measurement of resources post-reserve extraction is not practical. Therefore, as a simplification, to calculate mineral resources, exclusive of reserves, the quantity of lithium pumped in the life of mine plan was subtracted from the overall resource without modification to lithium concentration. Measured and indicated resource were deducted proportionate to their contribution to the overall mineral resource.
•Resources are reported on an in situ basis.
•Resources are reported above the elevation of 2,200 meters above sea level. Resources are reported as lithium metal.
•Resources have been categorized subject to the opinion of a QP based on the amount/robustness of informing data for the estimate, consistency of geological/grade distribution, survey information.
•Resources have been calculated using drainable porosity estimated from measured values in Upper Halite and Volcano-sedimentary units, and bibliographical values based on the lithology and QP’s experience in similar deposits.
•The following assumptions were used in developing the 2024 resource model:
◦The estimated economic cut-off grade utilized for resource reporting purposes is 904 mg/l lithium, based on the following assumptions:
◦A technical grade lithium carbonate price of $20,000/metric tonne CIF Asia. This is an 18% premium to the price utilized for reserve reporting purposes. The 18% premium applied to the resource versus the reserve was selected to generate a resource larger than the reserve, ensuring the resource fully encompassed the reserve while still maintaining reasonable prospect for economic extraction.
◦Recovery factors for the salar operation increase gradually over the span of 4 years, from the current 40% to the proposed salar yield improvement program 60% recovery in 2027. After that point, evaporation pond recovery is a constant 60%. An additional recovery factor of 80% lithium recovery is applied to the La Negra lithium carbonate plant.
◦An average annual brine pumping rate of 368 L/s is assumed to meet drawdown constraint consistent with Albemarle’s early warning plan.
◦Operating cost estimates are based on a combination of fixed brine extraction, general and administrative, and plant costs and variable costs associated with raw brine pumping rate or lithium production rate. Average life of mine operating cost is calculated at approximately $5,334/metric tonne CIF Asia.
◦Sustaining capital costs are included in the cut-off grade calculation and post the salar yield improvement program installation average around $110 million per year.
◦Royalties are included in the cut-off grade calculation and average approximately $4,172/metric tonne of lithium carbonate produced.
•Mineral resources tonnage and contained metal have been rounded to reflect the accuracy of the estimate, and numbers may not add due to rounding.
The Salar de Atacama measured and indicated mineral resources of 1.1 million metric tonnes at December 31, 2024 increased by 32% from 834,000 metric tonnes at December 31, 2023. Inferred mineral resources of 166,000 metric tonnes decreased by 30% from 237,000 metric tonnes. The net increase in total mineral resources was driven by new modeling completed in development of the current technical report summary as well as a decrease in the reserves due to reduced pumping rates imposed by Albemarle’s early warning plan. The new model assumptions included a higher estimated economic cut-off grade, lower pricing, a lower annual brine pumping rate and higher operating cost estimates. The model geology and updated units redistributed volumes of brine and adjusted lithium concentration contained within the brine in comparison with the previous geological units in the model. This redefinition along with new well sampling resulted in a conversion of resource from inferred to measured and indicated.
| | | | | | | | |
| Albemarle Corporation and Subsidiaries |
|
The Salar de Atacama reserve estimates with depletion from production from the effective date of the report through December 31, 2024 are summarized in the following table:
| | | | | | | | | | | | |
| Amount (‘000s metric tonnes) | | Concentration (mg/L) | |
| Proven mineral reserves: | | | | |
| In Situ | 288 | | 2,370 | |
| In Process | 23 | | 2,844 | |
| Probable mineral reserves: | | | | |
| In Situ | 147 | | 2,023 | |
| Total mineral reserves: | | | | |
| In Situ | 435 | | 2,240 | |
| In Process | 23 | | 2,844 | |
•In process reserves quantify the prior 24 months of pumping data and reflect the raw brine, at the time of pumping. These reserves represent the first 24 months of feed to the lithium process plant in the 2024 economic model.
•Proven reserves have been estimated as the lithium mass pumped during Years 2024 through mid-2035 of the proposed life of mine plan maintaining 10.5 years of proven reserve.
•Probable reserves have been estimated as the lithium mass pumped from mid-2035 until the end of the proposed life of mine plan (2041).
•The ratio of in situ proven to probable reserves has remained consistent through depletion since the development of the reserve model in 2024 with approximately 65% of the reserve designated as proven and 35% of the reserve designated as probable.
•Reserves are reported as lithium metal on a 100% ownership basis.
•This mineral reserve estimate was derived based on a production pumping plan truncated in September 2041 (i.e., approximately 16.75 years). This plan was truncated to reflect the termination date of Albemarle’s authorized brine extraction from the salar.
•The 2024 reserve model used as the basis for depletion has not been updated. The following assumptions were used in developing that model:
◦The estimated economic cut-off grade for the project is 1,073 mg/l lithium, based on the assumptions discussed below. The truncated production pumping plan remained well above the economic cut-off grade (i.e., the economic cut-off grade did not result in a limiting factor to the estimation of the reserve).
◦A technical grade lithium carbonate price of $17,000/metric tonne CIF Asia.
◦Recovery factors for the salar operation increase gradually over the span of 4 years, from the current 40% to the proposed salar yield improvement program 60% recovery in 2027. After that point, evaporation pond recovery remains relatively constant at 60%, An additional recovery factor of 80% lithium recovery is applied to the La Negra lithium carbonate plant.
◦An average annual brine pumping rate of 368 L/s is assumed to meet drawdown constraint with activation of Albemarle’s early warning plan.
◦Operating cost estimates are based on a combination of fixed brine extraction, general and administrative, and plant costs and variable costs associated with raw brine pumping rate or lithium production rate. Average life of mine operating cost is calculated at approximately $5,334/metric tonne CIF Asia.
◦Sustaining capital costs are included in the cut-off grade calculation and post the salar yield improvement program installation, average around $110 million per year.
◦Royalties are included in the cut-off grade calculation and average approximately $4,172/metric tonne of lithium carbonate produced.
•Mineral reserve tonnage, grade and mass yield have been rounded to reflect the accuracy of the estimate and numbers may not add due to rounding.
The Salar de Atacama total mineral reserves of 458,000 metric tonnes at December 31, 2024 decreased by 14% from 531,000 metric tonnes at December 31, 2023. The decrease in total mineral reserves was driven by depletion during the year, new modeling completed in development of the current technical report summary as well as a decrease in the reserves due to reduced pumping rates imposed by Albemarle’s early warning plan. The new model assumptions included a higher estimated economic cut-off grade, lower pricing, a lower annual brine pumping rate and higher operating cost estimates.
Additional information about key assumptions and parameters relating to the lithium mineral resources and reserves at the Salar de Atacama facility is discussed in sections 11 and 12, respectively, of the Salar de Atacama technical report summary.
| | | | | | | | |
| Albemarle Corporation and Subsidiaries |
|
Silver Peak, Nevada
The Silver Peak site (latitude 37.751773°N, longitude 117.639027°W) is located in a rural area approximately 30 miles southwest of Tonopah, in Esmeralda County, Nevada. It is located in the Clayton Valley, an arid valley historically covered with dry lake beds (playas). The operation borders the small, unincorporated town of Silver Peak, Nevada. Albemarle uses the Silver Peak site for the production of lithium brines, which are used to make lithium carbonate. Access to the site is off of the paved highway SR-265 in the town of Silver Peak, Nevada. The administrative offices are located on the south side of the road. The process facility is on the north side of the road and the brine operations are located approximately three miles east of Silver Peak on Silver Peak Road and occupy both the north and south sides of the road. In addition, access to the site is also possible via gravel/dirt roads from Tonopah, Nevada and Goldfield, Nevada.
Lithium brine extraction in the Clayton Valley began in the mid-1960’s by one of our predecessors, the Foote Mineral Company. Since that time, lithium brine operations have been operated on a continuous basis. In 1998, Chemetall purchased Foote Mineral Company. Subsequently, in 2004, Chemetall was acquired by Rockwood, and in 2015, Rockwood was acquired by Albemarle. Our mineral rights in Silver Peak consist of our right to access lithium brine pursuant to our permitted and certified senior water rights, a settlement agreement with the U.S. government, originally entered into in June 1991, and our patented and unpatented land claims. Pursuant to the 1991 agreement, our water rights and our land claims, we have rights to all lithium that we can remove economically from the Clayton Valley Basin in Nevada. See section 3 of the Silver Peak technical report summary, filed as Exhibit 96.4 to this report, for a listing of patented and unpatented claims at the Silver Peak site. We have been operating at the Silver Peak site since 1966. Our Silver Peak site covers a surface of over 13,500 acres, more than 10,500 acres of which we own through a subsidiary. The remaining acres are owned by the U.S. government from whom we lease the land pursuant to unpatented land claims that are renewed annually. Actual surface disturbance associated with the operations is 7,390 acres, primarily associated with the evaporation ponds. The manufacturing and administrative activities are confined to an area approximately 20 acres in size.
| | | | | | | | |
| Albemarle Corporation and Subsidiaries |
|
We extract lithium brine from our Silver Peak site through substantially the same evaporation process we use at the Salar de Atacama. We process the lithium brine extracted from our Silver Peak site into lithium carbonate at our plant in Silver Peak. It is hypothesized that the current levels of lithium dissolved in brine originate from relatively recent dissolution of halite by meteoric waters that have penetrated the playa in the last 10,000 years. The halite formed in the playa during the aforementioned climatic periods of low precipitation and that the concentrated lithium was incorporated as liquid inclusions into the halite crystals. There are no current exploration activities on the Silver Peak lithium operation.
The facilities at Silver Peak consist of extraction wells, evaporation and concentration ponds, a lithium carbonate plant, an anhydrous lithium hydroxide plant (for processing lithium hydroxide monohydrate), a liming plant, wellfield and mill maintenance, a shipping and packaging facility and administrative offices, as well as a fleet of owned and leased equipment. Silver Peak is supplied electricity from a local company and we currently have two operating fresh water wells nearby that supply water to the facilities. We consider the condition of all of our plants, facilities and equipment to be suitable and adequate for the businesses we conduct, and we maintain them regularly. As of December 31, 2024, the gross asset value of our facilities at our Silver Peak site was approximately $191.9 million.
A summary of the Silver Peak facility’s lithium mineral resources, exclusive of reserves, and reserves as of December 31, 2024 is shown in the following tables. SRK served as the QP and prepared the estimates of lithium mineral resources (exclusive of reserves) and reserves at the Silver Peak facility. A copy of the QP’s most recent technical report summary with respect to the lithium mineral resource and reserve estimates at the Silver Peak facility, dated February 8, 2025, with an effective date of June 30, 2024, is filed as Exhibit 96.4 to this report. The mineral resource economic assumptions remain unchanged from June 30, 2024. The June 30, 2024 resource has been depleted for actual production and is reported as of December 31, 2024 in the below table. The amounts represent Albemarle’s attributable portion based on a 100% ownership percentage, and are presented as metric tonnes of lithium metal in thousands.
The Silver Peak mineral resources, exclusive of reserves, estimates with depletion from production from the effective date of the report through December 31, 2024 are summarized in the following table:
| | | | | | | | | | | | |
| Amount (‘000s metric tonnes) | | Concentration (mg/L) | |
| Measured mineral resources | 7 | | 169 | |
| Indicated mineral resources | 11 | | 155 | |
| Measured and Indicated mineral resources | 17 | | 160 | |
| Inferred mineral resources | 102 | | 130 | |
•Mineral resources are reported exclusive of mineral reserves on a 100% ownership basis. Mineral resources are not mineral reserves and do not have demonstrated economic viability.
•Given the dynamic reserve versus the static resource, a direct measurement of resources post-reserve extraction is not practical. Therefore, as a simplification, to calculate mineral resources exclusive of reserves, the quantity of lithium pumped in the life of mine plan was subtracted from the overall resource without modification to lithium concentration. Measured and Indicated resources were deducted proportionate to their contribution to the overall mineral resource.
•Resources are reported on an in situ basis.
•Resources are reported as lithium metal.
•The resources have been calculated from the block model above 740 meters above sea level.
•Resources have been categorized subject to the opinion of a QP based on the amount/robustness of informing data for the estimate, consistency of geological/grade distribution, survey information.
•Resources have been calculated using drainable porosity estimated from bibliographical values based on the lithology and QP’s experience in similar deposits.
•The following assumptions were used in developing the 2024 resource model:
◦The estimated economic cut-off grade utilized for resource reporting purposes is 63 mg/L lithium, based on the assumptions discussed below.
◦A technical grade lithium carbonate price of $20,000/metric tonne CIF Asia. This is an 18% premium to the price utilized for reserve reporting purposes. The 18% premium applied to the resource versus the reserve was selected to generate a resource larger than the reserve, ensuring the resource fully encompassed the reserve while still maintaining reasonable prospect for economic extraction.
◦Recovery factors for the wellfield are = -206.23*(Li wellfield feed)2 +7.1903*(wellfield Li feed)+0.4609. An additional 78% lithium recovery factor is applied to the lithium carbonate plant.
◦A sustainable fixed brine pumping rate of 20,000 acre feet per year, ramped up from current levels.
◦Operating cost estimates are based on a combination of fixed brine extraction, general and administrative, and plant costs and variable costs associated with raw brine pumping rate or lithium production rate. Average life of mine operating costs is calculated at approximately $6,829/metric tonne lithium carbonate CIF Asia.
| | | | | | | | |
| Albemarle Corporation and Subsidiaries |
|
◦Sustaining capital costs are included in the cut-off grade calculation and include a fixed component of approximately $284 million through the ramp-up period to sustainably pumping 20,000 acre feet per year, then an estimated $20 million per year in addition to the estimated number of wells replaced and new wells drilled per year.
•Mineral Resources tonnage and contained metal have been rounded to reflect the accuracy of the estimate, and numbers may not add due to rounding.
The Silver Peak measured and indicated mineral resources of 17,100 metric tonnes at December 31, 2024 decreased by 66% from 50,200 metric tonnes at December 31, 2023. Inferred mineral resources of 102,000 metric tonnes increased by 14% from 89,500 metric tonnes. The net decrease in total mineral resources was driven by new modeling completed in development of the current technical report summary as well as a depletion based on actual production. The new model assumptions included a higher estimated economic cut-off grade, new brine concentrations data, lower lithium pricing and higher operating and capital cost estimates.
The Silver Peak reserve estimates with depletion from production from the effective date of the report through December 31, 2024 are summarized in the following table:
| | | | | | | | | | | | |
| Amount (‘000s metric tonnes) | | Concentration (mg/L) | |
| Proven mineral reserves: | | | | |
| In Situ | 12 | | 97 | |
| In Process | 1 | | 101 | |
| Probable mineral reserves: | | | | |
| In Situ | 66 | | 119 | |
| Total mineral reserves: | | | | |
| In Situ | 78 | | 115 | |
| In Process | 1 | | 101 | |
•In process reserves quantify the prior 24 months of pumping data and reflect the raw brine at the time of pumping. These reserves represent the first 24 months of feed to the lithium process plant in the 2024 economic model.
•Proven reserves have been estimated as the lithium mass pumped from the existing wells from 2025 through 2031 of the proposed life of mine plan.
•Probable reserves have been estimated as the lithium mass pumped from existing wells from 2032 and all new proposed production wells from installation until the end of the proposed life of mine plan (2053).
•The ratio of in situ Proven to Probable reserves has remained consistent through depletion since the development of the reserve model in 2024, with approximately 16% of the reserve designated as proven and 84% of the reserve designated as probable.
•Reserves are reported as lithium metal on a 100% ownership basis.
•This mineral reserve estimate was derived based on a production pumping plan truncated at the end of 2053 (i.e., approximately 29 years). This plan was truncated to reflect the QP’s opinion on uncertainty associated with the production plan, as a direct conversion of measured and indicated resources to proven and probable reserve is not possible in the same way as a typical hard rock mining project.
•The 2024 reserve model used as the basis for depletion has not been updated. The following assumptions were used in developing that model:
◦The estimated economic cut-off grade for the Silver Peak project is 76 mg/l lithium, based on the assumptions discussed below. The production pumping plan was truncated due to technical uncertainty inherent in long-term production modeling and remained well above the economic cut-off grade (i.e., the economic cut-off grade did not result in a limiting factor to the estimation of the reserve).
◦A technical grade lithium carbonate price of $17,000/metric tonne CIF Asia.
◦Recovery factors for the wellfield are = -206.23*(Li wellfield feed)2 +7.1903*(wellfield Li feed) + 0.4609. An additional 78% lithium recovery factor is applied to the lithium carbonate plant.
◦A sustainable fixed brine pumping rate of 20,000 acre feet per year, ramped up from current levels over a period of 7 years.
◦Operating cost estimates are based on a combination of fixed brine extraction, general and administrative, and plant costs and variable costs associated with raw brine pumping rate or lithium production rate. Average life of mine operating costs are calculated at approximately $6,829/metric tonne lithium carbonate CIF Asia.
◦Sustaining capital costs are included in the cut-off grade calculation and include a fixed component of approximately $284 million through the ramp-up period to sustainably pumping 20,000 acre feet per year, then an estimated $20 million per year in addition to the estimated number of wells replaced and new wells drilled per year.
•Mineral reserve tonnage, grade and mass yield have been rounded to reflect the accuracy of the estimate (thousand tonnes), and numbers may not add due to rounding.
The Silver Peak total mineral reserves of 79,400 metric tonnes at December 31, 2024 increased by 18% from 67,500 metric tonnes at December 31, 2023. The increase in total mineral reserves was driven by new modeling completed in development of the current technical report summary, partially offset by depletion during the year. The new model assumptions
| | | | | | | | |
| Albemarle Corporation and Subsidiaries |
|
included a higher estimated economic cut-off grade, lower pricing, a lower annual brine pumping rate and higher operating cost estimates.
Additional information about key assumptions and parameters relating to the lithium mineral resources and reserves at the Silver Peak facility is discussed in sections 11 and 12, respectively, of the Silver Peak technical report summary.
Safi, Jordan
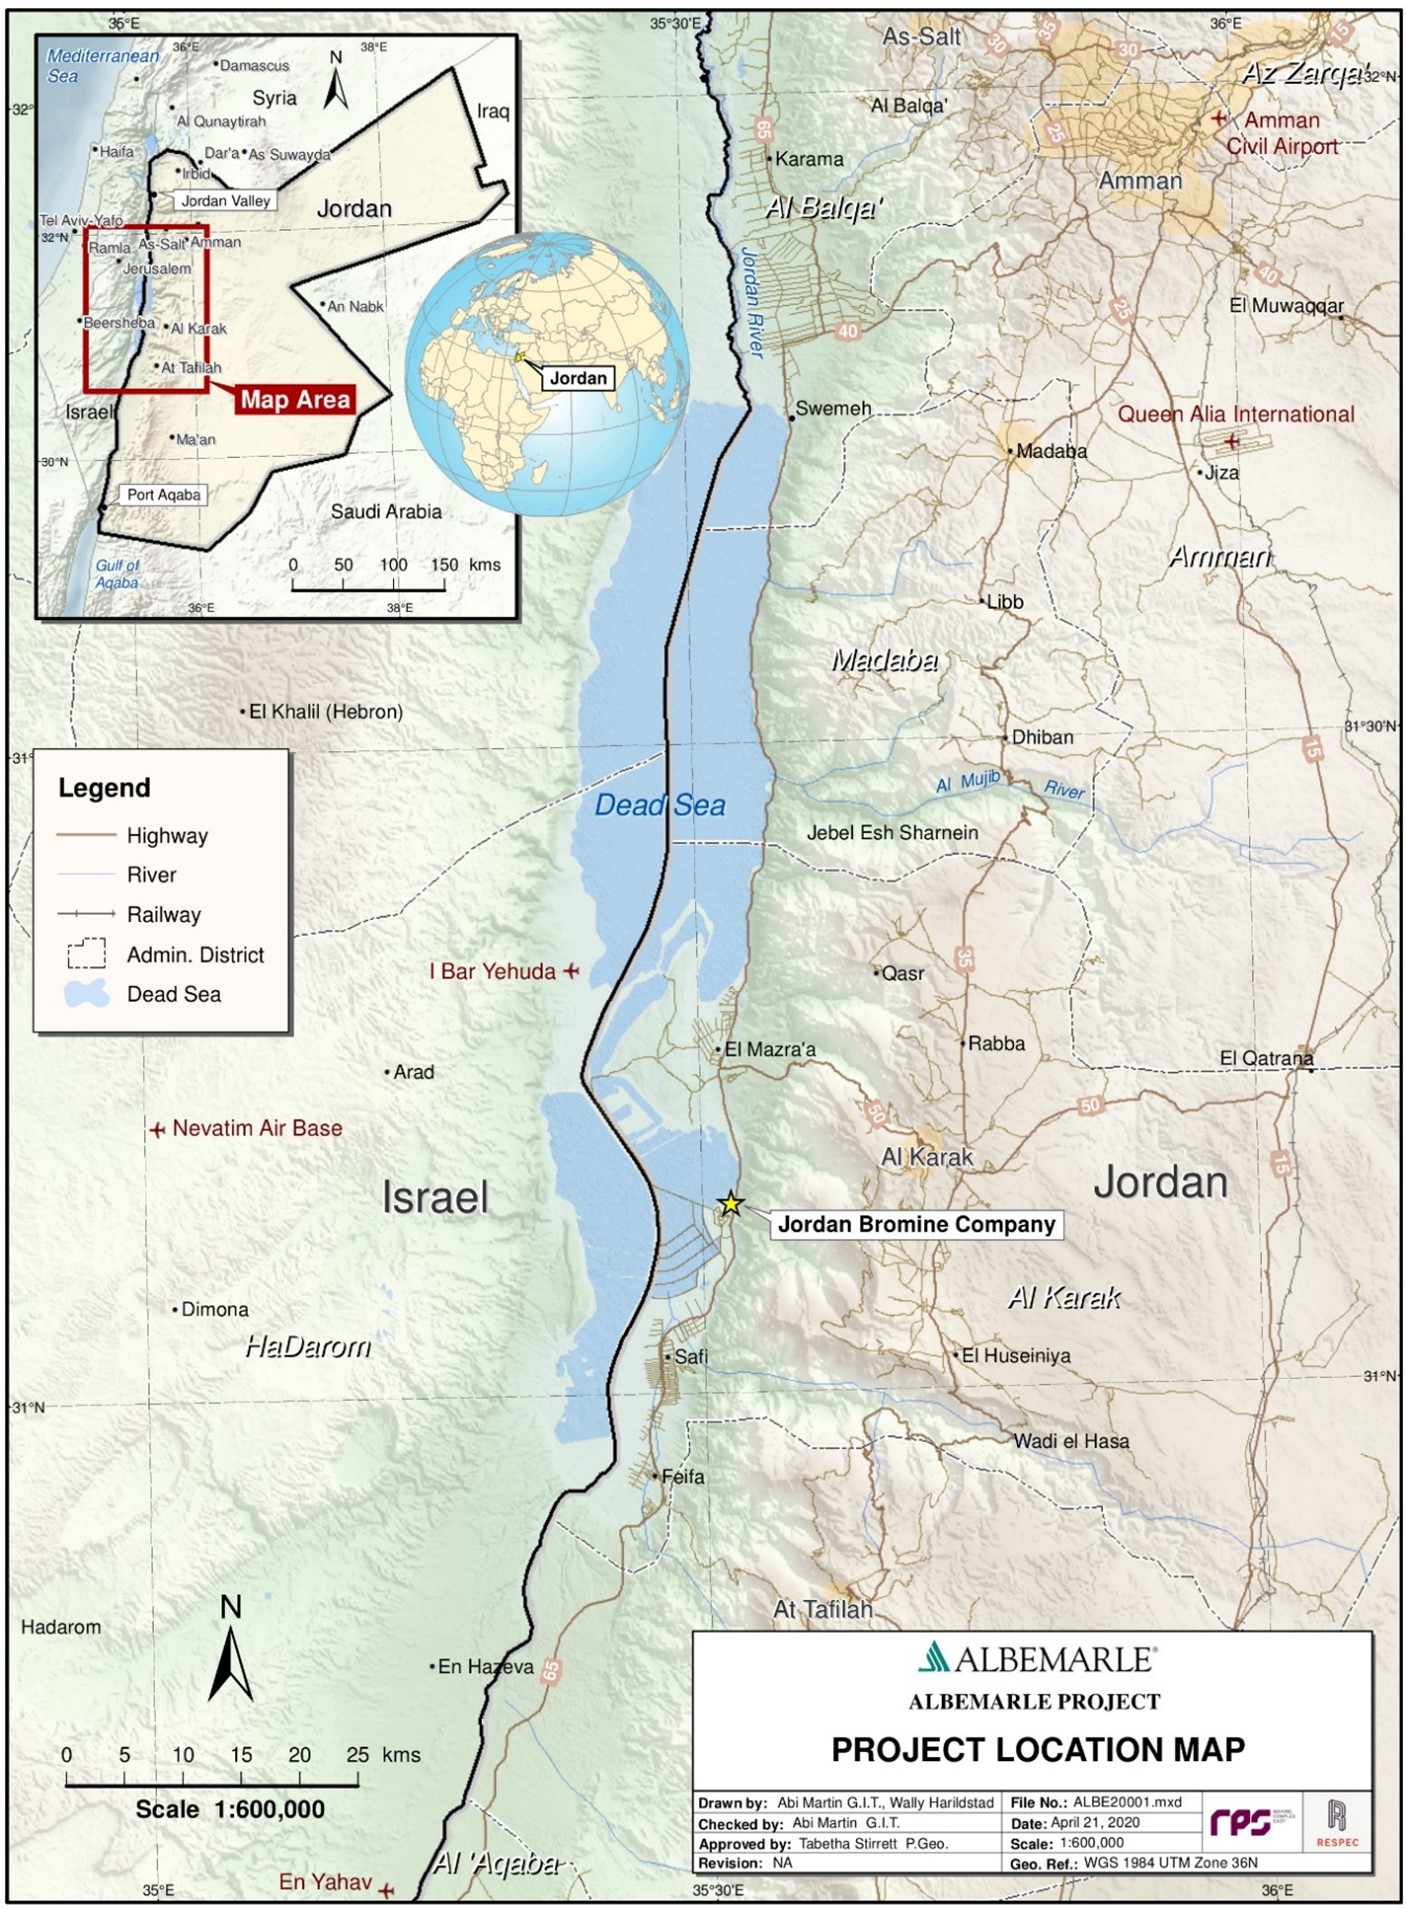
Our 50% interest in JBC, a consolidated joint venture established in 1999, with operations in Safi, Jordan, acquires bromine that is originally sourced from the Dead Sea. JBC processes the bromine at its facilities into a variety of end products. The JBC operation (latitude 31°8'34.85"N , longitude 35°31'34.68"E) is located in Safi, Jordan, and is located on a 33 hectare area on the southeastern edge of the Dead Sea, about 6 kilometers north of the of the APC plant. JBC also has a 2 hectare storage facility within the free-zone industrial area at the Port of Aqaba. The Jordan Valley Highway/Route 65 is the primary method of access for supplies and personnel to JBC. The Port of Aqaba is the main entry point for supplies and equipment for JBC, where imported shipping containers are offloaded from ships and are transported by truck to JBC via the Jordan Valley Highway. Aqaba is approximately 205 km south of JBC via Highway 65. Major international airports can be readily accessed either at Amman or Aqaba. Jordan’s railway transport runs north-south through Jordan and is not used to transport JBC employees and product.
In 1958, the Government of the Hashemite Kingdom of Jordan granted APC a concession for exclusive rights to exploit the minerals and salts from the Dead Sea brine until 2058; at that time, APC factories and installations would become the property of the Government. APC was granted its exclusive mineral rights under the Concession Ratification Law No. 16 of 1958. APC produces potash from the brine extracted from the Dead Sea. A concentrated bromide-enriched brine extracted from APC’s evaporation ponds is the feed material for the JBC plant. Following the formation of the joint venture, the JBC bromine plant began operations in 2002. Expansion of the facilities to double its bromine production capacity went into operation in 2017.
| | | | | | | | |
| Albemarle Corporation and Subsidiaries |
|
The climate, geology and location provide a setting that makes the Dead Sea a valuable large-scale natural resource for potash and bromine. Today, the Dead Sea has an estimated surface area of 569 km2 and a brine volume of 106 km3. The Dead Sea is the world’s saltiest natural lake, containing high concentrations of ions compared to that of regular seawater and an unusually high amount of magnesium and bromine. There is an estimated 666 million tonnes of bromine in the Dead Sea.
Mining methods consist of all activities necessary to extract brine from the Dead Sea and extract Bromine. The low rainfall, low humidity and high temperatures in the Dead Sea area provide ideal conditions for recovering potash from the brine by solar evaporation. JBC obtains its feedbrine from APC’s evaporation pond and this supply is intimately linked to the APC operation. As evaporation takes place the specific gravity of the brine increases until its constituent salts progressively crystallize and precipitate out of solution, starting with sodium chloride (common salt) precipitating out to the bottom of the ponds (pre-carnallite ponds). Brine is transferred to other pans in succession where its specific gravity increases further, ultimately precipitating out of the sodium chloride. Carnallite precipitation takes place at the evaporation pond where it is harvested from the brine and pumped as slurry to a process plant (where the potassium chloride is separated from the magnesium chloride). JBC extracts the bromide-rich, “carnallite-free” brine through a pumping station. This brine feeds the bromine and magnesium plants. There is no exploration as typically conducted for the characterization of a mineral deposit.
Infrastructure and facilities to support the operation of the bromine production plant at the Safi site is compact and contained in an approximately 33 hectare area. Fresh water is sourced from the Mujib Reservoir, a man-made reservoir. JBC is supplied electricity from the National Electric Power Company of Jordan. JBC ships product in bulk through a storage terminal in Aqaba. There are above ground storage tanks as well as pumps and piping for loading these products onto ships. JBC main activities at Aqaba are raw material/product storing, importing, and exporting. An evaporation pond collects the waste streams from pipe flushing, housekeeping, and other activities. We consider the condition of all of our plants, facilities and equipment to be suitable and adequate for the businesses we conduct, and we maintain them regularly. As of December 31, 2024, our 50% ownership interest of the gross asset value of the facilities at the Safi, Jordan site was approximately $261.2 million.
A summary of the Safi facility’s bromine mineral resources and reserves as of December 31, 2024 is provided below. RPS Energy Canada Ltd (“RPS”), a third-party firm comprising mining experts in accordance with Item 1302(b)(1) of Regulation S-K, served as the QP and prepared the estimates of bromine mineral resources and reserves at the Safi facility, with an effective date of December 31, 2024. A copy of the QP’s amended technical report summary with respect to the bromine mineral resource and reserve estimates at the Safi facility, dated February 12, 2025, is filed as Exhibit 96.5 to this report.
The feedstock is drawn from the Dead Sea, a nonconventional reservoir owned by the nations of Israel and Jordan. As such, there are no specific resources owned by JBC, but Albemarle’s joint venture partner, APC, has exclusive rights granted by the Hashemite Kingdom of Jordan to withdraw brine from the Dead Sea and process it to extract minerals. Revenues are based on a forecast bromine price ranging from $1,661 to $3,020 per metric tonne and the operating cost is approximately $364 per metric tonne. The measured resource of bromide ion attributable to Albemarle’s 50% interest in its JBC joint venture is estimated to be approximately 173.93 million metric tonnes. JBC is extracting approximately 1 percent of the bromine available in Jordan’s share of the Dead Sea. Bromide concentration in the Dead Sea is estimated to average approximately 5,037 ppm. The cut-off grade of the Albemarle bromine operations has been estimated to be at 1,000 ppm. The bromide ion concentration in the brine extracted which feeds the bromine plants, significantly exceeds the selected cut-off grade.
The Safi measured mineral resources of 173.93 million metric tonnes of bromide ion at December 31, 2024 decreased by 1% from 175.69 million metric tonnes at December 31, 2023. The decrease in measured mineral resources was driven by depletion and evaporation in the Dead Sea during the year.
All bromine reserves reported by Albemarle for the JBC project are classified as proven mineral reserves. The mineral reserve estimate attributable to Albemarle’s 50% interest in its JBC joint venture is approximately 2.0 million metric tonnes of bromine from the Dead Sea. This estimate is based on the time available under the concession agreement with the Hashemite Kingdom of Jordan and the processing capability of the JBC plant. As only approximately one percent of the available resource is consumed from the Dead Sea, as noted above, the reserve estimate is based on the amount the JBC plant can produce over until the end of 2058, when the APC concession agreement ends. Revenues are based on a forecast bromine price ranging from $1,661 to $3,020 per metric tonne and the operating cost is approximately $364 per metric tonne. At the plant process recovery of 87 percent (bromine from bromide), product bromine is estimated at approximately 118,000 metric tonnes per year. Bromide ion concentration of concentrated bromide-enriched brine from the APC evaporation pond used to estimate the reserve from the Dead Sea was approximately 8,742 ppm based on historical pumping. The cut-off grade of the Albemarle bromine operations has been estimated to be at 1,000 ppm. The bromide ion concentration in the brine extracted which feeds the bromine plants, significantly exceeds the selected cut-off grade.
| | | | | | | | |
| Albemarle Corporation and Subsidiaries |
|
The Safi total mineral reserves of 2.0 million of bromne metric tonnes at December 31, 2024 decreased by 3% from 2.07 million metric tonnes at December 31, 2023. The decrease in total mineral reserves was driven by depletion during the year. The end date of the forecast remained unchanged due to the concession agreement.
Additional information about key assumptions and parameters relating to the bromine mineral resources and reserves at the Safi facility is discussed in sections 11 and 12, respectively, of the Safi technical report summary.
Magnolia, Arkansas
Magnolia is located in the southwest Arkansas, north of the center of Columbia County, approximately 50 miles east of Texarkana and 135 miles south of Little Rock. Our facilities include two separate production plants, the South Plant and the West Plant. The South Plant (latitude 33.1775°N, longitude 93.2161°W) is accessible via U.S. Route 79 and paved local roads. The West Plant (latitude 33.2648°N, longitude 93.3151°W) is accessible by U.S. Route 371 and paved local roads. The decentralized well sites around the brine fields are accessed via paved Arkansas Highways 19, 98, 160 and 344.
In Magnolia, bromine is recovered from underground brine wells and then processed into a variety of end products at the plant on location. Albemarle has more than 50 brine production and injection wells that are currently active on the property. Albemarle’s area of bromine operation is comprised of over 9,500 individual leases with local landowners comprising a total area of over 99,500 acres. The leases have been acquired over time as field development extended across the field. Each lease continues for a period of 25 years or longer until after a two year period where brine is not injected or produced from/to a well within two miles of lease land areas, as long as lease rentals are continuing to be paid. See section 3 of the Magnolia technical report summary, filed as Exhibit 96.6 to this report, for a map of leases and burdens on those leases at the Magnolia site.
Bromine extraction began in Magnolia in 1965 as the first brine supply well was drilled, and additional wells were put into production over the next few years. In 1987, a predecessor company took over operations of certain brine supply and injection wells, which Albemarle continues to operate to this day. Albemarle has continued to drill new production and injection wells, as needed, to maintain production profile targets.
In Magnolia, bromine exists as sodium bromide in the formation waters or brine of the Jurassic age Smackover Formation, a geological formation in Arkansas, in the subsurface at 7,000 to 8,500 feet below sea level. The mineralization occurs within the highly saline Smackover Formation waters or brine where the bromide has an abnormally rich composition. The bromine concentration is more than twice as high as that found in normal evaporated seawater. The bromine mineralization of the brine is distributed throughout the porous intervals of the upper and middle Smackover on the property. The strong permeability and porosity of the Smackover grainstones provide excellent continuity of the bromine mineralization within the brine.
| | | | | | | | |
| Albemarle Corporation and Subsidiaries |
|
The facilities at Magnolia consist of brine production and injection wells, brine ponds, two bromine processing plants, pipelines between the plants and wells, a laboratory, storage and warehouses, administrative offices, as well as a fleet of owned and leased equipment. Our Magnolia facilities are supplied electricity from a local company and we currently have several operating freshwater wells nearby that supply water to the facilities. In addition, both plants have dedicated rail spurs that provide access to several rail lines to transport product throughout the country. We consider the condition of all of our plants, facilities and equipment to be suitable and adequate for the businesses we conduct, and we maintain them regularly. As of December 31, 2024, the gross asset value of our facilities at our Magnolia site was approximately $1.1 billion.
A summary of the Magnolia facility’s bromine mineral reserves as of December 31, 2024 is shown in the following table. RPS served as the QP and prepared the estimates of bromine mineral reserves at the Magnolia facility, with an effective date of December 31, 2024. A copy of the QP’s most recent technical report summary with respect to the bromine mineral resource and reserve estimates at the Magnolia facility, dated February 12, 2025, is filed as Exhibit 96.6 to this report. The amounts represent Albemarle’s attributable portion based on a 100% ownership percentage, and are presented as metric tonnes in thousands.
There are no mineral resource estimates at the Magnolia, AR bromine extraction site. All bromine mineral accumulations of economic interest and with reasonable prospects for eventual economic extraction within the Magnolia production lease area are either currently on production or subject to an economically viable future development plan and are classified as mineral reserves.
| | | | | | | | |
| Amount (‘000s metric tonnes) | | | |
| Proven mineral reserves | 2,468 | | | |
| Probable mineral reserves | 467 | | | |
| Total mineral reserves | 2,935 | | | |
•Reserves are reported as bromine, on an in situ basis.
•The estimated economic cut-off grade utilized for reserve reporting purposes is 1,000 mg/L bromine, with a bromine price ranging from $1,660 to $3,020 per metric tonne and operating costs ranging from $756 to $1,094 per metric tonne.
•Recovery factors for the Magnolia are 82% and 88% for the proven mineral reserves and total mineral reserves, respectively.
•The concentration of bromine at the Magnolia site varies based on the physical location of the field and can range up to over 6,600 mg/L.
The Magnolia total mineral reserves of 2.9 million metric tonnes at December 31, 2024 decreased by 12% from 3.3 million metric tonnes at December 31, 2023. The decrease in total mineral reserves was driven by depletion of the reserve during the year as well as lower pricing and higher costs used in the model.
Additional information about key assumptions and parameters relating to the bromine mineral reserves at the Magnolia facility is discussed in section 12 of the Magnolia technical report summary.
| | | | | |
| Item 3. | Legal Proceedings. |
We are involved in litigation incidental to our business and are a party to a number of legal actions and claims, various governmental proceedings and private civil lawsuits, including, but not limited to, those related to environmental and hazardous material exposure matters, product liability and breach of contract. Some of the legal proceedings include claims for compensatory as well as punitive damages. While the final outcome of these matters cannot be predicted with certainty, considering, among other things, the legal defenses available and liabilities that have been recorded along with applicable insurance, it is currently the opinion of management that none of these pending items will have a material adverse effect on our financial condition, results of operations or liquidity.
In addition, the information set forth under Note 15, “Commitments and Contingencies – Litigation” to the Consolidated Financial Statements of this Annual Report on Form 10-K is incorporated herein by reference.
An unexpected adverse resolution of one or more of these items, however, could have a material adverse effect on our financial condition, results of operations or liquidity in that particular period.
| | | | | |
| Item 4. | Mine Safety Disclosures. |
NONE
| | | | | | | | |
| Albemarle Corporation and Subsidiaries |
|
Executive Officers of the Registrant.
The names, ages and biographies of our executive officers, as of February 12, 2025, are set forth below. The term of office of each officer is until the meeting of the Board of Directors following the next annual shareholders’ meeting in May 2025.
| | | | | | | | | | | | | | |
| Name | | Age | | Position |
| J. Kent Masters | | 64 | | Chairman and Chief Executive Officer |
| Neal R. Sheorey | | 48 | | Executive Vice President, Chief Financial Officer |
| Melissa H. Anderson | | 60 | | Executive Vice President, Chief People and Transformation Officer |
| Netha N. Johnson | | 54 | | Executive Vice President, Chief Operations Officer |
| Eric W. Norris | | 58 | | Executive Vice President, Chief Commercial Officer |
| Stacy G. Grant | | 37 | | Senior Vice President, General Counsel, Corporate Secretary and Chief Compliance Officer |
| Cynthia R. Lima | | 63 | | Senior Vice President, Chief External Affairs and Communications Officer |
| Mark R. Mummert | | 57 | | Senior Vice President, Chief Capital, Resources and Supply Chain Officer |
| Michael J. Simmons | | 61 | | President, Ketjen Global Business Unit |
| Donald J. LaBauve, Jr. | | 58 | | Vice President, Corporate Controller and Chief Accounting Officer |
J. Kent Masters has served as Chairman and Chief Executive Officer of Albemarle since April 2020. He joined the Albemarle board of directors in 2015 as part of the Company’s Rockwood Holdings Inc. acquisition and served as lead independent director from 2018 until April 2020. Before joining Albemarle, Mr. Masters served as operating partner of Advent International, an international private equity group. Prior to Advent, he was chief executive officer of Foster Wheeler AG, a global engineering and construction contractor and power equipment supplier, from 2011 to 2014. He is also a former member of the executive board of Linde AG, a global leader in manufacturing and sales of industrial gases. He serves on the board of directors of Vibrantz Technologies, a global technology leader in color solutions, functional coatings and specialty minerals. He is also a member of the Charlotte Executive Leadership Council.
Neal R. Sheorey joined Albemarle in November 2023 as Executive Vice President and Chief Financial Officer. Prior to joining Albemarle, Mr. Sheorey served for more than 20 years in progressive leadership roles in finance, business and corporate organizations for The Dow Chemical Company (“Dow”), a global materials science company. He served as vice president of Dow’s Coatings and Performance Monomers business unit, where he was responsible for the group’s strategy, profitability and growth initiatives. Previously, Mr. Sheorey served as Dow’s vice president of investor relations, senior director of corporate development and global finance director for the Chemicals business group.
Melissa Anderson joined Albemarle Executive Vice President and Chief People Officer in January of 2021. In November 2024, she assumed responsibility for enterprise transformation. In this role, she is responsible for leading the transition to a fully integrated functional model along with execution of the Human Resources’ strategic plan and key initiatives. Prior to joining Albemarle, Ms. Anderson served as executive vice president, administration and chief human resources officer for Duke Energy, an American electric power holding company, from January 2015 to August 2020. Previously, she served in senior leadership roles at Domtar Corporation, The Pantry, Inc. and with IBM Corporation. She serves on the board of directors of Vulcan Materials and as a member of the advisory board of the HR Policy Association. Ms. Anderson is a member of the advisory board for the Center for Executive Succession at the University of South Carolina’s Darla Moore School of Business. She also serves on the board of directors for the Society for Human Resource Management (SHRM), previously serving as its chair.
Netha N. Johnson joined the company in 2018 as president of Albemarle’s Bromine Specialties business and was appointed Chief Operations Officer in November 2024. Prior to joining Albemarle, Mr. Johnson served in several progressive leadership roles with 3M Company. He served as vice president and general manager, Electrical Markets Division, where he was directly responsible for 3M’s electrical and renewable energy solutions. Prior to that, he served as 3M’s vice president, Advanced Materials Division. Mr. Johnson has more than 25 years of diverse leadership experience, with extensive work experience in Singapore, Malaysia, Taiwan, Japan and Germany. Preceding his business career, he served as a U.S. Naval Officer. Mr. Johnson is a member of the board of directors of Xcel Energy, where he serves as a member of the Finance Committee and the Operations, Nuclear, Environmental and Safety Committee.
| | | | | | | | |
| Albemarle Corporation and Subsidiaries |
|
Eric Norris is Executive Vice President and Chief Commercial Officer for Albemarle. He joined Albemarle in January 2018 as chief strategy officer and was appointed president of the lithium global business (now Energy Storage) in August 2018. In his current role, Mr. Norris is responsible for enterprise sales, commercial excellence, field and digital marketing, as well as product management. Prior to joining Albemarle, Mr. Norris served as president of Health and Nutrition for FMC Corporation. Following FMC’s announcement to acquire DuPont Agricultural Chemical assets, he led the divestiture of FMC Health and Nutrition to DuPont. Previously, Mr. Norris served as vice president and global business director for FMC Health and Nutrition, and vice president and global business director for FMC Lithium. During his 16-year FMC career, he served in additional leadership roles in investor relations and corporate development and was director of FMC Healthcare Ventures. Prior to FMC, Mr. Norris founded and led an internet-based firm offering formulation and design tools to the chemical industry. He started his career in a range of leadership roles with the Rohm and Haas Company. Mr. Norris is a member of the board of directors of Communities in Schools of Charlotte-Mecklenburg.
Stacy G. Grant joined Albemarle in May of 2023 as vice president and deputy general counsel, global corporate affairs and has more than 10 years of broad legal experience, navigating complex legal and regulatory landscapes. She led the legal team’s support for mergers and acquisition work, as well as issues regarding supply chain, labor and employment, capital projects and IT. Prior to Albemarle, she served as Honeywell International’s vice president and general counsel – M&A and ventures. In this role, Ms. Grant was the chief transactional legal advisor across the corporation with a focus on standardizing processes, advising internal stakeholders and transaction execution. In addition to her corporate experience, she held roles within the law firms of Moore & Van Allen PLLC, King & Spalding and Cravath, Swaine & Moore LLP.
Cynthia Lima joined Albemarle in February 2023 as Chief Communications Officer. Prior to joining Albemarle, Ms. Lima founded a communications and public affairs consultancy and held senior positions at domestic and global public relations agencies. Ms. Lima also served at the U.S. Department of State as a principal media advisor to the secretary of state and as a senate-confirmed presidential appointee at the U.S. Department of Veterans Affairs. Ms. Lima is a founding member and chair of the board of directors for The Heather Abbott Foundation. She also serves on the board of directors for the Albemarle Foundation and the board of trustees for the Charlotte Regional Business Alliance.
Mark R. Mummert joined Albemarle in 2019 as chief operating officer for the Energy Storage business before being appointed as Senior Vice President, Chief Capital, Resources and Supply Chain Officer in November 2024. Before joining Albemarle, Mr. Mummert held progressive leadership roles in supply chain and global operations at FMC Corporation. His industry experience also includes 20 years with Rohm and Haas Company in various manufacturing and engineering roles. Additionally, Mr. Mummert spent time with Dow where he improved S&OP in supply chain and embedded operational excellence principles at manufacturing sites. Mr. Mummert serves on the board of directors for Talison Spodumene Mine at Greenbushes, Western Australia.
Michael J. Simmons joined Albemarle as President, Ketjen global business unit in June 2023. Mr. Simmons has more than 30 years of experience as an operating executive, including serving as a senior partner at Vantage Consulting, a business advisory service specializing in strategy, execution and leadership for energy, financial, and medical clients, from January 2018 to June 2023, and serving as a group president at Shawcor from 2012 to 2017. He served as a private equity partner for Q Investments from 2006 to 2021. He began his career at GE, becoming chief executive officer of the PII Pipeline Solutions unit of GE Oil & Gas from 2005 to 2007.
Donald J. LaBauve, Jr. was appointed Albemarle’s Corporate Controller and Chief Accounting Officer in November 2024. Mr. LaBauve served as the chief financial officer of the lithium global business (now Energy Storage) since November 2019. He previously served as vice president, corporate controller and chief accounting officer from February 2014 to November 2019 after having previously served as vice president, finance - business operations. Since joining Albemarle in 1990, Mr. LaBauve has held various staff and leadership positions of increasing responsibility within the finance function.
PART II
| | | | | |
| Item 5. | Market for the Registrant’s Common Equity, Related Stockholder Matters and Issuer Purchases of Equity Securities. |
Our common stock trades on the New York Stock Exchange (“NYSE”) under the symbol “ALB.” There were 117,573,461 shares of common stock held by 1,930 shareholders of record as of February 5, 2025. On each of February 22, 2024 and May 7, 2024, we declared a dividend of $0.40 per share and on each of July 16, 2024 and October 28, 2024, we declared a dividend of $0.405 per share. In each quarter of 2023, we declared a dividend of $0.40 per share and, in each quarter of 2022, we declared a dividend of $0.395 per share. We expect to continue to declare and pay comparable dividends to our
| | | | | | | | |
| Albemarle Corporation and Subsidiaries |
|
shareholders in the future, however, dividends are declared solely at the discretion of our Board of Directors and there is no guarantee that the Board of Directors will continue to declare dividends in the future.
Stock Performance Graph
The graph below shows the cumulative total shareholder return assuming the investment of $100 in our common stock on December 31, 2019 and the reinvestment of all dividends thereafter. The information contained in the graph below is furnished and therefore not to be considered “filed” with the SEC, and is not incorporated by reference into any document that incorporates this Annual Report on Form 10-K by reference.
| | | | | |
| Item 7. | Management’s Discussion and Analysis of Financial Condition and Results of Operations. |
Forward-looking Statements
Some of the information presented in this Annual Report on Form 10-K, including the documents incorporated by reference herein, may constitute forward-looking statements within the meaning of the Private Securities Litigation Reform Act of 1995. Such forward-looking statements are based on our current expectations, which are in turn based on assumptions that we believe are reasonable based on our current knowledge of our business and operations. We have used words such as “ambition,” “anticipate,” “believe,” “could,” “estimate,” “expect,” “goal,” “intend,” “may,” “should,” “would,” “will” and variations of such words and similar expressions to identify such forward-looking statements.
These forward-looking statements are not guarantees of future performance and involve certain risks, uncertainties and assumptions, which are difficult to predict and many of which are beyond our control. There can be no assurance that our actual results will not differ materially from the results and expectations expressed or implied in the forward-looking statements. Factors that could cause actual results to differ materially from the outlook expressed or implied in any forward-looking statement include, without limitation, information related to:
•changes in economic and business conditions;
•product development;
•changes in financial and operating performance of our major customers and industries and markets served by us;
•the timing of orders received from customers;
•the gain or loss of significant customers;
•fluctuations in lithium market pricing, which could impact our revenues and profitability particularly due to our increased exposure to index-referenced and variable-priced contracts for battery grade lithium sales;
•inflationary trends in our input costs, such as raw materials, transportation and energy, and their effects on our business and financial results;
| | | | | | | | |
| Albemarle Corporation and Subsidiaries |
|
•changes with respect to contract renegotiations;
•potential production volume shortfalls;
•competition from other manufacturers;
•changes in the demand for our products or the end-user markets in which our products are sold;
•limitations or prohibitions on the manufacture and sale of our products;
•availability of raw materials;
•increases in the cost of raw materials and energy, and our ability to pass through such increases to our customers;
•technological change and development;
•changes in our markets in general;
•fluctuations in foreign currencies;
•changes in laws and government regulation impacting our operations or our products;
•the occurrence of regulatory actions, proceedings, claims or litigation (including with respect to the U.S. Foreign Corrupt Practices Act and foreign anti-corruption laws);
•the occurrence of cyber-security breaches, terrorist attacks, industrial accidents or natural disasters;
•the effects of climate change, including any regulatory changes to which we might be subject;
•hazards associated with chemicals manufacturing;
•the inability to maintain current levels of insurance, including product or premises liability insurance, or the denial of such coverage;
•political unrest affecting the global economy, including adverse effects from terrorism or hostilities;
•political instability affecting our manufacturing operations or joint ventures;
•changes in accounting standards;
•the inability to achieve results from our global manufacturing cost reduction initiatives as well as our ongoing continuous improvement and rationalization programs;
•changes in the jurisdictional mix of our earnings and changes in tax laws and rates or interpretation;
•changes in monetary policies, inflation or interest rates that may impact our ability to raise capital or increase our cost of funds, impact the performance of our pension fund investments and increase our pension expense and funding obligations;
•the ability to apply for and obtain government funding to to support new operations;
•volatility and uncertainties in the debt and equity markets;
•technology or intellectual property infringement, including cyber-security breaches, and other innovation risks;
•decisions we may make in the future;
•future acquisition and divestiture transactions, including the ability to successfully execute, operate and integrate acquisitions and divestitures and incurring additional indebtedness;
•expected benefits and expenses related to our new operating structure and asset optimization activities;
•timing of active and proposed restructuring and cost optimization projects;
•impact of any future pandemics;
•impacts of the situation in the Middle East and the military conflict between Russia and Ukraine, and the global response to it;
•performance of our partners in joint ventures and other projects;
•changes in credit ratings; and
•the other factors detailed from time to time in the reports we file with the SEC.
We assume no obligation to provide any revisions to any forward-looking statements should circumstances change, except as otherwise required by securities and other applicable laws. The following discussion should be read together with our consolidated financial statements and related notes included in this Annual Report on Form 10-K.
The following is a discussion and analysis of our results of operations for the years ended December 31, 2024, 2023 and 2022. A discussion of our consolidated financial condition and sources of additional capital is included under a separate heading “Financial Condition and Liquidity.”
| | | | | | | | |
| Albemarle Corporation and Subsidiaries |
|
Overview
We are a world leader in transforming essential resources into critical ingredients for mobility, energy, connectivity, and health. Our purpose is to enable a more resilient world. We partner to pioneer new ways to move, power, connect, and protect. The end markets we serve include grid storage, automotive, aerospace, conventional energy, electronics, construction, agriculture and food, pharmaceuticals and medical devices. We believe that our world-class resources with reliable and consistent supply, our leading process chemistry, high-impact innovation, customer centricity and focus on people and plant will enable us to maintain a leading position in the industries in which we operate.
Secular trends favorably impacting demand within the end markets that we serve combined with our diverse product portfolio, cost discipline, broad geographic presence and customer-focused solutions will continue to be key drivers of our future earnings. We continue to build upon our existing green solutions portfolio and our ongoing mission to provide innovative, yet commercially viable, clean energy products and services to the marketplace to contribute to our sustainability-based revenue. For example, our Energy Storage business contributes to the growth of clean miles driven with electric vehicles and more efficient use of renewable energy through grid storage; Specialties enables the prevention of fires starting in electronic equipment, greater fuel efficiency from rubber tires and the reduction of emissions from coal fired power plants; and our Ketjen business enhances the efficiency of natural resources through more usable products from a single barrel of oil, enables safer, greener production of alkylates used to produce more environmentally-friendly fuels, and reduced emissions through cleaner transportation fuels. We believe our disciplined cost reduction efforts and ongoing productivity improvements, among other factors, position us well to take advantage of strengthening economic conditions as they occur, while softening the negative impact of the current challenging global economic environment.
2024 Highlights
•We announced a comprehensive review of our cost and operating structure to maintain a competitive position, unlock near-term cash flow, further generate long-term financial flexibility and drive long-term value creation. This included a reduction of planned capital expenditures in 2024 to focus on significantly progressed, near completion and in startup projects, while deferring spending on certain projects.
•As part of the actions to optimize our cost structure and strengthen our financial flexibility, we have stopped construction of the Kemerton Trains 3 and 4. In addition, we have put Kemerton Train 2 into care and maintenance. Kemerton Train 1 will continue to operate and activity around it is currently focused on commercialization efforts.
•We announced a new operating structure, effective November 1, 2024, that transitions from two core global business units - Energy Storage and Specialities - to a fully integrated functional model (excluding Ketjen) designed to increase agility, deliver significant cost savings and maintain long-term competitiveness. We will continue to report results across its three existing operating segments: Energy Storage, Specialties and Ketjen.
•We entered into a definitive agreement with the BMW Group to deliver battery-grade lithium to enable the automaker to pursue high-performance, premium electric vehicles. This multi-year agreement, which takes effect in 2025, is one of the company’s largest ever globally by volume and value. In addition to supplying the BMW Group with lithium hydroxide, the two companies will partner on technology for safer and more energy dense lithium-ion batteries.
•In March 2024, the Company raised net cash proceeds of $2.2 billion from the issuance of depositary shares, representing interests of the Company’s Series A Mandatory Convertible Preferred Stock (“Mandatory Convertible Preferred Stock”). The 2,300,000 shares of Mandatory Convertible Preferred Stock issued in respect of the depositary shares have a $1,000 per share liquidation preference.
•Effective January 1, 2024, we changed our definition of adjusted EBITDA for financial accounting and reporting purposes. The updated definition includes our share of the pre-tax earnings of the Windfield joint venture, whereas the prior definition included our share of Windfield earnings net of tax. This calculation is consistent with the definition of adjusted EBITDA used in the leverage financial covenant calculation in the February 2024 amendment to our revolving, unsecured amended and restated credit agreement dated October 28, 2022 (the “2022 Credit Agreement”). This presentation more closely represents the materiality and financial contribution of the strategic investment in Windfield to the Company’s earnings, and more closely represents a measure of EBITDA.
•We proactively amended the 2022 Credit Agreement to modify the financial covenants through June 2026 given the market pricing of lithium. The amended results of the modification (a) temporarily increase the maximum leverage ratio permitted by the covenant; (b) add an interest coverage ratio and temporarily decrease the minimum interest coverage ratio permitted by the covenant; and (c) adjust the calculation of the EBITDA and net debt components that form the basis of the calculation of the consolidated leverage ratio. The amendments include certain other amendments to the 2022 Credit Agreement, including certain limitations on liens, subsidiary indebtedness, share repurchases and common dividends.
| | | | | | | | |
| Albemarle Corporation and Subsidiaries |
|
•We announced an innovative agreement with Martin Marietta Materials, Inc., a leading supplier of building materials, to make beneficial use of extracted limestone material from Albemarle’s proposed Kings Mountain Mine project. This agreement is part of the Company’s plan to resume lithium mining operations at the Kings Mountain Mine in an environmentally and socially responsible manner, including opportunities to repurpose byproduct material and enhance the economic benefits for the surrounding community.
•We introduced a project plan and submitted several state and federal permit applications for the potential redevelopment of the Kings Mountain Mine, one of the few known hard-rock lithium deposits in the United States. The plan includes the proposed site footprint, primary physical features and details of the mining processes. Pending permitting approval and a final investment decision, the mine is anticipated to produce approximately 420,000 tons of lithium-bearing spodumene concentrate yearly, providing a crucial building block for sustainable transportation and to support key defense applications.
•We published our 2023 Sustainability Report, All the Elements for a Better World, detailing updates on sustainability strategy execution and the important progress made toward achieving our sustainability goals.
•In the third quarter of 2024, we increased our quarterly dividend for the 30th consecutive year, to $0.405 per share.
•We recorded net sales of $5.4 billion during 2024; grew Energy Storage volumes by 19% year-over-year.
•Cash flows from operations in 2024 were $702.1 million.
Outlook
The current global business environment presents a diverse set of opportunities and challenges in the markets we serve. In particular, we believe that the global market for lithium battery and energy storage, particularly for EVs, remains strong, providing the opportunity to continue to develop high quality and innovative products while managing the high cost of expanding capacity. The other markets we serve continue to present various opportunities for value and growth as we have positioned ourselves to manage the impact on our business of changing global conditions, such as slow and uneven global growth, currency exchange volatility, crude oil price fluctuation, a dynamic pricing environment, an ever-changing landscape in electronics, the continuous need for cutting edge catalysts and technology by our refinery customers and increasingly stringent environmental standards. During the course of 2023 and 2024, lithium index pricing dropped significantly. Amidst these dynamics, and despite recent downward lithium price pressure, we believe our business fundamentals are sound and that we are strategically well-positioned as we remain focused on increasing sales volumes, optimizing and improving the value of our portfolio primarily through pricing and product development, managing costs and delivering value to our customers and shareholders. We believe that our businesses remain well-positioned to capitalize on new business opportunities and long-term trends driving growth within our end markets and to respond quickly to changes in economic conditions in these markets.
However, in order to optimize our cost structure and strengthen our financial flexibility, we are taking proactive actions, including certain restructuring activities and reducing planned capital expenditures. As part of these actions, we announced a new operating structure, effective November 1, 2024, that transitions from two core global business units to a fully integrated functional model (excluding Ketjen) designed to increase agility, deliver significant cost savings and maintain long-term competitiveness. We will continue to report results across our three existing operating segments of Energy Storage, Specialities and Ketjen. If lithium index pricing trends further downward or remains at low levels for an extended time, we may need to take additional measures to support growth and financial flexibility, including further restructuring actions.
At this time, relating to the current situation in the Middle East, our business operations have continued as normal with some shipping and raw material delays. We are monitoring the situation and will continue to make efforts to protect the safety of our employees and the health of our business.
Energy Storage: We expect Energy Storage net sales and profitability to decrease year-over-year in 2025 as lithium market prices are at lower levels compared to 2024. Because many of our contracts being index-referenced and variable-priced, our business is generally aligned with changes in market and index pricing. As a result, increases or further decreases in lithium market pricing could have a material impact on our results. We do expect the lower pricing to be partially offset by higher sales volume driven primarily by additional capacity from La Negra, Chile, Meishan and Qinzhou, China. The Meishan, China lithium conversion plant achieved first commercial sales during the second quarter of 2024. We could record inventory valuation charges in 2025 if lithium prices continue to deteriorate during the projected period of conversion and sale. While we ramp up our new capacity, we will continue to utilize tolling arrangements to meet growing customer demand. Global EV sales are expected to continue to increase over the prior year, driving continued demand for lithium batteries.
| | | | | | | | |
| Albemarle Corporation and Subsidiaries |
|
As part of the above-mentioned actions to optimize our cost structure and strengthen our financial flexibility, we have stopped construction of the Kemerton Trains 3 and 4. In addition, we have put Kemerton Train 2 into care and maintenance. Kemerton Train 1 will continue to operate and activity around it is currently focused on commercialization efforts.
On a longer-term basis, we believe that demand for lithium will continue to grow as new lithium applications advance and the use of plug-in hybrid EVs and full battery EVs increases. This demand for lithium is supported by a favorable backdrop of steadily declining lithium-ion battery costs, increasing battery performance, continuing significant investments in the battery and EV supply chain by cathode and battery producers and automotive OEMs and favorable global public policy toward e-mobility/renewable energy usage. Our outlook is also bolstered by long-term supply agreements with key strategic customers, reflecting our standing as a preferred global lithium partner, highlighted by our scale, access to geographically diverse, low-cost resources and long-term track record of reliability of supply and operating execution.
Specialties: We expect both net sales and profitability to be higher in 2025 year-over-year as we recover from reduced customer demand in certain markets, including consumer and industrial electronics. In addition, we expect to maintain strong demand in other end-markets, such as pharmaceuticals, agriculture and oilfield services.
On a longer-term basis, we continue to believe that improving global standards of living, widespread digitization, increasing demand for data management capacity and the potential for increasingly stringent fire safety regulations in developing markets are likely to drive continued demand for fire safety, bromine and lithium specialties products. We are focused on profitably growing our globally competitive production networks to serve all major bromine and lithium specialties consuming products and markets. The combination of our solid, long-term business fundamentals, strong cost position, product innovations and effective management of raw material costs should enable us to manage our business through end-market challenges and to capitalize on opportunities that are expected with favorable market trends in select end markets.
Ketjen: Total Ketjen results in 2025 are expected to increase year-over-year due to higher revenues. The FCC market is expected to remain stable. HPC demand is project-driven, based on the refineries taking turnarounds.
On a longer-term basis, we believe increased global demand for transportation fuels, new refinery start-ups, ongoing adoption of cleaner fuels and the continuous growth in chemical derivatives from petroleum products will be the primary drivers of growth in our Ketjen business. We believe delivering superior end-use performance continues to be the most effective way to create sustainable value in the refinery catalysts industry. We also believe our technologies continue to provide significant performance and financial benefits to refiners challenged to meet tighter regulations around the world.
Corporate: We continue to focus on cash generation, working capital management and process efficiencies. We expect our global effective tax rate will vary based on the locales in which income is actually earned and remains subject to potential volatility from changing legislation in the United States, such as the Inflation Reduction Act and Pillar Two which became effective in early 2024, and other tax jurisdictions. In 2024, we took actions as part of an effort that will focus on preserving our world-class resource advantages, optimizing our global conversion network, improving our cost competitiveness and efficiency, reducing capital intensity and enhancing our financial flexibility. As part of these measures, we stopped construction or deferred spending on certain capital projects, such as the Kemerton conversion plant noted above. In addition, we will incur severance and other restructuring charges associated with the Company’s transition to a new fully integrated functional operating model.
Actuarial gains and losses related to our defined benefit pension and OPEB plan obligations are reflected in Corporate as a component of non-operating pension and OPEB plan costs under mark-to-market accounting. Results for the year ended December 31, 2024 include an actuarial gain of $9.8 million ($7.5 million after income taxes), as compared to a gain of $10.2 million ($8.3 million after income taxes) for the year ended December 31, 2023.
From time to time, we may evaluate the merits of any opportunities that may arise for acquisitions or other business development activities that will complement our business footprint. Additional information regarding our products, markets and financial performance is provided at our website, www.albemarle.com. Our website is not a part of this document nor is it incorporated herein by reference.
Results of Operations
The following data and discussion provides an analysis of certain significant factors affecting our results of operations during the periods included in the accompanying consolidated statements of (loss) income. Certain percentage changes are considered not meaningful (“NM”).
| | | | | | | | |
| Albemarle Corporation and Subsidiaries |
|
With the exception of the segment results of operations for the change in definition of adjusted EBITDA, discussion of our results of operations for the year ended December 31, 2023 compared to the year ended December 31, 2022 can be found in Part II, Item 7 of our Annual Report on Form 10-K for the year ended December 31, 2023.
Comparison of 2024 to 2023
Net Sales | | | | | | | | | | | | | | | | | | | | | | | |
| In thousands | 2024 | | 2023 | | $ Change | | % Change |
| Net sales | $ | 5,377,526 | | | $ | 9,617,203 | | | $ | (4,239,677) | | | (44) | % |
•$5.6 billion decrease primarily attributable to lower lithium carbonate and hydroxide market pricing in Energy Storage •$1.4 billion increase attributable to higher sales volume, primarily in Energy Storage •$36.0 million of unfavorable currency translation resulting from the stronger U.S. Dollar against various currencies |
Gross Profit | | | | | | | | | | | | | | | | | | | | | | | |
| In thousands | 2024 | | 2023 | | $ Change | | % Change |
| Gross profit | $ | 62,539 | | | $ | 1,185,909 | | | $ | (1,123,370) | | | (95) | % |
| Gross profit margin | 1.2 | % | | 12.3 | % | | | | |
•Unfavorable pricing impacts primarily in Energy Storage, including the recognition of gross profit on converted inventory originally purchased from the Windfield joint venture, that was sold to third-party customers. The higher cost of goods sold of inventory purchased from Windfield is offset in the equity in net income of unconsolidated investments in the period the converted inventory is sold to third-party customers. •Lower average input costs, including the impact of a $604.1 million charge recorded in 2023 (reduced to $104.0 million as of December 31, 2024) to reduce the value of certain finished goods and spodumene to their net realizable value following the decline in lithium market pricing at the end of each year •Unfavorable currency exchange impacts resulting from the stronger U.S. Dollar against various currencies •Higher sales volume in Energy Storage and decreased commission expenses in Chile resulting from lower pricing |
Selling, General and Administrative (“SG&A”) Expenses | | | | | | | | | | | | | | | | | | | | | | | |
| In thousands | 2024 | | 2023 | | $ Change | | % Change |
| Selling, general and administrative expenses | $ | 618,048 | | | $ | 910,002 | | | $ | (291,954) | | | (32) | % |
| Percentage of Net sales | 11.5 | % | | 9.5 | % | | | | |
•2023 included a $218.5 million legal accrual recorded for the agreements in principle to resolve a previously disclosed legal matter with the DOJ and SEC. See Note 15, “Commitments and Contingencies,” for further details. •Reduced expenses as part of announced cost reduction efforts, including outside services and travel and entertainment costs |
Restructuring Charges and Asset Write-Offs
| | | | | | | | | | | | | | | | | | | | | | | |
| In thousands | 2024 | | 2023 | | $ Change | | % Change |
| Restructuring charges and asset write-offs | $ | 1,134,316 | | | $ | 9,491 | | | $ | 1,124,825 | | | NM |
•Capital project asset write-offs and associated contract cancellation costs recorded in 2024 primarily related to stopping construction of Kemerton Trains 3 and 4. The Company determined that these assets will not provide future value or will require significant re-engineering if the related projects are restarted. •Severance and other restructuring costs associated with the global headcount reductions from the announced change in operating structure and the actions taken at Kemerton in 2024 •2023 included separation and other severance costs to employees in Corporate and the Ketjen business |
Research and Development Expenses | | | | | | | | | | | | | | | | | | | | | | | |
| In thousands | 2024 | | 2023 | | $ Change | | % Change |
| Research and development expenses | $ | 86,720 | | | $ | 85,725 | | | $ | 995 | | | 1 | % |
| Percentage of Net sales | 1.6 | % | | 0.9 | % | | | | |
| | | | | | | | |
| Albemarle Corporation and Subsidiaries |
|
Gain on Change in Interest in Properties/Sale of Business, Net | | | | | | | | | | | | | | | | | | | | | | | |
| In thousands | 2024 | | 2023 | | $ Change | | % Change |
| Gain on change in interest in properties/sale of business, net | $ | — | | | $ | (71,190) | | | $ | 71,190 | | | NM |
•Gain in 2023 resulting from the restructuring of the MARBL joint venture with MRL. See Note 8, “Investments,” for further details. |
Interest and Financing Expenses | | | | | | | | | | | | | | | | | | | | | | | |
| In thousands | 2024 | | 2023 | | $ Change | | % Change |
| Interest and financing expenses | $ | (165,619) | | | $ | (116,072) | | | $ | (49,547) | | | 43 | % |
•Lower capitalized interest in 2024 •Increased amortization of debt discounts in 2024 primarily from interest-free loan entered into in the second quarter of 2023 |
Other Income, Net | | | | | | | | | | | | | | | | | | | | | | | |
| In thousands | 2024 | | 2023 | | $ Change | | % Change |
| Other income, net | $ | 178,339 | | | $ | 110,929 | | | $ | 67,410 | | | 61 | % |
•2024 included losses of $70.8 million related to the sale and fair market value adjustment of equity securities in public companies compared to $44.7 million of net losses for similar fair value adjustments in 2023 •$40.9 million gain primarily from the sale of assets at a site not part of our operations in 2024 •$27.9 million increase attributable to foreign exchange gains in 2024 compared to 2023. Foreign exchange gains in 2024 are net of a loss of $26.1 million due to the reclass from accumulated other comprehensive loss related to the dedesigation of cash flow hedge. •$17.0 million increase of income from PIK dividends of preferred equity in a Grace subsidiary in 2024 •$11.3 million of pension and OPEB credits (including mark-to-market actuarial gains of $9.8 million) in 2024 as compared to $8.0 million of pension and OPEB credits (including mark-to-market actuarial gains of $10.2 million) in 2023 •The mark-to-market actuarial gain in 2024 was primarily attributable to an increase in the weighted-average discount rate to 5.65% from 5.21% for our U.S. pension plans and to 4.04% from 3.73% for our foreign pension plans to reflect market conditions as of the December 31, 2024 measurement date. This was partially offset by a lower return on pension plan assets during the year than was expected, as a result of overall market and investment portfolio performance. The weighted-average actual return on our U.S. and foreign pension plan assets was 5.89% versus an expected return of 6.77%. •The mark-to-market actuarial gain in 2023 is primarily attributable to a higher return on pension plan assets during the year than was expected, as a result of overall market and investment portfolio performance. The weighted-average actual return on our U.S. and foreign pension plan assets was 11.21% versus an expected return of 6.66%. This was partially offset by a decrease in the weighted-average discount rate to 5.21% from 5.46% for our U.S. pension plans and to 3.73% from 4.04% for our foreign pension plans to reflect market conditions as of the December 31, 2023 measurement date. |
Income Tax Expense | | | | | | | | | | | | | | | | | | | | | | | |
| In thousands | 2024 | | 2023 | | $ Change | | % Change |
| Income Tax Expense | $ | 87,085 | | | $ | 430,277 | | | $ | (343,192) | | | (80) | % |
| Effective income tax rate | (4.9) | % | | 174.4 | % | | | | |
•Change in geographic mix of earnings, with lower 2024 earnings in various jurisdictions •2024 included the impact of the valuation allowance for losses in our consolidated Australian entities and certain entities in China •2024 included the impact of the 15% global minimum tax under Pillar Two •2023 included tax impact of a non-deductible $218.5 million legal accrual recorded for the agreements to resolve a previously disclosed legal matter with the DOJ and SEC, a $96.5 million tax reserve related to an uncertain tax position in Chile, and an establishment of a valuation allowance on 2023 losses in one of our Chinese entities resulting in an income tax expense impact of $223.0 million |
| | | | | | | | |
| Albemarle Corporation and Subsidiaries |
|
Equity in Net Income of Unconsolidated Investments | | | | | | | | | | | | | | | | | | | | | | | |
| In thousands | 2024 | | 2023 | | $ Change | | % Change |
| Equity in net income of unconsolidated investments | $ | 715,433 | | | $ | 1,854,082 | | | $ | (1,138,649) | | | (61) | % |
•Decreased earnings primarily from lower pricing from the Windfield joint venture in Energy Storage •$34.2 million decrease in foreign exchange impacts from our Windfield joint venture |
Net Income Attributable to Noncontrolling Interests | | | | | | | | | | | | | | | | | | | | | | | |
| In thousands | 2024 | | 2023 | | $ Change | | % Change |
| Net income attributable to noncontrolling interests | $ | (43,972) | | | $ | (97,067) | | | $ | 53,095 | | | (55) | % |
•Decrease in consolidated income related to our JBC joint venture primarily due to lower pricing |
Net (Loss) Income Attributable to Albemarle Corporation | | | | | | | | | | | | | | | | | | | | | | | |
| In thousands | 2024 | | 2023 | | $ Change | | % Change |
| Net (loss) income attributable to Albemarle Corporation | $ | (1,179,449) | | | $ | 1,573,476 | | | $ | (2,752,925) | | | NM |
| Percentage of Net Sales | (21.9) | % | | 16.4 | % | | | | |
| Net (loss) income attributable to Albemarle Corporation common shareholders | $ | (1,316,096) | | | $ | 1,573,476 | | | $ | (2,889,572) | | | NM |
| Basic (loss) earnings per share | $ | (11.20) | | | $ | 13.41 | | | $ | (24.61) | | | NM |
| Diluted (loss) earnings per share | $ | (11.20) | | | $ | 13.36 | | | $ | (24.56) | | | NM |
•Decrease in 2024 results due to reasons noted above •Net (loss) income attributable to Albemarle Corporation common shareholders in 2024 includes a $136.6 million reduction for mandatory convertible preferred stock dividends |
Other Comprehensive (Loss) Income, Net of Tax | | | | | | | | | | | | | | | | | | | | | | | |
| In thousands | 2024 | | 2023 | | $ Change | | % Change |
| Other comprehensive (loss) income, net of tax | $ | (213,469) | | | $ | 32,254 | | | $ | (245,723) | | | NM |
•Foreign currency translation and other | $ | (210,534) | | | $ | 26,403 | | | $ | (236,937) | | | NM |
•2024 included unfavorable movements in the Euro of approximately $182 million, the Brazilian Real of approximately $15 million, the Japanese Yen of approximately $11 million, the Taiwanese Dollar of approximately $6 million, the Korean Won of approximately $6 million and a net unfavorable variance in various other currencies of $7 million, partially offset by unfavorable movements in the Chinese Renminbi of approximately $15 million |
•2023 included favorable movements in the Euro of approximately $41 million and the Brazilian Real of approximately $5 million, partially offset by unfavorable movements in the Chinese Renminbi of approximately $12 million, the Japanese Yen of approximately $8 million and a net unfavorable variance in various other currencies of approximately $1 million |
| | | | | | | |
•Cash flow hedge | $ | (2,935) | | | $ | 5,851 | | | $ | (8,786) | | | NM |
Segment Information Overview. We have identified three reportable segments according to the nature and economic characteristics of our products as well as the manner in which the information is used internally by the Company’s chief operating decision maker to evaluate performance and make resource allocation decisions. Our reportable business segments consist of: (1) Energy Storage, (2) Specialties and (3) Ketjen.
The Corporate category is not considered to be a segment and includes corporate-related items not allocated to the operating segments. Pension and OPEB service cost (which represents the benefits earned by active employees during the period) and amortization of prior service cost or benefit are allocated to the reportable segments and Corporate, whereas the remaining components of pension and OPEB benefits cost or credit (“Non-operating pension and OPEB items”) are included in Corporate. Segment data includes intersegment transfers of raw materials at cost and allocations for certain corporate costs.
| | | | | | | | |
| Albemarle Corporation and Subsidiaries |
|
Our chief operating decision maker (“CODM”) uses adjusted EBITDA (as defined below) to assess the ongoing performance of the Company’s business segments and to allocate resources. In addition, the CODM uses adjusted EBITDA for business and enterprise planning purposes and as a significant component in the calculation of performance-based compensation for management and other employees. Effective January 1, 2024, the Company changed its definition of adjusted EBITDA for financial accounting purposes. The updated definition includes Albemarle’s share of the pre-tax earnings of the Windfield joint venture, whereas the prior definition included Albemarle’s share of Windfield earnings net of tax. This calculation is consistent with the definition of adjusted EBITDA used in the leverage financial covenant calculation in the February 9, 2024 amendment to the 2022 Credit Agreement, which is a material agreement for the Company and aligns the information presented to various stakeholders. This presentation more closely represents the materiality and financial contribution of the strategic investment in Windfield to the Company’s earnings, and more closely represents a measure of EBITDA. EBITDA is defined as earnings before interest and financing expenses, income tax expense, and depreciation and amortization. The Company’s updated definition of adjusted EBITDA is EBITDA before the proportionate share of Windfield income tax expense, as adjusted on a consistent basis for certain non-operating, non-recurring or unusual items on a segment basis. These non-operating, non-recurring or unusual items may include acquisition and integration related costs, gains or losses on sales of businesses, restructuring charges, facility divestiture charges, certain litigation and arbitration costs and charges, non-operating pension and OPEB items and other significant non-recurring items. We have reported adjusted EBITDA because management believes it provides additional useful measurements to review the Company’s operations, provides transparency to investors and enables period-to-period comparability of financial performance. Total adjusted EBITDA is a financial measure that is not required by, or presented in accordance with, the generally accepted accounting principles in the United States (“U.S. GAAP”). Total adjusted EBITDA should not be considered as an alternative to Net (loss) income attributable to Albemarle Corporation, the most directly comparable financial measure calculated and reported in accordance with U.S. GAAP, or any other financial measure reported in accordance with U.S. GAAP. The below segment information also includes a discussion of our segment net sales and adjusted EBITDA for the year ended December 31, 2023 compared to the year ended December 31, 2022 to conform to the current year presentation.
| | | | | | | | | | | | | | | | | | | | | | | | | | | | | | | | | | | | | | | | | | | | | | | |
| Year Ended December 31, | Percentage Change |
| 2024 | | % | | 2023 | | % | | 2022 | | % | | 2024 vs. 2023 | | 2023 vs. 2022 |
| (In thousands, except percentages) | | |
| Net sales: | | | | | | | | | | | | | | | |
| Energy Storage | $ | 3,015,121 | | | 56.1 | % | | $ | 7,078,998 | | | 73.6 | % | | $ | 4,660,945 | | | 63.7 | % | | (57) | % | | 52 | % |
| Specialties | 1,325,983 | | | 24.6 | % | | 1,482,425 | | | 15.4 | % | | 1,759,587 | | | 24.0 | % | | (11) | % | | (16) | % |
| Ketjen | 1,036,422 | | | 19.3 | % | | 1,055,780 | | | 11.0 | % | | 899,572 | | | 12.3 | % | | (2) | % | | 17 | % |
| Total net sales | $ | 5,377,526 | | | 100.0 | % | | $ | 9,617,203 | | | 100.0 | % | | $ | 7,320,104 | | | 100.0 | % | | (44) | % | | 31 | % |
| | | | | | | | | | | | | | | |
| Adjusted EBITDA: | | | | | | | | | | | | | | | |
| Energy Storage | $ | 757,540 | | | 66.5 | % | | $ | 3,181,593 | | | 89.7 | % | | $ | 3,352,356 | | | 88.3 | % | | (76) | % | | (5) | % |
| Specialties | 228,504 | | | 20.0 | % | | 298,506 | | | 8.4 | % | | 527,318 | | | 13.9 | % | | (23) | % | | (43) | % |
| Ketjen | 131,066 | | | 11.5 | % | | 103,872 | | | 2.9 | % | | 28,732 | | | 0.7 | % | | 26 | % | | 262 | % |
| Total segment adjusted EBITDA | 1,117,110 | | | 98.0 | % | | 3,583,971 | | | 101.0 | % | | $ | 3,908,406 | | | 102.9 | % | | (69) | % | | (8) | % |
| Corporate | 22,668 | | | 2.0 | % | | (37,983) | | | (1.0) | % | | (110,958) | | | (2.9) | % | | (160) | % | | (66) | % |
| Total adjusted EBITDA | $ | 1,139,778 | | | 100 | % | | $ | 3,545,988 | | | 100.0 | % | | $ | 3,797,448 | | | 100.0 | % | | (68) | % | | (7) | % |
See below for a reconciliation of total segment adjusted EBITDA to consolidated Net (loss) income attributable to Albemarle Corporation, the most directly comparable financial measure calculated and reported in accordance with U.S. GAAP, (in thousands):
| | | | | | | | |
| Albemarle Corporation and Subsidiaries |
|
| | | | | | | | | | | | | | | | | |
| Year ended December 31, |
| 2024 | | 2023 | | 2022 |
| Total segment adjusted EBITDA | $ | 1,117,110 | | | $ | 3,583,971 | | | $ | 3,908,406 | |
| Corporate expenses, net | 22,668 | | | (37,983) | | | (110,958) | |
| Depreciation and amortization | (588,638) | | | (429,944) | | | (300,841) | |
Interest and financing expenses(a) | (165,619) | | | (116,072) | | | (122,973) | |
| Income tax expense | (87,085) | | | (430,277) | | | (390,588) | |
Proportionate share of Windfield income tax expense(b) | (299,193) | | | (779,703) | | | (321,591) | |
| | | | | |
Gain (loss) on change in interest in properties/sale of business, net(c) | — | | | 71,190 | | | (8,400) | |
Acquisition and integration related costs(d) | (6,223) | | | (26,767) | | | (16,259) | |
Restructuring charges and asset write-offs(e) | (1,180,806) | | | (9,491) | | | — | |
Goodwill impairment(f) | — | | | (6,765) | | | — | |
| | | | | |
| Non-operating pension and OPEB items | 11,335 | | | 7,971 | | | 57,032 | |
| | | | | |
(Loss) gain in fair value of public equity securities(g) | (70,758) | | | (44,732) | | | 4,319 | |
Legal accrual(h) | — | | | (218,510) | | | — | |
| | | | | |
| | | | | |
Other(i) | 67,760 | | | 10,588 | | | (8,331) | |
| Net (loss) income attributable to Albemarle Corporation | $ | (1,179,449) | | | $ | 1,573,476 | | | $ | 2,689,816 | |
(a)Included in Interest and financing expenses is a loss on early extinguishment of debt of $19.2 million for the year ended December 31, 2022. See Note 12, “Long-term Debt,” for additional information. In addition, Interest and financing expenses for the year ended December 31, 2022 includes the correction of an out of period error of $17.5 million related to the overstatement of capitalized interest in prior periods.
(b)Albemarle’s 49% ownership interest in the reported income tax expense of the Windfield joint venture.
(c)Gain recorded during the year ended December 31, 2023 resulting from the restructuring of the MARBL joint venture with MRL. See Note 8, “Investments,” for further details. $8.4 million of expense recorded during the year ended December 31, 2022 as a result of revised estimates of the obligation to construct certain lithium hydroxide conversion assets in Kemerton, Western Australia, due to cost overruns from supply chain, labor and COVID-19 pandemic related issues.
(d)Costs related to the acquisition, integration and potential divestitures for various significant projects, recorded in Selling, general and administrative expenses (“SG&A”).
(e)See Note 17, “Restructuring Charges and Asset Write-offs,” for further details.
(f)Goodwill impairment charge recorded in SG&A during the year ended December 31, 2023 related to our PCS business. See Note 10, “Goodwill and Other Intangibles,” for further details.
(g)Other income, net for the year ended December 31, 2024 included losses of $37.0 million and $33.7 million resulting from the net change in fair value of investments in public equity securities and the sale of investments in public equity securities, respectively. For the years ended December 31, 2023 and 2022, a (loss) gain of ($44.7) million and $4.3 million, respectively, were recorded in Other income, net resulting from the change in fair value of investments in public equity securities.
(h)Loss recorded in SG&A for the agreements to resolve a previously disclosed legal matter with the DOJ and SEC during the year ended December 31, 2023. See Note 15, “Commitments and Contingencies,” for further details.
(i)Included amounts for the year ended December 31, 2024 recorded in:
•Cost of goods sold - $1.4 million of expenses related to non-routine labor and compensation related costs that are outside normal compensation arrangements.
•SG&A - $5.3 million of expenses related to certain historical legal and environmental matters.
•Other income, net - $40.9 million of gains from the sale of assets at a site not part of our operations, $36.3 million of income from PIK dividends of preferred equity in a Grace subsidiary, a $1.8 million net gain primarily resulting from the adjustment of indemnification related to previously disposed businesses and a $0.6 million gain from an updated cost estimate of an environmental reserve at a site not part of our operations, partially offset by $2.9 million of charges for asset retirement obligations at a site not part of our operations and $2.1 million of a loss related to the fair value adjustment of an investment in a nonmarketable security.
Included amounts for the year ended December 31, 2023 recorded in:
•Cost of goods sold - $15.1 million loss recorded to settle an arbitration matter with a regulatory agency in Chile, partially offset by a $4.1 million gain from an updated cost estimate of an environmental reserve at a site not part of our operations.
•SG&A - $2.3 million of facility closure expenses related to offices in Germany, $1.9 million of charges primarily for environmental reserves at sites not part of our operations and $1.8 million of various expenses including for certain legal costs and shortfall contributions for a multiemployer plan financial improvement plan.
•Other income, net - $19.3 million gain from PIK dividends of preferred equity in a Grace subsidiary, a $7.3 million gain resulting from insurance proceeds of a prior legal matter and $5.5 million of gains from the sale of investments and the write-off of certain
| | | | | | | | |
| Albemarle Corporation and Subsidiaries |
|
liabilities no longer required, partially offset by $3.6 million of charges for asset retirement obligations at a site not part of our operations and $0.9 million of a loss resulting from the adjustment of indemnification related to previously disposed businesses.
Included amounts for the year ended December 31, 2022 recorded in:
•Cost of goods sold - $2.7 million of expense related to one-time retention payments for certain employees during the Catalysts strategic review and business unit realignment, and $0.5 million related to the settlement of a legal matter resulting from a prior acquisition.
•SG&A - $4.3 million primarily related to facility closure expenses of offices in Germany, $2.8 million of charges for environmental reserves at sites not part of our operations, $2.8 million of shortfall contributions for our multiemployer plan financial improvement plan, $1.9 million of expense related to one-time retention payments for certain employees during the Catalysts strategic review, partially offset by $4.3 million of gains from the sale of legacy properties not part of our operations.
•Other income, net - $3.0 million gain from the reversal of a liability related to a previous divestiture, a $2.0 million gain relating to the adjustment of an environmental reserve at non-operating businesses we previously divested and a $0.6 million gain related to a settlement received from a legal matter in a prior period, partially offset by a $3.2 million loss resulting from the adjustment of indemnification related to previously disposed businesses.
Energy Storage | | | | | | | | | | | | | | | | | | | | | | | |
| In thousands | 2024 | | 2023 | | $ Change | | % Change |
| Net sales | $ | 3,015,121 | | | $ | 7,078,998 | | | $ | (4,063,877) | | | (57) | % |
•$5.4 billion decrease attributable to unfavorable pricing impacts, primarily in battery- and tech-grade carbonate and hydroxide sold under index-referenced and variable-priced contracts, and mix •$1.4 billion increase attributable to higher sales volume, primarily driven by the La Negra III/IV expansion in Chile, as well as sales of chemical-grade spodumene to meet growing customer demand •$30.3 million decrease attributable to unfavorable currency translation resulting from the stronger U.S. Dollar against currencies |
| Adjusted EBITDA | $ | 757,540 | | | $ | 3,181,593 | | | $ | (2,424,053) | | | (76) | % |
•Unfavorable pricing impacts in lithium carbonate and hydroxide •Decreased equity in net income from the Windfield joint venture, driven by lower spodumene pricing •Lower average input costs, including the impact of a $604.1 million charge recorded in 2023 (reduced to $104.0 million as of December 31, 2024) to reduce the value of certain finished goods and spodumene to their net realizable value following the decline in lithium market pricing at the end of each year •Higher sales volume •Decreased commission expenses in Chile resulting from the lower pricing •Savings from designed restructuring and productivity improvements •$82.0 million increase attributable to favorable currency translation resulting from the weaker U.S. Dollar against various currencies |
Specialties | | | | | | | | | | | | | | | | | | | | | | | |
| In thousands | 2024 | | 2023 | | $ Change | | % Change |
| Net sales | $ | 1,325,983 | | | $ | 1,482,425 | | | $ | (156,442) | | | (11) | % |
•$185.5 million decrease attributable to unfavorable pricing impacts •$34.5 million increase attributable to higher sales volume related to increased demand across all products •$5.5 million decrease attributable to unfavorable currency translation resulting from the stronger U.S. Dollar against various currencies |
| Adjusted EBITDA | $ | 228,504 | | | $ | 298,506 | | | $ | (70,002) | | | (23) | % |
•Unfavorable pricing impacts •Decreased manufacturing costs resulting from higher production volume and productivity initiatives •Higher sales volume related to increased demand across all products •Decrease in noncontrolling interests to JBC joint venture resulting from lower pricing •$6.1 million decrease attributable to unfavorable currency translation resulting from the stronger U.S. Dollar against various currencies |
| | | | | | | | |
| Albemarle Corporation and Subsidiaries |
|
Ketjen | | | | | | | | | | | | | | | | | | | | | | | |
| In thousands | 2024 | | 2023 | | $ Change | | % Change |
| Net sales | $ | 1,036,422 | | | $ | 1,055,780 | | | $ | (19,358) | | | (2) | % |
•$30.9 million decrease attributable to lower sales volume, primarily in the FCC division •$11.7 million increase attributable to favorable product mix, primarily in the CFT division |
| Adjusted EBITDA | $ | 131,066 | | | $ | 103,872 | | | $ | 27,194 | | | 26 | % |
•Higher margins, primarily in the CFT division due to favorable product mix •Lower input costs from designed productivity improvements •$2.3 million decrease attributable to unfavorable currency translation resulting from the weaker U.S. Dollar against various currencies •2023 included a $24 million gain recorded for insurance claim receipts |
Corporate | | | | | | | | | | | | | | | | | | | | | | | |
| In thousands | 2024 | | 2023 | | $ Change | | % Change |
| Adjusted EBITDA | $ | 22,668 | | | $ | (37,983) | | | $ | 60,651 | | | (160) | % |
•Reduced expenses as part of announced cost reduction efforts, including outside services and travel and entertainment costs •$14.2 million increase attributable to favorable currency exchange impacts, net of $34.2 million decrease in foreign exchange impacts from our Windfield joint venture |
Summary of Critical Accounting Policies and Estimates
Estimates and Assumptions
The preparation of financial statements in conformity with U.S. GAAP requires management to make estimates and assumptions that affect the reported amounts of revenues, expenses, assets and liabilities and disclosure of contingent assets and liabilities at the date of the financial statements. Listed below are the estimates and assumptions that we consider to be critical in the preparation of our financial statements.
Property, Plant and Equipment. We assign the useful lives of our property, plant and equipment based upon our internal engineering estimates, which are reviewed periodically. The estimated useful lives of our property, plant and equipment range from two to sixty years and depreciation is recorded on the straight-line method, with the exception of our mineral rights and reserves, which are depleted on a units-of-production method. We evaluate the recovery of our property, plant and equipment annually and when events or changes in circumstances indicate that its carrying amount may not be recoverable. Events that may trigger a test for recoverability include, but are not limited to, significant adverse changes to projected revenues, costs, or capital plans or changes to government regulations that may adversely impact our current or future operations. An impairment is determined to exist if the total projected future cash flows on an undiscounted basis are not recoverable or are less than the carrying amount of a long-lived asset group. We estimate future cash flows based on numerous assumptions, which are consistent or reasonable in relation to internal budgets and projections, and actual future cash flows may be significantly different than the estimates. Significant estimates used include, but are not limited to, market pricing (including lithium index pricing), customer demand, operating and production costs, and the timing and capital costs of expansion and sustaining projects. Significant management judgment is involved in estimating these variables and they include inherent uncertainties since they are forecasting future events.
Acquisition Method of Accounting. We recognize the identifiable assets acquired, the liabilities assumed and any noncontrolling interest in the acquiree at their estimated fair values on the date of acquisition for acquired businesses. Determining the fair value of these items requires management’s judgment and the utilization of independent valuation specialists and involves the use of significant estimates and assumptions with respect to the timing and amounts of future cash flows and discount rates, among other items. When acquiring mineral reserves, the fair value is estimated using an excess earnings approach, which requires management to estimate future cash flows, net of capital investments in the specific operation. Management’s cash flow projections involved the use of significant estimates and assumptions with respect to the expected production of the mine over the estimated time period, sales prices, shipment volumes, and expected profit margins. The present value of the projected net cash flows represents the preliminary fair value assigned to mineral reserves. The discount rate is a significant assumption used in the valuation model. The judgments made in the determination of the estimated fair value assigned to the assets acquired, the liabilities assumed and any noncontrolling interest in the investee, as well as the estimated useful life of each asset and the duration of each liability, can materially impact the financial statements in periods after acquisition, such as through depreciation and amortization expense. For more information on our acquisitions and
| | | | | | | | |
| Albemarle Corporation and Subsidiaries |
|
application of the acquisition method, see Note 2, “Acquisitions,” to our consolidated financial statements included in Part II, Item 8 of this report.
Income Taxes. We assume the deductibility of certain costs in our income tax filings, and we estimate the future recovery of deferred tax assets, uncertain tax positions and indefinite investment assertions.
Inventory Valuation. Inventories are stated at lower of cost and net realizable value with cost determined using standard cost, which approximates the first-in, first-out basis. Cost is determined on the weighted-average basis for a small portion of our inventories at foreign plants and our stores, supplies and other inventory. A portion of our domestic produced finished goods and raw materials are determined on the last-in, first-out basis. If management estimates that the market value is below cost or determines that future demand was lower than current inventory levels, based on historical experience, current and projected market pricing and demand, current and projected volume trends and other relevant current and projected factors associated with the current economic conditions, a reduction in inventory cost to estimated net realizable value is recorded in an inventory reserve with an expense recorded to Cost of goods sold.
Environmental Remediation Liabilities. We estimate and accrue the costs required to remediate a specific site depending on site-specific facts and circumstances. Cost estimates to remediate each specific site are developed by assessing (i) the scope of our contribution to the environmental matter, (ii) the scope of the anticipated remediation and monitoring plan and (iii) the extent of other parties’ share of responsibility.
Asset Retirement Obligations. Certain of our sites are subject to various laws and regulations, including legal and contractual obligations to reclaim, remediate, or otherwise restore properties at the time the property is removed from service. The fair value recorded is estimated based on cost information obtained both internally and externally. These estimates are inflated based the assumed timing of the obligation payments and discounted using on available risk-free discount rate at the time. We review our assumptions and estimates of these costs periodically or if we become aware of material changes to these obligations.
Actual results could differ materially from the estimates and assumptions that we use in the preparation of our financial statements.
Revenue Recognition
Revenue is measured as the amount of consideration we expect to receive in exchange for transferring goods or providing services, and is recognized when performance obligations are satisfied under the terms of contracts with our customers. A performance obligation is deemed to be satisfied when control of the product or service is transferred to our customer. The transaction price of a contract, or the amount we expect to receive upon satisfaction of all performance obligations, is determined by reference to the contract’s terms and includes adjustments, if applicable, for any variable consideration, such as customer rebates, noncash consideration or consideration payable to the customer, although these adjustments are generally not material. Where a contract contains more than one distinct performance obligation, the transaction price is allocated to each performance obligation based on the standalone selling price of each performance obligation, although these situations are rare and are generally not built into our contracts. Any unsatisfied performance obligations are not material. Standalone selling prices are based on prices we charge to our customers, which in some cases are based on established market prices. Sales and other similar taxes collected from customers on behalf of third parties are excluded from revenue. Our payment terms are generally between 30 to 90 days, however, they vary by market factors, such as customer size, creditworthiness, geography and competitive environment.
All of our revenue is derived from contracts with customers, and almost all of our contracts with customers contain one performance obligation for the transfer of goods where such performance obligation is satisfied at a point in time. Control of a product is deemed to be transferred to the customer upon shipment or delivery. Significant portions of our sales are sold free on board shipping point or on an equivalent basis, while delivery terms of other transactions are based upon specific contractual arrangements. Our standard terms of delivery are generally included in our contracts of sale, order confirmation documents and invoices, while the timing between shipment and delivery generally ranges between 1 and 45 days. Costs for shipping and handling activities, whether performed before or after the customer obtains control of the goods, are accounted for as fulfillment costs. Such costs are immaterial.
The Company currently utilizes the following practical expedients, as permitted by Accounting Standards Codification (“ASC”) 606, Revenue from Contracts with Customers:
•All sales and other pass-through taxes are excluded from contract value;
| | | | | | | | |
| Albemarle Corporation and Subsidiaries |
|
•In utilizing the modified retrospective transition method, no adjustment was necessary for contracts that did not cross over the reporting year;
•We will not consider the possibility of a contract having a significant financing component (which would effectively attribute a portion of the sales price to interest income) unless, if at contract inception, the expected payment terms (from time of delivery or other relevant criterion) are more than one year;
•If our right to customer payment is directly related to the value of our completed performance, we recognize revenue consistent with the invoicing right; and
•We expense as incurred all costs of obtaining a contract incremental to any costs/compensation attributable to individual product sales/shipments for contracts where the amortization period for such costs would otherwise be one year or less.
Costs incurred to obtain contracts with customers are not significant and are expensed immediately as the amortization period would be one year or less. When the Company incurs pre-production or other fulfillment costs in connection with an existing or specific anticipated contract and such costs are recoverable through margin or explicitly reimbursable, such costs are capitalized and amortized to Cost of goods sold on a systematic basis that is consistent with the pattern of transfer to the customer of the goods or services to which the asset relates, which is less than one year. We record bad debt expense in specific situations when we determine the customer is unable to meet its financial obligation.
Goodwill and Other Intangible Assets
We account for goodwill and other intangibles acquired in a business combination in conformity with current accounting guidance, which requires goodwill and indefinite-lived intangible assets to not be amortized.
We test goodwill for impairment by comparing the estimated fair value of our reporting units to the related carrying value. Our reporting units are either our operating business segments or one level below our operating business segments for which discrete financial information is available and for which operating results are regularly reviewed by the business management. In applying the goodwill impairment test, the Company initially performs a qualitative test (“Step 0”), where it first assesses qualitative factors to determine whether it is more likely than not that the fair value of the reporting units is less than its carrying value. Qualitative factors may include, but are not limited to, economic conditions, industry and market considerations, cost factors, overall financial performance of the reporting units and other entity and reporting unit specific events. If after assessing these qualitative factors, the Company determines it is “more-likely-than-not” that the fair value of the reporting unit is less than the carrying value, the Company performs a quantitative test (“Step 1”). During Step 1, the Company estimates the fair value using either a discounted cash flow model (income) approach or a combination of the discounted cash flow model (income) approach and earnings multiple (market) approach (placing equal weighting on the income and market approaches). The income approach determines fair value based on discounted cash flow model derived from a reporting unit’s long-term forecasted cash flows. The market approach determines fair value based on the application of earnings multiples of comparable companies to the projected earnings of the reporting unit. Future cash flows for all reporting units include assumptions about revenue growth rates, adjusted EBITDA margins, discount rate as well as other economic or industry-related factors. The Company defines adjusted EBITDA as earnings before interest and financing expenses, income tax expenses, the proportionate share of Windfield income tax expense, depreciation and amortization, as adjusted on a consistent basis for certain non-operating, non-recurring or unusual items on a segment basis. For the Refining Solutions reporting unit, within the Ketjen segment, the revenue growth rates, adjusted EBITDA margins, EBITDA multiples, market participant acquisition premium and the discount rate were deemed to be significant assumptions. For the Energy Storage reporting unit, the revenue growth rates, adjusted EBITDA margins and the discount rate were deemed to be significant assumptions. Significant management judgment is involved in estimating these variables and they include inherent uncertainties, particularly regarding future market conditions and cost fluctuations. Any adverse changes in these assumptions, such as a decline in demand, increased competition, rising costs or the imposition of new tariffs could negatively impact the fair value of the reporting units, since they are forecasting future events. The Company uses a Weighted Average Cost of Capital (“WACC”) approach to determine our discount rate for goodwill recoverability testing. The WACC calculation incorporates industry-weighted average returns on debt and equity from a market perspective. The factors in this calculation are largely external to the Company and, therefore, are beyond its control. The Company performs a sensitivity analysis by using a range of inputs to confirm the reasonableness of these estimates being used in the goodwill impairment analysis. The Company tests its recorded goodwill for impairment in the fourth quarter of each year or upon the occurrence of events or changes in circumstances that would more likely than not reduce the fair value of its reporting units below their carrying amounts.
In July 2024, the Company made the decision to stop construction of Kemerton conversion plant Train 3 and put Kemerton Train 2 into care and maintenance. See Note 17, “Restructuring Charges and Asset Write-offs,” for further details. The Company determined these actions to be a triggering event for a review for impairment of its Energy Storage reporting unit
| | | | | | | | |
| Albemarle Corporation and Subsidiaries |
|
goodwill. As a result, during the third quarter of 2024, the Company tested the goodwill of the Energy Storage reporting unit by comparing its estimated fair value, using a discounted cash flow model, to the related carrying value. Based on the analysis, the Energy Storage reporting unit had sufficient headroom, which is defined as the percentage difference between the fair value of a reporting unit and its carrying value, that reasonable differences in the significant assumptions used would not impact the conclusion. Consequently, the Company concluded that the Energy Storage estimated fair value exceeded its carrying value, thus no impairment was recorded in the third quarter of 2024.
The Company performed its annual goodwill impairment test as of October 31, 2024. No evidence of impairment was noted for the reporting units with goodwill balances from the analysis. However, if the adjusted EBITDA or discount rate estimates for the Refining Solutions reporting unit negatively changed by 10% (absent any other changes), the Refining Solutions fair value would be below its carrying value. Potential events and changes in circumstances that could reasonably be expected to negatively affect the key assumptions include reductions in demand in oilfield markets, inability to implement effective pricing actions to offset cost increases, changes in macroeconomic conditions and the introduction or escalation of tariffs on imported materials. We will continue to monitor these factors closely and assess their impact on our goodwill impairment evaluations in future periods.
We assess our indefinite-lived intangible assets, which include trade names and trademarks, for impairment annually and between annual tests if events or changes in circumstances indicate that it is more likely than not that the asset is impaired. The indefinite-lived intangible asset impairment standard allows us to first assess qualitative factors to determine if a quantitative impairment test is necessary. Further testing is only required if we determine, based on the qualitative assessment, that it is more likely than not that the indefinite-lived intangible asset’s fair value is less than its carrying amount. If we determine based on the qualitative assessment that it is more likely than not that the asset is impaired, an impairment test is performed by comparing the fair value of the indefinite-lived intangible asset to its carrying amount. During the year ended December 31, 2024, no evidence of impairment was noted from the analysis for our indefinite-lived intangible assets.
Definite-lived intangible assets, such as purchased technology, patents and customer lists, are amortized over their estimated useful lives generally for periods ranging from five to twenty-five years. Except for customer lists and relationships associated with the majority of our Lithium business, which are amortized using the pattern of economic benefit method, definite-lived intangible assets are amortized using the straight-line method. We evaluate the recovery of our definite-lived intangible assets by comparing the net carrying value of the asset group to the undiscounted net cash flows expected to be generated from the use and eventual disposition of that asset group when events or changes in circumstances indicate that its carrying amount may not be recoverable. If the carrying amount of the asset group is not recoverable, the fair value of the asset group is measured and if the carrying amount exceeds the fair value, an impairment loss is recognized. See Note 10, “Goodwill and Other Intangibles,” to our consolidated financial statements included in Part II, Item 8 of this report.
Pension Plans and Other Postretirement Benefits
Under authoritative accounting standards, assumptions are made regarding the valuation of benefit obligations and the performance of plan assets. As required, we recognize a balance sheet asset or liability for each of our pension and OPEB plans equal to the plan’s funded status as of the measurement date. The primary assumptions are as follows:
•Discount Rate—The discount rate is used in calculating the present value of benefits, which is based on projections of benefit payments to be made in the future.
•Expected Return on Plan Assets—We project the future return on plan assets based on prior performance and future expectations for the types of investments held by the plans as well as the expected long-term allocation of plan assets for these investments. These projected returns reduce the net benefit costs recorded currently.
•Rate of Compensation Increase—For salary-related plans, we project employees’ annual pay increases, which are used to project employees’ pension benefits at retirement.
•Mortality Assumptions—Assumptions about life expectancy of plan participants are used in the measurement of related plan obligations.
Actuarial gains and losses are recognized annually in our consolidated statements of (loss) income in the fourth quarter and whenever a plan is determined to qualify for a remeasurement during a fiscal year. The remaining components of pension and OPEB plan expense, primarily service cost, interest cost and expected return on assets, are recorded on a monthly basis. The market-related value of assets equals the actual market value as of the date of measurement.
During 2024, we made changes to assumptions related to discount rates and expected rates of return on plan assets. We consider available information that we deem relevant when selecting each of these assumptions.
| | | | | | | | |
| Albemarle Corporation and Subsidiaries |
|
Our U.S. defined benefit plans for non-represented employees are closed to new participants, with no additional benefits accruing under these plans as participants’ accrued benefits have been frozen. In selecting the discount rates for the U.S. plans, we consider expected benefit payments on a plan-by-plan basis. As a result, the Company uses different discount rates for each plan depending on the demographics of participants and the expected timing of benefit payments. For 2024, the discount rates were calculated using the results from a bond matching technique developed by Milliman, which matched the future estimated annual benefit payments of each respective plan against a portfolio of bonds of high quality to determine the discount rate. We believe our selected discount rates are determined using preferred methodology under authoritative accounting guidance and accurately reflect market conditions as of the December 31, 2024 measurement date.
In selecting the discount rates for the foreign plans, we look at long-term yields on AA-rated corporate bonds when available. Our actuaries have developed yield curves based on the yields of constituent bonds in the various indices as well as on other market indicators such as swap rates, particularly at the longer durations. For the Eurozone, we apply the Aon Hewitt yield curve to projected cash flows from the relevant plans to derive the discount rate. For the U.K., the discount rate is determined by applying the Aon Hewitt yield curve for typical schemes of similar duration to projected cash flows of Albemarle’s U.K. plan. In other countries where there is not a sufficiently deep market of high-quality corporate bonds, we set the discount rate by referencing the yield on government bonds of an appropriate duration.
At December 31, 2024, the weighted-average discount rate for the U.S. and foreign pension plans increased to 5.65% and 4.04%, respectively, from 5.21% and 3.73%, respectively, at December 31, 2023 to reflect market conditions as of the December 31, 2024 measurement date. The discount rate for the OPEB plans at December 31, 2024 and 2023 was 5.67% and 5.21%, respectively.
In estimating the expected return on plan assets, we consider past performance and future expectations for the types of investments held by the plan as well as the expected long-term allocations of plan assets to these investments. For the years 2024 and 2023, the weighted-average expected rate of return on U.S. pension plan assets was 6.88%, and the weighted-average expected rate of return on foreign pension plan assets was 5.95% and 4.86%, respectively. Effective January 1, 2025, the weighted-average expected rate of return on U.S. and foreign pension plan assets is 6.70% and 6.52%, respectively.
In projecting the rate of compensation increase, we consider past experience in light of changes in inflation rates. At December 31, 2024 and 2023, the assumed weighted-average rate of compensation increase was 3.65% and 3.67%, respectively, for our foreign pension plans.
For the purpose of measuring our U.S. pension and OPEB obligations at December 31, 2024 and 2023, we used the Pri-2012 Mortality Tables along with the MP-2021 Mortality Improvement Scale, respectively, published by the SOA.
At December 31, 2024, the assumed rate of increase in the pre-65 and post-65 per capita cost of covered health care benefits for U.S. retirees was zero as the employer-paid premium caps (pre-65 and post-65) were met starting January 1, 2013.
A variance in the assumptions discussed above would have an impact on the projected benefit obligations, the accrued OPEB liabilities, and the annual net periodic pension and OPEB cost. The following table reflects the sensitivities associated with a hypothetical change in certain assumptions, primarily in the U.S. (in thousands):
| | | | | | | | | | | | | | | | | | | | | | | |
| (Favorable) Unfavorable |
| 1% Increase | | 1% Decrease |
| Increase (Decrease)
in Benefit Obligation | | Increase (Decrease)
in Benefit Cost | | Increase (Decrease)
in Benefit Obligation | | Increase (Decrease)
in Benefit Cost |
| Actuarial Assumptions | | | | | | | |
| Discount Rate: | | | | | | | |
| Pension | $ | (53,893) | | | $ | 2,604 | | | $ | 62,968 | | | $ | (3,252) | |
| Other postretirement benefits | $ | (2,756) | | | $ | 145 | | | $ | 3,195 | | | $ | (179) | |
| Expected return on plan assets: | | | | | | | |
| Pension | * | | $ | (5,200) | | | * | | $ | 5,209 | |
| | | | | | | |
* Not applicable.
Of the $539.7 million total pension and postretirement assets at December 31, 2024, $56.9 million, or approximately 11%, are measured using the net asset value as a practical expedient. Gains or losses attributable to these assets are recognized in the consolidated balance sheets as either an increase or decrease in plan assets. See Note 13, “Pension Plans and Other Postretirement Benefits,” to our consolidated financial statements included in Part II, Item 8 of this report.
| | | | | | | | |
| Albemarle Corporation and Subsidiaries |
|
Income Taxes
We use the liability method for determining our income taxes, under which current and deferred tax liabilities and assets are recorded in accordance with enacted tax laws and rates. Under this method, the amounts of deferred tax liabilities and assets at the end of each period are determined using the tax rate expected to be in effect when taxes are actually paid or recovered. Future tax benefits are recognized to the extent that realization of such benefits is more likely than not. In order to record deferred tax assets and liabilities, we are following guidance under ASU 2015-17, which requires deferred tax assets and liabilities to be classified as noncurrent on the balance sheet, along with any related valuation allowance. Tax effects are released from Accumulated other comprehensive loss using either the specific identification approach or the portfolio approach based on the nature of the underlying item.
Deferred income taxes are provided for the estimated income tax effect of temporary differences between the financial statement carrying amounts and the tax basis of existing assets and liabilities. Deferred tax assets are also provided for operating losses, capital losses and certain tax credit carryovers. A valuation allowance, reducing deferred tax assets, is established when it is more likely than not that some portion or all of the deferred tax assets will not be realized. The realization of such deferred tax assets is dependent upon the generation of sufficient future taxable income of the appropriate character. Although realization is not assured, we do not establish a valuation allowance when we believe it is more likely than not that a net deferred tax asset will be realized. We elected to not consider the estimated impact of potential future Corporate Alternative Minimum Tax liabilities for purposes of assessing valuation allowances on its deferred tax balances.
We only recognize a tax benefit after concluding that it is more likely than not that the benefit will be sustained upon audit by the respective taxing authority based solely on the technical merits of the associated tax position. Once the recognition threshold is met, we recognize a tax benefit measured as the largest amount of the tax benefit that, in our judgment, is greater than 50% likely to be realized. Interest and penalties related to income tax liabilities are included in Income tax expense on the consolidated statements of (loss) income.
We are subject to income taxes in the U.S. and numerous foreign jurisdictions. Due to the statute of limitations, we are no longer subject to U.S. federal income tax audits by the Internal Revenue Service (“IRS”) for years prior to 2021. Due to the statute of limitations, we also are no longer subject to U.S. state income tax audits prior to 2018.
With respect to jurisdictions outside the U.S., several audits are in process. We have audits ongoing for the years 2014 through 2023 related to Belgium, Canada, Chile, China and Germany, some of which are for entities that have since been divested.
While we believe we have adequately provided for all tax positions, amounts asserted by taxing authorities could be greater than our accrued position. Accordingly, additional provisions on federal and foreign tax-related matters could be recorded in the future as revised estimates are made or the underlying matters are settled or otherwise resolved.
Since the timing of resolutions and/or closure of tax audits are uncertain, it is difficult to predict with certainty the range of reasonably possible significant increases or decreases in the liability related to uncertain tax positions that may occur within the next twelve months. As a result of the sale of the Chemetall Surface Treatment business in 2016, we agreed to indemnify certain income and non-income tax liabilities, including uncertain tax positions, associated with the entities sold. The associated liability is recorded in Other noncurrent liabilities. See Note 14, “Other Noncurrent Liabilities,” and Note 20, “Income Taxes,” to our consolidated financial statements included in Part II, Item 8 of this report for further details.
We have designated the undistributed earnings of a portion of our foreign operations as indefinitely reinvested and as a result we do not provide for deferred income taxes on the unremitted earnings of these subsidiaries. Our foreign earnings are computed under U.S. federal tax earnings and profits (“E&P”) principles. In general, to the extent our financial reporting book basis over tax basis of a foreign subsidiary exceeds these E&P amounts, deferred taxes have not been provided, as they are essentially permanent in duration. The determination of the amount of such unrecognized deferred tax liability is not practicable. We provide for deferred income taxes on our undistributed earnings of foreign operations that are not deemed to be indefinitely invested. We will continue to evaluate our permanent investment assertion taking into consideration all relevant and current tax laws.
Financial Condition and Liquidity
Overview
The principal uses of cash in our business generally have been capital investments and resource development costs, funding working capital, and service of debt. We also make contributions to our defined benefit pension plans, pay dividends to
| | | | | | | | |
| Albemarle Corporation and Subsidiaries |
|
our shareholders and have the ability to repurchase shares of our common stock. Historically, cash to fund the needs of our business has been principally provided by cash from operations, debt financing and equity issuances.
We are continually focused on working capital efficiency particularly in the areas of accounts receivable, payables and inventory. We anticipate that cash on hand, cash provided by operating activities, proceeds from divestitures and borrowings will be sufficient to pay our operating expenses, satisfy debt service obligations, fund capital expenditures and other investing activities, fund pension contributions and pay dividends for the foreseeable future.
Cash Flow
Our cash and cash equivalents were $1.2 billion at December 31, 2024 as compared to $889.9 million at December 31, 2023. Cash provided by operating activities was $702.1 million, $1.3 billion and $1.9 billion during the years ended December 31, 2024, 2023 and 2022, respectively.
The decrease in cash provided by operating activities in 2024 versus 2023 was primarily due to decreased earnings from the Energy Storage and Specialties segments, driven by lower lithium market prices, and $1.7 billion less dividends received from unconsolidated investments, partially offset by positive working capital changes year-over-year of $2.3 billion. The inflow from working capital in 2024 was primarily driven by working capital management and the impact of lower lithium pricing in inventories and accounts receivables. This was partially offset by lower accounts payable driven by similar lower lithium pricing. Working capital outflows in 2023 were driven by higher inventory balances from higher cost spodumene and accounts receivable balances from higher net sales. The decrease in cash provided by operating activities in 2023 versus 2022 was primarily due to lower earnings from the Energy Storage and Specialties segments, partially offset by lower working capital outflows and higher dividends received from unconsolidated investments, primarily from the Windfield joint venture. Working capital outflows in both 2023 and 2022 were driven by higher inventory balances from higher cost spodumene and accounts receivable balances from higher net sales each year.
During 2024, cash on hand, cash provided by operations and net proceeds from the issuance of mandatory convertible preferred stock of $2.2 billion funded $1.7 billion of capital expenditures for plant, machinery and equipment, the repayment of a net balance of $620.0 million of commercial paper, dividends to common shareholders of $188.5 million and dividends to mandatory convertible preferred shareholders of $122.7 million. During 2023, cash on hand, cash provided by operations and net proceeds from net borrowings of commercial paper and long-term debt of $944.2 million funded $2.1 billion of capital expenditures for plant, machinery and equipment, net; approximately $380 million paid to MRL for the restructuring of the MARBL joint venture; $218.5 million to resolve the legal matter with the DOJ and SEC; investments in marketable securities, primarily public equity securities, of $204.5 million; and dividends to shareholders of $187.2 million. During 2022, cash on hand, cash provided by operations and the proceeds of $2.0 billion in long-term debt and credit agreements funded $1.3 billion of capital expenditures for plant, machinery and equipment, the repayment of long-term debt and credit agreements of $705.0 million, the net repayment of $391.7 million of commercial paper, the final payment of $332.5 million of a settlement of an arbitration ruling for a prior legal matter and dividends to shareholders of $184.4 million. In addition, during the years ended December 31, 2024, 2023 and 2022, our consolidated joint venture, JBC, declared dividends of $149.8 million, $149.7 million and $274.5 million, respectively, which resulted in dividends paid to noncontrolling interests of $37.2 million, $105.6 million and $44.2 million ($53.1 million declared in 2022 was paid in the first quarter of 2023), respectively.
In January 2024, the Company sold equity securities of a public company for proceeds of approximately $81.5 million. As a result of the sale, the Company realized a loss of $33.7 million in the year ended December 31, 2024.
On March 8, 2024, the Company issued 46,000,000 depositary shares, each representing a 1/20th interest in a share of Mandatory Convertible Preferred Stock. The 2,300,000 shares of Mandatory Convertible Preferred Stock issued had a $1,000 per share liquidation preference. As a result of this transaction, the Company received cash proceeds of approximately $2.2 billion, net of underwriting fees and offering costs. The proceeds were used to repay outstanding commercial paper and for general corporate purposes. See Note 16, “Equity,” for additional information.
On October 18, 2023, the Company closed on the restructuring of the MARBL joint venture with MRL. This updated structure is intended to significantly simplify the commercial operation agreements previously entered into, allow us to retain full control of downstream conversion assets and to provide greater strategic opportunities for each company based on their global operations and the evolving lithium market.
Under the amended agreements, Albemarle acquired the remaining 40% ownership of the Kemerton lithium hydroxide processing facility in Australia that was jointly owned with Mineral Resources through the MARBL joint venture. Following this restructuring, Albemarle and MRL each own 50% of Wodgina, and MRL operates the Wodgina mine on behalf of the joint venture. During the fourth quarter of 2023, Albemarle paid MRL approximately $380 million in cash, which includes
| | | | | | | | |
| Albemarle Corporation and Subsidiaries |
|
$180 million of consideration for the remaining ownership of Kemerton as well as a payment for the economic effective date of the transaction being retroactive to April 1, 2022.
On October 25, 2022, the Company completed the acquisition of all of the outstanding equity of Qinzhou, for approximately $200 million in cash. Qinzhou's operations include a recently constructed lithium processing plant strategically positioned near the Port of Qinzhou in Guangxi, which began commercial production in the first half of 2022. The plant has designed annual conversion capacity of up to 25,000 metric tonnes of LCE and is capable of producing battery-grade lithium carbonate and lithium hydroxide.
On May 13, 2022, the Company issued a series of notes (collectively, the “2022 Notes”) as follows:
•$650.0 million aggregate principal amount of senior notes, bearing interest at a rate of 4.65% payable semi-annually on June 1 and December 1 of each year, beginning on December 1, 2022. The effective interest rate on these senior notes is approximately 4.84%. These senior notes mature on June 1, 2027.
•$600.0 million aggregate principal amount of senior notes, bearing interest at a rate of 5.05% payable semi-annually on June 1 and December 1 of each year, beginning on December 1, 2022. The effective interest rate on these senior notes is approximately 5.18%. These senior notes mature on June 1, 2032.
•$450.0 million aggregate principal amount of senior notes, bearing interest at a rate of 5.65% payable semi-annually on June 1 and December 1 of each year, beginning on December 1, 2022. The effective interest rate on these senior notes is approximately 5.71%. These senior notes mature on June 1, 2052.
The net proceeds from the issuance of the 2022 Notes were used to repay the balance of commercial paper notes, the remaining balance of $425.0 million of the 4.15% Senior Notes due 2024 (the “2024 Notes”) and for general corporate purposes. The 2024 Notes were originally due to mature on December 15, 2024 and bore interest at a rate of 4.15%. During the year ended December 31, 2022, the Company recorded a loss on early extinguishment of debt of $19.2 million in Interest and financing expenses, representing the tender premiums, fees, unamortized discounts and unamortized deferred financing costs from the redemption of the 2024 Notes. In addition, the loss on early extinguishment of debt includes the accelerated amortization of the interest rate swap associated with the 2024 Notes from Accumulated other comprehensive loss.
Capital expenditures were $1.7 billion, $2.1 billion and $1.3 billion for the years ended December 31, 2024, 2023 and 2022, respectively, and were incurred mainly for plant, machinery and equipment. Capital expenditures in 2024 include spending for construction of Kemerton Trains 3 and 4 and certain other capital projects, which were stopped as part of our announced comprehensive review of our cost and operating structure. During the years ended December 31, 2024, 2023 and 2022, capital expenditures for the construction of Kemerton Trains 3 and 4 were $296.2 million, $535.7 million and $44.0 million, respectively.
In addition, in stopping construction of Kemerton Trains 3 and 4, and putting Kemerton Train 2 on care and maintenance, we incurred $62.3 million of related contract cancellation costs and required charges under take or pay contracts, as well as of severance and employee benefit charges. The Company’s actions regarding Kemerton are part of a broader effort focused on preserving its world-class resource advantages, optimizing its global conversion network, improving our cost competitiveness and efficiency, reducing capital intensity and enhancing the Company’s financial flexibility. As part of this effort, effective November 1, 2024, the Company transitioned its operating structure to a fully integrated functional model (excluding Ketjen) from a global business unit model. In connection with all restructuring actions noted, we recorded severance and employee benefit charges of $70.1 million during the year ended December 31, 2024. We expect to record additional restructuring costs in the range of $35 million to $45 million associated with these actions in the year ended December 31, 2025.
We expect our capital expenditures to be between $700 million and $800 million in 2025 reflecting the announced new level of spending to unlock cash flow over the near term and generate long-term financial flexibility. The forecasted lower capital expenditures in 2025 reflect reduced sustaining growth and capital spend, while continuing safety and critical maintenance expenditures.
The Company is permitted to repurchase up to a maximum of 15,000,000 shares under a share repurchase program authorized by our Board of Directors. There were no shares of our common stock repurchased during 2024, 2023 or 2022. At December 31, 2024, there were 7,396,263 remaining shares available for repurchase under the Company’s authorized share repurchase program.
Net current assets increased to approximately $1.9 billion at December 31, 2024 from $1.7 billion at December 31, 2023. The increase is primarily due to the increased cash and cash equivalents balance as a result of the $2.2 billion of net proceeds from the issuance of Mandatory Convertible Preferred Stock in March 2024, and the resulting paydown of commercial paper. In addition, accounts receivable, inventory and accounts payable balances all decreased from December 31, 2023 due to the lower
| | | | | | | | |
| Albemarle Corporation and Subsidiaries |
|
lithium market prices and intentional working capital management. Additional changes in the components of net current assets are primarily due to the timing of the sale of goods and other ordinary transactions leading up to the balance sheet dates. The additional changes are not the result of any policy changes by the Company, and do not reflect any change in either the quality of our net current assets or our expectation of success in converting net working capital to cash in the ordinary course of business.
At December 31, 2024 and 2023, our cash and cash equivalents included $833.7 million and $857.6 million, respectively, held by our foreign subsidiaries. The majority of these foreign cash balances are associated with earnings that we have asserted are indefinitely reinvested and which we plan to use to support our continued growth plans outside the U.S. through funding of capital expenditures, acquisitions, research, operating expenses or other similar cash needs of our foreign operations. From time to time, we repatriate cash associated with earnings from our foreign subsidiaries to the U.S. for normal operating needs through intercompany dividends, but only from subsidiaries whose earnings we have not asserted to be indefinitely reinvested or whose earnings qualify as “previously taxed income” as defined by the Internal Revenue Code. For the years ended December 31, 2024, 2023 and 2022, we repatriated approximately $32.7 million, $2.9 million and $1.7 million of cash, respectively, as part of these foreign earnings cash repatriation activities.
While we continue to closely monitor our cash generation, working capital management and capital spending in light of continuing uncertainties in the global economy, we believe that we will continue to have the financial flexibility and capability to opportunistically fund future growth initiatives. Additionally, we anticipate that future capital spending, including business acquisitions and other cash outlays, should be financed primarily with cash flow provided by operations, cash on hand and additional issuances of debt or equity securities, as needed.
Long-Term Debt
We currently have the following notes outstanding:
| | | | | | | | | | | | | | | | | | | | | | | | | | | | | |
| Issue Month/Year | | Principal (in millions) | | Interest Rate | | Interest Payment Dates | | Maturity Date |
| November 2019 | | €377.1 | | 1.125% | | November 25 | | November 25, 2025 |
May 2022(a) | | $650.0 | | 4.65% | | June 1 and December 1 | | June 1, 2027 |
| November 2019 | | €500.0 | | 1.625% | | November 25 | | November 25, 2028 |
November 2019(a) | | $171.6 | | 3.45% | | May 15 and November 15 | | November 15, 2029 |
May 2022(a) | | $600.0 | | 5.05% | | June 1 and December 1 | | June 1, 2032 |
November 2014(a) | | $350.0 | | 5.45% | | June 1 and December 1 | | December 1, 2044 |
May 2022(a) | | $450.0 | | 5.65% | | June 1 and December 1 | | June 1, 2052 |
(a) Denotes senior notes.
Our senior notes are senior unsecured obligations and rank equally with all our other senior unsecured indebtedness from time to time outstanding. The notes are effectively subordinated to all of our existing or future secured indebtedness and to the existing and future indebtedness of our subsidiaries. As is customary for such long-term debt instruments, each series of notes outstanding has terms that allow us to redeem the notes before maturity, in whole at any time or in part from time to time, at a redemption price equal to the greater of (i) 100% of the principal amount of these notes to be redeemed, or (ii) the sum of the present values of the remaining scheduled payments of principal and interest thereon (exclusive of interest accrued to the date of redemption) discounted to the redemption date on a semi-annual basis using the comparable government rate (as defined in the indentures governing these notes) plus between 25 and 40 basis points, depending on the series of notes, plus, in each case, accrued interest thereon to the date of redemption. Holders may require us to purchase such notes at 101% upon a change of control triggering event, as defined in the indentures. These notes are subject to typical events of default, including bankruptcy and insolvency events, nonpayment and the acceleration of certain subsidiary indebtedness of $40 million or more caused by a nonpayment default.
Our Euro notes issued in 2019 are unsecured and unsubordinated obligations and rank equally in right of payment to all our other unsecured senior obligations. The Euro notes are effectively subordinated to all of our existing or future secured indebtedness and to the existing and future indebtedness of our subsidiaries. As is customary for such long-term debt instruments, each series of notes outstanding has terms that allow us to redeem the notes before their maturity, in whole at any time or in part from time to time, at a redemption price equal to the greater of (i) 100% of the principal amount of the notes to be redeemed and (ii) the sum of the present values of the remaining scheduled payments of principal thereof and interest thereon (exclusive of interest accrued to, but excluding, the date of redemption) discounted to the redemption date on an annual
| | | | | | | | |
| Albemarle Corporation and Subsidiaries |
|
basis using the bond rate (as defined in the indentures governing these notes) plus between 25 and 35 basis points, depending on the series of notes, plus, in each case, accrued and unpaid interest on the principal amount being redeemed to, but excluding, the date of redemption. Holders may require us to purchase such notes at 101% upon a change of control triggering event, as defined in the indentures. These notes are subject to typical events of default, including bankruptcy and insolvency events, nonpayment and the acceleration of certain subsidiary indebtedness exceeding $100 million caused by a nonpayment default.
Given current economic conditions, specifically around the market pricing of lithium, and the related impact on the Company’s future earnings, on October 31, 2024, we further amended the 2022 Credit Agreement, which provides for borrowings of up to $1.5 billion and matures on October 28, 2027. Borrowings under the 2022 Credit Agreement bear interest at variable rates based on a benchmark rate depending on the currency in which the loans are denominated, plus an applicable margin which ranges from 0.910% to 1.375%, depending on the Company’s credit rating from Standard & Poor’s Ratings Services LLC (“S&P”), Moody’s Investors Services, Inc. (“Moody’s”) and Fitch Ratings, Inc. (“Fitch”). With respect to loans denominated in U.S. dollars, interest is calculated using the term Secured Overnight Financing Rate (“SOFR”) plus a term SOFR adjustment of 0.10%, plus the applicable margin. The applicable margin on the facility was 1.20% as of December 31, 2024. There were 0 borrowings outstanding under the 2022 Credit Agreement as of December 31, 2024.
Borrowings under the 2022 Credit Agreement are conditioned upon satisfaction of certain customary conditions precedent, including the absence of defaults. The October 2024 amendment was entered into to modify the financial covenants under the 2022 Credit Agreement to avoid a potential covenant violation over the following 18 months given the current market pricing of lithium. The amended 2022 Credit Agreement subjects the Company to two financial covenants, as well as customary affirmative and negative covenants. The amended first financial covenant requires that the ratio of (a) (i) the Company’s consolidated net funded debt plus a proportionate amount of Windfield’s net funded debt less (ii) the Company’s unrestricted cash and cash equivalents plus a proportionate amount of Windfield’s unrestricted cash and cash equivalents (up to a specified amount) to (b) consolidated Windfield-Adjusted EBITDA (as such terms are defined in the 2022 Credit Agreement) be less than or equal to (i) 4.00:1.0 as of the end of the fourth quarter of 2024, (ii) 4.75:1.0 as of the end of the first quarter of 2025, (iii) 5.75:1.0 as of the end of the second quarter of 2025, (iv) 5.50:1.0 as of the end of the third quarter of 2025, (v) 5.00:1.0 as of the end of the fourth quarter of 2025, (vi) 4.75:1.0 as of the end of each of the first and second quarters of 2026, and (vii) 3.50:1.0 as of the end of the third quarter of 2026 and each fiscal quarter thereafter through the third quarter of 2027. The maximum permitted leverage ratios described above are subject to adjustment in accordance with the terms of the 2022 Credit Agreement upon the consummation of an acquisition after June 30, 2026 if the consideration includes cash proceeds from the issuance of funded debt in excess of $500 million.
Beginning in the fourth quarter of 2024, the amended second financial covenant requires that the ratio of the Company’s consolidated EBITDA to consolidated interest charges (as such terms are defined in the 2022 Credit Agreement) be no less than (i) 1.00:1.0 for fiscal quarters through June 30, 2025, (ii) 2.00:1.0 for the third quarter of 2025, (iii) 2.50:1.0 for the fourth quarter of 2025, and (iv) 3.00:1.0 for all fiscal quarters thereafter. The 2022 Credit Agreement also contains customary default provisions, including defaults for non-payment, breach of representations and warranties, insolvency, non-performance of covenants and cross-defaults to other material indebtedness. The occurrence of an event of default under the 2022 Credit Agreement could result in all loans and other obligations becoming immediately due and payable and the commitments under the 2022 Credit Agreement being terminated. Following the $2.2 billion issuance of Mandatory Convertible Preferred Stock in March 2024 and the amendments to the financial covenants, the Company expects to maintain compliance with the amended financial covenants in the near future. However, a significant downturn in lithium market prices or demand could impact the Company’s ability to maintain compliance with its amended financial covenants and it could require the Company to seek additional amendments to the 2022 Credit Agreement and/or issue debt or equity securities to fund its activities and maintain financial flexibility. If the Company were unable to obtain such necessary additional amendments, this could lead to an event of default and its lenders could require the Company to repay its outstanding debt. In that situation, the Company may not be able to raise sufficient debt or equity capital, or divest assets, to refinance or repay the lenders.
On May 29, 2013, we entered into agreements to initiate a commercial paper program on a private placement basis under which we may issue unsecured commercial paper notes (the “Commercial Paper Notes”) from time-to-time. On May 17, 2023, we entered into definitive documentation to increase the size of our existing commercial paper program. The maximum aggregate face amount of Commercial Paper Notes outstanding at any time is $1.5 billion. The proceeds from the issuance of the Commercial Paper Notes are expected to be used for general corporate purposes, including the repayment of other debt of the Company. The 2022 Credit Agreement is available to repay the Commercial Paper Notes, if necessary. Aggregate borrowings outstanding under the 2022 Credit Agreement and the Commercial Paper Notes will not exceed the $1.5 billion current maximum amount available under the 2022 Credit Agreement. The Commercial Paper Notes will be sold at a discount from par, or alternatively, will be sold at par and bear interest at rates that will vary based upon market conditions at the time of issuance. The maturities of the Commercial Paper Notes will vary but may not exceed 397 days from the date of issue. The
| | | | | | | | |
| Albemarle Corporation and Subsidiaries |
|
definitive documents relating to the commercial paper program contain customary representations, warranties, default and indemnification provisions. During the year ended December 31, 2024, we repaid a net amount of $620.0 million of commercial paper notes using the net proceeds received from the issuance of Mandatory Convertible Preferred Stock.
In the second quarter of 2023, the Company received a loan of $300.0 million to be repaid in five equal annual installments beginning on December 31, 2026. This interest-free loan was discounted using an imputed interest rate of 5.5% and the Company will amortize that discount through Interest and financing expenses over the term of the loan.
When constructing new facilities or making major enhancements to existing facilities, we may have the opportunity to enter into incentive agreements with local government agencies in order to reduce certain state and local tax expenditures. Under these agreements, we transfer the related assets to various local government entities and receive bonds. We immediately lease the facilities from the local government entities and have an option to repurchase the facilities for a nominal amount upon tendering the bonds to the local government entities at various predetermined dates. The bonds and the associated obligations for the leases of the facilities offset, and the underlying assets are recorded in property, plant and equipment. We currently have the ability to transfer up to $540 million in assets under these arrangements. At December 31, 2024 and 2023, there were $74.5 million and $14.3 million, respectively, of bonds outstanding under these arrangements.
The non-current portion of our long-term debt amounted to $3.1 billion at December 31, 2024, compared to $3.54 billion at December 31, 2023. In addition, at December 31, 2024, we had the ability to borrow $1.5 billion under our commercial paper program and the 2022 Credit Agreement, and $98.8 million under other existing lines of credit, subject to various financial covenants under the 2022 Credit Agreement. We have the ability and intent to refinance our borrowings under our other existing credit lines with borrowings under the 2022 Credit Agreement, as applicable. Therefore, the amounts outstanding under those credit lines, if any, are classified as long-term debt. We believe that as of December 31, 2024 we were, and currently are, in compliance with all of our debt covenants. For additional information about our long-term debt obligations, see Note 12, “Long-Term Debt,” to our consolidated financial statements included in Part II, Item 8 of this report.
Off-Balance Sheet Arrangements
In the normal course of business with customers, vendors and others, we have entered into off-balance sheet arrangements, including bank guarantees and letters of credit, which totaled approximately $115.7 million at December 31, 2024. None of these off-balance sheet arrangements has, or is likely to have, a material effect on our current or future financial condition, results of operations, liquidity or capital resources.
Liquidity Outlook
We generally use cash on hand and cash provided by operating activities, divestitures and borrowings to pay our operating expenses, satisfy debt service obligations, fund any capital expenditures, make acquisitions, make pension contributions and pay dividends. We also could issue additional debt or equity securities to fund these activities in an effort to maintain our financial flexibility. Our main focus in the short-term, during the continued uncertainty surrounding the global economy, including lithium market pricing and recent inflationary trends, is to continue to maintain financial flexibility by continuing our cost savings initiative, while still protecting our employees and customers, committing to shareholder returns and maintaining an investment grade rating. Over the next three years, in terms of uses of cash, we will continue to invest in growth of the businesses and return value to shareholders. Additionally, we will continue to evaluate the merits of any opportunities that may arise for acquisitions of businesses or assets, which may require additional liquidity. Financing the purchase price of any such acquisitions could involve borrowing under existing or new credit facilities and/or the issuance of debt or equity securities, in addition to cash on hand.
We expect our capital expenditures to be between $700 million and $800 million in 2025, down from $1.7 billion in 2024. Lower capital expenditures in 2025 reflects the announced new level of spending to unlock cash flow over the near term and generate long-term financial flexibility and is driven by reduced sustaining growth and capital spend, while continuing safety and critical maintenance expenditures.
The Company’s actions regarding Kemerton are part of a broader effort focused on preserving its world-class resource advantages, optimizing its global conversion network, improving the Company’s cost competitiveness and efficiency, reducing capital intensity and enhancing the Company’s financial flexibility. As part of this effort, effective November 1, 2024, the Company transitioned its operating structure to a fully integrated functional model (excluding Ketjen) from a global business unit model. We expect the comprehensive review of our cost and operating structure to drive additional cost and productivity improvements of $300 million to $400 million per year.
| | | | | | | | |
| Albemarle Corporation and Subsidiaries |
|
In the normal course of business, amounts received from customers in advance of the Company’s satisfaction of its contractual performance obligations are recorded as deferred revenue, and are recognized within Net sales as the Company satisfies the related performance obligation. In January 2025, the Company received $350 million from certain customers for the delivery of specified amounts of spodumene and lithium salts over the next 5 years.
As of December 31, 2024, we are party to master receivables purchase agreements, under which we may sell up to approximately $92 million of available and eligible outstanding customer accounts receivable generated by sales to certain customers. The agreements are uncommitted and can be terminated by us or the purchaser with certain notice as defined in the contracts. Transactions under this agreement are accounted for as sales of accounts receivable, and the receivables sold are removed from the consolidated balance sheets at the time of the sales transaction. As of December 31, 2024, there were no accounts receivable sold under these master receivables purchase agreements.
In 2022, we announced we had been awarded a nearly $150 million grant from the U.S. Department of Energy to expand domestic manufacturing of batteries for EVs and the electrical grid and for materials and components currently imported from other countries. The grant funding is intended to support a portion of the anticipated cost to construct a new, commercial-scale U.S.-based lithium concentrator facility at our Kings Mountain, North Carolina, location. We expect the concentrator facility to create hundreds of construction and full-time jobs and to produce approximately 420,000 tons of spodumene concentrate annually. To further support the restart of the Kings Mountain mine, in 2023, we announced a $90 million critical materials award from the U.S. Department of Defense. During the year ended December 31, 2024, the Company received $12.4 million of these funds.
Overall, with generally strong cash-generative businesses and various capital resources, we believe we have, and will be able to maintain a solid liquidity position. In order to maintain financial flexibility, we may issue additional debt or equity securities to fund future debt maturities, capital spending and other cash outlays. Our annual maturities of long-term debt as of December 31, 2024 are as follows (in millions): 2025—$398.5; 2026—$60.0; 2027—$710.0; 2028—$581.5; 2029—$231.6; thereafter—$1,623.1. In addition, we expect to make interest payments on those long-term debt obligations as follows (in millions): 2025—$124.3; 2026—$120.0; 2027—$102.4; 2028—$89.1; 2029—$80.2; thereafter—$927.7. For variable-rate debt obligations, projected interest payments are calculated using the December 31, 2024 weighted average interest rate of approximately 0.33%.
As of December 31, 2024, we have committed to approximately $240.2 million of payments to third-party vendors in the normal course of business to secure raw materials for our production processes, with approximately $128.4 million to be paid in 2025. In order to secure materials, sometimes for long durations, these contracts mandate a minimum amount of product to be purchased at predetermined rates over a set timeframe.
See Note 18, “Leases,” to our consolidated financial statements included in Part II, Item 8 of this report for our annual expected payments under our operating lease obligations at December 31, 2024.
In 2025, we expect to pay $82.7 million of the $127.3 million balance remaining from the transition tax on foreign earnings as a result of the Tax Cuts and Jobs Act (“TCJA”) signed into law in December 2017. The one-time transition tax imposed by the TCJA is based on our total post-1986 earnings and profits that we previously deferred from U.S. income taxes and is payable over an eight-year period, with the final payment to be made in 2026.
Contributions to our domestic and foreign qualified and nonqualified pension plans, including our supplemental executive retirement plan, are expected to approximate $17 million in 2025. We may choose to make additional pension contributions in excess of this amount. We made contributions of approximately $17.4 million to our domestic and foreign pension plans (both qualified and nonqualified) during the year ended December 31, 2024.
The liability related to uncertain tax positions, including interest and penalties, recorded in Other noncurrent liabilities totaled $259.6 million and $220.6 million at December 31, 2024 and 2023, respectively. Related assets for corresponding offsetting benefits recorded in Other assets totaled $74.8 million and $73.0 million at December 31, 2024 and 2023, respectively. We cannot estimate the amounts of any cash payments during the next twelve months associated with these liabilities and are unable to estimate the timing of any such cash payments in the future at this time.
Our cash flows from operations may be negatively affected by adverse consequences to our customers and the markets in which we compete as a result of moderating global economic conditions, continuing inflationary trends and reduced capital availability. We have experienced, and may continue to experience, volatility and increases in the price of certain raw materials and in transportation and energy costs as a result of global market and supply chain disruptions and the broader inflationary
| | | | | | | | |
| Albemarle Corporation and Subsidiaries |
|
environment. As a result, we are planning for various economic scenarios and actively monitoring our balance sheet to maintain the financial flexibility needed.
Although we maintain business relationships with a diverse group of financial institutions as sources of financing, an adverse change in their credit standing could lead them to not honor their contractual credit commitments to us, decline funding under our existing but uncommitted lines of credit with them, not renew their extensions of credit or not provide new financing to us. While the global corporate bond and bank loan markets remain strong, periods of elevated uncertainty related to the stability of the banking system, future pandemics or global economic and/or geopolitical concerns may limit efficient access to such markets for extended periods of time. If such concerns heighten, we may incur increased borrowing costs and reduced credit capacity as our various credit facilities mature. If the U.S. Federal Reserve or similar national reserve banks in other countries decide to continue tightening the monetary supply, we may incur increased borrowing costs (as interest rates increase on our variable rate credit facilities, as our various credit facilities mature or as we refinance any maturing fixed rate debt obligations), although these cost increases would be partially offset by increased income rates on portions of our cash deposits.
We had cash and cash equivalents totaling $1.2 billion as of December 31, 2024, of which $833.7 million is held by our foreign subsidiaries. This cash represents an important source of our liquidity and is invested in bank accounts or money market investments with no limitations on access. The cash held by our foreign subsidiaries is intended for use outside of the U.S. We anticipate that any needs for liquidity within the U.S. in excess of our cash held in the U.S. can be readily satisfied with borrowings under our existing U.S. credit facilities or our commercial paper program.
Guarantor Financial Information
Albemarle Wodgina Pty Ltd Issued Notes
Albemarle Wodgina Pty Ltd (the “Issuer”), a wholly-owned subsidiary of Albemarle Corporation, issued $300.0 million aggregate principal amount of 3.45% Senior Notes due 2029 (the “3.45% Senior Notes”) in November 2019. The 3.45% Senior Notes are fully and unconditionally guaranteed (the “Guarantee”) on a senior unsecured basis by Albemarle Corporation (the “Parent Guarantor”). No direct or indirect subsidiaries of the Parent Guarantor guarantee the 3.45% Senior Notes (such subsidiaries are referred to as the “Non-Guarantors”).
In 2019, we completed the acquisition of a 60% interest in Wodgina in Western Australia and formed an unincorporated joint venture with MRL, named MARBL Lithium Joint Venture, for the exploration, development, mining, processing and production of lithium and other minerals (other than iron ore and tantalum) from the Wodgina spodumene mine and for the operation of the Kemerton assets in Western Australia. We participate in Wodgina through our ownership interest in the Issuer. On October 18, 2023 we amended the joint venture agreements, resulting in a decrease of our ownership interest in the MARBL joint venture and Wodgina to 50%.
Prior to January 1, 2024, the Parent Guarantor conducted its U.S. Specialties and Ketjen operations directly, and conducted its other operations (other than operations conducted through the Issuer) through the Non-Guarantors. Effective January 1, 2024, the Company split its U.S. Ketjen operations to a separate non-guarantor subsidiary and its results are no longer included within the summarized Parent Guarantor and Issuer financial information below for the 2024 periods presented.
The 3.45% Senior Notes are the Issuer’s senior unsecured obligations and rank equally in right of payment to the senior indebtedness of the Issuer, effectively subordinated to all of the secured indebtedness of the Issuer, to the extent of the value of the assets securing that indebtedness, and structurally subordinated to all indebtedness and other liabilities of its subsidiaries. The Guarantee is the senior unsecured obligation of the Parent Guarantor and ranks equally in right of payment to the senior indebtedness of the Parent Guarantor, effectively subordinated to the secured debt of the Parent Guarantor to the extent of the value of the assets securing the indebtedness and structurally subordinated to all indebtedness and other liabilities of its subsidiaries.
For cash management purposes, the Parent Guarantor transfers cash among itself, the Issuer and the Non-Guarantors through intercompany financing arrangements, contributions or declaration of dividends between the respective parent and its subsidiaries. The transfer of cash under these activities facilitates the ability of the recipient to make specified third-party payments for principal and interest on the Issuer and/or the Parent Guarantor’s outstanding debt, common stock dividends and common stock repurchases. There are no significant restrictions on the ability of the Issuer or the Parent Guarantor to obtain funds from subsidiaries by dividend or loan.
The following tables present summarized financial information for the Parent Guarantor and the Issuer on a combined basis after elimination of (i) intercompany transactions and balances among the Issuer and the Parent Guarantor and (ii) equity
| | | | | | | | |
| Albemarle Corporation and Subsidiaries |
|
in earnings from and investments in any subsidiary that is a Non-Guarantor. Each entity in the combined financial information follows the same accounting policies as described herein.
Summarized Statement of Operations | | | | | | | |
| Year ended December 31, | | |
| $ in thousands | 2024 | | |
Net sales(a) | $ | 861,876 | | | |
| Gross profit | (66,144) | | | |
Loss before income taxes and equity in net income of unconsolidated investments(b) | (593,433) | | | |
| Net loss attributable to the Guarantor and the Issuer | (442,751) | | | |
(a) Includes net sales to Non-Guarantors of $460.6 million for the year ended December 31, 2024.
(b) Includes intergroup expenses to Non-Guarantors of $46.6 million for the year ended December 31, 2024.
Summarized Balance Sheet | | | | | | | |
| At December 31, |
| $ in thousands | 2024 | | |
Current assets(a) | $ | 921,221 | | | |
| Net property, plant and equipment | 2,005,613 | | | |
Other non-current assets(b) | 2,912,866 | | | |
| | | |
Current liabilities(c) | $ | 2,190,646 | | | |
| Long-term debt | 2,253,328 | | | |
Other non-current liabilities(d) | 7,157,705 | | | |
(a) Includes receivables from Non-Guarantors of $411.2 million at December 31, 2024.
(b) Includes non-curent receivables from Non-Guarantors of $2.3 billion at December 31, 2024.
(c) Includes current payables to Non-Guarantors of $1.9 billion at December 31, 2024.
(d) Includes non-current payables to Non-Guarantors of $6.8 billion at December 31, 2024.
The 3.45% Senior Notes are structurally subordinated to the indebtedness and other liabilities of the Non-Guarantors. The Non-Guarantors are separate and distinct legal entities and have no obligation, contingent or otherwise, to pay any amounts due pursuant to the 3.45% Senior Notes or the Indenture under which the 3.45% Senior Notes were issued, or to make any funds available therefor, whether by dividends, loans, distributions or other payments. Any right that the Parent Guarantor has to receive any assets of any of the Non-Guarantors upon the liquidation or reorganization of any Non-Guarantor, and the consequent rights of holders of the 3.45% Senior Notes to realize proceeds from the sale of any of a Non-Guarantor’s assets, would be effectively subordinated to the claims of such Non-Guarantor’s creditors, including trade creditors and holders of preferred equity interests, if any, of such Non-Guarantor. Accordingly, in the event of a bankruptcy, liquidation or reorganization of any of the Non-Guarantors, the Non-Guarantors will pay the holders of their debts, holders of preferred equity interests, if any, and their trade creditors before they will be able to distribute any of their assets to the Parent Guarantor.
The 3.45% Senior Notes are obligations of the Issuer. The Issuer’s cash flow and ability to make payments on the 3.45% Senior Notes could be dependent upon the earnings it derives from the production from MARBL for Wodgina. Absent income received from sales of its share of production from MARBL, the Issuer’s ability to service the 3.45% Senior Notes could be dependent upon the earnings of the Parent Guarantor’s subsidiaries and other joint ventures and the payment of those earnings to the Issuer in the form of equity, loans or advances and through repayment of loans or advances from the Issuer.
The Issuer’s obligations in respect of MARBL are guaranteed by the Parent Guarantor. Further, under MARBL pursuant to a deed of cross security between the Issuer, the joint venture partner and the manager of the project (the “Manager”), each of the Issuer, and the joint venture partner have granted security to each other and the Manager for the obligations each of the Issuer and the joint venture partner have to each other and to the Manager. The claims of the joint venture partner, the Manager and other secured creditors of the Issuer will have priority as to the assets of the Issuer over the claims of holders of the 3.45% Senior Notes.
| | | | | | | | |
| Albemarle Corporation and Subsidiaries |
|
Albemarle Corporation Issued Notes
In March 2021, Albemarle New Holding GmbH (the “Subsidiary Guarantor”), a wholly-owned subsidiary of Albemarle Corporation, added a full and unconditional guarantee (the “Upstream Guarantee”) to all securities of Albemarle Corporation (the “Parent Issuer”) issued and outstanding as of such date and, subject to the terms of the applicable amendment or supplement, securities issuable by the Parent Issuer pursuant to the Indenture, dated as of January 20, 2005, as amended and supplemented from time to time (the “Indenture”). No other direct or indirect subsidiaries of the Parent Issuer guarantee these securities (such subsidiaries are referred to as the “Upstream Non-Guarantors”). See Long-term debt section above for a description of the securities issued by the Parent Issuer.
The current securities outstanding under the Indenture are the Parent Issuer’s unsecured and unsubordinated obligations and rank equally in right of payment with all other unsecured and unsubordinated indebtedness of the Parent Issuer. All securities currently outstanding under the Indenture are effectively subordinated to the Parent Issuer’s existing and future secured indebtedness to the extent of the value of the assets securing that indebtedness. With respect to any series of securities issued under the Indenture that is subject to the Upstream Guarantee (which series of securities does not include the 2022 Notes), the Upstream Guarantee is, and will be, an unsecured and unsubordinated obligation of the Subsidiary Guarantor, ranking pari passu with all other existing and future unsubordinated and unsecured indebtedness of the Subsidiary Guarantor. All securities currently outstanding under the Indenture (other than the 2022 Notes) are effectively subordinated to all existing and future indebtedness and other liabilities of the Parent’s Subsidiaries other than the Subsidiary Guarantor. The 2022 Notes are effectively subordinated to all existing and future indebtedness and other liabilities of the Parent’s Subsidiaries, including the Subsidiary Guarantor.
For cash management purposes, the Parent Issuer transfers cash among itself, the Subsidiary Guarantor and the Upstream Non-Guarantors through intercompany financing arrangements, contributions or declaration of dividends between the respective parent and its subsidiaries. The transfer of cash under these activities facilitates the ability of the recipient to make specified third-party payments for principal and interest on the Parent Issuer and/or the Subsidiary Guarantor’s outstanding debt, common stock dividends and common stock repurchases. There are no significant restrictions on the ability of the Parent Issuer or the Subsidiary Guarantor to obtain funds from subsidiaries by dividend or loan.
The following tables present summarized financial information for the Subsidiary Guarantor and the Parent Issuer on a combined basis after elimination of (i) intercompany transactions and balances among the Parent Issuer and the Subsidiary Guarantor and (ii) equity in earnings from and investments in any subsidiary that is an Upstream Non-Guarantor.
Summarized Statement of Operations | | | | | | | |
| Year ended December 31, | | |
| $ in thousands | 2024 | | |
Net sales(a) | $ | 639,866 | | | |
| Gross profit | (12,059) | | | |
Loss before income taxes and equity in net income of unconsolidated investments(b) | (400,246) | | | |
| Net loss attributable to the Subsidiary Guarantor and the Parent Issuer | (353,248) | | | |
(a) Includes net sales to Non-Guarantors of $238.6 million for the year ended December 31, 2024.
(b) Includes intergroup income from Non-Guarantors of $148.3 million for the year ended December 31, 2024.
Summarized Balance Sheet | | | | | | | |
| At December 31, |
| $ in thousands | 2024 | | |
Current assets(a) | $ | 1,104,082 | | | |
| Net property, plant and equipment | 800,913 | | | |
Other non-current assets(b) | 2,188,306 | | | |
| | | |
Current liabilities(c) | $ | 2,559,256 | | | |
| Long-term debt | 2,551,714 | | | |
Other non-current liabilities(d) | 6,303,456 | | | |
| | | | | | | | |
| Albemarle Corporation and Subsidiaries |
|
(a) Includes current receivables from Non-Guarantors of $646.3 million at December 31, 2024.
(b) Includes noncurrent receivables from Non-Guarantors of $1.6 billion at December 31, 2024.
(c) Includes current payables to Non-Guarantors of $1.9 billion at December 31, 2024.
(d) Includes non-current payables to Non-Guarantors of $6.0 billion at December 31, 2024.
These securities are structurally subordinated to the indebtedness and other liabilities of the Upstream Non-Guarantors. The Upstream Non-Guarantors are separate and distinct legal entities and have no obligation, contingent or otherwise, to pay any amounts due pursuant to these securities or the Indenture under which these securities were issued, or to make any funds available therefor, whether by dividends, loans, distributions or other payments. Any right that the Subsidiary Guarantor has to receive any assets of any of the Upstream Non-Guarantors upon the liquidation or reorganization of any Upstream Non-Guarantors, and the consequent rights of holders of these securities to realize proceeds from the sale of any of an Upstream Non-Guarantor’s assets, would be effectively subordinated to the claims of such Upstream Non-Guarantor’s creditors, including trade creditors and holders of preferred equity interests, if any, of such Upstream Non-Guarantor. Accordingly, in the event of a bankruptcy, liquidation or reorganization of any of the Upstream Non-Guarantors, the Upstream Non-Guarantors will pay the holders of their debts, holders of preferred equity interests, if any, and their trade creditors before they will be able to distribute any of their assets to the Subsidiary Guarantor.
Safety and Environmental Matters
We are subject to federal, state, local and foreign requirements regulating the handling, manufacture and use of materials (some of which may be classified as hazardous or toxic by one or more regulatory agencies), the discharge of materials into the environment and the protection of the environment. To our knowledge, we are currently complying, and expect to continue to comply, in all material respects with applicable environmental laws, regulations, statutes and ordinances. Compliance with existing federal, state, local and foreign environmental protection laws is not currently expected to have a material effect on capital expenditures, earnings or our competitive position, but the costs associated with increased legal or regulatory requirements could have an adverse effect on our operating results.
Among other environmental requirements, we are subject to the federal Superfund law, and similar state laws, under which we may be designated as a PRP, and may be liable for a share of the costs associated with cleaning up various hazardous waste sites. Management believes that in cases in which we may have liability as a PRP, our liability for our share of cleanup is de minimis. Further, almost all such sites represent environmental issues that are quite mature and have been investigated, studied and in many cases settled. In de minimis situations, our policy generally is to negotiate a consent decree and to pay any apportioned settlement, enabling us to be effectively relieved of any further liability as a PRP, except for remote contingencies. In other than de minimis PRP matters, our records indicate that unresolved PRP exposures should be immaterial. We accrue and expense our proportionate share of PRP costs. Because management has been actively involved in evaluating environmental matters, we are able to conclude that the outstanding environmental liabilities for unresolved PRP sites should not have a material adverse effect upon our results of operations or financial condition.
Our environmental and safety operating costs charged to expense were $87.5 million, $73.0 million and $46.3 million during the years ended December 31, 2024, 2023 and 2022, respectively, excluding depreciation of previous capital expenditures, and are expected to be in the same range in the next few years. Costs for remediation have been accrued and payments related to sites are charged against accrued liabilities, which at December 31, 2024 totaled approximately $20.0 million, a decrease of $14.1 million from $34.1 million at December 31, 2023. See Note 15, “Commitments and Contingencies” to our consolidated financial statements included in Part II, Item 8 of this report for a reconciliation of our environmental liabilities for the years ended December 31, 2024, 2023 and 2022.
We believe that any sum we may be required to pay in connection with environmental remediation and asset retirement obligation matters in excess of the amounts recorded should occur over a period of time and should not have a material adverse effect upon our results of operations, financial condition or cash flows on a consolidated annual basis, although any such sum could have a material adverse impact on our results of operations, financial condition or cash flows in a particular quarterly reporting period.
Capital expenditures for pollution-abatement and safety projects, including such costs that are included in other projects, were approximately $54.4 million, $116.7 million and $75.6 million during the years ended December 31, 2024, 2023 and 2022, respectively. In the future, capital expenditures for these types of projects may increase due to more stringent environmental regulatory requirements and our efforts in reaching sustainability goals. Management’s estimates of the effects of compliance with governmental pollution-abatement and safety regulations are subject to (a) the possibility of changes in the applicable statutes and regulations or in judicial or administrative construction of such statutes and regulations and
| | | | | | | | |
| Albemarle Corporation and Subsidiaries |
|
(b) uncertainty as to whether anticipated solutions to pollution problems will be successful, or whether additional expenditures may prove necessary.
Recently Issued Accounting Pronouncements
See Note 1, “Summary of Significant Accounting Policies” to our consolidated financial statements included in Part II, Item 8 of this report for a discussion of our Recently Issued Accounting Pronouncements.
| | | | | |
| Item 7A. | Quantitative and Qualitative Disclosures About Market Risk. |
The primary currencies to which we have foreign currency exchange rate exposure are the Chinese Renminbi, Euro and Australian Dollar. In response to greater fluctuations in foreign currency exchange rates in recent periods, we have increased the degree of exposure risk management activities to minimize the potential impact on earnings.
We manage our foreign currency exposures by balancing certain assets and liabilities denominated in foreign currencies and through the use, from time to time, of foreign currency forward contracts. The principal objective of such contracts is to minimize the financial impact of changes in foreign currency exchange rates. The counterparties to these contractual agreements are major financial institutions with which we generally have other financial relationships. We are exposed to credit loss in the event of nonperformance by these counterparties. However, we do not anticipate nonperformance by the counterparties. We do not utilize financial instruments for trading or other speculative purposes.
The primary method we use to reduce foreign currency exposure is to identify natural hedges, in which the operating activities denominated in respective currencies across various subsidiaries balance in respect to timing and the underlying exposures. In the event a natural hedge is not available, we may employ a forward contract to reduce exposure, generally expiring within one year. While these contracts are subject to fluctuations in value, such fluctuations are intended to offset the changes in the value of the underlying exposures being hedged. In the fourth quarter of 2019, we entered into a foreign currency forward contract to hedge the cash flow exposure of non-functional currency purchases during the construction of the Kemerton plant in Australia. This contract has been designated as an effective hedging instrument. As a result of the actions taken at Kemerton Trains 3 and 4 during 2024, the Company dedesignated the remaining hedged foreign currency forward contracts. The Company recorded a loss in Other income, net of $26.1 million during the year ended December 31, 2024 from the reclassification of the hedged balance from Accumulated other comprehensive loss. The balance of the settled hedged foreign currency forward contracts associated with the construction of Kemerton Trains 1 and 2 assets placed in service will be reclassified to earnings over the life of the related assets. All other gains and losses on foreign currency forward contracts not designated as an effective hedging instrument are recognized in Other income, net, and generally do not have a significant impact on results of operations.
At December 31, 2024, our financial instruments subject to foreign currency exchange risk primarily consisted of foreign currency forward contracts with an aggregate notional value of $6.9 billion and with a fair value representing a net liability position of $7.0 million. Fluctuations in the value of these contracts are intended to offset the changes in the value of the underlying exposures being hedged. We conducted a sensitivity analysis on the fair value of our foreign currency hedge portfolio assuming an instantaneous 10% change in select foreign currency exchange rates from their levels as of December 31, 2024, with all other variables held constant. A 10% appreciation of the U.S. Dollar against foreign currencies that we hedge would result in an increase of approximately $102.9 million in the fair value of our foreign currency forward contracts. A 10% depreciation of the U.S. Dollar against these foreign currencies would result in a decrease of approximately $103.0 million in the fair value of our foreign currency forward contracts. The sensitivity of the fair value of our foreign currency hedge portfolio represents changes in fair values estimated based on market conditions as of December 31, 2024, without reflecting the effects of underlying anticipated transactions. When those anticipated transactions are realized, actual effects of changing foreign currency exchange rates could have a material impact on our earnings and cash flows in future periods.
We are exposed to changes in interest rates that could impact our results of operations and financial condition. We manage global interest rate and foreign exchange exposure as part of our regular operational and financing strategies. We had variable interest rate borrowings of $27.5 million and $650.2 million outstanding at December 31, 2024 and 2023, respectively. These borrowings represented 1% and 15% of total outstanding debt and bore average interest rates of 0.33% and 5.76% at December 31, 2024 and 2023, respectively. A hypothetical 100 basis point increase in the average interest rate applicable to these borrowings would change our annualized interest expense by approximately $0.3 million as of December 31, 2024. We may enter into interest rate swaps, collars or similar instruments with the objective of reducing interest rate volatility relating to our borrowing costs.
| | | | | | | | |
| Albemarle Corporation and Subsidiaries |
|
Our raw materials are subject to price volatility caused by weather, supply and demand conditions, political and economic variables and other unpredictable factors. Historically, we have not used futures, options or swap contracts to manage the volatility related to the above exposures. However, the refinery catalysts business has used financing arrangements to provide long-term protection against changes in natural gas and metals prices. We seek to limit our exposure by entering into long-term contracts when available, and we seek price increase limitations through contracts. These contracts do not have a significant impact on our results of operations.
| | | | | | | | |
| Albemarle Corporation and Subsidiaries |
|
Item 8. Financial Statements and Supplementary Data.
MANAGEMENT’S REPORT ON INTERNAL CONTROL OVER FINANCIAL REPORTING
Our management is responsible for establishing and maintaining adequate internal control over financial reporting as defined in Exchange Act Rule 13a-15(f) and 15d-15(f). Our internal control over financial reporting is a process designed to provide reasonable assurance regarding the reliability of financial reporting and the preparation of financial statements for external purposes in accordance with accounting principles generally accepted in the United States. Our internal control over financial reporting includes those policies and procedures that (i) pertain to the maintenance of records that, in reasonable detail, accurately and fairly reflect the transactions and dispositions of assets; (ii) provide reasonable assurance that transactions are recorded as necessary to permit preparation of financial statements in accordance with accounting principles generally accepted in the United States, and that receipts and expenditures of the Company are being made only in accordance with management’s and our directors’ authorizations; and (iii) provide reasonable assurance regarding prevention or timely detection of unauthorized acquisition, use, or disposition of our assets that could have a material effect on the financial statements.
Under the supervision and with the participation of our management, including our principal executive officer and principal financial officer, we conducted an evaluation of the effectiveness of our internal control over financial reporting as of December 31, 2024. In making this assessment, management used the criteria for effective internal control over financial reporting described in the Internal Control—Integrated Framework 2013 set forth by the Committee of Sponsoring Organizations of the Treadway Commission (COSO). Based on the assessment, management concluded that, as of December 31, 2024, our internal control over financial reporting was effective to provide reasonable assurance regarding the reliability of financial reporting and the preparation of financial statements for external purposes in accordance with generally accepted accounting principles in the United States. The concept of reasonable assurance is based on the recognition that there are inherent limitations in all systems of internal control. Because of its inherent limitations, internal control over financial reporting may not prevent or detect misstatements. Also, projections of any evaluation of effectiveness to future periods are subject to the risk that controls may become inadequate because of changes in conditions, or that the degree of compliance with the policies or procedures may deteriorate.
The effectiveness of our internal control over financial reporting as of December 31, 2024 has been audited by PricewaterhouseCoopers LLP, an independent registered public accounting firm, as stated in their report, which is included herein.
| | | | |
/S/ J. KENT MASTERS | | |
| | |
| J. Kent Masters | | |
| Chairman, President and Chief Executive Officer | | |
| (principal executive officer) | | |
| February 12, 2025 | | |
| | | | | | | | |
| Albemarle Corporation and Subsidiaries |
|
Report of Independent Registered Public Accounting Firm
To the Board of Directors and Shareholders of Albemarle Corporation
Opinions on the Financial Statements and Internal Control over Financial Reporting
We have audited the accompanying consolidated balance sheets of Albemarle Corporation and its subsidiaries (the “Company”) as of December 31, 2024 and 2023, and the related consolidated statements of (loss) income, of comprehensive (loss) income, of changes in equity and of cash flows for each of the three years in the period ended December 31, 2024, including the related notes (collectively referred to as the “consolidated financial statements”). We also have audited the Company's internal control over financial reporting as of December 31, 2024, based on criteria established in Internal Control - Integrated Framework (2013) issued by the Committee of Sponsoring Organizations of the Treadway Commission (COSO).
In our opinion, the consolidated financial statements referred to above present fairly, in all material respects, the financial position of the Company as of December 31, 2024 and 2023, and the results of its operations and its cash flows for each of the three years in the period ended December 31, 2024 in conformity with accounting principles generally accepted in the United States of America. Also in our opinion, the Company maintained, in all material respects, effective internal control over financial reporting as of December 31, 2024, based on criteria established in Internal Control - Integrated Framework (2013) issued by the COSO.
Basis for Opinions
The Company's management is responsible for these consolidated financial statements, for maintaining effective internal control over financial reporting, and for its assessment of the effectiveness of internal control over financial reporting, included in the accompanying Management’s Report on Internal Control over Financial Reporting. Our responsibility is to express opinions on the Company’s consolidated financial statements and on the Company's internal control over financial reporting based on our audits. We are a public accounting firm registered with the Public Company Accounting Oversight Board (United States) (PCAOB) and are required to be independent with respect to the Company in accordance with the U.S. federal securities laws and the applicable rules and regulations of the Securities and Exchange Commission and the PCAOB.
We conducted our audits in accordance with the standards of the PCAOB. Those standards require that we plan and perform the audits to obtain reasonable assurance about whether the consolidated financial statements are free of material misstatement, whether due to error or fraud, and whether effective internal control over financial reporting was maintained in all material respects.
Our audits of the consolidated financial statements included performing procedures to assess the risks of material misstatement of the consolidated financial statements, whether due to error or fraud, and performing procedures that respond to those risks. Such procedures included examining, on a test basis, evidence regarding the amounts and disclosures in the consolidated financial statements. Our audits also included evaluating the accounting principles used and significant estimates made by management, as well as evaluating the overall presentation of the consolidated financial statements. Our audit of internal control over financial reporting included obtaining an understanding of internal control over financial reporting, assessing the risk that a material weakness exists, and testing and evaluating the design and operating effectiveness of internal control based on the assessed risk. Our audits also included performing such other procedures as we considered necessary in the circumstances. We believe that our audits provide a reasonable basis for our opinions.
Definition and Limitations of Internal Control over Financial Reporting
A company’s internal control over financial reporting is a process designed to provide reasonable assurance regarding the reliability of financial reporting and the preparation of financial statements for external purposes in accordance with generally accepted accounting principles. A company’s internal control over financial reporting includes those policies and procedures that (i) pertain to the maintenance of records that, in reasonable detail, accurately and fairly reflect the transactions and dispositions of the assets of the company; (ii) provide reasonable assurance that transactions are recorded as necessary to permit preparation of financial statements in accordance with generally accepted accounting principles, and that receipts and expenditures of the company are being made only in accordance with authorizations of management and directors of the company; and (iii) provide reasonable assurance regarding prevention or timely detection of unauthorized acquisition, use, or disposition of the company’s assets that could have a material effect on the financial statements.
| | | | | | | | |
| Albemarle Corporation and Subsidiaries |
|
Because of its inherent limitations, internal control over financial reporting may not prevent or detect misstatements. Also, projections of any evaluation of effectiveness to future periods are subject to the risk that controls may become inadequate because of changes in conditions, or that the degree of compliance with the policies or procedures may deteriorate.
Critical Audit Matters
The critical audit matters communicated below are matters arising from the current period audit of the consolidated financial statements that were communicated or required to be communicated to the audit committee and that (i) relate to accounts or disclosures that are material to the consolidated financial statements and (ii) involved our especially challenging, subjective, or complex judgments. The communication of critical audit matters does not alter in any way our opinion on the consolidated financial statements, taken as a whole, and we are not, by communicating the critical audit matters below, providing separate opinions on the critical audit matters or on the accounts or disclosures to which they relate.
Interim and Annual Goodwill Impairment Assessments – Energy Storage Reporting Unit
As described in Notes 1 and 10 to the consolidated financial statements, the Company’s goodwill balance was $1,582.7 million as of December 31, 2024, and the goodwill associated with the Energy Storage reporting unit was $1,387.6 million. Management tests the Company’s recorded goodwill for impairment in the fourth quarter of each year or upon the occurrence of events or changes in circumstances that would more likely than not reduce the fair value of the Company’s reporting units below their carrying amounts. During the third quarter of 2024, management identified a triggering event for a review for impairment of the Company’s Energy Storage reporting unit goodwill. As a result, management tested the goodwill of the Energy Storage reporting unit by comparing its estimated fair value, using a discounted cash flow model, to the related carrying value. Management performed the annual goodwill impairment test as of October 31, 2024, by comparing the estimated fair value of the reporting unit to the related carrying value, and management estimated the fair value using a discounted cash flow model (income) approach. For the Energy Storage reporting unit, the revenue growth rates, adjusted earnings before interest and financing expenses, income tax expense, and depreciation and amortization (“EBITDA”) margins, and the discount rate were deemed by management to be significant assumptions.
The principal considerations for our determination that performing procedures relating to the interim and annual goodwill impairment assessments of the Energy Storage reporting unit is a critical audit matter are (i) the significant judgment by management when developing the fair value estimates of the Energy Storage reporting unit; (ii) a high degree of auditor judgment, subjectivity, and effort in performing procedures and evaluating management’s significant assumptions related to revenue growth rates, adjusted EBITDA margins, and the discount rate; and (iii) the audit effort involved the use of professionals with specialized skill and knowledge.
Addressing the matter involved performing procedures and evaluating audit evidence in connection with forming our overall opinion on the consolidated financial statements. These procedures included testing the effectiveness of controls relating to management’s goodwill impairment assessments, including controls over the valuation of the Energy Storage reporting unit. These procedures also included, among others (i) testing management’s process for developing the fair value estimates of the Energy Storage reporting unit; (ii) evaluating the appropriateness of the income approach used by management; (iii) testing the completeness and accuracy of underlying data used in the income approach; and (iv) evaluating the reasonableness of the significant assumptions used by management related to revenue growth rates, adjusted EBITDA margins, and the discount rate. Evaluating management’s assumptions related to revenue growth rates and adjusted EBITDA margins involved evaluating whether the assumptions used by management were reasonable considering (i) the current and past performance of the Energy Storage reporting unit; (ii) the consistency with external market and industry data; and (iii) whether the assumptions were consistent with evidence obtained in other areas of the audit. Professionals with specialized skill and knowledge were used to assist in evaluating (i) the appropriateness of the income approach and (ii) the reasonableness of the discount rate assumption.
Annual Goodwill Impairment Assessment – Refining Solutions Reporting Unit
As described in Notes 1 and 10 to the consolidated financial statements, the Company’s goodwill balance was $1,582.7 million as of December 31, 2024, and the goodwill associated with the Refining Solutions reporting unit was $162.5 million. Management tests the Company’s recorded goodwill for impairment in the fourth quarter of each year or upon the occurrence of events or changes in circumstances that would more likely than not reduce the fair value of the Company’s reporting units below their carrying amounts. Management performed the annual goodwill impairment test as of October 31, 2024, by comparing the estimated fair value of the reporting unit to the related carrying value. Management estimated the fair value using a combination of the discounted cash flow model (income) approach and earnings multiple (market) approach (placing equal weighting on the income and market approaches). For the Refining Solutions reporting unit, within the Ketjen segment,
| | | | | | | | |
| Albemarle Corporation and Subsidiaries |
|
the revenue growth rates, adjusted EBITDA margins, EBITDA multiples, market participant acquisition premium, and the discount rate were deemed by management to be significant assumptions.
The principal considerations for our determination that performing procedures relating to the annual goodwill impairment assessment of the Refining Solutions reporting unit is a critical audit matter are (i) the significant judgment by management when developing the fair value estimate of the Refining Solutions reporting unit; (ii) a high degree of auditor judgment, subjectivity, and effort in performing procedures and evaluating management’s significant assumptions related to revenue growth rates, adjusted EBITDA margins, EBITDA multiples, market participant acquisition premium, and the discount rate; and (iii) the audit effort involved the use of professionals with specialized skill and knowledge.
Addressing the matter involved performing procedures and evaluating audit evidence in connection with forming our overall opinion on the consolidated financial statements. These procedures included testing the effectiveness of controls relating to management’s goodwill impairment assessment, including controls over the valuation of the Refining Solutions reporting unit. These procedures also included, among others (i) testing management’s process for developing the fair value estimate of the Refining Solutions reporting unit; (ii) evaluating the appropriateness of the income and market approaches used by management; (iii) testing the completeness and accuracy of underlying data used in the income and market approaches; and (iv) evaluating the reasonableness of the significant assumptions used by management related to revenue growth rates, adjusted EBITDA margins, EBITDA multiples, market participant acquisition premium, and the discount rate. Evaluating management’s assumptions related to revenue growth rates and adjusted EBITDA margins involved evaluating whether the assumptions used by management were reasonable considering (i) the current and past performance of the Refining Solutions reporting unit; (ii) the consistency with external market and industry data; and (iii) whether the assumptions were consistent with evidence obtained in other areas of the audit. Professionals with specialized skill and knowledge were used to assist in evaluating (i) the appropriateness of the income and market approaches and (ii) the reasonableness of EBITDA multiples, market participant acquisition premium, and the discount rate assumptions.
| | |
| /s/ PricewaterhouseCoopers LLP |
| Charlotte, North Carolina |
| February 12, 2025 |
We have served as the Company’s auditor since 1994.
| | | | | | | | |
| Albemarle Corporation and Subsidiaries |
| CONSOLIDATED STATEMENTS OF (LOSS) INCOME |
| | | | | | | | | | | | | | | | | |
| (In Thousands, Except Per Share Amounts) |
| Year Ended December 31 | 2024 | | 2023 | | 2022 |
| Net sales | $ | 5,377,526 | | | $ | 9,617,203 | | | $ | 7,320,104 | |
Cost of goods sold(a) | 5,314,987 | | | 8,431,294 | | | 4,245,517 | |
| Gross profit | 62,539 | | | 1,185,909 | | | 3,074,587 | |
| Selling, general and administrative expenses | 618,048 | | | 910,002 | | | 524,145 | |
| Restructuring charges and asset write-offs | 1,134,316 | | | 9,491 | | | — | |
| Research and development expenses | 86,720 | | | 85,725 | | | 71,981 | |
| | | | | |
| | | | | |
| (Gain) loss on change in interest in properties/sale of business, net | — | | | (71,190) | | | 8,400 | |
| | | | | |
| Operating (loss) profit | (1,776,545) | | | 251,881 | | | 2,470,061 | |
| Interest and financing expenses | (165,619) | | | (116,072) | | | (122,973) | |
| Other income, net | 178,339 | | | 110,929 | | | 86,356 | |
| (Loss) income before income taxes and equity in net income of unconsolidated investments | (1,763,825) | | | 246,738 | | | 2,433,444 | |
| Income tax expense | 87,085 | | | 430,277 | | | 390,588 | |
| (Loss) income before equity in net income of unconsolidated investments | (1,850,910) | | | (183,539) | | | 2,042,856 | |
| Equity in net income of unconsolidated investments (net of tax) | 715,433 | | | 1,854,082 | | | 772,275 | |
| | | | | |
| | | | | |
| Net (loss) income | (1,135,477) | | | 1,670,543 | | | 2,815,131 | |
| Net income attributable to noncontrolling interests | (43,972) | | | (97,067) | | | (125,315) | |
| Net (loss) income attributable to Albemarle Corporation | (1,179,449) | | | 1,573,476 | | | 2,689,816 | |
| Mandatory convertible preferred stock dividends | (136,647) | | | — | | | — | |
| Net (loss) income attributable to Albemarle Corporation common shareholders | $ | (1,316,096) | | | $ | 1,573,476 | | | $ | 2,689,816 | |
| | | | | |
| | | | | |
| | | | | |
| Basic (loss) earnings per share attributable to common shareholders | $ | (11.20) | | | $ | 13.41 | | | $ | 22.97 | |
| | | | | |
| | | | | |
| | | | | |
| Diluted (loss) earnings per share attributable to common shareholders | $ | (11.20) | | | $ | 13.36 | | | $ | 22.84 | |
| Weighted-average common shares outstanding—basic | 117,516 | | | 117,317 | | | 117,120 | |
| Weighted-average common shares outstanding—diluted | 117,516 | | | 117,766 | | | 117,793 | |
(a)Included purchases from related unconsolidated affiliates of $1.7 billion, $2.3 billion and $656.7 million for the years ended December 31, 2024, 2023 and 2022, respectively.
See accompanying notes to the consolidated financial statements.
| | | | | | | | |
| Albemarle Corporation and Subsidiaries |
| CONSOLIDATED STATEMENTS OF COMPREHENSIVE (LOSS) INCOME |
| | | | | | | | | | | | | | | | | |
| (In Thousands) |
| Year Ended December 31 | 2024 | | 2023 | | 2022 |
| Net (loss) income | $ | (1,135,477) | | | $ | 1,670,543 | | | $ | 2,815,131 | |
| Other comprehensive (loss) income, net of tax: | | | | | |
| Foreign currency translation and other | (210,534) | | | 26,403 | | | (171,295) | |
| | | | | |
| | | | | |
| Cash flow hedge | (2,935) | | | 5,851 | | | (4,399) | |
| Interest rate swap | — | | | — | | | 7,399 | |
| Total other comprehensive (loss) income, net of tax | (213,469) | | | 32,254 | | | (168,295) | |
| Comprehensive (loss) income | (1,348,946) | | | 1,702,797 | | | 2,646,836 | |
| Comprehensive income attributable to noncontrolling interests | (44,039) | | | (97,185) | | | (125,232) | |
| Comprehensive (loss) income attributable to Albemarle Corporation | $ | (1,392,985) | | | $ | 1,605,612 | | | $ | 2,521,604 | |
See accompanying notes to the consolidated financial statements.
| | | | | | | | |
| Albemarle Corporation and Subsidiaries |
| CONSOLIDATED BALANCE SHEETS |
| | | | | | | | | | | |
| (In Thousands) |
| December 31 | 2024 | | 2023 |
| Assets | | | |
| Current assets: | | | |
| Cash and cash equivalents | $ | 1,192,230 | | | $ | 889,900 | |
| Trade accounts receivable, less allowance for credit losses (2024—$5,201; 2023—$2,808) | 742,201 | | | 1,213,160 | |
| Other accounts receivable | 238,384 | | | 509,097 | |
| Inventories | 1,502,531 | | | 2,161,287 | |
| Other current assets | 166,916 | | | 443,475 | |
| | | |
| Total current assets | 3,842,262 | | | 5,216,919 | |
| Property, plant and equipment, at cost | 12,523,368 | | | 12,233,757 | |
| Less accumulated depreciation and amortization | 3,191,898 | | | 2,738,553 | |
| Net property, plant and equipment | 9,331,470 | | | 9,495,204 | |
| Investments | 1,117,739 | | | 1,369,855 | |
| | | |
| Other assets | 504,711 | | | 297,087 | |
| Goodwill | 1,582,714 | | | 1,629,729 | |
| Other intangibles, net of amortization | 230,753 | | | 261,858 | |
| Total assets | $ | 16,609,649 | | | $ | 18,270,652 | |
| Liabilities and Equity | | | |
| Current liabilities: | | | |
| Accounts payable to third parties | $ | 793,455 | | | $ | 1,537,859 | |
| Accounts payable to related parties | 150,432 | | | 550,186 | |
| Accrued expenses | 467,997 | | | 544,835 | |
| Current portion of long-term debt | 398,023 | | | 625,761 | |
| Dividends payable | 61,282 | | | 46,666 | |
| | | |
| | | |
| Income taxes payable | 95,275 | | | 255,155 | |
| Total current liabilities | 1,966,464 | | | 3,560,462 | |
| Long-term debt | 3,118,142 | | | 3,541,002 | |
| Postretirement benefits | 31,930 | | | 26,247 | |
| Pension benefits | 116,192 | | | 150,312 | |
| | | |
| Other noncurrent liabilities | 819,204 | | | 769,100 | |
| Deferred income taxes | 358,029 | | | 558,430 | |
| Commitments and contingencies (Note 15) | | | |
| Equity: | | | |
| Albemarle Corporation shareholders’ equity: | | | |
| Common stock, $.01 par value (authorized 275,000 shares), issued and outstanding — 117,560 in 2024 and 117,356 in 2023 | 1,176 | | | 1,174 | |
| Mandatory convertible preferred stock, Series A, no par value, $1,000 stated value, authorized - 15,000, issued and outstanding - 2,300 in 2024 and 0 in 2023 | 2,235,105 | | | — | |
| Additional paid-in capital | 2,985,606 | | | 2,952,517 | |
| Accumulated other comprehensive loss | (742,062) | | | (528,526) | |
| Retained earnings | 5,481,692 | | | 6,987,015 | |
| Total Albemarle Corporation shareholders’ equity | 9,961,517 | | | 9,412,180 | |
| Noncontrolling interests | 238,171 | | | 252,919 | |
| Total equity | 10,199,688 | | | 9,665,099 | |
| Total liabilities and equity | $ | 16,609,649 | | | $ | 18,270,652 | |
See accompanying notes to the consolidated financial statements.
| | | | | | | | |
| Albemarle Corporation and Subsidiaries |
| CONSOLIDATED STATEMENTS OF CHANGES IN EQUITY |
| | | | | | | | | | | | | | | | | | | | | | | | | | | | | | | | | | | | | | | | | | | | | | | | | | | | | | | | | | | | | | |
| (In Thousands, Except Share Data) |
| | Common Stock | | Mandatory Convertible Preferred Stock | | Additional Paid-in Capital | | Accumulated Other Comprehensive Loss | | Retained Earnings | | Total Albemarle
Shareholders’ Equity | | Noncontrolling Interests | | Total Equity |
| Shares | | Amounts | | Shares | | Amounts | |
| Balance at January 1, 2022 | | 117,015,333 | | | $ | 1,170 | | | — | | | $ | — | | | $ | 2,920,007 | | | $ | (392,450) | | | $ | 3,096,539 | | | $ | 5,625,266 | | | $ | 180,341 | | | $ | 5,805,607 | |
| Net income | | | | | | | | | | | | | | 2,689,816 | | | 2,689,816 | | | 125,315 | | | 2,815,131 | |
| Other comprehensive loss | | | | | | | | | | | | (168,212) | | | | | (168,212) | | | (83) | | | (168,295) | |
| Common stock dividends declared, $1.58 per common share | | | | | | | | | | | | | | (185,078) | | | (185,078) | | | (97,353) | | | (282,431) | |
| | | | | | | | | | | | | | | | | | | | |
| Stock-based compensation | | | | | | | | | | 31,390 | | | | | | | 31,390 | | | | | 31,390 | |
| | | | | | | | | | | | | | | | | | | | |
| Exercise of stock options | | 32,581 | | | 1 | | | | | | | 2,395 | | | | | | | 2,396 | | | | | 2,396 | |
| | | | | | | | | | | | | | | | | | | | |
| Issuance of common stock, net | | 186,768 | | | 2 | | | | | | | 385 | | | | | | | 387 | | | | | 387 | |
| | | | | | | | | | | | | | | | | | | | |
| Shares withheld for withholding taxes associated with common stock issuances | | (66,316) | | | (1) | | | | | | | (13,337) | | | | | | | (13,338) | | | | | (13,338) | |
| Balance at December 31, 2022 | | 117,168,366 | | | $ | 1,172 | | | — | | | $ | — | | | $ | 2,940,840 | | | $ | (560,662) | | | $ | 5,601,277 | | | $ | 7,982,627 | | | $ | 208,220 | | | $ | 8,190,847 | |
| | | | | | | | | | | | | | | | | | | | |
| Net income | | | | | | | | | | | | | | 1,573,476 | | | 1,573,476 | | | 97,067 | | | 1,670,543 | |
| Other comprehensive income | | | | | | | | | | | | 32,136 | | | | | 32,136 | | | 118 | | | 32,254 | |
| Common stock dividends declared, $1.60 per common share | | | | | | | | | | | | | | (187,738) | | | (187,738) | | | (52,486) | | | (240,224) | |
| Stock-based compensation | | | | | | | | | | 38,957 | | | | | | | 38,957 | | | | | 38,957 | |
| | | | | | | | | | | | | | | | | | | | |
| Exercise of stock options | | 3,124 | | | — | | | | | | | 190 | | | | | | | 190 | | | | | 190 | |
| | | | | | | | | | | | | | | | | | | | |
| Issuance of common stock, net | | 298,781 | | | 3 | | | | | | | (3) | | | | | | | — | | | | | — | |
| | | | | | | | | | | | | | | | | | | | |
| Shares withheld for withholding taxes associated with common stock issuances | | (114,001) | | | (1) | | | | | | | (27,467) | | | | | | | (27,468) | | | | | (27,468) | |
| Balance at December 31, 2023 | | 117,356,270 | | | $ | 1,174 | | | — | | | $ | — | | | $ | 2,952,517 | | | $ | (528,526) | | | $ | 6,987,015 | | | $ | 9,412,180 | | | $ | 252,919 | | | $ | 9,665,099 | |
| | | | | | | | | | | | | | | | | | | | |
| Net (loss) income | | | | | | | | | | | | | | (1,179,449) | | | (1,179,449) | | | 43,972 | | | (1,135,477) | |
| Other comprehensive (loss) income | | | | | | | | | | | | (213,536) | | | | | (213,536) | | | 67 | | | (213,469) | |
| Common stock dividends declared, $1.61 per common share | | | | | | | | | | | | | | (189,227) | | | (189,227) | | | (55,363) | | | (244,590) | |
| Mandatory convertible preferred stock cumulative dividends | | | | | | | | | | | | | | (136,647) | | | (136,647) | | | | | (136,647) | |
| Stock-based compensation | | | | | | | | | | 33,062 | | | | | | | 33,062 | | | | | 33,062 | |
| | | | | | | | | | | | | | | | | | | | |
| Exercise of stock options | | 6,570 | | | — | | | | | | | 374 | | | | | | | 374 | | | | | 374 | |
| | | | | | | | | | | | | | | | | | | | |
| Issuance of common stock, net | | 300,877 | | | 3 | | | | | | | 11,543 | | | | | | | 11,546 | | | | | 11,546 | |
| Issuance of mandatory convertible preferred stock, net | | | | | | 2,300,000 | | | 2,235,105 | | | | | | | | | 2,235,105 | | | | | 2,235,105 | |
| Sale of noncontrolling interest | | | | | | | | | | | | | | | | — | | | (3,424) | | | (3,424) | |
| Shares withheld for withholding taxes associated with common stock issuances | | (103,943) | | | (1) | | | | | | | (11,890) | | | | | | | (11,891) | | | | | (11,891) | |
| Balance at December 31, 2024 | | 117,559,774 | | | $ | 1,176 | | | 2,300,000 | | | $ | 2,235,105 | | | $ | 2,985,606 | | | $ | (742,062) | | | $ | 5,481,692 | | | $ | 9,961,517 | | | $ | 238,171 | | | $ | 10,199,688 | |
See accompanying notes to the consolidated financial statements.
| | | | | | | | |
| Albemarle Corporation and Subsidiaries |
| CONSOLIDATED STATEMENTS OF CASH FLOWS |
| | | | | | | | | | | | | | | | | |
| (In Thousands) |
| Year Ended December 31 | 2024 | | 2023 | | 2022 |
| Cash and cash equivalents at beginning of year | $ | 889,900 | | | $ | 1,499,142 | | | $ | 439,272 | |
| Cash flows from operating activities: | | | | | |
| Net (loss) income | (1,135,477) | | | 1,670,543 | | | 2,815,131 | |
| Adjustments to reconcile net (loss) income to cash flows from operating activities: | | | | | |
| Depreciation and amortization | 588,638 | | | 429,944 | | | 300,841 | |
| Non-cash restructuring and asset write-offs | 1,013,444 | | | — | | | — | |
| | | | | |
| | | | | |
| (Gain) loss on change in interest in properties/sale of business, net | — | | | (71,190) | | | 8,400 | |
| | | | | |
| Inventory net realizable value adjustment | (500,153) | | | 604,099 | | | — | |
| Stock-based compensation and other | 32,141 | | | 36,545 | | | 30,474 | |
| Equity in net income of unconsolidated investments (net of tax) | (715,433) | | | (1,854,082) | | | (772,275) | |
| Dividends received from unconsolidated investments and nonmarketable securities | 358,933 | | | 2,000,862 | | | 801,239 | |
| Pension and postretirement benefit | (5,274) | | | (1,658) | | | (52,254) | |
| Pension and postretirement contributions | (19,379) | | | (17,866) | | | (16,112) | |
| Realized loss on investments in marketable securities | 33,746 | | | — | | | — | |
| Unrealized loss on investments in marketable securities | 30,073 | | | 39,864 | | | 3,279 | |
| Loss on early extinguishment of debt | — | | | — | | | 19,219 | |
| Deferred income taxes | (230,406) | | | 100,877 | | | 93,339 | |
| Changes in current assets and liabilities, net of effects of acquisitions and divestitures: | | | | | |
| Decrease (increase) in accounts receivable | 555,218 | | | (350,655) | | | (786,121) | |
| Decrease (increase) in inventories | 1,560,450 | | | (962,924) | | | (1,609,642) | |
| Decrease (increase) in other current assets | 244,987 | | | (171,870) | | | (104,655) | |
| (Decrease) increase in accounts payable to third parties | (462,839) | | | (315,220) | | | 816,194 | |
| (Decrease) increase in accounts payable to related parties | (399,398) | | | 31,809 | | | 470,878 | |
| (Decrease) increase in accrued expenses and income taxes payable | (140,099) | | | 253,518 | | | (201,356) | |
| | | | | |
| Other, net | (107,104) | | | (97,275) | | | 91,270 | |
| Net cash provided by operating activities | 702,068 | | | 1,325,321 | | | 1,907,849 | |
| Cash flows from investing activities: | | | | | |
| | | | | |
| Acquisitions, net of cash acquired | — | | | (426,228) | | | (162,239) | |
| | | | | |
| Capital expenditures | (1,685,790) | | | (2,149,281) | | | (1,261,646) | |
| | | | | |
| | | | | |
| | | | | |
| Proceeds from sale of property and equipment | 29,102 | | | — | | | — | |
| | | | | |
| | | | | |
| Sales (purchases) of marketable securities, net | 82,520 | | | (204,451) | | | 1,942 | |
| | | | | |
| Investments in equity investments and nonmarketable securities | (270) | | | (1,200) | | | (706) | |
| Net cash used in investing activities | (1,574,438) | | | (2,781,160) | | | (1,422,649) | |
| Cash flows from financing activities: | | | | | |
| | | | | |
| Proceeds from issuance of mandatory convertible preferred stock, net of issuance costs | 2,236,750 | | | — | | | — | |
| Proceeds from borrowings of long-term debt and credit agreements | 112,439 | | | 356,047 | | | 1,964,216 | |
| Repayments of long-term debt and credit agreements | (112,439) | | | (28,862) | | | (705,000) | |
| Other (repayments) borrowings, net | (631,834) | | | 617,014 | | | (391,662) | |
| Fees related to early extinguishment of debt | — | | | — | | | (9,767) | |
| Dividends paid to common shareholders | (188,530) | | | (187,188) | | | (184,429) | |
| Dividends paid to mandatory convertible preferred shareholders | (122,746) | | | — | | | — | |
| Dividends paid to noncontrolling interests | (37,194) | | | (105,631) | | | (44,208) | |
| | | | | |
| | | | | |
| Proceeds from exercise of stock options | 374 | | | 190 | | | 2,783 | |
| Withholding taxes paid on stock-based compensation award distributions | (11,891) | | | (27,468) | | | (13,338) | |
| Other | (3,194) | | | (191) | | | (6,708) | |
| | | | | |
| Net cash provided by financing activities | 1,241,735 | | | 623,911 | | | 611,887 | |
| Net effect of foreign exchange on cash and cash equivalents | (67,035) | | | 222,686 | | | (37,217) | |
| Increase (decrease) in cash and cash equivalents | 302,330 | | | (609,242) | | | 1,059,870 | |
| Cash and cash equivalents at end of year | $ | 1,192,230 | | | $ | 889,900 | | | $ | 1,499,142 | |
See accompanying notes to the consolidated financial statements.
| | | | | | | | |
| Albemarle Corporation and Subsidiaries |
| NOTES TO THE CONSOLIDATED FINANCIAL STATEMENTS |
NOTE 1—Summary of Significant Accounting Policies:
Basis of Consolidation
The consolidated financial statements include the accounts and operations of Albemarle Corporation and our wholly owned, majority owned and controlled subsidiaries. Unless the context otherwise indicates, the terms “Albemarle,” “we,” “us,” “our” or “the Company” mean Albemarle Corporation and its consolidated subsidiaries. For entities that we control and are the primary beneficiary, but own less than 100%, we record the minority ownership as noncontrolling interest, except as noted below. We apply the equity method of accounting for investments in which we have an ownership interest from 20% to 50% or where we exercise significant influence over the related investee’s operations. In addition, the consolidated financial statements contained herein include our proportionate share of the results of operations of the MARBL Lithium Joint Venture (“MARBL”), which manages the exploration, development, mining, processing and production of lithium and other minerals from the Wodgina hard rock lithium mine project (“Wodgina”). As described in Note 8, “Investments,” the Company closed on the restructuring of the MARBL joint venture with Mineral Resources Limited (“MRL”) on October 18, 2023 to reduce our ownership interest in the MARBL joint venture to 50% from 60%. The consolidated financial statements reflect our ownership percentage of the MARBL joint venture during the periods presented. The joint venture is unincorporated with each investor holding an undivided interest in each asset and proportionately liable for each liability; therefore our proportionate share of assets, liabilities, revenue and expenses are included in the appropriate classifications in the consolidated financial statements. All significant intercompany accounts and transactions are eliminated in consolidation.
Cost of goods sold for the year ended December 31, 2024 includes income of $17.4 million for the correction of out of period errors pertaining to an overstated accrual for a profit sharing arrangement with the partner of one of the Company’s joint ventures. For the year ended December 31, 2023, Cost of goods sold was overstated by $17.4 million. The Company believes this adjustment is not material to the consolidated financial statements for the prior period presented, or for the current periodd, in which the correction was made.
Estimates, Assumptions and Reclassifications
The preparation of financial statements in conformity with generally accepted accounting principles (“GAAP”) in the United States (“U.S.”) requires management to make estimates and assumptions that affect the reported amounts of revenues, expenses, assets and liabilities and disclosure of contingent assets and liabilities at the date of the financial statements. Actual results could differ from those estimates.
Revenue Recognition
Revenue is measured as the amount of consideration we expect to receive in exchange for transferring goods and is recognized when performance obligations are satisfied under the terms of contracts with our customers. A performance obligation is deemed to be satisfied when control of the product is transferred to our customer. The transaction price of a contract, or the amount we expect to receive upon satisfaction of all performance obligations, is determined by reference to the contract’s terms and includes adjustments, if applicable, for any variable consideration, such as customer rebates, noncash consideration or consideration payable to the customer, although these adjustments are generally not material. Where a contract contains more than one distinct performance obligation, the transaction price is allocated to each performance obligation based on the standalone selling price of each performance obligation, although these situations are rare and are generally not built into our contracts. Any unsatisfied performance obligations are not material. Standalone selling prices are based on prices we charge to our customers, which in some cases are based on established market prices. Sales and other similar taxes collected from customers on behalf of third parties are excluded from revenue. Our payment terms are generally between 30 to 90 days, however, they vary by market factors, such as customer size, creditworthiness, geography and competitive environment.
All of our revenue is derived from contracts with customers, and almost all of our contracts with customers contain one performance obligation for the transfer of goods where such performance obligation is satisfied at a point in time. Control of a product is deemed to be transferred to the customer upon shipment or delivery. Significant portions of our sales are sold free on board shipping point or on an equivalent basis, while delivery terms of other transactions are based upon specific contractual arrangements. Our standard terms of delivery are generally included in our contracts of sale, order confirmation documents and invoices, while the timing between shipment and delivery generally ranges between 1 and 45 days. Costs for shipping and handling activities, whether performed before or after the customer obtains control of the goods, are accounted for as fulfillment costs. Such costs are immaterial.
The Company currently utilizes the following practical expedients, as permitted by Accounting Standards Codification (“ASC”) 606, Revenue from Contracts with Customers:
| | | | | | | | |
| Albemarle Corporation and Subsidiaries |
| NOTES TO THE CONSOLIDATED FINANCIAL STATEMENTS |
•All sales and other pass-through taxes are excluded from contract value;
•In utilizing the modified retrospective transition method, no adjustment was necessary for contracts that did not cross over the reporting year;
•We will not consider the possibility of a contract having a significant financing component (which would effectively attribute a portion of the sales price to interest income) unless, if at contract inception, the expected payment terms (from time of delivery or other relevant criterion) are more than one year;
•If our right to customer payment is directly related to the value of our completed performance, we recognize revenue consistent with the invoicing right; and
•We expense as incurred all costs of obtaining a contract incremental to any costs/compensation attributable to individual product sales/shipments for contracts where the amortization period for such costs would otherwise be one year or less.
Costs incurred to obtain contracts with customers are not significant and are expensed immediately as the amortization period would be one year or less. When the Company incurs pre-production or other fulfillment costs in connection with an existing or specific anticipated contract and such costs are recoverable through margin or explicitly reimbursable, such costs are capitalized and amortized to Cost of goods sold on a systematic basis that is consistent with the pattern of transfer to the customer of the goods or services to which the asset relates, which is less than one year. We record bad debt expense in specific situations when we determine the customer is unable to meet its financial obligation.
Included in Trade accounts receivable at December 31, 2024 and 2023 is approximately $705.8 million and $1.2 billion, respectively, arising from contracts with customers. The remaining balance of Trade accounts receivable at December 31, 2024 and 2023 primarily includes value-added taxes collected from customers on behalf of various taxing authorities.
Cash and Cash Equivalents
Cash and cash equivalents include cash and money market investments with insignificant interest rate risks and no limitations on access.
Inventories
Inventories are stated at lower of cost and net realizable value with cost determined using standard cost, which approximates the first-in, first-out basis. Cost is determined on the weighted-average basis for a small portion of our inventories at foreign plants and our stores, supplies and other inventory. A portion of our domestic produced finished goods and raw materials are determined on the last-in, first-out basis.
The Company eliminates the balance of intra-entity profits on purchases of inventory from its equity method investments that remains unsold at the balance sheet in Inventories, specifically finished goods and equally reduces Equity in net income of unconsolidated investments (net of tax) on the consolidated statements of (loss) income. The intra-entity profit is recognized in Equity in net income of unconsolidated investments (net of tax) in the period that converted inventory is sold to a third-party customer. In the same period, the intra-entity profit is also recognized as higher Cost of goods sold on the consolidated statements of (loss) income.
Property, Plant and Equipment
Property, plant and equipment include costs of assets constructed, purchased or leased under a finance lease, related delivery and installation costs and interest incurred on significant capital projects during their construction periods. Expenditures for renewals and betterments also are capitalized, but expenditures for normal repairs and maintenance are expensed as incurred. Costs associated with yearly planned major maintenance are generally deferred and amortized over 12 months or until the same major maintenance activities must be repeated, whichever is shorter. The cost and accumulated depreciation applicable to assets retired or sold are removed from the respective accounts, and gains or losses thereon are included in income.
We assign the useful lives of our property, plant and equipment based upon our internal engineering estimates, which are reviewed periodically. The estimated useful lives of our property, plant and equipment range from two to sixty years and depreciation is recorded on the straight-line method, with the exception of our mineral rights and reserves, which are depleted on a units-of-production method.
We evaluate the recovery of our property, plant and equipment annually and when events or changes in circumstances indicate that its carrying amount may not be recoverable. Events that may trigger a test for recoverability include, but are not limited to, significant adverse changes to projected revenues, costs, or capital plans or changes to government regulations that
| | | | | | | | |
| Albemarle Corporation and Subsidiaries |
| NOTES TO THE CONSOLIDATED FINANCIAL STATEMENTS |
may adversely impact our current or future operations. An impairment is determined to exist if the total projected future cash flows on an undiscounted basis are not recoverable or are less than the carrying amount of a long-lived asset group. We estimate future cash flows based on numerous assumptions, which are consistent or reasonable in relation to internal budgets and projections, and actual future cash flows may be significantly different than the estimates. Significant estimates used include, but are not limited to, market pricing (including lithium index pricing), customer demand, operating and production costs, and the timing and capital costs of expansion and sustaining projects. Significant management judgment is involved in estimating these variables and they include inherent uncertainties since they are forecasting future events.
Leases
We determine if an arrangement is a lease at inception. Right-of-use (“ROU”) assets represent our right to use an underlying asset for the lease term and lease liabilities represent our obligation to make lease payments arising from the lease. Operating lease ROU assets and liabilities are recognized at commencement date based on the present value of lease payments over the lease term. As an implicit rate for most of our leases is not determinable, we use our incremental borrowing rate based on the information available at commencement date in determining the present value of lease payments. The lease payments for the initial measurement of lease ROU assets and lease liabilities include fixed and variable payments based on an index or a rate. Variable lease payments that are not index or rate based are recorded as expenses when incurred. Our variable lease payments typically include real estate taxes, insurance costs and common-area maintenance. The operating lease ROU asset also includes any lease payments made, net of lease incentives. The lease term is the non-cancelable period of the lease, including any options to extend, purchase or terminate the lease when it is reasonably certain that we will exercise that option. We amortize the operating lease ROU assets on a straight-line basis over the period of the lease and the finance lease ROU assets on a straight-line basis over the shorter of their estimated useful lives or the lease terms. Leases with an initial term of 12 months or less are not recorded on the balance sheet, and we recognize lease expense for these leases on a straight-line basis over the lease term.
Additionally, we have made accounting policy elections such as exclusion of short-term leases (leases with a term of 12 months or less and which do not include a purchase option that we are reasonably certain to exercise) from the balance sheet presentation, use of portfolio approach in determination of discount rate and accounting for non-lease components in a contract as part of a single lease component for all asset classes, except specific mining operation equipment.
Resource Development Expenses
We incur costs in resource exploration, evaluation and development during the different phases of our resource development projects. Exploration costs incurred before the declaration of proven and probable resources are generally expensed as incurred. After proven and probable resources are declared, exploration, evaluation and development costs necessary to bring the property to commercial capacity or increase the capacity or useful life are capitalized. Any costs to maintain the production capacity in a property under production are expensed as incurred.
Capitalized resource costs are depleted using the units-of-production method. Our resource development assets are evaluated for impairment when events or changes in circumstances indicate that the carrying amount may not be recoverable.
Investments
Investments are accounted for using the equity method of accounting if the investment gives us the ability to exercise significant influence, but not control, over the investee. Significant influence is generally deemed to exist if we have an ownership interest in the voting stock of the investee between 20% and 50%, although other factors, such as representation on the investee’s board of directors and the impact of commercial arrangements, are considered in determining whether the equity method of accounting is appropriate. Under the equity method of accounting, we record our investments in equity-method investees in the consolidated balance sheets as Investments and our share of investees’ earnings or losses together with other-than-temporary impairments in value as Equity in net income of unconsolidated investments in the consolidated statements of (loss) income. We evaluate our equity method investments for impairment whenever events or changes in circumstances indicate that the carrying amounts of such investments may be impaired. If a decline in the value of an equity method investment is determined to be other than temporary, a loss is recorded in earnings in the current period.
Certain investments in equity securities and mutual fund investments are accounted for as trading equities and are marked-to-market on a periodic basis through the consolidated statements of (loss) income. Investments in joint ventures and nonmarketable securities of immaterial entities are estimated based upon the overall performance of the entity where financial results are not available on a timely basis.
| | | | | | | | |
| Albemarle Corporation and Subsidiaries |
| NOTES TO THE CONSOLIDATED FINANCIAL STATEMENTS |
Environmental Compliance and Remediation
Environmental compliance costs include the cost of purchasing and/or constructing assets to prevent, limit and/or control pollution or to monitor the environmental status at various locations. These costs are capitalized and depreciated based on estimated useful lives. Environmental compliance costs also include maintenance and operating costs with respect to pollution prevention and control facilities and other administrative costs. Such operating costs are expensed as incurred. Environmental remediation costs of facilities used in current operations are generally immaterial and are expensed as incurred. We accrue for environmental remediation costs and post-remediation costs that relate to existing conditions caused by past operations at facilities or off-plant disposal sites in the accounting period in which responsibility is established and when the related liability is considered probable and estimable. In developing these cost estimates, we evaluate currently available facts regarding each site, with consideration given to existing technology, presently enacted laws and regulations, prior experience in remediation of contaminated sites, the financial capability of other potentially responsible parties and other factors, subject to uncertainties inherent in the estimation process. If the amount and timing of the cash payments for a site are fixed or reliably determinable, the liability is discounted, if the calculated discount is material. Additionally, these estimates are reviewed periodically, with adjustments to the accruals recorded as necessary.
Research and Development Expenses
Our research and development expenses related to present and future products are expensed as incurred. These expenses consist primarily of personnel-related costs and other overheads, as well as outside service and consulting costs incurred for specific programs. Our U.S. facilities in Texas and Louisiana and our global facilities in the Netherlands, Germany, Belgium and Korea form the capability base for our contract research and custom manufacturing businesses. These business areas provide research and scale-up services primarily to innovative life science companies.
Goodwill and Other Intangible Assets
We account for goodwill and other intangibles acquired in a business combination in conformity with current accounting guidance that requires that goodwill and indefinite-lived intangible assets not be amortized.
We test goodwill for impairment by comparing the estimated fair value of our reporting units to the related carrying value. Our reporting units are either our operating business segments or one level below our operating business segments for which discrete financial information is available and for which operating results are regularly reviewed by the business management. In applying the goodwill impairment test, the Company initially performs a qualitative test (“Step 0”), where it first assesses qualitative factors to determine whether it is more likely than not that the fair value of the reporting units is less than its carrying value. Qualitative factors may include, but are not limited to, economic conditions, industry and market considerations, cost factors, overall financial performance of the reporting units and other entity and reporting unit specific events. If after assessing these qualitative factors, the Company determines it is “more-likely-than-not” that the fair value of the reporting unit is less than the carrying value, the Company performs a quantitative test (“Step 1”). During Step 1, the Company estimates the fair value using either a discounted cash flow model (income) approach or a combination of the discounted cash flow model (income) approach and earnings multiple (market) approach (placing equal weighting on the income and market approaches). The income approach determines fair value based on discounted cash flow model derived from a reporting unit’s long-term forecasted cash flows. The market approach determines fair value based on the application of earnings multiples of comparable companies to the projected earnings of the reporting unit. Future cash flows for all reporting units include assumptions about revenue growth rates, adjusted EBITDA margins, discount rate as well as other economic or industry-related factors. The Company defines adjusted EBITDA as earnings before interest and financing expenses, income tax expenses, the proportionate share of Windfield income tax expense, depreciation and amortization, as adjusted on a consistent basis for certain non-operating, non-recurring or unusual items on a segment basis. For the Refining Solutions reporting unit, within the Ketjen segment, the revenue growth rates, adjusted EBITDA margins, EBITDA multiples, market participant acquisition premium and the discount rate were deemed to be significant assumptions. For the Energy Storage reporting unit, the revenue growth rates, adjusted EBITDA margins and the discount rate were deemed to be significant assumptions. Significant management judgment is involved in estimating these variables and they include inherent uncertainties, particularly regarding future market conditions and cost fluctuations. Any adverse changes in these assumptions, such as a decline in demand, increased competition, rising costs or the imposition of new tariffs could negatively impact the fair value of the reporting units, since they are forecasting future events. The Company uses a Weighted Average Cost of Capital (“WACC”) approach to determine our discount rate for goodwill recoverability testing. The WACC calculation incorporates industry-weighted average returns on debt and equity from a market perspective. The factors in this calculation are largely external to the Company and, therefore, are beyond its control. The Company performs a sensitivity analysis by using a range of inputs to confirm the reasonableness of these estimates being used in the goodwill impairment analysis. The Company tests its recorded goodwill for
| | | | | | | | |
| Albemarle Corporation and Subsidiaries |
| NOTES TO THE CONSOLIDATED FINANCIAL STATEMENTS |
impairment in the fourth quarter of each year or upon the occurrence of events or changes in circumstances that would more likely than not reduce the fair value of its reporting units below their carrying amounts.
In July 2024, the Company made the decision to stop construction of Kemerton conversion plant Train 3 and put Kemerton Train 2 into care and maintenance. See Note 17, “Restructuring Charges and Asset Write-offs,” for further details. The Company determined these actions to be a triggering event for a review for impairment of its Energy Storage reporting unit goodwill. As a result, during the third quarter of 2024, the Company tested the goodwill of the Energy Storage reporting unit by comparing its estimated fair value, using a discounted cash flow model, to the related carrying value. Based on the analysis, the Energy Storage reporting unit had sufficient headroom, which is defined as the percentage difference between the fair value of a reporting unit and its carrying value, that reasonable differences in the significant assumptions used would not impact the conclusion. Consequently, the Company concluded that the Energy Storage estimated fair value exceeded its carrying value, thus no impairment was recorded in the third quarter of 2024.
The Company performed its annual goodwill impairment test as of October 31, 2024. No evidence of impairment was noted for the reporting units with goodwill balances from the analysis. In addition, there were no triggering events subsequent to the annual goodwill impairment test for any of the reporting units. However, if the adjusted EBITDA or discount rate estimates for the Refining Solutions reporting unit negatively changed by 10% (absent any other changes), the Refining Solutions fair value would be below its carrying value. Potential events and changes in circumstances that could reasonably be expected to negatively affect the key assumptions include reductions in demand in oilfield markets, inability to implement effective pricing actions to offset cost increases, changes in macroeconomic conditions and the introduction or escalation of tariffs on imported materials. The Company will continue to monitor these factors closely and assess their impact on its goodwill impairment evaluations in future periods.
The Company assesses its indefinite-lived intangible assets, which include trade names and trademarks, for impairment annually and between annual tests if events or changes in circumstances indicate that it is more likely than not that the asset is impaired. The indefinite-lived intangible asset impairment standard allows the Company to first assess qualitative factors to determine if a quantitative impairment test is necessary. Further testing is only required if we determine, based on the qualitative assessment, that it is more likely than not that the indefinite-lived intangible asset’s fair value is less than its carrying amount. If we determine based on the qualitative assessment that it is more likely than not that the asset is impaired, an impairment test is performed by comparing the fair value of the indefinite-lived intangible asset to its carrying amount. During the year ended December 31, 2024, no evidence of impairment was noted from the analysis for the Company’s indefinite-lived intangible assets.
Definite-lived intangible assets, such as purchased technology, patents and customer lists, are amortized over their estimated useful lives generally for periods ranging from five to twenty-five years. Except for customer lists and relationships associated with the majority of our Energy Storage business, which are amortized using the pattern of economic benefit method, definite-lived intangible assets are amortized using the straight-line method. We evaluate the recovery of our definite-lived intangible assets by comparing the net carrying value of the asset group to the undiscounted net cash flows expected to be generated from the use and eventual disposition of that asset group when events or changes in circumstances indicate that its carrying amount may not be recoverable. If the carrying amount of the asset group is not recoverable, the fair value of the asset group is measured and if the carrying amount exceeds the fair value, an impairment loss is recognized. See Note 10, “Goodwill and Other Intangibles.”
Pension Plans and Other Postretirement Benefits
Under authoritative accounting standards, assumptions are made regarding the valuation of benefit obligations and the performance of plan assets. As required, we recognize a balance sheet asset or liability for each of our pension and other postretirement benefit (“OPEB”) plans equal to the plan’s funded status as of the measurement date. The primary assumptions are as follows:
•Discount Rate—The discount rate is used in calculating the present value of benefits, which is based on projections of benefit payments to be made in the future.
•Expected Return on Plan Assets—We project the future return on plan assets based on prior performance and future expectations for the types of investments held by the plans, as well as the expected long-term allocation of plan assets for these investments. These projected returns reduce the net benefit costs recorded currently.
•Rate of Compensation Increase—For salary-related plans, we project employees’ annual pay increases, which are used to project employees’ pension benefits at retirement.
•Mortality Assumptions—Assumptions about life expectancy of plan participants are used in the measurement of related plan obligations.
| | | | | | | | |
| Albemarle Corporation and Subsidiaries |
| NOTES TO THE CONSOLIDATED FINANCIAL STATEMENTS |
Actuarial gains and losses are recognized annually in our consolidated statements of (loss) income in the fourth quarter and whenever a plan is determined to qualify for a remeasurement during a fiscal year. The remaining components of pension and OPEB plan expense, primarily service cost, interest cost and expected return on assets, are recorded on a monthly basis. The market-related value of assets equals the actual market value as of the date of measurement.
During 2024, we made changes to assumptions related to discount rates and expected rates of return on plan assets. We consider available information that we deem relevant when selecting each of these assumptions.
In selecting the discount rates for the U.S. plans, we consider expected benefit payments on a plan-by-plan basis. As a result, the Company uses different discount rates for each plan depending on the demographics of participants and the expected timing of benefit payments. For 2024, the discount rates were calculated using the results from a bond matching technique developed by Milliman, which matched the future estimated annual benefit payments of each respective plan against a portfolio of bonds of high quality to determine the discount rate. We believe our selected discount rates are determined using preferred methodology under authoritative accounting guidance and accurately reflect market conditions as of the December 31, 2024 measurement date.
In selecting the discount rates for the foreign plans, we look at long-term yields on AA-rated corporate bonds when available. Our actuaries have developed yield curves based on the yields on the constituent bonds in the various indices as well as on other market indicators such as swap rates, particularly at the longer durations. For the Eurozone, we apply the Aon Hewitt yield curve to projected cash flows from the relevant plans to derive the discount rate. For the United Kingdom (“U.K.”), the discount rate is determined by applying the Aon Hewitt yield curve for typical schemes of similar duration to projected cash flows of Albemarle’s U.K. plan. In other countries where there is not a sufficiently deep market of high-quality corporate bonds, we set the discount rate by referencing the yield on government bonds of an appropriate duration.
In estimating the expected return on plan assets, we consider past performance and future expectations for the types of investments held by the plan as well as the expected long-term allocation of plan assets to these investments. In projecting the rate of compensation increase, we consider past experience in light of movements in inflation rates.
For the purpose of measuring our U.S. pension and OPEB obligations at December 31, 2024 and 2023, we used the Pri-2012 Mortality Tables along with the MP-2021 Mortality Improvement Scale, respectively, published by the SOA.
Stock-based Compensation Expense
The fair value of restricted stock awards, restricted stock unit awards and performance unit awards with a service condition are determined based on the number of shares or units granted and the quoted price of our common stock on the date of grant, and the fair value of stock options is determined using the Black-Scholes valuation model. The fair value of performance unit awards with a service condition and a market condition are estimated on the date of grant using a Monte Carlo simulation model. The fair value of these awards is determined after giving effect to estimated forfeitures. Such value is recognized as expense over the service period, which is generally the vesting period of the equity grant. To the extent restricted stock awards, restricted stock unit awards, performance unit awards and stock options are forfeited prior to vesting in excess of the estimated forfeiture rate, the corresponding previously recognized expense is reversed as an offset to operating expenses.
Income Taxes
We use the liability method for determining our income taxes, under which current and deferred tax liabilities and assets are recorded in accordance with enacted tax laws and rates. Under this method, the amounts of deferred tax liabilities and assets at the end of each period are determined using the tax rate expected to be in effect when taxes are actually paid or recovered. Future tax benefits are recognized to the extent that realization of such benefits is more likely than not. The Company’s deferred tax assets and liabilities are classified as noncurrent on the balance sheet, along with any related valuation allowance. Tax effects are released from Accumulated other comprehensive loss using either the specific identification approach or the portfolio approach based on the nature of the underlying item.
Deferred income taxes are provided for the estimated income tax effect of temporary differences between the financial statement carrying amounts and the tax basis of existing assets and liabilities. Deferred tax assets are also provided for operating losses, capital losses and certain tax credit carryovers. A valuation allowance, reducing deferred tax assets, is established when it is more likely than not that some portion or all of the deferred tax assets will not be realized. The realization of such deferred tax assets is dependent upon the generation of sufficient future taxable income of the appropriate character. Although realization is not assured, we do not establish a valuation allowance when we believe it is more likely than not that a net deferred tax asset will be realized. The Company elected to not consider the estimated impact of potential future Corporate Alternative Minimum Tax liabilities for purposes of assessing valuation allowances on its deferred tax balances.
| | | | | | | | |
| Albemarle Corporation and Subsidiaries |
| NOTES TO THE CONSOLIDATED FINANCIAL STATEMENTS |
We only recognize a tax benefit after concluding that it is more likely than not that the benefit will be sustained upon audit by the respective taxing authority based solely on the technical merits of the associated tax position. Once the recognition threshold is met, we recognize a tax benefit measured as the largest amount of the tax benefit that, in our judgment, is greater than 50% likely to be realized. Under current accounting guidance for uncertain tax positions, interest and penalties related to income tax liabilities are included in Income tax expense on the consolidated statements of (loss) income.
We have designated the undistributed earnings of a portion of our foreign operations as indefinitely reinvested and as a result we do not provide for deferred income taxes on the unremitted earnings of these subsidiaries. Our foreign earnings are computed under U.S. federal tax earnings and profits, or E&P, principles. In general, to the extent our financial reporting book basis over tax basis of a foreign subsidiary exceeds these E&P amounts, deferred taxes have not been provided as they are essentially permanent in duration. The determination of the amount of such unrecognized deferred tax liability is not practicable. We provide for deferred income taxes on our undistributed earnings of foreign operations that are not deemed to be indefinitely invested. We will continue to evaluate our permanent investment assertion taking into consideration all relevant and current tax laws.
Accumulated Other Comprehensive Loss
Accumulated other comprehensive loss comprises principally foreign currency translation adjustments, gains or losses on foreign currency cash flow hedges designated as effective hedging instruments and deferred income taxes related to the aforementioned items.
Foreign Currency Translation
The assets and liabilities of all foreign subsidiaries were prepared in their respective functional currencies and translated into U.S. Dollars based on the current exchange rate in effect at the balance sheet dates, while income and expenses were translated at average exchange rates for the periods presented. Translation adjustments are reflected as a separate component of equity.
Foreign exchange transaction and revaluation gains (losses) were $67.5 million, $39.9 million and ($21.8) million for the years ended December 31, 2024, 2023 and 2022, respectively, and are included in Other income, net, in our consolidated statements of (loss) income, with the unrealized portion included in Other, net, in our consolidated statements of cash flows.
Derivative Financial Instruments
We manage our foreign currency exposures by balancing certain assets and liabilities denominated in foreign currencies and through the use of foreign currency forward contracts from time to time, which generally expire within one year. The principal objective of such contracts is to minimize the financial impact of changes in foreign currency exchange rates. While these contracts are subject to fluctuations in value, such fluctuations are generally expected to be offset by changes in the value of the underlying foreign currency exposures being hedged. Gains or losses under foreign currency forward contracts that have been designated as an effective hedging instrument under ASC 815, Derivatives and Hedging will be recorded in Accumulated other comprehensive loss beginning on the date of designation. All other gains and losses on foreign currency forward contracts not designated as an effective hedging instrument are recognized currently in Other income, net, and generally do not have a significant impact on results of operations.
We may also enter into interest rate swaps, collars or similar instruments from time to time, with the objective of reducing interest rate volatility relating to our borrowing costs.
The counterparties to these contractual agreements are major financial institutions with which we generally have other financial relationships. We are exposed to credit loss in the event of nonperformance by these counterparties. However, we do not anticipate nonperformance by the counterparties. We do not utilize financial instruments for trading or other speculative purposes. In the fourth quarter of 2019, we entered into a foreign currency forward contract to hedge the cash flow exposure of non-functional currency purchases during the construction of the Kemerton plant in Australia and designated it as an effective hedging instrument under ASC 815, Derivatives and Hedging. As a result of the actions taken at Kemerton Trains 3 and 4 during 2024, the Company dedesignated the remaining hedged foreign currency forward contracts. The Company recorded a loss in Other income, net of $26.1 million during the year ended December 31, 2024 from the reclassification of the hedged balance from Accumulated other comprehensive loss. The balance of the settled hedged foreign currency forward contracts associated with the construction of Kemerton Trains 1 and 2 assets placed into service will be reclassified to earnings over the life of the related assets. All other foreign currency forward contracts outstanding at December 31, 2024 and 2023 have not been designated as hedging instruments under ASC 815, Derivatives and Hedging.
| | | | | | | | |
| Albemarle Corporation and Subsidiaries |
| NOTES TO THE CONSOLIDATED FINANCIAL STATEMENTS |
Recently Issued or Adopted Accounting Pronouncements
In August 2023, the FASB issued guidance which will require a joint venture to recognize and initially measure its assets, including goodwill, and liabilities using a new basis of accounting upon formation. Initial measurement of a joint venture’s total net assets will be equal to the fair value of one hundred percent of the joint venture’s equity. In addition, a joint venture will be permitted to apply the measurement period guidance of ASC 805-10 if the initial accounting for the joint venture formation is incomplete by the end of the reporting period in which the formation occurs. This guidance is effective prospectively for all joint venture formations with a formation date on or after January 1, 2025. The Company currently does not expect this guidance to have a significant impact on its consolidated financial statements.
In November 2023, the FASB issued guidance to update qualitative and quantitative reportable segment disclosure requirements, including enhanced disclosures about significant segment expenses and increased interim disclosure requirements, among others. This guidance is effective for fiscal years beginning after December 15, 2023, and interim periods within fiscal years beginning after December 15, 2024. Early adoption is permitted, and the amendments should be applied retrospectively. The Company has adopted this guidance and provided the required disclosures in this Annual Report on Form 10-K. See Note 25, “Segment and Geographic Area Information,” for further details.
In December 2023, the FASB issued guidance to require qualitative and quantitative updates to the rate reconciliation and income taxes paid disclosures, among others, in order to enhance the transparency of income tax disclosures, including consistent categories and greater disaggregation of information in the rate reconciliation and disaggregation by jurisdiction of income taxes paid. This guidance is effective for fiscal years beginning after December 15, 2024, with early adoption permitted. The amendments should be applied prospectively; however, retrospective application is also permitted. The Company is currently evaluating the impact this guidance will have on its financial statement disclosures.
In November 2024, the FASB issued guidance to require tabular disclosures disaggregating certain types of expenses presented on the income statement within continuing operations, as well as disclosures about selling expenses. This guidance is effective for fiscal years beginning after December 15, 2026, and interim periods within fiscal years beginning after December 15, 2027. Early adoption is permitted, and the amendments should be applied prospectively; however, retrospective application is also permitted. The Company is currently evaluating the impact this guidance will have on its financial statement disclosures.
NOTE 2—Acquisitions:
Guangxi Tianyuan New Energy Materials Acquisition
On October 25, 2022, the Company completed the acquisition of all of the outstanding equity of Guangxi Tianyuan New Energy Materials Co., Ltd. (“Qinzhou”), for approximately $200 million in cash, which included the deferral of approximately $29 million. The full amount of the deferral, net of working capital adjustments, was paid in installments ending in July 2023. Qinzhou's operations include a lithium processing plant strategically positioned near the Port of Qinzhou in Guangxi, which began commercial production in the first half of 2022. The plant has designed annual conversion capacity of up to 25,000 metric tonnes of lithium carbonate equivalent (“LCE”) and is capable of producing battery-grade lithium carbonate and lithium hydroxide.
The aggregate purchase price noted above was allocated to the major categories of assets and liabilities acquired based upon their estimated fair values at the acquisition closing date, which were based, in part, upon third-party appraisals for certain assets. The fair value of the assets and liabilities was primarily related to Property, plant and equipment of $106.6 million, Other intangibles of $16.3 million, net current liabilities of $5.5 million, and long-term liabilities of $7.1 million. The excess of the purchase price over the fair value of the net assets acquired was $76.8 million and was recorded as Goodwill within the Energy Storage reporting unit.
The allocation of the purchase price was finalized in the third quarter of 2023. The fair value of the assets acquired and liabilities assumed was based on management’s estimates and assumptions, as well as other information compiled by management, including valuations that utilize customary valuation procedures and techniques. The discount rate is a significant assumption used in the valuation model. If the actual results differ from the estimates and judgments used in these fair values, the amounts recorded in the consolidated financial statements could be subject to possible impairment.
Goodwill arising from the acquisition was recorded within the Energy Storage segment and consists largely of anticipated synergies and economies of scale from the combined companies and overall strategic importance of the acquired businesses to Albemarle. The goodwill attributable to the acquisition is not amortizable or deductible for tax purposes.
| | | | | | | | |
| Albemarle Corporation and Subsidiaries |
| NOTES TO THE CONSOLIDATED FINANCIAL STATEMENTS |
Acquisition, integration and potential divestiture related costs
Acquisition, integration and potential divestiture related costs for the years ended December 31, 2024, 2023 and 2022 of $6.2 million, $26.8 million and $16.3 million were included in Selling, general and administrative expenses, respectively, on our consolidated statements of (loss) income. These include costs for the Qinzhou acquisitions noted above, as well as various other completed or potential acquisitions and divestitures.
NOTE 3—Supplemental Cash Flow Information:
Supplemental information related to the consolidated statements of cash flows is as follows (in thousands): | | | | | | | | | | | | | | | | | |
| Year Ended December 31, |
| 2024 | | 2023 | | 2022 |
| Cash paid during the year for: | | | | | |
| Income taxes (net of refunds of $67,132, $31,386 and $11,564 in 2024, 2023 and 2022, respectively) | $ | 262,845 | | | $ | 319,391 | | | $ | 248,143 | |
| Interest (net of capitalization) | $ | 150,689 | | | $ | 101,978 | | | $ | 92,095 | |
| | | | | |
| Supplemental non-cash disclosures related to investing and financing activities: | | | | | |
| Capital expenditures included in Accounts payable | $ | 197,951 | | | $ | 494,029 | | | $ | 296,294 | |
Promissory note issued for capital expenditures(a) | $ | — | | | $ | — | | | $ | 10,876 | |
Common stock issued for annual incentive bonus plan(b) | $ | 11,545 | | | $ | — | | | $ | — | |
| | | | | |
(a) During the first quarter of 2022, the Company issued a promissory note with a present value of $10.9 million for land purchased in Kings Mountain, North Carolina. The promissory note is payable in equal annual installments from the years 2027 to 2048.
(b) During the first quarter of 2024, the Company issued 95,003 shares of common stock to certain employees in lieu of cash as payment of a portion of their 2023 annual incentive bonus plan.
As part of the purchase price paid for the acquisition of a 60% interest in Wodgina in 2019, the Company transferred $17.3 million and $122.7 million of its construction in progress of the designated Kemerton assets during the years ended December 31, 2023 and 2022, respectively, representing MRL’s 40% interest in the assets at the time of transfer. Since the acquisition, the Company has transferred the full $480 million of construction in progress to MRL, as defined in the original purchase agreement. In addition, during the year ended December 31, 2022, the Company recorded expenses of $8.4 million related to cost overruns of the designated Kemerton assets. The cash outflow for these assets was recorded in Capital expenditures within Cash flows from investing activities on the consolidated statements of cash flows. The non-cash transfer of these assets is recorded in Other, net within Cash flows from operating activities on the consolidated statements of cash flows.
Other, net within Cash flows from operating activities on the consolidated statements of cash flows for the years ended December 31, 2024, 2023 and 2022 included $82.7 million, $64.4 million and $41.8 million, respectively, representing the reclassification of the current portion of the one-time transition tax resulting from the enactment of the Tax Cuts and Jobs Act (“TCJA”) in 2017, from Other noncurrent liabilities to Income taxes payable within current liabilities. For additional information, see Note 20, “Income Taxes.” In addition, included in Other, net for the years ended December 31, 2024, 2023 and 2022 is $67.5 million, $39.9 million and ($21.8) million, respectively, related to gains (losses) on fluctuations in foreign currency exchange rates.
NOTE 4—Other Accounts Receivable:
Other accounts receivable consist of the following at December 31, 2024 and 2023 (in thousands): | | | | | | | | | | | |
| December 31, |
| 2024 | | 2023 |
| Value added tax/consumption tax | $ | 213,138 | | | $ | 474,280 | |
| Other | 25,246 | | | 34,817 | |
| Total | $ | 238,384 | | | $ | 509,097 | |
| | | | | | | | |
| Albemarle Corporation and Subsidiaries |
| NOTES TO THE CONSOLIDATED FINANCIAL STATEMENTS |
NOTE 5—Inventories:
The following table provides a breakdown of inventories at December 31, 2024 and 2023 (in thousands): | | | | | | | | | | | |
| December 31, |
| 2024 | | 2023 |
| Finished goods | $ | 912,662 | | | $ | 1,624,893 | |
Raw materials and work in process(a) | 429,080 | | | 401,050 | |
| Stores, supplies and other | 160,789 | | | 135,344 | |
Total(b) | $ | 1,502,531 | | | $ | 2,161,287 | |
(a)Included $290.6 million and $213.4 million at December 31, 2024 and 2023, respectively, of work in process in our Energy Storage segment.
(b)As a result of the decline in lithium market pricing, the Company recorded charges in Cost of goods sold to reduce the value of certain finished goods and spodumene to their net realizable value. The balance of these inventory reserves totaled $104.0 million and $604.1 million at December 31, 2024 and 2023, respectively.
Approximately 3% of our inventories are valued using the last-in, first-out (“LIFO”) method at both December 31, 2024 and 2023. The portion of our domestic inventories stated on the LIFO basis amounted to $44.5 million and $60.4 million at December 31, 2024 and 2023, respectively, which are below replacement cost by approximately $67.1 million and $60.1 million, respectively.
The Company eliminates the balance of intra-entity profits on purchases of inventory from its equity method investments that remains unsold at the balance sheet in Inventories, specifically finished goods and equally reduces Equity in net income of unconsolidated investments (net of tax) on the consolidated statements of (loss) income. The balance of intra-entity profits on inventory purchased from equity method investments in Inventories totaled $66.8 million and $559.6 million at December 31, 2024 and 2023, respectively. The intra-entity profit is recognized in Equity in net income of unconsolidated investments (net of tax) in the period that converted inventory is sold to a third-party customer. In the same period, the intra-entity profit is also recognized as higher Cost of goods sold on the consolidated statements of (loss) income.
NOTE 6—Other Current Assets:
Other current assets consist of the following at December 31, 2024 and 2023 (in thousands): | | | | | | | | | | | |
| December 31, |
| 2024 | | 2023 |
| | | |
| Income tax receivables | $ | 84,975 | | | $ | 112,953 | |
| Prepaid taxes | 217 | | | 207,894 | |
| Other prepaid expenses | 76,974 | | | 116,033 | |
| Other | 4,750 | | | 6,595 | |
| Total | $ | 166,916 | | | $ | 443,475 | |
NOTE 7—Property, Plant and Equipment:
Property, plant and equipment, at cost, consist of the following at December 31, 2024 and 2023 (in thousands):
| | | | | | | | | | | | | | | | | | | | |
| | Useful
Lives
(Years) | | December 31, |
| 2024 | | 2023 |
| Land | | — | | $ | 295,176 | | | $ | 297,435 | |
| Land improvements | | 10 – 30 | | 342,213 | | | 316,544 | |
| Buildings and improvements | | 10 – 50 | | 933,188 | | | 699,045 | |
Machinery and equipment(a) | | 2 – 45 | | 8,187,422 | | | 6,173,463 | |
| Mineral rights and reserves | | 7 – 60 | | 1,755,770 | | | 1,689,013 | |
| | | | | | |
| Construction in progress | | — | | 1,009,599 | | | 3,058,257 | |
| Total | | | | $ | 12,523,368 | | | $ | 12,233,757 | |
(a)Consists primarily of (1) short-lived production equipment components, office and building equipment and other equipment with estimated lives ranging 2 – 7 years, (2) production process equipment (intermediate components) with estimated lives ranging 8 – 19
| | | | | | | | |
| Albemarle Corporation and Subsidiaries |
| NOTES TO THE CONSOLIDATED FINANCIAL STATEMENTS |
years, (3) production process equipment (major unit components) with estimated lives ranging 20 – 29 years, and (4) production process equipment (infrastructure and other) with estimated lives ranging 30 – 45 years.
The cost of property, plant and equipment is depreciated generally by the straight-line method. Depletion of mineral rights is based on the units-of-production method. Depreciation expense, including depletion, amounted to $561.4 million, $398.5 million and $273.0 million during the years ended December 31, 2024, 2023 and 2022, respectively. Interest capitalized on significant capital projects in 2024, 2023 and 2022 was $49.0 million, $72.7 million and $31.1 million, respectively.
In 2022, the Company announced it has been awarded a nearly $150 million grant from the U.S. Department of Energy to expand domestic manufacturing of batteries for EVs and the electric grid and for materials and components currently imported from other countries. The grant funding is intended to support a portion of the anticipated cost to construct a new, commercial-scale U.S.-based lithium concentrator facility at our Kings Mountain, North Carolina location. The grant will be received over the life of the construction period for the new facility (projected through 2028) as reimbursement for capital expenditures. To further support the restart of the Kings Mountain mine, in 2023, we announced a $90 million critical materials award from the U.S. Department of Defense. As funds are received for both of these grants, the Company will reduce the cost of the assets by the amount of the grant, and income will be recognized by the lower depreciation expense over the useful life of the assets. During the year ended December 31, 2024, the Company received $12.4 million of these funds, which reduced the cost of Property, plant and equipment on the balance sheet.
NOTE 8—Investments:
Investments include our share of unconsolidated joint ventures, nonmarketable securities and marketable equity securities. The following table details the Company’s investment balances at December 31, 2024 and 2023 (in thousands):
| | | | | | | | | | | | | | |
| | December 31, |
| | 2024 | | 2023 |
| Joint ventures | | $ | 726,594 | | | $ | 855,131 | |
| Available for sale debt securities | | 313,991 | | | 289,307 | |
| Nonmarketable securities | | 16,528 | | | 18,389 | |
| Marketable equity securities | | 60,626 | | | 207,028 | |
| Total | | $ | 1,117,739 | | | $ | 1,369,855 | |
Unconsolidated Joint Ventures
The Company’s ownership positions in significant unconsolidated investments are shown below: | | | | | | | | | | | | | | | | | | | | | | | |
| | | December 31, |
| | | 2024 | | 2023 | | 2022 |
| * | | Windfield Holdings Pty. Ltd. (“Windfield”) - a joint venture with Sichuan Tianqi Lithium Industries, Inc., that mines lithium ore and produces lithium concentrate | 49 | % | | 49 | % | | 49 | % |
| * | | Nippon Aluminum Alkyls - a joint venture with Mitsui Chemicals, Inc. that produces aluminum alkyls | 50 | % | | 50 | % | | 50 | % |
| | | | | | | |
| * | | Nippon Ketjen Company Limited - a joint venture with Sumitomo Metal Mining Company Limited that produces refinery catalysts | 50 | % | | 50 | % | | 50 | % |
| * | | Eurecat S.A. - a joint venture with Axens Group for refinery catalysts regeneration services | 50 | % | | 50 | % | | 50 | % |
| * | | Fábrica Carioca de Catalisadores S.A. - a joint venture with Petrobras Quimica S.A. - PETROQUISA that produces catalysts and includes catalysts research and product development activities | 50 | % | | 50 | % | | 50 | % |
| | | | | | | |
| | | | | | | |
The following table details the Company’s equity in net income of unconsolidated investments (net of tax) for the years ended December 31, 2024, 2023 and 2022 (in thousands):
| | | | | | | | | | | | | | | | | | |
| | Year Ended December 31, |
| | 2024 | | 2023 | | 2022 |
| Windfield | | $ | 692,965 | | | $ | 1,833,589 | | | $ | 750,378 | |
| Other joint ventures | | 22,468 | | | 20,493 | | | 21,897 | |
| Total | | $ | 715,433 | | | $ | 1,854,082 | | | $ | 772,275 | |
| | | | | | | | |
| Albemarle Corporation and Subsidiaries |
| NOTES TO THE CONSOLIDATED FINANCIAL STATEMENTS |
Our investment in the significant unconsolidated joint ventures above amounted to $712.2 million and $841.5 million as of December 31, 2024 and 2023, respectively. Undistributed earnings attributable to our significant unconsolidated investments represented approximately $464.6 million and $97.3 million of our consolidated retained earnings at December 31, 2024 and 2023, respectively. All of the unconsolidated joint ventures in which we have investments are private companies and, accordingly, do not have a quoted market price available.
The following summary lists the assets, liabilities and results of operations for the Company’s significant unconsolidated joint ventures presented herein (in thousands): | | | | | | | | | | | | |
| | December 31, |
| | 2024 | | 2023 |
| Summary of Balance Sheet Information: | | | | |
| Current assets | | $ | 968,453 | | | $ | 1,424,059 | |
| Noncurrent assets | | 2,707,216 | | | 2,321,261 | |
| Total assets | | $ | 3,675,669 | | | $ | 3,745,320 | |
| Current liabilities | | $ | 390,522 | | | $ | 773,931 | |
| Noncurrent liabilities | | 1,727,181 | | | 1,267,271 | |
| Total liabilities | | $ | 2,117,703 | | | $ | 2,041,202 | |
| | | | | | | | | | | | | | | | | | |
| | Year Ended December 31, |
| | 2024 | | 2023 | | 2022 |
| Summary of Statements of Income Information: | | | | | | |
| Net sales | | $ | 1,810,801 | | | $ | 7,019,117 | | | $ | 4,290,223 | |
| Gross profit | | $ | 1,047,714 | | | $ | 6,373,472 | | | $ | 3,765,304 | |
| Income before income taxes | | $ | 695,932 | | | $ | 5,988,737 | | | $ | 3,301,875 | |
| Net income | | $ | 485,392 | | | $ | 4,224,961 | | | $ | 2,314,094 | |
We have evaluated each of the unconsolidated investments pursuant to current accounting guidance and none qualify for consolidation. Dividends received from our significant unconsolidated investments were $346.8 million, $2.0 billion and $800.9 million in 2024, 2023 and 2022, respectively.
The Company holds a 49% equity interest in Windfield, which we acquired in the Rockwood acquisition. With regards to the Company’s ownership in Windfield, the parties share risks and benefits disproportionate to their voting interests. As a result, the Company considers Windfield to be a variable interest entity (“VIE”). However, the Company does not consolidate Windfield as it is not the primary beneficiary. The carrying amount of our 49% equity interest in Windfield, which is within the Energy Storage segment and the most significant VIE, was $583.6 million and $712.0 million at December 31, 2024 and 2023, respectively. The Company’s unconsolidated VIEs are reported in Investments in the consolidated balance sheets. The Company does not guarantee debt for, or have other financial support obligations to, these entities, and its maximum exposure to loss in connection with its continuing involvement with these entities is limited to the carrying value of the investments.
Proportionately Consolidated Joint Ventures
On October 18, 2023, the Company closed on the restructuring of the MARBL joint venture with MRL. This updated structure is intended to significantly simplify the commercial operation agreements previously entered into, allowed us to retain full control of downstream conversion assets and provide greater strategic opportunities for each company based on their global operations and the evolving lithium market.
Under the amended agreements, Albemarle acquired the remaining 40% ownership of the Kemerton lithium hydroxide processing facility in Australia that was jointly owned with MRL through the MARBL joint venture, bringing Albemarle’s ownership in the processing facility to 100%. Following this restructuring, Albemarle and MRL each own 50% of Wodgina, and MRL operates the Wodgina mine on behalf of the joint venture. During the fourth quarter of 2023, Albemarle paid MRL approximately $380 million in cash, which included $180 million of consideration for the remaining ownership of Kemerton as well as a payment for the economic effective date of the transaction being retroactive to April 1, 2022.
As a result of this transaction, the Company recorded a gain of $71.2 million on the consolidated statement of (loss) income during the fourth quarter of 2023. The fair value of the 40% ownership of the Kemerton lithium hydroxide processing
| | | | | | | | |
| Albemarle Corporation and Subsidiaries |
| NOTES TO THE CONSOLIDATED FINANCIAL STATEMENTS |
facility was based on management’s estimates and assumptions, as well as other information compiled by management, including valuations that utilize customary valuation procedures and techniques. If the actual results differ from the estimates and judgments used in these fair values, the amounts recorded in the consolidated financial statements could be subject to possible impairment.
This joint venture is unincorporated with each investor holding an undivided interest in each asset and proportionately liable for each liability; therefore, our proportionate share of assets, liabilities, revenue and expenses are included in the appropriate classifications in the consolidated financial statements.
Public Equity Securities
Included in the Company’s marketable equity securities balance are holdings in equity securities of public companies. The fair value is measured using publicly available share prices of the investments, with any changes reported in Other income, net in our consolidated statements of (loss) income. During the year ended December 31, 2023, the Company purchased approximately $203.4 million of shares in publicly-traded companies. In addition, during the years ended December 31, 2024, 2023 and 2022, the Company recorded unrealized mark-to-market (losses) gains of ($37.0) million, ($41.4) million and $4.3 million, respectively, in Other income, net for all public equity securities held at the end of the balance sheet date.
In January 2024, the Company sold equity securities of a public company for proceeds of approximately $81.5 million. As a result of the sale, the Company realized a loss of $33.7 million in the year ended December 31, 2024.
Other
The Company holds a 50% equity interest in Jordan Bromine Company Limited (“JBC”), reported in the Specialties segment. The Company consolidates this venture as it is considered the primary beneficiary due to its operational and financial control.
As part of the proceeds from the sale of the fine chemistry services (“FCS”) business on June 1, 2021, W.R. Grace & Co. (“Grace”) issued Albemarle preferred equity of a Grace subsidiary having an aggregate stated value of $270 million. The preferred equity can be redeemed at Grace’s option under certain conditions and began accruing payment-in-kind (“PIK”) dividends at an annual rate of 12% on June 1, 2023. In addition, the preferred equity can be redeemed by Albemarle when the accumulated balance reaches 200% of the original value. This preferred equity had a fair value of $314.0 million and $289.3 million at December 31, 2024 and 2023, respectively, which is reported in Investments in the consolidated balance sheets.
We maintain a Benefit Protection Trust (the “Trust”) that was created to provide a source of funds to assist in meeting the obligations of our Executive Deferred Compensation Plan (“EDCP”), subject to the claims of our creditors in the event of our insolvency. Assets of the Trust, in conjunction with our EDCP, are accounted for as trading securities in accordance with authoritative accounting guidance. The assets of the Trust consist primarily of mutual fund investments and are marked-to-market on a monthly basis through the consolidated statements of (loss) income. At December 31, 2024 and 2023, these marketable securities amounted to $38.2 million and $33.6 million, respectively.
NOTE 9—Other Assets:
Other assets consist of the following at December 31, 2024 and 2023 (in thousands): | | | | | | | | | | | |
| December 31, |
| 2024 | | 2023 |
| Value added tax/consumption tax | $ | 155,068 | | | $ | — | |
Deferred income taxes(a) | 53,608 | | | 22,433 | |
Assets related to unrecognized tax benefits(a) | 74,809 | | | 73,009 | |
| | | |
| | | |
Operating leases(b) | 118,839 | | | 137,405 | |
Capital expenditure incentive receivables(c) | 74,506 | | | 14,264 | |
| Other | 27,881 | | | 49,976 | |
| Total | $ | 504,711 | | | $ | 297,087 | |
(a)See Note 1, “Summary of Significant Accounting Policies” and Note 20, “Income Taxes.”
(b)See Note 18, “Leases.”
(c)Bonds for incentive agreements with local government agencies that offset value with equal long-term liabilities. See Note 14, “Other Noncurrent Liabilities,” for further details.
| | | | | | | | |
| Albemarle Corporation and Subsidiaries |
| NOTES TO THE CONSOLIDATED FINANCIAL STATEMENTS |
NOTE 10—Goodwill and Other Intangibles:
The following table summarizes the changes in goodwill by reportable segment for the years ended December 31, 2024 and 2023 (in thousands): | | | | | | | | | | | | | | | | | | | | | | | | | |
| Energy Storage | | Specialties | | Ketjen | | | | Total |
| Balance at December 31, 2022 | $ | 1,424,275 | | | $ | 20,319 | | | $ | 173,033 | | | | | $ | 1,617,627 | |
| | | | | | | | | |
| | | | | | | | | |
Change in ownership interest(a) | (6,058) | | | — | | | — | | | | | (6,058) | |
Segment realignment(b) | (12,316) | | | 12,316 | | | — | | | | | — | |
Impairment loss(c) | — | | | — | | | (6,765) | | | | | (6,765) | |
| Foreign currency translation adjustments and other | 18,583 | | | 4 | | | 6,338 | | | | | 24,925 | |
Balance at December 31, 2023(d) | 1,424,484 | | | 32,639 | | | 172,606 | | | | | 1,629,729 | |
| | | | | | | | | |
| | | | | | | | | |
| | | | | | | | | |
| | | | | | | | | |
| Foreign currency translation adjustments | (36,893) | | | (62) | | | (10,060) | | | | | (47,015) | |
Balance at December 31, 2024(d) | $ | 1,387,591 | | | $ | 32,577 | | | $ | 162,546 | | | | | $ | 1,582,714 | |
(a) Represents the reduction of goodwill associated with the proportionately consolidated MARBL joint venture. On October 18, 2023, we completed the restructuring of the MARBL joint venture, which reduced the Company’s ownership percentage from 60% to 50%. See Note 8, “Investments,” for further details.
(b) Effective January 1, 2023, the Company realigned its Lithium and Bromine reportable segments into the Energy Storage and Specialties reportable segments. As a result, the Company transferred goodwill from its legacy Lithium segment to the new Specialties reportable segment during the year ended December 31, 2023.
(c) During the year ended December 31, 2023, the Company recorded an impairment loss for the remaining balance of its goodwill associated with its PCS reporting unit within the Ketjen segment. See Note 1, “Summary of Significant Accounting Policies,” for further details.
(d) Balance as of December 31, 2024 and 2023 includes an accumulated impairment loss of $6.8 million from the PCS reporting unit within the Ketjen segment. As a result, the balance of Ketjen as of December 31, 2024 and 2023 fully consists of goodwill related to the Refining Solutions reporting unit.
| | | | | | | | |
| Albemarle Corporation and Subsidiaries |
| NOTES TO THE CONSOLIDATED FINANCIAL STATEMENTS |
Other intangibles consist of the following at December 31, 2024 and 2023 (in thousands):
| | | | | | | | | | | | | | | | | | | | | | | | | | | | | |
| Customer Lists and Relationships | | Trade Names and Trademarks(a) | | Patents and Technology | | Other | | Total |
| Gross Asset Value | | | | | | | | | |
| Balance at December 31, 2022 | $ | 412,670 | | | $ | 13,161 | | | $ | 46,399 | | | $ | 35,186 | | | $ | 507,416 | |
| | | | | | | | | |
| | | | | | | | | |
| Foreign currency translation adjustments and other | 5,133 | | | 244 | | | (112) | | | (537) | | | 4,728 | |
| Balance at December 31, 2023 | 417,803 | | | 13,405 | | | 46,287 | | | 34,649 | | | 512,144 | |
| | | | | | | | | |
| Retirements | — | | | (2,309) | | | (14,506) | | | (4,449) | | | (21,264) | |
| Foreign currency translation adjustments and other | (15,791) | | | (426) | | | 484 | | | (1,190) | | | (16,923) | |
| Balance at December 31, 2024 | $ | 402,012 | | | $ | 10,670 | | | $ | 32,265 | | | $ | 29,010 | | | $ | 473,957 | |
| Accumulated Amortization | | | | | | | | | |
| Balance at December 31, 2022 | $ | (177,627) | | | $ | (3,587) | | | $ | (23,790) | | | $ | (14,542) | | | $ | (219,546) | |
| Amortization | (24,510) | | | — | | | (2,563) | | | (953) | | | (28,026) | |
| | | | | | | | | |
| Foreign currency translation adjustments and other | (2,344) | | | (86) | | | (405) | | | 121 | | | (2,714) | |
| Balance at December 31, 2023 | (204,481) | | | (3,673) | | | (26,758) | | | (15,374) | | | (250,286) | |
| Amortization | (19,570) | | | — | | | (2,549) | | | (917) | | | (23,036) | |
| Retirements | — | | | 2,309 | | | 14,506 | | | 4,449 | | | 21,264 | |
| Foreign currency translation adjustments and other | 7,820 | | | 40 | | | 548 | | | 446 | | | 8,854 | |
| Balance at December 31, 2024 | $ | (216,231) | | | $ | (1,324) | | | $ | (14,253) | | | $ | (11,396) | | | $ | (243,204) | |
| Net Book Value at December 31, 2023 | $ | 213,322 | | | $ | 9,732 | | | $ | 19,529 | | | $ | 19,275 | | | $ | 261,858 | |
| Net Book Value at December 31, 2024 | $ | 185,781 | | | $ | 9,346 | | | $ | 18,012 | | | $ | 17,614 | | | $ | 230,753 | |
(a)Net Book Value includes only indefinite-lived intangible assets.
Useful lives range from 13 – 25 years for customer lists and relationships; 8 – 20 years for patents and technology; and primarily 5 – 25 years for other.
Amortization of other intangibles amounted to $23.0 million, $28.0 million and $24.7 million for the years ended December 31, 2024, 2023 and 2022, respectively. Included in amortization for the years ended December 31, 2024, 2023 and 2022 is $16.1 million, $16.7 million and $17.2 million, respectively, of amortization using the pattern of economic benefit method.
Total estimated amortization expense of other intangibles for the next five fiscal years is as follows (in thousands): | | | | | |
| Estimated Amortization Expense |
| 2025 | $ | 23,554 | |
| 2026 | $ | 22,095 | |
| 2027 | $ | 20,499 | |
| 2028 | $ | 19,621 | |
| 2029 | $ | 18,091 | |
| | | | | | | | |
| Albemarle Corporation and Subsidiaries |
| NOTES TO THE CONSOLIDATED FINANCIAL STATEMENTS |
NOTE 11—Accrued Expenses:
Accrued expenses consist of the following at December 31, 2024 and 2023 (in thousands): | | | | | | | | | | | |
| December 31, |
| 2024 | | 2023 |
| Employee benefits, payroll and related taxes | $ | 157,153 | | | $ | 168,361 | |
| | | |
| | | |
| | | |
| | | |
| | | |
| | | |
| | | |
| | | |
| | | |
| | | |
| | | |
Other(a)(b) | 310,844 | | | 376,474 | |
| Total | $ | 467,997 | | | $ | 544,835 | |
(a)Other accrued expenses represent balances such as operating lease liabilities, environmental reserves, asset retirement obligations, pension obligations, interest, utilities, other taxes, among other liabilities, expected to be paid within the next 12 months. No individual component exceeds 5% of total current liabilities.
(b)See Note 17, “Restructuring Charges and Asset Write-offs,” for details of the restructuring liability balance recorded in Accrued liabilities.
NOTE 12—Long-Term Debt:
Long-term debt consisted of the following at December 31, 2024 and 2023 (in thousands): | | | | | | | | | | | |
| December 31, |
| 2024 | | 2023 |
| 1.125% notes due 2025 | $ | 393,346 | | | $ | 416,501 | |
| 1.625% notes due 2028 | 521,500 | | | 552,200 | |
| | | |
| 3.45% Senior notes due 2029 | 171,612 | | | 171,612 | |
| | | |
| 4.65% Senior notes due 2027 | 650,000 | | | 650,000 | |
| 5.05% Senior notes due 2032 | 600,000 | | | 600,000 | |
| 5.45% Senior notes due 2044 | 350,000 | | | 350,000 | |
| 5.65% Senior notes due 2052 | 450,000 | | | 450,000 | |
| | | |
| | | |
| Commercial paper notes | — | | | 620,000 | |
| Interest-free loan | 300,000 | | | 300,000 | |
| | | |
| Variable-rate foreign bank loans | 27,477 | | | 30,197 | |
| | | |
| Finance lease obligations | 118,796 | | | 110,245 | |
| Other | 22,000 | | | 22,000 | |
| Unamortized discount and debt issuance costs | (88,566) | | | (105,992) | |
| Total long-term debt | 3,516,165 | | | 4,166,763 | |
| Less amounts due within one year | 398,023 | | | 625,761 | |
| Long-term debt, less current portion | $ | 3,118,142 | | | $ | 3,541,002 | |
Aggregate annual maturities of long-term debt as of December 31, 2024 are as follows (in millions): 2025—$398.5; 2026—$60.0; 2027—$710.0; 2028—$581.5; 2029—$231.6; thereafter—$1,623.1.
2022 Notes
On May 13, 2022, the Company issued a series of notes (collectively, the “2022 Notes”) as follows:
•$650.0 million aggregate principal amount of senior notes, bearing interest at a rate of 4.65% payable semi-annually on June 1 and December 1 of each year, beginning on December 1, 2022. The effective interest rate on these senior notes is approximately 4.84%. These senior notes mature on June 1, 2027.
•$600.0 million aggregate principal amount of senior notes, bearing interest at a rate of 5.05% payable semi-annually on June 1 and December 1 of each year, beginning on December 1, 2022. The effective interest rate on these senior notes is approximately 5.18%. These senior notes mature on June 1, 2032.
•$450.0 million aggregate principal amount of senior notes, bearing interest at a rate of 5.65% payable semi-annually on June 1 and December 1 of each year, beginning on December 1, 2022. The effective interest rate on these senior notes is approximately 5.71%. These senior notes mature on June 1, 2052.
The net proceeds from the issuance of the 2022 Notes were used to repay the balance of the commercial paper notes, the remaining balance of $425.0 million of the 4.15% Senior Notes due 2024 (the “2024 Notes”) and for general corporate
| | | | | | | | |
| Albemarle Corporation and Subsidiaries |
| NOTES TO THE CONSOLIDATED FINANCIAL STATEMENTS |
purposes. The 2024 Notes were originally due to mature on December 15, 2024 and bore interest at a rate of 4.15%. During the year ended December 31, 2022, the Company recorded a loss on early extinguishment of debt of $19.2 million in Interest and financing expenses, representing the tender premiums, fees, unamortized discounts and unamortized deferred financing costs from the redemption of the 2024 Notes. In addition, the loss on early extinguishment of debt includes the accelerated amortization of the interest rate swap associated with the 2024 Notes from Accumulated other comprehensive loss.
2019 Notes
The Company has the following outstanding series of notes originally issued on November 25, 2019 (collectively, the “2019 Notes”) as follows:
•€377.1 million aggregate principal amount of notes, bearing interest at a rate of 1.125% payable annually on November 25 of each year, beginning in 2020. The effective interest rate on these notes is approximately 1.30%. These notes mature on November 25, 2025.
•€500.0 million aggregate principal amount of notes, bearing interest at a rate of 1.625% payable annually on November 25 of each year, beginning in 2020. The effective interest rate on these notes is approximately 1.74%. These notes mature on November 25, 2028.
•$171.6 million aggregate principal amount of senior notes, bearing interest at a rate of 3.45% payable semi-annually on May 15 and November 15 of each year, beginning in 2020. The effective interest rate on these senior notes is approximately 3.58%. These senior notes mature on November 15, 2029.
2014 Senior Notes
We currently have outstanding $350.0 million aggregate principal amount of senior notes issued on November 24, 2014, bearing interest at a rate of 5.45% payable semi-annually on June 1 and December 1 of each year, beginning June 1, 2015. The effective interest rate on these senior notes is approximately 5.50%. These senior notes mature on December 1, 2044.
On January 22, 2014, we entered into a pay fixed, receive variable rate forward starting interest rate swap, with a notional amount of $325.0 million, with J.P. Morgan Chase Bank, N.A., to be effective October 15, 2014. Our risk management objective and strategy for undertaking this hedge was to eliminate the variability in the interest rate and partial credit spread on the 20 future semi-annual coupon payments that were to be paid in connection with the 2024 Notes. On October 15, 2014, the swap was settled, resulting in a payment to the counterparty of $33.4 million. This amount was recorded in Accumulated other comprehensive loss and was to be amortized to interest expense over the life of the 2024 Notes. As noted above, the 2024 Notes were repaid in the second quarter of 2022, and as a result, the unamortized balance of this interest rate swap was reclassified to interest expense during the same period as part of the early extinguishment of debt.
Credit Agreements
Given economic conditions, specifically around the market pricing of lithium, and the related anticipated impact on the Company’s future earnings, on October 31, 2024 the Company further amended its revolving, unsecured amended and restated credit agreement dated October 28, 2022, as previously amended on February 9, 2024 (the “2022 Credit Agreement”), which provides for borrowings of up to $1.5 billion and matures on October 28, 2027. Borrowings under the 2022 Credit Agreement bear interest at variable rates based on a benchmark rate depending on the currency in which the loans are denominated, plus an applicable margin which ranges from 0.910% to 1.375%, depending on the Company’s credit rating from Standard & Poor’s Ratings Services LLC (“S&P”), Moody’s Investors Services, Inc. (“Moody’s”) and Fitch Ratings, Inc. (“Fitch”). With respect to loans denominated in U.S. dollars, interest is calculated using the term Secured Overnight Financing Rate (“SOFR”) plus a term SOFR adjustment of 0.10%, plus the applicable margin. The applicable margin on the facility was 1.20% as of December 31, 2024. There were no borrowings outstanding under the 2022 Credit Agreement as of December 31, 2024.
Borrowings under the 2022 Credit Agreement are conditioned upon satisfaction of certain customary conditions precedent, including the absence of defaults. The October 2024 amendment was entered into to modify the financial covenants under the 2022 Credit Agreement to avoid a potential covenant violation through June 2026 given the market pricing of lithium. The amended 2022 Credit Agreement subjects the Company to two financial covenants, as well as customary affirmative and negative covenants. The amended first financial covenant requires that the ratio of (a) (i) the Company’s consolidated net funded debt plus a proportionate amount of Windfield’s net funded debt less (ii) the Company’s unrestricted cash and cash equivalents plus a proportionate amount of Windfield’s unrestricted cash and cash equivalents (up to a specified amount) to (b) consolidated Windfield-Adjusted EBITDA (as such terms are defined in the 2022 Credit Agreement) be less than or equal to: (i) 4.00:1.0 as of the end of the fourth quarter of 2024, (ii) 4.75:1.0 as of the end of the first quarter of 2025, (iii) 5.75:1.0 as of the end of the second quarter of 2025, (iv) 5.50:1.0 as of the end of the third quarter of 2025, (v) 5.00:1.0 as of the end of the fourth quarter of 2025 (vi) 4.75:1.0 as of the end of the first and the second quarters of 2026, respectively and (vii) 3.50:1.0 as
| | | | | | | | |
| Albemarle Corporation and Subsidiaries |
| NOTES TO THE CONSOLIDATED FINANCIAL STATEMENTS |
of the end of the third quarter of 2026 and each fiscal quarter thereafter through the third quarter of 2027. The maximum permitted leverage ratios described above are subject to adjustment in accordance with the terms of the 2022 Credit Agreement upon the consummation of an acquisition after June 30, 2026 if the consideration includes cash proceeds from issuance of funded debt in excess of $500 million.
The amended second financial covenant requires that, beginning as of the end of the fourth quarter of 2024, the ratio of the Company’s consolidated EBITDA to consolidated interest charges (as such terms are defined in the 2022 Credit Agreement) be no less than (i) 1.00:1.0 as of the end of each fiscal quarter through the second quarter of 2025, (ii) 2.00:1.0 as of the end of the third quarter of 2025, (iii) 2.50:1.0 as of the end of the fourth quarter of 2025, and (iv) 3.00:1.0 as of the end of each fiscal quarter thereafter. The 2022 Credit Agreement also contains customary default provisions, including defaults for non-payment, breach of representations and warranties, insolvency, non-performance of covenants and cross-defaults to other material indebtedness. The occurrence of an event of default under the 2022 Credit Agreement could result in all loans and other obligations becoming immediately due and payable and the commitments under the 2022 Credit Agreement being terminated. Following the $2.2 billion issuance of mandatory convertible preferred stock in March 2024 and the amendments to the financial covenants, the Company expects to maintain compliance with the amended financial covenants for the next twelve months. In addition to the amended covenants, the Company has introduced additional cost reduction plans to further reduce operating expenses and capital investments, as discussed in Note 17, “Restructuring Charges and Asset Write-offs.”
No assurances can be given that any additional cost reduction strategies undertaken will be sufficient to meet the amended financial covenants. Further, a significant and extended downturn in lithium market prices or demand could impact the Company’s ability to maintain compliance with its amended financial covenants and it could require the Company to seek additional amendments to the 2022 Credit Agreement and/or issue debt or equity securities to fund its activities and maintain financial flexibility. If the Company were unable to obtain such necessary additional amendments, this could lead to an event of default and its lenders could require the Company to repay its outstanding debt. In that situation, the Company may not be able to raise sufficient debt or equity capital, or divest assets, to refinance or repay the lenders.
Commercial Paper Notes
On May 29, 2013, we entered into agreements to initiate a commercial paper program on a private placement basis under which we may issue unsecured commercial paper notes (the “Commercial Paper Notes”) from time-to-time. On May 17, 2023, we entered into definitive documentation to increase the size of our existing commercial paper program. The maximum aggregate face amount of Commercial Paper Notes outstanding at any time is $1.5 billion. The proceeds from the issuance of the Commercial Paper Notes are expected to be used for general corporate purposes, including the repayment of other debt of the Company. The 2022 Credit Agreement is available to repay the Commercial Paper Notes, if necessary. Aggregate borrowings outstanding under the 2022 Credit Agreement and the Commercial Paper Notes will not exceed the $1.5 billion current maximum amount available under the 2022 Credit Agreement. The Commercial Paper Notes will be sold at a discount from par, or alternatively, will be sold at par and bear interest at rates that will vary based upon market conditions at the time of issuance. The maturities of the Commercial Paper Notes will vary but may not exceed 397 days. During the year ended December 31, 2024, we repaid a net amount of $620.0 million of commercial paper notes using the net proceeds received from the issuance of mandatory convertible preferred stock. See Note 16, “Equity,” for additional information.
Other
In the second quarter of 2023, the Company received a loan of $300.0 million to be repaid in five equal annual installments beginning on December 31, 2026. This interest-free loan was discounted using an imputed interest rate of 5.53% and the Company will amortize that discount through Interest and financing expenses over the term of the loan.
We have additional uncommitted credit lines with various U.S. and foreign financial institutions that provide for borrowings of up to approximately $182.2 million at December 31, 2024. Outstanding borrowings under these agreements were $27.5 million and $30.2 million at December 31, 2024 and 2023, respectively. The average interest rate on borrowings under these agreements during 2024, 2023 and 2022 was approximately 0.3%.
At December 31, 2024 and 2023, we had the ability and intent to refinance our borrowings under our other existing credit lines with borrowings under the 2022 Credit Agreement. Therefore, the amounts outstanding under those credit lines, if any, are classified as long-term debt at December 31, 2024 and 2023. At December 31, 2024, we had the ability to borrow a total of $1.5 billion under our commercial paper program and the Credit Agreements.
We believe that as of December 31, 2024, we were, and currently are, in compliance with all of our debt covenants.
| | | | | | | | |
| Albemarle Corporation and Subsidiaries |
| NOTES TO THE CONSOLIDATED FINANCIAL STATEMENTS |
NOTE 13—Pension Plans and Other Postretirement Benefits:
We maintain various noncontributory defined benefit pension plans covering certain employees, primarily in the U.S., the U.K., Germany and Japan. We also have a contributory defined benefit plan covering certain Belgian employees. The benefits for these plans are based primarily on compensation and/or years of service. Our U.S. and U.K. defined benefit plans for non-represented employees are closed to new participants, with no additional benefits accruing under these plans as participants’ accrued benefits have been frozen. The funding policy for each plan complies with the requirements of relevant governmental laws and regulations. The pension information for all periods presented includes amounts related to salaried and hourly plans.
The following provides a reconciliation of benefit obligations, plan assets and funded status, as well as a summary of significant assumptions, for our defined benefit pension plans (in thousands):
| | | | | | | | | | | | | | | | | | | | | | | |
| Year Ended December 31, 2024 | | Year Ended December 31, 2023 |
| U.S. Pension Plans | | Foreign Pension Plans | | U.S. Pension Plans | | Foreign Pension Plans |
| Change in benefit obligations: | | | | | | | |
| Benefit obligation at January 1 | $ | 512,902 | | | $ | 195,918 | | | $ | 514,971 | | | $ | 180,561 | |
| Service cost | 545 | | | 5,391 | | | 499 | | | 5,686 | |
| Interest cost | 25,580 | | | 7,204 | | | 26,924 | | | 7,153 | |
| | | | | | | |
| Actuarial (gain) loss | (11,604) | | | (7,034) | | | 11,957 | | | 10,078 | |
| Benefits paid | (42,355) | | | (9,423) | | | (41,449) | | | (9,051) | |
| | | | | | | |
| | | | | | | |
| | | | | | | |
| Employee contributions | — | | | 70 | | | — | | | 60 | |
| Foreign exchange (gain) loss | — | | | (7,920) | | | — | | | 7,137 | |
| Settlements/curtailments | — | | | (6,197) | | | — | | | (5,606) | |
| | | | | | | |
| Other | — | | | (56) | | | — | | | (100) | |
| Benefit obligation at December 31 | $ | 485,068 | | | $ | 177,953 | | | $ | 512,902 | | | $ | 195,918 | |
| Change in plan assets: | | | | | | | |
| Fair value of plan assets at January 1 | $ | 484,131 | | | $ | 65,514 | | | $ | 469,828 | | | $ | 58,229 | |
| Actual return on plan assets | 33,707 | | | (1,317) | | | 54,785 | | | 4,395 | |
| Employer contributions | 1,911 | | | 15,498 | | | 967 | | | 14,496 | |
| Benefits paid | (42,355) | | | (9,423) | | | (41,449) | | | (9,051) | |
| | | | | | | |
| | | | | | | |
| Employee contributions | — | | | 70 | | | — | | | 60 | |
| Foreign exchange (loss) gain | — | | | (1,771) | | | — | | | 3,091 | |
| Settlements/curtailments | — | | | (6,197) | | | — | | | (5,606) | |
| | | | | | | |
| Other | — | | | (56) | | | — | | | (100) | |
| Fair value of plan assets at December 31 | $ | 477,394 | | | $ | 62,318 | | | $ | 484,131 | | | $ | 65,514 | |
| | | | | | | |
| Funded status at December 31 | $ | (7,674) | | | $ | (115,635) | | | $ | (28,771) | | | $ | (130,404) | |
| | | | | | | | |
| Albemarle Corporation and Subsidiaries |
| NOTES TO THE CONSOLIDATED FINANCIAL STATEMENTS |
| | | | | | | | | | | | | | | | | | | | | | | |
| December 31, 2024 | | December 31, 2023 |
| U.S. Pension Plans | | Foreign Pension Plans | | U.S. Pension Plans | | Foreign Pension Plans |
| Amounts recognized in consolidated balance sheets: | | | | | | | |
| Current liabilities (accrued expenses) | $ | (928) | | | $ | (6,189) | | | $ | (912) | | | $ | (7,951) | |
| Noncurrent liabilities (pension benefits) | (6,746) | | | (109,446) | | | (27,859) | | | (122,453) | |
| Net pension liability | $ | (7,674) | | | $ | (115,635) | | | $ | (28,771) | | | $ | (130,404) | |
| Amounts recognized in accumulated other comprehensive loss: | | | | | | | |
| Prior service benefit | $ | — | | | $ | (441) | | | $ | — | | | $ | (531) | |
| Net amount recognized | $ | — | | | $ | (441) | | | $ | — | | | $ | (531) | |
| Weighted-average assumptions used to determine benefit obligations at December 31: | | | | | | | |
| Discount rate | 5.65 | % | | 4.04 | % | | 5.21 | % | | 3.73 | % |
| Rate of compensation increase | — | % | | 3.65 | % | | — | % | | 3.67 | % |
The accumulated benefit obligation for all defined benefit pension plans was $655.9 million and $700.4 million at December 31, 2024 and 2023, respectively.
Postretirement medical benefits and life insurance is provided for certain groups of U.S. retired employees. Medical and life insurance benefit costs have been funded principally on a pay-as-you-go basis. Although the availability of medical coverage after retirement varies for different groups of employees, the majority of employees who retire before becoming eligible for Medicare can continue group coverage by paying a portion of the cost of a monthly premium designed to cover the claims incurred by retired employees subject to a cap on payments allowed. The availability of group coverage for Medicare-eligible retirees also varies by employee group with coverage designed either to supplement or coordinate with Medicare. Retirees generally pay a portion of the cost of the coverage. Plan assets for retiree life insurance are held under an insurance contract and are reserved for retiree life insurance benefits. In 2005, the postretirement medical benefit available to U.S. employees was changed to provide that employees who are under age 50 as of December 31, 2005 would no longer be eligible for a company-paid retiree medical premium subsidy. Employees who are of age 50 and above as of December 31, 2005 and who retire after January 1, 2006 will have their retiree medical premium subsidy capped. Effective January 1, 2008, our medical insurance for certain groups of U.S. retired employees is now insured through a medical carrier.
The following provides a reconciliation of benefit obligations, plan assets and funded status, as well as a summary of significant assumptions, for our postretirement benefit plans (in thousands): | | | | | | | | | | | |
| Year Ended December 31, |
| 2024 | | 2023 |
| Other Postretirement Benefits | | Other Postretirement Benefits |
| Change in benefit obligations: | | | |
| Benefit obligation at January 1 | $ | 28,889 | | | $ | 35,990 | |
| Service cost | 46 | | | 47 | |
| Interest cost | 1,441 | | | 1,873 | |
| Actuarial loss (gain) | 6,072 | | | (6,618) | |
| Benefits paid | (1,970) | | | (2,403) | |
| | | |
| | | |
| Benefit obligation at December 31 | $ | 34,478 | | | $ | 28,889 | |
| Change in plan assets: | | | |
| Fair value of plan assets at January 1 | $ | — | | | $ | — | |
| | | |
| Employer contributions | 1,970 | | | 2,403 | |
| Benefits paid | (1,970) | | | (2,403) | |
| | | |
| | | |
| Fair value of plan assets at December 31 | $ | — | | | $ | — | |
| Funded status at December 31 | $ | (34,478) | | | $ | (28,889) | |
| | | | | | | | |
| Albemarle Corporation and Subsidiaries |
| NOTES TO THE CONSOLIDATED FINANCIAL STATEMENTS |
| | | | | | | | | | | |
| December 31, |
| 2024 | | 2023 |
| Other Postretirement Benefits | | Other Postretirement Benefits |
| Amounts recognized in consolidated balance sheets: | | | |
| Current liabilities (accrued expenses) | $ | (2,548) | | | $ | (2,642) | |
| Noncurrent liabilities (postretirement benefits) | (31,930) | | | (26,247) | |
| Net postretirement liability | $ | (34,478) | | | $ | (28,889) | |
| | | |
| | | |
| | | |
| | | |
| Weighted-average assumptions used to determine benefit obligations at December 31: | | | |
| Discount rate | 5.67 | % | | 5.21 | % |
| Rate of compensation increase | 3.50 | % | | — | % |
The components of pension benefits cost (credit) are as follows (in thousands): | | | | | | | | | | | | | | | | | | | | | | | | | | | | | | | | | | | |
| Year Ended | | Year Ended | | Year Ended |
| December 31, 2024 | | December 31, 2023 | | December 31, 2022 |
| U.S. Pension Plans | | Foreign Pension Plans | | U.S. Pension Plans | | Foreign Pension Plans | | U.S. Pension Plans | | Foreign Pension Plans |
| Service cost | $ | 545 | | | $ | 5,391 | | | $ | 499 | | | $ | 5,686 | | | $ | 904 | | | $ | 3,700 | |
| Interest cost | 25,580 | | | 7,204 | | | 26,924 | | | 7,153 | | | 18,827 | | | 3,363 | |
| Expected return on assets | (31,862) | | | (3,867) | | | (30,875) | | | (2,872) | | | (40,288) | | | (3,252) | |
| Actuarial (gain) loss | (13,530) | | | (2,569) | | | (11,951) | | | 8,593 | | | (8,008) | | | (18,818) | |
| Amortization of prior service benefit | — | | | 79 | | | — | | | 81 | | | — | | | 89 | |
| Total net pension benefits (credit) cost | $ | (19,267) | | | $ | 6,238 | | | $ | (15,403) | | | $ | 18,641 | | | $ | (28,565) | | | $ | (14,918) | |
| Weighted-average assumption percentages: | | | | | | | | | | | |
| Discount rate | 5.21 | % | | 3.73 | % | | 5.46 | % | | 4.04 | % | | 2.86 | % | | 1.44 | % |
| Expected return on plan assets | 6.88 | % | | 5.95 | % | | 6.88 | % | | 4.86 | % | | 6.89 | % | | 3.85 | % |
| Rate of compensation increase | — | % | | 3.67 | % | | — | % | | 3.67 | % | | — | % | | 3.12 | % |
Effective January 1, 2025, the weighted-average expected rate of return on plan assets for the U.S. and foreign defined benefit pension plans is 6.70% and 6.52%, respectively.
The components of postretirement benefits cost (credit) are as follows (in thousands): | | | | | | | | | | | | | | | | | |
| Year Ended December 31, |
| 2024 | | 2023 | | 2022 |
| Other Postretirement Benefits | | Other Postretirement Benefits | | Other Postretirement Benefits |
| Service cost | $ | 46 | | | $ | 47 | | | $ | 85 | |
| Interest cost | 1,441 | | | 1,873 | | | 1,307 | |
| | | | | |
| Actuarial loss (gain) | 6,268 | | | (6,816) | | | (10,163) | |
| | | | | |
| | | | | |
| Total net postretirement benefits credit | $ | 7,755 | | | $ | (4,896) | | | $ | (8,771) | |
| Weighted-average assumption percentages: | | | | | |
| Discount rate | 5.21 | % | | 5.45 | % | | 2.85 | % |
| | | | | |
| | | | | |
All components of net benefit cost (credit), other than service cost, are included in Other income, net on the consolidated statements of (loss) income.
The mark-to-market actuarial gain in 2024 was primarily attributable to an increase in the weighted-average discount rate to 5.65% from 5.21% for our U.S. pension plans and to 4.04% from 3.73% for our foreign pension plans to reflect market
| | | | | | | | |
| Albemarle Corporation and Subsidiaries |
| NOTES TO THE CONSOLIDATED FINANCIAL STATEMENTS |
conditions as of the December 31, 2024 measurement date. This was partially offset by a lower return on pension plan assets during the year than was expected, as a result of overall market and investment portfolio performance. The weighted-average actual return on our U.S. and foreign pension plan assets was 5.89% versus an expected return of 6.77%.
The mark-to-market actuarial gain in 2023 was primarily attributable to a higher return on pension plan assets during the year than was expected, as a result of overall market and investment portfolio performance. The weighted-average actual return on our U.S. and foreign pension plan assets was 11.21% versus an expected return of 6.66%. This was partially offset by a decrease in the weighted-average discount rate to 5.21% from 5.46% for our U.S. pension plans and to 3.73% from 4.04% for our foreign pension plans to reflect market conditions as of the December 31, 2023 measurement date.
The mark-to-market actuarial gain in 2022 was primarily attributable to a significant increase in the weighted-average discount rate to 5.46% from 2.86% for our U.S. pension plans and to 4.04% from 1.44% for our foreign pension plans to reflect market conditions as of the December 31, 2022 measurement date. This was partially offset by a lower return on pension plan assets in 2022 than was expected, as a result of overall market and investment portfolio performance. The weighted-average actual return on our U.S. and foreign pension plan assets was (17.94)% versus an expected return of 6.48%.
Fair value is defined as the price that would be received to sell an asset or paid to transfer a liability in an orderly transaction between market participants at the measurement date (exit price). The inputs used to measure fair value are classified into the following hierarchy: | | | | | |
| Level 1 | Unadjusted quoted prices in active markets for identical assets or liabilities |
| |
| Level 2 | Unadjusted quoted prices in active markets for similar assets or liabilities, or unadjusted quoted prices for identical or similar assets or liabilities in markets that are not active, or inputs other than quoted prices that are observable for the asset or liability |
| |
| Level 3 | Unobservable inputs for the asset or liability |
We endeavor to utilize the best available information in measuring fair value. Financial assets and liabilities are classified in their entirety based on the lowest level of input that is significant to the fair value measurement. Investments for which market quotations are readily available are valued at the closing price on the last business day of the year. Listed securities for which no sale was reported on such date are valued at the mean between the last reported bid and asked price. Securities traded in the over-the-counter market are valued at the closing price on the last business day of the year or at bid price. The net asset value of shares or units is based on the quoted market value of the underlying assets. The market value of corporate bonds is based on institutional trading lots and is most often reflective of bid price. Government securities are valued at the mean between bid and ask prices. Holdings in private equity securities are typically valued using the net asset valuations provided by the underlying private investment companies.
The following tables set forth the assets of our pension and postretirement plans that were accounted for at fair value on a recurring basis as of December 31, 2024 and 2023 (in thousands): | | | | | | | | | | | | | | | | | | | | | | | |
| December 31, 2024 | | Quoted Prices in Active Markets for Identical Items (Level 1) | | Quoted Prices in Active Markets for Similar Items (Level 2) | | Unobservable Inputs (Level 3) |
| Pension Assets: | | | | | | | |
Domestic Equity(a) | $ | 78,124 | | | $ | 78,124 | | | $ | — | | | $ | — | |
International Equity(b) | 78,124 | | | 69,471 | | | 8,653 | | | — | |
Fixed Income(c) | 318,036 | | | 286,549 | | | 31,487 | | | — | |
| | | | | | | |
Absolute Return Measured at Net Asset Value(d) | 56,888 | | | — | | | — | | | — | |
| Cash | 8,540 | | | 8,540 | | | — | | | — | |
| Total Pension Assets | $ | 539,712 | | | $ | 442,684 | | | $ | 40,140 | | | $ | — | |
| | | | | | | |
| | | | | | | |
| | | | | | | | |
| Albemarle Corporation and Subsidiaries |
| NOTES TO THE CONSOLIDATED FINANCIAL STATEMENTS |
| | | | | | | | | | | | | | | | | | | | | | | |
| December 31, 2023 | | Quoted Prices in Active Markets for Identical Items (Level 1) | | Quoted Prices in Active Markets for Similar Items (Level 2) | | Unobservable Inputs (Level 3) |
| Pension Assets: | | | | | | | |
Domestic Equity(a) | $ | 58,906 | | | $ | 58,906 | | | $ | — | | | $ | — | |
International Equity(b) | 106,491 | | | 99,432 | | | 7,059 | | | — | |
Fixed Income(c) | 294,140 | | | 257,299 | | | 36,841 | | | — | |
| | | | | | | |
Absolute Return Measured at Net Asset Value(d) | 80,542 | | | — | | | — | | | — | |
| Cash | 9,566 | | | 9,566 | | | — | | | — | |
| Total Pension Assets | $ | 549,645 | | | $ | 425,203 | | | $ | 43,900 | | | $ | — | |
| | | | | | | |
| | | | | | | |
(a)Consists primarily of U.S. stock funds that track or are actively managed and measured against the S&P 500 index.
(b)Consists primarily of international equity funds that invest in common stocks and other securities whose value is based on an international equity index or an underlying equity security or basket of equity securities.
(c)Consists primarily of debt obligations issued by governments, corporations, municipalities and other borrowers. Also includes insurance policies.
(d)Consists primarily of funds with holdings in private investment companies. See additional information about the Absolute Return investments below. Holdings in private investment companies are measured at fair value using the net asset value per share as a practical expedient and have not been categorized in the fair value hierarchy. Their fair values are included in this table to permit reconciliation to the reconciliation of plan assets table above.
The Company’s pension plan assets in the U.S. and U.K. represent approximately 96% of the total pension plan assets. The investment objective of these pension plan assets is to achieve solid returns while preserving capital to meet current plan cash flow requirements. Assets should participate in rising markets, with defensive action in declining markets expected to an even greater degree. Depending on market conditions, the broad asset class targets may range up or down by approximately 10%. These asset classes include but are not limited to hedge fund of funds, bonds and other fixed income vehicles, high yield fixed income securities, equities and distressed debt. At December 31, 2024 and 2023, equity securities held by our pension and OPEB plans did not include direct ownership of Albemarle common stock.
The weighted-average target allocations as of the measurement date are as follows: | | | | | |
| Target Allocation |
| Equity securities | 35 | % |
| Fixed income | 59 | % |
| Absolute return | 6 | % |
| |
Our Absolute Return investments consist primarily of our investments in hedge fund of funds. These are holdings in private investment companies with fair values that are based on significant unobservable inputs including assumptions where there is little, if any, market activity for the investment. Investment managers or fund managers associated with these investments provide valuations of the investments on a monthly basis utilizing the net asset valuation approach for determining fair values. These valuations are reviewed by the Company for reasonableness based on applicable sector, benchmark and company performance to validate the appropriateness of the net asset values as a fair value measurement. Where available, audited financial statements are obtained and reviewed for the investments as support for the manager’s investment valuation. In general, the investment objective of these funds is high risk-adjusted returns with an emphasis on preservation of capital. The investment strategies of each of the funds vary; however, the objective of our Absolute Return investments is complementary to the overall investment objective of our U.S. pension plan assets.
We made contributions to our defined benefit pension and OPEB plans of $19.4 million, $17.9 million and $16.1 million during the years ended December 31, 2024, 2023 and 2022, respectively. We expect contributions to our domestic nonqualified and foreign qualified and nonqualified pension plans to approximate $16.5 million in 2025. Also, we expect to pay approximately $2.5 million in premiums to our U.S. postretirement benefit plan in 2025. However, we may choose to make additional voluntary pension contributions in excess of these amounts.
| | | | | | | | |
| Albemarle Corporation and Subsidiaries |
| NOTES TO THE CONSOLIDATED FINANCIAL STATEMENTS |
The current forecast of benefit payments, which reflects expected future service, amounts to (in thousands): | | | | | | | | | | | | | | | | | |
| U.S. Pension Plans | | Foreign Pension Plans | | Other Postretirement Benefits |
| 2025 | $ | 44,303 | | | $ | 11,655 | | | $ | 2,548 | |
| 2026 | $ | 44,088 | | | $ | 10,983 | | | $ | 2,770 | |
| 2027 | $ | 43,703 | | | $ | 11,760 | | | $ | 2,830 | |
| 2028 | $ | 43,099 | | | $ | 11,928 | | | $ | 2,875 | |
| 2029 | $ | 42,079 | | | $ | 13,427 | | | $ | 2,902 | |
| 2030-2034 | $ | 193,724 | | | $ | 58,399 | | | $ | 14,284 | |
We have a supplemental executive retirement plan (“SERP”), which provides unfunded supplemental retirement benefits to certain management or highly compensated employees. The SERP provides for incremental pension benefits to offset the limitations imposed on qualified plan benefits by federal income tax regulations. Costs (credits) relating to our SERP were $0.7 million, $0.6 million and ($1.2) million for the years ended December 31, 2024, 2023 and 2022, respectively. The projected benefit obligation for the SERP recognized in the consolidated balance sheets at December 31, 2024 and 2023 was $5.9 million and $6.2 million, respectively. The benefit expenses and obligations of this SERP are included in the tables above. Benefits of $0.9 million are expected to be paid to SERP retirees in 2025. On October 1, 2012, our Board of Directors approved amendments to the SERP, such that effective December 31, 2014, no additional benefits shall accrue under this plan and participants’ accrued benefits shall be frozen as of that date to reflect the same changes as were made under the U.S. qualified defined benefit plan.
At December 31, 2024, the assumed rate of increase in the pre-65 and post-65 per capita cost of covered health care benefits for U.S. retirees was zero as the employer-paid premium caps (pre-65 and post-65) were met starting January 1, 2013.
Defined Contribution Plans
On March 31, 2004, a new defined contribution pension plan benefit was adopted under the qualified defined contribution plan for U.S. non-represented employees hired after March 31, 2004. On October 1, 2012, our Board of Directors approved certain plan amendments, such that effective January 1, 2013, the defined contribution pension plan benefit is expanded to include non-represented employees hired prior to March 31, 2004, and revised the contribution for all participants to be based on 5% of eligible employee compensation. The employer portion of contributions to our U.S. defined contribution pension plan amounted to $18.3 million, $17.8 million, and $12.1 million in 2024, 2023 and 2022, respectively.
Certain of our employees participate in our defined contribution 401(k) employee savings plan, which is generally available to all U.S. full-time salaried and non-union hourly employees and to employees who are covered by a collective bargaining agreement that provides for such participation. This U.S. defined contribution plan is funded with contributions made by the participants and us. Our contributions to the 401(k) plan amounted to $20.4 million, $18.4 million and $12.7 million in 2024, 2023 and 2022, respectively.
| | | | | | | | |
| Albemarle Corporation and Subsidiaries |
| NOTES TO THE CONSOLIDATED FINANCIAL STATEMENTS |
NOTE 14—Other Noncurrent Liabilities:
Other noncurrent liabilities consist of the following at December 31, 2024 and 2023 (in thousands): | | | | | | | | | | | |
| December 31, |
| 2024 | | 2023 |
Transition tax on foreign earnings(a) | $ | 44,647 | | | $ | 127,339 | |
| | | |
Operating leases(b) | 99,514 | | | 113,681 | |
Liabilities related to uncertain tax positions(c) | 259,586 | | | 220,555 | |
| Executive deferred compensation plan obligation | 38,243 | | | 33,564 | |
| | | |
Environmental liabilities(d) | 15,783 | | | 23,224 | |
Asset retirement obligations(d) | 94,854 | | | 88,703 | |
Tax indemnification liability(e) | 12,567 | | | 14,481 | |
| Deferred revenue | 78,027 | | | 78,027 | |
Capital expenditure incentive payables(f) | 74,506 | | | 14,264 | |
Other(g) | 101,477 | | | 55,262 | |
| Total | $ | 819,204 | | | $ | 769,100 | |
(a)Noncurrent portion of one-time transition tax on foreign earnings. See Note 20, “Income Taxes,” for additional information.
(b)See Note 18, “Leases.”
(c)See Note 20, “Income Taxes.”
(d)See Note 15, “Commitments and Contingencies.”
(e)Indemnification of certain income and non-income tax liabilities, primarily associated with the Chemetall Surface Treatment entities sold in 2017.
(f)When constructing new facilities or making major enhancements to existing facilities, we may have the opportunity to enter into incentive agreements with local government agencies in order to reduce certain state and local tax expenditures. Under these agreements, we transfer the related assets to various local government entities and receive bonds. We immediately lease the facilities from the local government entities and have an option to repurchase the facilities for a nominal amount upon tendering the bonds to the local government entities at various predetermined dates. The bonds and the associated obligations for the leases of the facilities offset values, and the underlying assets are recorded in property, plant and equipment.
(g)No individual component exceeds 5% of total liabilities.
NOTE 15—Commitments and Contingencies:
In the ordinary course of business, we have commitments in connection with various activities. We believe that amounts recorded are adequate for known items which might become due in the current year. The most significant commitments are as follows:
Environmental
We had the following activity in our recorded environmental liabilities for the years ended December 31, 2024, 2023 and 2022 (in thousands):
| | | | | | | | | | | | | | | | | |
| Year Ended December 31, |
| 2024 | | 2023 | | 2022 |
| Balance, beginning of year | $ | 34,149 | | | $ | 38,245 | | | $ | 46,617 | |
| Expenditures | (4,159) | | | (3,393) | | | (10,378) | |
| | | | | |
| | | | | |
| Accretion of discount | 1,126 | | | 1,094 | | | 1,031 | |
| Additions, liability releases and changes in estimates, net | (11,304) | | | (2,541) | | | 673 | |
| | | | | |
| Foreign currency translation adjustments and other | 211 | | | 744 | | | 302 | |
| Balance, end of year | 20,023 | | | 34,149 | | | 38,245 | |
| Less amounts reported in Accrued expenses | 4,240 | | | 10,925 | | | 6,973 | |
| Amounts reported in Other noncurrent liabilities | $ | 15,783 | | | $ | 23,224 | | | $ | 31,272 | |
Environmental remediation liabilities included discounted liabilities of $16.8 million and $27.4 million at December 31, 2024 and 2023, respectively, discounted at rates with a weighted-average of 4.0% and 3.7%, respectively, with the undiscounted amount totaling $34.5 million and $55.4 million at December 31, 2024 and 2023, respectively. For certain
| | | | | | | | |
| Albemarle Corporation and Subsidiaries |
| NOTES TO THE CONSOLIDATED FINANCIAL STATEMENTS |
locations where the Company is operating groundwater monitoring and/or remediation systems, prior owners or insurers have assumed all or most of the responsibility.
The amounts recorded represent our future remediation and other anticipated environmental liabilities. These liabilities typically arise during the normal course of our operational and environmental management activities or at the time of acquisition of the site, and are based on internal analysis as well as input from outside consultants. As evaluations proceed at each relevant site, changes in risk assessment practices, remediation techniques and regulatory requirements can occur, therefore such liability estimates may be adjusted accordingly. The timing and duration of remediation activities at these sites will be determined when evaluations are completed. Although it is difficult to quantify the potential financial impact of these remediation liabilities, management estimates (based on the latest available information) that there is a reasonable possibility that future environmental remediation costs associated with our past operations could represent an additional $42 million before income taxes, in excess of amounts already recorded.
We believe that any sum we may be required to pay in connection with environmental remediation matters in excess of the amounts recorded would likely occur over a period of time and would likely not have a material adverse effect upon our results of operations, financial condition or cash flows on a consolidated annual basis although any such sum could have a material adverse impact on our results of operations, financial condition or cash flows in a particular quarterly reporting period.
Asset Retirement Obligations
The following is a reconciliation of our beginning and ending asset retirement obligation balances for 2024 and 2023 (in thousands): | | | | | | | | | | | |
| Year Ended December 31, |
| 2024 | | 2023 |
| Balance, beginning of year | $ | 89,159 | | | $ | 80,101 | |
| | | |
| Additions and changes in estimates | 6,608 | | | 11,288 | |
| Accretion of discount | 3,365 | | | 2,421 | |
| Liabilities settled | (2,653) | | | (3,044) | |
| | | |
| Foreign currency translation adjustments and other | (90) | | | (1,607) | |
| Balance, end of year | $ | 96,389 | | | $ | 89,159 | |
| Less amounts reported in Accrued expenses | 1,535 | | | 456 | |
| Amounts reported in Other noncurrent liabilities | $ | 94,854 | | | $ | 88,703 | |
Asset retirement obligations primarily relate to post-closure reclamation of brine wells and sites involved in the surface mining and manufacturing of lithium. We are not aware of any conditional asset retirement obligations that would require recognition in our consolidated financial statements.
Litigation
We are involved from time to time in legal proceedings of types regarded as common in our business, including administrative or judicial proceedings seeking remediation under environmental laws, such as the federal Comprehensive Environmental Response, Compensation and Liability Act, commonly known as CERCLA or Superfund, products liability, breach of contract liability and premises liability litigation. Where appropriate, we may establish financial reserves for such proceedings. We also maintain insurance to mitigate certain of such risks. Costs for legal services are generally expensed as incurred.
As first reported in 2018, following receipt of information regarding potential improper payments being made by third-party sales representatives of our Refining Solutions business, within what is now the Ketjen segment, we investigated and voluntarily self-reported potential violations of the U.S. Foreign Corrupt Practices Act to the U.S. Department of Justice (“DOJ”) and the SEC, and also reported this conduct to the Dutch Public Prosecutor (“DPP”). We cooperated with these agencies in their investigations of this historical conduct and implemented appropriate remedial measures intended to strengthen our compliance program and related internal controls.
In September 2023, the Company finalized agreements to resolve these matters with the DOJ and SEC. The DPP has confirmed it will not pursue action in this matter. In connection with this resolution, which relates to conduct prior to 2018, we entered into a non-prosecution agreement with the DOJ and an administrative resolution with the SEC, pursuant to which we paid a total of $218.5 million in aggregate fines, disgorgement, and prejudgment interest to the DOJ and SEC. The resolution
| | | | | | | | |
| Albemarle Corporation and Subsidiaries |
| NOTES TO THE CONSOLIDATED FINANCIAL STATEMENTS |
does not include a compliance monitorship, although the Company has agreed to certain ongoing compliance reporting obligations.
During the year ended December 31, 2023, the Company recorded a charge of $218.5 million in Selling, General and Administrative Expenses in its consolidated statement of operations and accrued a corresponding liability on its consolidated balance sheet for these agreements. The agreed upon amounts were paid to the DOJ and SEC in October 2023, with this matter considered finalized and no future financial obligations expected.
Indemnities
We are indemnified by third parties in connection with certain matters related to acquired and divested businesses. Although we believe that the financial condition of those parties who may have indemnification obligations to the Company is generally sound, in the event the Company seeks indemnity under any of these agreements or through other means, there can be no assurance that any party who may have obligations to indemnify us will adhere to their obligations and we may have to resort to legal action to enforce our rights under the indemnities.
The Company may be subject to indemnity claims relating to properties or businesses it divested, including properties or businesses of acquired businesses that were divested prior to the completion of the acquisition. In the opinion of management, and based upon information currently available, the ultimate resolution of any indemnification obligations owed to the Company or by the Company is not expected to have a material effect on the Company’s financial condition, results of operations or cash flows. The Company had approximately $12.6 million and $14.5 million at December 31, 2024 and 2023, respectively, recorded in Other noncurrent liabilities primarily related to the indemnification of certain income and non-income tax liabilities associated with the Chemetall Surface Treatment entities sold in 2017.
Other
The Company has standby letters of credit and guarantees with various financial institutions. The following table summarizes our letters of credit and guarantee agreements (in thousands):
| | | | | | | | | | | | | | | | | | | | | | | | | | | | | | | | | | | |
| 2025 | | 2026 | | 2027 | | 2028 | | 2029 | | Thereafter |
| Letters of credit and other guarantees | $ | 101,662 | | | $ | 5,369 | | | $ | 2,667 | | | $ | 656 | | | $ | — | | | $ | 5,310 | |
The outstanding letters of credit are primarily related to insurance claim payment guarantees. The majority of the Company’s other guarantees have terms of one year and mainly consist of performance and environmental guarantees, as well as guarantees to customs and port authorities. The guarantees arose during the ordinary course of business.
We do not have recorded reserves for the letters of credit and guarantees as of December 31, 2024. We are unable to estimate the maximum amount of the potential future liability under guarantees and letters of credit. However, we accrue for any potential loss for which we believe a future payment is probable and a range of loss can be reasonably estimated. We believe our liability under such obligations is immaterial.
We currently, and are from time to time, subject to transactional audits in various taxing jurisdictions and to customs audits globally. We do not expect the financial impact of any of these audits to have a material adverse effect on the Company’s results of operations, financial condition or cash flows.
NOTE 16—Equity:
Common Stock
On May 9, 2024, the Company filed to amend the Company’s Amended and Restated Articles of Incorporation (the “Charter”) to increase the number of authorized shares of common stock, $0.01 par value per share, from 150,000,000 to 275,000,000 (the “Charter Amendment”). The Charter Amendment became effective May 10, 2024.
Mandatory Convertible Preferred Stock
On March 8, 2024, the Company issued 46,000,000 depositary shares (“Depositary Shares”), each representing a 1/20th interest in a share of Series A Mandatory Convertible Preferred Stock (“Mandatory Convertible Preferred Stock”). The 2,300,000 shares of Mandatory Convertible Preferred Stock issued has a $1,000 per share liquidation preference. As a result of this transaction, the Company received cash proceeds of approximately $2.2 billion, net of underwriting fees and offering costs. The Company intends to use the proceeds for general corporate purposes, which may include, among other uses, funding capital expenditures, following the repayment of commercial paper with a portion of the proceeds in the first quarter of 2024.
| | | | | | | | |
| Albemarle Corporation and Subsidiaries |
| NOTES TO THE CONSOLIDATED FINANCIAL STATEMENTS |
Dividends on the Mandatory Convertible Preferred Stock are payable on a cumulative basis when, as and if declared by the Albemarle board of directors, or an authorized committee thereof, at an annual rate of 7.25% on the liquidation preference of $1,000 per share, and may be paid in cash or, subject to certain limitations, in shares of common stock or, subject to certain limitations, any combination of cash and shares of common stock. Dividends that are declared on the Mandatory Convertible Preferred Stock will be payable quarterly to the holders of record on February 15, May 15, August 15 and November 15 of each year, immediately preceding the relevant dividend payment date, whether or not such holders convert their Depositary Shares, or such Depositary Shares are automatically converted, after a record date and on or prior to the immediately succeeding dividend payment date. Dividends of $17.12 per share of Mandatory Convertible Preferred Stock were paid in June 2024 and dividends of $18.125 per share of Mandatory Convertible Preferred Stock were paid in September and December 2024. Subsequent quarterly cash dividends are expected to be $18.125 per share of Mandatory Convertible Preferred Stock. Dividends are expected to be paid on March 1, June 1, September 1 and December 1 of each year ending on, and including, March 1, 2027.
The Company may not redeem the shares of the Mandatory Convertible Preferred Stock. However, at its option, the Company may purchase the Mandatory Convertible Preferred Stock from time to time on the open market, by tender offer, exchange offer or otherwise.
Unless converted earlier in accordance with its terms, each share of Mandatory Convertible Preferred Stock will automatically convert on the mandatory conversion date, which is expected to be March 1, 2027, into between 7.618 shares and 9.140 shares of common stock, in each case, subject to customary anti-dilution adjustments described in the certificate of designations related to the Mandatory Convertible Preferred Stock (the “Certificate of Designations”). The number of shares of common stock issuable upon conversion will be determined based on the average volume weighted average price per share of common stock over the 20 consecutive trading day period beginning on, and including, the 21st scheduled trading day immediately prior to March 1, 2027.
Holders of shares of Mandatory Convertible Preferred Stock have the option to convert all or any portion of their shares of the Mandatory Convertible Preferred Stock at any time. The conversion rate applicable to any early conversion may in certain circumstances be increased to compensate holders of the Mandatory Convertible Preferred Stock for certain unpaid accumulated dividends in the Certificate of Designations.
If a Fundamental Change, as defined in the Certificate of Designations, occurs on or prior to March 1, 2027, then holders of the Mandatory Convertible Preferred Stock will be entitled to convert all or any portion of their Mandatory Convertible Preferred Stock at the fundamental change conversion rate, as defined in the Certificate of Designations, as for a specified period of time and to also receive an amount to compensate them for certain unpaid accumulated dividends and any remaining future scheduled dividend payments.
There were 2,300,000 shares of Mandatory Convertible Preferred Stock issued and outstanding at December 31, 2024.
| | | | | | | | |
| Albemarle Corporation and Subsidiaries |
| NOTES TO THE CONSOLIDATED FINANCIAL STATEMENTS |
Accumulated Other Comprehensive Loss
The components and activity in Accumulated other comprehensive loss (net of deferred income taxes) consisted of the following during the years ended December 31, 2024, 2023 and 2022 (in thousands):
| | | | | | | | | | | | | | | | | | | | | | | |
| Foreign Currency Translation and Other | | Cash Flow Hedge(a) | | Interest Rate Swap(b) | | Total |
| Balance at December 31, 2021 | $ | (391,674) | | | $ | 6,623 | | | $ | (7,399) | | | $ | (392,450) | |
| Other comprehensive loss before reclassifications | (171,367) | | | (4,399) | | | — | | | (175,766) | |
| Amounts reclassified from accumulated other comprehensive loss | 72 | | | — | | | 7,399 | | | 7,471 | |
| Other comprehensive (loss) income, net of tax | (171,295) | | | (4,399) | | | 7,399 | | | (168,295) | |
| Other comprehensive loss attributable to noncontrolling interests | 83 | | | — | | | — | | | 83 | |
| Balance at December 31, 2022 | $ | (562,886) | | | $ | 2,224 | | | $ | — | | | $ | (560,662) | |
| Other comprehensive income before reclassifications | 26,337 | | | 5,986 | | | — | | | 32,323 | |
| Amounts reclassified from accumulated other comprehensive loss | 66 | | | (135) | | | — | | | (69) | |
| Other comprehensive income, net of tax | 26,403 | | | 5,851 | | | — | | | 32,254 | |
| Other comprehensive income attributable to noncontrolling interests | (118) | | | — | | | — | | | (118) | |
| Balance at December 31, 2023 | $ | (536,601) | | | $ | 8,075 | | | $ | — | | | $ | (528,526) | |
| Other comprehensive loss before reclassifications | (210,611) | | | (28,701) | | | — | | | (239,312) | |
| Amounts reclassified from accumulated other comprehensive loss | 77 | | | 25,766 | | | — | | | 25,843 | |
| Other comprehensive loss, net of tax | (210,534) | | | (2,935) | | | — | | | (213,469) | |
| Other comprehensive income attributable to noncontrolling interests | (67) | | | — | | | — | | | (67) | |
| Balance at December 31, 2024 | $ | (747,202) | | | $ | 5,140 | | | $ | — | | | $ | (742,062) | |
(a) We previously entered into a foreign currency forward contract, which was designated and accounted for as a cash flow hedge under ASC 815, Derivatives and Hedging. During the year ended December 31, 2024, the Company dedesignated the remaining foreign currency forward contracts accounted for as cash flow hedges. The related loss was reclassified to Other income, net during the year ended December 31, 2024. The balance of the settled hedged foreign currency forward contracts will be reclassified to earnings over the life of the related assets. See Note 17, “Restructuring Charges and Asset Write-offs,” and Note 22, “Fair Value of Financial Instruments,” for additional information.
(b) The pre-tax portion of the amount reclassified from accumulated other comprehensive loss is included in interest expense. The balance of this interest rate swap was being amortized to Interest and financing expenses over the life of the 4.15% senior notes originally due in 2024. As discussed in Note 12, “Long-term Debt,” the Company repaid these notes in the second quarter of 2022, and as a result, reclassified the remaining balance of this interest rate swap to interest expense during the same period as part of the early extinguishment of debt.
| | | | | | | | |
| Albemarle Corporation and Subsidiaries |
| NOTES TO THE CONSOLIDATED FINANCIAL STATEMENTS |
The amount of income tax (expense) benefit allocated to each component of Other comprehensive (loss) income for the years ended December 31, 2024, 2023 and 2022 is provided in the following tables (in thousands):
| | | | | | | | | | | | | | | | | | | | | | | |
| Foreign Currency Translation and Other | | Cash Flow Hedge | | Interest Rate Swap | | Total |
| 2024 | | | | | | | |
| Other comprehensive loss, before tax | $ | (210,522) | | | $ | (2,935) | | | $ | — | | | $ | (213,457) | |
| Income tax expense | (12) | | | — | | | — | | | (12) | |
| Other comprehensive loss, net of tax | $ | (210,534) | | | $ | (2,935) | | | $ | — | | | $ | (213,469) | |
| | | | | | | |
| 2023 | | | | | | | |
| Other comprehensive income, before tax | $ | 23,964 | | | $ | 8,358 | | | $ | — | | | $ | 32,322 | |
| Income tax benefit (expense) | 2,439 | | | (2,507) | | | — | | | (68) | |
| Other comprehensive income, net of tax | $ | 26,403 | | | $ | 5,851 | | | $ | — | | | $ | 32,254 | |
| | | | | | | |
| 2022 | | | | | | | |
| Other comprehensive (loss) income, before tax | $ | (168,953) | | | $ | (4,399) | | | $ | 9,739 | | | $ | (163,613) | |
| Income tax expense | (2,342) | | | — | | | (2,340) | | | (4,682) | |
| Other comprehensive (loss) income, net of tax | $ | (171,295) | | | $ | (4,399) | | | $ | 7,399 | | | $ | (168,295) | |
NOTE 17—Restructuring Charges and Asset Write-offs:
Second Half 2024 Restructuring
In July 2024, the Company announced a comprehensive review of its cost and operating structure to proactively respond to ongoing industry headwinds, particularly in the lithium value chain, and to maintain a competitive position. As part of this review, the Company made the decision to stop construction of Kemerton conversion plant Train 3 in Western Australia and to put Kemerton Train 2 into care and maintenance as the Company determined the current lithium price environment makes it less economical to expand conversion in Australia. Kemerton Train 1 will continue to operate and activity around it is currently focused on commercialization efforts.
The Company’s actions regarding Kemerton are part of a broader effort focused on preserving its world-class resource advantages, optimizing its global conversion network, improving the Company’s cost competitiveness and efficiency by lowering operating costs, reducing capital intensity and enhancing the Company’s financial flexibility. As part of this effort, effective November 1, 2024, the Company transitioned its operating structure to a fully integrated functional model (excluding Ketjen) from a global business unit model. As a result, the Company implemented a global workforce reduction that impacted 6-7% of total headcount during the second half of 2024.
As a result of the above actions, the Company recorded charges in Cost of goods sold and Restructuring charges and asset write-offs for the year ended December 31, 2024 of $16.5 million and $762.6 million, respectively, consisting of the write-off of the carrying value of the Kemerton Train 3 assets less any salvage value, contract cancellation costs, decommissioning, demolition and other associated restructuring costs for both Kemerton Trains 2 and 3. The Company also recorded a loss of $20.7 million in Other income, net for the year ended December 31, 2024 related to the reclassification of the related dedesignated cash flow hedge from Accumulated other comprehensive loss. In addition, the Company recorded severance and employee benefit charges related to the above actions of $3.8 million and $47.5 million in Cost of goods sold and Restructuring charges and asset writeoffs, respectively, for the year ended December 31, 2024.
The Company expects to record additional restructuring costs related to the Second Half 2024 Restructuring in the range of $35 million to $45 million in the year ended December 31, 2025, when the Company expects the actions to be substantially completed.
First Half 2024 Restructuring
In January 2024, the Company announced measures to unlock near-term cash flow and generate long-term financial flexibility by re-phasing organic growth investments and optimizing its cost structure. As part of these measures, during the second quarter of 2024, the Company indefinitely suspended construction of Kemerton Train 4, as well as deferred spending
| | | | | | | | |
| Albemarle Corporation and Subsidiaries |
| NOTES TO THE CONSOLIDATED FINANCIAL STATEMENTS |
and investments with respect to certain other capital projects. The Company wrote-off the book value of assets related to these capital projects, which are no longer part of the Company’s modified capital plan, as it determined that these assets will not provide future value or will require significant re-engineering if the related projects are restarted, as well as recorded losses for associated contract cancellation costs. In addition, the Company recorded severance costs for employees in Corporate and each of the businesses as part of these announced measures. These actions resulted in charges of $324.3 million recorded in Restructuring charges and asset write-offs for the year ended December 31, 2024 and a loss of $5.4 million recorded in Other income, net for the year ended December 31, 2024 related to the reclassification of the related dedesignated cash flow hedge from Accumulated other comprehensive loss. No further costs associated with the First Half 2024 Restructuring are expected to be recorded as this restructuring plan was completed in the first half of 2024.
2023 Restructuring
During the year ended December 31, 2023, $9.5 million of separation and other severance costs to employees in Corporate and the Ketjen business were recorded in Restructuring charges and asset write-offs.
Detail of Restructuring Charges and Reserves
The following table provides details of our restructuring related charges for the year ended December 31, 2024, which represent the cumulative amounts incurred to date for these plans (in thousands):
| | | | | | | | | | | | | | | | | | | | | | | | | | | | | |
| Year Ended December 31, 2024 |
| Asset Write-offs(a) | | Severance and Employee Benefits(b) | | Contract Cancellation Costs(c) | | Other(d) | | Total |
First Half 2024 Restructuring(e) | $ | 280,596 | | | $ | 18,856 | | | $ | 24,887 | | | $ | 5,374 | | | $ | 329,713 | |
Second Half 2024 Restructuring(e) | 732,907 | | | 51,264 | | | 37,370 | | | 29,552 | | | 851,093 | |
| $ | 1,013,503 | | | $ | 70,120 | | | $ | 62,257 | | | $ | 34,926 | | | $ | 1,180,806 | |
(a) Asset write-offs include $16.5 million recorded in Cost of goods sold, primarily related to work in process inventory with no future value as a result of the decomissioning of Kemerton Train 2 that was placed into care and maintenance. The remainder of the asset write-offs primarily relate to property, plant and equipment of the in-construction Kemerton Trains 3 and 4, and Kemerton Train 2 that was placed into care and maintenance. All asset write-off charges not related to inventories were recorded in Restructuring charges and asset write-offs.
(b) Severance and employee benefit charges include $3.8 million recorded in Cost of goods sold. All other severance and employee benefit charges for global employees terminated during the various restructuring programs were recorded in Restructuring charges and asset write-offs.
(c) Includes cancellation fees for contractors and required payments under take or pay contracts. All contract cancellation costs were recorded in Restructuring charges and asset write-offs.
(d) Other includes costs to put Kemerton Train 2 into care and maintenance and similar restructuring costs, and are recorded in Restructuring charges and asset write-offs. In addition, Other also includes the reclassification of the related dedesignated cash flow hedge from Accumulated other comprehensive loss. $20.7 million recorded in Other income, net for the year ended December 31, 2024 related to the Second Half 2024 Restructuring and $5.4 million recorded in Other income, net for the year ended December 31, 2024 related to the First Half 2024 Restructuring.
(e) Severance and employee benefits related to Corporate and all segments. All other restructuring costs were primarily recorded in the Energy Storage segment.
Restructuring charges related to severance and employee benefits of $9.5 million for the year ended December 31, 2023 were recorded in Restructuring charges and asset write-offs and are reported in Corporate and the Ketjen segment. As of December 31, 2023, there was a liability of $3.3 million related to these severance costs, which was paid during the year ended December 31, 2024.
| | | | | | | | |
| Albemarle Corporation and Subsidiaries |
| NOTES TO THE CONSOLIDATED FINANCIAL STATEMENTS |
The following tables summarize the changes in restructuring liabilities for the year ended December 31, 2024 (in thousands):
| | | | | | | | | | | | | | | | | | | | | | | | | | | | | |
| First Half 2024 Restructuring | Asset Write-offs | | Severance and Employee Benefits | | Contract Cancellation Costs | | Other | | Total |
| Beginning balance at December 31, 2023 | $ | — | | | $ | — | | | $ | — | | | $ | — | | | $ | — | |
| 2024 charges | 280,596 | | | 19,365 | | | 34,510 | | | 5,374 | | | 339,845 | |
Change in estimate(a) | — | | | (509) | | | (9,623) | | | — | | | (10,132) | |
| Cash payments | — | | | (18,883) | | | (22,120) | | | — | | | (41,003) | |
| Asset writedowns/hedge dedesignation | (280,596) | | | — | | | — | | | (5,374) | | | (285,970) | |
| Foreign currency translation adjustments | — | | | 27 | | | — | | | — | | | 27 | |
Ending balance at December 31, 2024(b)(c) | $ | — | | | $ | — | | | $ | 2,767 | | | $ | — | | | $ | 2,767 | |
| | | | | | | | | |
| Second Half 2024 Restructuring | Asset Write-offs | | Severance and Employee Benefits | | Contract Cancellation Costs | | Other | | Total |
| Beginning balance at December 31, 2023 | $ | — | | | $ | — | | | $ | — | | | $ | — | | | $ | — | |
| 2024 charges | 785,005 | | | 51,264 | | | 46,870 | | | 28,883 | | | 912,022 | |
Change in estimate(a) | (52,098) | | | — | | | (9,500) | | | 669 | | | (60,929) | |
| Cash payments | — | | | (35,010) | | | (4,891) | | | — | | | (39,901) | |
| Asset writedowns/hedge dedesignation | (732,907) | | | — | | | — | | | (20,741) | | | (753,648) | |
| Foreign currency translation adjustments | — | | | (387) | | | — | | | — | | | (387) | |
Ending balance at December 31, 2024(b)(c) | $ | — | | | $ | 15,867 | | | $ | 32,479 | | | $ | 8,811 | | | $ | 57,157 | |
(a) In the fourth quarter of 2024, the Company updated its estimates concerning the progress of construction activities, related contractual obligations and the estimated salvage value of Kemerton equipment, resulting in a favorable adjustment of asset write-offs. Additionally, the Company successfully negotiated revised contract cancellation costs with key suppliers to result in a favorable adjustment of the restructuring related charges.
(b) Approximately $47.5 million recorded in Accrued expenses and $12.4 million recorded in Other noncurrent liabilities on the consolidated balance sheets as of December 31, 2024.
(c) The majority of the remaining balances are expected to be paid in the next twelve months. Certain take or pay liabilities will be paid in line with the terms of the original contract through 2027.
NOTE 18—Leases:
We lease certain office space, buildings, transportation and equipment in various countries. The initial lease terms generally range from 1 to 30 years for real estate leases, and from 2 to 15 years for non-real estate leases. Leases with an initial term of 12 months or less are not recorded on the balance sheet, and we recognize lease expense for these leases on a straight-line basis over the lease term.
Many leases include options to terminate or renew, with renewal terms that can extend the lease term from 1 to 50 years or more. The exercise of lease renewal options is at our sole discretion. Certain leases also include options to purchase the leased property. The depreciable life of assets and leasehold improvements are limited by the expected lease term, unless there is a transfer of title or purchase option reasonably certain of exercise. Our lease agreements do not contain any material residual value guarantees or material restrictive covenants.
| | | | | | | | |
| Albemarle Corporation and Subsidiaries |
| NOTES TO THE CONSOLIDATED FINANCIAL STATEMENTS |
The following table provides details of our lease contracts for the years ended December 31, 2024, 2023 and 2022 (in thousands):
| | | | | | | | | | | | | | | | | |
| Year Ended December 31, |
| 2024 | | 2023 | | 2022 |
| Operating lease cost | $ | 37,331 | | | $ | 48,238 | | | $ | 43,809 | |
| Finance lease cost: | | | | | |
| Amortization of right of use assets | 7,270 | | | 5,302 | | | 3,377 | |
| Interest on lease liabilities | 6,435 | | | 5,070 | | | 3,504 | |
| Total finance lease cost | 13,705 | | | 10,372 | | | 6,881 | |
| | | | | |
| Short-term lease cost | 25,651 | | | 20,309 | | | 13,985 | |
| Variable lease cost | 34,741 | | | 25,075 | | | 8,064 | |
| | | | | |
| | | | | |
| Total lease cost | $ | 111,428 | | | $ | 103,994 | | | $ | 72,739 | |
Supplemental cash flow information related to our lease contracts for the years ended December 31, 2024, 2023 and 2022 is as follows (in thousands): | | | | | | | | | | | | | | | | | |
| Year Ended December 31, |
| 2024 | | 2023 | | 2022 |
| Cash paid for amounts included in the measurement of lease liabilities: | | | | | |
| Operating cash flows from operating leases | $ | 35,638 | | | $ | 49,261 | | | $ | 36,629 | |
| Operating cash flows from finance leases | 9,681 | | | 4,671 | | | 3,389 | |
| Financing cash flows from finance leases | 4,982 | | | 2,165 | | | 1,432 | |
| Right-of-use assets obtained in exchange for lease obligations: | | | | | |
| Operating leases | 25,605 | | | 48,655 | | | 15,913 | |
| Finance leases | 12,706 | | | 46,773 | | | 3,976 | |
Supplemental balance sheet information related to our lease contracts, including the location on balance sheet, at December 31, 2024 and 2023 is as follows (in thousands, except as noted): | | | | | | | | | | | |
| December 31, |
| 2024 | | 2023 |
| Operating leases: | | | |
| Other assets | $ | 118,839 | | | $ | 137,405 | |
| | | |
| Accrued expenses | 32,626 | | | 30,583 | |
| Other noncurrent liabilities | 99,514 | | | 113,681 | |
| Total operating lease liabilities | 132,140 | | | 144,264 | |
| Finance leases: | | | |
| Net property, plant and equipment | 117,038 | | | 112,438 | |
| | | |
| Current portion of long-term debt | 5,183 | | | 9,702 | |
| Long-term debt | 113,613 | | | 104,484 | |
| Total finance lease liabilities | 118,796 | | | 114,186 | |
| Weighted average remaining lease term (in years): | | | |
| Operating leases | 12.9 | | 12.2 |
| Finance leases | 20.4 | | 20.7 |
| Weighted average discount rate (%): | | | |
| Operating leases | 4.47 | % | | 4.74 | % |
| Finance leases | 5.55 | % | | 4.71 | % |
| | | | | | | | |
| Albemarle Corporation and Subsidiaries |
| NOTES TO THE CONSOLIDATED FINANCIAL STATEMENTS |
Maturities of lease liabilities as of December 31, 2024 were as follows (in thousands): | | | | | | | | | | | |
| Operating Leases | | Finance Leases |
| 2025 | $ | 32,911 | | | $ | 11,917 | |
| 2026 | 24,135 | | | 11,291 | |
| 2027 | 18,442 | | | 11,222 | |
| 2028 | 13,559 | | | 11,084 | |
| 2029 | 12,078 | | | 11,084 | |
| Thereafter | 92,976 | | | 133,917 | |
| Total lease payments | 194,101 | | | 190,515 | |
| Less imputed interest | 61,961 | | | 71,719 | |
| Total | $ | 132,140 | | | $ | 118,796 | |
NOTE 19—Stock-based Compensation Expense:
Incentive Plans
We have various share-based compensation plans that authorize the granting of (i) qualified and non-qualified stock options to purchase shares of our common stock, (ii) restricted stock and restricted stock units, (iii) performance unit awards and (iv) stock appreciation rights (“SARs”) to employees and non-employee directors, at our option. Stock options granted to employees generally vest over three years and have a term of ten years. Restricted stock and restricted stock unit awards vest in periods ranging from one to five years from the date of grant. Performance unit awards are earned at a level ranging from 0% to 200% contingent upon the achievement of specific performance criteria over periods ranging from one to three years. Distribution of earned units occurs generally 50% upon completion of the applicable measurement period with the remaining 50% distributed one year thereafter.
In May 2017, the Company adopted the Albemarle Corporation 2017 Incentive Plan (the “Incentive Plan”), which replaced the Albemarle Corporation 2008 Incentive Plan. The maximum number of shares available for issuance to participants under the Incentive Plan is 4,500,000 shares. The adoption of the Incentive Plan did not affect awards already granted under the Albemarle Corporation 2008 Incentive Plan. In February 2023, the Company adopted the Albemarle Corporation 2023 Stock Compensation and Deferral Election Plan for Non-Employee Directors (the “Non-Employee Directors Plan”). The Non-Employee Directors Plan replaced the 2013 Stock Compensation and Deferral Election Plan for Non-Employee Directors, which expired by its terms in May 2023. Under the Non-Employee Directors Plan, a maximum aggregate number of 500,000 shares of our common stock is authorized for issuance to the Company’s non-employee directors; any shares remaining available for issuance under the prior plans were canceled. The aggregate fair market value of shares that may be issued to a director during any compensation year (as defined in the Non-Employee Directors Plan, generally July 1 to June 30) shall not exceed $750,000. At December 31, 2024, there were 2,604,956 shares available for grant under the Incentive Plan and 477,440 shares available for grant under the Non-Employee Directors Plan.
Total stock-based compensation expense associated with our incentive plans for the years ended December 31, 2024, 2023 and 2022 amounted to $33.1 million, $39.0 million and $31.4 million, respectively, and is included in Cost of goods sold and Selling, general and administrative expenses in the consolidated statements of (loss) income. Total related recognized tax benefits for the years ended December 31, 2024, 2023 and 2022 amounted to $2.7 million, $4.6 million and $4.0 million, respectively.
| | | | | | | | |
| Albemarle Corporation and Subsidiaries |
| NOTES TO THE CONSOLIDATED FINANCIAL STATEMENTS |
The following table summarizes information about the Company’s fixed-price stock options as of and for the year ended December 31, 2024: | | | | | | | | | | | | | | | | | | | | | | | |
| Shares | | Weighted-Average Exercise Price | | Weighted-Average Remaining Contractual Term (Years) | | Aggregate Intrinsic Value
(in thousands) |
| Outstanding at December 31, 2023 | 427,144 | | | $ | 129.59 | | | 5.8 | | $ | 14,891 | |
| Granted | 165,350 | | | 118.18 | | | | | |
| Exercised | (6,570) | | | 57.02 | | | | | |
| Forfeited | (30,268) | | | 141.91 | | | | | |
| | | | | | | |
| Outstanding at December 31, 2024 | 555,656 | | | $ | 126.38 | | | 5.9 | | $ | 1,255 | |
| Exercisable at December 31, 2024 | 316,658 | | | $ | 101.73 | | | 3.9 | | $ | 1,255 | |
We granted 165,350, 51,316 and 57,348 stock options during 2024, 2023 and 2022, respectively. There were no significant modifications made to any share-based grants during these periods.
The fair value of each option granted during the years ended December 31, 2024, 2023 and 2022 was estimated on the date of grant using the Black-Scholes option-pricing model with the following weighted-average assumptions: | | | | | | | | | | | | | | | | | |
| Year Ended December 31, |
| 2024 | | 2023 | | 2022 |
| Dividend yield | 1.43 | % | | 1.26 | % | | 1.32 | % |
| Volatility | 42.44 | % | | 40.06 | % | | 36.21 | % |
| Average expected life (years) | 6 | | 6 | | 6 |
| Risk-free interest rate | 4.33 | % | | 3.95 | % | | 1.97 | % |
| Fair value of options granted | $ | 48.70 | | | $ | 98.66 | | | $ | 63.00 | |
Dividend yield is the average of historical yields and those estimated over the average expected life. The stock volatility is based on historical volatilities of our common stock. The average expected life represents the weighted average period of time that options granted are expected to be outstanding giving consideration to vesting schedules and our historical exercise patterns. The risk-free interest rate is based on the U.S. Treasury strip rate with stripped coupon interest for the period equal to the contractual term of the share option grant in effect at the time of grant.
The intrinsic value of options exercised during the years ended December 31, 2024, 2023 and 2022 was $0.3 million, $0.5 million and $6.9 million, respectively. The intrinsic value of a stock option is the amount by which the market value of the underlying stock exceeds the exercise price of the option.
Total compensation cost not yet recognized for nonvested stock options outstanding as of December 31, 2024 is approximately $5.7 million and is expected to be recognized over a remaining weighted-average period of 1.6 years. Cash proceeds from stock options exercised and tax benefits related to stock options exercised were $0.4 million and $0.1 million for the year ended December 31, 2024, respectively. The Company issues new shares of common stock upon exercise of stock options and vesting of restricted common stock awards.
The following table summarizes activity in performance unit awards as of and for the year ended December 31, 2024: | | | | | | | | | | | |
| Shares | | Weighted-Average Grant Date Fair Value Per Share |
| Nonvested, beginning of period | 223,856 | | | $ | 207.61 | |
| Granted | 168,374 | | | 129.41 | |
| Vested | (74,188) | | | 133.87 | |
| Forfeited | (41,014) | | | 181.28 | |
| Nonvested, end of period | 277,028 | | | 183.16 | |
| | | | | | | | |
| Albemarle Corporation and Subsidiaries |
| NOTES TO THE CONSOLIDATED FINANCIAL STATEMENTS |
The weighted average grant date fair value of performance unit awards granted in 2024, 2023 and 2022 was $21.8 million, $22.9 million and $13.1 million, respectively. For all periods presented, half of the performance unit awards granted were based on the targeted return on invested capital (“ROIC Award”), while the other half were granted based on targeted market conditions (“TSR Award”). The fair value of each TSR Award was estimated on the date of grant using the Monte Carlo simulation model as these equity awards are tied to a service and market condition. The calculation used the following weighted-average assumptions: | | | | | | | | | | | | | | | | | |
| Year Ended December 31, |
| 2024 | | 2023 | | 2022 |
| | | | | |
| Volatility | 49.11 | % | | 50.41 | % | | 51.51 | % |
| Risk-free interest rate | 4.41 | % | | 4.51 | % | | 1.72 | % |
The weighted average fair value of performance unit awards that vested during 2024, 2023 and 2022 was $9.5 million, $17.2 million and $11.9 million, respectively, based on the closing prices of our common stock on the dates of vesting. Total compensation cost not yet recognized for nonvested performance unit awards outstanding as of December 31, 2024 is approximately $15.8 million, calculated based on current expectation of specific performance criteria, and is expected to be recognized over a remaining weighted-average period of approximately 1.9 years. Each performance unit represents one share of common stock.
The following table summarizes activity in non-performance based restricted stock and restricted stock unit awards as of and for the year ended December 31, 2024: | | | | | | | | | | | |
| Shares | | Weighted-Average Grant Date Fair Value Per Share |
| Nonvested, beginning of period | 198,147 | | | $ | 190.40 | |
| Granted | 137,436 | | | 111.78 | |
| Vested | (88,032) | | | 163.53 | |
| Forfeited | (40,969) | | | 169.87 | |
| Nonvested, end of period | 206,582 | | | 152.75 | |
The weighted average grant date fair value of restricted stock and restricted stock unit awards granted in 2024, 2023 and 2022 was $15.4 million, $19.4 million and $15.4 million, respectively. The weighted average fair value of restricted stock and restricted stock unit awards that vested in 2024, 2023 and 2022 was $10.0 million, $38.8 million and $17.8 million, respectively, based on the closing prices of our common stock on the dates of vesting. Total compensation cost not yet recognized for nonvested, non-performance based restricted stock and restricted stock units as of December 31, 2024 is approximately $14.2 million and is expected to be recognized over a remaining weighted-average period of 1.5 years. The fair value of the non-performance based restricted stock and restricted stock units was estimated on the date of grant adjusted for a dividend factor, if necessary.
| | | | | | | | |
| Albemarle Corporation and Subsidiaries |
| NOTES TO THE CONSOLIDATED FINANCIAL STATEMENTS |
NOTE 20—Income Taxes:
Income before income taxes and equity in net income of unconsolidated investments, and current and deferred income tax expense (benefit) are composed of the following (in thousands): | | | | | | | | | | | | | | | | | |
| Year Ended December 31, |
| 2024 | | 2023 | | 2022 |
| Income before income taxes and equity in net income of unconsolidated investments: | | | | | |
| Domestic | $ | 201,266 | | | $ | (461,897) | | | $ | 952,799 | |
| Foreign | (1,965,091) | | | 708,635 | | | 1,480,645 | |
| Total | $ | (1,763,825) | | | $ | 246,738 | | | $ | 2,433,444 | |
| | | | | |
| Current income tax expense (benefit): | | | | | |
| Federal | $ | 212,542 | | | $ | (54,250) | | | $ | 33,230 | |
| State | (450) | | | (3,395) | | | 4,965 | |
| Foreign | 105,399 | | | 387,045 | | | 259,054 | |
| Total | $ | 317,491 | | | $ | 329,400 | | | $ | 297,249 | |
| | | | | |
| Deferred income tax expense (benefit): | | | | | |
| Federal | $ | (172,464) | | | $ | (8,545) | | | $ | 84,054 | |
| State | 1,523 | | | (4,154) | | | (3,511) | |
| Foreign | (59,465) | | | 113,576 | | | 12,796 | |
| Total | $ | (230,406) | | | $ | 100,877 | | | $ | 93,339 | |
| | | | | |
| Total income tax expense | $ | 87,085 | | | $ | 430,277 | | | $ | 390,588 | |
The reconciliation of the U.S. federal statutory rate to the effective income tax rate is as follows:
| | | | | | | | | | | | | | | | | |
| % of Income Before Income Taxes |
| 2024 | | 2023 | | 2022 |
| Federal statutory rate | 21.0 | % | | 21.0 | % | | 21.0 | % |
| State taxes, net of federal tax benefit | — | | | (2.8) | | | — | |
Change in valuation allowance(a) | (26.0) | | | 98.8 | | | (3.9) | |
Impact of foreign earnings, net(b) | 3.3 | | | 7.7 | | | (0.1) | |
| Global intangible low tax inclusion | — | | | 4.2 | | | 0.3 | |
| | | | | |
| | | | | |
| Foreign-derived intangible income | — | | | — | | | (3.0) | |
| Section 162(m) limitation | (0.3) | | | 4.4 | | | 0.3 | |
| Subpart F income | (0.3) | | | (1.9) | | | 0.2 | |
| | | | | |
| | | | | |
| Stock-based compensation | — | | | (3.9) | | | (0.3) | |
| | | | | |
| Depletion | 0.3 | | | (2.4) | | | (0.2) | |
| U.S. federal return to provision | 0.1 | | | (6.1) | | | (0.4) | |
Revaluation of unrecognized tax benefits/reserve requirements(c) | (2.1) | | | 39.1 | | | 2.3 | |
| | | | | |
| Legal accrual | — | | | 18.6 | | | — | |
| Other items, net | (0.9) | | | (2.3) | | | (0.1) | |
| Effective income tax rate | (4.9) | % | | 174.4 | % | | 16.1 | % |
(a)Due to the Company being in a three-year cumulative loss position in China as of December 31, 2023, and Australia as of December 31, 2024, the year ended December 31, 2024 includes a valuation allowance of $271.0 million on current year losses in certain Chinese entities and the establishment of a valuation of $254.9 million on current year losses in the Company’s Australian entities. In addition, the year ended December 31, 2024 includes benefits of $70.1 million due to the release of a foreign valuation allowance due to changes in expected profitability.
(b)Our statutory rate is decreased by our share of the income of JBC, a Free Zones company under the laws of the Hashemite Kingdom of Jordan. The applicable provisions of the Jordanian law, and applicable regulations thereunder, do not have a termination provision and the exemption is indefinite. As a Free Zones company, JBC is not subject to income taxes on the profits of products exported from
| | | | | | | | |
| Albemarle Corporation and Subsidiaries |
| NOTES TO THE CONSOLIDATED FINANCIAL STATEMENTS |
Jordan, and currently, substantially all of the profits are from exports. This resulted in a rate benefit of 1.2%, 20.1%, and 3.2% for the years ended December 31, 2024, 2023, and 2022, respectively.
(c) The year ended December 31, 2024 includes a $37.0 million expense recorded for a current year tax reserve related to an uncertain tax position in Chile.
Deferred income tax assets and liabilities recorded on the consolidated balance sheets as of December 31, 2024 and 2023 consist of the following (in thousands): | | | | | | | | | | | |
| December 31, |
| 2024 | | 2023 |
| Deferred tax assets: | | | |
| | | |
| Accrued employee benefits | $ | 32,993 | | | $ | 31,917 | |
| | | |
| Operating loss carryovers | 1,841,399 | | | 1,316,916 | |
| Pensions | 17,148 | | | 23,527 | |
| Inventory reserves | 27,974 | | | 83,136 | |
| Tax credit carryovers | 11,228 | | | 1,431 | |
| | | |
| Capitalized research and development | 41,938 | | | 36,929 | |
| Lease liability | 53,968 | | | 35,977 | |
| Other | 62,406 | | | 30,611 | |
| Gross deferred tax assets | 2,089,054 | | | 1,560,444 | |
| Valuation allowance | (1,736,456) | | | (1,349,924) | |
| Deferred tax assets | 352,598 | | | 210,520 | |
| | | |
| Deferred tax liabilities: | | | |
| Depreciation | (456,231) | | | (541,245) | |
| Intangibles | (49,676) | | | (54,413) | |
| | | |
| | | |
| | | |
| Right of use asset | (48,951) | | | (30,336) | |
| Outside basis difference | (51,971) | | | (56,214) | |
| Other | (50,190) | | | (64,309) | |
| Deferred tax liabilities | (657,019) | | | (746,517) | |
| | | |
| Net deferred tax liabilities | $ | (304,421) | | | $ | (535,997) | |
| Classification in the consolidated balance sheets: | | | |
| | | |
| | | |
| Noncurrent deferred tax assets | $ | 53,608 | | | $ | 22,433 | |
| Noncurrent deferred tax liabilities | (358,029) | | | (558,430) | |
| Net deferred tax liabilities | $ | (304,421) | | | $ | (535,997) | |
Changes in the balance of our deferred tax asset valuation allowance are as follows (in thousands): | | | | | | | | | | | | | | | | | |
| Year Ended December 31, |
| 2024 | | 2023 | | 2022 |
| Balance at January 1 | $ | (1,349,924) | | | $ | (1,087,505) | | | $ | (1,276,305) | |
| Additions | (519,169) | | | (262,469) | | | (5,810) | |
| Deductions | 132,637 | | | 50 | | | 194,610 | |
| Balance at December 31 | $ | (1,736,456) | | | $ | (1,349,924) | | | $ | (1,087,505) | |
At December 31, 2024, we had approximately $11.3 million of domestic credits available to offset future payments of income taxes, expiring in varying amounts between 2025 and 2029. We have established valuation allowances for $0.1 million of those domestic credits since we believe that it is more likely than not that the related deferred tax assets will not be realized. We believe that sufficient taxable income will be generated during the carryover period in order to utilize the other remaining credit carryovers.
At December 31, 2024, we have on a pre-tax basis, domestic federal and state net operating losses of $1.1 billion, which have pre-tax valuation allowances of $13.8 million established. $0.5 billion of these domestic net operating losses expire between 2025 and 2041 and $0.6 billion have no expiration date. In addition, we have on a pre-tax basis $6.7 billion of foreign net operating losses, which have pre-tax valuation allowances for $6.6 billion established. $636.4 million of these foreign net
| | | | | | | | |
| Albemarle Corporation and Subsidiaries |
| NOTES TO THE CONSOLIDATED FINANCIAL STATEMENTS |
operating losses expire in 2028, $1.3 billion expire in 2029, $2.6 billion expire in 2035, $203.2 million expire in 2036, $19.3 million expire in 2037 and $1.8 billion have an indefinite life. We have established valuation allowances for these deferred tax assets since we believe that it is more likely than not that the related deferred tax assets will not be realized. For the same reason, we established pre-tax valuation allowances of $215.3 million and $15.3 million for other state and foreign deferred tax assets, respectively, unrelated to net operating losses. The realization of the deferred tax assets is dependent on the generation of sufficient taxable income in the appropriate tax jurisdictions. Although realization is not assured, we believe it is more likely than not that the remaining deferred tax assets will be realized. However, the amount considered realizable could be reduced if estimates of future taxable income change.
As of December 31, 2024, we have not recorded taxes on approximately $12.2 billion of cumulative undistributed earnings of our non-U.S. subsidiaries and joint ventures. The TCJA imposed a mandatory transition tax on accumulated foreign earnings and generally eliminated U.S. taxes on foreign subsidiary distribution with the exception of foreign withholding taxes and other foreign local tax. We generally do not provide for taxes related to our undistributed earnings because such earnings either would not be taxable when remitted or they are considered to be indefinitely reinvested. If in the foreseeable future, we can no longer demonstrate that these earnings are indefinitely reinvested, a deferred tax liability will be recognized. A determination of the amount of the unrecognized deferred tax liability related to these undistributed earnings is not practicable due to the complexity and variety of assumptions necessary based on the manner in which the undistributed earnings would be repatriated.
Liabilities related to uncertain tax positions were $259.6 million and $220.6 million at December 31, 2024 and 2023, respectively, inclusive of interest and penalties of $71.0 million and $42.0 million at December 31, 2024 and 2023, respectively, and are reported in Other noncurrent liabilities as provided in Note 14, “Other Noncurrent Liabilities.” These liabilities at December 31, 2024 and 2023 were reduced by $74.8 million and $73.0 million, respectively, for offsetting benefits from the corresponding effects of potential transfer pricing adjustments, state and local income taxes, and rate arbitrage related to foreign structure. These offsetting benefits are recorded in Other assets as provided in Note 9, “Other Assets.” The resulting net liability of $113.8 million, excluding interest and penalties, as of December 31, 2024 would favorably affect earnings if recognized and released, as would the net liability of $105.6 million, excluding interest and penalties, have as of December 31, 2023.
The liabilities related to uncertain tax positions, exclusive of interest, were $188.8 million and $178.8 million at December 31, 2024 and 2023, respectively. The following is a reconciliation of our total gross liability related to uncertain tax positions for 2024, 2023 and 2022 (in thousands):
| | | | | | | | | | | | | | | | | |
| Year Ended December 31, |
| 2024 | | 2023 | | 2022 |
| Balance at January 1 | $ | 178,785 | | | $ | 72,162 | | | $ | 20,717 | |
| | | | | |
| Additions for tax positions related to prior years | 31 | | | 6,216 | | | 1,673 | |
| Reductions for tax positions related to prior years | — | | | — | | | — | |
| Additions for tax positions related to current year | 10,989 | | | 101,179 | | | 50,531 | |
| Lapses in statutes of limitations/settlements | (1,038) | | | (770) | | | (995) | |
| Foreign currency translation adjustment | 59 | | | (2) | | | 236 | |
| Balance at December 31 | $ | 188,826 | | | $ | 178,785 | | | $ | 72,162 | |
We are subject to income taxes in the U.S. and numerous foreign jurisdictions. Due to the statute of limitations, we are no longer subject to U.S. federal income tax audits by the Internal Revenue Service (“IRS”) for years prior to 2021. Due to the statute of limitations, we also are no longer subject to U.S. state income tax audits prior to 2018.
With respect to jurisdictions outside the U.S., several audits are in process. We have audits ongoing for the years 2014 through 2023 related to Belgium, Canada, Chile, China and Germany, some of which are for entities that have since been divested.
While we believe we have adequately provided for all tax positions, amounts asserted by taxing authorities could be greater than our accrued position. Accordingly, additional provisions on federal and foreign tax-related matters could be recorded in the future as revised estimates are made or the underlying matters are settled or otherwise resolved.
| | | | | | | | |
| Albemarle Corporation and Subsidiaries |
| NOTES TO THE CONSOLIDATED FINANCIAL STATEMENTS |
Since the timing of resolutions and/or closure of tax audits is uncertain, it is difficult to predict with certainty the range of reasonably possible significant increases or decreases in the liability related to uncertain tax positions that may occur within the next twelve months.
NOTE 21—Earnings Per Share:
Basic and diluted (loss) earnings per share are calculated as follows (in thousands, except per share amounts): | | | | | | | | | | | | | | | | | |
| Year Ended December 31, |
| 2024 | | 2023 | | 2022 |
| Basic (loss) earnings per share | | | | | |
| Numerator: | | | | | |
| | | | | |
| | | | | |
| Net (loss) income attributable to Albemarle Corporation | $ | (1,179,449) | | | $ | 1,573,476 | | | $ | 2,689,816 | |
| Mandatory convertible preferred stock dividends | (136,647) | | | — | | | — | |
| Net (loss) income attributable to Albemarle Corporation common shareholders | $ | (1,316,096) | | | $ | 1,573,476 | | | $ | 2,689,816 | |
| Denominator: | | | | | |
| Weighted-average common shares for basic (loss) earnings per share | 117,516 | | | 117,317 | | | 117,120 | |
| Basic (loss) earnings per share | $ | (11.20) | | | $ | 13.41 | | | $ | 22.97 | |
| Diluted (loss) earnings per share | | | | | |
| Numerator: | | | | | |
| | | | | |
| | | | | |
| Net (loss) income attributable to Albemarle Corporation | $ | (1,179,449) | | | $ | 1,573,476 | | | $ | 2,689,816 | |
| Mandatory convertible preferred stock dividends | (136,647) | | | — | | | — | |
| Net (loss) income attributable to Albemarle Corporation common shareholders | $ | (1,316,096) | | | $ | 1,573,476 | | | $ | 2,689,816 | |
| Denominator: | | | | | |
| Weighted-average common shares for basic (loss) earnings per share | 117,516 | | | 117,317 | | | 117,120 | |
| | | | | |
| Incremental shares under stock compensation plans | — | | | 449 | | | 673 | |
| Weighted-average common shares for diluted (loss) earnings per share | 117,516 | | | 117,766 | | | 117,793 | |
| Diluted (loss) earnings per share | $ | (11.20) | | | $ | 13.36 | | | $ | 22.84 | |
The following table summarizes the number of shares, calculated on a weighted average basis, not included in the computation of diluted (loss) earnings per share because their effect would have been anti-dilutive (in thousands):
| | | | | | | | | | | | | | | | | |
| Year Ended December 31, |
| 2024 | | 2023 | | 2022 |
| Shares assuming the conversion of the mandatory convertible preferred stock | 16,932 | | | — | | | — | |
| Shares under the stock compensation plan | 1,064 | | | 158 | | | — | |
Included in the calculation of basic (loss) earnings per share are unvested restricted stock awards that contain nonforfeitable rights to dividends. At December 31, 2024, there were 14,000 unvested shares of restricted stock awards outstanding.
We have the authority to issue 15,000,000 shares of preferred stock in one or more classes or series. As of December 31, 2024, 2,300,000 shares of preferred stock have been issued.
In November 2016, our Board of Directors authorized an increase in the number of shares the Company is permitted to repurchase under our share repurchase program, pursuant to which the Company is now permitted to repurchase up to a maximum of 15,000,000 shares, including those previously authorized but not yet repurchased.
There were no shares of the Company’s common stock repurchased during the years ended December 31, 2024, 2023 or 2022. As of December 31, 2024, there were 7,396,263 remaining shares available for repurchase under the Company’s authorized share repurchase program.
| | | | | | | | |
| Albemarle Corporation and Subsidiaries |
| NOTES TO THE CONSOLIDATED FINANCIAL STATEMENTS |
NOTE 22—Fair Value of Financial Instruments:
In assessing the fair value of financial instruments, we use methods and assumptions that are based on market conditions and other risk factors existing at the time of assessment. Fair value information for our financial instruments is as follows:
Long-Term Debt—the fair values of our notes are estimated using Level 1 inputs and account for the difference between the recorded amount and fair value of our long-term debt. The carrying value of our remaining long-term debt reported in the accompanying consolidated balance sheets approximates fair value as substantially all of such debt bears interest based on prevailing variable market rates currently available in the countries in which we have borrowings.
| | | | | | | | | | | | | | | | | | | | | | | |
| December 31, |
| 2024 | | 2023 |
| Recorded Amount | | Fair Value | | Recorded Amount | | Fair Value |
| (In thousands) |
| Long-term debt | $ | 3,532,713 | | | $ | 3,332,064 | | | $ | 4,186,532 | | | $ | 4,021,693 | |
During the fourth quarter of 2019, we entered into a foreign currency forward contract to hedge the cash flow exposure of non-functional currency purchases during the construction of the Kemerton plant in Australia. This derivative financial instrument is used to manage risk and is not used for trading or other speculative purposes. This foreign currency forward contract has been designated as a hedging instrument under ASC 815, Derivatives and Hedging. As a result of the actions taken at Kemerton Trains 3 and 4 during 2024, the Company dedesignated the remaining hedged foreign currency forward contracts. The Company recorded a loss in Other income, net of $26.1 million during the year ended December 31, 2024 from the reclassification of the hedged balance from Accumulated other comprehensive loss. The balance of the settled hedged foreign currency forward contracts associated with the construction of Kemerton Trains 1 and 2 assets placed into service will be reclassified to earnings over the life of the related assets. At December 31, 2023, the notional value of these outstanding designated foreign currency forward contracts totaled the equivalent of $994.5 million.
In connection with our risk management strategies, we also enter into other derivative financial instruments that have not been designated as hedging instruments under ASC 815, Derivatives and Hedging. These derivative financial instruments are used to manage risk and are not used for trading or other speculative purposes. At December 31, 2024 and 2023, we had outstanding non-designated derivative financial instruments with notional values totaling $6.9 billion and $7.1 billion, respectively. The non-designated derivative financial instruments are primarily comprised of foreign currency forward contracts that attempt to minimize the financial impact of changes in foreign currency exchange rates. The fair values of our non-designated foreign currency forward contracts are estimated based on current settlement values. At December 31, 2024, these foreign currency forward contracts hedge our exposure to various currencies including the Chinese Renminbi, Euro and Australian Dollar.
| | | | | | | | |
| Albemarle Corporation and Subsidiaries |
| NOTES TO THE CONSOLIDATED FINANCIAL STATEMENTS |
The following table summarizes the fair value of our derivative financial instruments included in the consolidated balance sheets at December 31, 2024 and 2023 (in thousands): | | | | | | | | | | | | | | | | | | | | | | | |
| December 31, |
| 2024 | | 2023 |
| Assets | | Liabilities | | Assets | | Liabilities |
| Designated as hedging instruments | | | | | | | |
| Other current assets | $ | — | | | $ | — | | | $ | 3,489 | | | $ | — | |
| Other assets | — | | | — | | | 11,704 | | | — | |
| Accrued expenses | — | | | — | | | — | | | 446 | |
| Total designated as hedging instruments | — | | | — | | | 15,193 | | | 446 | |
| Not designated as hedging instruments | | | | | | | |
| Other current assets | 4,347 | | | — | | | 2,636 | | | — | |
| Accrued expenses | — | | | 6,586 | | | — | | | 5,306 | |
| Other noncurrent liabilities | — | | | 4,766 | | | — | | | — | |
| Total not designated as hedging instruments | 4,347 | | | 11,352 | | | 2,636 | | | 5,306 | |
| Total | $ | 4,347 | | | $ | 11,352 | | | $ | 17,829 | | | $ | 5,752 | |
The following table summarizes the net (losses) gains recognized for our derivative financial instruments during the years ended December 31, 2024, 2023 and 2022 (in thousands): | | | | | | | | | | | | | | | | | |
| Year Ended December 31, |
| 2024 | | 2023 | | 2022 |
| Designated as hedging instruments: | | | | | |
| (Loss) gain recognized in Other comprehensive (loss) income | $ | (28,701) | | | $ | 5,986 | | | $ | (4,399) | |
| (Loss) gain recognized in Other income, net | $ | (25,766) | | | $ | 135 | | | $ | — | |
| Not designated as hedging instruments: | | | | | |
(Loss) gain recognized in Other income, net(a) | $ | (14,728) | | | $ | 213,378 | | | $ | (41,088) | |
(a)Fluctuations in the value of our foreign currency forward contracts not designated as hedging instruments are generally expected to be offset by changes in the value of the underlying exposures being hedged, which are also reported in Other income, net.
In addition, for the years ended December 31, 2024, 2023 and 2022, we recorded net cash (settlements) receipts of ($9.8) million, $218.0 million and ($44.4) million, respectively, primarily within Changes in current assets and liabilities, in our consolidated statements of cash flows.
Unrealized gains and losses related to the cash flow hedges will be reclassified to earnings over the life of the related assets when settled and the related assets are placed into service.
The counterparties to our foreign currency forward contracts are major financial institutions with which we generally have other financial relationships. We are exposed to credit loss in the event of nonperformance by these counterparties. However, we do not anticipate nonperformance by the counterparties.
NOTE 23—Fair Value Measurement:
Fair value is defined as the price that would be received to sell an asset or paid to transfer a liability in an orderly transaction between market participants at the measurement date (exit price). The inputs used to measure fair value are classified into the following hierarchy:
| | | | | |
| Level 1 | Unadjusted quoted prices in active markets for identical assets or liabilities |
| |
| Level 2 | Unadjusted quoted prices in active markets for similar assets or liabilities, or unadjusted quoted prices for identical or similar assets or liabilities in markets that are not active, or inputs other than quoted prices that are observable for the asset or liability |
| |
| Level 3 | Unobservable inputs for the asset or liability |
| | | | | | | | |
| Albemarle Corporation and Subsidiaries |
| NOTES TO THE CONSOLIDATED FINANCIAL STATEMENTS |
We endeavor to utilize the best available information in measuring fair value. Financial assets and liabilities are classified in their entirety based on the lowest level of input that is significant to the fair value measurement. The following tables set forth our financial assets and liabilities that were accounted for at fair value on a recurring basis as of December 31, 2024 and 2023 (in thousands): | | | | | | | | | | | | | | | | | | | | | | | |
| December 31, 2024 | | Quoted Prices in Active Markets for Identical Items (Level 1) | | Quoted Prices in Active Markets for Similar Items (Level 2) | | Unobservable Inputs (Level 3) |
| Assets: | | | | | | | |
Available for sale debt securities(a) | $ | 313,991 | | | $ | — | | | $ | — | | | $ | 313,991 | |
Investments under executive deferred compensation plan(b) | $ | 38,243 | | | $ | 38,243 | | | $ | — | | | $ | — | |
Public equity securities(c) | $ | 17,910 | | | $ | 17,910 | | | $ | — | | | $ | — | |
Private equity securities measured at net asset value(d)(e) | $ | 4,472 | | | $ | — | | | $ | — | | | $ | — | |
Derivative financial instruments(f) | $ | 4,347 | | | $ | — | | | $ | 4,347 | | | $ | — | |
| Liabilities: | | | | | | | |
Obligations under executive deferred compensation plan(b) | $ | 38,243 | | | $ | 38,243 | | | $ | — | | | $ | — | |
Derivative financial instruments(f) | $ | 11,352 | | | $ | — | | | $ | 11,352 | | | $ | — | |
| | | | | | | | | | | | | | | | | | | | | | | |
| December 31, 2023 | | Quoted Prices in Active Markets for Identical Items (Level 1) | | Quoted Prices in Active Markets for Similar Items (Level 2) | | Unobservable Inputs (Level 3) |
| Assets: | | | | | | | |
Available for sale debt securities(a) | $ | 289,307 | | | $ | — | | | $ | — | | | $ | 289,307 | |
Investments under executive deferred compensation plan(b) | $ | 33,564 | | | $ | 33,564 | | | $ | — | | | $ | — | |
Public equity securities(c) | $ | 168,928 | | | $ | 168,928 | | | $ | — | | | $ | — | |
Private equity securities measured at net asset value(d)(e) | $ | 4,536 | | | $ | — | | | $ | — | | | $ | — | |
Derivative financial instruments(f) | $ | 17,829 | | | $ | — | | | $ | 17,829 | | | $ | — | |
| Liabilities: | | | | | | | |
Obligations under executive deferred compensation plan(b) | $ | 33,564 | | | $ | 33,564 | | | $ | — | | | $ | — | |
Derivative financial instruments(f) | $ | 5,752 | | | $ | — | | | $ | 5,752 | | | $ | — | |
(a)Preferred equity of a Grace subsidiary acquired as a portion of the proceeds of the FCS sale on June 1, 2021. A third-party estimate of the fair value was prepared using expected future cash flows over the period up to when the asset is likely to be redeemed, applying a discount rate that appropriately captures a market participant's view of the risk associated with the investment. These are considered to be Level 3 inputs.
(b)We maintain an EDCP that was adopted in 2001 and subsequently amended. The purpose of the EDCP is to provide current tax planning opportunities as well as supplemental funds upon the retirement or death of certain of our employees. The EDCP is intended to aid in attracting and retaining employees of exceptional ability by providing them with these benefits. We also maintain a Benefit Protection Trust (the “Trust”) that was created to provide a source of funds to assist in meeting the obligations of the EDCP, subject to the claims of our creditors in the event of our insolvency. Assets of the Trust are consolidated in accordance with authoritative guidance. The assets of the Trust consist primarily of mutual fund investments (which are accounted for as trading securities and are marked-to-market on a monthly basis through the consolidated statements of (loss) income) and cash and cash equivalents. As such, these assets and obligations are classified within Level 1.
(c)Holdings in equity securities of public companies reported in Investments in the consolidated balance sheets. The fair value is measured using publicly available share prices of the investments, and as a result these balances are classified within Level 1. Any changes are reported in Other income, net, in our consolidated statements of (loss) income. See Note 8, “Investments,” for further details.
(d)Primarily consists of private equity securities reported in Investments in the consolidated balance sheets. The changes in fair value are reported in Other income, net in our consolidated statements of (loss) income.
(e)Holdings in certain private equity securities are measured at fair value using the net asset value per share (or its equivalent) practical expedient and have not been categorized in the fair value hierarchy.
(f)The derivative financial instruments are primarily comprised of foreign currency forward contracts. As a result of our global operating and financing activities, we are exposed to market risks from changes in foreign currency exchange rates which may adversely affect our operating results and financial position. When deemed appropriate, we minimize our risks from foreign currency exchange rate fluctuations through the use of foreign currency forward contracts. The foreign currency forward contracts are valued using broker quotations or market transactions in either the listed or over-the-counter markets. As such, these derivative instruments are classified within Level 2. See Note 22, “Fair Value of Financial Instruments,” for further details about our foreign currency forward contracts.
| | | | | | | | |
| Albemarle Corporation and Subsidiaries |
| NOTES TO THE CONSOLIDATED FINANCIAL STATEMENTS |
The following tables set forth the reconciliation of the beginning and ending balance for the Level 3 recurring fair value measurements (in thousands):
| | | | | | | | | | | |
| Available for Sale Debt Securities |
| Year Ended December 31, |
| 2024 | | 2023 |
| Beginning balance | $ | 289,307 | | | $ | 260,139 | |
| | | |
| Accretion of discount | — | | | 5,306 | |
| PIK dividends | 36,311 | | | 19,307 | |
| Change in fair value | — | | | 4,555 | |
| Cash received for tax liability | (11,627) | | | — | |
| Ending balance | $ | 313,991 | | | $ | 289,307 | |
NOTE 24—Related Party Transactions:
Our consolidated statements of (loss) income include sales to and purchases from unconsolidated affiliates in the ordinary course of business as follows (in thousands): | | | | | | | | | | | | | | | | | |
| Year Ended December 31, |
| 2024 | | 2023 | | 2022 |
| Sales to unconsolidated affiliates | $ | 30,090 | | | $ | 35,676 | | | $ | 51,906 | |
Purchases from unconsolidated affiliates(a) | $ | 643,293 | | | $ | 3,652,784 | | | $ | 1,920,476 | |
(a)Purchases from unconsolidated affiliates primarily relate to spodumene purchased from the Company’s Windfield joint venture. The decrease from prior year primarily related to the lower lithium market prices in recent months.
Our consolidated balance sheets include accounts receivable due from and payable to unconsolidated affiliates in the ordinary course of business as follows (in thousands): | | | | | | | | | | | |
| December 31, |
| 2024 | | 2023 |
| Receivables from unconsolidated affiliates | $ | 11,950 | | | $ | 15,992 | |
Payables to unconsolidated affiliates(a) | $ | 150,432 | | | $ | 550,186 | |
(a)Payables to unconsolidated affiliates primarily relate to spodumene purchased from the Company’s Windfield joint venture under normal payment terms.
NOTE 25—Segment and Geographic Area Information:
The Company has three operating and reportable segments, which are: (1) Energy Storage; (2) Specialties; and (3) Ketjen. The segments are organized based on their similar markets, customers, economic characteristics and production processes. The organizational structure facilitates the continued standardization of business processes across the organization, and is consistent with the manner in which information is presently used internally by the Company’s Chairman, President and Chief Executive Officer, who is the Company’s chief operating decision maker (“CODM”), to evaluate performance and make resource allocation decisions.
The Corporate category is not considered to be a segment and includes corporate-related items not allocated to the operating segments. Pension and other post-employment benefit (“OPEB”) service cost (which represents the benefits earned by active employees during the period) and amortization of prior service cost or benefit are allocated to the reportable segments and Corporate, whereas the remaining components of pension and OPEB benefits cost or credit (“Non-operating pension and OPEB items”) are included in Corporate. Segment data includes inter-segment transfers of raw materials at cost and allocations for certain corporate costs.
The CODM uses adjusted EBITDA (as defined below) to assess the ongoing performance of the Company’s business segments and to allocate resources by considering the variance in the actual results to the forecasts on a monthly basis. The annual operating budget and ongoing forecasting process use adjusted EBITDA as a key metric in assessing the segments
| | | | | | | | |
| Albemarle Corporation and Subsidiaries |
| NOTES TO THE CONSOLIDATED FINANCIAL STATEMENTS |
process. In addition, the CODM uses adjusted EBITDA for business and enterprise planning purposes and as a significant component in the calculation of performance-based compensation for management and other employees. Effective January 1, 2024, the Company changed its definition of adjusted EBITDA for financial accounting purposes. The updated definition includes Albemarle’s share of the pre-tax earnings of the Windfield joint venture, whereas the prior definition included Albemarle’s share of Windfield earnings net of tax. This calculation is consistent with the definition of adjusted EBITDA used in the leverage financial covenant calculation in the amended 2022 Credit Agreement, which is a material agreement for the Company and aligns the information presented to various stakeholders. This presentation more closely represents the materiality and financial contribution of the strategic investment in Windfield to the Company’s earnings, and more closely represents a measure of EBITDA. The Company’s updated definition of adjusted EBITDA is earnings before interest and financing expenses, income tax expenses, the proportionate share of Windfield income tax expense, depreciation and amortization, as adjusted on a consistent basis for certain non-operating, non-recurring or unusual items on a segment basis. These non-operating, non-recurring or unusual items may include acquisition and integration related costs, gains or losses on sales of businesses, restructuring charges, facility divestiture charges, certain litigation and arbitration costs and charges, non-operating pension and OPEB items and other significant non-recurring items. Adjusted EBITDA for the prior periods has been recast to conform to the current year presentation.
See below for a reconciliation of segment Net sales to adjusted EBITDA by segment showing significant segment expenses regularly reviewed by the CODM for the years ended December 31, 2024, 2023 and 2022 (in thousands):
| | | | | | | | | | | | | | | | | | | | | | | |
| Energy Storage | | Specialties | | Ketjen | | Total Segments |
| Year Ended December 31, 2024 | | | | | | | |
Net sales(a) | $ | 3,015,121 | | | $ | 1,325,983 | | | $ | 1,036,422 | | | $ | 5,377,526 | |
Cost of goods sold(b) | (2,992,566) | | | (935,017) | | | (810,319) | | | (4,737,902) | |
Selling, general and administrative expenses(b) | (249,805) | | | (93,533) | | | (90,653) | | | (433,991) | |
Other segment items(c) | (25,101) | | | (25,676) | | | (26,852) | | | (77,629) | |
Equity in net income of unconsolidated investments(d) | 1,009,891 | | | — | | | 22,468 | | | 1,032,359 | |
| Net income attributable to noncontrolling interests | — | | | (43,253) | | | — | | | (43,253) | |
| Adjusted EBITDA by segment | $ | 757,540 | | | $ | 228,504 | | | $ | 131,066 | | | $ | 1,117,110 | |
| Year Ended December 31, 2023 | | | | | | | |
Net sales(a) | $ | 7,078,998 | | | $ | 1,482,425 | | | $ | 1,055,780 | | | $ | 9,617,203 | |
Cost of goods sold(b) | (6,205,403) | | | (961,177) | | | (847,018) | | | (8,013,598) | |
Selling, general and administrative expenses(b) | (266,190) | | | (100,173) | | | (94,387) | | | (460,750) | |
Other segment items(c) | (22,632) | | | (25,719) | | | (30,972) | | | (79,323) | |
Equity in net income of unconsolidated investments(d) | 2,596,820 | | | — | | | 20,469 | | | 2,617,289 | |
| Net income attributable to noncontrolling interests | — | | | (96,850) | | | — | | | (96,850) | |
| Adjusted EBITDA by segment | $ | 3,181,593 | | | $ | 298,506 | | | $ | 103,872 | | | $ | 3,583,971 | |
| Year Ended December 31, 2022 | | | | | | | |
Net sales(a) | $ | 4,660,945 | | | $ | 1,759,587 | | | $ | 899,572 | | | $ | 7,320,104 | |
Cost of goods sold(b) | (2,170,867) | | | (1,013,247) | | | (775,717) | | | (3,959,831) | |
Selling, general and administrative expenses(b) | (186,311) | | | (77,382) | | | (84,896) | | | (348,589) | |
Other segment items(c) | (18,389) | | | (16,677) | | | (32,131) | | | (67,197) | |
Equity in net income of unconsolidated investments(d) | 1,066,978 | | | — | | | 21,904 | | | 1,088,882 | |
| Net income attributable to noncontrolling interests | — | | | (124,963) | | | — | | | (124,963) | |
| Adjusted EBITDA by segment | $ | 3,352,356 | | | $ | 527,318 | | | $ | 28,732 | | | $ | 3,908,406 | |
(a)Intersegment sales are not considered material.
(b)The significant expense categories and amounts align with the segment information that is regularly provided to the CODM. Excludes depreciation and amortization, and non-operating, non-recurring or unusual items as described in the reconciliation of total segment adjusted EBITDA to consolidated Net (loss) income attributable to Albemarle Corporation below.
(c)Other segment items are comprised of Research and development expenses excluding depreciation and amortization.
(d)Excludes Albemarle’s 49% ownership interest in the income tax expense of the Windfield joint venture.
| | | | | | | | |
| Albemarle Corporation and Subsidiaries |
| NOTES TO THE CONSOLIDATED FINANCIAL STATEMENTS |
The Company reconciles the total segment adjusted EBITDA to the consolidated net (loss) income attributable to Albemarle Corporation given the impact of equity in net income from unconsolidated investments, the majority of which relates to the Windfield joint venture. This reconciliation reflects the strategic and operational significance of the Company’s joint ventures and aligns with our allocation of equity in net income from unconsolidated investments at the segment level, representing each segment's contribution to the Company's overall financial performance. See below for a reconciliation of total segment adjusted EBITDA to consolidated Net (loss) income attributable to Albemarle Corporation (in thousands):
| | | | | | | | | | | | | | | | | |
| Year Ended December 31, |
| 2024 | | 2023 | | 2022 |
| Total segment adjusted EBITDA | $ | 1,117,110 | | | $ | 3,583,971 | | | $ | 3,908,406 | |
| | | | | |
| Corporate expenses, net | 22,668 | | | (37,983) | | | (110,958) | |
| Depreciation and amortization | (588,638) | | | (429,944) | | | (300,841) | |
Interest and financing expenses(a) | (165,619) | | | (116,072) | | | (122,973) | |
| Income tax expense | (87,085) | | | (430,277) | | | (390,588) | |
Proportionate share of Windfield income tax expense(b) | (299,193) | | | (779,703) | | | (321,591) | |
| | | | | |
Gain (loss) on change in interest in properties/sale of business, net(c) | — | | | 71,190 | | | (8,400) | |
Acquisition and integration related costs(d) | (6,223) | | | (26,767) | | | (16,259) | |
Restructuring charges and asset write-offs(e) | (1,180,806) | | | (9,491) | | | — | |
Goodwill impairment(f) | — | | | (6,765) | | | — | |
| Non-operating pension and OPEB items | 11,335 | | | 7,971 | | | 57,032 | |
| | | | | |
(Loss) gain in fair value of public equity securities(g) | (70,758) | | | (44,732) | | | 4,319 | |
Legal accrual(h) | — | | | (218,510) | | | — | |
| | | | | |
| | | | | |
Other(i) | 67,760 | | | 10,588 | | | (8,331) | |
| Net (loss) income attributable to Albemarle Corporation | $ | (1,179,449) | | | $ | 1,573,476 | | | $ | 2,689,816 | |
(a)Included in Interest and financing expenses is a loss on early extinguishment of debt of $19.2 million for the year ended December 31, 2022. See Note 12, “Long-term Debt,” for additional information. In addition, Interest and financing expenses for the year ended December 31, 2022 includes the correction of an out of period error of $17.5 million related to the overstatement of capitalized interest in prior periods.
(b)Albemarle’s 49% ownership interest in the reported income tax expense of the Windfield joint venture.
(c)Gain recorded during the year ended December 31, 2023 resulting from the restructuring of the MARBL joint venture with MRL. See Note 8, “Investments,” for further details. $8.4 million of expense recorded during the year ended December 31, 2022 as a result of revised estimates of the obligation to construct certain lithium hydroxide conversion assets in Kemerton, Western Australia, due to cost overruns from supply chain, labor and COVID-19 pandemic related issues.
(d)Costs related to the acquisition, integration and potential divestitures for various significant projects, recorded in Selling, general and administrative expenses (“SG&A”).
(e)See Note 17, “Restructuring Charges and Asset Write-offs,” for further details.
(f)Goodwill impairment charge recorded in SG&A during the year ended December 31, 2023 related to our PCS business. See Note 10, “Goodwill and Other Intangibles,” for further details.
(g)Other income, net for the year ended December 31, 2024 included losses of $37.0 million and $33.7 million resulting from the net change in fair value of investments in public equity securities and the sale of investments in public equity securities, respectively. For the years ended December 31, 2023 and 2022, a (loss) gain of ($44.7) million and $4.3 million, respectively, were recorded in Other income, net resulting from the change in fair value of investments in public equity securities.
(h)Loss recorded in SG&A for the agreements to resolve a previously disclosed legal matter with the DOJ and SEC during the year ended December 31, 2023. See Note 15, “Commitments and Contingencies,” for further details.
(i)Included amounts for the year ended December 31, 2024 recorded in:
•Cost of goods sold - $1.4 million of expenses related to non-routine labor and compensation related costs that are outside normal compensation arrangements.
•SG&A - $5.3 million of expenses related to certain historical legal and environmental matters.
•Other income, net - $40.9 million of gains from the sale of assets at a site not part of our operations, $36.3 million of income from PIK dividends of preferred equity in a Grace subsidiary, a $1.8 million net gain primarily resulting from the adjustment of indemnification related to previously disposed businesses and a $0.6 million gain from an updated cost estimate of an environmental reserve at a site not part of our operations, partially offset by $2.9 million of charges for asset retirement obligations at a site not part of our operations and $2.1 million of a loss related to the fair value adjustment of a nonmarketable security investment.
Included amounts for the year ended December 31, 2023 recorded in:
| | | | | | | | |
| Albemarle Corporation and Subsidiaries |
| NOTES TO THE CONSOLIDATED FINANCIAL STATEMENTS |
•Cost of goods sold - $15.1 million loss recorded to settle an arbitration matter with a regulatory agency in Chile, partially offset by a $4.1 million gain from an updated cost estimate of an environmental reserve at a site not part of our operations.
•SG&A - $2.3 million of facility closure expenses related to offices in Germany, $1.9 million of charges primarily for environmental reserves at sites not part of our operations and $1.8 million of various expenses including for certain legal costs and shortfall contributions for a multiemployer plan financial improvement plan.
•Other income, net - $19.3 million gain from PIK dividends of preferred equity in a Grace subsidiary, a $7.3 million gain resulting from insurance proceeds of a prior legal matter and $5.5 million of gains from the sale of investments and the write-off of certain liabilities no longer required, partially offset by $3.6 million of charges for asset retirement obligations at a site not part of our operations and $0.9 million of a loss resulting from the adjustment of indemnification related to previously disposed businesses.
Included amounts for the year ended December 31, 2022 recorded in:
•Cost of goods sold - $2.7 million of expense related to one-time retention payments for certain employees during the Catalysts strategic review and business unit realignment, and $0.5 million related to the settlement of a legal matter resulting from a prior acquisition.
•SG&A - $4.3 million primarily related to facility closure expenses of offices in Germany, $2.8 million of charges for environmental reserves at sites not part of our operations, $2.8 million of shortfall contributions for our multiemployer plan financial improvement plan, $1.9 million of expense related to one-time retention payments for certain employees during the Catalysts strategic review, partially offset by $4.3 million of gains from the sale of legacy properties not part of our operations.
•Other income, net - $3.0 million gain from the reversal of a liability related to a previous divestiture, a $2.0 million gain relating to the adjustment of an environmental reserve at non-operating businesses we previously divested and a $0.6 million gain related to a settlement received from a legal matter in a prior period, partially offset by a $3.2 million loss resulting from the adjustment of indemnification related to previously disposed businesses.
Identifiable assets by segment as of December 31, 2024, 2023 and 2022 were as follows (in thousands):
| | | | | | | | | | | | | | | | | |
| December 31, |
| 2024 | | 2023 | | 2022 |
| | | | | |
| Assets: | | | | | |
Energy Storage(a) | $ | 11,285,847 | | | $ | 13,246,412 | | | $ | 10,471,949 | |
| Specialties | 1,843,564 | | | 1,696,307 | | | 1,396,583 | |
| Ketjen | 1,426,189 | | | 1,355,743 | | | 1,214,482 | |
| Total segment assets | 14,555,600 | | | 16,298,462 | | | 13,083,014 | |
| | | | | |
| Corporate | 2,054,049 | | | 1,972,190 | | | 2,373,508 | |
| Total assets | $ | 16,609,649 | | | $ | 18,270,652 | | | $ | 15,456,522 | |
| | | | | |
| | | | | |
| | | | | |
| | | | | |
| | | | | |
| | | | | |
Additional segment information for the years ended December 31, 2024, 2023 and 2022 was as follows (in thousands):
| | | | | | | | |
| Albemarle Corporation and Subsidiaries |
| NOTES TO THE CONSOLIDATED FINANCIAL STATEMENTS |
| | | | | | | | | | | | | | | | | |
| Year Ended December 31, |
| 2024 | | 2023 | | 2022 |
| | | | | |
| Depreciation and amortization: | | | | | |
| Energy Storage | $ | 434,916 | | | $ | 258,436 | | | $ | 175,738 | |
| Specialties | 95,043 | | | 86,673 | | | 67,705 | |
| Ketjen | 51,488 | | | 76,023 | | | 51,417 | |
| Total segment depreciation and amortization | 581,447 | | | 421,132 | | | 294,860 | |
| | | | | |
| | | | | |
| Corporate | 7,191 | | | 8,812 | | | 5,981 | |
| Total depreciation and amortization | $ | 588,638 | | | $ | 429,944 | | | $ | 300,841 | |
| Equity in net income of unconsolidated investments (net of tax): | | | | | |
| Energy Storage | $ | 705,378 | | | $ | 1,822,620 | | | $ | 746,882 | |
| | | | | |
| Ketjen | 22,468 | | | 20,469 | | | 21,904 | |
| Total segment equity in net income of unconsolidated investments (net of tax) | 727,846 | | | 1,843,089 | | | 768,786 | |
| | | | | |
| | | | | |
Corporate(a) | (12,413) | | | 10,993 | | | 3,489 | |
| Total equity in net income of unconsolidated investments (net of tax) | $ | 715,433 | | | $ | 1,854,082 | | | $ | 772,275 | |
| Capital expenditures: | | | | | |
| Energy Storage | $ | 1,231,009 | | | $ | 1,752,440 | | | $ | 980,410 | |
| Specialties | 257,673 | | | 214,039 | | | 183,658 | |
| Ketjen | 163,921 | | | 132,510 | | | 66,319 | |
| Total segment capital expenditures | 1,652,603 | | | 2,098,989 | | | 1,230,387 | |
| | | | | |
| | | | | |
| Corporate | 33,187 | | | 50,292 | | | 31,259 | |
| Total capital expenditures | $ | 1,685,790 | | | $ | 2,149,281 | | | $ | 1,261,646 | |
(a)Corporate equity in net income of unconsolidated investments (net of tax) relates to foreign exchange gains or losses from the Windfield joint venture.
The following table summarizes the Company’s net sales by geographic area for the years ended December 31, 2024, 2023 and 2022 (in thousands):
| | | | | | | | | | | | | | | | | |
| Year Ended December 31, |
| 2024 | | 2023 | | 2022 |
| | | | | |
Net Sales(a): | | | | | |
| United States | $ | 901,870 | | | $ | 930,838 | | | $ | 888,612 | |
| South Korea | 912,376 | | | 3,125,372 | | | 1,628,728 | |
| China | 1,961,143 | | | 2,851,809 | | | 2,380,459 | |
| Japan | 589,268 | | | 1,396,360 | | | 1,079,322 | |
Other(b) | 1,012,869 | | | 1,312,824 | | | 1,342,983 | |
| Total | $ | 5,377,526 | | | $ | 9,617,203 | | | $ | 7,320,104 | |
(a)Net sales are attributed to countries based upon shipments to final destination.
(b)Net sales to any other country are individually material.
During the year ended December 31, 2024, no customer represented greater than 10% of the Company’s consolidated net sales. During of the year ended December 31, 2023, one customer in the Energy Storage business represented approximately 12% of the Company’s consolidated net sales, and during the year ended December 31, 2022, a separate customer represented approximately 11% of the Company’s consolidated net sales.
| | | | | | | | |
| Albemarle Corporation and Subsidiaries |
| NOTES TO THE CONSOLIDATED FINANCIAL STATEMENTS |
The following table summarizes the Company’s long-lived assets by geographic area for the years ended December 31, 2024, 2023 and 2022 was as follows (in thousands):
| | | | | | | | | | | | | | | | | |
| As of December 31, |
| 2024 | | 2023 | | 2022 |
| | | (In thousands) | | |
Long-Lived Assets(a): | | | | | |
| United States | $ | 2,134,371 | | | $ | 1,912,243 | | | $ | 1,371,347 | |
| Australia | 3,943,847 | | | 4,610,963 | | | 3,253,069 | |
| Chile | 2,253,647 | | | 2,258,619 | | | 2,057,270 | |
| China | 966,785 | | | 819,119 | | | 438,090 | |
| Jordan | 309,148 | | | 292,870 | | | 267,612 | |
| Netherlands | 177,587 | | | 186,963 | | | 167,264 | |
| Germany | 90,367 | | | 91,979 | | | 77,845 | |
| France | 59,815 | | | 56,876 | | | 52,894 | |
| Brazil | 29,733 | | | 33,730 | | | 31,855 | |
| | | | | |
| | | | | |
| Other foreign countries | 92,655 | | | 87,489 | | | 77,747 | |
| Total | $ | 10,057,955 | | | $ | 10,350,851 | | | $ | 7,794,993 | |
(a) Long-lived assets are comprised of the Company’s Property, plant and equipment and joint ventures included in Investments.
| | | | | |
| Item 9. | Changes in and Disagreements with Accountants on Accounting and Financial Disclosure. |
NONE
| | | | | |
| Item 9A. | Controls and Procedures. |
Evaluation of Disclosure Controls and Procedures
Under the supervision and with the participation of our management, including our principal executive officer and principal financial officer, we conducted an evaluation of the effectiveness of the design and operation of our disclosure controls and procedures (as defined in Rules 13a-15(e) and 15d-15(e) under the Exchange Act), as of the end of the period covered by this report. Based on this evaluation, our principal executive officer and principal financial officer concluded that, as of the end of the period covered by this report, our disclosure controls and procedures are effective to ensure that information required to be disclosed by us in the reports that we file or submit under the Exchange Act, is recorded, processed, summarized and reported within the time periods specified in the SEC’s rules and forms, and that such information is accumulated and communicated to our management, including our principal executive officer and principal financial officer, as appropriate, to allow timely decisions regarding required disclosure.
Management’s report on internal control over financial reporting and the independent registered public accounting firm’s report are included in Item 8 under the captions entitled “Management’s Report on Internal Control over Financial Reporting” and “Report of Independent Registered Public Accounting Firm” and are incorporated herein by reference.
Changes in Internal Control over Financial Reporting
No changes in our internal control over financial reporting (as such term is defined in Exchange Act Rule 13a-15(f)) occurred during the fiscal quarter ended December 31, 2024 that materially affected, or are reasonably likely to materially affect, our internal control over financial reporting.
| | | | | |
| Item 9B. | Other Information. |
NONE
| | | | | |
| Item 9C. | Disclosure Regarding Foreign Jurisdictions That Prevent Inspections. |
NONE
PART III
| | | | | | | | |
| Albemarle Corporation and Subsidiaries |
|
| | | | | |
| Item 10. | Directors, Executive Officers and Corporate Governance. |
The information regarding Directors under the heading “Proposal 1 - Election of Directors,” and under the subheadings “Process for Selecting Directors” and “Director Candidate Recommendations and Nominations by Shareholders” under the heading “Corporate Governance”; the information under the subheading “Delinquent Section 16(a) Reports” under the heading “Share Ownership”; and the information regarding the Audit Committee under the subheading “Committees of the Board of Directors” under the heading “Corporate Governance” in the Company’s 2025 Proxy Statement are incorporated herein by reference. See “Executive Officers of the Registrant” appearing after Item 4 in Part I of this Annual Report for information regarding executive officers of the Company.
Code of Conduct
We have adopted a code of conduct and ethics for directors, officers and employees, known as the Albemarle Code of Conduct. The Albemarle Code of Conduct is available on our website, www.albemarle.com. Shareholders may also request a free copy of the Albemarle Code of Conduct from: Albemarle Corporation, Attention: Investor Relations, 4250 Congress Street, Suite 900, Charlotte, North Carolina 28209. We will disclose any amendments to, or waivers from, a provision of our Code of Conduct that applies to the principal executive officer, principal financial officer, principal accounting officer or controller, or persons performing similar functions that relates to any element of the Code of Conduct as defined in Item 406 of Regulation S-K by posting such information on our website.
New York Stock Exchange Certifications
Because our common stock is listed on the New York Stock Exchange (“NYSE”), our Chief Executive Officer is required to make, and he has made, an annual certification to the NYSE stating that he was not aware of any violation by us of the corporate governance listing standards of the NYSE. Our Chief Executive Officer made his annual certification to that effect to the NYSE as of May 20, 2024. In addition, we have filed, as exhibits to this Annual Report on Form 10-K, the certifications of our principal executive officer and principal financial officer required under Sections 906 and 302 of the Sarbanes-Oxley Act of 2002 to be filed with the Securities and Exchange Commission regarding the quality of our public disclosure.
Additional information will be contained in the Proxy Statement and is incorporated herein by reference.
| | | | | |
| Item 11. | Executive Compensation. |
The information under the heading “Director Compensation” and the information under the headings “Compensation Discussion and Analysis”; “Compensation Committee Report”; “Compensation Tables and Other Information”; and “Pay Ratio Disclosure” under the principal heading “Compensation”; and the information under the subheading “Compensation Committee Interlocks and Insider Participation” under the heading “Corporate Governance” in the Company’s 2025 Proxy Statement is incorporated herein by reference.
| | | | | |
| Item 12. | Security Ownership of Certain Beneficial Owners and Management and Related Stockholder Matters. |
The information under the subheading “Equity Plan Compensation Information” under the heading “Compensation Tables and Other Information” and the information under “Share Ownership” in the Company’s 2025 Proxy Statement is incorporated herein by reference.
| | | | | |
| Item 13. | Certain Relationships and Related Transactions, and Director Independence. |
The information under the subheading “Director Independence” under the principal heading “Corporate Governance” and under the heading “Certain Relationships and Related Transactions” in the Company’s 2025 Proxy Statement is incorporated herein by reference.
| | | | | |
| Item 14. | Principal Accountant Fees and Services. |
The information under the subheadings “Fees Billed by PwC” and “Audit & Finance Committee Pre-Approval Policy” under the heading “Proposal 3 - Ratification of Appointment of Independent Registered Public Accounting Firm” in the Company’s 2025 Proxy Statement is incorporated herein by reference.
| | | | | | | | |
| Albemarle Corporation and Subsidiaries |
| NOTES TO THE CONSOLIDATED FINANCIAL STATEMENTS |
PART IV
| | | | | |
| Item 15. | Exhibits and Financial Statement Schedules. |
(a)(1) The following consolidated financial and informational statements of the registrant are included in Part II Item 8 on pages 80 to 131:
Management’s Report on Internal Control Over Financial Reporting
Report of Independent Registered Public Accounting Firm (PCAOB ID 238)
Consolidated Balance Sheets as of December 31, 2024 and 2023
Consolidated Statements of (Loss) Income, Comprehensive (Loss) Income, Changes in Equity and Cash Flows for the years ended December 31, 2024, 2023 and 2022
Notes to the Consolidated Financial Statements
(a)(2) No financial statement schedules are provided in accordance with Item 15(a)(2) as the information is either not applicable, not required or has been furnished in the Consolidated Financial Statements or Notes thereto.
| | | | | | | | | | | |
| (a)(3) | | Exhibits | |
| | |
| | The following documents are filed as exhibits to this Annual Report on Form 10-K pursuant to Item 601 of Regulation S-K: | |
| | | |
| 3.1* | | | |
| | | |
| 3.2 | | | |
| | |
| 4.1 | | | |
| | | |
| 4.2 | | | |
| | | |
| 4.3 | | Fourth Supplemental Indenture, dated as of January 29, 2015, among Albemarle Corporation, Rockwood Holdings, Inc. (as successor by merger to Albemarle Holdings Corporation), Rockwood Specialties Group, Inc. (as successor by merger to Albemarle Holdings II Corporation), The Bank of New York Mellon Trust Company, N.A., a national banking association, as successor to The Bank of New York, as resigning trustee, and U.S. Bank National Association, as successor trustee [filed as Exhibit 4.1 to the Company’s Current Report on Form 8-K (No. 1-12658) filed on January 29, 2015, and incorporated herein by reference]. | |
| | | |
| 4.4 | | | |
| | | |
| 4.5 | | | |
| | | |
| 4.6 | | | |
| | | | | | | | |
| Albemarle Corporation and Subsidiaries |
|
| | | | | | | | | | | |
| | | |
| 4.7 | | | |
| | | |
| 4.8 | | | |
| | | |
| 4.9 | | | |
| | | |
| 4.10 | | | |
| | | |
| 4.11 | | | |
| | | |
| 4.12 | | | |
| | | |
| 4.13* | | | |
| | | |
| 10.1# | | | |
| | | |
| 10.2# | | | |
| | | |
| 10.3# | | | |
| | | |
| 10.4# | | | |
| | | |
| 10.5# | | | |
| | | |
| 10.6# | | | |
| | | |
| 10.7# | | | |
| | | |
| 10.8# | | | |
| | | |
| 10.9# | | | |
| | | |
| | | | | | | | |
| Albemarle Corporation and Subsidiaries |
|
| | | | | | | | | | | |
| 10.10# | | | |
| | | |
| 10.11# | | | |
| | | |
| 10.12# | | | |
| | | |
| 10.13# | | | |
| | | |
| 10.14# | | | |
| | | |
| 10.15# | | | |
| | | |
| 10.16# | | | |
| | | |
| 10.17# | | | |
| | | |
| 10.18# | | | |
| | | |
| 10.19# | | | |
| | | |
| 10.20# | | | |
| | | |
| 10.21# | | | |
| | | |
| 10.22# | | | |
| | | |
| 10.23# | | | |
| | | |
| 10.24# | | | |
| | | | | | | | |
| Albemarle Corporation and Subsidiaries |
|
| | | | | | | | | | | |
| | | |
| 10.25# | | | |
| | | |
| 10.26# | | | |
| | | |
| 10.27# | | | |
| | | |
| 10.28# | | | |
| | | |
| 10.29# | | | |
| | | |
| 10.30*# | | | |
| | | |
| 10.31# | | | |
| | | |
| 10.32# | | | |
| | | |
| 10.33# | | | |
| | | |
| 10.34# | | | |
| | | |
| 10.35# | | | |
| | | |
| 10.36# | | | |
| | | |
| 10.37# | | | |
| | | |
| 10.38# | | | |
| | | |
| 10.39# | | | |
| | | | | | | | |
| Albemarle Corporation and Subsidiaries |
|
| | | | | | | | | | | |
| | | |
| 10.40# | | | |
| | | |
| 10.41# | | | |
| | | |
| 10.42# | | | |
| | | |
| 10.43 | | | |
| | | |
| 10.44 | | | |
| | | |
| 10.45 | | Amended and Restated Credit Agreement, dated as of October 28, 2022, among Albemarle Corporation, certain other subsidiaries of the Company, the Lenders Party thereto, and Bank of America, N.A., as Administrative Agent for the Lenders [filed as Exhibit 10.1 to the Company’s Quarterly Report on Form 10-Q (No. 1-12658) filed on November 2, 2022, and incorporated herein by reference]. | |
| | | |
| 10.46 | | | |
| | | |
| 10.47 | | | |
| | | |
| 10.48# | | | |
| | | |
| 19* | | | |
| | | |
| | | |
| | | |
| | | |
| | | |
| 23.2 | | | |
| | | |
| 23.3 | | | |
| | | |
| 23.4 | | | |
| | | |
| | | | | | | | |
| Albemarle Corporation and Subsidiaries |
|
| | | | | | | | | | | |
| 23.5 | | | |
| | | |
| 23.6 | | | |
| | | |
| | | |
| | | |
| | | |
| | | |
| | | |
| | | |
| | | |
| | | |
| 96.1 | | | |
| | | |
| 96.2 | | | |
| | | |
| 96.3 | | | |
| | | |
| 96.4 | | | |
| | | |
| 96.5 | | | |
| | | |
| 96.6 | | | |
| | | |
| 97 | | | |
| | | |
| 101* | | Interactive Data Files (Annual Report on Form 10-K, for the fiscal year ended December 31, 2024, furnished in XBRL (eXtensible Business Reporting Language)). | |
| | | |
| | Attached as Exhibit 101 to this report are the following documents formatted in XBRL: (i) the Consolidated Statements of (Loss) Income for the fiscal years ended December 31, 2024, 2023 and 2022, (ii) the Consolidated Statements of Comprehensive (Loss) Income for the fiscal years ended December 31, 2024, 2023 and 2022, (iii) the Consolidated Balance Sheets at December 31, 2024 and 2023, (iv) the Consolidated Statements of Changes in Equity for the fiscal years ended December 31, 2024, 2023 and 2022, (v) the Consolidated Statements of Cash Flows for the fiscal years ended December 31, 2024, 2023 and 2022 and (vi) the Notes to Consolidated Financial Statements. | |
| | | | | | | | |
| Albemarle Corporation and Subsidiaries |
|
| | | | | | | | | | | |
| | | |
| 104* | | Cover Page Interactive Data File (formatted as inline XBRL and contained in Exhibit 101). | |
| | | | | |
| # | Management contract or compensatory plan or arrangement. |
| * | Included with this filing. |
| |
(c) In accordance with Regulation S-X Rule 3-09, the financial statements of Windfield Holdings Pty. Ltd. (“Windfield”) for the year ended December 31, 2024, Windfield’s fiscal year end, will be filed by amendment to this Annual Report on Form 10-K on or before June 30, 2025.
| | | | | |
| Item 16. | Form 10-K Summary. |
NONE
| | | | | | | | |
| Albemarle Corporation and Subsidiaries |
|
SIGNATURES
Pursuant to the requirements of Section 13 or 15(d) of the Securities Exchange Act of 1934, the registrant has duly caused this report to be signed on its behalf by the undersigned thereunto duly authorized. | | | | | | | | |
| | |
ALBEMARLE CORPORATION (Registrant) |
| |
| By: | | /S/ J. KENT MASTERS |
| | (J. Kent Masters) |
| | Chairman, President and Chief Executive Officer |
Dated: February 12, 2025
Pursuant to the requirements of the Securities Exchange Act of 1934, this report has been signed below by the following persons on behalf of the registrant and in the capacities indicated as of February 12, 2025.
| | | | | | | | |
| Signature | | Title |
| |
/S/ J. KENT MASTERS | | Chairman, President and Chief Executive Officer (principal executive |
| (J. Kent Masters) | | officer) |
| |
/S/ NEAL R. SHEOREY | | Executive Vice President, Chief Financial Officer (principal financial |
| (Neal R. Sheorey) | | officer) |
| | |
/S/ DONALD J. LABAUVE | | Vice President, Corporate Controller and Chief Accounting Officer (principal accounting officer) |
| (Donald. J. LaBauve) | |
| | |
/S/ M. LAUREN BRLAS | | Director |
| (M. Lauren Brlas) | | |
| | |
/S/ RALF H. CRAMER | | Director |
| (Ralf H. Cramer) | | |
| | |
/S/ GLENDA J. MINOR | | Director |
| (Glenda J. Minor) | | |
| | |
/S/ JAMES J. O’BRIEN | | Director |
| (James J. O’Brien) | | |
| |
/S/ DIARMUID B. O’CONNELL | | Director |
| (Diarmuid B. O’Connell) | | |
| |
/S/ DEAN L. SEAVERS | | Director |
| (Dean L. Seavers) | | |
| | |
/S/ GERALD A. STEINER | | Director |
| (Gerald A. Steiner) | | |
| |
/S/ HOLLY A. VAN DEURSEN | | Director |
| (Holly A. Van Deursen) | | |
| |
/S/ ALEJANDRO D. WOLFF | | Director |
| (Alejandro D. Wolff) | | |