| JULY 27, 2023 SECOND QUARTER 2023 FINANCIAL RESULTS |
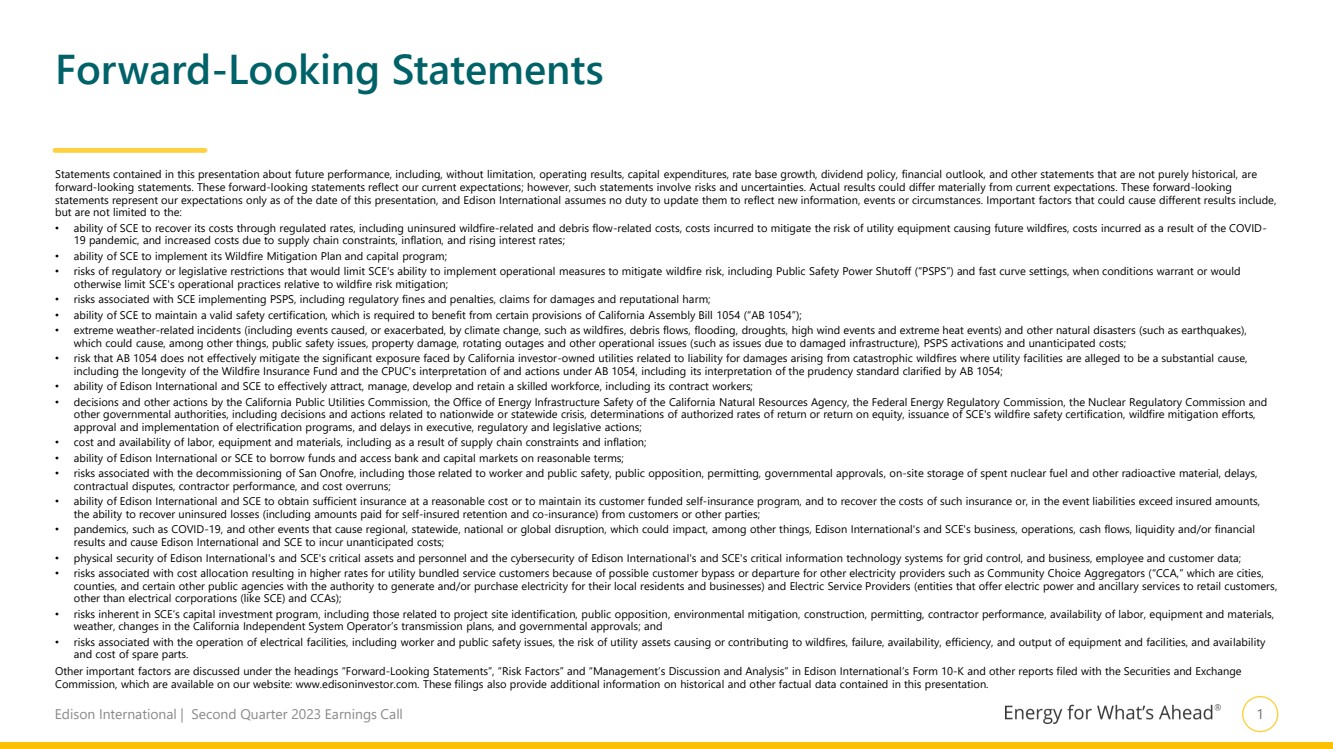
| Edison International | Second Quarter 2023 Earnings Call 1 Statements contained in this presentation about future performance, including, without limitation, operating results, capital expenditures, rate base growth, dividend policy, financial outlook, and other statements that are not purely historical, are forward-looking statements. These forward-looking statements reflect our current expectations; however, such statements involve risks and uncertainties. Actual results could differ materially from current expectations. These forward-looking statements represent our expectations only as of the date of this presentation, and Edison International assumes no duty to update them to reflect new information, events or circumstances. Important factors that could cause different results include, but are not limited to the: • ability of SCE to recover its costs through regulated rates, including uninsured wildfire-related and debris flow-related costs, costs incurred to mitigate the risk of utility equipment causing future wildfires, costs incurred as a result of the COVID-19 pandemic, and increased costs due to supply chain constraints, inflation, and rising interest rates; • ability of SCE to implement its Wildfire Mitigation Plan and capital program; • risks of regulatory or legislative restrictions that would limit SCE's ability to implement operational measures to mitigate wildfire risk, including Public Safety Power Shutoff (“PSPS”) and fast curve settings, when conditions warrant or would otherwise limit SCE's operational practices relative to wildfire risk mitigation; • risks associated with SCE implementing PSPS, including regulatory fines and penalties, claims for damages and reputational harm; • ability of SCE to maintain a valid safety certification, which is required to benefit from certain provisions of California Assembly Bill 1054 (“AB 1054”); • extreme weather-related incidents (including events caused, or exacerbated, by climate change, such as wildfires, debris flows, flooding, droughts, high wind events and extreme heat events) and other natural disasters (such as earthquakes), which could cause, among other things, public safety issues, property damage, rotating outages and other operational issues (such as issues due to damaged infrastructure), PSPS activations and unanticipated costs; • risk that AB 1054 does not effectively mitigate the significant exposure faced by California investor-owned utilities related to liability for damages arising from catastrophic wildfires where utility facilities are alleged to be a substantial cause, including the longevity of the Wildfire Insurance Fund and the CPUC's interpretation of and actions under AB 1054, including its interpretation of the prudency standard clarified by AB 1054; • ability of Edison International and SCE to effectively attract, manage, develop and retain a skilled workforce, including its contract workers; • decisions and other actions by the California Public Utilities Commission, the Office of Energy Infrastructure Safety of the California Natural Resources Agency, the Federal Energy Regulatory Commission, the Nuclear Regulatory Commission and other governmental authorities, including decisions and actions related to nationwide or statewide crisis, determinations of authorized rates of return or return on equity, issuance of SCE's wildfire safety certification, wildfire mitigation efforts, approval and implementation of electrification programs, and delays in executive, regulatory and legislative actions; • cost and availability of labor, equipment and materials, including as a result of supply chain constraints and inflation; • ability of Edison International or SCE to borrow funds and access bank and capital markets on reasonable terms; • risks associated with the decommissioning of San Onofre, including those related to worker and public safety, public opposition, permitting, governmental approvals, on-site storage of spent nuclear fuel and other radioactive material, delays, contractual disputes, contractor performance, and cost overruns; • ability of Edison International and SCE to obtain sufficient insurance at a reasonable cost or to maintain its customer funded self-insurance program, and to recover the costs of such insurance or, in the event liabilities exceed insured amounts, the ability to recover uninsured losses (including amounts paid for self-insured retention and co-insurance) from customers or other parties; • pandemics, such as COVID-19, and other events that cause regional, statewide, national or global disruption, which could impact, among other things, Edison International's and SCE's business, operations, cash flows, liquidity and/or financial results and cause Edison International and SCE to incur unanticipated costs; • physical security of Edison International's and SCE's critical assets and personnel and the cybersecurity of Edison International's and SCE's critical information technology systems for grid control, and business, employee and customer data; • risks associated with cost allocation resulting in higher rates for utility bundled service customers because of possible customer bypass or departure for other electricity providers such as Community Choice Aggregators (“CCA,” which are cities, counties, and certain other public agencies with the authority to generate and/or purchase electricity for their local residents and businesses) and Electric Service Providers (entities that offer electric power and ancillary services to retail customers, other than electrical corporations (like SCE) and CCAs); • risks inherent in SCE’s capital investment program, including those related to project site identification, public opposition, environmental mitigation, construction, permitting, contractor performance, availability of labor, equipment and materials, weather, changes in the California Independent System Operator’s transmission plans, and governmental approvals; and • risks associated with the operation of electrical facilities, including worker and public safety issues, the risk of utility assets causing or contributing to wildfires, failure, availability, efficiency, and output of equipment and facilities, and availability and cost of spare parts. Other important factors are discussed under the headings “Forward-Looking Statements”, “Risk Factors” and “Management’s Discussion and Analysis” in Edison International’s Form 10-K and other reports filed with the Securities and Exchange Commission, which are available on our website: www.edisoninvestor.com. These filings also provide additional information on historical and other factual data contained in this presentation. Forward-Looking Statements |
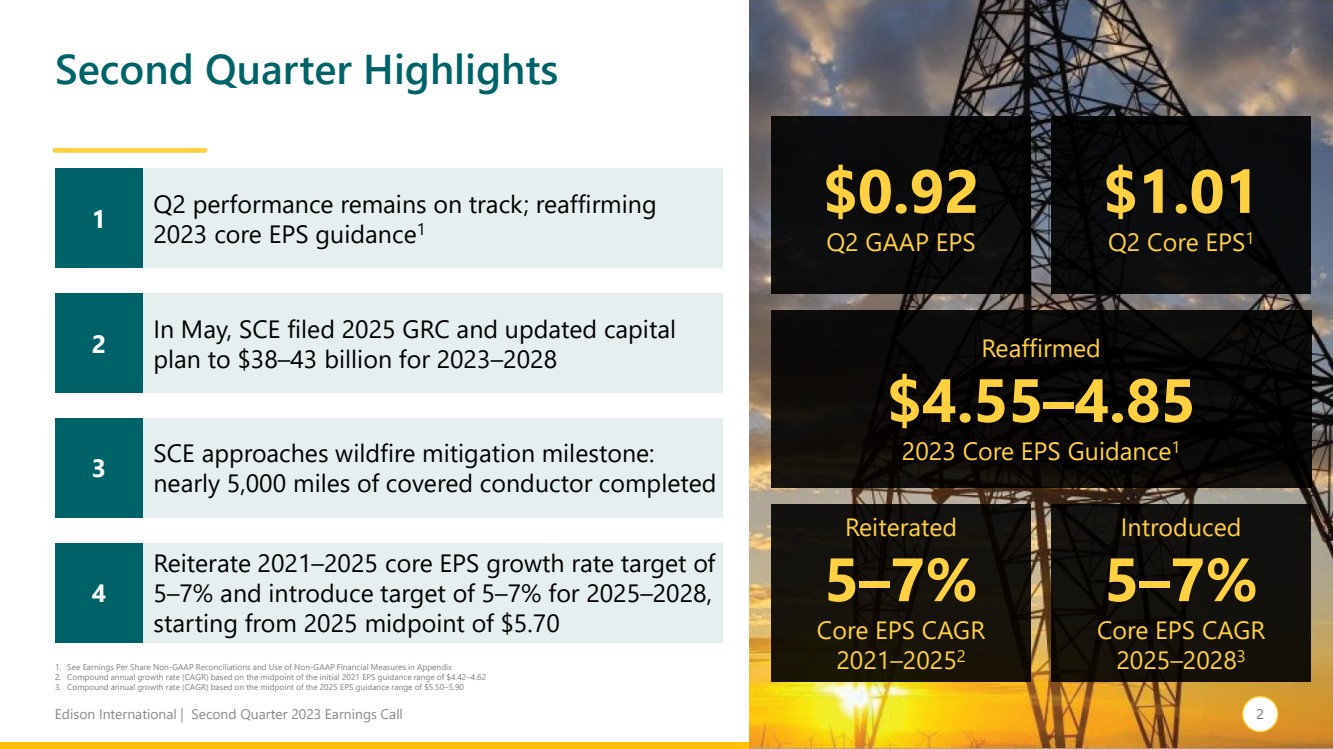
| Edison International | Second Quarter 2023 Earnings Call 2 Second Quarter Highlights $0.92 Q2 GAAP EPS $1.01 Q2 Core EPS1 Introduced 5–7% Core EPS CAGR 2025–20283 Reiterated 5–7% Core EPS CAGR 2021–20252 1 Reaffirmed $4.55–4.85 2023 Core EPS Guidance1 Q2 performance remains on track; reaffirming 2023 core EPS guidance1 2 In May, SCE filed 2025 GRC and updated capital plan to $38–43 billion for 2023–2028 3 SCE approaches wildfire mitigation milestone: nearly 5,000 miles of covered conductor completed 4 Reiterate 2021–2025 core EPS growth rate target of 5–7% and introduce target of 5–7% for 2025–2028, starting from 2025 midpoint of $5.70 1. See Earnings Per Share Non-GAAP Reconciliations and Use of Non-GAAP Financial Measures in Appendix 2. Compound annual growth rate (CAGR) based on the midpoint of the initial 2021 EPS guidance range of $4.42–4.62 3. Compound annual growth rate (CAGR) based on the midpoint of the 2025 EPS guidance range of $5.50–5.90 2 |
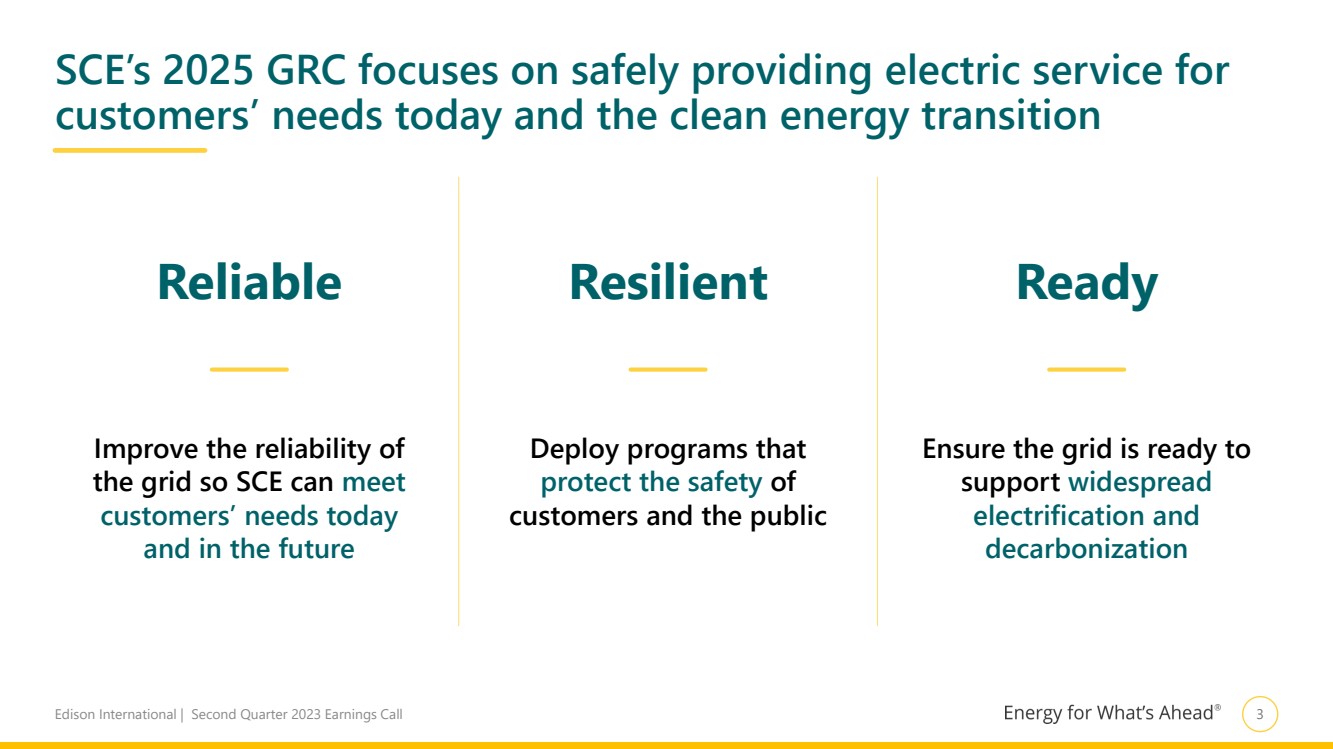
| Edison International | Second Quarter 2023 Earnings Call 3 SCE’s 2025 GRC focuses on safely providing electric service for customers’ needs today and the clean energy transition Reliable Resilient Ready Improve the reliability of the grid so SCE can meet customers’ needs today and in the future Deploy programs that protect the safety of customers and the public Ensure the grid is ready to support widespread electrification and decarbonization |
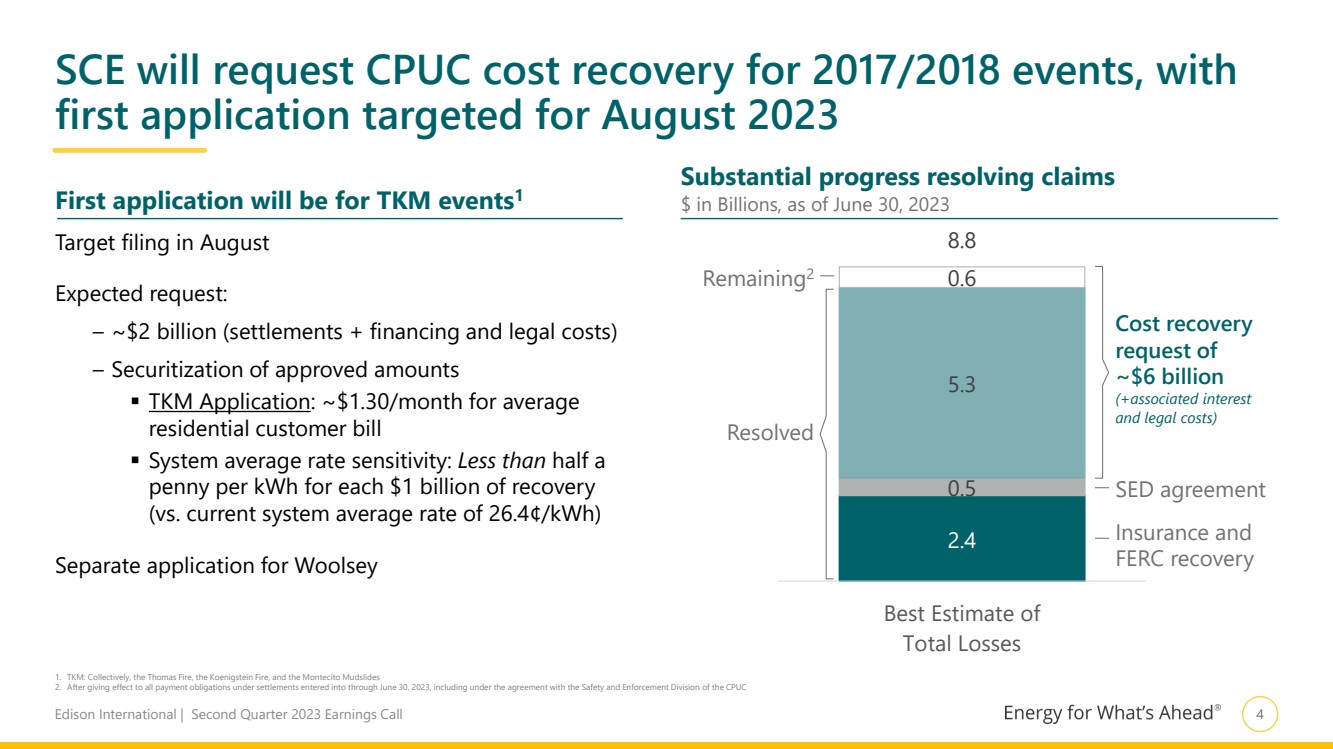
| Edison International | Second Quarter 2023 Earnings Call 4 SCE will request CPUC cost recovery for 2017/2018 events, with first application targeted for August 2023 2.4 0.5 5.3 0.6 8.8 Best Estimate of Total Losses 1. TKM: Collectively, the Thomas Fire, the Koenigstein Fire, and the Montecito Mudslides 2. After giving effect to all payment obligations under settlements entered into through June 30, 2023, including under the agreement with the Safety and Enforcement Division of the CPUC Substantial progress resolving claims First application will be for TKM events $ in Billions, as of June 30, 2023 1 Remaining2 Target filing in August Expected request: – ~$2 billion (settlements + financing and legal costs) – Securitization of approved amounts ▪ TKM Application: ~$1.30/month for average residential customer bill ▪ System average rate sensitivity: Less than half a penny per kWh for each $1 billion of recovery (vs. current system average rate of 26.4¢/kWh) Separate application for Woolsey Resolved Cost recovery request of ~$6 billion (+associated interest and legal costs) SED agreement Insurance and FERC recovery |
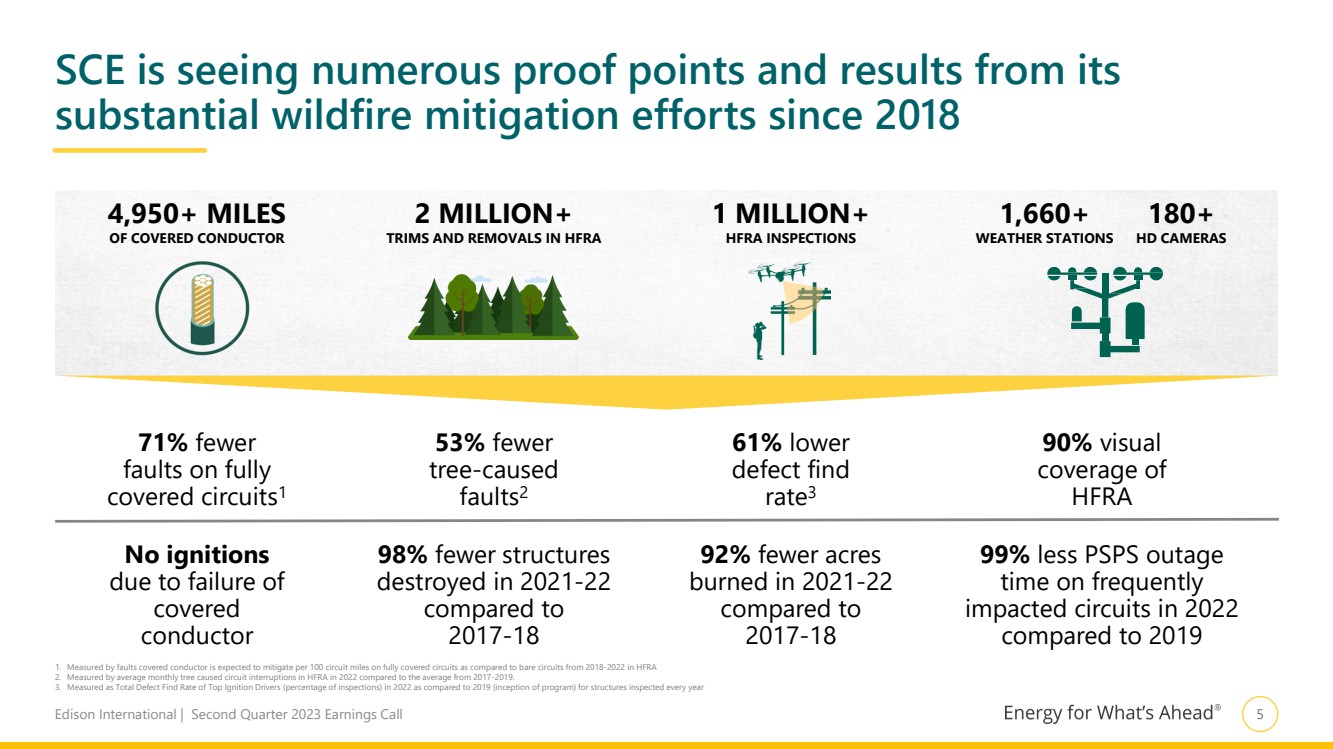
| Edison International | Second Quarter 2023 Earnings Call 5 SCE is seeing numerous proof points and results from its substantial wildfire mitigation efforts since 2018 1. Measured by faults covered conductor is expected to mitigate per 100 circuit miles on fully covered circuits as compared to bare circuits from 2018-2022 in HFRA 2. Measured by average monthly tree caused circuit interruptions in HFRA in 2022 compared to the average from 2017-2019. 3. Measured as Total Defect Find Rate of Top Ignition Drivers (percentage of inspections) in 2022 as compared to 2019 (inception of program) for structures inspected every year 71% fewer faults on fully covered circuits1 53% fewer tree-caused faults2 No ignitions due to failure of covered conductor 61% lower defect find rate3 90% visual coverage of HFRA 98% fewer structures destroyed in 2021-22 compared to 2017-18 92% fewer acres burned in 2021-22 compared to 2017-18 99% less PSPS outage time on frequently impacted circuits in 2022 compared to 2019 4,950+ MILES OF COVERED CONDUCTOR 2 MILLION+ TRIMS AND REMOVALS IN HFRA 1 MILLION+ HFRA INSPECTIONS 1,660+ WEATHER STATIONS 180+ HD CAMERAS |
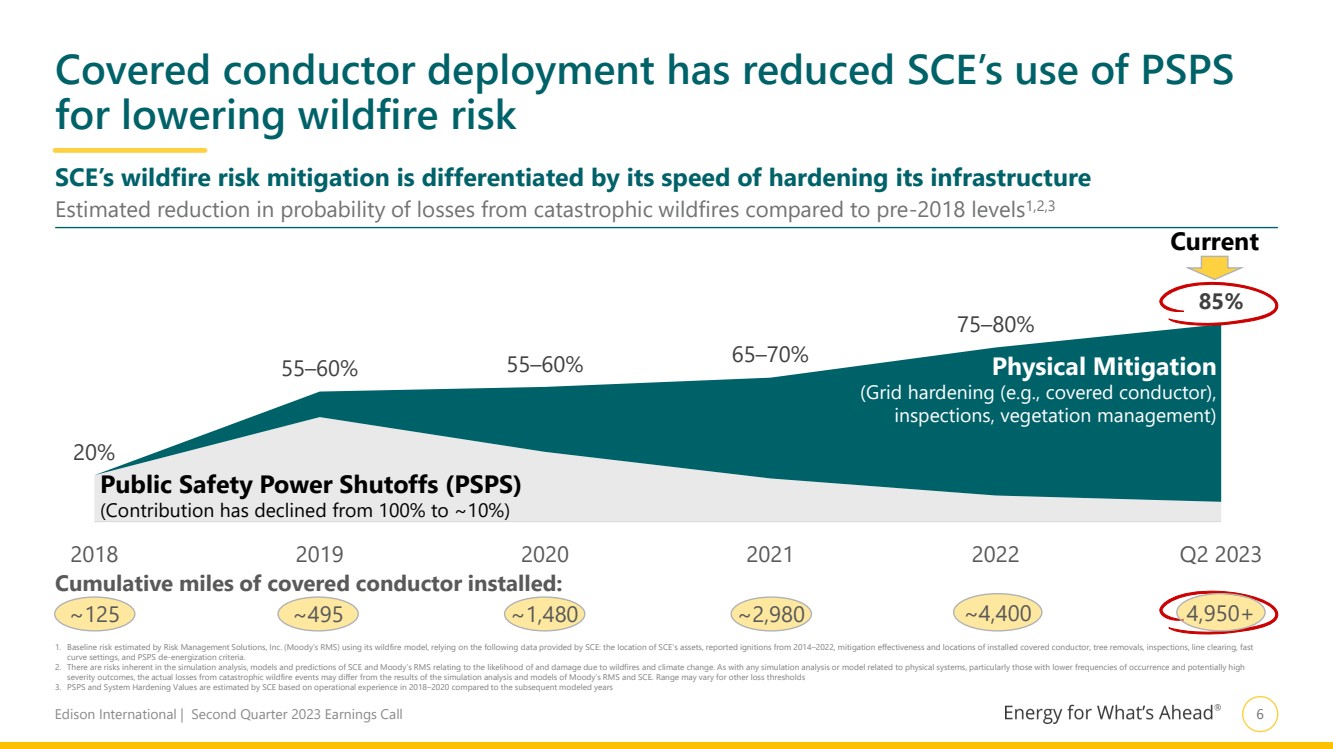
| Edison International | Second Quarter 2023 Earnings Call 6 Covered conductor deployment has reduced SCE’s use of PSPS for lowering wildfire risk 1. Baseline risk estimated by Risk Management Solutions, Inc. (Moody’s RMS) using its wildfire model, relying on the following data provided by SCE: the location of SCE’s assets, reported ignitions from 2014–2022, mitigation effectiveness and locations of installed covered conductor, tree removals, inspections, line clearing, fast curve settings, and PSPS de-energization criteria. 2. There are risks inherent in the simulation analysis, models and predictions of SCE and Moody’s RMS relating to the likelihood of and damage due to wildfires and climate change. As with any simulation analysis or model related to physical systems, particularly those with lower frequencies of occurrence and potentially high severity outcomes, the actual losses from catastrophic wildfire events may differ from the results of the simulation analysis and models of Moody’s RMS and SCE. Range may vary for other loss thresholds 3. PSPS and System Hardening Values are estimated by SCE based on operational experience in 2018–2020 compared to the subsequent modeled years SCE’s wildfire risk mitigation is differentiated by its speed of hardening its infrastructure Estimated reduction in probability of losses from catastrophic wildfires compared to pre-2018 levels1,2,3 20% 55–60% 55–60% 65–70% 75–80% 85% 2018 2019 2020 2021 2022 Q2 2023 Public Safety Power Shutoffs (PSPS) (Contribution has declined from 100% to ~10%) Physical Mitigation (Grid hardening (e.g., covered conductor), inspections, vegetation management) ~125 ~495 ~1,480 ~2,980 ~4,400 Cumulative miles of covered conductor installed: Current 4,950+ |
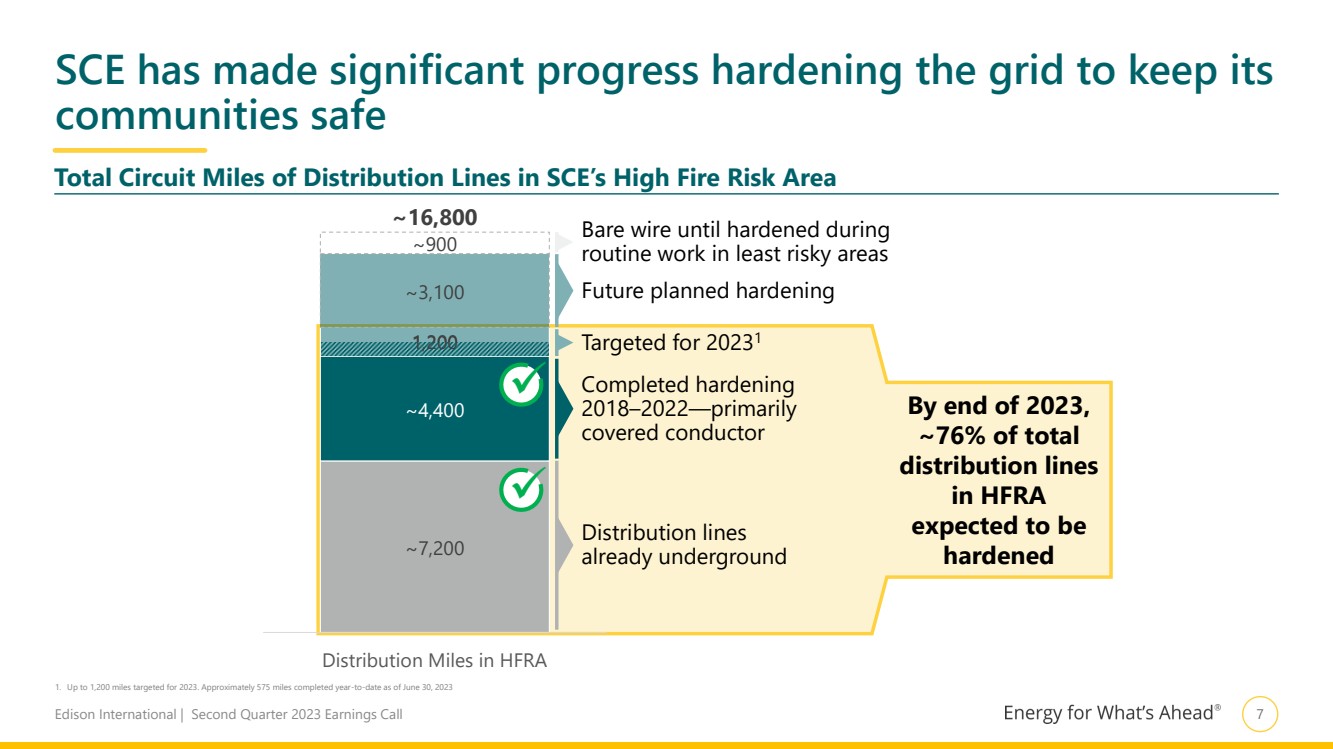
| Edison International | Second Quarter 2023 Earnings Call 7 SCE has made significant progress hardening the grid to keep its communities safe ~7,200 ~4,400 1,200 ~3,100 ~900 ~16,800 Distribution Miles in HFRA ✓ ✓ By end of 2023, ~76% of total distribution lines in HFRA expected to be hardened Distribution lines already underground Completed hardening 2018–2022—primarily covered conductor Future planned hardening Bare wire until hardened during routine work in least risky areas Targeted for 20231 Total Circuit Miles of Distribution Lines in SCE’s High Fire Risk Area 1. Up to 1,200 miles targeted for 2023. Approximately 575 miles completed year-to-date as of June 30, 2023 1,200 |
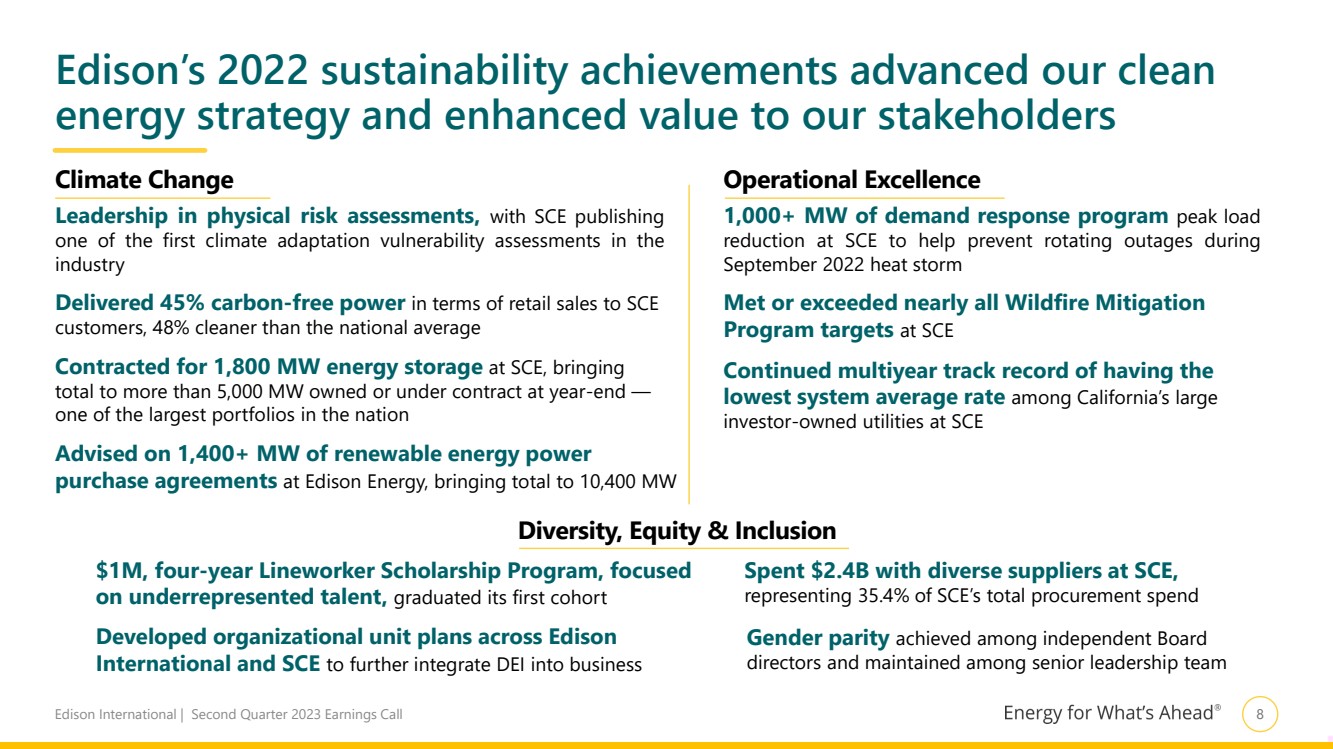
| Edison International | Second Quarter 2023 Earnings Call 8 Edison’s 2022 sustainability achievements advanced our clean energy strategy and enhanced value to our stakeholders Climate Change Leadership in physical risk assessments, with SCE publishing one of the first climate adaptation vulnerability assessments in the industry Delivered 45% carbon-free power in terms of retail sales to SCE customers, 48% cleaner than the national average Contracted for 1,800 MW energy storage at SCE, bringing total to more than 5,000 MW owned or under contract at year-end — one of the largest portfolios in the nation Advised on 1,400+ MW of renewable energy power purchase agreements at Edison Energy, bringing total to 10,400 MW Operational Excellence 1,000+ MW of demand response program peak load reduction at SCE to help prevent rotating outages during September 2022 heat storm Met or exceeded nearly all Wildfire Mitigation Program targets at SCE Continued multiyear track record of having the lowest system average rate among California’s large investor-owned utilities at SCE Diversity, Equity & Inclusion $1M, four-year Lineworker Scholarship Program, focused on underrepresented talent, graduated its first cohort Spent $2.4B with diverse suppliers at SCE, representing 35.4% of SCE’s total procurement spend Developed organizational unit plans across Edison International and SCE to further integrate DEI into business Gender parity achieved among independent Board directors and maintained among senior leadership team |
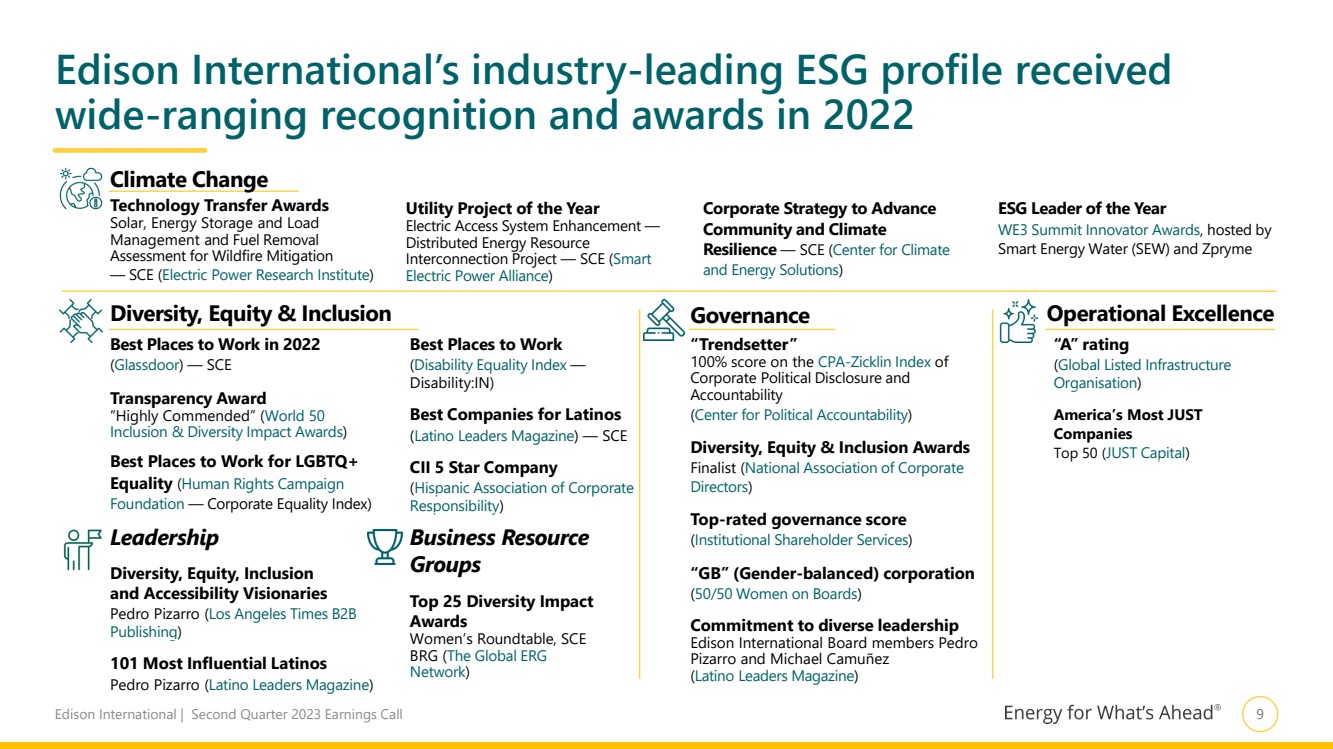
| Edison International | Second Quarter 2023 Earnings Call 9 Edison International’s industry-leading ESG profile received wide-ranging recognition and awards in 2022 Climate Change Technology Transfer Awards Solar, Energy Storage and Load Management and Fuel Removal Assessment for Wildfire Mitigation — SCE (Electric Power Research Institute) Utility Project of the Year Electric Access System Enhancement — Distributed Energy Resource Interconnection Project — SCE (Smart Electric Power Alliance) Corporate Strategy to Advance Community and Climate Resilience — SCE (Center for Climate and Energy Solutions) Diversity, Equity & Inclusion Best Places to Work in 2022 (Glassdoor) — SCE Transparency Award “Highly Commended” (World 50 Inclusion & Diversity Impact Awards) Best Places to Work for LGBTQ+ Equality (Human Rights Campaign Foundation — Corporate Equality Index) Best Places to Work (Disability Equality Index — Disability:IN) Best Companies for Latinos (Latino Leaders Magazine) — SCE CII 5 Star Company (Hispanic Association of Corporate Responsibility) Leadership Diversity, Equity, Inclusion and Accessibility Visionaries Pedro Pizarro (Los Angeles Times B2B Publishing) 101 Most Influential Latinos Pedro Pizarro (Latino Leaders Magazine) Business Resource Groups Top 25 Diversity Impact Awards Women’s Roundtable, SCE BRG (The Global ERG Network) Governance “Trendsetter” 100% score on the CPA-Zicklin Index of Corporate Political Disclosure and Accountability (Center for Political Accountability) Diversity, Equity & Inclusion Awards Finalist (National Association of Corporate Directors) Top-rated governance score (Institutional Shareholder Services) “GB” (Gender-balanced) corporation (50/50 Women on Boards) Commitment to diverse leadership Edison International Board members Pedro Pizarro and Michael Camuñez (Latino Leaders Magazine) Operational Excellence “A” rating (Global Listed Infrastructure Organisation) America’s Most JUST Companies Top 50 (JUST Capital) ESG Leader of the Year WE3 Summit Innovator Awards, hosted by Smart Energy Water (SEW) and Zpryme |
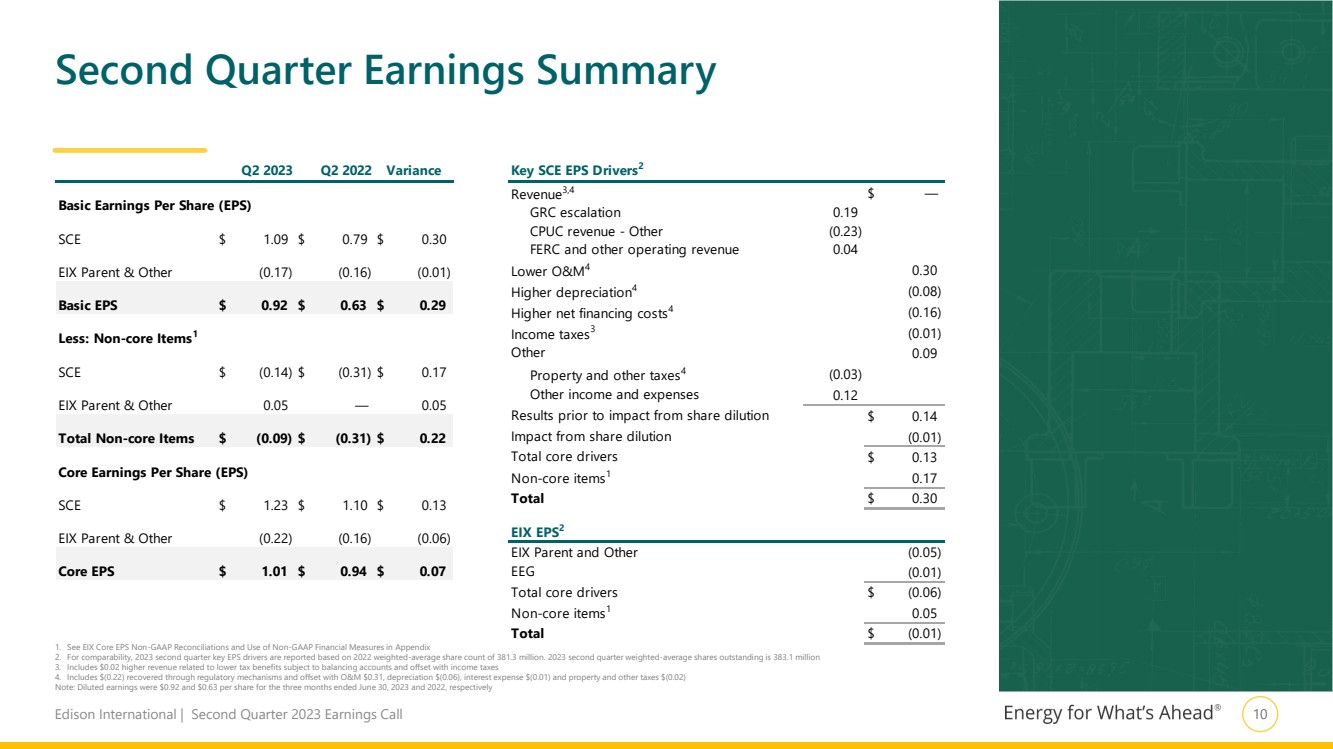
| Edison International | Second Quarter 2023 Earnings Call 10 Key SCE EPS Drivers2 Revenue3,4 $ — GRC escalation 0.19 CPUC revenue - Other (0.23) FERC and other operating revenue 0.04 Lower O&M4 0.30 Higher depreciation4 (0.08) Higher net financing costs4 (0.16) Income taxes3 (0.01) Other 0.09 Property and other taxes4 (0.03) Other income and expenses 0.12 Results prior to impact from share dilution $ 0.14 Impact from share dilution (0.01) Total core drivers $ 0.13 Non-core items1 0.17 Total $ 0.30 (0.05) (0.01) Total core drivers $ (0.06) Non-core items1 0.05 Total $ (0.01) EIX EPS2 EIX Parent and Other EEG Second Quarter Earnings Summary 1. See EIX Core EPS Non-GAAP Reconciliations and Use of Non-GAAP Financial Measures in Appendix 2. For comparability, 2023 second quarter key EPS drivers are reported based on 2022 weighted-average share count of 381.3 million. 2023 second quarter weighted-average shares outstanding is 383.1 million 3. Includes $0.02 higher revenue related to lower tax benefits subject to balancing accounts and offset with income taxes 4. Includes $(0.22) recovered through regulatory mechanisms and offset with O&M $0.31, depreciation $(0.06), interest expense $(0.01) and property and other taxes $(0.02) Note: Diluted earnings were $0.92 and $0.63 per share for the three months ended June 30, 2023 and 2022, respectively Q2 2023 Q2 2022 Variance Basic Earnings Per Share (EPS) SCE $ 1.09 $ 0.79 $ 0.30 EIX Parent & Other (0.17) (0.16) (0.01) Basic EPS $ 0.92 $ 0.63 $ 0.29 Less: Non-core Items1 SCE $ (0.14) $ (0.31) $ 0.17 EIX Parent & Other 0.05 — 0.05 Total Non-core Items $ (0.09) $ (0.31) $ 0.22 Core Earnings Per Share (EPS) SCE $ 1.23 $ 1.10 $ 0.13 EIX Parent & Other (0.22) (0.16) (0.06) Core EPS $ 1.01 $ 0.94 $ 0.07 |
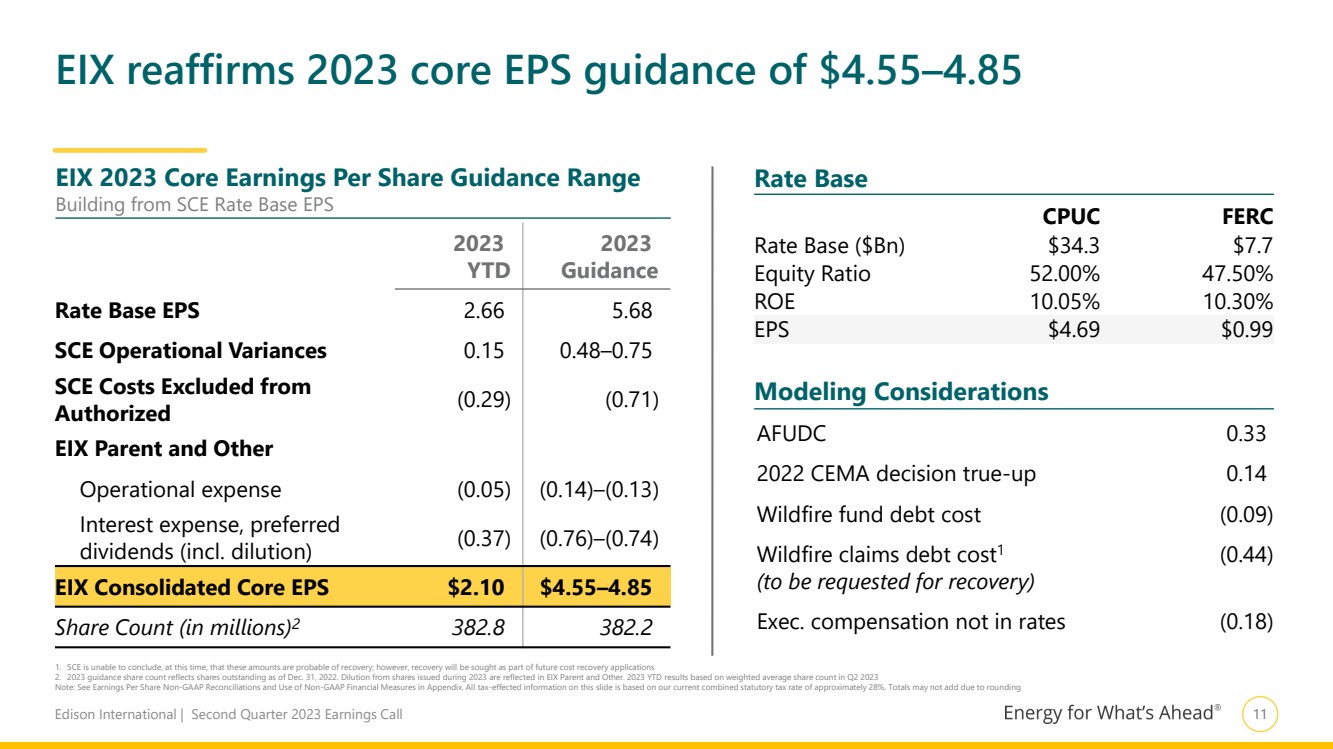
| Edison International | Second Quarter 2023 Earnings Call 11 EIX reaffirms 2023 core EPS guidance of $4.55–4.85 1. SCE is unable to conclude, at this time, that these amounts are probable of recovery; however, recovery will be sought as part of future cost recovery applications 2. 2023 guidance share count reflects shares outstanding as of Dec. 31, 2022. Dilution from shares issued during 2023 are reflected in EIX Parent and Other. 2023 YTD results based on weighted average share count in Q2 2023 Note: See Earnings Per Share Non-GAAP Reconciliations and Use of Non-GAAP Financial Measures in Appendix. All tax-effected information on this slide is based on our current combined statutory tax rate of approximately 28%. Totals may not add due to rounding 2023 YTD 2023 Guidance Rate Base EPS 2.66 5.68 SCE Operational Variances 0.15 0.48–0.75 SCE Costs Excluded from Authorized (0.29) (0.71) EIX Parent and Other Operational expense (0.05) (0.14)–(0.13) Interest expense, preferred dividends (incl. dilution) (0.37) (0.76)–(0.74) EIX Consolidated Core EPS $2.10 $4.55–4.85 Share Count (in millions)2 382.8 382.2 EIX 2023 Core Earnings Per Share Guidance Range Building from SCE Rate Base EPS Rate Base CPUC FERC Rate Base ($Bn) $34.3 $7.7 Equity Ratio 52.00% 47.50% ROE 10.05% 10.30% EPS $4.69 $0.99 Modeling Considerations AFUDC 0.33 2022 CEMA decision true-up 0.14 Wildfire fund debt cost (0.09) Wildfire claims debt cost1 (0.44) (to be requested for recovery) Exec. compensation not in rates (0.18) |
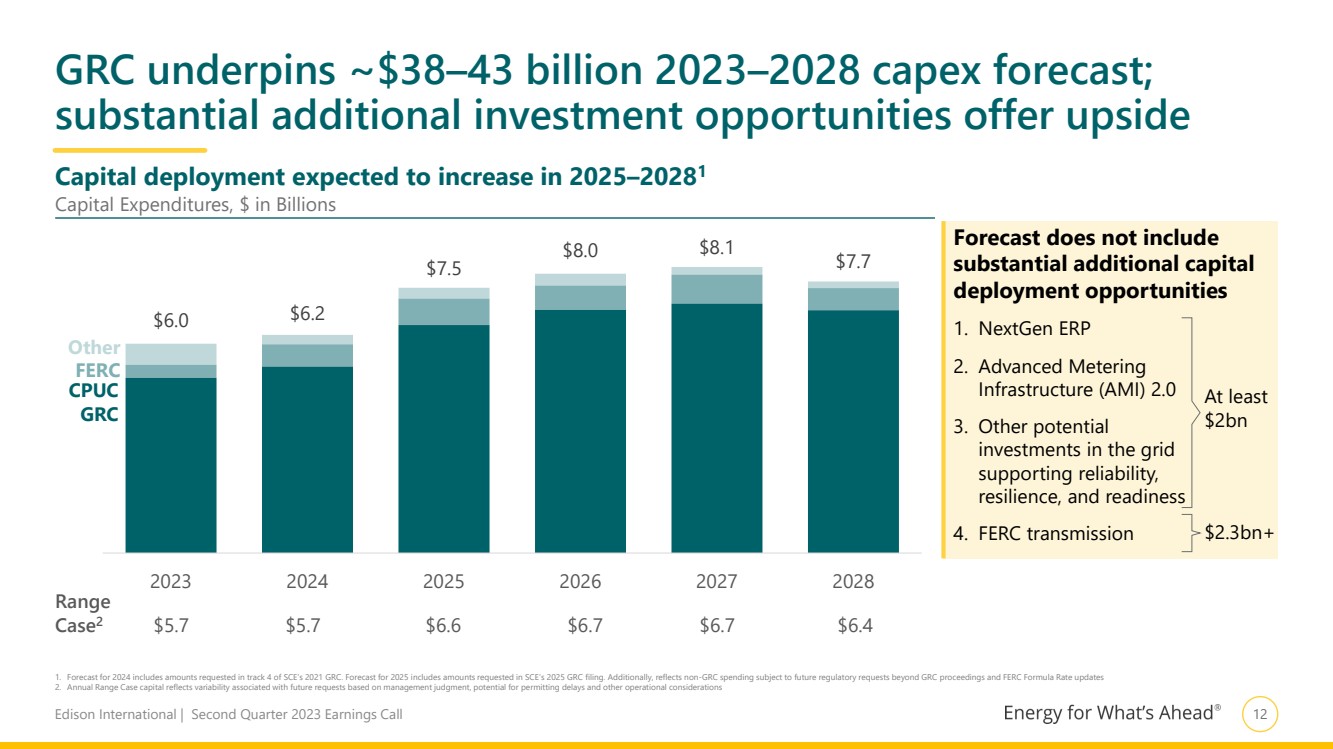
| Edison International | Second Quarter 2023 Earnings Call 12 Capital deployment expected to increase in 2025–20281 Range Case2 $5.7 $5.7 $6.6 $6.7 $6.7 $6.4 $6.0 $6.2 $7.5 $8.0 $8.1 $7.7 2023 2024 2025 2026 2027 2028 GRC underpins ~$38–43 billion 2023–2028 capex forecast; substantial additional investment opportunities offer upside 1. Forecast for 2024 includes amounts requested in track 4 of SCE’s 2021 GRC. Forecast for 2025 includes amounts requested in SCE’s 2025 GRC filing. Additionally, reflects non-GRC spending subject to future regulatory requests beyond GRC proceedings and FERC Formula Rate updates 2. Annual Range Case capital reflects variability associated with future requests based on management judgment, potential for permitting delays and other operational considerations CPUC GRC FERC Other Capital Expenditures, $ in Billions Forecast does not include substantial additional capital deployment opportunities 1. NextGen ERP 2. Advanced Metering Infrastructure (AMI) 2.0 3. Other potential investments in the grid supporting reliability, resilience, and readiness 4. FERC transmission At least $2bn $2.3bn+ |
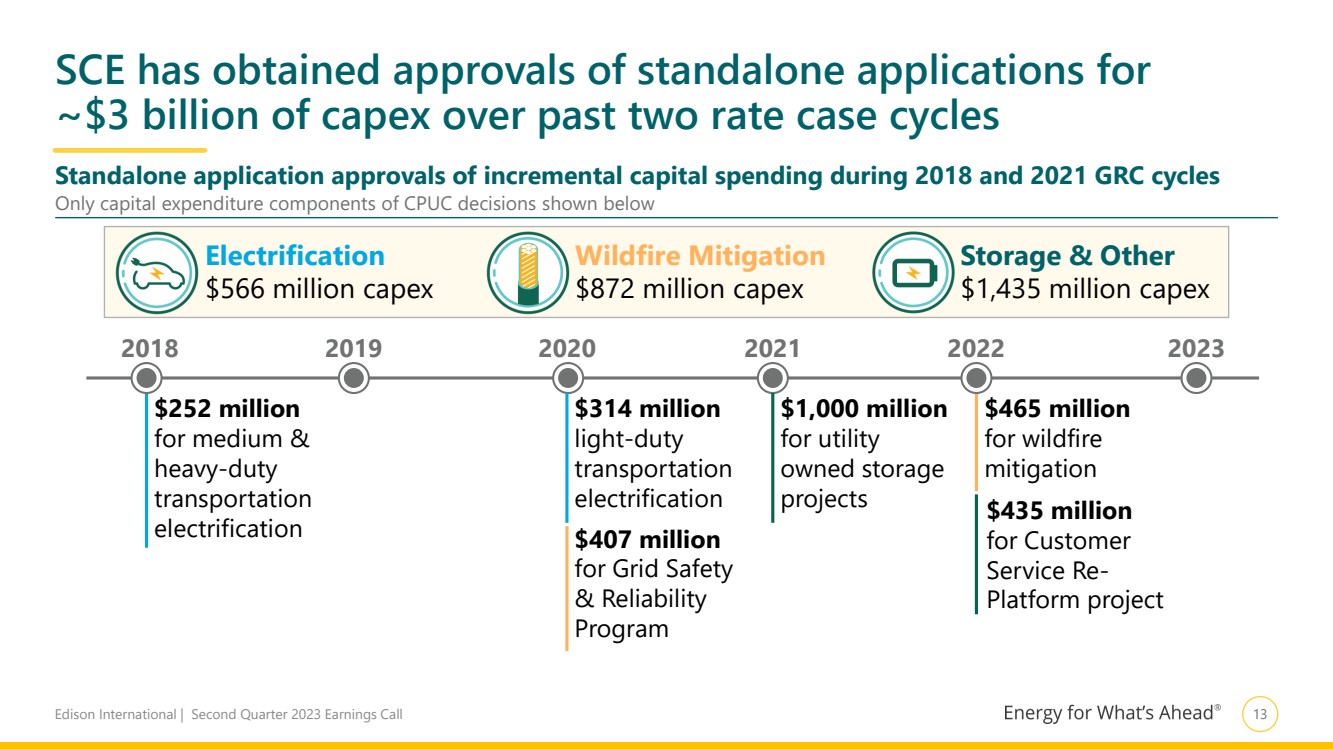
| Edison International | Second Quarter 2023 Earnings Call 13 SCE has obtained approvals of standalone applications for ~$3 billion of capex over past two rate case cycles 2018 2019 2020 2021 2022 2023 $252 million for medium & heavy-duty transportation electrification $314 million light-duty transportation electrification $407 million for Grid Safety & Reliability Program $1,000 million for utility owned storage projects $465 million for wildfire mitigation $435 million for Customer Service Re-Platform project Standalone application approvals of incremental capital spending during 2018 and 2021 GRC cycles Only capital expenditure components of CPUC decisions shown below Electrification $566 million capex Wildfire Mitigation $872 million capex Storage & Other $1,435 million capex |
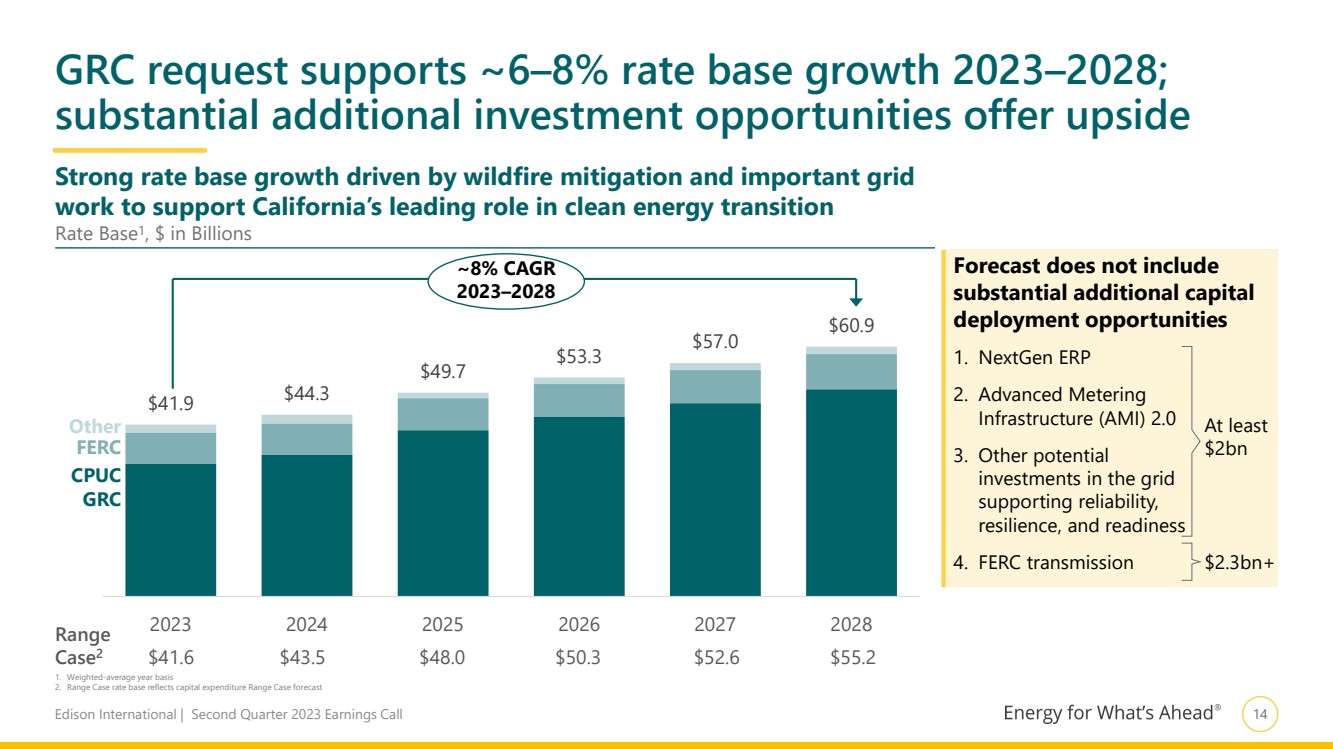
| Edison International | Second Quarter 2023 Earnings Call 14 GRC request supports ~6–8% rate base growth 2023–2028; substantial additional investment opportunities offer upside 1. Weighted-average year basis 2. Range Case rate base reflects capital expenditure Range Case forecast $41.9 $44.3 $49.7 $53.3 $57.0 $60.9 2023 2024 2025 2026 2027 2028 CPUC GRC FERC Other ~8% CAGR 2023–2028 Rate Base1 , $ in Billions Strong rate base growth driven by wildfire mitigation and important grid work to support California’s leading role in clean energy transition Range Case2 $41.6 $43.5 $48.0 $50.3 $52.6 $55.2 Forecast does not include substantial additional capital deployment opportunities 1. NextGen ERP 2. Advanced Metering Infrastructure (AMI) 2.0 3. Other potential investments in the grid supporting reliability, resilience, and readiness 4. FERC transmission At least $2bn $2.3bn+ |
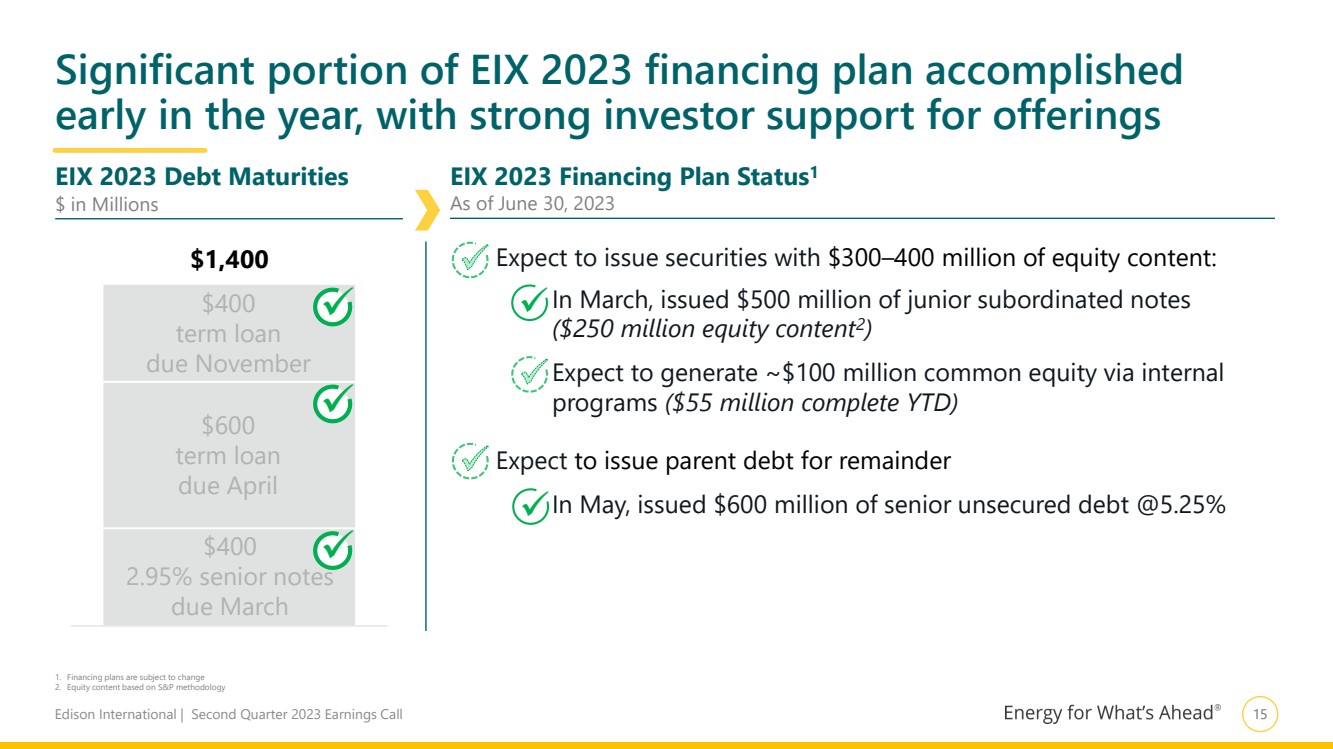
| Edison International | Second Quarter 2023 Earnings Call 15 Significant portion of EIX 2023 financing plan accomplished early in the year, with strong investor support for offerings 1. Financing plans are subject to change 2. Equity content based on S&P methodology $1,400 $400 2.95% senior notes due March $600 term loan due April EIX 2023 Debt Maturities EIX 2023 Financing Plan Status1 $ in Millions Expect to issue securities with $300–400 million of equity content: – In March, issued $500 million of junior subordinated notes ($250 million equity content2 ) – Expect to generate ~$100 million common equity via internal programs ($55 million complete YTD) Expect to issue parent debt for remainder – In May, issued $600 million of senior unsecured debt @5.25% $400 term loan due November ✓ ✓ ✓ As of June 30, 2023 ✓ ✓ |
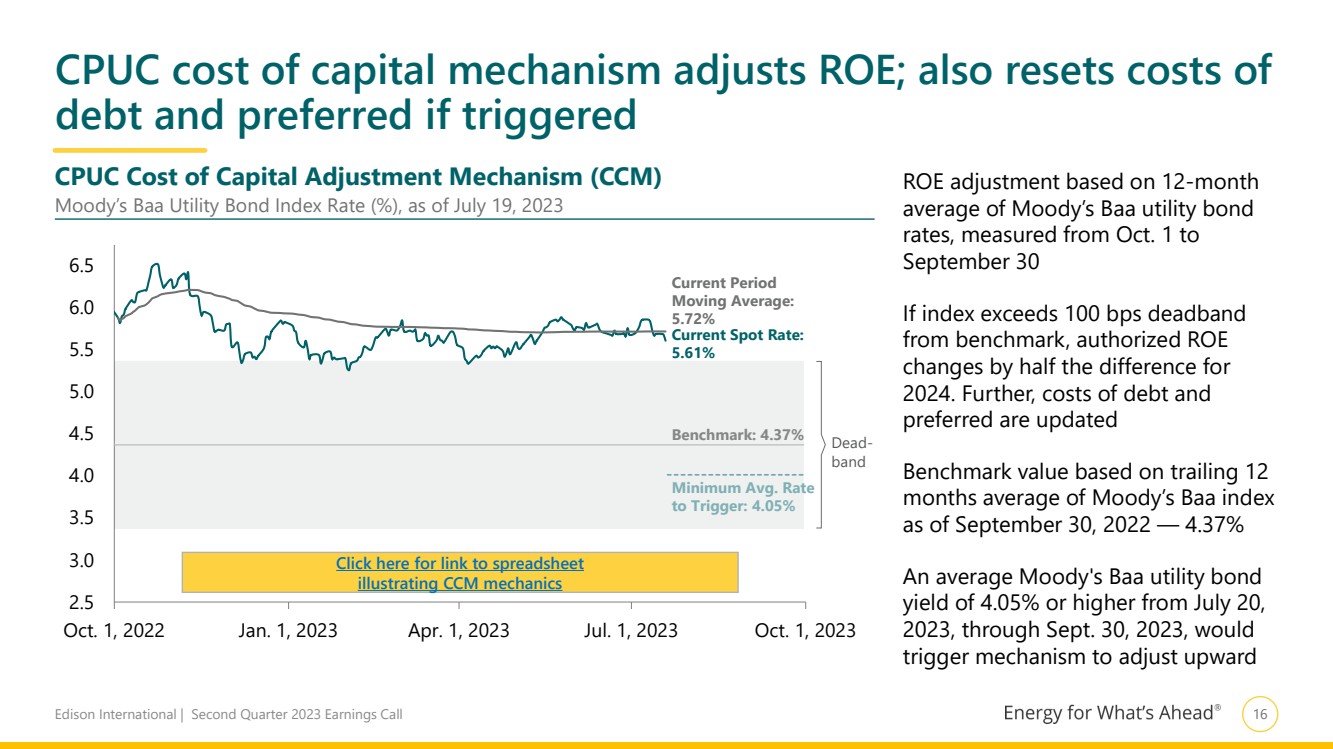
| Edison International | Second Quarter 2023 Earnings Call 16 2.5 3.0 3.5 4.0 4.5 5.0 5.5 6.0 6.5 Oct. 1, 2022 Jan. 1, 2023 Apr. 1, 2023 Jul. 1, 2023 Oct. 1, 2023 CPUC cost of capital mechanism adjusts ROE; also resets costs of debt and preferred if triggered ROE adjustment based on 12-month average of Moody’s Baa utility bond rates, measured from Oct. 1 to September 30 If index exceeds 100 bps deadband from benchmark, authorized ROE changes by half the difference for 2024. Further, costs of debt and preferred are updated Benchmark value based on trailing 12 months average of Moody’s Baa index as of September 30, 2022 — 4.37% An average Moody's Baa utility bond yield of 4.05% or higher from July 20, 2023, through Sept. 30, 2023, would trigger mechanism to adjust upward CPUC Cost of Capital Adjustment Mechanism (CCM) Moody’s Baa Utility Bond Index Rate (%), as of July 19, 2023 https://www.edison.com/_gallery/get_file/?file_id=63d432a6b3aed337c6e7381c&file_ext=.xlsx&page_id= Click here for link to spreadsheet illustrating CCM mechanics Current Period Moving Average: 5.72% Current Spot Rate: 5.61% Minimum Avg. Rate to Trigger: 4.05% Benchmark: 4.37% Dead-band |
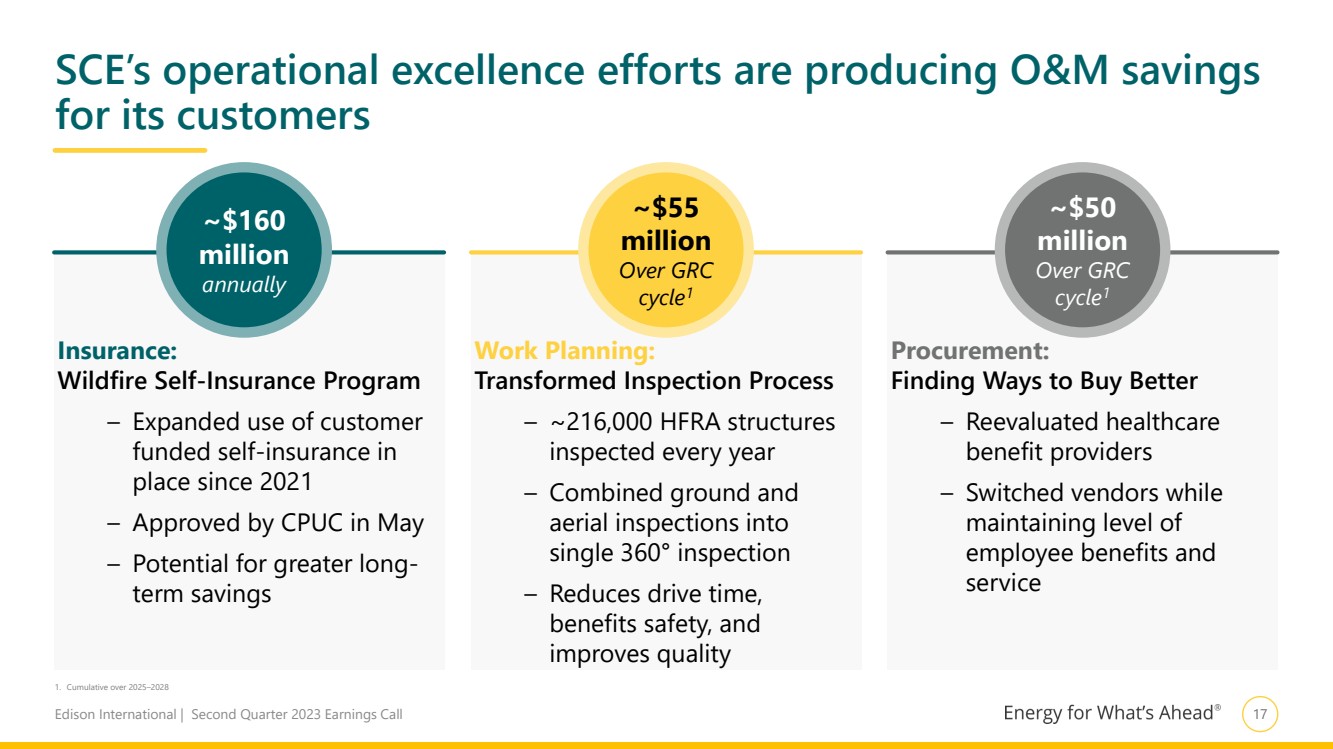
| Edison International | Second Quarter 2023 Earnings Call 17 SCE’s operational excellence efforts are producing O&M savings for its customers Insurance: Wildfire Self-Insurance Program – Expanded use of customer funded self-insurance in place since 2021 – Approved by CPUC in May – Potential for greater long-term savings Work Planning: Transformed Inspection Process – ~216,000 HFRA structures inspected every year – Combined ground and aerial inspections into single 360° inspection – Reduces drive time, benefits safety, and improves quality Procurement: Finding Ways to Buy Better – Reevaluated healthcare benefit providers – Switched vendors while maintaining level of employee benefits and service 1. Cumulative over 2025–2028 ~$160 million annually ~$50 million Over GRC cycle1 ~$55 million Over GRC cycle1 |
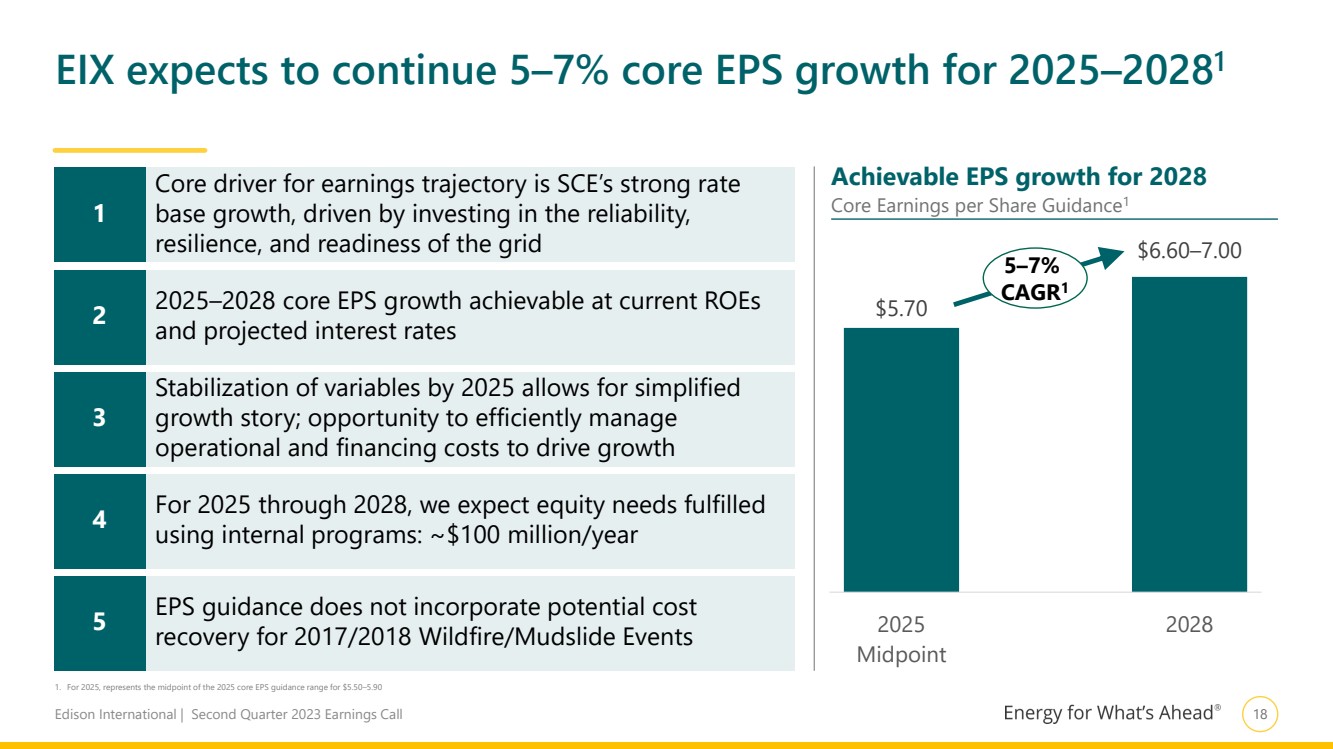
| Edison International | Second Quarter 2023 Earnings Call 18 EIX expects to continue 5–7% core EPS growth for 2025–20281 1. For 2025, represents the midpoint of the 2025 core EPS guidance range for $5.50–5.90 $5.70 $6.60–7.00 2025 Midpoint 2028 Achievable EPS growth for 2028 Core Earnings per Share Guidance1 1 Core driver for earnings trajectory is SCE’s strong rate base growth, driven by investing in the reliability, resilience, and readiness of the grid 2 2025–2028 core EPS growth achievable at current ROEs and projected interest rates 3 Stabilization of variables by 2025 allows for simplified growth story; opportunity to efficiently manage operational and financing costs to drive growth 4 For 2025 through 2028, we expect equity needs fulfilled using internal programs: ~$100 million/year 5–7% CAGR1 5 EPS guidance does not incorporate potential cost recovery for 2017/2018 Wildfire/Mudslide Events |
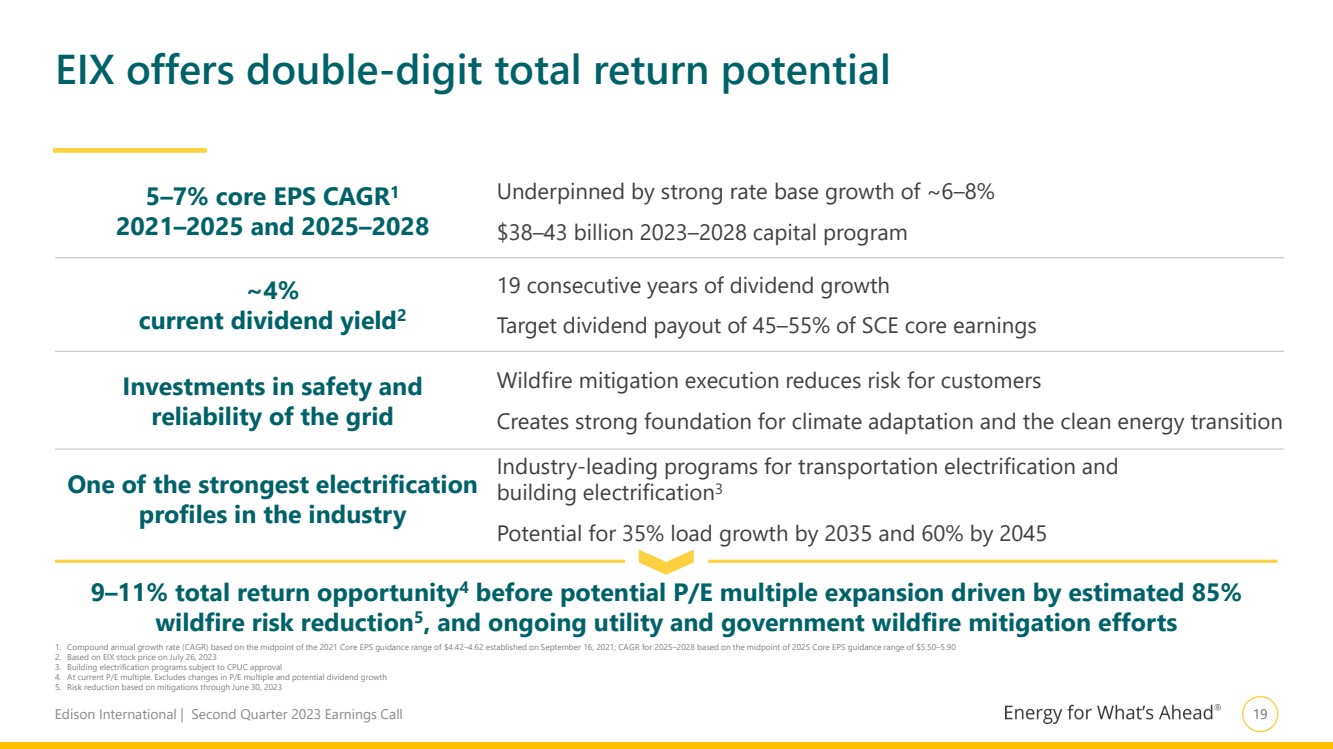
| Edison International | Second Quarter 2023 Earnings Call 19 EIX offers double-digit total return potential 1. Compound annual growth rate (CAGR) based on the midpoint of the 2021 Core EPS guidance range of $4.42–4.62 established on September 16, 2021; CAGR for 2025–2028 based on the midpoint of 2025 Core EPS guidance range of $5.50–5.90 2. Based on EIX stock price on July 26, 2023 3. Building electrification programs subject to CPUC approval 4. At current P/E multiple. Excludes changes in P/E multiple and potential dividend growth 5. Risk reduction based on mitigations through June 30, 2023 5–7% core EPS CAGR1 2021–2025 and 2025–2028 Underpinned by strong rate base growth of ~6–8% $38–43 billion 2023–2028 capital program ~4% current dividend yield2 19 consecutive years of dividend growth Target dividend payout of 45–55% of SCE core earnings Investments in safety and reliability of the grid Wildfire mitigation execution reduces risk for customers Creates strong foundation for climate adaptation and the clean energy transition One of the strongest electrification profiles in the industry Industry-leading programs for transportation electrification and building electrification3 Potential for 35% load growth by 2035 and 60% by 2045 9–11% total return opportunity4 before potential P/E multiple expansion driven by estimated 85% wildfire risk reduction5 , and ongoing utility and government wildfire mitigation efforts |
| ADDITIONAL INFORMATION |

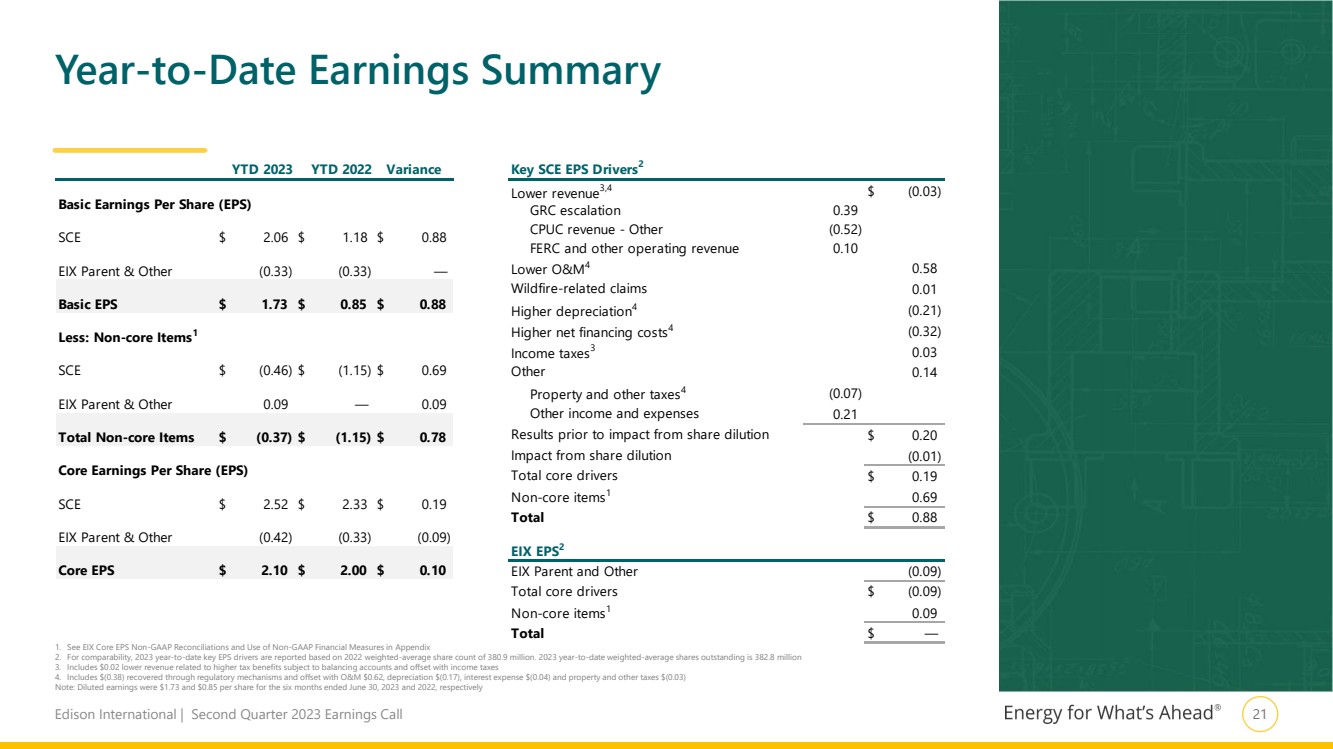
| Edison International | Second Quarter 2023 Earnings Call 21 YTD 2023 YTD 2022 Variance Basic Earnings Per Share (EPS) SCE $ 2.06 $ 1.18 $ 0.88 EIX Parent & Other (0.33) (0.33) — Basic EPS $ 1.73 $ 0.85 $ 0.88 Less: Non-core Items1 SCE $ (0.46) $ (1.15) $ 0.69 EIX Parent & Other 0.09 — 0.09 Total Non-core Items $ (0.37) $ (1.15) $ 0.78 Core Earnings Per Share (EPS) SCE $ 2.52 $ 2.33 $ 0.19 EIX Parent & Other (0.42) (0.33) (0.09) Core EPS $ 2.10 $ 2.00 $ 0.10 Key SCE EPS Drivers2 Lower revenue3,4 $ (0.03) GRC escalation 0.39 CPUC revenue - Other (0.52) FERC and other operating revenue 0.10 Lower O&M4 0.58 Wildfire-related claims 0.01 Higher depreciation4 (0.21) Higher net financing costs4 (0.32) Income taxes3 0.03 Other 0.14 Property and other taxes4 (0.07) Other income and expenses 0.21 Results prior to impact from share dilution $ 0.20 Impact from share dilution (0.01) Total core drivers $ 0.19 Non-core items1 0.69 Total $ 0.88 (0.09) Total core drivers $ (0.09) Non-core items1 0.09 Total $ — EIX EPS2 EIX Parent and Other Year-to-Date Earnings Summary 1. See EIX Core EPS Non-GAAP Reconciliations and Use of Non-GAAP Financial Measures in Appendix 2. For comparability, 2023 year-to-date key EPS drivers are reported based on 2022 weighted-average share count of 380.9 million. 2023 year-to-date weighted-average shares outstanding is 382.8 million 3. Includes $0.02 lower revenue related to higher tax benefits subject to balancing accounts and offset with income taxes 4. Includes $(0.38) recovered through regulatory mechanisms and offset with O&M $0.62, depreciation $(0.17), interest expense $(0.04) and property and other taxes $(0.03) Note: Diluted earnings were $1.73 and $0.85 per share for the six months ended June 30, 2023 and 2022, respectively |
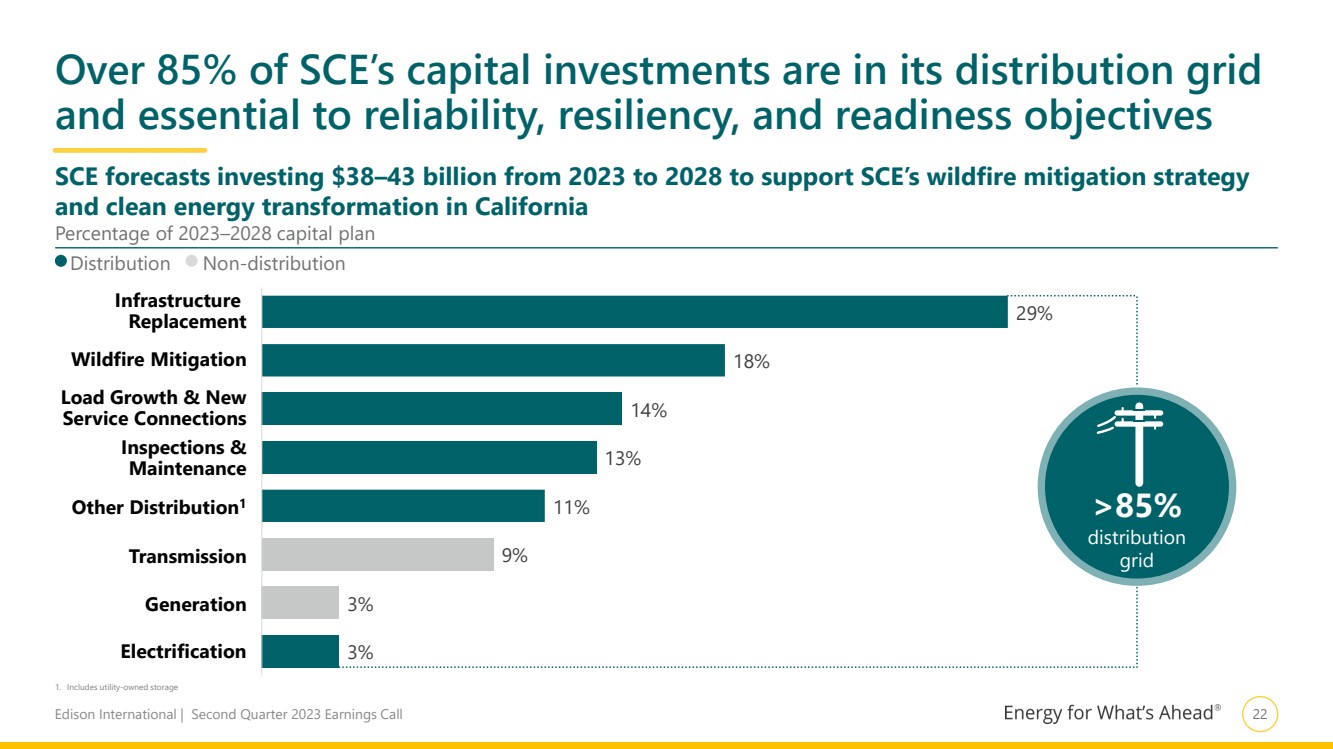
| Edison International | Second Quarter 2023 Earnings Call 22 Over 85% of SCE’s capital investments are in its distribution grid and essential to reliability, resiliency, and readiness objectives 1. Includes utility-owned storage Distribution Non-distribution 29% 18% 14% 13% 11% 9% 3% 3% Infrastructure Replacement Wildfire Mitigation Load Growth & New Service Connections Inspections & Maintenance Other Distribution1 Transmission Generation Electrification >85% distribution grid SCE forecasts investing $38–43 billion from 2023 to 2028 to support SCE’s wildfire mitigation strategy and clean energy transformation in California Percentage of 2023–2028 capital plan |
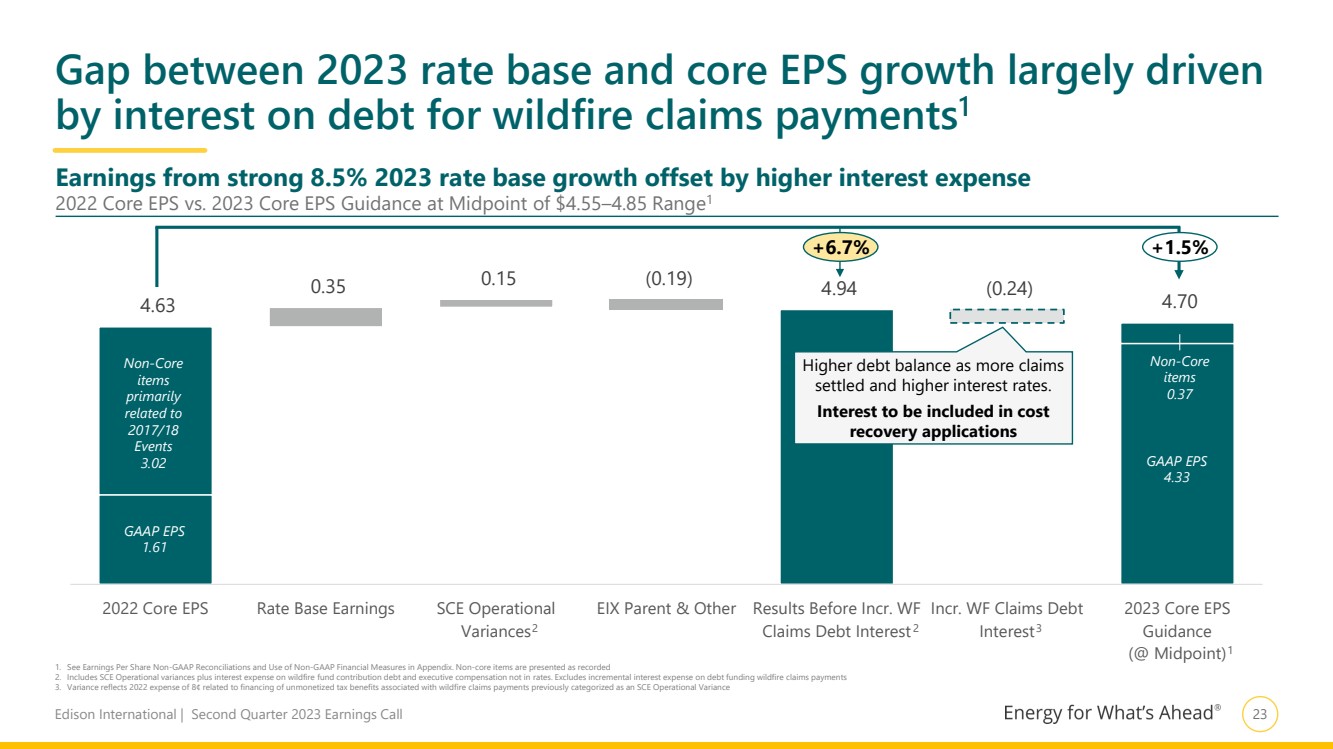
| Edison International | Second Quarter 2023 Earnings Call 23 4.63 0.35 0.15 (0.19) 4.94 (0.24) 4.70 2022 Core EPS Rate Base Earnings SCE Operational Variances EIX Parent & Other Results Before Incr. WF Claims Debt Interest Incr. WF Claims Debt Interest 2023 Core EPS Guidance (@ Midpoint) Gap between 2023 rate base and core EPS growth largely driven by interest on debt for wildfire claims payments1 1. See Earnings Per Share Non-GAAP Reconciliations and Use of Non-GAAP Financial Measures in Appendix. Non-core items are presented as recorded 2. Includes SCE Operational variances plus interest expense on wildfire fund contribution debt and executive compensation not in rates. Excludes incremental interest expense on debt funding wildfire claims payments 3. Variance reflects 2022 expense of 8¢ related to financing of unmonetized tax benefits associated with wildfire claims payments previously categorized as an SCE Operational Variance Earnings from strong 8.5% 2023 rate base growth offset by higher interest expense 2022 Core EPS vs. 2023 Core EPS Guidance at Midpoint of $4.55–4.85 Range1 Higher debt balance as more claims settled and higher interest rates. Interest to be included in cost recovery applications +6.7% +1.5% GAAP EPS 1.61 Non-Core items primarily related to 2017/18 Events 3.02 2 2 1 3 GAAP EPS 4.33 Non-Core items 0.37 |
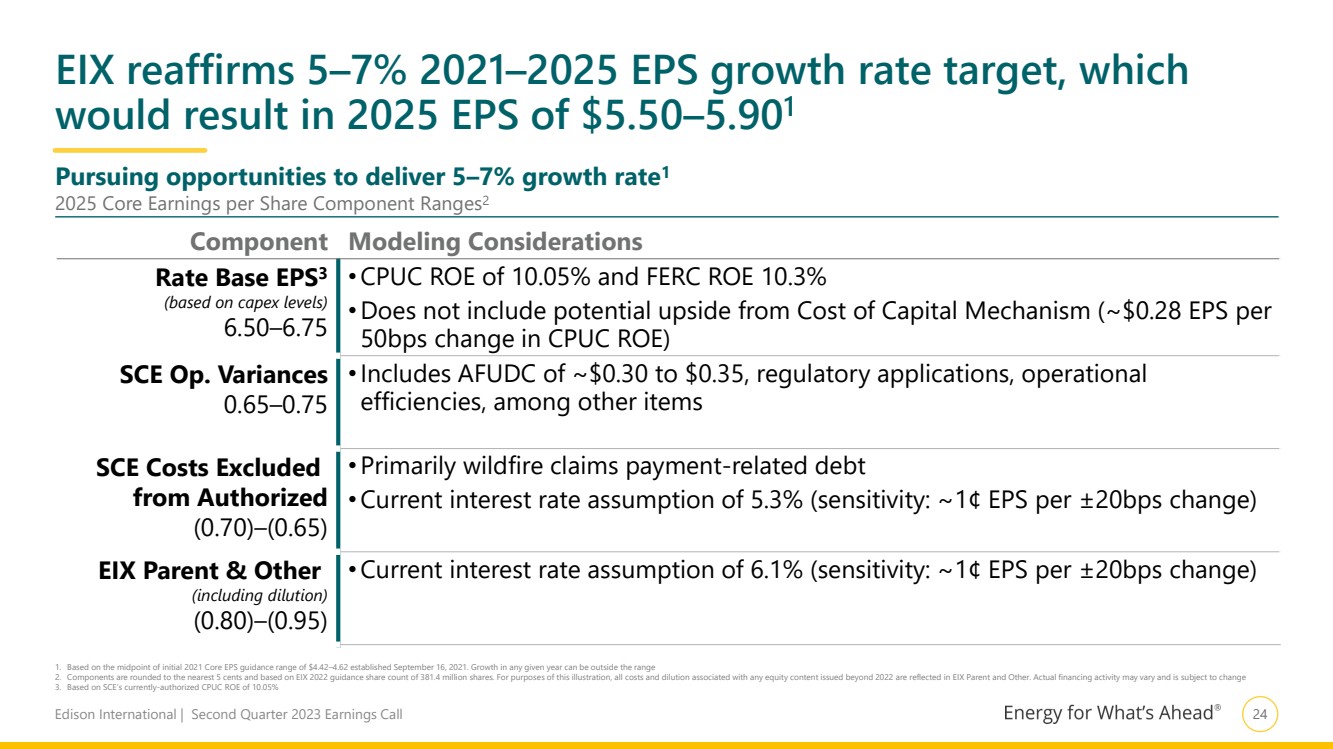
| Edison International | Second Quarter 2023 Earnings Call 24 EIX reaffirms 5–7% 2021–2025 EPS growth rate target, which would result in 2025 EPS of $5.50–5.901 1. Based on the midpoint of initial 2021 Core EPS guidance range of $4.42–4.62 established September 16, 2021. Growth in any given year can be outside the range 2. Components are rounded to the nearest 5 cents and based on EIX 2022 guidance share count of 381.4 million shares. For purposes of this illustration, all costs and dilution associated with any equity content issued beyond 2022 are reflected in EIX Parent and Other. Actual financing activity may vary and is subject to change 3. Based on SCE’s currently-authorized CPUC ROE of 10.05% Component Modeling Considerations Rate Base EPS3 (based on capex levels) 6.50–6.75 •CPUC ROE of 10.05% and FERC ROE 10.3% •Does not include potential upside from Cost of Capital Mechanism (~$0.28 EPS per 50bps change in CPUC ROE) SCE Op. Variances 0.65–0.75 •Includes AFUDC of ~$0.30 to $0.35, regulatory applications, operational efficiencies, among other items SCE Costs Excluded from Authorized (0.70)–(0.65) •Primarily wildfire claims payment-related debt •Current interest rate assumption of 5.3% (sensitivity: ~1¢ EPS per ±20bps change) EIX Parent & Other (including dilution) (0.80)–(0.95) •Current interest rate assumption of 6.1% (sensitivity: ~1¢ EPS per ±20bps change) Pursuing opportunities to deliver 5–7% growth rate1 2025 Core Earnings per Share Component Ranges2 |
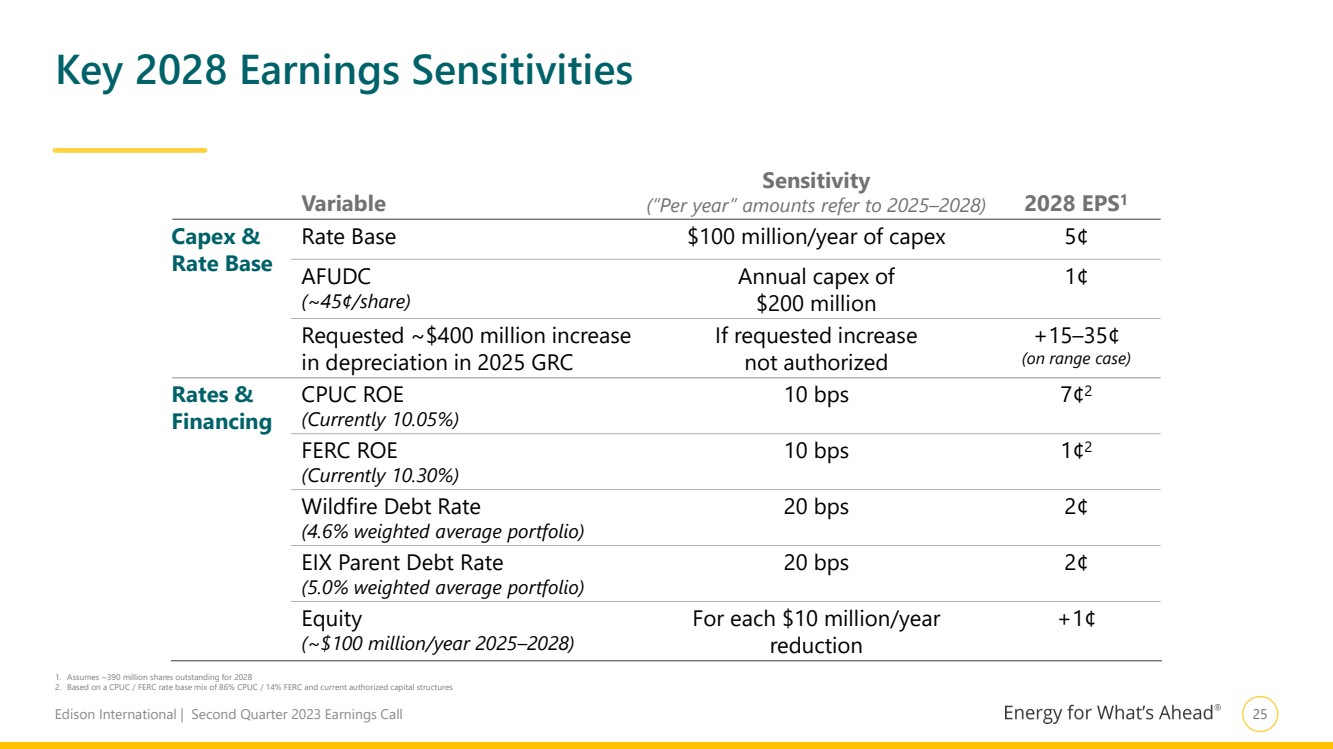
| Edison International | Second Quarter 2023 Earnings Call 25 Key 2028 Earnings Sensitivities Variable Sensitivity 2028 EPS1 (“Per year” amounts refer to 2025–2028) Capex & Rate Base Rate Base $100 million/year of capex 5¢ AFUDC (~45¢/share) Annual capex of $200 million 1¢ Requested ~$400 million increase in depreciation in 2025 GRC If requested increase not authorized +15–35¢ (on range case) Rates & Financing CPUC ROE (Currently 10.05%) 10 bps 7¢2 FERC ROE (Currently 10.30%) 10 bps 1¢2 Wildfire Debt Rate (4.6% weighted average portfolio) 20 bps 2¢ EIX Parent Debt Rate (5.0% weighted average portfolio) 20 bps 2¢ Equity (~$100 million/year 2025–2028) For each $10 million/year reduction +1¢ 1. Assumes ~390 million shares outstanding for 2028 2. Based on a CPUC / FERC rate base mix of 86% CPUC / 14% FERC and current authorized capital structures |
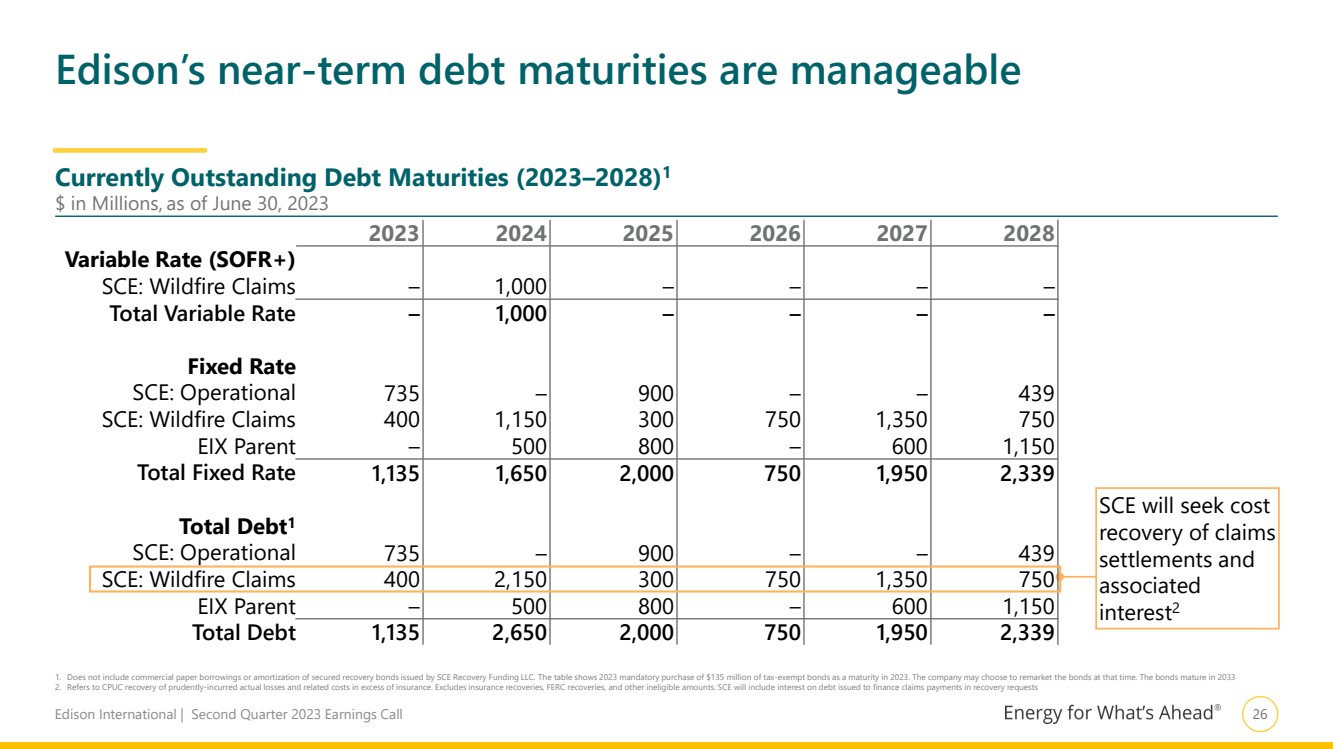
| Edison International | Second Quarter 2023 Earnings Call 26 Edison’s near-term debt maturities are manageable Currently Outstanding Debt Maturities (2023–2028)1 2023 2024 2025 2026 2027 2028 Variable Rate (SOFR+) SCE: Wildfire Claims – 1,000 – – – – Total Variable Rate – 1,000 – – – – Fixed Rate SCE: Operational 735 – 900 – – 439 SCE: Wildfire Claims 400 1,150 300 750 1,350 750 EIX Parent – 500 800 – 600 1,150 Total Fixed Rate 1,135 1,650 2,000 750 1,950 2,339 Total Debt1 SCE: Operational 735 – 900 – – 439 SCE: Wildfire Claims 400 2,150 300 750 1,350 750 EIX Parent – 500 800 – 600 1,150 Total Debt 1,135 2,650 2,000 750 1,950 2,339 $ in Millions, as of June 30, 2023 SCE will seek cost recovery of claims settlements and associated interest2 1. Does not include commercial paper borrowings or amortization of secured recovery bonds issued by SCE Recovery Funding LLC. The table shows 2023 mandatory purchase of $135 million of tax-exempt bonds as a maturity in 2023. The company may choose to remarket the bonds at that time. The bonds mature in 2033 2. Refers to CPUC recovery of prudently-incurred actual losses and related costs in excess of insurance. Excludes insurance recoveries, FERC recoveries, and other ineligible amounts. SCE will include interest on debt issued to finance claims payments in recovery requests |
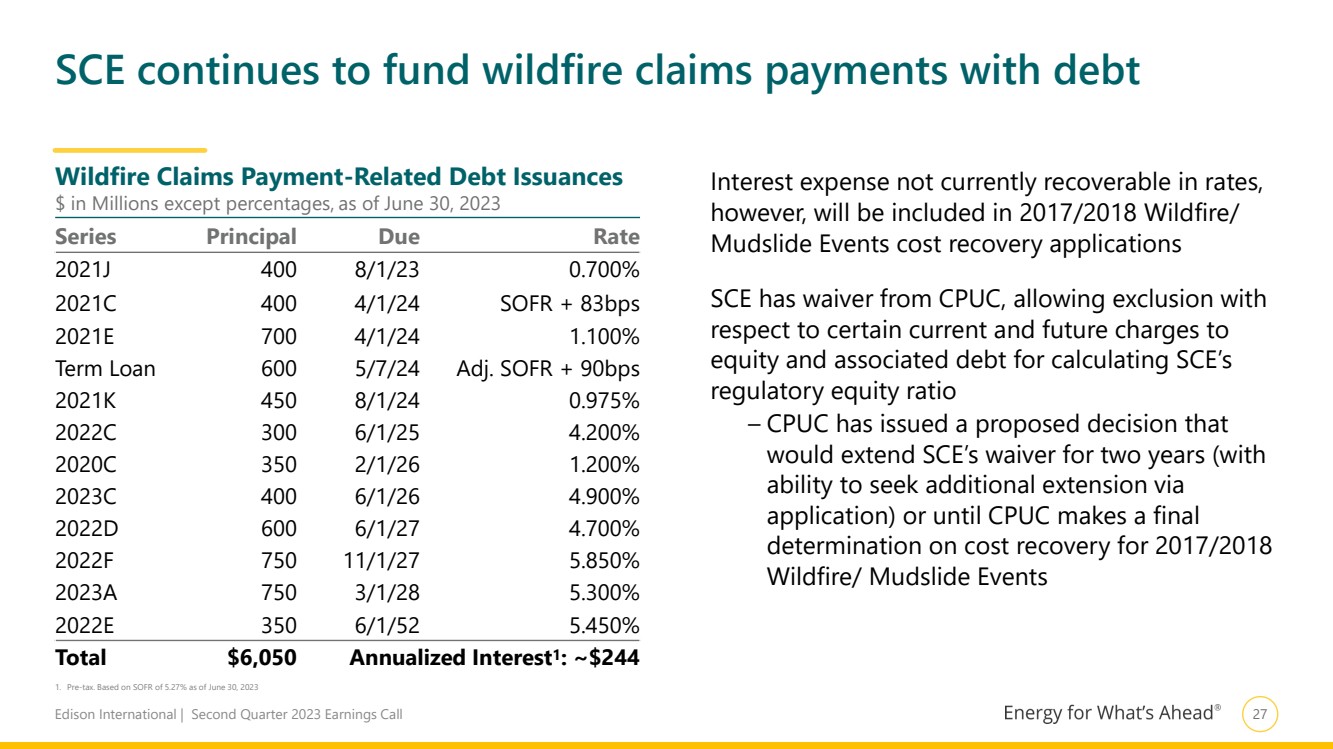
| Edison International | Second Quarter 2023 Earnings Call 27 SCE continues to fund wildfire claims payments with debt Series Principal Due Rate 2021J 400 8/1/23 0.700% 2021C 400 4/1/24 SOFR + 83bps 2021E 700 4/1/24 1.100% Term Loan 600 5/7/24 Adj. SOFR + 90bps 2021K 450 8/1/24 0.975% 2022C 300 6/1/25 4.200% 2020C 350 2/1/26 1.200% 2023C 400 6/1/26 4.900% 2022D 600 6/1/27 4.700% 2022F 750 11/1/27 5.850% 2023A 750 3/1/28 5.300% 2022E 350 6/1/52 5.450% Total $6,050 Annualized Interest1: ~$244 Wildfire Claims Payment-Related Debt Issuances $ in Millions except percentages, as of June 30, 2023 Interest expense not currently recoverable in rates, however, will be included in 2017/2018 Wildfire/ Mudslide Events cost recovery applications SCE has waiver from CPUC, allowing exclusion with respect to certain current and future charges to equity and associated debt for calculating SCE’s regulatory equity ratio – CPUC has issued a proposed decision that would extend SCE’s waiver for two years (with ability to seek additional extension via application) or until CPUC makes a final determination on cost recovery for 2017/2018 Wildfire/ Mudslide Events 1. Pre-tax. Based on SOFR of 5.27% as of June 30, 2023 |
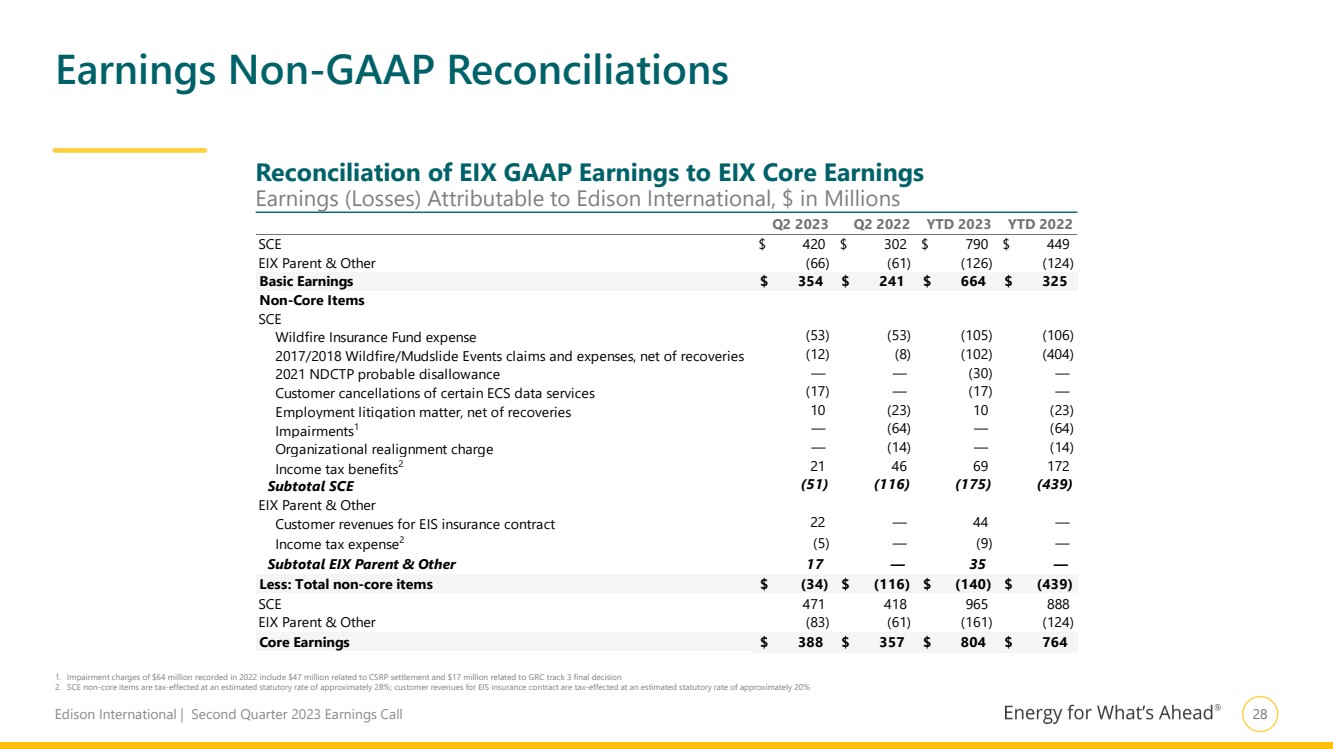
| Edison International | Second Quarter 2023 Earnings Call 28 Q2 2023 Q2 2022 YTD 2023 YTD 2022 SCE $ 420 $ 302 $ 790 $ 449 EIX Parent & Other (66) (61) (126) (124) Basic Earnings $ 354 $ 241 $ 664 $ 325 Non-Core Items SCE Wildfire Insurance Fund expense (53) (53) (105) (106) 2017/2018 Wildfire/Mudslide Events claims and expenses, net of recoveries (12) (8) (102) (404) 2021 NDCTP probable disallowance — — (30) — Customer cancellations of certain ECS data services (17) — (17) — Employment litigation matter, net of recoveries 10 (23) 10 (23) Impairments1 — (64) — (64) Organizational realignment charge — (14) — (14) Income tax benefits2 21 46 69 172 Subtotal SCE (51) (116) (175) (439) EIX Parent & Other Customer revenues for EIS insurance contract 22 — 44 — Income tax expense2 (5) — (9) — Subtotal EIX Parent & Other 1 7 — 3 5 — Less: Total non-core items $ (34) $ (116) $ (140) $ (439) SCE 471 418 965 888 EIX Parent & Other (83) (61) (161) (124) Core Earnings $ 388 $ 357 $ 804 $ 764 Earnings Non-GAAP Reconciliations 1. Impairment charges of $64 million recorded in 2022 include $47 million related to CSRP settlement and $17 million related to GRC track 3 final decision 2. SCE non-core items are tax-effected at an estimated statutory rate of approximately 28%; customer revenues for EIS insurance contract are tax-effected at an estimated statutory rate of approximately 20% Reconciliation of EIX GAAP Earnings to EIX Core Earnings Earnings (Losses) Attributable to Edison International, $ in Millions |
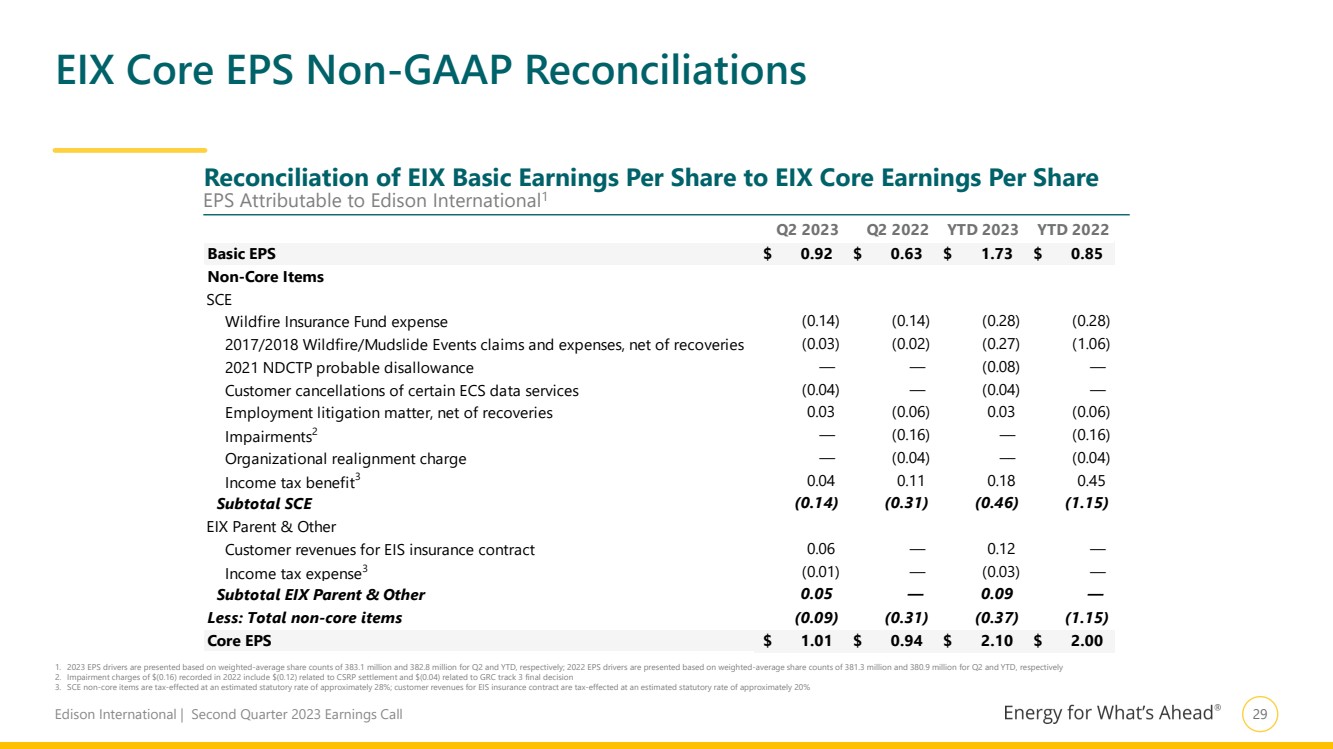
| Edison International | Second Quarter 2023 Earnings Call 29 EIX Core EPS Non-GAAP Reconciliations 1. 2023 EPS drivers are presented based on weighted-average share counts of 383.1 million and 382.8 million for Q2 and YTD, respectively; 2022 EPS drivers are presented based on weighted-average share counts of 381.3 million and 380.9 million for Q2 and YTD, respectively 2. Impairment charges of $(0.16) recorded in 2022 include $(0.12) related to CSRP settlement and $(0.04) related to GRC track 3 final decision 3. SCE non-core items are tax-effected at an estimated statutory rate of approximately 28%; customer revenues for EIS insurance contract are tax-effected at an estimated statutory rate of approximately 20% Q2 2023 Q2 2022 YTD 2023 YTD 2022 Basic EPS $ 0.92 $ 0.63 $ 1.73 $ 0.85 Non-Core Items SCE Wildfire Insurance Fund expense (0.14) (0.14) (0.28) (0.28) 2017/2018 Wildfire/Mudslide Events claims and expenses, net of recoveries (0.03) (0.02) (0.27) (1.06) 2021 NDCTP probable disallowance — — (0.08) — Customer cancellations of certain ECS data services (0.04) — (0.04) — Employment litigation matter, net of recoveries 0.03 (0.06) 0.03 (0.06) Impairments2 — (0.16) — (0.16) Organizational realignment charge — (0.04) — (0.04) Income tax benefit3 0.04 0.11 0.18 0.45 Subtotal SCE (0.14) (0.31) (0.46) (1.15) EIX Parent & Other Customer revenues for EIS insurance contract 0.06 — 0.12 — Income tax expense3 (0.01) — (0.03) — Subtotal EIX Parent & Other 0.05 — 0.09 — Less: Total non-core items (0.09) (0.31) (0.37) (1.15) Core EPS $ 1.01 $ 0.94 $ 2.10 $ 2.00 Reconciliation of EIX Basic Earnings Per Share to EIX Core Earnings Per Share EPS Attributable to Edison International1 |
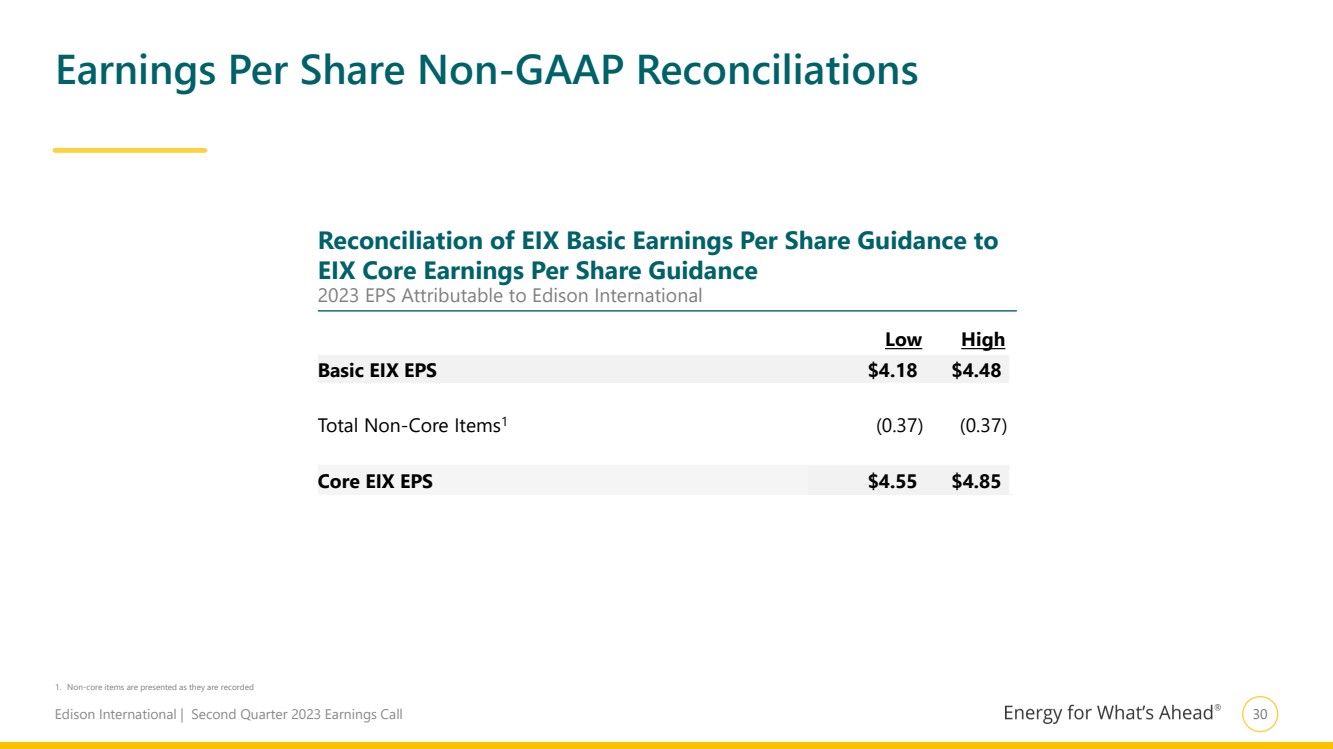
| Edison International | Second Quarter 2023 Earnings Call 30 Low High Basic EIX EPS $4.18 $4.48 Total Non-Core Items1 (0.37) (0.37) Core EIX EPS $4.55 $4.85 1. Non-core items are presented as they are recorded Earnings Per Share Non-GAAP Reconciliations Reconciliation of EIX Basic Earnings Per Share Guidance to EIX Core Earnings Per Share Guidance 2023 EPS Attributable to Edison International |
| Edison International | Second Quarter 2023 Earnings Call 31 Use of Non-GAAP Financial Measures Edison International's earnings are prepared in accordance with generally accepted accounting principles used in the United States. Management uses core earnings (losses) internally for financial planning and for analysis of performance. Core earnings (losses) are also used when communicating with investors and analysts regarding Edison International's earnings results to facilitate comparisons of the company's performance from period to period. Core earnings (losses) are a non-GAAP financial measure and may not be comparable to those of other companies. Core earnings (losses) are defined as earnings attributable to Edison International shareholders less non-core items. Non-core items include income or loss from discontinued operations and income or loss from significant discrete items that management does not consider representative of ongoing earnings, such as write downs, asset impairments and other income and expense related to changes in law, outcomes in tax, regulatory or legal proceedings, and exit activities, including sale of certain assets and other activities that are no longer continuing. A reconciliation of Non-GAAP information to GAAP information is included either on the slide where the information appears or on another slide referenced in this presentation. EIX Investor Relations Contact Sam Ramraj, Vice President Derek Matsushima, Principal Manager (626) 302-2540 (626) 302-3625 Sam.Ramraj@edisonintl.com Derek.Matsushima@edisonintl.com |