UNITED STATES
SECURITIES AND EXCHANGE COMMISSION
Washington, D.C. 20549
FORM N-CSR
CERTIFIED SHAREHOLDER REPORT OF REGISTERED
MANAGEMENT INVESTMENT COMPANIES
Investment Company Act file number 811-07319
Fidelity Covington Trust
(Exact name of registrant as specified in charter)
245 Summer St., Boston, Massachusetts 02210
(Address of principal executive offices) (Zip code)
Cynthia Lo Bessette, Secretary
245 Summer St.
Boston, Massachusetts 02210
(Name and address of agent for service)
Registrant’s telephone number, including area code: 617-563-7000
Date of fiscal year end: October 31
Date of reporting period: October 31, 2021
| Item 1. | Reports to Stockholders |


| Annual Report | 2 |
| 3 | Annual Report |
| Annual Report | 4 |
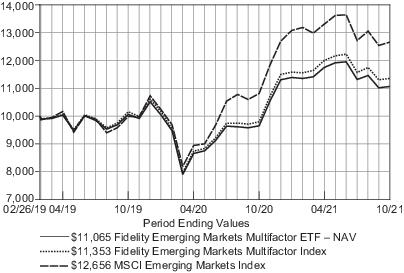
| Average Annual Total Returns | Past 1 Year | Life of fund |
| Fidelity Emerging Markets Multifactor ETF – NAVA | 14.55% | 3.85% |
| Fidelity Emerging Markets Multifactor ETF – Market PriceB | 14.35% | 4.22% |
| Fidelity Emerging Markets Multifactor IndexA | 15.92% | 4.85% |
| MSCI Emerging Markets IndexA | 16.98% | 9.19% |
| B | From February 28, 2019, date initially listed on the CboeBZX exchange. |
| * | Total returns are historical and include changes in share price and reinvestment of dividends and capital gains distributions, if any. |
| 5 | Annual Report |
| Annual Report | 6 |

| % of fund's net assets | |
| Tencent Holdings Ltd. | 5.2 |
| Taiwan Semiconductor Manufacturing Co. Ltd. | 4.3 |
| Samsung Electronics Co. Ltd. | 3.6 |
| Alibaba Group Holding Ltd. ADR | 2.9 |
| Aldar Properties PJSC | 2.3 |
| Longfor Group Holdings Ltd. | 2.3 |
| Inter RAO UES PJSC | 2.0 |
| China Vanke Co. Ltd. | 1.9 |
| Petronas Gas Bhd | 1.8 |
| Manila Electric Co. | 1.7 |
| 28.0 |
| % of fund's net assets | ||
| Information Technology | 16.8 | |
| Financials | 16.6 | |
| Communication Services | 16.4 | |
| Consumer Discretionary | 10.6 | |
| Consumer Staples | 9.8 | |
| Health Care | 9.1 | |
| Utilities | 7.1 | |
| Real Estate | 6.5 | |
| Materials | 4.7 | |
| Energy | 1.2 | |
| Industrials | 1.0 | |
| % of funds's net assets | ||
| Stocks | 99.8% | |
| Net Other Assets (Liabilities) | 0.2% | |
| 7 | Annual Report |
| Average Annual Total Returns | Past 1 Year | Life of fund |
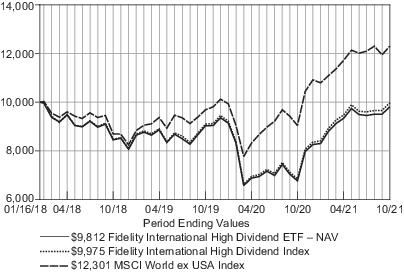
| Fidelity International High Dividend ETF – NAVA | 44.78% | -0.50% |
| Fidelity International High Dividend ETF – Market PriceB | 43.90% | -0.84% |
| Fidelity International High Dividend IndexA | 45.48% | -0.07% |
| MSCI World ex USA IndexA | 35.87% | 5.61% |
| B | From January 18, 2018, date initially listed on the NYSE Arca exchange. |
| * | Total returns are historical and include changes in share price and reinvestment of dividends and capital gains distributions, if any. |
| Annual Report | 8 |
| 9 | Annual Report |
| % of fund's net assets | |
| Fidelity Securities Lending Cash Central Fund, 0.06% | 5.8 |
| BP PLC | 3.8 |
| Daito Trust Construction Co. Ltd. | 3.7 |
| Hongkong Land Holdings Ltd. | 3.6 |
| Klepierre S.A. | 3.6 |
| TOTAL S.A. | 3.5 |
| Enbridge, Inc. | 3.4 |
| KDDI Corp. | 2.5 |
| National Grid PLC | 2.4 |
| SoftBank Corp. | 2.4 |
| 34.7 |
| % of fund's net assets | ||
| Financials | 27.7 | |
| Energy | 12.5 | |
| Communication Services | 11.2 | |
| Real Estate | 10.9 | |
| Utilities | 10.8 | |
| Industrials | 9.1 | |
| Consumer Discretionary | 5.0 | |
| Health Care | 4.8 | |
| Information Technology | 3.2 | |
| Consumer Staples | 2.5 | |
| Materials | 1.6 | |
| % of funds's net assets | ||
| Stocks and Equity Futures | 99.9% | |
| Short-Term Investments and Net Other Assets (Liabilities) | 0.1% | |
| Annual Report | 10 |
| Average Annual Total Returns | Past 1 Year | Life of fund |
| Fidelity International Multifactor ETF – NAVA | 25.08% | 8.96% |
| Fidelity International Multifactor ETF – Market PriceB | 25.47% | 9.42% |
| Fidelity International Multifactor IndexA | 25.68% | 9.52% |
| MSCI World ex USA IndexA | 35.87% | 11.96% |
| B | From February 28, 2019, date initially listed on the CboeBZX exchange. |
| * | Total returns are historical and include changes in share price and reinvestment of dividends and capital gains distributions, if any. |

| 11 | Annual Report |
| Annual Report | 12 |
| % of fund's net assets | |
| Nestle S.A. | 2.6 |
| Roche Holding AG | 2.0 |
| Novo Nordisk A/S Class B | 1.6 |
| Uniper SE | 1.4 |
| Red Electrica Corp. S.A. | 1.3 |
| Unilever PLC | 1.3 |
| Advance Residence Investment Corp. | 1.3 |
| Publicis Groupe S.A. | 1.2 |
| L'Oreal S.A. | 1.2 |
| Snam SpA | 1.2 |
| 15.1 |
| % of fund's net assets | ||
| Health Care | 16.1 | |
| Financials | 15.2 | |
| Consumer Staples | 13.8 | |
| Industrials | 12.1 | |
| Consumer Discretionary | 8.5 | |
| Utilities | 8.1 | |
| Communication Services | 7.9 | |
| Real Estate | 7.0 | |
| Information Technology | 6.3 | |
| Materials | 3.4 | |
| % of funds's net assets | ||
| Stocks and Equity Futures | 99.7% | |
| Short-Term Investments and Net Other Assets (Liabilities) | 0.3% | |
| 13 | Annual Report |
| Average Annual Total Returns | Past 1 Year | Life of fund |
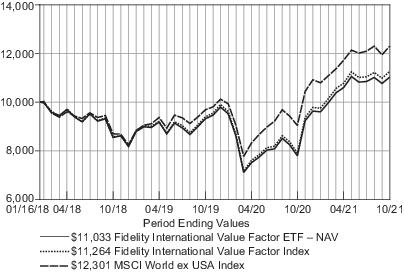
| Fidelity International Value Factor ETF – NAVA | 41.36% | 2.63% |
| Fidelity International Value Factor ETF – Market PriceB | 41.21% | 2.35% |
| Fidelity International Value Factor IndexA | 42.27% | 3.19% |
| MSCI World ex USA IndexA | 35.87% | 5.61% |
| B | From January 18, 2018, date initially listed on the NYSE Arca exchange. |
| * | Total returns are historical and include changes in share price and reinvestment of dividends and capital gains distributions, if any. |
| Annual Report | 14 |
| 15 | Annual Report |
| % of fund's net assets | |
| Nestle S.A. | 2.5 |
| ASML Holding N.V. | 2.2 |
| Suncor Energy, Inc. | 1.8 |
| Roche Holding AG | 1.6 |
| Sony Corp. | 1.6 |
| Canadian National Railway Co. | 1.5 |
| HSBC Holdings PLC | 1.5 |
| Japan Tobacco, Inc. | 1.5 |
| Royal Dutch Shell PLC | 1.4 |
| Macquarie Group Ltd. | 1.4 |
| 17.0 |
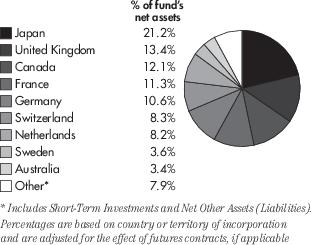
| % of fund's net assets | ||
| Financials | 19.3 | |
| Industrials | 16.1 | |
| Consumer Discretionary | 12.0 | |
| Health Care | 10.9 | |
| Information Technology | 9.6 | |
| Consumer Staples | 9.1 | |
| Materials | 7.4 | |
| Energy | 4.7 | |
| Communication Services | 4.1 | |
| Utilities | 3.6 | |
| Real Estate | 2.6 | |
| % of funds's net assets | ||
| Stocks and Equity Futures | 100.0% | |
| Short-Term Investments and Net Other Assets (Liabilities) | 0.0% | |
| Annual Report | 16 |
| Common Stocks – 99.3% | ||
| Shares | Value | |
| BRAZIL – 2.7% | ||
| Ambev S.A. | 65,700 | $ 198,021 |
| BB Seguridade Participacoes S.A. | 18,900 | 74,064 |
| Lojas Renner S.A. | 5,570 | 31,847 |
| Petro Rio S.A. (a) | 8,400 | 34,974 |
| Telefonica Brasil S.A. | 16,800 | 135,664 |
| Vale S.A. | 6,000 | 76,221 |
| WEG S.A. | 2,400 | 15,753 |
| TOTAL BRAZIL | 566,544 | |
| CAYMAN ISLANDS – 15.9% | ||
| Alibaba Group Holding Ltd. ADR (a) | 3,636 | 599,722 |
| ANTA Sports Products Ltd. | 5,000 | 78,159 |
| Autohome, Inc. ADR | 2,236 | 87,987 |
| Baozun, Inc. ADR (a) | 118 | 2,041 |
| Bosideng International Holdings Ltd. | 82,000 | 63,668 |
| China Medical System Holdings Ltd. | 96,000 | 163,639 |
| Hengan International Group Co. Ltd. | 33,500 | 175,057 |
| Huazhu Group Ltd. ADR (a) | 289 | 13,398 |
| JD.com, Inc. ADR (a) | 1,760 | 137,773 |
| Kingboard Laminates Holdings Ltd. | 47,500 | 74,495 |
| NetEase, Inc. ADR | 2,095 | 204,451 |
| New Oriental Education & Technology Group, Inc. ADR (a) | 2,936 | 6,019 |
| NIO, Inc. ADR (a) | 2,698 | 106,328 |
| Pinduoduo, Inc. ADR (a) | 688 | 61,177 |
| Shenzhou International Group Holdings Ltd. | 3,900 | 84,126 |
| TAL Education Group ADR (a) | 766 | 3,133 |
| Tencent Holdings Ltd. | 17,300 | 1,069,706 |
| Topsports International Holdings Ltd. (b) | 40,000 | 48,643 |
| Trip.com Group Ltd. ADR (a) | 915 | 26,132 |
| Vipshop Holdings Ltd. ADR (a) | 785 | 8,761 |
| Want Want China Holdings Ltd. | 293,000 | 227,122 |
| Yadea Group Holdings Ltd. (b) | 34,000 | 58,568 |
| TOTAL CAYMAN ISLANDS | 3,300,105 | |
| CHILE – 0.1% | ||
| Falabella S.A. | 9,331 | 25,873 |
| TOTAL CHILE | 25,873 | |
| CHINA – 14.2% | ||
| 360 DigiTech, Inc. (a) | 3,610 | 73,680 |
| Agricultural Bank of China Ltd. Class H | 218,000 | 74,264 |
| Anhui Conch Cement Co. Ltd. Class H | 14,500 | 72,136 |
| Baidu, Inc. ADR (a) | 1,265 | 205,234 |
| Bank of China Ltd. Class H | 295,000 | 104,286 |
| Bank of Communications Co. Ltd. Class H | 121,000 | 72,018 |
| China Cinda Asset Management Co. Ltd. | 251,000 | 41,946 |
| China Coal Energy Co. Ltd. | 31,000 | 18,889 |
| China Construction Bank Corp. Class H | 266,000 | 180,888 |
| | ||
| Shares | Value | |
| China Pacific Insurance Group Co. Ltd. Class H | 21,600 | $ 66,641 |
| China Shenhua Energy Co. Ltd. Class H | 10,500 | 22,622 |
| China Vanke Co. Ltd. | 166,900 | 390,911 |
| CSPC Pharmaceutical Group Ltd. | 170,000 | 177,888 |
| Dongfeng Motor Group Co. Ltd. | 66,000 | 61,681 |
| GF Securities Co. Ltd. Class H | 30,800 | 52,343 |
| Industrial & Commercial Bank of China Ltd. Class H | 251,000 | 137,454 |
| Jiumaojiu International Holdings Ltd. (b) | 20,000 | 50,135 |
| Li Auto, Inc. ADR (a) | 303 | 9,887 |
| Li Ning Co. Ltd. | 9,000 | 100,076 |
| Longfor Group Holdings Ltd. (b) | 98,000 | 476,202 |
| Shanghai Pharmaceuticals Holding Co. Ltd. | 98,900 | 181,296 |
| Sinopharm Group Co. Ltd. | 79,200 | 188,963 |
| The People's Insurance Co. Group of China Ltd. Class H | 152,000 | 47,481 |
| TravelSky Technology Ltd. Class H | 55,000 | 102,943 |
| XPeng, Inc. ADR (a) | 336 | 15,668 |
| Yangzijiang Shipbuilding Holdings Ltd. | 17,500 | 18,428 |
| TOTAL CHINA | 2,943,960 | |
| CYPRUS – 0.3% | ||
| TCS Group Holding PLC | 685 | 70,144 |
| TOTAL CYPRUS | 70,144 | |
| HONG KONG – 2.2% | ||
| China Merchants Port Holdings Co. Ltd. | 14,000 | 23,396 |
| Guangdong Investment Ltd. | 260,000 | 327,546 |
| Kingboard Holdings Ltd. | 18,500 | 80,977 |
| SITC International Holdings Co. Ltd. | 5,000 | 16,937 |
| TOTAL HONG KONG | 448,856 | |
| HUNGARY – 0.9% | ||
| Richter Gedeon Nyrt | 6,600 | 185,065 |
| TOTAL HUNGARY | 185,065 | |
| INDIA – 9.6% | ||
| Bajaj Auto Ltd. | 1,348 | 66,737 |
| Bharat Electronics Ltd. | 9,702 | 26,801 |
| Coal India Ltd. | 9,795 | 21,511 |
| Deepak Nitrite Ltd. | 1,583 | 47,150 |
| Divi's Laboratories Ltd. | 3,831 | 263,487 |
| Federal Bank Ltd. | 54,810 | 71,329 |
| HCL Technologies Ltd. | 3,354 | 51,230 |
| Hero MotoCorp Ltd. | 1,897 | 67,314 |
| Hindustan Unilever Ltd. | 7,089 | 226,559 |
| ICICI Bank Ltd. | 17,046 | 182,579 |
| Infosys Ltd. | 8,576 | 191,004 |
| Marico Ltd. | 22,365 | 169,781 |
| SBI Cards & Payment Services Ltd. (a) | 4,707 | 66,323 |
| 17 | Annual Report |
| Common Stocks – continued | ||
| Shares | Value | |
| INDIA – continued | ||
| SBI Life Insurance Co. Ltd. (b) | 4,735 | $ 72,437 |
| Shriram Transport Finance Co. Ltd. | 3,757 | 72,058 |
| State Bank of India | 13,612 | 91,281 |
| Tata Consultancy Services Ltd. | 2,544 | 115,435 |
| Tata Elxsi Ltd. | 321 | 25,173 |
| Tata Steel Ltd. | 3,302 | 58,029 |
| Vedanta Ltd. | 12,038 | 48,871 |
| Wipro Ltd. | 4,862 | 41,993 |
| TOTAL INDIA | 1,977,082 | |
| INDONESIA – 2.1% | ||
| Astra International Tbk PT | 140,200 | 59,623 |
| Kalbe Farma Tbk PT | 2,057,100 | 232,317 |
| Telkom Indonesia Persero Tbk PT | 435,200 | 116,729 |
| United Tractors Tbk PT | 13,800 | 22,939 |
| TOTAL INDONESIA | 431,608 | |
| JERSEY – 0.8% | ||
| Polymetal International PLC | 1,845 | 34,268 |
| WNS Holdings Ltd. ADR (a) | 1,376 | 122,203 |
| TOTAL JERSEY | 156,471 | |
| LUXEMBOURG – 0.1% | ||
| Ternium S.A. ADR | 481 | 22,285 |
| TOTAL LUXEMBOURG | 22,285 | |
| MALAYSIA – 5.7% | ||
| DiGi.Com Bhd | 79,400 | 81,107 |
| Hong Leong Bank Bhd | 15,300 | 69,535 |
| Malayan Banking Bhd | 45,617 | 88,678 |
| Nestle Malaysia Bhd | 5,800 | 188,384 |
| Petronas Chemicals Group Bhd | 10,800 | 22,664 |
| Petronas Gas Bhd | 90,200 | 364,634 |
| PPB Group Bhd | 43,900 | 192,732 |
| Public Bank Bhd | 95,000 | 95,665 |
| Telekom Malaysia Bhd | 56,700 | 79,279 |
| TOTAL MALAYSIA | 1,182,678 | |
| MAURITIUS – 0.0% | ||
| MakeMyTrip Ltd. (a) | 101 | 3,199 |
| TOTAL MAURITIUS | 3,199 | |
| MEXICO – 1.6% | ||
| Banco del Bajio S.A. (b) | 39,700 | 74,692 |
| Grupo Aeroportuario del Sureste SAB de CV Class B | 770 | 15,562 |
| Grupo Mexico S.A.B. de C.V. | 8,900 | 39,130 |
| Kimberly-Clark de Mexico SAB de CV Class A | 115,800 | 183,596 |
| | ||
| Shares | Value | |
| Orbia Advance Corp. SAB de CV | 8,800 | $ 22,922 |
| TOTAL MEXICO | 335,902 | |
| NETHERLANDS – 0.5% | ||
| VEON Ltd. (a) | 53,489 | 112,862 |
| TOTAL NETHERLANDS | 112,862 | |
| PHILIPPINES – 1.7% | ||
| Manila Electric Co. | 62,200 | 354,124 |
| TOTAL PHILIPPINES | 354,124 | |
| POLAND – 0.1% | ||
| Asseco Poland S.A. | 257 | 6,334 |
| Polskie Gornictwo Naftowe i Gazownictwo S.A. | 9,619 | 14,515 |
| TOTAL POLAND | 20,849 | |
| RUSSIA – 3.8% | ||
| Inter RAO UES PJSC (a) | 6,302,000 | 426,683 |
| LUKOIL PJSC | 346 | 35,299 |
| MMC Norilsk Nickel PJSC | 177 | 55,189 |
| Sberbank of Russia PJSC | 36,350 | 182,418 |
| Surgutneftegas PJSC | 40,500 | 19,468 |
| VTB Bank PJSC | 85,160,000 | 63,479 |
| TOTAL RUSSIA | 782,536 | |
| SAUDI ARABIA – 3.1% | ||
| Al Rajhi Bank | 4,195 | 155,010 |
| Jarir Marketing Co. | 1,418 | 76,667 |
| Mouwasat Medical Services Co. | 3,629 | 173,957 |
| Saudi Basic Industries Corp. | 2,087 | 71,775 |
| Southern Province Cement Co. | 1,224 | 23,365 |
| The Saudi National Bank | 7,636 | 134,158 |
| TOTAL SAUDI ARABIA | 634,932 | |
| SOUTH AFRICA – 3.3% | ||
| African Rainbow Minerals Ltd. | 2,662 | 35,645 |
| AVI Ltd. | 31,885 | 165,928 |
| Capitec Bank Holdings Ltd. | 768 | 86,237 |
| Kumba Iron Ore Ltd. | 1,022 | 31,211 |
| Mr Price Group Ltd. | 4,960 | 65,250 |
| Rand Merchant Investment Holdings Ltd. | 33,283 | 89,360 |
| Truworths International Ltd. | 17,115 | 60,713 |
| Vodacom Group Ltd. | 17,074 | 152,296 |
| TOTAL SOUTH AFRICA | 686,640 | |
| SOUTH KOREA – 12.6% | ||
| Cheil Worldwide, Inc. | 3,467 | 70,761 |
| DB HiTek Co. Ltd. | 82 | 4,035 |
| DGB Financial Group, Inc. | 11,124 | 98,527 |
| Annual Report | 18 |
| Common Stocks – continued | ||
| Shares | Value | |
| SOUTH KOREA – continued | ||
| Douzone Bizon Co. Ltd. | 34 | $ 2,366 |
| GS Engineering & Construction Corp. | 433 | 15,322 |
| GS Holdings Corp. | 475 | 17,174 |
| Hankook Tire & Technology Co. Ltd. | 1,761 | 62,314 |
| Hyosung TNC Corp. | 95 | 48,535 |
| Hyundai Glovis Co. Ltd. | 99 | 14,191 |
| Iljin Materials Co. Ltd. | 47 | 4,042 |
| KMW Co. Ltd. (a) | 62 | 2,186 |
| KT&G Corp. | 2,835 | 196,755 |
| Kumho Petrochemical Co. Ltd. | 206 | 30,321 |
| L&F Co. Ltd. | 52 | 8,192 |
| LEENO Industrial, Inc. | 21 | 3,077 |
| LG Display Co. Ltd. (a) | 477 | 8,042 |
| LG Innotek Co. Ltd. | 29 | 5,199 |
| LG Uplus Corp. | 6,141 | 75,413 |
| Lotte Chemical Corp. | 168 | 32,276 |
| NAVER Corp. | 571 | 198,876 |
| NCSoft Corp. | 143 | 76,728 |
| Osstem Implant Co. Ltd. | 1,545 | 163,286 |
| Pearl Abyss Corp. (a) | 1,219 | 108,386 |
| POSCO | 227 | 57,500 |
| S-1 Corp. | 215 | 15,326 |
| Samsung Electro-Mechanics Co. Ltd. | 126 | 17,144 |
| Samsung Electronics Co. Ltd. | 12,622 | 753,939 |
| Samsung SDI Co. Ltd. | 120 | 75,376 |
| Samsung SDS Co. Ltd. | 84 | 10,998 |
| Seegene, Inc. | 3,173 | 144,456 |
| SK Hynix, Inc. | 1,158 | 102,070 |
| WONIK IPS Co. Ltd. | 65 | 2,250 |
| Woongjin Coway Co. Ltd. | 1,042 | 70,801 |
| Woori Financial Group, Inc. | 10,214 | 115,815 |
| TOTAL SOUTH KOREA | 2,611,679 | |
| TAIWAN – 12.0% | ||
| ASE Technology Holding Co. Ltd. | 12,000 | 43,066 |
| Asustek Computer, Inc. | 3,000 | 38,082 |
| Catcher Technology Co. Ltd. | 5,000 | 28,948 |
| Cathay Financial Holding Co. Ltd. | 52,000 | 108,643 |
| Chicony Electronics Co. Ltd. | 9,000 | 25,697 |
| China Life Insurance Co. Ltd. | 76,960 | 80,258 |
| Chipbond Technology Corp. | 9,000 | 20,810 |
| Chunghwa Telecom Co. Ltd. | 27,000 | 107,287 |
| Elan Microelectronics Corp. | 4,000 | 24,021 |
| eMemory Technology, Inc. | 1,000 | 82,709 |
| Far EasTone Telecommunications Co. Ltd. | 37,000 | 81,428 |
| Formosa Plastics Corp. | 21,000 | 81,180 |
| Hon Hai Precision Industry Co. Ltd. | 32,000 | 123,128 |
| International Games System Co. Ltd. | 2,000 | 51,351 |
| Lite-On Technology Corp. | 14,000 | 30,861 |
| MediaTek, Inc. | 4,000 | 131,327 |
| | ||
| Shares | Value | |
| Nantex Industry Co. Ltd. | 13,000 | $ 38,100 |
| Novatek Microelectronics Corp. | 2,000 | 29,883 |
| Phison Electronics Corp. | 1,000 | 14,042 |
| Pou Chen Corp. | 61,000 | 74,801 |
| Quanta Computer, Inc. | 14,000 | 39,269 |
| Radiant Opto-Electronics Corp. | 7,000 | 24,493 |
| Simplo Technology Co. Ltd. | 2,000 | 21,504 |
| SinoPac Financial Holdings Co. Ltd. | 155,000 | 78,870 |
| Sitronix Technology Corp. | 2,000 | 19,167 |
| Taiwan Semiconductor Manufacturing Co. Ltd. | 42,000 | 891,094 |
| Tripod Technology Corp. | 6,000 | 25,352 |
| United Microelectronics Corp. | 34,000 | 70,914 |
| Yuanta Financial Holding Co. Ltd. | 98,000 | 87,045 |
| TOTAL TAIWAN | 2,473,330 | |
| THAILAND – 1.0% | ||
| Advanced Info Service PCL | 2,400 | 13,670 |
| Advanced Info Service PCL NVDR | 14,000 | 79,741 |
| Intouch Holdings PCL | 38,400 | 87,082 |
| Intouch Holdings PCL Class F | 3,000 | 6,803 |
| The Siam Cement PCL | 300 | 3,571 |
| The Siam Cement PCL NVDR | 1,300 | 15,475 |
| TOTAL THAILAND | 206,342 | |
| TURKEY – 1.3% | ||
| Akbank T.A.S. | 85,287 | 51,979 |
| BIM Birlesik Magazalar AS | 22,092 | 142,797 |
| Enka Insaat ve Sanayi AS | 12,340 | 14,117 |
| Haci Omer Sabanci Holding AS | 47,885 | 55,380 |
| TOTAL TURKEY | 264,273 | |
| UNITED ARAB EMIRATES – 3.5% | ||
| Aldar Properties PJSC | 435,513 | 479,009 |
| Dubai Islamic Bank PJSC | 40,738 | 56,674 |
| Emirates Telecommunications Group Co. PJSC | 26,194 | 182,559 |
| TOTAL UNITED ARAB EMIRATES | 718,242 | |
| UNITED STATES OF AMERICA – 0.2% | ||
| Yum China Holdings, Inc. | 833 | 47,548 |
| TOTAL UNITED STATES OF AMERICA | 47,548 | |
| TOTAL COMMON STOCKS (Cost $20,434,833) | 20,563,129 | |
| Preferred Stock – 0.5% | ||
| BRAZIL – 0.4% | ||
| Itausa - Investimentos Itau S.A. | 42,200 | 76,734 |
| TOTAL BRAZIL | 76,734 | |
| 19 | Annual Report |
| Preferred Stock – continued | ||
| Shares | Value | |
| RUSSIA – 0.1% | ||
| Transneft PJSC | 7 | $ 15,004 |
| TOTAL RUSSIA | 15,004 | |
| TOTAL PREFERRED STOCKS (Cost $116,124) | 91,738 | |
| Money Market Fund – 0.2% | ||
| Fidelity Cash Central Fund, 0.06% (c) (Cost $50,336) | 50,326 | 50,336 |
| TOTAL INVESTMENT IN SECURITIES – 100.0% (Cost $20,601,293) | 20,705,203 | |
| NET OTHER ASSETS (LIABILITIES) – (0.00%) | (2,277) | |
| NET ASSETS – 100.0% | $ 20,702,926 | |
| Categorizations in the Schedule of Investments are based on country or territory of incorporation. | ||
| Legend | ||
| (a) | Non-income producing. | |
| (b) | Security is exempt from registration under Rule 144A of the Securities Act of 1933. These securities may be resold in transactions exempt from registration, normally to qualified institutional buyers. At the end of the period, the value of these securities amounted to $780,677 or 3.8% of net assets. | |
| (c) | Affiliated fund that is generally available only to investment companies and other accounts managed by Fidelity Investments. The rate quoted is the annualized seven-day yield of the fund at period end. A complete unaudited listing of the fund's holdings as of its most recent quarter end is available upon request. In addition, each Fidelity Central Fund's financial statements, which are not covered by the Fund's Report of Independent Registered Public Accounting Firm, are available on the SEC's website or upon request. | |
| Fund | Value, beginning of period | Purchases | Sales Proceeds | Dividend Income | Realized Gain/Loss | Change in Unrealized appreciation (depreciation) | Value, end of period | % ownership, end of period | ||||||
| Fidelity Cash Central Fund, 0.06% | $— | $880,915 | $830,579 | $15 | $— | $— | $50,336 | 0.0% |
| Description | Total | Level 1 | Level 2 | Level 3 |
| Investments in Securities: | ||||||||
| Equities: | ||||||||
| Communication Services | $ 3,385,400 | $ 3,371,730 | $ 13,670 | $ — | ||||
| Consumer Discretionary | 2,247,782 | 2,247,782 | — | — | ||||
| Consumer Staples | 2,066,732 | 2,066,732 | — | — | ||||
| Energy | 207,391 | 207,391 | — | — | ||||
| Financials | 3,323,639 | 3,323,639 | — | — | ||||
| Health Care | 1,874,354 | 1,874,354 | — | — | ||||
| Industrials | 175,833 | 175,833 | — | — | ||||
| Information Technology | 3,495,070 | 3,495,070 | — | — | ||||
| Materials | 967,819 | 964,248 | 3,571 | — | ||||
| Real Estate | 1,346,122 | 1,346,122 | — | — | ||||
| Utilities | 1,472,987 | 1,472,987 | — | — | ||||
| Preferred Stock | 91,738 | 91,738 | — | — | ||||
| Money Market Fund | 50,336 | 50,336 | — | — | ||||
| Total Investments in Securities: | $ 20,705,203 | $ 20,687,962 | $ 17,241 | $ — |
| Annual Report | 20 |
| Common Stocks – 99.3% | ||
| Shares | Value | |
| AUSTRALIA – 6.8% | ||
| Coles Group Ltd. | 13,183 | $ 169,716 |
| Commonwealth Bank of Australia | 19,959 | 1,569,279 |
| Computershare Ltd. | 15,873 | 223,661 |
| Fortescue Metals Group Ltd. | 12,099 | 126,590 |
| QBE Insurance Group Ltd. | 139,358 | 1,238,267 |
| Sonic Healthcare Ltd. | 12,807 | 385,062 |
| Wesfarmers Ltd. | 7,102 | 305,389 |
| Woodside Petroleum Ltd. | 91,573 | 1,599,833 |
| TOTAL AUSTRALIA | 5,617,797 | |
| BERMUDA – 4.0% | ||
| Hongkong Land Holdings Ltd. | 539,625 | 2,973,334 |
| Jardine Matheson Holdings Ltd. | 4,982 | 288,607 |
| TOTAL BERMUDA | 3,261,941 | |
| CANADA – 11.5% | ||
| Emera, Inc. (a) | 34,931 | 1,622,627 |
| Enbridge, Inc. | 67,354 | 2,816,854 |
| Finning International, Inc. | 22,920 | 677,495 |
| Great-West Lifeco, Inc. | 45,529 | 1,337,349 |
| Manulife Financial Corp. | 63,524 | 1,235,580 |
| Nutrien Ltd. | 3,371 | 235,240 |
| Power Corp. of Canada | 46,128 | 1,533,941 |
| TOTAL CANADA | 9,459,086 | |
| DENMARK – 1.1% | ||
| Novo Nordisk A/S Class B | 4,308 | 471,991 |
| Pandora A/S | 3,135 | 438,233 |
| TOTAL DENMARK | 910,224 | |
| FINLAND – 0.5% | ||
| Nokian Renkaat Oyj | 8,011 | 300,371 |
| Orion Oyj Class B | 2,488 | 107,770 |
| TOTAL FINLAND | 408,141 | |
| FRANCE – 9.7% | ||
| Bouygues S.A. | 8,699 | 352,342 |
| Cie Generale des Etablissements Michelin SCA | 2,126 | 333,864 |
| Danone S.A. | 2,609 | 170,135 |
| Kering S.A. | 518 | 388,567 |
| Klepierre S.A. | 122,764 | 2,920,930 |
| Sanofi | 3,091 | 309,165 |
| Schneider Electric SE | 3,437 | 592,245 |
| TOTAL S.A. | 57,215 | 2,871,615 |
| TOTAL FRANCE | 7,938,863 | |
| GERMANY – 3.5% | ||
| Allianz SE | 5,170 | 1,203,476 |
| | ||
| Shares | Value | |
| BASF SE | 2,039 | $ 146,958 |
| Bayer AG | 3,371 | 189,866 |
| Bayerische Motoren Werke AG | 4,060 | 409,891 |
| SAP SE | 2,337 | 338,927 |
| Siemens AG | 3,436 | 557,797 |
| TOTAL GERMANY | 2,846,915 | |
| HONG KONG – 3.6% | ||
| BOC Hong Kong Holdings Ltd. | 341,500 | 1,084,329 |
| Power Assets Holdings Ltd. | 313,000 | 1,909,211 |
| TOTAL HONG KONG | 2,993,540 | |
| ITALY – 3.3% | ||
| Assicurazioni Generali SpA (a) | 50,004 | 1,090,795 |
| Enel SpA | 194,709 | 1,630,465 |
| TOTAL ITALY | 2,721,260 | |
| JAPAN – 18.8% | ||
| Astellas Pharma, Inc. | 16,300 | 274,037 |
| Bridgestone Corp. | 7,300 | 321,322 |
| Canon, Inc. | 10,400 | 233,310 |
| Daito Trust Construction Co. Ltd. | 24,300 | 3,009,130 |
| Eisai Co. Ltd. | 3,500 | 246,389 |
| Honda Motor Co. Ltd. | 11,600 | 340,701 |
| Japan Tobacco, Inc. | 9,600 | 188,211 |
| KDDI Corp. | 67,100 | 2,076,113 |
| Keyence Corp. | 600 | 360,500 |
| Kirin Holdings Co. Ltd. | 9,000 | 156,361 |
| Kyocera Corp. | 3,500 | 204,275 |
| Mitsubishi Corp. | 19,300 | 611,371 |
| Mitsubishi Heavy Industries Ltd. | 14,500 | 369,923 |
| Mitsubishi UFJ Financial Group, Inc. | 228,000 | 1,244,727 |
| Mitsui & Co. Ltd. | 25,500 | 579,662 |
| Otsuka Holdings Co. Ltd. | 6,100 | 240,416 |
| Shimizu Corp. | 58,100 | 424,445 |
| Showa Denko KK | 8,600 | 215,783 |
| SoftBank Corp. | 143,600 | 1,957,695 |
| Subaru Corp. | 12,900 | 252,061 |
| Sumitomo Corp. | 32,200 | 456,631 |
| Sumitomo Mitsui Financial Group, Inc. | 31,504 | 1,028,076 |
| Toyota Motor Corp. | 37,835 | 665,783 |
| TOTAL JAPAN | 15,456,922 | |
| NETHERLANDS – 1.0% | ||
| ASML Holding N.V. | 768 | 622,582 |
| Koninklijke Ahold Delhaize N.V. | 5,420 | 176,439 |
| TOTAL NETHERLANDS | 799,021 | |
| 21 | Annual Report |
| Common Stocks – continued | ||
| Shares | Value | |
| NORWAY – 0.2% | ||
| Mowi ASA | 5,664 | $ 163,774 |
| TOTAL NORWAY | 163,774 | |
| SINGAPORE – 3.7% | ||
| Oversea-Chinese Banking Corp. Ltd. | 140,732 | 1,231,470 |
| Singapore Telecommunications Ltd. | 863,600 | 1,601,038 |
| Singapore Telecommunications Ltd. | 22,600 | 41,898 |
| Venture Corp. Ltd. | 11,600 | 161,807 |
| TOTAL SINGAPORE | 3,036,213 | |
| SOUTH AFRICA – 0.0% | ||
| Thungela Resources Ltd. (b) | 421 | 1,979 |
| TOTAL SOUTH AFRICA | 1,979 | |
| SPAIN – 8.1% | ||
| ACS Actividades de Construccion y Servicios S.A. | 14,768 | 386,752 |
| Banco Bilbao Vizcaya Argentaria S.A. | 194,512 | 1,364,549 |
| Banco Santander S.A. (a) | 330,597 | 1,253,534 |
| Enagas S.A. | 76,939 | 1,727,775 |
| Telefonica S.A. | 439,916 | 1,916,479 |
| TOTAL SPAIN | 6,649,089 | |
| SWEDEN – 2.1% | ||
| Industrivarden AB Class A (a) | 1,510 | 49,800 |
| Securitas AB Class B | 34,895 | 576,945 |
| Svenska Handelsbanken AB (a) | 98,167 | 1,124,031 |
| TOTAL SWEDEN | 1,750,776 | |
| SWITZERLAND – 5.8% | ||
| ABB Ltd. | 19,219 | 637,093 |
| Clariant AG | 4,902 | 103,324 |
| Nestle S.A. | 4,503 | 595,406 |
| Novartis AG | 5,414 | 448,170 |
| Roche Holding AG | 1,567 | 607,164 |
| UBS Group AG | 69,889 | 1,273,108 |
| Zurich Insurance Group AG | 2,557 | 1,135,854 |
| TOTAL SWITZERLAND | 4,800,119 | |
| UNITED KINGDOM – 15.6% | ||
| Anglo American PLC | 4,161 | 158,705 |
| AstraZeneca PLC | 3,308 | 412,362 |
| Avast PLC (c) | 19,152 | 146,909 |
| BAE Systems PLC | 50,720 | 383,636 |
| Berkeley Group Holdings PLC | 5,121 | 305,704 |
| BHP Group PLC | 5,422 | 143,813 |
| | ||
| Shares | Value | |
| BP PLC | 644,728 | $ 3,094,929 |
| British American Tobacco PLC | 5,228 | 182,489 |
| GlaxoSmithKline PLC | 14,598 | 301,874 |
| HSBC Holdings PLC | 258,860 | 1,566,584 |
| Imperial Brands PLC | 5,649 | 119,403 |
| Legal & General Group PLC | 294,517 | 1,166,315 |
| National Grid PLC | 156,570 | 2,007,539 |
| RELX PLC | 15,658 | 485,927 |
| Rio Tinto PLC | 2,219 | 138,716 |
| Spectris PLC | 3,118 | 160,873 |
| The Sage Group PLC | 16,657 | 162,294 |
| Unilever PLC | 4,697 | 251,871 |
| Vodafone Group PLC | 1,127,875 | 1,670,335 |
| TOTAL UNITED KINGDOM | 12,860,278 | |
| TOTAL COMMON STOCKS (Cost $75,200,684) | 81,675,938 | |
| Money Market Funds – 5.9% | ||
| Fidelity Cash Central Fund, 0.06% (d) | 56,455 | 56,466 |
| Fidelity Securities Lending Cash Central Fund, 0.06% (d)(e) | 4,767,678 | 4,768,155 |
| TOTAL MONEY MARKET FUNDS (Cost $4,824,621) | 4,824,621 | |
| TOTAL INVESTMENT IN SECURITIES – 105.2% (Cost $80,025,305) | 86,500,559 | |
| NET OTHER ASSETS (LIABILITIES) – (5.2%) | (4,303,484) | |
| NET ASSETS – 100.0% | $ 82,197,075 | |
| Categorizations in the Schedule of Investments are based on country or territory of incorporation. | ||
| Legend | ||
| (a) | Security or a portion of the security is on loan at period end. | |
| (b) | Non-income producing. | |
| (c) | Security is exempt from registration under Rule 144A of the Securities Act of 1933. These securities may be resold in transactions exempt from registration, normally to qualified institutional buyers. At the end of the period, the value of these securities amounted to $146,909 or 0.2% of net assets. | |
| (d) | Affiliated fund that is generally available only to investment companies and other accounts managed by Fidelity Investments. The rate quoted is the annualized seven-day yield of the fund at period end. A complete unaudited listing of the fund's holdings as of its most recent quarter end is available upon request. In addition, each Fidelity Central Fund's financial statements, which are not covered by the Fund's Report of Independent Registered Public Accounting Firm, are available on the SEC's website or upon request. | |
| (e) | Investment made with cash collateral received from securities on loan. | |
| Annual Report | 22 |
| Futures Contracts | |||||
| Number of contracts | Expiration Date | Notional Amount | Value | Unrealized Appreciation/ (Depreciation) | |
| Purchased | |||||
| Equity Index Contract | |||||
| ICE MSCI EAFE Index Contracts (United States) | 4 | December 2021 | $467,920 | $3,433 | $3,433 |
| Fund | Value, beginning of period | Purchases | Sales Proceeds | Dividend Income | Realized Gain/Loss | Change in Unrealized appreciation (depreciation) | Value, end of period | % ownership, end of period | ||||||
| Fidelity Cash Central Fund, 0.06% | $10,119 | $ 3,841,977 | $ 3,795,630 | $ 47 | $— | $— | $ 56,466 | 0.0% | ||||||
| Fidelity Securities Lending Cash Central Fund, 0.06% | 933,300 | 13,948,526 | 10,113,671 | 3,648 | — | — | $4,768,155 | 0.0% | ||||||
| Total | $943,419 | $17,790,503 | $13,909,301 | $3,695 | $— | $— | $4,824,621 |
| 23 | Annual Report |
| Description | Total | Level 1 | Level 2 | Level 3 |
| Investments in Securities: | ||||||||
| Equities: | ||||||||
| Communication Services | $ 9,263,558 | $ 9,263,558 | $ — | $ — | ||||
| Consumer Discretionary | 4,061,886 | 4,061,886 | — | — | ||||
| Consumer Staples | 2,173,805 | 2,173,805 | — | — | ||||
| Energy | 10,385,210 | 10,385,210 | — | — | ||||
| Financials | 22,731,064 | 22,731,064 | — | — | ||||
| Health Care | 3,994,266 | 3,994,266 | — | — | ||||
| Industrials | 7,380,871 | 7,380,871 | — | — | ||||
| Information Technology | 2,615,138 | 2,615,138 | — | — | ||||
| Materials | 1,269,129 | 1,269,129 | — | — | ||||
| Real Estate | 8,903,394 | 8,903,394 | — | — | ||||
| Utilities | 8,897,617 | 8,897,617 | — | — | ||||
| Money Market Funds | 4,824,621 | 4,824,621 | — | — | ||||
| Total Investments in Securities: | $ 86,500,559 | $ 86,500,559 | $ — | $ — |
| Derivative Instruments: | ||||||||
| Assets | ||||||||
| Futures Contracts | $ 3,433 | $ 3,433 | $ — | $ — | ||||
| Total Assets | $ 3,433 | $ 3,433 | — | $ — | ||||
| Total Derivative Instruments: | $ 3,433 | $ 3,433 | $ — | $ — |
| Primary Risk/ Derivative Type | Value | ||
| Asset | Liabilities | ||
| Equity Risk | |||
| Futures Contracts(a) | $3,433 | $0 | |
| Total Equity Risk | 3,433 | 0 | |
| Total Value of Derivatives | $3,433 | $0 | |
| (a) | Reflects gross cumulative appreciation (depreciation) on futures contracts as presented in the Schedule of Investments. In the Statement of Assets and Liabilities, the period end daily variation margin is included in receivable or payable for daily variation margin on futures contracts, and the net cumulative appreciation (depreciation) is included in total accumulated earnings (loss). |
| Annual Report | 24 |
| Common Stocks – 98.4% | ||
| Shares | Value | |
| AUSTRALIA – 3.4% | ||
| ASX Ltd. | 629 | $ 39,222 |
| Australia & New Zealand Banking Group Ltd. | 3,105 | 65,627 |
| BHP Group Ltd. | 1,147 | 31,514 |
| Commonwealth Bank of Australia | 1,702 | 133,820 |
| Fortescue Metals Group Ltd. | 1,000 | 10,463 |
| JB Hi-Fi Ltd. | 518 | 19,644 |
| Medibank Pvt Ltd. | 14,081 | 35,113 |
| Rio Tinto Ltd. | 866 | 58,730 |
| Sonic Healthcare Ltd. | 4,600 | 138,306 |
| Wesfarmers Ltd. | 1,684 | 72,413 |
| TOTAL AUSTRALIA | 604,852 | |
| AUSTRIA – 0.0% | ||
| voestalpine AG | 98 | 3,724 |
| TOTAL AUSTRIA | 3,724 | |
| BELGIUM – 0.2% | ||
| Sofina S.A. | 91 | 40,270 |
| TOTAL BELGIUM | 40,270 | |
| BERMUDA – 0.3% | ||
| Jardine Matheson Holdings Ltd. | 977 | 56,598 |
| TOTAL BERMUDA | 56,598 | |
| CANADA – 9.9% | ||
| Barrick Gold Corp. | 1,482 | 27,152 |
| Canadian Apartment Properties REIT | 3,840 | 187,206 |
| Canadian Imperial Bank of Commerce | 607 | 73,537 |
| Canadian National Railway Co. | 899 | 119,291 |
| Canadian Pacific Railway Ltd. | 799 | 61,745 |
| CGI, Inc. (a) | 703 | 62,703 |
| Constellation Software, Inc. | 42 | 73,696 |
| Empire Co. Ltd. | 4,038 | 120,533 |
| Great-West Lifeco, Inc. | 1,203 | 35,336 |
| Kirkland Lake Gold Ltd. | 1,332 | 56,061 |
| Loblaw Cos. Ltd. | 1,405 | 105,504 |
| National Bank of Canada | 777 | 64,226 |
| Northland Power, Inc. | 4,736 | 152,027 |
| Open Text Corp. | 1,413 | 71,063 |
| Power Corp. of Canada | 1,489 | 49,515 |
| Quebecor, Inc. | 6,583 | 167,503 |
| Royal Bank of Canada | 1,025 | 106,523 |
| The Bank of Nova Scotia | 1,419 | 92,887 |
| The Toronto-Dominion Bank | 1,713 | 124,155 |
| TOTAL CANADA | 1,750,663 | |
| DENMARK – 4.3% | ||
| Carlsberg AS | 655 | 108,159 |
| Coloplast A/S Class B | 728 | 118,797 |
| | ||
| Shares | Value | |
| GN Store Nord A/S | 700 | $ 42,523 |
| Netcompany Group A/S (b) | 118 | 13,418 |
| Novo Nordisk A/S Class B | 2,513 | 275,328 |
| Novozymes A/S Class B | 718 | 52,853 |
| Pandora A/S | 427 | 59,689 |
| Royal Unibrew A/S | 525 | 65,205 |
| SimCorp A/S | 199 | 24,066 |
| TOTAL DENMARK | 760,038 | |
| FINLAND – 0.2% | ||
| Kone Oyj Class B | 479 | 32,683 |
| TOTAL FINLAND | 32,683 | |
| FRANCE – 8.2% | ||
| Bureau Veritas S.A. | 1,967 | 62,507 |
| Cie Generale des Etablissements Michelin SCA | 307 | 48,211 |
| Dassault Systemes SE | 717 | 41,803 |
| Edenred | 980 | 53,042 |
| Hermes International | 26 | 41,236 |
| La Francaise des Jeux SAEM (b) | 426 | 22,135 |
| Legrand S.A. | 782 | 85,284 |
| L'Oreal S.A. | 477 | 218,016 |
| LVMH Moet Hennessy Louis Vuitton SE | 174 | 136,362 |
| Publicis Groupe S.A. | 3,308 | 221,805 |
| Remy Cointreau S.A. | 460 | 92,946 |
| Sanofi | 1,612 | 161,234 |
| Sartorius Stedim Biotech | 150 | 82,662 |
| Schneider Electric SE | 735 | 126,651 |
| SEB S.A. | 18 | 2,818 |
| Teleperformance | 120 | 50,146 |
| TOTAL FRANCE | 1,446,858 | |
| GERMANY – 6.3% | ||
| Allianz SE | 413 | 96,139 |
| Carl Zeiss Meditec AG | 360 | 72,469 |
| Deutsche Bank AG (a) | 5,805 | 74,877 |
| Deutsche Post AG | 1,050 | 65,033 |
| Knorr-Bremse AG | 476 | 50,205 |
| Merck KGaA | 442 | 104,449 |
| ProSiebenSat.1 Media SE | 9,055 | 151,787 |
| Rational AG | 47 | 46,754 |
| TAG Immobilien AG | 6,786 | 206,379 |
| Uniper SE | 5,529 | 244,484 |
| TOTAL GERMANY | 1,112,576 | |
| HONG KONG – 1.2% | ||
| Sino Land Co. Ltd. | 160,993 | 211,510 |
| TOTAL HONG KONG | 211,510 | |
| 25 | Annual Report |
| Common Stocks – continued | ||
| Shares | Value | |
| IRELAND – 0.3% | ||
| Grafton Group PLC | 2,291 | $ 42,113 |
| Smurfit Kappa Group PLC | 176 | 9,224 |
| TOTAL IRELAND | 51,337 | |
| ISRAEL – 1.9% | ||
| Bank Hapoalim BM | 6,685 | 65,858 |
| Bank Leumi Le-Israel BM | 7,192 | 68,734 |
| ICL Group Ltd. | 5,739 | 49,176 |
| Israel Discount Bank Ltd. Class A (a) | 10,779 | 65,148 |
| Mizrahi Tefahot Bank Ltd. | 1,517 | 55,214 |
| Nice Ltd. (a) | 125 | 35,249 |
| TOTAL ISRAEL | 339,379 | |
| ITALY – 4.1% | ||
| Assicurazioni Generali SpA | 3,339 | 72,838 |
| DiaSorin SpA | 512 | 115,747 |
| Enel SpA | 22,415 | 187,700 |
| Moncler SpA | 885 | 63,621 |
| Recordati Industria Chimica e Farmaceutica SpA | 1,217 | 76,221 |
| Snam SpA | 37,786 | 214,135 |
| TOTAL ITALY | 730,262 | |
| JAPAN – 22.2% | ||
| Advance Residence Investment Corp. | 70 | 229,599 |
| Astellas Pharma, Inc. | 9,000 | 151,309 |
| Bandai Namco Holdings, Inc. | 600 | 45,711 |
| Dai Nippon Printing Co. Ltd. | 2,700 | 66,538 |
| Daito Trust Construction Co. Ltd. | 1,700 | 210,515 |
| Daiwa Securities Group, Inc. | 11,500 | 64,416 |
| Food & Life Cos. Ltd. | 1,400 | 60,469 |
| FUJIFILM Holdings Corp. | 800 | 61,748 |
| Fujitsu Ltd. | 400 | 68,845 |
| Hitachi Ltd. | 1,700 | 97,714 |
| Hoya Corp. | 1,000 | 146,678 |
| Iida Group Holdings Co. Ltd. | 2,100 | 51,623 |
| ITOCHU Corp. | 3,100 | 88,140 |
| Kajima Corp. | 5,700 | 69,985 |
| Kao Corp. | 1,700 | 95,880 |
| KDDI Corp. | 6,800 | 210,396 |
| Kobayashi Pharmaceutical Co. Ltd. | 1,100 | 87,884 |
| Medipal Holdings Corp. | 6,600 | 118,948 |
| Mitsui & Co. Ltd. | 3,700 | 84,108 |
| Nexon Co. Ltd. | 6,900 | 116,851 |
| Nippon Telegraph & Telephone Corp. | 7,600 | 212,487 |
| NOF Corp. | 1,100 | 55,084 |
| Nomura Research Institute Ltd. | 1,500 | 59,724 |
| Obayashi Corp. | 4,400 | 36,967 |
| Obic Co. Ltd. | 300 | 55,225 |
| | ||
| Shares | Value | |
| Oji Holdings Corp. | 8,700 | $ 43,033 |
| ORIX Corp. | 4,900 | 96,904 |
| Osaka Gas Co. Ltd. | 12,800 | 206,102 |
| Otsuka Corp. | 1,100 | 54,023 |
| Rinnai Corp. | 500 | 51,129 |
| Secom Co. Ltd. | 200 | 13,574 |
| Sekisui House Ltd. | 2,900 | 60,060 |
| Shimano, Inc. | 200 | 55,391 |
| Shionogi & Co. Ltd. | 2,500 | 162,399 |
| Sohgo Security Services Co. Ltd. | 1,000 | 42,622 |
| Sony Corp. | 1,200 | 138,286 |
| Sumitomo Mitsui Trust Holdings, Inc. | 1,900 | 62,553 |
| Taisei Corp. | 1,500 | 46,963 |
| The Shizuoka Bank Ltd. | 7,800 | 62,728 |
| Toppan Printing Co. Ltd. | 3,700 | 59,479 |
| Toyo Suisan Kaisha Ltd. | 2,900 | 124,876 |
| Trend Micro, Inc. | 1,100 | 62,030 |
| USS Co. Ltd. | 2,200 | 35,308 |
| TOTAL JAPAN | 3,924,304 | |
| LUXEMBOURG – 0.5% | ||
| Eurofins Scientific SE | 700 | 82,579 |
| TOTAL LUXEMBOURG | 82,579 | |
| NETHERLANDS – 2.3% | ||
| ASM International N.V. | 106 | 48,013 |
| ASML Holding N.V. | 233 | 188,882 |
| NN Group N.V. | 1,330 | 71,293 |
| Wolters Kluwer N.V. | 881 | 92,411 |
| TOTAL NETHERLANDS | 400,599 | |
| NEW ZEALAND – 0.0% | ||
| Fletcher Building Ltd. | 1,166 | 5,983 |
| TOTAL NEW ZEALAND | 5,983 | |
| NORWAY – 1.0% | ||
| Norsk Hydro ASA | 7,218 | 52,800 |
| Orkla ASA | 7,976 | 77,466 |
| Yara International ASA | 677 | 35,277 |
| TOTAL NORWAY | 165,543 | |
| SINGAPORE – 1.4% | ||
| DBS Group Holdings Ltd. | 3,300 | 77,159 |
| Oversea-Chinese Banking Corp. Ltd. | 6,481 | 56,712 |
| Singapore Exchange Ltd. | 6,800 | 48,813 |
| United Overseas Bank Ltd. | 3,200 | 63,478 |
| TOTAL SINGAPORE | 246,162 | |
| SPAIN – 2.7% | ||
| Enagas S.A. | 7,321 | 164,404 |
| Annual Report | 26 |
| Common Stocks – continued | ||
| Shares | Value | |
| SPAIN – continued | ||
| Industria de Diseno Textil S.A. | 2,068 | $ 74,763 |
| Red Electrica Corp. S.A. | 11,217 | 233,785 |
| TOTAL SPAIN | 472,952 | |
| SWEDEN – 3.1% | ||
| Atlas Copco AB Class A | 1,596 | 102,541 |
| Epiroc AB | 2,969 | 73,875 |
| Essity AB Class B | 1,889 | 61,101 |
| Evolution Gaming Group AB (b) | 330 | 53,378 |
| Industrivarden AB Class A | 1,091 | 35,975 |
| Investor AB | 2,750 | 63,367 |
| Nibe Industrier AB | 3,368 | 50,137 |
| Swedish Match AB | 12,021 | 105,786 |
| TOTAL SWEDEN | 546,160 | |
| SWITZERLAND – 13.9% | ||
| Chocoladefabriken Lindt & Spruengli AG | 5 | 59,042 |
| Cie Financiere Richemont S.A. | 553 | 68,448 |
| EMS-Chemie Holding AG | 54 | 53,631 |
| Galenica AG (b) | 147 | 10,779 |
| Geberit AG | 123 | 96,219 |
| Kuehne + Nagel International AG | 185 | 58,370 |
| Logitech International S.A. | 131 | 10,927 |
| Nestle S.A. | 3,437 | 454,455 |
| Novartis AG | 2,277 | 188,489 |
| Partners Group Holding AG | 33 | 57,694 |
| PSP Swiss Property AG | 1,467 | 183,666 |
| Roche Holding AG | 895 | 346,785 |
| Schindler Holding AG | 307 | 80,030 |
| Siegfried Holding AG | 73 | 70,264 |
| Sika AG | 22 | 7,464 |
| Sonova Holding AG | 191 | 79,076 |
| Straumann Holding AG | 33 | 68,690 |
| Swisscom AG | 304 | 165,815 |
| Tecan Group AG | 117 | 71,704 |
| The Swatch Group AG | 207 | 56,907 |
| UBS Group AG | 6,726 | 122,522 |
| Zurich Insurance Group AG | 307 | 136,373 |
| TOTAL SWITZERLAND | 2,447,350 | |
| UNITED KINGDOM – 10.3% | ||
| Admiral Group PLC | 989 | 38,908 |
| Auto Trader Group PLC (b) | 14,429 | 119,779 |
| Avast PLC (b) | 4,751 | 36,443 |
| Aviva PLC | 11,325 | 61,272 |
| Barclays PLC | 29,092 | 80,653 |
| BHP Group PLC | 1,393 | 36,948 |
| Diageo PLC | 3,978 | 198,047 |
| | ||
| Shares | Value | |
| Halma PLC | 1,181 | $ 47,950 |
| IG Group Holdings PLC | 3,869 | 42,083 |
| IMI PLC | 1,650 | 36,957 |
| Imperial Brands PLC | 5,159 | 109,045 |
| J Sainsbury PLC | 22,971 | 94,273 |
| Lloyds Banking Group PLC | 127,521 | 87,784 |
| Next PLC | 664 | 72,505 |
| Persimmon PLC | 2,233 | 83,287 |
| RELX PLC | 2,391 | 74,202 |
| Rightmove PLC | 17,582 | 166,631 |
| Rio Tinto PLC | 604 | 37,758 |
| Royal Mail PLC | 8,434 | 48,614 |
| Tate & Lyle PLC | 6,473 | 57,514 |
| The Sage Group PLC | 5,202 | 50,684 |
| Unilever PLC | 4,290 | 230,046 |
| TOTAL UNITED KINGDOM | 1,811,383 | |
| UNITED STATES OF AMERICA – 0.7% | ||
| Bausch Health Cos., Inc. (a) | 4,401 | 123,166 |
| TOTAL UNITED STATES OF AMERICA | 123,166 | |
| TOTAL COMMON STOCKS (Cost $15,784,284) | 17,366,931 | |
| Money Market Fund – 0.7% | ||
| Fidelity Cash Central Fund, 0.06% (c) (Cost $119,828) | 119,804 | 119,828 |
| TOTAL INVESTMENT IN SECURITIES – 99.1% (Cost $15,904,112) | 17,486,759 | |
| NET OTHER ASSETS (LIABILITIES) – 0.9% | 161,227 | |
| NET ASSETS – 100.0% | $ 17,647,986 | |
| Categorizations in the Schedule of Investments are based on country or territory of incorporation. | ||
| Legend | ||
| (a) | Non-income producing. | |
| (b) | Security is exempt from registration under Rule 144A of the Securities Act of 1933. These securities may be resold in transactions exempt from registration, normally to qualified institutional buyers. At the end of the period, the value of these securities amounted to $255,932 or 1.5% of net assets. | |
| (c) | Affiliated fund that is generally available only to investment companies and other accounts managed by Fidelity Investments. The rate quoted is the annualized seven-day yield of the fund at period end. A complete unaudited listing of the fund's holdings as of its most recent quarter end is available upon request. In addition, each Fidelity Central Fund's financial statements, which are not covered by the Fund's Report of Independent Registered Public Accounting Firm, are available on the SEC's website or upon request. | |
| 27 | Annual Report |
| Futures Contracts | |||||
| Number of contracts | Expiration Date | Notional Amount | Value | Unrealized Appreciation/ (Depreciation) | |
| Purchased | |||||
| Equity Index Contract | |||||
| ICE MSCI EAFE Index Contracts (United States) | 2 | December 2021 | $233,960 | $(2,998) | $(2,998) |
| Fund | Value, beginning of period | Purchases | Sales Proceeds | Dividend Income | Realized Gain/Loss | Change in Unrealized appreciation (depreciation) | Value, end of period | % ownership, end of period | ||||||
| Fidelity Cash Central Fund, 0.06% | $3,691 | $950,387 | $834,250 | $46 | $— | $— | $119,828 | 0.0% |
| Annual Report | 28 |
| Description | Total | Level 1 | Level 2 | Level 3 |
| Investments in Securities: | ||||||||
| Equities: | ||||||||
| Communication Services | $ 1,533,054 | $ 1,533,054 | $ — | $ — | ||||
| Consumer Discretionary | 1,373,394 | 1,373,394 | — | — | ||||
| Consumer Staples | 2,465,778 | 2,465,778 | — | — | ||||
| Financials | 2,689,726 | 2,689,726 | — | — | ||||
| Health Care | 2,808,602 | 2,808,602 | — | — | ||||
| Industrials | 2,124,439 | 2,124,439 | — | — | ||||
| Information Technology | 1,119,534 | 1,119,534 | — | — | ||||
| Materials | 620,892 | 620,892 | — | — | ||||
| Real Estate | 1,228,875 | 1,228,875 | — | — | ||||
| Utilities | 1,402,637 | 1,402,637 | — | — | ||||
| Money Market Fund | 119,828 | 119,828 | — | — | ||||
| Total Investments in Securities: | $ 17,486,759 | $ 17,486,759 | $ — | $ — |
| Derivative Instruments: | ||||||||
| Assets | ||||||||
| Futures Contracts | $ (2,998) | $ (2,998) | $ — | $ — | ||||
| Total Assets | $ (2,998) | $ (2,998) | — | $ — | ||||
| Total Derivative Instruments: | $ (2,998) | $ (2,998) | $ — | $ — |
| Primary Risk/ Derivative Type | Value | ||
| Asset | Liabilities | ||
| Equity Risk | |||
| Futures Contracts(a) | $0 | $(2,998) | |
| Total Equity Risk | 0 | (2,998) | |
| Total Value of Derivatives | $0 | $(2,998) | |
| (a) | Reflects gross cumulative appreciation (depreciation) on futures contracts as presented in the Schedule of Investments. In the Statement of Assets and Liabilities, the period end daily variation margin is included in receivable or payable for daily variation margin on futures contracts, and the net cumulative appreciation (depreciation) is included in total accumulated earnings (loss). |
| 29 | Annual Report |
| Common Stocks – 99.4% | ||
| Shares | Value | |
| AUSTRALIA – 3.4% | ||
| ASX Ltd. | 6,918 | $ 431,381 |
| Macquarie Group Ltd. | 4,048 | 597,582 |
| Rio Tinto Ltd. | 5,904 | 400,390 |
| TOTAL AUSTRALIA | 1,429,353 | |
| CANADA – 12.1% | ||
| Alimentation Couche-Tard, Inc. Class B | 7,635 | 285,924 |
| Canadian National Railway Co. | 4,669 | 619,545 |
| Canadian Tire Corp. Ltd. | 2,522 | 357,644 |
| CGI, Inc. (a) | 1,919 | 171,163 |
| Fairfax Financial Holdings Ltd. | 640 | 258,803 |
| Fortis, Inc. | 3,232 | 143,641 |
| Manulife Financial Corp. | 17,452 | 339,452 |
| Shaw Communications, Inc. | 7,603 | 218,604 |
| Shopify, Inc. Class A (a) | 317 | 462,124 |
| Sun Life Financial, Inc. | 6,321 | 359,663 |
| Suncor Energy, Inc. | 27,830 | 730,803 |
| The Toronto-Dominion Bank | 7,683 | 556,848 |
| West Fraser Timber Co. Ltd. | 6,375 | 509,619 |
| TOTAL CANADA | 5,013,833 | |
| CAYMAN ISLANDS – 0.4% | ||
| CK Asset Holdings Ltd. | 29,000 | 179,129 |
| TOTAL CAYMAN ISLANDS | 179,129 | |
| DENMARK – 1.0% | ||
| AP Moller - Maersk A/S Class B | 144 | 416,542 |
| TOTAL DENMARK | 416,542 | |
| FRANCE – 11.3% | ||
| Atos SE | 4,971 | 258,756 |
| AXA S.A. | 15,022 | 437,386 |
| BNP Paribas S.A. | 7,151 | 479,151 |
| Carrefour S.A. | 13,534 | 245,192 |
| Cie de Saint-Gobain | 5,175 | 356,691 |
| La Francaise des Jeux SAEM (b) | 9,310 | 483,752 |
| Publicis Groupe S.A. | 5,133 | 344,173 |
| Sanofi | 5,284 | 528,511 |
| Schneider Electric SE | 2,875 | 495,404 |
| Sodexo S.A. (a) | 5,619 | 546,217 |
| TOTAL S.A. | 9,772 | 490,456 |
| TOTAL FRANCE | 4,665,689 | |
| GERMANY – 10.6% | ||
| Allianz SE | 2,150 | 500,479 |
| Bayerische Motoren Werke AG | 4,237 | 427,761 |
| Daimler AG | 5,457 | 541,458 |
| Deutsche Bank AG (a) | 27,884 | 359,667 |
| Deutsche Post AG | 8,228 | 509,609 |
| | ||
| Shares | Value | |
| Fresenius Medical Care AG & Co. KGaA | 4,117 | $ 273,762 |
| Fresenius SE & Co. KGaA | 6,416 | 291,539 |
| RWE AG | 14,055 | 541,141 |
| SAP SE | 3,730 | 540,949 |
| Vonovia SE | 6,686 | 405,902 |
| TOTAL GERMANY | 4,392,267 | |
| HONG KONG – 2.3% | ||
| AIA Group Ltd. | 42,800 | 483,347 |
| BOC Hong Kong Holdings Ltd. | 73,500 | 233,377 |
| CK Hutchison Holdings Ltd. | 36,000 | 242,266 |
| TOTAL HONG KONG | 958,990 | |
| JAPAN – 21.2% | ||
| Brother Industries Ltd. | 17,200 | 331,555 |
| Chubu Electric Power Co., Inc. | 20,600 | 213,001 |
| Daiwa House Industry Co. Ltd. | 11,800 | 388,176 |
| Fujitsu Ltd. | 2,500 | 430,278 |
| Honda Motor Co. Ltd. | 13,300 | 390,631 |
| Iida Group Holdings Co. Ltd. | 14,200 | 349,069 |
| ITOCHU Corp. | 14,400 | 409,426 |
| Japan Tobacco, Inc. | 31,000 | 607,766 |
| JXTG Holdings, Inc. | 29,900 | 120,518 |
| Kajima Corp. | 28,300 | 347,468 |
| KDDI Corp. | 10,100 | 312,500 |
| Marubeni Corp. | 45,500 | 383,553 |
| Mitsubishi Corp. | 15,000 | 475,159 |
| Mitsubishi UFJ Financial Group, Inc. | 74,000 | 403,990 |
| Mitsui & Co. Ltd. | 17,800 | 404,627 |
| NEC Corp. | 7,500 | 382,811 |
| Nintendo Co. Ltd. | 600 | 264,153 |
| Nippon Steel Corp. | 25,300 | 443,540 |
| Otsuka Holdings Co. Ltd. | 9,700 | 382,300 |
| Panasonic Corp. | 30,700 | 374,916 |
| Sony Corp. | 5,700 | 656,856 |
| Sumitomo Mitsui Financial Group, Inc. | 10,300 | 336,122 |
| Takeda Pharmaceutical Co. Ltd. | 13,400 | 376,410 |
| TOTAL JAPAN | 8,784,825 | |
| LUXEMBOURG – 0.8% | ||
| ArcelorMittal S.A. | 9,876 | 335,155 |
| TOTAL LUXEMBOURG | 335,155 | |
| NETHERLANDS – 8.2% | ||
| ASML Holding N.V. | 1,138 | 922,523 |
| Koninklijke Ahold Delhaize N.V. | 9,837 | 320,228 |
| Koninklijke Philips N.V. | 8,527 | 401,869 |
| NN Group N.V. | 6,595 | 353,517 |
| Prosus N.V. | 4,810 | 424,213 |
| Randstad N.V. | 5,014 | 360,912 |
| Annual Report | 30 |
| Common Stocks – continued | ||
| Shares | Value | |
| NETHERLANDS – continued | ||
| Royal Dutch Shell PLC | 25,959 | $ 598,155 |
| TOTAL NETHERLANDS | 3,381,417 | |
| NEW ZEALAND – 0.0% | ||
| Fletcher Building Ltd. | 1,692 | 8,682 |
| TOTAL NEW ZEALAND | 8,682 | |
| SINGAPORE – 0.3% | ||
| CapitaLand Integrated Commercial Trust | 67,500 | 107,620 |
| TOTAL SINGAPORE | 107,620 | |
| SPAIN – 1.6% | ||
| ACS Actividades de Construccion y Servicios S.A. | 13,281 | 347,810 |
| Telefonica S.A. | 73,362 | 319,599 |
| TOTAL SPAIN | 667,409 | |
| SWEDEN – 3.6% | ||
| Essity AB Class B | 8,556 | 276,749 |
| Investor AB | 16,472 | 379,555 |
| Telefonaktiebolaget LM Ericsson | 24,561 | 268,817 |
| Volvo AB Class B | 24,577 | 572,094 |
| TOTAL SWEDEN | 1,497,215 | |
| SWITZERLAND – 8.3% | ||
| Galenica AG (b) | 1,530 | 112,186 |
| LafargeHolcim Ltd. | 6,054 | 302,849 |
| Nestle S.A. | 7,808 | 1,032,408 |
| Novartis AG | 6,266 | 518,698 |
| Roche Holding AG | 1,776 | 688,145 |
| STMicroelectronics N.V. | 6,551 | 310,031 |
| UBS Group AG | 25,741 | 468,902 |
| TOTAL SWITZERLAND | 3,433,219 | |
| UNITED KINGDOM – 13.4% | ||
| Anglo American PLC | 9,207 | 351,165 |
| Barclays PLC | 162,890 | 451,587 |
| BHP Group PLC | 13,536 | 359,029 |
| British American Tobacco PLC | 15,536 | 542,302 |
| Centrica PLC (a) | 703,325 | 581,534 |
| | ||
| Shares | Value | |
| GlaxoSmithKline PLC | 24,974 | $ 516,440 |
| HSBC Holdings PLC | 100,567 | 608,617 |
| Imperial Brands PLC | 20,347 | 430,074 |
| Kingfisher PLC | 90,011 | 413,331 |
| RELX PLC | 14,209 | 440,959 |
| Rio Tinto PLC | 5,694 | 355,949 |
| Royal Mail PLC | 45,646 | 263,104 |
| Vodafone Group PLC | 167,063 | 247,413 |
| TOTAL UNITED KINGDOM | 5,561,504 | |
| UNITED STATES OF AMERICA – 0.9% | ||
| Bausch Health Cos., Inc. (a) | 14,124 | 395,274 |
| TOTAL UNITED STATES OF AMERICA | 395,274 | |
| TOTAL COMMON STOCKS (Cost $39,036,977) | 41,228,123 | |
| Money Market Fund – 0.1% | ||
| Fidelity Cash Central Fund, 0.06% (c) (Cost $33,305) | 33,298 | 33,305 |
| TOTAL INVESTMENT IN SECURITIES – 99.5% (Cost $39,070,282) | 41,261,428 | |
| NET OTHER ASSETS (LIABILITIES) – 0.5% | 188,005 | |
| NET ASSETS – 100.0% | $41,449,433 | |
| Categorizations in the Schedule of Investments are based on country or territory of incorporation. | ||
| Legend | ||
| (a) | Non-income producing. | |
| (b) | Security is exempt from registration under Rule 144A of the Securities Act of 1933. These securities may be resold in transactions exempt from registration, normally to qualified institutional buyers. At the end of the period, the value of these securities amounted to $595,938 or 1.4% of net assets. | |
| (c) | Affiliated fund that is generally available only to investment companies and other accounts managed by Fidelity Investments. The rate quoted is the annualized seven-day yield of the fund at period end. A complete unaudited listing of the fund's holdings as of its most recent quarter end is available upon request. In addition, each Fidelity Central Fund's financial statements, which are not covered by the Fund's Report of Independent Registered Public Accounting Firm, are available on the SEC's website or upon request. | |
| 31 | Annual Report |
| Futures Contracts | |||||
| Number of contracts | Expiration Date | Notional Amount | Value | Unrealized Appreciation/ (Depreciation) | |
| Purchased | |||||
| Equity Index Contract | |||||
| ICE MSCI EAFE Index Contracts (United States) | 2 | December 2021 | $233,960 | $1,717 | $1,717 |
| Fund | Value, beginning of period | Purchases | Sales Proceeds | Dividend Income | Realized Gain/Loss | Change in Unrealized appreciation (depreciation) | Value, end of period | % ownership, end of period | ||||||
| Fidelity Cash Central Fund, 0.06% | $— | $2,109,800 | $2,076,495 | $ 13 | $— | $— | $33,305 | 0.0% | ||||||
| Fidelity Securities Lending Cash Central Fund, 0.06% | — | 1,769,374 | 1,769,374 | 1,532 | — | — | $ — | 0.0% | ||||||
| Total | $— | $3,879,174 | $3,845,869 | $1,545 | $— | $— | $33,305 |
| Annual Report | 32 |
| Description | Total | Level 1 | Level 2 | Level 3 |
| Investments in Securities: | ||||||||
| Equities: | ||||||||
| Communication Services | $ 1,706,442 | $ 1,706,442 | $ — | $ — | ||||
| Consumer Discretionary | 4,965,848 | 4,965,848 | — | — | ||||
| Consumer Staples | 3,740,643 | 3,740,643 | — | — | ||||
| Energy | 1,939,932 | 1,939,932 | — | — | ||||
| Financials | 8,039,426 | 8,039,426 | — | — | ||||
| Health Care | 4,485,134 | 4,485,134 | — | — | ||||
| Industrials | 6,653,851 | 6,653,851 | — | — | ||||
| Information Technology | 4,079,007 | 4,079,007 | — | — | ||||
| Materials | 3,057,696 | 3,057,696 | — | — | ||||
| Real Estate | 1,080,827 | 1,080,827 | — | — | ||||
| Utilities | 1,479,317 | 1,479,317 | — | — | ||||
| Money Market Fund | 33,305 | 33,305 | — | — | ||||
| Total Investments in Securities: | $ 41,261,428 | $ 41,261,428 | $ — | $ — |
| Derivative Instruments: | ||||||||
| Assets | ||||||||
| Futures Contracts | $ 1,717 | $ 1,717 | $ — | $ — | ||||
| Total Assets | $ 1,717 | $ 1,717 | — | $ — | ||||
| Total Derivative Instruments: | $ 1,717 | $ 1,717 | $ — | $ — |
| Primary Risk/ Derivative Type | Value | ||
| Asset | Liabilities | ||
| Equity Risk | |||
| Futures Contracts(a) | $1,717 | $0 | |
| Total Equity Risk | 1,717 | 0 | |
| Total Value of Derivatives | $1,717 | $0 | |
| (a) | Reflects gross cumulative appreciation (depreciation) on futures contracts as presented in the Schedule of Investments. In the Statement of Assets and Liabilities, the period end daily variation margin is included in receivable or payable for daily variation margin on futures contracts, and the net cumulative appreciation (depreciation) is included in total accumulated earnings (loss). |
| 33 | Annual Report |
| Fidelity Emerging Markets Multifactor ETF | Fidelity International High Dividend ETF | Fidelity International Multifactor ETF | Fidelity International Value Factor ETF | ||||
| Assets | |||||||
| Investments in securities, at value (including securities loaned of $—, $4,309,268, $— and $—, respectively) – See accompanying schedule: | |||||||
| Unaffiliated issuers | $20,654,867 | $81,675,938 | $17,366,931 | $41,228,123 | |||
| Fidelity Central Funds | 50,336 | 4,824,621 | 119,828 | 33,305 | |||
| Total Investments in Securities | $20,705,203 | $86,500,559 | $17,486,759 | $41,261,428 | |||
| Segregated cash with brokers for derivative instruments | — | 24,236 | 12,118 | 12,118 | |||
| Cash | 118 | 14,301 | 48,187 | 11,326 | |||
| Foreign currency held at value (cost $50,197, $51,825, $25,175 and $8,684, respectively) | 49,677 | 51,852 | 25,297 | 8,751 | |||
| Dividends receivable | 9,365 | 293,097 | 51,440 | 118,861 | |||
| Reclaims receivable | — | 109,538 | 31,192 | 51,569 | |||
| Distributions receivable from Fidelity Central Funds | 2 | 828 | 6 | 2 | |||
| Total assets | 20,764,365 | 86,994,411 | 17,654,999 | 41,464,055 | |||
| Liabilities | |||||||
| Accrued management fees | 7,774 | 26,401 | 5,623 | 13,232 | |||
| Payable for daily variation margin on futures contracts | — | 2,780 | 1,390 | 1,390 | |||
| Other payables and accrued expenses | 53,665 | — | — | — | |||
| Collateral on securities loaned, at value | — | 4,768,155 | — | — | |||
| Total liabilities | 61,439 | 4,797,336 | 7,013 | 14,622 | |||
| Net Assets | $20,702,926 | $82,197,075 | $17,647,986 | $41,449,433 | |||
| Net Assets consist of: | |||||||
| Paid in capital | $21,031,053 | $81,880,795 | $16,134,082 | $40,759,711 | |||
| Total accumulated earnings (loss) | (328,127) | 316,280 | 1,513,904 | 689,722 | |||
| Net Assets | $20,702,926 | $82,197,075 | $17,647,986 | $41,449,433 | |||
| Shares outstanding | 800,000 | 3,900,000 | 600,000 | 1,700,000 | |||
| Net Asset Value per share | $ 25.88 | $ 21.08 | $ 29.41 | $ 24.38 | |||
| Investments at cost – Unaffiliated issuers | $20,550,957 | $75,200,684 | $15,784,284 | $39,036,977 | |||
| Investments at cost – Fidelity Central Funds | 50,336 | 4,824,621 | 119,828 | 33,305 | |||
| Investments at cost | $20,601,293 | $80,025,305 | $15,904,112 | $39,070,282 |
| Annual Report | 34 |
| Fidelity Emerging Markets Multifactor ETF | Fidelity International High Dividend ETF | Fidelity International Multifactor ETF | Fidelity International Value Factor ETF | ||||
| Investment Income | |||||||
| Dividends | $ 657,985 | $ 2,958,485 | $ 399,089 | $ 1,108,817 | |||
| Non-Cash dividends | — | 306,592 | — | 60,940 | |||
| Interest | 1 | 25 | — | 2 | |||
| Income from Fidelity Central Funds (including $—, $3,648, $— and $1,532, from security lending, respectively) | 15 | 3,695 | 46 | 1,545 | |||
| Income before foreign taxes withheld | 658,001 | 3,268,797 | 399,135 | 1,171,304 | |||
| Less foreign taxes withheld | (72,202) | (253,624) | (41,244) | (106,763) | |||
| Total income | 585,799 | 3,015,173 | 357,891 | 1,064,541 | |||
| Expenses | |||||||
| Management fees | 85,048 | 278,396 | 52,205 | 111,283 | |||
| Independent trustees' fees and expenses | 66 | 254 | 48 | 97 | |||
| Total expenses before reductions | 85,114 | 278,650 | 52,253 | 111,380 | |||
| Expense reductions | (3) | (4) | (16) | (5) | |||
| Total expenses | 85,111 | 278,646 | 52,237 | 111,375 | |||
| Net investment income (loss) | 500,688 | 2,736,527 | 305,654 | 953,166 | |||
| Realized and Unrealized Gain (Loss) | |||||||
| Net realized gain (loss) on investment securities (net of foreign taxes of $45,517, $-, $-, $-, respectively.) | 141,708 | 2,428,128 | 271,773 | 1,337,545 | |||
| Net realized gain (loss) on In-kind redemptions | — | — | — | 1,047,707 | |||
| Net realized gain (loss) on futures contracts | (1,729) | 73,368 | 26,407 | 33,130 | |||
| Net realized gain (loss) on foreign currency transactions | (3,025) | (399) | 1,095 | 1,144 | |||
| Total net realized gain (loss) | 136,954 | 2,501,097 | 299,275 | 2,419,526 | |||
| Change in net unrealized appreciation (depreciation) on investment securities (net of decrease in deferred foreign taxes of $(35,514), $-, $- and $-, respectively.) | 260,542 | 16,544,282 | 1,701,929 | 3,277,499 | |||
| Change in net unrealized appreciation (depreciation) on futures contracts | — | 18,396 | 799 | 7,453 | |||
| Change in net unrealized appreciation (depreciation) on assets and liabilities in foreign currencies | (704) | (7,495) | (881) | (4,098) | |||
| Total change in net unrealized appreciation (depreciation) | 259,838 | 16,555,183 | 1,701,847 | 3,280,854 | |||
| Net gain (loss) | 396,792 | 19,056,280 | 2,001,122 | 5,700,380 | |||
| Net increase (decrease) in net assets resulting from operations | $ 897,480 | $21,792,807 | $2,306,776 | $ 6,653,546 |
| 35 | Annual Report |
| Fidelity Emerging Markets Multifactor ETF | Fidelity International High Dividend ETF | ||||||
| Year ended October 31, 2021 | Year ended October 31, 2020 | Year ended October 31, 2021 | Year ended October 31, 2020 | ||||
| Increase (Decrease) in Net Assets | |||||||
| Operations | |||||||
| Net investment income (loss) | $ 500,688 | $ 219,877 | $ 2,736,527 | $ 1,357,745 | |||
| Net realized gain (loss) | 136,954 | (298,421) | 2,501,097 | (4,552,063) | |||
| Change in net unrealized appreciation (depreciation) | 259,838 | (330,032) | 16,555,183 | (9,559,810) | |||
| Net increase (decrease) in net assets resulting from operations | 897,480 | (408,576) | 21,792,807 | (12,754,128) | |||
| Distributions to shareholders | (465,600) | (214,800) | (2,688,900) | (1,450,300) | |||
| Share transactions | |||||||
| Proceeds from sales of shares | 11,022,150 | — | 17,802,806 | 34,025,327 | |||
| Cost of shares redeemed | — | — | — | (18,552,856) | |||
| Net increase (decrease) in net assets resulting from share transactions | 11,022,150 | — | 17,802,806 | 15,472,471 | |||
| Total increase (decrease) in net assets | 11,454,030 | (623,376) | 36,906,713 | 1,268,043 | |||
| Net Assets | |||||||
| Beginning of year | 9,248,896 | 9,872,272 | 45,290,362 | 44,022,319 | |||
| End of year | $20,702,926 | $9,248,896 | $82,197,075 | $ 45,290,362 | |||
| Other Information | |||||||
| Shares | |||||||
| Sold | 400,000 | — | 900,000 | 1,800,000 | |||
| Redeemed | — | — | — | (900,000) | |||
| Net increase (decrease) | 400,000 | — | 900,000 | 900,000 | |||
| Annual Report | 36 |
| Fidelity International Multifactor ETF | Fidelity International Value Factor ETF | ||||||
| Year ended October 31, 2021 | Year ended October 31, 2020 | Year ended October 31, 2021 | Year ended October 31, 2020 | ||||
| Increase (Decrease) in Net Assets | |||||||
| Operations | |||||||
| Net investment income (loss) | $ 305,654 | $ 225,085 | $ 953,166 | $ 359,739 | |||
| Net realized gain (loss) | 299,275 | (6,230) | 2,419,526 | (1,404,104) | |||
| Change in net unrealized appreciation (depreciation) | 1,701,847 | (704,458) | 3,280,854 | (779,454) | |||
| Net increase (decrease) in net assets resulting from operations | 2,306,776 | (485,603) | 6,653,546 | (1,823,819) | |||
| Distributions to shareholders | (291,700) | (266,800) | (1,020,000) | (346,400) | |||
| Share transactions | |||||||
| Proceeds from sales of shares | 8,431,231 | — | 26,441,620 | 3,288,407 | |||
| Cost of shares redeemed | — | (2,519,075) | (4,879,284) | — | |||
| Net increase (decrease) in net assets resulting from share transactions | 8,431,231 | (2,519,075) | 21,562,336 | 3,288,407 | |||
| Total increase (decrease) in net assets | 10,446,307 | (3,271,478) | 27,195,882 | 1,118,188 | |||
| Net Assets | |||||||
| Beginning of year | 7,201,679 | 10,473,157 | 14,253,551 | 13,135,363 | |||
| End of year | $17,647,986 | $ 7,201,679 | $41,449,433 | $14,253,551 | |||
| Other Information | |||||||
| Shares | |||||||
| Sold | 300,000 | — | 1,100,000 | 200,000 | |||
| Redeemed | — | (100,000) | (200,000) | — | |||
| Net increase (decrease) | 300,000 | (100,000) | 900,000 | 200,000 | |||
| 37 | Annual Report |
| Fidelity Emerging Markets Multifactor ETF | |||||
| Year ended October 31, 2021 | Year ended October 31, 2020 | Year ended October 31, 2019A | |||
| Selected Per-Share Data | |||||
| Net asset value, beginning of period | $ 23.12 | $24.68 | $25.00 | ||
| Income from Investment Operations | |||||
| Net investment income (loss)B | 0.72 | 0.55 | 0.50 | ||
| Net realized and unrealized gain (loss) | 2.67 | (1.57) | (0.34) | ||
| Total from investment operations | 3.39 | (1.02) | 0.16 | ||
| Distributions from net investment income | (0.63) | (0.54) | (0.48) | ||
| Total distributions | (0.63) | (0.54) | (0.48) | ||
| Net asset value, end of period | $ 25.88 | $23.12 | $24.68 | ||
| Total ReturnC,D,E | 14.55% | (4.03)% | 0.66% | ||
| Ratios to Average Net AssetsF,G | |||||
| Expenses before reductions | .45% | .45% | .45% H | ||
| Expenses net of fee waivers, if any | .45% | .45% | .45% H | ||
| Expenses net of all reductions | .45% | .45% | .45% H | ||
| Net investment income (loss) | 2.64% | 2.39% | 3.05% H | ||
| Supplemental Data | |||||
| Net assets, end of period (000 omitted) | $20,703 | $9,249 | $9,872 | ||
| Portfolio turnover rateI | 65% J | 66% | 34% J,K | ||
| A | For the period February 26, 2019 (commencement of operations) to October 31, 2019. |
| B | Calculated based on average shares outstanding during the period. |
| C | Based on net asset value. |
| D | Total returns for periods of less than one year are not annualized. |
| E | Total returns would have been lower if certain expenses had not been reduced during the applicable periods shown. |
| F | Expense ratios reflect operating expenses of the class. Expenses before reductions do not reflect amounts reimbursed, waived, or reduced through arrangements with the investment advisor, brokerage services, or other offset arrangements, if applicable, and do not represent the amount paid by the class during periods when reimbursements, waivers or reductions occur. |
| G | Fees and expenses of any underlying mutual funds or exchange-traded funds (ETFs) are not included in the Fund’s expense ratio. The Fund indirectly bears its proportionate share of these expenses. For additional expense information related to investments in Fidelity Central Funds, please refer to the "Investments in Fidelity Central Funds" note found in the Notes to Financial Statements section of the most recent Annual or Semi-Annual report. |
| H | Annualized. |
| I | Amount does not include the portfolio activity of any underlying mutual funds or exchange-traded funds (ETFs). |
| J | Portfolio turnover rate excludes securities received or delivered in-kind. |
| K | Amount not annualized. |
| Annual Report | 38 |
| Fidelity International High Dividend ETF | |||||||
| Year ended October 31, 2021 | Year ended October 31, 2020 | Year ended October 31, 2019 | Year ended October 31, 2018A | ||||
| Selected Per-Share Data | |||||||
| Net asset value, beginning of period | $ 15.10 | $ 20.96 | $ 20.56 | $ 25.08 | |||
| Income from Investment Operations | |||||||
| Net investment income (loss)B | 0.77 | 0.60 | 1.04 | 0.82 | |||
| Net realized and unrealized gain (loss) | 5.95 | (5.81) | 0.31 | (4.63) | |||
| Total from investment operations | 6.72 | (5.21) | 1.35 | (3.81) | |||
| Distributions from net investment income | (0.74) | (0.65) | (0.95) | (0.71) | |||
| Total distributions | (0.74) | (0.65) | (0.95) | (0.71) | |||
| Net asset value, end of period | $ 21.08 | $ 15.10 | $ 20.96 | $ 20.56 | |||
| Total ReturnC,D,E | 44.78% | (24.98)% | 6.84% | (15.44)% | |||
| Ratios to Average Net AssetsF,G | |||||||
| Expenses before reductions | .39% | .39% | .39% | .39% H | |||
| Expenses net of fee waivers, if any | .39% | .39% | .39% | .39% H | |||
| Expenses net of all reductions | .39% | .39% | .39% | .39% H | |||
| Net investment income (loss) | 3.82% | 3.38% | 5.07% | 4.59% H | |||
| Supplemental Data | |||||||
| Net assets, end of period (000 omitted) | $82,197 | $45,290 | $44,022 | $18,500 | |||
| Portfolio turnover rateI,J | 67% | 82% | 47% | 42% K | |||
| A | For the period January 16, 2018 (commencement of operations) to October 31, 2018. |
| B | Calculated based on average shares outstanding during the period. |
| C | Based on net asset value. |
| D | Total returns for periods of less than one year are not annualized. |
| E | Total returns would have been lower if certain expenses had not been reduced during the applicable periods shown. |
| F | Expense ratios reflect operating expenses of the class. Expenses before reductions do not reflect amounts reimbursed, waived, or reduced through arrangements with the investment advisor, brokerage services, or other offset arrangements, if applicable, and do not represent the amount paid by the class during periods when reimbursements, waivers or reductions occur. |
| G | Fees and expenses of any underlying mutual funds or exchange-traded funds (ETFs) are not included in the Fund’s expense ratio. The Fund indirectly bears its proportionate share of these expenses. For additional expense information related to investments in Fidelity Central Funds, please refer to the "Investments in Fidelity Central Funds" note found in the Notes to Financial Statements section of the most recent Annual or Semi-Annual report. |
| H | Annualized. |
| I | Amount does not include the portfolio activity of any underlying mutual funds or exchange-traded funds (ETFs). |
| J | Portfolio turnover rate excludes securities received or delivered in-kind. |
| K | Amount not annualized. |
| 39 | Annual Report |
| Fidelity International Multifactor ETF | |||||
| Year ended October 31, 2021 | Year ended October 31, 2020 | Year ended October 31, 2019A | |||
| Selected Per-Share Data | |||||
| Net asset value, beginning of period | $ 24.01 | $26.18 | $ 25.05 | ||
| Income from Investment Operations | |||||
| Net investment income (loss)B | 0.65 | 0.57 | 0.55 | ||
| Net realized and unrealized gain (loss) | 5.34 | (2.07) | 1.12 | ||
| Total from investment operations | 5.99 | (1.50) | 1.67 | ||
| Distributions from net investment income | (0.59) | (0.67) | (0.54) | ||
| Total distributions | (0.59) | (0.67) | (0.54) | ||
| Net asset value, end of period | $ 29.41 | $24.01 | $ 26.18 | ||
| Total ReturnC,D,E | 25.08% | (5.73)% | 6.72% | ||
| Ratios to Average Net AssetsF,G | |||||
| Expenses before reductions | .39% | .39% | .39% H | ||
| Expenses net of fee waivers, if any | .39% | .39% | .39% H | ||
| Expenses net of all reductions | .39% | .39% | .39% H | ||
| Net investment income (loss) | 2.28% | 2.29% | 3.18% H | ||
| Supplemental Data | |||||
| Net assets, end of period (000 omitted) | $17,648 | $7,202 | $10,473 | ||
| Portfolio turnover rateI,J | 74% | 69% | 35% K | ||
| A | For the period February 26, 2019 (commencement of operations) to October 31, 2019. |
| B | Calculated based on average shares outstanding during the period. |
| C | Based on net asset value. |
| D | Total returns for periods of less than one year are not annualized. |
| E | Total returns would have been lower if certain expenses had not been reduced during the applicable periods shown. |
| F | Expense ratios reflect operating expenses of the class. Expenses before reductions do not reflect amounts reimbursed, waived, or reduced through arrangements with the investment advisor, brokerage services, or other offset arrangements, if applicable, and do not represent the amount paid by the class during periods when reimbursements, waivers or reductions occur. |
| G | Fees and expenses of any underlying mutual funds or exchange-traded funds (ETFs) are not included in the Fund’s expense ratio. The Fund indirectly bears its proportionate share of these expenses. For additional expense information related to investments in Fidelity Central Funds, please refer to the "Investments in Fidelity Central Funds" note found in the Notes to Financial Statements section of the most recent Annual or Semi-Annual report. |
| H | Annualized. |
| I | Amount does not include the portfolio activity of any underlying mutual funds or exchange-traded funds (ETFs). |
| J | Portfolio turnover rate excludes securities received or delivered in-kind. |
| K | Amount not annualized. |
| Annual Report | 40 |
| Fidelity International Value Factor ETF | |||||||
| Year ended October 31, 2021 | Year ended October 31, 2020 | Year ended October 31, 2019 | Year ended October 31, 2018A | ||||
| Selected Per-Share Data | |||||||
| Net asset value, beginning of period | $ 17.82 | $ 21.89 | $ 20.89 | $ 25.00 | |||
| Income from Investment Operations | |||||||
| Net investment income (loss)B | 0.79 | 0.51 | 0.80 | 0.62 | |||
| Net realized and unrealized gain (loss) | 6.54 | (4.09) | 1.05 | (4.18) | |||
| Total from investment operations | 7.33 | (3.58) | 1.85 | (3.56) | |||
| Distributions from net investment income | (0.77) | (0.49) | (0.85) | (0.55) | |||
| Total distributions | (0.77) | (0.49) | (0.85) | (0.55) | |||
| Net asset value, end of period | $ 24.38 | $ 17.82 | $ 21.89 | $ 20.89 | |||
| Total ReturnC,D,E | 41.36% | (16.32)% | 9.04% | (14.46)% | |||
| Ratios to Average Net AssetsF,G | |||||||
| Expenses before reductions | .39% | .39% | .39% | .39% H | |||
| Expenses net of fee waivers, if any | .39% | .39% | .39% | .39% H | |||
| Expenses net of all reductions | .39% | .39% | .39% | .39% H | |||
| Net investment income (loss) | 3.32% | 2.60% | 3.74% | 3.38% H | |||
| Supplemental Data | |||||||
| Net assets, end of period (000 omitted) | $41,449 | $14,254 | $13,135 | $12,532 | |||
| Portfolio turnover rateI | 101% J | 76% J | 56% | 65% J,K | |||
| A | For the period January 16, 2018 (commencement of operations) to October 31, 2018. |
| B | Calculated based on average shares outstanding during the period. |
| C | Based on net asset value. |
| D | Total returns for periods of less than one year are not annualized. |
| E | Total returns would have been lower if certain expenses had not been reduced during the applicable periods shown. |
| F | Expense ratios reflect operating expenses of the class. Expenses before reductions do not reflect amounts reimbursed, waived, or reduced through arrangements with the investment advisor, brokerage services, or other offset arrangements, if applicable, and do not represent the amount paid by the class during periods when reimbursements, waivers or reductions occur. |
| G | Fees and expenses of any underlying mutual funds or exchange-traded funds (ETFs) are not included in the Fund’s expense ratio. The Fund indirectly bears its proportionate share of these expenses. For additional expense information related to investments in Fidelity Central Funds, please refer to the "Investments in Fidelity Central Funds" note found in the Notes to Financial Statements section of the most recent Annual or Semi-Annual report. |
| H | Annualized. |
| I | Amount does not include the portfolio activity of any underlying mutual funds or exchange-traded funds (ETFs). |
| J | Portfolio turnover rate excludes securities received or delivered in-kind. |
| K | Amount not annualized. |
| 41 | Annual Report |
For the period ended October 31, 2021
| Fidelity Central Fund | Investment Manager | Investment Objective | Investment Practices | Expense Ratio(a) |
| Fidelity Money Market Central Funds | Fidelity Management & Research Company LLC (FMR) | Each fund seeks to obtain a high level of current income consistent with the preservation of capital and liquidity. | Short-term Investments | Less than .005% |
| Annual Report | 42 |
Equity securities, including restricted securities, for which market quotations are readily available, are valued at the last reported sale price or official closing price as reported by a third party pricing vendor on the primary market or exchange on which they are traded and are categorized as Level 1 in the hierarchy. In the event there were no sales during the day or closing prices are not available, securities are valued at the last quoted bid price or may be valued using the last available price and are generally categorized as Level 2 in the hierarchy. For foreign equity securities, when market or security specific events arise, comparisons to the valuation of American Depositary Receipts (ADRs), futures contracts, Exchange-Traded Funds (ETFs) and certain indexes as well as quoted prices for similar securities may be used and would be categorized as Level 2 in the hierarchy. For equity securities, including restricted securities, where observable inputs are limited, assumptions about market activity and risk are used and these securities may be categorized as Level 3 in the hierarchy.
| 43 | Annual Report |
on the jurisdiction. Foreign taxes are provided for based on each Fund’s understanding of the tax rules and rates that exist in the foreign markets in which it invests. Fidelity Emerging Markets Multifactor ETF is subject to a tax imposed on capital gains by certain countries in which it invests. An estimated deferred tax liability for net unrealized appreciation on the applicable securities is included in Other payables and accrued expenses on the Statements of Assets & Liabilities.
| Tax cost | Gross unrealized appreciation | Gross unrealized depreciation | Net unrealized appreciation (depreciation) | |
| Fidelity Emerging Markets Multifactor ETF | $ 20,673,586 | $ 2,020,734 | $ (1,989,117) | $ 31,617 |
| Fidelity International High Dividend ETF | 80,494,634 | 7,971,452 | (1,965,527) | 6,005,925 |
| Fidelity International Multifactor ETF | 16,034,910 | 1,857,806 | (405,957) | 1,451,849 |
| Fidelity International Value Factor ETF | 39,220,849 | 3,323,061 | (1,282,482) | 2,040,579 |
| Undistributed ordinary income | Undistributed capital gains | Capital loss carryforward | Net unrealized appreciation (depreciation) | |
| Fidelity Emerging Markets Multifactor ETF | $ 67,125 | $ — | $ (372,558) | $ (22,694) |
| Fidelity International High Dividend ETF | 279,058 | — | (5,965,520) | 6,002,742 |
| Fidelity International Multifactor ETF | 143,560 | — | (81,871) | 1,452,215 |
| Fidelity International Value Factor ETF | 241,194 | — | (1,590,085) | 2,038,613 |
| No-expiration Short-term | No-expiration Long-term | Total capital loss carryforward | |
| Fidelity Emerging Markets Multifactor ETF | $ (279,322) | $ (93,236) | $ (372,558) |
| Fidelity International High Dividend ETF | (1,312,216) | (4,653,304) | (5,965,520) |
| Fidelity International Multifactor ETF | (81,871) | — | (81,871) |
| Fidelity International Value Factor ETF | — | (1,590,085) | (1,590,085) |
| October 31, 2021 | ||||
| Ordinary Income | Long-Term Capital Gain | Tax Return Of Capital | Total | |
| Fidelity Emerging Markets Multifactor ETF | $ 465,600 | $ — | $ — | $ 465,600 |
| Fidelity International High Dividend ETF | 2,688,900 | — | — | 2,688,900 |
| Fidelity International Multifactor ETF | 291,700 | — | — | 291,700 |
| Fidelity International Value Factor ETF | 1,020,000 | — | — | 1,020,000 |
| October 31, 2020 | ||||
| Fidelity Emerging Markets Multifactor ETF | $ 214,800 | $ — | $ — | $ 214,800 |
| Fidelity International High Dividend ETF | 1,450,300 | — | — | 1,450,300 |
| Fidelity International Multifactor ETF | 266,800 | — | — | 266,800 |
| Annual Report | 44 |
| October 31, 2020 | ||||
| Fidelity International Value Factor ETF | 346,400 | — | — | 346,400 |
| Purchases ($) | Sales ($) | |
| Fidelity Emerging Markets Multifactor ETF | 18,989,111 | 11,845,176 |
| Fidelity International High Dividend ETF | 47,224,370 | 46,541,091 |
| Fidelity International Multifactor ETF | 10,073,828 | 9,726,845 |
| Fidelity International Value Factor ETF | 29,101,082 | 28,162,691 |
| 45 | Annual Report |
Securities received and delivered in-kind through subscriptions and redemptions are noted in the table below.
| In-kind Subscriptions ($) | In-kind Redemptions ($) | |
| Fidelity Emerging Markets Multifactor ETF | 3,809,329 | — |
| Fidelity International High Dividend ETF | 17,004,549 | — |
| Fidelity International Multifactor ETF | 7,941,732 | — |
| Fidelity International Value Factor ETF | 25,082,074 | 4,637,294 |
| Total Security Lending Income Fees Paid to NFS | Security Lending Income From Securities Loaned to NFS | Value of Securities Loaned to NFS at Period End | |
| Fidelity International High Dividend ETF | $ 154 | $ — | $ — |
| Fidelity International Value Factor ETF | 164 | — | — |
| Annual Report | 46 |
| Amount | |
| Fidelity Emerging Markets Multifactor ETF | $ 3 |
| Fidelity International High Dividend ETF | 4 |
| Fidelity International Multifactor ETF | 16 |
| Fidelity International Value Factor ETF | 5 |
| 47 | Annual Report |
| Annual Report | 48 |
| 49 | Annual Report |
| Annual Report | 50 |
| 51 | Annual Report |
| Annual Report | 52 |
| 53 | Annual Report |
| Annual Report | 54 |
| 55 | Annual Report |
| Annualized Expense RatioA | Beginning Account Value May 1, 2021 | Ending Account Value October 31, 2021 | Expenses Paid During PeriodB May 1, 2021 to October 31, 2021 | |
| Fidelity Emerging Markets Multifactor ETF | 0.45% | |||
| Actual | $ 1,000.00 | $ 942.20 | $ 2.20 | |
| Hypothetical C | $ 1,000.00 | $ 1,022.94 | $ 2.29 | |
| Fidelity International High Dividend ETF | 0.39% | |||
| Actual | $ 1,000.00 | $ 1,049.10 | $ 2.01 | |
| Hypothetical C | $ 1,000.00 | $ 1,023.24 | $ 1.99 | |
| Fidelity International Multifactor ETF | 0.39% | |||
| Actual | $ 1,000.00 | $ 1,048.60 | $ 2.01 | |
| Hypothetical C | $ 1,000.00 | $ 1,023.24 | $ 1.99 | |
| Fidelity International Value Factor ETF | 0.39% | |||
| Actual | $ 1,000.00 | $ 1,040.80 | $ 2.01 | |
| Hypothetical C | $ 1,000.00 | $ 1,023.24 | $ 1.99 |
| A | Annualized expense ratio reflects expenses net of applicable fee waivers. |
| B | Expenses are equal to the annualized expense ratio, multiplied by the average account value over the period, multiplied by 184/365 (to reflect the one-half year period). The fees and expenses of any Underlying Funds are not included in each annualized expense ratio. |
| C | 5% return per year before expenses. |
| Annual Report | 56 |
| December 2020 | March 2021 | June 2021 | September 2021 | |
| Fidelity Emerging Markets Multifactor ETF | 63% | 77% | 77% | 77% |
| Fidelity International High Dividend ETF | 75% | 100% | 100% | 100% |
| Fidelity International Multifactor ETF | 100% | 100% | 100% | 100% |
| Fidelity International Value Factor ETF | 100% | 99% | 99% | 99% |
| Ex-Date | Income | Taxes | |
| Fidelity Emerging Markets Multifactor ETF | 12/18/2020 | $ 0.1226 | $ 0.0207 |
| 3/19/2021 | $ 0.1107 | $ 0.0227 | |
| 6/18/2021 | $ 0.3370 | $ 0.0690 | |
| 9/17/2021 | $ 0.2201 | $ 0.0451 | |
| Fidelity International High Dividend ETF | 12/18/2020 | $ 0.0954 | $ 0.0075 |
| 3/19/2021 | $ 0.1998 | $ 0.0168 | |
| 6/18/2021 | $ 0.2828 | $ 0.0238 | |
| 9/17/2021 | $ 0.2315 | $ 0.0195 | |
| Fidelity International Multifactor ETF | 12/18/2020 | $ 0.0508 | $ 0.0068 |
| 3/19/2021 | $ 0.1799 | $ 0.0219 | |
| 6/18/2021 | $ 0.2630 | $ 0.0320 | |
| 9/17/2021 | $ 0.1810 | $ 0.0220 | |
| Fidelity International Value Factor ETF | 12/18/2020 | $ 0.1311 | $ 0.0112 |
| 3/19/2021 | $ 0.2327 | $ 0.0207 | |
| 6/18/2021 | $ 0.2415 | $ 0.0215 | |
| 9/17/2021 | $ 0.2393 | $ 0.0213 |
| 57 | Annual Report |
| Annual Report | 58 |
| 59 | Annual Report |

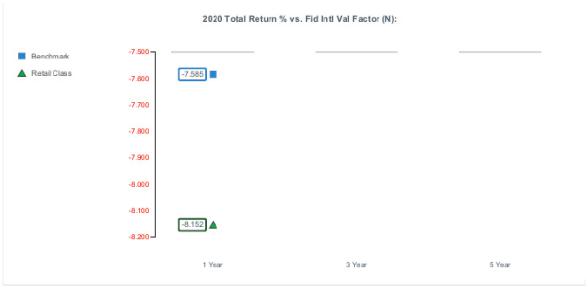
| Annual Report | 60 |

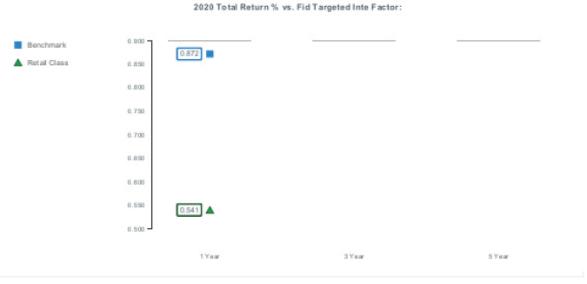
| 61 | Annual Report |
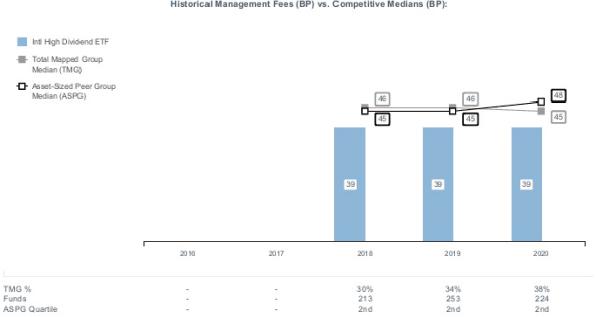

| Annual Report | 62 |


| 63 | Annual Report |
| Annual Report | 64 |
| 65 | Annual Report |
| Item 2. | Code of Ethics |
As of the end of the period, October 31, 2021, Fidelity Covington Trust (the trust) has adopted a code of ethics, as defined in Item 2 of Form N-CSR, that applies to its President and Treasurer and its Chief Financial Officer. A copy of the code of ethics is filed as an exhibit to this Form N-CSR.
| Item 3. | Audit Committee Financial Expert |
The Board of Trustees of the trust has determined that Donald F. Donahue is an audit committee financial expert, as defined in Item 3 of Form N-CSR. Mr. Donahue is independent for purposes of Item 3 of Form N-CSR.
| Item 4. | Principal Accountant Fees and Services |
Fees and Services
The following table presents fees billed by Deloitte & Touche LLP, the member firms of Deloitte Touche Tohmatsu, and their respective affiliates (collectively, “Deloitte Entities”) in each of the last two fiscal years for services rendered to Fidelity Emerging Markets Multifactor ETF, Fidelity International High Dividend ETF, Fidelity International Multifactor ETF and Fidelity International Value Factor ETF (the “Fund(s)”):
Services Billed by Deloitte Entities
October 31, 2021 FeesA
| Audit Fees | Audit- Related Fees | Tax Fees | All Other Fees | |||||||||||||
Fidelity Emerging Markets Multifactor ETF | $ | 15,900 | $ | — | $ | 3,500 | $ | 400 | ||||||||
Fidelity International High Dividend ETF | $ | 15,900 | $ | — | $ | 3,500 | $ | 400 | ||||||||
Fidelity International Multifactor ETF | $ | 15,900 | $ | — | $ | 3,500 | $ | 400 | ||||||||
Fidelity International Value Factor ETF | $ | 15,900 | $ | — | $ | 3,500 | $ | 400 | ||||||||
October 31, 2020 FeesA
| Audit Fees | Audit- Related Fees | Tax Fees | All Other Fees | |||||||||||||
Fidelity Emerging Markets Multifactor ETF | $ | 16,500 | $ | — | $ | 3,500 | $ | 400 | ||||||||
Fidelity International High Dividend ETF | $ | 16,500 | $ | — | $ | 3,500 | $ | 400 | ||||||||
Fidelity International Multifactor ETF | $ | 16,500 | $ | — | $ | 3,500 | $ | 400 | ||||||||
Fidelity International Value Factor ETF | $ | 16,500 | $ | — | $ | 3,500 | $ | 400 | ||||||||
| A | Amounts may reflect rounding. |
The following table(s) present(s) fees billed by Deloitte Entities that were required to be approved by the Audit Committee for services that relate directly to the operations and financial reporting of the Fund(s) and that are rendered on behalf of Fidelity Management & Research Company LLC (“FMR”) and entities controlling, controlled by, or under common control with FMR (not including any sub-adviser whose role is primarily portfolio management and is subcontracted with or overseen by another investment adviser) that provide ongoing services to the Fund(s) (“Fund Service Providers”):
Services Billed by Deloitte Entities
| October 31, 2021A | October 31, 2020A | |||||||
Audit-Related Fees | $ | — | $ | — | ||||
Tax Fees | $ | — | $ | — | ||||
All Other Fees | $ | — | $ | — | ||||
| A | Amounts may reflect rounding. |
“Audit-Related Fees” represent fees billed for assurance and related services that are reasonably related to the performance of the fund audit or the review of the fund’s financial statements and that are not reported under Audit Fees.
“Tax Fees” represent fees billed for tax compliance, tax advice or tax planning that relate directly to the operations and financial reporting of the fund.
“All Other Fees” represent fees billed for services provided to the fund or Fund Service Provider, a significant portion of which are assurance related, that relate directly to the operations and financial reporting of the fund, excluding those services that are reported under Audit Fees, Audit-Related Fees or Tax Fees.
Assurance services must be performed by an independent public accountant.
* * *
The aggregate non-audit fees billed by Deloitte Entities for services rendered to the Fund(s), FMR (not including any sub-adviser whose role is primarily portfolio management and is subcontracted with or overseen by another investment adviser), and any Fund Service Provider for each of the last two fiscal years of the Fund(s) are as follows:
Billed By | October 31, 2021A | October 31, 2020A | ||||||
Deloitte Entities | $ | 537,200 | $ | 517,200 | ||||
| A | Amounts may reflect rounding. |
The trust’s Audit Committee has considered non-audit services that were not pre-approved that were provided by Deloitte Entities to Fund Service Providers to be compatible with maintaining the independence of Deloitte Entities in its(their) audit of the Fund(s), taking into account representations from Deloitte Entities, in accordance with Public Company Accounting Oversight Board rules, regarding its independence from the Fund(s) and its(their) related entities and FMR’s review of the appropriateness and permissibility under applicable law of such non-audit services prior to their provision to the Fund(s) Service Providers.
Audit Committee Pre-Approval Policies and Procedures
The trust’s Audit Committee must pre-approve all audit and non-audit services provided by a fund’s independent registered public accounting firm relating to the operations or financial reporting of the fund. Prior to the commencement of any audit or non-audit services to a fund, the Audit Committee reviews the services to determine whether they are appropriate and permissible under applicable law.
The Audit Committee has adopted policies and procedures to, among other purposes, provide a framework for the Committee’s consideration of non-audit services by the audit firms that audit the Fidelity funds. The policies and procedures require that any non-audit service provided by a fund audit firm to a Fidelity fund and any non-audit service provided by a fund auditor to a Fund Service Provider that relates directly to the operations and financial reporting of a Fidelity fund (“Covered Service”) are subject to approval by the Audit Committee before such service is provided.
All Covered Services must be approved in advance of provision of the service either: (i) by formal resolution of the Audit Committee, or (ii) by oral or written approval of the service by the Chair of the Audit Committee (or if the Chair is unavailable, such other member of the Audit Committee as may be designated by the Chair to act in the Chair’s absence). The approval contemplated by (ii) above is permitted where the Treasurer determines that action on such an engagement is necessary before the next meeting of the Audit Committee.
Non-audit services provided by a fund audit firm to a Fund Service Provider that do not relate directly to the operations and financial reporting of a Fidelity fund are reported to the Audit Committee periodically.
Non-Audit Services Approved Pursuant to Rule 2-01(c)(7)(i)(C) and (ii) of Regulation S-X (“De Minimis Exception”)
There were no non-audit services approved or required to be approved by the Audit Committee pursuant to the De Minimis Exception during the Fund’s(s’) last two fiscal years relating to services provided to (i) the Fund(s) or (ii) any Fund Service Provider that relate directly to the operations and financial reporting of the Fund(s).
| Item 5. | Audit Committee of Listed Registrants |
The Audit Committee is a separately-designated standing audit committee in accordance with Section 3(a)(58)(A) of the Securities Exchange Act of 1934. As of October 31, 2021, the members of the Audit Committee were Donald F. Donahue, Thomas P. Bostick, Thomas Kennedy, Garnett A. Smith and Susan Tomasky.
| Item 6. | Investments |
| (a) | Not applicable. |
| (b) | Not applicable. |
| Item 7. | Disclosure of Proxy Voting Policies and Procedures for Closed-End Management Investment Companies |
Not applicable.
| Item 8. | Portfolio Managers of Closed-End Management Investment Companies |
Not applicable.
| Item 9. | Purchase of Equity Securities by Closed-End Management Investment Company and Affiliated Purchasers |
Not applicable.
| Item 10. | Submission of Matters to a Vote of Security Holders |
There were no material changes to the procedures by which shareholders may recommend nominees to the trust’s Board of Trustees.
| Item 11. | Controls and Procedures |
(a)(i) The President and Treasurer and the Chief Financial Officer have concluded that the trust’s disclosure controls and procedures (as defined in Rule 30a-3(c) under the Investment Company Act) provide reasonable assurances that material information relating to the trust is made known to them by the appropriate persons, based on their evaluation of these controls and procedures as of a date within 90 days of the filing date of this report.
(a)(ii) There was no change in the trust’s internal control over financial reporting (as defined in Rule 30a-3(d) under the Investment Company Act) that occurred during the period covered by this report that has materially affected, or is reasonably likely to materially affect, the trust’s internal control over financial reporting.
| Item 12. | Disclosure of Securities Lending Activities for Closed-End Management Investment Companies |
Not applicable.
| Item 13. | Exhibits |
SIGNATURES
Pursuant to the requirements of the Securities Exchange Act of 1934 and the Investment Company Act of 1940, the registrant has duly caused this report to be signed on its behalf by the undersigned, thereunto duly authorized.
Fidelity Covington Trust
| By: | /s/Stacie M. Smith | |
| Stacie M. Smith | ||
| President and Treasurer | ||
| Date: | December 21, 2021 | |
Pursuant to the requirements of the Securities Exchange Act of 1934 and the Investment Company Act of 1940, this report has been signed below by the following persons on behalf of the registrant and in the capacities and on the dates indicated.
| By: | /s/Stacie M. Smith | |
| Stacie M. Smith | ||
| President and Treasurer | ||
| Date: | December 21, 2021 | |
By: | /s/John J. Burke III | |
| John J. Burke III | ||
Chief Financial Officer | ||
Date: | December 21, 2021 | |