UNITED STATES
SECURITIES AND EXCHANGE COMMISSION
Washington, D.C. 20549
FORM 10-K
(Mark One)
| |
☒ | ANNUAL REPORT PURSUANT TO SECTION 13 OR 15 (d) OF THE SECURITIES EXCHANGE ACT OF 1934 |
For the fiscal year ended December 28, 2024
OR
| |
☐ | TRANSITION REPORT PURSUANT TO SECTION 13 OR 15 (d) OF THE SECURITIES EXCHANGE ACT OF 1934 |
For the transition period from __________ to __________
Commission file number: 1-14092
THE BOSTON BEER COMPANY, INC.
(Exact name of registrant as specified in its charter)
| |
| |
Massachusetts | 04-3284048 |
(State or other jurisdiction of incorporation or organization) | (I.R.S. Employer Identification No.) |
\
One Design Center Place, Suite 850, Boston, Massachusetts
(Address of principal executive offices)
02210
(Zip Code)
(617) 368-5000
(Registrant’s telephone number, including area code)
Securities registered pursuant to Section 12(b) of the Act:
| | | | |
Title of each class | | Trading Symbol(s) | | Name of each exchange on which registered |
Class A Common Stock. $0.01 par value | | SAM | | New York Stock Exchange |
Securities registered pursuant to Section 12(g) of the Act: None
Indicate by check mark if the registrant is a well-known seasoned issuer, as defined in Rule 405 of the Securities Act. Yes ☒ No ☐
Indicate by check mark if the registrant is not required to file reports pursuant to Section 13 or Section 15(d) of the Exchange Act. Yes ☐ No ☒
Indicate by check mark whether the registrant (1) has filed all reports required to be filed by Section 13 or 15(d) of the Securities Exchange Act of 1934 during the preceding 12 months (or for such shorter period that the registrant was required to file such reports), and (2) has been subject to such filing requirements for the past 90 days. Yes ☒ No ☐
Indicate by check mark whether the registrant has submitted electronically every Interactive Data File required to be submitted pursuant to Rule 405 of Regulation S-T (§232.405 of this chapter) during the preceding 12 months (or for such shorter period that the registrant was required to submit such files). Yes ☒ No ☐
Indicate by check mark whether the registrant is a large accelerated filer, an accelerated filer, a non-accelerated filer, a smaller reporting company, or an emerging growth company. See the definitions of “large accelerated filer,” “accelerated filer,” “smaller reporting company,” and “emerging growth company” in Rule 12b-2 of the Exchange Act.
| | | |
Large accelerated filer | ☒ | Accelerated filer | ☐ |
|
|
|
|
Non-accelerated filer | ☐ | Smaller reporting company | ☐ |
|
|
|
|
Emerging growth company | ☐ |
|
|
If an emerging growth company, indicate by check mark if the registrant has elected not to use the extended transition period for complying with any new or revised financial accounting standards provided pursuant to Section 13(a) of the Exchange Act. ☐
Indicate by check mark whether the registrant has filed a report on and attestation to its management’s assessment of the effectiveness of its internal control over financial reporting under Section 404(b) of the Sarbanes-Oxley Act (15 U.S.C. 7262(b)) by the registered public accounting firm that prepared or issued its audit report. ☒
If securities are registered pursuant to Section 12(b) of the Act, indicate by check mark whether the financial statements of the registrant included in the filing reflect the correction of an error to previously issued financial statements. ☐
Indicate by check mark whether any of those error corrections are restatements that required a recovery analysis of incentive-based compensation received by any of the registrant’s executive officers during the relevant recovery period pursuant to §240.10D-1(b). ☐
Indicate by check mark whether the registrant is a shell company (as defined in Rule 12b-2 of the Exchange Act). Yes ☐ No ☒
The aggregate market value of the Class A Common Stock ($0.01 par value) held by non-affiliates of the registrant totaled $2,737.76 million (based on the closing price of the Company’s Class A Common Stock on the New York Stock Exchange on June 28, 2024). All of the registrant’s Class B Common Stock ($0.01 par value) is held by an affiliate.
As of February 21, 2025 there were 9,175,801 shares outstanding of the Company’s Class A Common Stock ($0.01 par value) and 2,068,000 shares outstanding of the Company’s Class B Common Stock ($0.01 par value).
DOCUMENTS INCORPORATED BY REFERENCE
Certain parts of the registrant’s definitive Proxy Statement for its 2025 Annual Meeting to be held on May 14, 2025 are incorporated by reference into Part III of this report.
THE BOSTON BEER COMPANY, INC. AND SUBSIDIARIES
FORM 10-K
FOR THE PERIOD ENDED DECEMBER 28, 2024
PART I.
Item 1. Business
General
The Boston Beer Company, Inc. and certain subsidiaries (the “Company”) are engaged in the business of selling alcohol beverages throughout the United States and in selected international markets, under the trademarks “The Boston Beer Company®”, “Twisted Tea Brewing Company®”, “Hard Seltzer Beverage Company”, “Angry Orchard® Cider Company”, “Dogfish Head® Craft Brewery”, “Dogfish Head Distilling Co.”, “Angel City® Brewing Company”, “Coney Island® Brewing Company”, "Green Rebel Brewing Co.", “TeaPot Worldwide”, and “Sun Cruiser Beverage Co."
The Company produces alcohol beverages, including flavored malt beverages, hard seltzer, beer, hard cider, spirits based ready to drink beverages (“spirits RTDs”) and distilled spirits at Company-owned breweries and its cidery and under contract arrangements at other production facilities. The four primary Company-owned breweries are focused on production and research and development, including breweries located in Boston, Massachusetts (the “Boston Brewery”), Cincinnati, Ohio (the “Cincinnati Brewery”), Milton, Delaware (the “Milton Brewery”) and Breinigsville, Pennsylvania (the “Pennsylvania Brewery”). These breweries, with the exception of the Pennsylvania Brewery, have tap rooms for retail sales on site.
The Company also operates three smaller local breweries that are mainly focused on brewing and packaging beers for retail sales on site at tap rooms and gift shops, restaurant activities, developing innovative and traditional beers and in some cases, supporting draft and package accounts in the respective local market areas. These local breweries are located in Boston, Massachusetts (the “Samuel Adams Boston Downtown Tap Room”), Rehoboth, Delaware (“Dogfish Head Brewings and Eats”), Los Angeles, California (the “Angel City Brewery" and "Truly LA”), and Cincinnati, Ohio ("Cincinnati Tap Room").
In addition, the Company owns an apple orchard and cidery located in Walden, New York (the “Orchard” and “Cidery”), a restaurant in Rehoboth, Delaware (“Chesapeake & Maine”) and a boutique inn in Lewes, Delaware (the “Dogfish Inn”).
The Company sells its beverages in various packages. Sleek cans, standard cans and bottles are sold primarily for off-premise retailers, which include grocery stores, club stores, convenience stores, liquor stores, and other traditional and e-commerce retail outlets. Kegs are sold primarily for on-premise retailers, which include bars, restaurants, stadiums and other venues.
The Company’s principal executive offices are located at One Design Center Place, Suite 850, Boston, Massachusetts 02210, and its telephone number is (617) 368-5000.
Industry Background
Most of the Company’s products are sold through off-premise retailers and the Company estimates the size of its markets using third-party metrics from measured off-premise channels, which is standard in the United States beer industry.
The Company competes primarily in the United States in the combined Beyond beer and Traditional beer market (“US Beer Market”). Beyond beer includes flavored malt beverages, hard seltzer, hard cider, spirits RTDs and other emerging beverages. Traditional beer generally includes mass domestics, imports, domestic specialties and craft beer.
In measured off-premise channels in 2024, the US Beer Market increased 0.4% to $47.6 billion with Beyond beer increasing 4.4% to $10.3 billion and Traditional beer declining 0.7% to $37.3 billion. Beyond beer is 22% of the US Beer Market and the Company believes Beyond beer is positioned to continue to grow and gain share from Traditional beer.
Description of the Company’s Business
The Company was founded in 1984 as a craft brewery and competes in the craft beer category primarily with its Samuel Adams and Dogfish Head brands. The Company has a strong history of innovation and has internally developed brands outside of the craft beer category that are among the leaders in their respective categories. These brands include Twisted Tea, a flavored malt beverage introduced in 2001, Angry Orchard, a hard cider introduced in 2011, Truly Hard Seltzer, a hard seltzer introduced in 2016 and Sun Cruiser, a vodka spirits RTD introduced in 2024. In 2024, approximately 85% of the Company’s 2024 volume is in Beyond beer with the remainder in Traditional beer. The Company is the second largest supplier in Beyond beer at a 21% market share.
The Company’s business goal is to grow market share in the US Beer Market by creating and offering high quality alcohol beverages. With the support of a large, well-trained sales organization and world-class brewers, the Company strives to achieve this goal by offering consumer-responsive beverages, increasing brand availability and awareness through traditional media and digital advertising, point-of-sale, promotional programs, and drinker education and engagement.
The Company’s beverages are sold by the Company’s sales force to the same types of customers and drinkers in similar size quantities, at similar price points and through substantially the same channels of distribution. These beverages are manufactured using similar production processes, have comparable alcohol content and generally fall within the same regulatory environment.
The Company’s strategy is to create and offer a world-class variety of traditional and innovative alcohol beverages. The Company’s primary brands which include the Twisted Tea, Truly Hard Seltzer, Samuel Adams, Angry Orchard, Dogfish Head and Sun Cruiser brands are all available nationally. The Twisted Tea brand family has grown each year since the product was first introduced in 2001 and has established a loyal drinker following and has become the largest selling flavored malt beverage brand. In 2016, the Company began national distribution of the Truly Hard Seltzer brand and it maintained its place as one of the leading brands in the hard seltzer category in 2024. The Samuel Adams brand began in 1984 and the brand is recognized as one of the largest and most respected craft beer brands with a particular focus on lagers and seasonal beers. The Angry Orchard brand was launched in 2011 and since 2013, Angry Orchard has been the largest selling hard cider in the United States. The Dogfish Head brand began in 1995 and is recognized as one of the most innovative and respected craft beer and spirits brand with a particular focus on India Pale Ales (“IPAs”) and spirits RTDs. In addition to its primary brands, the Company has two local brands, Angel City® and Coney Island®, that primarily focus on local distribution.
The Company entered the market for spirits RTDs through its Dogfish Head brand in 2021 followed by its Truly spirits brands beginning in 2022 and Sun Cruiser in 2024. The Company discontinued its Truly spirits RTD brands in early 2025.
In 2021, the Company entered separate licensing agreements with PepsiCo, Inc. (“Pepsi”) and Jim Beam Brands Co. (“Jim Beam”) to develop, market and sell alcohol beverages. Beginning in 2022, the Company sold products under the brand names ‘Hard Mountain Dew’ under the Pepsi agreements and certain other brands under the Jim Beam agreements that have since been discontinued. Also, the Company collected royalties under the Jim Beam agreement on Jim Beam shipments of ‘Truly Vodka’ and ‘Twisted Tea Whiskey’. While the Company believes these agreements represent strategic opportunities to increase volume in the longer term, these combined brands represented approximately 2% of net revenue in 2023 and 2024, respectively.
Twisted Tea
The Company’s Twisted Tea products generally compete within the flavored malt beverage (“FMB”) category of Beyond beer. The FMB category is $4.6 billion in measured off-premise channels and comprises approximately 45% of Beyond beer and the FMB category grew in dollars approximately 20% in 2023 and 6% in 2024. This category is highly competitive due to, among other factors, the presence of large brewers and spirits companies in the category as well as many smaller national and regional competitors and a fast pace of product innovation.
The Company offers over ten styles of flavored malt beverages in the Twisted Tea brand family, most of which are available nationally in both the United States and Canada. Most styles are available in standard cans and some are available in 24 ounce cans and bottles. The majority of the promotional and distribution efforts for the Twisted Tea brand family are focused on Twisted Tea Original, Twisted Tea Half and Half and variety packs in various standard can packages. During 2023 and 2024, the Company increased its promotional efforts related to Twisted Tea Light, and in 2023 and 2024, the style grew significantly off a relatively small base.
In 2024, the Company launched in certain test markets, Twisted Tea Extreme, an 8% Alcohol By Volume ("ABV") flavored malt beverage in 2 styles, primarily sold in 24 ounce cans. Based on the results of the test markets, the Company anticipates launching Twisted Tea Extreme nationally during 2025.
Truly Hard Seltzer
The Company’s Truly Hard Seltzer brand generally competes within the hard seltzer category. This category grew rapidly in the early stages of its development and is highly competitive and includes large international and domestic competitors as well as many smaller national, regional and local hard seltzer companies. Beginning in the latter half of 2021 and continuing into 2023, the category saw sharp declines in volume. The Hard Seltzer category is $3.1 billion in measured off-premise channels and comprises approximately 30% of Beyond beer and the hard seltzer category declined in dollars approximately 16% in 2023 and 8% in 2024.
The Company offers over thirty styles of hard seltzer in the Truly Hard Seltzer brand family, most of which are available nationally in the United States. Most styles are available in sleek cans and some are available in 24 ounce cans. In 2024, the Company introduced Truly Unruly, an 8% ABV hard seltzer in a sleek can variety pack. In 2024, Truly Unruly was the top growth driver among higher ABV brands in the US Beer Market. The Company expects Truly Unruly to be a significant source of growth in 2025. The majority of the promotional and distribution efforts for the Truly brand family in 2024 were focused on sleek can variety packages which include, Truly Berry Mix Pack, Truly Party Pack, Truly Unruly Mix Pack, Truly Citrus Mix Pack, Truly Lemonade Seltzer Mix Pack and Truly Fruit Punch Mix Pack.
In early 2025, the Company anticipates launching nationally a new Truly Unruly Lemonade Mix Pack.
Samuel Adams and Dogfish Head Beers
The Company’s Samuel Adams and Dogfish Head beers generally compete within the craft beer and domestic specialty beer category. The craft beer category is $3.6 billion in measured off-premise channels and comprises approximately 10% of traditional beer and the craft beer category in dollars was approximately flat in 2023 and declined 2% in 2024. This category is highly competitive and includes large international and domestic competitors, as well as many smaller national, regional and local craft breweries.
The Company offers over twenty styles of beer in the Samuel Adams brand family and the brand is recognized for helping launch the craft beer industry. Samuel Adams Boston Lager® is the Company’s flagship beer that was introduced in 1984. The Samuel Adams Seasonal program of beers was originally introduced in the late 1980’s and includes various limited availability seasonal beers and variety packs. Samuel Adams American Light was introduced in 2024 and is made with high quality American ingredients and recently earned the title of Best Light Beer in America in the World Beer Awards.
Samuel Adams Just the Haze, a non-alcoholic hazy IPA, was released in early 2021 and Samuel Adams Golden, a non-alcoholic golden lager, was released in early 2023. The two Samuel Adams non-alcoholic beers combined in dollars grew 84% in 2023 and 27% in 2024 and represent 8% of the brands total.
The majority of the promotional and distribution efforts for the Samuel Adams brand family are focused on the Samuel Adams Seasonal program, Samuel Adams Boston Lager and Samuel Adams American Light. Most Samuel Adams beers are available nationally in various bottle, standard can, and keg packages.
The Samuel Adams brand also releases a variety of specialty package and draft beers brewed in limited quantities at its Samuel Adams Downtown Boston Tap Room, Samuel Adams Boston Brewery Tap Room, and Samuel Adams Cincinnati Brewery Tap Room.
The Company offers over twenty-five styles of beer in the Dogfish Head brand family. The Dogfish Head brand began in 1995 and it is recognized as an early leader in bringing culinary innovations to the U.S. craft beer market. The majority of the promotional and distribution efforts for the Dogfish Head brand family are focused on continually-hopped Dogfish Head 60 Minute and 90 Minute IPAs, along with seasonal variety packs. These styles are offered in various can, bottle and keg packages. The Dogfish Head brand also releases a variety of specialty package and draft beers brewed in limited quantities at its Dogfish Head Brewings and Eats and Milton Brewery tasting room locations. The Company does not own distribution rights to the Dogfish Head beer and distilled spirits brands outside of the United States and Canada.
Angry Orchard Hard Cider
The Company’s Angry Orchard ciders compete within the hard cider category. The hard cider category is $0.5 billion in measured off-premise channels and comprises approximately 5% of Beyond beer and the cider category in dollars increased 2% in 2023 and declined 2% in 2024. This category is small and highly competitive and the competition consists mostly of many small regional and local hard cider companies.
The Company offers over ten styles of hard cider in the Angry Orchard brand family, most of which are available nationally in the United States in various bottle, can, and keg packages. The majority of the promotional and distribution efforts for the Angry Orchard brand family are focused on Angry Orchard Crisp Apple. The Angry Orchard brand also releases a variety of specialty package and draft ciders fermented in limited quantities at its Company-owned Orchard and Cidery in Walden, New York.
Dogfish Head Spirit RTDs and Sun Cruiser
The Company’s Dogfish Head Canned Cocktails and Sun Cruiser brands compete in the spirits RTD category. The spirits RTD category is $1.3 billion in measured off-premise channels and comprises approximately 13% of Beyond beer and the spirits RTD category in dollars increased approximately 54% in 2023 and 24% in 2024. This category is highly competitive and includes large international and domestic competitors, as well as many small regional and local craft distilling companies.
The Dogfish Head brand began distilling spirits in 2002 and is considered one of the original craft distilleries. The Company offers over 15 styles of distilled spirits under the Dogfish Head brand in small quantities that are sold in limited markets. In 2021, the Company entered the market for spirits RTDs through its Dogfish Head brand. The Company currently offers over 7 styles of spirits RTDs under the Dogfish Head brand that are available in sleek can and sleek can variety packages.
The Sun Cruiser brand was launched in early 2024. The Company offers eight styles of vodka iced tea and lemonade RTDs in the Sun Cruiser brand family, that will be available nationally in the first half of 2025. All styles are available in sleek cans and some are available in 700 ml cans.
Product Innovations
The Company has a proven track record of innovation and building new brands and is committed to maintaining its position as a leading innovator. To that end, the Company continually tests new alcohol beverages and may sell them under various brand labels for evaluation of drinker interest. The Boston Brewery, the Milton Brewery and the Cidery, along with its other larger breweries and brewery tap rooms spend significant time ideating, testing and developing alcohol beverages for the Company’s potential future commercial development and evaluating ingredients and process improvements for existing beverages.
The Company’s most significant innovations in 2024 were the introduction of the Sun Cruiser brand, a new iced tea vodka based RTD, as well as the launch of Truly Unruly Mix Pack and Twisted Tea Extreme. Also, in 2024 the Company launched Samuel Adams American Light. In the first quarter of 2025, the Company is planning to launch Truly Unruly Lemonade Mix Pack, Sun Cruiser vodka based lemonade and Dogfish Head Grateful Dead Juicy Pale Ale. During the rest of 2025, the Company has plans to add new brands, new beverage styles and may reformulate existing styles of beverages.
In May 2021, the Company announced that it was establishing a subsidiary to serve as a dedicated research and innovation hub in the federally regulated market of Canada focused on non-alcoholic cannabis beverages. This subsidiary enables the Company to develop and pilot unique cannabis beverages, while cannabis regulations continue to evolve in the United States and worldwide. The Company began selling limited quantities of cannabis beverage products in Canada under the TeaPot brand during the second half of 2022. In late 2024, the Company began the launch of a new cannabis beverage brand of hand-crafted non-alcoholic cannabis cocktails named Emerald Hour. The Company currently does not have plans to produce or sell any cannabis products outside of Canada.
The Company continually evaluates the performance of its beverages and the rationalization of its product lines as a whole. Periodically, the Company discontinues certain styles and packages. For example, the Company discontinued Truly Margarita Style Variety Pack and Truly Tropical Variety Pack during the first half of 2024. Also late in 2024, the Company discontinued its Slingers and General Admission brands. In early 2025, Truly Vodka Soda and Truly Tequila Soda were discontinued. Certain styles or brands put on hiatus or discontinued in previous years may be produced for the Company’s variety packs or reintroduced.
Sales, Distribution, and Marketing
As dictated by the legal and regulatory environment, most all the Company’s sales are made to a network of over 300 wholesalers in the United States and to a network of foreign wholesalers, importers or other agencies (collectively referred to as “Distributors”). These Distributors, in turn, sell the products to retailers, such as grocery stores, club stores, convenience stores, liquor stores, bars, restaurants, stadiums and other traditional and e-commerce retail outlets, where the products are sold to drinkers, and in some limited circumstances to parties who act as sub-distributors. The Company sells its products predominantly in the United States, but also has markets in Canada, Mexico and other international markets.
With few exceptions, the Company’s products are not the primary brands in its Distributors’ portfolios. Thus, the Company, in addition to competing with other beverages for a share of the drinker’s business, competes with other beverage companies for a share of the Distributor’s attention, time and selling efforts. During 2024, the Company’s largest individual Distributor accounted for approximately 3% of the Company’s gross sales. The top three individual Distributors collectively accounted for approximately 7% of the Company’s gross sales. In some states and countries, the Company’s contracts with its Distributors may be affected by laws that restrict the enforcement of some contract terms, especially those related to the Company’s right to terminate the relationship.
Most of the Company’s products are shipped within days of packaging, resulting in limited finished goods at the Company’s breweries and third-party production facilities. The Company works with its distributors closely and has designed its internal supply chain systems and process to manage and maintain distributor inventories at between three and five weeks of sales on hand. These levels are designed to result in high customer service levels, limit distributor and retailer out of stocks and reduce the risk of inventory obsolescence.
During 2022, the Company produced and sourced materials for Truly Hard seltzer and some of its newer brands at the upper end of its projections to avoid out of stocks at retail. This led to improved customer service levels and significantly fewer out of stocks but resulted in write-offs of excess inventory at the Company’s breweries and warehouses. During 2023, the Company significantly improved its supply chain functions which led to reduced inventories internally and at distributors, while improving customer service levels and significantly reducing write-offs of excess inventory. During 2024, the Company’s distributor out of stocks improved significantly from prior years and were limited to some relatively minor out of stocks on its Truly brand during peak summer months. The Company continues to work on its supply chain improvement initiatives to better manage inventory and further reduce inventory obsolescence.
The Company believes distributor inventory as of December 28, 2024 and December 30, 2023 was at an appropriate level for each of its brands and averaged approximately four weeks on hand.
Boston Beer has a sales force of over 475 people, which the Company believes is one of the largest in the US Beer Market industry. The Company’s sales organization is designed to develop and strengthen relations at the Distributor, retailer and drinker levels by providing educational and promotional programs. The Company’s sales force has a high level of product knowledge and is trained in the details of the brewing and selling processes. Sales representatives typically carry samples of the Company’s beverages and other promotional materials to educate wholesale and retail buyers about the quality and taste of the Company’s products. The Company has developed strong relationships with its Distributors and retailers, many of which have benefited from the Company’s premium pricing strategy and growth.
The Company also engages in media campaigns, including television, digital and social media, radio, billboards, and print. These media efforts are complemented by participation in sponsorships, which currently include the United States Soccer Federation, Barstool Sports, the Boston Red Sox, and other professional sports teams, the Boston Marathon, local concert and festivals, and industry-related trade shows and promotional events at local establishments, to the extent permitted under local laws and regulations. The Company uses a wide array of point-of-sale items (banners, neon signs, umbrellas, glassware, display pieces, signs and menu stands) designed to stimulate impulse sales and continued awareness, where legal.
Packaging and Ingredients
Historically, the Company has been successful in obtaining sufficient quantities of the packaging materials and ingredients used in the production of its beverages. During 2020 and 2021, the Company experienced some supply chain constraints in packaging materials, primarily cans, that impacted the Company’s production schedules and increased can costs as a result of using a more expensive can supplier. The Company enters into limited-term supply agreements with certain vendors in order to receive preferential pricing. The Company maintains competitive sources for most packaging materials and ingredients. In 2024, certain flavorings, crowns and labels were each supplied by a single source; however, the Company believes that, given time to adjust, alternative suppliers are available. The most significant packaging and ingredients include:
Cans. Truly Hard Seltzer brand beverages are primarily packaged in sleek cans and Twisted Tea brand beverages are primarily packaged in standard cans. In 2024, approximately 79% of the Company’s total volume was packaged in cans and the Company expects that percentage to increase further in 2025. The demand for cans in the beverage industry significantly increased during 2020 and 2021 and there was a shortage of capacity, as can manufacturers adjusted their supply chains to keep up with the increased demand which had accelerated beginning in 2020 as alcohol consumption shifted from on-premise to off-premise. In 2021, as the Truly and the Twisted Tea brand families grew, the Company experienced supply shortages and these supply shortages impacted the Company’s production schedules and increased can costs as a result of using a more expensive can supplier. During 2022, 2023 and 2024 the Company did not have any significant disruptions in its can supply and the Company currently believes that it will have a sufficient supply of cans in 2025.
Flavorings and Fruit Juice. The Company’s beverages include many unique and proprietary flavors and combinations of flavors and most of these flavorings are single sourced. Truly Hard Seltzer and Twisted Tea brand beverages are particularly reliant on the use of flavorings and a variety of flavors as part of their appeal to drinkers. The Company is working closely with various flavoring and fruit juice suppliers to ensure it has an adequate supply and currently believes that it will have sufficient supply of flavorings and fruit juice in 2025.
Cardboard. The Company’s beverages are packaged primarily in cardboard wraps, carriers and cardboard shipping cases. Since 2020, the Company has not had any significant disruptions in its supply of cardboard and the Company currently believes that it will have a sufficient supply of cardboard wraps in 2025.
Glass. Some of the Company’s beverages are sold in glass bottles. Since 2020, the Company has not had any significant disruptions in its supply of glass and the Company currently believes that it will have a sufficient supply of glass in 2025.
Malt. The two-row varieties of barley used in the Company’s malt are mainly grown in the United States and Canada. The 2024 North American barley crop, which will support 2025 malt needs, was generally consistent with historical long-term averages with regard to both quality and quantity. The Company purchased most of the malt used in the production of its beers from four suppliers during 2024. The Company also believes that there are other malt suppliers available that are capable of supplying its needs.
Hops. The Company uses Noble hop varieties from Europe for many of its Samuel Adams beers and also uses hops grown in other areas of Europe, the United States, and New Zealand. Noble hops are grown in several specific areas in Germany and the Czech Republic that are recognized for growing hops with superior taste and aroma properties. The Company uses hops in various formats including T-90 hop pellets, T-45 hop pellets and CO2 Extract. The Company stores its hops in multiple cold storage warehouses to minimize the impact of a catastrophe at a single site.
The Company enters into purchase commitments with seven primary hop dealers, attempts to maintain a one to two-year supply of essential hop varieties on-hand in order to limit the risk of an unexpected reduction in supply, and procures hops needed for new beers, based on its best estimate of likely short-term demand. The Company classifies hops inventory in excess of two years of forecasted usage as other long term assets.
Variations to usage plans could result in hops shortages for specific beers or an excess of certain hops varieties.
Yeast. The Company uses multiple yeast strains for production of its beverages. While some strains are commercially available, other strains are proprietary. Since the proprietary strains cannot be replaced if destroyed, the Company protects these strains by storing multiple cultures of the same strain at different production locations and in several independent laboratories.
Apples. The Company uses special varieties and origins of apples in its hard ciders that it believes are important for their flavor profiles. In 2024, these apples were sourced primarily from Europe and the United States and include bittersweet apples from France and culinary apples from Italy, Washington State and New York. Purchases and commitments are denominated in Euros for European apples and US Dollars for American apples. There is limited availability of some of these apple varieties, and many outside factors, including weather conditions, growers rotating from apples to other crops, competitor demand, government regulation and legislation affecting agriculture could affect both price and supply.
Quality Assurance
The Company employs a quality assurance team and brewmasters to monitor the Company’s brewing operations and control the production of its beverages both at Company-owned breweries and at the third-party production facilities at which the Company’s products are produced. Extensive tests, tastings and evaluations are typically required to ensure that each batch of the Company’s beverages conforms to the Company’s standards. The Company has on-site quality control labs at each of the Company-owned breweries and supports the smaller tap rooms and local breweries with additional centralized lab services.
With the exception of certain specialty and distilled products, the Company includes a clearly legible “freshness” date on every bottle, can and keg of its beverages, in order to ensure that its drinkers enjoy only the freshest products. Boston Beer was the first American brewer to use this practice.
Production Strategy
The Company continues to pursue a production strategy that includes production at breweries owned by the Company and production facilities owned by others. The Company made capital investments in 2024 of approximately $76.8 million, most of which represented investments in breweries owned by the Company. These investments were made to drive efficiencies and cost reductions and support product innovation. Based on its current estimates of future volumes and mix, the Company expects to invest between $90 million and $110 million in 2025 to meet those estimates. The increase in 2025 estimated capital expenditures compared to 2024 is driven by an investment in our Pennsylvania Brewery infrastructure for wastewater treatment. Because actual capital investments are highly dependent on meeting demand, the actual amount spent may well be significantly different from the Company’s current expectations.
The Pennsylvania Brewery, the Cincinnati Brewery and the Milton Brewery produced most of the Company’s shipment volume from Company owned breweries during 2024. The Pennsylvania Brewery is the Company’s largest brewery.
Production and retail activities at the Company's local breweries and tap rooms are mainly for brewing and packaging beers for retail sales on site at tap rooms and gift shops, restaurant activities, developing innovative and traditional beers and in some cases supporting draft and package accounts in the respective local market areas.
The Cidery’s production is mainly for developing new types of innovative hard ciders and fermenting and packaging ciders for retail sales on site at the Cidery and supporting draft and package accounts in the local market area.
During each of the years ended December 28, 2024 and December 30, 2023, the Company produced approximately 74% of its domestic volume at Company-owned breweries. In the normal course of its business, the Company has historically entered into various production arrangements with other production companies. Pursuant to these arrangements, the Company generally supplies raw materials and packaging to those production companies and incurs conversion fees for labor at the time the liquid is produced and packaged. The Company has made up-front payments that were used for capital improvements at these third-party production facilities that it expenses over the period of the contracts.
The Company currently has production services agreements with subsidiaries of City Brewing Company, LLC (“City Brewing”). During 2024 and 2023, City Brewing supplied approximately 26% and 22%, respectively, of the Company’s annual domestic shipment volume. In accordance with the production services agreements, the Company has paid to City Brewing for capital improvements at its facilities and other pre-payments. These payments are being expensed over the terms of the agreements. Currently, certain of these production services agreements expire on December 31, 2025 and others on December 31, 2028. The Company has the contractual right to extend its agreements with City Brewing beyond the current termination dates on an annual basis through December 31, 2035. The remaining net book value of these third-party production prepayments is $14.5 million at December 28, 2024 of which $10.3 million is expected to be expensed to cost of goods sold during 2025 and the remainder thereafter.
These agreements include minimum capacity availability commitments by City Brewing and the Company is obligated to meet annual minimum volume commitments and is subject to contractual shortfall fees, if these annual minimum volume commitments are not met.
In January of 2024, the Company and City Brewing entered into a Loan and Security Agreement at which time payment of $20 million was made by the Company to City Brewing. Repayment of the note receivable plus an agreed investment return for a combined total of $22.4 million shall be repaid to the company subject to annual repayment limits. As of December 28, 2024, the balance of the note receivable is $16.7 million and the final maturity date is December 31, 2028.
In December of 2024 the Company entered into an amendment and restatement in its entirety of an existing production agreement with a third-party supplier, Rauch North America Inc ("Rauch"). This amendment and restatement adjusted the existing production agreement to better match the Company’s future capacity requirements and resulted in increased production flexibility and more favorable termination rights to the Company in exchange for a $26 million cash payment to Rauch which was paid on December 23, 2024. As a result of the payment, the Company recorded a pre-tax contract settlement expense of $26 million in the fourth quarter of 2024.
The amended and restated Rauch agreement includes quarterly minimum payments that generally total $4.1 million annually at zero volume and a termination fee of $5 million with 12 months written notice. The initial term of the agreement expires December 31, 2031 with provisions to extend.
At current production volume projections, the Company believes that it will fall short of its future annual volume commitments under the City Brewing and Rauch agreements and will incur shortfall fees. The Company expenses the shortfall fees during the contractual period when such fees are incurred as a component of cost of goods sold. During 2024 and 2023, the Company recorded $13.0 million and $9.5 million, respectively, in shortfall fees. At current volume projections, the Company anticipates that it will recognize approximately $30 million of shortfall fees in future years with $14 million forecasted to be expensed in 2025 and the remainder expected to be expensed primarily in 2026.
As of December 28, 2024, if volume for the remaining term of the production arrangements was zero, the total contractual shortfall and termination fees, with advance notice as specified in the related contractual agreements, would total approximately $37 million with $27 million due in 2025 and $10 million due in future years thereafter.
The Company has regular discussions with its third-party production suppliers related to its future capacity needs and the terms of its contracts. Changes to volume estimates, future amendments or cancellations of existing contracts could accelerate or change total shortfall fees expected to be incurred.
The Company currently expects that the percentage of total domestic production at third-party production facilities will be approximately 20% in 2025. The Company selects third-party production facilities with one or more of: (i) sleek can packaging and automated variety packaging capability and capacity; (ii) first-rate quality control capabilities throughout the process; and (iii) the capability of utilizing traditional brewing, fermenting and finishing methods. Under its production arrangements with third parties, the Company is charged a service fee based on units produced at each of the facilities.
The Company’s international business is primarily supplied by third-party production and packaging agreements and production under license at international locations.
While the Company believes that it has alternatives available to it, in the event that production at any of its current locations is interrupted, severe interruptions at the Pennsylvania Brewery, Cincinnati Brewery, or City Brewing facilities would be most problematic, especially in seasonal peak periods. In addition, the Company may not be able to maintain its current economics, if interruptions were to occur, and could face significant delays in starting up replacement production locations. Potential interruptions at production facilities include labor issues, governmental actions, quality issues, contractual disputes, machinery failures, operational shutdowns, or natural or other unavoidable catastrophes. The Company would work with available third-party production facilities to attempt to minimize any potential disruptions.
Competition
The US Beer Market is highly competitive due to large domestic and international brewers and a large number of smaller craft brewers and craft distilleries who distribute similar products that have similar pricing and target drinkers.
The two largest brewers in the United States, AB InBev and Molson Coors, participate actively in Beyond beer and Traditional beer, through numerous beers, flavored malt beverages, hard seltzers and spirit RTDs. Imported beers, such as Modelo Especial®, Corona®, Heineken®, and Stella Artois®, continue to compete aggressively in the United States and have gained market share over the last ten years. AB InBev, Molson Coors, Constellation Brands (owner of the United States Distribution rights to Modelo Especial and Corona) and Heineken may have substantially greater financial resources, marketing strength and distribution networks than the Company.
In addition, large non-alcoholic beverage companies including The Coca-Cola Company (“Coke"), Pepsi, Monster Beverage Corporation (“Monster”), and Arizona Beverage Company (“Arizona") have entered these markets directly or through licensing agreements with alcoholic beverage companies to develop alcohol versions of existing traditional non-alcohol brands. Coke has entered into agreements with Molson Coors to develop, market and sell Topo Chico brand Hard Seltzer, Simply Spiked Lemonade, and Peace Hard Tea. Coke also announced agreements with Constellation Brands to develop, market and sell FRESCA™ Mixed and with Brown Forman to develop, market and sell Jack Daniel's® Tennessee Whiskey and Coca-Cola®™ Ready-to-Drink Cocktail. As previously discussed, the Company has entered into an agreement with Pepsi to develop, market and sell Hard Mountain Dew, to take advantage of this trend. Pepsi also entered an agreement in late 2022 with FIFCO USA, a New York based brewery, to develop, market and sell Lipton Hard Iced Tea which launched during the first half of 2023. In addition, Monster acquired CaNarchy Craft Brewery Collective in early 2022 and launched the Beast Unleashed, a new brand of flavored malt beverages in early 2023 which includes Nasty Beast Hard Tea. Monster is planning to launch a new hard lemonade named Blind Lemon in early 2025. Arizona, after earlier development and launch in 2020 in Canadian markets, launched Arizona Hard Tea in the United States beginning in 2023.
The Company’s Twisted Tea beverages compete generally within the FMB category of Beyond beer. FMBs, such as Twisted Tea, Mike’s Hard Lemonade, Smirnoff Ice, Cayman Jack, Clubtails, Beast Unleashed, Bud Light Lime, Redd’s Apple Ale, Seagrams Escapes. As Twisted Tea has grown, more hard teas have been introduced by competitors. Some of these hard tea competitors currently include Arizona Hard Tea, Arnold Palmer Spiked, Nasty Beast Hard Tea, VooDoo Ranger Hard Charged Tea, Hoop Hard Tea, 2Hoots Hard Tea and Peace Hard Tea. As noted earlier, the FMB category is highly competitive due to, among other factors, the presence of large brewers and spirits companies in the category, the advertising of malt-based spirits brands in channels not available to the parent brands and a fast pace of product innovation.
The Company’s Truly Hard Seltzer beverages compete primarily within the hard seltzer category of Beyond beer. This category grew quickly from 2016 to 2021 and then declined in 2022, 2023 and 2024. The hard seltzer category is highly competitive and includes large international and domestic competitors. Hard seltzers are typically priced competitively with Traditional beer and Beyond beer and may compete for drinkers with beer, wine, spirits, or FMBs. Some of these competitors include Mark Anthony Brands under the brand name “White Claw” and "White Claw Surge."; ABInBev under “Bud Light Seltzer”, and Molson Coors under “Vizzy Hard Sparkling Water” and "Topo Chico".
The Company’s Truly brand also competes against a sub-category of Spirits RTDs that the Company and the alcohol industry at large categorize as Spirit Seltzer and Soda. The Spirit Seltzer and Soda sub-category generally consists of lower calorie and lower alcohol Spirits RTDs that are similar in flavor and taste to the hard seltzer category beverages but at a higher price. The leading brand in the Spirit Seltzer and Soda category is owned by E&J Gallo Winery under the brand name "High Noon” and other competitors in the category include ABInBev under “Nutrl Vodka Seltzer”, Mark Anthony under "White Claw Vodka Soda" and Molson Coors under "Topo Chico Spirited Can Cocktails".
The Company’s Samuel Adams and Dogfish Head beers compete primarily within the craft beer and domestic specialty beer category of Traditional beer. The Company expects competition and innovation among domestic craft brewers to remain strong. The Company estimates there are approximately 10,000 breweries in operation, up from approximately 1,500 operating breweries in 2009. Most of these new breweries are craft (small and independent) brewers.
In recent years, there have been numerous announcements of acquisitions of or investments in craft brewers by larger breweries and private equity and other investors. Most recently, during 2023 and 2024, in separate transactions AB InBev and Molson Coors sold some of these craft brands and breweries to Tilray Brands, Inc a global cannabis, craft beer, spirits beverage company.
The Company’s Angry Orchard product line competes within the hard cider category. As noted earlier, this category is small and highly competitive and the competitors include mostly small regional and local hard cider companies. Hard ciders are typically priced competitively with Traditional beer and Beyond beer and may compete for drinkers with beer, wine, spirits, or FMBs. Some of these competitors include "Bold Rock", "2 Towns" and “Blakes”.
The Company’s Dogfish Head Canned Cocktails and Sun Cruiser compete in the spirits RTDs category. This category is small and highly competitive and includes large international and domestic competitors, as well as many small regional and local distilling companies. Spirits RTDs are typically higher priced and may compete for drinkers with beer, wine, spirits, or FMBs. As discussed above, spirits RTDs consist of the sub-category of Spirit Seltzer and Soda. Dogfish Head Canned Cocktails generally competes in the other sub-category of spirits RTDs named Spirits-based Canned Cocktails. Beverages in the Spirits-based Canned Cocktails sub-category generally have more flavor and higher alcohol than spirits RTDs in the sub-category of Spirit Seltzer and Soda. Some of these Spirits-based Canned Cocktails competitors include; ABInBev under the brand name "Cutwater" and Diageo under the brand name "Crown Royal".
The Company’s products also compete with other alcoholic beverages for drinker attention and consumption and the pace of innovation in the categories in which the Company competes is increasing. In recent years, wine and spirits have been competing more directly with beers. The Company monitors such activity and attempts to develop strategies which benefit from the drinker’s interest in trading up, in order to position its beverages competitively with wine and spirits.
The Company competes with other beer and alcoholic beverage companies within a three-tier distribution system. The Company competes for a share of the Distributor’s attention, time and selling efforts. At retail, the Company competes for traditional retail shelf, cold box and tap space, as well as e-commerce placement. From a drinker perspective, competition exists for brand acceptance and loyalty. The principal factors of competition in the market for Traditional beer and Beyond beer occasions include product quality and taste, brand advertising and imagery, trade and drinker promotions, pricing, packaging and the development of innovative new products.
The Company distributes its products through independent Distributors who also distribute competitors’ products. Certain brewers have contracts with their Distributors that impose requirements on the Distributors that are intended to maximize the Distributors’ attention, time and selling efforts on that brewer’s products. These contracts generally result in increased competition among brewers as the contracts may affect the manner in which a Distributor allocates selling effort and investment to the brands included in its portfolio. The Company closely monitors these and other trends in its Distributor network and works to develop programs and tactics intended to best position its products in the market.
The Company has certain competitive advantages over other brewers and competitors, including a long history of awards for product quality, greater available resources and the ability to distribute and promote its products on a more cost-effective basis. Additionally, the Company believes it has competitive advantages over imported beers, including lower transportation costs, higher product quality, a lack of import charges and superior product freshness.
Regulation and Taxation
The alcoholic beverage industry is regulated by federal, state and local governments. These regulations govern the production, sale and distribution of alcoholic beverages, including permitting, licensing, marketing and advertising. To operate its production facilities, the Company must obtain and maintain numerous permits, licenses and approvals from various governmental agencies, including but not limited to, the Alcohol and Tobacco Tax and Trade Bureau (the “TTB”), the Food and Drug Administration, state alcohol regulatory agencies and state and federal environmental agencies.
Governmental entities may levy various taxes, license fees and other similar charges and may require bonds to ensure compliance with applicable laws and regulations. Beginning in 2018, as a result of the “Tax Cuts and Jobs Act”, the Company’s federal excise tax rate on hard seltzer and beer decreased from $18 to $16 per barrel on all barrels below 6 million barrels produced annually. The top tier rate on hard cider (with alcohol by volume of 8.5% or less) is $0.226 per gallon, on hard cider (with non-qualifying fermentable fruits) is $1.07 per gallon, on artificially carbonated wine (hard cider with high CO2 levels) is $3.30 per gallon, and on distilled spirits is $13.50 per proof gallon. States levy excise taxes at varying rates based on the type of beverage and alcohol content. Failure by the Company to comply with applicable federal, state or local laws and regulations could result in higher taxes, penalties, fees and suspension or revocation of permits, licenses or approvals. While there can be no assurance that any such regulatory action would not have a material adverse effect upon the Company or its operating results, the Company is not aware of any infraction affecting any of its licenses or permits that would materially impact its ability to continue its current operations.
Trademarks
The Company has obtained trademark registrations with the United States Patent and Trademark Office for over 400 trademarks, including Samuel Adams®, Sam Adams®, Twisted Tea®, Truly®, Truly Hard Seltzer®, Angry Orchard®, Dogfish Head®, Coney Island®, and Angel City Brewery®. It also has a number of common law trademarks. Several Company trademarks are also registered or have registrations pending in various foreign countries. The Company regards its trademarks as having substantial value and as being an important factor in the marketing of its products. The Company is not aware of any trademark infringements that could materially affect its current business or any prior claim to the trademarks that would prevent the Company from using such trademarks in its business. The Company’s policy is to pursue registration of its marks whenever appropriate and to oppose infringements of its marks through available enforcement options.
Environmental, Health, and Safety Regulations and Operating Considerations
We are committed to strong corporate governance, corporate responsibility, and the accountability of our Board and our Executive Leadership Team to our stockholders. This section provides a summary of the Board’s and management’s oversight of our strategies regarding our Environmental, Social, and Governance (ESG”) initiatives and selected highlights of the previous year’s accomplishments.
While formal ESG reporting began in our 2021 ESG Report, we began reporting on ESG initiatives starting in our 2019 Proxy Statement. While we’ve long believed that it’s important to provide accurate and transparent reporting on the impact that our Company has had on our people, our planet, and our communities, our commitment to sustainability has evolved significantly over the last several years, ushering in a new era of accountability in 2025. This shift reflects an increasing focus on transparency and meaningful progress. Since our inaugural ESG Report, we’ve built upon our strategy each year, strengthening our focus on transparency, progress, and responsible growth.
Among our key ESG achievements in 2024, we focused on establishing our sustainability goals and targets, which will be detailed in our forthcoming 2024 ESG report. This process involved extensive discussions with subject matter experts, collaborative workshops, and efforts to obtain Executive Leadership Team approval ahead of publication in 2025.
For additional information on our impact and ESG initiatives, the Company’s historical ESG reports are available in the sustainability section on our company website at www.bostonbeer.com/our-impact/sustainability. We anticipate that we will publish our 2024 ESG Report in the summer of 2025. In advance of the publication of that report, here is an early look at some of our ESG highlights from 2024.
2024 Environmental Highlights
•BBC advanced our commitment to sustainable packaging through two key initiatives:
•BBC advanced CO₂ recapturing systems across all three manufacturing locations. Most notably, at our Cincinnati brewery, we expanded CO₂ recovery capacity, reducing reliance on external sources and saving $30,000 weekly. The improved process captures CO₂ emissions from fermentation, filters and pressurizes the gas, and reuses it for carbonation and other operations. These energy-efficient advancements highlight our commitment to innovative solutions that drive both environmental and operational benefits.
•BBC committed to constructing a wastewater pre-treatment facility at our Samuel Adams Pennsylvania Brewery, which will reduce workloads for local wastewater treatment plants and capture biogas that will be used on site as an energy source, partially offsetting the need for fossil fuels.
•BBC Transportation Team improved truckload utilization by 2% in 2024 compared to 2023. Improving truck utilization allows Boston Beer to reduce the total number of trucks needed to ship our products and enable each truck to carry more products, thus reducing the overall emissions output of our transportation network.
2024 Social Highlights
•Creating and maintaining healthy and safe working environments is a critical part of our sustainability strategy. In 2024, we achieved an ambitious goal to reduce total injuries by 20% per location, with the ultimate target of achieving an injury-free workplace by 2030.
•As part of our Learning and Development team’s mission, we hold managers accountable for creating an environment that enhances coworker development. In 2024, we elevated manager development by launching a refreshed New Leader Experience course, a 2.5-day program providing essential leadership tools and training. We also introduced Moments that Matter training to empower all people leaders in handling key leadership moments effectively.
•We remain committed to fostering a diverse and inclusive workplace where all coworkers feel heard, valued, and respected. In 2024, we advanced this commitment by building participation and engagement within our seven coworker network groups, inclusive leadership development, bystander intervention training, and allyship programs.
•We remain committed to pay transparency by providing coworkers with insight into pay philosophy, administration, and job-specific pay ranges. In 2024, we refined our compensation strategy, expanded education for leaders and coworkers, enhanced manager training on compensation conversations, and engaged an independent third-party to analyze pay equity.
•In 2024, Boston Beer coworkers participated in 40 separate “Benevolence Days,” collectively volunteering more than 2,820 hours supporting 58 community partners and their mission-driven work.
•Building on 15 years of impact, our Samuel Adams Brewing the American Dream® program continued its mission in 2024 to empower entrepreneurs to thrive. By year’s end, the program had provided nearly 4,500 loans, totaling almost $113 million in funding. In collaboration with Accion Opportunity Fund, the nation’s largest nonprofit micro-lender, and a network of local nonprofit partners, the initiative empowers small business owners in the food, beverage, and brewing industries by offering access to capital, expert coaching, and opportunities to expand into new markets.
Human Capital Resources
As of December 28, 2024, the Company had 2,537 coworkers, of which 171 were represented by unions or similar organizations. The Company’s Executive Leadership Team (“ELT”) is comprised of the Company's CEO and seven of his direct reports who collectively have management responsibility for the Company's primary business areas, including but not limited to brewing, supply chain operations, sales, marketing, finance, legal, and people and culture. The Company’s Board of Directors and the ELT believe that succession planning, talent management, culture, and diversity, equity, and inclusion are critical to the Company’s continued success.
Succession Planning and Talent Management
The Company regularly reviews talent development and succession plans for each of its functional areas to identify and develop a pipeline of talent to maintain business operations. The Company understands the potential costs and risks of bringing in an outside executive officer in today’s environment, and that businesses are often – but not always – more successful in promoting internal candidates. Accordingly, the Board of Directors and the ELT make efforts to identify potential successors for those positions long in advance of any potential positional vacancies, perform skills gap analyses for those internal candidates, and provide training and exposure on those gap areas to those candidates in order to develop better potential successors. The Board of Directors is primarily responsible for succession planning for the CEO, but also participates in succession planning discussions for other executive officer positions. The Company believes that its culture, compensation structure, long-term equity program, and robust training and development program provide motivation for talented leaders to remain with the Company.
Other
The Company submitted the Section 12(a) CEO Certification to the New York Stock Exchange in accordance with the requirements of Section 303A of the NYSE Listed Company Manual. This Annual Report on Form 10-K contains at Exhibits 31.1 and 31.2 the certifications of the Chief Executive Officer and Chief Financial Officer, respectively, in accordance with the requirements of Section 302 of the Sarbanes-Oxley Act of 2002. The Company makes available free of charge copies of its Annual Report on Form 10-K, as well as other reports required to be filed by Section 13(a) or 15(d) of the Securities Exchange Act of 1934, on the Company’s investor relations website at www.bostonbeer.com, or upon written request to Investor Relations, The Boston Beer Company, Inc., One Design Center Place, Suite 850, Boston, Massachusetts 02210.
Item 1A. Risk Factors
In addition to the other information in this Annual Report on Form 10-K, the risks described below should be carefully considered before deciding to invest in shares of the Company’s Class A Common Stock. These are risks and uncertainties that management believes are most likely to be material and therefore are most important for an investor to consider. The Company’s business operations and results may also be adversely affected by additional risks and uncertainties not presently known to it, or which it currently deems immaterial, or which are similar to those faced by other companies in its industry or business in general. If any of the following risks or uncertainties actually occurs, the Company’s business, financial condition, results of operations or cash flows would likely suffer. In that event, the market price of the Company’s Class A Common Stock could decline.
Risks Associated with Our Industry
The Company faces substantial competition.
The Beyond beer and Traditional beer markets within the United States (“US Beer Market”) is highly competitive due to the participation of large domestic and international brewers and the large number of regional and local competitors, who distribute similar products that have similar pricing and target drinkers.
The two largest brewers in the United States, AB InBev and Molson Coors, participate actively in the US Beer Market, through numerous offerings including beers, flavored malt beverages, hard seltzers and spirit RTDs. Imported beers, such as Modelo Especial®, Corona®, Heineken®, and Stella Artois®, continue to compete aggressively in the United States and have gained market share over the last ten years. Constellation Brands (owner of the United States distribution rights to Modelo Especial and Corona) and Heineken may have substantially greater financial resources, marketing strength and distribution networks than the Company. The Company anticipates competition will remain strong as existing beverage companies continue adding more SKUs and styles. The potential for growth in the sales of flavored malt beverages, hard seltzers, domestic beers, imported beers and spirits RTDs is expected to increase the competition in the market for Beyond beer and Traditional beer occasions within the United States and, as a result, the Company may well face competitive pricing pressures and the demand for and market share of the Company’s products may fluctuate and possibly decline.
The Company’s products compete generally with other alcoholic beverages. The Company competes with other beer and beverage companies not only for drinker acceptance and loyalty, but also for traditional retail shelf, cold box and tap space, as well as e-commerce placement and for marketing focus by the Company’s distributors and their customers, all of which also distribute and sell other alcoholic beverage products. Many of the Company’s competitors, including AB InBev, Molson Coors, Constellation, Heineken and Mark Anthony Brands, have substantially greater financial resources, marketing strength and distribution networks than the Company. Moreover, the introduction of new products by competitors that compete directly with the Company’s products or that diminish the importance of the Company’s products to retailers or Distributors may have a material adverse effect on the Company’s business and financial results.
Several large non-alcoholic beverage companies including Coca-Cola Company (“Coke"), Pepsi, Monster Beverage Corporation (“Monster”) and Arizona Beverage Company ("Arizona") have entered the alcoholic beverage market directly or through licensing agreements with alcoholic beverage companies to develop alcohol versions of existing traditional non-alcohol brands. As previously discussed, the Company has entered into an agreement with Pepsi to develop, market and sell alcohol beverages which include Hard Mountain Dew, a flavored malt beverage, to take advantage of this trend.
Due to the increased leverage that the larger, alcohol and non-alcohol beverage companies may have in distribution and sales and marketing expenses, the costs to the Company of competing could increase. The potential also exists for these large competitors to increase their influence with their Distributors, making it difficult for smaller beverage companies to maintain their market presence or enter new markets. Also, consolidation in the industry could also reduce the contract brewing capacity that is available to the Company. These potential increases in the number and availability of competing brands, the costs to compete, reductions in contract brewing capacity and decreases in distribution support and opportunities may have a material adverse effect on the Company’s business and financial results.
Changes in public attitudes and drinker tastes could harm the Company’s business. Regulatory changes in response to public attitudes could adversely affect the Company’s business.
The alcoholic beverage industry has been the subject of considerable societal and political attention for several years, due to public concern over alcohol-related social problems, including driving under the influence, underage drinking and health consequences from the misuse of alcohol, including alcoholism. As an outgrowth of these concerns, the possibility exists that advertising by alcoholic beverage producers could be restricted, that additional cautionary labeling or packaging requirements might be imposed, that further restrictions on the sale of alcohol might be imposed or that there may be renewed efforts to impose increased excise or other taxes on beer sold in the United States.
The US Beer Market has experienced a decline in shipments over the last ten years. The Company believes that this decline is due to declining alcohol consumption per person in the population, health and wellness trends and increased competition from wine and spirits companies. If consumption of the Company’s products in general were to come into disfavor among domestic drinkers, or if the domestic alcohol beverage industry were subjected to significant additional societal pressure or governmental regulations, the Company’s business could be materially adversely affected.
Additionally, certain states are considering or have passed laws and regulations that allow the sale and distribution of cannabis. Currently, it is not possible to predict the impact of this on sales of alcohol, but it is possible that legal cannabis usage could adversely impact the demand for the Company’s products. The company has a cannabis-based beverage product in Canada and could be ready to produce that in the United States if the regulatory environment changes.
The Company is dependent on its distributors.
In the United States, where approximately 95% of its beverages are sold, the Company sells most of its alcohol beverages to independent beer Distributors for distribution to retailers and, ultimately, to drinkers. Although the Company currently has arrangements with over 300 Distributors, sustained growth will require it to maintain such relationships and possibly enter into agreements with additional Distributors. Changes in control or ownership within the current distribution network could lead to less support of the Company’s products.
Contributing to distribution risk is the fact that the Company’s distribution agreements are generally terminable by the Distributor on relatively short notice. While these distribution agreements contain provisions giving the Company enforcement and termination rights, some state laws prohibit the Company from exercising these contractual rights. The Company’s ability to maintain its existing distribution arrangements may be adversely affected by the fact that many of its Distributors are reliant on one of the major beer producers for a large percentage of their revenue and, therefore, they may be influenced by such producers. If the Company’s existing distribution agreements are terminated, it may not be able to enter into new distribution agreements on substantially similar terms, which may result in an increase in the costs of distribution.
No assurance can be given that the Company will be able to maintain its current distribution network or secure additional Distributors on terms not less favorable to the Company than its current arrangements.
Risks Related to the Company's Business and Operations
There is no assurance that the Company will grow its business in the future or that the Company can adapt to the challenges of the changing competitive environment.
Beginning in the second half of 2021, the market for hard seltzer products experienced decelerating growth trends, which contributed to the Company’s depletion volume decline of 5% in 2022, 6% in 2023 (5% decline on a 52-week comparable basis) and 2% in 2024. The slowdown in growth trends greatly impacted the Company's volume of production and shipments, as well as its volume projections for the future. The volume reduction also resulted in increased supply chain related costs. These costs include the destruction of excess inventory, provisions for excess and obsolete inventories, property, plant and equipment impairments, write-offs of third-party production prepayments and provisions for costs associated with the termination of various third-party production contracts.
The Company is targeting a percentage change in shipments and depletion volume of between down single digits to up single digits. The Company’s ability to meet these targets may be affected by an increasing number of competing beverages. The development of new products by the Company to meet these challenges may lead to reduced sales of the Company’s existing brands and there is no guarantee that these new product initiatives will generate stable long term volume. While the Company believes that a combination of innovation, new brand messaging and the use of traditional and social media, and increased investment in sales execution can lead to increased demand, there is no guarantee that the Company’s actions will be successful in maintaining the Company’s historical levels of profitability. Reduced sales, among other factors, could lead to lower brewery utilization, lower funds available to invest in brand support and reduced profitability, and these challenges may require a different mix and level of marketing investments to stabilize and grow volumes. A lower growth environment or periods of sales declines will present challenges for the Company to motivate and retain employees, maintain the current levels of distributor and retailer support of its brands, and fund its current brand investment levels. This could potentially lead to a review of long term organization and capacity needs. Currently, the Company believes it can meet its volume targets in 2025 and return to volume growth in future years, but there is no guarantee its efforts will be successful or profitable.
The Company’s inability to react to changes in demand could have a material adverse effect on the Company’s operations or financial results.
Historically, during periods of growth, the Company has faced challenges in meeting demand. The challenges were both production constraints, primarily resulting from canning and variety pack capacity limitations, and can supply constraints. During these periods of growth, the Company experienced increased inventory obsolescence, and operational, and freight costs, as it reacted. In response to these issues, the Company significantly increased its capacity and personnel to address these challenges.
With a decline in volume over the second half of 2021 through 2024, the Company incurred additional supply chain related costs associated with downsizing its production model to adjust to reduced demand. In recent years, the Company has been able to better match its supply chain to meet demand, but a sudden increase could result in a recurrence of challenges in meeting demand and a sudden decrease could result in other incremental costs. There can be no assurance that the Company will effectively address changing consumer demand or manage increasing product complexity, without experiencing similar issues in the future. Planning failures, operating inefficiencies, insufficient employee training, control deficiencies, or other similar issues could well have a material adverse effect on the Company’s business and financial results. Growth or decline in the Company’s revenues, changes in operating procedures, and increased complexity have required significant capital investment. The Company on an overall basis has yet to see any operating cost leverage from these investments and there is no guarantee that it will.
The Company remains reliant on third party-owned production facilities, particularly City Brewing Company, LLC, and its subsidiaries, to meet demand. The percentage of its domestic volume produced at Company owned breweries decreased from over 90% in 2017 to approximately 74% in 2024. The Company currently expects that the percentage of total domestic production at Company owned breweries in 2025 will be 80%. The Company expects its reliance on production at City Brewing Company, LLC to decline from approximately 26% of production in 2024 to approximately 20% of production in 2025.
The Company’s ability to grow and to meet potentially increasing consumer demand will be affected by:
•its ability to meet production goals and/or targets at the Company’s owned breweries and third party-owned production facilities;
•its ability to enter into new production contracts with third party-owned breweries on commercially acceptable terms;
•disruption or other operating performance issues at the Company’s owned breweries or limits on the availability of suitable production capacity at third party-owned production facilities;
•its ability to obtain sufficient quantities of certain packaging materials and ingredients, such as cans, flavorings, cardboard wraps and glass bottles from suppliers; and
•its ability to reduce risk of both over and under supply by improving and automating manual internal processes for demand and production planning.
If the Company were unable to increase supply to meet increased consumer demand for its products, the Company’s business and financial results could well be adversely affected. Alternatively, if there is a sudden decline in demand for the Company’s products, additional costs and inefficiencies could likely result from efforts to adjust the Company’s production model accordingly.
The Company’s advertising and promotional investments may affect the Company’s financial results but not be effective.
The Company has made and expects to continue to make, significant advertising and promotional expenditures to enhance its existing brands and promote new brands. These expenditures may adversely affect the Company’s results of operations in a particular quarter or even for the full year, and may not result in increased sales. Variations in the levels of advertising and promotional expenditures have in the past caused, and are expected in the future to continue to cause, variability in the Company’s quarterly results of operations. While the Company attempts to invest only in effective advertising and promotional activities, it is difficult to correlate such investments with sales results, and there is no guarantee that the Company’s expenditures will be effective in building brand equity or growing long term sales.
The Company is dependent on key packaging suppliers and an increase in packaging costs could harm the Company’s financial results.
In 2020 and 2021, as the Truly and the Twisted brand families grew significantly and overall demand for cans increased, the Company experienced supply constraints for cans. These supply constraints impacted the Company’s production schedules and increased can cost by having to use a more expensive supplier.
The Company maintains competitive sources for the supply of packaging materials, such as cans, glass and cardboard. The Company enters into limited-term supply agreements with certain vendors in order to receive preferential pricing. In 2024, certain flavorings, crowns, and labels were each supplied by single sources. The loss of any of the Company’s packaging materials suppliers could, in the short-term, adversely affect the Company’s results of operations, cash flows and financial position until alternative supply arrangements were secured. Additionally, there has been acquisition, change in control and consolidation activity in several of the packaging supplier networks which could potentially lead to further disruption in supply and changes in economics. If packaging costs continue to increase, there is no guarantee that such costs can be fully passed along through increased prices. The company's long-term supply agreements have varying lengths and terms and there is no guarantee that the economics of these contracts can be replicated when renewed. The Company’s inability to preserve the current economics on renewal could expose the Company to significant cost increases in future years. Some of these contracts require the Company to make commitments on minimum volume of purchases based on Company forecasts. If the Company's needs decline significantly from its forecasts, the Company would likely incur storage costs for excess production or contractual penalties that might be significant and could have a material adverse impact on the Company's financial results.
The Company is dependent on key ingredient suppliers, including foreign sources; its dependence on foreign sources creates foreign currency and tariff exposure for the Company; the Company’s use of natural ingredients creates weather and crop reliability and excess/shortage inventory exposure for the Company.
The Company purchases a substantial portion of the ingredients used in its beverages, including its flavorings, fruit juice, malt, hops, apples, and other ingredients, from a limited number of domestic and foreign suppliers. There can be no assurance that the Company would be able to acquire such ingredients from substitute sources on a timely or cost-effective basis, if current suppliers could not adequately fulfill orders or if tariffs significantly increase costs. The loss or significant reduction in the capability or increase of costs of a supplier to support the Company’s requirements could, in the short-term, adversely affect the Company’s business and financial results, until alternative supply arrangements are secured.
The Company’s beverages include many unique and proprietary flavors and combinations of flavors and some of these flavorings are single sourced. Twisted Tea and Truly Hard Seltzer brand beverages are particularly reliant on the use of flavorings and variety of flavors as part of their appeal to drinkers.
The Company purchased most of the malt used in the production of its beer from four suppliers during 2024. The Company is exposed to the quality of the barley crop each year, and significant failure of a crop would adversely affect the Company’s costs.
The Company uses Noble hop varieties from Europe for many of its Samuel Adams beers and also uses hops grown in other areas of Europe, the United States, and New Zealand. Noble hops are grown in several specific areas in Germany and the Czech Republic that are recognized for growing hops with superior taste and aroma properties. The Company stores its hops in multiple cold storage warehouses to minimize the impact of a catastrophe at a single site. The performance and availability of the hops, as with any agricultural product, may be materially adversely affected by factors such as adverse weather or pests and there is no guarantee the contracts will be fulfilled completely. The Company has purchase commitments with seven primary hop dealers and attempts to maintain a one to two-year supply of essential hop varieties on-hand in order to limit the risk of an unexpected reduction in supply and procures hops needed for new beers, based on its best estimate of likely short-term demand. The failure of management’s assumptions regarding future sales growth, product mix and hops market conditions to prove accurate could result in future material losses.
The Company uses special varieties of apples in its ciders that it believes are important for the ciders’ flavor profile. These apples are sourced primarily from European and United States suppliers and include bittersweet apples from France and culinary apples from Italy and Washington state. There is limited availability of these apples and many outside factors, including weather conditions, farmers rotating from apples to other crops, government regulations and legislation affecting agriculture, could affect both price and supply.
The Company’s new product development can also be constrained by any limited availability of the desired ingredients. Growth rates higher than planned or the introduction of new products requiring special ingredients could create demand for ingredients greater than the Company can source.
The Company’s contracts for certain hops and apples are payable in Euros, Pounds Sterling and New Zealand dollars, and therefore, the Company is subject to the risk that the currencies may fluctuate adversely against the U.S. dollar. The Company has, as a practice, not hedged this exposure, although this practice is regularly reviewed. The cost of hops has increased in recent years due to the rising market price of hops and exchange rate changes. The continuation of these trends will impact the Company’s product cost and potentially the Company’s ability to meet the demand for its beers. The Company buys some other ingredients and capital equipment from foreign suppliers for which the Company also carries exposure to foreign exchange rate and tariff changes. Significant adverse fluctuations in foreign currency exchange rates and increased tariffs may have a material adverse effect on the Company’s business and financial results.
The Company’s reliance on production facilities owned by others and an inability to leverage investment in the Company-owned breweries could have a material adverse effect on the Company’s operations or financial results.
During 2024, the Company produced approximately 74% of its domestic volume at breweries owned by the Company and, as noted above, anticipates producing 80% of its domestic volume at breweries owned by the Company in 2025. While, on balance, the Company views greater reliance on its own breweries favorably, this reliance on its own breweries exposes the Company to capacity constraints and risk of disruption of supply, as these breweries are operating at or close to current capacity in peak months. As volumes at the Pennsylvania Brewery increase, severe interruptions there would be problematic, particularly during peak seasons. Potential interruptions at breweries include labor issues, governmental action, quality issues, contractual disputes, machinery failures, operational shutdowns, pandemic-related or other staffing shortages, or natural or unavoidable catastrophes. If interruptions were to occur, the Company could face significant delays in starting replacement brewing locations and its operating results could be materially adversely affected.
The Company continues to avail itself of capacity at third-party production facilities. Also as noted above, during 2024, approximately 26% of the Company’s annual domestic shipment volume was produced under production service agreements with City Brewing Company, LLC and its subsidiaries. In selecting third party production facilities for production services arrangements, the Company carefully weighs a facility's sleek can packaging and automated variety packaging capability and capacity, its quality control capabilities throughout the production process. To the extent that the Company needs to avail itself of a third-party production services arrangement, it exposes itself to higher than planned costs of operating under such contract arrangements than would apply at the Company-owned breweries, potential lower service levels and reliability than internal production, and potential unexpected declines in the production capacity available to it, any of which could have a material adverse effect on the Company’s business and financial results. The use of such third party facilities also creates higher logistical costs and uncertainty in the ability to deliver product to the Company’s customers efficiently and on time.
As the beer industry continues to consolidate and the Company has grown, the capacity and willingness of breweries owned by others where the Company could brew, ferment or package some of its products, if necessary, has become a more significant concern and, thus, there is no guarantee that the Company’s needs will be uniformly met. The Company continues to work at its Company-owned breweries and with its third-party production partners to attempt to minimize any potential disruptions. Nevertheless, should an interruption occur, the Company could experience temporary shortfalls in production and/or increased production and/or distribution costs and be required to make significant capital investments to secure alternative capacity for certain brands and packages, the combination of which could have a material adverse effect on the Company’s business and financial results. A production interruption caused by an acquisition or change of control or bankruptcy of City Brewing Company, LLC, or its subsidiaries, or a simultaneous interruption at several of the Company’s other production locations would likely cause significant disruption, increased costs and, potentially, lost sales.
The Company’s emphasis on owning production facilities requires it to continue to make a significant level of capital expenditure to maintain and improve these facilities and to incur significant fixed operating costs to support them. In an uncertain volume environment, the Company faces the risk of not being able to support the owned brewery operating costs, if volumes were to decline. At the same time, despite making these expenditures and incurring these costs, if demand were to further increase above current volume estimates, the Company could still face the risk of not being able to meet the increased demand.
The Company attempts to mitigate production and distribution risks through a combination of owned breweries and access to third-party contract production facilities, but there is no guarantee that this strategy will be successful, and it might result in short term costs and inefficiencies which could adversely impact our business and financial results.
Turnover in Company leadership or other key positions may lead to loss of key knowledge or capability and adversely impact Company performance.
The Company has an experienced leadership team with an established track record of business success and innovation in the beverage and consumer goods industries.
The Company has and is likely to experience changes in key leadership or key positions regularly. The departure of key leadership personnel can take from the Company significant knowledge and experience. This loss of knowledge and experience can be mitigated through successful succession planning or external hiring and transition, but there can be no assurance that the Company will be successful in such efforts. Attracting, retaining, integrating and developing high performance individuals in key roles is a core component of the Company’s strategy for addressing its business opportunities. Attracting and retaining qualified senior leadership may be more challenging under adverse business conditions, such as the current declining growth environment the Company is facing. Failure to attract and retain the right talent, or to manage the transition of responsibilities resulting from such turnover smoothly, would affect the Company's ability to meet its challenges and may cause the Company to miss performance objectives or financial targets.
The Company has significantly increased its product offerings and distribution footprint, which increases complexity and could adversely affect the Company’s performance and financial results.
The Company has significantly increased the number of commercially available flavored malt beverages, hard seltzers, beers, hard ciders, and spirits RTDs that it produces. In the last five years, the Company has developed, introduced and reformulated many new and existing beverage styles under the Twisted Tea, Truly Hard Seltzer, Samuel Adams, Dogfish Head, Angry Orchard, Sun Cruiser and Hard Mountain Dew brands. The Company currently operates 9 retail locations where its beverages are sold and consumed on-premise, including six brewery tap rooms, an apple orchard and innovation cidery, a restaurant and a boutique inn. The Company’s most significant innovations in 2024 was the introduction of its Sun Cruiser brand, a new vodka based RTD, as well as the launch of its Truly Unruly Mix Pack and Twisted Tea Extreme. In the first quarter of 2025, the Company is planning to launch Truly Unruly Lemonade Mix Pack, Sun Cruiser vodka based hard lemonade and Dogfish Head Grateful Dead Juicy Pale Ale. During the rest of 2025, the Company has plans to add new beverage styles and may reformulate existing styles of beverages.
These additional brands, styles, reformulations and locations, along with the increases in demand for certain existing brands, have added to the complexity of the Company’s product development process, as well as its brewing, fermenting, distilling, packaging, marketing and selling processes, and retail operations. There can be no assurance that the Company will effectively manage such increased complexity, without experiencing coordination issues, operating inefficiencies, supply shortages or control deficiencies. Such inefficiencies or deficiencies could have a material adverse effect on the Company’s business and financial results.
Changes in drinker attitudes on brand equity and reliance on the Company’s founders in the Samuel Adams and Dogfish Head brand communications may adversely affect demand for the Company’s production and results of operations.
The success of the Company's brands depends upon the positive image that drinkers have of those brands and maintaining a good reputation is critical to selling our branded products. Our reputation could be impacted negatively by public perception, adverse publicity, negative comments in social media, or our responses to negative publicity or comments, either by members of the Company or those who may be affiliated with it. There is also no guarantee that the brand equities that the Company has built in its brands will continue to appeal to drinkers. Changes in drinker attitudes or demands, or competitor activity and promotion, could adversely affect the strength of the Company’s brands and the revenue that is generated from that strength. It is possible that the Company could react to such changes and reposition its brands, but there is no certainty that the Company would be able to maintain volumes, pricing power and profitability. It is also possible that marketing messages or other actions taken by the Company could damage its brand equities, as opposed to building them. If such damage were to occur, it would likely have a negative effect on the financial condition of the Company.
In addition to these inherent brand risks, C. James Koch, the founder and Chairman of the Company, as well as the founders of Dogfish Head brand, Samuel Calagione, Founder and Brewer, Dogfish Head Brewery and Mariah Calagione, Founder and Communitarian, Dogfish Head Brewery, are an integral part of the Company’s history, brand equity and current and potential future brand messaging and the Company relies on the positive public perception of these founders. Mariah Calagione has recently announced her retirement from the Company effective during 2025. The role of these founders as founders, brewers, leaders or former leaders of the Company is emphasized as part of the Company’s brand communication and has appeal to some drinkers. If these founders were not available to the Company, this could negatively affect the strength of the Company’s messaging and, accordingly, the Company’s growth prospects. The Company and its brands may also be impacted if drinkers’ perceptions of these founders, including their social or political views, were to change negatively. If any negative changes were to occur, the Company might need to adapt its strategy for communicating its key messages regarding its history, equity, and current and potential future brand messaging. Any such change in the Company’s messaging strategy might have a detrimental impact on the future growth of the Company.
The Company’s operations are subject to certain operating hazards that could result in unexpected costs or product recalls that could harm the Company’s business.
The Company’s operations are subject to certain hazards and liability risks faced by all beverage companies, such as potential contamination of ingredients or products by bacteria or other external agents that may be wrongfully or accidentally introduced into products or packaging, or defective packaging and handling. Such occurrences may create bad tasting beverages, or pose health risk to the consumer or risk to the integrity and safety of the packaging. These could result in unexpected costs to the Company and, in the case of a costly product recall, potentially serious damage to the Company’s reputation for product quality, as well as product liability claims.
The Company relies upon complex information systems and vulnerabilities or disruptions of these systems could expose us to liability and harm our business and operations.
The Company depends on information technology to be able to operate efficiently and interface with customers and suppliers, as well as maintain financial and accounting reporting accuracy to ensure compliance with all applicable laws. If the Company does not allocate and effectively manage the resources necessary to build and sustain the proper technology infrastructure, the Company could be subject to transaction errors, processing inefficiencies, the loss of customers, business disruptions, or the loss of or damage to intellectual property and proprietary information through security breaches. The Company recognizes that many groups on a world-wide basis have experienced increases in security breaches, cyber-attacks, and other hacking activities such as denial of service, malware and ransomware. As with all large information technology systems, the Company’s systems could be penetrated by outside threat actors intent on extracting confidential or proprietary information, corrupting information, disrupting business processes, or engaging in the unauthorized use of strategic information. Such unauthorized access could disrupt business operations and could result in the loss of assets or revenues, remediation costs or damage to the Company’s reputation, as well as litigation against the Company by third parties adversely affected by the unauthorized access. Such events could have a material adverse effect on the Company’s business and financial results. The Company also relies on third parties for supply of software, software and data hosting and telecommunications and networking, and is reliant on those third parties for the quality and integrity of these complex services. Failure by a third-party supplier could have material adverse effects on the Company’s ability to operate.
We use AI in our business, and challenges with properly managing its use could result in harm to our brands, reputation, business or customers.
The Company has started to implement the use of AI solutions, including machine learning and generative AI tools that collect, aggregate, and analyze data to assist in the development of the Company’s products and in the use of internal tools that support the Company’s business. These applications may become increasingly important in operations over time. This emerging technology presents a number of risks inherent in its use. AI algorithms trained with noisy data may create accuracy issues, unintended biases, and discriminatory outcomes that could harm the Company’s brands, reputation, business, or customers. Additionally, no assurance can be made that the usage of AI will assist the Company in being more efficient.
Further, dependence on AI without adequate safeguards to make certain business decisions may introduce additional operational vulnerabilities by producing inaccurate outcomes, recommendations, or other suggestions based on flaws in the underlying data or other unintended results. The Company’s competitors or other third parties may incorporate AI into their business, services, and products more rapidly or more successfully than the Company, which could hinder the Company’s ability to compete effectively and adversely affect the Company’s results of operations. Implementing the use of AI successfully, ethically and as intended, will require significant resources. In addition, the use of AI may increase cybersecurity and data privacy risks, such as intended, unintended, or inadvertent transmission of proprietary or sensitive information. The technologies underlying AI and their use cases are rapidly developing, and it is not possible to predict all of the legal, operational or technological risks related to the use of AI. While new AI initiatives, laws, and regulations are emerging and evolving, uncertainty will remain, and the Company’s obligation to comply with the evolving regulatory landscape could entail significant costs, negatively affect the Company’s business, or limit the Company’s ability to incorporate certain AI capabilities into the Company’s business.
An increase in energy costs could harm the Company’s financial results.
In the last five years, the Company has experienced significant variation in direct and indirect energy costs, and energy costs could change unpredictably. Increased energy costs would result in higher transportation, freight and other operating costs, including increases in the cost of ingredients and supplies. The Company’s future operating expenses and margins could be dependent on its ability to manage the impact of such cost increases. If energy costs increase, there is no guarantee that such costs can be fully passed along through increased prices.
The Class B shareholder has significant control over the Company.
The Company’s Class A Common Stock is not entitled to any voting rights except for the right as a class to (1) approve certain mergers, charter amendments and by-law amendments and (2) elect a minority of the directors of the Company. Although not as a matter of right, the Class A stockholders have also been afforded the opportunity to vote on an advisory basis on executive compensation. Consequently, the election of a majority of the Company’s directors and all other matters requiring stockholder approval are currently decided by C. James Koch, who is the founder and Chairman of the Company, as the holder of 100% of the voting rights to the outstanding shares of the Company’s Class B Common Stock. As a result, Mr. Koch is able to exercise substantial influence over all matters requiring stockholder approval, including the composition of the board of directors, approval of equity-based and other executive compensation and other significant corporate and governance matters, such as approval of the Company’s independent registered public accounting firm. This could have the effect of delaying or preventing a change in control of the Company and makes most material transactions difficult or impossible to accomplish without the support of Mr. Koch. While Mr. Koch is currently the 100% holder of the Company’s Class B Common Stock, there is nothing that prevents Mr. Koch or his heirs from transferring some or all shares of the Class B Common Stock to others.
Risks Related to Law and Regulations
Changes in tax, environmental and other regulations, government shutdowns or failure to comply with existing licensing, trade or other regulations could have a material adverse effect on the Company’s financial condition.
The Company’s business is highly regulated by federal, state and local laws and regulations regarding such matters as licensing requirements, trade and pricing practices, labeling, advertising, promotion and marketing practices, relationships with Distributors, environmental impact of operations and other matters. These laws and regulations are subject to frequent reevaluation, varying interpretations and political debate, and inquiries from governmental regulators charged with their enforcement. In addition, any delays in federal or state government required approvals caused by federal or state government shutdowns, could prevent new brands or innovations from getting to market on time or at all. Failure to comply with existing laws and regulations to which the Company’s operations are subject or any revisions to such laws and regulations or the failure to pay taxes or other fees imposed on the Company’s operations and results could result in the loss, revocation or suspension of the Company’s licenses, permits or approvals, and could have a material adverse effect on the Company’s business, financial condition and results of operations. Changes in federal and other tax rates could have a significant effect on the Company’s financial results.
There is no guarantee that the Company will not face litigation that could harm the Company’s business.
The Company has from time to time in the past been involved in material litigation. Claims, whether or not meritorious, could be asserted against the Company that might adversely impact the Company’s results.
The Company's approach to cybersecurity risk management includes the following key elements:
•Multi-Layered Defense and Continuous Monitoring. The Company works to protect its computing environments and products from cybersecurity threats through multi-layered defenses and apply lessons learned from its defense and monitoring efforts to proactively prevent future attacks. The Company utilizes best-in-class SIEM technologies, data analytics and threat intelligence to detect anomalies and search for cyber threats. The Company's internal cybersecurity team and third-party security services provide comprehensive cyber threat detection and response capabilities and maintain a full-time monitoring system which complements the technology, processes and threat detection techniques we use to monitor, manage and mitigate cybersecurity threats. From time to time, the Company engages third-party consultants or other advisors to assist in assessing, identifying and/or managing cybersecurity threats and also periodically uses its Internal Audit function to conduct additional reviews and assessments.
•Third-Party Risk Assessments. The Company conducts information security assessments before sharing or allowing the hosting of sensitive data in computing environments managed by third parties, and its standard terms and conditions contain contractual provisions requiring certain security protections.
•Training and Awareness. The Company conducts monthly attack simulations across the Company and provide awareness training to our coworkers to help identify, avoid and mitigate cybersecurity threats. Employees with network access participate annually in required training, including spear phishing, malware, access control, and other awareness training. The Company also periodically hosts tabletop exercises with management and other employees to practice rapid cyber incident response;
•Supplier Engagement. The Company requires its suppliers to comply with its standard information security terms and conditions as a condition of doing business, and requires them to complete information security questionnaires to review and assess any potential cyber-related risks depending on the nature of the services being provided. The Company also monitors supplier network access to its networks and systems.
While the Company has experienced minor cybersecurity incidents in the past, to date none have materially affected the Company or its financial position, results of operations and/or cash flows. The Company continues to invest in the cybersecurity and resiliency of its networks and to enhance its internal controls and processes, which are designed to help protect its systems, infrastructure, and the information they contain.
Item 2. Properties
The Company maintains its principal corporate offices in approximately 57,623 square feet of leased space located in Boston, Massachusetts, the term of which is set to expire in February 2031.
The Company leases approximately 43,000 square feet of space in Boston, Massachusetts, on which it maintains a Samuel Adams Boston Brewery brand tap room and tour center. The current term of the lease for this facility will expire in 2034, although it has an option to extend the term for an additional fifteen years in five-year increments.
The Company leases approximately 6,666 square feet of space in Boston, Massachusetts, on which it maintains a research and development site. The current term of the lease for this facility will expire in 2026, although it has an option to renew for one (1) additional period of five (5) years and, thereafter, one (1) additional period of three (3) years.
The Company leases approximately 9,000 square feet of space in Boston, Massachusetts, on which it maintains a Samuel Adams brand tap room and small brewery. The current term of the lease for this facility will expire in 2028, although it has two options to extend the term for an additional 5 years.
The Company owns approximately 76 acres of land in Breinigsville, Pennsylvania, consisting of three parcels on which the Company’s Pennsylvania Brewery is located. The buildings on this property consist of approximately 1 million square feet of brewery and warehouse space.
The company leases approximately 585,000 square feet of space in Alburtis, PA, on which it maintains a warehouse for raw and finished goods. The current lease for this facility will expire January 2027, although it has an option to renew for one (1) five-year extension.
The Company owns approximately 12 acres of land in Cincinnati, Ohio, on which the Company’s Cincinnati Brewery is located, and leases, with an option to purchase, approximately 0.75 acre of land from 3rd party investment group which abuts its property. The buildings on this property consist of approximately 128,500 square feet of brewery and warehouse space.
The Company leases approximately 10,000 square feet of space in Cincinnati, Ohio, on which it maintains a Samuel Adams brand tap room and small brewery. The current term of the lease for this facility will expire in 2028.
The Company leases approximately 7,815 square feet of office space in Cincinnati, Ohio. Lease is due to expire in September 2025 with no extension options.
The Company owns approximately 64 acres of land in Walden, New York, consisting of an apple orchard and buildings, including a small cidery, gift shop, and tour center. The buildings on this property consist of approximately 17,650 square feet of space.
The Company owns approximately 57 acres of land in Milton, Delaware, on which the Company’s Milton Brewery is located. The buildings on this property consist of approximately 150,000 square feet of brewery and warehouse space.
The Company owns approximately 0.5 acre of land in Lewes, Delaware, on which the Company’s Dogfish Head Inn is located. The buildings on this property consists of approximately 8,400 square feet of space.
The Company leases approximately 14,000 square feet of space in Rehoboth, Delaware, on which it maintains Dogfish Head Brewings and Eats, a tap room, gift shop, small brewery and distillery, and the Chesapeake & Maine restaurant. The current term of the lease for this facility will expire in 2029.
The Company leases approximately 48,650 square feet of space in Los Angeles, California, on which it maintains an Angel City and Truly brand tap room, small brewery, and tour center. The current term of the lease for this facility will expire in 2026.
The Company, under a development agreement, has access to approximately 900 square feet of space in Windsor, Ontario, on which it maintains a cannabis research and development facility. The current term of the agreement for this facility will expire in 2026.
The Company also leases small offices in Burlington, Vermont, Montreal, Quebec, and Toronto, Ontario as well as various warehousing facilities across the United States and Canada.
The Company believes that its facilities are adequate for its current needs and that suitable additional space will be available on commercially acceptable terms as required.
Item 3. Legal Proceedings
The Company is party to legal proceedings and claims, where significant damages are asserted against it. Given the inherent uncertainty of litigation, it is possible that the Company could incur liabilities as a consequence of these claims, which may or may not have a material adverse effect on the Company’s financial condition or the results of its operations. The Company accrues loss contingencies if, in the opinion of management and its legal counsel, the risk of loss is probable and able to be estimated. Material pending legal proceedings are discussed below.
Supplier Dispute. On December 31, 2022, Ardagh Metal Packaging USA Corp. (“Ardagh”) filed an action against the Company alleging, among other things, that the Company had failed to purchase contractual minimum volumes of certain aluminum beverage can containers in 2021 and 2022. The Company filed an Amended Answer, Amended Affirmative Defenses and Amended Counterclaims on March 25, 2024. On November 9, 2023, Ardagh filed a Notice of Plaintiff’s Motion for Judgment on the Pleadings on Count II of the Complaint, to which the Company filed an Opposition on November 22, 2023. On February 26, 2024, the Court granted the Motion. On March 27, 2024, the Company filed a Motion to Clarify and to Reconsider the Court’s decision. Following briefing by the parties, on June 17, 2024, the Court granted the Company's Motion to Reconsider, denied Ardagh's Motion for Judgment on the Pleadings, and vacated its February 26, 2024 Order. The Court set a fact discovery deadline of November 25, 2024 with some discovery motions still pending. Expert discovery has begun and the Court has set an expert discovery deadline of April 18, 2025. The Court has not set a date for summary judgment filings or trial. The Company denies that it breached the terms of the parties’ contract and intends to defend against the Ardagh claims vigorously.
Item 4. Mine Safety Disclosures
Not Applicable
PART II.
Item 5. Market for Registrant’s Common Equity, Related Stockholder Matters and Issuer Purchases of Equity Securities
The graph set forth below shows the value of an investment of $100 on January 1, 2019 in each of the Company’s stock (“The Boston Beer Company, Inc.”), the Standard & Poor’s 500 Index (“S&P 500 Index”) and the Standard & Poor’s 500 Beverage Index, which consists of producers of alcoholic and non-alcoholic beverages (“S&P 500 Beverages Index”) for the five years ending December 28, 2024.
Total Return to Shareholders
(Includes reinvestment of dividends)
| | | | | | | | | | | | | | | | | | | | |
| | ANNUAL RETURN PERCENTAGE
Years Ending | |
Company Name / Index | | 12/26/2020 | | | 12/25/2021 | | | 12/31/2022 | | | 12/30/2023 | | | 12/28/2024 | |
The Boston Beer Company, Inc. | | | 167.97 | | | | (48.29 | ) | | | (37.22 | ) | | | 4.88 | | | | (12.87 | ) |
S&P 500 Index | | | 16.40 | | | | 29.44 | | | | (17.40 | ) | | | 26.29 | | | | 26.90 | |
S&P 500 Beverages Index | | | 6.56 | | | | 14.51 | | | | 8.93 | | | | (1.98 | ) | | | (0.89 | ) |
| | | | | | | | | | | | | | | | | | | | | | | | |
| | | | | INDEXED RETURNS
Years Ending | |
Company Name / Index | | Base Period 12/28/2019 | | | 12/26/2020 | | | 12/25/2021 | | | 12/31/2022 | | | 12/30/2023 | | | 12/28/2024 | |
The Boston Beer Company, Inc. | | | 100 | | | | 424.98 | | | | 219.78 | | | | 137.98 | | | | 144.71 | | | | 79.50 | |
S&P 500 Index | | | 100 | | | | 154.78 | | | | 200.35 | | | | 165.49 | | | | 209.00 | | | | 199.46 | |
S&P 500 Beverages Index | | | 100 | | | | 132.12 | | | | 151.29 | | | | 164.81 | | | | 161.54 | | | | 129.12 | |
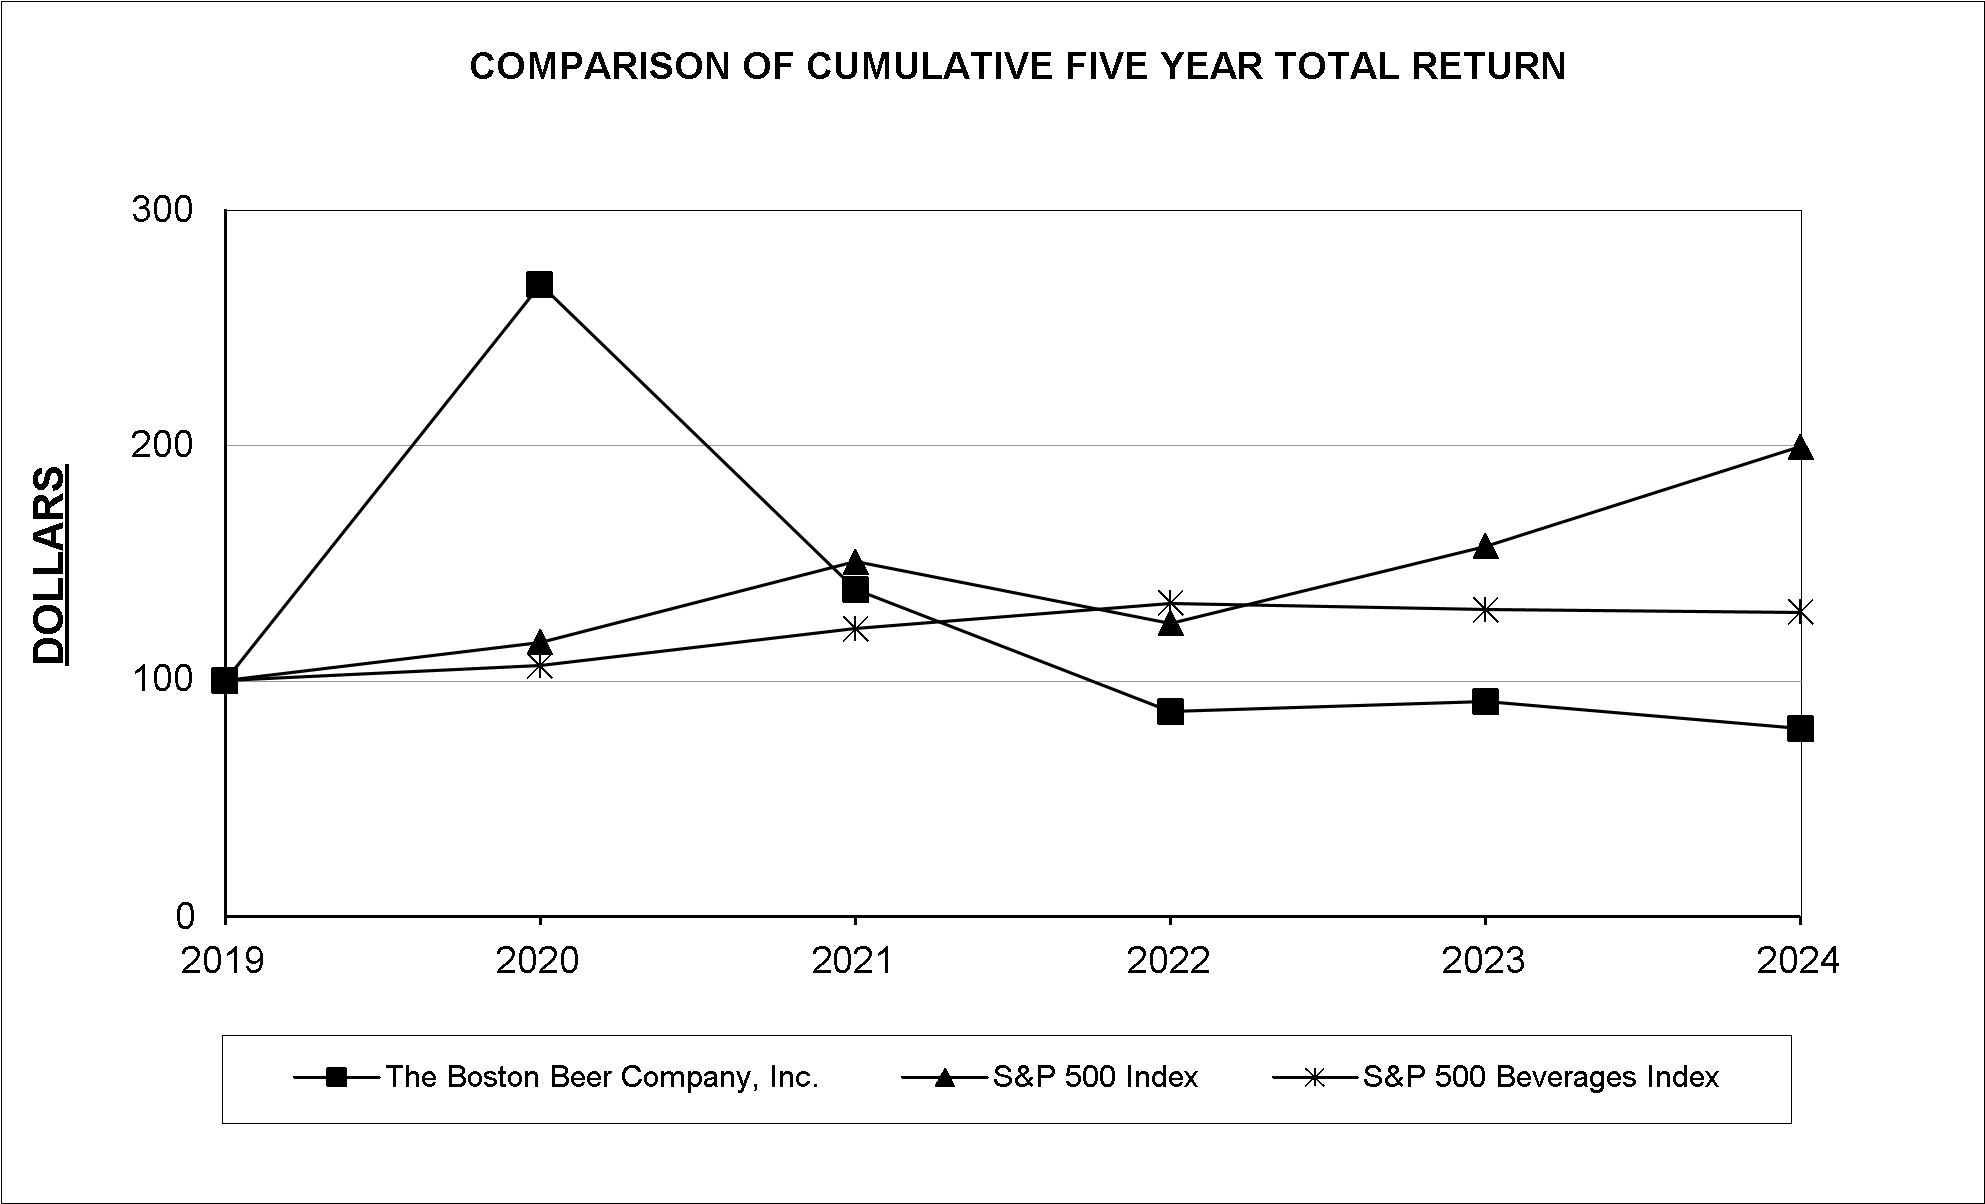
The Company’s Class A Common Stock is listed for trading on the New York Stock Exchange under the symbol SAM.
There were 6,603 holders of record of the Company’s Class A Common Stock as of February 21, 2025. Excluded from the number of stockholders of record are stockholders who hold shares in “nominee” or “street” name. The closing price per share of the Company’s Class A Common Stock as of February 21, 2025, as reported under the New York Stock Exchange-Composite Transaction Reporting System, was $227.32.
Class A Common Stock
At December 28, 2024, the Company had 22,700,000 authorized shares of Class A Common Stock with a par value of $0.01, of which 9,291,092 were issued and outstanding, which includes 27,894 shares that have trading restrictions. The Class A Common Stock has no voting rights, except (1) as required by law, (2) for the election of Class A Directors, and (3) that the approval of the holders of the Class A Common Stock is required for (a) future authorizations or issuances of additional securities which have rights senior to Class A Common Stock, (b) alterations of rights or terms of the Class A or Class B Common Stock as set forth in the Articles of Organization of the Company, (c) certain other amendments of the Articles of Organization of the Company, (d) certain mergers or consolidations with, or acquisitions of, other entities, and (e) sales or dispositions of any significant portion of the Company’s assets.
Class B Common Stock
At December 28, 2024, the Company had 4,200,000 authorized shares of Class B Common Stock with a par value of $0.01, of which 2,068,000 shares were issued and outstanding. The Class B Common Stock has full voting rights, including the right to (1) elect a majority of the members of the Company’s Board of Directors and (2) approve all (a) amendments to the Company’s Articles of Organization, (b) mergers or consolidations with, or acquisitions of, other entities, (c) sales or dispositions of any significant portion of the Company’s assets and, (d) equity-based and other executive compensation, and other significant corporate matters, such as approval of the Company’s independent registered public accounting firm. The Company’s Class B Common Stock is not listed for trading. Each share of Class B Common Stock is freely convertible into one share of Class A Common Stock, upon request of any Class B holder.
As of February 21, 2025, C. James Koch, the Company’s Chairman, was the direct holder of record of all of the Company’s issued and outstanding Class B Common Stock.
The holders of the Class A and Class B Common Stock are entitled to dividends, on a share-for-share basis, only if and when declared by the Board of Directors of the Company out of funds legally available for payment thereof. Since its inception, the Company has not paid dividends and does not currently anticipate paying dividends on its Class A or Class B Common Stock in the foreseeable future.
Repurchases of Class A Common Stock
In 1998, the Company began a share repurchase program. Under this program, the Company's Board of Directors has authorized the repurchase of the Company's Class A Stock. On October 2, 2024, the Board of Directors authorized an increase in the aggregate expenditure limit for the Company’s stock repurchase program by $400.0 million, increasing the limit from $1.2 billion to $1.6 billion. The Board of Directors did not specify a date upon which the total authorization would expire and, in the future, can further increase the authorized amount. As of December 28, 2024, the Company had repurchased a cumulative total of approximately 14.9 million shares of its Class A Common Stock for an aggregate purchase price of approximately $1.17 billion and had approximately $427.5 million remaining on the $1.6 billion stock repurchase expenditure limit set by the Board of Directors.
During fiscal year 2024, the Company repurchased and subsequently retired 803,281 shares of its Class A Common Stock for an aggregate purchase price of $238.9 million. Additionally, the Company repurchased 1,351 shares of its Class A Common Stock for repurchases of unvested investment shares issued under the Investment Share Program of the Company’s Employee Equity Incentive Plan, as illustrated in the table below:
| | | | | | | | | | | | | | | | |
Period | | Total Number
of Shares
Purchased | | | Average
Price Paid
per Share | | | Total Number
of Shares
Purchased as
Part of Publicly
Announced
Plans or
Programs | | | Dollar Value
of Shares that
May Yet be
Purchased
Under the
Plans or
Programs
(in thousands) | |
December 31, 2023 - February 3, 2024 | | | 61,817 | | | $ | 349.89 | | | | 61,525 | | | $ | 244,893 | |
February 4, 2024 - March 2, 2024 | | | 53,335 | | | | 345.82 | | | | 53,328 | | | | 226,450 | |
March 3, 2024 - March 30, 2024 | | | 33,386 | | | | 298.76 | | | | 33,330 | | | | 216,490 | |
March 31, 2024 - May 4, 2024 | | | 86,768 | | | | 288.13 | | | | 86,741 | | | | 191,494 | |
May 5, 2024 - June 1, 2024 | | | 69,743 | | | | 273.32 | | | | 69,339 | | | | 172,497 | |
June 2, 2024 - June 29, 2024 | | | 64,486 | | | | 294.91 | | | | 64,366 | | | | 153,499 | |
June 30, 2024 - August 3, 2024 | | | 84,144 | | | | 285.37 | | | | 84,067 | | | | 129,502 | |
August 4, 2024 - August 31, 2024 | | | 72,999 | | | | 274.42 | | | | 72,744 | | | | 109,504 | |
September 1, 2024 - September 28, 2024 | | | 69,054 | | | | 275.29 | | | | 68,973 | | | | 90,505 | |
September 29, 2024 - November 2, 2024 | | | 86,828 | | | | 287.89 | | | | 86,828 | | | | 465,506 | |
November 3, 2024 - November 30, 2024 | | | 60,978 | | | | 311.62 | | | | 60,946 | | | | 446,509 | |
December 1, 2024 - December 28, 2024 | | | 61,094 | | | | 310.53 | | | | 61,094 | | | | 427,536 | |
Total | | | 804,632 | | | $ | 297.22 | | | | 803,281 | | | $ | 427,536 | |
Item 6. [Reserved]
Item 7. Management’s Discussion and Analysis of Financial Condition and Results of Operations
The Company has elected to omit discussion of the earliest of the three years covered by the consolidated financial statements presented. Refer to Item 7. "Management's Discussion and Analysis of Financial Condition and Results of Operations" located in the Company's Form 10-K for the fiscal year ended December 30, 2023, filed on February 27, 2024, for reference to discussion of the fiscal year ended December 31, 2022, the earliest of the three fiscal years presented.
Forward-Looking Statements
In this Form 10-K and in other documents incorporated herein, as well as in oral statements made by the Company, statements that are prefaced with the words “may,” “will,” “expect,” “anticipate,” “continue,” “estimate,” “project,” “intend,” “designed,” and similar expressions, are intended to identify forward-looking statements regarding events, conditions, and financial trends that may affect the Company’s future plans of operations, business strategy, results of operations, and financial position. These statements are based on the Company’s current expectations and estimates as to prospective events and circumstances about which the Company can give no firm assurance. Further, any forward-looking statement speaks only as of the date on which such statement is made, and the Company undertakes no obligation to update any forward-looking statement to reflect future events or circumstances. Forward-looking statements should not be relied upon as a prediction of actual future financial condition or results. These forward-looking statements, like any forward-looking statements, involve risks and uncertainties that could cause actual results to differ materially from those projected or anticipated. Such risks and uncertainties include the factors set forth above and the other information set forth in this Form 10-K.
Introduction
The Boston Beer Company is engaged in the business of producing and selling alcohol beverages primarily in the domestic market and, to a lesser extent, in selected international markets. The Company’s revenues are primarily derived by selling its beverages to Distributors, who in turn sell the products to retailers and drinkers.
The Company competes primarily in the combined Beyond beer and Traditional beer market ("US Beer Market"). Beyond beer includes flavored malt beverages, hard seltzer, hard cider, spirits based ready to drink beverages (“spirits RTDs”) and other emerging beverages. Traditional beer generally includes mass domestics, imports, domestic specialties and craft beer.
Results of Operations
Year Ended December 28, 2024 (52 weeks) Compared to Year Ended December 30, 2023 (52 weeks)
| | | | | | | | | | | | | | | | | | | | | | | | | | | | | | | | | | | | |
| | Year Ended
(in thousands, except per barrel) | | | | | | | | | | |
| | Dec. 28
2024 | | | Dec. 30
2023 | | | Amount
change | | | % change | | | Per barrel
change | |
Barrels sold | | | | | | 7,493 | | | | | | | | | | 7,678 | | | | | | | (185 | ) | | | (2.4 | )% | | | |
| | | | | Per barrel | | | % of net
revenue | | | | | | Per barrel | | | % of net
revenue | | | | | | | | | | |
Net revenue | | $ | 2,012,926 | | | $ | 268.64 | | | | 100.0 | % | | $ | 2,008,625 | | | $ | 261.61 | | | | 100.0 | % | | $ | 4,301 | | | | 0.2 | % | | $ | 7.03 | |
Cost of goods | | | 1,119,194 | | | | 149.36 | | | | 55.6 | % | | | 1,156,256 | | | | 150.59 | | | | 57.6 | % | | | (37,062 | ) | | | (3.2 | )% | | | (1.23 | ) |
Gross profit | | | 893,732 | | | | 119.27 | | | | 44.4 | % | | | 852,369 | | | | 111.01 | | | | 42.4 | % | | | 41,363 | | | | 4.9 | % | | | 8.26 | |
Advertising, promotional, and selling
expenses | | | 552,033 | | | | 73.67 | | | | 27.4 | % | | | 555,998 | | | | 72.41 | | | | 27.7 | % | | | (3,965 | ) | | | (0.7 | )% | | | 1.26 | |
General and administrative
expenses | | | 189,906 | | | | 25.34 | | | | 9.4 | % | | | 174,548 | | | | 22.73 | | | | 8.7 | % | | | 15,358 | | | | 8.8 | % | | | 2.61 | |
Impairment of intangible assets | | | 42,584 | | | | 5.68 | | | | 2.1 | % | | | 16,426 | | | | 2.14 | | | | 0.8 | % | | | 26,158 | | | >100% | | | | 3.54 | |
Impairment of brewery assets | | | 7,184 | | | | 0.96 | | | | 0.4 | % | | | 5,396 | | | | 0.70 | | | | 0.3 | % | | | 1,788 | | | | 33.1 | % | | | 0.26 | |
Contract settlement costs | | | 26,052 | | | | 3.48 | | | | 1.3 | % | | | 0 | | | | 0.00 | | | | 0.0 | % | | | 26,052 | | | >100% | | | | 3.48 | |
Total operating expenses | | | 817,759 | | | | 109.14 | | | | 40.6 | % | | | 752,368 | | | | 97.99 | | | | 37.5 | % | | | 65,391 | | | | 8.7 | % | | | 11.15 | |
Operating income | | | 75,973 | | | | 10.14 | | | | 3.8 | % | | | 100,001 | | | | 13.02 | | | | 5.0 | % | | | (24,028 | ) | | | (24.0 | )% | | | (2.88 | ) |
Other income, net | | | 11,629 | | | | 1.55 | | | | 0.6 | % | | | 9,587 | | | | 1.25 | | | | 0.5 | % | | | 2,042 | | | | 21.3 | % | | | 0.30 | |
Income before income tax provision | | | 87,602 | | | | 11.69 | | | | 4.4 | % | | | 109,588 | | | | 14.27 | | | | 5.5 | % | | | (21,986 | ) | | | (20.1 | )% | | | (2.58 | ) |
Income tax provision | | | 27,907 | | | | 3.72 | | | | 1.4 | % | | | 33,338 | | | | 4.34 | | | | 1.7 | % | | | (5,431 | ) | | | (16.3 | )% | | | (0.62 | ) |
Net income | | $ | 59,695 | | | $ | 7.97 | | | | 3.0 | % | | $ | 76,250 | | | $ | 9.93 | | | | 3.8 | % | | $ | (16,555 | ) | | | (21.7 | )% | | $ | (1.96 | ) |
Net revenue. Net revenue increased by $4.3 million, or 0.2%, to $2,012.9 million for the year ended December 28, 2024, as compared to $2,008.6 million for the year ended December 30, 2023, due to price increases of $38.3 million and lower returns of $13.0 million, partially offset by the impact of lower shipment volume of $48.3 million.
Volume. Total shipment volume of 7,493,000 barrels for the year ended December 28, 2024 decreased by 2.4% over 2023 levels of 7,678,000 barrels, primarily due to decreases in the Company’s Truly brands, partially offset by increases in its Twisted Tea and Sun Cruiser brands.
Depletions of the Company’s products for the year ended December 28, 2024 decreased by approximately 2% compared to the prior year.
The Company believes distributor inventory as of December 28, 2024 averaged approximately four weeks on hand and was at an appropriate level for each of its brands.
Net Revenue per barrel. The net revenue per barrel increased by 2.7% to $268.64 per barrel for the year ended December 28, 2024, as compared to $261.61 per barrel for the year ended December 30, 2023, primarily due to price increases and lower returns.
Cost of goods sold. Cost of goods sold was $149.36 per barrel for the fifty-two weeks ended December 28, 2024, as compared to $150.59 per barrel for the fifty-two weeks ended December 30, 2023. The 2024 decrease in cost of goods sold of $1.23, or 3.2% per barrel was primarily due to contract renegotiations and recipe optimization savings of $24.1 million, or $3.22 per barrel, partially offset by inflationary impacts of $18.6 million, or $2.48 per barrel.
Inflationary impacts of $18.6 million consist primarily of increased material costs of $10.2 million and internal brewery costs of $8.4 million.
Gross profit. Gross profit was $119.27 per barrel for the year ended December 28, 2024, as compared to $111.01 per barrel for the year ended December 30, 2023. Gross margin was 44.4% for the year ended December 28, 2024, as compared to 42.4% for the year ended December 30, 2023. Gross margin primarily benefited from price increases, contract renegotiations and recipe optimization savings and lower returns, partially offset by higher brewery processing costs per barrel due to lower volumes and increased inflationary costs.
The Company includes freight charges related to the movement of finished goods from manufacturing locations to Distributor locations in its advertising, promotional and selling expense line item. As such, the Company’s gross margins may not be comparable to other entities that classify costs related to distribution differently.
Advertising, promotional, and selling expenses. Advertising, promotional and selling expenses, decreased $4.0 million, or 0.7%, to $552.0 million for the year ended December 28, 2024, as compared to $556.0 million for the year ended December 30, 2023. The decrease was primarily due to decreased freight to distributors of $10.5 million from lower rates and volumes. Brand and selling costs increased $6.5 million, primarily due to increased brand media investments and higher salaries and benefits.
Advertising, promotional and selling expenses were 27.4% of net revenue, or $73.67 per barrel, for the year ended December 28, 2024, as compared to 27.7% of net revenue, or $72.41 per barrel, for the year ended December 30, 2023. The Company will invest in advertising and promotional campaigns that it believes are effective, but there is no guarantee that such investment will generate sales growth.
The Company conducts certain advertising and promotional activities in its Distributors’ markets, and the Distributors make contributions to the Company for such efforts. These amounts are included in the Company’s statement of operations as reductions to advertising, promotional and selling expenses. Historically, contributions from Distributors for advertising and promotional activities have amounted to approximately 2% of net sales. The Company may adjust its promotional efforts in the Distributors’ markets, if changes occur in these promotional contribution arrangements, depending on the industry and market conditions.
General and administrative expenses. General and administrative expenses increased by $15.4 million, or 8.8%, to $189.9 million for the year ended December 28, 2024, as compared to $174.5 million for the comparable period in 2023. The increase was primarily due to higher salaries and benefits costs resulting from Chief Executive Officer transition costs recorded in the first quarter as well as increased inflationary costs.
Impairment of intangible assets. Impairment of intangible assets reflects a $42.6 million non-cash impairment charge recorded for the Dogfish Head brand, taken as a result of the Company’s annual impairment analysis as of September 1, 2024. The impairment determination was primarily based on the latest forecasts of brand performance which have been below the Company’s previous projections. In fiscal 2023, the Company recorded an impairment charge of $16.4 million primarily for the Dogfish Head brand. See further discussion in Note H to the Consolidated Financial Statements within Part II, Item 8 of this Form 10-K.
Impairment of brewery assets. Impairment of brewery assets of $7.2 million increased by $1.8 million from the prior fiscal year, due to higher write-offs of equipment at Company-owned breweries.
Contract settlement costs. Contract settlement costs of $26 million due to an amendment and restatement in its entirety of an existing production agreement with a third-party supplier, Rauch. This amendment adjusts the existing production agreement to better match the Company’s future capacity requirements and results in increased production flexibility and more favorable termination rights to the Company.
Income tax provision. The Company’s effective tax rate for fiscal 2024 was 31.9% compared to 30.2% in fiscal 2023, primarily due to lower pre-tax income with no corresponding reduction in non-deductible expenses. The Company estimates the lower pre-tax income resulting from the impairment of intangible assets and the contract settlement negatively impacted the 2024 effective tax rate by approximately 300 basis points.
Liquidity and Capital Resources
The Company’s primary sources of liquidity are its existing cash balances, cash flows from operating activities and amounts available under its revolving credit facility. The Company’s material cash requirements include working capital needs, satisfaction of contractual commitments, and investment in the Company’s business through capital expenditures.
Cash and cash equivalents decreased to $211.8 million as of December 28, 2024 from $298.5 million as of December 30, 2023, primarily reflecting repurchases of the Company's Class A common stock, a note receivable issued, and purchases of property, plant, and equipment, partially offset by net cash provided by operating activities.
Cash provided by operating activities consists of net income, adjusted for certain non-cash items, such as depreciation and amortization, impairment of intangible assets, stock-based compensation expense, other non-cash items included in operating results, and changes in operating assets and liabilities, such as accounts receivable, inventory, prepaid expenses and other current assets, accounts payable, and accrued expenses.
Cash provided by operating activities for the year ended December 28, 2024 was $248.9 million and consisted of net income of $59.7 million, non-cash items of $150.3 million, and an inflow of $38.9 million from a net decrease in operating assets and liabilities. The third-party production prepayments decrease of $19.1 million is due to a full year amortization of these prepayments during 2024, decreasing the prepaid balance from $33.6 million as of December 30, 2023 to $14.5 million as of December 28, 2024. The accrued expenses and other current liabilities increase of $12.3 million is primarily due to increases in accrued supply chain costs and accrued marketing costs compared to the prior year. The inventory decrease of $6.9 million is primarily due decrease on hops inventory compared to the prior year to align with beer volumes.
Cash provided by operating activities for the year ended December 30, 2023 was $265.2 million and consisted of net income of $76.3 million, non-cash items of $124.0 million, and an inflow of $64.9 million from a net decrease in operating assets and liabilities. The inventory decrease of $31.5 million is due to improvements in supply chain process resulting in lower inventory levels and lower volumes. The third-party production prepayments decrease of $27.8 million is due to expensing of these prepayments over the respective contract terms. The accrued expenses and other current liabilities increase of $13.9 million is primarily due to increases in accrued incentive compensation compared to the prior year. The accounts receivable increase of $10.3 million is primarily due to timing of shipments in the month of December compared to the prior year.
The Company used $96.3 million in investing activities during the year ended December 28, 2024, as compared to $62.4 million during the year ended December 30, 2023. The increase in investing activity cash outflows is due to a $20.0 million note receivable issued and a $12.2 million increase in capital investments. For both periods, capital investments were made mostly in the Company’s breweries to drive efficiencies and cost reductions and support product innovation and future growth.
Cash used in financing activities was $239.3 million during the year ended December 28, 2024, as compared to $84.8 million during the year ended December 30, 2023. The $154.5 million increase in financing activity cash outflows in 2024 compared to 2023 is primarily due to higher repurchases of the Company's Class A common stock in the current year.
During fiscal year 2024, the Company repurchased and subsequently retired 803,281 shares of its Class A Common Stock for an aggregate purchase price of $238.9 million. As of December 28, 2024, the Company had repurchased a cumulative total of approximately 14.9 million shares of its Class A Common Stock for an aggregate purchase price of approximately $1.17 billion and had approximately $427.5 million remaining on the $1.6 billion stock repurchase expenditure limit set by the Board of Directors.
The Company expects that its cash balance as of December 28, 2024 of $211.8 million and future operating cash flows, along with its $150.0 million credit facility agreement, will be sufficient to fund future cash requirements. Refer to Note K of the Notes to the Consolidated Financial Statements within Part II, Item 8 of this Form 10-K for further details of the terms of the credit facility agreement. As of the date of this filing, the Company was not in violation of any of its covenants to the lender under the credit facility.
Critical Accounting Policies
The discussion and analysis of the Company’s financial condition and results of operations is based upon its consolidated financial statements, which have been prepared in accordance with U.S. generally accepted accounting principles. The preparation of these financial statements requires the Company to make significant estimates and judgments that affect the reported amounts of assets, liabilities, revenues and expenses, and related disclosure of contingent assets and liabilities. These items are monitored and analyzed by management for changes in facts and circumstances, and material changes in these estimates could occur in the future. The more judgmental estimates are summarized below. Changes in estimates are recorded in the period in which they become known. The Company bases its estimates on historical experience and various other assumptions that the Company believes to be reasonable under the circumstances. Actual results may differ from the Company’s estimates.
Provision for Excess or Expired Inventory
The provisions for excess or expired inventory are based on management’s estimates of forecasted usage of inventories on hand. Forecasting usage involves significant judgments regarding future demand for the Company’s various existing products and products under development as well as the potency and shelf-life of various raw material ingredients and finished goods. A significant change in the timing or level of demand for certain products as compared to forecasted amounts may result in recording additional provisions for excess or expired inventory in the future. Provision for excess or expired inventory included in cost of goods sold was $21.9 million, $19.3 million, and $35.9 million in fiscal years 2024, 2023, and 2022 respectively.
Valuation of Property, Plant, and Equipment
The carrying value of property, plant, and equipment, net of accumulated depreciation, at December 28, 2024 was $616.2 million. For purposes of determining whether there are any impairment losses on brewery assets, as further discussed below, management has historically examined the carrying value of the Company’s identifiable long-lived assets, including their useful lives, semi-annually, or more frequently when indicators of impairment are present. Evaluations of whether indicators of impairment exist involve judgments regarding the current and future business environment and the length of time the Company intends to use the asset. If an impairment loss is identified based on the fair value of the asset, as compared to the carrying value of the asset, such loss would be charged to expense in the period the impairment is identified. Furthermore, if the review of the carrying values of the long-lived assets indicates impairment of such assets, the Company may determine that shorter estimated useful lives are more appropriate. In that event, the Company will be required to record additional depreciation in future periods, which will reduce earnings. Estimating the amount of impairment, if any, requires significant judgments including identification of potential impairments, market comparison to similar assets, estimated cash flows to be generated by the asset, discount rates, the remaining useful life of the asset, and the usefulness of the asset in consideration of future business plans. Impairment of brewery assets classified as property, plant, and equipment included in operating expenses was $7.2 million, $5.0 million and $2.6 million in fiscal years 2024, 2023, and 2022, respectively.
Factors generally considered important which could trigger an impairment review on the carrying value of long-lived assets include the following: (1) significant underperformance relative to historical or projected future operating results; (2) significant changes in the manner of use of acquired assets or the strategy for the Company’s overall business; (3) underutilization of assets; and (4) discontinuance of products by the Company or its customers.
Valuation of Goodwill and Indefinite Lived Intangible Assets
The Company has recorded intangible assets with indefinite lives and goodwill for which impairment testing is required at least annually or more frequently if events or circumstances indicate that these assets might be impaired. The Company performs its annual impairment tests and re-evaluates the useful lives of other intangible assets with indefinite lives at the annual impairment test measurement date in the third quarter of each fiscal year or when circumstances arise that indicate a possible impairment or change in useful life might exist.
The Company’s annual goodwill impairment evaluation analysis conducted at the end of fiscal August indicated that the fair value of the Company’s goodwill was substantially greater than the carrying value and accordingly there was no impairment to record during fiscal 2024. The guidance for goodwill impairment testing allows an entity to assess qualitative factors to determine whether the existence of events or circumstances leads to a determination that it is more likely than not that the estimated fair value of a reporting unit, of which the Company has one, is less than its carrying amount or to proceed directly to performing a quantitative impairment test. Under the quantitative assessment, the estimated fair value of the Company’s reporting unit is compared to its carrying value, including goodwill. The estimate of fair value of the Company’s reporting unit is generally calculated based on an income approach using the discounted cash flow method supplemented by the market approach which considers the Company’s market capitalization and enterprise value. If the estimated fair value of the Company’s reporting unit is less than the carrying value of its reporting unit, a goodwill impairment will be recognized. In estimating the fair value of the Company’s reporting unit, management must make assumptions and projections regarding such items as future cash flows, future revenues, future earnings, cost of capital, and other factors. The assumptions used in the estimate of fair value are based on historical trends and the projections and assumptions that are used in the latest operating plans. These assumptions reflect management’s estimates of future economic and competitive conditions and are, therefore, subject to change as a result of changing market conditions. If these estimates or their related assumptions change in the future, the Company may be required to recognize an impairment loss for the Company’s goodwill which could have a material adverse impact on the Company’s financial statements.
The Company’s intangible assets consist primarily of a trademark and customer relationships obtained through the Company’s Dogfish Head acquisition. Customer relationships are amortized over their estimated useful lives. As of the annual impairment assessment date at the end of fiscal August, the Dogfish Head trademark was determined to have a indefinite useful life and was not amortized. The guidance for indefinite lived intangible asset impairment testing allows an entity to assess qualitative factors to determine whether the existence of events or circumstances indicates that it is more likely than not that the indefinite lived intangible asset is impaired or to proceed directly to performing the quantitative impairment test. Under the quantitative assessment, the trademark is evaluated for impairment by comparing the carrying value of the trademark to its estimated fair value. The estimated fair value of the trademark is calculated based on an income approach using the relief from royalty method. If the estimated fair value is less than the carrying value of the trademark, then an impairment charge is recognized to reduce the carrying value of the trademark to its estimated fair value.
Significant judgment is required to estimate the fair value of the Dogfish Head trademark. Accordingly, the Company obtains the assistance of third-party valuation specialists as part of the impairment evaluation. In estimating the fair value of the trademark, management must make assumptions and projections regarding future cash flows based upon future revenues, the market-based royalty rate, the discount rate, and the after-tax royalty savings expected from ownership of the trademark. The assumptions and projections used in the estimate of fair value are consistent with recent trends and represent the projections used in Company’s current strategic operating plans which include reductions in revenues from the Dogfish Head beer products. These assumptions reflect management’s estimates of future economic and competitive conditions and consider many factors including macroeconomic conditions, industry growth rates, and competitive activities and are, therefore, subject to change as a result of changing market conditions. Beginning in the fourth quarter of 2024, the Company changed the indefinite useful life of the Dogfish Head trademark asset and began amortizing the remaining $14.4 million balance over an estimated useful life of 10 years.
The Company performed a sensitivity analysis on its significant assumptions used in the Dogfish Head trademark fair value calculation as of September 28, 2024 and determined the following:
•A decrease in the annual forecasted revenue growth rate of 1.0% would result in a 4.9% decrease to the fair value of $14.4 million as of September 28, 2024.
•A decrease in the discount rate of 1.5% would result in a 8.3% increase to the fair value of $14.4 million as of September 28, 2024, and an increase in the discount rate of 1.5% would result in a 6.9% decrease to the fair value of $14.4 million as of September 28, 2024.
Revenue Recognition and Classification of Customer Programs and Incentives
The Company recognizes revenue when obligations under the terms of a contract with its customer are satisfied; generally, this occurs with the transfer of control of its products. Revenue is measured as the amount of consideration expected to be received in exchange for transferring products. If the conditions for revenue recognition are not met, the Company defers the revenue until all conditions are met. As of December 28, 2024 and December 30, 2023, the Company had deferred revenue of $11.3 million and $8.9 million, respectively, related to product shipped prior to these dates for which the criteria to recognize revenue was not met as of these dates. These amounts are included in accrued expenses and other current liabilities in the accompanying consolidated balance sheets.
The Company is committed to maintaining the freshness of its products in the market. In certain circumstances and with the Company’s approval, the Company accepts and destroys or offers credits for stale beer that is returned or destroyed by Distributors. The Company generally credits approximately fifty percent of the distributor’s cost of beer that has passed its freshness expiration date when it is returned to the Company or destroyed. The Company reduces revenue and establishes an accrual based upon both historical returns, which is applied to an estimated lag time for receipt of product, and knowledge of specific return transactions. Estimating this reserve involves significant judgments and estimates, including comparability of historical return trends to future trends, lag time from date of sale to date of return, and product mix of returns. Stale beer expense is reflected in the accompanying financial statements as a reduction of revenue. Historically, the cost of actual stale beer returns has been in line with established reserves; however, the cost could differ materially from the reserves which would impact revenue. As of December 28, 2024, and December 30, 2023, the stale beer reserve was $6.1 million and $8.2 million, respectively. These amounts are included in accrued expenses and other current liabilities in the accompanying consolidated balance sheets.
Customer programs and incentives are a common practice in the alcohol beverage industry. Amounts paid in connection with customer programs and incentives are recorded as reductions to net revenue or as advertising, promotional and selling expenses, based on the nature of the expenditure. Customer incentives and other payments made to Distributors are primarily based upon the performance of certain marketing and advertising activities. Depending on applicable state laws and regulations, these activities promoting the Company’s products may include, but are not limited to, point-of-sale and merchandise placement, samples, product displays, promotional programs at retail locations and meals, travel and entertainment. Amounts paid to customers in connection with these programs that were recorded as reductions to net revenue or as advertising, promotional and selling expenses totaled $112.3 million, $106.4 million and $95.9 million in fiscal years 2024, 2023, and 2022, respectively. Estimates are based on historical and projected experience for each type of program or customer and have historically been in line with actual costs incurred.
Customer promotional discount programs are entered into with Distributors for certain periods of time. Amounts paid to Distributors in connection with these programs in fiscal years 2024, 2023, and 2022 were $61.0 million, $62.6 million and $54.8 million, respectively. The reimbursements for discounts to Distributors are recorded as reductions to net revenue. The agreed-upon discount rates are applied to certain Distributors’ sales to retailers, based on volume metrics, in order to determine the total discounted amount. The computation of the discount allowance requires that management make certain estimates and assumptions that affect the timing and amounts of revenue and liabilities recorded. Actual promotional discounts owed and paid have historically been in line with allowances recorded by the Company; however, the amounts could differ from the estimated allowances.
Customer incentives and other payments are made primarily to Distributors based upon the performance of certain marketing and advertising activities. Depending on applicable state laws and regulations, these activities promoting the Company’s products may include, but are not limited to, point-of-sale and merchandise placement, samples, product displays, promotional programs at retail locations and meals, travel and entertainment. Amounts paid to customers in connection with these programs in fiscal years 2024, 2023, and 2022 were $51.3 million, $43.8 million and $41.1 million, respectively. In fiscal years 2024, 2023, and 2022, the Company recorded certain of these costs in the total amount of $32.2 million, $31.4 million and $29.9 million, respectively as reductions to net revenue. Costs recognized in net revenues include, but are not limited to, promotional discounts, sales incentives and certain other promotional activities. Costs recognized in advertising, promotional and selling expenses include point of sale materials, samples and media advertising expenditures in local markets. These costs are recorded as incurred, generally when invoices are received; however certain estimates are required at the period end. Estimates are based on historical and projected experience for each type of program or customer and have historically been in line with actual costs incurred.
In connection with its preparation of financial statements and other financial reporting, management is required to make certain estimates and assumptions regarding the amount, timing and classification of expenditures resulting from these activities. Actual expenditures incurred could differ from management’s estimates and assumptions.
Stock-Based Compensation
The Company accounts for share-based awards in accordance with ASC Topic 718, Compensation – Stock Compensation (“ASC 718”), which generally requires recognition of share-based compensation costs in financial statements based on fair value. Compensation cost is recognized over the period during which an employee is required to provide services in exchange for the award (the requisite service period). The amount of compensation cost recognized in the consolidated statements of comprehensive income is based on the awards ultimately expected to vest, and therefore, reduced for estimated forfeitures. Stock-based compensation was $19.0 million, $17.0 million and $14.0 million in fiscal years 2024, 2023, and 2022, respectively.
As permitted by ASC 718, the Company elected to use a lattice model, such as the trinomial option-pricing model, to estimate the fair values of stock options. All option-pricing models require the input of subjective assumptions. These assumptions include the estimated volatility of the Company’s common stock price over the expected term, the expected dividend rate, the estimated post-vesting forfeiture rate, the risk-free interest rate and expected exercise behavior. See Note O for further discussion of the application of the option-pricing models.
In addition, an estimated pre-vesting forfeiture rate is applied in the recognition of the compensation charge. Periodically, the Company grants performance-based stock options. The Company only recognizes compensation expense with respect to these options if it is probable that the performance targets will be met. Consequently, at the end of each reporting period, the Company estimates whether it is probable that performance targets will be met. Changes in the subjective assumptions and estimates can materially affect the amount of stock-based compensation expense recognized in the consolidated statements of comprehensive income.
Business Environment
The alcoholic beverage industry is highly regulated at the federal, state and local levels. The TTB and the Justice Department’s Bureau of Alcohol, Tobacco, Firearms and Explosives enforce laws under the Federal Alcohol Administration Act. The TTB is responsible for administering and enforcing excise tax laws that directly affect the Company’s results of operations. State and regulatory authorities have the ability to suspend or revoke the Company’s licenses and permits or impose substantial fines for violations. The Company has established strict policies, procedures and guidelines in efforts to ensure compliance with all applicable state and federal laws. However, the loss or revocation of any existing license or permit could have a material adverse effect on the Company’s business, results of operations, cash flows and financial position.
The Beyond beer and Traditional beer categories within the United States are highly competitive due to large domestic and international brewers and the large number of craft brewers in this category who distribute similar products that have similar pricing and target drinkers. The Company believes that its pricing is appropriate given the quality and reputation of its brands, while realizing that economic pricing pressures may affect future pricing levels. Large domestic and international brewers are able to compete more aggressively than the Company, as they have substantially greater resources, marketing strength and distribution networks than the Company. The Company also increasingly competes with wine and spirits companies, some of which have significantly greater resources than the Company. This competitive environment may affect the Company’s overall performance within the Beyond beer and Traditional beer categories. As the market continues to consolidate, the Company believes that companies that are well-positioned in terms of brand equity, marketing and distribution will have greater success than those who do not. With its over 300 Distributors nationwide and the Company’s sales force of over 475 people, as well as a commitment to maintaining its innovation capability, brand equity and quality, the Company believes it is well positioned to compete in the Beyond beer and Traditional beer categories.
Item 7A. Quantitative and Qualitative Disclosures About Market Risk
In the ordinary course of business, the Company is exposed to the impact of fluctuations in foreign exchange rates. The Company does not enter into derivatives or other market risk sensitive instruments for the purpose of speculation or for trading purposes. Market risk sensitive instruments include derivative financial instruments, other financial instruments and derivative commodity instruments, such as futures, forwards, swaps and options, that are exposed to rate or price changes.
The Company enters into hops purchase contracts, as described in Note M to the Consolidated Financial Statements within Part II, Item 8 of this Form 10-K, and makes purchases of other ingredients, equipment, and machinery and payments for commissions and marketing services to an international sales agent denominated in foreign currencies. The cost of these commitments changes as foreign exchange rates fluctuate. Currently, it is not the Company’s policy to hedge against foreign currency fluctuations.
The interest rate for borrowings under the Company’s credit facility is based on the applicable secured overnight financing rate ("SOFR") plus 1.1%, and therefore, subjects the Company to fluctuations in such rates. At December 28, 2024, the applicable SOFR was 4.5%. As of December 28, 2024, the Company had no amounts outstanding under its current line of credit.
Sensitivity Analysis
The Company applies a sensitivity analysis to reflect the impact of a 10% hypothetical adverse change in the foreign currency exchange rates. A potential adverse fluctuation in foreign currency exchange rates could negatively impact future cash flows by approximately $2.5 million as of December 28, 2024.
There are many economic factors that can affect volatility in foreign exchange rates. As such factors cannot be predicted, the actual impact on earnings due to an adverse change in the respective rates could vary substantially from the amounts calculated above.
Item 8. Financial Statements and Supplementary Data
REPORT OF INDEPENDENT REGISTERED PUBLIC ACCOUNTING FIRM
To the stockholders and the Board of Directors of The Boston Beer Company, Inc.
Opinion on the Financial Statements
We have audited the accompanying consolidated balance sheets of The Boston Beer Company, Inc. and subsidiaries (the "Company") as of December 28, 2024 and December 30, 2023, the related consolidated statements of comprehensive income, stockholders’ equity, and cash flows, for each of the three years in the period ended December 28, 2024, and the related notes (collectively referred to as the “financial statements”). In our opinion, the financial statements present fairly, in all material respects, the financial position of the Company as of December 28, 2024 and December 30, 2023, and the results of its operations and its cash flows for each of the three years in the period ended December 28, 2024, in conformity with accounting principles generally accepted in the United States of America.
We have also audited, in accordance with the standards of the Public Company Accounting Oversight Board (United States) (PCAOB), the Company's internal control over financial reporting as of December 28, 2024, based on criteria established in Internal Control — Integrated Framework (2013) issued by the Committee of Sponsoring Organizations of the Treadway Commission and our report dated February 25, 2025, expressed an unqualified opinion on the Company's internal control over financial reporting.
Basis for Opinion
These financial statements are the responsibility of the Company's management. Our responsibility is to express an opinion on the Company's financial statements based on our audits. We are a public accounting firm registered with the PCAOB and are required to be independent with respect to the Company in accordance with the U.S. federal securities laws and the applicable rules and regulations of the Securities and Exchange Commission and the PCAOB.
We conducted our audits in accordance with the standards of the PCAOB. Those standards require that we plan and perform the audit to obtain reasonable assurance about whether the financial statements are free of material misstatement, whether due to error or fraud. Our audits included performing procedures to assess the risks of material misstatement of the financial statements, whether due to error or fraud, and performing procedures that respond to those risks. Such procedures included examining, on a test basis, evidence regarding the amounts and disclosures in the financial statements. Our audits also included evaluating the accounting principles used and significant estimates made by management, as well as evaluating the overall presentation of the financial statements. We believe that our audits provide a reasonable basis for our opinion.
Critical Audit Matter
The critical audit matter communicated below is a matter arising from the current-period audit of the financial statements that was communicated or required to be communicated to the audit committee and that (1) relates to accounts or disclosures that are material to the financial statements and (2) involved our especially challenging, subjective, or complex judgments. The communication of critical audit matters does not alter in any way our opinion on the financial statements, taken as a whole, and we are not, by communicating the critical audit matter below, providing a separate opinion on the critical audit matter or on the accounts or disclosures to which it relates.
Dogfish Head Trademark Intangible — Refer to Notes B, H, and N to the financial statements
Critical Audit Matter Description
The Company had an indefinite lived intangible asset consisting of the Dogfish Head Trademark (the “trademark”). The Company's evaluation of the trademark for impairment involves the comparison of the fair value to its carrying value. Management estimates the fair value of the trademark annually on its elected assessment date which is September 1st of each fiscal year, or more often if impairment indicators are present, using the relief-from-royalty method, which is a discounted cash flow method. The determination of fair value requires management to make significant estimates and assumptions related to forecasted revenues, including growth rates, the royalty rate, and the discount rate used to estimate the fair value of the trademark asset. Changes in these assumptions could have a significant impact on the fair value of the trademark and the amount of any impairment charge. As of December 28, 2024, the carrying value of the trademark was $14.4 million. During the year ended December 28, 2024, the Company recognized an impairment charge of $41.2 million related to the trademark, since its fair value was lower than its carrying value.
We identified the valuation of the trademark as a critical audit matter because of the significant judgments and assumptions management makes in estimating the fair value of the trademark. This required a high degree of auditor judgment and an increased extent of effort when performing audit procedures to evaluate the reasonableness of management’s estimates and assumptions related to the forecasts of future revenues as well as the selection of royalty rate and discount rate, including the need to involve our fair value specialists.
How the Critical Audit Matter Was Addressed in the Audit
Our audit procedures related to forecasts of future revenues and the selection of the royalty rate and discount rate for the Dogfish Head Trademark included the following, among others:
•We tested the effectiveness of controls over management’s trademark impairment evaluation, including those over the determination of the fair value of the trademark, such as controls related to management’s forecasts of future revenue, and the selection of the royalty rate and discount rate.
•We evaluated management’s ability to accurately forecast revenues by comparing actual revenues to management’s historical forecasts.
•We evaluated the reasonableness of management’s forecasts by comparing forecasted revenues to:
oThe Company’s business strategies and growth plans including consideration of the effects of new products;
oHistorical results and trends; and
•With the assistance of our fair value specialists, we evaluated the reasonableness of the valuation methodology and management’s assumptions including the royalty rate and the discount rate by:
oTesting the source information underlying the determination of the royalty rate, the discount rate, and the mathematical accuracy of the calculations.
oDeveloping a range of independent estimates for the discount rate and comparing those to the discount rate selected by management.
|
/s/ Deloitte & Touche LLP |
|
Boston, Massachusetts |
February 25, 2025 |
We have served as the Company’s auditor since 2015.
THE BOSTON BEER COMPANY, INC. AND SUBSIDIARIES
CONSOLIDATED STATEMENTS OF COMPREHENSIVE INCOME
(in thousands, except per share data)
| | | | | | | | | | | | |
| | Year Ended | |
| | December 28,
2024 | | | December 30,
2023 | | | December 31,
2022 | |
| | | | | | | | | |
Revenue | | $ | 2,137,802 | | | $ | 2,133,292 | | | $ | 2,222,667 | |
Less excise taxes | | | 124,876 | | | | 124,667 | | | | 132,333 | |
Net revenue | | | 2,012,926 | | | | 2,008,625 | | | | 2,090,334 | |
Cost of goods sold | | | 1,119,194 | | | | 1,156,256 | | | | 1,228,348 | |
Gross profit | | | 893,732 | | | | 852,369 | | | | 861,986 | |
Operating expenses: | | | | | | | | | |
Advertising, promotional, and selling expenses | | | 552,033 | | | | 555,998 | | | | 578,400 | |
General and administrative expenses | | | 189,906 | | | | 174,548 | | | | 157,534 | |
Impairment of intangible assets | | | 42,584 | | | | 16,426 | | | | 27,100 | |
Impairment of brewery assets | | | 7,184 | | | | 5,396 | | | | 2,782 | |
Contract settlement costs | | | 26,052 | | | | — | | | | 5,379 | |
Total operating expenses | | | 817,759 | | | | 752,368 | | | | 771,195 | |
Operating income | | | 75,973 | | | | 100,001 | | | | 90,791 | |
Other income, net: | | | | | | | | | |
Interest income, net | | | 13,249 | | | | 10,995 | | | | 2,561 | |
other | | | (1,620 | ) | | | (1,408 | ) | | | (1,916 | ) |
Total other income, net | | | 11,629 | | | | 9,587 | | | | 645 | |
Income before income tax provision | | | 87,602 | | | | 109,588 | | | | 91,436 | |
Income tax provision | | | 27,907 | | | | 33,338 | | | | 24,173 | |
Net income | | $ | 59,695 | | | $ | 76,250 | | | $ | 67,263 | |
Net income per common share - basic | | $ | 5.07 | | | $ | 6.23 | | | $ | 5.46 | |
Net income per common share - diluted | | $ | 5.06 | | | $ | 6.21 | | | $ | 5.44 | |
Weighted-average number of common shares - basic | | | 11,774 | | | | 12,243 | | | | 12,317 | |
Weighted-average number of common shares - diluted | | | 11,766 | | | | 12,258 | | | | 12,345 | |
Net income | | $ | 59,695 | | | $ | 76,250 | | | $ | 67,263 | |
Other comprehensive (loss) income: | | | | | | | | | |
Foreign currency translation adjustment | | | (715 | ) | | | 166 | | | | (269 | ) |
Defined benefit plans liability adjustment | | | 76 | | | | (13 | ) | | | 253 | |
Total other comprehensive (loss) income, net of tax | | | (639 | ) | | | 153 | | | | (16 | ) |
Comprehensive income | | $ | 59,056 | | | $ | 76,403 | | | $ | 67,247 | |
The accompanying notes are an integral part of these consolidated financial statements.
THE BOSTON BEER COMPANY, INC. AND SUBSIDIARIES
CONSOLIDATED BALANCE SHEETS
(in thousands, except share data)
| | | | | | | | |
| | December 28, 2024 | | | December 30,
2023 | |
| | | | | | |
Assets | | | | | | |
Current Assets: | | | | | | |
Cash and cash equivalents | | $ | 211,819 | | | $ | 298,491 | |
Accounts receivable | | | 61,423 | | | | 66,997 | |
Inventories | | | 117,159 | | | | 115,773 | |
Prepaid expenses and other current assets | | | 20,209 | | | | 20,538 | |
Income tax receivable | | | 6,681 | | | | 1,711 | |
Total current assets | | | 417,291 | | | | 503,510 | |
Property, plant, and equipment, net | | | 616,242 | | | | 642,509 | |
Operating right-of-use assets | | | 27,837 | | | | 35,559 | |
Goodwill | | | 112,529 | | | | 112,529 | |
Intangible assets | | | 16,446 | | | | 59,644 | |
Third-party production prepayments | | | 14,473 | | | | 33,581 | |
Note receivable | | | 16,738 | | | | — | |
Other assets | | | 28,462 | | | | 42,661 | |
Total assets | | $ | 1,250,018 | | | $ | 1,429,993 | |
Liabilities and Stockholders' Equity | | | | | | |
Current Liabilities: | | | | | | |
Accounts payable | | $ | 87,276 | | | $ | 87,245 | |
Accrued expenses and other current liabilities | | | 138,618 | | | | 126,930 | |
Current operating lease liabilities | | | 5,735 | | | | 9,113 | |
Total current liabilities | | | 231,629 | | | | 223,288 | |
Deferred income taxes, net | | | 65,803 | | | | 85,721 | |
Non-current operating lease liabilities | | | 30,205 | | | | 36,161 | |
Other liabilities | | | 6,194 | | | | 6,894 | |
Total liabilities | | | 333,831 | | | | 352,064 | |
Commitments and Contingencies (See Note M) | | | | | | |
Stockholders' Equity: | | | | | | |
Class A Common Stock, $0.01 par value; 22,700,000 shares authorized; 9,263,198
and 10,033,303 issued and outstanding as of December 28, 2024 and
December 30, 2023, respectively | | | 93 | | | | 100 | |
Class B Common Stock, $0.01 par value; 4,200,000 shares authorized; 2,068,000
issued and outstanding at December 28, 2024 and December 30, 2023 | | | 21 | | | | 21 | |
Additional paid-in capital | | | 676,454 | | | | 656,297 | |
Accumulated other comprehensive loss | | | (696 | ) | | | (57 | ) |
Retained earnings | | | 240,315 | | | | 421,568 | |
Total stockholders' equity | | | 916,187 | | | | 1,077,929 | |
Total liabilities and stockholders' equity | | $ | 1,250,018 | | | $ | 1,429,993 | |
The accompanying notes are an integral part of these consolidated financial statements
THE BOSTON BEER COMPANY, INC. AND SUBSIDIARIES
CONSOLIDATED STATEMENTS OF STOCKHOLDERS’ EQUITY
For the Years Ended December 28, 2024, December 30, 2023, and December 31, 2022
(in thousands)
| | | | | | | | | | | | | | | | | | | | | | | | | | | | | | | | |
| | | | | Class A | | | | | | | | | | | | Accumulated | | | | | | | |
| | Class A | | | Common | | | Class B | | | Class B | | | Additional | | | Other | | | | | | Total | |
| | Common | | | Stock, | | | Common | | | Common | | | Paid-in | | | Comprehensive | | | Retained | | | Stockholders’ | |
| | Shares | | | Par | | | Shares | | | Stock, Par | | | Capital | | | Loss | | | Earnings | | | Equity | |
Balance at December 25, 2021 | | | 10,184 | | | $ | 102 | | | | 2,068 | | | $ | 21 | | | $ | 611,622 | | | $ | (194 | ) | | $ | 371,858 | | | $ | 983,409 | |
Net income | | | | | | | | | | | | | | | | | | | | | 67,263 | | | | 67,263 | |
Stock options exercised and restricted
shares activities | | | 54 | | | | — | | | | | | | | | | 3,905 | | | | | | | | | | 3,905 | |
Stock-based compensation expense | | | | | | | | | | | | | | | 13,988 | | | | | | | | | | 13,988 | |
Defined benefit plans liability adjustment, net of tax of ($95) | | | | | | | | | | | | | | | | | | 253 | | | | | | | 253 | |
Foreign currency translation adjustment | | | | | | | | | | | | | | | | | | (269 | ) | | | | | | (269 | ) |
Balance at December 31, 2022 | | | 10,238 | | | $ | 102 | | | | 2,068 | | | $ | 21 | | | $ | 629,515 | | | $ | (210 | ) | | $ | 439,121 | | | $ | 1,068,549 | |
Net income | | | | | | | | | | | | | | | | | | | | | 76,250 | | | | 76,250 | |
Repurchase and retirement of Class A Common Stock | | | (276 | ) | | | (2 | ) | | | | | | | | | | | | | | | (93,803 | ) | | | (93,805 | ) |
Stock options exercised and restricted
shares activities | | | 71 | | | | — | | | | | | | | | | 9,811 | | | | | | | | | | 9,811 | |
Stock-based compensation expense | | | | | | | | | | | | | | | 16,971 | | | | | | | | | | 16,971 | |
Defined benefit plans liability adjustment, net of tax of $1 | | | | | | | | | | | | | | | | | | (13 | ) | | | | | | (13 | ) |
Foreign currency translation adjustment | | | | | | | | | | | | | | | | | | 166 | | | | | | | 166 | |
Balance at December 30, 2023 | | | 10,033 | | | $ | 100 | | | | 2,068 | | | $ | 21 | | | $ | 656,297 | | | $ | (57 | ) | | $ | 421,568 | | | $ | 1,077,929 | |
Net income | | | | | | | | | | | | | | | | | | | | | 59,695 | | | | 59,695 | |
Repurchase and retirement of Class A Common Stock | | | (803 | ) | | | (7 | ) | | | — | | | | | | | | | | | | | (240,948 | ) | | | (240,955 | ) |
Stock options exercised and restricted
shares activities | | | 33 | | | | 0 | | | | — | | | | | | | 1,203 | | | | | | | | | | 1,203 | |
Stock-based compensation expense | | | | | | | | | | | | | | | 18,954 | | | | | | | | | | 18,954 | |
Defined benefit plans liability adjustment, net of tax of $1 | | | | | | | | | | | | | | | | | | 76 | | | | | | | 76 | |
Foreign currency translation adjustment | | | | | | | | | | | | | | | | | | (715 | ) | | | | | | (715 | ) |
Balance at December 28, 2024 | | | 9,263 | | | $ | 93 | | | | 2,068 | | | $ | 21 | | | $ | 676,454 | | | $ | (696 | ) | | $ | 240,315 | | | $ | 916,187 | |
| | | | | | | | | | | | | | | | | | | | | | | | |
The accompanying notes are an integral part of these consolidated financial statements.
THE BOSTON BEER COMPANY, INC. AND SUBSIDIARIES
CONSOLIDATED STATEMENTS OF CASH FLOWS
(in thousands)
| | | | | | | | | | | | |
| | Year Ended | |
| | December 28,
2024 | | | December 30,
2023 | | | December 31,
2022 | |
Cash flows provided by operating activities: | | | | | | | | | |
Net income | | $ | 59,695 | | | $ | 76,250 | | | $ | 67,263 | |
Adjustments to reconcile net income to net cash provided by operating activities: | | | | | | | | | |
Depreciation and amortization | | | 93,992 | | | | 88,141 | | | | 81,356 | |
Impairment of intangible assets | | | 42,584 | | | | 16,426 | | | | 27,100 | |
Impairment of brewery assets | | | 7,184 | | | | 5,396 | | | | 2,782 | |
Change in right-of-use assets | | | 7,722 | | | | 7,678 | | | | 7,972 | |
Stock-based compensation expense | | | 18,954 | | | | 16,971 | | | | 13,988 | |
Deferred income taxes | | | (19,918 | ) | | | (10,871 | ) | | | 9,097 | |
Other non-cash (income) expense | | | (237 | ) | | | 224 | | | | 89 | |
Changes in operating assets and liabilities: | | | | | | | | | |
Accounts receivable | | | 5,548 | | | | (10,340 | ) | | | (2,042 | ) |
Inventories | | | 6,907 | | | | 31,500 | | | | 131 | |
Prepaid expenses, income tax receivable, and other current assets | | | (4,660 | ) | | | 13,979 | | | | 38,652 | |
Third-party production prepayments | | | 19,108 | | | | 27,758 | | | | 26,955 | |
Other assets | | | 6,156 | | | | (5,849 | ) | | | (14,031 | ) |
Accounts payable | | | 2,602 | | | | 2,763 | | | | (2,219 | ) |
Accrued expenses, other current liabilities, and other liabilities | | | 12,320 | | | | 13,884 | | | | (50,632 | ) |
Operating lease liabilities | | | (9,065 | ) | | | (8,759 | ) | | | (6,516 | ) |
Net cash provided by operating activities | | | 248,892 | | | | 265,151 | | | | 199,945 | |
Cash flows used in investing activities: | | | | | | | | | |
Purchases of property, plant, and equipment | | | (76,277 | ) | | | (64,087 | ) | | | (90,582 | ) |
Proceeds from sale of property, plant, and equipment | | | 23 | | | | 1,709 | | | | 2,076 | |
Cash paid for note receivable | | | (20,000 | ) | | | — | | | | — | |
Net cash used in investing activities | | | (96,254 | ) | | | (62,378 | ) | | | (88,506 | ) |
Cash flows (used in) provided by financing activities: | | | | | | | | | |
Repurchases and retirement of Class A common stock | | | (238,614 | ) | | | (92,877 | ) | | | — | |
Proceeds from exercise of stock options and sale of investment shares | | | 3,597 | | | | 11,723 | | | | 7,946 | |
Net cash paid on finance leases and notes payable | | | (1,886 | ) | | | (1,575 | ) | | | (1,672 | ) |
Payment of tax withholding on stock-based payment awards and investment shares | | | (2,407 | ) | | | (2,113 | ) | | | (3,474 | ) |
Line of credit borrowings | | | — | | | | — | | | | 30,000 | |
Line of credit repayments | | | — | | | | — | | | | (30,000 | ) |
Net cash (used in) provided by financing activities | | | (239,310 | ) | | | (84,842 | ) | | | 2,800 | |
Change in cash and cash equivalents | | | (86,672 | ) | | | 117,931 | | | | 114,239 | |
Cash and cash equivalents at beginning of period | | | 298,491 | | | | 180,560 | | | | 66,321 | |
Cash and cash equivalents at end of period | | $ | 211,819 | | | $ | 298,491 | | | $ | 180,560 | |
Supplemental disclosure of cash flow information: | | | | | | | | | |
Income tax (payments) refunds, net | | $ | (52,028 | ) | | $ | (35,728 | ) | | $ | 28,144 | |
Cash paid for amounts included in measurement of lease liabilities | | | | | | | | | |
Operating cash outflows from operating leases | | $ | 10,496 | | | $ | 10,483 | | | $ | 8,510 | |
Operating cash outflows from finance leases | | $ | 222 | | | $ | 138 | | | $ | 71 | |
Financing cash outflows from finance leases | | $ | 1,886 | | | $ | 1,575 | | | $ | 1,598 | |
Right-of-use-assets obtained in exchange for operating lease obligations | | $ | - | | | $ | (107 | ) | | $ | (827 | ) |
Right-of-use-assets obtained in exchange for finance lease obligations | | $ | 2,017 | | | $ | 2,825 | | | $ | - | |
(Decrease) increase in accounts payable and accrued expenses for purchases of property, plant, and equipment | | $ | (3,998 | ) | | $ | 1,107 | | | $ | 1,045 | |
Non-cash financing activity – increase in accrued excise taxes on share repurchases | | $ | 1,364 | | | $ | 929 | | | $ | - | |
Non-cash investing activity - reduction in accrued expenses and notes receivable | | $ | 2,423 | | | $ | - | | | $ | - | |
| | | | | | | | | |
The accompanying notes are an integral part of these consolidated financial statements.
THE BOSTON BEER COMPANY, INC. AND SUBSIDIARIES
NOTES TO CONSOLIDATED FINANCIAL STATEMENTS
December 28, 2024
A. Organization and Basis of Presentation
The Boston Beer Company, Inc. and certain subsidiaries (the “Company”) are engaged in the business of selling alcohol beverages throughout the United States and in selected international markets, under the trademarks “The Boston Beer Company®”, “Twisted Tea Brewing Company®”, “Hard Seltzer Beverage Company”, “Angry Orchard® Cider Company”, “Dogfish Head® Craft Brewery”, “Dogfish Head Distilling Co.”, “Angel City® Brewing Company”, “Coney Island® Brewing Company”, "Green Rebel Brewing Co.",“TeaPot Worldwide”, and “Sun Cruiser Beverage Co.".
B. Summary of Significant Accounting Policies
Fiscal Year
The Company’s fiscal year is a fifty-two or fifty-three-week period ending on the last Saturday in December. The 2024 and 2023 fiscal years consisted of fifty-two weeks, while the 2022 fiscal year consisted of fifty-three weeks.
Principles of Consolidation
The accompanying consolidated financial statements include the accounts of the Company and its subsidiaries, all of which are wholly-owned. All intercompany transactions and balances have been eliminated in consolidation.
Use of Estimates
The preparation of condensed consolidated financial statements in conformity with United States generally accepted accounting principles (“GAAP”) requires management to make estimates and assumptions that affect the reported amounts of assets and liabilities during the reporting periods, the reported amounts of revenue and expenses during the reporting periods and the disclosure of contingent assets and liabilities at the date of the financial statements. On an ongoing basis, the Company bases estimates and assumptions on historical experience, currently available information, and various other factors that management believes to be reasonable under the circumstances. Actual results may differ materially from these estimates and assumptions.
Cash and Cash Equivalents
Cash and cash equivalents at December 28, 2024 and December 30, 2023 included cash on-hand and money market instruments that are highly liquid investments. Cash and cash equivalents are carried at cost, which approximates fair value.
Accounts Receivable and Allowance for Credit Losses
The Company’s accounts receivable primarily consist of trade receivables. The Company records an allowance for credit losses that is based on historical trends, customer knowledge, any known disputes, and the aging of the accounts receivable balances combined with management’s estimate of future potential recoverability. Receivables are written off against the allowance after all attempts to collect a receivable have failed. The Company believes its allowances for credit losses as of December 28, 2024 and December 30, 2023 are adequate, but actual losses could exceed the recorded allowance.
Concentrations of Credit Risk
Financial instruments that potentially subject the Company to concentrations of credit risk consist principally of cash equivalents, and trade receivables. The Company places its cash equivalents with high credit quality financial institutions. As of December 28, 2024 and December 30, 2023, the Company’s cash and cash equivalents were primarily invested in a “Triple A” rated money market fund.
The Company sells primarily to a network of independent wholesalers in the United States and to a network of foreign wholesalers, importers or other agencies (collectively referred to as “Distributors”). In 2024, 2023, and 2022, sales to foreign Distributors were approximately 5%, 4%, 4%, respectively of total sales. Receivables arising from the Company's sales are not collateralized; however, credit risk is minimized as a result of the large and diverse nature of the Company’s customer base. There were no individual customer accounts receivable balances outstanding at December 28, 2024 or December 30, 2023 that were in excess of 10% of the gross accounts receivable balance on those dates. No individual customers represented more than 10% of the Company’s revenues in fiscal years 2024, 2023, or 2022.
Financial Instruments and Fair Value of Financial Instruments
The Company’s primary financial instruments at December 28, 2024 and December 30, 2023 consisted of cash equivalents, accounts receivable, and accounts payable. The Company determines the fair value of its financial assets and liabilities in accordance with Financial Accounting Standards Board (“FASB”) Accounting Standards Codification (“ASC”) Topic 820, Fair Value Measurements and Disclosures (“ASC 820”). The Company believes that the carrying amount of its cash equivalents, accounts receivable, and accounts payable approximates fair value due to the short-term nature of these assets and liabilities. The Company is not exposed to significant interest, currency or credit risks arising from these financial assets and liabilities.
Inventories and Provision for Excess or Expired Inventory
Inventories consist of raw materials and packaging materials, work in process and finished goods. Raw materials, which principally consist of flavorings, hops, malt, fruit juices, other brewing materials and packaging, are stated at the lower of cost (first-in, first-out basis) or net realizable value. The Company’s goal is to maintain on-hand a supply of approximately two years for essential hop varieties, in order to limit the risk of an unexpected reduction in supply. Inventories are generally classified as current assets. The Company classifies hops inventory in excess of two years of forecasted usage in other long-term assets. The cost elements of work in process and finished goods inventory consist of raw materials, direct labor and manufacturing overhead. Packaging design costs are expensed as incurred. The Company enters into multi-year purchase commitments in order to secure adequate supply of ingredients and packaging, to brew and package its products.
The provisions for excess or expired inventory are based on management’s estimates of forecasted usage of inventories on hand. Forecasting usage involves significant judgments regarding future demand for the Company’s various existing products and products under development as well as the potency and shelf-life of various raw material ingredients and finished goods. A significant change in the timing or level of demand for certain products as compared to forecasted amounts may result in recording additional provisions for excess or expired inventory in the future. Provision for excess or expired inventory included in cost of goods sold was $21.9 million, $19.3 million, and $35.9 million in fiscal years 2024, 2023, and 2022 respectively.
Property, Plant and Equipment
Property, plant, and equipment are stated at cost or fair value as of the date of acquisition. Expenditures for repairs and maintenance are expensed as incurred. Major renewals and betterments that extend the life of the property are capitalized. Depreciation is computed using the straight-line method based upon the estimated useful lives of the underlying assets as follows:
| |
Kegs | 5 years |
|
|
Computer software and equipment | 2 to 5 years |
|
|
Office equipment and furniture | 3 to 7 years |
|
|
Machinery and plant equipment | 3 to 20 years |
|
|
Leasehold improvements | Lesser of the remaining term of the lease or estimated useful life of the asset |
|
|
Building and building improvements | 12 to 20 years, or the remaining useful life of the building, whichever is shorter |
For purposes of determining whether there are any impairment losses on brewery assets, as further discussed below, management has historically examined the carrying value of the Company’s identifiable long-lived assets, including their useful lives, semi-annually, or more frequently when indicators of impairment are present. Evaluations of whether indicators of impairment exist involve judgments regarding the current and future business environment and the length of time the Company intends to use the asset. If an impairment loss is identified based on the fair value of the asset, as compared to the carrying value of the asset, such loss would be charged to expense in the period the impairment is identified. Furthermore, if the review of the carrying values of the long-lived assets indicates impairment of such assets, the Company may determine that shorter estimated useful lives are more appropriate. In that event, the Company will be required to record additional depreciation in future periods, which will reduce earnings. Estimating the amount of impairment, if any, requires significant judgments including identification of potential impairments, market comparison to similar assets, estimated cash flows to be generated by the asset, discount rates, the remaining useful life of the asset, and the usefulness of the asset in consideration of future business plans. Impairment of brewery assets classified as property, plant, and equipment included in operating expenses was $7.2 million, $5.0 million and $2.6 million in fiscal years 2024, 2023, and 2022, respectively.
Factors generally considered important which could trigger an impairment review on the carrying value of long-lived assets include the following: (1) significant underperformance relative to historical or projected future operating results; (2) significant changes in the manner of use of acquired assets or the strategy for the Company’s overall business; (3) underutilization of assets; and (4) discontinuance of products by the Company or its customers.
Segment Reporting
The Company consists of one operating segment that produces and sells alcohol beverages under various brands. All brands are predominantly beverages that are manufactured using similar production processes, have comparable alcohol content, generally fall under the same regulatory environment, and are sold to the same types of customers in similar size quantities at similar price points, with similar profit margins, and through the same channels of distribution. See Note U for further discussion of the Company's segment reporting.
Goodwill and Intangible Assets
The Company has recorded intangible assets with indefinite lives and goodwill for which impairment testing is required at least annually or more frequently if events or circumstances indicate that these assets might be impaired. The Company performs its annual impairment tests and re-evaluates the useful lives of other intangible assets with indefinite lives at the annual impairment test measurement date in the third quarter of each fiscal year or when circumstances arise that indicate a possible impairment or change in useful life might exist.
The Company’s annual goodwill impairment evaluation analysis conducted at the end of fiscal August indicated that the fair value of the Company’s goodwill was greater than the carrying value and accordingly there was no impairment to record as of the impairment evaluation analysis date. The guidance for goodwill impairment testing allows an entity to assess qualitative factors to determine whether the existence of events or circumstances leads to a determination that it is more likely than not that the estimated fair value of a reporting unit, of which the Company has one, is less than its carrying amount or to proceed directly to performing a quantitative impairment test. Under the quantitative assessment, the estimated fair value of the Company’s reporting unit is compared to its carrying value, including goodwill. The estimate of fair value of the Company’s reporting unit is generally calculated based on an income approach using the discounted cash flow method supplemented by the market approach which considers the Company’s market capitalization and enterprise value. If the estimated fair value of the Company’s reporting unit is less than the carrying value of its reporting unit, a goodwill impairment will be recognized. In estimating the fair value of the Company’s reporting unit, management must make assumptions and projections regarding such items as future cash flows, future revenues, future earnings, cost of capital, and other factors. The assumptions used in the estimate of fair value are based on historical trends and the projections and assumptions that are used in the latest operating plans. These assumptions reflect management’s estimates of future economic and competitive conditions and are, therefore, subject to change as a result of changing market conditions. If these estimates or their related assumptions change in the future, the Company may be required to recognize an impairment loss for the Company’s goodwill which could have a material adverse impact on the Company’s financial statements.
The Company’s intangible assets consist primarily of a trademark and customer relationships obtained through the Company’s Dogfish Head acquisition. Customer relationships are amortized over their estimated useful lives. As of the annual impairment assessment date at the end of fiscal August, the Dogfish Head trademark was determined to have an indefinite useful life and was not amortized. The guidance for indefinite lived intangible asset impairment testing allows an entity to assess qualitative factors to determine whether the existence of events or circumstances indicates that it is more likely than not that the indefinite lived intangible asset is impaired or to proceed directly to performing the quantitative impairment test. Under the quantitative assessment, the trademark is evaluated for impairment by comparing the carrying value of the trademark to its estimated fair value. The estimated fair value of the trademark is calculated based on an income approach using the relief from royalty method. If the estimated fair value is less than the carrying value of the trademark, then an impairment charge is recognized to reduce the carrying value of the trademark to its estimated fair value.
Significant judgment is required to estimate the fair value of the Dogfish Head trademark. Accordingly, the Company obtains the assistance of third-party valuation specialists as part of the impairment evaluation. In estimating the fair value of the trademark, management must make assumptions and projections regarding future cash flows based upon future revenues, the market-based royalty rate, the discount rate, and the after-tax royalty savings expected from ownership of the trademark. The assumptions and projections used in the estimate of fair value are consistent with recent trends and represent the projections used in the Company’s current strategic operating plans which include reductions in revenues from the Dogfish Head beer products. These assumptions reflect management’s estimates of future economic and competitive conditions and consider many factors including macroeconomic conditions, industry growth rates, and competitive activities and are, therefore, subject to change as a result of changing market conditions.
Refundable Deposits on Kegs and Pallets
The Company distributes its packaged flavored malt beverages, hard seltzers, beers, hard ciders and spirits based ready to drink beverages primarily in cans and glass bottles and its draft beer and hard ciders in kegs and such cans, bottles, and kegs are shipped on pallets to Distributors. Most kegs and pallets are owned by the Company. Kegs are reflected in the Company’s balance sheets at cost and are depreciated over the estimated useful life of the keg, while pallets are expensed upon purchase. Upon shipment of beer to Distributors, the Company collects a refundable deposit on the kegs and certain pallets, which is included in current liabilities in the Company’s balance sheets. Upon return of the kegs and pallets to the Company, the deposit is refunded to the Distributor.
The Company has experienced some loss of kegs and pallets and anticipates that some loss will occur in future periods due to the significant volume of kegs and pallets handled by each Distributor and retailer, the homogeneous nature of kegs and pallets owned by most brewers, and the relatively small deposit collected for each keg when compared with its market value. The Company believes that this is an industry-wide issue and that the Company’s loss experience is not atypical. The Company believes that the loss of kegs and pallets, after considering the forfeiture of related deposits, has not been material to the financial statements. The Company uses internal records, records maintained by Distributors, records maintained by other third-party vendors and historical information to estimate the physical count of kegs and pallets held by Distributors. These estimates affect the amount recorded as property, plant and equipment and current liabilities as of the date of the financial statements. The actual liability for refundable deposits could differ from these estimates. For the year ended December 28, 2024, the Company increased its liability for refundable deposits, and decreased its gross property, plant, and equipment and related accumulated depreciation by $1.8 million, $2.3 million and $2.2 million, respectively. For the year ended December 30, 2023, the Company decreased its liability for refundable deposits and increased its gross property, plant, and equipment and related accumulated depreciation by $0.7 million, $2.2 million and $0.3 million. As of December 28, 2024, and December 30, 2023, the Company’s balance sheet includes $15.1 million and $13.3 million, respectively, in refundable deposits on kegs and pallets and $2.8 million and $0.7 million, respectively, in kegs, net of accumulated depreciation.
Income Taxes
The Company provides for deferred taxes using an asset and liability approach that requires the recognition of deferred tax assets and liabilities for the expected future tax consequences of events that have been recognized in the Company’s consolidated financial statements or tax returns. This results in differences between the book and tax basis of the Company’s assets, liabilities and carry-forwards, such as tax credits. In estimating future tax consequences, all expected future events, other than enactment of changes in the tax laws or rates, are generally considered. Valuation allowances are provided when recovery of deferred tax assets does not meet the more likely than not standards as defined in ASC Topic 740, Income Taxes.
The calculation of the Company’s uncertain tax positions involves dealing with uncertainties in the application of tax regulations in several different state tax jurisdictions. The Company is periodically reviewed by tax authorities regarding the amount of taxes due. These reviews include inquiries regarding the timing and amount of deductions and the allocation of income among various tax jurisdictions. The Company records estimated reserves for exposures associated with positions that it takes on its income tax returns that do not meet the more likely than not standards as defined in ASC Topic 740, Income Taxes.
The Organization for Economic Co-operation and Development/G20 Inclusive Framework on Base Erosion and Profit Shifting has introduced rules to establish a global minimum tax rate of 15%, commonly referred to as the Pillar Two rules. Numerous foreign countries have enacted legislation to implement the Pillar Two rules, effective beginning in 2024, or are expected to enact similar legislation. The Company is currently evaluating the potential impacts that Pillar Two may have on future periods and will continue to monitor the implementation of the Pillar Two rules in the jurisdictions in which it operates. The Company meets the transitional safe harbor for the period ended December 28, 2024.
Revenue Recognition and Classification of Customer Programs and Incentives
During fiscal years 2024, 2023, and 2022 approximately 94%, 94%, and 95%, respectively, of the Company’s revenue was from shipments of its products to domestic Distributors and 5%, 4%, 4% from shipments to international Distributors, primarily located in Canada. Approximately 1%, 2%, and 1% of the Company’s revenue was from retail beer, cider, food and merchandise sales at the Company’s retail locations during fiscal years 2024, 2023, and 2022, respectively.
The Company recognizes revenue when obligations under the terms of a contract with its customer are satisfied; generally, this occurs with the transfer of control of its products. Revenue is measured as the amount of consideration expected to be received in exchange for transferring products. If the conditions for revenue recognition are not met, the Company defers the revenue until all conditions are met. As of December 28, 2024 and December 30, 2023, the Company had deferred revenue of $11.3 million and $8.9 million, respectively, related to product shipped prior to these dates for which the criteria to recognize revenue was not met as of these dates. These amounts are included in accrued expenses and other current liabilities in the accompanying consolidated balance sheets.
The Company is committed to maintaining the freshness of its products in the market. In certain circumstances and with the Company’s approval, the Company accepts and destroys or offers credits for stale beer that is returned or destroyed by Distributors. The Company generally credits approximately fifty percent of the distributor’s cost of beer that has passed its freshness expiration date when it is returned to the Company or destroyed. The Company reduces revenue and establishes an accrual based upon both historical returns, which is applied to an estimated lag time for receipt of product, and knowledge of specific return transactions. Estimating this reserve involves significant judgments and estimates, including comparability of historical return trends to future trends, lag time from date of sale to date of return, and product mix of returns. Stale beer expense is reflected in the accompanying financial statements as a reduction of revenue. Historically, the cost of actual stale beer returns has been in line with established reserves; however, the cost could differ materially from the reserves which would impact revenue. As of December 28, 2024, and December 30, 2023, the stale beer reserve was $6.1 million and $8.2 million, respectively. These amounts are included in accrued expenses and other current liabilities in the accompanying consolidated balance sheets. Provision for stale beer recorded as reductions to revenue totaled $5.3 million, $18.8 million, and $19.6 million in fiscal years 2024, 2023, and 2022 respectively.
Customer programs and incentives are a common practice in the alcohol beverage industry. Amounts paid in connection with customer programs and incentives are recorded as reductions to net revenue or as advertising, promotional and selling expenses, based on the nature of the expenditure. Customer incentives and other payments made to Distributors are primarily based upon the performance of certain marketing and advertising activities. Depending on applicable state laws and regulations, these activities promoting the Company’s products may include, but are not limited to, point-of-sale and merchandise placement, samples, product displays, promotional programs at retail locations and meals, travel and entertainment. Amounts paid to customers in connection with these programs that were recorded as reductions to net revenue or as advertising, promotional and selling expenses totaled $112.3 million, $106.4 million and $95.9 million in fiscal years 2024, 2023, and 2022, respectively. Estimates are based on historical and projected experience for each type of program or customer and have historically been in line with actual costs incurred.
Customer promotional discount programs are entered into with Distributors for certain periods of time. Amounts paid to Distributors in connection with these programs in fiscal years 2024, 2023, and 2022 were $61.0 million, $62.6 million and $54.8 million, respectively. The reimbursements for discounts to Distributors are recorded as reductions to net revenue. The agreed-upon discount rates are applied to certain Distributors’ sales to retailers, based on volume metrics, in order to determine the total discounted amount. The computation of the discount allowance requires that management make certain estimates and assumptions that affect the timing and amounts of revenue and liabilities recorded. Actual promotional discounts owed and paid have historically been in line with allowances recorded by the Company; however, the amounts could differ from the estimated allowances.
Customer incentives and other payments are made primarily to Distributors based upon the performance of certain marketing and advertising activities. Depending on applicable state laws and regulations, these activities promoting the Company’s products may include, but are not limited to point-of-sale and merchandise placement, samples, product displays, promotional programs at retail locations and meals, travel and entertainment. Amounts paid to customers in connection with these programs in fiscal years 2024, 2023, and 2022 were $51.3 million, $43.8 million and $41.1 million, respectively. In fiscal years 2024, 2023, and 2022, the Company recorded certain of these costs in the total amount of $32.2 million, $31.4 million and $29.9 million, respectively, as reductions to net revenue. Costs recognized in net revenues include, but are not limited to, promotional discounts, sales incentives and certain other promotional activities. Costs recognized in advertising, promotional and selling expenses include point of sale materials, samples and media advertising expenditures in local markets. These costs are recorded as incurred, generally when invoices are received; however certain estimates are required at the period end. Estimates are based on historical and projected experience for each type of program or customer and have historically been in line with actual costs incurred.
In connection with its preparation of financial statements and other financial reporting, management is required to make certain estimates and assumptions regarding the amount, timing and classification of expenditures resulting from these activities. Actual expenditures incurred could differ from management’s estimates and assumptions.
Excise Taxes
The Company is responsible for compliance with TTB regulations, including making timely and accurate excise tax payments. The Company is subject to periodic compliance audits by the TTB. Individual states also impose excise taxes on alcohol beverages in varying amounts. The Company calculates its excise tax expense based upon units shipped and on its understanding of the applicable excise tax laws.
Cost of Goods Sold
The following expenses are included in cost of goods sold in the accompanying consolidated statements of comprehensive income: raw material costs, packaging material costs, costs and income related to deposit activity, purchasing and receiving costs, manufacturing labor and overhead, brewing and processing costs, inspection costs relating to quality control, inbound freight charges, depreciation expense related to manufacturing equipment and warehousing costs, which include rent, labor and overhead costs.
Shipping Costs
Costs incurred for the shipping of products to customers are included in advertising, promotional and selling expenses in the accompanying consolidated statements of comprehensive income. The Company incurred shipping costs of $104.1 million, $114.7 million, and $165.5 million in fiscal years 2024, 2023, and 2022, respectively.
Advertising, Promotional, and Selling Expenses
The following expenses are included in advertising, promotional and selling expenses in the accompanying consolidated statements of comprehensive income: media advertising and production costs, sales and brand related expenses, sales and brand salary and benefit expenses, stock compensation, meals, travel and entertainment expenses, promotional activity expenses, shipping costs related to shipments of finished goods from manufacturing locations to distributor locations and point-of-sale items. Total advertising and sales promotional expenditures of $240.9 million, $233.5 million, and $226.7 million were included in advertising, promotional and selling expenses in the accompanying consolidated statements of comprehensive income for fiscal years 2024, 2023, and 2022, respectively.
The Company conducts certain advertising and promotional activities in its Distributors’ markets and the Distributors make contributions to the Company for such efforts. Reimbursements from Distributors for advertising and promotional activities are recorded as reductions to advertising, promotional and selling expenses.
General and Administrative Expenses
The following expenses are included in general and administrative expenses in the accompanying consolidated statements of comprehensive income: general and administrative salary and benefit expenses, stock compensation, insurance costs, consulting and professional service fees, rent and utility expenses, meals, travel and entertainment expenses for general and administrative employees, and other general and administrative overhead costs.
Stock-Based Compensation
The Company accounts for share-based awards in accordance with ASC Topic 718, Compensation – Stock Compensation (“ASC 718”), which generally requires recognition of share-based compensation costs in financial statements based on fair value. Compensation cost is recognized over the period during which an employee is required to provide services in exchange for the award (the requisite service period). The amount of compensation cost recognized in the consolidated statements of comprehensive income is based on the awards ultimately expected to vest, and therefore, reduced for estimated forfeitures. Stock-based compensation was $19.0 million, $17.0 million and $14.0 million in fiscal years 2024, 2023, and 2022, respectively.
As permitted by ASC 718, the Company elected to use a lattice model, such as the trinomial option-pricing model, to estimate the fair values of stock options. All option-pricing models require the input of subjective assumptions. These assumptions include the estimated volatility of the Company’s common stock price over the expected term, the expected dividend rate, the estimated post-vesting forfeiture rate, the risk-free interest rate and expected exercise behavior. See Note O for further discussion of the application of the option-pricing models.
In addition, an estimated pre-vesting forfeiture rate is applied in the recognition of the compensation charge. Periodically, the Company grants performance-based stock options. The Company only recognizes compensation expense with respect to these options if it is probable that the performance targets will be met. Consequently, at the end of each reporting period, the Company estimates whether it is probable that performance targets will be met. Changes in the subjective assumptions and estimates can materially affect the amount of stock-based compensation expense recognized in the consolidated statements of comprehensive income.
Basic net income per share is calculated by dividing net income by the weighted-average common shares outstanding. Diluted net income per share is calculated by dividing net income by the weighted-average common shares and potentially dilutive securities outstanding during the period using the treasury stock method or the two-class method, whichever is more dilutive.
C. Recent Accounting Pronouncements
New accounting pronouncements are issued periodically by the FASB and are adopted by the Company as of the specified effective dates. Unless otherwise disclosed below, the Company believes that recently issued and adopted pronouncements will not have a material impact on the Company’s financial position, results of operations and cash flows or do not apply to the Company’s operations.
In November 2023, the FASB issued ASU 2023-07—Segment Reporting (Topic 280): Improvements to Reportable Segment Disclosures. This ASU was issued to improve reportable segment disclosure requirements, primarily through enhanced disclosures about significant segment expenses. This ASU applies to all public entities that are required to report segment information in accordance with Topic 280, Segment Reporting. ASU 2023-07 is effective for fiscal years beginning after December 15, 2023, and interim periods within fiscal years beginning after December 15, 2024. The Company has adopted ASU 2023-07 for the fiscal year ending December 28, 2024. See Note U for further discussion of the Company's segment reporting.
In December 2023, the FASB issued ASU 2023-09—Income Taxes (Topic 740): Improvements to Income Tax Disclosures. This ASU was issued to address investor requests for more transparency about income tax information through improvements to income tax disclosure primarily related to the rate reconciliation and income taxes paid information, and to improve the effectiveness of income tax disclosures. This ASU is effective for public entities for annual periods beginning after December 15, 2024. Early adoption is permitted. ASU 2023-09 will be effective for the Company in the first quarter of its fiscal year ending December 27, 2025. The Company is currently evaluating the impact the adoption of this ASU will have on its consolidated financial statements.
In November 2024, the FASB issued ASU 2024-03—Income Statement - Reporting Comprehensive Income - Expenses Disaggregation Disclosures (SubTopic 220-40): Disaggregation of Income Statement Expenses. This ASU was issued to address investor requests for more detailed information about the types of expenses in commonly presented expense captions (such as cost of sales, SG&A, and research and development). This ASU is effective for public entities for annual periods beginning after December 15, 2026. Early adoption is permitted. ASU 2024-03 will be effective for the Company in the first quarter of its fiscal year ending December 15, 2027. The Company is currently evaluating the impact the adoption of this ASU will have on its consolidated financial statements.
D. Inventories
Inventories consisted of the following as of:
| | | | | | | | |
| | December 28,
2024 | | | December 30,
2023 | |
| | (in thousands) | |
Current inventory: | | | | | | |
Raw materials | | $ | 48,321 | | | $ | 55,116 | |
Work in process | | | 18,878 | | | | 18,750 | |
Finished goods | | | 49,960 | | | | 41,907 | |
Total current inventory | | | 117,159 | | | | 115,773 | |
Long term inventory | | | 6,076 | | | | 14,369 | |
Total inventory | | $ | 123,235 | | | $ | 130,142 | |
As of December 28, 2024 and December 30, 2023, the Company has recorded inventory obsolescence reserves of $16.3 million and $7.6 million, respectively. The increase in inventory obsolescence reserves was primarily driven by the reserves for slow moving inventory.
E. Prepaid Expenses and Other Current Assets
Prepaid expenses and other current assets consisted of the following as of:
| | | | | | | | |
| | December 28,
2024 | | | December 30,
2023 | |
| | (in thousands) | |
Prepaid insurance | | $ | 4,718 | | | $ | 3,394 | |
Prepaid advertising, promotional and selling costs | | | 4,678 | | | | 3,324 | |
Prepaid taxes | | | 3,984 | | | | 5,536 | |
Prepaid software and consulting fees | | | 3,907 | | | | 3,627 | |
Other | | | 2,922 | | | | 4,657 | |
Total prepaid expenses and other current assets | | $ | 20,209 | | | $ | 20,538 | |
F. Property, Plant, and Equipment
Property, plant, and equipment consisted of the following as of:
| | | | | | | | |
| | December 28,
2024 | | | December 30,
2023 | |
| | (in thousands) | |
Machinery and plant equipment | | $ | 830,964 | | | $ | 777,185 | |
Building and building improvements | | | 256,829 | | | | 247,384 | |
Leasehold improvements | | | 71,846 | | | | 74,603 | |
Kegs | | | 58,384 | | | | 58,492 | |
Office equipment and furniture | | | 44,409 | | | | 40,723 | |
Land | | | 25,980 | | | | 25,752 | |
Assets under construction | | | 46,637 | | | | 66,700 | |
Property, plant, and equipment, gross | | | 1,335,049 | | | | 1,290,839 | |
Less accumulated depreciation | | | (718,807 | ) | | | (648,330 | ) |
Property, plant, and equipment, net | | $ | 616,242 | | | $ | 642,509 | |
The Company recorded depreciation expense related to these assets of $93.2 million, $87.9 million, and $81.1 million, in fiscal years 2024, 2023, and 2022, respectively.
Impairment of Assets
The Company evaluates its assets for impairment when events indicate that an asset or asset group may have suffered impairment. During fiscal years 2024, 2023, and 2022, the Company recorded impairment charges on brewery equipment and other brewery related assets classified as property, plant, and equipment of $7.2 million, $5.0 million, and $2.6 million, respectively.
G. Leases
The Company has various lease agreements in place for facilities and equipment. Terms of these leases include, in some instances, scheduled rent increases, renewals, purchase options, and maintenance costs, and vary by lease. These lease obligations expire at various dates through 2034. As the rate implicit in each lease is not readily determinable, the Company uses its incremental borrowing rate based on information available at lease commencement to determine the present value of the lease payments. Leases with an initial term of 12 months or less (“short-term leases”) are not recorded on the balance sheet and are recognized on a straight-line basis over the lease term. Total right-of-use ("ROU") assets and lease liabilities were as follows at:
| | | | | | | | | | |
| | Classification | | Leases | |
| | | | December 28,
2024 | | | December 30,
2023 | |
| | | | (in thousands) | |
Right-of-use assets | | | | | | | | |
Operating lease assets | | Operating right-of-use assets | | $ | 27,837 | | | $ | 35,559 | |
Finance lease assets | | Property, plant, and equipment, net | | | 2,818 | | | | 2,680 | |
Lease Liabilities | | | | | | | | |
Current | | | | | | | | |
Operating lease liabilities | | Current operating lease liabilities | | | 5,735 | | | | 9,113 | |
Finance lease liabilities | | Accrued expenses and other current liabilities | | | 1,904 | | | | 1,257 | |
Non-current | | | | | | | | |
Operating lease liabilities | | Non-current operating lease liabilities | | | 30,205 | | | | 36,161 | |
Finance lease liabilities | | Other liabilities | | | 936 | | | | 1,451 | |
The gross value and accumulated depreciation of ROU assets related to finance leases were as follows at:
| | | | | | | | |
| | Finance Leases | |
| | December 28,
2024 | | | December 30,
2023 | |
| | (in thousands) | |
Gross value | | $ | 5,316 | | | $ | 6,134 | |
Accumulated amortization | | | (2,498 | ) | | | (3,454 | ) |
Carrying value | | $ | 2,818 | | | $ | 2,680 | |
Components of lease cost for the fiscal year-ended are as follows at:
| | | | | | | | | | | | |
| | | |
| | Fiscal years ended | |
| | December 28,
2024 | | | December 30,
2023 | | | December 31,
2022 | |
| | (in thousands) | |
Operating lease cost: | | | | | | | | | |
Amortization of right-of-use assets | | $ | 9,420 | | | $ | 8,339 | | | $ | 9,978 | |
Variable lease costs not included in liability | | | 561 | | | | 606 | | | | 702 | |
Total operating lease cost | | $ | 9,981 | | | $ | 8,945 | | | $ | 10,680 | |
Finance lease cost: | | | | | | | | | |
Amortization of right-of-use assets | | $ | 1,624 | | | $ | 1,568 | | | $ | 1,590 | |
Interest on lease liabilities | | | 222 | | | | 138 | | | | 71 | |
Total finance lease cost | | $ | 1,846 | | | $ | 1,706 | | | $ | 1,661 | |
Additionally, during 2024, 2023 and 2022, the Company recorded losses on disposals of right-of use assets of $0.2 million in 2024 and impairment charges of $0.4 million and $0.2 million in 2023 and 2022, respectively, included within other expenses, net within the Company's consolidated statements of comprehensive income.
Maturities of lease liabilities as of December 28, 2024 are as follows:
| | | | | | | | | | | | | | | | |
| | Operating | | | Finance | | | Weighted- Average
Remaining Term
in Years | |
| | Leases | | | Leases | | | Operating
Leases | | | Finance
Leases | |
| | (in thousands) | | | | | | | |
2025 | | $ | 6,885 | | | $ | 1,852 | | | | | | | |
2026 | | | 6,670 | | | | 1,132 | | | | | | | |
2027 | | | 6,122 | | | | 8 | | | | | | | |
2028 | | | 6,039 | | | | — | | | | | | | |
2029 | | | 4,522 | | | | — | | | | | | | |
Thereafter | | | 10,224 | | | | — | | | | | | | |
Total lease payments | | | 40,462 | | | | 2,992 | | | | | | | |
Less imputed interest (based on 3.5% weighted-average
discount rate) | | | (4,522 | ) | | | (152 | ) | | | | | | |
Present value of lease liabilities | | $ | 35,940 | | | $ | 2,840 | | | | 6.6 | | | | 1.7 | |
H. Goodwill and Intangible Assets
The Company has recorded intangible assets with indefinite lives and goodwill for which impairment testing is required at least annually or more frequently if events or circumstances indicate that these assets might be impaired. The Company performs its annual impairment tests and re-evaluates the useful lives of other intangible assets with indefinite lives at the annual impairment test measurement date in the third quarter of each fiscal year or when circumstances arise that indicate a possible impairment or change in useful life might exist.
Goodwill. No impairment of goodwill was recorded in any period.
Intangible assets. The Company's annual impairment testing occurs as of September 1 each year. During fiscal 2024, the Company evaluated the continuing negative trends of the Dogfish Head brand, including declining sales resulting from increased competition and updated its long-term financial forecasts for the Dogfish Head brand. These updated forecasts for the brand included reductions in revenues from the continuing negative trends in the brands’ beer products and the overall slowing craft beer industry sector and flat revenue projections from the brands’ canned cocktail products. As a result of performing this assessment, the Dogfish Head trademark asset with a carrying value of $55.6 million was written down to its estimated fair value of $14.4 million, resulting in an impairment of $41.2 million which was recorded during the third quarter of 2024. As a result of the continued declining trends in the brand, the Company re-assessed the remaining useful life of the trademark asset and changed the remaining useful life from an indefinite life to a 10 year life at the end of the third quarter of 2024. Additionally, during the third quarter of 2024, an impairment of $1.4 million was recorded on other intangible assets. During fiscal 2023, an impairment of $15.8 million was recorded to reduce the carrying value of the Dogfish Head trademark asset from $71.4 million to $55.6 million.
The Company’s intangible assets were as follows as of:
| | | | | | | | | | | | | | | | | | | | | | | | | | |
| | | | December 28, 2024 | | | December 30, 2023 | |
| | Estimated
Useful | | Gross
Carrying | | | Accumulated | | | Net Book | | | Gross
Carrying | | | Accumulated | | | Net Book | |
| | Life (Years) | | Value | | | Amortization | | | Value | | | Value | | | Amortization | | | Value | |
| | | | | | | | | | (in thousands) | | | | | | | | | | |
Customer relationships | | 15 | | $ | 3,800 | | | $ | (1,394 | ) | | $ | 2,406 | | | $ | 3,800 | | | $ | (1,140 | ) | | $ | 2,660 | |
Trademarks | | 10* | | | 14,400 | | | | (360 | ) | | | 14,040 | | | | 56,984 | | | | — | | | | 56,984 | |
Total intangible assets | | | | $ | 18,200 | | | $ | (1,754 | ) | | $ | 16,446 | | | $ | 60,784 | | | $ | (1,140 | ) | | $ | 59,644 | |
*During the 2024 annual intangible impairment testing the Company changed the remaining useful life of the Dogfish Head trademark intangible asset to 10 years.
Amortization expense was approximately $613,000 and $253,000 in fiscal 2024 and 2023, respectively. The Company expects to record amortization expense as follows over the subsequent years:
| | | | |
Fiscal Year | | Amount (in thousands) | |
2025 | | $ | 1,693 | |
2026 | | | 1,693 | |
2027 | | | 1,693 | |
2028 | | | 1,693 | |
2029 | | | 1,693 | |
Thereafter | | | 7,981 | |
Total amortization to be recorded | | $ | 16,446 | |
I. Third-Party Production Payments
During each of the years ended December 28, 2024 and December 30, 2023, the Company brewed, fermented, and packaged approximately 74%, of its domestic volume at Company-owned breweries. In the normal course of its business, the Company has historically entered into various production arrangements with other brewing companies. Pursuant to these arrangements, the Company generally supplies raw materials and packaging to those brewing companies and incurs conversion fees for labor at the time the liquid is produced and packaged.
The Company currently has brewing and packaging services agreements with subsidiaries of City Brewing Company, LLC (“City Brewing”). During 2024 and 2023, City Brewing supplied approximately 26% and 22%, respectively, of the Company’s annual domestic shipment volume. In accordance with the brewing and packaging services agreement, the Company has made payments to City Brewing which were principally used for capital improvements at City Brewing facilities. These payments are being expensed over the terms of the agreements and the remaining net book value of these third-party production prepayments was $14.5 million at December 28, 2024. Currently, certain of these packaging and service agreements expire on December 31, 2025 and others on December 31, 2028. The Company has the contractual right to extend its agreements with City Brewing beyond the current termination dates on an annual basis through December 31, 2035.
These City Brewing agreements include a minimum capacity availability commitment by City Brewing and the Company is obligated to meet annual minimum volume commitments and is subject to contractual shortfall fees, if these annual minimum volume commitments are not met.
In January of 2024, the Company and City Brewing entered into a Loan and Security agreement at which time payment of $20 million was made by the Company to City Brewing. Repayment of the note receivable plus an agreed investment return for a combined total of $22.4 million shall be repaid to the Company subject to annual repayment limits. As of December 28, 2024, the balance of the note receivable was $16.7 million and the final maturity date is December 31, 2028.
In December of 2024, the Company announced an amendment and restatement in its entirety of an existing production agreement with a third-party supplier, Rauch North America Inc (‘Rauch’). This amendment adjusted the existing production agreement to better match the Company’s future capacity requirements and resulted in increased production flexibility and more favorable termination rights to the Company in exchange for a $26 million cash payment to Rauch which was paid on December 23, 2024. As a result of the payment, the Company recorded a pre-tax contract settlement expense of $26 million in the fourth quarter of 2024.
The amended and restated Rauch agreement includes quarterly minimum payments that total $4.1 million annually at zero volume and a termination fee of $5 million with 12 months written notice. The initial term of the agreement expires on December 31, 2031 with provisions to extend.
At current production volume projections, the Company believes that it will fall short of its future annual volume commitments under the City Brewing and Rauch agreements and will incur shortfall fees. The Company expenses the shortfall fees during the contractual period when such fees are incurred as a component of cost of goods sold. During 2024 and 2023, the Company recorded $13.0 million and $9.5 million, respectively, in shortfall fees. At current volume projections, the Company anticipates that it will recognize approximately $30 million of shortfall fees in the future with $14 million forecasted to be expensed in 2025 and the remainder expected to be expensed primarily in 2026.
As of December 28, 2024, if volume for the remaining term of the production arrangements was zero, the total contractual shortfall fees, with advance notice as specified in the related contractual agreements, would total approximately $37 million with $27 million due in 2025 and $10 million due in future years thereafter.
The Company has regular discussions with its third-party production suppliers related to its future capacity needs and the terms of its contracts. Changes to volume estimates, future amendments or cancellations of existing contracts could accelerate or change total shortfall fees expected to be incurred.
J. Accrued Expenses and Other Current Liabilities
Accrued expenses and other current liabilities consisted of the following as of:
| | | | | | | | |
| | December 28,
2024 | | | December 30,
2023 | |
| | (in thousands) | |
Employee wages, benefits, and reimbursements | | $ | 47,992 | | | $ | 49,446 | |
Advertising, promotional, and selling expenses | | | 22,666 | | | | 18,950 | |
Accrued deposits | | | 15,213 | | | | 13,425 | |
Accrued inventory and production related costs | | | 14,657 | | | | 9,775 | |
Deferred revenue | | | 11,302 | | | | 8,895 | |
Accrued taxes | | | 7,444 | | | | 6,757 | |
Accrued returns | | | 6,092 | | | | 8,240 | |
Other | | | 13,252 | | | | 11,442 | |
Total accrued expenses and other current liabilities | | $ | 138,618 | | | $ | 126,930 | |
K. Revolving Line of Credit
During 2022, the Company amended its $150.0 million credit facility agreement, which now has a term not scheduled to expire until December 16, 2027. Under the terms of the amended agreement, the Company may elect an interest rate for borrowings under the credit facility based on the applicable secured overnight financing rate ("SOFR") plus 1.1%. At December 28, 2024, the applicable SOFR was 4.5%. The Company incurs an annual commitment fee of 0.2% on the unused portion of the facility and is obligated to meet certain financial covenants, which are measured using earnings before interest, tax, depreciation, and amortization (“EBITDA”) based ratios. The Company’s EBITDA to interest expense ratio was 1,303.3 as of December 28, 2024, compared to a minimum allowable ratio of 2.0 and the Company’s total funded debt to EBITDA ratio was 0.0 as of December 28, 2024, compared to a maximum allowable ratio of 2.5. There were no borrowings, repayments, or interest payments during 2024 or 2023. During the year ended December 31, 2022, the Company borrowed and repaid $30.0 million on the credit facility and paid a total of approximately $18,000 in related interest. There were no borrowings outstanding under the credit facility as of December 28, 2024.
There are also certain restrictive covenants set forth in the credit agreement. Pursuant to the negative covenants, the Company has agreed that it will not: enter into any indebtedness or guarantees other than those specified by the lender, enter into any sale and leaseback transactions, merge, consolidate, or dispose of significant assets without the lender’s prior written consent, make or maintain any investments other than those permitted in the credit agreement, or enter into any transactions with affiliates outside of the ordinary course of business. In addition, the credit agreement requires the Company to obtain prior written consent from the lender on distributions on account of, or in repurchase, retirement or purchase of its capital stock or other equity interests with the exception of the following: (a) distributions of capital stock from subsidiaries to The Boston Beer Company, Inc. and Boston Beer Corporation (a subsidiary of The Boston Beer Company, Inc.), (b) repurchase from former employees of non-vested investment shares of Class A Common Stock, issued under the Employee Equity Incentive Plan, and (c) redemption of shares of Class A Common Stock as approved by the Board of Directors and payment of cash dividends to its holders of common stock. Borrowings under the credit facility may be used for working capital, capital expenditures and general corporate purposes of the Company and its subsidiaries. In the event of a default that has not been cured, the credit facility would terminate and any unpaid principal and accrued interest would become due and payable.
L. Income Taxes
Significant components of the income tax provision (benefit) for fiscal 2024, 2023, and 2022 were as follows:
| | | | | | | | | | | | |
| | 2024 | | | 2023 | | | 2022 | |
| | (in thousands) | |
Current: | | | | | | | | | |
Federal | | $ | 37,971 | | | $ | 36,556 | | | $ | 10,453 | |
State | | | 9,880 | | | | 7,650 | | | | 4,683 | |
Total current | | | 47,851 | | | | 44,206 | | | | 15,136 | |
Deferred: | | | | | | | | | |
Federal | | | (17,175 | ) | | | (10,816 | ) | | | 8,196 | |
State | | | (2,769 | ) | | | (52 | ) | | | 841 | |
Total deferred | | | (19,944 | ) | | | (10,868 | ) | | | 9,037 | |
Total income tax provision | | $ | 27,907 | | | $ | 33,338 | | | $ | 24,173 | |
The reconciliations to statutory rates for fiscal 2024, 2023, and 2022 were as follows:
| | | | | | | | | | | | |
| | 2024 | | | 2023 | | | 2022 | |
Statutory rate | | | 21.0 | % | | | 21.0 | % | | | 21.0 | % |
State income taxes, net of federal benefit | | | 5.5 | | | | 4.8 | | | | 4.1 | |
Non-deductible compensation under Internal Revenue Code Section 162(m) | | | 1.1 | | | | 3.4 | | | | 0.2 | |
Non-deductible meals & entertainment | | | 2.1 | | | | 1.2 | | | | 0.6 | |
Change in valuation allowance | | | 3.0 | | | | 1.0 | | | | 1.2 | |
Deduction relating to excess stock-based compensation | | | 0.6 | | | | 0.1 | | | | (0.9 | ) |
Other | | | (1.4 | ) | | | (1.1 | ) | | | 0.2 | |
| | | 31.9 | % | | | 30.4 | % | | | 26.4 | % |
Significant components of the Company’s deferred tax assets and liabilities were as follows at:
| | | | | | | | |
| | December 28,
2024 | | | December 30,
2023 | |
| | (in thousands) | |
Deferred tax assets: | | | | | | |
Lease liabilities | | $ | 9,669 | | | $ | 12,034 | |
Stock-based compensation expense | | | 9,415 | | | | 8,062 | |
Accrued expenses | | | 3,714 | | | | 4,146 | |
Inventory reserves | | | 8,282 | | | | 4,689 | |
Loss carryforwards and tax credit carryforwards | | | 3,216 | | | | 2,553 | |
Capitalized research and development | | | 3,598 | | | | 2,954 | |
Intangible assets amortization | | | 433 | | | | — | |
Other | | | 1,710 | | | | 1,091 | |
Total deferred tax assets | | | 40,037 | | | | 35,529 | |
Valuation allowance | | | (8,203 | ) | | | (5,808 | ) |
Total deferred tax assets, net of valuation allowance | | | 31,834 | | | | 29,721 | |
Deferred tax liabilities: | | | | | | |
Property, plant, and equipment | | | (84,081 | ) | | | (90,372 | ) |
Right-of-use assets | | | (7,643 | ) | | | (9,590 | ) |
Intangible assets amortization | | | — | | | | (8,244 | ) |
Prepaid expenses | | | (5,913 | ) | | | (7,236 | ) |
Total deferred tax liabilities | | | (97,637 | ) | | | (115,442 | ) |
Net deferred tax liabilities | | $ | (65,803 | ) | | $ | (85,721 | ) |
The Company’s policy is to classify interest and penalties related to income tax matters in income tax expense. Interest and penalties included in the provision for income taxes amounted to $(0.2) million in fiscal year 2024, $0.1 million in fiscal year 2023, and $0 in fiscal years 2022. Accrued interest and penalties amounted to $0.1 million at December 28, 2024 and $0.2
million at December 30, 2023.
A reconciliation of the beginning and ending amount of unrecognized tax benefits for fiscal 2024 and 2023 was as follows:
| | | | | | | | |
| | 2024 | | | 2023 | |
| | (in thousands) | |
Balance at beginning of period | | $ | 303 | | | $ | 243 | |
Increases related to current period tax positions | | | 33 | | | | 69 | |
Increases related to prior period tax positions | | | 309 | | | | 4 | |
Decreases related to lapse of statute of limitations | | | (165 | ) | | | (13 | ) |
Balance at end of period | | $ | 480 | | | $ | 303 | |
Included in the balance of unrecognized tax benefits at December 28, 2024 and December 30, 2023 are potential net benefits of $0.5 million and $0.3 million, respectively, that would favorably impact the effective tax rate if recognized. Unrecognized tax benefits are included in accrued expenses in the accompanying consolidated balance sheets and adjusted in the period in which new information about a tax position becomes available or the final outcome differs from the amount recorded.
As of December 28, 2024, the Company’s 2021, 2022, and 2023 federal income tax returns remain subject to examination by the IRS. The Company’s state income tax returns remain subject to examination for three or four years depending on the state’s statute of limitations. In addition, the Company is generally obligated to report changes in taxable income arising from federal income tax audits. The Company is not currently under any income tax audits as of December 28, 2024.
As of December 28, 2024, the Company’s deferred tax assets include a valuation allowance of $8.2 million, compared to $5.8 million at December 30, 2023. The valuation allowance as of December 28, 2024 and December 30, 2023 was primarily related to stock-based compensation expected by management to be non-deductible under Internal Revenue Code, Section 162(m), as well as jurisdictional losses not expected to be utilized before expiring. The net increase in total valuation allowance was $2.4 million from December 30, 2023 to December 28, 2024, compared to a net increase of $1.2 million from December 31, 2022 to December 30, 2023 and a net increase of $1.3 million from December 25, 2021 to December 31, 2022.
M. Commitments and Contingencies
Contractual Obligations
As of December 28, 2024, projected cash outflows under non-cancellable contractual obligations for the remaining years under the contracts are as follows:
| | | | | | | | | | | | | | | | | | | | |
| | Payments Due by Fiscal Year | |
| | Total | | | 2025 | | | 2026 | | | 2027 | | | Thereafter | |
| | (in thousands) | |
Brand support | | $ | 68,602 | | | $ | 63,618 | | | $ | 4,559 | | | $ | 425 | | | $ | - | |
Ingredients and packaging (excluding hops and malt) | | | 56,044 | | | | 56,044 | | | | — | | | | — | | | | — | |
Hops and malt | | | 38,264 | | | | 33,080 | | | | 2,005 | | | | 1,462 | | | | 1,717 | |
Equipment and machinery | | | 34,240 | | | | 31,665 | | | | 1,934 | | | | 641 | | | | — | |
Other | | | 27,927 | | | | 18,415 | | | | 6,273 | | | | 3,170 | | | | 69 | |
Total contractual obligations | | $ | 225,077 | | | $ | 202,822 | | | $ | 14,771 | | | $ | 5,698 | | | $ | 1,786 | |
The Company’s accounting policy for inventory and non-cancellable purchase commitments is to recognize a loss by establishing a reserve to the extent inventory levels and commitments exceed forecasted needs. The computation of the excess inventory requires management to make certain assumptions regarding future sales growth, product mix, cancellation costs and supply, among others. Actual results may differ materially from management’s estimates. The Company continues to manage inventory levels and purchase commitments in an effort to maximize utilization. However, changes in management’s assumptions regarding future sales growth, product mix, and hops market conditions could result in future material losses.
Currently, the Company has entered into contracts for barley, wheat and malt used in the Company’s products with four major suppliers. The contracts cover the Company’s barley, wheat, and malt requirements for 2025 and extend through crop year 2026. These purchase commitments outstanding at December 28, 2024 totaled $28.0 million.
The Company utilizes several varieties of hops in the production of its products. To ensure adequate supplies of these varieties, the Company enters into advance multi-year purchase commitments based on forecasted future hop requirements,
among other factors. These purchase commitments extend through crop year 2029 and specify both the quantities and prices, denominated in U.S. Dollar, Euros, New Zealand Dollars and British Pounds, to which the Company is committed. Hops purchase commitments outstanding at December 28, 2024 totaled $10.3 million, based on the exchange rates on that date.
The Company does not use forward currency exchange contracts and intends to purchase future hops using the exchange rate at the time of purchase. These contracts were deemed necessary in order to bring hop inventory levels and purchase commitments into balance with the Company’s current brewing volume and hop usage forecasts. In addition, these contracts enable the Company to secure its position for future supply with hop vendors in the face of some competitive buying activity.
The Company anticipates paying shortfall fees at certain of its third-party production locations in future periods. See Note I for further discussion of the Company's third-party production arrangements and the anticipated shortfall fees. The anticipated shortfall fees are not included in the contractual obligations above.
Litigation
The Company is party to legal proceedings and claims, including class action claims, where significant damages are asserted against it. Given the inherent uncertainty of litigation, it is possible that the Company could incur liabilities as a consequence of these claims, which may or may not have a material adverse effect on the Company’s financial condition or the results of its operations. The Company accrues loss contingencies if, in the opinion of management and its legal counsel, the risk of loss is probable and able to be estimated. Material pending legal proceedings are discussed below.
Supplier Dispute. On December 31, 2022, Ardagh Metal Packaging USA Corp. (“Ardagh”) filed an action against the Company alleging, among other things, that the Company had failed to purchase contractual minimum volumes of certain aluminum beverage can containers in 2021 and 2022. The Company filed an Amended Answer, Amended Affirmative Defenses and Amended Counterclaims on March 25, 2024. On November 9, 2023, Ardagh filed a Notice of Plaintiff’s Motion for Judgment on the Pleadings on Count II of the Complaint, to which the Company filed an Opposition on November 22, 2023. On February 26, 2024, the Court granted the Motion. On March 27, 2024, the Company filed a Motion to Clarify and to Reconsider the Court’s decision. Following briefing by the parties, on June 17, 2024, the Court granted the Company's Motion to Reconsider, denied Ardagh's Motion for Judgment on the Pleadings, and vacated its February 26, 2024 Order. The Court set a fact discovery deadline of November 25, 2024 with some discovery motions still pending. Expert discovery has begun and the Court has set an expert discovery deadline of April 18, 2025. The Court has not set a date for summary judgment filings or trial. The Company denies that it breached the terms of the parties’ contract and intends to defend against the Ardagh claims vigorously.
N. Fair Value Measurements
The Company defines fair value as the price that would be received to sell an asset or be paid to transfer a liability in an orderly transaction between market participants at the measurement date. The Company applies the following fair value hierarchy, which prioritizes the inputs used to measure fair value into three levels and bases the categorization within the hierarchy upon the lowest level of input that is available and significant to the fair value measurement. The hierarchy gives the highest priority to unadjusted quoted prices in active markets for identical assets or liabilities (Level 1 measurements) and the lowest priority to unobservable inputs (Level 3 measurements).
•Level 1 — Level 1 inputs are quoted prices (unadjusted) in active markets for identical assets or liabilities that the reporting entity has the ability to access at the measurement date.
•Level 2 — Level 2 inputs are inputs other than quoted prices included within Level 1 that are observable for the asset or liability, either directly or indirectly. If the asset or liability has a specified (contractual) term, a Level 2 input must be observable for substantially the full term of the asset or liability.
•Level 3 — Level 3 inputs are unobservable inputs for the asset or liability in which there is little, if any, market activity for the asset or liability at the measurement date.
The Company’s investments in money market funds are measured at fair value on a recurring basis (at least annually) and are classified within Level 1 of the fair value hierarchy because they are valued using quoted market prices. The money market funds are invested substantially in United States Treasury and government securities. The Company does not adjust the quoted market price for such financial instruments. Cash, accounts receivable, accounts payable, and accrued expenses are carried at their cost, which approximates fair value, because of their short-term nature.
At December 28, 2024 and December 30, 2023, the Company had funds invested in a “Triple A” rated money market fund. The Company considers the “Triple A” rated money market fund to be a large, highly-rated investment-grade institution. As
of December 28, 2024 and December 30, 2023, the Company’s cash and cash equivalents balance was $211.8 million and $298.5 million, respectively, including money market funds amounting to $203.1 million and $291.5 million, respectively.
Non-Recurring Fair Value Measurement
The fair value as of the issuance date of the Company's note receivable as discussed further in Note I is classified within Level 2 of the fair value hierarchy as the fair value was partially derived from publicly quoted inputs of market interest rates for a loan of similar terms, provisions, and maturity.
The fair value of the Company's Dogfish Head trademark intangible assets as of the 2024 impairment assessment date is classified within Level 3 of the fair value hierarchy because there are no observable inputs of market activity. When performing a quantitative assessment for impairment of the trademark asset, the Company measures the amount of impairment by calculating the amount by which the carrying value of the trademark asset exceeds its estimated fair value. The estimated fair value is determined based on an income approach using the relief from royalty method, which assumes that, in lieu of ownership, a third party would be willing to pay a royalty in order to exploit the related benefits of the trademark asset. The cash flow projections the Company uses to estimate the fair value of its Dogfish Head trademark intangible asset involves several assumptions, including (i) projected revenue growth, (ii) an estimated royalty rate, (iii) after-tax royalty savings expected from ownership of the trademark and (iv) a discount rate used to derive the estimated fair value of the trademark asset.
O. Common Stock and Share-Based Compensation
Class A Common Stock
The Class A Common Stock has no voting rights, except (1) as required by law, (2) for the election of Class A Directors, and (3) that the approval of the holders of the Class A Common Stock is required for (a) certain future authorizations or issuances of additional securities which have rights senior to Class A Common Stock, (b) certain alterations of rights or terms of the Class A or Class B Common Stock as set forth in the Articles of Organization of the Company, (c) other amendments of the Articles of Organization of the Company, (d) certain mergers or consolidations with, or acquisitions of, other entities, and (e) sales or dispositions of any significant portion of the Company’s assets.
Class B Common Stock
The Class B Common Stock has full voting rights, including the right to (1) elect a majority of the members of the Company’s Board of Directors and (2) approve all (a) amendments to the Company’s Articles of Organization, (b) mergers or consolidations with, or acquisitions of, other entities, (c) sales or dispositions of any significant portion of the Company’s assets, and (d) equity-based and other executive compensation and other significant corporate matters. The Company’s Class B Common Stock is not listed for trading. Each share of Class B Common Stock is freely convertible into one share of Class A Common Stock, upon request of any Class B holder, and participates equally in earnings.
All distributions with respect to the Company’s capital stock are restricted by the Company’s credit agreement, with the exception of distributions of capital stock from subsidiaries to The Boston Beer Company, Inc. and Boston Beer Corporation, repurchase from former employees of non-vested investment shares of Class A Common Stock issued under the Company’s equity incentive plan, redemption of certain shares of Class A Common Stock as approved by the Board of Directors and payment of cash dividends to its holders of common stock.
Employee Stock Compensation Plan
The Company’s Employee Equity Incentive Plan (the “Equity Plan”) currently provides for the grant of discretionary options, restricted stock awards and restricted stock units to employees, and provides for shares to be sold to employees of the Company at a discounted purchase price under its investment share program. The Equity Plan is administered by the Board of Directors of the Company, based on recommendations received from the Compensation Committee of the Board of Directors. The Compensation Committee consists of three independent directors. In determining the quantities and types of awards for grant, the Compensation Committee periodically reviews the objectives of the Company’s compensation system and takes into account the position and responsibilities of the employee being considered, the nature and value to the Company of his or her service and accomplishments, his or her present and potential contributions to the success of the Company, the value of the type of awards to the employee and such other factors as the Compensation Committee deems relevant.
Stock options and related vesting requirements and terms are granted at the Board of Directors’ discretion, but generally vest ratably over three to five-year periods and, with respect to certain options granted to members of senior management, based on the Company’s performance. Generally, the maximum contractual term of stock options is ten years, although the Board of Directors may grant options that exceed the ten-year term. During fiscal years 2024, 2023, and 2022, the Company granted options to purchase 21,205 shares, 58,054 shares, and 17,114 shares, respectively, of its Class A Common Stock to employees at market value on the grant dates. All of the 2024 stock option grants were service-based awards and none contain any performance conditions.
During fiscal years 2024, 2023, and 2022, the Company granted 74,262 shares, 53,884 shares, and 32,744 shares, respectively, of restricted stock units to certain senior managers and key employees. 39,308 of the 2024 restricted stock unit grants were service-based while 34,954 were performance-based.
The Equity Plan also has an investment share program which permits employees who have been with the Company for at least one year to purchase shares of Class A Common Stock at a discount from current market value of 0% to 40%, based on the employee’s tenure with the Company. Investment shares vest ratably over service periods of five years. Participants may pay for these shares either up front or through payroll deductions over an eleven-month period during the year of purchase. During fiscal years 2024, 2023, and 2022, employees elected to purchase an aggregate of 12,007 investment shares, 10,594 investment shares, and 10,845 investment shares, respectively.
The Company has reserved 6.7 million shares of Class A Common Stock for issuance pursuant to the Equity Plan, of which 0.8 million shares were available for grant as of December 28, 2024. Shares reserved for issuance under cancelled employee stock options and forfeited restricted stock are returned to the reserve under the Equity Plan for future grants or purchases. The Company also purchases unvested investment shares from employees who have left the Company at the lesser of (i) the price paid for the shares when the employee acquired the shares or (ii) the fair market value of the shares as of the date next preceding the date on which the shares are called for redemption by the Company. These shares are also returned to the reserve under the Equity Plan for future grants or purchases.
Non-Employee Director Plan
The Company has a stock option and restricted stock unit plan for non-employee directors of the Company (the “Non-Employee Director Plan”), pursuant to which each non-employee director of the Company is granted a combination of options to purchase shares of the Company’s Class A Common Stock and restricted stock units upon election or re-election to the Board of Directors. Stock options issued to non-employee directors vest upon grant and have a maximum contractual term of ten years. Restricted stock units granted to non-employee directors vest over a 1-year service period, During fiscal years 2024, 2023, and 2022 the Company granted options to purchase an aggregate of 4,430 shares, 2,941 shares, and 3,810 shares of the Company’s Class A Common Stock to non-employee directors, respectively. During fiscal year 2024 and 2023 1,997 and 1,442 respectively, of restricted stock units were granted to non-employee directors. No restricted stock units were granted to non-employee directors during fiscal years 2022.
The Company has reserved 0.6 million shares of Class A Common Stock for issuance pursuant to the Non-Employee Director Plan, of which 0.1 million shares were available for grant as of December 28, 2024. Shares under any cancelled non-employee directors’ restricted stock units or stock options or options that expire unexercised are returned to the reserve under the Non-Employee Director Plan for future grants.
Option Activity
Information related to stock options under the Equity Plan and the Non-Employee Director Plan is summarized as follows:
| | | | | | | | | | | | | | | | |
| | Shares | | | Weighted-
Average
Exercise Price | | | Weighted-
Average
Remaining
Contractual
Term in Years | | | Aggregate
Intrinsic
Value
(in thousands) | |
Outstanding at December 30, 2023 | | | 207,810 | | | $ | 361.53 | | | | | | | |
Granted | | | 25,635 | | | | 299.57 | | | | | | | |
Exercised | | | (8,164 | ) | | | 203.68 | | | | | | | |
Cancelled/Forfeited | | | (15,487 | ) | | | 383.46 | | | | | | | |
Expired | | | - | | | | - | | | | | | | |
Outstanding at December 28, 2024 | | | 209,794 | | | $ | 358.48 | | | | 4.93 | | | $ | 5,913 | |
Exercisable at December 28, 2024 | | | 126,930 | | | $ | 328.56 | | | | 3.91 | | | $ | 5,611 | |
Vested and expected to vest at December 28, 2024 | | | 200,272 | | | $ | 360.37 | | | | 4.77 | | | $ | 5,865 | |
Of the total options outstanding at December 28, 2024, 6,348 shares were performance-based options for which the performance criteria had yet to be achieved.
Weighted average assumptions used to estimate fair values of stock options on the date of grants for fiscal 2024, 2023, and 2022 was as follows:
| | | | | | | | | | | | |
| | 2024 | | | 2023 | | | 2022 | |
Expected volatility | | | 40.0 | % | | | 39.7 | % | | | 38.0 | % |
Risk-free interest rate | | | 4.23 | % | | | 3.96 | % | | | 2.11 | % |
Expected dividends | | | 0 | % | | | 0 | % | | | 0 | % |
Exercise factor | | 2.1 times | | | 2.3 times | | | 3.0 times | |
Discount for post-vesting restrictions | | | 0.0 | % | | | 0.0 | % | | | 0.0 | % |
Expected volatility is based on the Company’s historical realized volatility. The risk-free interest rate represents the implied yields available from the U.S. Treasury zero-coupon yield curve over the contractual term of the option when using the trinomial option-pricing model. Expected dividend yield is 0% because the Company has not paid dividends in the past and currently has no known intention to do so in the future. Exercise factor and discount for post-vesting restrictions are based on the Company’s historical experience.
Options to purchase 40,468 shares vested during fiscal year 2024. The total fair value of options vested during fiscal years 2024 was $6.5 million. The aggregate intrinsic value of stock options exercised during fiscal years 2024, 2023, and 2022 was $0.7 million, $6.6 million, and $6.9 million, respectively.
Non-Vested Shares Activity
The following table summarizes vesting activities of shares issued under the investment share program and restricted stock awards:
| | | | | | | | |
| | Number of Shares | | | Weighted Average Fair Value | |
Non-vested at December 30, 2023 | | | 114,797 | | | $ | 373.56 | |
Granted | | | 88,266 | | | | 290.71 | |
Vested | | | (32,823 | ) | | | 381.95 | |
Forfeited | | | (5,689 | ) | | | 331.93 | |
Non-vested at December 28, 2024 | | | 164,551 | | | $ | 328.88 | |
The fair value of restricted stock awards is based on the Company’s traded stock price on the date of the grants. Fair value of investment shares is calculated using the trinomial option-pricing model.
32,823 shares vested in 2024 with a weighted average fair value of $381.95, 27,640 shares vested in 2023 with a weighted average fair value of $341.57, and 32,476 shares vested in 2022 with a weighted average fair value of $292.27.
Stock-Based Compensation
The following table provides information regarding stock-based compensation expense included in operating expenses in the accompanying consolidated statements of comprehensive income:
| | | | | | | | | | | | |
| | 2024 | | | 2023 | | | 2022 | |
| | (in thousands) | |
Amounts included in general and administrative
expenses | | $ | 11,835 | | | $ | 10,370 | | | $ | 8,804 | |
Amounts included in advertising, promotional, and
selling expenses | | | 7,119 | | | | 6,601 | | | | 5,184 | |
Total stock-based compensation expense | | $ | 18,954 | | | $ | 16,971 | | | $ | 13,988 | |
Amounts related to performance-based stock awards
included in total stock-based compensation expense | | $ | 2,720 | | | $ | 2,518 | | | $ | 1,198 | |
The Company uses the straight-line attribution method in recognizing stock-based compensation expense for awards that vest based on service conditions. For awards that vest subject to performance conditions, compensation expense is recognized ratably for each tranche of the award over the performance period if it is probable that performance conditions will be met.
The Company recognizes compensation expense, less estimated forfeitures. For Equity Plan awards during fiscal year 2024, the estimated forfeiture rate was 16.0% for stock options and 13.0% for restricted stock units and investment shares. For Equity Plan awards during fiscal year 2023, the estimated forfeiture rate was 20.0% for stock options and 12.0% for restricted stock units and investment shares. For Equity Plan awards during fiscal year 2022, the estimated forfeiture rate was 19.0% for all types of awards. The estimated forfeiture rates used are based upon historical experience with the various award types and the Company annually reviews these rates to ensure proper projection of future forfeitures.
Based on equity awards outstanding as of December 28, 2024, there is $54.1 million of unrecognized compensation costs, net of estimated forfeitures, related to unvested share-based compensation arrangements that are expected to vest. Such costs are expected to be recognized over a weighted-average period of 2.1 years.
Stock Repurchase Program
In 1998, the Company began a share repurchase program. Under this program, the Company's Board of Directors has authorized the repurchase of the Company's Class A Stock. On October 2, 2024, the Board of Directors authorized an increase in the aggregate expenditure limit for the Company’s stock repurchase program by $400.0 million, increasing the limit from $1.2 billion to $1.6 billion. The Board of Directors did not specify a date upon which the total authorization would expire and, in the future, can further increase the authorized amount. Share repurchases under this program for the periods included herein were effected through open market transactions
During fiscal year 2024, the Company repurchased and subsequently retired 803,281 shares of its Class A Common Stock for an aggregate purchase price of $238.9 million. As of December 28, 2024, the Company had repurchased a cumulative total of approximately 14.9 million shares of its Class A Common Stock for an aggregate purchase price of approximately $1.17 billion and had approximately $427.5 million remaining on the $1.6 billion stock repurchase expenditure limit set by the Board of Directors.
P. Employee Retirement Plans and Post-Retirement Medical Benefits
The Company’s workforce comprises mostly of non-union employees who are employed by Boston Beer Corporation, American Craft Brewery LLC, or Angry Orchard Cider Company, LLC. As of December 28, 2024, the Company had three unions at its Cincinnati Brewery: Local 1, Local 20, and Teamsters Local Union. No. 1199 (“Local Union 1199”). The Company has different retirement and post-retirement plans available to each group of employees. The Boston Beer Company 401(k) Plan (the “Boston Beer 401(k) Plan”) covers most non-union employees and all members of Local 1 and Local Union 1199. The Samuel Adams Cincinnati Brewery 401(k) Plan for Represented Employees (the “SACB 401(k) Plan”) covers members of Local 20. The Company additionally provides a supplement to eligible retirees from Local 1, Local 20, and Local Union 1199 to assist with the cost of Medicare gap coverage after their retirement on account of age or permanent disability (collectively, the “Retiree Medical Plan”). The Company previously offered a pension plan (the “Local 1199 Pension Plan”) to members of Local Union 1199 until the plan was terminated effective January 1, 2020.
Boston Beer 401(k) Plan
The Boston Beer 401(k) Plan, which was established by the Company in 1993, is a Company-sponsored defined contribution plan. Most non-union employees and all members of the Local 1 and Local 1199 unions are eligible to participate in the Plan immediately upon employment. Participants may make voluntary contributions up to 60% of their annual compensation, subject to IRS limitations. The Company matches each participant’s contribution. A maximum of 5% of compensation is taken into account in determining the amount of the match. In January 2020, the Company amended the Boston Beer 401(k) Plan to update the Company match as follows: 100% of the first 3% of the eligible compensation participants contribute. Thereafter, the Company matches 50% of the next 2% of the eligible compensation participants contribute. Beginning April 1, 2023, for Local 1 union members specifically, the Company match is 100% of the first 5% of the eligible contribution. The Company’s contributions to the Boston Beer 401(k) Plan amounted to $9.7 million, $8.8 million, and $7.6 million in fiscal years 2024, 2023, and 2022, respectively.
SACB 401(k) Plan
The “SACB 401(k) Plan”, which was established by the Company in 1997, is a Company-sponsored defined contribution plan. It is available to all members of Local 20 upon commencement of employment or, if later, attaining age 21. Participants may make voluntary contributions up to 60% of their annual compensation to the SACB 401(k) Plan, subject to IRS limitations. Company contributions for fiscal years 2024, 2023, and 2022 were insignificant.
Retiree Medical Plan
To qualify for this benefit, an eligible employee must have worked for at least 20 years for the Company or its predecessor at the Company’s Cincinnati Brewery as a part of one of its three unions, must have been enrolled in the Company’s group medical insurance plan for at least 5 years before retirement, and, in the case of retirees from Local 20, for at least 7 of the last 10 years of their employment, and must be eligible for Medicare benefits under the Social Security Act. The accumulated post-retirement benefit obligation was determined using a discount rate of 5.69% at December 28, 2024 and 5.03% at December 30, 2023 and a health care cost increase based on the Cincinnati Consumer Price Index of 3.0% and 2.5% for the years 2024 and 2023, respectively. The effect of a 1% increase and the effect of a 1% decrease in the assumed health care cost trend rates on the aggregate of the service and interest cost components of net periodic post-retirement health care benefit costs and on the accumulated post-retirement benefit obligation for health care benefits would not be significant.
In addition, the comprehensive medical plan offered to currently employed members of Local 20 remains available to them should they retire after reaching age 57, and before reaching age 65, with at least 20 years of service with the Company or its predecessor at the Company’s Cincinnati Brewery. These eligible retirees may choose to continue to be covered under the Company’s comprehensive group medical plan until they reach the age when they are eligible for Medicare health benefits under the Social Security Act or coverage under a comparable State health benefit plan. Eligible retirees pay 100% of the cost of the coverage.
The funded status of the Retiree Medical Plan is as follows at:
| | | | | | | | | |
| | | December 28,
2024 | | | December 30,
2023 | |
| | | |
Benefit obligation at end of period | | | $ | 798 | | | $ | 828 | |
Unfunded Status | | | $ | 798 | | | $ | 828 | |
Q. Net Income per Share
Net Income per Common Share - Basic
The following table sets forth the computation of basic net income per share using the two-class method:
| | | | | | | | | | | | |
| | December 28, | | | December 30, | | | December 31, | |
| | 2024 | | | 2023 | | | 2022 | |
| | (in thousands, except per share data) | |
Net Income | | $ | 59,695 | | | $ | 76,250 | | | $ | 67,263 | |
Allocation of net income for basic: | | | | | | | | | |
Class A Common Stock | | $ | 49,070 | | | $ | 63,216 | | | $ | 55,812 | |
Class B Common Stock | | | 10,485 | | | | 12,880 | | | | 11,293 | |
Unvested participating shares | | | 140 | | | | 154 | | | | 158 | |
| | $ | 59,695 | | | $ | 76,250 | | | $ | 67,263 | |
Weighted average number of shares for basic: | | | | | | | | | |
Class A Common Stock | | | 9,678 | | | | 10,150 | | | | 10,221 | |
Class B Common Stock | | | 2,068 | | | | 2,068 | | | | 2,068 | |
Unvested participating shares | | | 28 | | | | 25 | | | | 28 | |
| | | 11,774 | | | | 12,243 | | | | 12,317 | |
Net income per share for basic: | | | | | | | | | |
Class A Common Stock | | $ | 5.07 | | | $ | 6.23 | | | $ | 5.46 | |
Class B Common Stock | | $ | 5.07 | | | $ | 6.23 | | | $ | 5.46 | |
Net Income per Common Share - Diluted
The Company calculates diluted net income per share for common stock using the more dilutive of (1) the treasury stock method, or (2) the two-class method, which assumes the participating securities are not exercised or converted.
The following tables set forth the computation of diluted net income per share, assuming the conversion of all Class B Common Stock into Class A Common Stock:
| | | | | | | | | | | | |
| | Fiscal year ended December 28, 2024 | |
| | Earnings to
Common
Shareholders | | | Common
Shares | | | EPS | |
| | (in thousands, except per share data) | | | | |
As reported - basic | | $ | 49,070 | | | | 9,678 | | | $ | 5.07 | |
Add: effect of dilutive potential common shares | | | | | | | | | |
Share-based awards | | | — | | | | 20 | | | | |
Class B Common Stock | | | 10,485 | | | | 2,068 | | | | |
Net effect of unvested participating shares | | | — | | | | — | | | | |
Net income per common share - diluted | | $ | 59,555 | | | $ | 11,766 | | | $ | 5.06 | |
| | | | | | | | | | | | |
| | Fiscal year ended December 30, 2023 | |
| | Earnings to
Common
Shareholders | | | Common
Shares | | | EPS | |
| | (in thousands, except per share data) | | | | |
As reported - basic | | $ | 63,216 | | | | 10,150 | | | $ | 6.23 | |
Add: effect of dilutive potential common shares | | | | | | | | | |
Share-based awards | | | — | | | | 40 | | | | |
Class B Common Stock | | | 12,880 | | | | 2,068 | | | | |
Net effect of unvested participating shares | | | — | | | | — | | | | |
Net income per common share - diluted | | $ | 76,096 | | | | 12,258 | | | $ | 6.21 | |
| | | | | | | | | | | | |
| | Fiscal year ended December 31, 2022 | |
| | Earnings to
Common
Shareholders | | | Common
Shares | | | EPS | |
| | (in thousands, except per share data) | | | | |
As reported - basic | | $ | 55,812 | | | | 10,221 | | | $ | 5.46 | |
Add: effect of dilutive potential common shares | | | | | | | | | |
Share-based awards | | | — | | | | 56 | | | | |
Class B Common Stock | | | 11,293 | | | | 2,068 | | | | |
Net effect of unvested participating shares | | | 1 | | | | — | | | | |
Net income per common share - diluted | | $ | 67,106 | | | | 12,345 | | | $ | 5.44 | |
Basic net income per common share for each share of Class A Common Stock and Class B Common Stock is $5.07, $6.23, and $5.46 for the fiscal years 2024, 2023, and 2022, respectively, as each share of Class A and Class B participates equally in earnings. Shares of Class B are convertible at any time into shares of Class A on a one-for-one basis at the option of the stockholder.
Weighted average stock options to purchase approximately 142,000, 52,000, and 17,000 shares of Class A Common Stock were outstanding during fiscal years 2024, 2023, and 2022, respectively, but not included in computing diluted income per share because their effects were anti-dilutive. Additionally, approximately 52,000, 54,000, and 1,000 performance awards were outstanding during fiscal years 2024, 2023, and 2022, respectively, but not included in computing dilutive income per share because the performance criteria of these stock awards were not met at the respective fiscal year ends.
R. Accumulated Other Comprehensive Loss
Accumulated other comprehensive loss represents cumulative currency translation adjustments and amounts of unrecognized actuarial gains or losses related to the Company sponsored post-retirement medical plan, net of tax effect. Changes in accumulated other comprehensive loss represent currency translation adjustments due to exchange rate fluctuations in the period and actuarial losses or gains, net of tax effect, recognized as components of net periodic benefit costs. The components of the accumulated other comprehensive loss was as follows as of:
| | | | | | | | |
| | December 28, | | | December 30, | |
| | 2024 | | | 2023 | |
| | (in thousands) | |
Cumulative currency translation adjustments | | $ | (856 | ) | | $ | (141 | ) |
Deferred benefit costs, net of tax | | | 160 | | | | 84 | |
Total accumulated other comprehensive loss | | $ | (696 | ) | | $ | (57 | ) |
S. Valuation and Qualifying Accounts
The Company maintains reserves against accounts receivable for doubtful accounts and inventory for obsolete and slow-moving inventory. The Company also maintains reserves against accounts receivable for distributor promotional allowances. In addition, the Company maintains a reserve for estimated returns of stale beer, which is included in accrued expenses.
| | | | | | | | | | | | | | | | |
Allowance for Credit Losses | | Balance at
Beginning of
Period | | | Net Provision
(Recovery) | | | Amounts
Charged Against
Reserves | | | Balance at
End of Period | |
| | (In thousands) | |
2024 | | $ | 427 | | | $ | 26 | | | $ | (406 | ) | | $ | 47 | |
2023 | | $ | 418 | | | $ | 15 | | | $ | (6 | ) | | $ | 427 | |
2022 | | $ | 353 | | | $ | 326 | | | $ | (261 | ) | | $ | 418 | |
| | | | | | | | | | | | | | | | |
Discount Accrual | | Balance at
Beginning of
Period | | | Net Provision
(Recovery) | | | Amounts
Charged Against
Reserves | | | Balance at
End of Period | |
| | (In thousands) | |
2024 | | $ | 7,953 | | | $ | 61,037 | | | $ | (60,843 | ) | | $ | 8,147 | |
2023 | | $ | 8,179 | | | $ | 62,620 | | | $ | (62,846 | ) | | $ | 7,953 | |
2022 | | $ | 11,221 | | | $ | 54,825 | | | $ | (57,867 | ) | | $ | 8,179 | |
| | | | | | | | | | | | | | | | |
Inventory Obsolescence Reserve | | Balance at
Beginning of
Period | | | Net Provision
(Recovery) | | | Amounts
Charged Against
Reserves | | | Balance at
End of Period | |
| | (In thousands) | |
2024 | | $ | 7,640 | | | $ | 21,916 | | | $ | (13,241 | ) | | $ | 16,315 | |
2023 | | $ | 21,976 | | | $ | 19,328 | | | $ | (33,664 | ) | | $ | 7,640 | |
2022 | | $ | 43,055 | | | $ | 35,867 | | | $ | (56,946 | ) | | $ | 21,976 | |
| | | | | | | | | | | | | | | | |
Stale Beer Reserve | | Balance at
Beginning of
Period | | | Net Provision
(Recovery) | | | Amounts
Charged Against
Reserves | | | Balance at
End of Period | |
| | (In thousands) | |
2024 | | $ | 8,240 | | | $ | 5,311 | | | $ | (7,459 | ) | | $ | 6,092 | |
2023 | | $ | 5,580 | | | $ | 18,772 | | | $ | (16,112 | ) | | $ | 8,240 | |
2022 | | $ | 6,045 | | | $ | 19,589 | | | $ | (20,054 | ) | | $ | 5,580 | |
T. Licensing Agreements
Pepsi Licensing Agreement
On August 9, 2021, the Company signed a series of agreements with PepsiCo, Inc. (“Pepsi”) to develop, market, and sell alcohol beverages. Under the agreements, the Company is responsible for developing, manufacturing, and marketing a flavored malt beverage product under the HARD MTN DEW® brand. As part of the agreements, Pepsi provides certain proprietary ingredients and also licenses the Company the use of its HARD MTN DEW® trademark in connection with manufacturing, promoting, marketing, and distributing the developed product, primarily through the Pepsi distribution network.
During fiscal 2023 and the first half of 2024, distribution was primarily managed through the Pepsi distribution network per terms of the original agreements. Pursuant to these terms, the Company made payments to Pepsi for proprietary ingredients, freight costs to ship the product to Pepsi, and certain marketing services. The costs of the proprietary ingredients above fair market value are recorded within net revenue at the time revenue is recognized for the flavored malt beverages sold to Pepsi and were $0.2 and $2.0 million during fiscal 2024 and 2023, respectively. Freight costs and marketing costs are recorded in advertising, promotional, and selling expenses. The excess costs over fair market value of proprietary ingredients on hand at the end of the period are classified within prepaid expenses and other current assets. The excess over fair market value for inventory on hand was zero and $0.1 million as of December 28, 2024 and December 30, 2023, respectively. During fiscal 2024 and 2023, total net revenue recognized under these agreements amounted to approximately less than 1% and 2%, respectively, of the Company's total net revenues.
On February 24, 2024, the Company and Pepsi amended the terms of these agreements, most notably to change distribution from the Pepsi Distribution network to the Company’s distribution network. The transition of distributor networks began in May of 2024 and is extending into 2025. Under the agreements, the Company is responsible for developing, manufacturing, and marketing a flavored malt beverage product under Pepsi’s MTN DEW® brand. Pepsi provides certain proprietary ingredients and also licenses the Company the use of its HARD MTN DEW® trademark in connection with manufacturing, promoting, marketing, and distributing the developed product.
U. Segment Reporting
Operating segments are defined as components of an enterprise about which separate discrete information is available for evaluation by the chief operating decision maker, or decision making group, in deciding how to allocate resources in assessing performance. The Company has one operating segment and one reportable segment that produces and sells alcohol beverages under various brands. All brands are predominantly beverages that are manufactured using similar production processes, have comparable alcohol content, generally fall under the same regulatory environment, and are sold to the same types of customers in similar size quantities at similar price points, with similar profit margins, and through the same channels of distribution. The Company’s chief operating decision maker (“CODM”) is the chief executive officer.
The accounting policies of the segment are the same as those described in the summary of significant accounting policies. The CODM assesses performance for the segment based on net income, which is reported on the income statement as consolidated net income. The measure of segment assets is reported on the balance sheet as total consolidated assets.
The table below summarizes the Company’s measures of segment net income that the CODM considered in determining how to allocate resources and assess segment performance for the years ended December 28, 2024, December 30, 2023, and December 31, 2022:
| | | | | | | | | | | | |
| | Year Ended | |
| | December 28,
2024 | | | December 30,
2023 | | | December 31,
2022 | |
| | | | | | | | | |
Net revenue | | $ | 2,012,926 | | | $ | 2,008,625 | | | $ | 2,090,334 | |
Less: | | | | | | | | | |
Cost of goods sold | | | 1,119,194 | | | | 1,156,256 | | | | 1,228,348 | |
Salaries and benefits expenses | | | 254,589 | | | | 238,363 | | | | 219,491 | |
Advertising, promotional, and selling expenses (excluding salaries and benefits) | | | 402,221 | | | | 410,710 | | | | 447,085 | |
General and administrative expenses (excluding salaries and benefits) | | | 85,129 | | | | 81,473 | | | | 69,358 | |
Impairment of intangible assets | | | 42,584 | | | | 16,426 | | | | 27,100 | |
Impairment of brewery assets | | | 7,184 | | | | 5,396 | | | | 2,782 | |
Contract settlement costs | | | 26,052 | | | | — | | | | 5,379 | |
Interest income, net | | | (13,249 | ) | | | (10,995 | ) | | | (2,561 | ) |
Other expense, net | | | 1,620 | | | | 1,408 | | | | 1,916 | |
Income tax provision | | | 27,907 | | | | 33,338 | | | | 24,173 | |
Segment net income | | $ | 59,695 | | | $ | 76,250 | | | $ | 67,263 | |
| | | | | | | | | |
V. Related Party Transactions
The Company has entered into a lease with the Dogfish Head founders and other owners of buildings used in certain of the Company’s restaurant operations. The lease is for ten years with renewal options. The total payments due under the initial ten year term is $3.6 million. Total related party expense recognized was approximately $366,000, in fiscal 2024, 2023, and 2022, respectively. Other related party expenses and transactions totaled less than $0.1 million for fiscal 2024, 2023, and 2022.
W. Subsequent Events
The Company evaluated subsequent events occurring after the balance sheet date, December 28, 2024, through the issuance of these financial statements and concluded that there were no events of which management was aware that occurred that would require any adjustment to or disclosure in the accompanying consolidated financial statements.
Item 9. Changes in and Disagreements with Accountants on Accounting and Financial Disclosures
None.
Item 9A. Controls and Procedures
(a) Evaluation of disclosure controls and procedures
The Company’s management, including the Chief Executive Officer and the Chief Financial Officer, carried out an evaluation of the effectiveness of the Company’s disclosure controls and procedures (as such term is defined in Rules 13a-15(e) and 15d-15(e) under the Securities Exchange Act of 1934, as amended) as of the end of the period covered by this report. Based on this evaluation, the Company’s Chief Executive Officer and Chief Financial Officer concluded that the Company’s disclosure controls and procedures were effective in alerting them in a timely manner to material information required to be disclosed in the Company’s reports filed with or submitted to the SEC.
(b) Management’s Report on Internal Control Over Financial Reporting
The management of the Company is responsible for establishing and maintaining adequate internal control over financial reporting, as such term is defined in Exchange Act Rules 13a-15(f). The Company’s internal control system was designed to provide reasonable assurance to the Company’s management and Board of Directors regarding the preparation and fair presentation of published financial statements.
The Company’s management assessed the effectiveness of the Company’s internal control over financial reporting as of December 28, 2024. In making this assessment, the Company used the criteria set forth by the Committee of Sponsoring Organizations of the Treadway Commission (COSO) in Internal Control—Integrated Framework (2013 framework). Based on its assessment, the Company believes that, as of December 28, 2024, the Company’s internal control over financial reporting is effective based on those criteria.
The effectiveness of the Company’s internal control over financial reporting as of December 28, 2024 has been audited by Deloitte & Touche LLP, an independent registered public accounting firm, as stated in their report.
Because of its inherent limitations, internal control over financial reporting may not prevent or detect misstatements. Also, projections of any evaluation of effectiveness to future periods are subject to the risk that controls may become inadequate because of changes in conditions, or that the degree of compliance with the policies or procedures may deteriorate.
(c) Changes in internal control over financial reporting
No changes in the Company’s internal control over financial reporting occurred during the quarter ended December 28, 2024 that have materially affected, or are reasonably likely to materially affect, the Company’s internal control over financial reporting.
REPORT OF INDEPENDENT REGISTERED PUBLIC ACCOUNTING FIRM
To the stockholders and Board of Directors of The Boston Beer Company, Inc.
Opinion on Internal Control over Financial Reporting
We have audited the internal control over financial reporting of The Boston Beer Company, Inc. and subsidiaries (the “Company”) as of December 28, 2024, based on criteria established in Internal Control — Integrated Framework (2013) issued by the Committee of Sponsoring Organizations of the Treadway Commission (COSO). In our opinion, the Company maintained, in all material respects, effective internal control over financial reporting as of December 28, 2024, based on criteria established in Internal Control — Integrated Framework (2013) issued by COSO.
We have also audited, in accordance with the standards of the Public Company Accounting Oversight Board (United States) (PCAOB), the consolidated financial statements as of and for the year ended December 28, 2024, of the Company and our report dated February 25, 2025, expressed an unqualified opinion on those financial statements.
Basis for Opinion
The Company’s management is responsible for maintaining effective internal control over financial reporting and for its assessment of the effectiveness of internal control over financial reporting, included in the accompanying Management’s Report on Internal Control Over Financial Reporting. Our responsibility is to express an opinion on the Company’s internal control over financial reporting based on our audit. We are a public accounting firm registered with the PCAOB and are required to be independent with respect to the Company in accordance with the U.S. federal securities laws and the applicable rules and regulations of the Securities and Exchange Commission and the PCAOB.
We conducted our audit in accordance with the standards of the PCAOB. Those standards require that we plan and perform the audit to obtain reasonable assurance about whether effective internal control over financial reporting was maintained in all material respects. Our audit included obtaining an understanding of internal control over financial reporting, assessing the risk that a material weakness exists, testing and evaluating the design and operating effectiveness of internal control based on the assessed risk, and performing such other procedures as we considered necessary in the circumstances. We believe that our audit provides a reasonable basis for our opinion.
Definition and Limitations of Internal Control over Financial Reporting
A company’s internal control over financial reporting is a process designed to provide reasonable assurance regarding the reliability of financial reporting and the preparation of financial statements for external purposes in accordance with generally accepted accounting principles. A company’s internal control over financial reporting includes those policies and procedures that (1) pertain to the maintenance of records that, in reasonable detail, accurately and fairly reflect the transactions and dispositions of the assets of the company; (2) provide reasonable assurance that transactions are recorded as necessary to permit preparation of financial statements in accordance with generally accepted accounting principles, and that receipts and expenditures of the company are being made only in accordance with authorizations of management and directors of the company; and (3) provide reasonable assurance regarding prevention or timely detection of unauthorized acquisition, use, or disposition of the company’s assets that could have a material effect on the financial statements.
Because of its inherent limitations, internal control over financial reporting may not prevent or detect misstatements. Also, projections of any evaluation of effectiveness to future periods are subject to the risk that controls may become inadequate because of changes in conditions, or that the degree of compliance with the policies or procedures may deteriorate.
|
/s/ Deloitte & Touche LLP |
|
Boston, Massachusetts |
February 25, 2025 |
Item 9B. Other Information
Insider Trading Agreements
No trading plans were adopted or terminated during the thirteen weeks ended December 28, 2024 by an executive that is intended to satisfy the affirmative defense conditions of Securities Exchange Act Rule 10b5-1(c) or a non-Rule 10b501(c) trading agreement.
Item 9C. Disclosure Regarding Foreign Jurisdictions that Prevent Inspections
Not Applicable
PART III.
Item 10. Directors, Executive Officers and Corporate Governance
In December 2002, the Board of Directors of the Company adopted a (i) Code of Business Conduct and Ethics that applies to its Chief Executive Officer and its Chief Financial Officer, and (ii) Corporate Governance Guidelines. The Code of Business Conduct and Ethics was amended effective August 1, 2007 to provide for a third-party whistleblower hotline. These, as well as the charters of each of the Board Committees, are posted on the Company’s investor relations website, www.bostonbeer.com, and are available in print to any shareholder who requests them. Such requests should be directed to the Investor Relations Department, The Boston Beer Company, Inc., One Design Center Place, Suite 850, Boston, MA 02210. The Company intends to disclose any amendment to, or waiver from, a provision of its code of ethics that applies to the Company’s Chief Executive Officer or Chief Financial Officer and that relates to any element of the Code of Ethics definition enumerated in Item 406 of Regulation S-K by posting such information on the Company’s website.
The information required by Item 10 is hereby incorporated by reference from the registrant’s definitive Proxy Statement for the 2025 Annual Meeting to be held on May 14, 2025.
Item 11. Executive Compensation
The Information required by Item 11 is hereby incorporated by reference from the registrant’s definitive Proxy Statement for the 2025 Annual Meeting to be held on May 14, 2025.
Item 12. Security Ownership of Certain Beneficial Owners and Management and Related Stockholder Matters
Security Ownership
The information required by Item 12 with respect to security ownership of certain beneficial owners and management is hereby incorporated by reference from the registrant’s definitive Proxy Statement for the 2025 Annual Meeting to be held on May 14, 2025.
Related Stockholder Matters
EQUITY COMPENSATION PLAN INFORMATION
As of December 28, 2024:
| | | | | | | | | | | | |
Plan Category | | Number of
Securities to
be Issued Upon
Exercise of
Outstanding
Options,
Warrants and
Rights | | | Weighted-
Average
Exercise Price of
Outstanding
Options,
Warrants and
Rights | | | Number of
Securities
Remaining
Available
for Future
Issuance
Under Equity
Compensation
Plans | |
Equity Compensation Plans Approved by
Security Holders | | | 209,794 | | | $ | 358.48 | | | | — | |
Equity Compensation Plans Not Approved by
Security Holders | | N/A | | | N/A | | | N/A | |
| | | | | | | | | |
Total | | | 209,794 | | | $ | 358.48 | | | | — | |
Item 13. Certain Relationships and Related Transactions, and Director Independence
The information required by Item 13 is hereby incorporated by reference from the registrant’s definitive Proxy Statement for the 2025 Annual Meeting to be held on May 14, 2025.
Item 14. Principal Accountant Fees and Services
The information required by Item 14 is hereby incorporated by reference from the registrant’s definitive Proxy Statement for the 2025 Annual Meeting to be held on May 14, 2025.
PART IV.
Item 15. Exhibits and Financial Statement Schedules
(a) 1. Financial Statements.
The following financial statements are filed as a part of this report:
| | |
| | Page |
Report of Independent Registered Public Accounting Firm (PCAOB ID No. 34) | | 38 |
Consolidated Financial Statements: | | |
Consolidated Statements of Comprehensive Income for the years ended December 28, 2024, December 30, 2023, and December 31, 2022 | | 40 |
Consolidated Balance Sheets as of December 28, 2024 and December 30, 2023 | | 41 |
Consolidated Statements of Stockholders’ Equity for the years ended December 28, 2024, December 30, 2023, and December 31, 2022 | | 42 |
Consolidated Statements of Cash Flows for the years ended December 28, 2024, December 30, 2023, and December 31, 2022 | | 43 |
Notes to the Consolidated Financial Statements | | 44 |
(a) 2. Financial Statement Schedules.
All schedules for which provision is made in the applicable accounting regulation of the Securities and Exchange Commission have been omitted because they are inapplicable or the required information is shown in the consolidated financial statements, or notes thereto, included herein.
(b) Exhibits
The following is a list of exhibits filed as part of this Form 10-K:
| |
Exhibit No. | Title |
|
|
2.1 | Agreement and Plan of Merger, dated May 8, 2019, with Dogfish Head Holding Company, Canoe Acquisition Corp., and solely with respect to the indemnification obligations set forth in the Merger Agreement, Samuel A. Calagione III and Mariah D. Calagione (incorporated by reference to Exhibit 2.1 to the Company’s Form 8-K filed on May 9, 2019). |
|
|
2.2 | Membership Unit Purchase Agreement, dated May 8, 2019, by and among The Boston Beer Company, Inc., Dogfish East of the Mississippi LP, and solely with respect to indemnification obligations set forth therein, Samuel A. Calagione III and Mariah D. Calagione (incorporated by reference to Exhibit 2.2 to the Company’s Form 8-K filed on May 9, 2019). |
|
|
2.3 | Membership Unit Purchase Agreement, dated as of May 8, 2019, by and among The Boston Beer Company, Inc. and DFH Investors LLC (incorporated by reference to Exhibit 2.3 to the Company’s Form 8-K filed on May 9, 2019). |
|
|
3.1 | Amended and Restated By-Laws of the Company, dated June 2, 1998 (incorporated by reference to Exhibit 3.5 to the Company’s Form 10-Q filed on August 10, 1998). |
|
|
3.2 | Restated Articles of Organization of the Company, dated November 17, 1995, as amended August 4, 1998 (incorporated by reference to Exhibit 3.6 to the Company’s Form 10-Q filed on August 10, 1998). |
|
|
4.1 | Form of Class A Common Stock Certificate (incorporated by reference to Exhibit 4.1 to the Company’s Registration Statement No. 33-96164). (P) |
|
|
4.2 | Description of the Registrant’s Securities Registered Pursuant to Section 12 of the Securities Exchange Act of 1934 (incorporated by reference to Exhibit 4.1 to the Company’s Form 10-K filed on February 19, 2020) |
|
|
10.1 | Stockholder Rights Agreement, dated as of December 1995, among The Boston Beer Company, Inc. and the initial Stockholders (incorporated by reference to the Company’s Form 10-K, filed on April 1, 1996). (P) |
|
|
| |
+10.2 | Production Agreement between Samuel Adams Brewery Company, Ltd. and Brown-Forman Distillery Company, a division of Brown-Forman Corporation, effective as of April 11, 2005 (incorporated by reference to the Company’s 10-Q filed on May 5, 2005). |
|
|
+10.3 | Brewing Services Agreement between CBC Latrobe Acquisition, LLC and Boston Beer Corporation dated March 28, 2007 (incorporated by reference to the Company’s Quarterly Report on Form 10-Q filed on May 10, 2007). |
|
|
+10.4 | Office Lease Agreement between Boston Design Center LLC and Boston Beer Corporation dated March 24, 2006 (“Office Lease Agreement”), as amended on September 29, 2006, October 31, 2007, March 25, 2008, August 27, 2012, February 22, 2013, and June 3, 2015 (incorporated by reference to the Company’s Quarterly Report on Form 10-Q filed on May 11, 2006 and Annual Report on Form 10-K filed on February 18, 2016). |
| |
+10.5 | Seventh Amendment to Lease Agreement dated June 1, 2019. Certain information in this exhibit is confidential and has been excluded pursuant to applicable rules because it (i) is not material and (ii) would likely cause competitive harm if publicly disclosed (incorporated by reference to the Company's Annual Report on Form 10-K filed on February 17, 2021). |
|
|
**10.6 | The Boston Beer Company, Inc. Equity Plan for Non-Employee Directors, adopted on February 9, 2023 (incorporated by reference to Exhibit 10.1 to the Company’s Current Report on Form 8-K filed on February 10, 2023. |
| |
**10.7 | The Boston Beer Company, Inc. Employee Equity Incentive Plan, as amended on February 23, 1996, December 20, 1997, December 19, 2005, December 19, 2006, December 21, 2007, October 30, 2009, October 8, 2013, October 8, 2014, and December 9, 2015, December 20, 2017, and December 20, 2018 (incorporated by reference to the Company’s Current Report on Form 8-K filed on December 21, 2018). |
|
|
**10.8 | Offer Letter to David A. Burwick, Chief Executive Officer and President, dated January 23, 2018 (incorporated by reference to the Company’s Current Report on Form 8-K filed on February 16, 2018). |
|
|
**10.9 | Employment Agreement of Samuel A. Calagione III, dated July 3, 2019 (incorporated by reference to Exhibit 10.3 to the Company’s 10-Q filed on July 25, 2019) |
|
|
10.11 | Registration Rights Agreement with the Former Dogfish Head Stockholders, dated July 3, 2019 (incorporated by reference to Exhibit 10.1 to the Company’s 10-Q filed on July 25, 2019). |
|
|
**10.12 | Indemnification Agreement with the Dogfish Head Founders, dated July 3, 2019 (incorporated by reference to Exhibit 10.2 to the Company’s 10-Q filed on July 25, 2019). |
| |
10.13 | Third Amended and Restated Credit Agreement by and among The Boston Beer Company, Inc., Boston Beer Corporation, American Craft Brewery LLC, and Bank of America, N.A., dated December 16, 2022 (incorporated by reference to the Company’s Current Report on Form 8-K filed on December 22, 2022). |
| |
10.14 | Offer Letter to Lesya Lysyj, Chief Marketing Officer, dated March 21, 2019 (incorporated by reference to Exhibit 10.5 to the Company's 10-Q filed on July 25, 2019). |
| |
10.15 | Offer Letter to Carolyn O'Boyle, Chief People Officer, dated February 7, 2020 (incorporated by reference to Exhibit 10.6 to the Company's 10-Q filed on July 27, 2020). |
| |
10.16 | Offer Letter to Diego Reynoso, Chief Financial Officer, dated July 21, 2023 (incorporated by reference to exhibit 10.1 to a Current Report on Form 8-K filed by the Company on July 24, 2023) |
| |
10.17 | Offer Letter to Michael Spillane, Chief Executive Officer dated February 23, 2024 (incorporated by reference to Exhibit 10.1 of the Company's Current Report on Form 8-K filed on February 24, 2024.) |
| |
*10.18 | Offer Letter to Michael Crowley, Chief Sales Officer, dated August 15, 2023 |
| |
*19.1 | Insider Trading Policy of The Boston Beer Company, Inc., adopted on March 1, 2015 and amended on February 9, 2023. |
| |
*21.1 | List of subsidiaries of The Boston Beer Company, Inc. effective as of December 28, 2024. |
|
|
*23.1 | Consent of Deloitte & Touche LLP, an Independent Registered Public Accounting Firm. |
|
|
* Filed with this report.
+ Portions of this Exhibit were omitted pursuant to an application for an order declaring confidential treatment filed with and approved by the Securities and Exchange Commission.
** Indicates management contract or compensatory plan or arrangement.
Item 16. Form 10-K Summary
Not Applicable
SIGNATURES
Pursuant to the requirements of Section 13 or 15(d) of the Securities and Exchange Act of 1934, the registrant has duly caused this report to be signed on its behalf by the undersigned, thereunto duly authorized, on this 25th day of February 2025.
| | |
| | THE BOSTON BEER COMPANY, INC. |
| |
|
| | /s/ Michael Spillane
|
| | Michael Spillane |
| | President and Chief Executive Officer (principal executive officer) |
Pursuant to the requirements of the Securities and Exchange Act of 1934, the following persons on behalf of the registrant and in the capacities and on the dates indicated have signed this report below.
| | | |
Signature | | Title | Date |
| |
| |
/s/ Michael Spillane
Michael Spillane | | President, Chief Executive Officer (principal executive officer) and Director | February 25, 2025 |
| |
| |
/s/ Diego Reynoso
Diego Reynoso | | Chief Financial Officer (principal financial officer) | February 25, 2025 |
| |
| |
/s/ Matthew D. Murphy
Matthew D. Murphy | | VP Finance and Chief Accounting Officer (principal accounting officer) | February 25, 2025 |
| |
| |
/s/ Samuel A. Calagione III
Samuel A. Calagione III | | Brewer and Director | February 25, 2025 |
| |
| |
/s/ Cynthia A. Fisher
Cynthia A. Fisher | | Director | February 25, 2025 |
| |
| |
/s/ Meghan V. Joyce
Meghan V. Joyce | | Director | February 25, 2025 |
| |
| |
/s/ C. James Koch
C. James Koch | | Chairman and Director | February 25, 2025 |
| |
| |
/s/ Julio N. Nemeth
Julio N. Nemeth | | Director | February 25, 2025 |
/s/ Joseph H. Jordan
Joseph H. Jordan | | Director | February 25, 2025 |
/s/ Christopher I. Stone
Christopher I. Stone | | Director | February 25, 2025 |
| | | |
/s/ Cynthia L. Swanson
Cynthia L. Swanson | | Director | February 25, 2025 |
| |
| |
/s/ Jean-Michel Valette
Jean-Michel Valette | | Director | February 25, 2025 |