Use these links to rapidly review the document
TABLE OF CONTENTS
U.S. Securities and Exchange Commission
Washington, D.C. 20549
Form 40-F
o REGISTRATION STATEMENT PURSUANT TO SECTION 12 OF THE SECURITIES EXCHANGE ACT OF 1934
OR
ý ANNUAL REPORT PURSUANT TO SECTION 13(a) OR 15 (d) OF THE SECURITIES EXCHANGE ACT OF 1934
For the fiscal year ended December 31, 2002 Commission File Number 1-8887
TRANSCANADA PIPELINES LIMITED
(Exact Name of Registrant as specified in its charter)
Canada
(Jurisdiction of incorporation or organization)
4922, 4923, 4924, 5172
(Primary Standard Industrial Classification Code Number (if applicable))
Not Applicable
(I.R.S. Employer Identification Number (if applicable))
TransCanada Tower, 450 – 1 Street S.W.
Calgary, Alberta, Canada, T2P 5H1
(403) 920-2000
(Address and telephone number of Registrant’s principal executive offices)
CT Corporation, Suite 2610, 520 Pike Street
Seattle, Washington, 98101; (206) 622-4511; 1-800-456-4511
(Name, address (including zip code) and telephone number (including area code)
of agent for service in the United States)
Securities registered pursuant to section 12(b) of the Act:
Title of each class |
| Name of each exchange on which registered |
Common Shares (including Rights under Shareholder Rights Plan) |
| New York Stock Exchange |
Securities registered pursuant to Section 12(g) of the Act: None
Securities for which there is a reporting obligation pursuant to Section 15(d) of the Act: None
For annual reports, indicate by check mark the information filed with this Form:
ý Annual Information Form ý Audited annual financial statements
Indicate the number of outstanding shares of each of the issuer’s classes of capital or common stock as of the close of the period covered by the annual report.
At December 31, 2002, 479,502,341 TransCanada common shares
were issued and outstanding
Indicate by check mark whether the Registrant by filing the information contained in this Form is also thereby furnishing the information to the Commission pursuant to Rule 12g3-2(b) under the Securities Exchange Act of 1934 (the “Exchange Act”). If “Yes” is marked, indicate the file number assigned to the Registrant in connection with such Rule.
Yes o No ý
Indicate by check mark whether the Registrant (1) has filed all reports required to be filed by Section 13 or 15(d) of the Exchange Act during the preceding 12 months (or such shorter period that the Registrant was required to file such reports) and (2) has been subject to such filing requirements for the past 90 days.
Yes ý No o
The documents (or portions thereof) forming part of this Form 40-F are incorporated by reference into the following registration statements under the Securities Act of 1933, as amended:
Form |
| Registration No. |
|
|
|
|
|
S-8 |
| 33-00958 |
|
S-8 |
| 333-5916 |
|
S-8 |
| 333-8470 |
|
S-8 |
| 333-9130 |
|
F-3 |
| 33-13564 |
|
F-3 |
| 333-6132 |
|
F-10 |
| 333-101140 |
|
CONSOLIDATED AUDITED ANNUAL FINANCIAL STATEMENTS AND
MANAGEMENT’S DISCUSSION & ANALYSIS
A. Audited Annual Financial Statements
For consolidated audited financial statements, including the report of independent chartered accountants with respect thereto, see pages 44 through 77 of the TransCanada 2002 Annual Report to Shareholders included herein. See Note 20 of the Notes to Consolidated Financial Statements on pages 72 through 77 of the TransCanada 2002 Annual Report to Shareholders, reconciling the important differences between Canadian and United States generally accepted accounting principles.
B. Management’s Discussion & Analysis
For management’s discussion and analysis, see pages 7 through 42 of the TransCanada 2002 Annual Report to Shareholders included herein under the heading “Management’s Discussion & Analysis”.
For the purposes of this Report, only pages 7 through 42 and 44 through 77 of the TransCanada 2002 Annual Report to Shareholders as referred to above shall be deemed incorporated herein by reference and filed, and the balance of such 2002 Annual Report, except as otherwise specifically incorporated by reference in the TransCanada Annual Information Form, shall be deemed not filed with the Securities and Exchange Commission as part of this Report under the Exchange Act.
UNDERTAKING
Registrant undertakes to make available, in person or by telephone, representatives to respond to inquiries made by the Commission staff, and to furnish promptly, when requested to do so by the Commission staff, information relating to: the securities registered pursuant to Form 40-F; the securities in relation to which the obligation to file an Annual Report on Form 40-F arises; or transactions in said securities.
CONTROLS AND PROCEDURES
The conclusions of TransCanada's management with respect to the effectiveness of TransCanada's disclosure controls and procedures are contained on pages 37 and 38 of the TransCanada 2002 Annual Report to Shareholders.
FORWARD-LOOKING INFORMATION
Certain of the information included herein is forward-looking and relates to, among other things, anticipated financial performance, business prospects, strategies, regulatory decisions, new services, market forces, commitments and technological developments. Much of this information appears in the Management’s Discussion and Analysis at pages 7 through 42 of TransCanada’s Annual Report to Shareholders for the year ended December 31, 2002 incorporated herein by reference. By its nature, such forward-looking information is subject to various risks and uncertainties, including those discussed herein, which could cause TransCanada’s actual results and experience to differ materially from the anticipated results or other expectations expressed. Readers are cautioned not to place undue reliance on this forward-looking information, which is as of the date hereof, and TransCanada undertakes no obligation to update publicly or revise any forward-looking information, whether as a result of new information, future events or otherwise. Factors which could cause actual results or events to differ materially from current expectations include, among other things, the ability of TransCanada to successfully implement its strategic initiatives and whether such strategic initiatives will yield the expected benefits, the availability and price of energy commodities, regulatory decisions, competitive factors in the pipeline and power industry sectors, and the current economic conditions in North America.
2
SIGNATURES
Pursuant to the requirements of the Exchange Act, the Registrant certifies that it meets all of the requirements for filing on Form 40-F and has duly caused this Annual Report to be signed on its behalf by the undersigned, thereto duly authorized, in the City of Calgary, Province of Alberta, Canada.
| TRANSCANADA PIPELINES LIMITED | ||
|
|
| |
|
|
| |
| Per: | “Russell K. Girling” |
|
|
| RUSSELL K. GIRLING, Executive Vice-President, | |
|
|
| |
|
| Date: March 25, 2003 | |
|
|
| |
3
Certificate Pursuant to Section 302
Of the Sarbanes-Oxley Act
I, Harold N. Kvisle, certify that:
1. I, Harold N. Kvisle have reviewed this annual report on Form 40-F of TransCanada PipeLines Limited;
2. Based on my knowledge, this annual report does not contain any untrue statement of a material fact or omit to state a material fact necessary to make the statements made, in light of the circumstances under which such statements were made, not misleading with respect to the period covered by this annual report;
3. Based on my knowledge, the financial statements, and other financial information included in this annual report, fairly present in all material respects the financial condition, results of operations and cash flows of the registrant as of, and for, the periods presented in this annual report;
4. The registrant’s other certifying officers and I are responsible for establishing and maintaining disclosure controls and procedures (as defined in Exchange Act Rules 13a-14 and 15d-14) for the registrant and we have:
a) designed such disclosure controls and procedures to ensure that material information relating to the registrant, including its consolidated subsidiaries, is made known to us by others within those entities, particularly during the period in which this annual report is being prepared;
b) evaluated the effectiveness of the registrant’s disclosure controls and procedures as of a date within 90 days prior to the filing date of this annual report (the “Evaluation Date”); and
c) presented in this annual report our conclusions about the effectiveness of the disclosure controls and procedures based on our evaluation as of the Evaluation Date;
5. The registrant’s other certifying officers and I have disclosed, based on our most recent evaluation, to the registrant’s auditors and the audit committee of registrant’s board of directors (or persons performing the equivalent function):
a) all significant deficiencies in the design or operation of internal controls which could adversely affect the registrant’s ability to record, process, summarize and report financial data and have identified for the registrant’s auditors any material weaknesses in internal controls; and
b) any fraud, whether or not material, that involves management or other employees who have a significant role in the registrant’s internal controls; and
6. The registrant’s other certifying officers and I have indicated in this annual report whether there were significant changes in internal controls or in other factors that could significantly affect internal controls subsequent to the date of our most recent evaluation, including any corrective actions with regard to significant deficiencies and material weaknesses.
Dated March 25, 2003 |
| |
|
| |
|
| |
| / s / Harold N. Kvisle |
|
| Harold N. Kvisle | |
| President and Chief Executive Officer | |
4
Certificate Pursuant to Section 302
Of the Sarbanes-Oxley Act
I, Russell K. Girling, certify that:
1. I, Russell K. Girling have reviewed this annual report on Form 40-F of TransCanada PipeLines Limited;
2. Based on my knowledge, this annual report does not contain any untrue statement of a material fact or omit to state a material fact necessary to make the statements made, in light of the circumstances under which such statements were made, not misleading with respect to the period covered by this annual report;
3. Based on my knowledge, the financial statements, and other financial information included in this annual report, fairly present in all material respects the financial condition, results of operations and cash flows of the registrant as of, and for, the periods presented in this annual report;
4. The registrant’s other certifying officers and I are responsible for establishing and maintaining disclosure controls and procedures (as defined in Exchange Act Rules 13a-14 and 15d-14) for the registrant and we have:
(a) designed such disclosure controls and procedures to ensure that material information relating to the registrant, including its consolidated subsidiaries, is made known to us by others within those entities, particularly during the period in which this annual report is being prepared;
(b) evaluated the effectiveness of the registrant’s disclosure controls and procedures as of a date within 90 days prior to the filing date of this annual report (the “Evaluation Date”); and
(c) presented in this annual report our conclusions about the effectiveness of the disclosure controls and procedures based on our evaluation as of the Evaluation Date;
5. The registrant’s other certifying officers and I have disclosed, based on our most recent evaluation, to the registrant’s auditors and the audit committee of registrant’s board of directors (or persons performing the equivalent function):
(a) all significant deficiencies in the design or operation of internal controls which could adversely affect the registrant’s ability to record, process, summarize and report financial data and have identified for the registrant’s auditors any material weaknesses in internal controls; and
(b) any fraud, whether or not material, that involves management or other employees who have a significant role in the registrant’s internal controls; and
6. The registrant’s other certifying officers and I have indicated in this annual report whether there were significant changes in internal controls or in other factors that could significantly affect internal controls subsequent to the date of our most recent evaluation, including any corrective actions with regard to significant deficiencies and material weaknesses.
Dated March 25, 2003 |
| |
|
| |
|
| |
| / s / Russell K. Girling |
|
| Russell K. Girling | |
| Executive Vice-President, Corporate Development | |
5
DOCUMENTS FILED AS PART OF THIS REPORT
1. TransCanada PipeLines Limited Renewal Annual Information Form for the year ended December 31, 2002.
2. Management's Discussion and Analysis (included on pages 7 through 42 of the TransCanada 2002 Annual Report to Shareholders).
3. 2002 Consolidated Audited Financial Statements (included on pages 44 through 77 of the TransCanada 2002 Annual Report to Shareholders).
4. U.S. GAAP reconciliation of the 2002 Consolidated Audited Financial Statements (included on pages 72 through 77 of the TransCanada 2002 Annual Report to Shareholders).
EXHIBITS
1. Consent of KPMG, LLP Chartered Accountants.
2. Certification of Chief Executive Officer under Section 906 of Sarbanes-Oxley.
3. Certification of Chief Financial Officer under Section 906 of Sarbanes-Oxley.
6

TRANSCANADA PIPELINES LIMITED
RENEWAL
ANNUAL INFORMATION FORM
for the year ended December 31, 2002
February 25, 2003
Unless otherwise noted, the information contained in this Annual Information Form is given as at December 31, 2002 (the "Year End").
TRANSCANADA PIPELINES LIMITED i
For the reference information noted below, please refer to Schedule "A".
- •
- Exchange Rate of the Canadian Dollar
- •
- Metric Conversion Table
- •
- Glossary
Certain written and oral statements made or incorporated by reference from time to time by TransCanada or its representatives in this Annual Information Form and other reports and filings made with the securities regulatory authorities, press releases, conferences or otherwise, are forward-looking and relate to, among other things, anticipated financial performance, business prospects, strategies, regulatory developments, new services, market forces, commitments and technological developments. Much of this information also appears in the Management's Discussion and Analysis of Financial Condition and Results of Operations ("MD&A") found in TransCanada's Annual Report to Shareholders for the year ended December 31, 2002 (the "Annual Report"), which is incorporated by reference into this document. By its nature, such forward-looking information is subject to various risks and uncertainties, including those discussed herein, which could cause TransCanada's actual results and experience to differ materially from the anticipated results or other expectations expressed. Readers are cautioned not to place undue reliance on this forward-looking information, which is as of the date of this Annual Information Form, and TransCanada undertakes no obligation to update publicly or revise any forward-looking information, whether as a result of new information, future events or otherwise.
A number of factors, including but not limited to those discussed in this section, could cause actual results or events to differ materially from current expectations. Please note that capitalized terms in this section are defined later in the document and can also be found in the Glossary in Schedule "A".
TransCanada's businesses are highly complex and are dispersed over tens of thousands of square kilometres, often in remote locations. Pipeline and power facilities are subject to operational risks, including mechanical failure, physical degradation, operator error, manufacturer defects, labor disputes, sabotage, terrorism, failure of supply, catastrophic events and natural disasters. The occurrence or continuation of such events could increase TransCanada's costs and reduce its ability to transport natural gas or deliver power.
TransCanada's power business and investments rely on feedstocks of natural gas, biomass, water, coal and (as of February 2003) uranium. Failure of supplies of feedstocks could affect TransCanada's ability to generate electricity and fulfill its supply obligations, and changes in prices of feedstocks could affect TransCanada's financial results. Although TransCanada hedges against most of these risks, there can be no assurance that such hedging will be adequate in all circumstances.
TransCanada does not operate the Bruce Power facility or the assets underlying the Sundance A or Sundance B power purchase arrangements. Failure by the operators of these facilities to operate at the cost or in the manner projected by TransCanada could negatively affect TransCanada's financial position.
TransCanada does not own any of the power transmission lines over which its electricity is transmitted and delivered. Any disruption in transmission could affect TransCanada's ability to deliver electricity and could have an adverse impact on TransCanada's financial results.
ii TRANSCANADA PIPELINES LIMITED
The Canadian Mainline, the Alberta System, the BC System and the Foothills System transport natural gas from the Western Canada Sedimentary Basin. Continuing use of these systems is dependent on a number of factors including the level of exploration and development within the basin, the price of natural gas, the ability of natural gas producers to deliver natural gas to the various pipeline systems, the development of northern gas reserves, and the regulatory environment for producers, transporters and consumers of natural gas.
Information on competition risks in TransCanada's natural gas transmission business can be found under the heading "Transmission — Competition in Transmission" below.
Information on competition risks in TransCanada's power business can be found under the heading "Power — Competition in Power" below.
TransCanada carries on its businesses with numerous counterparties with a wide range of creditworthiness. While processes are followed to address the creditworthiness of certain of these counterparties, the failure of any counterparty to meet its financial obligations could have an impact on TransCanada's financial position. Such failure could result from a number of factors beyond TransCanada's control, including (but not limited to) fluctuating commodity energy prices and interest rates, changes in regulatory and economic environments, political instability and legally reviewable activities.
Political and Regulatory Risks
TransCanada's businesses are subject to regulation by the jurisdictions in which they carry on business. The regulation of the natural gas transportation business and the power generation business have changed over the past ten years, and further changes could have a material impact on TransCanada's financial results. Such changes could result from changes in environmental laws, changes to the regulatory philosophies in Canada or the United States, changes to international tax treaties and jurisdictional issues among governments and governmental bodies.
TransCanada is subject to federal, state, provincial, municipal and other applicable environmental laws and regulations. Increasingly stringent environmental laws could result in increased costs and liabilities, which could impact TransCanada's financial results. In December 2002, the Canadian federal government ratified the Kyoto Protocol, which requires Canada to reduce its greenhouse gas emissions significantly. Although the Canadian government has not yet provided details on how it intends to meet these reduction targets, the energy industry has been identified as one of the areas that will be affected. Under the rules being proposed by the federal government, TransCanada will be considered a large industrial emitter. The final rules, once known, could affect TransCanada's operations and profitability.
TransCanada maintains customary insurance for its businesses, consistent with pipeline and power industry practices. Insurance coverage is always subject to limits and exclusions, and the financial stability of the insurance carriers. In the event of a significant insurable event, insurance proceeds may not be adequate to cover completely the costs of such event. In addition, certain environmental and other risks are excluded by law from insurance coverage.
TRANSCANADA PIPELINES LIMITED iii
Because TransCanada operates in Canada and the United States, its financial results can be impacted by interest rates and foreign exchange rates. TransCanada has an active hedging program in place to address interest and foreign exchange rate risks, but there can be no assurances that such hedging will be adequate to address the risks.
TransCanada's growth strategy is dependent upon the acquisition and construction of facilities and businesses that align with its current businesses. TransCanada may incur costs in the pursuit of acquisitions or development of power or transmission assets that may not be completed. Failure by TransCanada to consummate negotiated acquisitions or new developments may result in contractual liabilities, liquidated damages, additional costs and expenses which could affect profitability.
TransCanada's growth strategy is also dependent on access to capital markets in the United States and Canada. Although significant credit facilities are currently available, changing market conditions could result in a materially increased cost of capital which would reduce TransCanada's ability to pursue this strategy.
Since the terrorist attacks of September 11, 2001, certain energy assets (including the pipeline and power generation infrastructure in the United States) may be a target of future terrorist attacks. This risk has been heightened by the current situation in Iraq. Subsequent to the terrorist attacks of September 11, 2001, many insurers have reduced or eliminated insurance coverage for terrorist attacks. Terrorist attacks on TransCanada's assets or the assets of its customers or suppliers could have a negative impact on TransCanada's operations or financial results which may not be covered by insurance.
iv TRANSCANADA PIPELINES LIMITED
TransCanada PipeLines Limited ("TransCanada") is a Canadian public company. Significant dates and events are set forth below.
| Date | Event | |
|---|---|---|
| March 21, 1951 | Incorporated by Special Act of Parliament as Trans-Canada Pipe Lines Limited. | |
April 19, 1972 | Continued under theCanada Corporations Act by Letters Patent, which included the alteration of its capital and change of name to TransCanada PipeLines Limited. | |
June 1, 1979 | Continued under theCanada Business Corporations Act. Since then, TransCanada has had several amendments to its Articles with respect to its authorized share capital, and several restatements of its Articles to consolidate the various amendments to its Articles and for the creation of certain classes of preferred shares. | |
July 2, 1998 | Received a Certificate of Arrangement in connection with the Plan of Arrangement between TransCanada and NOVA Corporation ("NOVA") through which the companies merged and then split off the commodity chemicals business carried on by NOVA into a separate public company. | |
January 1, 1999 | Received a Certificate of Amalgamation reflecting TransCanada's vertical short form amalgamation with a wholly-owned subsidiary, Alberta Natural Gas Company Ltd. | |
January 1, 2000 | Received a Certificate of Amalgamation reflecting TransCanada's vertical short form amalgamation with a wholly-owned subsidiary, NOVA Gas International Ltd. |
Unless the context indicates otherwise, a reference in this Annual Information Form to "TransCanada" includes TransCanada PipeLines Limited and the subsidiaries through which its various business operations are conducted.
TransCanada's registered office and executive office are located at 450 - 1st Street S.W., Calgary, Alberta, T2P 5H1.
At Year End, TransCanada had approximately 2,475 employees in Canada and the United States, with two employees posted abroad under contract.
TransCanada's significant subsidiaries at Year End are noted below. The list excludes certain of TransCanada's subsidiaries where:
- •
- the total assets and total revenue of the individual excluded subsidiaries do not constitute more than ten percent of the consolidated assets and revenues of TransCanada at the most recent year end; and
- •
- the aggregate assets and operating revenues of the excluded subsidiaries represent less than 20-percent of the consolidated assets and revenues of TransCanada at the most recent year end.
| Subsidiary(1) | Organized Under the Laws of | Percentage Ownership by TransCanada of Voting Shares | |||
|---|---|---|---|---|---|
| NOVA Gas Transmission Ltd. | Alberta | 100 | |||
TransCanada PipeLine USA Ltd. | Nevada | 100 | |||
| TransCanada Energy USA Inc. | Delaware | 100 | |||
701671 Alberta Ltd. | Alberta | 100 | |||
| TransCanada Energy Ltd. | Canada | 100 | |||
Note:
- (1)
- Names shown without indentation are direct subsidiaries of TransCanada. The indentation of the name of a subsidiary indicates that such subsidiary is held by a subsidiary of TransCanada. The percentage ownership shown for a subsidiary is the share in that subsidiary held directly by its immediate parent.
TRANSCANADA PIPELINES LIMITED 1
This Annual Information Form has been prepared to reflect the presentation of TransCanada's continuing operations and its discontinued operations as they are presented in TransCanada's 2002 Audited Consolidated Financial Statements. The MD&A, together with Notes 1, 2, 18 and 19 of TransCanada's 2002 Audited Consolidated Financial Statements as found in the Annual Report, are hereby incorporated by reference.
GENERAL DEVELOPMENT OF THE BUSINESS
The general development of TransCanada's business during the last three financial years, and the significant events or conditions which have had an influence on that development, are summarized below. Most of these events are discussed in greater detail under the heading "Business of TransCanada" in this Annual Information Form.
TransCanada has substantial Canadian natural gas pipeline holdings, including:
- •
- a Canadian mainline natural gas transmission system (the "Canadian Mainline");
- •
- a natural gas transmission system throughout the province of Alberta (the "Alberta System");
- •
- a natural gas transmission system in southeastern British Columbia (the "BC System");
- •
- a 50-percent interest in Foothills Pipe Lines Ltd. ("Foothills");
- •
- both directly and through its interest in Foothills,
- •
- a 69.5-percent interest in Foothills Pipe Lines (Sask.) Ltd.,
- •
- a 74.5-percent interest in Foothills Pipe Lines (Alta.) Ltd., and
- •
- a 74.5-percent interest in Foothills Pipe Lines (South B.C.) Ltd.,
(collectively, the "Foothills System"); and
- •
- a 50-percent interest in Trans Québec & Maritimes Pipeline Inc. ("TQM").
TransCanada's natural gas pipeline holdings in the United States include:
- •
- a 50-percent interest in Great Lakes Gas Transmission Limited Partnership ("Great Lakes");
- •
- a 40.96-percent interest in the Iroquois Gas Transmission System ("Iroquois");
- •
- a 33.29-percent interest in the Portland Natural Gas Transmission System ("Portland");
- •
- a 12.25-percent voting interest in Northern Border Pipeline Company ("Northern Border"); and
- •
- a one-percent interest in Tuscarora Gas Transmission Company ("Tuscarora").
TC PipeLines, LP is a publicly held limited partnership of which TransCanada holds indirectly a 33.4-percent interest and of which TransCanada, through a subsidiary, acts as the general partner. TC PipeLines, LP holds:
- •
- a 30-percent interest in Northern Border; and
- •
- a 49-percent interest in Tuscarora.
Developments in 2002 — Transmission Business
In August 2002, TransCanada completed the acquisition of a portion of the two-percent general partnership interest in Northern Border Partners, L.P. ("NBPLP"), a publicly held limited partnership. This acquisition provides TransCanada with a 17.5-percent voting interest on the partnership policy committee of NBPLP.
2 TRANSCANADA PIPELINES LIMITED
NBPLP owns interests in pipelines and gas processing plants in the United States and Canada, including a 70-percent interest in Northern Border.
TransCanada owns and/or operates (or has under construction) a number of power plants, and purchases power under a number of power purchase arrangements. TransCanada's power plants and power purchase arrangements, in the aggregate, represent in excess of 4,000 megawatts ("MW") of power generation capacity.
TransCanada holds a 35.6-percent interest in, and is the general partner of, TransCanada Power, L.P. ("Power LP"), with the remaining interest being widely held by the public. Power LP owns seven power plants which are managed by subsidiaries of TransCanada.
Developments in 2002 — Power Business
In November 2002, TransCanada completed the acquisition of the 300 MW ManChief power plant, situated approximately 145 kilometres northeast of Denver, Colorado. The ManChief power plant is operated under contract by an unaffiliated third party.
In December 2002, TransCanada announced that it had, as part of a consortium, reached an agreement for the acquisition of a 31.6-percent interest in Bruce Power L.P. ("Bruce Power") and an approximate 33.3-percent interest in Bruce Power Inc., the general partner of Bruce Power. The acquisition was completed on February 14, 2003. Bruce Power leases its generation facilities from Ontario Power Generation Inc. ("OPG"). The facilities consist of eight nuclear reactors, four of which are currently operational with a capacity of 3,140 MW. It is anticipated that two of the four idle reactors will be restarted by mid-2003, adding additional capacity of approximately 1,500 MW.
The members of the purchasing consortium of Bruce Power have severally, on a pro-rata basis, guaranteed certain contingent financial obligations of Bruce Power related to operator licenses, the lease agreement, power sales agreements and contractor services. Bruce Power will continue to be operated by its current management which is comprised of experienced nuclear operators. Spent fuel and decommissioning liabilities remain with OPG under the terms of the lease.
Also in December 2002, TransCanada and OPG announced the formation of an equal limited partnership called Portlands Energy Centre L.P. ("PEC"). The partnership will assess the viability of developing a natural gas-fuelled energy centre at OPG's former R.L. Hearn Generating Station in the Portlands area of the downtown waterfront in Toronto, Ontario. As currently envisaged, PEC would construct a 550 MW combined cycle natural gas-fuelled cogeneration facility.
Developments in 2003 — Corporate
On January 28, 2003, the Board of Directors approved an increase in TransCanada's quarterly dividend on common shares from $0.25 to $0.27 per quarter for the quarter ending March 31, 2003.
On February 25, 2003, Board of Directors unanimously recommended that common shareholders vote in favor of a plan of arrangement to establish a holding company — named TransCanada Corporation — as TransCanada's parent. Upon the plan of arrangement becoming effective, existing common shareholders of TransCanada exchange each of their common shares for one common share of TransCanada Corporation; TransCanada Corporation will then hold all of the common shares of TransCanada; and the assets and liabilities of TransCanada remain with TransCanada. Establishing the holding company addresses a covenant contained in trust indentures governing some of TransCanada's debt securities that could limit the company's ability to pay dividends if it invests in certain businesses. This plan of arrangement is subject to approval by the common shareholders of TransCanada, and certain legal and regulatory approvals.
TRANSCANADA PIPELINES LIMITED 3
The following table shows TransCanada's revenues from continuing operations by segment, classified geographically, for the years ended December 31, 2002 and 2001.
| | 2002 | 2001 | |||
|---|---|---|---|---|---|
| | (millions of dollars) | (millions of dollars) | |||
| Transmission | |||||
| Canada — Domestic Deliveries | 2,076 | 2,469 | |||
| Canada — Export Deliveries(1) | 1,641 | 1,239 | |||
| United States | 204 | 172 | |||
| 3,921 | 3,880 | ||||
Power | |||||
| Canada — Domestic Deliveries | 655 | 834 | |||
| Canada — Export Deliveries(1) | — | 90 | |||
| United States | 638 | 471 | |||
| 1,293 | 1,395 | ||||
| Total Revenues(2) | 5,214 | 5,275 | |||
Notes:
- (1)
- Export deliveries are deliveries to customers serving United States markets.
- (2)
- Revenues are attributed to countries, based on country of origin of product or service.
TransCanada's transmission business includes the operation of the Canadian Mainline, the Alberta System, the BC System, and TransCanada's other investments in natural gas pipelines located in Canada and the United States.
Canadian natural gas transmission services are provided under gas transportation tariffs that provide for cost recovery and return on investment as approved by the applicable regulatory authorities. In some cases, such tariffs are determined under agreements with customers and other interested parties, subject to regulatory approval. The net income of the transmission business is generated based on such tariffs. Net income is not directly affected by fluctuations in the commodity price of natural gas, but such fluctuations influence both production levels and the natural gas basin from which North American natural gas users elect to purchase natural gas supplies. Under the current regulatory model, TransCanada's net income from its wholly-owned pipelines is not materially affected by fluctuations in throughput.
The volume of natural gas shipments on the Alberta System, the Canadian Mainline, and the BC System depends on the volume of natural gas produced and sold both in and outside of Alberta, and on the construction and availability of other pipeline capacity. The natural gas transported by TransCanada comes primarily from the Western Canada Sedimentary Basin ("WCSB"). Based on TransCanada's 2001 year-end estimates, the WCSB had remaining established reserves of natural gas of approximately 56 trillion cubic feet ("Tcf") with a remaining reserves-to-production ratio of approximately nine years at current levels of production. Incremental reserves are continually being discovered, and generally maintain the reserve-to-production ratio at close to nine years. Production of natural gas from the WCSB has increased fifteen percent overall since 1995. With the expansion of capacity on TransCanada's wholly and partly owned pipelines over the past decade and the competition provided by other pipelines, combined with significant growth in natural gas demand in Alberta, TransCanada anticipates there will be excess pipeline capacity out of the WCSB for the next several years.
In addition to the information concerning the transmission segment of TransCanada's business set out herein, further information is found in the MD&A under the heading "Transmission — Wholly-Owned Pipelines — Business Risks".
4 TRANSCANADA PIPELINES LIMITED
Alberta System
The Alberta System — held by NOVA Gas Transmission Ltd. ("NGTL"), a wholly-owned subsidiary of TransCanada — is an Alberta-wide natural gas transmission system that collects and transports natural gas for use in Alberta and for delivery to connecting pipelines, such as the Canadian Mainline, the Foothills System and the BC System, as well as to other unaffiliated pipelines, at the Alberta border for delivery to eastern Canada, British Columbia and the United States. The Alberta System includes approximately 22,700 kilometres of mainlines and laterals.
Capital expenditures, which are dependent in part upon requests for increased transportation service by customers, were $165 million in 2002. TransCanada anticipates approximately $121 million of capital spending on the Alberta System in 2003. As in 2002, these capital expenditures will be primarily related to capacity expansion.
The following table sets forth the annual volumes delivered off the Alberta System for the years ended December 31, 2002 and 2001.
| | 2002 | 2001 | ||||||
|---|---|---|---|---|---|---|---|---|
| Delivery Points | ||||||||
| Volume(1) | Percent | Volume(2) | Percent | |||||
| | (Bcf) | | (Bcf) | | ||||
| Alberta | 475 | 11 | 423 | 10 | ||||
| Eastern Canada and Eastern United States | 1,738 | 42 | 1,665 | 41 | ||||
| Western United States | 750 | 18 | 833 | 21 | ||||
| Midwestern United States | 1,156 | 28 | 1,097 | 27 | ||||
| British Columbia | 28 | 1 | 41 | 1 | ||||
| Total | 4,146 | 100 | 4,059 | 100 | ||||
Notes:
- (1)
- Of the total volumes transported in 2002, 2.09 Tcf of natural gas was delivered to the Canadian Mainline, 773 Bcf of natural gas was delivered to the BC System (including Foothills South B.C. Ltd.) and 779 Bcf of natural gas was delivered to the Foothills System.
- (2)
- Of the total volumes transported in 2001, 1.99 Tcf of natural gas was delivered to the Canadian Mainline, 855 Bcf of natural gas was delivered to the BC System (including Foothills South B.C. Ltd.) and 762 Bcf of natural gas was delivered to the Foothills System.
Alberta System Contracted Firm Transportation Services
As of Year End, the Alberta System was providing transportation for 232 shippers pursuant to approximately 17,240 firm service transportation contracts.
As of Year End, the weighted average remaining term of transportation contracts was approximately three years. Currently, these contracts are renewable by the customer by providing notice to NGTL at least twelve months prior to the expiry of the current contract term. The Alberta System has seen a 21-percent decrease in firm contracted capacity since the 1998-1999 contract year; and over the same period, total deliveries of natural gas in Alberta decreased by nine percent. For further information on the Alberta System, refer to the heading "Transmission — Wholly-Owned Pipelines — Business Risks" in the MD&A.
Regulation of the Alberta System
The construction and operation of the Alberta System is regulated by the Alberta Energy and Utilities Board (the "Alberta Regulator") primarily under the provisions of theGas Utilities Act (Alberta) and thePipeline Act (Alberta). NGTL also requires the Alberta Regulator's approval for rates, tolls and charges, and the terms and conditions under which it provides its services. Under the provisions of thePipeline Act, the Alberta Regulator oversees various matters, including the economic, orderly and efficient development of the pipeline, the operation and abandonment of the pipeline, and certain related pollution and environmental conservation
TRANSCANADA PIPELINES LIMITED 5
issues. In addition to requirements under thePipeline Act, the construction and operation of natural gas pipelines in Alberta are subject to certain provisions of, and require certain approvals under, other provincial legislation such as theEnvironmental Protection and Enhancement Act (Alberta).
Alberta System tolls are designed to generate sufficient revenues for TransCanada to recover operating expenses, depreciation, taxes and financing costs of the Alberta System, including interest on debt and payments on securities attributable to the Alberta System, together with a return on deemed common equity.
In 2001 the Alberta System Rate Settlement ("ASRS") was negotiated with shippers and other interested parties for the years 2001 and 2002. Under the ASRS, approved by the Alberta Regulator on May 29, 2001, the revenue to be collected for services provided was fixed for each year, subject to a number of adjustments, including adjustments for taxes, variances from previous agreements, pipe integrity spending and the costs associated with providing service to the Fort McMurray area. The rates were determined by the fixed revenue (subject to the adjustments above) and throughput. The ASRS also enabled the Alberta System to offer two new services: a service to meet shippers' one-year firm service requirements, and another to meet short-haul, point-to-point transportation needs within the province. The ASRS also provided TransCanada with an incentive to reduce costs below the fixed revenue requirement, by accruing any savings to TransCanada's account.
On December 31, 2002, the Alberta Regulator approved interim rates effective January 1, 2003, which will remain in place until final 2003 rates are determined. On January 23, 2003, NGTL filed a tariff application with the Alberta Regulator requesting modifications to intra-Alberta delivery service tolls to reflect better the actual costs that such deliveries impose on the Alberta System, and two new services to enhance the Alberta System's competitive position. On February 7, 2003, TransCanada announced a one year settlement with customers and other interested parties regarding NGTL's 2003 revenue requirement. NGTL expects to file an application for approval of the settlement and final 2003 rates with the Alberta Regulator by February 28, 2003.
Tolling Methodology for the Alberta System
The current tolling methodology and rate design for the Alberta System features differentiated pricing for each gas receipt-point on the Alberta System. The receipt-point price is dependent on geographic location, the diameter of the pipe through which the customer's gas travels and the term of the transportation contract.
Canadian Mainline
The Canadian Mainline consists of approximately 14,900 kilometres of pipeline system transporting natural gas from the Alberta border east to various delivery points in Canada and at the United States border.
Capital expenditures on the Canadian Mainline in 2002 were approximately $57 million. These expenditures were primarily maintenance related. TransCanada anticipates approximately $76 million of capital spending on the Canadian Mainline in 2003. These capital expenditures will also be primarily maintenance related.
6 TRANSCANADA PIPELINES LIMITED
The following table sets forth the revenues earned and volumes delivered for the years ended December 31, 2002 and 2001 for the Canadian Mainline.
| | 2002 | 2001 | ||||||
|---|---|---|---|---|---|---|---|---|
| | Revenues(1) | Percent | Revenues | Percent | ||||
| Revenues | (millions of dollars) | | (millions of dollars) | | ||||
| Domestic | 610 | 28 | 973 | 45 | ||||
| Export | 1,568 | 72 | 1,168 | 55 | ||||
| Total | 2,178 | 100 | 2,141 | 100 | ||||
| | 2002 | 2001 | ||||||
|---|---|---|---|---|---|---|---|---|
Volume(2) | Percent | Volume(3) | Percent | |||||
| Volumes Transported | (Bcf) | | (Bcf) | | ||||
| Domestic | 1,223 | 47 | 1,216 | 50 | ||||
| Export | 1,407 | 53 | 1,234 | 50 | ||||
| Total | 2,630 | 100 | 2,450 | 100 | ||||
Notes:
- (1)
- Domestic revenue was reduced as a result of transportation service credits introduced in 2002. Total credits of $662 million were reported within 2002 domestic revenues.
- (2)
- Effective December 2001, TransCanada sold the subsidiary referred to in note 3, and therefore no volumes were transported for that subsidiary in 2002.
- (3)
- Of the total volumes transported in 2001, 345 Bcf or 14 percent of total volumes were transported for a wholly-owned subsidiary of TransCanada.
Canadian Mainline Contracted Firm Transportation Services
As of Year End, the Canadian Mainline was providing transportation for 118 shippers pursuant to 312 firm service transportation contracts. Approximately 53 percent of the total daily transportation volume represented by these contracts relates to contracts for delivery of natural gas at United States border points.
As of Year End, the weighted average remaining term of firm transportation contracts on the Canadian Mainline was approximately 3.7 years compared to 4.3 years at December 31, 2001. These contracts are renewable by the customer providing notice to TransCanada at least six months prior to the expiry of the current contract term. The Canadian Mainline last operated at capacity with one year or longer firm service contracts during the 1998-1999 contract year. The Canadian Mainline has since seen a 31-percent decrease in firm contracted deliveries and an 11-percent decrease in total deliveries originating at the Alberta border and in Saskatchewan. For further information, refer to the heading "Transmission — Wholly-Owned Pipelines — Business Risks" in the MD&A.
Regulation of the Canadian Mainline
Under the terms of theNational Energy Board Act (Canada), the National Energy Board (the "Federal Regulator") regulates the construction, operation, tolls and tariffs of the Canadian Mainline. The Federal Regulator is a responsible authority under theCanadian Environmental Assessment Act to consider the environmental and social impacts of proposed pipeline projects. The Canadian Mainline tolls are designed to generate sufficient revenues for TransCanada to recover operating expenses, depreciation, taxes and financing costs of the Canadian Mainline, including interest on debt and payments on preferred securities attributable to the Canadian Mainline, together with a return on deemed common equity.
The tolls are composed of a demand charge component and a commodity charge component. The demand charge is independent of the volumes shipped and is designed to recover fixed costs, such as fixed operating expenses, financing costs (including a return on deemed common equity), taxes and depreciation. The
TRANSCANADA PIPELINES LIMITED 7
commodity charge is designed to recover variable operating costs. These charges are paid by shippers under transportation contracts with TransCanada.
In November 2001 the Federal Regulator approved the 2001 and 2002 Canadian Mainline Service and Pricing Settlement ("S&P Settlement"). The S&P Settlement featured:
- •
- a two-year term that expired on December 31, 2002;
- •
- a cost of service framework;
- •
- revenue requirement components, excluding cost of capital, and certain cost and revenue incentives that provided mutual benefits for TransCanada and its shippers;
- •
- enhancements to firm transportation service through the implementation of firm transportation make-up and authorized overrun service credits; and
- •
- a framework for resolving several rate design and service issues during its term.
In June 2002, the Federal Regulator denied TransCanada's request to adopt an after-tax weighted average cost of capital methodology for establishing investment return and an after-tax weighted average cost of capital of 7.5 percent, equivalent to a 12.5 percent rate of return on deemed common equity of 40 percent. The Federal Regulator instead affirmed a formula established in 1995 for setting return on common equity. Under this formula, the rate of return on common equity for the Canadian Mainline was 9.61 percent in 2001 and 9.53 percent in 2002. The Federal Regulator increased deemed common equity to 33 percent from the previously approved level of 30 percent.
In September 2002, TransCanada filed an application with the Federal Regulator for new tolls on the Canadian Mainline to be effective January 1, 2003. The proposed new tolls include a requested increase in depreciation rates. Such increase is proposed to reflect better the risk of recovery of TransCanada's investments in the Canadian Mainline and to be fair to both current and future shippers. Concurrently, TransCanada filed an application with the Federal Regulator to review and vary its June 2002 decision respecting TransCanada's cost of capital for 2001 and 2002, which was declined by the Federal Regulator in a decision released February 20, 2003. On December 6, 2002, the Federal Regulator approved interim rates effective January 1, 2003, which will remain in place until final 2003 tolls are determined.
BC System
The BC System consists of approximately 200 kilometres of pipeline that carries natural gas from a connecting point with the Alberta System through the southeastern corner of British Columbia to connect with unaffiliated pipeline systems which further connect to California and the northwestern United States.
In 2002, capital expenditures on the BC System were approximately $50 million, primarily for capacity expansion. TransCanada anticipates approximately $3 million of capital spending on the BC System in 2003, primarily for capital maintenance.
The BC System is regulated by the Federal Regulator on a complaint basis and the tolls are based on a cost-of-service methodology. In December 2002, the Federal Regulator adopted interim rates and charges for 2003 pending the resolution of certain issues with shippers on the BC System.
TransCanada actively pursues gas pipeline and pipeline-related development, acquisition and operation opportunities in Canada and the United States, where these opportunities are driven by strong customer demand.
8 TRANSCANADA PIPELINES LIMITED
Great Lakes
Great Lakes, a 3,387-kilometre pipeline system in which TransCanada holds a 50-percent interest, transports Canadian natural gas from its interconnection with the Canadian Mainline at Emerson, Manitoba to markets in central Canada at St. Clair, Ontario and serves markets in the eastern and midwestern United States. Great Lakes has received approval from the U.S. Federal Energy Regulatory Commission (the "US Regulator") regarding a settlement agreement on its rates through to October 31, 2005.
TC PipeLines, LP
TC PipeLines, LP, a U.S. publicly-held limited partnership, was formed to acquire, own and participate in the management of U.S.-based pipeline assets. In May 1999, TransCanada's 30-percent general partner interest in Northern Border was conveyed to TC PipeLines, LP in exchange for cash and a 33.4-percent interest in TC PipeLines, LP, 31.4 percent of which is comprised of common units and subordinated units, and two percent of which is a general partnership interest. TC PipeLines, LP also issued common units to the public. Northern Border, in which TransCanada now indirectly holds an approximate ten percent interest through its investment in TC PipeLines, LP, operates a 2,010-kilometre natural gas pipeline system which connects with the Foothills System in Saskatchewan and serves the midwestern United States, terminating at North Hayden, Indiana. In October 2001, Northern Border completed a 55-kilometre pipeline extension and installed additional compression that provides 545 MMcf/d of incremental transportation capacity to North Hayden, Indiana and expands Northern Border's delivery capability into the Chicago area by approximately 30 percent.
On September 1, 2000, TC PipeLines, LP acquired a 49-percent general partner interest in Tuscarora from TransCanada, and TransCanada, through a wholly-owned subsidiary, retains a one-percent general partner interest in Tuscarora. Tuscarora is a 386-kilometre natural gas pipeline system which has been in operation since December 1995. This system transports natural gas from Malin, Oregon to Wadsworth, Nevada and delivers to points in northeastern California. The Hungry Valley lateral extension, Tuscarora's second city-gate connection into Reno, Nevada, was completed in January 2001. On December 1, 2002, Tuscarora completed construction and placed into service an expansion of its pipeline system, consisting of two compressor stations and a 17-kilometre pipeline extension from the previous terminus near Reno, Nevada to Wadsworth, Nevada. The expansion serves growing power generation and residential requirements in northern Nevada. Tuscarora's current capacity is approximately 182 MMcf/d.
A subsidiary of TransCanada acts as the general partner of TC PipeLines, LP.
Iroquois
Iroquois connects with the Canadian Mainline in eastern Ontario. This 604-kilometre pipeline delivers gas to customers in the northeastern United States and currently terminates on Long Island, New York. TransCanada's total interest in Iroquois, through two wholly-owned subsidiaries, is 40.96 percent. Iroquois has a settlement agreement on a rate structure with the US Regulator effective until January 1, 2004.
Construction on Iroquois' Eastchester expansion is underway and partially complete. Portions of the project's compression additions went into service in November 2002 with the remainder of the project anticipated to be completed mid-2003. This extension will extend Iroquois' system from Long Island into New York City and will provide an additional 230 MMcf/d of new service into this market.
Trans Québec & Maritimes
TransCanada holds a 50-percent interest in the 572-kilometre TQM pipeline, which connects with the Canadian Mainline. TQM serves markets in Québec and connects with the Portland system. In 2002, TransCanada agreed to provide various operating and administrative services to TQM effective January 2003.
Portland
TransCanada's 33.29-percent interest in Portland is held through two wholly-owned subsidiaries. Portland is a 471-kilometre interstate pipeline that interconnects with the pipeline system of TQM at the United States/
TRANSCANADA PIPELINES LIMITED 9
Canadian border at Pittsburg, New Hampshire and with the Tennessee Gas Pipeline in Haverhill and Dracut, Massachusetts. The southern sections of Portland, consisting of 163 kilometres, are part of the joint facilities shared with Maritimes and Northeast Pipeline. Portland holds a one-third ownership interest in the joint facilities.
Portland filed a rate application with the US Regulator in October 2001 which was accepted and went into effect subject to refund in April 2002. Portland and customer representatives reached an agreement on new rates and Portland submitted an uncontested agreement to the US Regulator in October 2002, which was approved in its entirety in January 2003.
Foothills System
The Foothills System is a 1,040-kilometre natural gas pipeline that transports western Canadian natural gas from central Alberta to connecting pipelines for transportation to markets in the United States.
Northern Development
TransCanada is actively pursuing northern gas development opportunities. Foothills holds the regulatory certificate for the Canadian portion of the Alaska Highway project, and together, TransCanada and Foothills hold the Alaskan certificate for the project. TransCanada believes that the Alaska Natural Gas Transportation System ("ANGTS") has significant advantages over alternative proposals to deliver Alaskan gas to market, and that a successful completion of the project would meet the needs of both the Alaskan producers and North American consumers.
TransCanada continues to work with Mackenzie Delta producers in Canada to bring Mackenzie Delta natural gas to market by accessing gas resources through new pipeline infrastructure in the Northwest Territories which would connect to the Alberta System.
Ventures LP
TransCanada Pipeline Ventures Limited Partnership ("Ventures LP") is a business created by TransCanada to provide energy solutions for its customers operating in the WCSB. It currently owns two natural gas pipelines providing service from the Alberta System, one to the Fort McMurray oil sands region in northern Alberta, and the other to a large petrochemical complex at Joffre, Alberta.
CrossAlta
TransCanada holds a 60-percent interest in Crossfield Storage Joint Venture and is thereby entitled to a proportional share of the earnings of CrossAlta Gas Storage & Services Ltd., which owns a gas storage facility near Crossfield, Alberta.
TransGas
TransCanada holds a 46.5-percent interest in TransGas de Occidente S.A. ("TransGas"), a 344-kilometre natural gas pipeline, extending from Mariquita to Cali, Colombia. TransCanada is also the operator of TransGas.
Regulation of North American Pipelines
The operations of TQM and the Foothills System and their subsidiaries are regulated by the Federal Regulator. The Foothills System is also regulated by the Northern Pipeline Agency of Canada. Under theNational Energy Board Act (Canada), the Federal Regulator regulates the construction and operation of interprovincial pipelines and the Canadian portion of international pipelines. The Federal Regulator also approves pipeline tolls and the import and export of natural gas.
The construction and operations of Ventures LP's Fort McMurray oilsands pipeline and Joffre pipeline are regulated by the Alberta Regulator.
10 TRANSCANADA PIPELINES LIMITED
With respect to TransCanada's United States pipeline investments, theNatural Gas Act of 1938 ("NGA") establishes the framework for regulation of interstate natural gas transportation, facilities construction and terms and conditions of service. The US Regulator is charged with implementing the NGA's requirements. The volumes of natural gas transported for TransCanada on Great Lakes are subject to NGA authorizations issued by the US Regulator. Interconnected natural gas pipelines and other United States interstate pipeline projects in which TransCanada has investments are subject to the US Regulator and NGA regulation, as well as certain state regulatory requirements.
The cross-border import and export of natural gas is subject to authorizations granted by the Federal Regulator and the United States Department of Energy.
All three of TransCanada's wholly-owned pipelines are connected to and supplied by one of North America's largest natural gas basins, the WCSB. However, the WCSB is maturing and it will be a challenge for producers to increase production in this basin. Other pipeline systems connected to the WCSB, including some of TransCanada's interconnected pipelines, have expanded in the last few years. These expansions have provided shippers with additional flexibility and competitive choices when moving WCSB supplies to market. The WCSB gas supply is not expected to increase.
The Alberta System is the primary transporter of natural gas within the province of Alberta and to provincial boundary points. However, a number of alternative pipelines have been constructed which seek to offer price advantages and provide competition to the Alberta System. The Alliance Pipeline went into service in December 2000, and competes for supply directly with the Alberta System, the Canadian Mainline, Foothills and Northern Border pipelines. AltaGas Services' short-haul South Suffield and North Suffield bypass pipelines went into service in 2000 and 2001, respectively, and both connect with TransCanada's Canadian Mainline. These short-haul bypasses account for less than five percent of the Alberta System's throughput. The Alberta System also faces increased competition from other pipelines.
In anticipation of and in response to these developments, the Alberta System's current tolling methodology was designed to enhance TransCanada's ability to provide competitive pricing and service flexibility and to provide TransCanada with the ability to respond to potential future bypass pipelines through the offering of load retention services.
The Canadian Mainline is now one of three natural gas pipelines providing transportation service directly from the WCSB to eastern Canada and to export points serving the midwestern and northeastern United States. Increased competition has led to the non-renewal of some of the firm service contracts on the Alberta System and the Canadian Mainline, and has led to decreased utilization on certain pipeline segments. The Vector pipeline (in which TransCanada has no ownership interest) went into service in 2000 and provides additional capacity to the Canadian Mainline's core markets in eastern Canada by connecting with the Alliance Pipeline, and other pipelines in Chicago, Illinois. Together, the Alliance pipeline, the Northern Border pipeline and the Vector pipeline form a bypass of the Canadian Mainline for service to Eastern Canadian markets.
For additional information on business risks in Transmission, please see "Transmission — Business Risks" in the MD&A.
In 2002, TransCanada spent approximately $10.6 million on research and development activities of which approximately $1.8 million related to research on pipeline integrity management, approximately $3.9 million on other regulated pipeline activities and approximately $4.9 million on non-regulated pipeline ventures.
The power segment of TransCanada's business includes the construction, ownership, operation and management of power plants and the marketing of electricity, and provides electricity account services to energy and industrial customers. This segment operates in Canada and the United States.
TRANSCANADA PIPELINES LIMITED 11
TransCanada owns and operates:
- •
- a waste-heat fuelled power plant at the Cancarb facility in Medicine Hat, Alberta (27 MW);
- •
- cogeneration plants in Alberta at Carseland (80 MW), Redwater (40 MW), Bear Creek (80 MW) and MacKay River (165 MW — anticipated to be in service in late 2003);
- •
- the Curtis Palmer hydro-electric power facilities near Corinth, New York (60 MW); and
- •
- Ocean State Power in Burrillville, Rhode Island (560 MW).
TransCanada has long-term power purchase arrangements in place for:
- •
- 100-percent of the production of the Sundance A (560 MW) and 50-percent of the production of Sundance B (353 MW of 706 MW) power facilities near Wabamun, Alberta.
TransCanada operates, through Power LP:
- •
- five power plants in Ontario and one in British Columbia (264 MW); and
- •
- one power plant in the United States (64 MW).
TransCanada owns, but does not operate:
- •
- the ManChief power plant near Denver, Colorado (300 MW);
- •
- a 31.6-percent interest in the nuclear power generation facilities of Bruce Power in Ontario (3,140 MW total in operation, plus approximately 1,500 MW total expected to be operational in 2003); and
- •
- a 17-percent interest in Huron Wind L.P. (9 MW total).
TransCanada has a power marketing office in Westborough, Massachusetts to manage the Ocean State Power purchase agreements and market supply obligations, and to take advantage of additional marketing opportunities in the New England and New York markets. The office also markets the output of Power LP's Castleton-on-Hudson power plant.
TransCanada sells the entire output from the Curtis Palmer facilities under a fixed price power purchase agreement with Niagara Mohawk Power Corporation. At current rates of production, the agreement has a remaining term of more than 25 years. In 2000, the Curtis Palmer facility was re-licensed by the US Regulator to operate for a period of 40 years.
Operations and maintenance services for the ManChief power plant will continue to be supplied by the current contracted service provider.
Operations and maintenance services for the Bruce Power plants will continue to be supplied by the current management and staff of Bruce Power.
In December 2002, TransCanada and OPG created a new limited partnership, the Portlands Energy Centre L.P., to study the feasibility of developing a 550 MW combined-cycle natural gas-fuelled cogeneration power plant on a former power generation site in the Portlands area of the Toronto, Ontario downtown waterfront.
TransCanada continues to investigate potential investment opportunities in North America.
TransCanada manages, operates and is the largest unitholder of Power LP, a publicly-held limited partnership that owns seven power plants. TransCanada holds 35.6 percent of the units of Power LP.
Power LP owns combined-cycle power plants — fuelled by a combination of natural gas and waste exhaust heat from adjacent TransCanada compression facilities — in Nipigon, Kapuskasing, North Bay and Tunis, Ontario. It also owns a natural gas cogeneration plant in Castleton-on-Hudson, New York and wood-waste fuelled power plants near Hearst, Ontario and at Williams Lake, British Columbia.
TransCanada supplies the natural gas fuel for certain of Power LP's plants.
12 TRANSCANADA PIPELINES LIMITED
On October 23, 2001, Power LP completed the sale of approximately 5.7 million partnership units from treasury for net proceeds of $166 million, which was used to retire the partnership's long-term debt. This transaction resulted in TransCanada's ownership interest being reduced to 35.6 percent.
Power LP's seven plants have a total generating output of 328 MW. It is the largest publicly traded power income fund in Canada with a market capitalization of approximately $1.2 billion.
The following tables set forth the revenues earned, power volumes marketed and generation capacity in Canada and the United States for the years ended December 31, 2002 and 2001 from TransCanada's power operations.
| | 2002 | 2001 | ||||||
|---|---|---|---|---|---|---|---|---|
| | Revenues | Percent | Revenues | Percent | ||||
| Revenues(1) | (millions of dollars) | | (millions of dollars) | | ||||
| Canada — Domestic | 655 | 51 | 834 | 60 | ||||
| Canada — Export | — | — | 90 | 6 | ||||
| United States | 638 | 49 | 471 | 34 | ||||
| Total | 1,293 | 100 | 1,395 | 100 | ||||
| | 2002 | 2001 | ||||||
|---|---|---|---|---|---|---|---|---|
Volume | Percent | Volume | Percent | |||||
| Volumes Sold(2) | (gigawatt hours) | | (gigawatt hours) | | ||||
| Canada — Domestic | 11,493 | 60 | 10,140 | 71 | ||||
| Canada — Export | 10 | — | 210 | 1 | ||||
| United States | 7,541 | 40 | 3,973 | 28 | ||||
| Total | 19,044 | 100 | 14,323 | 100 | ||||
| | 2002 | 2001 | ||||||
|---|---|---|---|---|---|---|---|---|
Generation | Percent | Generation | Percent | |||||
| Generation Capacity(2)(3)(4)(5) | (megawatts) | | (megawatts) | | ||||
| Canada | 1,404 | 59 | 1,324 | 66 | ||||
| United States | 984 | 41 | 684 | 34 | ||||
| Total | 2,388 | 100 | 2,008 | 100 | ||||
Notes:
- (1)
- Includes TransCanada's revenues generated by Ocean State Power and Power LP (after eliminating intercompany transactions with TransCanada).
- (2)
- Includes 100-percent of volumes sold by, and the generation capacity of, Ocean State Power and Power LP (after eliminating intercompany transactions with TransCanada).
- (3)
- Excludes MacKay River (165 MW) which was under construction at Year End. Construction of the Bear Creek plant (80 MW) was substantially complete by December 31, 2002.
- (4)
- Includes power purchase arrangements from Sundance A (560 MW) controlled by TransCanada and Sundance B (353 MW). TransCanada owns 50-percent of Sundance B's total output of 706 MW through an investment in ASTC Power Partnership.
- (5)
- Excludes the generation capacity of Bruce Power (3,140 MW, plus 1,538 MW anticipated to be on-line mid-2003).
TransCanada's investments in Ocean State Power, Curtis Palmer, ManChief, and TransCanada's United States electric power marketing activities are subject to the jurisdiction of the US Regulator under the U.S. Federal Power Act, as well as the jurisdiction of certain state regulatory authorities.
Deregulation of the power industry is proceeding at different stages throughout most of the markets in which TransCanada currently operates, namely Alberta, Ontario and the northern United States. In 2001, Alberta deregulated its generation assets and opened the market for retailers and wholesalers. In 2002, the Ontario
TRANSCANADA PIPELINES LIMITED 13
government began deregulation of its electricity market but later capped rates for small consumers. This cap does not directly affect the wholesale market where TransCanada is primarily focused.
TransCanada's power business has operated and continues to operate in highly competitive markets that are driven mainly by price. However, the majority of TransCanada's power generation business is underpinned by long-term or medium-term fixed price contracts that are unaffected by short-term price changes in the marketplace. The power industry in North America is currently in the process of deregulation, with various provinces and states at different stages in the process. TransCanada continues to monitor such deregulation and to seek investment opportunities as they arise.
For additional information on business risks in TransCanada's Power business, please see "Power — Business Risks" in the MD&A.
TransCanada owns Cancarb Limited, a thermal carbon black manufacturing facility located in Medicine Hat, Alberta.
TransCanada owns a 50-percent interest in TransCanada Turbines Ltd., a repair and overhaul business for aero-derivative industrial gas turbines. This business operates primarily out of facilities in Calgary, Alberta, with offices in Bakersfield, California; East Windsor, Connecticut; and Liverpool, England.
TransCanada owns 80 percent of TransCanada Calibrations Ltd, a gas meter calibration business certified by Measurement Canada, located at Ile des Chênes, Manitoba.
Between 1999 and 2002, TransCanada continued to focus on natural gas transmission and power generation. During that time, TransCanada sold off substantially all of its assets in international, midstream, and oil and gas marketing businesses that were identified for disposition. For further information on Discontinued Operations please refer to Note 19 of TransCanada's 2002 Audited Consolidated Financial Statements.
As of December 1, 2001, TransCanada sold substantially all of its natural gas marketing and trading operations. TransCanada retains certain contingent liabilities relating to its former gas marketing business due to the refusal of some counterparties to agree to the assignment and novation of its contracts to the purchasers of the assets. The exposures relating to these contracts are declining as the terms of the contracts expire.
TransCanada's international transmission, processing and power generation operations were focused primarily in Latin America, Europe and Asia Pacific. In December 1999, TransCanada announced its intention to exit from all of its international operations and during 2000 and 2001 sold the majority of its international businesses and assets, leaving, as at February 25, 2003, the following discontinued international operations remaining to be sold.
14 TRANSCANADA PIPELINES LIMITED
Latin America
TransCanada holds:
- •
- a 30-percent interest in Gasoducto del Pacifico ("Gas Pacifico"), a 540-kilometre natural gas pipeline from Argentina to Concepción, Chile; and
- •
- a 30-percent interest in INNERGY Holdings S.A., an industrial natural gas transportation and marketing company operating in the Concepción, Chile region, which transports gas on the Gas Pacifico system.
Asia Pacific
TransCanada holds an indirect ten percent interest in PT Paiton Energy Company, which owns a power project consisting of two 615-megawatt coal-fired power units located in Indonesia.
Regulation in International
The majority of countries in which TransCanada continues to have business interests have various government entities in charge of drafting and implementing the policies and regulations with respect to exploration, production, transportation, refining, processing and distribution of hydrocarbons, as well as all other activities related to the energy sector.
Competition in International
TransCanada's international businesses are conducted in a highly competitive environment, comprised of major energy companies and consortia with years of international experience and established relationships. Projects were generally awarded by way of international tender.
International Business Risks
TransCanada's international investments are subject to a number of risks unique to international business. These risks include exchange controls and fluctuation of the local currency, political risk, community actions, changes in laws, price control, the availability and quality of local labour skills, and labour unrest, among others. Such risks are mitigated by insurance policies, participation of local and foreign partners, prudent commercial structuring and other measures.
In 2000 and 2001, TransCanada sold substantially all of its portfolio of natural gas gathering, processing, straddle plant and extraction assets in Alberta, British Columbia and Saskatchewan.
During 2002, the Harmattan gas plant was TransCanada's only remaining midstream asset. Although a purchase and sale agreement for the plant was signed in 2001, an unrelated third party initiated litigation which delayed the sale. The litigation was settled in late 2002, and the sale closed in January 2003.
HEALTH, SAFETY AND ENVIRONMENT
TransCanada is committed to providing a safe and healthy environment for its employees and the public, and to the protection of the environment. Health, safety and environment ("HS&E") is a priority in all of TransCanada's operations. The HS&E Committee of the Board of Directors monitors compliance with the TransCanada HS&E corporate policy through regular reporting by the company's department of Community, Safety & Environment. TransCanada's senior executives are also committed to ensuring TransCanada is in compliance with its policies and is an industry leader. Senior executives are regularly advised of all important operational issues and initiatives relating to HS&E.
TRANSCANADA PIPELINES LIMITED 15
TransCanada has an HS&E management system modeled after ISO 14001 elements to facilitate the focus of resources on the areas of greatest risk to the organization's business activities relating to health, safety and environment. It highlights opportunities for improvement, enables the company to work towards defined HS&E expectations and objectives, and provides a competitive business advantage. HS&E audits, management system assessments and planned inspections are used to assess both the effectiveness of implementation of HS&E programs, processes and procedures, and TransCanada's compliance with regulatory requirements.
TransCanada employs full-time staff dedicated to HS&E matters, and incorporates HS&E policies and principles into the planning, development, construction and operation of all its projects. Environmental protection requirements have not had a material impact on the capital expenditures of TransCanada to date; however there can be no assurance that such requirements will not have a material impact on TransCanada's financial or operating results in future years. Such requirements can be dependent on a variety of factors including the regulatory environment in which TransCanada operates.
Environmental initiatives related to climate change are a strategic issue for TransCanada, particularly in light of the Canadian government's ratification of the Kyoto Protocol in December 2002. TransCanada has had a comprehensive climate change strategy in place since 1999, which includes five key areas of activity:
- •
- Participation in policy forums;
- •
- Direct emissions reduction;
- •
- Long term technology development;
- •
- Emissions offset analysis; and
- •
- Pursuit of business opportunities.
Activities in each of these areas occurred in 2002 and will continue in 2003.
In 2002, TransCanada received a fourth consecutive gold level reporting status for its 2002 Voluntary Challenge and Registry ("VCR") report. To achieve gold level status, VCR reports are rated in several categories. Gold level reporters must attain a score of at least 90/100 and must also meet mandatory criteria. Approximately twelve percent of the submissions to the registry have received gold level reporting recognition.
The Kyoto Protocol, ratified by the Canadian Federal Government in December 2002, requires Canada to reduce its greenhouse gas emissions significantly. The Canadian government has not yet provided details on how it intends to meet these reduction targets, and until it does so, TransCanada cannot predict the degree to which it will be affected.
PATENTS, LICENCES AND TRADEMARKS
TransCanada is the beneficial owner and, in some cases, the licencee of a number of trademarks, patents and licences. While these trademarks, patents and licences constitute valuable assets, TransCanada does not regard any single trademark, patent or licence as being material to its operations as a whole.
TransCanada is subject to various legal proceedings and actions arising in the normal course of business. For further information, refer to Note 18 of TransCanada's 2002 Audited Consolidated Financial Statements.
16 TRANSCANADA PIPELINES LIMITED
Three-Year Selected Consolidated Financial Information
Selected consolidated financial information for the years ended December 31, 2002, 2001 and 2000 is found under the heading "Three-Year Financial Highlights" in the Annual Report and is hereby incorporated by reference.
For a discussion on the factors affecting the comparability of the financial data, including discontinued operations and changes in accounting policies, refer to Note 1, Note 2 and Note 19 of TransCanada's 2002 Audited Consolidated Financial Statements.
Three-Year Dividend Information
The dividends declared per share during the past three completed financial years are set forth in the following tables.
Dividends Declared on Common Shares
| | 2002 | 2001 | 2000 | |||
|---|---|---|---|---|---|---|
| | (dollars per share) | |||||
| Common Shares(1) | 1.00 | 0.90 | 0.80 | |||
Note:
- (1)
- On January 28, 2003, the Board of Directors of TransCanada announced an increase in the dividend on Common Shares to $0.27 per share for the quarter ended March 31, 2003.
Dividends Declared on Preferred Shares
| | 2002 | 2001 | 2000 | ||||
|---|---|---|---|---|---|---|---|
| | (dollars per share) | ||||||
| Cumulative Redeemable First Preferred Shares | |||||||
| Series R(1) | — | — | 2.23125 | ||||
| Series S(2) | — | — | 1.93125 | ||||
| Series U(3) | 2.80 | 2.80 | 2.80 | ||||
| Series Y(4) | 2.80 | 2.80 | 2.80 | ||||
Notes:
- (1)
- Series R Shares were redeemed December 15, 2000.
- (2)
- Series S Shares were issued July 2, 1998 pursuant to the Plan of Arrangement with NOVA in exchange for the Cumulative Redeemable First Preferred Shares, Series 1 issued March 27, 1997 by NOVA. The Series S Shares were subsequently repurchased by way of a substantial issuer bid and through the compulsory acquisition provisions of theCanada Business Corporations Act in November 2000. The 0.64375 dividend declared for Series S Shares on October 31, 2000 for shareholders of record on January 31, 2001 has not been included in the table.
- (3)
- Series U Shares were issued October 15, 1998.
- (4)
- Series Y Shares were issued March 5, 1999.
Certain of TransCanada's outstanding preferred shares contain restrictions requiring that no dividends shall be declared or paid on common shares unless all dividends payable on all shares ranking in priority to the common shares with respect to payment of dividends have been declared and paid. In addition, there are provisions in the various trust indentures and credit agreements to which TransCanada is a party, which restrict the payment of dividends on TransCanada's common shares in certain limited circumstances. At Year End, such provisions did not restrict or alter TransCanada's ability to declare or pay dividends.
The following information is given at February 25, 2003.
TransCanada's common shares are listed on the Toronto Stock Exchange and the New York Stock Exchange.
TRANSCANADA PIPELINES LIMITED 17
The Cumulative Redeemable First Preferred Shares, Series U and Series Y are listed on the Toronto Stock Exchange.
The 8.75% junior subordinated debentures (which are obligations of TransCanada Capital, an unaffiliated business trust), due 2045; and the 8.25% preferred securities, due 2047, are listed on the New York Stock Exchange.
The 7.875% debentures due April 1, 2023 of NGTL are listed on the New York Stock Exchange.
The 16.50% First Mortgage Pipe Line Bonds due 2007 are listed on the London Stock Exchange.
As of February 25, 2003, the directors and officers of TransCanada as a group beneficially owned, directly or indirectly, or exercised control or direction over, 412,771 common shares and 32,540 units of Power LP, which constitutes less than one percent of TransCanada's common shares and less than one percent of the voting securities of any of its subsidiaries or affiliates. TransCanada collects this information from its directors and officers but otherwise has no direct knowledge of individual holdings of its securities. Further information as to securities beneficially owned or over which control or direction is exercised, is provided in TransCanada's 2003 Management Proxy Circular dated February 25, 2003 under the heading "Annual Meeting Business — Election of Directors". See "Additional Information" in this Annual Information Form.
Set forth below are the names of the thirteen directors who served on TransCanada's Board of Directors at Year End, together with their municipalities of residence, all positions and offices held by them with TransCanada and its significant affiliates, their principal occupations or employment during the past five years and the year from which each director has continually served as a director of TransCanada, and NOVA prior to the 1998 merger, as applicable.
| Name | Principal Occupation During The Five Preceding Years | Director Since | ||
|---|---|---|---|---|
| Douglas D. Baldwin, P. Eng. Calgary, Alberta | Corporate Director. President and Chief Executive Officer, TransCanada, from August 1999 to April 2001. Prior to December 1998, Senior Vice-President and Director, Imperial Oil Limited (integrated energy). Director, Talisman Energy Inc., UTS Energy Corporation and Resolute Energy Inc. | 1999 | ||
Ronald B. Coleman Calgary, Alberta | President, R.B. Coleman Consulting Co. Ltd. and Chairman, Dominion Equity Resource Fund Inc. (oil and gas activities). Retiring April 25, 2003. | 1998 (NOVA, 1987) | ||
Wendy K. Dobson Uxbridge, Ontario | Professor, Rotman School of Management and Director, Institute for International Business, University of Toronto (education). Director, MDS Inc., DuPont Canada Inc. and The Toronto-Dominion Bank. | 1992 | ||
The Hon. Paule Gauthier, P.C., O.C., O.Q., Q.C. Québec, Québec | Senior Partner, Desjardins Ducharme Stein Monast (law firm). Director, The Royal Bank of Canada, Royal Trust Corporation of Canada, The Royal Trust Company, Rothmans Inc. and Metro Inc. Member, Board of Governors, Royal Military College of Canada. Chair, Security Intelligence Review Committee. President, Fondation de la Maison Michel Sarrazin and President, Institut Québecois des Hautes Études Internationales, Laval University. | 2002 | ||
18 TRANSCANADA PIPELINES LIMITED
Richard F. Haskayne, O.C., F.C.A. Calgary, Alberta | Chairman of the Board, TransCanada since July 1998. Prior to February 19, 2003, Chairman, Fording Inc. (coal and wolastonite). Prior to July 1998, Chairman of the Board, NOVA (energy services and commodity chemicals). Until September 1998, Chairman, TransAlta Corporation (electric industry holding company). Director, EnCana Corporation and Weyerhaeuser Company Limited. | 1998 (NOVA, 1991) | ||
Kerry L. Hawkins Winnipeg, Manitoba | President, Cargill Limited (grain handlers, merchants, transporters and processors of agricultural products). Director, NOVA Chemicals Corporation, Shell Canada Limited and Hudson's Bay Company. | 1996 | ||
S. Barry Jackson Calgary, Alberta | Chairman, Resolute Energy Inc. (oil and gas) since 2002 and Deer Creek Energy Limited (oil and gas) since 2001. President and Chief Executive Officer, Crestar Energy Inc. (oil and gas), from 1993 to 2000. Director, Nexen Inc. | 2002 | ||
Harold N. Kvisle, P. Eng. Calgary, Alberta | President and Chief Executive Officer, TransCanada, since May 2001. Executive Vice-President, Trading and Business Development, TransCanada, from June 2000 to April 2001. Senior Vice-President, Trading and Business Development, TransCanada, from April 2000 to June 2000. Senior Vice-President and President, Energy Operations, TransCanada, from September 1999 to April 2000. Prior to September 1999, President, Fletcher Challenge Energy Canada (oil and gas). Director, Norske Skog Canada Limited, PrimeWest Energy Inc. and TransCanada Power, L.P. | 2001 | ||
David P. O'Brien Calgary, Alberta | Chairman, EnCana Corporation (oil and gas), since April 2002. Chairman and Chief Executive Officer, PanCanadian Energy Corporation (oil and gas), from October 2001 to April 2002. Chairman, President and Chief Executive Officer, Canadian Pacific Limited (transportation, energy and hotels), from May 1996 to October 2001. Director, The Royal Bank of Canada, Air Canada, Fairmont Hotels & Resorts Inc., Inco Limited, Molson Inc., Profico Energy Management Ltd. and The E & P Limited Partnership. | 2001 | ||
James R. Paul Kingwood, Texas | Chairman, James and Associates (private investment firm). Director, AMEC PLC. | 1996 | ||
Harry G. Schaefer, F.C.A. Calgary, Alberta | President, Schaefer & Associates (business advisory services). Vice-Chairman of the Board, TransCanada since 1998. Chairman, Crestar Energy Inc. (oil and gas), from May 1996 to November 2000. Director, Agrium Inc. and Fording Canadian Coal Trust. | 1987 | ||
TRANSCANADA PIPELINES LIMITED 19
W. Thomas Stephens Greenwood Village, Colorado | Corporate Director. Chief Executive Officer, MacMillan Bloedel Limited (forest products), from October 1997 to October 1999. Director, Xcel Energy Inc., Norske Skog Canada Limited and Qwest Communications International Inc. | 1999 | ||
Joseph D. Thompson, P. Eng. Edmonton, Alberta | Chairman, PCL Construction Group Inc. (general construction contractors). Director, NOVA Chemicals Corporation. | 1995 |
Each director holds office until the next annual meeting or until his or her successor is earlier elected or appointed.
TransCanada is required to have an audit committee, which at TransCanada is called the Audit and Risk Management Committee. The directors who are members of this committee are H.G. Schaefer (Chair), R.B. Coleman (retiring April 25, 2003), the Hon. P. Gauthier, K.L. Hawkins, S.B. Jackson and J.R. Paul. The other committees of the Board of Directors are the Governance Committee, the Health, Safety and Environment Committee and the Human Resources Committee. Additional information about the committees of the Board of Directors and corporate governance practices at TransCanada can be found in the Management Proxy Circular under "Annual Meeting Business — Compensation and Other Information — Corporate Governance". See "Additional Information" in this Annual Information Form.
All of the executive officers and corporate officers of TransCanada reside in Calgary, Alberta. As of February 25, 2003, the officers of TransCanada, their present positions within TransCanada and their principal occupations during the five preceding years are as follows:
Executive Officers
| Name | Present Position Held | Principal Occupation During the Five Preceding Years | ||
|---|---|---|---|---|
| Harold N. Kvisle | President and Chief Executive Officer | President and Chief Executive Officer, TransCanada, since May 2001. Executive Vice-President, Trading and Business Development, TransCanada, from June 2000 to April 2001 and Senior Vice-President Trading and Business Development, TransCanada from April 2000 to June 2000. Senior Vice-President and President, Energy Operations, TransCanada, from September 1999 to April 2000. Prior to September 1999, President, Fletcher Challenge Energy Canada (oil and gas). | ||
Albrecht W.A. Bellstedt, Q.C. | Executive Vice-President, Law and General Counsel | Prior to June 2000, Senior Vice-President, Law and General Counsel. Prior to April 2000, Senior Vice-President, Law and Administration and prior to August 1999, Senior Vice-President, Law and Chief Compliance Officer. Prior to February 1999, partner, Fraser Milner, a law firm, and prior to October 1998, partner, Milner Fenerty, a predecessor of Fraser Milner. | ||
20 TRANSCANADA PIPELINES LIMITED
Russell K. Girling | Executive Vice-President and Chief Financial Officer | Prior to June 2000, Senior Vice-President and Chief Financial Officer. From January to September 1999, Vice-President, Finance. Prior to January 1999, Executive Vice-President, Power (TransCanada Energy). Prior to July 1998, Senior Vice-President, North American Power (TransCanada Energy). | ||
Dennis J. McConaghy | Executive Vice-President, Gas Development | Prior to May 2001, Senior Vice President, Business Development. Prior to October 2000, Senior Vice-President, Midstream/Divestments. Prior to June 2000, Vice-President, Corporate Strategy and Planning. Prior to July 1998, Vice-President, Strategy and Corporate Development, NOVA Corporation. | ||
Alexander J. Pourbaix | Executive Vice-President, Power Development | Prior to June 2001, Vice-President, Corporate Development, Power Services. Prior to June 1998, held progressively senior management positions within affiliates of TransCanada. | ||
Sarah E. Raiss | Executive Vice-President, Corporate Services | Prior to January 2002, Executive Vice President, Human Resources and Public Sector Relations. Prior to June 2000, Senior Vice-President, Human Resources and Public Sector Relations. Prior to February 2000, Senior Vice-President, Human Resources. Prior to March 1999, President of SE Raiss Group, Inc. (organizational consulting). | ||
Ronald J. Turner | Executive Vice-President, Operations and Engineering | Prior to June 2000, Senior Vice-President and President, TransCanada International. Prior to September 1999, Senior Vice-President and President, Transmission West. Prior to July 1998, Vice-President, Value Process West, NOVA Chemicals Ltd. and Executive Vice-President, NOVA Gas Transmission Ltd. |
| Name | Present Position Held | Principal Occupation During the Five Preceding Years | ||
|---|---|---|---|---|
| Ronald L. Cook | Vice-President, Taxation | Prior to April 2002, Director, Taxation. | ||
Rhondda E.S. Grant | Vice-President and Corporate Secretary | Prior to September 1999, Corporate Secretary and Associate General Counsel, Corporate. Prior to July 1998, held the same offices in NOVA Corporation. | ||
Lee G. Hobbs | Vice-President and Controller | Prior to July 2001, Director, Accounting. Prior to May 1999, Chief Financial Officer, Snow Leopard Resources Inc. | ||
TRANSCANADA PIPELINES LIMITED 21
Garry E. Lamb | Vice-President, Risk Management | Prior to October 2001, Vice-President, Audit and Risk Management. Prior to June 2000, Vice-President, Risk Management. Prior to February 2000, Vice-President, Risk Identification and Quantification. Prior to September 1999, General Manager, Counterparty Risk, and prior to January 1999, General Manager, Counterparty Risk, TransCanada Energy Ltd. | ||
Donald R. Marchand | Vice-President, Finance and Treasurer | Prior to September 1999, Director, Finance. Prior to January 1998, Manager, Finance. |
- 1.
- Additional information including compensation of directors and officers, indebtedness of directors and officers, principal holders of TransCanada's securities, options to purchase securities and interests of insiders in material transactions (all where applicable), is contained in the Management Proxy Circular, which can be obtained upon request from the Corporate Secretary of TransCanada.
- 2.
- Additional financial information is provided in TransCanada's 2002 Audited Consolidated Financial Statements, contained in the Annual Report.
- 3.
- TransCanada will provide to any person or company upon request to the Corporate Secretary of TransCanada:
- (a)
- when the securities of TransCanada are in the course of a distribution pursuant to a short form prospectus or a preliminary short form prospectus has been filed in respect of a distribution of its securities:
- (i)
- one copy of TransCanada's latest Annual Information Form, together with one copy of any document, or the pertinent pages of any document, incorporated by reference in the Annual Information Form;
- (ii)
- one copy of the comparative consolidated financial statements of TransCanada for TransCanada's most recently completed financial year in respect of which such financial statements have been filed, together with the report of the auditor thereon, Management's Discussion and Analysis of Financial Condition and Results of Operations, and one copy of any interim financial statements of TransCanada which have been filed subsequent to the last filed annual financial statements;
- (iii)
- one copy of the information circular of TransCanada in respect of the most recent annual meeting of shareholders of TransCanada which involved the election of directors or one copy of any annual filing prepared in lieu of that information circular, as appropriate; and
- (iv)
- one copy of any other document or report which is incorporated by reference into the preliminary short form prospectus or the short form prospectus and is not required to be provided under (i), (ii) or (iii) above; or
- (b)
- at any other time, one copy of any other document referred to in paragraphs (3)(a)(i), (ii) and (iii) above, provided that TransCanada may require the payment of a reasonable charge from such person or company who is not a security holder of TransCanada where the documents are furnished by TransCanada pursuant to clause (3).
22 TRANSCANADA PIPELINES LIMITED
Exchange Rate of the Canadian Dollar
All dollar amounts are in Canadian dollars, except where otherwise indicated. The following table shows the high and low spot rates, the average noon spot rates and the year-end noon spot rates for the United States dollar for the past five years, each expressed in Canadian dollars, as reported by the Bank of Canada.
| | Year Ended December 31 | |||||||||
|---|---|---|---|---|---|---|---|---|---|---|
| | 2002 | 2001 | 2000 | 1999 | 1998 | |||||
| High | 1.6125 | 1.6034 | 1.5583 | 1.5475 | 1.5845 | |||||
| Low | 1.5122 | 1.4935 | 1.4353 | 1.4420 | 1.4040 | |||||
| Average Noon Rate | 1.5704 | 1.5484 | 1.4852 | 1.4858 | 1.4835 | |||||
| Year-End | 1.5796 | 1.5926 | 1.5002 | 1.4433 | 1.5305 | |||||
On February 25, 2003, the noon spot rate for the United States dollar as reported by the Bank of Canada was U.S. $1.00 = Cdn. $1.4926.
The conversion factors set out below are approximate factors. To convert from Metric to Imperial multiply by the factor indicated. To convert from Imperial to Metric divide by the factor indicated.
| Metric | Imperial | Factor | ||
|---|---|---|---|---|
| Kilometres | Miles | 0.62 | ||
| Millimetres | Inches | 0.04 | ||
| Gigajoules | Million British thermal units ("MMBtu") | 0.95 | ||
| Cubic metres* | Cubic feet | 35.3 | ||
| Kilopascals | Pounds per square inch ("psi") | 0.15 | ||
| Degrees Celsius | Degrees Fahrenheit | to convert to Fahrenheit multiply by 1.8, then add 32 degrees; to convert to Celsius subtract 32 degrees, then divide by 1.8 |
* The conversion is based on natural gas at a base pressure of 101.325 kilopascals and at a base temperature of 15° Celsius.
TRANSCANADA PIPELINES LIMITED 23
| AIF | Annual Information Form or Renewal Annual Information Form | |
| Alberta Regulator | Alberta Energy and Utilities Board (or "EUB") | |
| Alberta System | TransCanada's Alberta natural gas transmission system, held by NGTL | |
| ANGTS | Alaska Natural Gas Transportation System | |
| Annual Report | TransCanada's 2002 annual report to shareholders | |
| BC System | TransCanada's British Columbia natural gas transmission system, located in southeastern British Columbia | |
| Bcf | Billion cubic feet | |
| Board of Directors | The Board of Directors of TransCanada | |
| Canadian Mainline | TransCanada's Canadian mainline natural gas transmission system | |
| EUB | Alberta Energy and Utilities Board | |
| Federal Regulator | National Energy Board (or "NEB") | |
| FERC | Federal Energy Regulatory Commission | |
| Foothills System | Pipeline system operated by Foothills Pipe Lines Ltd. | |
| Gigajoule | 109 joules | |
| Gigawatt | 109 watts | |
| GJ | Gigajoule. 109 joules | |
| Great Lakes | Great Lakes Gas Transmission Limited Partnership | |
| GW | Gigawatt. 109 watts | |
| HS&E | Health, safety and environment | |
| Iroquois | Iroquois Gas Transmission System | |
| Km | Kilometre | |
| Management Proxy Circular | TransCanada's 2003 Management Proxy Circular dated February 25, 2003 | |
| MD&A | Management's Discussion and Analysis of Financial Condition and Results of Operations | |
| Megawatt | 106 watts | |
| MMcf/d | Million cubic feet per day | |
| MW | Megawatt. 106 watts | |
| NBPLP | Northern Border Partners, L.P. | |
| NEB | National Energy Board | |
| NGTL | NOVA Gas Transmission Ltd. | |
| Northern Border | Northern Border Pipeline Company | |
| NOVA | NOVA Corporation | |
| OPG | Ontario Power Generation Inc. | |
| PEC | Portlands Energy Centre L.P. | |
| Portland | Portland Natural Gas Transmission System | |
| Power LP | TransCanada Power, L.P. | |
| Tcf | Trillion cubic feet | |
| Thermal carbon black | Very fine particular aggregates of carbon possessing an amorphous quasi-graphitic molecular structure. Used primarily in the rubber industry. | |
| TQM | Trans Québec & Maritimes Pipeline Inc. | |
| TransCanada | TransCanada PipeLines Limited. In this AIF, includes operating subsidiaries except where the context requires otherwise | |
| Tuscarora | Tuscarora Gas Transmission Company | |
| US Regulator | Federal Energy Regulatory Commission (or "FERC") | |
| Ventures LP | TransCanada Pipeline Ventures Limited Partnership | |
| WCSB | Western Canada Sedimentary Basin | |
| Year End | December 31, 2002 |
24 TRANSCANADA PIPELINES LIMITED

Backed by $20 billion of premium assets, TransCanada is a leading North American energy company focused on natural gas transmission and power generation. The skills and expertise of our people and our strong financial position provide us with a clear advantage in a highly competitive environment.
Our 38,000 kilometre (24,000 mile) natural gas pipeline system is one of the largest and most sophisticated in the world. It links the rich natural gas resources of the Western Canada Sedimentary Basin to markets across Canada and the United States. We are well positioned to play a key role in bringing northern gas to the growing North American marketplace.
A rapidly emerging player in the North American power industry, we have interests in a growing portfolio of assets capable of producing more than 4,000 megawatts of power. Our plants utilize a diverse range of fuels and are among the most efficient on the continent. We also market electricity across Canada and the northern United States to meet the needs of a wide range of industrial clients.

STRATEGIES FOR GROWTH AND VALUE CREATION
• SUSTAIN, GROW AND OPTIMIZE OUR NORTH AMERICAN NATURAL GAS TRANSMISSION BUSINESS
• ESTABLISH A NEW REGULATED BUSINESS MODEL
• GROW OUR POWER BUSINESS
• PURSUE OPERATIONAL EXCELLENCE
• MAINTAIN AND UTILIZE OUR STRONG FINANCIAL POSITION


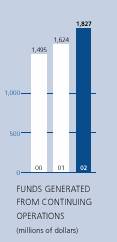

IN 2002, TRANSCANADA DELIVERED ON ITS COMMITMENT TO MAXIMIZE SHAREHOLDER VALUE. TOTAL SHAREHOLDER RETURN, INCLUDING DIVIDENDS, WAS 21 PER CENT.
We continued to make profitable investments in our core businesses, pay down debt and reduce operating costs. Our actions resulted in an increase in earnings and cash flow and a stronger balance sheet. In January 2003, TransCanada’s Board of Directors raised the quarterly dividend on the company’s common shares from $0.25 per share to $0.27 per share, for the quarter ended March 31, 2003.
OPERATING RESULTS
Year ended December 31 |
| 2002 |
| 2001 |
| 2000 |
|
(millions of dollars) |
|
|
|
|
|
|
|
|
|
|
|
|
|
|
|
Income Statement |
|
|
|
|
|
|
|
Net income/(loss) applicable to common shares |
|
|
|
|
|
|
|
Continuing operations |
| 747 |
| 686 |
| 628 |
|
Discontinued operations |
| — |
| (67 | ) | 61 |
|
|
| 747 |
| 619 |
| 689 |
|
Cash Flow Statement |
|
|
|
|
|
|
|
Funds generated from continuing operations |
| 1,827 |
| 1,624 |
| 1,495 |
|
Capital expenditures and acquisitions in continuing operations |
| 814 |
| 1,025 |
| 773 |
|
Balance Sheet |
|
|
|
|
|
|
|
Total assets |
| 19,916 |
| 19,954 |
| 24,817 |
|
Long-term debt |
| 8,815 |
| 9,347 |
| 9,928 |
|
Common shareholders’ equity |
| 5,747 |
| 5,426 |
| 5,211 |
|
COMMON SHARE STATISTICS
Year ended December 31 |
| 2002 |
| 2001 |
| 2000 |
| |||
|
|
|
|
|
|
|
| |||
Net income/(loss) per share – basic |
|
|
|
|
|
|
| |||
Continuing operations |
| $ | 1.56 |
| $ | 1.44 |
| $ | 1.32 |
|
Discontinued operations |
| — |
| (0.14 | ) | 0.13 |
| |||
|
| $ | 1.56 |
| $ | 1.30 |
| $ | 1.45 |
|
Net income per share – diluted |
| $ | 1.55 |
| $ | 1.30 |
| $ | 1.45 |
|
Dividends declared per share |
| $ | 1.00 |
| $ | 0.90 |
| $ | 0.80 |
|
Common shares outstanding (millions) |
|
|
|
|
|
|
| |||
Average for the year |
| 478.3 |
| 475.8 |
| 474.6 |
| |||
End of year |
| 479.5 |
| 476.6 |
| 474.9 |
| |||
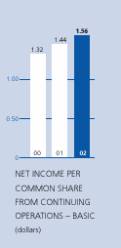
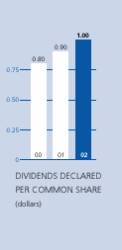

1
2002 WAS A YEAR IN WHICH CORPORATE GOVERNANCE ROSE TO NEW PROMINENCE IN THE EYES OF INVESTORS.
We are pleased to see governance recognized as a significant factor in determining a company’s success. However, we are disappointed that the actions of a highly visible few have resulted in widespread distrust of our corporate leaders and a belief that ethics and integrity must be enforced.
TransCanada takes this issue very seriously. We are proud to have been recognized for our leadership in corporate governance. The Board and management have long been committed to achieving the highest standards of business ethics and governance, consistently meeting, and exceeding, the Toronto Stock Exchange’s Guidelines for Corporate Governance. Further, TransCanada already meets most of the new requirements of the Sarbanes-Oxley Act and the proposed stock exchange guidelines.
At TransCanada, we are genuinely motivated by the desire to do the right thing in the interests of our shareholders. We are gratified that our commitment to sound ethical practices contributes directly to enhancing TransCanada’s reputation, and ultimately, its value to shareholders. By setting a high standard of honesty, fairness and integrity, TransCanada, along with its peers, hopes to restore respect for the business community.
The management and employees of TransCanada are deserving of our recognition for their commitment to living TransCanada’s values and for their work in delivering strong financial and operating performance. In January 2003, on the strength and sustainability of TransCanada’s earnings in 2002, the Board was able to raise the dividend for the third consecutive year. We applaud your efforts and thank you for your continued commitment to TransCanada.
I thank my fellow Directors for their hard work and ongoing dedication to TransCanada. Ron Coleman will be retiring from the Board at our shareholder meeting in 2003. He has served with distinction for many years on the boards of NOVA Corporation and TransCanada and we thank him for his valuable contribution. We also welcome Barry Jackson, Chairman of Resolute Energy Inc. and Deer Creek Energy Limited, and a Director of Nexen Inc., who was appointed to the Board in December 2002.
On behalf of the Board of Directors,
/s/ Richard F. Haskayne |
|
Richard F. Haskayne | |
Chairman | |

2
IN 2002, TRANSCANADA MAINTAINED ITS LEADERSHIP POSITION IN THE NORTH AMERICAN NATURAL GAS TRANSMISSION BUSINESS AND CONTINUED ITS DISCIPLINED, VALUE-CREATING GROWTH IN POWER.
TransCanada delivered another year of strong financial performance with increases in earnings and operating cash flow. We continued to strengthen our balance sheet and liquidity position. In January 2003, TransCanada’s Board of Directors raised the dividend on common shares for the third consecutive year. The quarterly dividend was increased by eight per cent to $0.27 per share for the quarter ending March 31, 2003.
We accomplished this against a backdrop of challenge and change within the North American energy industry. Our achievements are testament to the dedication and commitment of the people of TransCanada. Our expertise, experience and disciplined approach to value creation make TransCanada the strongest team in the business and I’m proud to be part of that team. I thank all employees for their contributions to our continuing success.
STRATEGY AND FOCUS
Our achievements are clear evidence that the strategic direction we established in 2000 is working exceptionally well. While we have refined our key strategies to keep pace with developments in the rapidly changing external environment, the five core components have remained consistent.
1. Sustain, Grow and Optimize Our North American Natural Gas Transmission Business
In 2002, we substantially completed the Westpath expansion project on the Alberta and BC systems to serve growing markets in California and the Pacific Northwest. This project marked the first field installation and testing of X100 steel line pipe – the highest strength large diameter line pipe in use worldwide. Throughout the year, we continued our efforts to optimize all aspects of our wholly-owned pipelines, which together comprise the largest single natural gas transmission system in North America.
We also acquired a general partnership interest in Northern Border Partners, L.P., which owns a 70 per cent interest in Northern Border Pipeline Company. We consider Northern Border to be one of the preferred routes to move gas from the Northern frontier to midwestern markets.

TOTAL SHAREHOLDER RETURN
including dividends, was 21 per cent in each of the last two years and 48 per cent in 2000.
OUR STRENGTHS
are our premium assets, the experience and expertise of our people and our strong financial position.
3
The projected growth of North American natural gas demand, combined with the potential to acquire significant assets as competitors seek to restore their balance sheets, create attractive opportunities for TransCanada.
On the supply side, growth is expected from a number of traditional sources including the Western Canada Sedimentary Basin (WCSB) and the Gulf Coast. However, even optimistic assessments of future supply from these basins will not meet the anticipated growth in demand. We strongly believe northern gas and offshore liquefied natural gas will be required by the end of the decade.
In the near term, our emphasis will be on connecting new supply from the WCSB to our Alberta System. We will also expand and extend our long-haul delivery systems as appropriate and look to increase our ownership in partially-owned pipeline systems.
Over the long term we will move forward on northern development. We will also seek opportunities to work closely with producers and regional stakeholders to build the facilities necessary for the importation of liquefied natural gas.
TransCanada supports the development of both the Mackenzie Valley and Alaska Highway pipelines. At this point in time, we expect the Mackenzie Valley pipeline to be the first to proceed. Our high capacity connections from the WCSB to premier North American markets will enable us to move northern gas when the time is right. Our many years of experience in constructing and operating large diameter natural gas pipeline systems in cold weather, combined with our solid reputation for safety and reliability, are significant competitive advantages.
2. Establish a New Regulated Business Model
On the regulatory front, 2002 proved to be a challenging year. The National Energy Board’s (NEB) decision on the Canadian Mainline Fair Return application – and its subsequent denial of TransCanada’s request to review this decision – was disappointing. In our view, the ruling does not recognize the long-term business risks of the Canadian Mainline.
In February 2003, we reached a one-year settlement regarding the 2003 revenue requirement for the Alberta System. The settlement, which was the result of a consultative process that included producers, industrial users, consumer groups, marketers, and export groups, was significantly influenced by the NEB decision on the Fair Return application.
OUR GOAL
is to be one of the most profitable, competitive, reliable providers of wholesale natural gas transportation and electric power in North America.
OUR PIPELINE BUSINESS
is focused on developing the infrastructure required to link future supply sources with growing demand.
4
The issues TransCanada and our stakeholders face are difficult to address within a single negotiated settlement or regulatory proceeding. However, we have established a new level of dialogue with our customers and we remain optimistic that future negotiations will lead to acceptable outcomes for both TransCanada and our customers. Our goal is to establish a framework that provides flexible, cost-competitive services and allows us to earn a fair risk-adjusted return.
3. Grow Our Power Business
In a year of downturn for the power industry, TransCanada’s power business produced solid results. In 2002:
• We started operations at the Redwater and Carseland power facilities and continued construction of the Bear Creek and MacKay River power plants in Alberta
• We acquired the ManChief power plant, a 300 megawatt facility in Colorado, and
• We announced our acquisition of a 31.6 per cent interest in Bruce Power L.P., the tenant under a lease on the Bruce nuclear power facility in Ontario. This acquisition was completed in mid-February 2003.
The current state of the power industry provides both opportunities and challenges for TransCanada. While the pace of plant construction in North America has slowed, we anticipate a number of quality acquisition opportunities in the coming year, together with niche development opportunities where we can leverage our expertise in cogeneration. We will grow our power portfolio by focusing on low-risk opportunities in markets we know. We will apply business models that benefit from, and support, our strong balance sheet. We will use power marketing to optimize the value of our assets and create stable and predictable income and cash flow.
4. Pursue Operational Excellence
Over the last three years we have achieved significant and sustainable operating cost savings, which, over the longer term, largely accrue to the benefit of our customers. We have also improved the quality and timeliness of customer service. Our objectives are to:
• Be the most efficient operator of North American pipe and power assets
• Provide the right services at the lowest possible cost
• Invest our capital in the right things at the right time, and
• Be responsive to our customers.
We relentlessly pursue our commitment to an operational excellence business model, recognizing that our customers count on us to deliver gas and generate power in a low-cost, safe and reliable manner.
OUR POWER PORTFOLIO
now includes interests in more than 4,000 megawatts of generating capacity located in some of the best markets in North America.
TRANSCANADA STRIVES
to deliver a combination of quality, price and ease of doing business that no peer can match.
5
5. Maintain and Utilize Our Strong Financial Position
TransCanada’s financial position strengthened during 2002. Today, our balance sheet is stronger than it has been in the past 15 years. Over the last three years, our strong cash flow, together with the proceeds from the sale of non-core assets have allowed us to:
• Invest more than $2.5 billion in our core businesses, and
• Retire more than $4 billion in term debt and preferred securities.
We expect to generate substantial operating cash flow in 2003 and beyond. Our strong discretionary cash position means we are well positioned for growth and value creation.
LOOKING AHEAD
In 2003, we will maintain our focus on our core strategies with an emphasis on well planned, well executed growth that creates value for our shareholders without compromising our financial strength.
TransCanada is poised to capture opportunities and create value in a business environment that has challenged many of our competitors. We are driven by shareholder value rather than the size of our asset base – we measure success in terms of profitability, value creation and long-term sustainability.
TransCanada has been participating in North American energy markets for more than 50 years – we’re in this for the long haul. We’ll keep this firmly in mind as we evaluate the opportunities and deal with the challenges of 2003.
/s/ Harold N. Kvisle |
|
Harold N. Kvisle | |
President and Chief Executive Officer | |
| |
February 25, 2003 | |
WE ARE FOCUSED
on disciplined management and growth of our natural gas transmission and power businesses.
6
MANAGEMENT’S DISCUSSION AND ANALYSIS
Management’s Discussion and Analysis should be read in conjunction with the audited Consolidated Financial Statements of TransCanada PipeLines Limited (TransCanada or the company) and the notes thereto for the year ended December 31, 2002.
Consolidated Financial Review
HIGHLIGHTS
Earnings Increase TransCanada’s net income applicable to common shares from continuing operations (net earnings) increased $61 million or nine per cent to $747 million or $1.56 per share in 2002 compared to $686 million or $1.44 per share in 2001.
Funds Flow Increase Funds generated from continuing operations increased $203 million or 13 per cent to $1.8 billion in 2002 compared to $1.6 billion in 2001.
Balance Sheet Strengthened In 2002, TransCanada continued to strengthen its balance sheet as it repaid debt maturities of $486 million, reduced notes payable by $46 million and increased shareholders’ equity by $320 million.
Dividend Increase On January 28, 2003, the Board of Directors of TransCanada raised the quarterly dividend on the company’s outstanding common shares eight per cent from $0.25 per share to $0.27 per share for the quarter ending March 31, 2003.
Growth in Core Businesses In 2002, TransCanada invested more than $800 million in its gas transmission and power businesses from internally generated cash flow.
CONSOLIDATED RESULTS-AT-A-GLANCE
Year ended December 31 |
| 2002 |
| 2001 |
| 2000 |
| |||
(millions of dollars except per share amounts) |
|
|
|
|
|
|
| |||
|
|
|
|
|
|
|
| |||
Net Income/(Loss) Applicable to Common Shares |
|
|
|
|
|
|
| |||
Continuing operations |
| 747 |
| 686 |
| 628 |
| |||
Discontinued operations |
| — |
| (67 | ) | 61 |
| |||
|
| 747 |
| 619 |
| 689 |
| |||
Net Income/(Loss) Per Share – Basic |
|
|
|
|
|
|
| |||
Continuing operations |
| $ | 1.56 |
| $ | 1.44 |
| $ | 1.32 |
|
Discontinued operations |
| — |
| (0.14 | ) | 0.13 |
| |||
|
| $ | 1.56 |
| $ | 1.30 |
| $ | 1.45 |
|
7
SEGMENT RESULTS-AT-A-GLANCE
Year ended December 31 |
| 2002 |
| 2001 |
| 2000 |
|
(millions of dollars) |
|
|
|
|
|
|
|
|
|
|
|
|
|
|
|
Transmission |
| 653 |
| 585 |
| 623 |
|
Power |
| 146 |
| 168 |
| 85 |
|
Corporate |
| (52 | ) | (67 | ) | (80 | ) |
Continuing operations |
| 747 |
| 686 |
| 628 |
|
Discontinued operations |
| — |
| (67 | ) | 61 |
|
Net Income Applicable to Common Shares |
| 747 |
| 619 |
| 689 |
|
Net income applicable to common shares for the year ended December 31, 2002, was $747 million or $1.56 per share. This compares to net income of $619 million or $1.30 per share in 2001 which included a net loss from discontinued operations of $67 million or $0.14 per share, and net income of $689 million or $1.45 per share in 2000, which included net income from discontinued operations of $61 million or $0.13 per share.
TransCanada’s net income applicable to common shares from continuing operations for the year ended December 31, 2002, was $747 million or $1.56 per share compared to $686 million or $1.44 per share for 2001 and $628 million or $1.32 per share for 2000. The increase in 2002 compared to 2001 is primarily due to higher earnings from the Transmission business and reduced expenses in the Corporate segment, partially offset by lower earnings from the Power segment. The increase in 2001 compared to 2000 was primarily due to higher earnings from the Power business, as well as reduced financial and preferred equity charges. In 2001, the Power segment earnings reflected the company’s ability to capture significant market opportunities created by high market prices and power price volatility.
In June 2002, TransCanada received the National Energy Board (NEB) decision on its Fair Return application (Fair Return decision) to determine the cost of capital to be included in the calculation of 2001 and 2002 final tolls on its Canadian Mainline. The results for the year ended December 31, 2002 include after-tax net income of $36 million or $0.08 per share representing the impact of the Fair Return decision for 2001 ($16 million) and 2002 ($20 million). The 2002 results also include $7 million relating to TransCanada’s proportionate share of a favourable ruling for Great Lakes Gas Transmission Limited Partnership (Great Lakes) with respect to Minnesota use tax paid in prior years. In 2002, TransCanada chose to expense stock options and the impact of this accounting change was a $2 million charge to net income for the year ended December 31, 2002.
Net income applicable to common shares from continuing operations in 2000 included gains on the sale of assets amounting to $30 million, after tax, or $0.06 per share, and tax recoveries of $28 million or $0.06 per share, reflecting the impact of tax law and income tax rate changes in the February 2000 and October 2000 Federal budgets.
TRANSCANADA – STRATEGY
TransCanada’s Mission is to be one of the most profitable, competitive and reliable providers of wholesale natural gas transportation and electric power across North America, with strong roots in the Western Canada Sedimentary Basin (WCSB) and key customer relationships in consuming regions.
8
TransCanada’s Strategies to achieve this mission continue to be:
• Sustain, grow and optimize the company’s North American natural gas transmission business;
• Establish a new regulated business model that provides value to customers, reduces the long-term risks of the Canadian long-haul pipelines and allows the company to earn a fair and competitive return;
• Grow the power business;
• Pursue operational excellence, with a focus on providing low-cost, reliable service to the company’s customers;
• Maintain and utilize the company’s strong financial position.
TRANSCANADA – DEVELOPMENTS
TransCanada’s focus on the disciplined implementation of the strategies resulted in strong financial performance in 2002 with increases in net income and operating cash flow, as well as the maintenance of a solid balance sheet. Strong internally generated cash flow allowed TransCanada to continue to repay debt maturities, invest in the core businesses of natural gas transmission and power, and maintain a strong liquidity position. In addition, TransCanada’s financial position and performance enabled the Board of Directors to raise the quarterly dividend on the company’s common shares from $0.20 per share in 2000, to $0.225 per share in 2001, to $0.25 per share in 2002, and to $0.27 per share for the quarter ended March 31, 2003.
The company’s access to capital markets remains strong. During 2002, TransCanada established a new $1.5 billion syndicated credit facility, replacing existing lines of credit set to expire in mid-2003, and also filed universal shelf prospectuses with Canadian and United States securities regulators qualifying for issuance $2 billion and US$1 billion of securities, respectively.
The company invested more than $800 million in natural gas transmission and power assets in 2002 pursuant to the strategies of growing and optimizing the natural gas transmission network and power business. In the Transmission business, TransCanada continued to connect incremental natural gas supply within the WCSB, expanded its pipeline system in western Alberta and British Columbia to meet growing demand in California and the Pacific Northwest, and achieved growth in its investments in North American Pipeline Ventures (NAPV). In 2002, TransCanada pursued pipeline opportunities to move Mackenzie Delta and Alaska North Slope natural gas to markets throughout North America. In the Power business, TransCanada started operations at two new power plants, completed the acquisition of the ManChief power plant and announced plans to acquire a 31.6 per cent equity interest in Bruce Power L.P. for $376 million, subject to closing adjustments.
TransCanada held extensive discussions with industry stakeholders throughout 2002 on a future business model for its Canadian regulated pipelines. These stakeholder discussions and TransCanada’s view of the future business model influenced the 2003 Canadian Mainline Tolls and Tariff Application filed with the NEB in September 2002 and the proposed rate design changes to the Alberta System filed with the Alberta Energy and Utilities Board (EUB) in January 2003. In June 2001, TransCanada filed the Fair Return application with the NEB, seeking an after-tax weighted average cost of capital (ATWACC) of 7.5 per cent to be included in the Canadian Mainline tolls for 2001 and 2002. In June 2002, following a hearing, the NEB released its decision not to adopt the ATWACC methodology, but did increase the deemed common equity from 30 per cent to 33 per cent.
9
Although disappointed with the NEB’s decision, which in TransCanada’s opinion does not adequately recognize the long-term business risks of the Canadian Mainline, the company remains committed to the Canadian pipeline business. In February 2003, the NEB denied TransCanada’s request for a review and variance of the Fair Return decision.
TRANSCANADA – OUTLOOK
TransCanada will continue to implement its strategy in 2003. The company’s main focus in 2003 will be to evaluate opportunities to grow and optimize the natural gas transmission and power businesses with a view to enhancing shareholder value and meeting customers’ unique requirements in a constantly changing marketplace. The company will also focus on TransCanada’s commitment to an operational excellence business model and advancement of the future business model for its Canadian regulated pipelines. The company’s earnings and cash flow, combined with the solid balance sheet and liquidity at December 31, 2002, provide the financial flexibility for TransCanada to make disciplined investments in the two core businesses, with a primary focus on the acquisition and construction of highly efficient and well-positioned assets.
In February 2003, TransCanada announced a settlement with the customers on the Alberta System. This settlement, if approved by the EUB, will result in a decline in the fixed revenue requirement from $1.347 billion in 2002 to $1.277 billion in 2003. A reduction in 2003 net earnings as a result of this settlement is expected to be approximately $40 million after tax. TransCanada worked with its customers to negotiate a settlement that represented a balance of customer and shareholder interests. However, the Fair Return decision rendered by the NEB had a significant impact on the terms of reaching the settlement, as it provided a benchmark for negotiations on the Alberta System.
TRANSCANADA – COMPETITIVE STRENGTHS
The company’s competitive strengths continue to be:
Transmission
• Unparalleled Market Access High capacity connections from the WCSB to premier North American markets give the company a strategic position in the continental natural gas market, offering producers the connectivity, penetration and flexibility they need to capitalize on growing demand. With the current capacity, infrastructure, market access, and ease of expansion offered by TransCanada’s transmission systems, the company has a competitive advantage in attracting new natural gas supply from the North and British Columbia.
• Experience and Expertise TransCanada has a half century of expertise in large diameter, cold weather natural gas pipeline construction. The company is a leading builder and operator of large gas turbine compressor stations, and is the operator of one of the largest, most sophisticated, remote-controlled pipeline networks in the world.
• Operational Excellence The company has a solid reputation for reliability and safety and is focused on providing low-cost, reliable service by utilizing and applying innovation and best practices.
Power
• Broad Understanding of Continental Markets TransCanada has extensive knowledge of North American energy markets, opportunities and competitors, with an in-depth understanding of the company’s core markets. In addition, the company has significant power deregulation experience.
10
• Ability to Structure Deals and Manage Risk The company’s analytical, deal structuring and risk management skills have been a key element of success, complemented by marketing operations to capitalize on opportunities presented by market volatility.
• Operational Excellence TransCanada’s power business is characterized by a commitment to industry-leading performance, as evidenced by a highly efficient generating fleet of turbines that operated at an average availability of 95 per cent in 2002. The company’s strong management team has a proven track record in maximizing value from existing assets and in developing quality opportunities, both in new acquisitions and greenfield projects.
TRANSCANADA – CHALLENGES AND OPPORTUNITIES
The two most significant challenges to TransCanada’s pipeline business in the long term are competition and the risk of declining supply in the WCSB. Over the past several years TransCanada has been working diligently with all stakeholders to provide value to its customers in the form of flexible, cost-competitive services and to earn a fair risk-adjusted return on its pipeline assets.
There will be significant opportunities to continue to grow TransCanada’s pipeline business. North American natural gas demand is expected to grow by more than 25 per cent over the next 10 years. There is considerable concern that supply from the traditional supply basins in North America will not be able to meet this increased demand for natural gas. Alternative supplies such as from Alaska, the Mackenzie Delta and liquefied natural gas (LNG) may be required to meet this demand. TransCanada is well-positioned to build and operate the infrastructure to bring these new supplies to market.
TransCanada’s high capacity connections from the WCSB to premier North American markets position the company well to move northern natural gas. TransCanada brings real competitive advantages to these projects. In the event that incremental LNG imports will be needed to meet market requirements in North America, TransCanada has the technology and pipeline capacity to bring this supply to market. Both the northern gas and LNG supplies are longer term prospects for TransCanada.
The growth of TransCanada’s power business faces a number of challenges, including the uncertainties related to deregulation, long-term availability of fuel at economic prices, excess power generation, and the price of power in the long term.
TransCanada’s strategy to grow its power business is supported by an expectation that the majority of the increase in natural gas demand is driven by the demand for power. Although there has been a significant increase in power supply in some markets over the past few years, TransCanada believes that there are niche opportunities available to build its power business. The increased demand for power and steam in the Alberta oil sands and other industrial sectors presents significant opportunities for growth. TransCanada has significant experience and competitive advantages in developing cogeneration facilities.
A key aspect to TransCanada’s growth strategy focuses on the acquisition of existing pipeline and power assets. As a result of economic turmoil experienced by certain of TransCanada’s competitors, the company expects to pursue acquisition opportunities that would create shareholder value.
11
Transmission
HIGHLIGHTS
Earnings Increase Net earnings from the Transmission business increased $68 million to $653 million in 2002 compared to $585 million in 2001. Contributing to this increase were the Alberta System – $10 million, Canadian Mainline – $33 million and NAPV – $24 million.
Alberta System The 2001/2002 Alberta System Rate Settlement (ASRS) expired at the end of 2002. Through a consultative process with major stakeholders, TransCanada reached a one-year settlement to establish a fixed revenue requirement for 2003. The settlement, together with proposed modifications to rate design, and new services currently before the EUB for approval, will form the basis of the Alberta System’s tolls for 2003.
Canadian Mainline In June 2002, TransCanada received the NEB’s Fair Return decision to determine the cost of capital to be included in the calculation of 2001 and 2002 tolls on TransCanada’s Canadian Mainline. Despite the fact that the NEB granted an increase in the Canadian Mainline’s deemed common equity ratio from 30 to 33 per cent, TransCanada was disappointed with this decision, and the NEB’s denial of the request for a review and variance of the Fair Return decision, because it did not adequately recognize the long-term business risks to the Canadian Mainline.
TRANSMISSION RESULTS-AT-A-GLANCE
Year ended December 31 |
| 2002 |
| 2001 |
| 2000 |
|
(millions of dollars) |
|
|
|
|
|
|
|
|
|
|
|
|
|
|
|
Wholly-Owned Pipelines |
|
|
|
|
|
|
|
Alberta System |
| 214 |
| 204 |
| 219 |
|
Canadian Mainline |
| 307 |
| 274 |
| 281 |
|
BC System |
| 6 |
| 5 |
| 6 |
|
|
| 527 |
| 483 |
| 506 |
|
North American Pipeline Ventures |
|
|
|
|
|
|
|
Great Lakes |
| 66 |
| 56 |
| 52 |
|
TC PipeLines, LP |
| 17 |
| 15 |
| 11 |
|
Iroquois |
| 18 |
| 16 |
| 13 |
|
Portland |
| 2 |
| (1 | ) | (2 | ) |
Foothills |
| 17 |
| 20 |
| 22 |
|
Trans Québec & Maritimes |
| 8 |
| 8 |
| 8 |
|
Tuscarora |
| — |
| — |
| 9 |
|
CrossAlta |
| 13 |
| 8 |
| 6 |
|
Northern Development |
| (6 | ) | (9 | ) | (3 | ) |
Other |
| (9 | ) | (11 | ) | 1 |
|
|
| 126 |
| 102 |
| 117 |
|
Net earnings |
| 653 |
| 585 |
| 623 |
|
ALBERTA SYSTEM
TransCanada’s 100 per cent owned natural gas transmission system in Alberta gathers natural gas for use within the province and delivers gas to provincial boundary points for connection with the Canadian Mainline, BC System and other pipelines. The 22,700 kilometre system is one of the largest carriers of natural gas in North America.
CANADIAN MAINLINE
TransCanada’s 100 per cent owned natural gas transmission system in Canada extends 14,900 kilometres from the Alberta/Saskatchewan border east to Québec/ Vermont and connects with other natural gas pipelines in Canada and the U.S.
BC SYSTEM
TransCanada’s 100 per cent owned natural gas transmission system extends 200 kilometres from Alberta’s western border through British Columbia to the U.S. border, serving markets in British Columbia as well as the Pacific Northwest, California and Nevada.
12
In 2002, net earnings from the Transmission business were $653 million, compared to $585 million and $623 million in 2001 and 2000, respectively. The increase in 2002 over 2001 was mainly due to the Canadian Mainline Fair Return decision, higher incentive earnings from wholly-owned pipelines, and higher earnings from TransCanada’s investment in Great Lakes. The decrease in 2001 over 2000 was mainly due to lower earnings from the Alberta System and Canadian Mainline as well as higher costs related to the company’s Northern Development activities.
WHOLLY-OWNED PIPELINES – FINANCIAL REVIEW
Alberta System Net earnings of $214 million in 2002 are $10 million higher than 2001 and $5 million lower than 2000. The increase over 2001 was primarily due to an interest refund of $4 million relating to a prior year income tax reassessment, and the expiry of TransCanada’s transition support costs with respect to the products and receipt point pricing structure introduced in 2000. Earnings in 2002 and 2001 were both lower than 2000 earnings as a result of a lower implicit rate of return on equity in the ASRS compared to the Cost Efficiency Incentive Settlement (CEIS) that expired at the end of 2000. Under the ASRS, the majority of the Alberta System revenue requirement for 2002 and 2001 was at negotiated amounts of $1.347 billion and $1.390 billion, respectively.
The Alberta System is one of the largest volume carriers of natural gas in North America and delivered 4,146 billion cubic feet (Bcf) of natural gas in 2002, as compared to deliveries of 4,059 Bcf in 2001 and 4,490 Bcf in 2000. The volumes transported by the Alberta System in 2002 represented approximately 17 per cent of total North American natural gas production and about 68 per cent of the natural gas produced in the WCSB.
The Alberta System is regulated by the EUB primarily under the provisions of the Gas Utilities Act (Alberta) (GUA) and the Pipeline Act (Alberta). Under the GUA, the rates, tolls and other charges, and terms and conditions of service are subject to the approval of the EUB.
Canadian Mainline The Canadian Mainline generated net earnings of $307 million in 2002, an increase of $33 million and $26 million compared to 2001 and 2000, respectively. The increase in net earnings in 2002 was primarily due to the Fair Return decision by the NEB in June 2002, which included an increase in the deemed common equity ratio from 30 to 33 per cent effective January 1, 2001. Net earnings in 2002 reflected the impact of the Fair Return decision for both 2001 and 2002. The increase in earnings was partially offset by a decline in the NEB approved rate of return on common equity from 9.90 per cent in 2000 to 9.61 per cent in 2001 to 9.53 per cent in 2002, combined with a lower average investment base.


13
Annual deliveries of natural gas on the Canadian Mainline totaled 2,630 Bcf in 2002, compared to deliveries of 2,450 Bcf in 2001 and 2,675 Bcf in 2000. In 2002, deliveries to export border points comprised approximately 53 per cent of total deliveries compared to approximately 50 per cent in 2001 and 2000.
The Canadian Mainline is regulated by the NEB. The NEB sets tolls which provide TransCanada the opportunity to recover projected costs of transporting natural gas and also provide a return on the Canadian Mainline average investment base. New facilities are approved by the NEB before construction begins. Changes in investment base, the rate of return on common equity, the level of deemed common equity, and the availability of incentive earnings affect the net earnings of the Canadian Mainline.
WHOLLY-OWNED PIPELINES – DEVELOPMENTS
Regulatory As part of TransCanada’s plan to establish a new regulated business model, the company held extensive discussions with industry stakeholders in early 2002. The new regulated business model proposes changes to TransCanada’s Canadian regulated pipeline business that would enhance the company’s ability to compete for future market demand and gas supply while bringing benefits to customers. This regulated business model is intended to advance the evolution of TransCanada’s rate and service offerings on all three of its wholly-owned pipelines (Alberta System, Canadian Mainline and BC System).
In the 2003 Canadian Mainline Tolls and Tariff Application, TransCanada seeks to increase the existing minimum bid floor price of IT from 80 per cent to 110 per cent of the Firm Transportation (FT) toll. This proposed change will better reflect the value associated with the reliability and flexibility currently inherent with IT, and will enhance the relative value of FT on the Canadian Mainline. TransCanada also proposes to establish a new geographic area in southwestern Ontario for tolling purposes. TransCanada believes the creation of this new tolling zone will increase market liquidity in the area, make TransCanada’s tolls more reflective of actual costs, and ultimately improve TransCanada’s competitiveness.
TransCanada has developed and filed for approval with the EUB proposed rate design changes to its Alberta System. The proposed changes include an intra-Alberta delivery toll, a short-haul transportation service, a price-matching service, and improved cost accountability for capacity expansions. Based on a settlement with its stakeholders, TransCanada applied in February 2003 to the EUB for approval of the 2003 revenue requirement.
Operational Excellence TransCanada continued its commitment to operational excellence in 2002 by advancing initiatives that will improve the company’s ability to provide low-cost, reliable and responsive service to customers. Fundamentally, TransCanada continues to pursue this strategy in order to become the preferred company that customers choose to connect new gas supplies and markets.
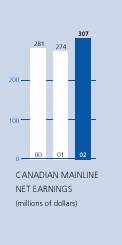


14
Objectives in 2002 that focused on improving levels of customer service to Transmission customers included enhancing TransCanada’s responsiveness to resolving customer issues, building effective relations with customers’ senior management, and consolidating and improving TransCanada’s information systems for managing customer transactions.
Specific 2002 objectives established within TransCanada’s operations and engineering functions included operating and maintenance cost-related targets, per unit capital costs, and maintenance and operating costs per gas volume transported. These objectives were met or exceeded.
Supply Growth In 2002, TransCanada continued to connect incremental gas supply within the WCSB, both in Alberta and British Columbia. The Northwest Mainline Expansion project was completed in early 2002. Located along the western edge of Alberta, this additional pipeline capacity accommodates incremental receipt contract volumes of approximately 415 million cubic feet per day (MMcf/d) to be transported from the Ladyfern area of British Columbia. The Narraway Extension project was also completed in 2002, and resulted in incremental volumes of approximately 100 MMcf/d from the Narraway and Cutbank areas of western Alberta. In addition, TransCanada negotiated a competitive service offering in the Suffield area of Alberta to retain natural gas supply, which would have otherwise bypassed the Alberta System.
The timely connection of these significant volumes has allowed TransCanada’s customers to take advantage of premium gas price environments. TransCanada will continue to grow by seeking new opportunities to connect additional gas supplies.
Market Growth TransCanada continues to pursue growth opportunities within existing and new natural gas markets. In 2002, TransCanada expanded its pipeline system in western Alberta and British Columbia by approximately 350 MMcf/d to meet growing market demand in California and the Pacific Northwest.
TransCanada continues to strengthen business relations with customers in the Fort McMurray area. This market, located in northeastern Alberta, is comprised of oil sands and upgrading plants that are heavily reliant on natural gas as a source of fuel. In 2002, TransCanada experienced steady growth of delivered gas volumes to this market. Looking forward, this market represents one of the largest growth opportunities for natural gas demand in North America. In other geographic regions of Alberta, TransCanada connected both new and expansion projects for existing and smaller markets.
WHOLLY-OWNED PIPELINES – OUTLOOK
TransCanada’s Transmission business has a long history of providing market access and connecting gas supply for its customers. As the marketplace has evolved and competition has grown, the wholly-owned pipelines business has focused on providing market-responsive products and services, a competitive cost structure, and world-class levels of reliability to its customers.
15
In 2003, the wholly-owned pipelines business will focus on achieving additional efficiency improvements in all aspects of the business, by maintaining focus on operational excellence and leveraging technological advancements. TransCanada will also continue to work collaboratively with all stakeholders on resolving jurisdictional issues, advancing regulated business model changes and addressing fair return challenges.
Looking forward, in order to replace declines in production, producers will continue to explore and develop other fields that are geologically similar to the Ladyfern project and unconventional supply such as the recently connected initial gas production from coal bed methane reserves to the Alberta System. As new reserves are developed in the WCSB, TransCanada will seek to connect these additional natural gas supplies to the Alberta System.
TransCanada’s net income is not directly affected by fluctuations in the commodity price of natural gas, but such fluctuations may influence both production levels and the natural gas basin from which North American users elect to purchase natural gas supplies. Under the current regulatory model, TransCanada’s net income from its wholly-owned pipelines is not materially affected by fluctuations in throughput.
Earnings In 2003, the net earnings from wholly-owned pipelines are expected to be significantly lower than in 2002.
For the Alberta System, the one-year fixed 2003 revenue requirement settlement reached between TransCanada and its stakeholders will negatively impact Alberta System’s 2003 net earnings by approximately $40 million after tax, as compared to 2002.
The 2002 Canadian Mainline earnings included the recognition of the impact of the Fair Return decision on 2001, which will not be repeated in 2003. The 2003 net earnings from the Canadian Mainline will depend on the outcome of the 2003 Tolls and Tariff Application currently before the NEB. Approval of the 2003 Tolls and Tariff Application as filed would significantly increase TransCanada’s revenue and cash flow due to increased depreciation. However, higher depreciation has a negative earnings impact due to the associated reduction of the investment base.
Capital Expenditures Total capital spending for the wholly-owned pipelines during 2002 was $272 million. Capital expenditures in 2002 included approximately $113 million to expand transmission capacity on the Alberta and BC Systems to serve growing markets in California and the Pacific Northwest. Capital spending in 2003 is expected to decrease by approximately $70 million from 2002, primarily due to lower capacity capital spending requirements.
16
WHOLLY-OWNED PIPELINES – BUSINESS RISKS
Competition and Regulation TransCanada faces competition at both the supply end and the market end of its system. The competition is a result of other pipelines accessing an increasingly mature WCSB. The construction of the Alliance Pipeline, a natural gas pipeline from northeast British Columbia to the Chicago area, and the continuing expiry of transportation contracts have resulted in significant reductions in firm contracted capacity on both the Alberta System and the Canadian Mainline. The Canadian Mainline has effectively become the “swing” pipeline out of the WCSB, absorbing the bulk of any volume swings in the supply area.
Based on TransCanada’s year-end 2001 estimates, the WCSB had remaining discovered reserves of 56 trillion cubic feet and a reserves-to-production ratio of approximately nine years at current levels of production. Additional reserves are continually being discovered to maintain the reserves-to-production ratio at close to nine years. Gas prices in the future are expected to be higher than long-term historical averages due to a tighter supply/demand balance which should stimulate exploration and production in the WCSB.
TransCanada’s Alberta System provides the major natural gas gathering and export transportation capacity for the WCSB. It does so by connecting to most of the gas processing plants in Alberta and then transporting gas to two large mainline systems for domestic and export deliveries. The Alberta System faces competition primarily from the Alliance Pipeline, which connects to some of the same gas plants. The maximum receipt capacity of the Alliance Pipeline is approximately 1.7 Bcf/d compared to TransCanada’s Alberta System average 2002 receipt volumes of 11.2 Bcf/d. Two bypass pipelines in southern Alberta connect to the Canadian Mainline and have a combined capacity of 0.4 Bcf/d. In addition, the Alberta System has faced, and will continue to face, increasing competition from other pipelines.
The Canadian Mainline is TransCanada’s cross-continent pipeline serving mid-western and eastern markets in Canada and the U.S. The demand for gas in TransCanada’s key eastern markets is expected to continue to increase, particularly to meet the expected growth in gas-fired power generation. TransCanada does, however, face competition for its transportation services to eastern Canadian markets and U.S. export points. The main source of this competition is the combination of the Alliance and Vector pipelines. Alliance transports gas from the WCSB to the U.S. Midwest, where Vector connects to Alliance and transports gas to Eastern Canada, essentially allowing a complete bypass of the Canadian Mainline. In addition, there are several smaller pipeline systems that compete with TransCanada for markets in Eastern Canada. TransCanada must also compete to retain and attract customers in the northeastern U.S. market where consumers have access to an array of supply options such as U.S. supplies, imported LNG supplies, and natural gas from the Canadian East Coast offshore supply basin. New market growth customers and existing customers with expiring FT contracts may take advantage of these alternatives.
17
The increased competitive environment has resulted in contract non-renewals on both the Alberta System and the Canadian Mainline. There are significant quantities of excess firm capacity available for IT service as a consequence of FT service contract non-renewals on the Canadian Mainline. As a result, IT service provides some shippers with flexibility and a level of reliability comparable to FT service. In 2002, IT service pricing for the Canadian Mainline was determined based on bids received by shippers with a floor price of 80 per cent of the FT price. The Canadian Mainline has had reductions in FT contracts for deliveries originating at the Alberta border and in Saskatchewan of approximately 2.1 Bcf/d, or approximately 31 per cent of its capacity. As a result of reduced contracted FT volumes, tolls have increased on the Canadian Mainline. However, the toll increases due to contract non-renewals are somewhat mitigated by higher volumes flowed under IT contracts. Looking forward, there is limited opportunity to reduce tolls by increasing volumes on the Canadian Mainline. The utilization of the Canadian Mainline is not expected to increase in the short to medium term as additional supply from the WCSB is expected to be absorbed by demand growth within Western Canada and higher flows on other pipeline systems.
One of the responses by the Transmission business towards increased competition has been to focus on changes to the regulated business model. TransCanada will continue to work with stakeholders in 2003 to advance various aspects of the company’s competitive business model for the Alberta System, Canadian Mainline and BC System.
For the Canadian Mainline, TransCanada has filed an application with the NEB in the 2003 Tolls and Tariff Application to increase the depreciation rate and further the company’s initiatives on services and pricing. The decisions by the NEB on TransCanada’s 2003 Tolls and Tariff Application may have an impact on TransCanada’s 2003 earnings. In February 2003, the NEB denied TransCanada’s request for a review and variance of the Fair Return decision. As a result, the company has concerns about the long-term implications of a financial return that discourages additional investment in existing Canadian natural gas transmission systems.
The EUB is currently considering holding a generic cost of capital inquiry for all Alberta utilities. TransCanada’s position is that the inquiry should not apply to the Alberta System. Should the EUB proceed with the inquiry and should the Alberta System be subject to the inquiry, TransCanada will fully advance its views on the level of returns that are required to induce investment in pipelines.
Safety TransCanada worked closely with regulators, customers and communities during 2002 to ensure the continued safety of employees and the public. In 2002, two line breaks occurred in relatively remote areas of Manitoba and Alberta resulting in minimal impact. Pipeline integrity expenditures, including increased spending as a result of these line breaks, are anticipated to be approximately $80 million in 2003 compared to $53 million in 2002. TransCanada continues to use a rigorous risk management system that focuses spending on issues and areas that have the largest impact on maintaining or improving the reliability and safety of the pipeline system.
18
Environment In 2002, TransCanada continued efforts to minimize the impact of operations on the environment through continuous improvements to the leak detection and repair program and blowdown emissions management program. Through the use of innovative technology, TransCanada is able to quantify leaks and prioritize them for repair. TransCanada also tested a new technology for minimizing the impacts from pipeline blowdowns. This technology incinerates gas that would have normally been vented after the use of a portable transfer compressor and, as a result, significantly reduces the amount of greenhouse gases emitted to the atmosphere.
For information on management of risks with respect to the Transmission business, see Risk Management.
NORTH AMERICAN PIPELINE VENTURES – FINANCIAL REVIEW
NAPV is comprised of TransCanada’s direct and indirect investment in various natural gas pipelines and pipeline-related businesses. NAPV also includes project development activities related to TransCanada’s pursuit of new natural gas pipeline and pipeline-related opportunities in the North and throughout North America.
TransCanada’s proportionate share of net income in 2002 from NAPV was $126 million compared to $102 million and $117 million in 2001 and 2000, respectively. The increased net earnings of $24 million in 2002 compared to 2001 were due to $17 million of higher earnings from U.S. affiliates which included TransCanada’s $7 million share of a favourable ruling for Great Lakes related to Minnesota use tax paid in prior years. Also contributing to higher earnings from U.S. affiliates were the increased ownership interests in Iroquois Gas Transmission System (Iroquois) and Portland Natural Gas Transmission System (Portland) acquired in mid-2001, higher transportation margins, and favourable exchange rates. While TransCanada recorded lower earnings from Foothills Pipe Lines Ltd. (Foothills) of $3 million due to a lower return on equity and declining rate base, this was more than offset by earnings from CrossAlta Gas Storage & Services Ltd. (CrossAlta) which increased significantly due to higher storage margins, increased storage capacity and reduced operating expenses. In addition, there was reduced spending on Northern Development in 2002 and increased earnings from TransGas de Occidente S.A. (TransGas) and TransCanada Pipeline Ventures Limited Partnership (Ventures LP).
NAPV’s net earnings of $102 million in 2001 decreased by $15 million compared to 2000. This decrease resulted from increased Northern Development and pipeline business development activities in 2001, and a one-time gain of $7 million from the sale of a 49 per cent interest in Tuscarora Gas Transmission Company (Tuscarora) to TC PipeLines, LP in 2000.
19
NORTH AMERICAN PIPELINE VENTURES – DEVELOPMENTS
In 2002, the Tuscarora and Ventures LP systems were expanded, an interest in Northern Border Partners, L.P. (NBPLP) was acquired, a settlement related to Portland’s rates was reached, and TransCanada continued its active participation in Northern Development.
Great Lakes In 2002, Great Lakes received a favourable ruling relating to Minnesota use tax paid in prior years. TransCanada’s share of this settlement was approximately $7 million.
TC PipeLines, LP TransCanada holds a 33.4 per cent interest in TC PipeLines, LP that in turn holds a 30 per cent interest in Northern Border Pipeline Company (Northern Border) and a 49 per cent interest in Tuscarora. In July 2002, TC PipeLines, LP increased its quarterly distribution from US$0.50 per unit to US$0.525 per unit. This represents the third increase in the partnership’s quarterly cash distribution since the commencement of operations in May 1999.
Iroquois Construction on Iroquois’ Eastchester Expansion is well under way. Some of the compression additions relating to this extension were placed in-service in November 2002 with the balance of the project expected to be complete and ready for in-service by mid-2003. This extension will extend Iroquois’ system from Long Island into New York City and will provide an additional 230 MMcf/d of new service into this market.
Portland Portland filed a rate application with the Federal Energy Regulatory Commission (FERC) in October 2001 that was approved and went into effect, subject to refund, in April 2002. Portland and customer representatives reached an agreement on new tolls and Portland submitted an uncontested agreement to the FERC in October 2002, which was approved in its entirety in January 2003. The lower depreciation rates and revised tolls should have a positive impact on Portland’s future earnings.
Northern Border Partners, L.P. In 2002, the company purchased an interest in NBPLP for $19 million, which provides TransCanada with a general partnership interest in NBPLP and a 17.5 per cent vote on the partnership policy committee. NBPLP owns the 70 per cent of Northern Border not owned by TC PipeLines, LP.
TQM Effective January 2003, TransCanada took over the field operations and administration functions of Trans Québec & Maritimes Pipeline Inc. (TQM). The transition phase should be mainly completed by the end of first quarter 2003.
CrossAlta TransCanada holds a 60 per cent interest in Crossfield Storage Joint Venture and is entitled to a similar share of the earnings of CrossAlta. CrossAlta reported strong results in 2002 due to higher storage margins, increased storage capacity and reduced operating costs.
GREAT LAKES
Great Lakes connects with the Canadian Mainline at Emerson, Manitoba and serves markets in central Canada and the eastern and midwestern U.S. TransCanada has a 50 per cent ownership interest in this 3,387 kilometre pipeline system.
NORTHERN BORDER
Northern Border is a 2,010 kilometre natural gas pipeline system which serves the U.S. Midwest with a connection from Foothills. TransCanada indirectly owns approximately 10 per cent of Northern Border through its 33.4 per cent interest in TC PipeLines, LP.
IROQUOIS
Iroquois connects with the Canadian Mainline and delivers natural gas to customers in northeastern U.S. TransCanada has a 40.96 per cent interest in this 604 kilometre pipeline system.
PORTLAND
Portland operates a 471 kilometre pipeline which connects with TQM near Pittsburg, New Hampshire and has delivery points in Massachusetts. TransCanada has a 33.29 per cent interest in Portland.
20
Northern Development In 2002, TransCanada pursued pipeline opportunities to move both Mackenzie Delta and Alaska North Slope natural gas to markets throughout North America. TransCanada worked with key stakeholders in the interest of participating in any potential pipeline project.
TransCanada and Foothills held discussions in 2002 with Alaska North Slope producers regarding rate design, capital costs, commercial terms and timing of the Alaska Highway Pipeline. These producers are seeking legislative changes in Washington D.C. and Alaska to facilitate construction of a pipeline. Legislative initiatives are expected to continue in Washington D.C. and Alaska in 2003 to advance a project.
TransCanada has proposed an integrated solution to move Arctic gas to various markets across North America. The integration comes from connecting both the Mackenzie Delta and Alaska pipelines with the existing Alberta System. The Alberta System would be expanded as required for the combined volume of Arctic gas and western Canadian production. Expansions downstream from Alberta would be sized to reflect expected market supply and demand conditions at the time of construction. TransCanada’s proposal provides producers with lower capital costs and significant market flexibility. The company continues to refine and discuss this plan with producers and other key stakeholders.
All costs incurred relating to Northern Development continue to be expensed as incurred.
NORTH AMERICAN PIPELINE VENTURES – STRATEGY AND OUTLOOK
TransCanada continues to actively pursue gas pipeline and pipeline-related development and acquisition opportunities in Canada and the U.S., where these opportunities are driven by strong customer demand and sound economics. With TransCanada’s strong financial position, the company is poised to capitalize on future acquisition and development opportunities. The company will continue to evaluate options in a disciplined fashion to maintain a strong financial position.
As world geo-political events develop, they will have an impact on the level of development of future and existing gas supplies worldwide. This could impact TransCanada directly with its involvement in the development of natural gas transportation solutions as producers access gas reserves in the North and Atlantic Canada, as well as existing facility expansions across North America.
TransCanada is poised to play a key role in Northern Development. While there are many issues to be resolved before this development moves forward, TransCanada has competitive advantages including expertise in the design, construction and operation of large diameter pipe in cold weather conditions. TransCanada is also the leading builder and operator of large gas turbine compressor stations, owns and operates one of the largest, most sophisticated, remote-controlled pipeline networks in the world, and has a solid reputation for safety and reliability.
TQM
TQM is a 572 kilometre natural gas pipeline system which connects with the Canadian Mainline and transports gas from Montréal to Québec City and to the Portland system. TransCanada holds a 50 per cent interest in TQM.
CROSSALTA
CrossAlta is an underground natural gas storage facility connected to TransCanada’s Alberta System, and is located near Crossfield, Alberta. CrossAlta has a working gas capacity of 47 Bcf with a maximum deliverability capability of 475 MMcf/d. TransCanada holds a 60 per cent interest in CrossAlta.
FOOTHILLS
Foothills carries natural gas for export from central Alberta to the U.S. border to serve markets in the U.S. Midwest, Pacific Northwest and California. TransCanada owns 50 per cent of Foothills, 69.5 per cent of Foothills (Sask.), 74.5 per cent of Foothills (Alta.) and 74.5 per cent of Foothills (South B.C.). Together, these pipeline systems total 1,040 kilometres in length.
21
NORTH AMERICAN PIPELINE VENTURES – BUSINESS RISKS
Foreign Exchange A significant amount of the revenue in this business segment is generated from U.S. pipeline affiliates. The performance of the Canadian dollar compared to the U.S. dollar would either positively or negatively impact this business segment’s results.
Throughput Risk Iroquois, Portland and Tuscarora all have long-term demand charge contracts in place with customers and as such, are virtually unaffected by changes in throughput. As transportation contracts expire on Great Lakes and Northern Border, these entities will be exposed to throughput risk and their revenues will experience some variability. Throughput risk is created by supply availability, economic activity, weather variability, and pricing of alternative fuels.
Insurance, Benefits and Interest Rates Insurance costs continue to rise as a result of events in the U.S. in 2001, while interest rates remain low. Also, the costs of employee benefits, particularly in the U.S., continue to increase. If these costs continue to rise and the economy recovers, resulting in increased interest rates, earnings of affiliated pipelines and businesses could be negatively impacted.
Regulation The U.S. partially-owned pipelines are regulated by the FERC while the Canadian partially-owned pipelines are regulated by the NEB. These regulators play a significant role in approving the pipelines’ return on equity, capital structure, tolls and system expansion.
NATURAL GAS THROUGHPUT VOLUMES
|
| 2002 |
| 2001 |
| 2000 |
|
(Bcf) |
|
|
|
|
|
|
|
|
|
|
|
|
|
|
|
Alberta System |
| 4,146 |
| 4,059 |
| 4,490 |
|
Canadian Mainline |
| 2,630 |
| 2,450 |
| 2,675 |
|
BC System |
| 371 |
| 395 |
| 408 |
|
Great Lakes |
| 863 |
| 804 |
| 898 |
|
Northern Border |
| 839 |
| 821 |
| 853 |
|
Iroquois |
| 340 |
| 314 |
| 344 |
|
Portland |
| 52 |
| 44 |
| 40 |
|
Tuscarora |
| 20 |
| 23 |
| 25 |
|
Foothills |
| 1,098 |
| 1,117 |
| 1,186 |
|
Trans Québec & Maritimes |
| 175 |
| 161 |
| 168 |
|
Ventures LP |
| 85 |
| 60 |
| 36 |
|
TUSCARORA
Tuscarora operates a 386 kilometre pipeline system transporting gas from Malin, Oregon to Wadsworth, Nevada with delivery points in northeastern California. TransCanada owns an aggregate 17.4 per cent interest in Tuscarora, of which 16.4 per cent is held through TransCanada’s interest in TC PipeLines, LP.
VENTURES LP
Ventures LP, which is 100 per cent owned by TransCanada, owns a 110 kilometre pipeline and related facilities which supply natural gas to the oil sands region of northern Alberta, and a 27 kilometre pipeline which supplies natural gas to a petrochemical complex at Joffre, Alberta.
TRANSGAS
TransGas is a 344 kilometre natural gas pipeline system which runs from Mariquita in the central region of Colombia to Cali in the southwest of Colombia. TransCanada holds a 46.5 per cent interest in this pipeline.
22
Power
HIGHLIGHTS
Earnings In a year characterized by a downturn in the power industry, TransCanada’s Power segment made a significant contribution to TransCanada’s earnings in 2002 through strong base earnings from its plants, asset optimization and successful marketing activities in the New England and Alberta markets.
Expanding Asset Base TransCanada completed the acquisition of ManChief, which increased TransCanada’s available power supply by 300 megawatts (MW). 2002 was the first year of operations for two new Alberta plants, Redwater and Carseland, with a third plant commencing operations in first quarter 2003.
Bruce Power L.P. TransCanada announced plans in December 2002 to acquire a 31.6 per cent equity interest in Bruce Power L.P., the operator and lessee of the Bruce nuclear power plant. This acquisition will indirectly increase TransCanada’s nominal generating capacity by 992 MW starting in February 2003 with an additional 486 MW expected in mid-2003, which represents 31.6 per cent of the total plant output.
Operational Excellence Average plant availability in 2002 was 95 per cent with an average of 96 per cent plant availability over the past three years.
POWER RESULTS-AT-A-GLANCE
Year ended December 31 |
| 2002 |
| 2001 |
| 2000 |
|
(millions of dollars) |
|
|
|
|
|
|
|
|
|
|
|
|
|
|
|
Northeastern U.S. operations |
| 149 |
| 159 |
| 68 |
|
Western operations |
| 131 |
| 149 |
| 59 |
|
Power LP investment |
| 36 |
| 39 |
| 33 |
|
General, administrative and support costs |
| (73 | ) | (49 | ) | (21 | ) |
Operating and other income |
| 243 |
| 298 |
| 139 |
|
Financial charges |
| (13 | ) | (24 | ) | (15 | ) |
Income taxes |
| (84 | ) | (106 | ) | (39 | ) |
Net earnings |
| 146 |
| 168 |
| 85 |
|
TransCanada’s Power business contributed $146 million of net earnings in 2002, a decrease of $22 million or 13 per cent, compared to very strong earnings of $168 million in 2001. This decrease is primarily attributable to TransCanada’s ability to capitalize on market opportunities in both Northeastern U.S. and Western Operations in 2001 that did not exist in 2002.
In 2002, TransCanada focused on sustaining a base level of earnings and reducing exposure to volatile market conditions through additional long-term sales arrangements and expanding the asset base. Net earnings in 2002 from the Northeastern U.S. Operations also included a full year of earnings from the Curtis Palmer hydroelectric facilities purchased in July 2001. Western Operations’ lower marketing margins in 2002 were partially offset by income from its expanding asset base. The Carseland and Redwater plants had their first full year of operations in 2002 and the ManChief plant was acquired in November 2002. Transactions under the Sundance B power purchase arrangement (PPA) also commenced in January 2002. TransCanada’s earnings in 2002 were lower from the investment in TransCanada Power, L.P. (Power LP) due to the unplanned outage at the Williams Lake plant in the first half of 2002, reduced enhancement opportunities, and a reduction in


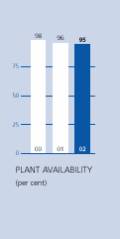
23
TransCanada’s ownership interest from 41.6 per cent to 35.6 per cent in Power LP, effective October 2001. The increase in general, administrative and support costs in 2002 compared to the two prior years reflects the increased activity in TransCanada’s Power business, as well as the company’s focus on future growth in this segment.
Power’s net earnings of $168 million in 2001 increased by $83 million compared to net earnings of $85 million in 2000. This increase reflected Power’s ability to take advantage of market opportunities in 2001 created by high prices and power price volatility in both Northeastern U.S. and Western Operations, the acquisition of the Curtis Palmer facility in July 2001, and the commencement of transactions under the Sundance A PPA. Power’s net earnings in 2000 included a $23 million after-tax gain on the sale of TransCanada’s interest in the Hermiston Power Partnership.
NOMINAL GENERATING CAPACITY OF POWER PLANTS
(MW) |
|
|
|
|
|
|
|
TransCanada Power |
|
|
|
Ocean State |
| 560 |
|
ManChief |
| 300 |
|
MacKay River(1) |
| 165 |
|
Carseland |
| 80 |
|
Bear Creek |
| 80 |
|
Curtis Palmer |
| 60 |
|
Redwater |
| 40 |
|
Cancarb |
| 27 |
|
|
|
|
|
Bruce Power L.P.(2) |
|
|
|
Bruce A(3) |
| 486 |
|
Bruce B(4) |
| 994 |
|
|
|
|
|
Power LP(5) |
|
|
|
Williams Lake |
| 66 |
|
Castleton |
| 64 |
|
Tunis |
| 43 |
|
Kapuskasing |
| 40 |
|
Nipigon |
| 40 |
|
North Bay |
| 40 |
|
Calstock |
| 35 |
|
|
|
|
|
Other(6) |
|
|
|
Sundance A |
| 560 |
|
Sundance B |
| 353 |
|
|
| 4,033 |
|
(1) Currently under construction.
(2) TransCanada’s purchase of a 31.6 per cent interest in Bruce Power L.P., which includes facilities consisting of eight nuclear reactors, was announced in December 2002 and closed in February 2003. The volumes in the table represent TransCanada’s 31.6 per cent interest.
(3) Bruce A consists of four 769 MW reactors, which are currently not operating. Two of the Bruce A units (3 and 4) are expected to be restarted and on-line by mid-2003, subject to receipt of all necessary regulatory approvals.
(4) Bruce B consists of four reactors, which are currently in operation, with a capacity of approximately 3,140 MW. The generating capacity of 994 MW includes two MW from TransCanada’s 17 per cent indirect share in Huron Wind L.P. which owns a nine MW wind farm.
(5) At December 31, 2002, TransCanada operated and managed Power LP and held a 35.6 per cent ownership interest in Power LP. The volumes in the table represent 100 per cent of plant capacity.
(6) TransCanada directly or indirectly acquires 560 MW from Sundance A and 353 MW from Sundance B through long-term PPAs, which represents 100 per cent of the Sundance A and 50 per cent of the Sundance B power plant output, respectively.
24
POWER – DEVELOPMENTS
TransCanada’s Power business had a strong performance in 2002 particularly considering the volatile and depressed market conditions. In a year in which the industry experienced many regulatory and market uncertainties, the Power business delivered on its growth objective through the acquisition of the ManChief plant, announcing its acquisition of a 31.6 per cent interest in Bruce Power L.P., a full year of operations at the Carseland and Redwater plants, and construction on the MacKay River and Bear Creek plants. Power also announced the formation of Portlands Energy Centre L.P., a partnership to assess the viability of developing a natural gas-fuelled energy centre to meet electricity needs in downtown Toronto. TransCanada continues to utilize its competitive strengths to seek acquisition and development opportunities that will complement the overall asset base and contribute positively to earnings and cash flow.
NORTHEASTERN U.S. OPERATIONS
Power’s Northeastern U.S. Operations consists of two primary businesses, power generation and power marketing, in the New England and New York markets.
TransCanada owns 100 per cent of Ocean State Power (OSP), a 560 MW gas-fired plant located in Rhode Island, and the 60 MW Curtis and Palmer (Curtis Palmer) hydroelectric facilities near Corinth, New York. OSP earns a FERC-regulated return on equity on its investment, which has a declining rate base. Additionally, TransCanada Power Marketing Limited (TCPM), TransCanada’s marketing affiliate in the region operating out of Westborough, Massachusetts, purchases 76.5 per cent of the output from OSP and re-markets this power to third parties for terms extending out to 2009. Output from Curtis Palmer is generated into the New York Power Pool and sold under a fixed-price, long-term power purchase agreement to Niagara Mohawk Power Corporation for a term of more than 25 years. Curtis Palmer enjoys a high capacity factor due to its strategic location just downstream of certain water storage facilities on the Hudson River. However, it is subject to variations in water levels.
TCPM has also contracted with third parties for additional supplies that are re-marketed in a portfolio of wholesale and large retail arrangements. This includes TCPM’s purchase of 100 per cent of the output of the 64 MW gas-fired combined-cycle plant located in Castleton-on-Hudson, New York (Castleton), which is owned by Power LP.
TransCanada’s continued success and growth in the northeastern U.S. is the direct result of a very efficient, controlled risk marketing operation. TCPM is focused on selling power under varying contract terms to wholesale and retail industrial customers while managing its portfolio of power supplies. Through active portfolio management, TCPM has positioned itself to capture market opportunities as they arise, while reducing downside exposure.
Northeastern U.S. Operations’ operating income of $149 million in 2002 was slightly lower than the unprecedented $159 million earned in 2001. Operating income in 2002 was strong considering the general retrenchment and softness of the wholesale power markets in 2002. The decrease year over year was primarily due to the ability throughout 2001 to capitalize on price volatility that was less prevalent in 2002, partially offset by a full year of earnings from the Curtis Palmer hydroelectric facilities purchased in July 2001. In 2002, TCPM substantially increased its earnings from, and presence in, the retail customer sector by
OCEAN STATE
The OSP plant is a 560 MW natural gas-fired, combined-cycle facility in Rhode Island.
CURTIS PALMER
The 60 MW Curtis Palmer facility near Corinth, New York is the company’s only hydroelectric facility. All output from this facility is sold through a fixed-price, long-term agreement.
CASTLETON
Castleton is a combined-cycle plant located at Castleton-on-Hudson, New York and is owned by Power LP.
25
selling more volumes and services to large industrial and commercial customers. In December 2002, OSP concluded an arbitration process with respect to its cost of fuel gas, which will substantially increase OSP’s costs. The matter is presently in another arbitration process in 2003 with a decision expected in second quarter of 2003.
Over the past five years, TCPM has firmly established itself as a leading energy provider in the New England power market. TransCanada continues to look for opportunities to augment its existing operations and successful marketing business in the region, including the potential to increase its presence in the New York market.
WESTERN OPERATIONS
The focus of Western Operations is to optimize and expand its existing asset base and maximize the potential rewards through a combination of long- and short-term contracts and low cost generation and supply. In addition to growing the Alberta cogeneration facilities, TransCanada’s Power business further diversified its Western portfolio in 2002 through the acquisition of the 300 MW ManChief plant.
Western Operations has two main components – Western Marketing and Plant Operations. Western Marketing consists of the power marketing operations originating out of the Calgary office, including marketing of generation from the Alberta plants and the purchase and resale of electricity related to the Sundance PPAs. Western Marketing also participates in marketing electricity across Canada and throughout the northern tier of the U.S. from Washington to Wisconsin. Plant Operations consists of contributions from TransCanada’s Alberta power plants, the newly acquired ManChief plant in Colorado, and fees earned to manage Power LP and operate its seven plants.
Operating income attributable to Western Operations decreased by 12 per cent from $149 million in 2001 to $131 million in 2002. Market opportunities that existed in 2001 resulting from high power prices (average Alberta Pool Price of $71/megawatt hour (MWh) in 2001 compared to $44/MWh in 2002) and price volatility in Western Canada and the Pacific Northwest regions did not carry over into 2002. However, this was partially offset by income from the Sundance B PPA and the Redwater, Carseland and ManChief plants.
The increase of $90 million in operating income from 2000 to 2001 was primarily due to the increased volumes commencing January 2001 from the acquisition of the 560 MW Sundance A PPA and increased commercial activity that capitalized on opportunities created by higher power prices and price volatility in Western Canada and the Pacific Northwest regions. Operating income in 2000 included a $26 million gain on sale of the Hermiston plant.
Western Marketing In December 2001, through a partnership arrangement, TransCanada effectively acquired 50 per cent of the remaining rights and obligations of the 706 MW Sundance B PPA. Beginning in January 2002, this acquisition provided TransCanada with an additional 353 MW of supply for the next 19 years. The Sundance A PPA that was acquired in August 2000 provides 560 MW of supply for a 17 year period.
MANCHIEF
In November 2002, TransCanada acquired the 300 MW simple-cycle ManChief facility near Brush, Colorado. The entire capacity of the natural gas-fired ManChief plant is sold under long-term tolling contracts that expire in 2012.
SUNDANCE A&B
The Alberta Sundance power plant is the largest coal-fired electrical generating facility in Western Canada. Through the Alberta PPA auction in August 2000, TransCanada acquired the Sundance A PPA, which increased the company’s power supply by 560 MW for a 17 year period commencing January 2001. In December 2001, TransCanada acquired 50 per cent of the 706 MW Sundance B PPA through a partnership arrangement, which increased the company’s power supply by 353 MW for approximately 19 years commencing January 2002.
26
In order to mitigate market price risk, TransCanada has sold essentially all of its Sundance PPA power supply in 2003 and 77 per cent of the expected, average combined power supply for the next three years. TransCanada continues to secure additional long-term sales contracts for the remaining Sundance power supply, as well as any uncontracted supply from its Alberta power plants.
Plant Operations Plant Operations is another area of success and growth for TransCanada. The expansion of this area is consistent with TransCanada’s focus on capitalizing on its expertise in developing new projects and becoming a prominent player in the Alberta market. The Carseland and Redwater cogeneration plants successfully completed their first year of operation in 2002.
The Bear Creek plant will begin commercial operations in first quarter 2003. This 80 MW cogeneration facility near Grande Prairie, Alberta will sell the majority of its power to Weyerhaeuser at its Grande Prairie Pulp Mill, as well as Weyerhaeuser’s other Alberta facilities. The construction of the MacKay River plant is continuing and is expected to be in operation in late 2003. This 165 MW cogeneration facility near Fort McMurray, Alberta will provide electricity and steam to Petro-Canada’s adjacent in-situ oil sands operations.
Both the Bear Creek and the MacKay River plants have followed the strategic power development model that was designed for Redwater and Carseland. Under this model, TransCanada is generally able to expand its portfolio of power plants while avoiding excessive price risk through the long-term sale of electricity and steam/heat to the adjacent industrial customer for a portion of the plant output while, at the same time, retaining a certain amount of merchant power capacity. Upon completion in late 2003, the MacKay River plant will be TransCanada’s largest power plant in Alberta, and will increase TransCanada’s directly controlled supply in the province to more than 1,300 MW.
TransCanada expanded its generation base in 2002 through the acquisition of the 300 MW ManChief facility. This facility is a simple-cycle, two-turbine facility near Brush, Colorado. The operations and maintenance services for the ManChief plant will continue to be supplied by the current contracted service provider, Colorado Energy Management, LLC. This new addition to TransCanada’s portfolio of generation assets meets the objective of creating stable and predictable cash flows as the entire capacity is sold under long-term tolling contracts that expire in 2012.
POWER LP INVESTMENT
Power LP Investment includes the earnings generated from holding TransCanada’s investment in TransCanada Power, L.P. which is Canada’s largest publicly-held, power-based income fund. Power LP owns six power plants in Canada and one in the U.S. that are fuelled by natural gas, waste heat, waste wood or a combination of the three.
CARSELAND
TransCanada completed construction of an 80 MW natural gas-fired cogeneration plant near Carseland, Alberta in September 2001, with commercial operation commencing in January 2002.
REDWATER
TransCanada completed construction of a 40 MW natural gas-fired cogeneration plant near Redwater, Alberta in November 2001, with commercial operation commencing in January 2002.
BEAR CREEK
Commercial operation of this 80 MW natural gas-fired cogeneration plant near Grande Prairie, Alberta commenced in first quarter 2003.
MACKAY RIVER
This 165 MW facility near Fort McMurray, Alberta is currently under construction. The expected completion date is late 2003.
27
TransCanada acts as manager for Power LP. In this capacity, TransCanada manages the operations and maintenance requirements of Power LP and minimizes its exposure to gas price fluctuations by locking in much of the required gas supply under predetermined long-term contracts. In addition, when market conditions warrant, TransCanada enhances the overall operating profits of Power LP by curtailing certain plants during off-peak hours and selling the displaced gas at attractive market prices, resulting in increased overall net earnings for Power LP.
Operating income from TransCanada’s investment in Power LP decreased $3 million or eight per cent compared to 2001 mainly as a result of decreased ownership throughout 2002 compared to 2001, reduced enhancement opportunities, and an unplanned outage at the Williams Lake plant in the first half of 2002. In October 2001, Power LP issued approximately 5.7 million units in a public offering which decreased TransCanada’s ownership interest from 41.6 per cent to 35.6 per cent. At December 31, 2002, the Power LP units closed at $30.90 on The Toronto Stock Exchange and TransCanada owned approximately 14.0 million units.
As noted, TransCanada provides management services to Power LP. This, combined with TransCanada’s ownership share, has resulted in Power LP being a key asset in growing TransCanada’s overall power business. Power LP has grown substantially since its inception in mid-1997 and will continue to pursue further growth in the future.
BRUCE POWER L.P.
In February 2003, the company completed the acquisitions of a 31.6 per cent interest in Bruce Power L.P. and an approximate 33.3 per cent interest in Bruce Power Inc., the general partner of Bruce Power L.P., for $376 million, subject to closing adjustments. TransCanada also funded a one-third share ($75 million) of a $225 million accelerated deferred rent payment to Ontario Power Generation (OPG).
TransCanada acquired the interests as part of a consortium (the Consortium) that includes Cameco Corporation (Cameco) and BPC Generation Infrastructure Trust, a trust established by the Ontario Municipal Employees Retirement System. Under the agreement, the Consortium acquired British Energy (Canada) Ltd. (British Energy), which owns a 79.8 per cent interest in Bruce Power L.P. as well as a 50 per cent interest in the nine MW Huron Wind L.P. power facility. Bruce Power L.P. is the tenant under a lease with OPG on the Bruce nuclear power facility. The lease expires in 2018 with an option to extend the lease by up to 25 years. The Bruce power facility will continue to be managed and operated by the management and staff of Bruce Power L.P. Spent fuel and decommissioning liabilities remain the responsibility of OPG.
TransCanada recorded this acquisition as an equity investment and will report the income as equity income.
Through the use of PPAs, Bruce Power L.P. has sold approximately 45 per cent of its expected combined Bruce A and B output for 2003, 40 per cent for 2004 and 30 per cent for 2005.
WILLIAMS LAKE
Power LP owns a 66 MW wood waste-fired power plant at Williams Lake, British Columbia.
CALSTOCK
Calstock is fuelled by a combination of waste wood and waste heat exhaust from the adjacent Canadian Mainline compressor station and is owned by Power LP.
NIPIGON, KAPUSKASING, TUNIS AND NORTH BAY
These efficient, enhanced combined-cycle facilities are fuelled by a combination of natural gas and waste heat exhaust from adjacent compressor stations on the Canadian Mainline and are owned by Power LP.
CANCARB
The 27 MW Cancarb power plant is fuelled by waste heat from TransCanada’s adjacent thermal carbon black facility.
28
POWER – STRATEGY AND OUTLOOK
TransCanada will capitalize on opportunities resulting from industry changes and grow through the addition of new power supplies. TransCanada will continue its pursuit of operational excellence as new plants are added. Expansion of Northeastern U.S. Operations and Western Operations will continue with a balanced portfolio of short-term marketing around existing operations and new opportunities combined with medium- to long-term sales to industrial customers. TransCanada will continue to market power generation to maximize the value of the portfolio of power assets and strengthen cash flows. The company will evaluate additional acquisition opportunities of various sizes in target markets that are consistent with its strategy, directly or through Power LP.
Power continues to have significant opportunities for growth in both the near and long term. The current state of the power industry provides both opportunities and challenges to TransCanada. A combination of acquisitions, greenfield developments and further expansions of its existing businesses will allow Power to grow in a way that will optimize the asset mix. TransCanada expects to encounter challenges including reduced power prices, higher input prices, and construction risks of new plants. In order to overcome these challenges, potential acquisition opportunities will include plants of varying fuel sources, such as the Bruce nuclear plant, to provide greater diversification in the company’s asset portfolio. TransCanada will draw on the company’s technical expertise and business models that have proved successful to date for new development projects. In addition, it will leverage off its market knowledge in the Alberta and New England deregulated markets as TransCanada increases its presence in Ontario.
The Ontario electricity market officially opened, at both wholesale and retail levels, on May 1, 2002. However, in November 2002, the government revised the marketplace through both statutes and regulations. Currently, rates for small consumers are capped at a maximum cost of 4.3 cents per kilowatt hour of power. This cap does not affect the wholesale market where TransCanada is primarily focused. The average wholesale price per kilowatt hour from May 2002 to February 2003 was approximately 30 per cent higher than the small consumer capped rate.
The net earnings from the Power business in 2003 are expected to be slightly higher than 2002 primarily due to TransCanada’s investment in the Bruce, ManChief and Bear Creek power plants. Power will continue to seek opportunities to enhance its solid base earnings from the remainder of the generation supply business through active marketing and management of its entire portfolio mix. Earnings opportunities may be limited due to factors such as fluctuating gas costs, regulatory changes, weather, lack of price volatility, plant availability and overall stability of the power industry. In terms of growing its generation portfolio, Power will look for investments that will continue to provide stable, predictable cash flows through substantially contracted revenue streams or electricity generation at the low end of the cost dispatch curve.
BRUCE POWER L.P.
In February 2003, TransCanada acquired a 31.6 per cent share of Bruce Power L.P., which owns the Bruce nuclear power plant located near Lake Huron, Ontario. This investment indirectly increased TransCanada’s nominal generating capacity by 992 MW, and an additional 486 MW is expected to be restarted and on-line in mid-2003.
29
POWER – BUSINESS RISKS
Plant Availability Maintaining plant availability is critical to the continued success of the Power business and this risk is mitigated through a commitment to excellent operating performance at each of its power plants. This same commitment will be applied in 2003 and future years. Unexpected plant outages may, however, require purchases at market prices to enable TransCanada to meet the company’s contractual power supply obligations.
Fluctuating Market Prices TransCanada operates in highly competitive markets that are driven mainly by price. Volatility in electricity prices is caused by market factors such as power plant fuel costs and fluctuating supply and demand which are greatly affected by weather, consumer usage and plant availability. These inherent market risks are managed through the use of long-term purchase and sales contracts for both electricity and plant fuels, control over generation output, matching physical plant contracts or PPA supply with customer demand, fee-for-service managed accounts rather than direct commodity exposure, and TransCanada’s overall risk management program with respect to general market and counterparty risks. The company’s risk management practices are described in the section on Risk Management and in Note 13 to the Consolidated Financial Statements.
Regulatory As the electricity markets evolve across North America, there is the potential for regulatory bodies to implement new rules that could negatively impact TransCanada as a generator and as a marketer. These may be in the form of price caps or attempts to control the wholesale market by encouraging new plant construction. TransCanada continues to monitor regulatory issues as well as participate in and lead discussions around these topics.
Weather Demand fluctuations caused by changes in temperature and weather patterns may create power price volatility and may have an earnings impact due to TransCanada’s requirements under certain long-term supply arrangements. Seasonal changes in temperature also affect the efficiency and output capability of natural gas-fired power plants. In addition, the seasonality of water flows on the Hudson River impacts the output and related earnings from the Curtis Palmer hydroelectric facility.
Uncontracted Volumes Although TransCanada seeks to secure sales under medium- to long-term contracts, TransCanada generally retains a small amount of unsold generation in the short term in order to provide flexibility in managing the portfolio of assets. The potential sale of this power in the open market is subject to market price volatility. Through the use of PPAs and other marketing arrangements, TransCanada has sold almost all of its expected power supply in 2003 and 70 to 80 per cent for the years 2004 to 2006.
30
Corporate
HIGHLIGHTS
Lower Net Expenses Net expenses in 2002 decreased $15 million or 22 per cent from 2001.
Cost Reductions In 2002, the company continued to reduce general and administrative costs related to discontinued operations.
CORPORATE RESULTS-AT-A-GLANCE
Year ended December 31 |
| 2002 |
| 2001 |
| 2000 |
|
(millions of dollars) |
|
|
|
|
|
|
|
|
|
|
|
|
|
|
|
General and administrative costs related to discontinued operations |
| 4 |
| 13 |
| 18 |
|
Indirect financial and preferred equity charges |
| 64 |
| 62 |
| 111 |
|
Interest income and other |
| (16 | ) | (8 | ) | (49 | ) |
Net expenses, after tax |
| 52 |
| 67 |
| 80 |
|
The Corporate segment reflects net expenses not allocated to specific business segments, including:
• General and Administrative Costs Related to Discontinued Operations Corporate overhead costs related to discontinued operations remain in the Corporate segment.
• Indirect Financial and Preferred Equity Charges Direct financial charges are reported in their respective business segments and are primarily associated with the debt and preferred securities related to the wholly-owned pipelines. Indirect financial charges primarily reside in the Corporate segment. These costs are directly impacted by the amount of debt TransCanada maintains and the degree to which TransCanada is impacted by fluctuations in interest rates.
• Interest Income and Other Interest income is earned on invested cash balances.
Net expenses, after tax, in the Corporate segment, were $52 million in 2002 compared to $67 million in 2001 and $80 million in 2000.
The decrease in 2002 from 2001 is primarily due to lower general and administrative expenses to support discontinued operations and the positive impact of lower interest rates offset by increased Corporate financial charges resulting from the Fair Return decision. The decrease in 2001 from 2000 is primarily due to lower financial and preferred equity charges as a result of lower net debt balances and the redemption of preferred securities, partially offset by tax recoveries of $28 million recorded in 2000 to reflect the impact of tax law and income tax rate changes. Financial charges in 2001 reflect a full year’s impact of the 2000 debt reductions as well as additional debt reductions in 2001.
Results for 2001 and 2000 included an adjustment of $5 million and $(2) million to foreign currency gains/(losses), respectively, reflecting the January 1, 2002 required retroactive adoption of an accounting change issued by the Canadian Institute of Chartered Accountants (CICA) related to foreign currency translation. There was no impact as a result of this accounting change in 2002.
31
Liquidity and Capital Resources
HIGHLIGHTS
Funds Flow Increase Funds generated from continuing operations increased $203 million or 13 per cent in 2002 compared to 2001.
Sustained Growth Total capital expenditures including acquisitions have exceeded $3.0 billion over the past three years.
Debt Reduction The company’s repayment of long-term debt and redemption of preferred shares and securities has exceeded $4.0 billion over the past three years.
Dividend Increase TransCanada’s Board of Directors has increased quarterly common share dividend payments for the past three consecutive years, including an eight per cent increase from $0.25 to $0.27 for the quarter ended March 31, 2003.
Funds Generated from Operations Funds generated from continuing operations were $1.8 billion for the year ended December 31, 2002 compared with $1.6 billion and $1.5 billion for 2001 and 2000, respectively. The Transmission business was the primary source of funds generated from operations for each of the three years.
The company also reduced long-term debt, preferred shares and securities in each of the past three years. TransCanada’s ability to generate adequate amounts of cash in the short term and the long term when needed, and to maintain financial capacity and flexibility to provide for planned growth, remained as strong at December 31, 2002 as in the past few years.
Investing Activities Capital expenditures, excluding acquisitions, totalled $599 million in 2002 compared to $492 million and $812 million in 2001 and 2000, respectively. Expenditures in all three years related primarily to maintenance and capacity capital in TransCanada’s Transmission business and construction of new power plants in Alberta.
During 2002, TransCanada acquired the ManChief power plant for $209 million and a general partnership interest in NBPLP for $19 million. During 2001, TransCanada acquired the Curtis Palmer Hydroelectric Company, L.P. for $438 million, and through a partnership, effectively acquired 50 per cent of the rights and obligations of the 706 MW Sundance B PPA for $110 million.
TransCanada’s 2001 and 2000 investing activities also include proceeds of $1.17 billion and $2.23 billion, respectively, from the sale of non-core assets under the company’s divestiture plans.
Financing Activities TransCanada used a portion of its cash resources to repay debt maturities of $486 million and reduce notes payable by $46 million in 2002 and repay debt maturities of $793 million and redeem preferred securities of $318 million in 2001. In 2001, TransCanada increased notes payable by $186 million. In 2000, TransCanada used proceeds on disposition of assets, together with cash flow from operations, to repurchase or redeem approximately $2.5 billion in long-term debt and preferred shares and reduce notes payable by $25 million. Dividends and preferred securities charges amounting to $546 million were paid in 2002 compared to $517 million and $536 million in 2001 and 2000, respectively.

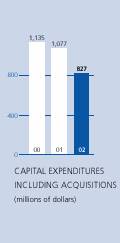

32
In January 2003, TransCanada’s Board of Directors approved an increase in the quarterly common share dividend payment from $0.25 per share to $0.27 per share for the quarter ended March 31, 2003. This was the third consecutive year of dividend increase. In January 2002, TransCanada’s Board of Directors approved an increase in the quarterly common share dividend payment from $0.225 per share to $0.25 per share for the quarter ended March 31, 2002. In January 2001, TransCanada’s Board of Directors approved an increase from $0.20 per share to $0.225 per share for the quarter ended March 31, 2001.
Net cash used in financing activities includes TransCanada’s proportionate share of the net reduction in non-recourse debt of joint ventures amounting to $36 million in 2002 compared to $109 million in 2001. Net cash provided by non-recourse joint venture debt activities was $122 million in 2000.
Credit Activities In 2002, TransCanada filed shelf prospectuses in Canada and the U.S. qualifying for issuance $2 billion of common shares, preferred shares and/or debt securities including medium-term notes and US$1 billion of common shares, preferred shares and/or debt securities, respectively. Any offer to sell securities under these shelf prospectuses will only be made by means of prospectus supplements filed with the appropriate securities regulatory authorities.
In December 2002, TransCanada established a new $1.5 billion syndicated credit facility, replacing existing lines set to expire in mid-2003. The new facility is comprised of a $1.0 billion tranche with a three-year term and a $500 million tranche with a 364-day term with a two-year term out option. Both tranches are extendible on an annual basis and are revolving unless during a term out period.
At December 31, 2002, TransCanada had total credit facilities of $2.0 billion which support the company’s commercial paper program and general corporate purposes. At December 31, 2002, the company had used approximately $269 million of its total lines of credit for letters of credit to support its ongoing commercial arrangements.
Credit ratings on the company’s senior unsecured debt assigned by Dominion Bond Rating Service Limited (DBRS), Moody’s Investors Service (Moody’s) and Standard & Poor’s are currently A, A2 and A-, respectively. On December 23, 2002, Standard & Poor’s placed its rating of TransCanada’s senior unsecured debt on ‘CreditWatch’ with negative implications. DBRS and Moody’s continue to maintain a ‘stable’ outlook.
Obligations and Commitments Total long-term debt at December 31, 2002 was $9.3 billion compared to $9.8 billion at December 31, 2001. TransCanada’s share of total non-recourse debt of joint ventures at December 31, 2002 was $1.3 billion, consistent with the prior year-end. Total notes payable, including those of joint ventures, at December 31, 2002 were $297 million compared to $343 million at December 31, 2001. The debt and notes payable of joint ventures are non-recourse to TransCanada. The security provided by each joint venture is limited to the rights and assets of that joint venture and does not extend to the rights and assets of TransCanada, except to the extent of TransCanada’s investment.
33
At December 31, 2002, mandatory retirements resulting from maturities and sinking fund obligations related to long-term debt and the company’s proportionate share of the non-recourse debt of joint ventures are as follows.
MANDATORY RETIREMENTS
Year ended December 31 |
| 2003 |
| 2004 |
| 2005 |
| 2006 |
| 2007 |
| 2008+ |
|
(millions of dollars) |
|
|
|
|
|
|
|
|
|
|
|
|
|
|
|
|
|
|
|
|
|
|
|
|
|
|
|
Long-term debt |
| 517 |
| 386 |
| 375 |
| 453 |
| 621 |
| 6,980 |
|
Non-recourse debt of joint ventures |
| 75 |
| 42 |
| 462 |
| 26 |
| 24 |
| 668 |
|
Total retirements |
| 592 |
| 428 |
| 837 |
| 479 |
| 645 |
| 7,648 |
|
At December 31, 2002, future annual payments, net of sub-lease receipts, for the next five years under operating leases for various premises are approximately as follows.
OPERATING LEASE PAYMENTS
Year ended December 31 |
| 2003 |
| 2004 |
| 2005 |
| 2006 |
| 2007 |
|
(millions of dollars) |
|
|
|
|
|
|
|
|
|
|
|
|
|
|
|
|
|
|
|
|
|
|
|
Minimum lease payments |
| 27 |
| 25 |
| 25 |
| 24 |
| 22 |
|
Amounts recoverable under sub-leases |
| (9 | ) | (7 | ) | (7 | ) | (7 | ) | (6 | ) |
Net payments |
| 18 |
| 18 |
| 18 |
| 17 |
| 16 |
|
The company will fund its pension plans during 2003 in an amount that is expected to be approximately double the $54 million contributed during 2002. This increased funding is due to investment performance in 2002 below long-term expectations, continued reductions in discount rates used to calculate plan liabilities, and one-time plan design changes.
At December 31, 2002, TransCanada held a 35.6 per cent interest in Power LP which is a publicly-held limited partnership. On June 30, 2017, the partnership will redeem all units outstanding, not held directly or indirectly by TransCanada, at their then fair market value, being the average of the fair market values assigned thereto by independent valuators, plus all declared and unpaid distributions of distributable cash thereon (the Redemption Price). The Redemption Price will be satisfied by TransCanada in cash or, at the election of TransCanada, in common shares of TransCanada or a combination of cash and common shares.
TransCanada has established a $50 million operating line of credit to Power LP, available on a revolving basis. As at December 31, 2002, the amount borrowed against this line of credit was $37 million compared to $16 million at December 31, 2001.
At December 31, 2002, TransCanada held a 33.4 per cent interest in TC PipeLines, LP which is a publicly-held limited partnership. On May 28, 2001, TC PipeLines, LP renewed its $40 million unsecured two-year revolving credit facility (TransCanada Credit Facility) with a subsidiary of TransCanada. At December 31, 2002 and 2001, the partnership had no amount outstanding under the TransCanada Credit Facility.
34
The company had no outstanding guarantees related to the long-term debt of unrelated third parties at December 31, 2002. TransCanada and its affiliates have long-term natural gas transportation and natural gas purchase arrangements as well as other purchase obligations, all of which are or were transacted at market prices and in the normal course of business.
TransCanada has guaranteed the equity undertaking of a subsidiary which supports the payment of debt obligations of TransGas, in the event a change of law would result in insufficient funds in TransGas to pay the interest and principal on its public US$206 million debt obligations. The company has an indirect 46.5 per cent interest in TransGas. Under the terms of the agreement, the company severally, with another major multinational company, may be required to fund more than its proportionate share of debt obligations of TransGas in the event that the minority shareholders fail to contribute. Any payments made by TransCanada under this agreement convert into shares of TransGas. The potential exposure is contingent on the impact of any change of law on TransGas’ ability to service the debt. From the issuance of the debt in 1995 to date, there has been no change in applicable law and thus no exposure to TransCanada. The debt matures in 2010. The company has made no provision related to this guarantee.
Upon the acquisition of Bruce Power L.P., the Consortium members guaranteed on a several, pro-rata basis certain contingent financial obligations of Bruce Power L.P. related to operator licences, the lease agreement, power sales agreements and contractor services. TransCanada’s share of the net exposure under these guarantees at the time of closing was estimated to be approximately $260 million.
Contingencies The California Attorney General has filed a complaint for civil penalties in California Superior Court under the California Business and Professions Code.
The complaint alleges that certain TransCanada subsidiaries and affiliates engaged in sales or purchases of electricity in California for which they failed to comply with the filing requirements of the Federal Power Act and FERC orders. TransCanada believes the actions of its subsidiaries and affiliates were in compliance with the Federal Power Act and FERC requirements. TransCanada considers the complaint to be without merit and is vigorously defending it. The company has made no provision for any potential liability.
The Canadian Alliance of Pipeline Landowners’ Associations and two individual landowners have commenced an action under Ontario’s Class Proceedings Act, 1992, against TransCanada and Enbridge Inc. for damages alleged to arise from the creation of a control zone within 30 metres of the pipeline pursuant to section 112 of the NEB Act. The company believes the claim is without merit and will vigorously defend the action. The company has made no provision for any potential liability. A liability, if any, would be dealt with through the regulatory process.
The company and its subsidiaries are subject to various other legal proceedings and actions arising in the normal course of business. While the final outcome of such legal proceedings and actions cannot be predicted with certainty, it is the opinion of management that their resolution will not have a material impact on the company’s consolidated financial position or results of operations.
35
RISK MANAGEMENT
Risk Management Overview TransCanada and its subsidiaries are exposed to market, financial and counterparty risks in the normal course of their business activities. The risk management function assists in managing these various business activities and the risks associated with these activities. A strong commitment to a risk management culture by management supports this function. TransCanada’s primary risk management objective is to protect earnings and cash flow and ultimately, shareholder value.
The risk management function is guided by the following principles that are applied to all businesses and risk types:
• Board Oversight Risk strategies, policies and limits are subject to Board of Directors’ review and approval.
• Independent Review Risk-taking activities are subject to independent review, separate from the business lines that initiate the activity.
• Assessment Processes are in place to ensure that risks are properly assessed at the transaction and counterparty levels.
• Review and Reporting Risk profiles of counterparties are subjected to ongoing review and reporting to executive management.
• Accountability Business lines are accountable for all risks and the related returns for their particular businesses.
• Audit Review Individual risks are subject to internal audit review, with independent reporting to the Audit and Risk Management Committee of the Board of Directors.
The processes within TransCanada’s risk management function are designed to ensure that risks are properly identified, quantified, reported and managed. Risk management strategies, policies and limits are designed to ensure TransCanada’s risk-taking is consistent with its business objectives and risk tolerance. Risks are managed within limits ultimately established by the Board of Directors and implemented by senior management, monitored by risk management personnel and audited by internal audit personnel.
TransCanada manages market risk exposures in accordance with its corporate market risk policy and position limits. The company’s primary market risks result from volatility in commodity prices, interest rates, foreign currency exchange rates and the failure of counterparties to meet contractual financial obligations.
Senior management reviews these exposures and reports to the Audit and Risk Management Committee of the Board of Directors regularly.
Power Marketing Price Risk Management In order to manage market risk exposures created by fixed and variable pricing arrangements at different pricing indices and delivery points, the company enters into offsetting physical positions and derivative financial instruments. Market risks are quantified using value-at-risk methodology and are reviewed weekly by senior management.
Financial Risk Management TransCanada monitors the financial market risk exposures relating to its investments in foreign currency denominated net assets, its regulated and non-regulated long-term debt portfolios and its foreign currency exposure on transactions. The market risk exposures created by these business activities are managed by establishing offsetting positions or through the use of derivative financial instruments.
36
The company’s financial risk management practices are further described under Foreign Exchange and Interest Rate Management Activity in Note 13 to the Consolidated Financial Statements.
Counterparty Risk Management Counterparty risk entails a counterparty’s ability to meet its obligations in a timely manner as outlined under the terms and conditions of its contracts. Counterparty risk is mitigated by conducting financial and other assessments to establish a counterparty’s creditworthiness, setting exposure limits and monitoring exposures against these limits, and, where warranted, obtaining financial assurances.
The company’s counterparty risk management practices and positions are further described under Credit Risk in Note 13 to the Consolidated Financial Statements.
Risks and Risk Management Related to the Kyoto Protocol Once the details of the Canadian government’s implementation plans with respect to the Kyoto Protocol are clarified, TransCanada will be better able to assess the degree of impact to the company’s business. Anything that adds costs to the company’s services and products makes TransCanada less competitive. Studies suggest there could be a significant drop in WCSB oil and gas activity, thereby reducing throughputs on the company’s pipeline system and substantially increasing the costs of doing business.
Over the past few years, working in partnership with energy producers and consumers on a voluntary basis, TransCanada’s focus has been, and continues to be, on developing options for reducing greenhouse gas (GHG) emissions. This is being achieved through technical and operational improvements, driven in large part by improved fuel efficiency, cleaner combustion and the elimination of methane emissions. TransCanada’s current position is that operating initiatives that reduce GHG at the source are more appropriate than other mechanisms.
Disclosure Controls and Procedures, and Internal Controls Pursuant to the Sarbanes-Oxley Act as adopted by the U.S. Securities and Exchange Commission, TransCanada’s management evaluates the effectiveness of the design and operation of the company’s disclosure controls and procedures (disclosure controls) and internal controls for financial reporting (internal controls). This evaluation is done under the supervision of, and with the participation of, the Chief Executive Officer and the Chief Financial Officer.
Disclosure controls are procedures designed to ensure that information required to be disclosed in reports filed with securities regulatory agencies is recorded, processed, summarized and reported on a timely basis, and that TransCanada’s management, including the Chief Executive Officer and the Chief Financial Officer, can make timely decisions utilizing such information. Internal controls are procedures designed to provide reasonable assurance that transactions are properly authorized, assets are safeguarded against unauthorized or improper use, and transactions are properly recorded and reported. The risk management controls provide significant support to the disclosure and internal controls.
37
Within 90 days prior to the filing of this Annual Report, TransCanada’s management evaluated the effectiveness of disclosure controls and internal controls. Based on that evaluation, the Chief Executive Officer and the Chief Financial Officer have concluded that:
• �� TransCanada’s disclosure controls are effective in ensuring that material information relating to TransCanada is made known to management on a timely basis, and is included in this Annual Report;
• TransCanada’s internal controls are effective in providing assurance that the consolidated financial statements for 2002 are fairly presented.
To the best of these officers’ knowledge and belief, there have been no significant changes in internal controls or in other factors that could significantly affect internal controls subsequent to the date on which such evaluation was completed in connection with this Annual Report.
CRITICAL ACCOUNTING POLICY
The company accounts for the impacts of rate regulation in accordance with generally accepted accounting principles (GAAP) as outlined in Note 1 to the Consolidated Financial Statements. Three criteria must be met to use these accounting principles: the rates for regulated services or activities must be subject to approval by a regulator; the regulated rates must be designed to recover the cost of providing the services or products; and it must be reasonable to assume that rates set at levels to recover the cost can be charged to and will be collected from customers in view of the demand for services or products and the level of direct and indirect competition. Management believes that all three of these criteria have been met. The most significant impact from the use of these accounting principles is that in order to achieve a proper matching of revenues and expenses, the timing of recognition of certain expenses and revenues may differ from that otherwise expected under GAAP. The two most significant examples of this relate to the recording of income taxes on the taxes payable basis and the deferral of foreign exchange losses as outlined in the Consolidated Financial Statements’ Note 14 and Note 8, respectively.
CRITICAL ACCOUNTING ESTIMATES
Since a determination of many assets, liabilities, revenues and expenses is dependent upon future events, the preparation of the company’s consolidated financial statements requires the use of estimates and assumptions which have been made using careful judgment. TransCanada’s critical accounting estimates are:
Deferred After-Tax Gains and Remaining Obligations Related to the Gas Marketing Business TransCanada remains contingently liable pursuant to obligations under certain contracts that relate to the divested Gas Marketing business. In 2001, the company deferred recognition of after-tax gains on sales of approximately $100 million which remain in the December 31, 2002 balance sheet provision for loss on discontinued operations. The company uses estimates to determine its exposure to these contracts. These estimates primarily relate to future market prices. This obligation is further described in Discontinued Operations.
38
Depreciation Expense TransCanada’s plant, property and equipment are depreciated on a straight-line basis over their estimated useful lives. Depreciation expense for the year ended December 31, 2002 was $848 million. Depreciation expense impacts the Transmission and Power segments of the company. In the Transmission business, depreciation rates are approved by the regulators and recoverable based on the cost of providing the services or products. A change in the estimation of the useful lives of the plant, property and equipment in the Transmission segment would therefore have no material impact on TransCanada’s net income but would directly impact the funds generated from operations.
ACCOUNTING CHANGES
Price Risk Management In 2002, the company adopted accrual accounting for energy trading contracts in its continuing operations, changing from its previous policy of mark-to-market accounting for these contracts. This accounting change has been applied retroactively with restatement of prior periods. This change eliminates unrealized gains and losses on energy trading contracts recognized under mark-to-market accounting. See Note 2 to the Consolidated Financial Statements for the impact of this accounting change.
Foreign Currency Translation In 2002, TransCanada adopted the amendment to the CICA Handbook Section “Foreign Currency Translation”. This amendment eliminates the deferral and amortization of unrealized translation gains and losses on foreign currency denominated monetary items that have a fixed or ascertainable life extending beyond the end of the fiscal year following the current reporting period. This accounting change was applied retroactively with restatement of prior periods. See Note 2 to the Consolidated Financial Statements for the impact of this accounting change.
Stock-Based Compensation In 2002, TransCanada adopted the new standard of the CICA Handbook Section “Stock-Based Compensation and Other Stock-Based Payments”. This section establishes standards for the recognition, measurement and disclosure of stock-based compensation and other stock-based payments made in exchange for goods and services. It applies to transactions in which an enterprise grants shares of common stock, stock options, or other equity instruments, or incurs liabilities based on the price of common stock or other equity instruments. This standard allows companies to either expense, over the vesting period, the fair value of the stock options granted or to disclose this impact. The company has chosen to expense stock options. This new standard has been applied prospectively. See Note 2 to the Consolidated Financial Statements for the impact of this accounting change.
Disclosure of Guarantees In 2002, TransCanada adopted the new Accounting Guideline “Disclosure of Guarantees” issued by the Accounting Standards Board of the CICA that requires a guarantor to disclose significant information about guarantees it has provided, without regard to whether it will have to make any payments under the guarantees. See Note 18 to the Consolidated Financial Statements.
39
Hedging Relationships In November 2001, the Accounting Standards Board of the CICA issued an Accounting Guideline “Hedging Relationships” that establishes standards for the documentation and effectiveness of hedging relationships. These standards are substantially similar to the corresponding requirements under Statement of Financial Accounting Standards (SFAS) No. 133 which was adopted by the company for U.S. GAAP purposes, effective January 1, 2001. The company does not expect the new Canadian requirement to have a significant impact on its financial statements.
Disposal of Long-Lived Assets and Discontinued Operations In November 2002, the CICA issued a new Handbook Section “Disposal of Long-Lived Assets and Discontinued Operations”. This Section establishes new standards for the recognition, measurement, presentation and disclosure of the disposal of long-lived assets. It also establishes standards for the presentation and disclosure of discontinued operations, whether or not they include long-lived assets. This Section will be effective for the company on a prospective basis after May 1, 2003 and will not result in restatement of income for prior periods.
Impairment on Long-Lived Assets In November 2002, the CICA issued a new Handbook Section “Impairment on Long-Lived Assets”. This Section establishes new standards for the recognition, measurement and disclosure of the impairment of long-lived assets and establishes new write-down provisions. This Section will be effective for the company as of January 1, 2004 and is not expected to have a significant impact on the company’s financial statements.
Asset Retirement Obligations In January 2003, the CICA issued a new Handbook Section “Asset Retirement Obligations”. The new Section focuses on the recognition and measurement of liabilities for obligations associated with the retirement of property, plant and equipment when those obligations result from the acquisition, construction, development or normal operation of the assets. The Section requires that the fair value of a liability for an asset retirement obligation be recognized in the period in which it is incurred if a reasonable estimate of fair value can be made. The fair value is added to the carrying amount of the associated asset. The liability is accreted at the end of each period through charges to operating expenses. This Section will be effective for the company as of January 1, 2004 and is not expected to have a significant impact on the company’s financial statements.
40
Discontinued Operations
FINANCIAL REVIEW
In July 2001, the Board of Directors approved a plan to dispose of the company’s Gas Marketing business. The Gas Marketing business provided supply, transportation and asset management services, as well as structured financial products and services, to its customers in Canada and the northern tier of the U.S. In December 1999, the Board of Directors approved a plan (December Plan) to dispose of the company’s International, Canadian midstream and certain other businesses.
These businesses are accounted for as discontinued operations. The net income/(loss) and cash provided from/(used in) operations are presented as discontinued operations in the Consolidated Statements of Income and Cash Flows. The net assets of discontinued operations included in the Consolidated Balance Sheet are disclosed separately in Note 19 to the Consolidated Financial Statements.
The company’s net income/(loss) from discontinued operations in 2002 is nil as the existing provision for loss on discontinued operations was reviewed by management and determined to be appropriate. Any adjustments to the estimate of the net loss on disposal will be recognized as a gain or loss from discontinued operations in the period that such changes are determined.
The company recorded a net loss from discontinued operations in 2001 of $67 million. This amount includes a net loss of $90 million based on management’s estimates of proceeds and disposal costs and net earnings of $3 million prior to plan approval, related to the Gas Marketing business. Also included in 2001 is a positive $20 million after-tax adjustment to the December Plan.
The company recorded a net gain from discontinued operations in 2000 of $61 million. This amount includes operating losses of $139 million related to the Gas Marketing business prior to plan approval and a net gain of $200 million related to the December Plan, primarily due to proceeds in excess of the original estimate.
TransCanada remains contingently liable pursuant to obligations under certain contracts that relate to the divested Gas Marketing business. In 2001, the company deferred recognition of after-tax gains on sales of approximately $100 million. These deferred gains remain in the December 31, 2002 balance sheet provision for loss on discontinued operations and will be recognized in income from discontinued operations as the underlying exposures reduce. In accordance with the terms of these contracts and in the normal course of business, the underlying volumes related to the contracts are expected to decrease over time. The contingent liability under these obligations, which could be significant, is contingent on certain future events, the occurrence of which is not determinable, and the amount, if any, is dependent upon future prevailing market prices and conditions. The purchasers of the Gas Marketing business have agreed to indemnify TransCanada in the event the company is called upon to perform under the obligations.
41
SELECTED QUARTERLY CONSOLIDATED FINANCIAL DATA
Quarterly consolidated financial data for the years ended December 31, 2002 and 2001 is found under the heading “Selected Quarterly and Annual Consolidated Financial Data” on page 78 in the Annual Report and is hereby incorporated by reference.
FORWARD-LOOKING INFORMATION
Certain information in this Management’s Discussion and Analysis is forward-looking and is subject to important risks and uncertainties. The results or events predicted in this information may differ from actual results or events. Factors which could cause actual results or events to differ materially from current expectations include, among other things, the ability of TransCanada to successfully implement its strategic initiatives and whether such strategic initiatives will yield the expected benefits, the availability and price of energy commodities, regulatory decisions, competitive factors in the pipeline and power industry sectors, and the prevailing economic conditions in North America. For additional information on these and other factors, see the reports filed by TransCanada with Canadian securities regulators and with the U.S. Securities and Exchange Commission. TransCanada disclaims any intention or obligation to update or revise any forward-looking statements, whether as a result of new information, future events or otherwise.
42
2002 CONSOLIDATED FINANCIAL STATEMENTS
REPORT OF MANAGEMENT
The consolidated financial statements included in this Annual Report are the responsibility of Management and have been approved by the Board of Directors of the Company. These consolidated financial statements have been prepared by Management in accordance with generally accepted accounting principles (GAAP) in Canada and include amounts that are based on estimates and judgments. Financial information contained elsewhere in this Annual Report is consistent with the consolidated financial statements.
Management has prepared Management’s Discussion and Analysis (MD&A) which is based on the Company’s financial results prepared in accordance with Canadian GAAP. It compares the Company’s financial performance in 2002 to 2001 and should be read in conjunction with the consolidated financial statements and accompanying notes. In addition, significant changes between 2001 and 2000 are highlighted. Note 20 to the consolidated financial statements describes the impact on the consolidated financial statements of significant differences between Canadian and United States GAAP.
Management has developed and maintains a system of internal accounting controls, including a program of internal audits. Management believes that these controls provide reasonable assurance that financial records are reliable and form a proper basis for preparation of financial statements. The internal accounting control process includes Management’s communication to employees of policies which govern ethical business conduct.
The Board of Directors has appointed an Audit and Risk Management Committee consisting of unrelated, non-management directors which meets at least four times during the year with Management and independently with each of the internal and external auditors and as a group to review any significant accounting, internal control and auditing matters. The Audit and Risk Management Committee reviews the consolidated financial statements with Management and the external auditors before the consolidated financial statements are submitted to the Board of Directors for approval. The internal and external auditors have free access to the Audit and Risk Management Committee without obtaining prior Management approval.
With respect to the external auditors, KPMG LLP, the Audit and Risk Management Committee approves the terms of engagement and reviews the annual audit plan, the Auditors’ Report and results of the audit. It also recommends to the Board of Directors the firm of external auditors to be appointed by the shareholders.
The independent external auditors, KPMG LLP, have been appointed by the shareholders to express an opinion as to whether the consolidated financial statements present fairly, in all material respects, the Company’s financial position, results of operations and cash flows in accordance with Canadian generally accepted accounting principles. The report of KPMG LLP on page 48 outlines the scope of their examination and their opinion on the consolidated financial statements.
/s/ Harold N. Kvisle |
| /s/ Russell K. Girling |
|
Harold N. Kvisle | Russell K. Girling | ||
President and | Executive Vice-President | ||
|
| ||
February 25, 2003 |
| ||
43
CONSOLIDATED INCOME
Year ended December 31 |
| 2002 |
| 2001 |
| 2000 |
| |||
(millions of dollars except per share amounts) |
|
|
|
|
|
|
| |||
|
|
|
|
|
|
|
| |||
Revenues |
| 5,214 |
| 5,275 |
| 4,384 |
| |||
|
|
|
|
|
|
|
| |||
Operating Expenses |
|
|
|
|
|
|
| |||
Cost of sales |
| 627 |
| 712 |
| 133 |
| |||
Other costs and expenses |
| 1,546 |
| 1,618 |
| 1,539 |
| |||
Depreciation |
| 848 |
| 793 |
| 737 |
| |||
|
| 3,021 |
| 3,123 |
| 2,409 |
| |||
|
|
|
|
|
|
|
| |||
Operating Income |
| 2,193 |
| 2,152 |
| 1,975 |
| |||
|
|
|
|
|
|
|
| |||
Other Expenses/(Income) |
|
|
|
|
|
|
| |||
Financial charges (Note 8) |
| 867 |
| 889 |
| 953 |
| |||
Financial charges of joint ventures (Note 9) |
| 90 |
| 107 |
| 113 |
| |||
Interest and other income |
| (86 | ) | (77 | ) | (115 | ) | |||
Gain on sale of assets |
| — |
| — |
| (37 | ) | |||
|
| 871 |
| 919 |
| 914 |
| |||
|
|
|
|
|
|
|
| |||
Income from Continuing Operations before Income Taxes |
| 1,322 |
| 1,233 |
| 1,061 |
| |||
Income Taxes (Note 14) |
| 517 |
| 480 |
| 354 |
| |||
Net Income from Continuing Operations |
| 805 |
| 753 |
| 707 |
| |||
Net (Loss)/Income from Discontinued Operations (Note 19) |
| — |
| (67 | ) | 61 |
| |||
Net Income |
| 805 |
| 686 |
| 768 |
| |||
Preferred Securities Charges (Note 10) |
| 36 |
| 45 |
| 44 |
| |||
Preferred Share Dividends |
| 22 |
| 22 |
| 35 |
| |||
Net Income Applicable to Common Shares |
| 747 |
| 619 |
| 689 |
| |||
|
|
|
|
|
|
|
| |||
Net Income/(Loss) Applicable to Common Shares |
|
|
|
|
|
|
| |||
Continuing operations |
| 747 |
| 686 |
| 628 |
| |||
Discontinued operations |
| — |
| (67 | ) | 61 |
| |||
|
| 747 |
| 619 |
| 689 |
| |||
Net Income/(Loss) Per Share (Note 12) |
|
|
|
|
|
|
| |||
Continuing operations |
| $ | 1.56 |
| $ | 1.44 |
| $ | 1.32 |
|
Discontinued operations |
| — |
| (0.14 | ) | 0.13 |
| |||
Basic |
| $ | 1.56 |
| $ | 1.30 |
| $ | 1.45 |
|
Diluted |
| $ | 1.55 |
| $ | 1.30 |
| $ | 1.45 |
|
The accompanying notes to the consolidated financial statements are an integral part of these statements.
44
CONSOLIDATED CASH FLOWS
Year ended December 31 |
| 2002 |
| 2001 |
| 2000 |
|
(millions of dollars) |
|
|
|
|
|
|
|
|
|
|
|
|
|
|
|
Cash Generated from Operations |
|
|
|
|
|
|
|
Net income from continuing operations |
| 805 |
| 753 |
| 707 |
|
Depreciation |
| 848 |
| 793 |
| 737 |
|
Future income taxes |
| 247 |
| 127 |
| 74 |
|
Gain on sale of assets |
| — |
| — |
| (37 | ) |
Other |
| (73 | ) | (49 | ) | 14 |
|
Funds generated from continuing operations |
| 1,827 |
| 1,624 |
| 1,495 |
|
Decrease/(increase) in operating working capital (Note 17) |
| 33 |
| 170 |
| (416 | ) |
Net cash provided by continuing operations |
| 1,860 |
| 1,794 |
| 1,079 |
|
Net cash provided by/(used in) discontinued operations |
| 59 |
| (659 | ) | 853 |
|
|
| 1,919 |
| 1,135 |
| 1,932 |
|
|
|
|
|
|
|
|
|
Investing Activities |
|
|
|
|
|
|
|
Capital expenditures |
| (599 | ) | (492 | ) | (812 | ) |
Acquisitions, net of cash acquired |
| (228 | ) | (585 | ) | (323 | ) |
Disposition of assets |
| — |
| 1,170 |
| 2,233 |
|
Deferred amounts and other |
| (115 | ) | 30 |
| (31 | ) |
Net cash (used in)/provided by investing activities |
| (942 | ) | 123 |
| 1,067 |
|
|
|
|
|
|
|
|
|
Financing Activities |
|
|
|
|
|
|
|
Dividends and preferred securities charges |
| (546 | ) | (517 | ) | (536 | ) |
Notes payable (repaid)/issued, net |
| (46 | ) | 186 |
| (25 | ) |
Reduction of long-term debt |
| (486 | ) | (793 | ) | (2,139 | ) |
Non-recourse debt of joint ventures issued |
| 44 |
| 23 |
| 404 |
|
Reduction of non-recourse debt of joint ventures |
| (80 | ) | (132 | ) | (282 | ) |
Common shares issued |
| 50 |
| 24 |
| 5 |
|
Partnership units of joint ventures issued |
| — |
| 59 |
| — |
|
Preferred securities redeemed |
| — |
| (318 | ) | — |
|
Preferred shares redeemed |
| — |
| — |
| (328 | ) |
Net cash used in financing activities |
| (1,064 | ) | (1,468 | ) | (2,901 | ) |
|
|
|
|
|
|
|
|
(Decrease)/Increase in Cash and Short-Term Investments |
| (87 | ) | (210 | ) | 98 |
|
|
|
|
|
|
|
|
|
Cash and Short-Term Investments |
|
|
|
|
|
|
|
Beginning of year |
| 299 |
| 509 |
| 411 |
|
|
|
|
|
|
|
|
|
Cash and Short-Term Investments |
|
|
|
|
|
|
|
End of year |
| 212 |
| 299 |
| 509 |
|
The accompanying notes to the consolidated financial statements are an integral part of these statements.
45
CONSOLIDATED BALANCE SHEET
December 31 |
| 2002 |
| 2001 |
|
(millions of dollars) |
|
|
|
|
|
|
|
|
|
|
|
ASSETS |
|
|
|
|
|
Current Assets |
|
|
|
|
|
Cash and short-term investments |
| 212 |
| 299 |
|
Accounts receivable |
| 691 |
| 655 |
|
Inventories |
| 178 |
| 177 |
|
Other |
| 102 |
| 43 |
|
|
| 1,183 |
| 1,174 |
|
Long-Term Investments (Note 7) |
| 291 |
| 268 |
|
Plant, Property and Equipment (Notes 4, 8 and 9) |
| 17,496 |
| 17,685 |
|
Other Assets (Note 5) |
| 946 |
| 827 |
|
|
| 19,916 |
| 19,954 |
|
|
|
|
|
|
|
LIABILITIES AND SHAREHOLDERS’ EQUITY |
|
|
|
|
|
Current Liabilities |
|
|
|
|
|
Notes payable (Note 15) |
| 297 |
| 343 |
|
Accounts payable |
| 902 |
| 786 |
|
Accrued interest |
| 227 |
| 233 |
|
Current portion of long-term debt (Note 8) |
| 517 |
| 483 |
|
Current portion of non-recourse debt of joint ventures (Note 9) |
| 75 |
| 44 |
|
Provision for loss on discontinued operations (Note 19) |
| 234 |
| 264 |
|
|
| 2,252 |
| 2,153 |
|
Deferred Amounts |
| 353 |
| 393 |
|
Long-Term Debt (Note 8) |
| 8,815 |
| 9,347 |
|
Future Income Taxes (Note 14) |
| 226 |
| 39 |
|
Non-Recourse Debt of Joint Ventures (Note 9) |
| 1,222 |
| 1,295 |
|
Junior Subordinated Debentures (Note 10) |
| 238 |
| 237 |
|
|
| 13,106 |
| 13,464 |
|
|
|
|
|
|
|
Shareholders’ Equity |
|
|
|
|
|
Preferred securities (Note 10) |
| 674 |
| 675 |
|
Preferred shares (Note 11) |
| 389 |
| 389 |
|
Common shares (Note 12) |
| 4,614 |
| 4,564 |
|
Contributed surplus |
| 265 |
| 263 |
|
Retained earnings |
| 854 |
| 586 |
|
Foreign exchange adjustment (Note 13) |
| 14 |
| 13 |
|
|
| 6,810 |
| 6,490 |
|
Commitments, Contingencies and Guarantees (Note 18) |
|
|
|
|
|
Subsequent Event (Note 21) |
|
|
|
|
|
|
| 19,916 |
| 19,954 |
|
The accompanying notes to the consolidated financial statements are an integral part of these statements.
On behalf of the Board:
/s/ Harold N. Kvisle |
| /s/ Harry G. Schaefer |
|
Harold N. Kvisle | Harry G. Schaefer | ||
Director | Director | ||
46
CONSOLIDATED RETAINED EARNINGS
Year ended December 31 |
| 2002 |
| 2001 |
| 2000 |
|
(millions of dollars) |
|
|
|
|
|
|
|
|
|
|
|
|
|
|
|
Balance at beginning of year |
| 586 |
| 395 |
| 85 |
|
Net income |
| 805 |
| 686 |
| 768 |
|
Preferred securities charges |
| (36 | ) | (45 | ) | (44 | ) |
Preferred share dividends |
| (22 | ) | (22 | ) | (35 | ) |
Common share dividends |
| (479 | ) | (428 | ) | (379 | ) |
|
| 854 |
| 586 |
| 395 |
|
The accompanying notes to the consolidated financial statements are an integral part of these statements.
47
AUDITORS’ REPORT
To the Shareholders of TransCanada PipeLines Limited
We have audited the consolidated balance sheets of TransCanada PipeLines Limited as at December 31, 2002 and 2001 and the consolidated statements of income, retained earnings and cash flows for each of the years in the three-year period ended December 31, 2002. These financial statements are the responsibility of the Company’s management. Our responsibility is to express an opinion on these financial statements based on our audits.
We conducted our audits in accordance with Canadian generally accepted auditing standards. Those standards require that we plan and perform an audit to obtain reasonable assurance whether the financial statements are free of material misstatement. An audit includes examining, on a test basis, evidence supporting the amounts and disclosures in the financial statements. An audit also includes assessing the accounting principles used and significant estimates made by management, as well as evaluating the overall financial statement presentation.
In our opinion, these consolidated financial statements present fairly, in all material respects, the financial position of the Company as at December 31, 2002 and 2001 and the results of its operations and its cash flows for each of the years in the three-year period ended December 31, 2002 in accordance with Canadian generally accepted accounting principles.
/s/ KPMG LLP |
|
Chartered Accountants | |
Calgary, Canada | |
| |
February 25, 2003 | |
48
NOTES TO CONSOLIDATED FINANCIAL STATEMENTS
TransCanada PipeLines Limited (the Company or TransCanada) is a leading North American energy company. TransCanada operates in two business segments, Transmission and Power, each of which offers different products and services.
TRANSMISSION
The Transmission business owns and operates a natural gas transmission system in Alberta (the Alberta System), a natural gas transmission system extending from the Alberta border east into Québec (the Canadian Mainline) and a natural gas transmission system extending from the Alberta border west into southeastern British Columbia (the BC System). It also holds the Company’s investments in other natural gas pipelines in Canada and the United States, and investigates and develops new natural gas transmission facilities in Canada and the United States.
POWER
The Power business builds, owns and operates electrical power plants, and markets electricity. This business operates in both Canada and the United States.
NOTE 1 Accounting Policies
The consolidated financial statements of the Company have been prepared by Management in accordance with Canadian generally accepted accounting principles (Canadian GAAP). These accounting principles are different in some respects from United States generally accepted accounting principles (U.S. GAAP) and the significant differences are described in Note 20. Amounts are stated in Canadian dollars unless otherwise indicated. Certain comparative figures have been reclassified to conform with the current year’s presentation.
Since a determination of many assets, liabilities, revenues and expenses is dependent upon future events, the preparation of these consolidated financial statements requires the use of estimates and assumptions which have been made using careful judgment. In the opinion of Management, these consolidated financial statements have been properly prepared within reasonable limits of materiality and within the framework of the significant accounting policies summarized below.
Basis of Presentation The consolidated financial statements include the accounts of TransCanada PipeLines Limited and its subsidiaries, as well as its proportionate share of the accounts of its joint ventures. The Company uses the equity method of accounting for investments over which it is able to exercise significant influence.
Regulation The Alberta System is regulated by the Alberta Energy and Utilities Board (EUB), and the Canadian Mainline and the BC System are subject to the authority of the National Energy Board (NEB). All Canadian natural gas transmission operations are regulated with respect to the determination of tolls, construction and operations. In June 2002, the Company received the NEB decision on its Fair Return application (Fair Return decision) to determine the cost of capital to be included in the calculation of 2001 and 2002 final tolls on the Canadian Mainline. The Fair Return decision on the cost of capital included an increase in the deemed common equity ratio from 30 to 33 per cent effective January 1, 2001. The NEB also decided that the return on equity as calculated based on the NEB formula continued to be appropriate for the Canadian Mainline which results in an approved rate of return on common equity of 9.61 per cent for 2001 and 9.53 per cent for 2002. The natural gas pipelines in the United States and certain power plants are also subject to the authority of regulatory bodies. In order to achieve a proper matching of revenues and expenses, the timing of recognition of certain revenues and expenses in these businesses may differ from that otherwise expected under generally accepted accounting principles.
49
Cash and Short-Term Investments The Company’s short-term investments with original maturities of three months or less are considered to be cash equivalents and are recorded at cost, which approximates market value.
Inventories Inventories are carried at the lower of average cost or net realizable value.
Plant, Property and Equipment
Transmission Plant, property and equipment of natural gas transmission operations are carried at cost. Depreciation is calculated on the straight-line basis. Pipeline and compression equipment are depreciated at annual rates ranging from two to five per cent and metering and other plant are depreciated at various rates. Removal and site restoration costs are not determinable and will be recorded when reasonably estimable and when approved by the regulators. An allowance for funds used during construction, using the rate of return on rate base approved by the regulators, is capitalized and included in the cost of gas transmission plant.
Power and Other Plant, property and equipment in the power business are recorded at cost and depreciated on the straight-line basis over estimated service lives at average annual rates ranging from two to five per cent. Other plant, property and equipment are recorded at cost and depreciated on a straight-line basis over estimated useful lives at average annual rates ranging from four to twenty per cent.
Power Purchase Arrangements The initial payments for power purchase arrangements (PPAs) are deferred and are being amortized over the terms of the contracts, from the dates of acquisition, which range from nine to 27 years. PPAs are long-term contracts to purchase power on a predetermined basis. PPAs are included in Other Assets.
Income Taxes As prescribed by the regulators, the taxes payable method of accounting for income taxes is used for tollmaking purposes for Canadian natural gas transmission operations. Under the taxes payable method, it is not necessary to provide for future income taxes. This method is also used for accounting purposes, since there is reasonable expectation that future taxes payable will be included in future costs of service and recorded in revenues at that time. The liability method of accounting for income taxes is used for the remainder of the Company’s operations. Under this method, future tax assets and liabilities are recognized for the future tax consequences attributable to differences between the financial statement carrying amounts of existing assets and liabilities and their respective tax bases. Future income tax assets and liabilities are measured using enacted or substantively enacted tax rates expected to apply to taxable income in the years in which temporary differences are expected to be recovered or settled. Changes to these balances are recognized in income in the period in which they occur.
Canadian income taxes are not provided on the unremitted earnings of foreign investments which are considered to be indefinitely reinvested in foreign operations.
Foreign Currency Translation The Company’s foreign operations are self-sustaining and are translated into Canadian dollars using the current rate method. Translation adjustments are reflected in the foreign exchange adjustment in Shareholders’ Equity.
Exchange gains or losses on the principal amounts of foreign currency debt, junior subordinated debentures and preferred securities related to the Alberta System and the Canadian Mainline are deferred until they are recovered in tolls.
Derivative Financial Instruments The Company utilizes derivative and other financial instruments to manage its exposure to changes in foreign currency exchange rates, interest rates and energy commodity prices. Gains or losses relating to derivatives that are hedges are deferred and recognized in the same period and in the same financial statement category as the gains or losses on the corresponding hedged transactions. The recognition of gains and losses on derivatives used as hedges for Alberta System and Canadian Mainline exposures is determined through the regulatory process.
50
A derivative must be designated and effective to be accounted for as a hedge. For cash flow hedges, effectiveness is achieved if the changes in the cash flows of the derivative substantially offset the changes in the cash flows of the hedged position and the timing of the cash flows is similar. Effectiveness for fair value hedges is achieved if the fair value of the derivative substantially offsets changes in fair value attributable to the hedged item. In the event that a derivative does not meet the designation or effectiveness criterion, the gain or loss on the derivative is recognized in income. If a derivative that qualifies as a hedge is settled early, the gain or loss at settlement is deferred and recognized when the gain or loss on the hedged transaction is recognized. Premiums paid or received with respect to derivatives that are hedges are deferred and amortized to income over the term of the hedge.
Employee Benefit Plans The Company sponsors defined benefit pension plans. The cost of defined benefit pensions and other post-employment benefits earned by employees is actuarially determined using the projected benefit method pro-rated on service and Management’s best estimate of expected plan investment performance, salary escalation, retirement ages of employees and expected health care costs. Pension plan assets are measured at fair value. The expected return on pension plan assets is determined using market-related values. Adjustments arising from plan amendments are amortized on a straight-line basis over the average remaining service period of employees active at the date of amendment. The excess of the net actuarial gain or loss over 10 per cent of the greater of the benefit obligation and the fair value of plan assets is amortized over the average remaining service period of the active employees. In addition to the defined benefit plan, the Company previously sponsored two additional plans, a defined contribution plan and a combination of the defined benefit and defined contribution plans which were effectively terminated at December 31, 2002.
NOTE 2 Accounting Changes
Price Risk Management In 2002, the Company adopted accrual accounting for energy trading contracts in its continuing operations, changing from its previous policy of mark-to-market accounting for these contracts. This accounting change has been applied retroactively with restatement of prior periods. This change eliminates unrealized gains and losses on energy trading contracts recognized under mark-to-market accounting. The cumulative effect of this accounting change as at January 1, 2000 was nil. The impact of this change on net income for the years ended December 31, 2001 and December 31, 2000 was an increase of $11 million ($0.02 per share) and a decrease of $20 million ($0.04 per share), respectively, which is reflected in the Power segment. Under accrual accounting, net income for the year ended December 31, 2002 is $13 million ($0.03 per share) higher than would have been reported under mark-to-market accounting.
Foreign Currency Translation In 2002, the Company adopted the amendment to the Canadian Institute of Chartered Accountants (CICA) Handbook Section “Foreign Currency Translation”. This amendment eliminates the deferral and amortization of unrealized translation gains and losses on foreign currency denominated monetary items that have a fixed or ascertainable life extending beyond the end of the fiscal year following the current reporting period. This accounting change was applied retroactively with restatement of prior periods. The cumulative effect of this accounting change as at January 1, 2000 was an increase of $3 million in retained earnings. The impact of this change on net income for the years ended December 31, 2001 and December 31, 2000 was an increase of $5 million ($0.01 per share) and a decrease of $2 million ($0.01 per share), respectively, which is reflected in the Corporate segment. This change had no impact on net income for the year ended December 31, 2002.
Stock-Based Compensation In 2002, the Company adopted the new standard of the CICA Handbook Section “Stock-Based Compensation and Other Stock-Based Payments”. This section establishes standards for the recognition, measurement and disclosure of stock-based compensation and other stock-based payments made in exchange for goods and services. It applies to transactions in which an enterprise grants shares of common stock, stock options, or other equity instruments, or incurs liabilities based on the price of common stock or other equity instruments. This standard allows companies to either expense, over the vesting period, the fair value of the stock options granted or to disclose this impact. This new standard has been applied prospectively.
51
The Company has chosen to expense stock options and the impact of this accounting change, which has been recorded in 2002, results in a $2 million charge to net income. This charge is reflected in the Transmission and Power segments. The Company used the Black-Scholes model for this calculation with the weighted average assumptions being 5 years of expected life, 4.7 per cent interest rate, 18 per cent volatility and 4.7 per cent dividend yield.
The impacts of the accounting changes on the Consolidated Balance Sheet, Consolidated Statement of Income and Consolidated Statement of Cash Flows as at and for the years ended December 31, 2001 and December 31, 2000, respectively, are as follows.
|
| Increase/(Decrease) |
| ||
|
| 2001 |
| 2000 |
|
(millions of dollars) |
|
|
|
|
|
|
|
|
|
|
|
Consolidated Balance Sheet |
|
|
|
|
|
Energy trading assets |
|
|
|
|
|
Current asset |
| (152 | ) | (582 | ) |
Long-term asset |
| (365 | ) | (379 | ) |
Other assets |
| 322 |
| 215 |
|
Future income tax asset |
| — |
| 15 |
|
Total assets |
| (195 | ) | (731 | ) |
Energy trading liabilities |
|
|
|
|
|
Current liability |
| (72 | ) | (542 | ) |
Long-term liability |
| (112 | ) | (170 | ) |
Future income tax liability |
| (8 | ) | — |
|
Total liabilities |
| (192 | ) | (712 | ) |
Retained earnings |
| (3 | ) | (19 | ) |
|
|
|
|
|
|
Consolidated Income |
|
|
|
|
|
Revenues |
| 26 |
| (37 | ) |
Operating expenses |
| 9 |
| — |
|
Financial charges |
| (6 | ) | 2 |
|
Income taxes – current and future |
| 7 |
| (17 | ) |
Net income |
| 16 |
| (22 | ) |
|
|
|
|
|
|
Consolidated Cash Flows |
|
|
|
|
|
Funds generated from continuing operations |
| 110 |
| 212 |
|
Net cash used in investing activities |
| (110 | ) | (212 | ) |
52
NOTE 3 Segmented Information
Net Income/(Loss)(1)
Year ended December 31, 2002 |
| Transmission |
| Power |
| Corporate |
| Total |
|
(millions of dollars) |
|
|
|
|
|
|
|
|
|
|
|
|
|
|
|
|
|
|
|
Revenues |
| 3,921 |
| 1,293 |
| — |
| 5,214 |
|
Cost of sales(2) |
| — |
| (627 | ) | — |
| (627 | ) |
Other costs and expenses |
| (1,166 | ) | (371 | ) | (9 | ) | (1,546 | ) |
Depreciation |
| (783 | ) | (65 | ) | — |
| (848 | ) |
Operating income/(loss) |
| 1,972 |
| 230 |
| (9 | ) | 2,193 |
|
Financial and preferred equity charges |
| (821 | ) | (13 | ) | (91 | ) | (925 | ) |
Financial charges of joint ventures |
| (90 | ) | — |
| — |
| (90 | ) |
Interest and other income |
| 50 |
| 13 |
| 23 |
| 86 |
|
Income taxes |
| (458 | ) | (84 | ) | 25 |
| (517 | ) |
Continuing Operations |
| 653 |
| 146 |
| (52 | ) | 747 |
|
Discontinued Operations |
|
|
|
|
|
|
| — |
|
Net Income Applicable to Common Shares |
|
|
|
|
|
|
| 747 |
|
Year ended December 31, 2001 |
|
|
|
|
|
|
|
|
|
(millions of dollars) |
|
|
|
|
|
|
|
|
|
|
|
|
|
|
|
|
|
|
|
Revenues |
| 3,880 |
| 1,395 |
| — |
| 5,275 |
|
Cost of sales(2) |
| — |
| (712 | ) | — |
| (712 | ) |
Other costs and expenses |
| (1,226 | ) | (361 | ) | (31 | ) | (1,618 | ) |
Depreciation |
| (753 | ) | (37 | ) | (3 | ) | (793 | ) |
Operating income/(loss) |
| 1,901 |
| 285 |
| (34 | ) | 2,152 |
|
Financial and preferred equity charges |
| (856 | ) | (15 | ) | (85 | ) | (956 | ) |
Financial charges of joint ventures |
| (98 | ) | (9 | ) | — |
| (107 | ) |
Interest and other income |
| 30 |
| 13 |
| 34 |
| 77 |
|
Income taxes |
| (392 | ) | (106 | ) | 18 |
| (480 | ) |
Continuing Operations |
| 585 |
| 168 |
| (67 | ) | 686 |
|
Discontinued Operations |
|
|
|
|
|
|
| (67 | ) |
Net Income Applicable to Common Shares |
|
|
|
|
|
|
| 619 |
|
Year ended December 31, 2000 |
|
|
|
|
|
|
|
|
|
(millions of dollars) |
|
|
|
|
|
|
|
|
|
|
|
|
|
|
|
|
|
|
|
Revenues |
| 3,856 |
| 528 |
| — |
| 4,384 |
|
Cost of sales(2) |
| — |
| (133 | ) | — |
| (133 | ) |
Other costs and expenses |
| (1,252 | ) | (256 | ) | (31 | ) | (1,539 | ) |
Depreciation |
| (698 | ) | (35 | ) | (4 | ) | (737 | ) |
Operating income/(loss) |
| 1,906 |
| 104 |
| (35 | ) | 1,975 |
|
Financial and preferred equity charges |
| (877 | ) | (3 | ) | (152 | ) | (1,032 | ) |
Financial charges of joint ventures |
| (101 | ) | (12 | ) | — |
| (113 | ) |
Interest and other income |
| 52 |
| 9 |
| 54 |
| 115 |
|
Gain on sale of assets |
| 11 |
| 26 |
| — |
| 37 |
|
Income taxes |
| (368 | ) | (39 | ) | 53 |
| (354 | ) |
Continuing Operations |
| 623 |
| 85 |
| (80 | ) | 628 |
|
Discontinued Operations |
|
|
|
|
|
|
| 61 |
|
Net Income Applicable to Common Shares |
|
|
|
|
|
|
| 689 |
|
(1) In determining the net income of each segment, certain expenses such as indirect financial charges and related income taxes are not allocated to business segments.
(2) Cost of sales include commodity purchases for resale.
53
Total Assets
December 31 |
| 2002 |
| 2001 |
|
(millions of dollars) |
|
|
|
|
|
|
|
|
|
|
|
Transmission |
| 16,979 |
| 17,269 |
|
Power |
| 2,292 |
| 1,880 |
|
Corporate |
| 457 |
| 480 |
|
Continuing Operations |
| 19,728 |
| 19,629 |
|
Discontinued Operations |
| 188 |
| 325 |
|
|
| 19,916 |
| 19,954 |
|
Geographic Information
Year ended December 31 |
| 2002 |
| 2001 |
| 2000 |
|
(millions of dollars) |
|
|
|
|
|
|
|
|
|
|
|
|
|
|
|
Revenues(3) |
|
|
|
|
|
|
|
Canada – domestic |
| 2,731 |
| 3,303 |
| 2,765 |
|
Canada – export |
| 1,641 |
| 1,329 |
| 1,120 |
|
United States |
| 842 |
| 643 |
| 499 |
|
|
| 5,214 |
| 5,275 |
| 4,384 |
|
(3) Revenues are attributed to countries based on country of origin of product or service.
Plant, Property and Equipment
December 31 |
| 2002 |
| 2001 |
|
(millions of dollars) |
|
|
|
|
|
|
|
|
|
|
|
Canada |
| 15,479 |
| 15,752 |
|
United States |
| 2,017 |
| 1,933 |
|
|
| 17,496 |
| 17,685 |
|
Capital Expenditures
Year ended December 31 |
| 2002 |
| 2001 |
| 2000 |
|
(millions of dollars) |
|
|
|
|
|
|
|
|
|
|
|
|
|
|
|
Transmission |
| 382 |
| 285 |
| 354 |
|
Power |
| 193 |
| 121 |
| 104 |
|
Corporate |
| 11 |
| 34 |
| 60 |
|
Continuing Operations |
| 586 |
| 440 |
| 518 |
|
Discontinued Operations |
| 13 |
| 52 |
| 294 |
|
|
| 599 |
| 492 |
| 812 |
|
54
NOTE 4 Plant, Property and Equipment
December 31 |
| 2002 |
| 2001 |
| ||||||||
|
| Cost |
| Accumulated |
| Net Book |
| Cost |
| Accumulated |
| Net Book |
|
(millions of dollars) |
|
|
|
|
|
|
|
|
|
|
|
|
|
|
|
|
|
|
|
|
|
|
|
|
|
|
|
Transmission |
|
|
|
|
|
|
|
|
|
|
|
|
|
Alberta System |
|
|
|
|
|
|
|
|
|
|
|
|
|
Pipeline |
| 4,922 |
| 1,755 |
| 3,167 |
| 4,810 |
| 1,607 |
| 3,203 |
|
Compression |
| 1,517 |
| 479 |
| 1,038 |
| 1,489 |
| 413 |
| 1,076 |
|
Metering and other |
| 919 |
| 237 |
| 682 |
| 964 |
| 258 |
| 706 |
|
|
| 7,358 |
| 2,471 |
| 4,887 |
| 7,263 |
| 2,278 |
| 4,985 |
|
Under construction |
| 4 |
| — |
| 4 |
| 33 |
| — |
| 33 |
|
|
| 7,362 |
| 2,471 |
| 4,891 |
| 7,296 |
| 2,278 |
| 5,018 |
|
Canadian Mainline |
|
|
|
|
|
|
|
|
|
|
|
|
|
Pipeline |
| 8,674 |
| 2,933 |
| 5,741 |
| 8,659 |
| 2,708 |
| 5,951 |
|
Compression |
| 3,291 |
| 709 |
| 2,582 |
| 3,400 |
| 738 |
| 2,662 |
|
Metering and other |
| 429 |
| 118 |
| 311 |
| 444 |
| 124 |
| 320 |
|
|
| 12,394 |
| 3,760 |
| 8,634 |
| 12,503 |
| 3,570 |
| 8,933 |
|
Under construction |
| 15 |
| — |
| 15 |
| 21 |
| — |
| 21 |
|
|
| 12,409 |
| 3,760 |
| 8,649 |
| 12,524 |
| 3,570 |
| 8,954 |
|
North American |
|
|
|
|
|
|
|
|
|
|
|
|
|
Pipelines and Other |
|
|
|
|
|
|
|
|
|
|
|
|
|
Pipelines |
| 4,070 |
| 1,573 |
| 2,497 |
| 3,942 |
| 1,472 |
| 2,470 |
|
Other |
| 121 |
| 60 |
| 61 |
| 120 |
| 53 |
| 67 |
|
|
| 4,191 |
| 1,633 |
| 2,558 |
| 4,062 |
| 1,525 |
| 2,537 |
|
|
| 23,962 |
| 7,864 |
| 16,098 |
| 23,882 |
| 7,373 |
| 16,509 |
|
Power |
|
|
|
|
|
|
|
|
|
|
|
|
|
Power generation facilities |
| 1,693 |
| 398 |
| 1,295 |
| 1,432 |
| 365 |
| 1,067 |
|
Other |
| 77 |
| 38 |
| 39 |
| 77 |
| 34 |
| 43 |
|
|
| 1,770 |
| 436 |
| 1,334 |
| 1,509 |
| 399 |
| 1,110 |
|
Corporate |
| 120 |
| 56 |
| 64 |
| 114 |
| 48 |
| 66 |
|
|
| 25,852 |
| 8,356 |
| 17,496 |
| 25,505 |
| 7,820 |
| 17,685 |
|
NOTE 5 Other Assets
December 31 |
| 2002 |
| 2001 |
|
(millions of dollars) |
|
|
|
|
|
|
|
|
|
|
|
Power purchase arrangements – Canada |
| 297 |
| 314 |
|
Power purchase arrangements – U.S. |
| 325 |
| 221 |
|
Discontinued operations |
| 103 |
| 200 |
|
Other |
| 221 |
| 92 |
|
|
| 946 |
| 827 |
|
Amortization expense with respect to the PPAs was $28 million for the year ended December 31, 2002 (2001 – $18 million; 2000 – nil). At December 31, 2002, the accumulated amortization for the PPAs – Canada and the PPAs – U.S. was $32 million and $14 million, respectively (December 31, 2001 – $14 million and $4 million, respectively). In 2002, the Company acquired $114 million of PPAs – U.S. In 2001, the Company acquired $110 million of PPAs – Canada and $225 million of PPAs – U.S.
55
NOTE 6 Joint Venture Investments
|
| TransCanada’s Proportionate Share |
| ||||||||||
|
|
|
| Income Before Income Taxes |
| Net Assets |
| ||||||
|
| Ownership Interest |
| 2002 |
| 2001 |
| 2000 |
| 2002 |
| 2001 |
|
(millions of dollars) |
|
|
|
|
|
|
|
|
|
|
|
|
|
|
|
|
|
|
|
|
|
|
|
|
|
|
|
Transmission |
|
|
|
|
|
|
|
|
|
|
|
|
|
Great Lakes |
| 50.0 | % | 102 |
| 89 |
| 84 |
| 492 |
| 473 |
|
Iroquois |
| 41.0 | %(1) | 30 |
| 27 |
| 22 |
| 160 |
| 132 |
|
Foothills |
| 50.0-74.5 | % | 29 |
| 26 |
| 33 |
| 204 |
| 215 |
|
TC PipeLines, LP |
| 33.4 | % | 24 |
| 23 |
| 5 |
| 158 |
| 136 |
|
Trans Québec & Maritimes |
| 50.0 | % | 13 |
| 15 |
| 14 |
| 79 |
| 80 |
|
CrossAlta |
| 60.0 | % | 21 |
| 15 |
| 11 |
| 35 |
| 22 |
|
Other |
| Various |
| 7 |
| 4 |
| 4 |
| 17 |
| 18 |
|
Power |
|
|
|
|
|
|
|
|
|
|
|
|
|
TransCanada Power, L.P. |
| 35.6 | %(2) | 26 |
| 21 |
| 21 |
| 244 |
| 253 |
|
ASTC Power Partnership |
| 50.0 | %(3) | — |
| — |
| — |
| 105 |
| 118 |
|
Ocean State Power |
|
| (4) | — |
| — |
| 22 |
| — |
| — |
|
|
|
|
| 252 |
| 220 |
| 216 |
| 1,494 |
| 1,447 |
|
(1) In May 2001, the Company increased its interest in Iroquois from 35.0 per cent to 41.0 per cent.
(2) During 2000, the Company increased its interest in TransCanada Power, L.P. from 32.7 per cent to 41.6 per cent and in October 2001, decreased its interest to 35.6 per cent.
(3) In December 2001, the Company purchased 50.0 per cent of ASTC Power Partnership, which is located in Alberta and holds a power purchase arrangement. In 2002, the underlying power volume related to the 50.0 per cent ownership interest in the Partnership was effectively transferred to TransCanada.
(4) In October 2000, the Company increased its interest in the Ocean State Power plant from 70.1 per cent to 100 per cent and the investment was consolidated subsequent to that date.
Consolidated retained earnings at December 31, 2002 include undistributed earnings from these joint ventures of $433 million (2001 – $347 million).
Summarized Financial Information of Joint Ventures
Year ended December 31 |
| 2002 |
| 2001 |
| 2000 |
|
(millions of dollars) |
|
|
|
|
|
|
|
|
|
|
|
|
|
|
|
Income |
|
|
|
|
|
|
|
Revenues |
| 680 |
| 592 |
| 603 |
|
Other costs and expenses |
| (251 | ) | (172 | ) | (155 | ) |
Depreciation |
| (119 | ) | (119 | ) | (132 | ) |
Financial charges and other |
| (58 | ) | (81 | ) | (100 | ) |
Proportionate share of income before income taxes of joint ventures |
| 252 |
| 220 |
| 216 |
|
Year ended December 31 |
| 2002 |
| 2001 |
| 2000 |
|
(millions of dollars) |
|
|
|
|
|
|
|
|
|
|
|
|
|
|
|
Cash Flows |
|
|
|
|
|
|
|
Operations |
| 323 |
| 279 |
| 321 |
|
Investing activities |
| (125 | ) | 21 |
| (80 | ) |
Financing activities |
| (210 | ) | (291 | ) | (240 | ) |
Proportionate share of (decrease)/increase in cash and short-term investments of joint ventures |
| (12 | ) | 9 |
| 1 |
|
56
December 31 |
| 2002 |
| 2001 |
|
(millions of dollars) |
|
|
|
|
|
|
|
|
|
|
|
Balance Sheet |
|
|
|
|
|
Cash and short-term investments |
| 63 |
| 75 |
|
Other current assets |
| 127 |
| 92 |
|
Long-term investments |
| 148 |
| 132 |
|
Plant, property and equipment |
| 2,503 |
| 2,490 |
|
Other assets and deferred amounts (net) |
| 103 |
| 135 |
|
Current liabilities |
| (164 | ) | (118 | ) |
Non-recourse debt |
| (1,222 | ) | (1,295 | ) |
Future income taxes |
| (64 | ) | (64 | ) |
Proportionate share of net assets of joint ventures |
| 1,494 |
| 1,447 |
|
The Company is charged for gas transmission by certain of the Transmission joint ventures. These charges are at rates approved by regulators and the Company’s proportionate share is eliminated within the Transmission segment.
NOTE 7 Long-Term Investments
December 31 |
| 2002 |
| 2001 |
|
(millions of dollars) |
|
|
|
|
|
|
|
|
|
|
|
Equity Investments |
|
|
|
|
|
Northern Border |
| 129 |
| 132 |
|
TransGas |
| 75 |
| 70 |
|
Portland |
| 68 |
| 66 |
|
Other |
| 19 |
| — |
|
|
| 291 |
| 268 |
|
The Northern Border equity investment (Northern Border) is the result of the Company holding a 33.4 per cent interest in TC PipeLines, LP, which holds a 30.0 per cent interest in Northern Border Pipeline Company. The Company holds a 33.3 per cent interest in Portland Natural Gas Transmission System Partnership (Portland) and a 46.5 per cent interest in TransGas de Occidente S.A. (TransGas). Consolidated retained earnings at December 31, 2002 include undistributed earnings from these equity investments of $44 million (2001 – $40 million).
Income from these equity investments for the year ended December 31, 2002 was $34 million (2001 – $25 million; 2000 – $28 million).
57
NOTE 8 Long-Term Debt
|
|
|
| 2002 |
| 2001 |
| ||||
|
| Maturity |
| Outstanding |
| Weighted |
| Outstanding |
| Weighted |
|
|
|
|
|
|
|
|
|
|
|
|
|
Alberta System |
|
|
|
|
|
|
|
|
|
|
|
Debentures and Notes |
|
|
|
|
|
|
|
|
|
|
|
Canadian dollars |
| 2003 to 2024 |
| 798 |
| 11.0 | % | 819 |
| 11.0 | % |
U.S. dollars (2002 – US$500; 2001 – US$625) |
| 2004 to 2023 |
| 790 |
| 8.3 | % | 995 |
| 8.2 | % |
Medium-Term Notes |
|
|
|
|
|
|
|
|
|
|
|
Canadian dollars |
| 2005 to 2030 |
| 767 |
| 7.4 | % | 774 |
| 7.4 | % |
U.S. dollars (2002 and 2001 – US$233) |
| 2026 to 2029 |
| 368 |
| 7.7 | % | 371 |
| 7.7 | % |
Unsecured Loans |
|
|
|
|
|
|
|
|
|
|
|
U.S. dollars (2002 and 2001 – US$107) |
| 2003 |
| 169 |
| 2.1 | % | 170 |
| 2.3 | % |
|
|
|
| 2,892 |
|
|
| 3,129 |
|
|
|
Foreign exchange differential recoverable through the tollmaking process |
|
|
| (271 | ) |
|
| (322 | ) |
|
|
|
|
|
| 2,621 |
|
|
| 2,807 |
|
|
|
|
|
|
|
|
|
|
|
|
|
|
|
Canadian Mainline |
|
|
|
|
|
|
|
|
|
|
|
First Mortgage Pipe Line Bonds |
|
|
|
|
|
|
|
|
|
|
|
Pounds Sterling (2002 and 2001 – £25) |
| 2007 |
| 64 |
| 16.5 | % | 58 |
| 16.5 | % |
Debentures |
|
|
|
|
|
|
|
|
|
|
|
Canadian dollars |
| 2008 to 2020 |
| 1,354 |
| 10.9 | % | 1,455 |
| 10.9 | % |
U.S. dollars (2002 and 2001 – US$800) |
| 2012 to 2023 |
| 1,264 |
| 9.2 | % | 1,274 |
| 9.2 | % |
Medium-Term Notes |
|
|
|
|
|
|
|
|
|
|
|
Canadian dollars |
| 2003 to 2031 |
| 2,405 |
| 7.0 | % | 2,585 |
| 7.1 | % |
U.S. dollars (2002 and 2001 – US$120) |
| 2010 |
| 190 |
| 6.1 | % | 191 |
| 6.1 | % |
|
|
|
| 5,277 |
|
|
| 5,563 |
|
|
|
Foreign exchange differential recoverable through the tollmaking process |
|
|
| (330 | ) |
|
| (337 | ) |
|
|
|
|
|
| 4,947 |
|
|
| 5,226 |
|
|
|
|
|
|
|
|
|
|
|
|
|
|
|
Other |
|
|
|
|
|
|
|
|
|
|
|
Medium-Term Notes |
|
|
|
|
|
|
|
|
|
|
|
Canadian dollars |
| 2005 to 2030 |
| 342 |
| 6.6 | % | 342 |
| 6.6 | % |
U.S. dollars (2002 and 2001 – US$665) |
| 2006 to 2029 |
| 1,050 |
| 6.8 | % | 1,059 |
| 6.8 | % |
Subordinated Debentures |
|
|
|
|
|
|
|
|
|
|
|
U.S. dollars (2002 and 2001 – US$57) |
| 2006 |
| 90 |
| 9.1 | % | 91 |
| 9.1 | % |
Unsecured Loans and Debentures |
|
|
|
|
|
|
|
|
|
|
|
Canadian dollars |
| 2003 |
| 110 |
| 8.4 | % | 110 |
| 8.4 | % |
U.S. dollars (2002 – US$109; 2001 – US$123) |
| 2006 to 2011 |
| 172 |
| 8.3 | % | 195 |
| 8.3 | % |
|
|
|
| 1,764 |
|
|
| 1,797 |
|
|
|
|
|
|
| 9,332 |
|
|
| 9,830 |
|
|
|
Less: Current Portion of Long-Term Debt |
|
|
| 517 |
|
|
| 483 |
|
|
|
|
|
|
| 8,815 |
|
|
| 9,347 |
|
|
|
(1) Amounts outstanding are stated in millions of Canadian dollars; amounts denominated in currencies other than Canadian dollars are stated in millions.
(2) Weighted average interest rates are stated as at the respective outstanding dates. The effective weighted average interest rates resulting from swap agreements are as follows: Alberta System U.S. dollar unsecured loans – 8.3 per cent (2001 – 8.3 per cent); and Other U.S. dollar subordinated debentures – 9.0 per cent (2001 – 8.9 per cent).
58
Mandatory Retirements Mandatory retirements resulting from maturities and sinking fund obligations of the long-term debt of the Company approximate: 2003 – $517 million; 2004 – $386 million; 2005 – $375 million; 2006 – $453 million; and 2007 – $621 million.
Universal Shelf Programs At December 31, 2002, $2 billion of common shares, preferred shares and/or debt securities including medium-term notes could be issued under TransCanada’s universal shelf program in Canada and US$1 billion of common shares, preferred shares and/or debt securities could be issued under TransCanada’s universal shelf program in the U.S.
Alberta System
Debentures Debentures amounting to $225 million have retraction provisions which entitle the holders to require redemption of up to 8.0 per cent of the then outstanding principal plus accrued and unpaid interest on repayment dates. No redemptions have been made to December 31, 2002.
Medium-Term Notes Medium-term notes amounting to $50 million have a provision entitling the holders to extend the maturity of the medium-term notes from the initial repayment date of 2007 to 2027. If extended, the interest rate would increase from 6.1 per cent to 7.0 per cent and the medium-term notes would become redeemable at the option of the Company.
Canadian Mainline
First Mortgage Pipe Line Bonds The Deed of Trust and Mortgage securing the Company’s First Mortgage Pipe Line Bonds limits the specific and floating charges to those assets comprising the present and future Canadian Mainline and the Company’s present and future gas transportation contracts.
Medium-Term Notes Medium-term notes amounting to $98 million have retraction provisions which entitle the holders to require redemption of the principal plus accrued and unpaid interest on repayment dates in 2003.
Other
Medium-Term Notes Medium-term notes amounting to $150 million and US$145 million have retraction provisions which entitle the holders to require redemption of the principal plus accrued and unpaid interest in 2005 and 2004, respectively. The Company also has the option to redeem the US$145 million medium-term notes in 2004. If the U.S. dollar medium-term notes remain outstanding, the interest rate will change in 2004 from 6.4 per cent to a rate based on the then U.S. Treasury 30 year bond yield plus a market-based corporate credit spread.
Financial Charges
Year ended December 31 |
| 2002 |
| 2001 |
| 2000 |
|
(millions of dollars) |
|
|
|
|
|
|
|
|
|
|
|
|
|
|
|
Interest on long-term debt |
| 850 |
| 890 |
| 974 |
|
Regulatory deferrals and amortizations |
| (17 | ) | (30 | ) | (11 | ) |
Short-term interest and other financial charges |
| 34 |
| 38 |
| 47 |
|
|
| 867 |
| 898 |
| 1,010 |
|
Financial charges – discontinued operations |
| — |
| (9 | ) | (57 | ) |
|
| 867 |
| 889 |
| 953 |
|
The Company made interest payments of $866 million for the year ended December 31, 2002 (2001 – $936 million; 2000 – $1,024 million).
59
NOTE 9 Non-Recourse Debt of Joint Ventures
|
|
|
| 2002 |
| 2001 |
| ||||
|
| Maturity |
| Outstanding |
| Weighted |
| Outstanding |
| Weighted |
|
|
|
|
|
|
|
|
|
|
|
|
|
Great Lakes |
|
|
|
|
|
|
|
|
|
|
|
Senior Unsecured Notes |
|
|
|
|
|
|
|
|
|
|
|
(2002 – US$261; 2001 – US$284) |
| 2005 to 2030 |
| 412 |
| 8.0 | % | 452 |
| 8.1 | % |
Iroquois |
|
|
|
|
|
|
|
|
|
|
|
Senior Unsecured Notes |
|
|
|
|
|
|
|
|
|
|
|
(2002 – US$151; 2001 – US$82) |
| 2010 to 2027 |
| 239 |
| 7.5 | % | 132 |
| 8.7 | % |
Bank Loan |
|
|
|
|
|
|
|
|
|
|
|
(2002 – US$16; 2001 – US$71) |
| 2009 |
| 25 |
| 3.2 | % | 112 |
| 5.7 | % |
Foothills |
|
|
|
|
|
|
|
|
|
|
|
Senior Unsecured Notes |
| 2005 |
| 325 |
| 3.3 | % | 336 |
| 3.1 | % |
Senior Secured Notes |
| 2005 |
| 62 |
| 6.7 | % | 63 |
| 6.3 | % |
Trans Québec & Maritimes |
|
|
|
|
|
|
|
|
|
|
|
First Mortgage Bonds |
| 2005 to 2010 |
| 143 |
| 7.3 | % | 143 |
| 7.3 | % |
Term Loan |
| 2003 |
| 40 |
| 2.8 | % | 42 |
| 4.6 | % |
TC PipeLines, LP |
|
|
|
|
|
|
|
|
|
|
|
Senior Unsecured Notes |
|
|
|
|
|
|
|
|
|
|
|
(2002 – US$4; 2001 – US$7) |
| 2004 |
| 6 |
| 3.0 | % | 11 |
| 5.3 | % |
Other |
| 2003 to 2012 |
| 45 |
| 5.6 | % | 48 |
| 6.5 | % |
|
|
|
| 1,297 |
|
|
| 1,339 |
|
|
|
Less: Current Portion of Non-Recourse Debt of Joint Ventures |
|
|
| 75 |
|
|
| 44 |
|
|
|
|
|
|
| 1,222 |
|
|
| 1,295 |
|
|
|
(1) Amounts outstanding represent TransCanada’s proportionate share and are stated in millions of Canadian dollars; amounts denominated in U.S. dollars are stated in millions.
(2) Weighted average interest rates are stated as at the respective outstanding dates. At December 31, 2002, the effective weighted average interest rates on the bank loan of Iroquois and senior unsecured notes of Foothills resulting from swap agreements are 4.8 per cent (2001 – 6.3 per cent) and 5.8 per cent (2001 – 5.9 per cent), respectively.
The debt of joint ventures is non-recourse to TransCanada. The security provided by each joint venture is limited to the rights and assets of that joint venture and does not extend to the rights and assets of TransCanada, except to the extent of TransCanada’s investment.
The Company’s proportionate share of mandatory retirements resulting from maturities and sinking fund obligations of the non-recourse joint venture debt approximates: 2003 – $75 million; 2004 – $42 million; 2005 – $462 million; 2006 – $26 million; and 2007 – $24 million.
Financial Charges of Joint Ventures
Year ended December 31 |
| 2002 |
| 2001 |
| 2000 |
|
(millions of dollars) |
|
|
|
|
|
|
|
|
|
|
|
|
|
|
|
Interest on long-term non-recourse debt |
| 90 |
| 107 |
| 149 |
|
Other |
| — |
| — |
| 5 |
|
|
| 90 |
| 107 |
| 154 |
|
Financial charges of joint ventures – discontinued operations |
| — |
| — |
| (41 | ) |
|
| 90 |
| 107 |
| 113 |
|
The Company’s proportionate share of the interest payments of joint ventures in continuing operations was $88 million for the year ended December 31, 2002 (2001 – $100 million; 2000 – $99 million).
60
NOTE 10 Junior Subordinated Debentures and Preferred Securities
December 31 |
| Maturity Dates |
| 2002 |
| 2001 |
|
|
|
|
| (millions of dollars) |
| ||
|
|
|
|
|
|
|
|
Junior Subordinated Debentures |
|
|
|
|
|
|
|
8.75% Issue (2002 and 2001 – US$160 million) |
| 2045 |
| 218 |
| 218 |
|
Preferred Securities |
|
|
|
|
|
|
|
8.25% Issue (2002 – US$13 million; 2001 – US$12 million) |
| 2047 |
| 20 |
| 19 |
|
|
|
|
| 238 |
| 237 |
|
The foreign exchange differential on the principal amount of the 8.75 per cent Junior Subordinated Debentures and 8.25 per cent Preferred Securities, which are Canadian Mainline financings, will be recovered through the tollmaking process.
Junior Subordinated Debentures The US$160 million 8.75 per cent Junior Subordinated Debentures are redeemable at par by the Company. The Company may elect to defer interest payments on the Junior Subordinated Debentures. Interest and deferred interest, if any, are payable in cash.
Preferred Securities The US$460 million 8.25 per cent Preferred Securities are redeemable by the Company at par at any time on or after October 8, 2003, and in certain circumstances, prior to that date. The Company may elect to defer interest payments on the Preferred Securities and settle the deferred interest in either cash or common shares.
Since the deferred interest may be settled through the issuance of common shares at the option of the Company, the Preferred Securities are classified into their respective debt and equity components. The equity component of the Preferred Securities is $674 million at December 31, 2002 (2001 – $675 million).
On November 7, 2001, the Company redeemed US$200 million of 8.50 per cent Preferred Securities, including accrued and unpaid interest to the redemption date, without premium or penalty.
The Company incurred preferred securities charges, after-tax, of $36 million for the year ended December 31, 2002 (2001 – $45 million; 2000 – $44 million).
NOTE 11 Preferred Shares
December 31 |
| Number |
| Dividend |
| Redemption |
| 2002 |
| 2001 |
| ||
|
| (thousands) |
|
|
|
|
| (millions of dollars) |
| ||||
|
|
|
|
|
|
|
|
|
|
|
| ||
Cumulative First Preferred Shares |
|
|
|
|
|
|
|
|
|
|
| ||
Series U |
| 4,000 |
| $ | 2.80 |
| $ | 50.00 |
| 195 |
| 195 |
|
Series Y |
| 4,000 |
| $ | 2.80 |
| $ | 50.00 |
| 194 |
| 194 |
|
|
|
|
|
|
|
|
| 389 |
| 389 |
| ||
The authorized number of preferred shares issuable in series is unlimited. All of the cumulative first preferred shares are without par value.
On or after October 15, 2013, for the Series U shares, and on or after March 5, 2014, for the Series Y shares, the Company may redeem the shares at $50 per share.
61
NOTE 12 Common Shares
|
| Number |
| Amount |
|
|
| (thousands) |
| (millions of dollars) |
|
|
|
|
|
|
|
Outstanding at January 1, 2000 |
| 474,531 |
| 4,535 |
|
Exercise of options |
| 382 |
| 5 |
|
Outstanding at December 31, 2000 |
| 474,913 |
| 4,540 |
|
Exercise of options |
| 1,718 |
| 24 |
|
Outstanding at December 31, 2001 |
| 476,631 |
| 4,564 |
|
Exercise of options |
| 2,871 |
| 50 |
|
Outstanding at December 31, 2002 |
| 479,502 |
| 4,614 |
|
Common Shares Issued and Outstanding The Company is authorized to issue an unlimited number of common shares of no par value.
Net Income Per Share Basic and diluted earnings per share are calculated based on the weighted average number of common shares outstanding during the year of 478.3 million and 480.7 million (2001 – 475.8 million and 477.6 million; 2000 – 474.6 million and 475.2 million), respectively.
Stock Options |
| Number |
| Weighted Average |
| Options |
| |
|
| (thousands) |
|
|
| (thousands) |
| |
|
|
|
|
|
|
|
| |
Outstanding at January 1, 2000 |
| 12,871 |
| $ | 20.27 |
| 9,661 |
|
Granted |
| 3,475 |
| $ | 10.30 |
|
|
|
Exercised |
| (382 | ) | $ | 12.86 |
|
|
|
Cancelled or expired |
| (573 | ) | $ | 18.85 |
|
|
|
Outstanding at December 31, 2000 |
| 15,391 |
| $ | 18.25 |
| 12,102 |
|
Granted |
| 2,142 |
| $ | 18.07 |
|
|
|
Exercised |
| (1,718 | ) | $ | 14.08 |
|
|
|
Cancelled or expired |
| (1,365 | ) | $ | 21.45 |
|
|
|
Outstanding at December 31, 2001 |
| 14,450 |
| $ | 18.42 |
| 11,376 |
|
Granted |
| 1,946 |
| $ | 21.43 |
|
|
|
Exercised |
| (2,871 | ) | $ | 17.18 |
|
|
|
Cancelled or expired |
| (633 | ) | $ | 23.16 |
|
|
|
Outstanding at December 31, 2002 |
| 12,892 |
| $ | 18.92 |
| 10,258 |
|
The following table summarizes information about stock options outstanding at December 31, 2002.
|
| Options Outstanding |
| Options Exercisable |
| ||||||||
Range of |
| Number |
| Weighted |
| Weighted |
| Number |
| Weighted |
| ||
|
| (thousands) |
| (years) |
| (thousands) |
| ||||||
|
|
|
|
|
|
|
|
|
|
|
| ||
$10.03 to $13.91 |
| 2,243 |
| 7.1 |
| $ | 10.62 |
| 1,889 |
| $ | 10.72 |
|
$14.21 to $18.89 |
| 3,098 |
| 7.1 |
| $ | 17.52 |
| 2,286 |
| $ | 17.35 |
|
$19.00 to $20.59 |
| 2,830 |
| 5.7 |
| $ | 20.07 |
| 2,780 |
| $ | 20.09 |
|
$21.00 to $21.86 |
| 2,173 |
| 8.9 |
| $ | 21.43 |
| 755 |
| $ | 21.42 |
|
$22.85 to $24.61 |
| 2,548 |
| 5.1 |
| $ | 24.49 |
| 2,548 |
| $ | 24.49 |
|
|
| 12,892 |
| 6.8 |
| $ | 18.92 |
| 10,258 |
| $ | 18.95 |
|
The Key Employee Stock Incentive Plan (KESIP) permits the award of options to purchase the Company’s common shares to certain key employees, some of whom are officers. Options may be exercised at a price determined at the time the option is awarded. Generally, 25 per cent of the common shares subject to an option may be purchased on the award date and 25 per cent on each of the three following award date anniversaries. On February 25, 2002, the Company issued 1,946,300 options to purchase common shares at $21.43 under the Company’s Key Employee Stock Incentive Plan. At December 31, 2002, an additional six million common shares have been reserved for future issuance under KESIP. The Company is recording compensation expense over the three year vesting period.
62
Restricted Share Unit (RSU) Plan Effective January 1, 2002, the Company implemented the RSU plan. This is a long-term, broad-based employee incentive plan, which granted units to each eligible employee. The units will vest at the end of three years, should certain conditions be achieved which include the employee’s continued employment during that period and achievement of specified corporate performance targets. The Company is recording compensation expense over the three year vesting period and the value of the units will be paid at the end of the vesting period.
Shareholder Rights Plan The Company’s Shareholder Rights Plan is designed to encourage the fair treatment of shareholders in connection with any takeover offer for the Company. Under certain circumstances, each common share is entitled to one right which entitles certain holders to purchase common shares of the Company at 50 per cent of the then market price. The Plan was reaffirmed by shareholders in 2001 with certain amendments.
Restriction on Dividends Certain terms of the Company’s preferred shares, preferred securities, junior subordinated debentures and debt instruments could restrict the Company’s ability to declare dividends on preferred and common shares. At December 31, 2002, such terms did not restrict or alter the Company’s ability to declare dividends.
NOTE 13 Risk Management and Financial Instruments
The Company issues short-term and long-term debt including amounts in foreign currencies, purchases and sells energy commodities and invests in foreign operations. These activities result in exposures to interest rates, energy commodity prices and foreign currency exchange rates. The Company uses derivatives to manage the risk that results from these activities.
Carrying Values of Derivatives The carrying amounts of derivatives, which hedge the price risk of foreign currency denominated assets and liabilities and represent the net unrealized gains or losses on the derivatives, partially offset the foreign exchange adjustment in Shareholders’ Equity. Carrying amounts for interest rate swaps represent the net accrued interest from the last payment date to the reporting date. Foreign currency transactions hedged by foreign exchange contracts are recorded at the contract rate. The carrying amounts shown in the tables that follow are recorded in the Consolidated Balance Sheet.
Fair Values of Financial Instruments Cash and short-term investments and notes payable are valued at their carrying amounts due to the short period to maturity. The fair values of long-term debt, non-recourse long-term debt of joint ventures and junior subordinated debentures are determined using market prices for the same or similar issues.
The fair values of foreign exchange and interest rate derivatives have been estimated using year-end market rates. These fair values approximate the amount that the Company would receive or pay if the instruments were closed out at these dates.
Credit Risk Credit risk results from the possibility that a counterparty to a derivative in which the Company has an unrealized gain fails to perform according to the terms of the contract. Credit exposure is minimized through the use of established credit management techniques, including formal assessment processes, contractual and collateral requirements and credit exposure limits. At December 31, 2002, for foreign currency and interest rate derivatives, total credit risk and the largest credit exposure to a single counterparty were $168 million and $60 million, respectively. At December 31, 2002, for power energy trading contracts, total credit risk and the largest credit exposure to a single counterparty were $4 million and $1 million, respectively.
Notional Amounts Notional principal amounts are not recorded in the financial statements because these amounts are not exchanged by the Company and its counterparties and are not a measure of the Company’s exposure. Notional amounts are used only as the basis for calculating payments for certain derivatives.
63
Foreign Investments At December 31, 2002 and 2001, the Company had foreign currency denominated assets and liabilities which created an exposure to changes in exchange rates. The Company uses foreign currency derivatives to hedge this exposure on an after-tax basis. The cross-currency swaps have a floating interest rate which the Company partially hedges by entering into interest rate swaps and forward rate agreements. The Company’s portfolio of foreign investment derivatives is comprised of contracts for periods up to 5 years. The fair values shown in the table below for foreign exchange risk are offset by translation gains or losses on the net assets and are recorded in the foreign exchange adjustment in Shareholders’ Equity.
Asset/(Liability) at December 31 |
| 2002 |
| 2001 |
| ||||
|
| Carrying |
| Fair |
| Carrying |
| Fair |
|
(millions of dollars) |
|
|
|
|
|
|
|
|
|
|
|
|
|
|
|
|
|
|
|
Foreign Exchange Risk |
|
|
|
|
|
|
|
|
|
Cross-currency swaps |
|
|
|
|
|
|
|
|
|
U.S. dollars |
| (8 | ) | (8 | ) | (5 | ) | (5 | ) |
Forward foreign exchange contracts |
|
|
|
|
|
|
|
|
|
U.S. dollars |
| (4 | ) | (4 | ) | (6 | ) | (6 | ) |
Interest rate swaps |
|
|
|
|
|
|
|
|
|
Canadian dollars |
| 1 |
| 9 |
| — |
| — |
|
U.S. dollars |
| 1 |
| (13 | ) | — |
| (1 | ) |
At December 31, 2002, the principal amounts of cross-currency swaps were US$350 million (2001 – US$150 million), principal amounts of forward foreign exchange contracts were US$225 million (2001 – US$375 million) and principal amounts of interest rate swaps were $309 million (2001 – nil) and US$350 million (2001 – US$50 million).
Reconciliation of Foreign Exchange Adjustment
December 31 |
| 2002 |
| 2001 |
|
(millions of dollars) |
|
|
|
|
|
|
|
|
|
|
|
Balance at beginning of year |
| 13 |
| 13 |
|
Translation gains on foreign currency denominated net assets |
| 3 |
| 11 |
|
Foreign exchange losses on derivatives, and other |
| (2 | ) | (11 | ) |
|
| 14 |
| 13 |
|
Energy Price Risk Management The Company executes power and natural gas derivatives for overall management of its contractual portfolio. The Company’s portfolio of power and natural gas derivatives is primarily comprised of swap and option contracts for periods of up to 4 years, with fixed and floating price commitments. The fair values of power and natural gas derivatives have been calculated at year-end using estimated forward prices for the relevant period. The fair values of the swap and option contracts as at December 31, 2002 and 2001 are shown in the table below.
Asset/(Liability) at December 31 |
| 2002 |
| 2001 |
| ||||
|
| Carrying |
| Fair |
| Carrying |
| Fair |
|
(millions of dollars) |
|
|
|
|
|
|
|
|
|
|
|
|
|
|
|
|
|
|
|
Swaps – power |
| (36 | ) | (36 | ) | — |
| (1 | ) |
Options – gas |
| (3 | ) | (3 | ) | — |
| — |
|
At December 31, 2002, notional volumes were 5,604 gigawatt hours (GWh) (2001 – 6,013 GWh) for power swaps, and 6.3 Bcf (2001 – nil) for gas options.
U.S. Dollar Transaction Hedges To reduce risk and protect margins when purchase and sale contracts are denominated in different currencies, the Company enters into forward foreign exchange contracts, cross-currency swaps, and foreign exchange options which establish the foreign exchange rate for the cash flows from the related purchase and sale transactions.
64
Foreign Exchange and Interest Rate Management Activity The Company manages the foreign exchange risk of U.S. dollar debt, U.S. dollar expenses and the interest rate exposures of the Alberta System and the Canadian Mainline through the use of foreign currency and interest rate derivatives. These derivatives are comprised of contracts for periods up to 10 years. Certain of the realized gains and losses on these derivatives are shared with shippers on predetermined terms.
Asset/(Liability) at December 31 |
| 2002 |
| 2001 |
| ||||
|
| Carrying |
| Fair |
| Carrying |
| Fair |
|
(millions of dollars) |
|
|
|
|
|
|
|
|
|
|
|
|
|
|
|
|
|
|
|
Foreign Exchange Risk |
|
|
|
|
|
|
|
|
|
Cross-currency swaps |
| 46 |
| 46 |
| 88 |
| 88 |
|
Interest Rate Risk |
|
|
|
|
|
|
|
|
|
Interest rate swaps |
|
|
|
|
|
|
|
|
|
Canadian dollars |
| 4 |
| 45 |
| 4 |
| 26 |
|
U.S. dollars |
| (1 | ) | 4 |
| — |
| (3 | ) |
At December 31, 2002, the principal amounts of cross-currency swaps were US$162 million (2001 – US$407 million). Notional principal amounts for interest rate swaps were $1,024 million (2001 – $780 million) and US$175 million (2001 – US$125 million).
The Company manages the foreign exchange risk and interest rate exposure of its other U.S. dollar debt through the use of foreign currency and interest rate derivatives. The carrying amount and fair value of U.S. dollar interest rate swaps at December 31, 2002 were $2 million (2001 – $2 million) and $55 million (2001 – $30 million), respectively. Notional principal amounts were US$250 million (2001 – US$200 million). These derivatives are comprised of contracts for periods up to 8 years.
Other Fair Values
December 31 |
| 2002 |
| 2001 |
| ||||
|
| Carrying |
| Fair |
| Carrying |
| Fair |
|
(millions of dollars) |
|
|
|
|
|
|
|
|
|
|
|
|
|
|
|
|
|
|
|
Long-Term Debt |
|
|
|
|
|
|
|
|
|
Alberta System |
| 2,892 |
| 3,420 |
| 3,129 |
| 3,611 |
|
Canadian Mainline |
| 5,277 |
| 6,080 |
| 5,563 |
| 6,245 |
|
Other |
| 1,765 |
| 1,904 |
| 1,797 |
| 1,837 |
|
Non-Recourse Debt of Joint Ventures |
| 1,297 |
| 1,427 |
| 1,339 |
| 1,408 |
|
Junior Subordinated Debentures |
| 274 |
| 276 |
| 274 |
| 276 |
|
These fair values are provided solely for information purposes and are not recorded in the Consolidated Balance Sheet.
NOTE 14 Income Taxes
Provision for Income Taxes
Year ended December 31 |
| 2002 |
| 2001 |
| 2000 |
|
(millions of dollars) |
|
|
|
|
|
|
|
|
|
|
|
|
|
|
|
Current |
|
|
|
|
|
|
|
Canada |
| 229 |
| 307 |
| 246 |
|
Foreign |
| 41 |
| 46 |
| 34 |
|
|
| 270 |
| 353 |
| 280 |
|
Future |
|
|
|
|
|
|
|
Canada |
| 193 |
| 70 |
| 41 |
|
Foreign |
| 54 |
| 57 |
| 33 |
|
|
| 247 |
| 127 |
| 74 |
|
|
| 517 |
| 480 |
| 354 |
|
65
Geographic Components of Income
Year ended December 31 |
| 2002 |
| 2001 |
| 2000 |
|
(millions of dollars) |
|
|
|
|
|
|
|
|
|
|
|
|
|
|
|
Canada |
| 1,042 |
| 933 |
| 858 |
|
Foreign |
| 280 |
| 300 |
| 203 |
|
Income from continuing operations before income taxes |
| 1,322 |
| 1,233 |
| 1,061 |
|
Reconciliation of Income Tax Expense
Year ended December 31 |
| 2002 |
| 2001 |
| 2000 |
|
(millions of dollars) |
|
|
|
|
|
|
|
|
|
|
|
|
|
|
|
Income from continuing operations before income taxes |
| 1,322 |
| 1,233 |
| 1,061 |
|
Income from regulated operations not subject to tax currently |
| (22 | ) | (130 | ) | (245 | ) |
|
| 1,300 |
| 1,103 |
| 816 |
|
Federal and provincial statutory tax rate |
| 39.2 | % | 42.1 | % | 44.6 | % |
Expected income tax expense |
| 510 |
| 464 |
| 364 |
|
Non-deductible expenses |
| 1 |
| 3 |
| 3 |
|
Net difference between the federal and provincial statutory tax rate and rate of foreign authorities |
| (13 | ) | (13 | ) | (8 | ) |
Large corporations tax |
| 30 |
| 31 |
| 32 |
|
Change in valuation allowance |
| 8 |
| — |
| (8 | ) |
Adjustment to future tax assets and liabilities for enacted changes in tax laws and rates |
| — |
| — |
| (28 | ) |
Other |
| (19 | ) | (5 | ) | (1 | ) |
Actual income tax expense |
| 517 |
| 480 |
| 354 |
|
Future Income Tax Assets and Liabilities
December 31 |
| 2002 |
| 2001 |
|
(millions of dollars) |
|
|
|
|
|
|
|
|
|
|
|
Net operating and capital loss carryforwards |
| 91 |
| 180 |
|
Deferred costs |
| 49 |
| 91 |
|
Deferred revenue |
| 55 |
| 49 |
|
Alternative minimum tax credits |
| 31 |
| 40 |
|
Other |
| 41 |
| 29 |
|
|
| 267 |
| 389 |
|
Less: Valuation allowance |
| 33 |
| 25 |
|
Future income tax assets, net of valuation allowance |
| 234 |
| 364 |
|
|
|
|
|
|
|
Difference in accounting and tax bases of plant, equipment and power purchase arrangements |
| 345 |
| 282 |
|
Investments in subsidiaries and partnerships |
| 107 |
| 116 |
|
Other |
| 8 |
| 5 |
|
Future income tax liabilities |
| 460 |
| 403 |
|
Net future income tax liabilities |
| 226 |
| 39 |
|
The Company follows the taxes payable method of accounting for income taxes related to the operations of the Canadian natural gas transmission operations. If the liability method of accounting had been used, additional future income tax liabilities in the amount of $1,702 million at December 31, 2002 (2001 – $1,716 million) would have been recorded and would be recoverable from future revenues.
66
Unremitted Earnings of Foreign Investments Income taxes have not been provided on the unremitted earnings of foreign investments which the Company intends to indefinitely reinvest in foreign operations. If provision for these taxes had been made, future income tax liabilities would increase by approximately $60 million at December 31, 2002 (2001 – $54 million).
Income Tax Payments Income tax payments of $257 million were made during the year ended December 31, 2002 (2001 – $292 million; 2000 – $231 million).
NOTE 15 Notes Payable
|
| 2002 |
| 2001 |
| ||||
|
| Outstanding |
| Weighted |
| Outstanding |
| Weighted |
|
|
| (millions of dollars) |
| (millions of dollars) |
| ||||
|
|
|
|
|
|
|
|
|
|
Commercial Paper |
|
|
|
|
|
|
|
|
|
Canadian dollars |
| 258 |
| 2.9 | % | 340 |
| 2.3 | % |
U.S. dollars |
| 39 |
| 1.4 | % | — |
| — |
|
Notes Payable of Joint Ventures |
|
|
|
|
|
|
|
|
|
Canadian dollars |
| — |
| — |
| 3 |
| 4.7 | % |
|
| 297 |
|
|
| 343 |
|
|
|
Total credit facilities of $2 billion at December 31, 2002, were available to support the Company’s commercial paper program and for general corporate purposes. Of this total, $1.5 billion represents a new committed syndicated credit facility established in December 2002 which replaced existing lines set to expire in mid-2003. The new facility is comprised of a $1.0 billion tranche with a three year term and a $500 million tranche with a 364 day term with a two year term out option. Both tranches are extendible on an annual basis and revolving unless during a term out period.
At December 31, 2002, the Company had used approximately $269 million of its total lines of credit for letters of credit to support its ongoing commercial arrangements. If used, interest on the lines of credit would be charged at prime rates of Canadian chartered and U.S. banks and at other negotiated financial bases. The cost to maintain the unused portion of the lines of credit is approximately $1 million for the year ended December 31, 2002 (2001 – $1 million).
NOTE 16 Employee Future Benefits
The Company sponsors defined benefit pension plans that cover substantially all employees and sponsored a defined contribution pension plan which was effectively terminated at December 31, 2002. The defined benefit pension plans are based on years of service and highest average earnings over three consecutive years of employment. Under the defined contribution pension plan, Company contributions were based on the participating employees’ pensionable earnings. As a result of the termination of the defined contribution pension plan, members of this plan were awarded retroactive service credit under the defined benefit plans for all years of service. In exchange for past service credit, members surrendered the accumulated assets in their defined contribution accounts to the defined benefit plan as at December 31, 2002. This plan amendment is subject to regulatory approval and resulted in unamortized past service costs of $44 million.
The Company also provides its employees with other post-employment benefits other than pensions, including special termination benefits and defined life insurance and medical benefits beyond those provided by government-sponsored plans. Effective January 1, 2003, the Company combined its previously existing post-employment benefit plans into one plan for active employees and provided existing retirees the option of adopting the provisions of the new plan. This plan amendment resulted in unamortized past service costs of $7 million.
The total expense for the defined contribution plan is $6 million for the year ended December 31, 2002 (2001 – $7 million; 2000 – $8 million).
67
Information about the Company’s defined benefit plans is as follows.
|
| Pension Benefit Plans |
| Other Benefit Plans |
| ||||
|
| 2002 |
| 2001 |
| 2002 |
| 2001 |
|
(millions of dollars) |
|
|
|
|
|
|
|
|
|
|
|
|
|
|
|
|
|
|
|
Change in Benefit Obligation |
|
|
|
|
|
|
|
|
|
Benefit obligation – beginning of year |
| 659 |
| 644 |
| 60 |
| 55 |
|
Current service cost |
| 11 |
| 12 |
| 2 |
| 2 |
|
Interest cost |
| 43 |
| 41 |
| 4 |
| 4 |
|
Employee contributions |
| 1 |
| 1 |
| — |
| — |
|
Benefits paid |
| (58 | ) | (59 | ) | (4 | ) | (3 | ) |
Actuarial loss |
| 93 |
| 20 |
| 26 |
| 2 |
|
Plan amendment |
| 92 |
| — |
| 7 |
| — |
|
Benefit obligation – end of year |
| 841 |
| 659 |
| 95 |
| 60 |
|
|
|
|
|
|
|
|
|
|
|
Change in Plan Assets |
|
|
|
|
|
|
|
|
|
Plan assets at fair value – beginning of year |
| 573 |
| 612 |
| — |
| — |
|
Actual return on plan assets |
| 9 |
| (8 | ) | — |
| — |
|
Employer contributions |
| 48 |
| 27 |
| 4 |
| 3 |
|
Employee contributions |
| 1 |
| 1 |
| — |
| — |
|
Benefits paid |
| (58 | ) | (59 | ) | (4 | ) | (3 | ) |
Assets receivable from defined contribution plan |
| 48 |
| — |
| — |
| — |
|
Plan assets at fair value – end of year |
| 621 |
| 573 |
| — |
| — |
|
|
|
|
|
|
|
|
|
|
|
Funded status – plan deficit |
| (220 | ) | (86 | ) | (95 | ) | (60 | ) |
Unamortized net actuarial loss |
| 246 |
| 123 |
| 33 |
| 7 |
|
Unamortized past service costs |
| 44 |
| — |
| 7 |
| — |
|
Unamortized transitional obligation related to regulated business |
| — |
| — |
| 27 |
| 29 |
|
Accrued benefit asset/(liability), net of valuation allowance of nil(1) |
| 70 |
| 37 |
| (28 | ) | (24 | ) |
(1) Assets and liabilities are included in Other Assets and Deferred Amounts, respectively, in TransCanada’s consolidated balance sheet.
The significant weighted average actuarial assumptions adopted in measuring the Company’s accrued benefit obligations and net benefit plan expense as at December 31 are as follows.
|
| Pension Benefit Plans |
| Other Benefit Plans |
| ||||||||
|
| 2002 |
| 2001 |
| 2000 |
| 2002 |
| 2001 |
| 2000 |
|
|
|
|
|
|
|
|
|
|
|
|
|
|
|
Discount rate |
| 6.25% |
| 6.75% |
| 6.80% |
| 6.50% |
| 6.85% |
| 6.90% |
|
Expected long-term rate of return on plan assets |
| 7.52% |
| 7.10% |
| 7.24% |
| — |
| — |
| — |
|
Rate of compensation increase |
| 3.75% |
| 3.50% |
| 3.50% |
| 3.75% |
| 3.50% |
| 3.50% |
|
For measurement purposes, an 8.0 per cent annual rate of increase in the per capita cost of covered health care benefits was assumed for 2003. The rate was assumed to decrease gradually to 5.0 per cent for 2009 and remain at that level thereafter. A one percentage point increase or decrease in assumed health care cost trend rates would have the following effects.
|
| Increase |
| Decrease |
|
(millions of dollars) |
|
|
|
|
|
|
|
|
|
|
|
Effect on total of service and interest cost components |
| 1 |
| (1 | ) |
Effect on post-employment benefit obligation |
| 11 |
| (10 | ) |
68
The Company’s net benefit plan expense is as follows.
|
| Pension Benefit Plans |
| Other Benefit Plans |
| ||||||||
Year ended December 31 |
| 2002 |
| 2001 |
| 2000 |
| 2002 |
| 2001 |
| 2000 |
|
(millions of dollars) |
|
|
|
|
|
|
|
|
|
|
|
|
|
|
|
|
|
|
|
|
|
|
|
|
|
|
|
Current service cost |
| 11 |
| 12 |
| 15 |
| 2 |
| 2 |
| 2 |
|
Interest cost |
| 43 |
| 41 |
| 44 |
| 4 |
| 4 |
| 3 |
|
Expected return on plan assets |
| (45 | ) | (41 | ) | (45 | ) | — |
| — |
| — |
|
Amortization of transitional obligation related to regulated business |
| — |
| — |
| — |
| 2 |
| 2 |
| 2 |
|
Amortization of net actuarial loss |
| 2 |
| — |
| — |
| — |
| — |
| — |
|
Corporate restructuring giving rise to curtailments |
| — |
| — |
| (5 | ) | — |
| — |
| — |
|
|
| 11 |
| 12 |
| 9 |
| 8 |
| 8 |
| 7 |
|
Net benefit plan expense – discontinued operations |
| — |
| (2 | ) | (2 | ) | — |
| — |
| — |
|
Net benefit plan expense – continuing operations |
| 11 |
| 10 |
| 7 |
| 8 |
| 8 |
| 7 |
|
NOTE 17 Changes in Operating Working Capital
Year ended December 31 |
| 2002 |
| 2001 |
| 2000 |
|
(millions of dollars) |
|
|
|
|
|
|
|
|
|
|
|
|
|
|
|
(Increase)/decrease in accounts receivable |
| (45 | ) | 38 |
| (92 | ) |
(Increase)/decrease in inventories |
| (3 | ) | 52 |
| 5 |
|
Increase in other current assets |
| (53 | ) | (12 | ) | (6 | ) |
Increase/(decrease) in accounts payable |
| 120 |
| 105 |
| (318 | ) |
Increase/(decrease) in accrued interest |
| 14 |
| (13 | ) | (5 | ) |
|
| 33 |
| 170 |
| (416 | ) |
NOTE 18 Commitments, Contingencies and Guarantees
Commitments Future annual payments, net of sub-lease receipts, under the Company’s operating leases for various premises are approximately as follows.
Year ended December 31 |
| Minimum |
| Amounts |
| Net |
|
(millions of dollars) |
|
|
|
|
|
|
|
|
|
|
|
|
|
|
|
2003 |
| 27 |
| (9 | ) | 18 |
|
2004 |
| 25 |
| (7 | ) | 18 |
|
2005 |
| 25 |
| (7 | ) | 18 |
|
2006 |
| 24 |
| (7 | ) | 17 |
|
2007 |
| 22 |
| (6 | ) | 16 |
|
At December 31, 2002, TransCanada held a 35.6 per cent interest in TransCanada Power, L.P. which is a publicly-held limited partnership. On June 30, 2017, the partnership will redeem all units outstanding, not held directly or indirectly by TransCanada, at their then fair market value, being the average of the fair market values assigned thereto by independent valuators, plus all declared and unpaid distributions of distributable cash thereon (the Redemption Price). The Redemption Price will be satisfied by TransCanada in cash or, at the election of TransCanada, in common shares of TransCanada or a combination of cash and common shares.
69
Contingencies The California Attorney General has filed a complaint for civil penalties in California Superior Court under the California Business and Professions Code. The complaint alleges that certain TransCanada subsidiaries and affiliates engaged in sales or purchases of electricity in California for which they failed to comply with the filing requirements of the Federal Power Act and the U.S. Federal Energy Regulatory Commission (FERC) orders. TransCanada believes the actions of its subsidiaries and affiliates were in compliance with the Federal Power Act and FERC requirements. TransCanada considers the complaint to be without merit and is vigorously defending it. The Company has made no provision for any potential liability.
The Canadian Alliance of Pipeline Landowners’ Associations and two individual landowners have commenced an action under Ontario’s Class Proceedings Act, 1992, against TransCanada and Enbridge Inc. for damages alleged to arise from the creation of a control zone within 30 metres of the pipeline pursuant to section 112 of the NEB Act. The Company believes the claim is without merit and will vigorously defend the action. The Company has made no provision for any potential liability. A liability, if any, would be dealt with through the regulatory process.
The Company and its subsidiaries are subject to various other legal proceedings and actions arising in the normal course of business. While the final outcome of such legal proceedings and actions cannot be predicted with certainty, it is the opinion of Management that their resolution will not have a material impact on the Company’s consolidated financial position or results of operations.
Guarantees TransCanada has guaranteed the equity undertaking of a subsidiary which supports the payment of debt obligations of TransGas de Occidente, S.A. (TransGas), in the event a change of law would result in insufficient funds in TransGas to pay the interest and principal on US$206 million of its public debt obligations. The Company has a 46.5 per cent interest in TransGas. Under the terms of the agreement, the Company severally with another major multinational company may be required to fund more than their proportionate share of debt obligations of TransGas in the event that the minority shareholders fail to contribute. Any payments made by TransCanada under this agreement convert into share capital of TransGas. The potential exposure is contingent on the impact of any change of law on TransGas’ ability to service the debt. From the issuance of the debt in 1995 to date, there has been no change in applicable law and thus no exposure to TransCanada. The debt matures in 2010. The Company has made no provision related to this guarantee.
NOTE 19 Discontinued Operations
In July 2001, the Board of Directors approved a plan to dispose of the Company’s Gas Marketing business. The Gas Marketing business provided supply, transportation and asset management services, as well as structured financial products and services. In December 1999, the Board of Directors approved a plan (December Plan) to dispose of the Company’s International, Canadian Midstream and certain other businesses. The Company’s disposals under both plans were substantially completed at December 31, 2001.
The Company remains contingently liable pursuant to obligations under certain energy trading contracts that relate to the divested Gas Marketing business. The contingent liability under these obligations, which could be significant, is contingent on certain future events, the occurrence of which is not determinable, and the amount, if any, is dependent upon future prevailing market prices and conditions. The purchasers of the Gas Marketing business have agreed to indemnify TransCanada in the event the Company is called upon to perform under the obligations. At December 31, 2002, the provision for loss on discontinued operations, including approximately $100 million of deferred after-tax gains and remaining obligations related to the Gas Marketing business, was reviewed and was concluded to be appropriate.
Revenues from discontinued operations for the year ended December 31, 2002, were $36 million (2001 – $12,895 million; 2000 – $15,212 million). The provision for loss on discontinued operations at December 31, 2002 was $234 million (2001 – $264 million). This was comprised of $129 million (2001 – $129 million) relating to Gas Marketing and $105 million (2001 – $135 million) relating to the December Plan.
70
Net Income/(Loss)
Year ended December 31 |
| 2002 |
| 2001 |
| 2000 |
|
(millions of dollars) |
|
|
|
|
|
|
|
|
|
|
|
|
|
|
|
Net Income/(Loss) |
|
|
|
|
|
|
|
Gas Marketing |
| — |
| 5 |
| (252 | ) |
Income taxes |
| — |
| (2 | ) | 113 |
|
Results of operations prior to plan approval |
| — |
| 3 |
| (139 | ) |
Net Gain/(Loss) from Discontinued Operations |
|
|
|
|
|
|
|
December Plan(1) |
| — |
| 34 |
| 295 |
|
Income taxes |
| — |
| (14 | ) | (95 | ) |
|
| — |
| 20 |
| 200 |
|
Gas Marketing(1) |
| — |
| (139 | ) | — |
|
Income taxes |
| — |
| 49 |
| — |
|
|
| — |
| (90 | ) | — |
|
|
| — |
| (67 | ) | 61 |
|
(1) The net loss on disposal in 2001 related to Gas Marketing includes the actual and estimated gains and losses on sale, the results of the discontinued operations between the date of plan approval and the expected dates of disposal, together with direct incremental costs of the dispositions, including severance and transaction expenses. The net gains in 2001 and 2000 related to the December Plan represent adjustments to the 1999 provision resulting from transactions completed and revisions to estimates.
Other Financial Information The following amounts related to discontinued operations are included in the consolidated balance sheet.
December 31 |
| 2002 |
| 2001 |
|
(millions of dollars) |
|
|
|
|
|
|
|
|
|
|
|
Current assets |
| 79 |
| 113 |
|
Non-current assets |
| 109 |
| 212 |
|
Current liabilities |
| (98 | ) | (116 | ) |
Non-current liabilities |
| — |
| (9 | ) |
Net Assets of Discontinued Operations |
| 90 |
| 200 |
|
71
NOTE 20 Significant Differences Between Canadian and U.S. GAAP
Net Income Reconciliation
Year ended December 31 |
| 2002 |
| 2001 |
| 2000 |
| |||
(millions of dollars except per share amounts) |
|
|
|
|
|
|
| |||
|
|
|
|
|
|
|
| |||
Net income from continuing operations as reported in accordance with Canadian GAAP |
| 805 |
| 753 |
| 707 |
| |||
U.S. GAAP adjustments |
|
|
|
|
|
|
| |||
Preferred securities charges(1) |
| (58 | ) | (77 | ) | (78 | ) | |||
Tax impact of preferred securities charges |
| 22 |
| 32 |
| 34 |
| |||
Unrealized gain/(loss) on derivatives(2) |
| 30 |
| (14 | ) | — |
| |||
Tax impact of gain/(loss) on derivatives |
| (12 | ) | 6 |
| — |
| |||
Unrealized (losses)/gains on energy trading contracts(3) |
| (21 | ) | (17 | ) | 37 |
| |||
Tax impact of unrealized (losses)/gains on energy trading contracts |
| 8 |
| 6 |
| (17 | ) | |||
Income taxes from substantively enacted tax rates(4) |
| — |
| 28 |
| (28 | ) | |||
Gain on early retirement of long-term debt(5) |
| — |
| — |
| (15 | ) | |||
Tax impact of gain on early retirement of long-term debt |
| — |
| — |
| 2 |
| |||
Income from continuing operations in accordance with U.S. GAAP |
| 774 |
| 717 |
| 642 |
| |||
Net (loss)/income from discontinued operations in accordance with U.S. GAAP |
| — |
| (67 | ) | 61 |
| |||
Income before cumulative effect of the application of SFAS No. 133 in accordance with U.S. GAAP |
| 774 |
| 650 |
| 703 |
| |||
Cumulative effect of the application of SFAS No. 133, net of tax(2) |
| — |
| (2 | ) | — |
| |||
Extraordinary item: |
|
|
|
|
|
|
| |||
Gain on early retirement of long-term debt, net of tax(5) |
| — |
| — |
| 13 |
| |||
Net income in accordance with U.S. GAAP |
| 774 |
| 648 |
| 716 |
| |||
|
|
|
|
|
|
|
| |||
Net income/(loss) per share in accordance with U.S. GAAP |
|
|
|
|
|
|
| |||
Continuing operations |
| $ | 1.57 |
| $ | 1.46 |
| $ | 1.27 |
|
Discontinued operations |
| — |
| (0.14 | ) | 0.13 |
| |||
Extraordinary item |
| — |
| — |
| 0.03 |
| |||
Basic |
| $ | 1.57 |
| $ | 1.32 |
| $ | 1.43 |
|
Diluted |
| $ | 1.56 |
| $ | 1.32 |
| $ | 1.43 |
|
|
|
|
|
|
|
|
|
|
|
|
Net income per share in accordance with Canadian GAAP |
|
|
|
|
|
|
| |||
Basic |
| $ | 1.56 |
| $ | 1.30 |
| $ | 1.45 |
|
Diluted |
| $ | 1.55 |
| $ | 1.30 |
| $ | 1.45 |
|
Dividends per common share |
| $ | 1.00 |
| $ | 0.90 |
| $ | 0.80 |
|
(1) Under U.S. GAAP, the financial charges related to preferred securities are recognized as an expense, rather than dividends.
(2) In 2001, the Company adopted the provisions of Statement of Financial Accounting Standards (SFAS) No. 133 “Accounting for Derivatives and Hedging Activities”. SFAS No. 133 requires that all derivatives be recognized as assets and liabilities on the balance sheet and measured at fair value.
For derivatives designated as fair value hedges, changes in the fair value are recognized in earnings together with an equal or lesser amount of changes in the fair value of the hedged item attributable to the hedged risk. For derivatives designated as cash flow hedges, changes in the fair value of the derivative that are effective in offsetting the hedged risk are recognized in other comprehensive income until the hedged item is recognized in earnings. Any ineffective portion of the change in fair value is recognized in earnings each period.
On initial adoption of SFAS No. 133 on January 1, 2001, additional assets of $93 million and liabilities of $99 million were recorded for U.S. GAAP purposes to reflect the fair value of derivatives designated as hedges and the corresponding change in the fair value of items designated as hedges. A charge of $2 million, after tax, relating to the fair value of hedges was recognized in income and $4 million, after tax, relating to the fair value of derivatives designated as cash flow hedges was recognized in other comprehensive income as the cumulative effect of application of SFAS No. 133.
During 2002, net gains of $38 million (2001 - $36 million) from the hedges of changes in the fair value of long-term debt, and net losses of $20 million (2001 - $44 million) in the fair value of the hedged item were included in earnings as an adjustment to interest expense and foreign exchange losses. The difference of the change in the fair value of the derivative as compared to the change in the fair value of the hedged item of $18 million (2001 - $(8) million), after tax, is included in earnings for U.S. GAAP purposes. During 2002 and 2001, no amounts of the derivatives’ gains or losses were excluded from the assessment of hedge effectiveness in fair value hedging relationships.
72
No amounts were included in income in 2002 and 2001 with respect to cash flow hedges. For amounts included in other comprehensive income at December 31, 2002, $(5) million (2001 – $(3) million) relates to the hedge of interest rate risk and $1 million (2001 – $(2) million) relates to the hedge of foreign exchange rate risk. Of these amounts, none are expected to be recorded in earnings during 2003.
At December 31, 2002, additional assets of $198 million (2001 – $162 million) and additional liabilities of $196 million (2001 – $187 million) were recorded for U.S. GAAP purposes to reflect the fair value of derivatives designated as hedges and the corresponding change in the fair value of items designated as hedges.
(3) Under U.S. GAAP, energy trading contracts are measured at fair value determined as at the balance sheet date. In 2002, TransCanada adopted the transitional provisions of FASB Emerging Issues Task Force (EITF) 02-3, “Accounting for Contracts Involved in Energy Trading and Risk Management Activities”, whereby the Company is netting all mark-to-market revenues and expenses related to energy trading contracts. This accounting change has been applied retroactively with reclassification of prior periods. In 2003, the Company will fully adopt EITF 02-3. The Company’s energy trading contracts that are derivatives held for trading purposes will be measured at fair value and accounted for under the provisions of SFAS No. 133. The Company’s energy trading contracts that are not derivatives will not be subject to mark-to-market accounting.
(4) Under U.S. GAAP, only enacted rates can be used in measuring deferred tax assets and liabilities; use of substantively enacted rates is not permitted. The February 2000 and October 2000 Federal budgets would not be considered enacted until the proposals were completely enacted into law in June 2001 and, accordingly, the related tax recoveries were recognized in 2001.
(5) Under U.S. GAAP, gain on early retirement of long-term debt is recognized as an extraordinary item, rather than ordinary income from operations.
Condensed Statement of Consolidated Income in Accordance with U.S. GAAP(8)
Year ended December 31 |
| 2002 |
| 2001 |
| 2000 |
|
(millions of dollars) |
|
|
|
|
|
|
|
|
|
|
|
|
|
|
|
Revenues(3)(8) |
| 4,284 |
| 4,165 |
| 3,921 |
|
Cost of sales |
| 160 |
| 47 |
| 52 |
|
Other costs and expenses(3)(8) |
| 1,532 |
| 1,609 |
| 1,566 |
|
Depreciation |
| 729 |
| 675 |
| 608 |
|
|
| 2,421 |
| 2,331 |
| 2,226 |
|
Operating income |
| 1,863 |
| 1,834 |
| 1,695 |
|
Other (income)/expenses |
|
|
|
|
|
|
|
Equity income |
| (260 | ) | (221 | ) | (247 | ) |
Other expenses(6) |
| 850 |
| 931 |
| 937 |
|
Income taxes |
| 499 |
| 407 |
| 363 |
|
|
| 1,089 |
| 1,117 |
| 1,053 |
|
Income from continuing operations in accordance with U.S. GAAP |
| 774 |
| 717 |
| 642 |
|
Net (loss)/income from discontinued operations in accordance with U.S. GAAP |
| — |
| (67 | ) | 61 |
|
Income before cumulative effect of the application of SFAS No. 133 in accordance with U.S. GAAP |
| 774 |
| 650 |
| 703 |
|
Cumulative effect of the application of SFAS No. 133, net of tax(2) |
| — |
| (2 | ) | — |
|
Extraordinary item: |
|
|
|
|
|
|
|
Gain on early retirement of long-term debt, net of tax(5) |
| — |
| — |
| 13 |
|
Net income in accordance with U.S. GAAP |
| 774 |
| 648 |
| 716 |
|
73
Comprehensive Income in Accordance with U.S. GAAP
Year ended December 31 |
| 2002 |
| 2001 |
| 2000 |
|
(millions of dollars) |
|
|
|
|
|
|
|
|
|
|
|
|
|
|
|
Net income in accordance with U.S. GAAP |
| 774 |
| 648 |
| 716 |
|
Adjustments affecting comprehensive income under U.S. GAAP Foreign currency translation adjustment |
| 1 |
| — |
| (5 | ) |
Additional minimum liability for employee future benefits (SFAS No. 87)(7) |
| (62 | ) | (86 | ) | — |
|
Tax impact of additional minimum liability for employee future benefits |
| 22 |
| 30 |
| — |
|
Unrealized loss on derivatives(2) |
| (3 | ) | (7 | ) | — |
|
Tax impact of loss on derivatives |
| (1 | ) | 2 |
| — |
|
Comprehensive income before cumulative effect of the application of SFAS No. 133 in accordance with U.S. GAAP |
| 731 |
| 587 |
| 711 |
|
Cumulative effect of the application of SFAS No. 133, net of tax(2) |
| — |
| (4 | ) | — |
|
Comprehensive income in accordance with U.S. GAAP |
| 731 |
| 583 |
| 711 |
|
Condensed Balance Sheet in Accordance with U.S. GAAP(8)
December 31 |
| 2002 |
| 2001 |
|
(millions of dollars) |
|
|
|
|
|
|
|
|
|
|
|
Current assets |
| 1,074 |
| 1,162 |
|
Long-term energy trading assets(3) |
| 218 |
| 255 |
|
Long-term investments |
| 1,629 |
| 1,570 |
|
Plant, property and equipment |
| 14,992 |
| 15,379 |
|
Regulatory asset(9) |
| 2,578 |
| 2,613 |
|
Other assets |
| 893 |
| 473 |
|
|
| 21,384 |
| 21,452 |
|
|
|
|
|
|
|
Current liabilities(10) |
| 1,918 |
| 1,844 |
|
Provision for loss on discontinued operations |
| 234 |
| 264 |
|
Long-term energy trading liabilities(3) |
| 41 |
| 112 |
|
Deferred amounts |
| 593 |
| 503 |
|
Long-term debt |
| 8,963 |
| 9,512 |
|
Deferred income taxes(9) |
| 2,692 |
| 2,556 |
|
Preferred securities(11) |
| 694 |
| 694 |
|
Trust originated preferred securities |
| 218 |
| 218 |
|
Shareholders’ equity |
| 6,031 |
| 5,749 |
|
|
| 21,384 |
| 21,452 |
|
74
Statement of Other Comprehensive Income in Accordance with U.S. GAAP
December 31 |
| Cumulative |
| Minimum |
| Cash Flow |
| Total |
|
(millions of dollars) |
|
|
|
|
|
|
|
|
|
|
|
|
|
|
|
|
|
|
|
Balance at January 1, 2000 |
| 18 |
| — |
| — |
| 18 |
|
Foreign currency translation adjustment |
| (5 | ) | — |
| — |
| (5 | ) |
Balance at December 31, 2000 |
| 13 |
| — |
| — |
| 13 |
|
Additional minimum liability for employee future benefits, net of tax(7) |
| — |
| (56 | ) | — |
| (56 | ) |
Unrealized loss on derivatives, net of tax(2) |
| — |
| — |
| (5 | ) | (5 | ) |
Cumulative effect of adoption of SFAS No. 133, net of tax(2) |
| — |
| — |
| (4 | ) | (4 | ) |
Balance at December 31, 2001 |
| 13 |
| (56 | ) | (9 | ) | (52 | ) |
Additional minimum liability for employee future benefits, net of tax(7) |
| — |
| (40 | ) | — |
| (40 | ) |
Unrealized loss on derivatives, net of tax(2) |
| — |
| — |
| (4 | ) | (4 | ) |
Foreign currency translation adjustment |
| 1 |
| — |
| — |
| 1 |
|
Balance at December 31, 2002 |
| 14 |
| (96 | ) | (13 | ) | (95 | ) |
(6) Other expenses included an allowance for funds used during construction of $4 million for the year ended December 31, 2002 (2001 – $5 million; 2000 – $8 million).
(7) Under U.S. GAAP, a net loss recognized pursuant to SFAS No. 87 “Employers’ Accounting for Pensions” as an additional pension liability not yet recognized as net period pension cost, must be recorded as a component of comprehensive income.
(8) In accordance with U.S. GAAP, the Condensed Statement of Consolidated Income and Balance Sheet are prepared using the equity method of accounting for joint ventures. Excluding the impact of other U.S. GAAP adjustments, the use of the proportionate consolidation method of accounting for joint ventures, as required under Canadian GAAP, results in the same net income and shareholders’ equity.
(9) Under U.S. GAAP, the Company is required to record a deferred income tax liability for its cost-of-service regulated businesses. As these deferred income taxes are recoverable through future revenues, a corresponding regulatory asset is recorded for U.S. GAAP purposes.
(10) Current liabilities at December 31, 2002 included dividends payable of $125 million (2001 – $114 million) and current taxes payable of $150 million (2001 – $149 million).
(11) Under U.S. GAAP, the preferred securities are classified as a liability. The fair value of the preferred securities at December 31, 2002 was $743 million (2001 – $740 million). The Company made preferred securities charges payments of $58 million for the year ended December 31, 2002 (2001 – $77 million; 2000 – $78 million).
Income Taxes The tax effects of differences between the accounting value and the tax value of assets and liabilities are as follows.
December 31 |
| 2002 |
| 2001 |
|
(millions of dollars) |
|
|
|
|
|
|
|
|
|
|
|
Deferred Tax Liabilities |
|
|
|
|
|
Difference in accounting and tax bases of plant, equipment and power purchase arrangements |
| 1,703 |
| 1,722 |
|
Taxes on future revenue requirement |
| 876 |
| 897 |
|
Investments in subsidiaries and partnerships |
| 379 |
| 318 |
|
Other |
| 22 |
| 16 |
|
|
| 2,980 |
| 2,953 |
|
|
|
|
|
|
|
Deferred Tax Assets |
|
|
|
|
|
Net operating and capital loss carryforwards |
| 91 |
| 180 |
|
Deferred amounts |
| 104 |
| 140 |
|
Other |
| 126 |
| 102 |
|
|
| 321 |
| 422 |
|
Less: Valuation allowance |
| 33 |
| 25 |
|
|
| 288 |
| 397 |
|
Net deferred tax liabilities |
| 2,692 |
| 2,556 |
|
75
Stock-Based Compensation Under the transition rules provided by SFAS No. 148 “Accounting for Stock-Based Compensation – Transition and Disclosure – an amendment of FASB Statement No. 123”, the Company has expensed stock options granted in 2002. The use of the fair value method of SFAS No. 123 “Accounting for Stock-Based Compensation” for previously issued options would have resulted in net income under U.S. GAAP of $770 million in 2002 (2001 – $643 million; 2000 – $712 million) and net income per share (basic) of $1.56 in 2002 (2001 – $1.30 per share; 2000 – $1.43 per share).
Other In June 2001, the FASB issued SFAS No. 143 “Accounting for Asset Retirement Obligations”, which addresses financial accounting and reporting for obligations associated with asset retirement costs. SFAS No. 143 requires that the fair value of a liability for an asset retirement obligation be recognized in the period in which it is incurred if a reasonable estimate of fair value can be made. The fair value is added to the carrying amount of the associated asset. The liability is accreted at the end of each period through charges to operating expenses. The Company is required and plans to adopt the provisions of SFAS No. 143 for the quarter ending March 31, 2003. The initial adoption of the new standard is not expected to have a significant impact on the Company’s financial statements.
In August 2001, the FASB issued SFAS No. 144 “Accounting for the Impairment or Disposal of Long-term Assets”, which addresses the financial accounting and reporting for the impairment or disposal of long-lived assets. Assets to be disposed of through abandonment or an exchange for similar productive assets will be classified as held for use until they cease to be used. SFAS No. 144 establishes criteria that must be met in order to classify an asset or group of assets as held for sale. Assets classified as held for sale will be measured at the lower of their carrying amount or fair value less cost to sell, and depreciation will cease when the asset or group is classified as held for sale. The standard broadens the definition of disposals to be presented as discontinued operations to include components of an entity that comprise operating income and cash flows that clearly can be distinguished, operationally and for financial reporting purposes from the rest of the entity. Adopting the provisions of SFAS No. 144 on a prospective basis did not result in the restatement of income for prior periods.
In November 2002, the FASB issued Financial Interpretation (FIN) 45 that will require the recognition of a liability for the fair value of certain guarantees that require payments contingent on specified types of future events. The measurement standards of FIN 45 are applicable to guarantees entered into after January 1, 2003. For guarantees that existed as at December 31, 2002, FIN 45 requires additional disclosures which have been included in these consolidated financial statements to the extent applicable to the Company.
In January 2003, the FASB issued FIN 46 that will require the consolidation of certain entities that are controlled through financial interests that indicate control (referred to as “variable interests”). Variable interests are the rights or obligations that convey economic gains or losses from changes in the values of an entity’s assets or liabilities. The holder of the majority of an entity’s variable interests will be required to consolidate the variable interest entity. The Company does not have any variable interest entities as interpreted under FIN 46 that would result in the consolidation of any additional entities that existed at December 31, 2002.
Summarized Financial Information of Long-Term Investments
Year ended December 31 |
| 2002 |
| 2001 |
| 2000 |
|
(millions of dollars) |
|
|
|
|
|
|
|
|
|
|
|
|
|
|
|
Income |
|
|
|
|
|
|
|
Revenues |
| 798 |
| 695 |
| 700 |
|
Other costs and expenses |
| (273 | ) | (191 | ) | (175 | ) |
Depreciation |
| (146 | ) | (143 | ) | (156 | ) |
Financial charges and other |
| (112 | ) | (136 | ) | (154 | ) |
Proportionate share of income before income taxes of long-term investments |
| 267 |
| 225 |
| 215 |
|
76
December 31 |
| 2002 |
| 2001 |
|
(millions of dollars) |
|
|
|
|
|
|
|
|
|
|
|
Balance Sheet |
|
|
|
|
|
Current assets |
| 246 |
| 223 |
|
Plant, property and equipment |
| 3,197 |
| 3,171 |
|
Other assets and deferred amounts (net) |
| 112 |
| 139 |
|
Current liabilities |
| (216 | ) | (231 | ) |
Non-recourse debt |
| (1,646 | ) | (1,669 | ) |
Deferred income taxes |
| (64 | ) | (63 | ) |
Proportionate share of net assets of long-term investments |
| 1,629 |
| 1,570 |
|
NOTE 21 Subsequent Event
In February 2003, the Company completed the acquisitions of a 31.6 per cent interest in Bruce Power L.P. and an approximate 33.3 per cent interest in Bruce Power Inc., the general partner of Bruce Power L.P., for $376 million, subject to closing adjustments. TransCanada has also funded a one-third share ($75 million) of a $225 million accelerated deferred rent payment to Ontario Power Generation (OPG).
TransCanada acquired the interests as part of a consortium (the Consortium) that includes Cameco and BPC Generation Infrastructure Trust, a trust established by the Ontario Municipal Employees Retirement System. Under the agreement, the Consortium acquired British Energy (Canada) Ltd. (British Energy) which owns a 79.8 per cent interest in Bruce Power L.P. as well as a 50 per cent interest in the nine megawatt (MW) Huron Wind L.P. power facility. Bruce Power L.P. is the tenant under a lease with OPG on the Bruce nuclear power facility. The lease expires in 2018 with an option to extend the lease by up to 25 years. Spent fuel and decomissioning liabilities remain the responsibility of OPG.
The Bruce Power facility is made up of two nuclear plants – Bruce B and Bruce A. Bruce B consists of four reactors, currently generating a total of 3,140 MW. Bruce A consists of four 769 MW reactors, which are currently not operating. Two of the Bruce A units (3 and 4) are expected to be restarted and on-line by mid-2003, subject to receipt of all necessary regulatory approvals.
Upon the acquisition of Bruce Power L.P., the Consortium members guaranteed on a several, pro-rata basis certain contingent financial obligations of Bruce Power L.P. related to operator licences, the lease agreement, power sales agreements and contractor services. TransCanada’s share of the net exposure under these guarantees at the time of closing was estimated to be approximately $260 million.
TransCanada recorded this acquisition as an equity investment and will report the income as equity income.
77
SUPPLEMENTARY INFORMATION SELECTED QUARTERLY AND ANNUAL CONSOLIDATED FINANCIAL DATA
The following sets forth selected quarterly and annual financial data for 2002 and 2001 in millions of dollars except for per share amounts.
|
| First |
| Second |
| Third |
| Fourth |
| Annual |
|
(unaudited) |
|
|
|
|
|
|
|
|
|
|
|
|
|
|
|
|
|
|
|
|
|
|
|
2002 |
|
|
|
|
|
|
|
|
|
|
|
Operating Results |
|
|
|
|
|
|
|
|
|
|
|
Revenues |
| 1,246 |
| 1,345 |
| 1,285 |
| 1,338 |
| 5,214 |
|
Net income from continuing operations |
| 201 |
| 220 |
| 189 |
| 195 |
| 805 |
|
Net income applicable to common shares |
|
|
|
|
|
|
|
|
|
|
|
Continuing operations |
| 187 |
| 205 |
| 175 |
| 180 |
| 747 |
|
Discontinued operations |
| — |
| — |
| — |
| — |
| — |
|
|
| 187 |
| 205 |
| 175 |
| 180 |
| 747 |
|
Share Statistics |
|
|
|
|
|
|
|
|
|
|
|
Net income per share – Basic |
|
|
|
|
|
|
|
|
|
|
|
Continuing operations |
| 0.39 |
| 0.43 |
| 0.37 |
| 0.37 |
| 1.56 |
|
Discontinued operations |
| — |
| — |
| — |
| — |
| — |
|
|
| 0.39 |
| 0.43 |
| 0.37 |
| 0.37 |
| 1.56 |
|
Net income per share – Diluted |
| 0.39 |
| 0.43 |
| 0.36 |
| 0.37 |
| 1.55 |
|
Dividend declared per common share |
| 0.25 |
| 0.25 |
| 0.25 |
| 0.25 |
| 1.00 |
|
|
|
|
|
|
|
|
|
|
|
|
|
2001 |
|
|
|
|
|
|
|
|
|
|
|
Operating Results |
|
|
|
|
|
|
|
|
|
|
|
Revenues |
| 1,365 |
| 1,338 |
| 1,293 |
| 1,279 |
| 5,275 |
|
Net income from continuing operations |
| 194 |
| 202 |
| 176 |
| 181 |
| 753 |
|
Net income/(loss) applicable to common shares |
|
|
|
|
|
|
|
|
|
|
|
Continuing operations |
| 177 |
| 184 |
| 159 |
| 166 |
| 686 |
|
Discontinued operations |
| (8 | ) | (79 | ) | — |
| 20 |
| (67 | ) |
|
| 169 |
| 105 |
| 159 |
| 186 |
| 619 |
|
Share Statistics |
|
|
|
|
|
|
|
|
|
|
|
Net income/(loss) per share – Basic and Diluted |
|
|
|
|
|
|
|
|
|
|
|
Continuing operations |
| 0.37 |
| 0.39 |
| 0.33 |
| 0.35 |
| 1.44 |
|
Discontinued operations |
| (0.02 | ) | (0.17 | ) | — |
| 0.05 |
| (0.14 | ) |
|
| 0.35 |
| 0.22 |
| 0.33 |
| 0.40 |
| 1.30 |
|
Dividend declared per common share |
| 0.225 |
| 0.225 |
| 0.225 |
| 0.225 |
| 0.90 |
|
78
QUARTERLY AND ANNUAL SHARE TRADING INFORMATION
(Stock trading symbol TRP)
Toronto Stock Exchange |
| First |
| Second |
| Third |
| Fourth |
| Annual |
|
(dollars) |
|
|
|
|
|
|
|
|
|
|
|
|
|
|
|
|
|
|
|
|
|
|
|
2002 |
|
|
|
|
|
|
|
|
|
|
|
High |
| 22.80 |
| 23.91 |
| 23.63 |
| 23.47 |
| 23.91 |
|
Low |
| 19.05 |
| 21.50 |
| 20.51 |
| 22.03 |
| 19.05 |
|
Close |
| 21.60 |
| 23.00 |
| 22.60 |
| 22.92 |
| 22.92 |
|
Volume (thousands of shares) |
| 68,790 |
| 59,958 |
| 74,608 |
| 77,165 |
| 280,521 |
|
|
|
|
|
|
|
|
|
|
|
|
|
2001 |
|
|
|
|
|
|
|
|
|
|
|
High |
| 19.52 |
| 19.35 |
| 21.13 |
| 20.95 |
| 21.13 |
|
Low |
| 14.85 |
| 17.50 |
| 18.45 |
| 18.71 |
| 14.85 |
|
Close |
| 19.24 |
| 18.75 |
| 20.34 |
| 19.87 |
| 19.87 |
|
Volume (thousands of shares) |
| 94,732 |
| 58,892 |
| 57,424 |
| 77,207 |
| 288,255 |
|
New York Stock Exchange |
|
|
|
|
|
|
|
|
|
|
|
(U.S. dollars) |
|
|
|
|
|
|
|
|
|
|
|
|
|
|
|
|
|
|
|
|
|
|
|
2002 |
|
|
|
|
|
|
|
|
|
|
|
High |
| 14.39 |
| 15.56 |
| 15.53 |
| 15.08 |
| 15.56 |
|
Low |
| 11.89 |
| 13.49 |
| 12.91 |
| 13.90 |
| 11.89 |
|
Close |
| 13.60 |
| 15.32 |
| 14.21 |
| 14.51 |
| 14.51 |
|
Volume (thousands of shares) |
| 3,569 |
| 3,083 |
| 4,959 |
| 6,929 |
| 18,540 |
|
|
|
|
|
|
|
|
|
|
|
|
|
2001 |
|
|
|
|
|
|
|
|
|
|
|
High |
| 12.48 |
| 12.68 |
| 13.41 |
| 13.40 |
| 13.41 |
|
Low |
| 9.88 |
| 11.32 |
| 12.17 |
| 11.91 |
| 9.88 |
|
Close |
| 12.23 |
| 12.33 |
| 12.84 |
| 12.51 |
| 12.51 |
|
Volume (thousands of shares) |
| 6,587 |
| 4,956 |
| 4,936 |
| 4,668 |
| 21,147 |
|
79
THREE-YEAR FINANCIAL HIGHLIGHTS
|
| 2002 |
| 2001 |
| 2000 |
| |||
(millions of dollars except where indicated) |
|
|
|
|
|
|
| |||
|
|
|
|
|
|
|
| |||
Income Statement |
|
|
|
|
|
|
| |||
Revenues |
| 5,214 |
| 5,275 |
| 4,384 |
| |||
Net income from continuing operations |
| 805 |
| 753 |
| 707 |
| |||
Net income |
| 805 |
| 686 |
| 768 |
| |||
Results by segment |
|
|
|
|
|
|
| |||
Transmission |
| 653 |
| 585 |
| 623 |
| |||
Power |
| 146 |
| 168 |
| 85 |
| |||
Corporate |
| (52 | ) | (67 | ) | (80 | ) | |||
Continuing operations |
| 747 |
| 686 |
| 628 |
| |||
Discontinued operations |
| — |
| (67 | ) | 61 |
| |||
Net income applicable to common shares |
| 747 |
| 619 |
| 689 |
| |||
|
|
|
|
|
|
|
| |||
Cash Flow Statement |
|
|
|
|
|
|
| |||
Funds generated from continuing operations |
| 1,827 |
| 1,624 |
| 1,495 |
| |||
Capital expenditures and acquisitions |
|
|
|
|
|
|
| |||
Continuing operations |
| 814 |
| 1,025 |
| 773 |
| |||
Discontinued operations |
| 13 |
| 52 |
| 362 |
| |||
Dividends and preferred securities charges |
| 546 |
| 517 |
| 536 |
| |||
|
|
|
|
|
|
|
| |||
Balance Sheet |
|
|
|
|
|
|
| |||
|
|
|
|
|
|
|
| |||
Assets |
|
|
|
|
|
|
| |||
Plant, property and equipment |
|
|
|
|
|
|
| |||
Transmission |
| 16,098 |
| 16,509 |
| 16,894 |
| |||
Power |
| 1,334 |
| 1,110 |
| 771 |
| |||
Corporate |
| 64 |
| 66 |
| 111 |
| |||
Total assets |
|
|
|
|
|
|
| |||
Continuing operations |
| 19,728 |
| 19,629 |
| 19,761 |
| |||
Discontinued operations |
| 188 |
| 325 |
| 5,056 |
| |||
|
|
|
|
|
|
|
| |||
Capitalization |
|
|
|
|
|
|
| |||
Long-term debt |
| 8,815 |
| 9,347 |
| 9,928 |
| |||
Non-recourse debt of joint ventures |
| 1,222 |
| 1,295 |
| 1,296 |
| |||
Junior subordinated debentures |
| 238 |
| 237 |
| 243 |
| |||
Preferred securities |
| 674 |
| 675 |
| 969 |
| |||
Preferred shares |
| 389 |
| 389 |
| 389 |
| |||
Common shareholders’ equity |
| 5,747 |
| 5,426 |
| 5,211 |
| |||
|
|
|
|
|
|
|
| |||
U.S. GAAP Information |
|
|
|
|
|
|
| |||
Net income/(loss) |
|
|
|
|
|
|
| |||
Continuing operations before extraordinary items |
| 774 |
| 715 |
| 642 |
| |||
Discontinued operations |
| — |
| (67 | ) | 61 |
| |||
Extraordinary item |
| — |
| — |
| 13 |
| |||
Net income |
| 774 |
| 648 |
| 716 |
| |||
Net income/(loss) per share |
|
|
|
|
|
|
| |||
Continuing operations before extraordinary items |
| $ | 1.57 |
| $ | 1.46 |
| $ | 1.27 |
|
Discontinued operations |
| $ | — |
| $ | (0.14 | ) | $ | 0.13 |
|
Extraordinary item |
| $ | — |
| $ | — |
| $ | 0.03 |
|
Net income applicable to common shares – Basic |
| $ | 1.57 |
| $ | 1.32 |
| $ | 1.43 |
|
Net income applicable to common shares – Diluted |
| $ | 1.56 |
| $ | 1.32 |
| $ | 1.43 |
|
Common shareholders’ equity |
| 5,642 |
| 5,360 |
| 5,163 |
| |||
80
|
| 2002 |
| 2001 |
| 2000 |
| |||
Per Common Share Data |
|
|
|
|
|
|
| |||
Net income – Basic |
|
|
|
|
|
|
| |||
Continuing operations |
| $ | 1.56 |
| $ | 1.44 |
| $ | 1.32 |
|
Discontinued operations |
| — |
| (0.14 | ) | 0.13 |
| |||
|
| $ | 1.56 |
| $ | 1.30 |
| $ | 1.45 |
|
Net income – Diluted |
| $ | 1.55 |
| $ | 1.30 |
| $ | 1.45 |
|
Dividends declared |
| $ | 1.00 |
| $ | 0.90 |
| $ | 0.80 |
|
Book Value(1) |
| $ | 11.99 |
| $ | 11.38 |
| $ | 10.97 |
|
Market Price |
|
|
|
|
|
|
| |||
Toronto Stock Exchange (Cdn dollars) |
|
|
|
|
|
|
| |||
High |
| 23.91 |
| 21.13 |
| 17.25 |
| |||
Low |
| 19.05 |
| 14.85 |
| 9.80 |
| |||
Close |
| 22.92 |
| 19.87 |
| 17.20 |
| |||
Volume (millions of shares) |
| 280.5 |
| 288.2 |
| 400.7 |
| |||
New York Stock Exchange (U.S. dollars) |
|
|
|
|
|
|
| |||
High |
| 15.56 |
| 13.41 |
| 11.50 |
| |||
Low |
| 11.89 |
| 9.88 |
| 6.75 |
| |||
Close |
| 14.51 |
| 12.51 |
| 11.50 |
| |||
Volume (millions of shares) |
| 18.5 |
| 21.1 |
| 28.1 |
| |||
Shares outstanding (millions) |
|
|
|
|
|
|
| |||
Average for the year |
| 478.3 |
| 475.8 |
| 474.6 |
| |||
End of year |
| 479.5 |
| 476.6 |
| 474.9 |
| |||
Registered common shareholders(1) |
| 34,902 |
| 36,350 |
| 30,758 |
| |||
|
|
|
|
|
|
|
| |||
Financial Ratios |
|
|
|
|
|
|
| |||
Return on average common shareholders’ equity |
| 13.4 | % | 11.6 | % | 13.6 | % | |||
Dividend yield(1) |
| 4.4 | % | 4.5 | % | 4.7 | % | |||
Price/earnings multiple(1) |
| 14.7 |
| 15.3 |
| 11.9 |
| |||
Price/book multiple(1) |
| 1.9 |
| 1.7 |
| 1.6 |
| |||
Debt to debt plus shareholders’ equity(2) |
| 58 | % | 61 | % | 62 | % | |||
Cash flow from continuing operations to total debt(2) |
| 0.19 |
| 0.18 |
| 0.10 |
| |||
Earnings to fixed charges(3) |
| 2.4 |
| 2.2 |
| 2.0 |
| |||
Earnings to fixed charges (per U.S. GAAP)* |
| 2.2 |
| 2.0 |
| 2.0 |
| |||
(1) As at December 31.
(2) Debt does not include non-recourse debt of joint ventures.
(3) The ratio of earnings to fixed charges is determined by dividing the financial charges incurred by the company (including capitalized interest) into its income from continuing operations before financial charges and income taxes, excluding undistributed income from equity investees.
* The ratio is determined in the manner described in (3) above, but utilizing similar information determined in accordance with U.S. GAAP. Differences are described in Note 20 “Significant Differences Between Canadian and U.S. GAAP”, to the Consolidated Financial Statements.
81
Stock Exchanges, Securities and Symbols Common shares are listed on the Toronto and New York stock exchanges under the symbol: TRP
Preferred shares are listed on the Toronto Stock Exchange under the following symbols:
• Cumulative redeemable first preferred Series U: TRP.PR.X and Series Y: TRP.PR.Y
Preferred securities are listed on the New York Stock Exchange under the following symbols:
• 8.75% Trust Originated Preferred SecuritiesSM* (TOPrSSM): TCL.Pr
• 8.25% Preferred Securities: TRP.Pr
7.875% NOVA Gas Transmission Ltd. (NGTL) Debentures are listed on the New York Stock Exchange under the symbol: NVA 23
16.50% First Mortgage Pipe Line Bonds due 2007 are listed on the London Stock Exchange.
* service mark of Merrill Lynch & Co., Inc.
Dividend Reinvestment and Share Purchase Plan TransCanada’s dividend reinvestment and share purchase plan allows shareholders to purchase additional common shares by reinvesting their cash dividend without incurring brokerage or administrative fees. Participants in the plan may also buy additional shares of up to $10,000 (US$7,000) per quarter. Please contact our plan agent, Computershare Trust Company of Canada, for more information on the plan or visit us at www.transcanada.com.
Non-Resident Investors Dividends paid by TransCanada to shareholders outside Canada are subject to Canadian non-resident withholding tax. The general rate is 15 per cent for investors resident in the United States and other countries where Canadian tax treaties apply. Effective January 1, 2001, the U.S. Internal Revenue Service (IRS) requires certain foreign payers of dividends or interest to U.S. persons (including resident aliens) to withhold and pay to the IRS 31 per cent of such payments (“Backup Withholding”). This Backup Withholding is in addition to the non-resident tax rate of 15 per cent required under Canadian law. Residents of non-treaty countries are subject under Canadian law to a 25 per cent withholding tax on dividends.
TRANSFER AGENTS, REGISTRARS AND TRUSTEE
Common Shares Computershare Trust Company of Canada (Montréal, Toronto, Winnipeg, Calgary and Vancouver) and Computershare Trust Company (New York)
Preferred Shares Computershare Trust Company of Canada (Montréal, Toronto, Winnipeg, Calgary and Vancouver)
Preferred Securities The Bank of New York (New York)
First Mortgage Pipe Line Bonds CIBC Mellon Trust Company, as agent for National Trust Company (Toronto). Co-Registrar and Paying Agent U.K. Series, 16.50%: Computershare Services plc (London, England)
ANNUAL MEETING
The annual meeting of shareholders is scheduled for April 25, 2003 at 10:30 a.m. (Mountain Daylight Time) at the Roundup Centre, Calgary, Alberta.
DIVIDEND PAYMENT DATES
Scheduled common share dividend payment dates in 2003 are January 31, April 30, July 31 and October 31.
82
TransCanada Debentures
Canadian Series CIBC Mellon Trust Company (Halifax, Montréal, Toronto, Winnipeg, Regina, Calgary and Vancouver)
8.40% series A |
| 10.50% series O |
| 10.625% series Q |
| 11.90% series S |
| 9.80% series V |
11.10% series N |
| 10.50% series P |
| 11.85% series R |
| 11.80% series U |
| 9.45% series W |
U.S. Series The Bank of New York (New York) 9.875%, 8.625% and 8.50%
NGTL Debentures
Canadian Series CIBC Mellon Trust Company (Halifax, Montréal, Toronto, Winnipeg, Regina, Calgary and Vancouver)
11.95% series 13 |
| 11.20% series 18 |
| 12.20% series 20 |
| 8.30% series 22 |
11.70% series 15 |
| 12.625% series 19 |
| 12.20% series 21 |
| 8.90% series 23 |
U.S. Debentures U.S. Bank Trust National Association (New York) Series 8.50% and 7.875%
U.S. Notes U.S. Bank Trust National Association (New York) Series 8.50%
Subordinated Debentures The Bank of Nova Scotia Trust Company of New York (New York) U.S. Series 9.125%
TransCanada Canadian Medium Term Notes and NGTL Canadian Medium Term Notes CIBC Mellon Trust Company (Halifax, Montréal, Toronto, Winnipeg, Regina, Calgary and Vancouver)
TransCanada U.S. Medium Term Notes The Bank of New York (New York)
NGTL U.S. Medium Term Notes U.S. Bank Trust National Association (New York)
REGULATORY FILINGS
Annual Information Form TransCanada’s 2002 Annual Information Form, as filed with Canadian securities commissions and as filed under Form 40-F with the U.S. Securities and Exchange Commission, is available on our Web site at www.transcanada.com. A printed copy may be obtained from:
Corporate Secretary TransCanada PipeLines Limited, P.O. Box 1000, Station M, Calgary, Alberta, Canada T2P 4K5
SHAREHOLDER ASSISTANCE
If you are a registered shareholder and have questions regarding your account, please contact our transfer agent in writing, by phone, fax or e-mail at:
Computershare Trust Company of Canada100 University Avenue, 9th floor, Toronto, Ontario, Canada M5J 2Y1
Toll-free: 1-888-267-6555 Fax: 1-888-453-0330 (North America)
Telephone: 1-514-982-7270 Fax: 1-416-263-9394 (outside North America)
E-mail: caregistryinfo@computershare.com
VISIT OUR WEB SITE
To access TransCanada’s corporate and financial information, including quarterly reports, news releases, real-time conference call Web casts and investor presentations, visit us at www.transcanada.com/investor
BENEFICIAL SHAREHOLDERS
If you hold your shares in a brokerage account, questions should be directed to your broker on all administrative matters.
To receive quarterly reports, please contact Computershare or visit our Web site.
83
BOARD OF DIRECTORS
Richard F. Haskayne, O.C., F.C.A.* Chairman TransCanada PipeLines Limited Calgary, Alberta
President and CEO TransCanada PipeLines Limited Calgary, Alberta Douglas D. Baldwin(2)(3) Corporate Director Calgary, Alberta Ronald B. Coleman(1)(3) President R. B. Coleman Consulting Co. Ltd. Calgary, Alberta |
| Wendy Dobson(2)(4) Professor, Rotman School of Management and Director, Institute for International Business, University of Toronto Uxbridge, Ontario The Hon. Paule Gauthier, P.C., O.C., O.Q., Q.C.(1)(3) Senior Partner Desjardins Ducharme Stein Monast Québec, Québec Kerry L. Hawkins(1)(4) President Cargill Limited Winnipeg, Manitoba |
| S. Barry Jackson**(1)(3) Chairman Resolute Energy Inc. Deer Creek Energy Limited Calgary, Alberta Chairman EnCana Corporation Calgary, Alberta James R. Paul(1)(2) Chairman James and Associates Kingwood, Texas |
| Harry G. Schaefer, F.C.A.(1)(2) President Schaefer & Associates Ltd. and Vice-Chairman TransCanada PipeLines Limited Calgary, Alberta W. Thomas Stephens(3)(4) Corporate Director Greenwood Village, Colorado Joseph D. Thompson, P. Eng. (3)(4) Chairman PCL Construction Group Inc. Edmonton, Alberta |
* Non-voting member of all committees of the Board
** Appointed December 3, 2002
(1) Member, Audit and Risk Management Committee
(2) Member, Governance Committee
(3) Member, Health, Safety and Environment Committee
(4) Member, Human Resources Committee
CORPORATE GOVERNANCE
Please refer to TransCanada’s Notice of 2003 Annual and Special Meeting of Shareholders and Management Proxy Circular for the company’s report on Corporate Governance.
ETHICS HELP-LINE
The audit committee of the Board of Directors has established an anonymous and confidential toll free telephone number for employees, contractors and others to call with respect to accounting irregularities and ethical violations. The Ethics Help-Line number is 1 (888) 920-2042.
ELECTRONIC PROXY VOTING AND DELIVERY OF DOCUMENTS
In 2002 we introduced electronic proxy solicitation and voting and electronic delivery of documents (annual report, management proxy circular, notice of meeting and view-only proxy form) for registered and beneficial shareholders. We will be doing the same in 2003.
This will provide increased convenience to shareholders, benefits to the environment and reduced mailing and printing costs for the corporation. We will continue to provide printed copies of these documents for those shareholders preferring this format.
Si vous désirez vous procurer un exemplaire de ce rapport en français, veuillez consulter notre site Web ou vous adresser par écrit à TransCanada PipeLines Limited, bureau du secrétaire.
84
EXECUTIVE OFFICERS
|
|
|
|
|
|
Harold N. Kvisle |
| Albrecht W.A. Bellstedt, Q.C. |
| Russell K. Girling |
|
President and |
| Executive Vice-President, |
| Executive Vice-President |
|


|
|
|
|
|
|
|
|
Dennis J. McConaghy |
| Alexander J. Pourbaix |
| Sarah E. Raiss |
| Ronald J. Turner |
|
Executive Vice-President, |
| Executive Vice-President, |
| Executive Vice-President, |
| Executive Vice-President, |
|


TRANSCANADA IN THE COMMUNITY
Copies of the Annual Report on Environment, Health and Safety, and Community and the Submission to the Climate Change Voluntary Challenge and Registry are available at www.transcanada.com. If you would like to receive a copy of these reports by mail, please contact:
Communications and Government Relations P.O. Box 1000, Station M, Calgary, Alberta T2P 4K5 (403) 920-2000
METRIC CONVERSION TABLE
Metric |
| Imperial |
| Factor |
|
|
|
|
|
Kilometres |
| miles |
| 0.62 |
Millimetres |
| inches |
| 0.04 |
Gigajoules |
| million British thermal units |
| 0.95 |
cubic metres* |
| cubic feet |
| 35.3 |
degrees Celsius |
| degrees Fahrenheit |
| Multiply by 1.8, then add 32 degrees. To convert to |
* The conversion is based on natural gas at a base pressure of 101.325 kilopascals and a base temperature of 15 degrees Celsius.
Please recycle • March 2003 Printed in Canada |
| Designed and produced by SMITH + ASSOCIATES |
2002 ANNUAL REPORT TRANSCANADA

TRANSCANADA PIPELINES LIMITED
TransCanada Tower 450-First Street SW, Calgary, Alberta, Canada T2P 5H1 (403) 920-2000
TransCanada welcomes questions from shareholders and investors. Please contact:
David Moneta, Director, Investor Relations at 1 (800) 361-6522 (Canada and U.S. Mainland)
Visit: TransCanada’s Web site at www.transcanada.com