Exhibit 99.1
|
| | |
| ▪ Cloud Subscription Revenue Up 39% (IFRS) and Up 41% (Non-IFRS at Constant Currencies) ▪ Cloud Eclipsing Software Even Faster than Expected: Cloud Subscription Revenue Now 40% Larger than Software License Revenue ▪ Accelerated New Cloud Bookings Growth, Up 36% (37% at Constant Currencies) ▪ Continued Strong New Cloud and Software License Order Entry, Up 12% at Constant Currencies ▪ Total Revenue Up 8% (IFRS) and Up 10% (Non-IFRS at Constant Currencies) ▪ Operating Profit Down 6% (IFRS) and Up 11% (Non-IFRS at Constant Currencies) Even with Stronger than Expected Cloud Momentum ▪ EPS Down 1% (IFRS) and Up 13% (Non-IFRS) ▪ SAP Raises 2018 Outlook Again Backed by Strong Cloud and Overall Business Momentum | |
| | |
| 
| | 
| |
| | | | |
| 
| | 
| | 
| |
| | | | |
| “SAP is the fastest growing cloud company at scale in the enterprise software applications industry. Our growth drivers are firing on all cylinders, especially SAP C/4HANA and SAP S/4HANA as foundations of the Intelligent Enterprise. With a stronger than ever Q4 pipeline, we confidently raise our full year guidance.” | | “I am proud of SAP’s excellent business momentum: our accelerating cloud growth shows our strategic priorities are exactly on track. Our non-IFRS operating profit was up double digit even with a higher share of cloud and services revenue. As promised SAP’s business is growing its resilience with a constantly increasing share of more predictable revenue. All of this makes me confident that we will deliver on our raised 2018 outlook and 2020 ambition.” | |
| | | | |
| Bill McDermott, CEO | | Luka Mucic, CFO | |
| | | | |
| | | | |
| | | | | | | | |

Walldorf, Germany – October 18, 2018
SAP SE (NYSE: SAP) today announced its financial results for the third quarter ended September 30, 2018.
Business Performance
Financial Highlights Third Quarter 2018
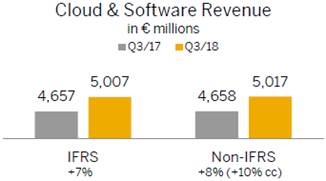
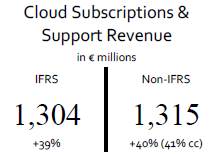
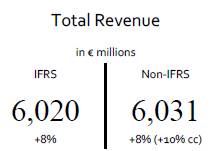
New cloud bookings1 growth accelerated to 36% (37% at constant currencies). Cloud subscriptions and support revenue grew 39% year over year to €1.30 billion (IFRS), up 41% (non-IFRS at constant currencies).2 Software revenue was down 9% year over year to €937 million (IFRS), down 8% (non-IFRS at constant currencies). While SAP had a strong software revenue performance in APJ and Greater China, customers in the Americas and parts of EMEA were moving faster than expected to cloud and hybrid models. With its expanded Intelligent Suite in the cloud and unique hybrid capabilities, SAP is capitalizing on this market trend. This is reflected in the strong new cloud and software license order entry3, up 12% at constant currencies year over year in the third quarter. Cloud and software revenue grew 7% year over year to €5.01 billion (IFRS), up 10% (non-IFRS at constant currencies). Total revenue grew 8% year over year to €6.02 billion (IFRS), up 10% (non-IFRS at constant currencies).
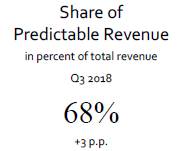
SAP’s rapidly expanding cloud business together with solid growth in support revenue continued to drive the share of more predictable revenue. The total of cloud subscriptions & support revenue and software support revenue as a percentage of total revenue grew three percentage points year-over-year to 68% in the third quarter.
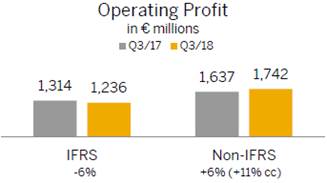
Amid a higher than expected share of cloud and services revenue third quarter operating profit declined 6% year over year to €1.24 billion (IFRS) and was up 11% (non-IFRS at constant currencies). The IFRS operating profit was mainly impacted by higher share-based compensation expenses. As announced in January 2018, the Company expects a positive revenue and profit impact from the adoption of IFRS 15 in 2018. In the third quarter, this positive impact on SAP’s operating profit was around €74 million. Earnings per share declined 1% at €0.82 (IFRS) and increased 13% to €1.14 (non-IFRS).
Operating cash flow for the first nine months was €3.48 billion, down 16% year-over-year. The decrease in operating cash flow was mainly due to higher share-based compensation payments, higher tax and insurance payments as well as currency headwinds. Free cash flow decreased 26% year-over-year to €2.34 billion. Free cash flow was also lower due to the previously announced additional CapEx for 2018. At the end of the third quarter, net liquidity was -€2.78 billion.
1 New cloud bookings is the total of all orders received in a given period the revenue from which is expected to be classified as cloud subscription and support revenue and that result from purchases by new customers and from incremental purchases by existing customers. Consequently, orders to renew existing contracts are not included in this metric. The order amount must be committed. Consequently, due to their pay-per-use nature, business network transaction fees which do not include a committed minimum consumption are not reflected in the bookings metric (e.g. SAP Ariba and SAP Fieldglass transaction-based fees). Amounts included in the measures are generally annualized (annualized contract value ACV).
2 For the third quarter 2018, Callidus contributed €52 million to SAP’s Non-IFRS cloud subscriptions and support revenue at constant currencies and negatively impacted the operating margin by approximately 40 basis points. The Callidus acquisition was closed on April 5th 2018.
3 New cloud and software license order entry is the total of new cloud order entry and software license order entry. The new cloud order entry metric is identical to the new cloud bookings metric defined above except that it considers the total contract value (TCV) of the orders where the new cloud bookings metric considers the orders’ annualized contract value (ACV). Software license order entry is the total of all orders received in a given period the revenue from which is expected to be classified as software license revenue. The support services commonly sold with the software licenses are not included in the software license order entry metric.
SAP Q3 2018 Quarterly Statement | 2 |
Segment Performance Third Quarter 2018
SAP’s three reportable segments “Applications, Technology & Services”, “Customer Experience” and “SAP Business Network” showed the following performance.
Applications, Technology & Services (ATS)
In the third quarter, segment revenue in ATS was up 5% to €5.05 billion year-over-year (up 8% at constant currencies). Solutions which contributed to this growth in the third quarter are listed below.
SAP S/4HANA
SAP S/4HANA is at the core of the Intelligent Enterprise. With S/4HANA, customers automate more and more of their business processes enabling employees to focus on higher-value tasks. It detects patterns, predicts outcomes and suggests actions empowering companies to reinvent their business models for the digital economy across every industry.
S/4HANA adoption grew to approximately 9,500 customers, up 37% year over year. In the third quarter, approximately 50% of the additional S/4HANA customers were net new.
S/4HANA continues to be selected by world-class global companies, including Wipro, Bombardier and McKesson. OSRAM Continental went live with S/4HANA this quarter. A growing number of companies including Delivery Hero and Shanghai Fosun Pharmaceutical Group have chosen S/4HANA in the Cloud. Shell has gone live on S/4HANA Cloud in the third quarter.
Human Capital Management
SAP delivers total workforce management across both permanent and contingent labor. The SAP SuccessFactors suite is localized for 92 countries and 42 languages.
SAP SuccessFactors Employee Central, which is the flagship of SAP’s HCM offering, added more than 200 customers in the quarter and has now more than 2,800 customers globally. Competitive wins included Skechers, Atos, and Air Arabia. American Airlines went live with SAP SuccessFactors Employee Central in the third quarter.
SAP SuccessFactors was recently named a Leader in the Gartner Magic Quadrant for Talent Management Suites and all four IDC MarketScape reports for Worldwide Integrated Talent Management, Performance, Learning and Compensation.
SAP Leonardo
SAP Leonardo brings together cutting-edge technologies – AI, Machine Learning, IoT, Big Data, Advanced Analytics and Blockchain – with deep process and industry expertise, delivering completely new ways of working and powering the Intelligent Enterprise.
Companies like Deloitte and Chint Group are among many others that adopted SAP Leonardo solutions in the third quarter.
SAP Digital Platform
SAP Digital Platform includes SAP Cloud Platform and SAP Data Management Solutions. With SAP HANA’s data rich and real-time in-memory architecture as the foundation, this represents a massive opportunity to drive full use of HANA.
The SAP Cloud Platform (SCP) facilitates new app development, extensions and seamless integration. It orchestrates “hybrid” customer landscapes across on premise and cloud.
The SAP Data Hub is the “enterprise control tower” bringing together multi-source data including unstructured. It provides a 360-degree view of all company data and manages compliance and governance policies from one central location.
Grupo Energía Bogotá is one of many customers that adopted SAP’s Digital Platform solutions in the third quarter.
Customer Experience
In the third quarter, SAP’s C/4HANA customer experience solutions achieved triple-digit growth in new cloud bookings and cloud subscription revenue year-over-year. Segment revenue in Customer Experience was up 54% to €232 million year-over-year (up 54% at constant currencies).
SAP’s C/4HANA solutions serve a wide range of industries across both B2C and B2B and enable businesses to manage their entire front office: marketing, sales, commerce, service, customer data cloud – seamlessly and in real-time.
C/4HANA provides companies with a single, complete view of their customer across all channels and connects demand to the fulfillment engine in one end-to-end value chain.
Giorgio Armani, Dubai Expo 2020, Colgate-Palmolive, HP, and Döhler were among those that chose SAP’s C/4HANA solutions this quarter.
SAP Q3 2018 Quarterly Statement | 3 |
SAP Business Network
In the third quarter, segment revenue in SAP Business Network was up 22% to €675 million year-over-year (up 22% at constant currencies).
With the SAP Business Network SAP provides collaborative commerce capabilities (Ariba), effortless travel and expense processing (Concur) and flexible workforce management (Fieldglass). SAP Business Network is the largest commerce platform in the world with approximately $2.6 trillion4 in global commerce annually transacted in more than 180 countries.
Public Works of Canada, United States Department of Defense, Nationwide, and Commonwealth Bank of Australia chose SAP’s Business Network Solutions in the third quarter.
Segment Results at a Glance
Segment Performance Third Quarter 2018 |
| Applications, Technology & Services | SAP Business Network | Customer Experience |
€ million, unless otherwise stated
(Non-IFRS) | Actual
Currency | ∆ in % | ∆ in %
const.
curr. | Actual
Currency | ∆ in % | ∆ in %
const.
curr. | Actual
Currency | ∆ in % | ∆ in %
const.
curr. |
Cloud subscriptions and support | 600 | 38 | 39 | 563 | 24 | 24 | 151 | >100 | >100 |
Segment revenue | 5,046 | 5 | 8 | 675 | 22 | 22 | 232 | 54 | 54 |
Segment profit | 2,096 | 4 | 8 | 155 | 60 | 57 | 24 | 21 | 23 |
Cloud subscriptions and support
gross margin (in %) | 48 | 0pp | -1pp | 78 | 3pp | 3pp | 70 | 16pp | 16pp |
Segment margin (in %) | 42 | -1pp | 0pp | 23 | 5pp | 5pp | 10 | -3pp | -3pp |
Regional Revenue Performance
SAP had a solid performance in the EMEA region with cloud and software revenue increasing 4% (IFRS) and 5% (non-IFRS at constant currencies). Cloud subscriptions and support revenue was strong and grew by 40% (IFRS) and 40% (non-IFRS at constant currencies) with Germany and Russia being highlights. In addition, SAP had strong software revenue growth in Russia, Italy and the Netherlands.
The Company had a strong performance in the Americas region. Cloud and software revenue increased by 9% (IFRS) and increased by 13% (non-IFRS at constant currencies). Cloud subscriptions and support revenue increased by 36% (IFRS) and 38% (non-IFRS at constant currencies) with a solid quarter in the United States. Canada had an especially strong quarter in software revenue.
In the APJ region, SAP had a strong performance. Cloud and software revenue was up by 15% (IFRS) and grew by 17% (non-IFRS at constant currencies). Cloud subscriptions and support revenue was exceptional and grew by 53% (IFRS) and 58% (non-IFRS at constant currencies) with Greater China and Japan being highlights. For software revenue, Greater China, Japan, India and South Korea had impressive quarters.
4 SAP Business Network commerce is the total commerce transacted on the Ariba, Concur and Fieldglass Networks in the trailing 12 months. Ariba commerce includes procurement and sourcing spend. Previously we only included the total commerce transacted on the Ariba Network in this metric.
SAP Q3 2018 Quarterly Statement | 4 |
Financial Results at a Glance
Third Quarter 2018 |
| | IFRS | | Non-IFRS1) |
€ million, unless otherwise stated | | Q3 2018 | | Q3 2017 | | ∆ in % | | Q3 2018 | | Q3 2017 | | ∆ in % | | ∆ in %
const.
curr. |
New Cloud Bookings2) | | N/A | | N/A | | N/A | | 411 | | 302 | | 36 | | 37 |
Cloud subscriptions and support revenue | | 1,304 | | 937 | | 39 | | 1,315 | | 938 | | 40 | | 41 |
Software licenses and support revenue | | 3,702 | | 3,720 | | 0 | | 3,702 | | 3,720 | | 0 | | 2 |
Cloud and software revenue | | 5,007 | | 4,657 | | 7 | | 5,017 | | 4,658 | | 8 | | 10 |
Total revenue | | 6,020 | | 5,590 | | 8 | | 6,031 | | 5,590 | | 8 | | 10 |
Share of predictable revenue (in %) | | 68 | | 65 | | 3pp | | 68 | | 65 | | 3pp | | |
Operating profit | | 1,236 | | 1,314 | | –6 | | 1,742 | | 1,637 | | 6 | | 11 |
Profit after tax | | 974 | | 993 | | –2 | | 1,360 | | 1,214 | | 12 | | |
Basic earnings per share (€) | | 0.82 | | 0.82 | | –1 | | 1.14 | | 1.01 | | 13 | | |
Number of employees (FTE, September 30) | | 94,989 | | 87,874 | | 8 | | N/A | | N/A | | N/A | | N/A |
Nine months ended September 2018 |
| | IFRS | | Non-IFRS1) |
€ million, unless otherwise stated | | Q1–Q3
2018 | | Q1–Q3
2017 | | ∆ in % | | Q1–Q3
2018 | | Q1–Q3
2017 | | ∆ in % | | ∆ in %
const. curr. |
New Cloud Bookings2) | | N/A | | N/A | | N/A | | 1,078 | | 857 | | 26 | | 31 |
Cloud subscriptions and support revenue | | 3,588 | | 2,775 | | 29 | | 3,614 | | 2,775 | | 30 | | 37 |
Software licenses and support revenue | | 10,714 | | 10,968 | | –2 | | 10,715 | | 10,968 | | –2 | | 3 |
Cloud and software revenue | | 14,302 | | 13,742 | | 4 | | 14,329 | | 13,743 | | 4 | | 10 |
Total revenue | | 17,280 | | 16,656 | | 4 | | 17,307 | | 16,657 | | 4 | | 10 |
Share of predictable revenue (in %) | | 68 | | 66 | | 2pp | | 68 | | 66 | | 2pp | | |
Operating profit | | 3,304 | | 2,913 | | 13 | | 4,618 | | 4,405 | | 5 | | 12 |
Profit after tax | | 2,401 | | 2,189 | | 10 | | 3,401 | | 3,220 | | 6 | | |
Basic earnings per share (€) | | 2.01 | | 1.81 | | 11 | | 2.85 | | 2.67 | | 7 | | |
Number of employees (FTE, September 30) | | 94,989 | | 87,874 | | 8 | | N/A | | N/A | | N/A | | N/A |
1) For a detailed description of SAP’s non-IFRS measures see Explanation of Non-IFRS Measures online. For a breakdown of the individual adjustments see table “Non-IFRS Adjustments by Functional Areas” in this Quarterly Statement.
2) As this is an order entry metric, there is no IFRS equivalent.
Due to rounding, numbers may not add up precisely.
SAP Q3 2018 Quarterly Statement | 5 |
Business Outlook 2018
Due to the strong cloud and overall business momentum the Company is raising its outlook for the full year 2018:
· Non-IFRS cloud subscriptions and support revenue is now expected to be in a range of €5.150 billion – €5.250 billion at constant currencies (2017: €3.77 billion), up 36.5% – 39.0% at constant currencies. The previous range was €5.050 billion – €5.200 billion at constant currencies.
· Non-IFRS cloud and software revenue is now expected to be in a range of €21.150 – €21.350 billion at constant currencies (2017: €19.55 billion), up 8.0% – 9.0% at constant currencies. The previous range was €21.025 – €21.250 billion at constant currencies.
· Non-IFRS total revenue is now expected to be in a range of €25.200 billion – €25.500 billion at constant currencies (2017: €23.46 billion), up 7.5% – 8.5% at constant currencies. The previous range was €24.975 billion – €25.300 billion at constant currencies.
· Non-IFRS operating profit is now expected to be in a range of €7.425 billion – €7.525 billion at constant currencies (2017: €6.77 billion), up 9.5% - 11.0% at constant currencies. The previous range was €7.400 billion – €7.500 billion at constant currencies.
While SAP’s full-year 2018 business outlook is at constant currencies, actual currency reported figures are expected to be impacted by currency exchange rate fluctuations as the Company progresses through the year. See the table below for the Q4 and FY 2018 expected currency impacts.
Expected Currency Impact Based on September 2018 Level for the Rest of the Year |
In percentage points | | Q4 | | FY |
Cloud subscriptions and support | | 1 to –1 pp | | –4 to –6 pp |
Cloud and software | | 1 to –1 pp | | –3 to –5 pp |
Operating profit | | 1 to –1 pp | | –3 to –5 pp |
IFRS 15 Impact
As of January 1, 2018, SAP changed several of its accounting policies to adopt IFRS 15 ‘Revenue from Contracts with Customers’. Under the IFRS 15 adoption method chosen by SAP prior years are not restated to conform to the new policies. Consequently, the year over year growth of revenue and profit in 2018 will be impacted by the new policies.
As already announced in SAP’s Q4 2017 Quarterly Statement, the Company expects the full year 2018 impact of the policy change5 on revenue, operating expenses and profit to be as follows:
· Revenues are expected to experience a benefit of substantially less than €0.1 billion with most of the difference resulting from exercises of customer software purchase options granted in prior years which result in software revenue.
· Operating expenses are expected to benefit, in cost of sales and marketing, in the amount of approximately €0.2 billion from higher capitalization of sales commissions. Other policy changes will weigh on operating expenses with an additional cost of revenue of substantially less than €0.1 billion.
· The above-mentioned effects will result in a net positive impact on operating profit of approximately €0.2 billion.
The new revenue recognition policies were described in our Half Year Report 2018. Details regarding the IFRS 15 impact in the third quarter and first nine months can be found in the section ‘Impact of Changes in Accounting Policies’ in this Quarterly Statement.
Ambition 2020
Looking beyond 2018, SAP continues to expect in 2020:
· €8.2 – €8.7 billion non-IFRS cloud subscriptions and support revenue
· €28 – €29 billion non-IFRS total revenue
· €8.5 – €9.0 billion non-IFRS operating profit
· The share of more predictable revenue (defined as the total of cloud subscriptions & support revenue and software support revenue) in a range of 70% – 75%.
5 “Impact of the accounting policy change” means the difference between a revenue and profit measure determined under SAP’s new IFRS 15-based policies and the respective measure as it would stand had our previous accounting policies continued to apply.
SAP Q3 2018 Quarterly Statement | 6 |
Additional Information
All numbers for the SAP group and the Customer Experience segment include Callidus revenues and profits from April 5, 2018 onwards. Numbers for periods before the acquisition do not include Callidus’ revenues or profits.
This Quarterly Statement and all information therein is unaudited.
For a more detailed description of all of SAP’s non-IFRS measures and their limitations as well as our constant currency and free cash flow figures see Explanation of Non-IFRS Measures online.
Webcast
SAP senior management will host a financial analyst conference call at 2:00 PM (CET) / 1:00 PM (GMT) / 8:00 AM (Eastern) / 5:00 AM (Pacific). The call will be webcast live on the Company’s website at www.sap.com/investor and will be available for replay. Supplementary financial information pertaining to the third quarter results can be found at www.sap.com/investor.
About SAP
As the cloud company powered by SAP HANA®, SAP is the market leader in enterprise application software, helping companies of all sizes and in all industries run at their best. Our machine learning, IoT, and advanced analytics technologies help turn customers’ businesses into intelligent enterprises. Our end-to-end suite of applications and services enable more than 413,000 business and public customers to operate profitably, adapt continuously, and make a difference. For more information, visit www.sap.com.
For more information, financial community only:
Stefan Gruber | +49 (6227) 7-44872 | investor@sap.com, CET |
Follow SAP Investor Relations on Twitter at @sapinvestor.
For more information, press only:
Rajiv Sekhri | +49 (6227) 7-74871 | rajiv.sekhri@sap.com, CET |
Daniel Reinhardt | +49 (6227) 7-40201 | daniel.reinhardt@sap.com, CET |
For customers interested in learning more about SAP products:
Global Customer Center: | +49 180 534-34-24 |
United States Only: | +1 (800) 872-1SAP (+1-800-872-1727) |
Note to editors:
To preview and download broadcast-standard stock footage and press photos digitally, please visit www.sap.com/photos. On this platform, you can find high resolution material for your media channels. To view video stories on diverse topics, visit www.sap-tv.com. From this site, you can embed videos into your own Web pages, share video via e-mail links and subscribe to RSS feeds from SAP TV.
Any statements contained in this document that are not historical facts are forward-looking statements as defined in the U.S. Private Securities Litigation Reform Act of 1995. Words such as “anticipate,” “believe,” “estimate,” “expect,” “forecast,” “intend,” “may,” “plan,” “project,” “predict,” “should” and “will” and similar expressions as they relate to SAP are intended to identify such forward-looking statements. SAP undertakes no obligation to publicly update or revise any forward-looking statements. All forward-looking statements are subject to various risks and uncertainties that could cause actual results to differ materially from expectations. The factors that could affect SAP’s future financial results are discussed more fully in SAP’s filings with the U.S. Securities and Exchange Commission (“SEC”), including SAP’s most recent Annual Report on Form 20-F filed with the SEC. Readers are cautioned not to place undue reliance on these forward-looking statements, which speak only as of their dates.
© 2018 SAP SE. All rights reserved.
No part of this publication may be reproduced or transmitted in any form or for any purpose without the express permission of SAP SE. The information contained herein may be changed without prior notice.
Some software products marketed by SAP SE and its distributors contain proprietary software components of other software vendors. National product specifications may vary.
These materials are provided by SAP SE and its affiliated companies (“SAP Group”) for informational purposes only, without representation or warranty of any kind, and SAP Group shall not be liable for errors or omissions with respect to the materials. The only warranties for SAP Group products and services are those that are set forth in the express warranty statements accompanying such products and services, if any. Nothing herein should be construed as constituting an additional warranty.
SAP and other SAP products and services mentioned herein as well as their respective logos are trademarks or registered trademarks of SAP SE (or an SAP affiliate company) in Germany and other countries. All other product and service names mentioned are the trademarks of their respective companies. Please see www.sap.com/about/legal/copyright.html for additional trademark information and notice.
SAP Q3 2018 Quarterly Statement | 7 |
Financial and Non-Financial Key Facts (IFRS and Non-IFRS)
€ millions, unless otherwise stated | | Q1
2017 | | Q2
2017 | | Q3
2017 | | Q4
2017 | | TY
2017 | | Q1
2018 | | Q2
2018 | | Q3
2018 |
Revenues | | | | | | | | | | | | | | | | |
Cloud subscriptions and support (IFRS) | | 905 | | 932 | | 937 | | 995 | | 3,769 | | 1,070 | | 1,213 | | 1,304 |
Cloud subscriptions and support (non-IFRS) | | 906 | | 932 | | 938 | | 997 | | 3,771 | | 1,072 | | 1,227 | | 1,315 |
% change – yoy | | 34 | | 29 | | 22 | | 21 | | 26 | | 18 | | 32 | | 40 |
% change constant currency – yoy | | 30 | | 27 | | 27 | | 28 | | 28 | | 31 | | 40 | | 41 |
Software licenses (IFRS) | | 691 | | 1,090 | | 1,033 | | 2,058 | | 4,872 | | 625 | | 996 | | 937 |
Software licenses (non-IFRS) | | 691 | | 1,090 | | 1,033 | | 2,058 | | 4,872 | | 625 | | 996 | | 937 |
% change – yoy | | 13 | | 5 | | 0 | | –5 | | 0 | | –10 | | –9 | | –9 |
% change constant currency – yoy | | 10 | | 4 | | 3 | | –1 | | 2 | | –2 | | –5 | | –8 |
Software support (IFRS) | | 2,731 | | 2,736 | | 2,687 | | 2,754 | | 10,908 | | 2,656 | | 2,735 | | 2,765 |
Software support (non-IFRS) | | 2,731 | | 2,736 | | 2,687 | | 2,754 | | 10,908 | | 2,656 | | 2,735 | | 2,765 |
% change – yoy | | 7 | | 5 | | 1 | | 0 | | 3 | | –3 | | 0 | | 3 |
% change constant currency – yoy | | 3 | | 4 | | 4 | | 5 | | 4 | | 5 | | 7 | | 6 |
Software licenses and support (IFRS) | | 3,422 | | 3,826 | | 3,720 | | 4,813 | | 15,780 | | 3,281 | | 3,731 | | 3,702 |
Software licenses and support (non-IFRS) | | 3,422 | | 3,826 | | 3,720 | | 4,813 | | 15,781 | | 3,281 | | 3,731 | | 3,702 |
% change – yoy | | 8 | | 5 | | 1 | | –2 | | 2 | | –4 | | –2 | | 0 |
% change constant currency – yoy | | 5 | | 4 | | 4 | | 2 | | 4 | | 4 | | 3 | | 2 |
Cloud and software (IFRS) | | 4,328 | | 4,757 | | 4,657 | | 5,807 | | 19,549 | | 4,351 | | 4,944 | | 5,007 |
Cloud and software (non-IFRS) | | 4,328 | | 4,758 | | 4,658 | | 5,809 | | 19,552 | | 4,353 | | 4,959 | | 5,017 |
% change – yoy | | 12 | | 9 | | 5 | | 1 | | 6 | | 1 | | 4 | | 8 |
% change constant currency – yoy | | 9 | | 8 | | 8 | | 6 | | 8 | | 9 | | 10 | | 10 |
Total revenue (IFRS) | | 5,285 | | 5,782 | | 5,590 | | 6,805 | | 23,461 | | 5,261 | | 5,999 | | 6,020 |
Total revenue (non-IFRS) | | 5,285 | | 5,782 | | 5,590 | | 6,807 | | 23,464 | | 5,262 | | 6,014 | | 6,031 |
% change – yoy | | 12 | | 10 | | 4 | | 1 | | 6 | | 0 | | 4 | | 8 |
% change constant currency – yoy | | 8 | | 9 | | 8 | | 6 | | 8 | | 9 | | 10 | | 10 |
Share of predictable revenue (IFRS, in %) | | 69 | | 63 | | 65 | | 55 | | 63 | | 71 | | 66 | | 68 |
Share of predictable revenue (non-IFRS, in %) | | 69 | | 63 | | 65 | | 55 | | 63 | | 71 | | 66 | | 68 |
| | | | | | | | | | | | | | | | |
Profits | | | | | | | | | | | | | | | | |
Operating profit (IFRS) | | 673 | | 926 | | 1,314 | | 1,964 | | 4,877 | | 1,025 | | 1,044 | | 1,236 |
Operating profit (non-IFRS) | | 1,198 | | 1,570 | | 1,637 | | 2,364 | | 6,769 | | 1,235 | | 1,640 | | 1,742 |
% change | | 8 | | 4 | | 0 | | 0 | | 2 | | 3 | | 4 | | 6 |
% change constant currency | | 2 | | 3 | | 4 | | 6 | | 4 | | 14 | | 12 | | 11 |
Profit after tax (IFRS) | | 530 | | 666 | | 993 | | 1,867 | | 4,056 | | 708 | | 720 | | 974 |
Profit after tax (non-IFRS) | | 887 | | 1,120 | | 1,214 | | 2,136 | | 5,356 | | 868 | | 1,173 | | 1,360 |
% change | | 16 | | 14 | | 11 | | 17 | | 15 | | –2 | | 5 | | 12 |
| | | | | | | | | | | | | | | | |
Margins | | | | | | | | | | | | | | | | |
Cloud subscriptions and support gross margin (IFRS, in %) | | 57.7 | | 56.0 | | 54.8 | | 55.4 | | 56.0 | | 59.3 | | 58.3 | | 58.6 |
Cloud subscriptions and support gross margin (non-IFRS, in %) | | 64.6 | | 62.4 | | 60.8 | | 61.0 | | 62.2 | | 63.2 | | 63.6 | | 63.5 |
Software license and support gross margin (IFRS, in %) | | 83.3 | | 85.3 | | 86.2 | | 87.8 | | 85.8 | | 85.7 | | 85.8 | | 86.0 |
Software license and support gross margin (non-IFRS, in %) | | 85.1 | | 86.6 | | 87.3 | | 88.6 | | 87.0 | | 86.4 | | 87.0 | | 87.1 |
Cloud and software gross margin (IFRS, in %) | | 77.9 | | 79.6 | | 79.9 | | 82.2 | | 80.1 | | 79.2 | | 79.0 | | 78.9 |
Cloud and software gross margin (non-IFRS, in %) | | 80.8 | | 81.8 | | 82.0 | | 83.9 | | 82.2 | | 80.7 | | 81.2 | | 80.9 |
Gross margin (IFRS, in %) | | 66.7 | | 69.0 | | 70.1 | | 73.2 | | 69.9 | | 68.5 | | 68.6 | | 68.3 |
Gross margin (non-IFRS, in %) | | 69.9 | | 71.5 | | 72.5 | | 75.2 | | 72.5 | | 70.2 | | 71.5 | | 71.0 |
Operating margin (IFRS, in %) | | 12.7 | | 16.0 | | 23.5 | | 28.9 | | 20.8 | | 19.5 | | 17.4 | | 20.5 |
Operating margin (non-IFRS, in %) | | 22.7 | | 27.2 | | 29.3 | | 34.7 | | 28.9 | | 23.5 | | 27.3 | | 28.9 |
AT&S segment – Cloud subscriptions and support gross margin (in %) | | 53 | | 50 | | 47 | | 43 | | 48 | | 49 | | 49 | | 48 |
AT&S segment – Gross margin (in %) | | 71 | | 73 | | 74 | | 76 | | 74 | | 71 | | 73 | | 72 |
AT&S segment – Segment margin (in %) | | 36 | | 41 | | 42 | | 47 | | 42 | | 36 | | 41 | | 42 |
SAP BN segment – Cloud subscriptions and support gross margin (in %) | | 77 | | 77 | | 76 | | 77 | | 77 | | 77 | | 77 | | 78 |
SAP BN segment – Gross margin (in %) | | 67 | | 68 | | 68 | | 68 | | 68 | | 69 | | 69 | | 69 |
SAP BN segment – Segment margin (in %) | | 16 | | 17 | | 18 | | 18 | | 17 | | 17 | | 20 | | 23 |
SAP Q3 2018 Quarterly Statement | 8 |
€ millions, unless otherwise stated | | Q1
2017 | | Q2
2017 | | Q3
2017 | | Q4
2017 | | TY
2017 | | Q1
2018 | | Q2
2018 | | Q3
2018 |
SAP CEC Segment – Cloud subscriptions and support gross margin (in %) | | 68 | | 63 | | 54 | | 63 | | 62 | | 73 | | 74 | | 70 |
SAP CEC Segment – Gross margin (in %) | | 76 | | 80 | | 77 | | 87 | | 81 | | 82 | | 81 | | 78 |
SAP CEC Segment – Segment margin (in %) | | –15 | | 7 | | 13 | | 33 | | 14 | | 9 | | 6 | | 10 |
| | | | | | | | | | | | | | | | |
Key Profit Ratios | | | | | | | | | | | | | | | | |
Effective tax rate (IFRS, in %) | | 20.6 | | 26.6 | | 28.6 | | 9.4 | | 19.3 | | 28.5 | | 30.0 | | 23.8 |
Effective tax rate (non-IFRS, in %) | | 25.7 | | 27.8 | | 29.2 | | 13.2 | | 22.6 | | 27.8 | | 27.8 | | 23.7 |
| | | | | | | | | | | | | | | | |
Earnings per share, basic (IFRS, in €) | | 0.43 | | 0.56 | | 0.82 | | 1.55 | | 3.36 | | 0.59 | | 0.60 | | 0.82 |
Earnings per share, basic (non-IFRS, in €) | | 0.73 | | 0.94 | | 1.01 | | 1.77 | | 4.44 | | 0.73 | | 0.98 | | 1.14 |
| | | | | | | | | | | | | | | | |
Order Entry | | | | | | | | | | | | | | | | |
New Cloud Bookings | | 215 | | 340 | | 302 | | 591 | | 1,448 | | 245 | | 421 | | 411 |
Share of cloud orders greater than €5 million based on total cloud order entry volume (in %) | | 35 | | 32 | | 27 | | 31 | | 31 | | 20 | | 32 | | 28 |
Share of cloud orders smaller than €1 million based on total cloud order entry volume (in %) | | 31 | | 31 | | 30 | | 31 | | 31 | | 39 | | 31 | | 35 |
Contract liabilities / deferred income (current) | | 6,215 | | 4,898 | | 3,531 | | 2,771 | | 2,771 | | 5,041 | | 4,867 | | 3,603 |
Orders – Number of on-premise software deals (in transactions) | | 13,115 | | 14,361 | | 13,889 | | 17,782 | | 59,147 | | 13,549 | | 14,538 | | 13,794 |
Share of orders greater than €5 million based on total software order entry volume (in %) | | 27 | | 31 | | 29 | | 30 | | 30 | | 18 | | 29 | | 22 |
Share of orders smaller than €1 million based on total software order entry volume (in %) | | 46 | | 40 | | 41 | | 37 | | 40 | | 50 | | 41 | | 42 |
| | | | | | | | | | | | | | | | |
Liquidity and Cash Flow | | | | | | | | | | | | | | | | |
Net cash flows from operating activities | | 2,872 | | 642 | | 611 | | 920 | | 5,045 | | 2,578 | | 407 | | 499 |
Free cash flow | | 2,581 | | 322 | | 258 | | 609 | | 3,770 | | 2,151 | | 16 | | 171 |
% of total revenue (IFRS) | | 49 | | 6 | | 5 | | 9 | | 16 | | 41 | | 0 | | 3 |
% of profit after tax (IFRS) | | 487 | | 48 | | 26 | | 33 | | 93 | | 304 | | 2 | | 18 |
Group liquidity, gross | | 7,345 | | 4,927 | | 4,960 | | 4,785 | | 4,785 | | 8,270 | | 4,688 | | 4,738 |
Group debt | | –7,805 | | –6,716 | | –6,667 | | –6,264 | | –6,264 | | –7,723 | | –7,660 | | –7,521 |
Group liquidity, net | | –460 | | –1,789 | | –1,706 | | –1,479 | | –1,479 | | 546 | | –2,972 | | –2,784 |
Days’ sales outstanding (DSO, in days)1) | | 72 | | 72 | | 72 | | 70 | | 70 | | 68 | | 68 | | 68 |
| | | | | | | | | | | | | | | | |
Financial Position | | | | | | | | | | | | | | | | |
Cash and cash equivalents | | 5,937 | | 4,236 | | 4,220 | | 4,011 | | 4,011 | | 7,598 | | 4,515 | | 4,507 |
Goodwill | | 23,091 | | 21,949 | | 21,353 | | 21,271 | | 21,271 | | 20,854 | | 23,377 | | 23,510 |
Total assets | | 47,724 | | 42,900 | | 41,430 | | 42,509 | | 42,509 | | 45,473 | | 45,481 | | 45,646 |
Equity ratio (total equity in % of total assets) | | 56 | | 57 | | 59 | | 60 | | 60 | | 56 | | 57 | | 59 |
| | | | | | | | | | | | | | | | |
Non-Financials | | | | | | | | | | | | | | | | |
Number of employees (quarter end)2) | | 85,751 | | 87,114 | | 87,874 | | 88,543 | | 88,543 | | 91,120 | | 93,846 | | 94,989 |
Employee retention (in %, rolling 12 months) | | 94.4 | | 94.7 | | 94.5 | | 94.6 | | 94.6 | | 94.4 | | 94.3 | | 94.1 |
Women in management (in %, quarter end) | | 24.8 | | 25.0 | | 25.2 | | 25.4 | | 25.4 | | 25.6 | | 25.8 | | 25.9 |
Greenhouse gas emissions (in kilotons) | | 100 | | 55 | | 80 | | 90 | | 325 | | 100 | | 75 | | 65 |
1) Days’ sales outstanding measures the average number of days from the raised invoice to cash receipt from the customer. We calculate DSO by dividing the average invoiced trade receivables balance of the last 12 months by the average monthly cash receipt of the last 12 months.
2) In full-time equivalents.
Due to rounding, numbers may not add up precisely.
SAP Q3 2018 Quarterly Statement | 9 |
Consolidated Income Statements of SAP Group (IFRS) – Quarter
€ millions, unless otherwise stated | | | | Q3 2018 | | Q3 2017 | | ∆ in % |
Cloud subscriptions and support | | | | 1,304 | | 937 | | 39 |
Software licenses | | | | 937 | | 1,033 | | –9 |
Software support | | | | 2,765 | | 2,687 | | 3 |
Software licenses and support | | | | 3,702 | | 3,720 | | 0 |
Cloud and software | | | | 5,007 | | 4,657 | | 7 |
Services | | | | 1,013 | | 932 | | 9 |
Total revenue | | | | 6,020 | | 5,590 | | 8 |
| | | | | | | | |
Cost of cloud subscriptions and support | | | | –540 | | –423 | | 28 |
Cost of software licenses and support | | | | –517 | | –512 | | 1 |
Cost of cloud and software | | | | –1,057 | | –935 | | 13 |
Cost of services | | | | –851 | | –738 | | 15 |
Total cost of revenue | | | | –1,908 | | –1,673 | | 14 |
Gross profit | | | | 4,112 | | 3,917 | | 5 |
Research and development | | | | –918 | | –781 | | 18 |
Sales and marketing | | | | –1,673 | | –1,640 | | 2 |
General and administration | | | | –284 | | –251 | | 13 |
Restructuring | | | | –4 | | 67 | | <-100 |
Other operating income/expense, net | | | | 2 | | 1 | | 97 |
Total operating expenses | | | | –4,784 | | –4,276 | | 12 |
Operating profit | | | | 1,236 | | 1,314 | | –6 |
| | | | | | | | |
Other non-operating income/expense, net | | | | 33 | | 4 | | >100 |
Finance income | | | | 84 | | 130 | | –36 |
Finance costs | | | | –74 | | –58 | | 28 |
Financial income, net | | | | 10 | | 73 | | –87 |
Profit before tax | | | | 1,278 | | 1,390 | | –8 |
| | | | | | | | |
Income tax expense | | | | –304 | | –398 | | –24 |
Profit after tax | | | | 974 | | 993 | | –2 |
Attributable to owners of parent | | | | 973 | | 983 | | –1 |
Attributable to non-controlling interests | | | | 1 | | 9 | | –94 |
| | | | | | | | |
Earnings per share, basic (in €)1) | | | | 0.82 | | 0.82 | | –1 |
Earnings per share, diluted (in €)1) | | | | 0.82 | | 0.82 | | –1 |
1) For the three months ended September 30, 2018 and 2017, the weighted average number of shares was 1,194 million (diluted 1,194 million) and 1,198 million (diluted: 1,198 million), respectively (treasury stock excluded).
Due to rounding, numbers may not add up precisely.
SAP Q3 2018 Quarterly Statement | | 10 |
Consolidated Income Statements of SAP Group (IFRS) – Year-to-Date
€ millions, unless otherwise stated | | | | Q1–Q3
2018 | | Q1–Q3
2017 | | ∆ in % |
Cloud subscriptions and support | | | | 3,588 | | 2,775 | | 29 |
Software licenses | | | | 2,558 | | 2,814 | | –9 |
Software support | | | | 8,156 | | 8,154 | | 0 |
Software licenses and support | | | | 10,714 | | 10,968 | | –2 |
Cloud and software | | | | 14,302 | | 13,742 | | 4 |
Services | | | | 2,978 | | 2,914 | | 2 |
Total revenue | | | | 17,280 | | 16,656 | | 4 |
| | | | | | | | |
Cost of cloud subscriptions and support | | | | –1,481 | | –1,216 | | 22 |
Cost of software licenses and support | | | | –1,518 | | –1,646 | | –8 |
Cost of cloud and software | | | | –2,999 | | –2,862 | | 5 |
Cost of services | | | | –2,451 | | –2,366 | | 4 |
Total cost of revenue | | | | –5,450 | | –5,228 | | 4 |
Gross profit | | | | 11,831 | | 11,428 | | 4 |
Research and development | | | | –2,680 | | –2,475 | | 8 |
Sales and marketing | | | | –4,986 | | –5,055 | | –1 |
General and administration | | | | –832 | | –820 | | 1 |
Restructuring | | | | –26 | | –174 | | –85 |
Other operating income/expense, net | | | | –3 | | 9 | | <-100 |
Total operating expenses | | | | –13,976 | | –13,743 | | 2 |
Operating profit | | | | 3,304 | | 2,913 | | 13 |
| | | | | | | | |
Other non-operating income/expense, net | | | | –58 | | –6 | | >100 |
Finance income | | | | 269 | | 273 | | –2 |
Finance costs | | | | –218 | | –213 | | 2 |
Financial income, net | | | | 50 | | 59 | | –15 |
Profit before tax | | | | 3,297 | | 2,966 | | 11 |
| | | | | | | | |
Income tax expense | | | | –895 | | –777 | | 15 |
Profit after tax | | | | 2,401 | | 2,189 | | 10 |
Attributable to owners of parent | | | | 2,400 | | 2,172 | | 10 |
Attributable to non-controlling interests | | | | 1 | | 17 | | –94 |
| | | | | | | | |
Earnings per share, basic (in €)1) | | | | 2.01 | | 1.81 | | 11 |
Earnings per share, diluted (in €)1) | | | | 2.01 | | 1.81 | | 11 |
1) For the nine months ended September 30, 2018 and 2017, the weighted average number of shares was 1,194 million (diluted 1,194 million) and 1,198 million (diluted: 1,199 million), respectively (treasury stock excluded).
Due to rounding, numbers may not add up precisely.
SAP Q3 2018 Quarterly Statement | | 11 |
Consolidated Statements of Financial Position of SAP Group (IFRS)
as at 9/30/2018 and 12/31/2017 | |
€ millions | | | | 2018 | | 20171) | |
Cash and cash equivalents | | | | 4,507 | | 4,011 | |
Other financial assets | | | | 484 | | 990 | |
Trade and other receivables | | | | 4,931 | | 5,899 | |
Other non-financial assets | | | | 1,024 | | 725 | |
Tax assets | | | | 444 | | 306 | |
Total current assets | | | | 11,391 | | 11,930 | |
Goodwill | | | | 23,510 | | 21,271 | |
Intangible assets | | | | 3,258 | | 2,967 | |
Property, plant, and equipment | | | | 3,420 | | 2,967 | |
Other financial assets | | | | 1,461 | | 1,155 | |
Trade and other receivables | | | | 123 | | 118 | |
Other non-financial assets | | | | 1,024 | | 621 | |
Tax assets | | | | 438 | | 443 | |
Deferred tax assets | | | | 1,022 | | 1,037 | |
Total non-current assets | | | | 34,255 | | 30,579 | |
Total assets | | | | 45,646 | | 42,509 | |
| | | | | | | |
€ millions | | | | 2018 | | 20171) | |
Trade and other payables | | | | 1,246 | | 1,151 | |
Tax liabilities | | | | 504 | | 597 | |
Financial liabilities | | | | 1,123 | | 1,561 | |
Other non-financial liabilities | | | | 3,511 | | 3,946 | |
Provisions | | | | 107 | | 184 | |
Contract liabilities / deferred income | | | | 3,603 | | 2,771 | |
Total current liabilities | | | | 10,094 | | 10,210 | |
Trade and other payables | | | | 119 | | 119 | |
Tax liabilities | | | | 542 | | 471 | |
Financial liabilities | | | | 6,802 | | 5,034 | |
Other non-financial liabilities | | | | 507 | | 503 | |
Provisions | | | | 259 | | 303 | |
Deferred tax liabilities | | | | 215 | | 251 | |
Contract liabilities / deferred income | | | | 101 | | 79 | |
Total non-current liabilities | | | | 8,545 | | 6,759 | |
Total liabilities | | | | 18,639 | | 16,969 | |
Issued capital | | | | 1,229 | | 1,229 | |
Share premium | | | | 543 | | 570 | |
Retained earnings | | | | 25,769 | | 24,794 | |
Other components of equity | | | | 1,004 | | 508 | |
Treasury shares | | | | –1,580 | | –1,591 | |
Equity attributable to owners of parent | | | | 26,964 | | 25,509 | |
| | | | | | | |
Non-controlling interests | | | | 43 | | 31 | |
Total equity | | | | 27,006 | | 25,540 | |
Total equity and liabilities | | | | 45,646 | | 42,509 | |
| | | | | | | | | |
1) Under the adoption methods we chose for IFRS 15 and IFRS 9, prior years are not restated to conform to the new policies.
Due to rounding, numbers may not add up precisely.
SAP Q3 2018 Quarterly Statement | 12 |
Consolidated Statements of Cash Flows of SAP Group (IFRS)
€ millions | | Q1–Q3 2018 | | Q1–Q3 2017 | |
Profit after tax | | 2,401 | | 2,189 | |
Adjustments to reconcile profit after tax to net cash flows from operating activities: | | | | | |
Depreciation and amortization | | 986 | | 961 | |
Income tax expense | | 895 | | 777 | |
Financial income, net | | –50 | | –59 | |
Decrease/increase in sales and bad debt allowances on trade receivables | | –59 | | –15 | |
Other adjustments for non-cash items | | –13 | | –35 | |
Decrease/increase in trade and other receivables | | 1,522 | | 731 | |
Decrease/increase in other assets | | –554 | | –338 | |
Decrease/increase in trade payables, provisions, and other liabilities | | –505 | | –456 | |
Decrease/increase in contract liabilities/deferred income | | 86 | | 1,480 | |
Interest paid | | –123 | | –145 | |
Interest received | | 75 | | 53 | |
Income taxes paid, net of refunds | | –1,177 | | –1,016 | |
Net cash flows from operating activities | | 3,484 | | 4,125 | |
Business combinations, net of cash and cash equivalents acquired | | –2,017 | | –22 | |
Purchase of intangible assets or property, plant, and equipment | | –1,146 | | –964 | |
Proceeds from sales of intangible assets or property, plant, and equipment | | 54 | | 77 | |
Purchase of equity or debt instruments of other entities | | –810 | | –2,098 | |
Proceeds from sales of equity or debt instruments of other entities | | 1,309 | | 2,371 | |
Net cash flows from investing activities | | –2,609 | | –636 | |
Dividends paid | | –1,671 | | –1,499 | |
Dividends paid on non-controlling interests | | –6 | | –39 | |
Purchase of treasury shares | | 0 | | –288 | |
Proceeds from borrowings | | 1,833 | | 27 | |
Repayments of borrowings | | –626 | | –1,007 | |
Net cash flows from financing activities | | –470 | | –2,806 | |
Effect of foreign currency rates on cash and cash equivalents | | 91 | | –165 | |
Net decrease/increase in cash and cash equivalents | | 496 | | 518 | |
Cash and cash equivalents at the beginning of the period | | 4,011 | | 3,702 | |
Cash and cash equivalents at the end of the period | | 4,507 | | 4,220 | |
Due to rounding, numbers may not add up precisely. | | | | | |
SAP Q3 2018 Quarterly Statement | 13 |
Segment Reporting – Quarter
Applications, Technology & Services
€ millions, unless otherwise stated | | Q3 2018 | | Q3 2017 | | ∆ in % | | ∆ in % |
| | Actual
Currency | | Constant
Currency | | Actual
Currency | | Actual
Currency | | Constant
Currency |
Cloud subscriptions and support – SaaS/PaaS1) | | 470 | | 474 | | 358 | | 31 | | 33 |
Cloud subscriptions and support – IaaS2) | | 131 | | 132 | | 77 | | 70 | | 72 |
Cloud subscriptions and support | | 600 | | 606 | | 435 | | 38 | | 39 |
Software licenses | | 860 | | 869 | | 942 | | –9 | | –8 |
Software support | | 2,761 | | 2,851 | | 2,683 | | 3 | | 6 |
Software licenses and support | | 3,621 | | 3,719 | | 3,625 | | 0 | | 3 |
Cloud and software | | 4,221 | | 4,326 | | 4,059 | | 4 | | 7 |
Services | | 825 | | 857 | | 757 | | 9 | | 13 |
Total segment revenue | | 5,046 | | 5,183 | | 4,816 | | 5 | | 8 |
Cost of cloud subscriptions and support – SaaS/PaaS1) | | –206 | | –216 | | –151 | | 36 | | 43 |
Cost of cloud subscriptions and support – IaaS2) | | –109 | | –110 | | –78 | | 39 | | 41 |
Cost of cloud subscriptions and support | | –315 | | –326 | | –230 | | 37 | | 42 |
Cost of software licenses and support | | –459 | | –466 | | –453 | | 1 | | 3 |
Cost of cloud and software | | –773 | | –792 | | –683 | | 13 | | 16 |
Cost of services | | –630 | | –641 | | –567 | | 11 | | 13 |
Total cost of revenue | | –1,403 | | –1,433 | | –1,249 | | 12 | | 15 |
Segment gross profit | | 3,644 | | 3,750 | | 3,567 | | 2 | | 5 |
Other segment expenses | | –1,548 | | –1,571 | | –1,542 | | 0 | | 2 |
Segment profit | | 2,096 | | 2,179 | | 2,025 | | 4 | | 8 |
Margins | | | | | | | | | | |
Cloud subscriptions and support gross margin – SaaS/PaaS1) (in %) | | 56 | | 54 | | 58 | | –2pp | | –3pp |
Cloud subscriptions and support gross margin – IaaS2) (in %) | | 17 | | 17 | | –2 | | 19pp | | 18pp |
Cloud subscriptions and support gross margin (in %) | | 48 | | 46 | | 47 | | 0pp | | –1pp |
Gross margin (in %) | | 72 | | 72 | | 74 | | –2pp | | –2pp |
Segment margin (in %) | | 42 | | 42 | | 42 | | –1pp | | 0pp |
1) Software as a Service/Platform as a Service
2) Infrastructure as a Service
Due to rounding, numbers may not add up precisely.
SAP Q3 2018 Quarterly Statement | 14 |
SAP Business Network
€ millions, unless otherwise stated | | Q3 2018 | | Q3 2017 | | ∆ in % | | ∆ in % |
| | Actual
Currency | | Constant
Currency | | Actual
Currency | | Actual
Currency | | Constant
Currency |
Cloud subscriptions and support – SaaS/PaaS1) | | 563 | | 563 | | 453 | | 24 | | 24 |
Cloud subscriptions and support – IaaS2) | | 0 | | 0 | | 0 | | 0 | | 0 |
Cloud subscriptions and support | | 563 | | 563 | | 453 | | 24 | | 24 |
Software licenses | | 0 | | 0 | | 0 | | 0 | | 0 |
Software support | | 4 | | 4 | | 4 | | –14 | | –14 |
Software licenses and support | | 4 | | 4 | | 4 | | –14 | | –14 |
Cloud and software | | 566 | | 566 | | 457 | | 24 | | 24 |
Services | | 109 | | 108 | | 95 | | 15 | | 14 |
Total segment revenue | | 675 | | 675 | | 552 | | 22 | | 22 |
Cost of cloud subscriptions and support – SaaS/PaaS1) | | –121 | | –122 | | –109 | | 11 | | 11 |
Cost of cloud subscriptions and support – IaaS2) | | 0 | | 0 | | 0 | | 0 | | 0 |
Cost of cloud subscriptions and support | | –121 | | –122 | | –109 | | 11 | | 11 |
Cost of software licenses and support | | –1 | | –1 | | –1 | | 4 | | 4 |
Cost of cloud and software | | –123 | | –123 | | –111 | | 11 | | 11 |
Cost of services | | –86 | | –87 | | –66 | | 30 | | 31 |
Total cost of revenue | | –209 | | –210 | | –177 | | 18 | | 19 |
Segment gross profit | | 467 | | 465 | | 375 | | 24 | | 24 |
Other segment expenses | | –311 | | –312 | | –278 | | 12 | | 12 |
Segment profit | | 155 | | 152 | | 97 | | 60 | | 57 |
Margins | | | | | | | | | | |
Cloud subscriptions and support gross margin – SaaS/PaaS1) (in %) | | 78 | | 78 | | 76 | | 3pp | | 3pp |
Cloud subscriptions and support gross margin – IaaS2) (in %) | | NA | | NA | | NA | | NA | | NA |
Cloud subscriptions and support gross margin (in %) | | 78 | | 78 | | 76 | | 3pp | | 3pp |
Gross margin (in %) | | 69 | | 69 | | 68 | | 1pp | | 1pp |
Segment margin (in %) | | 23 | | 23 | | 18 | | 5pp | | 5pp |
1) Software as a Service/Platform as a Service
2) Infrastructure as a Service
Due to rounding, numbers may not add up precisely.
SAP Q3 2018 Quarterly Statement | 15 |
Customer Experience
€ millions, unless otherwise stated | | Q3 2018 | | Q3 2017 | | ∆ in % | | ∆ in % |
| | Actual
Currency | | Constant
Currency | | Actual
Currency | | Actual
Currency | | Constant
Currency |
Cloud subscriptions and support – SaaS/PaaS1) | | 151 | | 151 | | 50 | | >100 | | >100 |
Cloud subscriptions and support – IaaS2) | | 0 | | 0 | | 0 | | 0 | | 0 |
Cloud subscriptions and support | | 151 | | 151 | | 50 | | >100 | | >100 |
Software licenses | | 78 | | 78 | | 100 | | –23 | | –22 |
Software support | | 0 | | 0 | | 0 | | 0 | | 0 |
Software licenses and support | | 78 | | 79 | | 100 | | –22 | | –21 |
Cloud and software | | 229 | | 230 | | 150 | | 53 | | 53 |
Services | | 3 | | 3 | | 1 | | >100 | | >100 |
Total segment revenue | | 232 | | 233 | | 151 | | 54 | | 54 |
Cost of cloud subscriptions and support – SaaS/PaaS1) | | –45 | | –46 | | –23 | | 96 | | 97 |
Cost of cloud subscriptions and support – IaaS2) | | 0 | | 0 | | 0 | | 0 | | 0 |
Cost of cloud subscriptions and support | | –45 | | –46 | | –23 | | 96 | | 97 |
Cost of software licenses and support | | –5 | | –5 | | –12 | | –62 | | –61 |
Cost of cloud and software | | –50 | | –50 | | –35 | | 42 | | 43 |
Cost of services | | –2 | | –2 | | 0 | | >100 | | >100 |
Total cost of revenue | | –52 | | –52 | | –35 | | 47 | | 48 |
Segment gross profit | | 180 | | 181 | | 116 | | 56 | | 56 |
Other segment expenses | | –156 | | –157 | | –96 | | 63 | | 63 |
Segment profit | | 24 | | 24 | | 20 | | 21 | | 23 |
Margins | | | | | | | | | | |
Cloud subscriptions and support gross margin – SaaS/PaaS1) (in %) | | 70 | | 70 | | 54 | | 16pp | | 16pp |
Cloud subscriptions and support gross margin – IaaS2) (in %) | | NA | | NA | | NA | | NA | | NA |
Cloud subscriptions and support gross margin (in %) | | 70 | | 70 | | 54 | | 16pp | | 16pp |
Gross margin (in %) | | 78 | | 78 | | 77 | | 1pp | | 1pp |
Segment margin (in %) | | 10 | | 10 | | 13 | | –3pp | | –3pp |
1) Software as a Service/Platform as a Service
2) Infrastructure as a Service
Due to rounding, numbers may not add up precisely.
SAP Q3 2018 Quarterly Statement | 16 |
Reconciliation of Cloud Subscription Revenues and Margins
€ millions, unless otherwise stated | | | | Q3 2018 | | Q3 2017 | | ∆ in % | | ∆ in % | |
| | | | | | | | | | | | | |
| | | | Actual
Currency | | Constant
Currency | | Actual
Currency | | Actual
Currency | | Constant
Currency | |
Cloud subscriptions and support revenue – SaaS/PaaS1) | | SAP Business Network segment | | 563 | | 563 | | 453 | | 24 | | 24 | |
| Other3) | | 622 | | 626 | | 408 | | 52 | | 53 | |
| Total | | 1,184 | | 1,189 | | 861 | | 38 | | 38 | |
| | | | | | | | | | | | | |
Cloud subscriptions and support revenue – IaaS2) | | | | 131 | | 132 | | 77 | | 70 | | 72 | |
Cloud subscriptions and support revenue | | | | 1,315 | | 1,321 | | 938 | | 40 | | 41 | |
Cloud subscriptions and support gross margin – SaaS/PaaS1) (in %) | | SAP Business Network segment | | 78 | | 78 | | 76 | | 3pp | | 3pp | |
| Other3) | | 60 | | 60 | | 56 | | 4pp | | 4pp | |
| Total | | 69 | | 69 | | 66 | | 2pp | | 2pp | |
Cloud subscriptions and support gross margin – IaaS2) (in %) | | | | 17 | | 17 | | –2 | | 19pp | | 18pp | |
Cloud subscriptions and support gross margin (in %) | | | | 64 | | 63 | | 61 | | 3pp | | 3pp | |
1) Software as a Service/Platform as a Service
2) Infrastructure as a Service
3) Other includes Application, Technology & Services segment, Customer Experience segment and miscellaneous. The individual revenue and margin numbers for the Application, Technology & Services segment and the Customer Experience segment are disclosed on the previous pages
Due to rounding, numbers may not add up precisely.
SAP Q3 2018 Quarterly Statement | 17 |
Segment Reporting – Year-to-Date
Applications, Technology & Services
€ millions, unless otherwise stated | | | | Q1–Q3 2018 | | Q1–Q3 2017 | | ∆ in % | | ∆ in % |
| | Actual
Currency | | Constant
Currency | | Actual
Currency | | Actual
Currency | | Constant
Currency |
Cloud subscriptions and support – SaaS/PaaS1) | | 1,317 | | 1,387 | | 1,028 | | 28 | | 35 |
Cloud subscriptions and support – IaaS2) | | 347 | | 365 | | 234 | | 48 | | 56 |
Cloud subscriptions and support | | 1,665 | | 1,752 | | 1,262 | | 32 | | 39 |
Software licenses | | 2,331 | | 2,416 | | 2,537 | | –8 | | –5 |
Software support | | 8,147 | | 8,633 | | 8,139 | | 0 | | 6 |
Software licenses and support | | 10,478 | | 11,049 | | 10,677 | | –2 | | 3 |
Cloud and software | | 12,142 | | 12,800 | | 11,939 | | 2 | | 7 |
Services | | 2,399 | | 2,570 | | 2,359 | | 2 | | 9 |
Total segment revenue | | 14,542 | | 15,371 | | 14,298 | | 2 | | 7 |
Cost of cloud subscriptions and support – SaaS/PaaS1) | | –554 | | –585 | | –414 | | 34 | | 41 |
Cost of cloud subscriptions and support – IaaS2) | | –302 | | –314 | | –218 | | 38 | | 44 |
Cost of cloud subscriptions and support | | –855 | | –899 | | –632 | | 35 | | 42 |
Cost of software licenses and support | | –1,368 | | –1,433 | | –1,421 | | –4 | | 1 |
Cost of cloud and software | | –2,223 | | –2,332 | | –2,053 | | 8 | | 14 |
Cost of services | | –1,851 | | –1,952 | | –1,833 | | 1 | | 6 |
Total cost of revenue | | –4,074 | | –4,284 | | –3,886 | | 5 | | 10 |
Segment gross profit | | 10,468 | | 11,087 | | 10,413 | | 1 | | 6 |
Other segment expenses | | –4,688 | | –4,912 | | –4,737 | | –1 | | 4 |
Segment profit | | 5,780 | | 6,175 | | 5,676 | | 2 | | 9 |
Margins | | | | | | | | | | |
Cloud subscriptions and support gross margin – SaaS/PaaS1) (in %) | | 58 | | 58 | | 60 | | –2pp | | –2pp |
Cloud subscriptions and support gross margin – IaaS2) (in %) | | 13 | | 14 | | 7 | | 6pp | | 7pp |
Cloud subscriptions and support gross margin (in %) | | 49 | | 49 | | 50 | | –1pp | | –1pp |
Gross margin (in %) | | 72 | | 72 | | 73 | | –1pp | | –1pp |
Segment margin (in %) | | 40 | | 40 | | 40 | | 0pp | | 0pp |
1) Software as a Service/Platform as a Service | | | | | | | | | | |
2) Infrastructure as a Service | | | | | | | | | | |
Due to rounding numbers may not add up precisely.
SAP Q3 2018 Quarterly Statement | | 18 |
SAP Business Network
€ millions, unless otherwise stated | | | | Q1–Q3 2018 | | Q1–Q3 2017 | | ∆ in % | | ∆ in % |
| | Actual
Currency | | Constant
Currency | | Actual
Currency | | Actual
Currency | | Constant
Currency |
Cloud subscriptions and support – SaaS/PaaS1) | | 1,577 | | 1,676 | | 1,378 | | 14 | | 22 |
Cloud subscriptions and support – IaaS2) | | 0 | | 0 | | 0 | | 0 | | 0 |
Cloud subscriptions and support | | 1,577 | | 1,676 | | 1,378 | | 14 | | 22 |
Software licenses | | 0 | | 0 | | 0 | | 0 | | 0 |
Software support | | 12 | | 13 | | 15 | | –21 | | –15 |
Software licenses and support | | 12 | | 13 | | 15 | | –20 | | –14 |
Cloud and software | | 1,589 | | 1,689 | | 1,393 | | 14 | | 21 |
Services | | 320 | | 338 | | 297 | | 8 | | 14 |
Total segment revenue | | 1,908 | | 2,026 | | 1,690 | | 13 | | 20 |
Cost of cloud subscriptions and support – SaaS/PaaS1) | | –351 | | –373 | | –323 | | 9 | | 16 |
Cost of cloud subscriptions and support – IaaS2) | | 0 | | 0 | | 0 | | 0 | | 0 |
Cost of cloud subscriptions and support | | –351 | | –373 | | –323 | | 9 | | 16 |
Cost of software licenses and support | | –5 | | –5 | | –3 | | 50 | | 62 |
Cost of cloud and software | | –355 | | –378 | | –326 | | 9 | | 16 |
Cost of services | | –236 | | –250 | | –218 | | 8 | | 14 |
Total cost of revenue | | –591 | | –628 | | –544 | | 9 | | 15 |
Segment gross profit | | 1,317 | | 1,399 | | 1,146 | | 15 | | 22 |
Other segment expenses | | –933 | | –993 | | –859 | | 9 | | 16 |
Segment profit | | 384 | | 406 | | 287 | | 34 | | 41 |
Margins | | | | | | | | | | |
Cloud subscriptions and support gross margin – SaaS/PaaS1) (in %) | | 78 | | 78 | | 77 | | 1pp | | 1pp |
Cloud subscriptions and support gross margin – IaaS2) (in %) | | NA | | NA | | NA | | NA | | NA |
Cloud subscriptions and support gross margin (in %) | | 78 | | 78 | | 77 | | 1pp | | 1pp |
Gross margin (in %) | | 69 | | 69 | | 68 | | 1pp | | 1pp |
Segment margin (in %) | | 20 | | 20 | | 17 | | 3pp | | 3pp |
1) Software as a Service/Platform as a Service | | | | | | | | | | |
2) Infrastructure as a Service | | | | | | | | | | |
Due to rounding numbers may not add up precisely.
SAP Q3 2018 Quarterly Statement | | 19 |
Customer Experience
€ millions, unless otherwise stated | | | | Q1–Q3 2018 | | Q1–Q3 2017 | | ∆ in % | | ∆ in % |
| | Actual
Currency | | Constant Currency | | Actual
Currency | | Actual
Currency | | Constant
Currency |
Cloud subscriptions and support – SaaS/PaaS1) | | 368 | | 382 | | 134 | | >100 | | >100 |
Cloud subscriptions and support – IaaS2) | | 0 | | 0 | | 0 | | 0 | | 0 |
Cloud subscriptions and support | | 368 | | 382 | | 134 | | >100 | | >100 |
Software licenses | | 227 | | 236 | | 276 | | –18 | | –14 |
Software support | | 1 | | 1 | | 0 | | 0 | | 0 |
Software licenses and support | | 228 | | 237 | | 275 | | –17 | | –14 |
Cloud and software | | 595 | | 619 | | 410 | | 45 | | 51 |
Services | | 6 | | 7 | | 3 | | >100 | | >100 |
Total segment revenue | | 602 | | 626 | | 413 | | 46 | | 52 |
Cost of cloud subscriptions and support – SaaS/PaaS1) | | –103 | | –105 | | –52 | | 96 | | >100 |
Cost of cloud subscriptions and support – IaaS2) | | 0 | | 0 | | 0 | | 0 | | 0 |
Cost of cloud subscriptions and support | | –103 | | –105 | | –52 | | 96 | | >100 |
Cost of software licenses and support | | –15 | | –16 | | –40 | | –61 | | –60 |
Cost of cloud and software | | –118 | | –121 | | –92 | | 28 | | 31 |
Cost of services | | –1 | | –1 | | 0 | | >100 | | >100 |
Total cost of revenue | | –119 | | –122 | | –93 | | 29 | | 32 |
Segment gross profit | | 482 | | 504 | | 320 | | 51 | | 57 |
Other segment expenses | | –432 | | –449 | | –307 | | 41 | | 47 |
Segment profit | | 51 | | 54 | | 13 | | >100 | | >100 |
Margins | | | | | | | | | | |
Cloud subscriptions and support gross margin – SaaS/PaaS1) (in %) | | 72 | | 72 | | 61 | | 11pp | | 12pp |
Cloud subscriptions and support gross margin – IaaS2) (in %) | | NA | | NA | | NA | | NA | | NA |
Cloud subscriptions and support gross margin (in %) | | 72 | | 72 | | 61 | | 11pp | | 12pp |
Gross margin (in %) | | 80 | | 80 | | 77 | | 3pp | | 3pp |
Segment margin (in %) | | 8 | | 9 | | 3 | | 5pp | | 5pp |
1) Software as a Service/Platform as a Service | | | | | | | | | | |
2) Infrastructure as a Service | | | | | | | | | | |
Due to rounding numbers may not add up precisely.
SAP Q3 2018 Quarterly Statement | | 20 |
Reconciliation of Cloud Subscription Revenues and Margins
€ millions, unless otherwise stated | | | | | Q1–Q3 2018 | | Q1–Q3 2017 | | ∆ in % | | ∆ in % | |
| | | Actual
Currency | | Constant
Currency | | Actual
Currency | | Actual Currency | | Constant
Currency | |
Cloud subscriptions and support revenue –SaaS/PaaS1) | SAP Business Network segment | | 1,577 | | 1,676 | | 1,378 | | 14 | | 22 | |
Other3) | | 1,690 | | 1,769 | | 1,163 | | 45 | | 52 | |
Total | | 3,267 | | 3,445 | | 2,541 | | 29 | | 36 | |
Cloud subscriptions and support revenue – IaaS2) | | | 347 | | 365 | | 234 | | 48 | | 56 | |
Cloud subscriptions and support revenue | | | 3,614 | | 3,810 | | 2,775 | | 30 | | 37 | |
Cloud subscriptions and support gross margin – SaaS/PaaS1) (in %) | SAP Business Network segment | | 78 | | 78 | | 77 | | 1pp | | 1pp | |
Other3) | | 61 | | 60 | | 57 | | 3pp | | 3pp | |
Total | | 69 | | 69 | | 68 | | 1pp | | 1pp | |
Cloud subscriptions and support gross margin – IaaS2) (in %) | | | 13 | | 14 | | 7 | | 6pp | | 7pp | |
Cloud subscriptions and support gross margin (in %) | | | 63 | | 63 | | 63 | | 1pp | | 1pp | |
1) Software as a Service/Platform as a Service | | | | | | | | | | | |
2) Infrastructure as a Service | | | | | | | | | | | |
3) Other includes Application, Technology & Services segment, Customer Experience segment and miscellaneous. The individual revenue and margin numbers for the Application, Technology & Services segment and the Customer Experience segment are disclosed on the previous pages. | | |
| | | | | | | | | | | | | | |
Due to rounding numbers may not add up precisely.
SAP Q3 2018 Quarterly Statement | | 21 |
Reconciliation from Non-IFRS Numbers to IFRS Numbers – Quarter
€ millions, unless otherwise stated | | | | | | | | | | Q3 2018 | | | | | | Q3 2017 | | | | | | ∆ in % | |
| | IFRS | | Adj.1) | | Non-
IFRS1) | | Currency
Impact2) | | Non-IFRS
Constant
Currency2) | | IFRS | | Adj.1) | | Non-
IFRS1) | | IFRS | | Non-
IFRS1) | | Non-IFRS
Constant
Currency2) | |
Revenue Numbers | | | | | | | | | | | | | | | | | | | | | | | |
Cloud subscriptions and support | | 1,304 | | 10 | | 1,315 | | 6 | | 1,321 | | 937 | | 0 | | 938 | | 39 | | 40 | | 41 | |
Software licenses | | 937 | | 0 | | 937 | | 10 | | 947 | | 1,033 | | 0 | | 1,033 | | –9 | | –9 | | –8 | |
Software support | | 2,765 | | 0 | | 2,765 | | 89 | | 2,854 | | 2,687 | | 0 | | 2,687 | | 3 | | 3 | | 6 | |
Software licenses and support | | 3,702 | | 0 | | 3,702 | | 99 | | 3,801 | | 3,720 | | 0 | | 3,720 | | 0 | | 0 | | 2 | |
Cloud and software | | 5,007 | | 11 | | 5,017 | | 105 | | 5,122 | | 4,657 | | 0 | | 4,658 | | 7 | | 8 | | 10 | |
Services | | 1,013 | | 0 | | 1,013 | | 31 | | 1,045 | | 932 | | 0 | | 932 | | 9 | | 9 | | 12 | |
Total revenue | | 6,020 | | 11 | | 6,031 | | 136 | | 6,167 | | 5,590 | | 0 | | 5,590 | | 8 | | 8 | | 10 | |
| | | | | | | | | | | | | | | | | | | | | | | |
Operating Expense Numbers | | | | | | | | | | | | | | | | | | | | | | | |
Cost of cloud subscriptions and support | | –540 | | 61 | | –479 | | | | | | –423 | | 56 | | –368 | | 28 | | 30 | | | |
Cost of software licenses and support | | –517 | | 41 | | –476 | | | | | | –512 | | 41 | | –471 | | 1 | | 1 | | | |
Cost of cloud and software | | –1,057 | | 101 | | –956 | | | | | | –935 | | 97 | | –839 | | 13 | | 14 | | | |
Cost of services | | –851 | | 59 | | –792 | | | | | | –738 | | 41 | | –697 | | 15 | | 14 | | | |
Total cost of revenue | | –1,908 | | 160 | | –1,747 | | | | | | –1,673 | | 137 | | –1,536 | | 14 | | 14 | | | |
Gross profit | | 4,112 | | 171 | | 4,283 | | | | | | 3,917 | | 138 | | 4,055 | | 5 | | 6 | | | |
Research and development | | –918 | | 91 | | –828 | | | | | | –781 | | 64 | | –717 | | 18 | | 15 | | | |
Sales and marketing | | –1,673 | | 201 | | –1,471 | | | | | | –1,640 | | 162 | | –1,478 | | 2 | | 0 | | | |
General and administration | | –284 | | 39 | | –245 | | | | | | –251 | | 28 | | –223 | | 13 | | 10 | | | |
Restructuring | | –4 | | 4 | | 0 | | | | | | 67 | | –67 | | 0 | | <-100 | | NA | | | |
Other operating income/expense, net | | 2 | | 0 | | 2 | | | | | | 1 | | 0 | | 1 | | 97 | | 97 | | | |
Total operating expenses | | –4,784 | | 496 | | –4,289 | | –67 | | –4,356 | | –4,276 | | 323 | | –3,953 | | 12 | | 9 | | 10 | |
| | | | | | | | | | | | | | | | | | | | | | | |
Profit Numbers | | | | | | | | | | | | | | | | | | | | | | | |
Operating profit | | 1,236 | | 506 | | 1,742 | | 69 | | 1,811 | | 1,314 | | 323 | | 1,637 | | –6 | | 6 | | 11 | |
Other non-operating income/expense, net | | 33 | | 0 | | 33 | | | | | | 4 | | 0 | | 4 | | >100 | | >100 | | | |
Finance income | | 84 | | 0 | | 84 | | | | | | 130 | | 0 | | 130 | | –36 | | –36 | | | |
Finance costs | | –74 | | 0 | | –74 | | | | | | –58 | | 0 | | –58 | | 28 | | 28 | | | |
Financial income, net | | 10 | | 0 | | 10 | | | | | | 73 | | 0 | | 73 | | –87 | | –87 | | | |
Profit before tax | | 1,278 | | 506 | | 1,784 | | | | | | 1,390 | | 323 | | 1,714 | | –8 | | 4 | | | |
Income tax expense | | –304 | | –119 | | –424 | | | | | | –398 | | –102 | | –500 | | –24 | | –15 | | | |
Profit after tax | | 974 | | 387 | | 1,360 | | | | | | 993 | | 221 | | 1,214 | | –2 | | 12 | | | |
Attributable to owners of parent | | 973 | | 387 | | 1,360 | | | | | | 983 | | 221 | | 1,204 | | –1 | | 13 | | | |
Attributable to non-controlling interests | | 1 | | 0 | | 1 | | | | | | 9 | | 0 | | 9 | | –94 | | –94 | | | |
| | | | | | | | | | | | | | | | | | | | | | | |
Key Ratios | | | | | | | | | | | | | | | | | | | | | | | |
Operating margin (in %) | | 20.5 | | | | 28.9 | | | | 29.4 | | 23.5 | | | | 29.3 | | –3.0pp | | –0.4pp | | 0.1pp | |
Effective tax rate (in %)3) | | 23.8 | | | | 23.7 | | | | | | 28.6 | | | | 29.2 | | –4.8pp | | –5.4pp | | | |
Earnings per share, basic (in €) | | 0.82 | | | | 1.14 | | | | | | 0.82 | | | | 1.01 | | –1 | | 13 | | | |
1) Adjustments in the revenue line items are for software support revenue, cloud subscriptions and support revenue, and other similarly recurring revenues that entities acquired by SAP would have recognized had they remained stand-alone entities but that SAP is not permitted to recognize as revenue under IFRS as a result of business combination accounting rules. Adjustments in the operating expense line items are for acquisition-related charges, share-based payment expenses, as well as restructuring expenses.
2) Constant currency revenue and operating income figures are calculated by translating revenue and operating income of the current period using the average exchange rates from the previous year’s respective period instead of the current period. Constant currency period-over-period changes are calculated by comparing the current year’s non-IFRS constant currency numbers with the non-IFRS number of the previous year’s respective period.
For a more detailed description of these adjustments and their limitations as well as our constant currency figures, see Explanation of Non-IFRS Measures.
SAP Q3 2018 Quarterly Statement | 22 |
3) The difference between our effective tax rate (IFRS) and effective tax rate (non-IFRS) in Q3 2018 and Q3 2017 mainly results from tax effects of acquisition-related charges and share-based payment expenses.
Due to rounding, numbers may not add up precisely.
SAP Q3 2018 Quarterly Statement | 23 |
Reconciliation from Non-IFRS Numbers to IFRS Numbers –
Year-to-Date
€ millions, unless otherwise stated | | Q1–Q3 2018 | | Q1–Q3 2017 | | ∆ in % | |
| | IFRS | | Adj.1) | | Non-
IFRS1) | | Currency
Impact2) | | Non-IFRS
Constant
Currency2) | | IFRS | | Adj.1) | | Non-
IFRS1) | | IFRS | | Non-
IFRS1) | | Non-IFRS
Constant
Currency2) | |
Revenue Numbers | | | | | | | | | | | | | | | | | | | | | | | |
Cloud subscriptions and support | | 3,588 | | 26 | | 3,614 | | 196 | | 3,810 | | 2,775 | | 0 | | 2,775 | | 29 | | 30 | | 37 | |
Software licenses | | 2,558 | | 0 | | 2,558 | | 94 | | 2,653 | | 2,814 | | 0 | | 2,814 | | –9 | | –9 | | –6 | |
Software support | | 8,156 | | 0 | | 8,156 | | 490 | | 8,646 | | 8,154 | | 0 | | 8,154 | | 0 | | 0 | | 6 | |
Software licenses and support | | 10,714 | | 0 | | 10,715 | | 584 | | 11,299 | | 10,968 | | 0 | | 10,968 | | –2 | | –2 | | 3 | |
Cloud and software | | 14,302 | | 27 | | 14,329 | | 781 | | 15,109 | | 13,742 | | 1 | | 13,743 | | 4 | | 4 | | 10 | |
Services | | 2,978 | | 0 | | 2,978 | | 201 | | 3,179 | | 2,914 | | 0 | | 2,914 | | 2 | | 2 | | 9 | |
Total revenue | | 17,280 | | 27 | | 17,307 | | 981 | | 18,288 | | 16,656 | | 1 | | 16,657 | | 4 | | 4 | | 10 | |
| | | | | | | | | | | | | | | | | | | | | | | |
Operating Expense Numbers | | | | | | | | | | | | | | | | | | | | | | | |
Cost of cloud subscriptions and support | | –1,481 | | 161 | | –1,320 | | | | | | –1,216 | | 178 | | –1,039 | | 22 | | 27 | | | |
Cost of software licenses and support | | –1,518 | | 112 | | –1,406 | | | | | | –1,646 | | 151 | | –1,495 | | –8 | | –6 | | | |
Cost of cloud and software | | –2,999 | | 273 | | –2,726 | | | | | | –2,862 | | 329 | | –2,533 | | 5 | | 8 | | | |
Cost of services | | –2,451 | | 145 | | –2,306 | | | | | | –2,366 | | 126 | | –2,240 | | 4 | | 3 | | | |
Total cost of revenue | | –5,450 | | 417 | | –5,032 | | | | | | –5,228 | | 455 | | –4,773 | | 4 | | 5 | | | |
Gross profit | | 11,831 | | 444 | | 12,275 | | | | | | 11,428 | | 455 | | 11,884 | | 4 | | 3 | | | |
Research and development | | –2,680 | | 217 | | –2,462 | | | | | | –2,475 | | 216 | | –2,258 | | 8 | | 9 | | | |
Sales and marketing | | –4,986 | | 520 | | –4,466 | | | | | | –5,055 | | 536 | | –4,519 | | –1 | | –1 | | | |
General and administration | | –832 | | 106 | | –725 | | | | | | –820 | | 109 | | –710 | | 1 | | 2 | | | |
Restructuring | | –26 | | 26 | | 0 | | | | | | –174 | | 174 | | 0 | | –85 | | NA | | | |
Other operating income/expense, net | | –3 | | 0 | | –3 | | | | | | 9 | | 0 | | 9 | | <-100 | | <-100 | | | |
Total operating expenses | | –13,976 | | 1,286 | | –12,690 | | –666 | | –13,356 | | –13,743 | | 1,491 | | –12,252 | | 2 | | 4 | | 9 | |
| | | | | | | | | | | | | | | | | | | | | | | |
Profit Numbers | | | | | | | | | | | | | | | | | | | | | | | |
Operating profit | | 3,304 | | 1,313 | | 4,618 | | 315 | | 4,933 | | 2,913 | | 1,492 | | 4,405 | | 13 | | 5 | | 12 | |
Other non-operating income/expense, net | | –58 | | 0 | | –58 | | | | | | –6 | | 0 | | –6 | | >100 | | >100 | | | |
Finance income | | 269 | | 0 | | 269 | | | | | | 273 | | 0 | | 273 | | –2 | | –2 | | | |
Finance costs | | –218 | | 0 | | –218 | | | | | | –213 | | 0 | | –213 | | 2 | | 2 | | | |
Financial income, net | | 50 | | 0 | | 50 | | | | | | 59 | | 0 | | 59 | | –15 | | –15 | | | |
Profit before tax | | 3,297 | | 1,313 | | 4,610 | | | | | | 2,966 | | 1,492 | | 4,458 | | 11 | | 3 | | | |
Income tax expense | | –895 | | –313 | | –1,209 | | | | | | –777 | | –461 | | –1,238 | | 15 | | –2 | | | |
Profit after tax | | 2,401 | | 1,000 | | 3,401 | | | | | | 2,189 | | 1,031 | | 3,220 | | 10 | | 6 | | | |
Attributable to owners of parent | | 2,400 | | 1,000 | | 3,400 | | | | | | 2,172 | | 1,031 | | 3,203 | | 10 | | 6 | | | |
Attributable to non-controlling interests | | 1 | | 0 | | 1 | | | | | | 17 | | 0 | | 17 | | –94 | | –94 | | | |
| | | | | | | | | | | | | | | | | | | | | | | |
Key Ratios | | | | | | | | | | | | | | | | | | | | | | | |
Operating margin (in %) | | 19.1 | | | | 26.7 | | | | 27.0 | | 17.5 | | | | 26.4 | | 1.6pp | | 0.2pp | | 0.5pp | |
Effective tax rate (in %)3) | | 27.2 | | | | 26.2 | | | | | | 26.2 | | | | 27.8 | | 1.0pp | | –1.6pp | | | |
Earnings per share, basic (in €) | | 2.01 | | | | 2.85 | | | | | | 1.81 | | | | 2.67 | | 11 | | 7 | | | |
1) Adjustments in the revenue line items are for software support revenue, cloud subscriptions and support revenue, and other similarly recurring revenues that entities acquired by SAP would have recognized had they remained stand-alone entities but that SAP is not permitted to recognize as revenue under IFRS as a result of business combination accounting rules. Adjustments in the operating expense line items are for acquisition-related charges, share-based payment expenses, as well as restructuring expenses.
SAP Q3 2018 Quarterly Statement | 24 |
2) Constant currency revenue and operating income figures are calculated by translating revenue and operating income of the current period using the average exchange rates from the previous year’s respective period instead of the current period. Constant currency period-over-period changes are calculated by comparing the current year’s non-IFRS constant currency numbers with the non-IFRS number of the previous year’s respective period.
For a more detailed description of these adjustments and their limitations as well as our constant currency figures, see Explanation of Non-IFRS Measures.
3) The difference between our effective tax rate (IFRS) and effective tax rate (non-IFRS) in the first nine months of 2018 and 2017 mainly results from tax effects of acquisition-related charges and share-based payment expenses.
Due to rounding, numbers may not add up precisely.
SAP Q3 2018 Quarterly Statement | 25 |
Non-IFRS Adjustments – Actuals and Estimates
| | | | | | | | | | |
€ millions | | Estimated Amounts for
Full Year 2018 | | Q1–Q3 2018 | | Q3 2018 | | Q1–Q3
2017 | | Q3 2017 |
Operating profit (IFRS) | | | | 3,304 | | 1,236 | | 2,913 | | 1,314 |
Revenue adjustments | | 30–60 | | 27 | | 11 | | 1 | | 0 |
Adjustment for acquisition-related charges | | 550–610 | | 422 | | 144 | | 449 | | 140 |
Adjustment for share-based payment expenses | | 800–1,100 | | 838 | | 347 | | 868 | | 250 |
Adjustment for restructuring | | 25–35 | | 26 | | 4 | | 174 | | –67 |
Operating expense adjustments | | | | 1,286 | | 496 | | 1,491 | | 323 |
Operating profit adjustments | | | | 1,313 | | 506 | | 1,492 | | 323 |
Operating profit (non-IFRS) | | | | 4,618 | | 1,742 | | 4,405 | | 1,637 |
Non-IFRS Adjustments by Functional Areas
€ millions | | Q3 2018 | | Q3 2017 |
| | IFRS | | Acqui-
sition-
Related | | SBP1) | | Restruc-
turing | | Non-IFRS | | IFRS | | Acqui-
sition-
Related | | SBP1) | | Restruc-turing | | Non-IFRS |
Cost of cloud and software | | –1,057 | | 69 | | 32 | | 0 | | –956 | | –935 | | 72 | | 24 | | 0 | | –839 |
Cost of services | | –851 | | 2 | | 57 | | 0 | | –792 | | –738 | | 2 | | 39 | | 0 | | –697 |
Research and development | | –918 | | 2 | | 89 | | 0 | | –828 | | –781 | | 3 | | 61 | | 0 | | –717 |
Sales and marketing | | –1,673 | | 71 | | 130 | | 0 | | –1,471 | | –1,640 | | 62 | | 100 | | 0 | | –1,478 |
General and administration | | –284 | | 1 | | 38 | | 0 | | –245 | | –251 | | 1 | | 26 | | 0 | | –223 |
Restructuring | | –4 | | 0 | | 0 | | 4 | | 0 | | 67 | | 0 | | 0 | | –67 | | 0 |
Other operating income/expense, net | | 2 | | 0 | | 0 | | 0 | | 2 | | 1 | | 0 | | 0 | | 0 | | 1 |
Total operating expenses | | –4,784 | | 144 | | 347 | | 4 | | –4,289 | | –4,276 | | 140 | | 250 | | –67 | | –3,953 |
1) Share-based payments
| | | | |
€ millions | | Q1–Q3 2018 | | Q1–Q3 2017 |
| | IFRS | | Acqui-
sition-
Related | | SBP1) | | Restruc-
turing | | Non-IFRS | | IFRS | | Acqui-
sition-
Related | | SBP1) | | Restruc-turing | | Non-IFRS |
Cost of cloud and software | | –2,999 | | 195 | | 78 | | 0 | | –2,726 | | –2,862 | | 236 | | 92 | | 0 | | –2,533 |
Cost of services | | –2,451 | | 7 | | 138 | | 0 | | –2,306 | | –2,366 | | 6 | | 120 | | 0 | | –2,240 |
Research and development | | –2,680 | | 5 | | 212 | | 0 | | –2,462 | | –2,475 | | 8 | | 208 | | 0 | | –2,258 |
Sales and marketing | | –4,986 | | 205 | | 315 | | 0 | | –4,466 | | –5,055 | | 196 | | 340 | | 0 | | –4,519 |
General and administration | | –832 | | 11 | | 96 | | 0 | | –725 | | –820 | | 2 | | 107 | | 0 | | –710 |
Restructuring | | –26 | | 0 | | 0 | | 26 | | 0 | | –174 | | 0 | | 0 | | 174 | | 0 |
Other operating income/expense, net | | –3 | | 0 | | 0 | | 0 | | –3 | | 9 | | 0 | | 0 | | 0 | | 9 |
Total operating expenses | | –13,976 | | 422 | | 838 | | 26 | | –12,690 | | –13,743 | | 449 | | 868 | | 174 | | –12,252 |
1) Share-based payments
Due to rounding, numbers may not add up precisely.
SAP Q3 2018 Quarterly Statement | 26 |
If not presented in a separate line item in our income statement, the restructuring expenses would break down as follows:
€ millions | | Q3 2018 | | Q1–Q3 2018 | | Q3 2017 | | Q1–Q3 2017 |
Cost of cloud and software | | –1 | | –3 | | 50 | | –55 |
Cost of services | | –1 | | –9 | | 3 | | –107 |
Research and development | | –2 | | –3 | | 7 | | –10 |
Sales and marketing | | –1 | | –10 | | 7 | | –2 |
General and administration | | 0 | | 0 | | 0 | | 0 |
Restructuring expenses | | –4 | | –26 | | 67 | | –174 |
Due to rounding, numbers may not add up precisely.
SAP Q3 2018 Quarterly Statement | 27 |
Revenue by Region (IFRS and Non-IFRS) – Quarter
€ millions | | | | | | | | | | Q3 2018 | | | | | | Q3 2017 | | | | | | ∆ in % |
| | IFRS | | Adj.1) | | Non-
IFRS1) | | Currency
Impact2) | | Non-IFRS
Constant
Currency2) | | IFRS | | Adj.1) | | Non-IFRS1) | | IFRS | | Non-IFRS1) | | Non-IFRS
Constant
Currency2) |
Cloud subscriptions and support revenue by region | | | | | | | | | | | | | | |
| | | | | | | | | | | | | | | | | | | | | | |
EMEA | | 363 | | 0 | | 363 | | 0 | | 364 | | 259 | | 0 | | 259 | | 40 | | 40 | | 40 |
Americas | | 784 | | 10 | | 795 | | 1 | | 796 | | 576 | | 0 | | 576 | | 36 | | 38 | | 38 |
APJ | | 157 | | 0 | | 157 | | 5 | | 161 | | 102 | | 0 | | 102 | | 53 | | 53 | | 58 |
Cloud subscriptions and support revenue | | 1,304 | | 10 | | 1,315 | | 6 | | 1,321 | | 937 | | 0 | | 938 | | 39 | | 40 | | 41 |
| | | | | | | | | | | | | | | | | | | | | | |
Cloud and software revenue by region | | | | | | | | | | | | | | | | | | |
EMEA | | 2,186 | | 0 | | 2,186 | | 16 | | 2,202 | | 2,099 | | 0 | | 2,099 | | 4 | | 4 | | 5 |
Americas | | 2,008 | | 10 | | 2,019 | | 72 | | 2,091 | | 1,849 | | 0 | | 1,849 | | 9 | | 9 | | 13 |
APJ | | 813 | | 0 | | 813 | | 17 | | 830 | | 709 | | 0 | | 709 | | 15 | | 15 | | 17 |
Cloud and software revenue | | 5,007 | | 11 | | 5,017 | | 105 | | 5,122 | | 4,657 | | 0 | | 4,658 | | 7 | | 8 | | 10 |
| | | | | | | | | | | | | | | | | | | | | | |
Total revenue by region | | | | | | | | | | | | | | | | | | | | | | |
| | | | | | | | | | | | | | | | | | | | | | |
Germany | | 902 | | 0 | | 902 | | 0 | | 901 | | 857 | | 0 | | 857 | | 5 | | 5 | | 5 |
Rest of EMEA | | 1,714 | | 0 | | 1,714 | | 19 | | 1,733 | | 1,636 | | 0 | | 1,637 | | 5 | | 5 | | 6 |
Total EMEA | | 2,616 | | 0 | | 2,616 | | 19 | | 2,634 | | 2,494 | | 0 | | 2,494 | | 5 | | 5 | | 6 |
United States | | 2,005 | | 10 | | 2,015 | | –22 | | 1,994 | | 1,800 | | 0 | | 1,800 | | 11 | | 12 | | 11 |
Rest of Americas | | 439 | | 0 | | 439 | | 119 | | 558 | | 447 | | 0 | | 447 | | –2 | | –2 | | 25 |
Total Americas | | 2,444 | | 10 | | 2,454 | | 97 | | 2,551 | | 2,247 | | 0 | | 2,247 | | 9 | | 9 | | 14 |
Japan | | 240 | | 0 | | 240 | | –2 | | 239 | | 198 | | 0 | | 198 | | 21 | | 21 | | 21 |
Rest of APJ | | 721 | | 0 | | 721 | | 21 | | 742 | | 651 | | 0 | | 651 | | 11 | | 11 | | 14 |
Total APJ | | 961 | | 0 | | 961 | | 20 | | 981 | | 849 | | 0 | | 849 | | 13 | | 13 | | 16 |
Total revenue | | 6,020 | | 11 | | 6,031 | | 136 | | 6,167 | | 5,590 | | 0 | | 5,590 | | 8 | | 8 | | 10 |
1) Adjustments in the revenue line items are for support revenue, cloud subscriptions and support revenue, and other similarly recurring revenues that entities acquired by SAP would have recognized had they remained stand-alone entities but that SAP is not permitted to recognize as revenue under IFRS as a result of business combination accounting rules.
2) Constant currency revenue figures are calculated by translating revenue of the current period using the average exchange rates from the previous year’s respective period instead of the current period. Constant currency period-over-period changes are calculated by comparing the current year’s non-IFRS constant currency numbers with the non-IFRS number of the previous year’s respective period.
For a more detailed description of these adjustments and their limitations as well as our constant currency figures, see Explanation of Non-IFRS Measures.
Due to rounding, numbers may not add up precisely.
SAP Q3 2018 Quarterly Statement | 28 |
Revenue by Region (IFRS and Non-IFRS) – Year-to-Date
€ millions | | | | | | | | | | Q1–Q3 2018 | | | | | Q1–Q3 2017 | | | | | | ∆ in % |
| | IFRS | | Adj.1) | | Non-
IFRS1) | | Currency
Impact2) | | Non-IFRS
Constant
Currency2) | | IFRS | | Adj.1) | | Non-IFRS1) | | IFRS | | Non-IFRS1) | | Non-IFRS
Constant
Currency2) |
Cloud subscriptions and support revenue by region | | | | | | | | | | | | | | |
| | | | | | | | | | | | | | | | | | | | | | |
EMEA | | 1,034 | | 0 | | 1,034 | | 27 | | 1,061 | | 738 | | 0 | | 738 | | 40 | | 40 | | 44 |
Americas | | 2,117 | | 26 | | 2,143 | | 141 | | 2,284 | | 1,735 | | 0 | | 1,735 | | 22 | | 24 | | 32 |
APJ | | 436 | | 0 | | 436 | | 29 | | 465 | | 302 | | 0 | | 302 | | 45 | | 45 | | 54 |
Cloud subscriptions and support revenue | | 3,588 | | 26 | | 3,614 | | 196 | | 3,810 | | 2,775 | | 0 | | 2,775 | | 29 | | 30 | | 37 |
| | | | | | | | | | | | | | | | | | | | | | |
Cloud and software revenue by region | | | | | | | | | | | | | | | | | | |
EMEA | | 6,393 | | 0 | | 6,393 | | 114 | | 6,507 | | 5,992 | | 0 | | 5,992 | | 7 | | 7 | | 9 |
Americas | | 5,594 | | 27 | | 5,620 | | 534 | | 6,155 | | 5,572 | | 1 | | 5,573 | | 0 | | 1 | | 10 |
APJ | | 2,315 | | 0 | | 2,315 | | 132 | | 2,447 | | 2,178 | | 0 | | 2,178 | | 6 | | 6 | | 12 |
Cloud and software revenue | | 14,302 | | 27 | | 14,329 | | 781 | | 15,109 | | 13,742 | | 1 | | 13,743 | | 4 | | 4 | | 10 |
| | | | | | | | | | | | | | | | | | | | | | |
Total revenue by region | | | | | | | | | | | | | | | | | | | | | | |
| | | | | | | | | | | | | | | | | | | | | | |
Germany | | 2,519 | | 0 | | 2,519 | | 2 | | 2,521 | | 2,312 | | 0 | | 2,312 | | 9 | | 9 | | 9 |
Rest of EMEA | | 5,159 | | 0 | | 5,159 | | 136 | | 5,295 | | 4,886 | | 0 | | 4,886 | | 6 | | 6 | | 8 |
Total EMEA | | 7,678 | | 0 | | 7,678 | | 138 | | 7,816 | | 7,198 | | 0 | | 7,199 | | 7 | | 7 | | 9 |
United States | | 5,578 | | 27 | | 5,604 | | 365 | | 5,970 | | 5,488 | | 1 | | 5,488 | | 2 | | 2 | | 9 |
Rest of Americas | | 1,290 | | 0 | | 1,290 | | 321 | | 1,611 | | 1,358 | | 0 | | 1,358 | | –5 | | –5 | | 19 |
Total Americas | | 6,867 | | 27 | | 6,894 | | 687 | | 7,581 | | 6,846 | | 1 | | 6,847 | | 0 | | 1 | | 11 |
Japan | | 683 | | 0 | | 683 | | 36 | | 719 | | 647 | | 0 | | 647 | | 6 | | 6 | | 11 |
Rest of APJ | | 2,052 | | 0 | | 2,052 | | 120 | | 2,173 | | 1,964 | | 0 | | 1,964 | | 4 | | 4 | | 11 |
Total APJ | | 2,735 | | 0 | | 2,735 | | 156 | | 2,891 | | 2,612 | | 0 | | 2,612 | | 5 | | 5 | | 11 |
Total revenue | | 17,280 | | 27 | | 17,307 | | 981 | | 18,288 | | 16,656 | | 1 | | 16,657 | | 4 | | 4 | | 10 |
1) Adjustments in the revenue line items are for support revenue, cloud subscriptions and support revenue, and other similarly recurring revenues that entities acquired by SAP would have recognized had they remained stand-alone entities but that SAP is not permitted to recognize as revenue under IFRS as a result of business combination accounting rules.
2) Constant currency revenue figures are calculated by translating revenue of the current period using the average exchange rates from the previous year’s respective period instead of the current period. Constant currency period-over-period changes are calculated by comparing the current year’s non-IFRS constant currency numbers with the non-IFRS number of the previous year’s respective period.
For a more detailed description of these adjustments and their limitations as well as our constant currency figures, see Explanation of Non-IFRS Measures.
Due to rounding, numbers may not add up precisely.
SAP Q3 2018 Quarterly Statement | 29 |
Employees by Region and Functional Areas
Full-time equivalents | | | | | | | | 9/30/2018 | | | | | | | | 9/30/2017 |
| | EMEA | | Americas | | APJ | | Total | | EMEA | | Americas | | APJ | | Total |
Cloud and software | | 6,237 | | 4,109 | | 5,183 | | 15,529 | | 5,760 | | 3,839 | | 4,707 | | 14,306 |
Services | | 8,097 | | 5,682 | | 5,491 | | 19,270 | | 7,407 | | 4,792 | | 4,751 | | 16,951 |
Research and development | | 12,113 | | 5,616 | | 8,787 | | 26,516 | | 11,199 | | 5,240 | | 8,386 | | 24,826 |
Sales and marketing | | 9,839 | | 9,532 | | 5,008 | | 24,379 | | 9,199 | | 9,118 | | 4,889 | | 23,206 |
General and administration | | 2,784 | | 1,916 | | 1,098 | | 5,798 | | 2,706 | | 1,801 | | 1,041 | | 5,548 |
Infrastructure | | 2,010 | | 931 | | 555 | | 3,496 | | 1,688 | | 852 | | 498 | | 3,038 |
SAP Group (9/30) | | 41,080 | | 27,786 | | 26,123 | | 94,989 | | 37,960 | | 25,642 | | 24,272 | | 87,874 |
Thereof acquisitions1) | | 638 | | 952 | | 434 | | 2,024 | | 4 | | 13 | | 0 | | 17 |
SAP Group (nine months’ end average) | | 40,077 | | 27,274 | | 25,493 | | 92,844 | | 37,250 | | 25,359 | | 23,925 | | 86,534 |
1) Acquisitions closed between January 1 and September 30 of the respective year
SAP Q3 2018 Quarterly Statement | 30 |
Accounting Policy Disclosures
Adoption of IFRS 15
As of January 1, 2018, SAP changed several of its accounting policies to adopt IFRS 15 ‘Revenue from Contracts with Customers’. Under the IFRS 15 adoption method chosen by SAP, prior years (including the prior-period numbers presented in the primary financial statements in this quarterly statement) are not restated to conform to the new policies.
The impact of the policy change6 in the third quarter (first nine months) of 2018 was as follows:
– Software licenses and support revenues experienced a benefit of €26 million (€49 million), with most of the difference resulting from:
§ exercises of customer software purchase options granted in prior years which result in software revenue, as well as;
§ revised recognition pattern for one single on-premise software subscription contract which includes an obligation to deliver, in the future, unspecified software products.
Together with other offsetting effects this resulted in a benefit of €24 million (€40 million) on total revenue.
– Operating expenses benefitted, in cost of sales and marketing, in the amount of €44 million (€127 million) from higher capitalization of sales commissions net of higher amortization of amounts capitalized.
– The abovementioned effects together with other insignificant effects resulted in a net positive impact on operating profit of approximately €74 million (€172 million).
Per September 30, 2018, balance sheet line items are affected by the application of IFRS 15 as compared to our pre-IFRS 15 accounting policies as follows:
– Non-current and current other non-financial assets were higher by €240 million and €48 million, respectively (January 1, 2018: higher by €132 million and €26 million, respectively) due to the higher capitalization of sales commissions.
– Trade and other receivables and contract liabilities were lower by €658 million and €595 million, respectively (January 1, 2018: higher by €560 million and €652 million, respectively), resulting from changes in the timing of and amounts recognized as contract balances.
– Provisions were lower by €13 million (January 1, 2018: lower by €25 million), reflecting lower provisions for onerous customer contracts.
– Intangible Assets were higher by €32 million (January 1, 2018: higher by €14 million), due to capitalization of costs for certain customer-specific on-premise software development arrangements.
Adoption of IFRS 9
As of January 1, 2018, SAP changed several of its accounting policies to adopt IFRS 9 ‘Financial Instruments’. Under the IFRS 9 adoption method chosen by SAP, prior years are not restated to conform to the new policies.
The impact of the policy change as of January 1, 2018 was as follows:
– Trade receivables are lower by €25 million resulting from the application of the expected credit loss model.
– OCI is lower by €157 million resulting from the reclassification of amounts attributable to available-for-sale financial assets accumulated in OCI so far to opening retained earnings.
Please also refer to Note (3e) of our Integrated Report 2017 for further qualitative explanations of the changes in accounting policies as a result of the adoption of IFRS 9 and IFRS 15.
6 “Impact of the policy change” means the difference between a measure determined under SAP’s new IFRS 15-based policies and the respective measure as it would stand had our previous accounting policies continued to apply.
SAP Q3 2018 Quarterly Statement | 31 |
Foreign Currencies
We apply hyperinflation accounting for our subsidiary in Venezuela, by restating the financial statements of this subsidiary for the current period to account for changes in the general purchasing power of the local currency based on relevant price indices at the reporting date. The restated financial statements of our subsidiary in Venezuela are translated at closing rates. Most significantly impacted by this accounting are:
– Total revenue (decrease of €16 million and €5 million in the third quarter and the nine months of 2018 respectively),
– Operating profit (decrease of €14 million and €5 million in the third quarter and the nine months of 2018 respectively),
– Other non-operating income/expense (gain of €49 million and loss of €3 million in the third quarter and the nine months of 2018 respectively),
– Equity (retained earnings and other comprehensive income) (increase of €15 million as at 9/30/2018),
– Contract liabilities (decrease of €15 million as at 9/30/2018).
SAP Q3 2018 Quarterly Statement | 32 |