Exhibit 99.1

About This Report
Content
The SAP Integrated Report 2019 presents our full-year financial, social, and environmental performance in one integrated report (“SAP Integrated Report”) available at www.sapintegratedreport.com. Since 2012, we have taken into consideration the recommendations of the International Integrated Reporting Framework.
The SAP Integrated Report also serves as our United Nations (UN) Global Compact progress report. Since 2018, we have also reported on our contribution to the UN Sustainable Development Goals (SDGs).
Basis of Presentation
Our combined management report is prepared in accordance with sections 289, 289a, 289f, 315, 315a, and 315d of the German Commercial Code and German Accounting Standards No. 17 and 20. The combined management report is also a management commentary complying with the International Financial Reporting Standards (IFRS) Practice Statement Management Commentary.
Our consolidated financial statements are prepared in accordance with IFRS. Our executive management has confirmed the effectiveness of our internal controls over financial reporting.
Our non-financial report is prepared in accordance with sections 289b and 315b of the German Commercial Code, which require us to report, for both, SAP SE and SAP Group, on social, environmental, and other non-financial matters. All non-financial information stipulated in the German Commercial Code, sections 315c and 289c that is relevant to understand SAP’s development, performance of the business, and the position of the Group and SAP SE is included in our combined management report. Rather than repeating this information, our Non-Financial Report (which is part of this integrated report at http://www.sap.com/investors/sap-2019-combined-non-financial-report) provides references to the sections of our combined management report in which the required disclosures are made.
The social and environmental data and information included in the SAP Integrated Report is prepared in accordance with the GRI Standards: Core option. This GRI option indicates that a report contains the minimum information needed to understand the nature of the organization, its material topics and related impacts, and how these are managed. We apply the GRI principles (sustainability context, stakeholder inclusiveness, materiality, and completeness) for defining report content. We also report on SDGs identified as material.
Greenhouse gas data is prepared based on the Greenhouse Gas Protocol.
Data
All financial and non-financial data and information for the reporting period is reported utilizing SAP software solutions and sourced from the responsible business units.
The reporting period is fiscal year 2019. The report encompasses SAP SE and all subsidiaries of the SAP Group. To make this report as current as possible, we have included relevant information available up to the auditor’s opinion dated February 19, 2020. The report is available in English and German.
Independent Audit and Assurance
KPMG AG Wirtschaftsprüfungsgesellschaft has audited our consolidated financial statements and our combined management report (including the information to which our non-financial report makes references). Additionally, KPMG has provided assurance on selected sustainability information in accordance with the International Standard on Assurance Engagements (ISAE) 3000, a pertinent standard for the assurance of sustainability reporting. Both the Independent Auditor’s Report and the Assurance Report of the Independent Auditor for sustainability information are available in the Independent Auditor’s Report section and the Independent Assurance Report section.
Concept and Realization
This report was designed by SAP and created with SAP S/4HANA software and the SAP Disclosure Management application.
Key Facts
€ millions, unless otherwise stated | | 2019 | | 2018 | | D in % |
Revenues | | | | | | |
Cloud (IFRS) | | 6,933 | | 4,993 | | 39 |
Cloud (non-IFRS) | | 7,013 | | 5,027 | | 40 |
Software licenses (IFRS) | | 4,533 | | 4,647 | | –2 |
Software licenses (non-IFRS) | | 4,533 | | 4,647 | | –2 |
Software support (IFRS) | | 11,547 | | 10,981 | | 5 |
Software support (non-IFRS) | | 11,548 | | 10,982 | | 5 |
Cloud and software (IFRS) | | 23,012 | | 20,622 | | 12 |
Cloud and software (non-IFRS) | | 23,093 | | 20,655 | | 12 |
Total revenue (IFRS) | | 27,553 | | 24,708 | | 12 |
Total revenue (non-IFRS) | | 27,634 | | 24,741 | | 12 |
Applications, Technology & Services Segment revenue | | 23,544 | | 21,753 | | 8 |
Intelligent Spend Group Segment revenue | | 3,184 | | 2,629 | | 21 |
Qualtrics Segment revenue | | 508 | | NA | | NA |
Share of more predictable revenue (IFRS, in %) | | 67 | | 65 | | 4 |
Share of more predictable revenue (non-IFRS, in %) | | 67 | | 65 | | 4 |
| | | | | | |
Operating Expenses | | | | | | |
Cost of cloud (IFRS) | | –2,534 | | –2,068 | | 22 |
Cost of cloud (non-IFRS) | | –2,228 | | –1,855 | | 20 |
Cost of software licenses and support (IFRS) | | –2,159 | | –2,092 | | 3 |
Cost of software licenses and support (non-IFRS) | | –2,018 | | –1,962 | | 3 |
Cost of cloud and software (IFRS) | | –4,692 | | –4,160 | | 13 |
Cost of cloud and software (non-IFRS) | | –4,247 | | –3,817 | | 11 |
Total cost of revenue (IFRS) | | –8,355 | | –7,462 | | 12 |
Total cost of revenue (non-IFRS) | | –7,655 | | –6,969 | | 10 |
Research and development (IFRS) | | –4,292 | | –3,624 | | 18 |
| | | | | | |
Profits and Margins | | | | | | |
Cloud gross margin (in % of corresponding revenue, IFRS) | | 63.5 | | 58.6 | | 8 |
Cloud gross margin (in % of corresponding revenue, non-IFRS) | | 68.2 | | 63.1 | | 8 |
Software and support gross margin (IFRS, in %) | | 86.6 | | 86.6 | | 0 |
Software and support gross margin (non-IFRS, in %) | | 87.4 | | 87.4 | | 0 |
Cloud and software gross margin (in % of corresponding revenue, IFRS) | | 79.6 | | 79.8 | | 0 |
Cloud and software gross margin (in % of corresponding revenue, non-IFRS) | | 81.6 | | 81.5 | | 0 |
Gross margin (in % of total revenue, IFRS) | | 69.7 | | 69.8 | | 0 |
Gross margin (in % of total revenue, non-IFRS) | | 72.3 | | 71.8 | | 1 |
Applications, Technology & Services Segment gross margin (in % of corresponding revenue) | | 74 | | 73 | | 1 |
Intelligent Spend Group Segment gross margin (in % of corresponding revenue) | | 70 | | 69 | | 1 |
Qualtrics Segment gross margin (in % of corresponding revenue) | | 78 | | NA | | NA |
Operating profit (IFRS) | | 4,473 | | 5,703 | | –22 |
Operating profit (non-IFRS) | | 8,208 | | 7,163 | | 15 |
Operating margin (in % of total revenue, IFRS) | | 16.2 | | 23.1 | | –30 |
Operating margin (in % of total revenue, non-IFRS) | | 29.7 | | 29.0 | | 3 |
Free cash flow | | 2,276 | | 2,844 | | –20 |
€ millions, unless otherwise stated | | 2019 | | 2018 | | D in % |
Net liquidity (net debt) | | –8,286 | | –2,493 | | 232 |
Days sales outstanding (DSO, in days) | | 71 | | 70 | | 1 |
Equity ratio (total equity in % of total assets) | | 51 | | 56 | | –9 |
Effective tax rate (IFRS, in %) | | 26.7 | | 27.0 | | –1 |
Effective tax rate (non-IFRS, in %) | | 26.2 | | 26.3 | | –1 |
| | | | | | |
Order Entry | | | | | | |
New cloud bookings | | 2,268 | | 1,814 | | 25 |
Contract liabilities/Deferred income – current (IFRS)1) | | 4,266 | | 3,028 | | 41 |
Orders – number of on-premise software deals (in transactions) | | 52,584 | | 58,530 | | –10 |
Share of software orders greater than €5 million (in % of total software order entry) | | 32 | | 29 | | 10 |
Share of software orders less than €1 million (in % of total software order entry) | | 35 | | 39 | | –10 |
| | | | | | |
Key SAP Stock Facts | | | | | | |
Earnings per share, basic (in €) | | 2.78 | | 3.42 | | –19 |
Earnings per share, basic (non-IFRS, in €) | | 5.11 | | 4.35 | | 17 |
Dividend per share2) (in €) | | 1.58 | | 1.50 | | 5 |
Market capitalization1) (in € billions) | | 147.81 | | 106.80 | | 38 |
| | | | | | |
Employees and Personnel Expenses | | | | | | |
Number of employees1), 3) | | 100,330 | | 96,498 | | 4 |
Personnel expenses per employee – excluding share-based payments (in € thousands) | | 131 | | 115 | | 14 |
Women working at SAP (in %) | | 33.5 | | 33.0 | | 0 |
Women in management1) (total, in % of total number of employees) | | 26.4 | | 25.7 | | 3 |
Employee Engagement Index (in %) | | 83 | | 84 | | –1 |
Business Health Culture Index (in %) | | 80 | | 78 | | 3 |
Leadership Trust Index (LTI, as NPS) | | 59 | | 60 | | –2 |
Employee retention (in %) | | 93.3 | | 93.9 | | –1 |
| | | | | | |
Customer | | | | | | |
Customer Net Promoter Score4) | | –6.0 | | –5.0 | | 20 |
| | | | | | |
Environment | | | | | | |
Net greenhouse gas emissions (in kilotons) | | 300 | | 310 | | –3 |
Total energy consumption (in GWh) | | 955 | | 919 | | 4 |
Total data center electricity (in GWh) | | 338 | | 318 | | 6 |
1) Numbers based on at year-end. | | | | | | |
2) Numbers are based on the proposed dividend and on level of treasury stock at year-end. | | | | | | |
3) Full-time equivalents | | | | | | |
4) Due to changes in sampling, Customer NPS is not fully comparable to the prior year’s score. | | | | | | |
Contents
About This Report | 2 |
Key Facts | 3 |
| |
Contents | 5 |
| |
To Our Stakeholders | 7 |
| |
Letter from the Co-CEOs | 8 |
SAP Executive Board | 10 |
Investor Relations | 12 |
Report by the Supervisory Board | 15 |
Compensation Report | 23 |
Responsibility Statement | 44 |
Independent Auditor’s Report | 45 |
| |
Combined Group Management Report | 51 |
| |
General Information About This Management Report | 52 |
Strategy and Business Model | 54 |
Performance Management System | 60 |
Products, Research & Development, and Services | 67 |
Security, Data Protection, and Privacy | 71 |
Customers | 74 |
Employees and Social Investments | 75 |
Energy and Emissions | 80 |
Financial Performance: Review and Analysis | 83 |
Corporate Governance Fundamentals | 101 |
Business Conduct | 103 |
Risk Management and Risks | 105 |
Expected Developments and Opportunities | 126 |
| |
Consolidated Financial Statements IFRS | 131 |
| |
Notes | 138 |
Section A – Customers | 141 |
Section B – Employees | 147 |
Section C – Financial Results | 156 |
Section D – Invested Capital | 164 |
Section E – Capital Structure, Financing, and Liquidity | 175 |
Section F – Management of Financial Risk Factors | 182 |
Section G – Other Disclosures | 197 |
Management’s Annual Report on Internal Control over Financial Reporting in the Consolidated Financial Statements | 211 |
| |
Further Information on Economic, Environmental, and Social Performance | 212 |
| |
About This Further Information on Economic, Environmental, and Social Performance | 213 |
Connectivity of Financial and Non-Financial Indicators | 214 |
Materiality | 221 |
Stakeholder Engagement | 223 |
Sustainability Management and Policies | 224 |
Our Contribution to the UN Sustainable Development Goals | 226 |
Human Rights and Labor Standards | 228 |
Sustainable Procurement | 230 |
Waste and Water | 232 |
Public Policy | 234 |
Memberships | 235 |
Non-Financial Notes: Social Performance | 236 |
Non-Financial Notes: Environmental Performance | 237 |
GRI Index and UN Global Compact Communication on Progress | 242 |
Task Force on Climate-Related Financial Disclosure (TCFD) | 247 |
Management’s Acknowledgement of the SAP Integrated Report 2019 | 248 |
Assurance Report of the Independent Auditor regarding Sustainability Information | 249 |
| |
Additional Information | 251 |
| |
Five-Year Summary | 252 |
2019 Glossary (Abridged) | 256 |
Financial Calendar and Addresses | 268 |
Financial and Sustainability Publications | 269 |
Publication Details | 270 |
To Our Stakeholders
Letter from the Co-CEOs | 8 |
SAP Executive Board | 10 |
Investor Relations | 12 |
Report by the Supervisory Board | 15 |
Compensation Report | 23 |
Responsibility Statement | 44 |
Independent Auditor’s Report | 45 |
To Our
Stakeholders | Combined Group
Management Report | Consolidated Financial
Statements IFRS | Further Information on Economic,
Environmental, and Social Performance | Additional
Information |
Letter from the Co-CEOs
Dear Fellow Shareholders,
Thank you for your commitment to and belief in SAP. As the company’s new co-CEOs, we appreciate that SAP thrives when we put our customers, shareholders, and communities at the center of all that we do.
We are proud of all that SAP has accomplished in 2019 and are laser-focused on continued innovation at scale, integration across our portfolio, and strong customer success and adoption of our solutions. For nearly 50 years, SAP has grown because we have the market’s best engineering talent, a global footprint across every industry in more than 180 countries, and a deep understanding of how businesses must operate in today’s global landscape. Never has that heritage been more valuable.
The year 2019 showed once again that SAP can deliver both reliable financial returns and strong underlying growth – and we take great pride in this continued growth story:
– We delivered 12% growth in total revenue, our highest growth rate since 2015.
– Cloud revenue continued to be the major growth driver, growing 40% (non-IFRS).
– We increased our operating profit by 15% (non-IFRS), with margin improving by 0.8pp (non-IFRS).
– With increased efficiency in cloud delivery, cloud gross margin increased 5pp in 2019.
– Our flagship suite, SAP S/4HANA, had a record year, growing to approximately 13,800 customers across 25 industries.
Our stock posted an all-time high in December 2019, and again in early 2020. Our share price grew by 38.4% last year, out-performing the German DAX index, which increased by 25.5%.
We are pleased that our shareholders continue to participate in our growth, with a proposed annual dividend of €1.58 per share for 2019, representing an increase of 5.3%. Further, we intend to return an additional €1.5 billion to shareholders through a share buyback program. The share buyback program, in addition to the attractive regular dividend policy, is an important element in delivering value to our shareholders, and together they show our disciplined approach to capital allocation.
8 | | Letter from the Co-CEOs |
To Our
Stakeholders | Combined Group
Management Report | Consolidated Financial
Statements IFRS | Further Information on Economic,
Environmental, and Social Performance | Additional
Information |
We spent our first 100 days as co-CEOs listening to our stakeholders and understanding their perspectives, and we are now acting on what we have heard. Our first step was to align our customer-facing organization to simplify and improve the experience of our customers. We are also unifying our engineering teams across the entire portfolio into one team with one set of priorities. This will allow us to focus relentlessly on accelerating the integration of our Intelligent Enterprise and driving SAP’s next wave of organic innovations. We will continue to be the partner that enables customers to rewrite their business models, redefine their industries, and leapfrog their competition.
Our acquisition of Qualtrics this past year makes SAP the leader in the Experience Management (XM) category. The Qualtrics XM Platform is enabling our customers to listen, understand, and act on the core experiences of business: customer, employee, brand, and product. Our vision for XM is resonating with our customers – as Qualtrics has expanded our customer base to over 11,450 customers in 2019 and has only just begun to penetrate our installed base.
Leading in the experience economy also means putting an even greater focus on ensuring superior experiences for our own stakeholders, which is why we aim to increase our Customer Net Promoter Score by three to five points in 2020. We believe the changes we have already begun making will improve and harmonize how our customers experience SAP. The same holds true for our own workforce – we announced a new vision in 2019 that shifts HR from traditional, often transactional human capital management (HCM) to human experience management (HXM) – to go upstream in the employee lifecycle to transform the human experience at work. Our own Employee Engagement Index reflects our approach, remaining above industry benchmarks at 83%.
We also remain prouder than ever that our enduring vision is to help the world run better and improve people’s lives. We lead our industry on issues ranging from sustainability to diversity and inclusion – such as with our Autism at Work program. But that’s just the start of how we serve our world:
– We are launching the Climate 21 program at SAP to build analytical and transactional capabilities into our core business applications, to help our customers both understand and minimize the carbon footprint of their products and operations.
– Our solutions help eradicate modern slavery from supply chains and help customers move away from single-use plastics to sustainable, alternative materials. Our software is used to predict and prevent disasters, eliminate gender inequality, and educate people who have never had the opportunity to enter a classroom.
– We are committed to becoming carbon neutral by 2025, and we have reduced our net carbon footprint for the past five years, despite strong growth.
– We will continue to support all aspects of diversity in our business. We are proud that SAP is at the top of the Forbes America’s Best Employers for Diversity list, reflecting our industry-leading metrics, including roughly 34% women in our workforce today and nearly 27% women in leadership positions.
– We also strive to have a positive impact in the communities where we work and live: Our SAP One Billion Lives program inspires a closer collaboration between social enterprises, corporations, and consumers to accelerate wider social change. In 2019, SAP employees around the world dedicated more than 270,000 hours of service to causes important to them.
In closing, we want to thank you for your trust and confidence. Between us, we have called SAP home for nearly four decades – and we ascended to the role of co-CEOs with deep humility, a profound reverence for our past, and an unbridled optimism for our future. It is an honor to write the next chapter of SAP alongside 100,000 of the most talented colleagues in the technology industry.
In 2020 and beyond, the best for SAP is yet to come.
Sincerely,
Jennifer Morgan and Christian Klein
Co-CEOs, SAP SE
Letter from the Co-CEOs | | 9 |
To Our
Stakeholders | Combined Group
Management Report | Consolidated Financial
Statements IFRS | Further Information on Economic,
Environmental, and Social Performance | Additional
Information |
SAP Executive Board

| | 
|
| | |
Christian Klein Co-CEO and Chief Operating Officer | | Jennifer Morgan Co-CEO |
| | |
| | |
| | |

| | 
|
| | |
Adaire Fox-Martin Global Customer Operations | | Luka Mucic Chief Financial Officer |
To Our
Stakeholders | Combined Group
Management Report | Consolidated Financial
Statements IFRS | Further Information on Economic,
Environmental, and Social Performance | Additional
Information |

| | 
|
| | |
Jürgen Müller Chief Technology Officer | | Michael Kleinemeier SAP Digital Business Services |
| | |
| | |

| | 
|
| | |
Stefan Ries Chief Human Resources Officer | | Thomas Saueressig SAP Product Engineering |
To Our
Stakeholders | Combined Group
Management Report | Consolidated Financial
Statements IFRS | Further Information on Economic,
Environmental, and Social Performance | Additional
Information |
Investor Relations
Stock Markets on the Rise – SAP Remains Most Valuable DAX Company
The global economic environment remained difficult in 2019, characterized by fears of a recession, the ongoing Brexit tug-of-war, the political crisis in Italy, and the trade dispute between the United States and China. Despite the nervousness, a general hope for amicable conflict resolution prevailed. Enjoying the predominately positive mood on global stock markets, SAP stock gained 38.4%, once again outperforming the benchmark indexes DAX 30 and NASDAQ 100, which grew 25.5% and 38.0%, respectively. With a market capitalization of €147.8 billion, SAP continues to be the most valuable DAX company by far.
SAP Stock Climbs to New All-Time High
After closing at €86.93 on the Xetra trading system at the end of 2018, the SAP share price fell to €84.31, its lowest level for the year, on January 3. In the first few months of 2019, SAP stock traded parallel to the DAX, which profited from improved domestic and global economic prospects as well as a persistently weak euro. SAP stock dipped briefly at the end of January following publication of our full-year results for 2018, as shareholders were disappointed that profitability was below market expectations. Publication of our proposed dividend of €1.50 per share on February 21, however, soon gave SAP stock new momentum, and on March 21, our stock passed the €100 mark again for the first time since October 2018.
On presentation of our results for the first quarter on April 24, the price of SAP stock climbed 12.5% to a temporary all-time high of €114.62 – its greatest single-day performance in more than a decade. The stock markets rewarded SAP not only on our excellent quarterly figures and raised earnings forecast through to 2023, but they also acknowledged that a prominent U.S.-based investor had announced it had taken a stake in the Company. SAP stock remained strong at this new share price level in May and June, and, buoyed by an upbeat industry environment, clearly outperformed all relevant comparator indexes, hitting new records. This trend continued until July 3, pushing the share price to an interim high of €124.38.
July then brought a turn in direction fueled by fears of recession and continuing escalations in the trade dispute between the United States and China, which also impacted SAP’s business in Asia. In addition, presentation of our second-quarter results on July 18 failed to fully meet market expectations, particularly with respect to margin development, causing SAP stock to close the day down 5.6% at €113.32. The share price continued to drop throughout the month, reaching a low of €104.00 at the beginning of August. Industry sentiment remained generally negative in September, such that SAP stock was unable to benefit from speculation about interest rate cuts or the market upswing that month.
The fourth quarter moved primarily on expectations of a conciliation in the pervasive trade dispute between the United States and China, which were partially fulfilled when the two countries signed a Phase 1 trade agreement on December 15. Global stock markets reacted favorably to the news. In addition, SAP surprised the markets on October 11 with changes in the Company’s leadership and strong preliminary results for the third quarter. SAP stock advanced 10.2% in response, closing the day at € 115.68. SAP’s new cloud partnership with Microsoft announced on October 21 provided further momentum: SAP stock continued to grow in line with the market trend, reaching a new all-time high of €124.72 on December 16. The next day, a negative analyst commentary caused the share price to slip 3.3% to €120.56. SAP stock ultimately ended the reporting year on December 30 up 38.4% at €120.32.
To Our
Stakeholders | Combined Group
Management Report | Consolidated Financial
Statements IFRS | Further Information on Economic,
Environmental, and Social Performance | Additional
Information |
Continued Dialog with Investors
SAP is continuously engaged with the investment community through a number of channels. Over the course of the year, members of the Executive Board of SAP SE and the Investor Relations (IR) team discussed our strategy and business development with institutional investors, analysts, and private investors worldwide.
Once again an essential part of our global IR program, we held a Capital Markets Day at the New York Stock Exchange in February 2019. With more than 120 financial analysts and investors in attendance, the Executive Board discussed the details of SAP’s strong position in the market and how SAP technologies help customers run at their best. The Executive Board also discussed the business model and charted the future course of the Company. SAP customers New Era Cap, Verizon Communications, and JetBlue presented their perspectives on how the intelligent enterprise supports their respective business. This year, we further enhanced our dialogue for the financial community with a Special Capital Markets Day held at our Hudson Yards offices in New York City in November, highlighting our strategic vision, details on operation excellence programs, and future capital allocation.
In addition, we hosted events during the year for buy-side analysts in Walldorf (Germany), and New York City (USA). At the SAPPHIRE NOW conference in Orlando, Florida, we hosted events for investors and financial analysts. Members of the Executive Board together with the IR team participated in more than 25 conferences worldwide. We continued our dialogue with socially responsible investors (SRI), providing them with insights into our environmental, social, and corporate governance policies. SAP representatives engaged with retail shareholders at multiple events. The IR team and the Treasury team also maintained regular communication with the debt investor community.
We provide a wide range of information about SAP and its shares online. Our communications channels include our Twitter feed @sapinvestor and the quarterly SAP INVESTOR magazine. Shareholders can reach the IR team directly by telephone hotline and by e-mail at investor@sap.com. We also publish an overview of the latest analyst consensus in collaboration with Vara Research.
We provide a Webcast for all key investor events at which members of our Executive Board speak, and we post all relevant presentations on the Investor Relations Web site.
Key Facts About SAP Stock/SAP ADRs
Listings | | |
Germany | | Berlin, Frankfurt, Stuttgart |
United States (ADRs) | | New York Stock Exchange |
IDs and symbols | | |
WKN/ISIN | | 716460/DE0007164600 |
NYSE (ADRs) | | 803054204 (CUSIP) |
Reuters | | SAPG.F or .DE |
Bloomberg | | SAP GR |
Weight (%) in indexes as at 12/31/2019 | | |
DAX 30 | | 10.00 |
Prime All Share | | 8.54 |
CDAX | | 9.84 |
HDAX | | 9.11 |
Dow Jones STOXX 50 | | 3.22 |
Dow Jones EURO STOXX 50 | | 4.87 |
Return on SAP Common Stock — WKN 716460/ISIN DE007164600
Percent, unless otherwise stated | | | | |
Initial investment €10,000 | | | | | | |
Date of investment | | 12/31/2009 | | 12/31/2014 | | 12/31/2018 |
Period of investment | | 10 years | | 5 years | | 1 year |
Value as at 12/31/20191) (in €) | | 36,736 | | 20,652 | | 13,841 |
Average annual return | | 13.9 | | 15.6 | | 38.4 |
Performance comparators | | | | | | |
DAX 30 Performance — total return index | | 8.3 | | 6.2 | | 25.5 |
REX General Bond — total return index | | 1.5 | | 0.6 | | 1.3 |
S&P 500 Composite — total return index | | 14.0 | | 11.1 | | 31.8 |
S&P North American Technology Software Index | | 19.1 | | 20.8 | | 44.5 |
1) Assuming all dividends were reinvested | | |
Return on SAP ADRs — 803054204 (CUSIP)
Percent, unless otherwise stated | | | | | | |
Initial investment US$10,000 | | | | | | |
Date of investment | | 12/31/2009 | | 12/31/2014 | | 12/31/2018 |
Period of investment | | 10 years | | 5 years | | 1 year |
Value at 12/31/20191) (in US$) | | 28,841 | | 19,238 | | 13,460 |
Average annual return | | 11.2 | | 14.0 | | 34.6 |
Performance comparators | | | | | | |
S&P 500 Composite — total return index | | 11.2 | | 9.4 | | 28.9 |
1) Assuming all dividends were reinvested | |
Source: Bloomberg | |
| | |
To Our
Stakeholders | Combined Group
Management Report | Consolidated Financial
Statements IFRS | Further Information on Economic,
Environmental, and Social Performance | Additional
Information |
Dividend Increased to €1.58
We had a very successful year in 2019, as customers continue to turn to SAP to support them in their journey to become intelligent enterprises. We believe our shareholders should share greatly in this success, therefore it is our policy to pay a dividend totaling 40% or more of IFRS profit after tax.
At the Annual General Meeting of Shareholders, the Executive Board and the Supervisory Board of SAP SE will recommend increasing the total dividend for fiscal year 2019 by more than 5% to €1.58 per share (2018: €1.50). This represents a payout ratio of 56% (2018: 44%).
Capital Stock Unchanged
SAP’s capital stock as at December 31, 2019, was €1,228,504,232 (2018: €1,228,504,232). It is issued as 1,228,504,232 no-par shares, each with an attribute value of €1 in relation to capital stock. According to the German Stock Exchange (Deutsche Börse), shares of SAP were among the most traded German stock in 2019.
Shareholder Structure
Applying the definition accepted on the Frankfurt Stock Exchange, which excludes treasury stock from the free float, as at December 31, 2019, the free float stood at 86% (December 31, 2018: 85.5%).
*15% of institutional investors (marked yellow) are classified as socially responsible investors (SRIs)
To Our
Stakeholders | Combined Group
Management Report | Consolidated Financial
Statements IFRS | Further Information on Economic,
Environmental, and Social Performance | Additional
Information |
Report by the Supervisory Board
Dear Shareholders,
In the following, we would like to inform you about the work of the Supervisory Board in the fiscal year 2019.
Collaboration Between the Supervisory Board and the Executive Board
In the past fiscal year, the Supervisory Board advised the Executive Board on an ongoing basis with regard to the management of the Company and kept the Executive Board’s global management of the Company under observation and scrutiny for legal compliance, adherence to proper accounting principles, business focus, and expediency. We were directly involved when the Executive Board made any decision of fundamental importance to SAP.
We regularly received full and timely reports from the Executive Board, both from members in person and in written documents. This ensured that we were always up-to-date, even between meetings, on the Company’s strategy, planning, business performance, risks, risk management, compliance (in other words, adherence to laws, to the Company’s Articles of Incorporation, and to internal policies), and on transactions of special significance for SAP. In its reports, the Executive Board also informed us in particular where business deviated from plan or target, and why. In addition, the Supervisory Board members can use the SAP Digital Boardroom solution to check on business performance at any time. Offering maximum transparency, the digital decision and analysis cockpit allows us to call up comprehensive metrics in real time and generate analyses as and when required.
The content and scope of the Executive Board’s reports to us fully met our requirements for them. The Executive Board came to Supervisory Board meetings for discussion of the agenda items. We questioned and probed the Executive Board to satisfy ourselves that the information it gave us was plausible. All transactions requiring approval by the Supervisory Board whether by law, the Articles of Incorporation, or the Supervisory Board’s list of transactions requiring its consent were carefully examined and discussed with the Executive Board.
The CEO, and subsequently the Co-CEOs, were in continuous contact with the Supervisory Board chairperson, which meant that the chairperson was always informed without delay of all important events that were significant for assessing SAP’s situation and progress or for the management and governance of the Company. Moreover, the chairperson of the Supervisory Board met regularly with the CEO, and subsequently the Co-CEOs, to discuss SAP’s strategy, planning, business performance, risks, risk management, compliance, and other key topics and decisions. The chairperson of the Supervisory Board was thus in a position to inform the members of the Supervisory Board between meetings.
Supervisory Board Meetings and Resolutions
In 2019, the full Supervisory Board of SAP SE held four ordinary meetings and five extraordinary meetings at which it deliberated and resolved on all matters of relevance to the Company. These meetings were regularly held in the form of physical meetings but in some cases in the form of telephone conference meetings. We also adopted five resolutions by correspondence vote. In the fiscal year, no Supervisory Board member attended only half or less of the meetings of the Supervisory Board and of the committees to which the member belonged. One shareholder representative on the Supervisory Board was only able to attend 13 of the 19 meetings of the Supervisory Board or its committees to which he belongs, particularly due to the fact that several of these meetings were called at very short notice. The Supervisory Board member in question nevertheless participated in the resolutions passed at these meetings by means of voting instructions submitted beforehand. The table included in this chapter provides an overview of all the members’ attendance at the Supervisory Board’s plenary sessions and committee meetings during fiscal year 2019.
Report by the Supervisory Board | | 15 |
To Our
Stakeholders | Combined Group
Management Report | Consolidated Financial
Statements IFRS | Further Information on Economic,
Environmental, and Social Performance | Additional
Information |
Meeting Participation of SAP Supervisory Board Members During Fiscal Year 2019
| Plenum | Committees | All Meetings |
| | | |
Supervisory Board Members | Meetings | Participation | Meetings | Participation | Meetings | Participation | Participation
in % |
Prof. Dr. h.c. Hasso Plattner | 9 | 9 | 12 | 12 | 21 | 21 | 100% |
Pekka Ala-Pietilä | 9 | 6 | 10 | 7 | 19 | 13 | 68% |
Panagiotis Bissiritsas | 9 | 9 | 24 | 24 | 33 | 33 | 100% |
Martin Duffek (until May 15, 2019) | 3 | 3 | 7 | 7 | 10 | 10 | 100% |
Aicha Evans | 9 | 9 | 15 | 14 | 24 | 23 | 96% |
Diane Greene | 9 | 9 | 4 | 4 | 13 | 13 | 100% |
Andreas Hahn (until May 15, 2019) | 3 | 3 | 6 | 6 | 9 | 9 | 100% |
Prof. Dr. Gesche Joost | 9 | 9 | 7 | 7 | 16 | 16 | 100% |
Margret Klein-Magar | 9 | 9 | 15 | 15 | 24 | 24 | 100% |
Monika Kovachka-Dimitrova (since May 15, 2019) | 6 | 6 | 4 | 4 | 10 | 10 | 100% |
Lars Lamadé | 9 | 9 | 11 | 11 | 20 | 20 | 100% |
Bernard Liautaud | 9 | 7 | 12 | 12 | 21 | 19 | 90% |
Gerhard Oswald (since January 1, 2019) | 9 | 9 | 21 | 19 | 30 | 28 | 93% |
Christine Regitz | 9 | 9 | 15 | 15 | 24 | 24 | 100% |
Dr. Friederike Rotsch | 9 | 9 | 22 | 22 | 31 | 31 | 100% |
Dr. Erhard Schipporeit (until May 15, 2019) | 3 | 3 | 7 | 7 | 10 | 10 | 100% |
Robert Schuschnig-Fowler (until May 15, 2019) | 3 | 3 | 4 | 4 | 7 | 7 | 100% |
Dr. Sebastian Sick (until May 15, 2019) | 3 | 3 | 7 | 7 | 10 | 10 | 100% |
Heike Steck (since May 15, 2019) | 6 | 6 | 4 | 3 | 10 | 9 | 90% |
Pierre Thiollet (until May 15, 2019) | 3 | 3 | 2 | 2 | 5 | 5 | 100% |
Christa Vergien-Knopf (since May 15, 2019) | 6 | 6 | 4 | 4 | 10 | 10 | 100% |
Gunnar Wiedenfels (since May 15, 2019) | 6 | 6 | 11 | 11 | 17 | 17 | 100% |
James Wright (since May 15, 2019) | 6 | 6 | 13 | 13 | 19 | 19 | 100% |
Ralf Zeiger (since May 15, 2019) | 6 | 6 | 6 | 5 | 12 | 11 | 92% |
The Supervisory Board and its committees also convened wholly or partly without the Executive Board as necessary in 2019 to deliberate on items that pertained to the Executive Board or required internal discussion among Supervisory Board members alone. This was the case in five of the seven plenary sessions, in three of the eight General and Compensation Committee sessions, and in two of the 10 Finance and Investment Committee sessions. In addition, the shareholder representatives and the employee representatives independently discussed individual agenda items as required prior to the adoption of resolutions in plenary sessions. The Supervisory Board addressed the following key topics during the year:
Changes on the Executive Board, and Compensation Topics
The Supervisory Board’s work and deliberations in 2019 were predominated by several personnel changes on the Executive Board. At our meeting on February 20, 2019, we mutually agreed together with Bernd Leukert his early departure from the Executive Board effective March 31, 2019. At the same time, we extended Michael Kleinemeier’s Executive Board appointment to December 31, 2020. In our extraordinary meeting on April 5, 2019, we dealt with Robert Enslin’s resignation from the Executive Board. The Executive Board informed us of the resulting changes to the Executive Board portfolios, which included Jennifer Morgan and Adaire Fox-Martin assuming responsibility for the Cloud Business Group and SAP’s global sales organization, respectively. When we met on July 25, 2019, we extended both Jennifer Morgan’s and Adaire Fox-Martin’s Executive Board appointments to April 30, 2025. At the end of September 2019, SAP’s CEO of nearly 10 years, Bill McDermott, decided to leave SAP and thus the Executive Board before the regular end of his contract. The Supervisory Board therefore held an extraordinary meeting on October 10, 2019, to discuss the timing and modalities of Bill McDermott’s departure from the Executive Board, and resolved on the contractual terms in relation to the early termination of his
16 | | Report by the Supervisory Board |
To Our
Stakeholders | Combined Group
Management Report | Consolidated Financial
Statements IFRS | Further Information on Economic,
Environmental, and Social Performance | Additional
Information |
employment contract. In accordance with our succession planning, we also approved the appointment of Jennifer Morgan and Christian Klein as Co-CEOs effective October 10, 2019, and in the process extended the duration of Christian Klein’s appointment contract to match and keep it in sequence with Jennifer Morgan’s. Bill McDermott served as a regular member of the Executive Board from this date onward until his departure on November 15, 2019. At its ordinary meeting on October 24, 2019, the Supervisory Board appointed Thomas Saueressig to the Executive Board effective November 1, 2019. He took on responsibility for the Product Engineering unit and the Company’s global product development, particularly for SAP’s core product SAP S/4HANA, its supply chain solutions, its software for small businesses and midsize companies, the SAP User Experience organization, the SAP Knowledge and Education organization, and SAP Labs Network, as well as the global cloud infrastructure and SAP HANA Enterprise Cloud. In an extraordinary meeting on November 19, 2019, the new Co-CEOs apprised us of their corporate strategy and the further changes they planned to make step-by-step to the Executive Board portfolios in order to improve SAP’s organizational structure, for which we gave our approval. All resolutions of the full Supervisory Board regarding the personnel changes, the ensuing agreements in Executive Board appointment contracts, and the necessary adjustments to the individual Executive Board members’ compensation resulting from the reassignment of portfolios were prepared by the General and Compensation Committee, whose proposed recommendations we discussed in-depth prior to approving.
Besides this, we made several decisions in 2019 regarding Executive Board compensation – either in the course of our regular deliberations, as developments warranted, or in connection with the introduction of the new LTI 2020 Plan. At our ordinary Supervisory Board meeting on February 20, 2019, for example, we determined Executive Board compensation for 2018 by deciding on the total target achievement and the payouts for the individual Executive Board members under the Short-Term Incentive (STI) 2018 Plan. We also deliberated on Executive Board compensation for 2019 at the February meeting: We first defined the key performance indicators (KPIs) for the STI 2019 and set the target numbers for each KPI and their relative weightings. We then resolved the individual allocation amounts for the 2019 tranche of the LTI 2016. The Supervisory Board, as required, evaluated the appropriateness of the Executive Board members’ compensation, and in each case found it to be appropriate in terms of amount, structure, objective criteria, and for each member’s responsibilities and tasks. We referred in this regard to an appropriateness certificate obtained beforehand from Ernst & Young GmbH. In our meeting on October 24, 2019, we approved numerous changes to the STI with effect from fiscal year 2020. At our plenary meetings on July 25, 2019, and October 24, 2019, we also dealt at length with the concept of the new LTI 2020 Plan, which we subsequently adopted at our extraordinary meeting on November 19, 2019, based on a recommendation that the General and Compensation Committee had adopted earlier by circular resolution. The preparatory work for this new LTI Plan had been executed by a project group that was set up in February 2019 following deliberations by the Committee and by the plenum. Comprised of members from the Executive Board and Supervisory Board, the group had been tasked to draw up a proposal for the new LTI plan for 2020. In this connection, the Supervisory Board sought the support of two external compensation experts, who provided the Supervisory Board with benchmarks for Executive Board compensation and advised on the Plan’s design. The project group’s proposed Plan details were discussed in the General and Compensation Committee’s meetings on April 10, 2019, and July 24, 2019, together with the compensation experts, and adopted in several stages, most recently in the abovementioned circular resolution in November 2019.
For more detailed information about the STI 2020, the LTI 2016 Plan, the new LTI 2020 Plan, and the other elements of the compensation package for Executive Board members, see the Compensation Report.
Capital Allocation Policy
In 2019, we consulted with the Executive Board on an ongoing basis with regard to the Company strategy and the Executive Board’s proposals for the future allocation of capital. In three plenary meetings and four meetings of the Finance and Investment Committee, the Supervisory Board met with and in some cases without the Executive Board, as appropriate, to discuss the Company’s capital allocation policy. We first discussed this topic in our April 11, 2019, meeting. On April 24, 2019, the Company announced an updated ambition for 2023 together with a new, comprehensive program to accelerate operational excellence, and scheduled a Special Capital Markets Day for November 12, 2019. The Executive Board also announced in this context that it would investigate the possibility of a share buyback program. On July 25, 2019, and October 24, 2019, the Supervisory Board discussed the Executive Board’s proposed allocation of resources, taking into account the Company’s strategy. In our extraordinary meeting on November 4, 2019, we subsequently approved, on recommendation of the Finance and Investment Committee, the Executive Board’s plan for an enhanced capital return in 2020. Thus, the Company is authorized to share buybacks and/or the issue of a special dividend in an amount of up to €1.5 billion in the financial year 2020. Due to the complexity of the subject matter, the Supervisory Board solicited advice from a large management consultancy firm when assessing the Executive Board’s proposed capital allocation plan. The consultant in question attended the preparatory meetings of the Finance and Investment Committee on September 11, October 18 and 24, and November 3, 2019.
Compliance Matters
In 2019, SAP’s compliance department (Ethics and Compliance Office) continued to investigate possible violations of anti-bribery laws (including the U.S. Foreign Corrupt Practices Act (FCPA)) with the assistance of an external law firm, and updated the Audit Committee and the full Supervisory Board on the status of those investigations frequently throughout the fiscal year, notably at the Audit Committee’s meetings and at the plenary sessions in April, July, and October 2019. Among other things, it explained SAP’s voluntary cooperation with local authorities, the U.S. Securities and Exchange Commission (U.S. SEC), and the U.S. Department of Justice (U.S. DOJ). To gain deeper insight into this matter, the Audit Committee had submitted a catalog of questions to the Executive Board regarding the facts under investigation and the measures taken. The Executive Board answered these questions in detail in the plenary session on October 24, 2019. At the April 11 session, the Executive Board also reported on the status of the investigations
Report by the Supervisory Board | | 17 |
To Our
Stakeholders | Combined Group
Management Report | Consolidated Financial
Statements IFRS | Further Information on Economic,
Environmental, and Social Performance | Additional
Information |
into potential export controls and economic sanctions violations. Currently ongoing, these investigations and likewise being pursued with the assistance the with external lawyers. Management has made substantial improvements to the Company’s measures for complying with anti-corruption legislation and export control laws, and has expanded the compliance teams significantly. The Executive Board kept us up to speed on the details of these measures throughout the year.
Other key topics addressed at our meetings in 2019 notably included the following:
Meeting in February (Meeting to Discuss the Financial Statements)
In the plenary session on February 20, 2019, we discussed with the Executive Board the results of the 2018 employee survey and the Company’s 2018 financial results. The Supervisory Board also dealt in depth with the SAP SE financial statements and the consolidated financial statements for 2018, the audits conducted by KPMG AG Wirtschaftsprüfungsgesellschaft (KPMG), and the Executive Board’s proposed resolution on the appropriation of retained earnings for 2018. The auditor attended the meeting and reported in detail on the audit and its findings for each of the focus areas that had been agreed between the auditor and the Audit Committee. The auditor also related the discussions on those matters at the preceding meetings of the Audit Committee. The auditor then discussed the results of the audit with the Supervisory Board and answered our questions. The Audit Committee had comprehensively prepared all topics in connection with the financial statements and the consolidated financial statements for 2018, and in particular reported on the form and scope of its examination of the documents relating to the financial statements, which it recommended we approve. The Supervisory Board approved the audit. There were no findings from our own examination, so we gave our consent to the SAP SE and consolidated financial statements for 2018. We checked and endorsed the Executive Board’s proposal to appropriate retained earnings in accordance with the Audit Committee’s recommendation. We then discussed in detail the annual budget for 2019 as presented to us by the Executive Board, and approved same. The Executive Board also reported on its priorities for 2019 and its strategy for Cloud ERP, SAP’s cloud-based solution for enterprise resource planning. Following these reports, we decided on the (further) resolutions we would propose for the agenda of the Annual General Meeting of Shareholders in May 2019. This notably included our recommendation to the Annual General Meeting of Shareholders concerning the auditor to elect for 2019, which followed the recommendation of the Audit Committee to us. We were also informed about SAP’s donation activities. Thereafter we discussed corporate governance matters and resolved to restrict the maximum amount of time a member can serve on the Supervisory Board in future to 12 years. It had not been our practice in the past to set a time limit in absolute figures.
Meeting in April
When we met on April 11, 2019, an analyst from Royal Bank of Canada presented his perspective of SAP. We also looked at the capital market’s expectations of SAP, particularly with regards to SAP’s business model and its financial reporting approach. We then discussed in-depth with the Executive Board its strategy to enable customers to become intelligent enterprises (Intelligent Enterprise strategy), with particular focus on the experience management products from Qualtrics and SAP’s competitive position. In this context, the Executive Board explained its further plans for the abovementioned program to optimize SAP’s business processes. In addition, the Executive Board reported on first-quarter results for 2019, using the SAP Digital Boardroom solution.
Extraordinary Meeting in May
The Supervisory Board held an extraordinary meeting immediately following the Annual General Meeting of Shareholders on May 15, 2019, to welcome the newly-elected members, to elect the Supervisory Board chairperson and deputy chairperson, and to decide the membership of its committees.
Resolution Adopted by Correspondence in July
By way of correspondence vote in July 2019, we consented, on recommendation from the Finance and Investment Committee, to the issuance of bonds up to a volume of €2.5 billion under the commercial paper program that had been created for this purpose. With this program, the Executive Board has extended SAP’s options for addressing short-term funding needs.
Meeting in July
Our ordinary meeting on July 25, 2019, was held in San Martin, California, USA, where the newly-comprised Supervisory Board spent several days together. It used this time intensively for discussions and networking, and also had the opportunity to meet with a number of strategic customers and partners locally. In the plenary session, we mainly discussed the directors’ and officers’ group liability insurance policies that we take out from year to year, and resolved adjustments to the rules of procedure for the Executive Board, the Supervisory Board, and several of the latter’s Committees. In addition, we updated the list of transactions and business management measures for which the Executive Board must obtain the Supervisory Board’s consent. The Executive Board then gave us an account of business in the second quarter of 2019 and performance in the first half year. Referring to the Executive Board’s reports, we discussed with the Executive Board the measures to be taken and their implementation. Thereafter, one of Qualtrics’ founders gave us a deep dive into Qualtrics products and their application areas for SAP.
Resolutions Adopted by Correspondence in August
On August 30, 2019, we consented by way of correspondence vote to a long-term R&D collaboration agreement between SAP SE, the Technical University of Munich, and the Free State of Bavaria.
Meeting in October
At our meeting on October 24, 2019, the Executive Board reported on business performance in the third quarter. On recommendation from the Finance and Investment Committee, we consented to the financing of a new Sapphire Ventures fund (“SAPPHIRE Ventures Fund V”) and approved the release of further capital for existing Sapphire Venture funds. The total volume committed for both investments was €1.55 billion. The Executive Board also explained the planned changes in Executive Board responsibilities resulting from the appointment of the new Co-
18 | | Report by the Supervisory Board |
To Our
Stakeholders | Combined Group
Management Report | Consolidated Financial
Statements IFRS | Further Information on Economic,
Environmental, and Social Performance | Additional
Information |
CEOs. We approved these changes. In addition to the above, the Supervisory Board assessed the independence of its members at regular intervals pursuant to the specifications of the German Corporate Governance Code (“Code”), using benchmarks we had set at our own discretion. We first ascertained that the Supervisory Board has a sufficient number of independent members, and confirmed that the targets set also provide for an appropriate number of independent shareholder representatives in our opinion. We then ascertained that, taking account of the shareholder structure, the Supervisory Board has a sufficient number of independent members. In accordance with the Code provisions, we also identified those shareholder representatives whom the Supervisory Board deems independent; these representatives are named in the Corporate Governance Statement, which also includes the Corporate Governance Report. In agreement with the Executive Board, we also adopted for regular publication in October 2019 the annual Declaration of Implementation of the Code.
The Work of the Supervisory Board Committees
The committees made a key contribution to the work of the Supervisory Board in 2019 and reported on their work to us, including their preparatory work for and decisions made on the relevant agenda items of the subsequent Supervisory Board meetings. In the course of the regular election of new shareholder and employee representatives on the Supervisory Board, we adopted a number of changes to the composition of the committees. The following committees were in place during the reporting year:
– General and Compensation Committee: Hasso Plattner (chairperson), Pekka Ala-Pietilä, Panagiotis Bissiritsas (from May 15, 2019), Aicha Evans, Andreas Hahn (until May 15, 2019), Margret Klein-Magar, Lars Lamade, Bernard Liautaud, Christine Regitz (from May 29, 2019), Friederike Rotsch (from May 29, 2019), Sebastian Sick (until May 15, 2019), Ralf Zeiger (from May 15, 2019)
– Audit Committee: Gunnar Wiedenfels (from May 15, 2019, as member and chairperson), Panagiotis Bissiritsas, Martin Duffek (until May 15, 2019), Margret Klein-Magar (from May 15, 2019), Gerhard Oswald (from May 15, 2019), Friederike Rotsch, Erhard Schipporeit (until May 5, 2019, as member and chairperson), James Wright (from May 15, 2019)
– Finance and Investment Committee: Friederike Rotsch (from May 15, 2019, as chairperson), Panagiotis Bissiritsas, Gerhard Oswald, Christine Regitz (from May 15, 2019), Erhard Schipporeit (until May 15, 2019, as member and chairperson), Robert Schuschnig-Fowler (until May 15, 2019), Sebastian Sick (until May 15, 2019), Gunnar Wiedenfels (from May 15, 2019), James Wright (from May 15, 2019)
– Technology and Strategy Committee: Hasso Plattner (chairperson), Christine Regitz (deputy chairperson), Panagiotis Bissiritsas (until May 15, 2019), Martin Duffek (until May 15, 2019), Aicha Evans, Diane Greene, Andreas Hahn (until May 15, 2019), Gesche Joost, Margret Klein-Magar (until May 15, 2019), Monika Kovachka-Dimitrova (from May 15, 2019), Lars Lamade (from May 15, 2019), Bernard Liautaud, Gerhard Oswald, Heike Steck (from May 15, 2019), Pierre Thiollet (until May 15, 2019), Christa Vergien-Knopf (from May 15, 2019), James Wright (from May 15, 2019)
– People and Organization Committee: Gerhard Oswald (from May 15, 2019, as chairperson), Pekka Ala-Pietilä (from May 15, 2019), Martin Duffek (until May 15, 2019), Aicha Evans, Gesche Joost, Monika Kovachka-Dimitrova (from May 15, 2019), Lars Lamade (until May 15, 2019), Hasso Plattner (until May 15, 2019, as member and chairperson), Christine Regitz (until May 15, 2019), Robert Schuschnig-Fowler (until May 15, 2019), Heike Steck (from May 15, 2019), Christa Vergien-Knopf (from May 15, 2019), Ralf Zeiger (from May 15, 2019)
– Nomination Committee: Hasso Plattner (chairperson), Pekka Ala-Pietilä, Diane Green (from May 15, 2019), Bernard Liautaud
– Special Committee: This committee was dissolved effective May 15, 2019. Its members were Hasso Plattner (chairperson), Pekka Ala-Pietilä, Lars Lamade, Friederike Rotsch, Erhard Schipporeit, and Sebastian Sick.
Each of the committees was active in 2019 except the Nomination Committee and the dissolved Special Committee. For more information about the Supervisory Board committees and their duties, see SAP’s Corporate Governance Statement pursuant to the German Commercial Code, sections 315d and 289f, published on the SAP public Web site.
Besides the matters mentioned above, the committees focused primarily on the following topics in 2019:
– The General and Compensation Committee held five regular meetings and three extraordinary meeting in 2019, and outside these meetings it passed four resolutions by correspondence. In particular, the Committee extensively prepared and discussed in advance the deliberations of the Supervisory Board and its resolutions on Executive Board compensation within the scope of duties assigned to it, or resolved its own resolutions in this regard. This applies in particular for the meetings in January, February, April, July, and October 2019, for the correspondence vote in November 2019, and for a correspondence vote and two extraordinary meetings in December 2019. At its meeting in February 2019, the Committee also deliberated on the annual report compiled by SAP’s corporate governance and insider trading compliance officer. The Supervisory Board’s decisions with respect to the submission of the declaration of implementation of the Code and ascertaining the independence of Supervisory Board members were prepared in October 2019. In the fiscal year ended, the Committee also approved the acceptance of an outside supervisory board seat by an Executive Board member in two cases.
– The Audit Committee held six physical meetings – two of which jointly with the Finance and Investment Committee – and four telephone conference meetings in 2019. At these meetings, the Committee deliberated on the course of business over the quarter concerned, the accounting processes, the preparation of quarterly financial reports, and the quarterly reports to be published. Recurring topics at our meetings included SAP’s risk management system, internal control system, and compliance system (including the existing compliance cases, the status of the respective SAP-internal investigations, and SAP’s case-related collaboration with authorities). During its physical meeting in February 2019, the Committee focused on the
Report by the Supervisory Board | | 19 |
To Our
Stakeholders | Combined Group
Management Report | Consolidated Financial
Statements IFRS | Further Information on Economic,
Environmental, and Social Performance | Additional
Information |
financial accounts of SAP SE and the Group for 2018, and prepared the Supervisory Board’s recommendations to the Annual General Meeting of Shareholders concerning the election of an auditor and the appropriation of retained earnings. The decision on the recommendation regarding the election of the auditor was preceded by a review of the auditor’s independence, qualifications, and quality of work. To this end, the Audit Committee obtained regular reports from the auditor on its internal quality assurance standards and on any material findings from internal quality audits, from external quality controls via peer review, and from any investigations conducted by the government or regulators into the auditor’s audits. In addition, the internal audit department reported on the fiscal year 2018 for its area, and on its audit plan for 2019. At mid-year, the internal audit department informed the Committee about its audit findings to date as well as its plans for the second half of 2019 and the first half of 2020. We were informed at several meetings about the course and result of the audit of the consolidated financial statements and the combined management report for 2017 by the German Financial Reporting Enforcement Panel (Deutsche Prüfstelle für Rechnungslegung). Throughout the year, we engaged in detailed discussions about corporate security, with particular focus on additional security measures in the IT environment. The Committee turned its attention in the second half of the year to the revised German auditing standard IDW PS 350 (new version) and the resulting changes to SAP’s combined management report and non-financial report. We also discussed the regulatory requirements for mandatory rotation of external auditors, and their implications for SAP. Also, in the second half of the year, we updated the Committee’s rules of procedure due to the changed composition and increased number of Committee members. The auditor attended all physical meetings and telephone conference meetings of the Audit Committee and reported in-depth on its audit work and on its quarterly reviews of selected software agreements. The Committee discussed the audit focus with the auditor in July, and the audit fees with the auditor in October 2019. As reported in more detail below, the Committee also held two joint meetings with the Finance and Investment Committee in February and December 2019 to discuss the Group annual plan for 2019 and the preliminary Group annual plan for 2020.
– The Finance and Investment Committee held six ordinary meetings and four extraordinary meetings in 2019. Two of the meetings held in February and December 2019 were held jointly with the Audit Committee. Outside these meetings it passed two resolutions by correspondence. At its February 2019 meeting, the Committee examined the transactions in 2018 involving equity interests, and took a critical look at the Company’s current process of involving the Supervisory Board on major acquisitions. In the joint meeting with the Audit Committee that followed immediately thereafter, the members of both Committees discussed the annual plan for 2019 and voted in favor of recommending its approval to the Supervisory Board. In April, the Executive Board gave the Committee an overview of various investor relations activities. By circular correspondence vote in May 2019, the Committee approved the sale of assets from our healthcare business, which consists of SAP solutions for the data management in the healthcare sector. In July 2019, we met by telephone conference to prepare a resolution on the use of a $2.5 billion commercial paper program to sell short-term bonds to investors. In October 2019, representatives from Sapphire Ventures, LLC. gave the Committee an overview of the European and U.S. market for venture capital in technology and a status report on the active SAP venture capital funds. In this context, the Committee resolved, as reported above, to recommend that the Supervisory Board approve further financing for the Sapphire Venture funds. In December 2019, the Committee held a second joint meeting with the Audit Committee, at which the Executive Board presented the preliminary 2020 Group annual plan. This meeting was held in preparation for the Supervisory Board’s meeting in February 2020, at which the full Supervisory Board resolved the 2020 Group annual plan. In the separate Finance and Investment Committee meeting that followed the joint meeting in December 2019, the members were given a status report on the success of the Company’s acquisitions in 2018, the current climate for corporate takeovers, and ongoing divestment projects. Further, the Committee approved the sale of a building and the land on which it stands to a company whose shares are owned by the Supervisory Board chairperson. The sale was negotiated at arm’s length; the Supervisory Board chairperson is not a member of the Committee and therefore did not vote on the resolution.
– The Technology and Strategy Committee met four times in 2019. It discussed the key technology trends in the software industry in the years to come and SAP’s corporate and product strategies. At the February meeting, the Executive Board reported on the progress made in implementing the Company’s Intelligent Enterprise strategy aimed at helping SAP customers evolve into “intelligent enterprises.” The report focused primarily on SAP’s partnerships with hyperscaler cloud providers as regards SAP Cloud Platform. In addition, the Executive Board updated the Committee on the SAP Customer Experience portfolio, especially the integration of Qualtrics solutions. When it met in April 2019, the Committee reviewed the integration status of various SAP solutions and discussed the latest innovations in SAP HANA Cloud. In July 2019, the Executive Board briefed the Committee members on security risks and protection measures, and updated them on the status of and further plans for the Cloud Business Group. At its meeting in October 2019, the Committee addressed the master agreements with Microsoft with respect to SAP Cloud Platform and discussed SAP’s machine learning portfolio.
– The People and Organization Committee held three meetings in 2019. At its meeting in February, the Committee discussed the SAP University Alliances program. Offered at universities worldwide, this initiative aims to familiarize and inspire students with the latest SAP innovations and provide next-generation talents with the skills and technologies they need for the 21st century, whether at SAP or elsewhere. When we met in July, the Executive Board explained its new, comprehensive program to accelerate operational excellence, the approach behind it, its implementation, and its impact on employees. We also met in September, with key topics being India as a growth market, the current challenges there, the talent situation inside and outside SAP in India, and the business areas and business potential for SAP in that country. We also discussed the SAP’s measures to
20 | Report by the Supervisory Board |
To Our
Stakeholders | Combined Group
Management Report | Consolidated Financial
Statements IFRS | Further Information on Economic,
Environmental, and Social Performance | Additional
Information |
win talented employees and the media it currently used to do so. During this discussion, the Committee members were given an initial look at the structure and curriculum of the new SAP Academy for Engineering training program, which prepares students for a career in the SAP ecosystem.
Regular reports from the committees ensured that we were kept fully informed of all matters covered by the committees and were able to discuss them thoroughly.
Corporate Governance
SAP’s corporate governance and insider trading compliance officer monitored our compliance with those recommendations in the Code with which we claim to comply in SAP SE’s declaration, and reported in full to the General and Compensation Committee. Detailed information about compliance with the Code, as required by section 3.10 of the Code, is available in the Executive and Supervisory Boards’ Corporate Governance Statement, which also includes the Corporate Governance Report. Members of the Executive Board and of the Supervisory Board had no conflicts of interest that sections 4.3.3 and 5.5.2 of the Code require to be disclosed to the Supervisory Board. Some Supervisory Board members currently have business dealings with SAP or hold senior positions or material equity in companies that currently have business dealings with SAP, or had done so in the course of the year. SAP’s business dealings with these persons or companies are at arm’s length. In the Supervisory Board’s view, especially given the limited scope and materiality of those dealings, they did not affect the independence of the Supervisory Board members concerned and do not give rise to any substantial and not merely temporary conflict of interest in the meaning of the Code. There were a number of transactions involving members of the Executive Board in 2018 which were all consistent with industry standards and immaterial. These transactions were approved by the General and Compensation Committee during the year under review. Other than those contracts mentioned in this report, the Company made no other contracts with members of the Executive Board or Supervisory Board that would have required a resolution of the Supervisory Board.
In connection with the combined SAP Group and SAP SE management report, the Supervisory Board closely examined the Corporate Governance Statement, which also includes the Corporate Governance Report. We approved the Statement on February 12, 2020, by correspondence vote.
Training and Professional Development
The members of the Supervisory Board engaged in continuous training and professional development throughout the year, with sufficient support from the Company. In July and October 2019, for example, in follow-up to the Supervisory Board elections, the Company organized a number of information sessions for the newly-elected Supervisory Board members, which reelected members also attended. Among other things, the sessions included presentations by the internal departments as well a presentation from an external consultant explaining the corporate governance fundamentals for European stock corporations, accounting and reporting, internal audit, investor relations, risk management, compliance, and cybersecurity. In addition, dedicated training events in October 2019 enabled the Supervisory Board members to enhance their technical knowledge of artificial intelligence, SAP S/4HANA, and analytics, as well as gain a better understanding of the individual regions in which SAP operates. Besides this, a number of presentations were offered focusing specifically on committee work, for example on audit committee activities.
SAP SE and Consolidated Financial Reports for 2019
KPMG audited the SAP SE and consolidated financial reports for 2019. The Annual General Meeting of Shareholders elected KPMG as the SAP SE and SAP Group auditor on May 15, 2019. The Supervisory Board proposed the appointment of KPMG on the recommendation of the Audit Committee. Before proposing KPMG to the Annual General Meeting of Shareholders as auditor for the year, the chairperson of the Supervisory Board and the Audit Committee obtained confirmation from KPMG that circumstances did not exist that might prejudice or raise any doubt concerning its independence as the Company’s auditor. In that connection, KPMG informed us of the volume of the services that were not part of the audit which it had either provided to the Group in the past year or was engaged to provide in the year to come. The Supervisory Board has agreed with KPMG that the auditor should report to the Supervisory Board and record in the auditor’s report any fact found during the audit that is inconsistent with the declaration given by the Executive Board and the Supervisory Board concerning implementation of the German Corporate Governance Code. KPMG examined the SAP SE financial statements prepared in accordance with the German Commercial Code, the consolidated financial statements prepared in accordance with International Financial Reporting Standards (IFRSs) as required by the German Commercial Code, section 315e, and the combined SAP Group and SAP SE management report prepared in accordance with the German Commercial Code, and certified them without qualification. The auditor thus confirmed that, in its opinion and based on its audit in accordance with the applicable accounting principles, the SAP SE and consolidated financial statements give a true and fair view of the net assets, financial position, and results of operations of SAP SE and the SAP Group. The auditor also confirmed that the combined SAP SE and SAP Group management report is consistent with the corresponding financial statements and as a whole gives a suitable view of the position of SAP SE and the SAP Group and of foreseeable opportunities and risks. KPMG also audited SAP’s internal control over financial reporting and certified without qualification that it complies with the applicable U.S. standards. The auditor stated in its opinion that it considers SAP’s internal controls with respect to the consolidated financial statements to be effective in all material respects. Additionally, it provided assurance on selected qualitative and quantitative sustainability disclosures included in the Integrated Report but outside of the Management Report. All Audit Committee and Supervisory Board members received – initially in the form of drafts that were identical to the final documents – the documents concerning the financial statements mentioned above, the audit reports prepared by KPMG, and the Executive Board’s proposal concerning the appropriation of retained earnings in good time.
On February 18, 2020, the Executive Board prepared the financial accounts of SAP SE and the Group for 2019, comprising the SAP SE financial statements, the consolidated financial statements, and the combined management report, as well as the
Report by the Supervisory Board | 21 |
To Our
Stakeholders | Combined Group
Management Report | Consolidated Financial
Statements IFRS | Further Information on Economic,
Environmental, and Social Performance | Additional
Information |
combined non-financial report and submitted them without delay to the Supervisory Board.
The Executive Board explained the financial statements of SAP SE and the SAP Group and its proposal concerning the appropriation of retained earnings at the meeting of the Audit Committee on February 18, 2020 (based on the drafts identical to the final documents) and at the meeting of the Supervisory Board on February 19, 2020. Members of the Executive Board answered questions from the Audit Committee and the Supervisory Board. At the Audit Committee meeting, they also explained the Annual Report on Form 20-F prepared in accordance with the applicable U.S. standards as well as the combined non-financial report.
After the Executive Board had explained them, the Audit Committee and the Supervisory Board reviewed the financial statement documents (based on drafts identical to the final documents) along with the combined non-financial report, taking KPMG’s audit reports (or the drafts identical to the final documents) into account. The representatives of the auditor who attended presented full reports on the audit and the results of the audit to the Audit Committee and Supervisory Board meetings and explained its audit reports (or final drafts thereof). The auditor also reported that it had not identified any material weaknesses in SAP’s internal control and risk-management systems for financial reporting. Both the Audit Committee and the Supervisory Board asked detailed questions about the form, scope, and results of the audit. The Audit Committee reported to the Supervisory Board on its own review of the financial statements of SAP SE and the SAP Group, its discussions with the Executive Board and with the auditor, and its supervision of the financial reporting process. It confirmed that as part of its supervisory work, it had addressed the SAP Group’s internal control, risk management, and internal auditing systems, and found the systems to be effective.
The Committee also reported that KPMG had told it that no circumstances had arisen that might give cause for concern about KPMG’s impartiality, and informed us about the services KPMG had provided that were not part of the audit. The Committee reported that it had examined the auditor’s independence, taking the non-audit services it had rendered into consideration, and stated that in the Committee’s opinion the auditor possessed the required degree of independence and expertise.
The Audit Committee and the Supervisory Board satisfied themselves that KPMG had conducted the audit properly. In particular, they concluded that both the audit reports and the audit itself fulfilled the legal requirements. On the basis of the report and the Audit Committee’s recommendation, the Supervisory Board approved the audit and, since there were no findings from our own examination, we gave our consent to the SAP SE financial statements, the consolidated financial statements, and the combined management report, as well as the combined non-financial report pursuant to the German Commercial Code, sections 315b and 289b. The financial statements and combined management report were thus formally adopted upon approval by the Supervisory Board. The Supervisory Board’s opinion of the Company and the Group coincided with that of the Executive Board as set out in the combined management report. The Supervisory Board considered the proposal presented by the Executive Board concerning the appropriation of retained earnings. We had regard to the requirements of dividends policy, the effects on the liquidity of SAP SE and the Group, and the interests of the shareholders. We also discussed these matters with the auditor. We then endorsed the Executive Board’s proposal concerning the appropriation of retained earnings, in accordance with the Audit Committee’s recommendation. Finally, we approved this present Report.
Changes on the Supervisory and Executive Boards
The Supervisory Board mandate of Erhard Schipporeit ended at the close of the Annual General Meeting of Shareholders on May 15, 2019. On that day, the Annual General Meeting reelected all other Supervisory Board members standing for election by it, and appointed Gunnar Wiedenfels as a new member to the Supervisory Board. On the employee representatives’ side, Martin Duffek, Andreas Hahn, Pierre Thiollet, Sebastian Sick, and Robert Schuschnig-Fowler left the Supervisory Board at the end of the May 15, 2019, Annual General Meeting. Monika Kovachka-Dimitrova, Heike Steck, Christa Vergien-Knopf, James Wright, and Ralf Zeiger were elected as their successors and took up their mandates that same day.
Jürgen Müller joined to the Executive Board on January 1, 2019, and is responsible for the Board area Technology & Innovation. Bernd Leukert and Rob Enslin resigned from the Executive Board effective March 31, 2019, and April 5, 2019, respectively. On October 10, 2019, the Executive Board members Jennifer Morgan and Christian Klein were appointed as Co-CEOs of SAP. Bill McDermott left the Executive Board at his own request on November 15, 2019, after previously stepping down as CEO on October 10, 2019. Thomas Saueressig was appointed to the Executive Board effective November 1, 2019, and oversees SAP’s product development.
The Supervisory Board would like to sincerely thank its members, as well as the Executive Board members who relinquished their functions in the year under review, for their invaluable contribution to the success of the Company.
The Supervisory Board also thanks the current members of the Executive Board and all SAP employees for their great commitment and dedication in 2019.
For the Supervisory Board
Professor Hasso Plattner
(Chairperson)
22 | Report by the Supervisory Board |
To Our
Stakeholders | Combined Group
Management Report | Consolidated Financial
Statements IFRS | Further Information on Economic,
Environmental, and Social Performance | Additional
Information |
Compensation Report
Note: This compensation report is part of the audited management report.
Compensation for Executive and Supervisory Board Members
This compensation report describes the compensation system, outlines the criteria that apply to the compensation for Executive Board and Supervisory Board members for the year 2019, and discloses the amount of compensation. In addition, it discloses an outlook of the changes to the compensation system for the year 2020.
Compensation for Executive Board Members
Compensation System for 2019
The compensation for Executive Board members is intended to reflect the demanding role of Executive Board members leading a global company in a rapidly evolving sector. The compensation level is aimed to be competitive to support SAP in the global market for highly skilled executives, especially in the context of the software industry. It is our goal that our Executive Board compensation provides sustainable incentive for committed, successful work in a dynamic business environment.
The Supervisory Board – supported by its General and Compensation Committee – determines the compensation for each Executive Board member based on their individual role and performance in its first regular meeting of each fiscal year. For more information about the work of the Supervisory Board and its committees, see the Report by the Supervisory Board. As pictured below, the compensation contains performance-based elements and non-performance-based elements:
The amount of performance-based compensation depends primarily on SAP’s performance against predefined financial target values (Key Performance Indicators, KPIs) and on the SAP share price, and is subject to hurdles and caps. These KPIs and their target values as well as their weighting are set by the Supervisory Board each plan year and are aligned to the SAP budget for that year.
The Supervisory Board sets the individual total target compensation for each Executive Board member, comprised of the fixed compensation element and the two performance-based elements. This target compensation is benchmarked based on SAP’s global strategy, market position, business performance and future prospects of economy, and the compensation paid at comparable national and international companies. The Supervisory Board also considers the compensation systems applicable for the rest of the Company, comparing Executive Board pay with the pay of SAP executives and non-executive SAP employees. The performance-based elements each correspond to a target achievement of 100% of all KPIs. The Supervisory Board reviews, assesses, and sets these compensation targets, in its first meeting of each fiscal year (February 20, 2019, for 2019). The Supervisory Board is of the opinion that this approach ensures that the compensation is appropriate.
The compensation system is designed to support the growth in value for the Company over the long term. The long-term incentive element therefore has significant weighting, making up about two-thirds of the Co-CEOs’ compensation target, and more than 50% of each Executive Board member’s compensation target.
In the case of any extraordinary, unforeseeable events, the Supervisory Board is entitled, at its reasonable discretion, to adjust the performance-based compensation before payout upwards or downwards in the interest of SAP. No corrections to the payout amounts paid in May 2019 were made.
The individual elements of SAP’s Executive Board compensation are described in more detail below.
Non-Performance-Based Compensation
Fixed Compensation
The fixed compensation is paid monthly in 12 equal installments in the Executive Board member’s home currency1).
Fringe Benefits
The contractually guaranteed fringe benefits mainly comprise additional benefits such as insurance contributions, benefits in kind, expenses for maintenance of two households, use of aircraft, and tax gross-ups according to local conditions.
1) Home currency is the currency of the Executive Board member’s primary place of residence.
To Our
Stakeholders | Combined Group
Management Report | Consolidated Financial
Statements IFRS | Further Information on Economic,
Environmental, and Social Performance | Additional
Information |
Performance-Based Compensation
Short-Term Incentive
The short-term, one-year performance-based compensation (Short-Term Incentive, STI) is determined based on a set of financial targets (KPIs).
For the STI 2019, the financial KPIs are: Constant currency new cloud bookings in 2019, year-over-year growth in non-IFRS constant currency cloud and software revenue in 2019, and non-IFRS constant currency operating margin in 2019. The KPIs and their respective target values are derived from SAP’s budget for that year. For more information about financial KPIs, see the Performance Management System section.
If the weighted target achievement for the financial KPIs is below 75%, there is no STI payout. In this case, the target achievement for these KPIs is set to zero.
On February 19, 2020, the Supervisory Board assessed SAP’s performance against the agreed targets and determined the amount of the STI 2019 for the entire Executive Board. This resulted in a target achievement of 82.4% (cloud and software revenue growth of 106.4%, operating margin increase of 130.8%, and new cloud bookings of 31.2%).
The STI compensation for 2019 will be paid out after the Annual General Meeting of Shareholders in May 2020. It is paid in the Executive Board member’s home currency1). All Executive Board members are obliged to purchase SAP shares worth at least 5% of the actual payout amount in accordance with appropriate trading period regulations. These shares are subject to a three-year holding period.
Long-Term Incentive
The purpose of the long-term, multi-year performance-based compensation (Long-Term Incentive, LTI) is to reward the annual achievement of the non-IFRS constant currency operating profit, to ensure long-term retention of our Executive Board members (Retention), and to reward them for a long-term SAP share price performance (Performance) as compared to its main peer group (Peer Group).
The LTI 2016 plan came into effect on January 1, 2016. It is a virtual share program with a term of four years per tranche.
Under the plan, a new LTI tranche is granted annually. Each grant starts with determining a grant amount in euros. This grant amount is based on the Executive Board members’ contractual LTI target amount and the operating profit target achievement (non-IFRS, at constant currency) for the previous year. Taking this target achievement into account, the grant amount can be adjusted upwards or downwards in the range of 80% to 120% of the contractual LTI target amount. The 2018 operating profit target achievement was 101.9%. Considering this, the Supervisory Board set the grant amount of the 2019 tranche at 101.9% of the contractual LTI target amount.
This grant amount is converted into virtual shares (Share Units), so that Executive Board members participate in further share price developments. The grant price is the arithmetic mean of the XETRA closing prices of SAP stock on the 20 trading days following publication of SAP’s fourth-quarter results. The grant date of the 2019 tranche was February 20, 2019.
All Share Units granted in this way, comprising 60% Performance Share Units (PSUs) and 40% Retention Share Units (RSUs), have a vesting period of approximately four years, during which the Executive Board member must actively contribute to the Company’s operations. The value of the Share Units varies positively and negatively with the performance of SAP’s share price. At the end of the vesting period, the corresponding Share Units are non-forfeitable.
1) Home currency is the currency of the Executive Board member’s primary place of residence.
To Our
Stakeholders | Combined Group
Management Report | Consolidated Financial
Statements IFRS | Further Information on Economic,
Environmental, and Social Performance | Additional
Information |
LTI Grant Process
The payout price used for the settlement is the simple arithmetic mean of the XETRA closing prices of SAP stock on the 20 trading days following the publication of SAP’s fourth-quarter results subsequent to the end of the vesting period. The payout price is capped at 300% of the grant price. The LTI tranche is paid in euros after the Annual General Shareholders’ Meeting of the corresponding year. Any potential foreign currency exchange rate risk is borne by the Executive Board members themselves.
The number of Share Units that will finally result in payments to the Executive Board members can and will likely differ from the number originally granted. The number of PSUs ultimately paid out changes depending on the performance of the SAP share relative to the Peer Group Index at the end of the vesting period. This places more weight on SAP’s performance within the industry. In contrast, the final number of RSUs is fixed. However, both types of Share Units may expire during the entire term of a tranche under certain conditions (see the “LTI Forfeiture Rules” graphic below).
PSU Calculation

SAP’s share price performance is measured by comparing the grant price against the payout price. We calculate the difference between SAP’s share price performance and the Peer Group Index performance. In case of an increased SAP share price and an outperformance against the Peer Group Index, the calculated difference is doubled to reward positive performance.
To Our
Stakeholders | Combined Group
Management Report | Consolidated Financial
Statements IFRS | Further Information on Economic,
Environmental, and Social Performance | Additional
Information |
The following examples of the PSU calculation illustrate possible outcomes assuming 1,000 PSUs granted:
SAP share price performs better than Peer Group Index | | |
SAP share price performance | | +18% |
Peer Group Index performance | | +10% |
Difference | +18% – (+10%) | +8% |
Performance factor with doubled difference | (+8% x 2) + 100% | 116% |
Final number of PSUs | 116% x 1,000 | 1,160 |
SAP share price performs much higher than Peer Group Index; cap is triggered | | |
SAP share price performance | | +30% |
Peer Group Index performance | | –5% |
Difference | +30% – (–5%) | +35% |
Performance factor with doubled difference | (+35% x 2) + 100% | 170% |
| Capped at | 150% |
Final number of PSUs | 150% x 1,000 | 1,500 |
Peer Group Index performs better than SAP share price | | |
SAP share price performance | | +5% |
Peer Group Index performance | | +10% |
Difference | +5% – (+10%) | –5% |
Performance factor | –5% + 100% | 95% |
Final number of PSUs | 95% x 1,000 | 950 |
Peer Group Index performs better than SAP share price; low hurdle is triggered | | |
SAP share price performance | | –10% |
Peer Group Index performance | | +50% |
Difference | –10% – (+50%) | –60% |
Performance factor | –60% + 100% | 40% |
| Hurdle is 50% | 0% |
Final number of PSUs | 0% x 1,000 | 0 |
The Peer Group Index currently includes the following major international competitors of SAP: Adobe, Microsoft, IBM, Salesforce, Oracle, VMWare, ServiceNow, Workday, and NortonLifeLock (formerly Symantec). The Supervisory Board has defined this group based on internal and external recommendations and, if necessary, adjusts the group. In 2019, Tableau was delisted and therefore removed without replacement from the group. The Peer Group Index is calculated as a price index based on weighted market capitalization. The weighting is adjusted quarterly, applying a cap of 15%. Consequently, the weight of smaller, more volatile competitors is increased in relation to their size, resulting in a highly ambitious index. The index is calculated daily by Deutsche Börse Group and can be tracked under ISIN DE000A2BLEB9.
Composition and Weighting of Peer Group Index

LTI Forfeiture Rules
If an Executive Board member’s service contract is terminated before the end of the third year following the year in which the Share Units were granted, both the PSUs and RSUs are forfeited in whole or in part, depending on the circumstances of the relevant resignation from office or termination of the service contract. In case PSUs and RSUs are forfeited in part, the percentage of the forfeiture is proportional to the four-year vesting period of each grant. This means that 25% of the grant is earned each year of the vesting period. Unearned grants are forfeited.
To Our
Stakeholders | Combined Group
Management Report | Consolidated Financial
Statements IFRS | Further Information on Economic,
Environmental, and Social Performance | Additional
Information |
LTI Forfeiture Rules
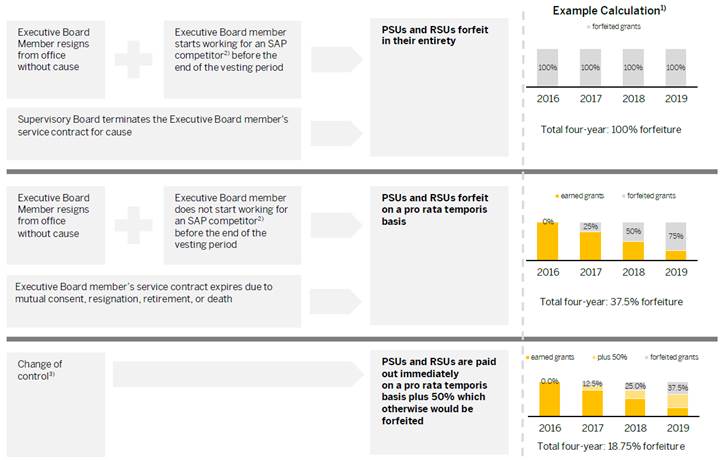
1) Example calculation with four tranches (grant allocation of 100%, stable share price from grant to vest, and no consideration of performance condition);
Executive Board member’s contract terminates after year four (December 31, 2019).
2) As defined in the individual Executive Board members’ contracts; this is not equal to the companies listed in the Peer Group Index.
3) For the definition, see the Early End-of-Service Undertakings section.
The change from the previous RSU Milestone Plan to the LTI 2016 Plan required a transition rule in order to avoid unjustified disadvantages for Executive Board members. In the event an Executive Board member leaves the company, the disadvantage arises from the difference in the one-year vesting period in the RSU Milestone Plan in comparison to the four-year vesting period in the LTI 2016 Plan. In order to compensate for this disadvantage related to the vesting periods, an individual equalization amount was determined for Executive Board members who participated in the RSU Milestone Plan.
The equalization amount has been subject to:
– A target achievement of at least 60% of the non-IFRS constant currency operating profit target, and
– An ongoing employment relationship in 2016, 2017, and, in one case, in 2018.
In the event an Executive Board member leaves the company and PSUs would otherwise be forfeited on a pro rata basis, the Executive Board member is entitled to PSUs equal to the equalization amount. The following graphic gives an example of how the equalization amount was derived, assuming a grant of €1,000 for the RSU Milestone Plan, a grant of €1,500 for the LTI 2016 Plan, and a forfeiture of the grants on a pro rata temporis basis on December 31, 2019:

To Our
Stakeholders | Combined Group
Management Report | Consolidated Financial
Statements IFRS | Further Information on Economic,
Environmental, and Social Performance | Additional
Information |
Clawback Provisions
SAP has the contractual right to request that the Executive Board member returns any payments made from STI or LTI if it subsequently emerges that the payment was not justified in whole or in part because targets were not achieved at all or not achieved in the scope assumed when calculating the payment amount due on account of false information having been provided. In such case, the Executive Board member is obliged to repay to SAP the amount by which the payment actually made exceeds the payment amount due on the basis of the targets actually achieved. Such contractually agreed claim to repayment supplements the claim for restitution of unjustified enrichment pursuant to section 812 of the German Civil Code (BGB).
Minimum and Maximum Compensation
The minimum compensation amount reflects the fixed compensation amount and an LTI and STI payout of zero.
The maximum compensation amount is capped at 347% (Co-CEO) and 317% (Executive Board member other than Co-CEO) of the total target compensation of the Executive Board members who were employed at year end. Due to the change during the year, we have annualized the compensation for our calculation. This would be achieved in the event of the maximum possible payout amount of the STI and the LTI, as follows:
– The maximum possible payout amount of the STI is reached when the target achievement of all financial KPIs is 140%.
– The maximum possible payout amount for the LTI tranche is 468% of the contractual target amount.
The maximum possible payout amount of the LTI is reached if all of the following conditions are cumulatively met:
– The grant amount for the LTI tranche has been set at its capped maximum of 120% of the contractual target amount.
– SAP’s share price outperforms the Peer Group Index by at least 25 percentage points (reaching the capped maximum 150% of the initial PSU allocation for that year).
– The SAP share price has at least tripled (corresponding to an average annual increase of approximately 32%) compared to the grant price (cap on share price development).
In the event of the maximum LTI payout for the entire Executive Board of €117 million in 2023, the shareholders would also benefit through the strong increase in market capitalization, which would be at least €200 billion from 2019 to 2023.
The following graphic illustrates the relation of the fixed and performance-based compensation elements in the Executive Board members’ target compensation for 2019 based on € amounts, as well as the minimum and maximum possible compensation. The height of the bars is not indicative of the absolute compensation amount.
Compensation Scheme 2019

Overview of the Relations Between Target and Payout for Performance-Based Compensation
The total target achievements of STI reflect the relation between the target amount and the payout amount. The STIs for the years 2015 to 2018 were already paid out.
STI Total Target Achievement
Percentage | | | | 2019 | | 2018 | | 2017 | | 2016 | | 2015 |
| | | | 82.4 | | 93.0 | | 88.2 | | 104.4 | | 147.5 |
The relation between the LTI target amounts for the 2016 to 2019 tranches and the theoretical payout amounts are based on SAP’s share price at year end. The 2015 tranche discloses the relation between the respective target amount and the actual payout amount in May 2019.
Relation Between Target Amount and Payout Amount of the LTI
Percentage | | | | | | | | LTI 2016 Plan | | RSU
Milestone
Plan 2015 | |
| | 2019
Tranche1) | | 2018
Tranche1) | | 2017
Tranche1) | | 2016
Tranche1) | | 2015
Tranche2) | |
12/31/2019 | | 156.6 | | 126.4 | | 110.5 | | 76.8 | | 233.8 | |
12/31/2018 | | NA | | 90.9 | | 82.6 | | 55.5 | | 233.8 | |
1) Consideration of theoretical payout amounts based on SAP’s share price at year end
2) Consideration of individual adjustment factor in addition to target achievement 2015 ranging between 31.62% and 37.38%
To Our
Stakeholders | Combined Group
Management Report | Consolidated Financial
Statements IFRS | Further Information on Economic,
Environmental, and Social Performance | Additional
Information |
Changes to Compensation System for 2020
General
For 2020 and beyond, the Supervisory Board established changes to the STI and LTI to align compensation to support SAP’s strategy, including business transformation and medium-term prospects. The changes were based on analysis of market best practice and feedback from investors.
Short-Term Incentive
The major differences in the STI 2020 compared to the previous STI are as follows:
– Introduction of sustainability targets (sustainability KPIs) with a total weighting of 20% in addition to the financial targets (financial KPIs). The sustainability KPIs are: Customer Net Promoter Score, which measures SAP’s customer loyalty; Employee Engagement Index, which measures SAP’s employee commitment, pride, and loyalty; and Carbon Impact, which measures SAP’s greenhouse gas emissions.
– Replacement of the financial KPI new cloud bookings by current cloud backlog, which includes new contracts as well as renewals of existing contracts and thus reflects cloud growth more holistically than the cloud bookings metric.
– Limitation of the Supervisory Board’s discretion to adjust the performance-based compensation for the STI before payout upwards or downwards in the interest of SAP for cases of extraordinary, unforeseeable events, to a range of +/–20%.
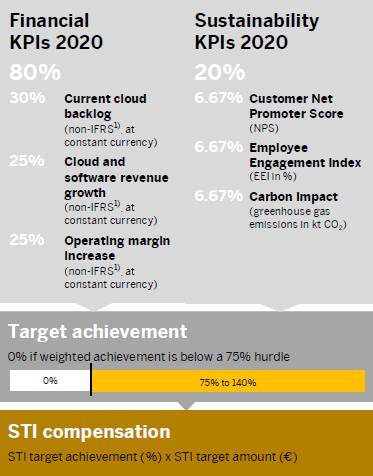
1) Based on SAP’s non-IFRS metrics as defined for use in SAP’s 2019 full year external financial reporting
Each underlying KPI includes a hurdle and a cap in addition to the overall hurdle of 75% and the overall cap of 140%. In the event that the hurdle for the individual KPIs is missed and results in the weighted target achievement also falling below the overall hurdle of 75%, the individual hurdle for the respective KPI will be ignored.
Long-Term Incentive
The Supervisory Board introduced a new long-term multi-year performance-based compensation plan effective from 2020 and onwards: the SAP Long Term Incentive Program 2020 (LTI 2020).
The LTI 2020 reflects SAP’s strategy, rewards the development of SAP’s total shareholder return (TSR) in comparison to the market, and has a retention element. It is a financially rewarding instrument for attracting and retaining SAP’s Executive Board members, who play a key role in increasing the earnings power and in enhancing the value of SAP over the long term.
The major differences in the LTI 2020 compared to the previous LTI plan are as follows:
– The discretion element in determining the grant amount has been eliminated. Therefore, the grant amount is the contractually agreed target amount.
– SAP’s performance of the Market Performance Share Units (MSUs) is now measured based on total shareholder return (previous plan: share price) and compared against the NASDAQ-100 Index (previous plan: SAP Peer Group Index) over three years (previous plan: four years).
– The achievement of financial targets is rewarded with Financial Performance Share Units (FSUs) with a performance period of three years. The financial targets are set in line with SAP’s communicated mid-term ambition for 2023. (previous plan: no FSUs).
– The RSU component has been reduced to 33.3% (previous plan: 40%).
– The payout will include the share price as well as dividends (previous plan: only share price).
– The payout is capped at 200% of the grant price (previous plan: 300%).
– In case of death or disability, the unearned grant will vest in full according to the payout schedule (previous plan: forfeits on a pro rata temporis basis).
– The Supervisory Board limited the extent of the discretion to adjust the performance-based compensation for the LTI before payout upwards or downwards in the interest of SAP for cases of extraordinary, unforeseeable events, to a range of +/–10% (previous plan: no limitation).
To Our
Stakeholders | Combined Group
Management Report | Consolidated Financial
Statements IFRS | Further Information on Economic,
Environmental, and Social Performance | Additional
Information |
LTI Grant Process
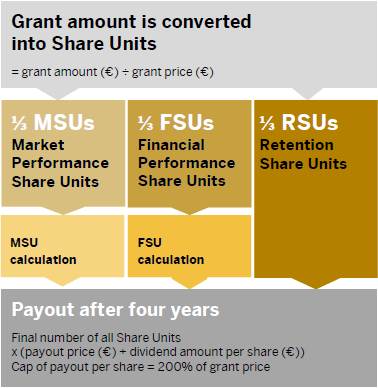
The vesting period of four years remains unchanged. In connection with Michael Kleinemeier’s contract extension, a vesting period of one year has been agreed for his 2020 tranche.
MSU Calculation
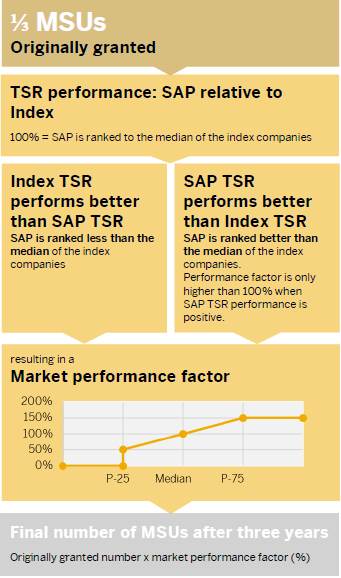
SAP’s total shareholder return (TSR) performance is measured over the three-year measurement period and ranked in relation to the TSR performance of the companies of the NASDAQ-100 Index. TSR means the performance of the share combining share price development and granted and reinvested dividends. The market performance factor has a cap at 150% at the 75th percentile (P-75) and a hurdle of 50% at 25th percentile (P-25), below the hurdle no MSUs are considered.
To Our
Stakeholders | Combined Group
Management Report | Consolidated Financial
Statements IFRS | Further Information on Economic,
Environmental, and Social Performance | Additional
Information |
The following examples of the MSU calculation illustrate possible outcomes assuming 1,000 MSUs granted:
SAP TSR performs better than TSR of NASDAQ-100 companies; cap is triggered | | |
SAP TSR performance | | +18% |
| | |
Performance factor | 80th percentile | 160% |
| Cap 75th percentile | 150% |
Final number of MSUs | 150% x 1,000 | 1,500 |
SAP TSR performs better than TSR of NASDAQ-100 companies; in a downwards market trend | | |
SAP TSR performance | | –5% |
| | |
Performance factor | 55th percentile | 110% |
| Cap positive performance | 100% |
Final number of MSUs | 100% x 1,000 | 1,000 |
TSR of NASDAQ-100 companies perform better than SAP TSR; low hurdle is triggered | | |
SAP TSR performance | | –5% |
| | |
Performance factor | 20th percentile | 40% |
| Hurdle 25th percentile | 0% |
Final number of MSUs | 0% x 1,000 | 0 |
FSU Calculation

1) Based on SAP’s non-IFRS metrics as defined for use in SAP’s 2019 full-year external financial reporting
The final number of FSUs changes depending on SAP’s performance against the financial KPI targets over the entire three-year performance period. The financial KPIs are derived from SAP’s communicated mid-term ambition for 2023. Cloud revenue and total revenue have a cap of 120% and a hurdle of 80% target achievement, while operating income has a cap of 110% and a hurdle of 90% target achievement.
To Our
Stakeholders | Combined Group
Management Report | Consolidated Financial
Statements IFRS | Further Information on Economic,
Environmental, and Social Performance | Additional
Information |
Compensation Scheme 2020

Amount of Compensation for 2019
We present the Executive Board compensation disclosures in accordance with the recommendations of the German Corporate Governance Code (“GCGC”). Furthermore, the tables below provide a reconciliation statement following the requirements of sections 314 and 315 of the German Commercial Code (Handelsgesetzbuch, or “HGB”) as specified in the German Accounting Standards (“GAS 17”). Pursuant to the recommendations of the GCGC, the value of benefits granted for the year under review as well as the benefits received, that is, the amounts disbursed for the year under review, are disclosed below based on the reference tables recommended in the GCGC. In contrast to the disclosure rules stipulated in the German HGB and GAS 17, the GCGC includes the pension expense, that is, the service cost according to IAS 19, in the Executive Board compensation and requires the additional disclosure of the target value for the one-year variable compensation and the maximum and minimum compensation amounts achievable for the variable compensation elements.
Executive Board Members’ Compensation
German Corporate Governance Code
€ thousands | | Christian Klein
(Co-CEO from 10/10/2019) | | Jennifer Morgan
(Co-CEO from 10/10/2019) | |
| | Benefits Granted | | Benefits Received | | Benefits Granted | | Benefits Received | |
| | 2019 | | 2019 | | 2019 | | 2018 | | 2019 | | 2018 | | 20191) | | 2019 | | 2019 | | 20181) | | 20191) | | 20181) | |
| | | | (Min) | | (Max) | | | | | | | | | | (Min) | | (Max) | | | | | | | |
Fixed compensation | | 789.9 | | 789.9 | | 789.9 | | 700.0 | | 789.9 | | 700.0 | | 762.1 | | 762.1 | | 762.1 | | 634.3 | | 762.1 | | 634.3 | |
Fringe benefits2) | | 14.8 | | 14.8 | | 14.8 | | 13.1 | | 14.8 | | 13.1 | | 125.8 | | 125.8 | | 125.8 | | 128.4 | | 125.8 | | 128.4 | |
Total | | 804.7 | | 804.7 | | 804.7 | | 713.1 | | 804.7 | | 713.1 | | 887.9 | | 887.9 | | 887.9 | | 762.7 | | 887.9 | | 762.7 | |
One-year variable compensation | | 1,301.8 | | 0 | | 1,822.5 | | 1,125.8 | | 1,046.9 | | | | 1,251.5 | | 0 | | 1,752.1 | | 1,052.0 | | 978.4 | | 594.6 | |
Multi-year variable compensation | | | | | | | | | | | | | | | | | | | | | | | | | |
LTI 2016 Plan | | 3,407.9 | | 0 | | 12,260.1 | | 1,793.2 | | | | | | 3,731.2 | | 0 | | 13,424.8 | | 2,128.8 | | | | | |
RSU Milestone Plan 2015 | | | | | | | | | | | | | | | | | | | | | | | | | |
Total | | 5,514.4 | | 804.7 | | 14,887.3 | | 3,632.1 | | 1,851.6 | | 713.1 | | 5,870.5 | | 887.9 | | 16,064.8 | | 3,943.5 | | 1,866.2 | | 1,357.3 | |
Service cost | | | | | | | | | | | | | | 104.6 | | 104.6 | | 104.6 | | 51.4 | | 104.6 | | 51.4 | |
Total according to GCGC | | 5,514.4 | | 804.7 | | 14,887.3 | | 3,632.1 | | 1,851.6 | | 713.1 | | 5,975.1 | | 992.5 | | 16,169.4 | | 3,994.9 | | 1,970.8 | | 1,408.7 | |
To Our
Stakeholders | Combined Group
Management Report | Consolidated Financial
Statements IFRS | Further Information on Economic,
Environmental, and Social Performance | Additional
Information |
German Corporate Governance Code
€ thousands | | Robert Enslin
Member of the Executive Board (until 4/5/2019) | | Adaire Fox-Martin
Member of the Executive Board | |
| | Benefits Granted | | Benefits Received | | Benefits Granted | | Benefits Received | |
| | 20191) | | 2019 | | 2019 | | 20181) | | 20191) | | 20181) | | 2019 | | 2019 | | 2019 | | 2018 | | 2019 | | 2018 | |
| | | | (Min) | | (Max) | | | | | | | | | | (Min) | | (Max) | | | | | | | |
Fixed compensation | | 219.7 | | 219.7 | | 219.7 | | 800.2 | | 219.7 | | 800.2 | | 700.0 | | 700.0 | | 700.0 | | 700.0 | | 700.0 | | 700.0 | |
Fringe benefits2) | | 202.1 | | 202.1 | | 202.1 | | 105.1 | | 202.1 | | 105.1 | | 31.0 | | 31.0 | | 31.0 | | 54.6 | | 31.0 | | 54.6 | |
Total | | 421.8 | | 421.8 | | 421.8 | | 905.3 | | 421.8 | | 905.3 | | 731.0 | | 731.0 | | 731.0 | | 754.6 | | 731.0 | | 754.6 | |
One-year variable compensation | | 1,352.8 | | 0 | | 1,893.9 | | 1,327.3 | | 1,234.4 | | 1,117.7 | | 1,125.8 | | 0 | | 1,576.1 | | 1,125.8 | | 1,046.9 | | 666.5 | |
Multi-year variable compensation | | | | | | | | | | | | | | | | | | | | | | | | | |
LTI 2016 Plan | | 2,545.6 | | 0 | | 10,062.8 | | 2,270.3 | | | | | | 2,823.1 | | 0 | | 10,873.8 | | 2,128.8 | | | | | |
RSU Milestone Plan 2015 | | | | | | | | | | 3,628.6 | | 1,248.8 | | | | | | | | | | | | | |
Total | | 4,320.2 | | 421.8 | | 12,378.5 | | 4,502.9 | | 5,284.8 | | 3,271.8 | | 4,679.9 | | 731.0 | | 13,180.9 | | 4,009.2 | | 1,777.9 | | 1,421.1 | |
Service cost | | 177.5 | | 177.5 | | 177.5 | | 235.8 | | 177.5 | | 235.8 | | | | | | | | | | | | | |
Total according to GCGC | | 4,497.7 | | 599.3 | | 12,556.0 | | 4,738.7 | | 5,462.3 | | 3,507.6 | | 4,679.9 | | 731.0 | | 13,180.9 | | 4,009.2 | | 1,777.9 | | 1,421.1 | |
€ thousands | | Michael Kleinemeier
Member of the Executive Board | | Bernd Leukert
Member of the Executive Board (until 3/31/2019) | |
| | Benefits Granted | | Benefits Received | | Benefits Granted | | Benefits Received | |
| | 2019 | | 2019 | | 2019 | | 2018 | | 2019 | | 2018 | | 2019 | | 2019 | | 2019 | | 2018 | | 2019 | | 2018 | |
| | | | (Min) | | (Max) | | | | | | | | | | (Min) | | (Max) | | | | | | | |
Fixed compensation | | 700.0 | | 700.0 | | 700.0 | | 700.0 | | 700.0 | | 700.0 | | 175.0 | | 175.0 | | 175.0 | | 700.0 | | 175.0 | | 700.0 | |
Fringe benefits2) | | 29.0 | | 29.0 | | 29.0 | | 29.1 | | 29.0 | | 29.1 | | 2.3 | | 2.3 | | 2.3 | | 10.3 | | 2.3 | | 10.3 | |
Total | | 729.0 | | 729.0 | | 729.0 | | 729.1 | | 729.0 | | 729.1 | | 177.3 | | 177.3 | | 177.3 | | 710.3 | | 177.3 | | 710.3 | |
One-year variable compensation | | 1,125.8 | | 0 | | 1,576.1 | | 1,125.8 | | 1,046.9 | | 992.9 | | 1,125.8 | | 0 | | 1,576.1 | | 1,125.8 | | 1,046.9 | | 992.9 | |
Multi-year variable compensation | | | | | | | | | | | | | | | | | | | | | | | | | |
LTI 2016 Plan | | 2,387.0 | | 0 | | 9,435.6 | | 2,128.8 | | | | | | 2,688.6 | | 0 | | 10,627.9 | | 2,397.7 | | | | | |
RSU Milestone Plan 2015 | | | | | | | | | | 473.8 | | | | | | | | | | | | 3,773.2 | | 1,248.8 | |
Total | | 4,241.7 | | 729.0 | | 11,740.6 | | 3,983.7 | | 2,249.7 | | 1,722.0 | | 3,991.6 | | 177.3 | | 12,381.3 | | 4,233.8 | | 4,997.4 | | 2,952.0 | |
Service cost | | | | | | | | | | | | | | | | | | | | | | | | | |
Total according to GCGC | | 4,241.7 | | 729.0 | | 11,740.6 | | 3,983.7 | | 2,249.7 | | 1,722.0 | | 3,991.6 | | 177.3 | | 12,381.3 | | 4,233.8 | | 4,997.4 | | 2,952.0 | |
To Our
Stakeholders | Combined Group
Management Report | Consolidated Financial
Statements IFRS | Further Information on Economic,
Environmental, and Social Performance | Additional
Information |
German Corporate Governance Code | | | | | | | | | | | |
€ thousands | | Bill McDermott
(CEO until 10/10/2019,
member of the Executive Board until 11/15/2019) | | Luka Mucic
Member of the Executive Board | |
| | Benefits Granted | | Benefits Received | | | | | | Benefits Granted | | Benefits Received | |
| | 20191) | | 2019
(Min) | | 2019
(Max) | | 20181) | | 20191) | | 20181) | | 2019 | | 2019
(Min) | | 2019
(Max) | | 2018 | | 2019 | | 2018 | |
Fixed compensation | | 1,212.0 | | 1,212.0 | | 1,212.0 | | 1,314.7 | | 1,212.0 | | 1,314.7 | | 700.0 | | 700.0 | | 700.0 | | 700.0 | | 700.0 | | 700.0 | |
Fringe benefits2) | | 1,123.6 | | 1,123.6 | | 1,123.6 | | 794.7 | | 1,123.6 | | 794.7 | | 12.0 | | 12.0 | | 12.0 | | 11.8 | | 12.0 | | 11.8 | |
Total | | 2,335.6 | | 2,335.6 | | 2,335.6 | | 2,109.4 | | 2,335.6 | | 2,109.4 | | 712.0 | | 712.0 | | 712.0 | | 711.8 | | 712.0 | | 711.8 | |
One-year variable compensation | | 2,235.2 | | 0 | | 3,129.3 | | 2,193.0 | | 2,039.5 | | 1,846.7 | | 1,125.8 | | 0 | | 1,576.1 | | 1,125.8 | | 1,046.9 | | 992.9 | |
Multi-year variable compensation | | | | | | | | | | | | | | | | | | | | | | | | | |
LTI 2016 Plan | | 7,710.6 | | 0 | | 30,479.5 | | 6,876.6 | | | | | | 2,387.0 | | 0 | | 9,435.6 | | 2,128.8 | | | | | |
RSU Milestone Plan 2015 | | | | | | | | | | 10,315.3 | | 5,251.0 | | | | | | | | | | 3,732.5 | | 949.5 | |
Total | | 12,281.3 | | 2,335.6 | | 35,944.4 | | 11,179.0 | | 14,690.4 | | 9,207.1 | | 4,224.7 | | 712.0 | | 11,723.6 | | 3,966.4 | | 5,491.4 | | 2,654.2 | |
Service cost | | 486.5 | | 486.5 | | 486.5 | | 568.3 | | 486.5 | | 568.3 | | | | | | | | | | | | | |
Total according to GCGC | | 12,767.8 | | 2,822.1 | | 36,430.9 | | 11,747.3 | | 15,176.9 | | 9,775.4 | | 4,224.7 | | 712.0 | | 11,723.6 | | 3,966.4 | | 5,491.4 | | 2,654.2 | |
€ thousands | | Jürgen Müller
Member of the Executive Board (from 1/1/2019) | | Stefan Ries
Member of the Executive Board | |
| | Benefits Granted | | Benefits Received | | Benefits Granted | | Benefits Received | |
| | 2019 | | 2019
(Min) | | 2019
(Max) | | 2018 | | 2019 | | 2018 | | 2019 | | 2019
(Min) | | 2019
(Max) | | 2018 | | 2019 | | 2018 | |
Fixed compensation | | 700.0 | | 700.0 | | 700.0 | | | | 700.0 | | | | 700.0 | | 700.0 | | 700.0 | | 700.0 | | 700.0 | | 700.0 | |
Fringe benefits2) | | 13.5 | | 13.5 | | 13.5 | | | | 13.5 | | | | 21.8 | | 21.8 | | 21.8 | | 21.9 | | 21.8 | | 21.9 | |
Total | | 713.5 | | 713.5 | | 713.5 | | 0 | | 713.5 | | 0 | | 721.8 | | 721.8 | | 721.8 | | 721.9 | | 721.8 | | 721.9 | |
One-year variable compensation | | 1,125.8 | | 0 | | 1,576.1 | | | | | | | | 1,125.8 | | 0 | | 1,576.1 | | 1,125.8 | | 1,046.9 | | 992.9 | |
Multi-year variable compensation | | | | | | | | | | | | | | | | | | | | | | | | | |
LTI 2016 Plan | | 2,185.8 | | 0 | | 8,640.5 | | | | | | | | 2,010.7 | | 0 | | 7,948.3 | | 1,793.2 | | | | | |
RSU Milestone Plan 2015 | | | | | | | | | | | | | | | | | | | | | | | | | |
Total | | 4,025.1 | | 713.5 | | 10,930.1 | | 0 | | 713.5 | | 0 | | 3,858.3 | | 721.8 | | 10,246.2 | | 3,640.9 | | 1,768.7 | | 1,714.8 | |
Service cost | | | | | | | | | | | | | | | | | | | | | | | | | |
Total according to GCGC | | 4,025.1 | | 713.5 | | 10,930.1 | | 0 | | 713.5 | | 0 | | 3,858.3 | | 721.8 | | 10,246.2 | | 3,640.9 | | 1,768.7 | | 1,714.8 | |
To Our
Stakeholders | Combined Group
Management Report | Consolidated Financial
Statements IFRS | Further Information on Economic,
Environmental, and Social Performance | Additional
Information |
German Corporate Governance Code | | | | | | | | | |
€ thousands | | Thomas Saueressig
Member of the Executive Board (from 11/1/2019) | | Total Executive Board | |
| | Benefits Granted | | Benefits Received | | Benefits Granted | | Benefits Received | |
| | 2019 | | 2019
(Min) | | 2019
(Max) | | 2018 | | 2019 | | 2018 | | 2019 | | 2018 | | 2019 | | 2018 | |
Fixed compensation | | 116.7 | | 116.7 | | 116.7 | | | | 116.7 | | | | 6,775.3 | | 6,949.2 | | 6,775.3 | | 6,949.2 | |
Fringe benefits2) | | 2.1 | | 2.1 | | 2.1 | | | | 2.1 | | | | 1,578.0 | | 1,169.0 | | 1,578.0 | | 1,169.0 | |
Total | | 118.8 | | 118.8 | | 118.8 | | 0 | | 118.8 | | 0 | | 8,353.2 | | 8,118.2 | | 8,353.3 | | 8,118.2 | |
One-year variable compensation | | 188.1 | | 0 | | 263.4 | | | | | | | | 13,083.9 | | 11,327.1 | | 10,534.0 | | 8,197.1 | |
Multi-year variable compensation | | | | | | | | | | | | | | | | | | | | | |
LTI 2016 Plan | | 515.2 | | 0 | | 1,444.0 | | | | | | | | 32,392.7 | | 23,646.2 | | | | | |
RSU Milestone Plan 2015 | | | | | | | | | | | | | | | | | | 21,923.4 | | 8,698.1 | |
Total | | 822.1 | | 118.8 | | 1,826.2 | | 0 | | 118.8 | | 0 | | 53,829.8 | | 43,091.5 | | 40,810.6 | | 25,013.4 | |
Service cost | | | | | | | | | | | | | | 768.6 | | 855.5 | | 768.6 | | 855.5 | |
Total according to GCGC | | 822.1 | | 118.8 | | 1,826.2 | | 0 | | 118.8 | | 0 | | 54,598.4 | | 43,947.0 | | 41,579.2 | | 25,868.9 | |
1) The value of the fixed and one-year variable compensation is granted in U.S. dollars. For conversion purposes from U.S. dollars into euro, for fixed compensation the average exchange rate and for the one-year variable compensation the year-end exchange rate of the respective period applies.
2) Insurance contributions, the private use of company cars and aircraft, benefits in kind, compensation for unused vacation, expenses for maintenance of two households, reimbursement of fees for lawyers, the preparation of tax returns, and tax gross-ups according to local conditions. The fringe benefits of Bill McDermott mainly consist of expenses for maintenance of two households, the preparation of tax returns, and tax gross-ups according to local conditions.
Reconciliation Reporting of Total Compensation Pursuant to Section 314(1)(6a) HGB in Connection with GAS 17 | |
€ thousands | | Christian Klein | | Jennifer Morgan | | Robert Enslin | | Adaire Fox-Martin | |
| | 2019 | | 2018 | | 2019 | | 2018 | | 2019 | | 2018 | | 2019 | | 2018 | |
Total according to GCGC | | 5,514.4 | | 3,632.1 | | 5,975.1 | | 3,994.9 | | 4,497.7 | | 4,738.7 | | 4,679.9 | | 4,009.2 | |
Less granted annual variable compensation | | –1,301.8 | | –1,125.8 | | –1,251.5 | | –1,052.0 | | –1,352.8 | | –1,327.3 | | –1,125.8 | | –1,125.8 | |
Plus allocated actual annual variable compensation | | 1,072.7 | | 1,046.9 | | 1,031.2 | | 978.4 | | 290.1 | | 1,234.4 | | 927.6 | | 1,046.9 | |
Less service cost | | | | | | –104.6 | | –51.4 | | –177.5 | | –235.8 | | | | | |
Total compensation | | 5,285.3 | | 3,553.2 | | 5,650.2 | | 3,869.9 | | 3,257.5 | | 4,410.0 | | 4,481.7 | | 3,930.3 | |
| | | | | | | | | | | | | | | | | |
€ thousands | | Michael Kleinemeier | | Bernd Leukert | | Bill McDermott | | Luka Mucic | |
| | 2019 | | 2018 | | 2019 | | 2018 | | 2019 | | 2018 | | 2019 | | 2018 | |
Total according to GCGC | | 4,241.7 | | 3,983.7 | | 3,991.6 | | 4,233.8 | | 12,767.8 | | 11,747.3 | | 4,224.7 | | 3,966.4 | |
Less granted annual variable compensation | | –1,125.8 | | –1,125.8 | | –1,125.8 | | –1,125.8 | | –2,235.2 | | –2,193.0 | | –1,125.8 | | –1,125.8 | |
Plus allocated actual annual variable compensation | | 927.6 | | 1,046.9 | | 228.7 | | 1,046.9 | | 1,609.7 | | 2,039.5 | | 927.6 | | 1,046.9 | |
Less service cost | | | | | | | | | | –486.5 | | –568.3 | | | | | |
Total compensation | | 4,043.6 | | 3,904.8 | | 3,094.6 | | 4,154.9 | | 11,655.9 | | 11,025.5 | | 4,026.6 | | 3,887.5 | |
To Our
Stakeholders | Combined Group
Management Report | Consolidated Financial
Statements IFRS | Further Information on Economic,
Environmental, and Social Performance | Additional
Information |
Reconciliation Reporting of Total Compensation Pursuant to Section 314(1)(6a) HGB in Connection with GAS 17 | |
€ thousands | | Jürgen Müller | | Stefan Ries | | Thomas Saueressig | | Total Executive Board | |
| | 2019 | | 2018 | | 2019 | | 2018 | | 2019 | | 2018 | | 2019 | | 2018 | |
Total according to GCGC | | 4,025.1 | | 0 | | 3,858.3 | | 3,640.9 | | 822.1 | | 0 | | 54,598.4 | | 43,947.0 | |
Less granted annual variable compensation | | –1,125.8 | | | | –1,125.8 | | –1,125.8 | | –188.1 | | | | –13,083.9 | | –11,327.1 | |
Plus allocated actual annual variable compensation | | 927.6 | | | | 927.6 | | 1,046.9 | | 155.0 | | | | 9,025.4 | | 10,534.0 | |
Less service cost | | | | | | | | | | | | | | –768.6 | | –855.5 | |
Total compensation | | 3,826.9 | | 0 | | 3,660.1 | | 3,562.0 | | 788.9 | | 0 | | 49,771.3 | | 42,298.4 | |
Vertical Pay Ratio
The vertical pay ratio compares the total target compensation granted to the Co-CEOs and the Executive Board members other than Co-CEO with the total target compensation granted to the Executives and all employees collectively who were employed at year end. Due to the changes on the Executive Board during the year, we have annualized the compensation for our calculation. In order to ensure comparability, only fixed compensation, one-year and multi-year variable compensation are considered. The Executives comprise the first and second management levels below the Executive Board, that is, the Global Executive Team (GET) and the Senior Executive Team (SET).
| | | | | | 2019 | |
Ratio | | | | Co-CEO | | Executive Board
(Other Than
Co- CEO) | |
| | Average Annual
Compensation
(in €thousands) | | 8,604.5 | | 4,196.4 | |
Executives | | 915 | | 9 | | 5 | |
Employees including Executives | | 103 | | 84 | | 41 | |
| | | | | | | |
| | | | | | 2018 | |
Ratio | | | | CEO | | Executive Board (Other Than CEO) | |
| | Average Annual
Compensation
(in €thousands) | | 10,384.3 | | 3,942.3 | |
Executives | | 906 | | 11 | | 4 | |
Employees including Executives | | 99 | | 105 | | 40 | |
| | | | | | | |
| | | | | | 2017 | |
Ratio | | | | CEO | | Executive Board (Other Than CEO) | |
| | Average Annual
Compensation
(in €thousands) | | 11,209.2 | | 3,880.0 | |
Executives | | 923 | | 12 | | 4 | |
Employees including Executives | | 101 | | 111 | | 39 | |
| | | | | | | |
| | | | | | 2016 | |
Ratio | | | | CEO | | Executive Board
(Other Than CEO) | |
| | Average Annual
Compensation
(in €thousands) | | 11,785.4 | | 4,090.8 | |
Executives | | 823 | | 14 | | 5 | |
Employees including Executives | | 99 | | 119 | | 41 | |
To Our
Stakeholders | Combined Group
Management Report | Consolidated Financial
Statements IFRS | Further Information on Economic,
Environmental, and Social Performance | Additional
Information |
Share-Based Payment Information Relating to Long-Term Incentives
Members of the Executive Board received, hold, or held share units issued to them under the LTI 2016 Plan and hold or held RSUs issued to them under the RSU Milestone Plan 2015. For more information about the terms and details of these programs, see the Notes to the Consolidated Financial Statements, Note (B.3).
Grants Under the LTI 2016 Plan | | | | | |
| | | | | | | | |
| Year | | Total | RSUs | PSUs | | Fair Value at Time of Grant |
| Granted | | Share Units | (40%) | (60%) | | | |
| | | Quantity | Quantity | Quantity | € per RSUs | € per PSUs | € thousands |
Christian Klein
(Co-CEO from 10/10/2019) | 2019 | 1) | 7,797 | 3,119 | 4,678 | 117.39 | 139.97 | 1,021 |
2019 | | 26,047 | 10,419 | 15,628 | 88.54 | 93.71 | 2,387 |
| 2018 | | 22,385 | 8,954 | 13,431 | 79.01 | 80.84 | 1,793 |
Jennifer Morgan
(Co-CEO from 10/10/2019) | 2019 | 1) | 6,378 | 2,552 | 3,826 | 117.39 | 139.97 | 835 |
2019 | 2) | 4,634 | 1,853 | 2,781 | 101.98 | 115.10 | 509 |
| 2019 | | 26,047 | 10,419 | 15,628 | 88.54 | 93.71 | 2,387 |
| 2018 | | 26,574 | 10,630 | 15,944 | 79.01 | 80.84 | 2,129 |
Robert Enslin
(until 4/5/2019) | 2019 | | 27,778 | 11,111 | 16,667 | 88.54 | 93.71 | 2,546 |
2018 | | 28,340 | 11,336 | 17,004 | 79.01 | 80.84 | 2,270 |
Adaire Fox-Martin | 2019 | 2) | 3,970 | 1,588 | 2,382 | 101.98 | 115.10 | 436 |
| 2019 | | 26,047 | 10,419 | 15,628 | 88.54 | 93.71 | 2,387 |
| 2018 | | 26,574 | 10,630 | 15,944 | 79.01 | 80.84 | 2,129 |
Michael Kleinemeier | 2019 | | 26,047 | 10,419 | 15,628 | 88.54 | 93.71 | 2,387 |
| 2018 | | 26,574 | 10,630 | 15,944 | 79.01 | 80.84 | 2,129 |
Bernd Leukert
(until 3/31/2019) | 2019 | | 29,338 | 11,735 | 17,603 | 88.54 | 93.71 | 2,689 |
2018 | | 29,931 | 11,972 | 17,959 | 79.01 | 80.84 | 2,398 |
Bill McDermott
(CEO until 10/10/2019, Executive
Board member until 11/15/2019) | 2019 | | 84,138 | 33,655 | 50,483 | 88.54 | 93.71 | 7,711 |
2018 | | 85,841 | 34,336 | 51,505 | 79.01 | 80.84 | 6,877 |
Luka Mucic | 2019 | | 26,047 | 10,419 | 15,628 | 88.54 | 93.71 | 2,387 |
| 2018 | | 26,574 | 10,630 | 15,944 | 79.01 | 80.84 | 2,129 |
Jürgen Müller (from 1/1/2019) | 2019 | | 23,852 | 9,541 | 14,311 | 88.54 | 93.71 | 2,186 |
Stefan Ries | 2019 | | 21,941 | 8,776 | 13,165 | 88.54 | 93.71 | 2,011 |
| 2018 | | 22,385 | 8,954 | 13,431 | 79.01 | 80.84 | 1,793 |
Thomas Saueressig (from 11/1/2019) | 2019 | | 3,986 | 1,594 | 2,392 | 114.67 | 138.96 | 515 |
Total | 2019 | | 344,047 | 137,619 | 206,428 | | | 32,393 |
| 2018 | | 295,178 | 118,072 | 177,106 | | | 23,646 |
1) Additional grant due to appointment as Co-CEO
2) Additional grant due to extension of responsibilities
To Our
Stakeholders | Combined Group
Management Report | Consolidated Financial
Statements IFRS | Further Information on Economic,
Environmental, and Social Performance | Additional
Information |
Executive Board Members’ Holdings
LTI 2016 Plan | | | | | | | | |
Quantity of Share Units | Year | | Holding on | | Granted | Forfeited1) | Balanced PSUs2) | Holding on |
| Granted | | 1/1/2019 | RSUs (40%) | PSUs (60%) | | | 12/31/2019 |
Christian Klein (Co-CEO from 10/10/2019) | 2019 | | 0 | 13,538 | 20,306 | 0 | 0 | 33,844 |
2018 | | 22,385 | 0 | 0 | 0 | 0 | 22,385 |
Jennifer Morgan (Co-CEO from 10/10/2019) | 2019 | | 0 | 14,824 | 22,235 | 0 | 0 | 37,059 |
2018 | | 26,574 | 0 | 0 | 0 | 0 | 26,574 |
| 2017 | | 18,539 | 0 | 0 | 0 | 0 | 18,539 |
Robert Enslin (until 4/5/2019) | 2019 | | 0 | 11,111 | 16,667 | 25,972 | 14,809 | 16,615 |
| 2018 | | 28,340 | 0 | 0 | 19,417 | 0 | 8,923 |
| 2017 | | 29,454 | 0 | 0 | 12,822 | 0 | 16,632 |
| 2016 | | 40,417 | 0 | 0 | 7,470 | 0 | 32,947 |
Adaire Fox-Martin | 2019 | | 0 | 12,007 | 18,010 | 0 | 0 | 30,017 |
| 2018 | | 26,574 | 0 | 0 | 0 | 0 | 26,574 |
| 2017 | | 18,539 | 0 | 0 | 0 | 0 | 18,539 |
Michael Kleinemeier | 2019 | | 0 | 10,419 | 15,628 | 0 | 0 | 26,047 |
| 2018 | | 26,574 | 0 | 0 | 0 | 0 | 26,574 |
| 2017 | | 27,619 | 0 | 0 | 0 | 0 | 27,619 |
| 2016 | | 37,898 | 0 | 0 | 0 | 0 | 37,898 |
Bernd Leukert (until 3/31/2019)3) | 2019 | | 0 | 11,735 | 17,603 | 12,852 | 10,443 | 26,929 |
2018 | | 29,931 | 0 | 0 | 5,634 | 3,381 | 27,678 |
| 2017 | | 31,109 | 0 | 0 | 0 | 0 | 31,109 |
| 2016 | | 42,687 | 0 | 0 | 0 | 0 | 42,687 |
Bill McDermott (CEO until 10/10/2019, Executive Board member until 11/15/2019) | 2019 | | 0 | 33,655 | 50,483 | 65,767 | 35,857 | 54,228 |
2018 | | 85,841 | 0 | 0 | 45,653 | 0 | 40,188 |
2017 | | 89,217 | 0 | 0 | 25,159 | 0 | 64,058 |
2016 | | 122,423 | 0 | 0 | 3,855 | 0 | 118,568 |
Luka Mucic | 2019 | | 0 | 10,419 | 15,628 | 0 | 0 | 26,047 |
| 2018 | | 26,574 | 0 | 0 | 0 | 0 | 26,574 |
| 2017 | | 27,619 | 0 | 0 | 0 | 0 | 27,619 |
| 2016 | | 37,898 | 0 | 0 | 0 | 0 | 37,898 |
Jürgen Müller (from 1/1/2019) | 2019 | | 0 | 9,541 | 14,311 | 0 | 0 | 23,852 |
Stefan Ries | 2019 | | 0 | 8,776 | 13,165 | 0 | 0 | 21,941 |
| 2018 | | 22,385 | 0 | 0 | 0 | 0 | 22,385 |
| 2017 | | 23,265 | 0 | 0 | 0 | 0 | 23,265 |
| 2016 | | 23,987 | 0 | 0 | 0 | 0 | 23,987 |
Thomas Saueressig (from 11/1/2019) | 2019 | | 0 | 1,594 | 2,392 | 0 | 0 | 3,986 |
Total | | | 865,849 | 137,619 | 206,428 | 224,601 | 64,490 | 1,049,785 |
1) Forfeiture according to leaver rules
2) To balance disadvantages from leaver rules under the LTI 2016 Plan
3) Forfeiture under the leaver rules assuming termination as at 3/31/2021
The Share Units granted in 2019 have a remaining term of 3.1 years, the share units granted in 2018 have a remaining term of 2.1 years, the share units granted in 2017 have a remaining term of 1.1 years, and the share units granted in 2016 have a remaining term of 0.1 years.
To Our
Stakeholders | Combined Group
Management Report | Consolidated Financial
Statements IFRS | Further Information on Economic,
Environmental, and Social Performance | Additional
Information |
RSU Milestone Plan 2015 | | | | |
Quantity of RSUs | Year Granted | Holding on | Exercised | Holding on |
| | 1/1/2019 | | 12/31/2019 |
Robert Enslin (until 4/5/2019) | 2015 | 39,985 | 39,985 | 0 |
Michael Kleinemeier | 2015 | 5,221 | 5,221 | 0 |
Bernd Leukert (until 3/31/2019) | 2015 | 41,578 | 41,578 | 0 |
Bill McDermott (CEO until 10/10/2019, Executive Board member until 11/15/2019) | 2015 | 113,667 | 113,667 | 0 |
Luka Mucic | 2015 | 41,130 | 41,130 | 0 |
Total | | 241,581 | 241,581 | 0 |
The table above shows the Executive Board members’ holdings issued to them under the RSU Milestone Plan 2015. The plan was a cash-settled long-term incentive scheme with a payout subsequent to a performance period of one year (after which the RSUs become non-forfeitable) and an additional holding period of three years. The plan consisted of four plan tranches which were issued with respect to the calendar years 2012 through 2015.
Total Expense for Share-Based Payment | | |
€ thousands | 2019 | 2018 |
Christian Klein (Co-CEO from 10/10/2019) | 1,925 | 442.2 |
Jennifer Morgan (Co-CEO from 10/10/2019) | 2,894 | 796.1 |
Robert Enslin (until 4/5/2019) | 3,480 | 727.0 |
Adaire Fox-Martin | 2,667 | 796.1 |
Michael Kleinemeier | 3,253 | 914.2 |
Bernd Leukert (until 3/31/2019) | 8,606 | 775.2 |
Bill McDermott (CEO until 10/10/2019, Executive Board member until 11/15/2019) | 14,689 | 2,155.8 |
Luka Mucic | 3,391 | 675.8 |
Jürgen Müller (from 1/1/2019) | 768 | - |
Stefan Ries | 2,646 | 772.0 |
Thomas Saueressig (from 11/1/2019) | 128 | - |
Total | 44,446.5 | 8,054.4 |
Total expense for the share-based payment plans of Executive Board members was determined in accordance with IFRS 2 (Share-Based Payments) and consists exclusively of obligations arising from Executive Board activities.
End-of-Service Benefits
Regular End-of-Service Undertakings
Retirement Pension Plan
The following retirement pension agreements apply to the individual members of the Executive Board:
– Adaire Fox-Martin, Christian Klein, Michael Kleinemeier, Bernd Leukert, Luka Mucic, Jürgen Müller, Stefan Ries, and Thomas Saueressig are entitled to receive a retirement pension when they reach the retirement age of 62 and retire from their Executive Board seat; or a disability pension depending on a health examination if, before reaching the regular retirement age, they become subject to occupational disability or permanent incapacity. A surviving dependent’s pension is paid on the death of a former member of the Executive Board. The disability pension is 100% of the vested retirement pension entitlement and is payable until the beneficiary’s 62nd birthday, after which it is replaced by a retirement pension. The surviving dependent’s pension is 60% of the retirement pension or vested disability pension entitlement at death. Entitlements are enforceable against SAP SE. Current pension payments are reviewed annually for adjustments and, if applicable, increased according to the surplus in the pension liability insurance. If service is ended before the retirement age of 62, pension entitlement is reduced in proportion as the actual length of service stands in relation to the maximum possible length of service. The applied retirement pension plan is contributory. The contribution is 4% of applicable compensation up to the applicable income threshold plus 14% of applicable compensation above the applicable income threshold. For this purpose, applicable compensation is 180% of annual base salary. The applicable income threshold is the statutory annual income threshold for the state pension plan in Germany (West), as amended from time to time.
– Bill McDermott has rights to future benefits under the portion of the pension plan for SAP America classified as “Non-Qualified Retirement Plan” according to the U.S. Employee Retirement Income Security Act (ERISA). This “Non-Qualified” pension plan is a cash balance plan that provides either monthly pension payments or a lump sum on retirement. The pension becomes available from the beneficiary’s 65th birthday. Subject to certain conditions, the plan also provides earlier payment or invalidity benefits. The “Non-Qualified” pension plan closed with effect from January 1, 2009. Interest continues to be accrued on the earned rights to benefits within this plan. The rights were partially earned before Bill McDermott became a member of the SAP Executive Board.
– SAP made contributions to a third-party pension plan for Bill McDermott, Robert Enslin, and Jennifer Morgan, as disclosed in the tables ‘German Corporate Governance Code’. SAP’s matching contributions are based on payments by Bill McDermott, Robert Enslin, and Jennifer Morgan into this pension plan.
To Our
Stakeholders | Combined Group
Management Report | Consolidated Financial
Statements IFRS | Further Information on Economic,
Environmental, and Social Performance | Additional
Information |
Total Defined Benefit Obligations (DBO) and Net Defined Benefit Liability (Asset) to Executive Board Members |
€ thousands | | Christian Klein (Co-CEO from 10/10/2019)1) | | Adaire Fox- Martin1) | | Michael Kleinemeier1) | | Bernd Leukert (until 3/31/2019)1) | | Bill McDermott (CEO until 10/10/2019, Executive Board Member until 11/15/2019) | | Luka Mucic1) | | Jürgen Müller (from 1/1/2019)1) | | Stefan Ries 1) | | Thomas Saueressig (from 11/1/2019)1) | | Total |
DBO 1/1/2018 | | – | | 93.5 | | 271.9 | | 584.5 | | 1,310.5 | | 585.9 | | – | | 344.6 | | – | | 3,190.9 |
Less plan assets market value 1/1/2018 | | – | | 100.7 | | 345.9 | | 540.9 | | – | | 490.7 | | – | | 275.8 | | – | | 1,754.0 |
Net defined benefit liability (asset) 1/1/2018 | | – | | –7.2 | | –74.0 | | 43.6 | | 1,310.5 | | 95.2 | | – | | 68.8 | | – | | 1,436.9 |
DBO change in 2018 | | 112.8 | | 89.9 | | 66.7 | | –16.1 | | 106.2 | | –42.1 | | – | | –67.2 | | – | | 250.2 |
Plan assets change in 2018 | | 141.3 | | 156.3 | | 161.7 | | 153.9 | | – | | 145.0 | | – | | 143.5 | | – | | 901.7 |
DBO 12/31/2018 | | 112.8 | | 183.4 | | 338.6 | | 568.4 | | 1,416.7 | | 543.8 | | – | | 277.4 | | – | | 3,441.1 |
Less plan assets market value 12/31/2018 | | 141.3 | | 257.0 | | 507.6 | | 694.8 | | – | | 635.7 | | – | | 419.3 | | – | | 2,655.7 |
Net defined benefit liability (asset) 12/31/2018 | | –28.5 | | –73.6 | | –169.0 | | –126.4 | | 1,416.7 | | –91.9 | | – | | –141.9 | | – | | 785.4 |
DBO change in 2019 | | 244.7 | | 207.6 | | 205.9 | | 416.5 | | 63.3 | | 475.0 | | 149.7 | | 251.4 | | 41.9 | | 2,056.0 |
Plan assets change in 2019 | | 145.9 | | 160.6 | | 171.2 | | 363.0 | | – | | 147.2 | | – | | 144.9 | | – | | 1,132.8 |
DBO 12/31/2019 | | 357.5 | | 391.0 | | 544.5 | | 984.9 | | 1,480.0 | | 1,018.8 | | 149.7 | | 528.8 | | 41.9 | | 5,497.1 |
Less plan assets market value 12/31/2019 | | 287.2 | | 417.6 | | 678.8 | | 1,057.8 | | – | | 782.9 | | – | | 564.2 | | – | | 3,788.5 |
Net defined benefit liability (asset) 12/31/2019 | | 70.3 | | –26.6 | | –134.3 | | –72.9 | | 1,480.0 | | 235.9 | | 149.7 | | –35.4 | | 41.9 | | 1,708.6 |
1) The values shown here only reflect the pension entitlements that Christian Klein, Adaire Fox-Martin, Michael Kleinemeier, Bernd Leukert, Luka Mucic, Jürgen Müller, Stefan Ries and Thomas Saueressig will receive from the retirement pension plan for Executive Board members.
The table below shows the annual pension entitlement earned during the Executive Board membership of each member of the Executive Board on reaching the scheduled retirement age of 62, based on entitlements from SAP under performance-based and salary-linked plans.
Annual Pension Entitlement | | |
€ thousands | Vested on
12/31/2019 | Vested on
12/31/2018 |
Christian Klein (Co-CEO from 10/11/2019) | 8.2 | 4.1 |
Adaire Fox-Martin | 11.8 | 7.3 |
Michael Kleinemeier | 20.0 | 14.8 |
Bernd Leukert (until 3/31/2019) | 34.7 | 24.6 |
Bill McDermott (CEO until 10/10/2019, Executive Board Member until 11/15/2019)1) | 90.8 | 105.1 |
Luka Mucic | 27.6 | 23.2 |
Jürgen Müller (from 1/1/2019) | 4.8 | - |
Stefan Ries | 16.8 | 12.6 |
Thomas Saueressig (from 11/1/2019) | 0.2 | - |
1) The rights shown here for Bill McDermott refer solely to rights under the pension plan for SAP America.
These are vested entitlements. To the extent that members continue to serve on the Executive Board and that therefore more contributions are made for them in the future, pensions actually payable at the scheduled retirement age will be higher than the amounts shown in the table.
To Our
Stakeholders | Combined Group
Management Report | Consolidated Financial
Statements IFRS | Further Information on Economic,
Environmental, and Social Performance | Additional
Information |
Postcontractual Non-Compete Provisions
Each Executive Board member’s contract includes a 12-month postcontractual non-compete agreement. During this non-compete period, Executive Board members receive abstention payments corresponding to 50% of their average contractual compensation as members. This average is calculated on the basis of the preceding three years. Any other occupational income generated by the Executive Board member is deducted from their compensation.
The following table presents the theoretical amounts for the net present values of the postcontractual non-compete abstention payments. The calculation assumes the following:
– The Executive Board member leaves SAP at the end of their respective current contract term.
– Their final average contractual compensation prior to their departure equals their compensation in 2019.
Actual postcontractual non-compete payments will likely differ from these amounts depending on the time of departure and the compensation levels and target achievements at the time of departure.
Net Present Values of the Postcontractual Non- Compete Abstention Payments | |
€ thousands | Contract | Net Present |
| Term Expires | Value of |
| | Postcontractual |
| | Non-Compete |
| | Abstention |
| | Payment1) |
Christian Klein (Co-CEO from 10/10/2019) | 4/30/2025 | 2,607 |
Jennifer Morgan (Co-CEO from 10/10/2019) | 4/30/2025 | 2,787 |
Adaire Fox-Martin | 4/30/2025 | 2,211 |
Michael Kleinemeier | 12/31/2020 | 2,024 |
Luka Mucic | 3/31/2021 | 2,016 |
Jürgen Müller (from 1/1/2019) | 12/31/2021 | 1,915 |
Stefan Ries | 3/31/2024 | 1,817 |
Thomas Saueressig (from 11/1/2019) | 10/31/2022 | 394 |
Total | | 15,771 |
1) For the purpose of this calculation, the following discount rates have been applied: Christian Klein 0.26%; Jennifer Morgan 0.26%; Adaire Fox.Martin 0.26%; Michael Kleinemeier –0.13%; Luka Mucic –0.12%; Jürgen Müller –0.05%; Stefan Ries 0.17%; Thomas Saueressig 0.03%.
Early End-of-Service Undertakings
Severance Payments
The standard contract for all Executive Board members provides that on termination before full term (for example, by the Company without cause where the member’s appointment is revoked, where the member becomes occupationally disabled, or in connection with a change of control), SAP SE will pay to the member the outstanding part of the compensation target for the entire remainder of the term, appropriately discounted for early payment. Starting 2018, in accordance with the German Corporate Governance Code (GCGC), section 4.2.3, payments made to an Executive Board member due to early termination must not exceed twice the annual total compensation, or 150% of the severance payment cap in case of change of control. Members are not entitled to that severance payment if they have not served SAP as a member of the Executive Board for at least one year or if they leave SAP SE for reasons for which they are responsible. Upon the appointment of Jürgen Müller and Thomas Saueressig to the Executive Board, the Supervisory Board abstained from the waiting period of one year in consideration of their long-term successful tenures with SAP.
If an Executive Board member’s appointment to the Executive Board expires or ceases to exist because of, or as a consequence of, change or restructuring, or due to a change of control, SAP SE and each Executive Board member has the right to terminate the employment contract within eight weeks of the occurrence by giving six months’ notice. A change of control is deemed to occur when:
– A third party is required to make a mandatory takeover offer to the shareholders of SAP SE under the German Securities Acquisition and Takeover Act;
– SAP SE merges with another company and becomes the subsumed entity;
– A control or profit transfer agreement is concluded with SAP SE as the dependent company.
An Executive Board member’s contract can also be terminated before full term if their appointment as an Executive Board member of SAP SE is revoked in connection with a change of control.
Postcontractual Non-Compete Provisions
Abstention compensation for the postcontractual non-compete period as described above is also payable on early contract termination.
Payments to Executive Board Members Resigning in 2019
Robert Enslin resigned from his position as Executive Board member on his own accord with effect from April 5, 2019, therefore no severance payment was made. The STI 2019 and the granted rights under the LTI 2016 Plan were handled according to plan terms. The postcontractual non-compete provision was canceled without compensation.
Bernd Leukert reached a mutual agreement with the Supervisory Board to end his employment at SAP with immediate effect on March 31, 2019. He received the following payments in connection with his retirement for the remainder of the term of appointment until March 31, 2021:
– Discounted severance payment equaling the appropriately discounted target salary (base salary plus target STI) totaling €3,646,393.
– Granted rights under the LTI 2016 Plan were handled according to plan terms with respect to the performance criteria and the payout schedule.
– As compensation for the LTI tranches 2020 and 2021 which are not granted due to early termination, a one-time gross payment of €999,412.
– For a period of 24 months, monthly abstention compensation for the postcontractual non-compete period totaling €4,723,398.
– One-time payment to his retirement account in the amount of €336,720.
Bill McDermott resigned from his position as Executive Board member on his own accord with effect from November 15, 2019, therefore no severance payment was made. The STI 2019 and the granted rights under the LTI 2016 Plan were handled according to
To Our
Stakeholders | Combined Group
Management Report | Consolidated Financial
Statements IFRS | Further Information on Economic,
Environmental, and Social Performance | Additional
Information |
plan terms. Negotiations regarding abstention compensation for post-contractual non-compete obligations are still ongoing.
Permanent Disability
In case of permanent disability, an Executive Board member’s contract will end at the end of the quarter in which the permanent inability to work was determined. The Executive Board member receives, in addition to a potential disability pension under the retirement plan described above, the monthly basic salary (fixed compensation) for a further 12 months starting from the date the permanent disability is determined.
Payments to Former Executive Board Members
In 2019, we paid pension benefits of €2,081,100 to Executive Board members who had retired before January 1, 2019 (2018: €2,054,300). At the end of 2019, the DBO for former Executive Board members who had retired or left SAP before January 1, 2019 was €44,306,300 (2018: €38,373,500). Plan assets of €31,074,600 are available to meet these obligations (2018: €31,615,100).
Executive Board: Other Information
We did not grant any compensation advance or credit to, or enter into any commitment for the benefit of, any member of our Executive Board in 2019 or the previous year.
As far as the law permits, SAP SE and its affiliated companies in Germany and elsewhere indemnify and hold harmless their respective directors and officers against and from the claims of third parties. To this end, we maintain directors’ and officers’ (D&O) group liability insurance. The policy is annual and is renewed from year to year. The insurance covers the personal liability of the insured group for financial loss caused by its managerial acts and omissions. The current D&O policy includes an individual deductible for Executive Board members of SAP SE as required by section 93 (2) of the German Stock Corporation Act.
Compensation for Supervisory Board Members
Compensation System
Supervisory Board members’ compensation is governed by our Articles of Incorporation, section 16.
Each member of the Supervisory Board receives, in addition to the reimbursement of their expenses, an annual basic compensation of €165,000. The chairperson receives €275,000 and the deputy chairperson €220,000 annually. In addition, we reimburse members of the Supervisory Board for the value-added tax payable on their compensation.
For membership of the Audit Committee, Supervisory Board members receive an additional fixed annual compensation of €16,500, and for membership of any other Supervisory Board committee €11,000, provided that the committee concerned has met in the year. The chairperson of the Audit Committee receives €27,500, and the chairpersons of the other committees receive €22,000. The fixed remuneration is payable after the end of the year.
Any members of the Supervisory Board who have served for less than the entire year receive one-twelfth of the annual remuneration for each month of service commenced. This also applies to the increased compensation of the chairperson and the deputy chairperson(s) and to the remuneration for the chairperson and the members of a committee.
To Our
Stakeholders | Combined Group
Management Report | Consolidated Financial
Statements IFRS | Further Information on Economic,
Environmental, and Social Performance | Additional
Information |
Supervisory Board Members’ Compensation in 2019 | | | |
€ thousands | | | 2019 | | | 2018 |
| Fixed | Compensation | Total | Fixed | Compensation | Total |
| Compensation | for Committee | | Compensation | for Committee | |
| | Work | | | Work | |
Prof. Dr. h.c. mult. Hasso Plattner (chairperson) | 275.0 | 53.2 | 328.2 | 275.0 | 88.0 | 363.0 |
Margret Klein-Magar (deputy chairperson) | 220.0 | 26.6 | 246.6 | 220.0 | 22.0 | 242.0 |
Pekka Ala-Pietilä | 165.0 | 18.3 | 183.3 | 165.0 | 40,3 | 205.3 |
Panagiotis Bissiritsas | 165.0 | 39.4 | 204.4 | 165.0 | 38.5 | 203.5 |
Martin Duffek (until 5/15/2019) | 68.8 | 16.0 | 84.8 | 165.0 | 38.5 | 203.5 |
Aicha Evans | 165.0 | 33.0 | 198.0 | 165.0 | 29.3 | 194.3 |
Anja Feldmann (until 12/31/2018) | NA | NA | NA | 165.0 | 19.3 | 184.3 |
Diane Greene (from 5/17/2018) | 165.0 | 11.0 | 176.0 | 110.0 | 2.8 | 112.8 |
Prof. Dr. Wilhelm Haarmann (until 5/17/2018) | NA | NA | NA | 68.5 | 13.8 | 82.3 |
Andreas Hahn (until 5/15/2019) | 68.8 | 9.2 | 77.9 | 165.0 | 22.0 | 187.0 |
Prof. Dr. Gesche Joost | 165.0 | 22.0 | 187.0 | 165.0 | 22.0 | 187.0 |
Monika Kovacka-Dimitrova (from 5/15/2019) | 110.0 | 14.7 | 124.7 | NA | NA | NA |
Lars Lamadé | 165.0 | 22.9 | 187.9 | 165.0 | 22.0 | 187.0 |
Bernard Liautaud | 165.0 | 22.0 | 187.0 | 165.0 | 33.0 | 198.0 |
Gerhard Oswald (from 1/1/2019) | 165.0 | 52.3 | 217.3 | NA | NA | NA |
Christine Regitz | 165.0 | 30.3 | 195.3 | 165.0 | 22.0 | 187.0 |
Dr. Friederike Rotsch (from 5/17/2018) | 165.0 | 43.1 | 208.1 | 110.0 | 18.3 | 128.3 |
Dr. Erhard Schipporeit (until 5/15/2019) | 68.8 | 20.6 | 89.4 | 165.0 | 46.8 | 211.8 |
Robert Schuschnig-Fowler (until 5/15/2019) | 68.8 | 9.2 | 77.9 | 165.0 | 22.0 | 187.0 |
Dr. Sebastian Sick (until 5/15/2019) | 68.8 | 9.2 | 77.9 | 165.0 | 22.0 | 187.0 |
Heike Steck (from 5/15/2019) | 110.0 | 14.7 | 124.7 | NA | NA | NA |
Pierre Thiollet (until 5/15/2019) | 68.8 | 4.6 | 73.3 | 165.0 | 11.0 | 176.0 |
Christa Vergien-Knopf (from 5/15/2019) | 110.0 | 14.7 | 124.7 | NA | NA | NA |
Dr. Gunnar Wiedenfels (from 5/15/2019) | 110.0 | 25.7 | 135.7 | NA | NA | NA |
James Wright (from 5/15/2019) | 110.0 | 25.7 | 135.7 | NA | NA | NA |
Prof. Dr.-Ing. Dr.-Ing. E.h. Klaus Wucherer (until 5/17/2018) | NA | NA | NA | 68.5 | 6.9 | 75.4 |
Ralf Zeiger (from 5/15/2019) | 110.0 | 14.7 | 124.7 | NA | NA | NA |
Total | 3,217.5 | 552.7 | 3,770.2 | 3,162.0 | 540.4 | 3,702.4 |
In 2019, we received services from members of the Supervisory Board (including services from employee representatives on the Supervisory Board in their capacity as employees of SAP) in the amount of €1,976,000 (2018: €1,206,500).
Long-Term Incentives for the Supervisory Board
We do not offer members of the Supervisory Board share-based payment for their Supervisory Board work. Any share-based payment awards received by employee-elected members relate to their position as SAP employees and not to their work on the Supervisory Board.
Supervisory Board: Other Information
We did not grant any compensation advance or credit to, or enter into any commitment for the benefit of, any member of our Supervisory Board in 2019 or the previous year.
Hasso Plattner, the chairperson of the Supervisory Board, entered into a consulting contract with SAP after joining the Supervisory Board in May 2003. The contract does not provide for any compensation. The only cost we incurred under the contract was the reimbursement of expenses.
As far as the law permits, we indemnify Supervisory Board members against, and hold them harmless from, claims brought by third parties. To this end, we maintain directors’ and officers’ (D&O) group liability insurance. In accordance with section 3.8 of the GCGC, each member of the Supervisory Board will bear a deductible of at least 10% of any loss. The deductible is capped at 1.5 times a member’s fixed annual compensation.
To Our | Combined Group | Consolidated Financial | Further Information on Economic, | Additional |
Stakeholders | Management Report | Statements IFRS | Environmental, and Social Performance | Information |
Responsibility Statement
To the best of our knowledge, and in accordance with the applicable reporting principles, the Consolidated Financial Statements give a true and fair view of the assets, finances, and operating results of the SAP Group, and the management report of the Group and SAP SE includes a fair review of the development and performance of the business and the position of the Group and SAP SE, together with a description of the principal opportunities and risks associated with the expected development of the Group and SAP SE.
Walldorf, February 18, 2020
SAP SE
Walldorf, Germany
Executive Board of SAP SE
Christian Klein | Jennifer Morgan |
| |
| |
| |
| |
Adaire Fox-Martin | Michael Kleinemeier |
| |
| |
| |
| |
Luka Mucic | Jürgen Müller |
| |
| |
| |
| |
Stefan Ries | Thomas Saueressig |
44 | | Responsibility Statement |
To Our | Combined Group | Consolidated Financial | Further Information on Economic, | Additional |
Stakeholders | Management Report | Statements IFRS | Environmental, and Social Performance | Information |
Independent Auditor’s Report
For the consolidated financial statements and Group Management Report we have issued an unqualified auditor’s report. The English language text below is a translation of the independent auditor’s report.
To SAP SE, Walldorf
Report on the Audit of the Consolidated Financial Statements and of the Group Management Report
Opinions
We have audited the consolidated financial statements of SAP SE, Walldorf, and its subsidiaries (the Group), which comprise the consolidated statements of financial position as at December 31, 2019, consolidated income statements, consolidated statements of comprehensive income, consolidated statements of changes in equity and consolidated statements of cash flows for the financial year from January 1 to December 31, 2019 and notes to the consolidated financial statements, including a summary of significant accounting policies.
In addition, we have audited the combined Group Management Report by the SAP Group and the management report of SAP SE, Walldorf (“Group Management Report”) for the financial year from January 1 to December 31, 2019. In accordance with German legal requirements, we have not audited the content of those components of the Group Management Report specified in the “Other Information” section of our auditor’s report.
In our opinion, on the basis of the knowledge obtained in the audit,
– the accompanying consolidated financial statements comply, in all material respects ,with the IFRSs as adopted by the EU and the additional requirements of German commercial law pursuant to Section 315e (1) HGB [Handelsgesetzbuch: German Commercial Code], as well as the IFRSs as adopted by the International Accounting Standards Board and, in compliance with these requirements, give a true and fair view of the assets, liabilities and financial position of the Group as at December 31, 2019, and of its financial performance for the financial year from January 1 to December 31, 2019 and
– the accompanying Group Management Report as a whole provides an appropriate view of the Group’s position. In all material respects, this Group Management Report is consistent with the consolidated financial statements, complies with German legal requirements and appropriately presents the opportunities and risks of future development. Our opinion on the Group Management Report does not cover the content of those components of the Group Management Report specified in the “Other Information” section of the auditor’s report.
Pursuant to Section 322 (3) sentence 1 HGB, we declare that our audit has not led to any reservations relating to the legal compliance of the consolidated financial statements and of the Group Management Report.
Basis for the Opinions
We conducted our audit of the consolidated financial statements and of the Group Management Report in accordance with Section 317 HGB and the EU Audit Regulation No. 537/2014 (referred to subsequently as “EU Audit Regulation”) and in compliance with German Generally Accepted Standards for Financial Statement Audits promulgated by the Institut der Wirtschaftsprüfer [Institute of Public Auditors in Germany] (IDW) as well as in supplementary compliance with the International Standards on Auditing (ISAs) and guidelines of the Public Company Accounting Oversight Board (United States).
Our responsibilities under those requirements, principles and standards are further described in the “Auditor’s Responsibilities for the Audit of the Consolidated Financial Statements and of the Group Management Report” section of our auditor’s report. We are independent of the group entities in accordance with the requirements of European law and German commercial and professional law, and we have fulfilled our other German professional responsibilities in accordance with these requirements. In addition, in accordance with Article 10 (2) point (f) of the EU Audit Regulation, we declare that we have not provided non-audit services prohibited under Article 5 (1) of the EU Audit Regulation. We believe that the evidence we have obtained is sufficient and appropriate to provide a basis for our opinions on the consolidated financial statements and on the Group Management Report.
Key Audit Matters in the Audit of Consolidated Financial Statements
Key audit matters are those matters that, in our professional judgment, were of most significance in our audit of the consolidated financial statements for the financial year from January 1 to December 31, 2019. These matters were addressed in the context of our audit of the consolidated financial statements as a whole, and in forming our opinion thereon, we do not provide a separate opinion on these matters.
Revenue
Refer to note (A.1) – Revenue and Group Management Report, section Risk Management and Risks.
The Financial Statement Risk
In the financial year 2019 SAP generated revenue of EUR 27.6 billion, of which EUR 16.1 billion relate to revenues from sales of software licenses and support services.
The evaluation of software licenses revenue recognition bears an inherent risk of errors as SAP´s software customer contracts are complex. SAP defined detailed policies, procedures and processes to manage the accounting for its customer contracts, which are also described in the notes. Applying them often requires significant judgments, in particular in the assessment of the following:
– (i) whether various contracts are interrelated,
– (ii) whether product and services qualify as separate performance obligations, and
Independent Auditor’s Report | | 45 |
To Our | Combined Group | Consolidated Financial | Further Information on Economic, | Additional |
Stakeholders | Management Report | Statements IFRS | Environmental, and Social Performance | Information |
– (iii) the standalone selling price used to allocate the transaction price of a customer contract to the performance obligations in the contract
SAP derives its revenue from different revenue classes. SAP is using a Revenue Accounting and Reporting software solution for all revenue streams which aims at increasing the level of automation in SAP’s revenue accounting processes. Primarily due to the high number and complexity of SAP’s customer contracts, the software solution as well as the application of the processes to these contracts bear a significant risk of error. In response to this significant risk of error, SAP established processes and manual controls to ensure the accurate revenue recognition in the consolidated financial statements. An internal task force was established by SAP to prevent and remediate issues. The additional processes and controls focused on agreeing revenues processed through the Revenue Accounting and Reporting software solution to underlying source documentation such as sales orders or billing plans. Thresholds were determined to focus the control performance on significant deviations.
There is the financial statement risk that revenue recognition cut-off as at the balance sheet date is incorrect and that revenues are allocated incorrectly.
Our Audit Approach
On software revenue recognition, we evaluated the compliance of SAP’s accounting policies with the IFRS Framework and IFRS 15.
We tested certain internal controls within the revenue process to identify interrelated contracts and separate performance obligations, to develop estimates of stand-alone selling prices to allocate the transaction price.
For a sample of customer contracts, which were selected using a statistical approach, we also:
– inspected the underlying contractual agreements and other related documents as well as inquiries with SAP’s accounting and/or sales representatives to evaluate SAP’s assessment of whether contracts were interrelated as well as identified performance obligations and allocation of transaction price;
– obtained and inspected external confirmations of the key terms and conditions from the respective customers to test the contract identification as well as the performance obligations and the transaction price and
– evaluated whether the revenue recognition policies applicable to each separate performance obligation were applied appropriately to ensure that revenue is recognized in the correct period.
We evaluated the stand-alone selling prices for each of the deliverables that qualified as a separate performance obligation by assessing the methodology applied, testing mathematical accuracy of the underlying calculations, and testing a sample of customer contracts to evaluate the underlying transaction data.
On the Revenue Accounting and Reporting software solution and the related process we tested the design and operating effectiveness of the manual controls that were implemented to agree revenues processed through the Revenue Accounting and Reporting software solution to underlying source documentation. In this regard, we also assessed whether the reports used by SAP to perform the controls were complete and accurate and evaluated the results of management’s testing. For the majority of software support revenue, we compared the actual support revenue with the support revenue that is expected based on last year’s support revenue, the loss rate of last year´s support contracts and the current year software sales that trigger additional support revenue. For all other significant revenue streams we selected samples to determine the accurate revenue recognition.
Our Observations
SAP has developed an adequate framework for determining the accounting treatment for its revenue. For the vast majority of the software arrangements entered into during 2019, it was clear which of SAP’s revenue recognition policies should be applied. Where there was room for interpretation, SAP’s judgment was balanced and appropriate. SAP established adequate processes and manual controls to ensure accurate revenue recognition in the consolidated financial statements.
Assessment of the Group’s tax uncertainties
Refer to note (C.5) – Income Taxes, and Group Management Report section Risk Management and Risks.
The Financial Statement Risk
SAP operates in multiple tax jurisdictions with complexities and uncertainties due to different interpretations of tax laws, such as those involving revenue sharing and cost reimbursement arrangements. The determination of provisions for tax uncertainties requires SAP to make judgments on tax issues and develop estimates regarding SAP’s exposure to tax risks. SAP regularly engages external experts to provide tax opinions to support their own risk assessment. The risk for the consolidated financial statements relates to the completeness, measurement and disclosure of the provision for uncertain tax treatments. As at December 31, 2019 SAP disclosed contingent liabilities relating to tax uncertainties of EUR 2,013 million.
Our Audit Approach
We tested certain internal controls over the tax process including controls over the Group’s assessment of tax law and the process to estimate the related exposures. We assessed the competency, skill and objectivity of the external experts as well as the opinions they prepared. We inquired of the Group’s tax department and inspected correspondence with the responsible tax authorities. We involved our tax professionals with specialized skills and knowledge, who assisted in evaluating SAP´s conclusion´s over the estimate of tax uncertainties based on knowledge and experience regarding the application of relevant legislation by tax authorities and the courts.
Our Observations
SAP’s judgments as to the amounts recognized as tax provisions for tax uncertainties as at December 31, 2019 are appropriate.
Accounting for the acquisition of Qualtrics International Inc., Provo/USA
Refer to note (D.1) – Business Combinations.
The Financial Statement Risk
On January 23rd, 2019 SAP acquired Qualtrics International Inc., Provo, USA (“Qualtrics”). The purchase price amounted to EUR 6,449 million. In allocating the purchase price to identifiable assets acquired and liabilities assumed, SAP recognised net assets in the amount of EUR 1,434 million, and goodwill in the amount of EUR 5,015 million.
46 | | Independent Auditor’s Report |
To Our | Combined Group | Consolidated Financial | Further Information on Economic, | Additional |
Stakeholders | Management Report | Statements IFRS | Environmental, and Social Performance | Information |
SAP engaged an external valuation expert to determine and measure the identifiable assets acquired.
The recognition and initial measurement of the assets acquired is complex and is based on the Executive Board’s judgmental assumptions. Significant assumptions used in the measurement of intangible assets acquired comprise the projections of the acquired business’s revenues and margins, asset-specific revenue and margin adjustments, estimated useful lives, royalty and attrition rates, as well as the cost of capital.
The risk for the consolidated financial statements relates to insufficient recognition or incorrect measurement of the assets acquired and the liabilities assumed. In addition, there is the risk that the disclosures in the notes to the consolidated financial statements are not accurate.
Our Audit Approach
We tested certain internal controls over the Company´s acquisition-date valuation process including controls over the identification of intangible assets separate from goodwill and controls to develop the relevant assumptions mentioned above.
We involved our valuation professionals with specialized skills and knowledge, who assisted in testing the assumptions as listed above by comparing them to our own expectations based on our knowledge of the acquired business, our experience in the software industry, and taking into account recent comparable transactions. The assumptions and parameters underlying the cost of capital were compared with own assumptions and publicly available data.
We agreed the total purchase price with the underlying purchase agreement and evidence of payment.
We assessed the competency, skills and objectivity of the external valuation expert engaged by SAP.
To assess the mathematical accuracy we recalculated amounts selected using a risk-oriented approach.
Finally, we assessed whether the disclosures in the notes to the consolidated financial statements with respect to the acquisition of Qualtrics are accurate.
Our Observations
The approaches underlying the identification and valuation of the assets acquired are appropriate and consistent with the applicable accounting and valuation principles. SAP applied a balanced set of key assumptions and parameters. The disclosures in the notes to the consolidated financial statements are appropriate.
Recoverability of the carrying amount of goodwill for Qualtrics Segment
Refer to note (D.2) – Goodwill.
The Financial Statement Risk
SAP performed the annual goodwill impairment test at the level of its operating segments as there are no lower levels within SAP at which goodwill is monitored for internal management purposes. SAP’s acquisition executed in the current period led to a material goodwill in the Qualtrics Segment in which SAP mainly develops, markets and sells its SAP Qualtrics offerings. Goodwill allocated to the Qualtrics Segment is EUR 2,882 Mio as of December 31, 2019 (4.8 % of consolidated balance sheet total).
The respective impairment test is complex and involves significant judgment. The estimated recoverable amount of the Qualtrics Segment approximated its carrying amount, indicating a higher risk that the goodwill may be impaired. The key assumptions relate to the budgeted revenue growth, budgeted operating margin, and discount rate, whereas minor changes to those assumptions have a significant effect on the estimated recoverable amount.
SAP engaged an external valuation expert to perform the goodwill impairment test.
Our Audit Approach
SAP performed the annual goodwill impairment test at the level of its operating segments as there are no lower levels within SAP at which goodwill is monitored for internal management purposes. SAP’s acquisition executed in the current period led to a material goodwill in the Qualtrics Segment in which SAP mainly develops, markets and sells its SAP Qualtrics offerings. Goodwill allocated to the Qualtrics Segment is EUR 2,882 Mio as of December 31, 2019 (4.8 % of consolidated balance sheet total).
The respective impairment test is complex and involves significant judgment. The estimated recoverable amount of the Qualtrics Segment approximated its carrying amount, indicating a higher risk that the goodwill may be impaired. The key assumptions relate to the budgeted revenue growth, budgeted operating margin, and discount rate, whereas minor changes to those assumptions have a significant effect on the estimated recoverable amount.
SAP engaged an external valuation expert to perform the goodwill impairment test.
Our Observations
The approaches underlying the impairment testing of goodwill are appropriate and consistent with the applicable accounting and valuation principles. SAP applied a balanced set of assumptions in determining the recoverable amount.
Other Information
The Executive Board and the Supervisory Board, respectively, of SAP SE is responsible for the other information. The other information comprises the following unaudited information in the Group Management Report:
– the combined non-financial report, included in section “General Information About This Management Report” of the Group Management Report,
– the corporate governance statement, included in section “Corporate Governance Fundamentals” of the Group Management Report, and
– Information extraneous to the Group Management Report and marked as unaudited.
The other information also includes the annual report on Form 20-F and remaining parts of the annual report.
The other information does not include the consolidated financial statements, group management report information and our auditor’s report thereon.
Our opinions on the consolidated financial statements and on the Group Management Report do not cover the other information and consequently we do not express an opinion or any other form of assurance conclusion thereon.
In connection with our audit, our responsibility is to read the other information and, in so doing, to consider whether the other information
– is materially inconsistent with the consolidated financial statements, with the Group Management Report information audited for content or our knowledge obtained in the audit, or
Independent Auditor’s Report | | 47 |
To Our | Combined Group | Consolidated Financial | Further Information on Economic, | Additional |
Stakeholders | Management Report | Statements IFRS | Environmental, and Social Performance | Information |
– otherwise appears to be materially misstated.
If, based on the work we have performed, we conclude that there is a material misstatement of this other information, we are required to report that fact. We have nothing to report in this regard.
In addition, we were engaged to perform an independent assurance engagement on selected qualitative and quantitative sustainability disclosures of the integrated report 2019. In regard to the nature, extent and conclusions of this independent assurance engagement we refer to our Independence Assurance Report dated on February 19, 2020.
Responsibilities of the Executive Board and the Supervisory Board for the Consolidated Financial Statements and the Group Management Report
The Executive Board of SAP SE is responsible for the preparation of the consolidated financial statements that comply, in all material respects, with IFRSs as adopted by the EU and the additional requirements of German commercial law pursuant to Section 315e (1) HGB as well as IFRS as adopted by the International Accounting Standards Board and that the consolidated financial statements, in compliance with these requirements, give a true and fair view of the assets, liabilities, financial position, and financial performance of the Group. In addition, the Executive Board is responsible for such internal control as the Executive Board has determined necessary to enable the preparation of consolidated financial statements that are free from material misstatement, whether due to fraud or error.
In preparing the consolidated financial statements, the Executive Board is responsible for assessing the Group’s ability to continue as a going concern. The Executive Board also has the responsibility for disclosing, as applicable, matters related to going concern. In addition, the Executive Board is responsible for financial reporting based on the going concern basis of accounting unless there is an intention to liquidate the Group or to cease operations, or there is no realistic alternative but to do so.
Furthermore, the Executive Board is responsible for the preparation of the Group Management Report that, as a whole, provides an appropriate view of the Group’s position and is, in all material respects, consistent with the consolidated financial statements, complies with the German legal requirements and appropriately presents the opportunities and risks of future development. In addition, the Executive Board is responsible for such arrangements and measures (systems) as the Executive Board has considered necessary to enable the preparation of the Group Management Report that is in accordance with the applicable German legal requirements, the German Accounting Standards number 17 and 20 (GAS 17, GAS 20) and the IFRS Practice Statement Management Commentary and to be able to provide sufficient appropriate evidence for the assertions in the Group Management Report.
The Supervisory Board is responsible for overseeing the Group’s financial reporting process for the preparation of the consolidated financial statements and of the Group Management Report.
Auditor’s Responsibilities for the Audit of the Consolidated Financial Statements and of the Group Management Report
Our objectives are to obtain reasonable assurance about whether the consolidated financial statements as a whole are free from material misstatement, whether due to fraud or error, and whether the Group Management Report as a whole provides an appropriate view of the Group’s position and, in all material respects, is consistent with the consolidated financial statements and the knowledge obtained in the audit, complies with the German legal requirements and appropriately presents the opportunities and risks of future development, as well as to issue an auditor’s report that includes our opinions on the consolidated financial statements and on the Group Management Report.
Reasonable assurance is a high level of assurance, but is not a guarantee that an audit conducted in accordance with Section 317 HGB and the EU Audit Regulation and in compliance with German Generally Accepted Standards for Financial Statement Audits promulgated by the Institut der Wirtschaftsprüfer (IDW) as well as in supplementary compliance with ISAs and guidelines of the Public Company Accounting Oversight Board (United States) will always detect a material misstatement. Misstatements can arise from fraud or error and are considered material if, individually or in the aggregate, they could reasonably be expected to influence the economic decisions of users taken on the basis of these consolidated financial statements and this Group Management Report.
We exercise professional judgment and maintain professional scepticism throughout the audit. We also:
– Identify and assess the risks of material misstatement of the consolidated financial statements and of the Group Management Report, whether due to fraud or error, design and perform audit procedures responsive to those risks, and obtain audit evidence that is sufficient and appropriate to provide a basis for our opinions. The risk of not detecting a material misstatement resulting from fraud is higher than for one resulting from error, as fraud may involve collusion, forgery, intentional omissions, misrepresentations, or the override of internal control.
– Obtain an understanding of internal control relevant to the audit of the consolidated financial statements and of arrangements and measures (systems) relevant to the audit of the Group Management Report in order to design audit procedures that are appropriate in the circumstances.
– Evaluate the appropriateness of accounting policies used by the Executive Board and the reasonableness of accounting estimates made by the Executive Board and related disclosures.
– Conclude on the appropriateness of the Executive Board’s use of the going concern basis of accounting and, based on the audit evidence obtained, whether a material uncertainty exists related to events or conditions that may cast significant doubt on the Group’s ability to continue as a going concern. If we conclude that a material uncertainty exists, we are required to draw attention in the auditor’s report to the related disclosures in the consolidated financial statements and in the Group Management Report or, if such disclosures are inadequate, to modify our respective opinions. Our conclusions are based on the audit evidence obtained up to the date of our auditor’s report. However, future events or conditions may cause the Group to cease to be able to continue as a going concern.
– Evaluate the overall presentation, structure and content of the consolidated financial statements, including the disclosures, and whether the consolidated financial statements present the underlying transactions and events in a manner that the consolidated financial statements give a true and fair view of the assets, liabilities, financial position and financial performance of
48 | | Independent Auditor’s Report |
To Our | Combined Group | Consolidated Financial | Further Information on Economic, | Additional |
Stakeholders | Management Report | Statements IFRS | Environmental, and Social Performance | Information |
the Group in compliance with IFRSs as adopted by the EU as well as with IFRSs as adopted by the International Accounting Standards Board and the additional requirements of German commercial law pursuant to Section 315e(1) HGB.
– Obtain sufficient appropriate audit evidence regarding the financial information of the entities or business activities within the Group to express opinions on the consolidated financial statements and on the Group Management Report. We are responsible for the direction, supervision and performance of the group audit. We remain solely responsible for our opinions.
– Evaluate the consistency of the Group Management Report with the consolidated financial statements, its conformity with German law, and the view of the Group’s position it provides.
– Perform audit procedures on the prospective information presented by the Executive Board in the Group Management Report. On the basis of sufficient appropriate audit evidence we evaluate, in particular, the significant assumptions used by the Executive Board as a basis for the prospective information, and evaluate the proper derivation of the prospective information from these assumptions. We do not express a separate opinion on the prospective information and on the assumptions used as a basis. There is a substantial unavoidable risk that future events will differ materially from the prospective information.
We communicate with the Supervisory Board regarding, among other matters, the planned scope and timing of the audit and significant audit findings, including any significant deficiencies in internal control that we identify during our audit.
We also provide the Supervisory Board with a statement that we have complied with relevant independence requirements, and communicate with them all relationships and other matters that may reasonably be thought to bear on our independence, and where applicable the related safeguards.
From the matters communicated with the Supervisory Board, we determine those matters that were of most significance in the audit of the consolidated financial statements of the current period and are therefore the key audit matters. We describe these matters in our auditor’s report, unless law or regulation precludes public disclosure about the matter.
Other Legal and Regulatory Requirements
Report on Internal Control over Financial Reporting in the Consolidated Financial Statements pursuant to PCAOB
Opinion on Internal Control over Financial Reporting in the Consolidated Financial Statements
We have audited the internal control over financial reporting in the consolidated financial statements of SAP SE, Walldorf, and its subsidiaries in place as at December 31, 2019. This control system is based on criteria set out in the Internal Control – Integrated Framework (2013) issued by the Committee of Sponsoring Organizations of the Treadway Commission (COSO).
In our opinion, SAP maintained, in all material respects, effective internal control over financial reporting in the consolidated financial statements as at December 31, 2019 based on the criteria set out in the Internal Control – Integrated Framework (2013) issued by the COSO.
Executive Board’s and Supervisory Board’s Responsibility for the Internal Control over Financial Reporting in the Consolidated Financial Statements
SAP SE’s Executive Board is responsible for maintaining effective internal control over financial reporting in the consolidated financial statements and assessing its effectiveness, which is included in the Executive Board’s report on the internal control over consolidated financial reporting.
A company’s internal control over financial reporting in the consolidated financial statements is a process designed to provide reasonable assurance regarding the reliability of financial reporting in the consolidated financial statements and the preparation of financial statements for external purposes in accordance with generally accepted accounting principles. A company’s internal control over financial reporting in the consolidated financial statements includes policies and procedures to (1) ensure an accounting system that in reasonable detail accurately and fairly reflects the transactions and dispositions of the company’s assets, (2) provide reasonable assurance that transactions are recorded as necessary to permit preparation of financial statements in accordance with generally accepted accounting principles, and (3) provide reasonable assurance regarding prevention or timely detection of unauthorized acquisition, use or disposition of the company’s assets that could have a material effect on the financial statements.
Because of its inherent limitations, internal control over financial reporting may not prevent or detect material misstatements. Also, projections of any evaluation of effectiveness to future periods are subject to the risk that controls may become inadequate because of changes in conditions, or that the degree of compliance with the policies or procedures may deteriorate.
The Supervisory Board is responsible for overseeing the Group’s internal control over financial reporting in the consolidated financial statements.
Auditor’s Responsibility for the Internal Control over Financial Reporting in the Consolidated Financial Statements
Our responsibility is to express an opinion on the internal control over financial reporting in the consolidated financial statements based on our audit. We conducted our audit in accordance with the standards of the Public Company Accounting Oversight Board (United States). Those standards require that we plan and perform the audits to obtain reasonable assurance about whether effective internal control over financial reporting in the consolidated financial statements was maintained in all material respects. Our audit of internal control over financial reporting in the consolidated financial statements included obtaining an understanding of internal control over financial reporting, assessing the risk of material deficiencies in internal control, testing and evaluating the design and operating effectiveness of internal control based on this assessment, and performing such other procedures as we considered necessary in the circumstances.
We believe that the audit evidence we have obtained is sufficient and appropriate to provide a basis for our opinion.
Independent Auditor’s Report | | 49 |
To Our | Combined Group | Consolidated Financial | Further Information on Economic, | Additional |
Stakeholders | Management Report | Statements IFRS | Environmental, and Social Performance | Information |
Further Information pursuant to Article 10 of the EU Audit Regulation
We were elected as group auditor at the annual general meeting on May 15, 2019. We were engaged by the Chairman of the Audit Committee of the Supervisory Board of SAP SE on May 23, 2019, and this engagement was confirmed on July 31, 2019. We have been the group auditor of SAP SE without interruption since the financial year 2002.
We declare that the opinions expressed in this auditor’s report are consistent with the additional report to the audit committee pursuant to Article 11 of the EU Audit Regulation (long-form audit report).
In addition to the financial statement audit, we have provided to group entities the following services that are not disclosed in the consolidated financial statements or in the Group Management Report:
We audited the financial statements of SAP SE and performed various financial statement audits at subsidiaries. Furthermore, other assurance services required by law or on a contractual basis were performed, including an assurance engagement on selected qualitative and quantitative sustainability disclosures of the Integrated Report 2019 and an EMIR assurance service pursuant to section 20 of German Securities Trading Act [WpHG] and service organization attestation procedures.
German Public Auditor Responsible for the Engagement
The German Public Auditor responsible for the engagement is Bodo Rackwitz.
Mannheim, February 19, 2020
KPMG AG
Wirtschaftsprüfungsgesellschaft
[Original German version signed by:]
Rackwitz | Schneider |
Wirtschaftsprüfer | Wirtschaftsprüferin |
[German Public Auditor] | [German Public Auditor] |
50 | | Independent Auditor’s Report |
To Our | Combined Group | Consolidated Financial | Further Information on Economic, | Additional |
Stakeholders | Management Report | Statements IFRS | Environmental, and Social Performance | Information |
Combined Group Management Report
General Information About This Management Report | 52 |
Strategy and Business Model | 54 |
Performance Management System | 60 |
Products, Research & Development, and Services | 67 |
Security, Data Protection, and Privacy | 71 |
Customers | 74 |
Employees and Social Investments | 75 |
Energy and Emissions | 80 |
Financial Performance: Review and Analysis | 83 |
Corporate Governance Fundamentals | 101 |
Business Conduct | 103 |
Risk Management and Risks | 105 |
Expected Developments and Opportunities | 126 |
Combined Group Management Report | 51 |
To Our | Combined Group | Consolidated Financial | Further Information on Economic, | Additional |
Stakeholders | Management Report | Statements IFRS | Environmental, and Social Performance | Information |
General Information About This Management Report
Basis of Presentation
This combined group management report by the SAP Group (collectively, “we,” “us,” “our,” “SAP,” “Group,” or “Company”) and the management report of SAP SE have been prepared in accordance with sections 289, 289a, 289f, 315, 315a, and 315d of the German Commercial Code and German Accounting Standards (GAS) No. 17 and 20. The management report is also a management commentary complying with the International Financial Reporting Standards (IFRS) Practice Statement “Management Commentary”.
German Commercial Code, sections 289b and 315b, requires us to prepare, for both SAP SE and the SAP Group, a non-financial statement within the management report or a non-financial report outside of the management report in which we report on social, environmental, and other non-financial matters. The required disclosures can be, but do not need to be, a separate section in our management report. Instead, the information required can also be provided, in an integrated manner, in the different sections of the management report. SAP released a combined non-financial report outside of the combined management report but within our online integrated report with references to the sections of our combined management report. This combined non-financial report is available at http://www.sap.com/investors/sap-2019-combined-non-financial-report. We believe that this approach is best aligned with SAP’s integrated reporting strategy, also taking into account that all non-financial information stipulated in the German Commercial Code, sections 289c and 315c, that is relevant to understand SAP’s development, business performance, and the position of the Group and SAP SE is included in our combined management report.
Our auditor, KPMG AG Wirtschaftsprüfungsgesellschaft (KPMG), audited SAP’s combined group management report, except for information that was not subject to the statutory audit of our combined group management report, but on which a limited assurance engagement was performed as stated in the following in this paragraph. Additionally, KPMG performed an independent assurance engagement on selected qualitative and quantitative sustainability disclosures. The SAP’s Impact; Security, Data Protection, and Privacy; Employees and Social Investments; Energy and Emissions; and Business Conduct sections include information that was not subject to the statutory audit of our combined group management report, but on which a limited assurance engagement was performed. These sections contain further explanations about the audit scope in an info box at the end of the respective section marked by the symbol  . For more information about the scope of the assurance and the underlying reporting criteria, see KPMG’s Independent Auditor’s Report and the Assurance Report of the Independent Auditor on Selected Qualitative and Quantitative Sustainability Disclosures in the SAP Integrated Report.
All of the information in this report relates to the situation as at December 31, 2019, or the fiscal year ended on that date, unless otherwise stated.
Forward-Looking Statements
This management report contains forward-looking statements and information based on the beliefs of, and assumptions made by, SAP management using information currently available to them. Any statements contained in this report that are not historical facts are forward-looking statements as defined in the U.S. Private Securities Litigation Reform Act of 1995. We have based these forward-looking statements on our current expectations, assumptions, and projections about future conditions and events. As a result, our forward-looking statements and information are subject to uncertainties and risks, many of which are beyond our control. If one or more of these uncertainties or risks materializes, or if management’s underlying assumptions prove incorrect, our actual results could differ materially from those described in or inferred from our forward-looking statements and information. We describe these risks and uncertainties in the Risk Management and Risks section.
The words “aim,” “anticipate,” “assume,” “believe,” “continue,” “could,” “counting on,” “is confident,” “development,” “estimate,” “expect,” “forecast,” “future trends,” “guidance,” “intend,” “may,” “might,” “outlook,” “plan,” “predict,” “project,” “seek,” “should,” “strategy,” “want,” “will,” “would,” and similar expressions as they relate to us are intended to identify such forward-looking statements. Such statements include, for example, those made in the Operating Results section, our quantitative and qualitative disclosures about market risk pursuant to the International Financial Reporting Standards (IFRS), namely IFRS 7 and related statements in our Notes to the Consolidated Financial Statements; Expected Developments and Opportunities section; Risk Management and Risks section; and other forward-looking information appearing in other parts of this report. To fully consider the factors that could affect our future financial results, both this report and our Annual Report on Form 20-F should be considered, as well as all of our other filings with the U.S. Securities and Exchange Commission (SEC). Readers are cautioned not to place undue reliance on these forward-looking statements, which speak only as of the date specified or the date of this report. We undertake no obligation to publicly update or revise any forward-looking statements as a result of new information that we receive about conditions that existed upon issuance of this report, future events, or otherwise unless we are required to do so by law.
This report includes statistical data about the IT industry and global economic trends that comes from information published by sources including International Data Corporation (IDC), Gartner, the European Central Bank (ECB), and the International Monetary Fund (IMF). This type of data represents only the estimates of IDC, Gartner, the ECB, the IMF, and other sources of industry data. SAP does not adopt or endorse any of the statistical information provided by sources such as IDC, Gartner, the ECB, the IMF, or other similar sources that is contained in this report. The data from these
52 | General Information About This Management Report |
To Our | Combined Group | Consolidated Financial | Further Information on Economic, | Additional |
Stakeholders | Management Report | Statements IFRS | Environmental, and Social Performance | Information |
sources is subject to risks and uncertainties, and subject to change based on various factors, including those described above, in the Risk Management and Risks section, and elsewhere in this report. These and other factors could cause our results to differ materially from those expressed in the estimates made by third parties and SAP. We caution readers not to place undue reliance on this data.
General Information About This Management Report | 53 |
To Our | Combined Group | Consolidated Financial | Further Information on Economic, | Additional |
Stakeholders | Management Report | Statements IFRS | Environmental, and Social Performance | Information |
Strategy and Business Model
Overview of SAP
Founded in 1972, SAP is a global company headquartered in Walldorf, Germany. Our legal corporate name is SAP SE. SAP is the market leader in enterprise application software1) and also the leading experience management, analytics, and business intelligence company. The SAP Group has a global presence and employs more than 100,000 people.
Our ordinary shares are listed on the Frankfurt Stock Exchange. American Depositary Receipts (ADRs) representing SAP SE ordinary shares are listed on the New York Stock Exchange (NYSE). SAP is a member of Germany’s DAX and TecDAX as well as the Dow Jones EURO STOXX 50, the Dow Jones Sustainability Index World, and the Dow Jones Sustainability Index Europe. As at December 31, 2019, SAP was the most valuable company in the DAX and the 49th most valuable company globally based on market capitalization. SAP was ranked as the most sustainable software company in the Dow Jones Sustainability Indices for the thirteenth consecutive year.
SAP SE is the parent company of the SAP Group. As at December 31, 2019, the SAP Group comprised 264 companies that develop, distribute, and provide our products, solutions, and services. For a list of our subsidiaries, associates, and other equity investments, see the Notes to the Consolidated Financial Statements, Note (G.9).
Our Purpose
At SAP, our purpose is to “help the world run better and improve people’s lives” by empowering our customers to create a better economy, society, and environment for the world.
In line with our purpose, we are committed to supporting the United Nations Sustainable Development Goals (UN SDGs). Technology-driven innovation underpins how SAP, together with our customers and our partner ecosystem, can execute initiatives across all 17 of the UN SDGs. Our goal is to lead the evolution of technology while also helping ensure that the focus remains on taking responsibility for its outcomes and societal effects. Examples of how we are doing this include the focus of social investments on building digital skills and our guiding principles for artificial intelligence and governance.
Our Strategy
SAP’s strategy is to be the Experience Company powered by the Intelligent Enterprise.2) We believe every digital interaction is an opportunity for a company to positively influence a customer. Through these interactions, companies can measure “experiences” – such as customer satisfaction, employee engagement, partner collaboration, and brand impact. These interactions are also opportunities for companies to understand how end users and customers perceive a vendor or a product. We want to help every SAP customer thrive in today’s “experience economy” by equipping them with the technologies to become intelligent enterprises.
Our vision for the intelligent enterprise, an event-driven, real-time business, focuses on three key objectives:
– Create a new end-to-end customer experience through a platform for Experience Management that allows businesses to collect, understand, and act on feedback across their customers, employees, products, and brands in real time. In particular, we enable companies to enhance feedback with analytics, so they not only can understand what is being said, but also why.
– Achieve a step change in productivity through the next level of automation in business processes powered by artificial intelligence/machine learning (AI/ML) embedded in every part of the business process (across financials, supply chain, manufacturing, procurement, travel, and human resources). AI is defined as algorithms that learn from data without being explicitly programmed, thus empowering enterprises to scale by automating business processes. The key to doing so is improving the cycle time of business processes and injecting speed and increasing quality wherever possible.
– Help companies engage their workforces by delivering total workforce engagement across full-time and contingent labor.
At SAP, our commitment to our customers is to help them meet today’s challenges and prepare for anticipated challenges of the future. SAP aims to deliver on these objectives by leveraging the power of data in SAP software with technologies such as AI/ML to build powerful intelligent applications.
Becoming the “Experience Company powered by the Intelligent Enterprise”
Our software, technologies, and services address the three core elements of the intelligent enterprise for the 25 industries and the 12 lines of business (LoBs) we serve:
– An intelligent suite of LoB applications that includes enterprise resource planning (ERP) and digital supply chain management, as well as solutions for customer experience, intelligent spend management, and human experience management. The intelligent suite is integrated and differentiated through industry-specific business processes for end-to-end scenarios.
– A business technology platform to help customers manage data orchestration across their entire application footprint. This includes real-time visibility into distributed data silos using data management solutions and an open cloud platform as a business platform for integration and business process innovation.
– An Experience Management (XM) platform, bringing together experience data (X-data) and operational data (O-data) to help organizations manage four core experiences – customer, employee, product, and brand. This includes using API-based integration between XM and the intelligent suite to connect X-data with relevant O-data.
For more information about the products and solutions offered as part of our strategy framework, see the Products, Research & Development, and Services section.
54 | Strategy and Business Model |
To Our | Combined Group | Consolidated Financial | Further Information on Economic, | Additional |
Stakeholders | Management Report | Statements IFRS | Environmental, and Social Performance | Information |
Our people are critical to delivering our strategy, as they are key in delivering innovations to help our customers transform. For more information, see the Employees and Social Investments section.
Acquisitions
We will continue to focus on organic investments in technology and innovations that ensure sustainable growth of our solution portfolio to drive our short-term, mid-term, and long-term ambitions. Additionally, we may make targeted acquisitions to complement our solution offerings and improve coverage in key strategic markets.
In January 2019, we acquired Qualtrics International, Inc., a leader in the Experience Management (XM) software category that enables organizations to thrive in today’s economy. The acquisition closed on January 23, 2019. Together, SAP and Qualtrics are working to accelerate the new XM category by combining experience data and operational data to power the experience economy. For more information about the Qualtrics segment, see the Notes to the Consolidated Financial Statements, Note (C.1).
For more information about the acquisition of Qualtrics International Inc., see the Notes to the Consolidated Financial Statements, Note (D.1).
Sapphire Ventures
In addition to our investments in organic growth and acquisitions, SAP also supports entrepreneurs that aspire to build industry-leading businesses, through venture capital funds managed by Sapphire Ventures. Sapphire Ventures manages over US$3.5 billion and has invested in more than 160 companies. These include growth-stage technology companies and early-stage venture capital funds. Sapphire Ventures pursues opportunities in which it can help fuel enterprise growth by adding expertise, relationships, geographic reach, and capital. It places a particular focus on companies in Europe, Israel, and the United States. In addition to our venture investments through Sapphire Ventures, SAP also has the SAP.iO Fund, managed by Sapphire Ventures, that focuses on strategic early-stage investments in enterprise software startups. As a part of the SAP.iO Fund, SAP has also committed to invest up to 40% of the investable capital in underrepresented groups in enterprise software to foster diversity and inclusion, such as startups founded or led by female entrepreneurs.
1) Enterprise application software is computer software specifically developed to support and automate business processes.
2) An “intelligent enterprise” is an event-driven, real-time business powered by technology that includes machine learning, blockchain, the Internet of Things, and analytics capabilities to help scale innovation.
Strategy and Business Model | 55 |
To Our | Combined Group | Consolidated Financial | Further Information on Economic, | Additional |
Stakeholders | Management Report | Statements IFRS | Environmental, and Social Performance | Information |
SAP’s Impact
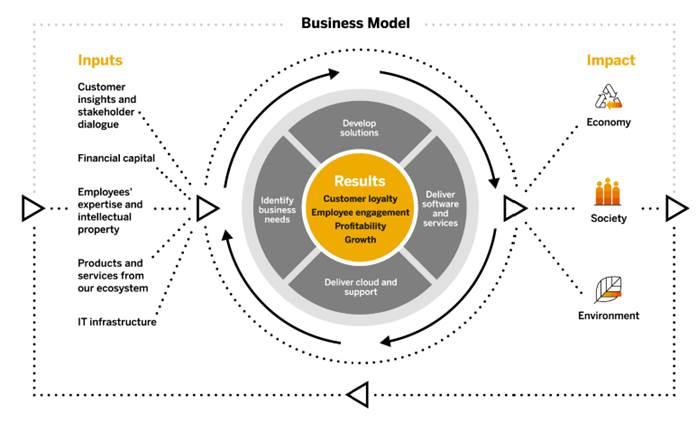
We innovate software and technology solutions that help empower our customers to become intelligent enterprises. For us, delivering an intelligent enterprise and helping our customers thrive in the experience economy are essential for a better, more productive world. By helping unlock the potential of innovation, we support businesses and governments with having a positive impact on the economies, societies, and environments in which they exist. In this way, we aim to fulfill our purpose of helping the world run better and improving people’s lives.
Our Business Model
We create value by identifying the business needs of our customers, then developing and delivering software, services, and support that address these business needs. Through close collaboration with our customers and partners, we aim to ensure that our software creates value for our customers. By obtaining customer feedback, we strive to continuously improve our solutions, identify further business needs, and deliver enhanced value to our customers.
Results
By developing software, providing our software and services to our customers, and engaging them in feedback, we generate results for SAP such as growth, profitability, employee engagement, and customer loyalty.
Inputs
This process does not happen in a vacuum. It is enabled by internal and external inputs, most importantly customer insights and broader stakeholder dialogue, financial capital, employees’ expertise, and intellectual property, products and services from our partner ecosystem, as well as the IT infrastructure we rely on.
Impact
Our solutions enable impact at our customers and – through them – in the world. The following are some examples of our impact in various areas.
Economy
SAP software supports the UN SDGs 8 (Decent Work and Economic Growth); 9 (Industry, Innovation, and Infrastructure); 10 (Reduced Inequalities); and 12 (Responsible Consumption and Production) by helping companies provide jobs and strengthening industries and infrastructure. For example, SAP software helps:
– Companies work better to bring economic prosperity and fairly paid jobs to people around the world.
– Organizations optimize resource utilization, aspiring for a world with zero waste.
Society
SAP software supports the UN SDGs 1 (No Poverty); 2 (Zero Hunger); 3 (Good Health and Well-Being); 4 (Quality Education); 5 (Gender Equality); 7 (Affordable and Clean Energy); 11 (Sustainable Cities and Communities); and 16 (Peace, Justice,
56 | Strategy and Business Model |
To Our | Combined Group | Consolidated Financial | Further Information on Economic, | Additional |
Stakeholders | Management Report | Statements IFRS | Environmental, and Social Performance | Information |
and Strong Institutions) by helping create a peaceful and just society through better healthcare, education, and access to technology. For example:
– We are also deeply committed to empowering the world’s youth, working adults, differently-abled people, and the unemployed with the right skills to thrive in the digital economy.
– Cities are facing growing populations and aging infrastructures. SAP solutions for the Internet of Things can help manage and monitor resources so that cities can run more sustainably and help citizens enjoy more enjoyable, safer lives.
Environment
SAP software supports the UN SDGs 6 (Clean Water and Sanitation); 13 (Climate Action); 14 (Life Below Water); and 15 (Life on Land) and helps protect the environment by addressing the need for water, clean energy, and responsible development. For example:
– We are all affected by climate change. SAP technology is helping our customers increase their overall resource productivity and transform their businesses to reduce carbon outputs.
– With the world population growing steadily, humanity will need to provide water, food, and shelter to billions of people in the coming years. SAP solutions help our customers reduce water waste and support sustainable management of water and sanitation for all.
Furthermore, we know there is power in collaboration and we engage in a wide range of partnerships to address SDG 17 (Partnerships for the Goals).
Trade-Offs
At the same time, we are aware of potential negative impacts of our business activities and strive to mitigate these. For example:
– An acceleration of the digital divide could decouple societal groups from entire segments of the economy, impacting employment potential. SAP focuses our social investment activities on providing digital skills to underprivileged people. For more information, see the Employees and Social Investments section.
– We expect increasing energy consumption due to our own growth and increasing digitization globally. We offer a green cloud to help reduce CO2 footprint. For more information, see the Energy and Emissions section.
 Audit Scope Audit Scope
| |
The content of this section was not subject to the statutory audit of our combined group management report. However, our external auditor, KPMG, performed an independent limited assurance engagement on the contents of this section. | |
Strategy and Business Model | 57 |
To Our | Combined Group | Consolidated Financial | Further Information on Economic, | Additional |
Stakeholders | Management Report | Statements IFRS | Environmental, and Social Performance | Information |
Measuring Our Success
We use the following financial and non-financial objectives to steer our company:
– Growth
– Profitability
– Customer loyalty
– Employee engagement
The table below provides an overview of the specific key performance indicators (KPIs) used to measure performance within these objectives and compares this performance with our goals. In addition, we are committed to become carbon neutral in 2025 and therefore regularly report and analyze the reduction in our carbon footprint. 1
Outlook and Results for 2019 | | |
Strategic Objective | KPI | 2019 Outlook* (non-IFRS, at constant currencies) | 2019 Results (non-IFRS, at constant currencies) |
| Cloud revenue | €6.7 billion to €7.0 billion | €6.77 billion |
Growth | Cloud and software revenue | €22.4 billion to €22.7 billion | €22.49 billion |
| Total revenue | Strong increase, at a rate lower than operating profit | €26.91 billion |
Profitability | Operating profit | €7.85 billion to €8.05 billion | €7.95 billion |
Customer Loyalty | Customer Net Promoter Score | +1 | –6 |
Employee Engagement | Employee Engagement Index | 84% to 86% | 83% |
Carbon Impact | Net greenhouse gas emissions | 285 kt | 300 kt |
* The outlook was communicated in January 2019 and financial targets were raised in April. The 2019 outlook numbers above reflect the raised outlook from April 2019. Note: A reconciliation of non-IFRS results to IFRS equivalent is available in the Performance Management System section.
Outlook for 2020 | | |
Strategic Objective | KPI | 2019 Results (non-IFRS) | 2020 Outlook (non-IFRS, at constant currencies) |
| Cloud revenue | €7.01 billion | €8.7 billion to €9.0 billion |
Growth | Cloud and software revenue | €23.09 billion | €24.7 billion to €25.1 billion |
| Total revenue | €27.63 billion | €29.2 billion to €29.7 billion |
Profitability | Operating profit | €8.21 billion | €8.9 billion to €9.3 billion |
Customer Loyalty | Customer Net Promoter Score | –6.0 | Increase by three to five points |
Employee Engagement | Employee Engagement Index | 83% | 84% to 86% |
Carbon Impact | Net greenhouse gas emissions | 300 kt | 238 kt |
Note: A reconciliation of non-IFRS results to IFRS equivalent is available in the Performance Management System section.
_________________________
1 Carbon emissions are part of the short-term incentive in Executive Board compensation as of fiscal year 2020.
58 | Strategy and Business Model |
To Our | Combined Group | Consolidated Financial | Further Information on Economic, | Additional |
Stakeholders | Management Report | Statements IFRS | Environmental, and Social Performance | Information |
Ambitions for 2023 | | |
Strategic Objective | KPI | 2023 Ambition (non-IFRS) |
Growth | Cloud revenue | More than triple compared to 2018 |
| Total revenue | More than €35 billion |
Profitability | Operating margin | Increase the non-IFRS operating margin by one percentage point per year on average, representing a total expansion of approximately 500 basis points compared to 2018 |
Customer Loyalty | Customer Net Promoter Score | Steadily increase |
Employee Engagement | Employee Engagement Index | 84% to 86% |
Carbon Impact | Net greenhouse gas emissions | 95 kt, with the goal of becoming carbon neutral by 2025 |
Note: A reconciliation of non-IFRS results to IFRS equivalent is available in the Performance Management System section.
Strategy and Business Model | 59 |
To Our | Combined Group | Consolidated Financial | Further Information on Economic, | Additional |
Stakeholders | Management Report | Statements IFRS | Environmental, and Social Performance | Information |
Performance Management System
We use various performance measures to manage our performance with regard to our primary financial objectives, which are growth and profitability, and our primary non-financial objectives, which are customer loyalty and employee engagement. We view growth and profitability as indicators of our current performance, while we see customer loyalty and employee engagement as indicators of our future performance.
Measures to Manage Our Financial Performance
Measures to Manage Our Operating Financial Performance
In 2019, we used the following key measures to manage our operating financial performance:
Cloud revenue (non-IFRS): This revenue driver comprises the main revenues of our fast-growing cloud business. Revenue from cloud is derived from fees earned from providing customers with any of the following:
– Software as a service (SaaS)
– Platform as a service (PaaS)
– Infrastructure as a service (IaaS)
– Premium cloud support beyond regular support embedded in cloud offerings.
For more information regarding cloud revenue and a description of these services, see the Notes to the Consolidated Financial Statements, Note (A.1).
We use the cloud revenue (non-IFRS) measure at both actual currencies and constant currencies.
Cloud and software revenue (non-IFRS): We use cloud and software revenue (non-IFRS) expressed in both actual currencies and constant currencies to measure our revenue growth. Our cloud and software revenue includes cloud revenue plus software licenses and support revenue. Cloud revenue and software revenue are our key revenue drivers because they tend to affect our other revenue streams. Generally, customers that buy software licenses also enter into related support contracts, and these generate recurring support revenue after the software sale. Support contracts cover standardized support services and unspecified future software updates and enhancements. Cloud and software revenue also tends to stimulate services revenue, which is earned by providing customers with professional services, premium engagement services, training services, messaging services, and payment services.
Total revenue (non-IFRS): We use total revenue (non-IFRS) to measure our growth at both actual currencies and constant currencies. The total of cloud revenue and support revenue divided by total revenue is the share of more predictable revenue. This measure provides additional insight into our sustained business success.
New cloud bookings: For our cloud activities, we also look at new cloud bookings (both in actual currencies and constant currencies). This measure reflects the committed order entry from new customers and from incremental purchases by existing customers for offerings that generate cloud revenue. For new cloud bookings we take into consideration committed deals only, meaning utilization-based payments are not included in this measure. In this way, it is an indicator of cloud-related sales success in a given period and of secured future cloud revenue. We focus primarily on the average contract value variant of the new cloud bookings measure that generally takes into account annualized amounts for contracts. There are no comparable IFRS measures for these bookings metrics.
Cloud backlog: In addition to new cloud bookings, we use the measure “cloud backlog” to evaluate our sales success in the cloud business. We define cloud backlog as a measure that represents expected future cloud revenue that, as of period end, is contracted but not yet billed.
Operating profit (non-IFRS): We use operating profit (non-IFRS) expressed in both actual currencies and constant currencies to measure our overall operational process efficiency and overall business performance.
Cloud gross margin (non-IFRS): We use our cloud gross margin (non-IFRS) to measure our process efficiency in our cloud business. Cloud gross margin (non-IFRS) is the ratio of our cloud gross profit (non-IFRS) to cloud revenue (non-IFRS), expressed as a percentage.
Operating margin (non-IFRS): We use operating margin to measure our overall operational efficiency. Operating margin (non-IFRS) is the ratio of our operating profit (non-IFRS) to total revenue (non-IFRS), expressed as a percentage.
Starting in 2020, new cloud bookings will be replaced by current cloud backlog (CCB), both in actual and at constant currencies, to manage our operating financial performance. We intend to use that measure to evaluate our overall go-to-market success in the committed cloud business. CCB is the contractually committed cloud revenue we expect to recognize over the upcoming 12 months as of a specific key date. Thus, it is a subcomponent of our overall remaining performance obligations following IFRS 15.120. For CCB, we take into consideration committed deals only. CCB can be regarded as a lower boundary for cloud revenue to be recognized over the next 12 months, as it excludes utilization-based models without pre-commitments and committed deals closed after the key date. For our committed cloud business, we believe the expansion of CCB over a period is a valuable indicator of go-to-market success, as it reflects both new contracts closed as well as existing contracts renewed.
Measures to Manage Our Non-Operating Financial Performance
We use the following measures to manage our non-operating financial performance:
Financial income, net: This measure provides insight into the return on liquid assets and capital investments and the cost of borrowed funds. To manage our financial income, net, we focus on cash flow, the composition of our liquid assets and capital
60 | Performance Management System |
To Our | Combined Group | Consolidated Financial | Further Information on Economic, | Additional |
Stakeholders | Management Report | Statements IFRS | Environmental, and Social Performance | Information |
investment portfolio, and the average rate of interest at which assets are invested. We also monitor average outstanding borrowings and associated finance costs.
Days Sales Outstanding (DSO): We manage working capital by controlling the DSO of trade receivables. DSO measures the average number of days from the raised invoice to cash receipt from the customer. We calculate DSO by dividing the average invoiced trade receivables balance of the last 12 months by the average monthly cash receipt of the last 12 months.
Measures to Manage Overall Financial Performance
We use the following measures to manage our overall financial performance:
Earnings per share (EPS) (IFRS and non-IFRS): EPS measures our overall performance because it captures all operating and non-operating elements of profit as well as income tax expense. It represents the portion of profit after tax allocable to each SAP share outstanding. EPS is influenced not only by our operating and non-operating business and income taxes but also by the number of shares outstanding.
Effective tax rate (IFRS and non-IFRS): We define our effective tax rate as the ratio of income tax expense to profit before tax, expressed as a percentage.
Operating, investing, and financing cash flows and free cash flow: Our consolidated statement of cash flows provides insight into how we generate and use cash and cash equivalents. When applied in conjunction with the other primary financial statements, it provides information that helps us evaluate the changes in our net assets, our financial structure (including our liquidity and solvency), and our ability to affect the amounts and timing of cash flows to adapt to changing circumstances and opportunities. We use our free cash flow measure to determine the cash flow remaining after all expenditures required to maintain or expand our organic business have been paid off. This measure provides management with supplemental information to assess our liquidity needs. We calculate free cash flow as net cash from operating activities minus purchases (other than purchases made in connection with business combinations) of intangible assets and property, plant, and equipment, as well as payments for lease liabilities.
Measures to Manage Our Non-Financial Performance
In 2019, we used the following key measures to manage our non-financial performance in the areas of customer loyalty, employee engagement, and leadership trust:
Customer Net Promoter Score (Customer NPS): This score measures the willingness of our customers to recommend or promote SAP to others. It is derived from ongoing customer surveys and identifies, on a scale of 0–10, whether a customer is likely to recommend SAP to friends or colleagues, is neutral, or is unwilling to recommend. We introduced this measure in 2012, as we are convinced that we can achieve our financial goals only when our customers are loyal to, and satisfied with, SAP and our solutions. To derive the Customer NPS, we start with the percentage of “promoters” of SAP, that is, those giving us a score of 9 or 10 on a scale of 0–10. We then subtract the percentage of “detractors,” that is, those giving us a score of 0 to 6. The method ignores “passives,” that is, those giving us a score of 7 or 8. Consequently, the range of achievable scores is –100 to +100, with the latter being the best achievable score for customer loyalty as measured by the Customer NPS methodology.
Employee Engagement Index: We use this index to measure the motivation and loyalty of our employees, how proud they are of our company, and how strongly they identify with SAP. The index is derived from an annual survey of our employees. Applying this measure is recognition that our growth strategy depends on engaged employees.
Leadership Trust Score: We use this score to further enhance accountability and to measure our collective effort to foster a work environment based on trust. It is derived from a question in our annual global employee survey that gauges employees’ trust in our leaders. We measure leadership trust by using the same NPS methodology that we use to compute the Customer NPS.
Starting in 2020, we will also use carbon emissions to manage our non-financial performance. It is used as a metric to strengthen our ambitious short-term and long-term carbon reduction targets. We measure our net carbon emissions according to the Greenhouse Gas (GHG) Protocol. The net carbon emissions are calculated by deducting emission savings such as renewable energy and carbon offsets from our gross carbon emissions.
Value-Based Management
Our holistic view of the performance measures described above, together with our associated analyses, comprises the information we use for value-based management. We use planning and control processes to manage the compilation of these key measures and their availability to our decision-makers across various management levels.
SAP’s long-term strategic plans are the point of reference for our short-term and mid-term planning and controlling processes. We initially identify future growth and profitability drivers at a highly aggregated level. In a first step, the resulting financial plan is broken down into (i) our deployment models “On Premise”, “Software as a Service/Platform as a Service”, “Infrastructure as a Service”, and “Intelligent Spend Management”; and (ii) functions such as development, sales, and administration. In a second step, the planned total revenues and total expenses are generally allocated to the areas of functional responsibility of the individual members of the Executive Board (the Board areas). If a Board area represents not only a functional department but also has a responsibility for operating segments within this Board area (for example, Intelligent Spend Group segment and Qualtrics segment), the allocation is done at the lower segment level. Budget adjustments may be applied during the year to reflect changes in priorities, to achieve efficiency targets, and to reflect endogenous and exogenous factors. Such budget adjustments, as well as the assessment of the Executive Board’s performance, are handled at the Board area level if the Board area is part of a segment, or at the segment level if the Board area comprises several segments. It is then the individual Board member’s responsibility to break down the allocated budget adjustments within the segment budget boundary. Based on an integrated portfolio process running in parallel to the budgeting process, we ensure aligned investment behavior across Board areas with regards to specific solutions or solution areas. In a final step, customer-facing revenue targets and cost-of-sales and marketing targets are broken down into sales regions.
Performance Management System | 61 |
To Our | Combined Group | Consolidated Financial | Further Information on Economic, | Additional |
Stakeholders | Management Report | Statements IFRS | Environmental, and Social Performance | Information |
Based on our detailed annual plans, we determine the budget for the respective year. We also have processes in place to forecast revenue and profit on a quarterly basis, to quantify whether we expect to realize our financial goals, and to identify any deviations from plan. We continuously monitor the affected units in the Group to analyze these developments and define any appropriate actions. Our entire network of planning, control, and reporting processes is implemented in integrated planning and information systems, based on SAP software, across all organizational units so that we can conduct the evaluations and analyses needed to make informed decisions.
Non-IFRS Financial Measures Cited in This Report
Explanation of Non-IFRS Measures
We disclose certain financial measures such as revenue (non-IFRS), expense (non-IFRS), and profit measures (non-IFRS) that are not prepared in accordance with IFRS and are therefore considered non-IFRS financial measures. Our non-IFRS financial measures may not correspond to non-IFRS financial measures that other companies report. The non-IFRS financial measures that we report should only be considered in addition to, and not as substitutes for, or superior to, our IFRS financial measures.
We believe that the disclosed supplemental historical and prospective non-IFRS financial information provides useful information to investors because management uses this information, in addition to financial data prepared in accordance with IFRS, to attain a more transparent understanding of our past performance and our anticipated future results. We use non-IFRS revenue and profit measures consistently in our internal planning and forecasting, reporting, and compensation, as well as in our external communications, as follows:
– Our management primarily uses these non-IFRS measures rather than IFRS measures as the basis for making financial, strategic, and operating decisions.
– The variable components of our Executive Board members’ and employees’ remuneration are based on revenue (non-IFRS), operating profit (non-IFRS), operating margin (non-IFRS), as well as new cloud bookings measures rather than the respective IFRS measures.
– The annual budgeting process for all management units is based on revenue (non-IFRS) and operating profit (non-IFRS) numbers rather than the respective IFRS financial measures.
– All forecast and performance reviews with all senior managers globally are based on these non-IFRS measures, rather than the respective IFRS financial measures.
– Both our internal performance targets and the guidance we provide to the capital markets are based on non-IFRS revenue and profit measures rather than the respective IFRS financial measures.
Our non-IFRS financial measures reflect adjustments based on the items below, as well as adjustments for the related income tax effects.
Revenue (Non-IFRS)
Non-IFRS revenue measures have been adjusted from the respective IFRS financial measures by including the full amount of software support revenue, cloud revenue, and other similarly recurring revenue that we are not permitted to record as revenue under IFRS due to fair value accounting for the contracts in effect at the time of the respective acquisitions.
Under IFRS, we record at fair value the contracts in effect at the time entities were acquired. Consequently, our IFRS software support revenue, IFRS cloud revenue, IFRS cloud and software revenue, and IFRS total revenue for periods subsequent to acquisitions do not reflect the full amount of revenue that would have been recorded by entities acquired by SAP had they remained stand-alone entities. Adjusting revenue numbers for this revenue impact provides additional insight into the comparability of our ongoing performance across periods.
Operating Expense (Non-IFRS)
Operating expense numbers that are identified as operating expenses (non-IFRS) have been adjusted by excluding the following expenses:
– Acquisition-related charges
▪ Amortization expense/impairment charges for intangibles acquired in business combinations and certain stand-alone acquisitions of intellectual property (including purchased in-process research and development)
▪ Settlements of preexisting business relationships in connection with a business combination
▪ Acquisition-related third-party expenses
– Share-based payment expenses
– Restructuring expenses, that is, expenses resulting from measures which comply with the definition of restructuring according to IFRS.
We exclude certain acquisition-related expenses for the purpose of calculating operating profit (non-IFRS), operating margin (non-IFRS), and earnings per share (non-IFRS) when evaluating SAP’s continuing operational performance because these expenses generally cannot be changed or influenced by management after the relevant acquisition other than by disposing of the acquired assets. Since management at levels below the Executive Board does not influence these expenses, we generally do not consider these expenses for the purpose of evaluating the performance of management units. For similar reasons, we eliminate share-based payment expenses as these costs are impacted by share price developments and other factors outside our control. We also eliminate restructuring expenses because they are volatile and mostly cannot be influenced by management at levels below the Executive Board.
Operating Profit (Non-IFRS), Cloud Gross Margin (Non-IFRS), Operating Margin (Non-IFRS), Effective Tax Rate (Non-IFRS), and Earnings per Share (Non-IFRS)
Operating profit, cloud gross margin, operating margin, effective tax rate, and earnings per share identified as operating profit (non-IFRS), cloud gross margin (non-IFRS), operating margin (non-IFRS), effective tax rate (non-IFRS), and earnings per share (non-IFRS) have been adjusted from the respective IFRS measures by adjusting for the aforementioned revenue (non-IFRS) and operating expenses (non-IFRS) and the income tax effects thereon.
Constant Currencies Information
We believe it is important for investors to have information that provides insight into our sales. Revenue measures determined
62 | Performance Management System |
To Our | Combined Group | Consolidated Financial | Further Information on Economic, | Additional |
Stakeholders | Management Report | Statements IFRS | Environmental, and Social Performance | Information |
under IFRS provide information that is useful in this regard. However, both sales volume and currency effects impact period-over-period changes in sales revenue. We do not sell standardized units of products and services, so we cannot provide relevant information on sales volume by providing data on the changes in product and service units sold. To provide additional information that may be useful to investors in breaking down and evaluating changes in sales volume, we present information about our revenue and various values and components relating to operating profit that are adjusted for foreign currency effects.
We calculate constant currencies measures by translating foreign currencies using the average exchange rates from the comparative period instead of the current period. Constant currency measures on revenue backlog use the closing exchange rate from the previous year’s corresponding keydate instead of the average exchange rate.
Free Cash Flow
Among other measures, we use free cash flow to manage our overall financial performance. We have modified the free cash flow metric by subtracting payments of leasing liabilities in order to eliminate the impact of increasing net cash flows from operating activities, following the adoption of IFRS 16.
€ millions | 2019 | 2018 | D in % |
Net cash flows from operating activities | 3,496 | 4,303 | –19 |
Purchase of intangible assets and property, plant, and equipment (without acquisitions) | –817 | –1,458 | –44 |
Payments of lease liabilities | –403 | 0 | NA |
Free cash flow | 2,276 | 2,844 | –20 |
Usefulness of Non-IFRS Measures
We believe that our non-IFRS measures are useful to investors for the following reasons:
– Our revenue (non-IFRS), expense (non-IFRS), and profit (non-IFRS) measures, along with the “new cloud bookings” and “cloud backlog” measures (see above) provide investors with insight into management’s decision-making because management uses these measures to run our business and make financial, strategic, and operating decisions. We include the revenue adjustments outlined above and exclude the expense adjustments outlined above when making decisions to allocate resources. In addition, we use these non-IFRS measures to facilitate comparisons of SAP’s operating performance from period to period.
– The non-IFRS measures provide investors with additional information that enables a comparison of year-over-year operating performance by eliminating certain direct effects of acquisitions, share-based compensation plans, and restructuring plans.
– Non-IFRS and non-GAAP measures are widely used in the software industry. In many cases, inclusion of our non-IFRS measures may facilitate comparison with our competitors’ corresponding non-IFRS and non-GAAP measures.
Limitations of Non-IFRS Measures
We believe that our non-IFRS financial measures described above have limitations including, but not limited to, the following:
– Without being analyzed in conjunction with the corresponding IFRS measures, the non-IFRS measures are not indicative of our present and future performance, foremost for the following reasons:
▪ While our profit (non-IFRS) numbers reflect the elimination of certain acquisition-related expenses, no eliminations are made for the additional revenue or other income that results from the acquisitions.
▪ While we adjust for the fair value accounting of the acquired entities’ recurring revenue contracts, we do not adjust for the fair value accounting of deferred compensation items that result from commissions paid to the acquired company’s sales force and third parties for closing the respective customer contracts.
▪ The acquisition-related amortization expense that we eliminate in deriving our profit (non-IFRS) numbers is a recurring expense that will impact our financial performance in future years.
▪ The remaining acquisition-related charges that we eliminate in deriving our profit (non-IFRS) numbers are likely to recur should SAP enter into material business combinations in the future. Similarly, the restructuring expenses that we eliminate in deriving our profit (non-IFRS) numbers are likely to recur should SAP perform restructurings in the future.
▪ The revenue adjustment for the fair value accounting of the acquired entities’ contracts and the expense adjustment for acquisition-related charges do not arise from a common conceptual basis. This is because the revenue adjustment aims to improve the comparability of the initial post-acquisition period with future post-acquisition periods, while the expense adjustment aims to improve the comparability between post-acquisition periods and pre-acquisition periods. This should particularly be considered when evaluating our operating profit (non-IFRS) and operating margin (non-IFRS) numbers as these combine our revenue (non-IFRS) and expenses (non-IFRS) despite the absence of a common conceptual basis.
▪ Our restructuring charges resulted in significant cash outflows in the past and could do so in the future. The same applies to our share-based payment expense because most of our share-based payments are settled in cash rather than shares.
▪ The valuation of our cash-settled share-based payments could vary significantly from period to period due to the fluctuation of our share price and other parameters used in the valuation of these plans.
▪ In the past, we have issued share-based payment awards to our employees every year and we intend to continue doing so in the future. Thus, our share-based payment expenses are recurring, although the amounts usually change from period to period.
We believe that constant currencies measures have limitations, particularly as the currency effects that are eliminated constitute a significant element of our revenue and expenses and could materially impact our performance. Therefore, we limit our use of constant currencies measures to the analysis of changes in volume
Performance Management System | 63 |
To Our | Combined Group | Consolidated Financial | Further Information on Economic, | Additional |
Stakeholders | Management Report | Statements IFRS | Environmental, and Social Performance | Information |
as one element of the full change in a financial measure. We do not evaluate our results and performance without considering both constant currencies and nominal measures of revenue (non-IFRS) and operating profit (non-IFRS) measures on the one hand, and changes in revenue, operating expenses, operating profit, or other measures of financial performance prepared in accordance with IFRS on the other. We caution the readers of our financial reports to follow a similar approach by considering nominal and constant currencies non-IFRS measures only in addition to, and not as a substitute for or superior to, changes in revenue, operating expenses, operating profit, or other measures of financial performance prepared in accordance with IFRS.
Despite these limitations, we believe that the presentation of our non-IFRS measures and the corresponding IFRS measures, together with the relevant reconciliations, provide useful information to management and investors regarding present and future business trends relating to our financial condition and results of operations.
64 | Performance Management System |
To Our | Combined Group | Consolidated Financial | Further Information on Economic, | Additional |
Stakeholders | Management Report | Statements IFRS | Environmental, and Social Performance | Information |
Reconciliations of IFRS to Non-IFRS Financial Measures for the Years 2019 and 2018 | |
| |
€ millions, unless otherwise stated | | | | | 2019 | | | 2018 |
| IFRS | Adj. | Non-IFRS | Currency | Non-IFRS | IFRS | Adj. | Non-IFRS |
| | | | Impact | Constant | | | |
| | | | | Currency | | | |
| | | | | | | | |
Revenue measures | | | | | | | | |
Cloud | 6,933 | 81 | 7,013 | –240 | 6,773 | 4,993 | 33 | 5,027 |
Software licenses | 4,533 | 0 | 4,533 | –101 | 4,431 | 4,647 | 0 | 4,647 |
Software support | 11,547 | 0 | 11,548 | –263 | 11,285 | 10,981 | 0 | 10,982 |
Software licenses and support | 16,080 | 0 | 16,080 | –364 | 15,716 | 15,628 | 0 | 15,629 |
Cloud and software | 23,012 | 81 | 23,093 | –604 | 22,489 | 20,622 | 33 | 20,655 |
Services | 4,541 | 0 | 4,541 | –124 | 4,417 | 4,086 | 0 | 4,086 |
Total revenue | 27,553 | 81 | 27,634 | –728 | 26,906 | 24,708 | 33 | 24,741 |
| | | | | | | | |
Operating expense measures | | | | | | | | |
Cost of cloud | –2,534 | 305 | –2,228 | | | –2,068 | 213 | –1,855 |
Cost of software licenses and support | –2,159 | 141 | –2,018 | | | –2,092 | 130 | –1,962 |
Cost of cloud and software | –4,692 | 446 | –4,247 | | | –4,160 | 343 | –3,817 |
Cost of services | –3,662 | 254 | –3,408 | | | –3,302 | 151 | –3,151 |
Total cost of revenue | –8,355 | 700 | –7,655 | | | –7,462 | 494 | –6,969 |
Gross profit | 19,199 | 781 | 19,979 | | | 17,246 | 527 | 17,773 |
Research and development | –4,292 | 438 | –3,854 | | | –3,624 | 219 | –3,406 |
Sales and marketing | –7,693 | 909 | –6,784 | | | –6,781 | 589 | –6,192 |
General and administration | –1,629 | 477 | –1,152 | | | –1,098 | 106 | –992 |
Restructuring | –1,130 | 1,130 | 0 | | | –19 | 19 | 0 |
Other operating income/expense, net | 18 | 0 | 18 | | | –20 | 0 | –20 |
Total operating expenses | –23,081 | 3,654 | –19,426 | 474 | –18,953 | –19,005 | 1,426 | –17,579 |
| | | | | | | | |
Profit numbers | | | | | | | | |
Operating profit | 4,473 | 3,735 | 8,208 | –255 | 7,953 | 5,703 | 1,459 | 7,163 |
Other non-operating income/expense, net | –74 | 0 | –74 | | | –56 | 0 | –56 |
Finance income | 787 | 0 | 787 | | | 371 | 0 | 371 |
Finance costs | –589 | 0 | –589 | | | –418 | 0 | –418 |
Financial income, net | 198 | 0 | 198 | | | –47 | 0 | –47 |
Profit before tax | 4,596 | 3,735 | 8,331 | | | 5,600 | 1,459 | 7,059 |
Income tax expense | –1,226 | –954 | –2,180 | | | –1,511 | –349 | –1,860 |
Profit after tax | 3,370 | 2,781 | 6,152 | | | 4,088 | 1,111 | 5,199 |
Attributable to owners of parent | 3,321 | 2,781 | 6,102 | | | 4,083 | 1,111 | 5,193 |
Attributable to non-controlling interests | 50 | 0 | 50 | | | 6 | 0 | 6 |
| | | | | | | | |
Key ratios | | | | | | | | |
Operating margin (in %) | 16.2 | | 29.7 | | 29.6 | 23.1 | | 29.0 |
Effective tax rate (in %) | 26.7 | | 26.2 | | | 27.0 | | 26.3 |
Earnings per share, basic (in €) | 2.78 | | 5.11 | | | 3.42 | | 4.35 |
Note: Due to rounding, the sum of the numbers presented in the table above might not precisely equal the totals we provide.
Performance Management System | 65 |
To Our | Combined Group | Consolidated Financial | Further Information on Economic, | Additional |
Stakeholders | Management Report | Statements IFRS | Environmental, and Social Performance | Information |
Non-IFRS Adjustments by Functional Areas | |
| |
€ millions | | | | | 2019 | | | | | 2018 |
| IFRS | Acquisition- | SBP1) | Restructuring | Non-IFRS | IFRS | Acquisition- | SBP1) | Restructuring | Non-IFRS |
| | Related | | | | | Related | | | |
| | | | | | | | | | |
Cost of cloud and software | –4,692 | 308 | 138 | 0 | –4,247 | –4,160 | 264 | 78 | 0 | –3,817 |
Cost of services | –3,662 | 9 | 246 | 0 | –3,408 | –3,302 | 9 | 142 | 0 | –3,151 |
Research and development | –4,292 | 9 | 429 | 0 | –3,854 | –3,624 | 9 | 210 | 0 | –3,406 |
Sales and marketing | –7,693 | 348 | 562 | 0 | –6,784 | –6,781 | 277 | 312 | 0 | –6,192 |
General and administration | –1,629 | 16 | 461 | 0 | –1,152 | –1,098 | 18 | 88 | 0 | –992 |
Restructuring | –1,130 | 0 | 0 | 1,130 | 0 | –19 | 0 | 0 | 19 | 0 |
Other operating income/expense, net | 18 | 0 | 0 | 0 | 18 | –20 | 0 | 0 | 0 | –20 |
Total operating expenses | –23,081 | 689 | 1,835 | 1,130 | –19,426 | –19,005 | 577 | 830 | 19 | –17,579 |
1) Share-based payments
66 | Performance Management System |
To Our | Combined Group | Consolidated Financial | Further Information on Economic, | Additional |
Stakeholders | Management Report | Statements IFRS | Environmental, and Social Performance | Information |
Products, Research & Development, and Services
The Intelligent Enterprise Framework
The Intelligent Enterprise Framework illustrates a high-level view of our product portfolio.

Bringing Experience Management to the Intelligent Enterprise
Product Innovation Strategy
SAP invests in the following three types of innovation:
– Continuous innovation involves incremental improvements to existing offerings.
– Adjacent innovation describes enhancements to the existing portfolio using new technologies or applying existing knowledge to new markets to gain new customers.
– Transformative innovation occurs as a result of new trends, technologies, and business models.
Experience
Experience Management (XM) refers both to the discipline of seeking out and closing the gaps found in the four core experiences of business – customer, product, employee, and brand – as well as technology. Qualtrics XM Platform represents the technology that came to SAP with the acquisition of Qualtrics International, Inc., in 2019.
Qualtrics XM Platform includes the following:
– Qualtrics CoreXM provides a foundation for XM and aims to help analyze experience data (X-data).
– Qualtrics CustomerXM brings new capabilities to support specific use cases and help process customer feedback.
– Qualtrics EmployeeXM delivers new capabilities to gather employee feedback and propose actions for human resources (HR) to help improve the employee experience.
– Qualtrics ProductXM identifies consumers’ favorite products based on feedback from users.
– Qualtrics BrandXM aims to make visible consumer sentiment towards a brand.
Intelligence
The Business Technology Platform was introduced in 2019. It provides solutions across four key technology areas: database and data management (SAP HANA); analytics (SAP Analytics Cloud); application development and integration (SAP Cloud Platform); and intelligent technologies (Internet of Things, machine learning, and blockchain) on an open cloud platform, running in SAP data centers and on selected hyperscalers. The platform’s business-centric technologies are designed to enable integration and innovation across the entire intelligent suite.
Database and Data Management
SAP HANA
The innovative architecture in SAP HANA allows both transactional processing for data capture and retrieval, and analytical processing for business intelligence and reporting. It enables businesses to process and analyze live data and make business decisions based on the most up-to-date information. SAP HANA is available both on premise and as a service in the cloud with SAP Cloud Platform across multiple cloud environments. In 2019, we released the latest SAP HANA innovations including enhanced capabilities in our data anonymization functionality and hyperconverged infrastructure (HCI) certification. SAP HANA is also the first major database optimized for Intel Optane DC persistent
Products, Research & Development, and Services | 67 |
To Our | Combined Group | Consolidated Financial | Further Information on Economic, | Additional |
Stakeholders | Management Report | Statements IFRS | Environmental, and Social Performance | Information |
memory. As part of SAP’s own digital transformation, SAP completed the move of SAP SuccessFactors solutions to SAP HANA in 2019.
Enterprise Information Management
SAP solutions for enterprise information management (EIM) provide capabilities to understand, integrate, cleanse, manage, associate, and archive data. This includes the on-premise solution SAP Data Hub and the cloud service SAP Data Intelligence, which have been designed to help businesses connect their siloed data assets and manage the discovery, refinement, governance, and orchestration of all data across a distributed data landscape. The data landscape can include SAP software systems (such as SAP S/4HANA, SAP C/4HANA, and SAP BW/4HANA) as well as third-party systems. SAP Data Intelligence also includes machine learning (ML) services and tooling.
Analytics
Business analytics tools from SAP help customers get insights to enable them to adapt their businesses in real time.
SAP Analytics Cloud
SAP Analytics Cloud is a cloud analytics solution running on SAP HANA that brings together the domains of business intelligence, predictive capabilities, and enterprise planning. Customers can discover, analyze, plan, and predict in one solution and make decisions. It provides a single user experience across all devices to help customers make end-to-end business decisions.
SAP BusinessObjects Business Intelligence
SAP BusinessObjects Business Intelligence (BI) suite is a set of flexible and scalable self-service BI tools, designed to give customers discovery and insights in real time.
SAP Data Warehouse Cloud
Released in 2019, SAP Data Warehouse Cloud is a cloud data warehouse solution designed for business and IT users with capabilities for data integration, database, data warehousing, and analytics. It is an open solution built on SAP HANA.
SAP BW/4HANA
SAP BW/4HANA is our on-premise data warehouse solution built entirely on SAP HANA. It includes an analytics layer that processes data directly in-memory on the database, instead of at the application layer, as is the case with traditional analytical engines.
Application Development and Integration
Our open Business Technology Platform helps customers extend and integrate SAP applications with third-party solutions and build new business applications with intelligent capabilities at scale.
SAP Cloud Platform
SAP Cloud Platform provides an integration and extension platform that allows customers to build solutions as cloud services, with intuitive tools and support to address industry and line-of-business (LoB) processes.
Intelligent Technologies
SAP uses the term intelligent technologies to describe tools and technology designed to turn intelligence into business outcomes such as ML, AI, Internet of Things (IoT), and blockchain. Intelligent technologies are embedded within our operations suite of applications and applied to processes that integrate both SAP and third-party data and applications.
SAP Leonardo Internet of Things
The SAP Leonardo IoT solution provides industry-specific business services and capabilities, designed to embed device and telemetry data into SAP applications. It also offers prepackaged scenarios in the SAP Field Service Management solution in the SAP C/4HANA suite, business scenario content templates, and interoperability with hyperscalers, such as Amazon Web Services IoT Core and Microsoft Azure IoT Hub.
SAP Leonardo Artificial Intelligence
The SAP Leonardo Artificial Intelligence (AI) functionality has already been integrated in the SAP portfolio, providing intelligent capabilities in SAP S/4HANA, SAP C/4HANA, SAP Concur, SAP Fieldglass, and SAP SuccessFactors solutions, among others.
SAP Leonardo Blockchain
SAP Leonardo Blockchain capabilities are designed to enable open business collaboration across company boundaries in decentralized networks. These blockchain technologies are integrated into SAP Cloud Platform.
Operations
Integrated with SAP S/4HANA and built on an open cloud platform to enable integration across heterogeneous environments, our operations offerings can connect to third-party applications and data. Following the acquisition of Qualtrics in 2019, we added Experience Management (XM) capabilities to our operations solutions.
Customer
SAP C/4HANA
SAP C/4HANA is our customer experience suite. All five cloud areas – commerce, marketing, service, sales, and customer data – have been recognized by industry analysts as leaders in their respective categories.
XM capabilities from Qualtrics have been integrated across the suite, specifically within our commerce, marketing, sales, and service offerings.
SAP S/4HANA
SAP S/4HANA is our next-generation Intelligent ERP suite. Running on SAP HANA, SAP S/4HANA includes intelligent technologies and integrated business processes with real-time analytics to support rapid decision-making. Approximately 13,800 customers across 25 industries have chosen SAP S/4HANA. This represents a 24% increase year over year, up from 8,500 in 2017 and 11,100 in 2018. The suite provides software capabilities for human resources, sales, service, procurement, manufacturing, asset management, as well as research and development. In Q4/2019, SAP updated the definition of SAP S/4HANA to more closely reflect categories commonly covered by ERP. These categories include elements of digital supply chain management, finance/controlling, and risk management. SAP S/4HANA is built with an open architecture to connect to the entire SAP portfolio and beyond.
68 | Products, Research & Development, and Services |
To Our | Combined Group | Consolidated Financial | Further Information on Economic, | Additional |
Stakeholders | Management Report | Statements IFRS | Environmental, and Social Performance | Information |
Flexible Deployment Options
SAP offers a choice of SAP S/4HANA deployments – software as a service (SaaS), on premise, in a private cloud, or as a hybrid deployment. SAP S/4HANA Cloud offers the advantages of SaaS, such as scalability and quarterly innovation updates, whereas SAP S/4HANA on premise delivers updates on an annual cycle.
In 2019, we also announced a go-to-market partnership with Microsoft called “Embrace” to accelerate customer adoption of SAP S/4HANA and SAP Cloud Platform on Microsoft Azure.
Supply Chain
The SAP Digital Supply Chain portfolio offers an integrated suite of solutions to help plan, design, manufacture, deliver, and operate products.
Integrated Business Planning
SAP Integrated Business Planning for Supply Chain is a cloud-based solution powered by SAP HANA and designed to deliver real-time supply chain planning capabilities for sales and operations, demand, response and supply planning, and inventory optimization.
Manufacturing
SAP Intelligent Asset Management solutions aim to help define, plan, and monitor a service and maintenance strategy for physical products and assets along the manufacturing lifecycle.
Human Resources (HR)
SAP SuccessFactors
SAP SuccessFactors solutions aim to increase the value of a workforce by developing, managing, engaging, and empowering people. In 2019, SAP changed the name of SAP SuccessFactors HCM Suite to SAP SuccessFactors Human Experience Management (HXM) Suite, as XM functionality from Qualtrics has been integrated into the software. Further, HXM solutions from SAP provide offerings for core HR and payroll, talent management, employee experience, people analytics, and workforce planning.
Procurement
Our Intelligent Spend Management program brings together SAP Ariba, SAP Concur, and SAP Fieldglass solutions. In 2019, we strengthened integration between these solutions and SAP S/4HANA to help customers manage the three primary categories of supplier spending: procurement of indirect and direct goods; travel and expense; and external workforce management.
SAP Ariba
SAP Ariba solutions offer an online business-to-business marketplace. In 2019, we announced partnerships with Barclaycard Commercial Payments, American Express, and Standard Chartered Bank, establishing new payment and financial supply chain solutions on Ariba Network.
SAP Fieldglass
SAP Fieldglass solutions are cloud-based applications for contingent workforce management and services procurement.
SAP Concur
SAP Concur solutions aim to deliver a connected spend management system that encompasses travel, expense, invoice, compliance, and risk.
SAP Digital Business Services
In addition to software and technology, SAP provides an entire portfolio of services and support offerings designed to help customers maximize the value of their SAP solutions in on-premise, cloud, and hybrid environments. In 2019, we continued a process that began in 2017 to simplify the SAP services and support portfolio and expand our range of intelligent tools to underpin services and support offerings for the intelligent enterprise, including XM services. This simplification established three portfolio categories to address customers’ needs for as long as they use SAP software – premium success, project success, and continuous success.
Premium Success
Our premium success services support large-scale transformation initiatives through a single, strategic, and customized on-site engagement. Our team of SAP experts help customers design, deploy, adopt, and operate SAP solutions on premise, hybrid, or in the cloud. The offerings differ based on size of customer and intensity of engagement.
Project Success
Our project success services support the adoption of SAP products and technologies. These include services to help deliver a digital business strategy, preconfigured content for multiple industries or lines of business, best practices, methodologies, and tools. Further, these offerings also support the use of emerging technologies and the implementation of or transition to SAP S/4HANA.
Continuous Success
Our continuous success services support our cloud solutions and on-premise software. We offer services to provide proactive, predictive, and preventive support across hybrid landscapes to help customers move to the cloud and make SAP S/4HANA their Intelligent ERP of choice as well as bundled customer success activities to accelerate cloud adoption.
Intelligent Tools
We also provide intelligent tools to help guide and deliver application management and administrative support for our service offerings.
Ecosystem
Extending Our Reach Through a Broad Ecosystem
SAP’s ecosystem consists of more than 20,000 partners worldwide that build, sell, service, and run SAP solutions and technology.
Our partner ecosystem drives the bulk of SAP’s presence among small and midsize enterprise (SME) customers. In 2019, SAP announced a new initiative, Next-Generation Partnering, aimed to make partnerships simpler and more profitable for the ecosystem. Next-Generation Partnering emphasizes partner innovation and monetization through SAP App Center, where customers can discover, try, buy, manage, and deploy trusted partner applications that extend their existing SAP technology and solutions.
Products, Research & Development, and Services | 69 |
To Our | Combined Group | Consolidated Financial | Further Information on Economic, | Additional |
Stakeholders | Management Report | Statements IFRS | Environmental, and Social Performance | Information |
Investment in R&D
SAP’s strong commitment to R&D is reflected in our expenditures (see figure below).

In 2019, our IFRS R&D ratio, reflecting R&D expenses as a portion of total operating expenses, decreased by 0.5 percentage points (pp) to 18.6% (2018: 19.1%). Our non-IFRS R&D ratio increased by 0.4pp to 19.8% year over year (2018: 19.4%). At the end of 2019, our total full-time equivalent (FTE) headcount in development work was 27,634 (2018: 27,060). Measured in FTEs, our R&D headcount was 28% of total headcount (2018: 28%).
Total R&D expense not only includes our own personnel costs but also the external costs of work and services from the providers and cooperation partners we work with to deliver and enhance our products. We also incur external costs for the following:
– Translating, localizing, and testing products
– Obtaining certification for products in different markets
– Patent attorney services and fees
– Consulting related to our product strategy
– Professional development of our R&D workforce
Patents
SAP actively seeks intellectual property protection for innovations and proprietary information. Our software innovations continue to strengthen our market position as a leader in business solutions and services. Our investment in R&D has resulted in numerous patents. As at December 31, 2019, SAP held a total of more than 10,270 validated patents worldwide. Of these, 924 were granted and validated in 2019.
While our intellectual property is important to our success, we believe our business as a whole is not dependent on any particular patent or a combination of patents.
70 | Products, Research & Development, and Services |
To Our | Combined Group | Consolidated Financial | Further Information on Economic, | Additional |
Stakeholders | Management Report | Statements IFRS | Environmental, and Social Performance | Information |
Security, Data Protection, and Privacy
Meeting Today’s Data Protection Challenges
Every day, organizations around the world trust SAP with their data – either on their own premises, in the cloud, or when using mobile devices while on the move. Our customers need to know that we will keep that data safe, process it in a manner that complies with local legislation, and protect it from malicious use.
For this reason, data protection and IT security are of paramount importance to us. We have implemented safeguards to help protect the fundamental rights of everyone whose data is processed by SAP, whether they are our customers, prospects, employees, or partners. In addition, we work towards compliance with all relevant legal requirements for data protection. Our chief security officer and our data protection officer (DPO) monitor the compliance of all activities in these areas. In 2019, the chief security officer and the DPO both reported to SAP’s chief financial officer (CFO). Starting in 2020, the chief security officer will report directly to our Co-CEO Christian Klein.
To meet and ensure consistent data protection compliance and security, SAP has implemented a formal governance model in both areas that assigns clear responsibilities across the SAP Group. Relevant security topics are discussed during steering committee meetings attended by individual or multiple board members numerous times each year. Our chief security officer also reports regularly to the Audit Committee of the Supervisory Board of SAP.
Facing Increasing Risks in IT Security
Safeguarding data is an increasingly challenging task today. Companies are collecting and storing more data than ever before from more varied sources. Data now proliferates outside the four walls of businesses with multiple exposed endpoints vulnerable to attack. Moreover, the sheer number and sophistication of attacks facing businesses are at an all-time high and are increasing. We are seeing the “commercialization of hacking,” while at the same time, new advanced persistent threats can bypass many traditional security protection techniques.
Establishing a Comprehensive Security Vision
For SAP and for our customers, security means more than just addressing compliance demands. Companies need to be proactive when securing business-critical data and core information assets.
Several of our security measures extend across the entire company and thus to all of our products and services. These measures include, among other things, the regular training of our employees on IT security, data protection, and privacy, including the handling of confidential information and ensuring controlled and restrictive access to customer information. In addition, we operate on a security strategy that is based on three cornerstones concentrating on the security of our applications, operations, and organization:
Secure Applications: Championing Application Security
Businesses use SAP applications to process mission-critical data, which can be highly attractive to cyberattackers. Our secure applications approach focuses on security processes and controls intended to ensure the secure design and architecture of our applications. These processes are vital to avoid or detect and mitigate vulnerabilities at the earliest possible time and minimize the risk of a security breach.
Our secure software development lifecycle is at the heart of this strategy. It provides a comprehensive methodological approach for incorporating security properties and capabilities into our applications, following a risk-based approach. We strive to align our secure software development lifecycle to the recommendations of the ISO/IEC 27034-1 standard for application security. Furthermore, for all solutions included in SAP’s innovation cycle, our process framework for developing standard software as well as our controls for developing secure software are certified to comply with the ISO 27001:2013 and ISO 9001 standards.
Secure Operations Strategy: Running Secure Operations
Our secure operations strategy focuses on the security principles of “confidentiality, integrity, and availability” to support the overall protection of our business and our customers’ businesses. To help us achieve our mission to become the Experience Company powered by the Intelligent Enterprise, we seek to mitigate cybersecurity challenges through a comprehensive IT operations security framework. This includes system and data access, system security configuration, and security patch management, as well as proactive security event management, threat hunting, and incident handling.
Our secure operations strategy involves the implementation of key security measures across all layers, including physical access and process-integrated controls. Furthermore, our secure operations approach concentrates on the early identification of deviations from the standards defined in our security framework. Deviations are identified through a combination of automated and manual reviews that are performed by third parties as well as SAP employees.
SAP’s security compliance strategy is also focused on integrating the increasingly complex cybersecurity and data privacy-related laws and regulations around the world. SAP has established an internal control framework for DevOps and is undergoing many external certification audits, such as System and Organization Control (SOC) and International Organization for Standardization audits (ISO 9001, 27001, 27017, 27018, and 22301). This is important for us to build the necessary trust level for SAP’s customers and regularly increase the security and compliance level through the organization.
Security, Data Protection, and Privacy | 71 |
To Our | Combined Group | Consolidated Financial | Further Information on Economic, | Additional |
Stakeholders | Management Report | Statements IFRS | Environmental, and Social Performance | Information |
Secure Company: Taking a Holistic Approach to the Security of Our Business
At SAP, we take a holistic approach to the security of our company, encompassing processes, technology, and employees. At the heart of our secure company strategy are an information security management system and a security governance model that bring together different aspects of security. These include the following three main areas:
– Security culture: Training, assessments, and reporting on these efforts foster awareness and compliance with our security policy and standards.
– Secure environments: Industry-standard physical security measures are in place to ensure the security of our data centers and development sites so that we can protect buildings and facilities effectively.
– Business continuity: We maintain a corporate continuity framework aimed at having robust governance in place at all times and we review this framework on an annual basis to adapt to new or changed business needs.
In addition to these important measures, our security mechanisms, such as authentication, authorization, and encryption, serve as a first line of defense. To secure the SAP software landscape, we offer a portfolio of security products, services, and secure support as well as security consulting. These offerings help our customers build security, data protection, and privacy capabilities into their businesses.
Our solution portfolio, also available for customers, includes identity and access management tools, a tool for detecting potential threats, an ABAP code vulnerability scanner, and solutions for governance, risk, and compliance.
Furthermore, our SAP Trust Center site provides transparency for our customers about how SAP helps to improve security, privacy, and compliance in cloud and on-premise landscapes. The site also provides secure feedback mechanisms, for example to report a potential security issue and invoke our incident or vulnerability management processes.
Shifting Customer and Regulatory Requirements Demand an Integrated and Sophisticated Approach
The progressing transition from on premise to cloud-based business transfers additional responsibility to SAP and forms a higher sensitivity for security in our customer base, especially in light of shifting national and international regulatory requirements. As a result, we are evolving our strategy to focus even more on the following strategic commitments going forward, and we have begun taking steps to implement them. These commitments include (but are not limited to):
– Fundamentals secured: We will enhance incident, crisis, and disaster resiliency capabilities.
– Customer focused: Among other enhancements, we will further define and build a standard set of security features across products.
– Services driven: We enable security through a simple but thorough service catalog based on agile practices and increased automation.
– Cloud readiness: We will focus on cloud-centricity, both internally and externally, through secure by design agile product development across all SAP areas.
– Transparent and risk-based approach: We strive to manage and communicate SAP’s current and future cyberstates based on a risk-based approach. This includes the creation of an end-to-end supplier security assessment framework mitigating third party risks.
– Talent and execution excellence: We build new skill sets and awareness among security experts, non-security experts, and non-technical professionals.
Complying with Data Protection and Privacy Legislation
SAP respects and protects the fundamental right to data protection and privacy when processing the personal data of employees, applicants, customers, suppliers, and partners. SAP must comply with relevant laws when processing personal data. While implementing appropriate security measures, we develop and pursue our data protection and privacy strategy in accordance with our business strategy. This strategy consists of four pillars that have been implemented to help meet compliance with applicable data protection laws.
Our global data protection and privacy policy, mandatory global data protection and privacy training for employees, global data protection and privacy coordinator network, and the global data protection management system (DPMS) are designed to ensure that we comply with applicable data protection laws.
Our policy outlines a group-wide minimum standard for data-protection-compliant processing of personal data. It defines requirements for business processes that involve personal data and assigns clear responsibilities. The principles established by this policy take into account the requirements of the EU General Data Protection Regulation (GDPR). They apply generally and globally to all SAP Group affiliates. Additional data protection and privacy requirements, if applicable, are adopted on a local level as necessary. We actively monitor changes to applicable laws and regulations so that we can update our standards on an ongoing basis.
With our mandatory global data protection and privacy training established across SAP, covering all lines of businesses, we aim to drive data protection and privacy awareness of our employees.
Furthermore, we have renewed our global data protection and privacy coordinator network (“DPPC network”) across all SAP entities that process personal data. This DPPC network is designed to ensure data protection and privacy compliance on local level. Additional regional data protection and privacy coordinators support the DPPC network in the assigned region to help drive compliance with local data protection and privacy laws while monitoring changes to applicable laws.
Our DPMS conforms to the targets of the globally-recognized standard for data protection management systems, BS 10012:2017. Initially implemented at our global support organization, the DPMS has been successively rolled out and is now in place in all areas critical to data protection. It covers almost all areas and countries in which SAP has operations and will be introduced in all acquired companies. It is audited and certified on a yearly basis by the British Standards Institute and this audit last took place in 2019.
72 | Security, Data Protection, and Privacy |
To Our | Combined Group | Consolidated Financial | Further Information on Economic, | Additional |
Stakeholders | Management Report | Statements IFRS | Environmental, and Social Performance | Information |
We have implemented a wide range of measures intended to protect data controlled by SAP and SAP customers from unauthorized access and processing, as well as from accidental loss or destruction. Also, we are developing our products to support our customers in applying data protection requirements, including GDPR.
In 2019, SAP experienced three significant incidents in processing personal data – on our own behalf and on behalf of our customers – that were subject to GDPR or other applicable data protection laws and were reported to the competent authorities.
 Audit Scope Audit Scope
| |
| |
The content of this section was not subject to the statutory audit of our combined group management report. However, our external auditor KPMG performed an independent limited assurance engagement on the contents of this section. | |
Security, Data Protection, and Privacy | 73 |
To Our | Combined Group | Consolidated Financial | Further Information on Economic, | Additional |
Stakeholders | Management Report | Statements IFRS | Environmental, and Social Performance | Information |
Customers
Approaching Our Customers with Empathy
We want our customers to see SAP as a company that listens and responds to their needs. We want to design and develop with their needs in mind. We want them to experience a constantly improving SAP.
To achieve this, we have implemented extensive programs to deepen our relationship with our customers to ensure we understand what works well and what can be improved in their partnership with SAP.
Measuring customer loyalty is a part of this program, and we use the Customer Net Promoter Score (Customer NPS) as one feedback mechanism to do so. This allows us to directly understand what our customers are thinking and identify key pain points for action. Reflecting the importance of customers to SAP, it is only logical that Customer NPS is one of our main KPIs.
In 2019, 68% of customers gave us a score of 7 or higher. This means that a large majority of customers are satisfied or highly satisfied with SAP. Because the percentage of customers that rated us 9 or 10 is slightly smaller than the percentage of customers who rated us 6 or below, our Customer NPS for 2019 is –6 (2018: –5). We did not reach our target of +1 in 2019. While we have reported Customer Net Promoter Score since 2012, we revamped our program in 2018 with 2019 as the first full year of results. For 2019, SAP set a very aggressive target against a stringent metric. As we gather more insight on how the number reacts to the improvements we are making, we will continue to get better in forecasting the results. With our Experience Management (XM) innovations from Qualtrics, we have more information from our customers than ever and can react to it faster, helping us make changes that customers can see and feel in their interactions with SAP and our software.
As we continue to receive open and direct feedback from our customers, we are also incorporating XM across the company. In particular, programs such as Customer First, Build Customers for Life, and Insights to Action will continue to drive improvements. We expect this continuous feedback to help us achieve our goal of improving customer loyalty. Therefore, we aim to increase Customer NPS by three to five points in 2020 and to steadily increase the score through 2023 and beyond.
Starting in 2020, Customer NPS is included as a KPI in Executive Board remuneration as part of the short-term incentive component. For more information about executive compensation, see the Compensation Report section.
For more information about the Customer NPS, see the Performance Management System section.
Building Programs to Facilitate Customer Feedback
The Build Customers for Life program helps harmonize the customer experience in postsales with ongoing implementation projects, including customer success management, customer service management, outage management, and one customer portal.
With our global cross-Board initiative Customer First, efforts have been made to improve the way we work and care for our customers by supporting the organization in providing a consistent, positive, end-to-end experience.
Integrating XM across the organization, we significantly increased our capabilities to take actions from customer insights to deliver business change. We launched the Insights to Action program, a comprehensive collaboration that identified over 20 initiatives to address systemic customer feedback.
To Our | Combined Group | Consolidated Financial | Further Information on Economic, | Additional |
Stakeholders | Management Report | Statements IFRS | Environmental, and Social Performance | Information |
Employees and Social Investments
Becoming an Experience Company Driven by Engaged People
Our people are key in enabling our customers to successfully become intelligent enterprises. For this reason, we strive to understand the needs of today’s employee and how a 21st-century organization must evolve to keep attracting, retaining, and growing current and future talent.
To meet these expectations and to provide smart, enjoyable, and meaningful experiences and services for our people, we continuously evolve our Human Resources (HR) strategy. Our HR strategy details out people implications, derived from the corporate strategy, into areas of strategic investment that span the entire employee lifecycle. It allows us to create a working culture that deals successfully with the agility and scope of a digital workplace built on our purpose to help the world run better and improve people’s lives. This culture encourages the open sharing of ideas, it leads change, and ultimately it creates a great employee experience.
Overall responsibility for our HR strategy lies with the Executive Board under the leadership of our Chief Human Resources Officer, Stefan Ries.
Improving Our Working Culture Through Unfiltered Feedback from Our People
Our annual engagement survey, under the theme “#unfiltered”, was the starting point of a new feedback experience with Qualtrics. We continue to listen to, understand, and act upon the feedback of our employees and make use of the technology available through our acquisition.
The survey results remained high in 2019. The Employee Engagement Index was at a strong 83%, but slightly below our target range. For 2020 throughout to 2023, we aim to lift employee engagement and keep it between 84% and 86% as in the years before.
Employee Engagement Index

*The EEI score for 2015 was recalculated from 81% to 82% based on updated questions.
During 2019, we primarily focused on innovation and process simplification. Our efforts translated into positive results: the innovation score increased by +1pp to 79%, whereas process simplification score even increased by +9pp to 64% compared to 2018. The result shows that we continuously adjust our processes in an easy-to-use setup and develop them innovatively and sustainably. For 2020, we will primarily focus on three topics: innovation; strategy; and becoming simpler and more agile in our organization to improve our customer success supported by our employees and leaders.
Our workplace culture supports people’s well-being, work-life balance, and organizational health, which are shown in the increasing Business Health Culture Index (BHCI) score, resulting in 80% (+2pp compared to 2018) and thus reaching our target range. In particular, the topic of work-life balance increased by +5pp YoY. The ambitions for the BHCI stays at 78% to 80% from 2020 through 2023.
Business Health Culture Index
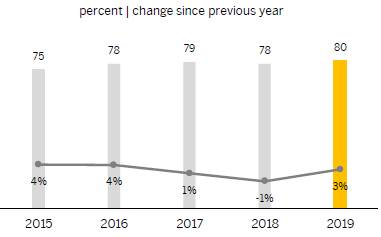
Hiring and Retaining the Best People
In line with our overall growth plan, we continued to increase our workforce in 2019: 12,833 employees were hired externally, thereof 21.4% were “Early Talents” and 37.5% were women. We also remain focused on building a highly inclusive workforce across various demographic aspects (generations, gender, and so on). We have been very successful again in positioning SAP as a talent magnet, despite the restructuring efforts during 2019. SAP has earned over 200 employer awards. SAP America was on Fortune’s 100 Best Workplaces for Women, and the Best Places to Work on Glassdoor’s annual ranking. SAP was also ranked as one of the best brands to work for on seven out of nine of the annual Glassdoor Employees’ Choice Best Places to Work 2020 country lists.
To position SAP to future talent, we work closely with over 3,800 universities on events, executive lectures, office visits, competitions, student club sponsorships, and Webinars to recruit top students and graduates as well as to integrate the latest SAP technologies into the curriculum.
Employees and Social Investments | 75 |
To Our | Combined Group | Consolidated Financial | Further Information on Economic, | Additional |
Stakeholders | Management Report | Statements IFRS | Environmental, and Social Performance | Information |
In 2019, more than 1,000 students were enrolled in SAP’s vocational training program (in Brazil, China, Germany, Hungary, India, Ireland, Japan, Singapore, Australia, Switzerland, and the United States). Overall, we measured a conversion rate (number of students who stayed with SAP after completing their dual studies) for vocational training students of 71% in 2019 (2018: 73%).
We are passionate about developing deep and lasting relationships with all our employees. Our overall retention rate in 2019 was 93.3% compared to 93.9% in 2018. We define retention as the ratio of the average number of employees minus the employees who voluntarily departed (excluding restructuring-related terminations) to the average number of employees (in full-time equivalents or FTEs). In 2019, we had 2,859 restructuring-related terminations (2.9%) compared to 305 in 2018 (0.3%).
Also, the average tenure with SAP remains at the same high level (7.3 years in 2019 and 7.2 years in 2018). The loyalty of our people is an additional indication that SAP is regarded as an employer of choice.
Engaging Our People Through Meaningful Career Paths and Passionate Leaders
Employees need to constantly acquire new skills to meet the demands of today’s workplace. Our career framework helps employees discover who they are, identify the areas where they want to grow, and develop an action plan to get there. During 2019, we further evolved our performance management approach called SAP Talk to a needs-driven and flexible dialogue between employees and managers, instead of calendar-driven checkpoints once a quarter.
Building trust in leaders is essential for continuously high employee engagement. We offer a career path for experts in parallel to our management development track. By the end of 2019, 5,152 SAP people managers (52%) and 4,407 SAP experts (19%) had completed our flagship development program. In 2019, Leadership Trust remained at a strong score of 59 (2018: 60). For more information about the measurement of the leadership trust, see the Performance Management System section.
Making Life-Long Learning the Key to Success
At SAP, learning happens on the job, through interactions with colleagues, and through formal learning activities. Self-paced online programs, plus technical and soft skills training courses, are open to all employees. Our peer-to-peer learning portfolio encompasses coaching, mentoring, job shadowing, and facilitation opportunities.
In 2019, we provided more than 1,199,000 courses (not including compliance trainings) to 96% of our employees.
Creating a Workplace That Drives Innovation, Performance, and Engagement
The following selection of benefits and activities are paramount in nurturing an attractive workplace:
– Own SAP: Our share purchase plan for SAP employees. In 2019, 70% of our employees participated in Own SAP, purchasing a total of 5.24 million shares. For more information, see the Notes to the Consolidated Financial Statements, Note (B.3).
– Hasso Plattner Founders’ Award: This prestigious award provides the highest internal employee recognition at SAP for delivering our vision and strategy. For 2019, the award went to Nicolas Neumann in Global Finance & Administration. The individual nomination was chosen from 157 nominations and with a total of 1,099 employees participating from 34 countries.
– SAP.iO Venture Studio: This initiative identifies high-potential entrepreneurial employees at SAP and helps develop them into successful leaders, with the objective of building new ventures that will have a positive impact on business and society. In 2019, SAP.iO Venture Studio engaged more than 7,500 employees and was able to jump-start close to 400 venture ideas.
– SAP Alumni Network: This growing network and online community provides a platform to reconnect with former colleagues and to unleash the power of a trusted network for the benefit of SAP and our ecosystem. In 2019, community members included 8,091 former and 4,243 current SAP employees.
– How We Run: Our corporate behaviors continue to be the cornerstone of our value-driven culture.
Our “How We Run” Behaviors

Fostering a Diverse and Inclusive Culture
An inclusive, bias-free workplace helps us attract, motivate, and retain employees and better serve the needs of a diverse workforce. It also increases innovation, employee engagement, and group performance and helps us think through challenges in new ways. At SAP, we are committed to helping employees acknowledge and reduce bias to make more objective decisions.
Increasing Gender Diversity
For SAP, gender equality is a core company value and a strategic priority. In 2016, SAP was the first IT company to certify with EDGE (Economic Dividends for Gender Equality), an independent third-party certification analyzes policies, practices, and data that ensure a sustainable approach to diversity and inclusion. In 2018, SAP recertified with the organization. The results of going through the EDGE certification have helped us to identify gaps and set the course for where we want to go in the future. As such, following recommendations from EDGE, SAP ran an awareness campaign in 12 countries (representing 80% of our employees worldwide) in
76 | Employees and Social Investments |
To Our | Combined Group | Consolidated Financial | Further Information on Economic, | Additional |
Stakeholders | Management Report | Statements IFRS | Environmental, and Social Performance | Information |
2019 to encourage the uptake of parental leave for men, which has a direct correlation with gender equality.
Furthermore, SAP continues to create and enhance our flexible work options, offer part time opportunities, audit our pay practices to ensure we pay equitably, cultivate a culture that is inclusive, and provide opportunities for all our employees to excel and develop their careers.
Our key indicator, the ratio of women in management positions, continued its upward trajectory from 25.7% in 2018 to 26.4% as at December 31, 2019. This is slightly below our 2019 target of 27%. The Executive Board continues its commitment to increase the percentage of women in management positions by 1pp each year with a target of 30% by year-end 2022.
Throughout 2019, we sponsored and hosted events to attract, develop, and support women at SAP around the world. Ongoing initiatives include the Women’s Professional Growth Webinar series, our grassroots Business Women’s Network (BWN), and our Women@SAP online community.
Strengthening an Inclusive Environment
SAP supports numerous global employee network groups that offer programs to help attract, retain, train, and promote people with diverse backgrounds. In 2019, we conducted enablement and leadership development programs to increase cultural intelligence and awareness. For example, for our efforts in support of the lesbian, gay, bisexual, and transgender (LGBT) community, SAP was among the first supporters of the United Nations Global LGBTI Standards of Conduct for Business and has been recognized by organizations including Human Rights Campaign, Stonewall, and Workplace Pride.
Exemplary activities to ensure an inclusive environment are:
– Accessibility: These efforts ensure that the environment at SAP and large global events hosted by SAP are accessible for differently-abled people. Adding live and closed captioning on videos and keynote screens improves the accessibility for people who use screen readers.
– Autism at Work: In 2019, SAP had 180 employees with autistic spectrum in 27 different types of roles, in 14 countries, and 31 locations.
– “Focus on Insight” Diversity and Inclusion: This award-winning training program contributes to a shared understanding of the importance and benefits of a diverse workplace.
Caring for the Health and Well-Being of Our People
SAP fosters a culture that empowers people to run at their best supported by providing innovative health and well-being programs and solutions. When people are healthy, respected, and cared for, it results in higher productivity, engagement, innovation, and customer satisfaction. We measure the progress of these activities through the Business Health Culture Index. For more information, see Improving Our Working Culture Through Unfiltered Feedback of Our People above.
Our programs include:
– Mindfulness practice: Various offerings support employees in bringing more mindfulness into their daily personal and professional life to increase well-being, productivity, self-management, and leadership skills.
– Corporate Oncology Program for Employees: Available in Australia, Canada, Germany, United Kingdom, and the United States, the program provides SAP employees facing cancer with access to an individual molecular genetic tumor analysis and interpretation.
– Healthy leadership: Various offerings are available to support SAP leaders in fostering a healthy mindset and culture, such as healthy leadership training and a personalized executive health and well-being program.
Headcount and Personnel Expense
SAP is constantly adapting to new market conditions and changing customer requirements. As part of this ongoing transformation, we launched a company-wide restructuring program in 2019. Our aim was to further simplify our structures and processes and invest in key strategic growth areas. With that, we endeavor to ensure that our organizational setup, skillsets, and resource allocation continue to meet customer demand. For more information about the numbers of employees who left SAP as part of the restructuring program and its financial impact, see the Notes to the Consolidated Financial Statements, Note (B.6).
Like similar restructuring programs in the past, this program was not about reducing the size of SAP. We are growing and continuing to focus on delivering the intelligent enterprise. As part of the restructuring program we offered our voluntary program in certain countries. It was built on “double voluntariness,” meaning SAP has reserved the right to reject the participation of individual employees, if their knowledge was considered business critical. In addition, we were monitoring our hiring patterns through 2019 to realize the structural effects of our restructuring efforts.
As at December 31, 2019, we had 100,330 full-time equivalent (FTE) employees worldwide (2018: 96,498). This represents an increase in headcount of 3,832 FTEs (thereof 2,113 from acquisitions) in comparison to 2018. The average number of employees in 2019 was 99,157 (2018: 93,709).
We define headcount in FTE as the number of people on permanent employment contracts considering their staffing percentage. Students, individuals employed by SAP currently not working for reasons such as maternity leave, and temporary employees on limited contracts of less than six months are excluded from our figures. The number of temporary employees is not material.
Our average personnel expense for each employee increased to approximately €150,000 in 2019 (2018: approximately €124,000). This increase is primarily attributable to an increase of share-based payment and restructuring expenses. The personnel expense for each employee is defined as the overall personnel expense divided by the average number of employees.
For more information about employee compensation and a breakdown of the components of personnel expense, see the Notes to the Consolidated Financial Statements, Note (B.2).
Employees and Social Investments | 77 |
To Our | Combined Group | Consolidated Financial | Further Information on Economic, | Additional |
Stakeholders | Management Report | Statements IFRS | Environmental, and Social Performance | Information |
Employee Headcount by Region and Function | |
Full-time
equivalents (FTEs) | | | 12/31/2019 | | | 12/31/2018 | | | 12/31/2017 |
EMEA | Americas | APJ | Total | EMEA | Americas | APJ | Total | EMEA | Americas | APJ | Total |
Cloud and software | 6,501 | 4,426 | 5,361 | 16,288 | 6,341 | 4,268 | 5,374 | 15,983 | 5,869 | 3,895 | 4,719 | 14,482 |
Services | 8,250 | 6,018 | 5,971 | 20,239 | 8,120 | 5,736 | 5,620 | 19,476 | 7,536 | 4,878 | 4,965 | 17,379 |
Research and development | 12,710 | 5,793 | 9,131 | 27,634 | 12,478 | 5,651 | 8,930 | 27,060 | 11,349 | 5,250 | 8,273 | 24,872 |
Sales and marketing | 10,205 | 10,368 | 5,209 | 25,781 | 9,843 | 9,452 | 4,918 | 24,213 | 9,196 | 9,169 | 4,854 | 23,219 |
General and administration | 3,161 | 2,123 | 1,246 | 6,530 | 2,906 | 1,970 | 1,147 | 6,024 | 2,676 | 1,781 | 1,047 | 5,504 |
Infrastructure | 2,220 | 984 | 654 | 3,859 | 2,160 | 951 | 631 | 3,742 | 1,732 | 855 | 501 | 3,087 |
SAP Group (12/31) | 43,048 | 29,712 | 27,571 | 100,330 | 41,848 | 28,029 | 26,620 | 96,498 | 38,357 | 25,827 | 24,359 | 88,543 |
Thereof acquisitions | 338 | 1,638 | 137 | 2,113 | 657 | 952 | 434 | 2,043 | 149 | 133 | 7 | 289 |
SAP Group (months’ end average) | 42,697 | 29,368 | 27,092 | 99,157 | 40,496 | 27,454 | 25,759 | 93,709 | 37,512 | 25,459 | 24,029 | 86,999 |
Powering Opportunity Through Digital Inclusion
As technology and innovation rapidly change the competencies needed to succeed in today’s digital world, our global corporate social responsibility (CSR) program is tackling this skills gap head-on, putting SAP’s purpose to help the world run better and improve people’s lives into action through its mission – powering opportunity through digital inclusion. As such, our initiatives consider issues including access, adoption, and application of skills to ensure everyone can benefit from and participate in the digital economy.
SAP CSR efforts focus on three strategic program pillars: building digital skills; accelerating best-run non-profits and social enterprises; and connecting employees with purpose. Our Global CSR Governance Committee, consisting of executive level representatives from different board areas at SAP, advises and approves the strategic direction of our overall CSR mission. In addition, regional CSR governance committees advise and approve all major CSR partnerships and efforts. Led by our head of global CSR, our global CSR team is part of the Corporate Affairs organization in the Office of the Co-CEOs Board area. There is also a regional CSR lead for each of our major SAP regions. On a group level, we ensure that donations are made in an appropriate manner through financial and compliance control processes described in our global CSR policy, and we monitor all major CSR programs for social impact.
In 2019, SAP donated €23 million to education and workforce development programs, as well as youth entrepreneurship projects. These programs, focused on digital skills, expanded operations into more than 105 countries. Additionally, SAP announced a multimillion, multiyear partnership with UNICEF in September 2019 focused on global workforce inclusion initiatives to help 1.5 million young people thrive and provide organizations with a prepared workforce. By bringing together businesses, governments and non-governmental organizations, together we will build sustainable education models. The partnership will address several strategic areas including standardizing national curricula, workforce readiness programs, and in-depth research to better inform and connect the private sector with future talent.
Building Digital Skills
SAP recognizes the responsibility of meeting people where they are on their employment journey. As such, SAP’s educational initiatives aim to help people – regardless of age or background – attain the relevant 21st-century skills to thrive, innovate, and secure meaningful work (including entrepreneurial pursuits) in a digital world. In 2019, SAP digital skills and coding programs trained 56,000 teachers, engaged 4.5 million young people, and spanned 105 countries.
Accelerating Best-Run Non-Profit Organizations and Social Enterprises
SAP CSR’s non-profit and social enterprise partners are selected because of their significant impact in areas of quality education and workforce preparedness. We provide unique skills, expertise, products, and financial support to partners that, in turn, accelerate their ability to drive sustainable social impact. In 2019, SAP built capacity for over 1,200 innovative non-profit organizations and social enterprises resulting in a social investment of €3.4 million, impacting 950,000 lives.
Social enterprises represent a powerful vehicle for a more caring, inclusive, and sustainable economy due to the nature of their socially driven business models. In 2019, we extended investment in this area by entering into a long-term partnership with Social Enterprise UK to open up annual transaction value of £65 billion (€77 billion) in the United Kingdom and help corporate buyers spend better with certified social enterprises.
Connecting Employees with Purpose
We empower our employees to take action around causes that matter to them personally through easy-to-digest resources
78 | Employees and Social Investments |
To Our | Combined Group | Consolidated Financial | Further Information on Economic, | Additional |
Stakeholders | Management Report | Statements IFRS | Environmental, and Social Performance | Information |
including training, a new cloud-based employee engagement platform called SAP Together, as well as funding. In this way, we foster employee engagement and societal impact. In 2019, SAP employees around the world dedicated more than 270,000 hours of service to causes important to them.
Collaborating for Impact
Increasingly, SAP CSR is collaborating with like-minded customers and partners to create collective impact through exemplary initiatives such as Global Alliance for YOUth, Corporate Champions for Education, and the SAP Social Sabbatical for executive engagement program. SAP, together with 19 international private companies, has joined forces in Global Alliance for YOUth, for example, tackling issues such as automation and the global skills gap and building a better future for younger generations.
Building on the success of our multicompany SAP Social Sabbatical for executive engagement program option piloted in 2018 with BMW, we expanded the program in 2019 to invite selected strategic customers and partners to join. As a result, we teamed up with EY and Nestlé for the SAP Social Sabbatical for executive engagement programs in Brazil and Rwanda to bring an added dimension of impact to our client organizations with three executives from these companies joining us.
 Audit Scope Audit Scope
| |
| |
Not all information in this section was part of the statuatory audit of our combined group management report by our external auditor KPMG. The quantitative indicators Business Health Culture Index, Employee Engagement Index, Employee Retention, Women in Management, as well as Headcount and Personnel Expense are audited at a reasonable assurance level. For the remaining qualitative and quantitative disclosures in this chapter, KPMG performed a limited assurance engagement. | |
Employees and Social Investments | 79 |
To Our | Combined Group | Consolidated Financial | Further Information on Economic, | Additional |
Stakeholders | Management Report | Statements IFRS | Environmental, and Social Performance | Information |
Energy and Emissions
Being a Front-Runner for a Greener Way of Working
SAP takes its environmental responsibilities seriously and strives to be a role model for sustainable business operations by running our own operations cleaner and greener. In addition, we aim to enable our customers to reduce their overall carbon emissions through our software.
Our global environmental policy promotes a more productive use of resources by providing transparency in environmental issues, driving efficiency, and leveraging transformational strategies. It also outlines our environmental goals.
The SAP Executive Board sponsor for sustainability, including climate change, is our chief financial officer (CFO). Our chief sustainability officer and our dedicated sustainability organization coordinate our response to climate change, which includes assessing and managing climate-related risks and opportunities. Facilities management staff design and operate our facilities based on robust environmental standards. In addition, our IT operations personnel is committed to optimizing energy consumption in our data centers. We assess our environmental performance and risks in quarterly management reviews.
To be able to innovate and embed sustainability further, we regularly engage with various stakeholder groups such as non-governmental organizations (NGOs), non-profit organizations (NPOs), and academia. This notably includes an external sustainability advisory panel comprised of expert representatives from our customers, investors, partners, NGOs, and academia.
To enable continuous improvement and to protect the environment, we are gradually introducing an ISO 14001-certified environmental management system (EMS) at SAP sites worldwide. In 2019, our global EMS covered 55 sites in 30 countries. In 2025, SAP aims to run an ISO 14001-certified EMS at 100% of its company-owned sites. An energy management system certified by the ISO 50001 standard is integrated with the existing environmental management system at SAP’s headquarters in Germany.
Cutting Carbon Emissions
We are committed to making our operations carbon neutral by 2025. This target includes all direct emissions from running our business as well as a selected subset of indirect emissions from supply chains and services.
Furthermore, in 2017, SAP joined the Science Based Targets initiative (SBTi) as the first German company to do so. We comply with the initiative’s ambitious requirements and are committed to reducing emissions by 85% by 2050 compared to the base-year level 2016, including energy consumption of our products in use at our customers. This target reflects the level of decarbonization required to keep the global temperature increase below 1.5°C compared to pre-industrial temperatures.
A number of initiatives harness innovative technologies to help us run our operations in a way that reduces our impact on the environment. In addition, our investment in renewable electricity certificates and carbon credits enables us to support sustainability projects across the globe.
Total Net Carbon Emissions

In addition to our commitment to carbon neutrality, we have derived annual targets for our internal operational steering. Compared to 2018, our carbon emissions slightly decreased, although our number of employees increased by 5.5%. While we continued our strategy to avoid and reduce our emissions wherever possible, we did see a significant increase in business flights, due to business growth, which we only partially compensated for with carbon offsets. In 2019, our carbon emissions target of 285 kilotons (kt) was exceeded by 15 kt.
Our focus on carbon emissions has contributed to a cumulative cost avoidance of €298.6 million in the past three years, compared to a business-as-usual scenario based on 2007. We achieved 34% of this cost avoidance in 2019. In 2020, we plan to re-evaluate the calculation approach.
Total Energy Consumption
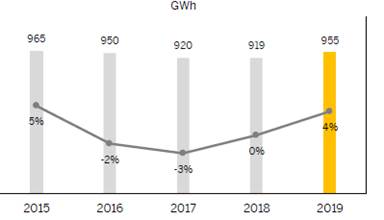
To Our | Combined Group | Consolidated Financial | Further Information on Economic, | Additional |
Stakeholders | Management Report | Statements IFRS | Environmental, and Social Performance | Information |
Strengthening Our “Green Cloud”
At SAP, we have tied our business strategy to our environmental strategy by creating a “green cloud” powered by 100% renewable electricity. As more business moves to the cloud, data centers are a key part of how SAP provides solutions to our customers. By using our green cloud services, customers can significantly reduce their carbon emissions. Given the increasing data center capacity and an increasing energy consumption, our data centers have become a primary focus of our carbon reduction efforts. The term data center refers to both SAP-owned and external data centers (co-location and hypercale data centers).
We have introduced initiatives to drive efficiency and innovation with respect to our buildings, data center operations, and infrastructure. This allowed us to maintain an efficient power usage effectiveness (PUE) of 1.36 in our data centers in St. Leon-Rot, Germany. The PUE is a ratio that describes the efficiency of a data center, with 1.0 being the ideal. Furthermore, in 2019, SAP opened its new state-of-the-art data center in Walldorf, Germany.
Committing to 100% Renewable Electricity
Our commitment to 100% renewable electricity is crucial to making our operations more sustainable. While SAP produces a small amount of renewable electricity through solar panels in some locations, we rely primarily on the purchase of renewable energy certificates (RECs) to achieve our target of 100% renewable electricity. We only invest in RECs with very high quality standards, which support renewable energy projects that meet robust criteria in terms of environmental integrity, stakeholder inclusivity, and reporting and verification.
Total Data Center Electricity
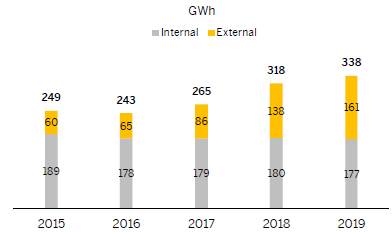
Helping Our Customers Run Greener Operations
The vast majority of our overall carbon emissions result from the use of our software. When our customers run SAP software on their hardware and on their premises, the resulting carbon emissions are about 40 times the size of our own net carbon emissions. To address this, we have developed a downstream emissions strategy to help our customers, hardware providers, and others run greener operations. One of the most important ways we help our customers reduce their energy usage and emissions is by managing their SAP systems through cloud services provided by our carbon-neutral green cloud offerings. In addition, the solutions in our portfolio, such as SAP Environment, Health, and Safety Management, enable our customers to manage their resources, such as electricity, more efficiently.
The SAP HANA platform contributes to helping our customers cut their energy consumption. By combining the worlds of analytic and transactional data into one real-time, in-memory platform, it can help to simplify system landscapes, increase their efficiency, and create leaner operations.
With the new SAP Profitability and Performance Management application powered by SAP HANA, we have integrated value chain sustainability management and carbon footprint management to support our customers on their path to increased transparency and help them combine non-financial and financial data into their reporting and steering. For example, customers can improve their real-time energy demand response for power demand management.
SAP also works with customers to optimize their on-premise landscapes so that they consume less energy. We achieve this by helping them decommission legacy systems, archive unused data, consolidate business applications, and virtualize their system landscape.
Driving Environmental Initiatives Throughout SAP
We continuously pursue strategies to help us achieve our goal of reducing emissions at a time of ongoing growth in our business. Key initiatives for 2019 included the following:
EKOenergy Certification
Most of our renewable electricity is purchased on the electricity market and is not produced by SAP. As recommended by the Greenhouse Gas Protocol and CDP, we actively look for the best available quality. Therefore, all of our purchased renewable electricity is EKOenergy-certified. EKOenergy is a high-quality, internationally recognized not-for-profit ecolabel for energy. It certifies electricity from renewable energy installations that fulfill additional sustainability criteria. Through the purchase of EKOenergy-certified electricity, we also contribute to EKOenergy’s Climate Fund, which finances solar projects tackling energy poverty.
Electric Vehicles
As a result of our business expansion, the number of SAP employees eligible for a company car has increased annually. We want to ensure that the resulting growth in our car fleet does not undo our successes in cutting carbon emissions. To help address this, SAP aims to increase the number of electric vehicles (battery electric vehicles and plug-in hybrid electric vehicles) in our company car fleet from 9.6% at the end of 2019 (2018: 7%) to 20% by the end of 2020. Our aim is that by 2025, one-third of all company cars will be more eco-friendly vehicles, such as electric or fuel cell cars.
All electric company cars charged at SAP are powered with 100% renewable electricity. In addition, in Germany we provide employees with an incentive to switch to electric alternatives by offering a battery subsidy that partially offsets the higher costs of an electric vehicle. Furthermore, we continously expand and enhance the charging infrastructure for our employees (2019: 750 charging stations; 2018: 550 charging stations).
To Our | Combined Group | Consolidated Financial | Further Information on Economic, | Additional |
Stakeholders | Management Report | Statements IFRS | Environmental, and Social Performance | Information |
Internal Carbon Pricing for Business Flights
In addition to avoiding business flights by investing in virtual collaboration and communication technologies, we invest in carbon emission offsets for air travel in the majority of countries we travel from by charging an internal carbon price.
We only invest in carbon offset projects with Gold Standard or other high-quality standards. In 2019, our offset effort resulted in a compensation of 240 kt of emissions.
Investment in Carbon Credits
In 2019, we continued to realize the benefits of our investment in the Livelihoods Fund. Several years ago, we made a commitment to invest €3 million covering a 20-year participation in a fund that supports social causes as well as the sustainability of agricultural and rural communities worldwide. The returns from this unique investment in the Livelihoods Fund consist of high-quality carbon credits. Following the success of this scheme, we now also invest in a second Livelihoods Fund, committing another €3 million over the next 30 years and thus increasing our commitment to sustainable initiatives. In 2019, the carbon credits we received from these funds helped us to offset our carbon emissions by 30 kt.
At the beginning of 2018, SAP pledged to plant five million trees by 2025 in collaboration with various non-governmental organizations. In 2019, we invested in 500,000 trees as part of our carbon offsetting initiatives.
 Audit Scope Audit Scope
| |
| |
The content of this section was not subject to the statutory audit of our combined group management report. However, our auditor KPMG has performed an independent assurance engagement on the contents of this section. Under this engagement, the quantitative indicators carbon emissions (Scope 1 and 2 as well as selected Scope 3 emissions including business flights and employee commuting), Renewable Energy, and Total Energy Consumed were audited at a reasonable assurance level. For the remaining qualitative and quantitative disclosures in this section, KPMG performed a limited assurance engagement. | |
To Our | Combined Group | Consolidated Financial | Further Information on Economic, | Additional |
Stakeholders | Management Report | Statements IFRS | Environmental, and Social Performance | Information |
Financial Performance: Review and Analysis
Economy and the Market
Global Economic Trends
According to the European Central Bank (ECB), global economic growth decreased during the first half of 2019, marking the weakest period since the global financial crisis, but signs of stabilization started to emerge towards the end of the year.1) In our 2019 half-year report, we mentioned that the ECB had expected a longer phase until recovery. Escalating trade tensions and Brexit-related uncertainties, however, continued to impair economic growth during the second half of the year.
For the Europe, Middle East, and Africa (EMEA) region, the ECB reports that growth in the euro area remained weak throughout the year at 1.2%. Some initial signs of stabilization – in line with previous expectations – materialized only toward the end of the year. In central and eastern Europe, economic activity continued to be supported by solid consumer spending despite tight labor markets. The Russian economy performed better than expected in the third quarter of 2019.
In the Americas region, the ECB saw economic activity expand steadily in the United States due to a strong labor market and supportive financial conditions. The resumption of trade negotiations between the United States and China in the last quarter of 2019 brought about a first trade deal and hopes of de-escalation, but trade tensions between the United States on the one side and the EU and Latin America on the other side remained unsolved. In Brazil, despite some improvements in early 2019 and against expectations, growth remained fragile throughout the year.
In the Asia Pacific Japan (APJ) region, the Japanese economy expanded on a steady but muted level all year, reports the ECB. Solid domestic demand especially ahead of the value-added tax increase effective October 1, 2019, posed as the main stabilizer of growth. In China, economic activity slowed gradually over the year, caused by lower-than-expected investment and the trade conflict with the United States.
The IT Market
At the end of 2019, technology required for digital transformation was no longer expensive and restricted to those businesses that could afford it. Instead, enterprise applications had become fundamental, says International Data Corporation (IDC), a U.S.-based market research firm, in recent publications.2) Enterprises were now required to continuously adapt to or drive disruptive changes in their operations, customers, and markets. They had to balance digital and physical competencies and master them at scale, creating new business models and digitally enabled products and services.3)
Furthermore, IDC describes a “platform economy” fueled by tools, capabilities, and frameworks based upon the power of information, cognitive computing, and ubiquitous access. In 2019, leading organisations shifted to platform thinking in order to evolve their business models and manage their technology architecture. At the same time, several “megaplatforms” competed to own infrastructure and developmental environments for providing infrastructure as a service (IaaS).4)
The driving factors of these developments in 2019, according to IDC, were data, analytics, and machine learning. They revolutionized operations, providing major increases in productivity and efficiency and thus value. Real-time data from mobile devices, the Internet of Things (IoT), and other devices at the edge, combined with historical data, global information, artificial intelligence (AI), and machine learning, continually enabled organizations to spread intelligence from the core to the edge and maximize their business outcomes.3)
Sources:
1) European Central Bank, Economic Bulletin, Issue 8/2019, Publication Date: December 27, 2019 (https://www.ecb.europa.eu/pub/pdf/ecbu/eb201908.en.pdf)
2) IDC FutureScape: Worldwide IT Industry 2020 Predictions, Doc #US45599219, October 2019
3) IDC FutureScape: Worldwide Digital Transformation 2020 Predictions, Doc #US45569118, October 2019
4) IDC FutureScape: Worldwide Intelligent ERP 2020 Predictions, Doc US44646019, October 2019
Impact on SAP
Despite macroeconomic uncertainties, SAP again demonstrated resilience, enjoying sustained growth and continued market adoption. Benefitting from the ongoing digital transformation of its customers, the rich portfolio of solutions, innovative and advanced technologies as well as the freedom of choice for customers to run their business in the cloud, on-premise or in a hybrid model, resulted in a remarkable full-year performance.
Overall Financial Position
Executive Board’s Assessment
In 2019, we met all our revenue and profit targets. Despite the expected decrease in software license revenue, total revenue increased again in 2019. This increase was mainly driven by double-digit growth rates in cloud revenue (39% IFRS and 40% non-IFRS).
In line with our expectations, IFRS operating profit, operating margin and earnings per share were negatively impacted by higher acquisition-related charges due to the Qualtrics acquisition and the charges from SAP’s global restructuring program announced in early 2019. In addition, IFRS results were negatively affected by higher share-based compensation (due to the Qualtrics acquisition and the strong SAP share price increase over the year). Adjusted by excluding these effects, there was solid growth in non-IFRS operating profit, non-IFRS operating margin, and non-IFRS earnings
Financial Performance: Review and Analysis | 83 |
To Our | Combined Group | Consolidated Financial | Further Information on Economic, | Additional |
Stakeholders | Management Report | Statements IFRS | Environmental, and Social Performance | Information |
per share. Given the continuous increase in cloud revenue and in new cloud and software license order entry, we are confident that we will deliver on our operational outlook for 2020 and on our 2023 mid-term ambitions.
Performance Against Our Outlook for 2019 (Non-IFRS)
As in previous years, our 2019 operating profit-related goals and published outlook were based on our non-IFRS financial measures at constant currencies. For this reason, in the following section we discuss performance against our outlook only in terms of non-IFRS numbers at constant currencies derived from IFRS measures. The subsequent section about IFRS operating results discusses numbers only in terms of the International Financial Reporting Standards (IFRSs), so the numbers in that section are not expressly identified as IFRS numbers.
Outlook for 2019 (Non-IFRS)
At the beginning of 2019, we projected that our 2019 non-IFRS cloud revenue would be between €6.70 billion and €7.00 billion at constant currencies (2018: €5.03 billion). This range represents a growth rate of 33% to 39% at constant currencies. The Company expected full-year 2019 non-IFRS cloud and software revenue to be in a range of €22.40 billion to €22.70 billion at constant currencies (2018: €20.66 billion). This range represents a growth rate of 8.5% to 10% at constant currencies. We also projected our full-year non-IFRS operating profit for 2019 would end between €7.70 billion and €8.00 billion (2018: €7.16 billion) at constant currencies. This range represents a growth rate of 7.5% to 11.5% at constant currencies. We expected a full-year 2019 effective tax rate (IFRS) of 26.5% to 27.5% (2018: 27.0%) and an effective tax rate (non-IFRS) of 26.0% to 27.0% (2018: 26.3%).
In light of our first-quarter 2019 results and SAP’s new initiatives to accelerate its operational excellence and value creation, we adjusted, in April 2019, our outlook for full-year non-IFRS operating profit for 2019 upward to range between €7.85 billion and €8.05 billion at constant currencies. This range represents a growth rate of 9.5% to 12.5% at constant currencies. In addition, SAP expected total revenues to increase strongly, albeit at a rate lower than operating profit (previously: slightly lower). Our projections for cloud revenue (non-IFRS, at constant currencies) and for cloud and software revenue (non-IFRS, at constant currencies) remained unchanged.
2019 Actual Revenue and Profit Performance Compared to Outlook (Non-IFRS)
We hit the raised outlook for revenue and operating profit that we published in April.
Comparison of Outlook and Results for 2019 | | |
| Outlook for 2019 (as Reported in Integrated Report 2018) | Revised Outlook for 2019 (Q1 Quarterly Statement) | Results for 2019 |
Cloud revenue
(non-IFRS, at constant currencies) | €6.70 billion
to €7.00 billion | €6.70 billion
to €7.00 billion | €6.77 billion |
Cloud and software revenue
(non-IFRS, at constant currencies) | €22.40 billion
to €22.70 billion | €22.40 billion
to €22.70 billion | €22.49 billion |
Total revenue
(non-IFRS, at constant currencies) | strong increase, at slightly lower rate than operating profit | strong increase, albeit at lower rate than operating profit | €26.91 billion |
Operating profit
(non-IFRS, at constant currencies) | €7.70 billion
to €8.00 billion | €7.85 billion
to €8.05 billion | €7.95 billion |
Effective tax rate (IFRS) | 26.5% to 27.5% | | 26.7% |
Effective tax rate (non-IFRS) | 26.0% to 27.0% | | 26.2% |
Despite economic and diplomatic tensions, arising particularly from the trade conflict between China and the United States, and uncertainties regarding the possible outcome and effects of the Brexit negotiations, our new and existing customers in 2019 continued to show a strong willingness to invest in our solutions and services.
At constant currencies, non-IFRS cloud revenue grew from €5.03 billion in 2018 to €6.77 billion in 2019 and therefore ended in our guidance range of €6.70 billion to €7.00 billion. That represents an increase of 35% at constant currencies.
Our new cloud bookings, which are one of our measures for cloud-related sales success and for future cloud revenue, increased in 2019 to €2.27 billion (2018: €1.81 billion). This is an increase of 25% (21% on a constant currency basis). In addition to this strong growth, our cloud backlog (unbilled future revenue based on existing cloud contracts) reached €12.4 billion (2018: €10.1 billion). This is an increase of 23% (20% on a constant currency basis).
Cloud and software revenue (non-IFRS) grew 9% at constant currencies to €22.49 billion (2018: €20.66 billion), and thus ended within our guidance range for 2019. This increase was mainly driven by strong cloud revenue growth as mentioned before. Software licenses revenue decreased by 5% at constant currencies.
Our total revenue (non-IFRS) on a constant currency basis rose 9% in 2019 to €26.91 billion (2018: €24.74 billion). Total revenue (non-IFRS) therefore grew at a rate lower than operating profit (non-IFRS) as forecasted, which increased 11% at constant currencies in 2019.
Operating expenses (non-IFRS) in 2019 on a constant currency basis were €18.95 billion (2018: €17.58 billion), an increase of 8%.
84 | Financial Performance: Review and Analysis |
To Our | Combined Group | Consolidated Financial | Further Information on Economic, | Additional |
Stakeholders | Management Report | Statements IFRS | Environmental, and Social Performance | Information |
Our expense base in 2019 continued to be impacted by our transformation to a fast-growing cloud business. In our outlook for 2019, we continued to expect to see the benefits from efficiency-based investments, and thus an increasing cloud gross margin. The cloud gross margin for 2019 was 68%, an increase of 5.0pp on a constant currency basis year over year. Despite continued investment in our business transformation, the margin improvement was primarily driven by increasing efficiency of our cloud offerings.
All cloud gross margins on our various cloud offerings developed positively in 2019:
The cloud gross margin (non-IFRS) on our Intelligent Spend Group segment improved slightly by 0.2pp (on a constant currency basis), resulting in 78% for 2019.
The cloud gross margin (non-IFRS) on our infrastructure as a service (IaaS) cloud offering continued to develop well in 2019. The corresponding gross margin improved by 16.4pp on a constant currency basis in 2019 to achieve a cloud gross margin (non-IFRS) of 29%.
Profitability in our software as a service/platform as a service (SaaS/PaaS) cloud offering was 68% at constant currencies (non-IFRS) for 2019. Despite ongoing investments in the further development and harmonization of our various software as a service/platform as a service offerings on a single platform, we were able to increase the margin by 8.5pp.
We saw efficiency improvements in both our cloud and traditional on-premise business, which drove continued operating profit expansion. Non-IFRS operating profit in 2019 was €7.95 billion on a constant currency basis (2018: €7.16 billion), reflecting an increase of 11%. As a result, we were able to surpass our excellent results from 2018, despite our continued investment in our business transformation during the reporting year. The positive development of our operating profit was largely influenced by investment decisions focused on customers and products which, among other things, resulted in an increase in our overall headcount by 3,832 full-time equivalents (thereof 1,719 organic), primarily in research and development, services, cloud, and sales. With these additional resources, we continued to make targeted investments in our innovation areas and growth markets. Thus, constant currency non-IFRS operating profit amounting to €7.95 billion was within our outlook range raised in April (€7.85 billion to €8.05 billion).
We achieved an effective tax rate (IFRS) of 26.7% and an effective tax rate (non-IFRS) of 26.2%, which is at the lower end of the range of 26.5% to 27.5% (IFRS) and 26.0% to 27.0% (non-IFRS).
Operating Results (IFRS)
This section on operating results (IFRS) discusses results only in terms of IFRS measures, so the IFRS numbers are not expressly identified as such.
We break our operations down into three regions: the Europe, Middle East, and Africa (EMEA) region, the Americas region, and the Asia Pacific Japan (APJ) region. We allocate revenue amounts to each region based on where the customer is located. For more information about revenue by geographic region, see the Notes to the Consolidated Financial Statements, Note (A.1).
Revenue
Total Revenue
Total revenue increased from €24,708 million in 2018 to €27,553 million in 2019, representing an increase of €2,845 million, or 12%.
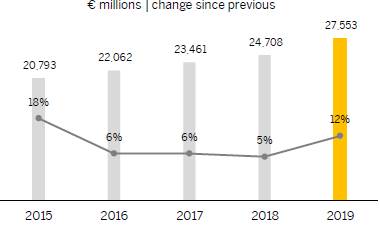
The growth in revenue resulted primarily from a €1,939 million increase in cloud revenue to €6,933 million. Cloud and software revenue represented 84% of total revenue in 2019 (2018: 83%). Service revenue increased 11% from €4,086 million in 2018 to €4,541 million in 2019, which was 16% of total revenue (2018: 17%).
Revenue by Revenue Type
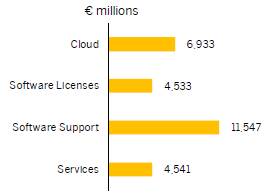
For more information about our regional performance, see the Revenue by Region section below.
Cloud and Software Revenue
Cloud revenue refers to the income earned from contracts that permit the customer to access specific software solutions hosted by SAP during the term of its contract with SAP. Software licenses revenue results from the fees earned from selling or licensing software to customers. Support revenue represents fees earned from providing customers with technical support services and unspecified software upgrades, updates, and enhancements. For more information about our revenue types, see the Notes to the Consolidated Financial Statements, Note (A.1).
Cloud and software revenue grew from €20,622 million in 2018 to €23,012 million in 2019, an increase of 12%.
Financial Performance: Review and Analysis | 85 |
To Our | Combined Group | Consolidated Financial | Further Information on Economic, | Additional |
Stakeholders | Management Report | Statements IFRS | Environmental, and Social Performance | Information |
Cloud and Software

Cloud revenue increased from €4,993 million in 2018 to €6,933 million in 2019.
Cloud Revenue

Our software licenses revenue declined by €114 million from €4,647 million in 2018 to €4,533 million in 2019. Our customer base continued to expand in 2019. Based on the number of contracts concluded, 13% of the orders we received for software licenses in 2019 were from new customers (2018: 15%). The total value of software licenses orders received decreased 5% year over year. The total number of contracts signed for new software licenses decreased 10% to 52,584 (2018: 58,530), with an average order value of €87 thousand in 2019 (2018: €82 thousand). Of all our software licenses orders received in 2019, 32% were attributable to deals worth more than €5 million (2018: 29%), while 35% were attributable to deals worth less than €1 million (2018: 39%).
Our stable customer base, the continued demand for our software throughout 2019 and the previous years, and the continued interest in our support offerings resulted in an increase in support revenue from €10,981 million in 2018 to €11,547 million in 2019. The SAP Enterprise Support offering was the largest contributor to our software support revenue. The €566 million, or 5%, growth in software support revenue is primarily attributable to our SAP Product Support for Large Enterprises services and our SAP Enterprise Support services.
Software licenses and software support revenue rose €452 million, or 3%, from €15,628 million in 2018 to €16,080 million in 2019.
We define more predictable revenue as the sum of our cloud revenue and our software support revenue. Compared to the previous year, our more predictable revenue increased from €15,975 million in 2018 to €18,480 million in 2019. This reflects a rise of 16%. More predictable revenue accounted for 67% of our total revenue in 2019 (2018: 65%).
More Predictable Revenue
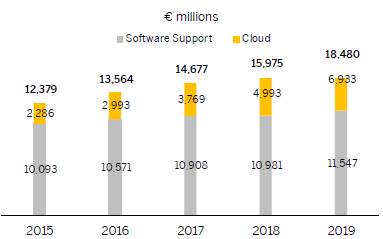
Services Revenue
Services revenue combines revenue from consulting services, premium support services, and other services such as training services and messaging services. Consulting services primarily relate to the implementation of our cloud subscriptions and on-premise software products. Our premium support offering consists of high-end support services tailored to customer requirements. Messaging services are primarily the transmission of electronic text messages from one mobile phone provider to another.
Services revenue increased €455 million, or 11%, from €4,086 million in 2018 to €4,541 million in 2019.
A solid market demand led to a 10% increase of €340 million in consulting revenue and premium support revenue from €3,356 million in 2018 to €3,696 million in 2019. In 2019, consulting and premium support revenue contributed 81% of the total services revenue (2018: 82%) and 13% of total revenue (2018: 14%).
Revenue from other services increased €114 million, or 16%, to €845 million in 2019 (2018: €731 million).
86 | Financial Performance: Review and Analysis |
To Our | Combined Group | Consolidated Financial | Further Information on Economic, | Additional |
Stakeholders | Management Report | Statements IFRS | Environmental, and Social Performance | Information |
Revenue by Region
(based on customer location)

EMEA Region
In 2019, the EMEA region generated €12,105 million in revenue (2018: €11,104 million), which was 44% of total revenue (2018: 45%). This represents a year-over-year increase of 9%. Revenue in Germany increased 8% to €3,948 million (2018: €3,658 million). Germany contributed 33% (2018: 33%) of all EMEA region revenue. The remaining revenue in the EMEA region was primarily generated in the United Kingdom, France, Switzerland, the Netherlands, and Italy. Cloud and software revenue generated in the EMEA region totaled €10,211 million (2018: €9,339 million). That was 84% of all revenue from the region (2018: 84%).
EMEA: Cloud and Software Revenue
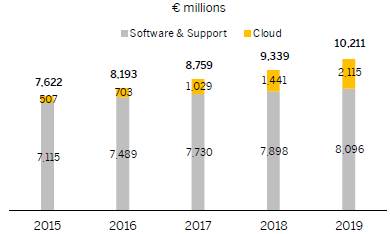
Cloud revenue in the EMEA region rose 47% to €2,115 million in 2019 (2018: €1,441 million). Software licenses and software support revenue rose 3% to €8,096 million in 2019 (2018: €7,898 million).
Americas Region
In 2019, 41% of our total revenue was generated in the Americas region (2018: 39%). Total revenue in the Americas region increased 15% to €11,194 million; revenue generated in the United States increased 15% to €9,085 million. The United States contributed 81% (2018: 81%) of all revenue generated in the Americas region. In the remaining countries of the Americas region, revenue increased 15% to €2,109 million. Revenue in the remaining countries of the Americas region was generated primarily in Canada, Brazil, and Mexico. Cloud and software revenue generated in the Americas region totaled €9,172 million (2018: €7,973 million). That was 82% of all revenue from the region (2018: 82%).
Americas: Cloud and Software Revenue
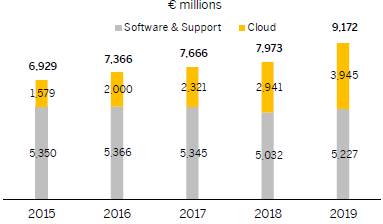
Cloud revenue in the Americas region rose 34% to €3,945 million in 2019 (2018: €2,941 million). Software licenses and software support revenue was €5,227 million in 2019 (2018: €5,032 million).
APJ Region
In 2019, 15% (2018: 16%) of our total revenue was generated in the APJ region. Total revenue in the APJ region increased 9% to €4,254 million. In Japan, revenue increased 23% to €1,180 million. Revenue from Japan was 28% (2018: 25%) of all revenue generated in the APJ region. In the remaining countries of the APJ region, revenue increased 5%. Revenue in the remaining countries of the APJ region was generated primarily in Australia, China, and India. Cloud and software revenue in the APJ region totaled €3,629 million (2018: €3,310 million). That was 85% of all revenue from the region (2018: 85%).
APJ: Cloud and Software Revenue
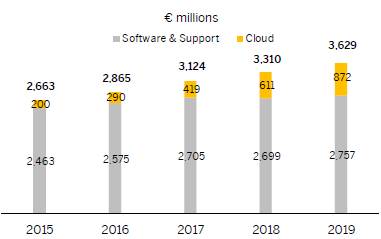
Cloud revenue in the APJ region rose 43% to €872 million in 2019 (2018: €611 million). Software licenses and software support
Financial Performance: Review and Analysis | | 87 |
To Our | Combined Group | Consolidated Financial | Further Information on Economic, | Additional |
Stakeholders | Management Report | Statements IFRS | Environmental, and Social Performance | Information |
revenue increased from €2,699 million in 2018 to €2,757 million in 2019. This reflects a rise of 2%.
Operating Profit and Operating Margin
SAP posted record revenues in 2019, particularly in Cloud and Services. Total revenue grew 12% to €27,553 million (2018: €24,708 million), representing an increase of €2,845 million.
On the other hand, our operating expenses increased €4,076 million, or 21%, to €23,081 million (2018: €19,005 million). The main contributors to that increase were the costs of the SAP restructuring program, totaling €1,130 million (2018: €19 million), our continued investment in research and development, and our revenue-related cloud subscriptions and support activities. We also continued our investments in the Services area in line with the increased revenue. Acquisition-related charges of €689 million (2018: €577 million) and share-based compensation of €1,835 million (2018: €830 million), arising chiefly from the acquisition of Qualtrics, also had a negative impact on operating profit. Our employee headcount (measured in full-time equivalents, or FTEs) grew by 3,832 FTEs year over year to 100,330.
We see the increased operating expenses largely as investments in the future that will help secure our operating profit in the long term.
As a result of these effects, our operating profit decreased by 22% to €4,473 million (2018: €5,703 million) and our operating margin decreased by 6.9pp to 16.2% (2018: 23.1%).
Operating Profit
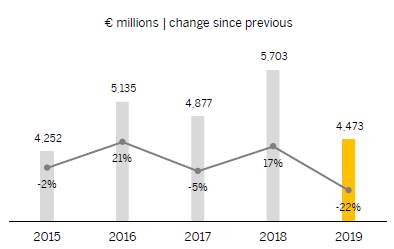
Operating Margin

Changes to the individual elements in our cost of revenue were as follows:
Cost of Cloud and Software
Cost of cloud and software consists primarily of costs for deploying and operating cloud solutions, the cost of developing custom solutions that address customers’ specific business requirements and customer support costs.
In 2019, the cost of cloud and software increased 13% to €4,692 million (2018: €4,160 million).
Significant costs arose through the expansion of the cloud business in response to strong customer demand, leading to the cost of delivering and operating our cloud applications increasing by an additional €466 million year over year. These investments contributed to revenue growth. Our cloud margin widened by 4.9pp from 58.6% in 2018 to 63.5% in 2019. This improvement in margin is attributable to strong growth in cloud revenue of 39% to €6,933 million (2018: €4,993 million) with a lower increase in cost of cloud of 22% to €2,534 million (2018: €2,068 million). Additional positive impacts on the cloud margin resulted from our Qualtrics acquisition and completion of the SuccessFactors migration to SAP S4/HANA.
A 3% increase in software licenses and software support revenue to €16,080 million (2018: €15,628 million) and a corresponding increase of 3% in the software licenses and software support costs to €2,159 million (2018: €2,092 million) saw our software licenses and software support margin remain constant at 86.6% (2018: 86.6%) The gross margin on cloud and software, defined as cloud and software profit as a percentage of cloud and software revenue, narrowed by 0.2pp in 2019 to 79.6% (2018: 79.8%). This decline was mainly driven by the change in the revenue mix, which now has a higher proportion of cloud revenues. Due to infrastructure costs, these revenues currently deliver a lower margin simultaneously with a declining proportion of higher-margin software and support revenues.
Cost of Services
Cost of services consists primarily of the cost of consulting, premium services and training courses and the cost of bought-in consulting and training resources.
We were able to increase our services revenue by 11% year over year to €4,541 million in 2019 (2018: €4,086 million). As our service
88 | | Financial Performance: Review and Analysis |
To Our | Combined Group | Consolidated Financial | Further Information on Economic, | Additional |
Stakeholders | Management Report | Statements IFRS | Environmental, and Social Performance | Information |
business trends away from traditional software licensing and consulting revenue toward more subscription revenue from cloud solutions, we continue to invest by expanding capacities to meet the higher demand. As a result, cost of services rose 11% to €3,662 million (2018: €3,302 million). Our gross margin on services, defined as services profit as a percentage of services revenue, increased slightly to 19.4% (2018: 19.2%).
Research and Development
Our research and development (R&D) expense consists primarily of the personnel cost of our R&D employees, costs incurred for independent contractors we retain to assist in our R&D activities, and amortization of the computer hardware and software we use for our R&D activities.
Due to growing personnel costs driven by a 4% increase on average for the year in our R&D headcount, and due to a higher proportion of employees in more cost-intensive countries as a result of the acquisition of Qualtrics, our R&D expense rose by 18% to €4,292 million in 2019 from €3,624 million in 2018. R&D expense as a percentage of total revenue thus increased to 15.6% in 2019 (2018: 14.7%). For more information, see the Products, Research & Development, and Services section.
Sales and Marketing Expense
Sales and marketing expense consists mainly of personnel costs, direct sales costs, and the cost of marketing our products and services.
Our sales and marketing expense rose 13% from €6,781 million in 2018 to €7,693 million in 2019. This increase is mainly attributable to the expansion of the global sales force, partly as a result of acquiring Qualtrics, and to greater expenditure on bonus payments prompted by strong revenue growth.
Accordingly, the ratio of sales and marketing expense to total revenue, expressed as a percentage, rose to 27.9% in 2019 (2018: 27.4%), an increase of 0.5pp.
General and Administration Expense
Our general and administration expense consists mainly of personnel costs to support our finance and administration functions.
General and administration expense rose 48% from €1,098 million in 2018 to €1,629 million in 2019, despite careful cost management. This increase is primarily the result of higher personnel costs related to job creation in administrative areas, based on the increased business volume related to our growth. The ratio of general and administration expense to total revenue rose by 1.5pp year over year to 5.9% (2018: 4.4%).
Segment Information
At the end of 2019, SAP had three reportable segments: Applications, Technology & Services segment; Intelligent Spend Group segment; and Qualtrics segment. Since we acquired Qualtrics on January 23, 2019, financial data for the Qualtrics segment is only presented from this acquisition date onwards. For more information about our segment reporting and the changes in the composition of our reportable segments in 2019, see the Notes to the Consolidated Financial Statements, Notes (C.1) and (C.2), and the Performance Management System section.
Applications, Technology & Services Segment
€ millions, unless otherwise stated
(Non-IFRS) | | | | 2019 | | 2018 | | D in % | | D in % | |
| Actual
Currency | | Constant
Currency | | Actual
Currency | | Actual
Currency | | Constant
Currency | |
Cloud revenue – SaaS/PaaS1) | | 3,243 | | 3,152 | | 2,347 | | 38 | | 34 | |
Cloud gross margin – SaaS/PaaS1) (in %) | | 65.3 | | 65.4 | | 59.6 | | 5.7pp | | 5.8pp | |
Cloud revenue – IaaS2) | | 695 | | 673 | | 488 | | 43 | | 38 | |
Cloud gross margin – IaaS2) (in %) | | 29.1 | | 28.5 | | 12.2 | | 16.9pp | | 16.4pp | |
Cloud revenue | | 3,938 | | 3,825 | | 2,835 | | 39 | | 35 | |
Cloud gross margin (in %) | | 58.9 | | 58.9 | | 51.4 | | 7.4pp | | 7.4pp | |
Segment revenue | | 23,544 | | 22,980 | | 21,753 | | 8 | | 6 | |
Segment gross margin (in %) | | 73.5 | | 73.5 | | 73.2 | | 0.3pp | | 0.3pp | |
Segment profit | | 9,868 | | 9,597 | | 8,922 | | 11 | | 8 | |
Segment margin (in %) | | 41.9 | | 41.8 | | 41.0 | | 0.9pp | | 0.7pp | |
1) Software as a service/platform as a service
2) Infrastructure as a service
The Applications, Technology & Services segment recorded a strong increase in cloud revenue in 2019. SaaS/PaaS revenue within the segment increased 38% (34% at constant currencies), primarily as a result of high demand in our Intelligent ERP solutions.
Our software support revenue improved slightly in 2019. It rose 5% (3% at constant currencies) to €11,532 million. Including software licenses revenue, which remained 3% (5% at constant currencies) below the prior-year level due to the shift toward cloud revenue, we achieved a total software licenses and support revenue of €16,054 million in 2019.
Overall, the revenue share of more predictable revenue streams in this segment increased 2.3pp from 63.5% in 2018 to 65.7% in 2019.
Financial Performance: Review and Analysis | | 89 |
To Our | Combined Group | Consolidated Financial | Further Information on Economic, | Additional |
Stakeholders | Management Report | Statements IFRS | Environmental, and Social Performance | Information |
The segment’s cost of revenue during the same period increased 7% (5% at constant currencies) to €6,228 million (2018: €5,823 million). This increase in expenses was primarily the result of greater investment in expanding our cloud infrastructure and in providing and operating our cloud applications. This applied to both the SaaS/PaaS and the IaaS business, whose cloud gross margins nevertheless increased owing to the growth in revenue. Whereas the SaaS/PaaS cloud gross margin within the Applications, Technology & Services segment grew 5.7pp (5.8pp at constant currencies), our IaaS business ended the fiscal year with a cloud gross margin growth of 16.9pp (16.4pp at constant currencies).
Intelligent Spend Group Segment
€ millions, unless otherwise stated
(Non-IFRS) | | | | 2019 | | 2018 | | D in % | | D in % | |
| Actual
Currency | | Constant
Currency | | Actual
Currency | | Actual
Currency | | Constant
Currency | |
Cloud revenue – SaaS/PaaS1) | | 2,693 | | 2,585 | | 2,178 | | 24 | | 19 | |
Cloud gross margin – SaaS/PaaS1) (in %) | | 78.1 | | 78.0 | | 77.8 | | 0.2pp | | 0.2pp | |
Cloud revenue | | 2,693 | | 2,585 | | 2,178 | | 24 | | 19 | |
Cloud gross margin (in %) | | 78.1 | | 78.0 | | 77.8 | | 0.2pp | | 0.2pp | |
Segment revenue | | 3,184 | | 3,057 | | 2,629 | | 21 | | 16 | |
Segment gross margin (in %) | | 70.1 | | 69.9 | | 69.1 | | 1.0pp | | 0.9pp | |
Segment profit | | 696 | | 661 | | 531 | | 31 | | 25 | |
Segment margin (in %) | | 21.9 | | 21.6 | | 20.2 | | 1.7pp | | 1.4pp | |
1) Software as a service/platform as a service
The Intelligent Spend Group segment, which comprises cloud solutions from SAP Ariba, SAP Concur, and SAP Fieldglass, was able to improve its cloud gross margin by 0.2pp to 78.1%. The segment’s cost of revenue increased 17% in 2019 (13% at constant currencies) to €953 million (2018: €813 million). Segment revenue increased by 21% (16% at constant currencies) to €3,184 million. As a result, the Intelligent Spend Group segment achieved a segment gross margin of 70.1% (69.9% at constant currencies) in 2019, reflecting an increase of 1.0pp (0.9pp at constant currencies).
Qualtrics Segment | | | | | | | | | | | |
€ millions, unless otherwise stated
(Non-IFRS) | | | | | | | | | | | |
| | | 2019 | | 20182) | | D in % | | D in % | |
| | Actual
Currency | | Constant
Currency | | Actual
Currency | | Actual
Currency | | Constant
Currency | |
Cloud revenue – SaaS/PaaS1) | | 371 | | 353 | | NA | | NA | | NA | |
Cloud gross margin – SaaS/PaaS1) (in %) | | 91.1 | | 91.1 | | NA | | NA | | NA | |
Cloud revenue | | 371 | | 353 | | NA | | NA | | NA | |
Cloud gross margin (in %) | | 91.1 | | 91.1 | | NA | | NA | | NA | |
Segment revenue | | 508 | | 483 | | NA | | NA | | NA | |
Segment gross margin (in %) | | 78.3 | | 78.1 | | NA | | NA | | NA | |
Segment profit | | 8 | | 9 | | NA | | NA | | NA | |
Segment margin (in %) | | 1.6 | | 2.0 | | NA | | NA | | NA | |
1) Software as a service/platform as a service
2) There are no prior-period numbers for the Qualtrics segment presented, since we acquired Qualtrics in 2019.
We acquired Qualtrics on January 23, 2019, as the leading provider of Experience Management (XM) solutions. The product portfolio comprises the Qualtrics XM Platform, which is designed to help organizations measure, prioritize, and optimize the four core experiences of business – customer, product, employee, and brand – on one platform. The Qualtrics segment, however, does not comprise the full impact of the acquisition since some functions of Qualtrics have already been integrated into SAP’s corporate functions.
In 2019, the Qualtrics segment realized cloud revenue of €371 million (€353 million at constant currencies) with a cloud gross margin of 91.1% (91.1% at constant currencies). Including the services revenue, total segment revenue was €508 million (€483 million at constant currencies), whereas the segment’s cost of revenue was €110 million (€106 million at constant currencies). As a result, the Qualtrics segment achieved a segment gross margin of 78.3% (78.1% at constant currencies) in 2019.
90 | | Financial Performance: Review and Analysis |
To Our | Combined Group | Consolidated Financial | Further Information on Economic, | Additional |
Stakeholders | Management Report | Statements IFRS | Environmental, and Social Performance | Information |
Reconciliation of Cloud Revenues and Margins | | | | | | | | | | | |
€ millions, unless otherwise stated
(Non-IFRS) | | | | | | 2019 | | 2018 | | D in % | | D in % | |
| | | Actual
Currency | | Constant
Currency | | Actual
Currency | | Actual
Currency | | Constant
Currency | |
| | Intelligent Spend Group segment | | 2,693 | | 2,585 | | 2,178 | | 24 | | 19 | |
Cloud revenue – SaaS/PaaS1) | | Other3) | | 3,625 | | 3,515 | | 2,361 | | 54 | | 49 | |
| | Total | | 6,318 | | 6,100 | | 4,539 | | 39 | | 34 | |
Cloud revenue – IaaS2) | | | | 695 | | 673 | | 488 | | 43 | | 38 | |
Cloud revenue | | | | 7,013 | | 6,773 | | 5,027 | | 40 | | 35 | |
| | Intelligent Spend Group segment | | 78.1 | | 78.0 | | 77.8 | | 0.2pp | | 0.2pp | |
Cloud gross margin – SaaS/PaaS1) (in %) | | Other3) | | 68.4 | | 68.5 | | 60.0 | | 8.4pp | | 8.5pp | |
| | Total | | 72.5 | | 72.5 | | 68.6 | | 4.0pp | | 3.9pp | |
Cloud gross margin – IaaS2) (in %) | | | | 29.1 | | 28.5 | | 12.2 | | 16.9pp | | 16.4pp | |
Cloud gross margin (in %) | | | | 68.2 | | 68.1 | | 63.1 | | 5.1pp | | 5.0pp | |
1) Software as a service/platform as a service
2) Infrastructure as a service
3) Other includes Applications, Technology & Services segment, Qualtrics segment, and miscellaneous. The individual revenue and margin numbers for the Applications, Technology & Services segment and the Qualtrics segment are disclosed on the previous pages.
Financial Income, Net
Financial income, net, changed to €198 million (2018: -€47 million). Our finance income was €787 million (2018: €371 million) and our finance costs were €589 million (2018: €418 million).
Finance income mainly consists of gains from disposal of equity securities and IFRS 9-related fair value adjustments, mainly of Sapphire Ventures investments, totaling €596 million (2018: €227 million), interest income from loans and receivables, and other financial assets (cash, cash equivalents, and current investments) totaling €75 million (2018: €62 million), and income from derivatives totaling €77 million (2018: €77 million).
Finance costs mainly consist of interest expense on financial liabilities amounting to €207 million (2018: €106 million), negative effects from derivatives amounting to €155 million (2018: €206 million), and losses from disposal or IFRS 9-related fair value adjustments of Sapphire Ventures investments totaling €152 million (2018: €45 million). For more information about financing instruments, see the Notes to the Consolidated Financial Statements, Note (E.3).
Income Taxes
The effective tax rate in 2019 was 26.7% (2018: 27.0%). For more information about income taxes, see the Notes to the Consolidated Financial Statements, Note (C.5).
Profit After Tax and Earnings per Share
Profit after tax decreased to €3,370 million in 2019 (2018: €4,088 million).
Profit After Tax
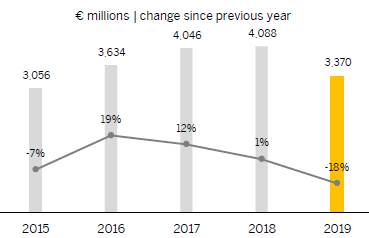
Basic earnings per share decreased to €2.78 (2018: €3.42). The number of shares outstanding remainded constant at 1,194 million in 2019 (2018: 1,194 million).
Financial Performance: Review and Analysis | | 91 |
| | | | |
To Our | Combined Group | Consolidated Financial | Further Information on Economic, | Additional |
Stakeholders | Management Report | Statements IFRS | Environmental, and Social Performance | Information |
Earnings per Share
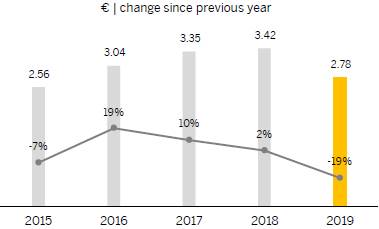
Dividend
We believe our shareholders should benefit appropriately from the profit the Company made in 2019. Our dividend policy is to pay a dividend totaling 40% or more of profit after tax.
The Executive Board and the Supervisory Board of SAP SE will recommend to the Annual General Meeting of Shareholders in May 2020 that the total dividend be increased by 5% to €1.58 per share (2018: €1.50). Based on this recommendation, the overall dividend payout ratio (which here means the total distributed dividend as a percentage of profit) would be 56% (2018: 44%).
If the shareholders approve this recommendation and if treasury shares remain at the 2019 closing level, the total amount distributed in dividends would be €1,886 million. The actual amount distributed may be different from this total because the number of shares held in treasury may change before the Annual General Meeting of Shareholders. In 2019, we distributed €1,790 million in dividends from our 2018 profit after tax.
Besides this, the Company intends to repurchase shares with a volume of €1.5 billion by December 31, 2020.
Dividend per Share
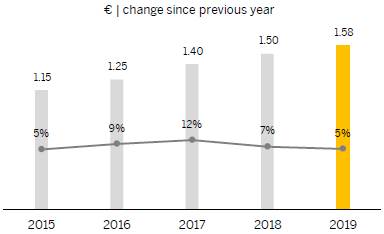
Finances (IFRS)
Overview
Global Financial Management
We use global centralized financial management to control liquid assets and monitor exposure to interest rates and currencies. The primary aim of our financial management is to maintain liquidity in the Group at a level that is adequate to meet our financial obligations at all times. Most SAP entities have their liquidity managed centrally by the Group, so that liquid assets across the Group can be consolidated, monitored, and invested in accordance with Group policy. High levels of liquid assets help keep SAP flexible, sound, and independent. In addition, various credit facilities are currently available for additional liquidity, if required. For more information about these facilities, see the Credit Facilities section.
We manage credit, liquidity, interest rate, equity price, and foreign exchange rate risks on a Group-wide basis. We use selected derivatives exclusively for this purpose and not for speculation, which is defined as entering into a derivative instrument for which we do not have corresponding underlying transactions. The rules for the use of derivatives and other rules and processes concerning the management of financial risks are documented in our treasury guideline, which applies globally to all companies in the Group. For more information about the management of each financial risk and about our risk exposure, see the Notes to the Consolidated Financial Statements, Notes (F.1) and (F.2).
Liquidity Management
Our primary source of cash, cash equivalents, and current investments is funds generated from our business operations. Over the past several years, our principal use of cash has been to support operations and our capital expenditure requirements resulting from our growth, to quickly repay financial debt, to acquire businesses, to pay dividends on our shares, and to buy back SAP shares on the open market. On December 31, 2019, our cash, cash equivalents, and current investments were primarily held in euros and U.S. dollars. We generally invest only in the financial assets of issuers or funds with a minimum credit rating of BBB, and pursue a policy of cautious investment characterized by wide portfolio diversification with a variety of counterparties, predominantly short-term investments, and standard investment instruments. Our investments in financial assets of issuers with a credit rating lower than BBB were not material in 2019.
We believe that our liquid assets combined with our undrawn credit facilities are sufficient to meet our operating financing needs in 2020 and, together with expected cash flows from operations, will support debt repayments, currently planned capital expenditure requirements, and capital returns to our shareholders over the near term and medium term. It may also be necessary to enter into financing transactions when additional funds are required that cannot be wholly sourced from free cash flow, to maintain flexibility, and/or limit repayment risk.
Therefore, we continuously monitor funding options available in the capital markets and trends in the availability of funds, as well as the cost of such funding. In recent years, we were able to repay additional debt within a short period of time due to our persistently strong free cash flow. For more information about the financial debt, see the Cash Flows and Liquidity section.
92 | Financial Performance: Review and Analysis |
To Our | Combined Group | Consolidated Financial | Further Information on Economic, | Additional |
Stakeholders | Management Report | Statements IFRS | Environmental, and Social Performance | Information |
Capital Structure Management
The primary objective of our capital structure management is to maintain a strong financial profile for investor, creditor, and customer confidence, and to support the growth of our business. We seek to maintain a capital structure that will allow us to cover our funding requirements through the capital markets at reasonable conditions, and in so doing, ensure a high level of independence, confidence, and financial flexibility.
For more information about the capital structure and its analysis, see the Analysis of Consolidated Statement of Financial Position section and the Notes to the Consolidated Financial Statements, Note (E.1).
The long-term credit rating for SAP SE is “A2” by Moody’s and “A” by Standard & Poor’s, both with a stable outlook.
The Company intends to repurchase shares with a volume of €1.5 billion by December 31, 2020. The timing and the instruments of capital returns will be determined by SAP based on its evaluation of market conditions, company performance, and other factors.
The enhanced capital return will be in addition to SAP’s regular dividend policy. Further capital returns in subsequent years will be decided on an annual basis in line with SAP’s capital allocation priorities.
Credit Facilities
Other sources of capital are available to us through various credit facilities, if required.
To retain high financial flexibility, we have available a €2.5 billion syndicated revolving credit facility with an end date in November 2024. A possible future utilization is not subject to any financial covenants. Borrowings under the facility bear interest of EURIBOR or LIBOR for the respective currency plus a margin of 0.17%. We are also required to pay a commitment fee of 0.0595% per annum on the unused available credit. So far, we have not used, and do not currently foresee any need to use, this credit facility.
As at December 31, 2019, SAP SE had additional available credit facilities totaling €424 million. Several other SAP entities have credit facilities available that allow them to borrow funds at prevailing interest rates. As at December 31, 2019, approximately €7 million was available through such arrangements. There were immaterial borrowings outstanding under these credit facilities from our foreign subsidiaries as at December 31, 2019.
Resulting from the acquisition of Qualtrics, a term loan of €2.0 billion was still outstanding on December 31, 2019. The amount can be flexibly repaid until maturity of the loan on January 23, 2022.
Financial Performance: Review and Analysis | 93 |
To Our | Combined Group | Consolidated Financial | Further Information on Economic, | Additional |
Stakeholders | Management Report | Statements IFRS | Environmental, and Social Performance | Information |
Financial Debts
Financial debt is defined as the nominal volume of bank loans, commercial papers, private placements, and bonds.
Maturity Profile of Financial Debts

Nominal volume of financial debt on December 31, 2019, included amounts in euros (€12,362 million) and U.S. dollars (€1,297 million). On December 31, 2019, approximately 54% of the financial debt was held at variable interest rates, partially swapped from fixed into variable using interest rate swaps.
For information about the intended repayments, see the goals for liquidity and finance in the Financial Targets and Prospects section.
Financial Debt by Instrument

For more information about our financial debt, see the Notes to the Consolidated Financial Statements, Note (E.3).
94 | Financial Performance: Review and Analysis |
To Our | Combined Group | Consolidated Financial | Further Information on Economic, | Additional |
Stakeholders | Management Report | Statements IFRS | Environmental, and Social Performance | Information |
Cash Flows and Liquidity
2019 Actual Cash Flow and Liquidity Performance Compared to Outlook
We met or exceeded the revised outlook for capital expenditure, share-based payment payouts, and income tax payouts that we published in November 2019. Due to higher payouts, we did not meet our outlook for restructuring payouts, operating cash flow, and free cash flow.
€ billions | Results 2018 | Outlook (as reported in
the Integrated Report) | Revised Outlook (Q2
Quarterly Statement) | Revised
Outlook
(November) | Results
2019 |
Operating cash flows | 4.3 | broadly in line | slightly lower | | 3.5 |
Capital expenditure | –1.5 | unchanged level | –1.2 | –1.0 | –0.8 |
Free cash flow | 2.8 | decrease moderately | decrease moderately | | 2.3 |
Share-based payment payouts | –1.0 | additional 0.3 | additional 0.4 | –1.4 | –1.3 |
Restructuring payouts | –0.1 | additional 0.55 to 0.75 | additional 0.55 to 0.75 | –0.6 to –0.8 | –0.9 |
Income taxes payouts | –1.7 | additional 0.3 | additional 0.6 | –2.2 to –2.4 | –2.3 |
Net debt (–) | –2.5 | | | –8 | –8.3 |
Ratio of net debt divided by operating profit plus depreciation and amortization | 0.4 | | | >1.2 | 1.3 |
Group Liquidity and Net Debt | | | |
€ millions | 2019 | 2018 | D |
Cash and cash equivalents | 5,314 | 8,627 | –3,313 |
Current time deposits and debt securities | 67 | 211 | –144 |
Group liquidity | 5,382 | 8,838 | –3,456 |
Current financial debt | –2,529 | –759 | –1,770 |
Non-current financial debt | –11,139 | –10,572 | –567 |
Financial debt | –13,668 | –11,331 | –2,337 |
Net debt (–) | –8,286 | –2,493 | –5,793 |
Lease liability | –2,203 | NA | |
Net debt including lease liability | –10,489 | NA | |
Group liquidity consists of cash and cash equivalents (for example, cash at banks, money market funds, and time deposits with original maturity of three months or less) and current investments (for example, time deposits and debt securities with original maturities of greater than three months and remaining maturities of less than one year included in other financial assets) as reported in our Consolidated Financial Statements. Group liquidity on December 31, 2019, primarily comprised amounts in euros and U.S. dollars.
The decrease in group liquidity compared to 2018 was mainly due to the cash outflows for the Qualtrics acquisition, while the cash inflow from borrowings for the Qualtrics acquisition already took place in 2018. They were partly offset by cash inflows from our operations.
Net debt is financial debt less group liquidity. For more information about our liquidity, see the Notes to the Consolidated Financial Statements, Note (E.3).
For information about the impact of cash, cash equivalents, current investments, and our financial liabilities on our income statements, see the analysis of our financial income, net, in the Operating Results (IFRS) section.
Financial Performance: Review and Analysis | 95 |
To Our | Combined Group | Consolidated Financial | Further Information on Economic, | Additional |
Stakeholders | Management Report | Statements IFRS | Environmental, and Social Performance | Information |
Development of Net Debt
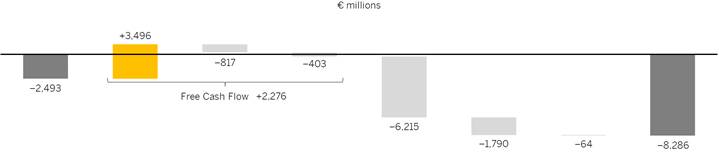
Net
Debt
12/31/2018 | Operating
Cash
Flow | Capital
Expenditure | Lease
Payments | Business
Combinations | Dividends | Other | Net
Debt
12/31/2019 |
| | | | | | | |
PY: –1,479 | +4,303 | –1,458 | +0 | –2,146 | –1,671 | –40 | –2,493 |
Analysis of Consolidated Statements of Cash Flow | | | |
€ millions | 2019 | 2018 | D in % |
Net cash flows from operating activities | 3,496 | 4,303 | –19 |
Net cash flows from investing activities | –7,021 | –3,066 | >100 |
Net cash flows from financing activities | 102 | 3,283 | –97 |
In 2019, cash inflows from operating activities decreased by €807 million to €3,496 million (2018: €4,303 million). This is particularly due to an increase in income tax payments (€2.3 billion in 2019 and €1.7 billion in 2018), higher payments related to restructuring (€0.9 billion in 2019 and €0.1 billion in 2018), and higher share-based payments (€1.3 billion in 2019 and €1.0 billion in 2018). Our days sales outstanding (DSO) for receivables, defined as the average number of days from the raised invoice to cash receipt from the customer, remained flat in 2019 at 71 days (2018: 70 days).
Following the new lease accounting rules (IFRS 16), we had a positive impact on operating cash flow from the reclass of leasing payments into cash flows from financing of €0.4 billion.
Cash outflows from investing activities were €7,021 million in 2019 (2018: €3,066 million). We paid, net of cash received, a total of €6.1 billion for the Qualtrics acquisition in 2019, compared to €2.1 billion in 2018, mainly for Callidus. Instead of investing in the expansion of our data centers, there was a strong focus on improving capacity utilization, resulting in a decrease in capital expenditures on purchases of intangible assets and property, plant, and equipment by €642 million to €817 million. For more information about current and planned capital expenditures, see the Assets section and the Investment Goals section.
Net cash inflows from financing activities were €102 million in 2019, compared to €3,283 million in 2018. In 2019, we drew €2.5 billion of an acquisition term loan for Qualtrics. We refinanced €0.5 billion of the acquisition term loan through the issuance of the same amount under a commercial paper program (Commercial Paper) we launched in September 2019. This program enables SAP SE to issue short-term notes up to €2.5 billion. The cash outflows resulted from repayments of €0.75 billion in Eurobonds when they matured, whereof we refinanced €0.6 billion through Commercial Paper. In 2018, we issued €6.0 billion in Eurobonds financing the acquisition of Callidus and Qualtrics, and a US$0.3 billion USD bond. Cash outflows in 2018 resulted from repayments of €1.15 billion in Eurobonds and US$0.15 billion in U.S. private placements when they matured.
The dividend payment of €1,790 million made in 2019 exceeded the respective amount of €1,671 million paid in the prior year, the dividend paid per share increased from €1.40 to €1.50.
96 | Financial Performance: Review and Analysis |
To Our | Combined Group | Consolidated Financial | Further Information on Economic, | Additional |
Stakeholders | Management Report | Statements IFRS | Environmental, and Social Performance | Information |
Assets (IFRS)
Analysis of Consolidated Statements of Financial Position
Total assets increased by 17% year over year to €60,215 million.
Assets

Total current assets decreased by 8% in 2019 from €16,620 million to €15,213 million. This was mainly due to a decrease in cash and cash equivalents based on cash outflows for the acquisition of Qualtrics, which were partly offset by cash inflows from our operations.
Investment in Goodwill, Intangible Assets, and Property, Plant, and Equipment
Total non-current assets increased by 29% in 2019 to €45,002 million compared to the previous year’s figure of €34,881 million. This change was mainly due to additions to goodwill and intangible assets from the acquisition of Qualtrics, capitalizations following the initial application of IFRS 16, and foreign-exchange-related revaluations.
Liabilities
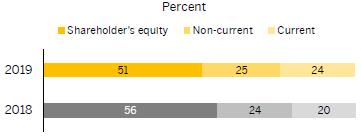
Current liabilities increased by 38% to €14,462 million in 2019 (2018: €10,486 million). This was mainly due to additional provisions out of our share-based payments plans, lease liabilities following the initial application of IFRS 16, as well as changes to our contract liabilities: increases in contract liabilities mainly result from billing and invoices becoming due (€9.0 billion), while decreases in contract liabilities mainly result from satisfying performance obligations (€8.0 billion). Furthermore, we issued commercial papers. For more information about our financing activities in 2019, see the Finances (IFRS) section.
Total non-current liabilities increased by 23% to €14,931 million in 2019 compared to the previous year’s figure of €12,138 million. This was mainly due to additional bank loans to finance the acquisition of Qualtrics. For more information about our financing activities in 2019, see the Finances (IFRS) section.
The equity ratio (that is, the ratio of shareholders’ equity to total assets) decreased to 51% (prior year: 56%).
Equity Ratio

Financial Performance: Review and Analysis | 97 |
To Our | Combined Group | Consolidated Financial | Further Information on Economic, | Additional |
Stakeholders | Management Report | Statements IFRS | Environmental, and Social Performance | Information |
Principal Investments and Divestitures Currently in Progress
In 2019, we finalized various construction projects and continued and started new construction activities in several locations. We plan to finance all of these projects from operating cash flow. Our most important projects are listed below.
Construction Projects
€ millions | | | | | |
Country | Location of Facility | Short Description | Estimated Total
Cost | Costs Incurred as at
12/31/2019 | Estimated
Completion Date |
Germany | Berlin | New office building for approx. 1,000 employees | 40 | 2 | October 2022 |
Germany | Munich | New office building for approx. 600 employees | 90 | 0 | March 2023 |
Brazil | São Leopoldo | New office building for approx. 700 employees | 33 | 2 | March 2021 |
Bulgaria | Sofia | New office building for approx. 1,200 employees | 46 | 1 | October 2022 |
India | Bangalore | New office building for approx. 4,000 employees | 84 | 0 | December 2022 |
US | Seattle | New office building for approx. 1,850 employees | 28 | 1 | July 2020 |
For more information about planned investment expenditures, see the Investment Goals section. There were no material divestitures within the reporting period.
Competitive Intangibles
The resources that are the basis for our current as well as future success do not appear in the Consolidated Financial Statements. This is apparent from a comparison of the market capitalization of SAP SE (based on all issued shares), which was €147.8 billion at the end of 2019 (2018: €106.8 billion), with the book value of our equity in the Consolidated Financial Statements, which was €30.8 billion (2018: €28.9 billion). This means that the market capitalization of our equity is nearly five times higher than the book value. The difference is mainly due to certain internally generated intangible resources that the applicable accounting standards do not allow to be recorded (at all or at fair value) in the Consolidated Financial Statements. They include customer capital (our customer base and customer relations); employees and their knowledge and skills; our ecosystem of partners; internally developed software; our ability to innovate; the brands we have built up, in particular, the SAP brand itself; and our organization.
As at December 31, 2019, SAP was the most valuable company in Germany in terms of market capitalization based on all issued shares.
In 2019, SAP’s brand value increased compared to 2018. According to the Interbrand “Best Global Brands” annual survey, SAP ranked as the 20th most valued brand in the world (2018: 21st). Against other German brands, the SAP brand ranks third behind Mercedes-Benz and BMW, and fourth globally against other brands in the business services sector. Interbrand determined our brand value to be US$25.1 billion, an increase of 10% compared to the previous year (2018: US$22.9 billion). BrandZ even recognized SAP as the world’s 16th most valuable brand in the 2019 BrandZ Top 100 Most Valuable Global Brands ranking. The ranking estimates SAP’s brand value at US$58 billion, an increase of 4% in brand value for SAP year over year.
Report on the Economic Position of SAP SE
SAP SE is headquartered in Walldorf, Germany, and is the parent company of the SAP Group, which comprises 264 companies. SAP SE is the Group holding company and employs most of the Group’s Germany-based development and service and support personnel.
As the owner of the intellectual property in most SAP software, SAP SE derives its revenue mainly from software license fees and bears the Group-wide research and development expenses for the most part.
The SAP SE annual financial statements are prepared in accordance with the reporting standards in the German Commercial Code and the German Stock Corporation Act. The full SAP SE annual financial report and unqualified audit report are submitted to the operator of the Elektronischer Bundesanzeiger (Online German Federal Gazette) for publication and inclusion in the Unternehmensregister (German Business Register). It is available from SAP SE on request.
Income
SAP SE’s income statement is classified following the nature of expense method and presents amounts in millions of euros.
98 | Financial Performance: Review and Analysis |
To Our | Combined Group | Consolidated Financial | Further Information on Economic, | Additional |
Stakeholders | Management Report | Statements IFRS | Environmental, and Social Performance | Information |
SAP SE Income Statement – German Commercial Code (Short Version) | | |
€ millions | 2019 | 2018 |
Total revenue | 15,220 | 14,244 |
Other operating income | 1,028 | 1,073 |
Cost of services and materials | –9,328 | –8,384 |
Personnel expenses | –2,463 | –2,097 |
Depreciation and amortization | –596 | –603 |
Other operating expenses | –2,755 | –2,246 |
Operating profit | 1,107 | 1,987 |
Finance income | 729 | 745 |
Income before taxes | 1,836 | 2,732 |
Income taxes | –492 | –788 |
Income after taxes | 1,343 | 1,943 |
Other taxes | –12 | –13 |
Net income | 1,332 | 1,929 |
The total revenue of SAP SE in 2019 was €15,220 million (2018: €14,244 million), an increase of 7%. Product revenue increased 8% to €12,715 million (2018: €11,768 million). As in previous years, product revenue was primarily generated from license fees paid by subsidiaries of SAP SE.
The milder increase compared to the sales growth of the SAP Group is primarily due to a reduction in the license fees during the year to be paid by the subsidiaries to cloud subscriptions and support. Service revenue decreased 14% to €462 million in 2019 (2018: €534 million), other revenue increased by 5% to €2,043 million (2018: €1,941 million).
SAP SE operating profit decreased 44% to €1,107 million (2018: €1,987 million). Other operating income decreased €43 million to €1,028 million (2018: €1,073 million).
SAP SE cost of services and materials increased 11% to €9,328 million (2018: €8,384 million). Services received increased by €783 million to €7,210 million (2018: €6,427 million), mainly due to increased services received in the context of intra-Group cost allocations. The main contributors to that increase were continued Group-wide investments in research and development activities as well as greater revenue-related and investment-related cloud subscriptions and support costs. The costs for licenses and provisions increased by 8% to €2,090 million (2018: €1,929 million).
SAP SE personnel expenses, mainly the labor cost of software developers, service and support employees, and administration staff employed by SAP SE, increased 17% to €2,463 million (2018: €2,097 million) primarily due to higher shared-based compensation expenses and headcount increase over the year. Other operating expenses increased by €509 million to €2,755 million (2018: €2,246 million). This increase is mainly attributable to a €596 million increase in restructuring costs, a €114 million increase in other services, and a €49 million increase in maintenance and services expense. The increase in other operating expenses is partly offset by a €182 million decrease in write-downs on receivables and a €93 million decrease in exchange rate losses.
Finance income was €729 million (2018: €745 million), representing a year-over-year decrease of €16 million. This decrease is primarily due to a €117 million decrease in income from other securities and loans held as financial assets and a €24 million decrease in income from investments.
The decrease in finance income was partly offset by a €86 million decrease in write-downs on financial assets, a €17 million increase in results from profit and loss transfer agreements, and a €23 million increase in net interest income.
SAP SE income before taxes decreased €896 million to €1,836 million (2018: €2,732 million). Income taxes decreased by €296 million to €492 million (2018: €788 million). After deducting taxes, the resulting net income was €1,332 million (2018: €1,929 million), a decrease of €598 million year over year.
Assets and Financial Position
In 2019, SAP SE total assets closed at €45,043 million (2018: €41,324 million).
SAP SE Balance Sheet as at December 31 – German Commercial Code (Short Version) | | |
€ millions | 2019 | 2018 |
Assets | | |
Intangible assets | 1,751 | 1,999 |
Property, plant, and equipment | 1,512 | 1,495 |
Financial assets | 33,874 | 27,363 |
Fixed assets | 37,136 | 30,857 |
Inventories | 1 | 1 |
Accounts receivable and other assets | 4,913 | 5,016 |
Marketable securities and liquid assets | 465 | 4,909 |
Short-term assets | 5,379 | 9,926 |
Prepaid expenses and deferred charges | 2,157 | 273 |
Deferred taxes | 369 | 266 |
Surplus arising from offsetting | 2 | 2 |
Total assets | 45,043 | 41,324 |
| | |
Equity and liabilities | | |
Shareholders’ equity | 15,993 | 16,452 |
Provisions | 1,968 | 1,711 |
Liabilities | 27,068 | 23,150 |
Deferred income | 14 | 11 |
Total shareholders’ equity and liabilities | 45,043 | 41,324 |
Financial assets increased by €6,511 million year over year to €33,874 million (2018: €27,363 million), mainly due to €6,725 million in capital contributions to subsidiaries, thereof €5,715 million to SAP America Inc. for the Qualtrics acquisition. The increase was partly offset by €155 million in write-downs on investments in affiliated companies.
Financial Performance: Review and Analysis | 99 |
To Our | Combined Group | Consolidated Financial | Further Information on Economic, | Additional |
Stakeholders | Management Report | Statements IFRS | Environmental, and Social Performance | Information |
The decrease of €103 million in accounts receivable and other assets was primarily the result of a €241 million decrease in receivables from affiliated companies and a €37 million decrease in options premiums. The decrease in accounts receivable and other assets was partly offset by an €184 million increase in tax assets.
Marketable securities and liquid assets decreased by €4,444 million to €465 million (2018: €4,909 million). The decrease was mainly due the indirect financing of the Qualtrics acquisition.
The increase in prepaid expenses is mainly due to prepayments of license fees of €1,805 million to subsidiaries for the years 2020, 2021, and 2022.
SAP SE shareholders’ equity decreased 3% to €15,993 million (2018: €16,452 million). Against outflows of €1,790 million associated with the payment of the 2018 dividend, there was a €1,332 million increase due to net income for 2019.
The equity ratio (that is, the ratio of shareholders’ equity to total assets) is 36% (2018: 40%).
Provisions increased by €256 million to €1,968 million (2018: €1,711 million).
Other provisions increased by €325 million to €1,453 million (2018: €1,128 million), primarily as a result of an increase in other obligations toward employees.
In contrast, provisions for tax decreased by €71 million to €504 million (2018: €575 million).
Liabilities increased by €3,918 million to €27,068 million (2018: €23,150 million). This increase mainly resulted from a €3,062 million increase in liabilities to financial institutions and from a €1,519 million increase in liabilities to affiliated companies, primarily due to higher cash contributions by subsidiaries through SAP SE’s centralized management of finance and liquidity. The increase in liabilities was partly offset by the scheduled repayment of a bond in the total amount of €750 million.
Opportunities and Risks
SAP SE is subject to essentially the same opportunities and risks as the SAP Group. For more information, see the Risk Management and Risks section and the Expected Developments and Opportunities section.
100 | Financial Performance: Review and Analysis |
To Our | Combined Group | Consolidated Financial | Further Information on Economic, | Additional |
Stakeholders | Management Report | Statements IFRS | Environmental, and Social Performance | Information |
Corporate Governance Fundamentals
Corporate Governance Statement, Including Corporate Governance Report
The German Commercial Code, section 315d in connection with section 289f, requires that, as a listed company, SAP SE publishes a corporate governance statement either as part of our management report or on our Web site. The Executive Board and the Supervisory Board of SAP SE issued the Corporate Governance Statement, which also includes the Corporate Governance Report, on February 18, 2020, and published it on our public Web site at www.sap.com/corporate-en/investors/governance.
Changes in Management
SAP Executive Board member Bernd Leukert, who had co-led the SAP Digital Business Services organization together with Michael Kleinemeier, left SAP at the end of March 2019. The Supervisory Board extended the Executive Board contract of Michael Kleinemeier through 2020.
In April 2019, the Executive Board member Robert Enslin, who had served as president of the Cloud Business Group, left SAP. Executive Board member Jennifer Morgan succeeded Robert Enslin as president of the Cloud Business Group, and Executive Board member Adaire Fox-Martin took over sole responsibility as president of Global Customer Operations.
On October 10, 2019, Bill McDermott stepped down as SAP’s chief executive officer (CEO). Jennifer Morgan and Christian Klein succeeded as Co-CEOs. Bill McDermott served as Executive Board member until November 15, 2019.
In October 2019, Thomas Saueressig was appointed to the Executive Board effective November 1, 2019. He leads the Board area SAP Product Engineering.
Information Concerning Takeovers
Information required under the German Commercial Code, sections 289a (1) and 315a (1), with an explanatory report:
Composition of share capital: For information about the composition of SAP SE’s share capital as at December 31, 2019, see the Notes to the Consolidated Financial Statements, Note (E.2). Each share entitles the bearer to one vote. American depositary receipts (ADRs) representing our shares are listed on the New York Stock Exchange (NYSE) in the United States. ADRs are certificates representing non-U.S. shares and are traded on U.S. stock exchanges instead of the underlying shares. One SAP ADR corresponds to one SAP share.
Restrictions applying to share voting rights or transfers: SAP shares are not subject to transfer restrictions. SAP held 34,854,354 treasury shares as at December 31, 2019 (see the Notes to the Consolidated Financial Statements, Note (E.2)). Treasury shares do not carry voting rights or dividend rights or other rights. We are not aware of any other restrictions applying to share voting rights or to share transfers.
Shareholdings that exceed 10% of the voting rights: We are not aware of any direct or indirect SAP SE shareholdings that exceed 10% of the voting rights.
Shares with special rights conferring powers of control: No SAP shareholder has special rights conferring powers of control.
Type of control over voting rights applying to employee shareholders who do not directly exercise their control rights: As with other shareholders, employee holders of SAP shares exercise their control rights in accordance with the law and the Articles of Incorporation. In votes on the formal approval of their acts at the Annual General Meeting of Shareholders, employee representatives on the Supervisory Board, as all other members of the Supervisory Board, are prohibited from exercising the voting rights associated with their shares.
Requirements concerning appointments and dismissals of members of the Executive Board and amendments to the Articles of Incorporation: Conditions for the appointment and dismissal of members of the Executive Board and amendment to the Articles of Incorporation reflect the relevant provisions of applicable European and German law, including Council Regulation (EC) No. 2157/2001 on the Statute for a European Company (“SE Regulation”) and the German Stock Corporation Act. Under the Articles of Incorporation, the Executive Board consists of at least two members, who are appointed for a period of not more than five years by the Supervisory Board in accordance with the SE Regulation, articles 39 and 46. The number of members of the Executive Board is decided by the Supervisory Board. Executive Board members may be reappointed for, or their term of office extended by, a maximum of five years. A simple majority of the Supervisory Board membership is required for Executive Board appointments. In the event of a tie, the chairperson of the Supervisory Board has the deciding vote. The Supervisory Board can appoint a chairperson of the Executive Board and one or more deputy chairpersons from among the members of the Executive Board. The Supervisory Board can revoke appointments to the Executive Board in accordance with the SE Regulation, article 9, and the German Stock Corporation Act, section 84, if compelling reasons exist, such as gross negligence on the part of the Executive Board member. If the Executive Board is short of a required member, one may be appointed in urgent cases by a court in accordance with the SE Regulation, article 9, and the German Stock Corporation Act, section 85. In accordance with the SE Regulation, article 59, and the German Stock Corporation Act, section 179, an amendment of the Articles of Incorporation requires a resolution of the General Meeting of Shareholders with a majority of at least three-quarters of the valid votes cast. For any amendments of the Articles of Incorporation that require a simple majority for stock corporations established under German law, however, the simple majority of the valid votes cast is sufficient if at least half of the subscribed capital is represented or, in the absence of such quorum, the majority prescribed by law (that is, two-thirds of the votes cast, pursuant to article 59 of the SE Regulation) is sufficient. Section 11 (2) of the Articles of Incorporation authorizes the Supervisory Board to amend the Articles of Incorporation where such amendments only concern the wording.
Corporate Governance Fundamentals | 101 |
To Our | Combined Group | Consolidated Financial | Further Information on Economic, | Additional |
Stakeholders | Management Report | Statements IFRS | Environmental, and Social Performance | Information |
Power to issue and repurchase shares: The Annual General Meeting of Shareholders on May 12, 2016, granted powers to the Executive Board, subject to the consent of the Supervisory Board, to issue convertible and/or warrant-linked bonds, profit-sharing rights and/or income bonds (or combinations of these instruments), and to grant conversion or option rights in respect of SAP SE shares representing a total attributable portion of the share capital of not more than €100 million secured by a corresponding amount of contingent capital. These powers will expire on May 11, 2021. The Executive Board is also authorized until May 19, 2020, to increase the share capital by not more than €250 million by issuing new shares against contributions in cash and to increase the share capital by not more than €250 million by issuing new shares against contributions in cash or in kind. For more information about the different tranches of authorized capital and the aforementioned contingent capital, see the Articles of Incorporation, section 4.
The Annual General Meeting of Shareholders on May 17, 2018, granted a power to the Executive Board in accordance with the German Stock Corporation Act, section 71 (1)(8), to buy back for treasury on or before May 16, 2023, SAP SE shares attributable in total to not more than €120 million of the share capital. This power is subject to the proviso that the shares repurchased, together with any shares that were previously acquired and are still held by SAP in treasury and any other shares controlled by SAP, must not in total exceed 10% of SAP’s share capital. Executive Board powers, such as those described to issue and repurchase stock and to grant rights of conversion and subscription to shares of SAP, are widely-followed common practice among German companies such as SAP. These powers give the Executive Board the flexibility it needs, in particular, the option to use SAP shares as consideration in equity investments, raise funds on the financial markets at short notice on favorable terms, or return value to shareholders during the course of the year.
Material agreements with change-of control-provisions: SAP SE has concluded the following material agreements with provisions that take effect in the event of a change of control, whether following a takeover bid or otherwise:
The terms of SAP’s syndicated €2.5 billion revolving credit facility include a change-of-control clause. For more information about this syndicated credit facility, see the Notes to the Consolidated Financial Statements, Note (F.1). This clause obliges SAP SE to notify the banks in case of a change of control. If, on receiving the notification, banks that represent at least two-thirds of the credit volume so require, the banks have the right to cancel the credit facility and demand complete repayment of the outstanding debt. If no continuation agreement is reached, the credit facility would end and the obligation to repay would become effective at an ascertainable time.
To finance the acquisition of Qualtrics International Inc., SAP took out a loan of €2.5 billion. The loan agreement contains a change-of-control clause which obliges SAP SE to notify the banks in case of a change of control. If, on receiving the notification, banks that represent at least two-thirds of the credit volume so require, the banks have the right to terminate the loan and demand complete repayment of the outstanding debt. If no continuation agreement is reached, the termination of the loan and the obligation to repay would become effective at an ascertainable time.
SAP had bonds totaling €9.25 billion and US$0.3 billion outstanding as at December 31, 2019. For more information about SAP’s bonds, see the Notes to the Consolidated Financial Statements, Note ( E.3). Under the terms agreed with the buyers, we are required to notify the buyers, without delay, of any change of control. If there is a change of control and SAP is consequently assigned a lower credit rating within a defined period, buyers are entitled to demand repayment.
Under the terms of our U.S. private placements totaling approximately US$1.16 billion as at December 31, 2019, we are required to offer lenders repayment of outstanding debt if there is a change of control and SAP is consequently assigned a lower credit rating within a defined period. For more information about these private placements, see the Notes to the Consolidated Financial Statements, Note (E.3). Lenders would have at least 30 days to accept the offer.
We have entered into relationships with other companies to jointly develop and market new software products. These relationships are governed by development and marketing agreements with the respective companies. Some of the agreements include provisions that, in the event of a change of control over one of the parties, give the other party a right to consent to the assignment of the agreement or to terminate it.
Change-of-control provisions in Executive Board compensation agreements: Agreements have been concluded with the members of the Executive Board concerning compensation in the event of a change of control. These agreements, which are customary in Germany and elsewhere, are described in the compensation report, which is an integral part of this management report. We have no analogous compensation agreements with our other employees.
102 | Corporate Governance Fundamentals |
To Our | Combined Group | Consolidated Financial | Further Information on Economic, | Additional |
Stakeholders | Management Report | Statements IFRS | Environmental, and Social Performance | Information |
Business Conduct
Championing Excellence in Business Conduct
In an increasingly complex business environment, making the right decisions and abiding by ethical choices has never been more challenging. As a company operating in numerous countries across the globe, SAP is required to adhere to strict international legislation that defines acceptable and ethical business conduct and practices.
At SAP, we understand that our customers expect our business practices to not only meet international rules and legal requirements, but also to adhere to high standards of compliance and integrity.
SAP’s reputation for doing business the right way is one of our most important assets. It is synonymous with quality, innovation, and excellence.
In 2019, the Office of Ethics and Compliance (OEC), formerly the Legal Compliance and Integrity Office (LC&IO), grew from 80 to 113 employees as it continued its efforts to raise the awareness of compliance and to ensure the practice of compliant and ethical behavior throughout SAP.
Nurturing an Environment in Which Integrity and Ethics Dominate
SAP expects compliance to permeate the entire company. Compliant behavior is expected to be an intrinsic part of our culture and an instinctive part of our daily decision-making at every level of the business. To help nurture this environment in which integrity and ethics dominate, we continually address compliance issues and strive to improve policies, guidelines, instruments, and measures related to their implementation.
Our internal compliance management system, for example, is part of the internal audit plan of Corporate Audit and encompasses all aspects of compliance management – from the analysis of compliance risks and the definition of objectives to the running of compliance programs as well as ongoing monitoring of business activities and adherence to policies.
Our Code of Business Conduct (CoBC) is communicated to employees globally and contains a fundamental set of rules that define how we conduct our business and require high levels of integrity and ethics. While we acknowledge that it is not possible to eliminate the potential for non-compliant behavior entirely, the CoBC remains one of our most important compliance documents and sets the standard for our dealings with customers, partners, competitors, and vendors, and each of our employees is bound by it. The CoBC is adapted locally and translated into local languages where required.
The key areas covered by the CoBC include:
– Prohibition of bribery and corruption in all its forms, including facilitation or “grease payments”
– Gifts and business entertainment limits
– Full, fair, and accurate accounting
– Conflicts of interest
– Confidentiality
– Anti-competitive practices
– Data protection and privacy rights
SAP also has established policies to maintain high standards within the following areas:
– Regulation of the appointment and remuneration of sales agents
– Charitable and political donations
– Intellectual property
– Accounting and financial reporting
– Export control and sanctions laws
– Data protection and privacy
– Sustainability
We also expect our partners and suppliers to commit to meeting our high standards of integrity and sustainability. For this reason, we have the SAP Partner Code of Conduct and the SAP Supplier Code of Conduct in place so that partners and suppliers understand what is expected of them.
Providing Comprehensive Training
SAP provides its employees with training to ensure that they are aware of the standards SAP expects. Our training programs cover, for example, guidelines on anticorruption, competition law, and governance for customer commitments, intellectual property, and information security.
In 2019, the OEC rolled out the “Five Pillars of Compliance” training to all employees. This online training was mandatory wherever legally permissible, and in those jurisdictions a completion rate of over 90% was achieved across all Executive Board areas. The training included modules on: bribery and corruption, conflict of interest, competition, channel and fair business conduct, partner engagement, and hospitality. A total of 54,857 employees had completed the training modules by November 2019.
Mandatory online certification on the CoBC for employees worldwide continued in 2019. We recorded that more than 72,000 employees received this certification during the certification cycle. This number includes 26,475 employees in the Americas region, 25,283 employees in the APJ region, and 20,295 employees in the EMEA region.
Field compliance officers at the OEC continued to hold classroom training sessions for employees across the organization – from customer-facing staff to individuals in supporting roles, such as corporate affairs and marketing. Furthermore, information about our compliance policies is included in onboarding sessions.
Communicating Our Standards
Quarterly newsletters provide employees with information on a range of compliance-related topics. We include a business ethics and compliance-related question in our annual engagement survey and in company-wide polls throughout the year. Employees can use the corporate portal at any time to access all global policies, guidelines, and additional information. In 2019, a compliance mobile app was also launched to provide mobile access to company
To Our | Combined Group | Consolidated Financial | Further Information on Economic, | Additional |
Stakeholders | Management Report | Statements IFRS | Environmental, and Social Performance | Information |
policies, compliance messaging, and a directory of field compliance officers.
We introduced a second cohort to our Executive Compliance Ambassador Program. We now have 119 executives, from all Board areas, who have taken on the role of championing compliance messaging and raising awareness of compliance throughout the company and the business. Program members can access a specific intranet site tailored to the ambassador role. This site encourages the exchange of information and networking and keeps the compliance community alive.
Assessing Compliance Risk
At SAP, we acknowledge that compliance risks exist in the business environments and countries in which we operate. We review the exposure of SAP business units to potential compliance risks on a regular basis. In 2019, we analyzed quantitative internal data such as number of employees, revenue information (including percentage of public sector business), number of compliance-related allegations and audits with compliance-relevant findings, and other quantitative information. In addition, we considered external information, such as the Transparency International Corruption Perceptions Index, in our wider compliance risk analysis.
Based on this information, we performed a detailed assessment for all SAP relevant high-risk countries and derived local as well as global mitigations. For more information, see the Risk Management and Risks section.
Enforcing Policies
SAP is committed to ensuring that compliance policies are strictly enforced, and that any infringements are quickly flagged and put right. To achieve this, we have a wide global network of compliance officers who act as business conduct stewards.
The OEC oversees the development and implementation of our CoBC, as well as other related policies and our anticorruption compliance program. Our compliance officers are based not only at SAP headquarters but also around the world, in high-risk and low risk jurisdictions, and especially in markets where there are local language needs.
In addition to making regular reports to our CFO, the Group chief compliance officer reports to the Audit Committee of the Supervisory Board each quarter and to the Executive Board annually. Matters of significance are brought to the attention of the Executive Board and the Audit Committee of the Supervisory Board immediately. As of 2020, the Group chief compliance officer will report directly to our Co-CEO Jennifer Morgan.
Facilitating Reporting and Remediation Without Retaliation
Employees at all levels of the organization must disclose conflicts of interest. Disclosures are followed up with guidance or mitigation if necessary.
If employees are concerned that our CoBC has been breached, or if they need advice on a compliance issue, they can access support in several ways. It sometimes takes courage to speak up when something is not right, and employees may feel uncomfortable or concerned when they do so. However, we guarantee a non-retaliation policy if employees reach out and raise their concerns.
SAP employees have different options if they become aware of potential misconduct within the company. For example, they can:
– Call our governance helpline at +49 6227 7-40022
– E-mail the Office of Ethics and Compliance at global-compliance-office@sap.com
– Contact local compliance officers by e-mail or telephone
– Use the anonymous online Whistleblower reporting tool Reporting channels are published in SAP Corporate Portal, on SAP.com, and in our codes of conduct for partners and suppliers.
Investigating Misconduct
SAP has received communications and whistleblower information alleging conduct that may violate antibribery laws. The OEC is conducting investigations with the assistance of an external law firm and has voluntarily advised the U.S. Securities and Exchange Commission and the U.S. Department of Justice, as well as local authorities where potential violations are being investigated.
Since 2018, SAP implemented substantial enhancements to its anti-corruption compliance program, including additional policy changes and more robust internal controls. SAP has appointed new management in some business units to address corruption concerns. SAP prohibits the use of commissioned business development partners as well as certain sales commission agents in public sector deals in high-risk markets and continues a systematic review of all relationships with state-owned entities and institutions in Africa.
Furthermore, we are investigating allegations regarding conduct that certain independent SAP partners violated SAP contractual terms and sold SAP products and services in embargoed countries. We are also investigating allegations regarding direct transactions between SAP and certain customers that may have engaged in unauthorized activities in embargoed countries.
SAP has taken remedial actions to terminate access to SAP products and services for certain end users and block additional business activities with these end users through SAP or SAP partners. SAP is implementing further enhancements to its export control compliance program, including new internal controls, and has been increasing the capacity of SAP’s Export Control team with a particular focus on high-risk countries. SAP has also required additional due diligence, conducted by independent third-parties, for certain SAP partners based in high-risk regions. We are fully committed to compliance with all U.S., EU, and German laws regarding economic sanctions and export controls, including laws restricting the sale, export, and usage of SAP software and services in Iran and in other embargoed countries.
For more information about the allegations, see Note (G.3).
 Audit Scope
The content of this section was not subject to the statutory audit of the combined group management report. However, our external auditor KPMG carried out an independent limited assurance engagement on the contents of this section.
To Our | Combined Group | Consolidated Financial | Further Information on Economic, | Additional |
Stakeholders | Management Report | Statements IFRS | Environmental, and Social Performance | Information |
Risk Management and Risks
Our Risk Management
Internal Control and Risk Management System
As a global company, SAP is exposed to a broad range of risks across our business operations. Consequently, our Executive Board has established comprehensive internal control and risk management structures that enable us to identify and analyze risks early and take appropriate action. Our risk management and internal control system is designed to identify potential events that could negatively impact the Company and to provide reasonable assurance regarding the operating effectiveness of our internal controls over our financial reporting.
This system comprises numerous control mechanisms and is an important element of our corporate decision-making process; it is therefore implemented across the entire Group as an integral part of SAP’s business processes. We have adopted an integrated risk management and internal control approach to help maintain effective global risk management while also enabling us to aggregate risks and report on them transparently.
In addition, we have a governance model in place across risk management and the internal control system to ensure both systems are effective, as well as a central software solution to store, maintain, and report all risk-relevant information.
Legal and Regulatory Requirements
Due to our public listings in both Germany and the United States, we are subject to both German and U.S. regulatory requirements that relate to risk management and internal controls over financial reporting, such as provisions in the German Stock Corporation Act, section 91 (2), and the U.S. Sarbanes-Oxley Act (SOX) of 2002, specifically sections 302 and 404. Hence, our Executive Board has established an early warning system (risk management system) to enable compliance with applicable regulations.
Risk Management Policy and Framework
The risk management policy issued by our Executive Board governs how we handle risk in line with the Company’s risk appetite and defines a methodology that is applied uniformly across all parts of the Group. Our global corporate audit function conducts periodical audits to assess the effectiveness of our risk management system. Every year, SAP’s external auditor assesses whether the SAP SE early risk identification system is adequate to identify risks that might endanger our ability to continue as a going concern.
Risk Management Pillars
Our risk management system is based on the framework published by the Committee of Sponsoring Organizations of the Treadway Commission (COSO) entitled “Enterprise Risk Management – Integrating with Strategy and Performance.” Updated in 2017, this framework is built on four pillars, which include a global risk management governance framework, a dedicated risk management policy, a global risk management organization, and a standardized risk management methodology,
In accordance with the COSO framework, SAP’s enterprise risk management covers risks in the areas of strategy, operations, finance, and compliance.
Our Global Risk Management Governance Framework
The risk management governance framework at SAP represents a comprehensive system of approaches and processes to ensure control through a clearly structured risk management system and a supporting risk culture. The risk culture is considered the basis of SAP’s risk management system. Risk culture at SAP comprises a system of values, beliefs, knowledge, attitudes, and understanding concerning risks and risk management as part of our corporate culture. To support and continuously foster SAP’s risk culture, our Global Governance, Risk and Compliance (GRC) organization conducts comprehensive risk awareness activities for the organization.
Our Executive Board is responsible for ensuring the effectiveness of the risk management system and the internal control system. The effectiveness of both systems and their implementation in the different Executive Board areas is monitored by each board member. Global GRC regularly provides a status update on the risk management and the internal control system to the Audit Committee of the Supervisory Board. The Audit Committee of the Supervisory Board regularly monitors the effectiveness of SAP’s risk management and internal control systems. At the direction of this Committee, the Corporate Audit department periodically audits various aspects of our risk management system and its effectiveness. Additional reassurance is obtained through the external audit of the effectiveness of our system of internal controls over financial reporting and the early warning system.
Our Global Risk Management Policy
The risk management policy, updated in 2019, stipulates responsibilities for conducting risk management activities and defines reporting and monitoring structures. Our global SAP risk management policy clearly states that every employee is responsible for active engagement in the risk management process as well as for the continuous identification of risks, based upon clear rules of engagement in adherence to the policy. Along with the policy, we maintain a system-based Risk Management Policy Cockpit that describes all business process specifics associated with the risk management lifecycle. The risk management system primarily analyzes risks. Opportunities are only assessed or analyzed where it is deemed appropriate.
Our Global Risk Management Organization
Our global risk management organization is responsible for the implementation of a group-wide effective risk management system. Furthermore, Global GRC is responsible for the regular maintenance
Risk Management and Risks | 105 |
To Our | Combined Group | Consolidated Financial | Further Information on Economic, | Additional |
Stakeholders | Management Report | Statements IFRS | Environmental, and Social Performance | Information |
and implementation of our risk management policy as well as the standardized internal and external risk reporting.
All GRC risk managers, working with assigned risk contacts in the relevant business units, identify and assess risks associated with material business operations using a uniform approach, and monitor the implementation and effectiveness of the measures chosen to mitigate risks.
Further financial risk management activities are performed by our Global Treasury and our Global Tax departments. General legal risks are managed by Global Legal. Sanction and embargo-related risks are managed by the Export Control team, harassment and other HR-related issues by our Global Labor & Employee Relations Office, and IP risks by our Global IP Office.
During the merger and acquisition and post-merger integration phase, newly acquired companies are subject to risk management performed by our Corporate Development M&A function. Furthermore, for as long as the newly acquired companies are not integrated, existing risk management structures are maintained or enhanced within the acquired companies for the purposes of compliance with legal requirements.
The head of Global GRC, who reports to our Group CFO, is responsible for SAP’s internal control and risk management program.
Risk Management Methodology and Reporting
The illustration on the right describes the key elements of the risk management process under SAP’s risk management policy.
Risk Planning
Based on SAP’s risk management policy and framework, the risk planning phase serves to align on the definition and assignment of roles and responsibilities, the definition of risk-relevant business activities (such as processes, projects or other aspects affecting Company assets), the determination of objectives and value drivers, the planning of risk assessments, and the determination of adequate information flow.
Risk planning and risk identification for internal and external risks are conducted jointly by GRC risk managers and the relevant business units or SAP entities.
Risk Assessment
A risk assessment covers the identification and analysis of a risk, as well as the determination of a response to that risk. We use various approaches to identify risks. For example, we have identified risk indicators and have developed a comprehensive risk catalog that includes risk mitigation strategies. Risk identification takes place at various levels of our organization to ensure that common risk trends are identified and end-to-end risk management across organizational borders is enabled. We apply both qualitative and quantitative risk analyses and other risk analysis methods such as sensitivity analyses and simulation techniques.
To determine which risks pose the greatest threat to the viability of the SAP Group, we classify them as “high,” “medium,” or “low” based on the likelihood that a risk will occur within the assessment horizon and the impact the risk would have on SAP’s business objectives if it were to occur. The scales for measuring these two indicators are given in the following tables.
Probability/Likelihood of Occurrence | Description |
1% to 19% | Remote |
20% to 39% | Unlikely |
40% to 59% | Likely |
60% to 79% | Highly Likely |
80% to 99% | Near Certainty |
In this framework, we define a remote risk as one that will occur only under exceptional circumstances, and a near certain risk as one that can be expected to occur within the specified time horizon. The period for analyzing our risks correlates with that of the respective associated business activities, considering a relevant forecast horizon of up to one year, and up to 2023 where applicable. The period for analyzing risks that could be possible threats to the Group’s ability to continue as a going concern is eight rolling quarters.

Impact Level | Impact Definition |
Insignificant | Negligible negative impact on business, financial position, profit, and cash flows |
Minor | Limited negative impact on business, financial position, profit, and cash flows |
Moderate | Some potential negative impact on business, financial position, profit, and cash flows |
Major | Considerable negative impact on business, financial position, profit, and cash flows |
Business-Critical | Detrimental negative impact on business, financial position, profit, and cash flows |
106 | Risk Management and Risks |
To Our | Combined Group | Consolidated Financial | Further Information on Economic, | Additional |
Stakeholders | Management Report | Statements IFRS | Environmental, and Social Performance | Information |
The combination of the likelihood that a risk will occur and its impact on SAP’s reputation, business, financial position, profit, and cash flow leads to a subsequent classification of the risk as either “high,” “medium,” or “low.”

| | Insignificant | Minor | Moderate | Major | Business-Critical |
80% to 99% | L | M | H | H | H |
60% to 79% | L | M | M | H | H |
40% to 59% | L | L | M | M | H |
| 20% to 39% | L | L | L | M | M |
| 1% to 19% | L | L | L | L | M |
| | | Impact | | |
| | L = Low Risk | | M = Medium Risk | | H = High Risk |
In the final stage of the risk assessment, after identifying and analyzing the risk, we determine a response for each identified risk. We have different response categories such as mitigating, retaining for research, transferring, delegating, accepting, or avoiding, for example by deciding not to start or not to continue the activity that may lead to a risk.
Risk Validation and Monitoring
Risk assessment is followed by risk validation and risk monitoring. The risk exposure and the risk description, as well as the appropriateness of agreed responses, are validated by the accountable management. Our GRC risk managers work in close cooperation with the relevant business owners, ensuring that strategies are implemented to address risks. Business owners are responsible for continuously monitoring the risks and associated mitigation strategies, with support from the respective GRC risk managers. Risks might be reduced by taking active steps based on risk approval. To provide greater risk transparency and enable appropriate decision-making for business owners, we have established a risk delegation of authority (RDOA) for relevant parts of the organization as deemed appropriate. RDOA is a risk management decision-making hierarchy that helps business owners gain timely insight into business transactions that pose the greatest risk, so that they are better able to review the relevant information, understand the risk profile and associated mitigation strategies, and determine whether their approval is warranted. Depending on the exposure, approval is required at different levels of the Company, up to and including the Executive Board.
Risk Reporting
All identified and relevant risks are reported at the local, regional, and global levels in accordance with our risk management policy and the risk reporting standard. At these levels, we have established executive risk councils that regularly discuss risks and countermeasures and that monitor the success of risk mitigation. In addition, the Executive Board is informed regularly and quarterly about individual risks based on clearly defined qualitative reporting criteria. Newly identified or existing significant risks that are above a defined threshold, meet a qualitative criterion, or have a potential significant impact are also reported to the Audit Committee and the chairperson of the Supervisory Board on a quarterly basis. This includes risks along our strategic portfolio for services and solutions as well as any risks to our ability to continue as a going concern, the latter supported by a process that analyzes those risks with respect to potential effects on liquidity, excessive indebtedness, and insolvency.
Internal Control and Risk Management System for Financial Reporting
The purpose of our system of internal control over financial reporting is to provide reasonable assurance that our financial reporting is reliable and compliant with generally accepted accounting principles. Because of the inherent limitations of internal control over financial reporting, it might not prevent or bring to light all potential misstatements in our financial statements.
Our internal control system consists of the internal control and risk management system for financial reporting (ICRMSFR), which also covers the broader business environment. In 2019, we adjusted existing control designs to adequately address the evolving risks and we continued to automate our internal control landscape. Using the current COSO Internal Control – Integrated Framework of 2013, we have defined and implemented internal controls along the value chain on a process and subprocess level to ensure that sound business objectives are set in line with the organization’s strategic, operational, financial, and compliance goals.
SAP’s ICRMSFR is based on our Group-wide risk management methodology. It includes organizational, control, and monitoring structures designed to ensure that data and information concerning our business is collected, compiled, and analyzed in accordance with applicable laws and properly reflected in our IFRS Consolidated Financial Statements.
Our ICRMSFR also includes policies, procedures, and measures designed to ensure compliance of SAP’s financial reports with applicable laws and standards. We analyze new statutes, standards, and other pronouncements concerning IFRS accounting and its impact on our financial statements and the ICRMSFR. Failure to adhere to these would present a substantial risk to the compliance of our financial reporting. Finally, the ICRMSFR has both preventive and detective controls, including, for example, automated and non-automated reconciliations, segregated duties with two-person responsibility, authorization concepts in our software systems, and corresponding monitoring measures.
Our Corporate Financial Reporting (CFR) department codifies all accounting policies in our Group accounting and global revenue recognition guidelines. These policies and the corporate closing schedule, together with our process descriptions, define the closing
Risk Management and Risks | 107 |
To Our | Combined Group | Consolidated Financial | Further Information on Economic, | Additional |
Stakeholders | Management Report | Statements IFRS | Environmental, and Social Performance | Information |
process. Under this closing process, we prepare, predominately through centralized or external services, the financial statements of all SAP entities for consolidation by CFR. CFR and other corporate departments are responsible for ensuring compliance with Group accounting policies and monitor the accounting work. CFR also conducts reviews of our accounting processes and books. The employees who work on SAP’s financial reporting receive training in the respective policies and processes.
We have outsourced some tasks, such as valuing projected benefit obligations and share-based payouts, quarterly tax calculations for most entities, and purchase price allocations in the context of asset acquisitions and business combinations. We have also outsourced the preparation of the local statutory financial statements for a number of our subsidiaries.
Based on an analysis of the design and operating effectiveness of our respective internal controls over financial reporting, a committee presents the results of the assessment on the ICRMSFR effectiveness with respect to our IFRS consolidated financial statements as at December 31 each year to our Group CFO. The committee meets regularly to set the annual scope for the test of effectiveness, to assess and evaluate any possible weaknesses in the controls, and to determine measures to address them timely and adequately. During its own meetings, the Audit Committee of the Supervisory Board regularly scrutinizes the resulting assessments of the effectiveness of the internal controls over financial reporting with respect to the IFRS consolidated financial statements.
The assessment, conducted by SAP and external audit, of the effectiveness of the ICRMSFR related to our IFRS consolidated financial statements concludes that, on December 31, 2019, the Group had an effective internal control system over financial reporting in place.
Additionally, and in compliance with German commercial law requirements, SAP maintains an internal control system beyond financial reporting. This is supported through automated controls (continuous control monitoring) as part of our business processes.
Supporting Software Solution
We use our own risk management software, SAP solutions for GRC powered by SAP HANA, to support the governance process. GRC risk managers record and track identified risks using our risk management software online and in real time to help create transparency across all known risks that exist in the Group, as well as to facilitate risk management and the associated risk reporting. This GRC solution also supports the risk-based approach of the ICRMSFR. Our continuous controls monitoring activities are performed utilizing our GRC software as well. This information is available to managers through direct access to our SAP Fiori application for enterprise risk reporting, and in regularly issued reports, and is consolidated and aggregated for the quarterly risk report to the Executive Board. We also utilize the SAP Digital Boardroom solution to share relevant risk information with the Executive Board and the Audit Committee of the Supervisory Board.
Risk Factors
The following sections outline our risk categories and risk factors that we have identified and continuously track.
An overview of the risk categories and the corresponding risk factors is outlined in the table below. Therein, risk factors are categorized according to our framework which is detailed in the Risk Management Methodology and Reporting section.
108 | Combined Group Management Report |
To Our | Combined Group | Consolidated Financial | Further Information on Economic, | Additional |
Stakeholders | Management Report | Statements IFRS | Environmental, and Social Performance | Information |
Overview of Risk Factors (Aggregated Statement for 2019)
| Probability | Impact | Risk Level | Trend1) |
Economic, Political, Social, and Regulatory Risks | | | | |
Global Economic and Political Environment | likely | business-critical | high | 
|
International Laws and Regulations | likely | business-critical | high |
|
Legal and IP | likely | business-critical | high |
|
Data Protection and Privacy | likely | business-critical | high |
|
Corporate Governance and Compliance Risks | | | | |
Unauthorized Disclosure of Information | remote | business-critical | medium |
|
Ethical Behavior | likely | business-critical | high |
|
Environment and Sustainability | unlikely | moderate | low |
|
Financial Risks | | | | |
Sales and Revenue Conditions | unlikely | moderate | low |
|
Liquidity | remote | major | low |
|
Use of Accounting Policies and Judgment | unlikely | moderate | low |
|
Currency, Interest Rate, and Share Price Fluctuations | remote | major | low |
|
Insurance | remote | business-critical | medium |
|
Venture Capital | remote | minor | low |
|
Human Capital Risks | | | | |
Human Workforce | unlikely | major | medium |
|
Operational Business Risks | | | | |
Sales and Services | unlikely | major | medium |
|
Partner Ecosystem | unlikely | major | medium |
|
Cloud Operations | unlikely | business-critical | medium |
|
Cybersecurity and Security | highly likely | business-critical | high | 
|
Technology and Products | unlikely | business-critical | medium |
|
Strategic Risks | | | | |
Market Share and Profit | unlikely | business-critical | medium |
|
Mergers and Acquisitions | likely | major | medium |
|
Innovation | remote | business-critical | medium |
|
| | Icon: | decreased | 
|
| | | unchanged | 
|
| | | increased | 
|
| | | | |
1) Trend: Risk level compared with previous year. | | | | |
Risk Management and Risks | 109 |
To Our | Combined Group | Consolidated Financial | Further Information on Economic, | Additional |
Stakeholders | Management Report | Statements IFRS | Environmental, and Social Performance | Information |
Economic, Political, Social, and Regulatory Risks
Global Economic and Political Environment: Uncertainty in the global economy, financial markets, social and political instability caused by state-based conflicts, terrorist attacks, civil unrest, war, or international hostilities could lead to disruptions of our business operations or have a negative impact on our business, financial position, profit, and cash flows.
As a global company, we are influenced by multiple external factors that are difficult to predict and beyond our influence and control. Any of these factors could have a significant adverse effect on the overall economy as well as on our business.
The following potential events, among others, could bring risks to SAP’s business:
– General economic, political, social, environmental, market conditions, and unrest (for example, United States–China supply chain restrictions, United States–North Korea conflicts, western pressure on Iran, UK/Brexit, unrest in Hong Kong, and so on)
– Continued deterioration in global economic conditions (impact on accurate forecast) or budgetary constraints of national governments
– Confrontations, frictions, trade or tariff conflicts such as that between the United States and China, with potential global implications as indicated by signs of a widespread economic slowdown, maybe even leading to a recession
– Financial market volatility episodes, global economic crises and chronic fiscal imbalances, slowing economic conditions, or disruptions in emerging markets
– Higher credit barriers for customers, reducing their ability to finance software purchases
– Increased number of bankruptcies among customers, business partners, and key suppliers
– Terrorist attacks or other acts of violence, civil unrest, natural disasters, or pandemic diseases impacting our business
– Regional conflicts, which may affect data centers as critical infrastructure assets
Any of these events could limit our ability to reach our targets as they could have a negative effect on our business operations, financial position, profit, and cash flows.
SAP has established measures to address and mitigate the described risks and adverse effects, such as:
– Further efforts to achieve our vison of a purpose-led company by transforming our and our customers’ business processes with intelligent technologies (SAP Leonardo) for the intelligent enterprise
– Ongoing shift to a higher share of cloud subscriptions and software support revenue streams, which will lead to more predictable revenue streams over time, providing increased stability against financial volatility
– Internal cost discipline and a conservative financial planning
– Reshaping of our organizational structure and processes to increase efficiency
– Monitoring and evaluation of global and political developments supported by our government relations unit to share insights and provide guidance to allow for proactive preparation
We cannot exclude the possibility that if the risk were to occur, it could have a business-critical impact on our operations, financial position, profit, and cash flows. We estimate the probability of occurrence of this risk to be likely. This could exacerbate the other risks we describe in this report or cause a negative deviation from our revenue and operating profit target. We classify this risk as a high risk.
International Laws and Regulations: Laws, regulatory requirements and standards in Germany, the United States, and elsewhere continue to be very stringent. Our international business activities and processes expose us to numerous and often conflicting laws and regulations, policies, standards, or other requirements and sometimes even conflicting regulatory requirements, and to risks that could harm our business, financial position, profit, and cash flows.
We are a global company and currently market our products and services in more than 180 countries and territories. As a European company domiciled in Germany with securities listed in Germany and the United States, we are subject to European, German, U.S., and other governance-related regulatory requirements.
Our business in these more than 180 countries is subject to numerous risks inherent to international business operations. Among others, these risks include:
– Possible tax constraints impeding business operations in certain countries
– Changes in external reporting standards and tax laws including, but not limited to, conflict and overlap among tax regimes as well as the introduction of new tax concepts that harm digitized business models
– Discriminatory, protectionist, or conflicting fiscal policies and tax laws, such as certain protectionist measures included in the U.S. Tax Reform which was enacted at the end of 2017, with some provisions still awaiting final regulations to provide guidance on compliance
– Workforce restrictions resulting from changing laws and regulations, from political decisions (such as Brexit, government elections), or through required works council involvements, labor union approvals, and immigration laws in different countries
– Protectionist trade policies, import and export regulations, and trade sanctions (such as in Russia or China), counter or even conflicting sanctions (such as in the United States and Russia), and embargoes (such as in Iran) including, but not limited to, country-specific software certification requirements
– Violations of country-specific sanctions (such as the UN sanction against North Korea or the United States’ sanction requirements against Iran and certain other countries)
– Compliance with and stringent enforcement of laws, as for example the EU General Data Protection Regulation (GDPR) or China’s Cyber Security Law, and regulations (including interpretations), implications of government elections, lack of reforms, data protection and privacy rules, regulatory requirements and standards (such as the Payment Card Industry Data Security Standard (PCI DSS)) or other compliance requirements (such as Service Organization Controls (SOC))
– Expenses associated with the localization of our products and compliance with local regulatory requirements
– Difficulties enforcing intellectual property and contractual rights in certain jurisdictions
110 | Risk Management and Risks |
To Our | Combined Group | Consolidated Financial | Further Information on Economic, | Additional |
Stakeholders | Management Report | Statements IFRS | Environmental, and Social Performance | Information |
In 2017, an investigation was initiated and is ongoing with regards to potential sanctions violations. For more information relating to the potential sanctions’ violations noted above, see the Business Conduct section and the Notes to the Consolidated Financial Statements, Note (G.3).
As we expand into new countries and markets and/or extend our business activities in these markets, including emerging and high-risk markets, these risks could intensify. The application of the respective local laws and regulations to our business is sometimes unclear, subject to change over time, and often conflicting among jurisdictions. Additionally, these laws and government approaches to enforcement are continuing to change and evolve, just as our products and services continually evolve. Compliance with these varying laws and regulations could involve significant costs or require changes in products or business practices. Non-compliance could result in the imposition of penalties or cessation of orders due to alleged non-compliant activity. Governmental authorities could use considerable discretion in applying these statutes and any imposition of sanctions against us could be material. One or more of these factors could have an adverse effect on our operations globally or in one or more countries or regions, which could have an adverse effect on our business, financial position, profit, and cash flows.
SAP has established measures intended to address and mitigate the described risks and adverse effects. For example:
– We continuously monitor new and increased regulatory requirements, updated or new enforcement trends, and publicly available information on compliance issues in the computer software industry, in the emerging markets where we invest our resources, and in the business environment in general to cope with an increase in regulation enforcement efforts of certain countries or state-driven protectionism.
– We continuously strive to improve, harmonize, and standardize our global processes and solutions to increase our efficiency and effectivity in meeting the various legal requirements to ensure compliance, while also utilizing scenario impact analyses.
– We have taken actions to terminate access to SAP products and services for certain users and to block additional business activities with these users through SAP or SAP partners to address export restriction requirements.
– We receive guidance from external economic consultants, law firms, tax advisors, and authorities in the concerned countries, and take legal actions when necessary.
– We engage with authorities in public policy issues, including the creation of reasonable framework conditions for new technologies such as cloud computing, Big Data, IoT, and for international trade.
– We conduct audits based on various audit standards on a regular basis to identify and remediate issues early on.
– We have a legal and compliance office presence in various countries, with compliance safeguards supported and monitored by our Office of Ethics & Compliance (OEC), formerly the Legal Compliance & Integrity Office (LC&IO).
– We maintain a data protection and privacy office and associated policy.
– We continue efforts to strengthen the Export Control team and have started a cross-board project to overhaul SAP’s export control and trade sanctions policies, operations, and controls, to safeguard compliance with applicable European Union (EU) and U.S. laws in all delivery channels both on premise and in the cloud.
– We continuously update and enhance our compliance programs to improve our effectiveness and to ensure that our employees understand and comply with the SAP Code of Business Conduct (CoBC). This process is coordinated by our OEC, a team of dedicated resources who are tasked with managing our policy-related compliance measures.
– Our OEC team coordinates and provides guidance on implementation, training, and enforcement efforts with respect to compliance-related policies throughout SAP, including but not limited to the Third Party Sales Commission Policy and accompanying training.
We cannot exclude the possibility that if the risk were to occur, it could have a business-critical impact on our operations, financial position, profit, and cash flows. We estimate the probability of occurrence of this risk to be likely. We classify this risk as a high risk.
Legal and IP: Claims and lawsuits against us, such as for IP infringements, or our inability to obtain or maintain adequate licenses for third-party technology, could have an adverse effect on our business, financial position, profit, cash flows, and reputation. Moreover, similar adverse effects could result if we are unable to adequately protect or enforce our own intellectual property.
We believe that we will continuously be subject to claims and lawsuits, including intellectual property infringement claims, as our solution portfolio grows; as we acquire companies with increased use of third-party code including open source code; as we expand into new industries with our offerings, resulting in greater overlap in the functional scope of offerings; and as non-practicing entities that do not design, manufacture, or distribute products assert intellectual property infringement claims. Moreover, protecting and defending our intellectual property is crucial to our success.
The outcome of litigation and other claims or lawsuits is intrinsically uncertain and could lead, for example, to the following risks:
– Claims and lawsuits might be brought against us, including claims and lawsuits involving customers or businesses we have acquired.
– We might be dependent in the aggregate on third-party technology, including cloud and Web services, that we embed in our products or that we resell to our customers.
– Third parties have claimed, and might claim in the future, that we infringe their intellectual property rights or that we are overusing or misusing licenses to these technologies.
– We integrate certain open source software components from third parties into our software. Open source licenses might require that the software code in those components or the software into which they are integrated be freely accessible under open source terms.
– Despite our efforts, we might not be able to prevent third parties from obtaining, using, or selling without authorization what we regard as our proprietary technology and information. In addition, proprietary rights could be challenged, invalidated, held unenforceable, or otherwise affected. Moreover, the laws and courts of certain countries might not offer effective means to
Risk Management and Risks | | 111 |
To Our | Combined Group | Consolidated Financial | Further Information on Economic, | Additional |
Stakeholders | Management Report | Statements IFRS | Environmental, and Social Performance | Information |
enforce our legal or intellectual property rights. Finally, SAP may not be able to collect all judgments awarded to it in legal proceedings.
– Some intellectual property might be vulnerable to disclosure or misappropriation by employees, partners, or other third parties.
Third parties might reverse-engineer or otherwise obtain and use technology and information that we regard as proprietary. Accordingly, we might not be able to protect our proprietary rights against unauthorized third-party copying or utilization. Adverse outcomes to some or all of the claims and lawsuits pending against us might result in the award of significant damages or injunctive relief against us or brought against us in the future that could hinder our ability to conduct our business and could have an adverse effect on our reputation, business, financial position, profit, and cash flows. Third parties could require us to enter into royalty and licensing arrangements on terms that are not favorable to us, cause product shipment delays, subject our products to injunctions, require a complete or partial redesign of products, result in delays to our customers’ investment decisions, and damage our reputation. Third-party claims might require us to make freely accessible under open source terms one of our products or third-party (non-SAP) software upon which we depend.
Any legal action we bring to enforce our proprietary rights could also involve enforcement against a partner or other third party, which might have an adverse effect on our ability, and our customers’ ability, to use that partner’s or other third parties’ products.
The outcome of litigation and other claims or lawsuits is intrinsically uncertain. Management’s view of the litigation might also change in the future. Actual outcomes of litigation and other claims or lawsuits could differ from the assessments made by management in prior periods, which are the basis for our accounting for these litigations and claims under IFRS.
SAP has established measures to address and mitigate the described risks and adverse effects. For example:
– Our OEC sets and manages internal policies related to our CoBC. Our Global GRC organization works closely with the OEC, Global Legal, and Corporate Audit, and is jointly responsible for the management and reporting of potential risks associated with third-party intellectual property.
– We have established various internal programs, such as internal policies, processes, and monitoring, to assess and manage the risks associated with open source, and third-party intellectual property.
– We endeavor to protect ourselves in the respective third-party software agreements by obtaining certain rights in case such agreements are terminated.
– We are party to certain patent cross-license agreements with third parties, which removes the risk of litigation with respect to the involved patents.
– We rely on a combination of the protections provided by applicable statutory and common law rights, including trade secret, copyright, patent, and trademark laws, license and non-disclosure agreements, and technical measures to establish and protect our proprietary rights in our products.
We cannot exclude the possibility that if the risk were to occur, it could have a business-critical impact on our operations, financial position, profit, and cash flows. We estimate the probability of occurrence of this risk to be likely. We classify this risk as a high risk.
We are named as a defendant in various legal proceedings for alleged intellectual property infringements. For more information and a more detailed report relating to certain of these legal proceedings, see the Notes to the Consolidated Financial Statements, Notes (A.4, C.5, and G.3).
Data Protection and Privacy: Non-compliance with increasingly complex and stringent, sometimes even conflicting, applicable data protection and privacy laws or failure to adequately meet the contractual requirements of SAP’s customers with respect to our products and services could lead to civil liabilities and fines, as well as loss of customers and damage to SAP’s reputation, and could have a material adverse effect on our financial performance and our business in general.
As a global software and service provider, SAP is required to comply with local laws wherever SAP does business. One of the latest major harmonizations of European data protection laws has been the General Data Protection Regulation (GDPR).
Furthermore, evolving regulations and new laws globally (such as the California Consumer Privacy Act and the EU’s proposed e-Privacy Regulation) regarding data protection and privacy or other standards increasingly aimed at the use of personal information, such as for marketing purposes and the tracking of individuals’ online activities, may impose additional burdens for SAP due to increasing compliance standards that could restrict the use and adoption of SAP’s products and services (in particular cloud services) and make it more challenging and complex to meet customer expectations.
This could lead to increased risks for SAP, which could harm SAP’s business and limit SAP’s growth.
Non-compliance with applicable data protection and privacy laws by SAP and/or any of the sub-processors engaged by SAP within the processing of personal data could lead, for example, to risks in the following areas:
– Mandatory disclosures of breaches to affected individuals, customers, and data protection supervisory authorities
– Investigations and administrative measures by data protection supervisory authorities, such as the instruction to alter or stop non-compliant data processing activities, including the instruction to stop using non-compliant subcontractors
– Fines of up to 4% of SAP’s annual Group turnover, or unlimited fines
– Damage claims by customers
– Harm to SAP’s reputation
– Increased complexity in times of digitalization with regards to legal requirements in the context of cross-border data transfer
– Lack of digital frameworks such as in the context of machine learning or artificial intelligence could lead to distortion of individual data or information.
In addition, the German Federal Office for the Protection of the Constitution and security industry experts have warned of risks related to a globally growing number of cybersecurity attacks aimed at obtaining or violating company data including personal data. We anticipate cyberattack techniques to continue to evolve and increase in sophistication, which could make it difficult to anticipate,
112 | | Risk Management and Risks |
To Our | Combined Group | Consolidated Financial | Further Information on Economic, | Additional |
Stakeholders | Management Report | Statements IFRS | Environmental, and Social Performance | Information |
prevent, detect, and mitigate attacks and intrusions, thus leading, for example, to risks described in the Cybersecurity and Security section, including risks in the following areas, among others:
– A globally increasing number of threat actor attacks aimed at obtaining or violating Company data including personal data as observed in recent prominent cases of cyberattacks where the use of ransomware was the preferred method of threat actors
Any one or more of these events could have a material adverse effect on our business, financial position, profit, and cash flows.
SAP has established measures to address and mitigate the described risks and adverse effects. For example:
– We have implemented internal processes and measures in an effort to enable SAP to successfully and sufficiently comply with applicable data protection requirements.
– Data protection and privacy is reflected in the mandatory product standards of SAP’s product development lifecycle.
– We continuously review SAP’s existing standards and policies to address changes to applicable laws and regulations.
– We continuously enhance our data center operations worldwide, also taking into account local and sector-specific market and legal requirements. For compliance with local legal requirements, we have established a network of local and regional Data Protection and Privacy Coordinators.
– We have a data protection management system in place in all our Board areas: SAP Digital Business Services (DBS), Global Finance & Administration (GFA), Office of the Co-CEOs (OCEO), Cloud Business Group (CBG), Global Customer Operations (GCO), Human Resources (HR), Technology & Innovation (T&I), Intelligent Enterprise Group (IEG), and SAP Product Engineering (PE). Furthermore, this data protection management system will be continuously enhanced and extended to apply to newly acquired companies within the SAP Group. SAP has been awarded the British Standards Institution (BSI) certification for the implementation and operation of SAP’s data protection management system, which underlines SAP’s compliance with data protection laws, including GDPR.
– We actively monitor legal developments and engage with political stakeholders and government authorities, directly or through industry associations, to clarify questions relevant to SAP and SAP’s business.
– Clear governance and guidance on data handling and processing standards as part of our data management framework, specifically incorporating aspects of new technologies such as those represented in embedded intelligence
We cannot exclude the possibility that if the risk were to occur, it could have a business-critical impact on our operations, financial position, profit, and cash flows. We estimate the probability of occurrence of this risk to be likely. We classify this risk as a high risk. For more information, see the Cybersecurity and Security and Security, Data Protection, and Privacy sections.
Corporate Governance and Compliance Risks
Unauthorized Disclosure of Information: Our controls and efforts to prevent the unauthorized disclosure of confidential information might not be effective.
Confidential information and internal information related to topics such as our strategy, new technologies, mergers and acquisitions, unpublished financial results, customer data, or personal data, could be disclosed prematurely or inadvertently and subsequently lead to market misperception and volatility.
Such disclosure could lead to risks in the following areas, among others:
– Disclosure of confidential information and intellectual property, defective products, production downtimes, supply shortages, and compromised data (including personal data) through, for example, inappropriate usage of social media by employees
– Requirement to notify multiple regulatory agencies and comply with applicable regulatory requirements and, where appropriate, the data owner
Any one or more of these events could have an adverse effect on our market position and lead to fines and penalties. In addition, this could have an adverse effect on our business, reputation, financial position, profit, and cash flows.
SAP has established measures to address and mitigate the described risks and adverse effects, such as:
– Mandatory compliance baseline training for all employees (security awareness, data privacy and data protection, compliance, and communication)
– Social engineering tests to check employees’ adherence to security policies
– Standards, governance, and controls for safe internal and external communication to ensure consistency
– Technical security features in our IT hardware and communication channels, such as mandatory encryption of sensitive data
– Organizational grouping of all security divisions into one global security unit to strengthen the security capabilities
– Continuous adoption of internal security measures
We cannot exclude the possibility that if the risk were to occur, it could have a business-critical impact on our operations, financial position, profit, and cash flows. However, we estimate the probability of occurrence of this risk to be remote. We classify this risk as a medium risk.
Ethical Behavior: Unethical behavior and non-compliance with our integrity standards by employees, other individuals, partners, or entities associated with SAP could seriously harm our business, financial position, profit, and reputation.
SAP’s leadership position in the global market is founded on the long-term and sustainable trust of our stakeholders worldwide. Our overarching approach is one of corporate transparency, open communication with financial markets, and adherence to recognized standards of business integrity. This commitment is formalized in SAP’s CoBC and supporting guidelines.
However, we might for instance encounter the following risks:
– Non-compliance with our integrity standards and violation of compliance related rules, regulations, and legal requirements
Risk Management and Risks | | 113 |
To Our | Combined Group | Consolidated Financial | Further Information on Economic, | Additional |
Stakeholders | Management Report | Statements IFRS | Environmental, and Social Performance | Information |
including, but not limited to, anticorruption and bribery legislation in Germany, the U.S. Foreign Corrupt Practices Act, the UK Bribery Act, and other local laws prohibiting corrupt conduct
– Unethical and fraudulent behavior by individual employees, other individuals, partners, or entities associated with SAP leading to criminal charges, fines, and claims by affected parties
– Collusion with external third parties, for example by aiding in securing business
– Fraud and corruption, especially in countries with a low Corruption Perceptions Index score and particularly in emerging markets
– Increased scrutiny of public sector transactions in territories exposed to a high risk of corruption
– Increased exposure and impact on business activities in highly regulated industries such as public sector, healthcare, banking, or insurance
Any one or more of these events could have an adverse effect on our business, reputation, financial position, share price, profit, and cash flows.
SAP has encountered situations that required clear messaging and strong action on non-compliance in the context of corrupt behavior that has the potential to harm our business and reputation. In South Africa, SAP is continuing to investigate its dealings with the public sector. For more information relating to the alleged anti-bribery law violations noted above, see the Business Conduct section and the Notes to the Consolidated Financial Statements, Note (G.3).
SAP has established measures to address and mitigate the described risks and adverse effects, such as:
– Continuous development of our comprehensive compliance management system (CMS) based on the three pillars of prevention, detection, and response
– Expansion of our OEC’s bandwidth through additional staffing
– Root cause analysis of all observations related to corrupt or fraudulent behavior to improve associated business processes and prevent further and future violations
– Refraining from engaging sales agents and paying third-party sales commissions on public sector deals in high-risk countries
– Review of partner compensation models to mitigate risks of corruption while meeting agility requirements
– Internal audit of our CMS
– Several educational, counseling, control, and investigative instruments
– Requirement for mandatory CoBC training applicable to every SAP employee, providing practical guidance on how to avoid corrupt behavior and solve dilemma situations
– Annual reconfirmation of commitment to the CoBC by SAP’s workforce (except where disallowed by local legal regulations)
– Implementation of compliance policies and processes aimed at managing third parties and preventing misuse of third-party payments for illegal purposes, including the performance of compliance due diligence activities prior to the engagement of third parties
– Guidance in our travel, entertainment, gift, and expense policies
– Promotion of a commitment for doing business with integrity through our partner and vendor ecosystems and internally within the Company
– Termination of partners who do not pass our partner compliance audit process, or remediation of their deficiencies
– In response to preliminary findings of alleged anti-corruption law violations, we have implemented enhancements to our anti-corruption compliance program, including guidance and policy changes as well as additional internal controls, and intend to continue these enhancements further.
Despite our comprehensive and continuously evolving compliance management system and established internal controls, intentional efforts of individuals to circumvent controls or engage in corruption, especially by way of collusion with other involved parties, cannot always be prevented.
We cannot exclude the possibility that if the risk were to occur, it could have a business-critical impact on our operations, financial position, profit, and cash flows. We estimate the probability of occurrence of this risk to be likely. We classify this risk as a high risk.
Environment and Sustainability: Failure to meet customer, partner, or other stakeholder expectations or generally accepted standards on climate change, energy constraints, and our social investment strategy could negatively impact SAP’s business, results of operations, and reputation.
Energy and emissions management are an integral component of our holistic management of social, environmental, and economic risks and opportunities.
We have identified risks in this context, including, but not limited to, the following:
– Failure to meet customer, partner, or other stakeholder expectations or generally accepted standards on climate change, energy constraints, and our social investment strategy
– Failure to achieve communicated targets for greenhouse gas emissions
– Failure to maintain our rating in sustainable investment indexes
If we do not meet stakeholder expectations in the areas identified, our rating in sustainable investment indexes might decrease, which could have an adverse effect on our reputation, profit, and share price.
SAP has established measures to address and mitigate the described risks and adverse effects, such as:
– Proactive identification and addressing of social and environmental issues
– Recognition for our sustainability efforts is shared with the market
– Ongoing efforts and activities to maintain our listing in the most prominent and recognized sustainability indexes, such as the expansion of ISO 14001 and ISO 50001 audits, strengthening our human rights commitment, and increasing transparency regarding SAP’s governance
– Ongoing efforts to continue receiving excellent scores and rankings such as the Dow Jones Sustainability Indices, ISS-oekom Corporate Sustainability Review, FTSE4GOOD, and the CDP Climate Change rating
– We reduced our carbon emissions further to 300 kilotons in 2019 (2018: 310 kilotons)
We cannot exclude the possibility that if the risk were to occur, it could have a moderate impact on our operations, financial position,
114 | | Risk Management and Risks |
To Our | Combined Group | Consolidated Financial | Further Information on Economic, | Additional |
Stakeholders | Management Report | Statements IFRS | Environmental, and Social Performance | Information |
profit, and cash flows. However, we estimate the probability of occurrence of this risk to be unlikely. We classify this risk as a low risk.
Financial Risks
Sales and Revenue Conditions: Our sales and revenue conditions are subject to market fluctuations and our forecasts might not be accurate.
Our revenue and operating results can vary and have varied in the past, sometimes substantially, from quarter to quarter. Our revenue in general, and our software revenue in particular, is difficult to forecast for a number of reasons, and could lead to risks related to the following, among others:
– Challenges in pipeline development and realization
– Long sales cycles for many of our products
– Timing issues with respect to the introduction of new products and services or product and service enhancements by SAP or our competitors
– Large size, complexity, and extended settlement of individual customer transactions
– Introduction/adaptation of licensing and deployment models such as cloud subscription models
– Adoption of, and conversion to, new business models, leading from upfront payment models to an increase in pay-per-use or subscription-based payment models, thus the respective service period typically ranges from one to three years, and goes up to five years
– Changes in customer budgets or seasonality of technology purchases by customers, or customer solvency challenges due for example to political instability
– Decreased software sales that could have an adverse effect on related maintenance and services revenue growth
– Shortfall in anticipated revenue or delay in revenue recognition or deployment models that require revenue to be recognized over an extended period of time
– Inability of acquired companies to accurately predict their sales pipelines
In recent years, the trend has been towards an increased number of sales transactions, with the average deal size remaining more or less constant. However, the loss or delay of one or a few large opportunities could have an adverse effect on our business, financial position, profit, and cash flows.
SAP has established measures to address and mitigate the described risks and adverse effects, such as:
– Implementation of methodologies and metrics for continuous forecasting and trend analysis in our business
– Pipeline analyses based on our business planning, budgeting, and forecasting
– Ongoing analysis and monitoring of demand, supply, and our competitive environment
– Constant monitoring of our revenues, costs, and operational KPIs utilizing system-based, real-time reporting to continuously improve our business performance
– Monitoring and payment planning measures for critical overdue accounts
– Increased predictability of revenue due to ongoing transformation to the cloud
– Continuous process standardization to increase transparency and reduce complexity
We cannot exclude the possibility that if the risk were to occur, it could have a moderate impact on our operations, financial position, profit, and cash flows. However, we estimate the probability of occurrence of this risk to be unlikely. We classify this risk as a low risk.
Liquidity: External factors could impact our liquidity and increase the default risk associated with, and the valuation of, our financial assets.
Macroeconomic factors such as an economic downturn could have an adverse effect on our future liquidity. We use a globally centralized financial management approach to control financial risk, such as liquidity, exchange rate, interest rate, counterparty, and equity price risks. The primary aim is to maintain liquidity in the SAP Group at a level that is adequate to meet our obligations at any time.
However, adverse macroeconomic factors could increase the default risk associated with the investment of our total Group liquidity, and could lead to the following risks, among others:
– Group liquidity shortages
– Inability to repay financial debt
– Increased default risk of financial investments, which might lead to significant impairment charges in the future
– Limitation of operating and/or strategic financial flexibility
Any one or more of these events could have an impact on the value of our financial assets, which could have an adverse effect on our business, financial position, profit, and cash flows.
SAP has established measures to address and mitigate the described risks and adverse effects, such as:
– We have policies and measures in place to support strong operating cash flow.
– SAP’s investment policy with regards to total Group liquidity is described in our internal treasury guideline, which is a collection of uniform rules that apply globally to all companies in the SAP Group. Among other things, it requires that investments, with limited exceptions, are only executed in assets and funds rated BBB flat or better.
– The weighted average rating of the investments of our total Group liquidity is in the range of A.
– We pursue a policy of cautious investment characterized by wide portfolio diversification with a variety of counterparties, predominantly short-term investments, and standard investment instruments.
We cannot exclude the possibility that if the risk were to occur, it could have a major impact on our operations, financial position, profit, and cash flows. However, we estimate the probability of occurrence of this risk to be remote. We classify this risk as a low risk.
Use of Accounting Policies and Judgment: In our accounting, management uses policies and applies estimates. This could negatively affect our business, financial position, profit, and cash flows.
To comply with IFRS, management is required to establish and apply accounting policies as well as to apply judgment, including
Risk Management and Risks | | 115 |
To Our | Combined Group | Consolidated Financial | Further Information on Economic, | Additional |
Stakeholders | Management Report | Statements IFRS | Environmental, and Social Performance | Information |
but not limited to making and using estimates and assumptions. The policies and judgment affect our reported financial figures.
This use of policies and judgment could lead to risks in the following areas, among others:
– New pronouncements by standard setters and regulators as well as changes in common practice or common interpretations of existing standards might force us to change existing policies. Where such changes trigger significant changes to our processes, we might struggle to implement the changes in a timely manner.
– The facts and circumstances, as well as the assumptions on which our management bases its judgment might change over time, requiring us to change the judgment previously applied.
Both of the above risks could result in significant changes to our reported financials, and could have an adverse effect on our business, financial position, profit, and cash flows.
SAP has established measures to address and mitigate the described risks and adverse effects, such as:
– Regular monitoring of possible future changes to financial reporting standards or interpretations thereof in order to identify or anticipate changes at an early stage
– Control procedures to make sure that our estimates and judgments are adequate, such as two-person verification to significant estimating
We cannot exclude the possibility that if the risk were to occur, it could have a moderate impact on our operations, financial position, profit, and cash flows. However, we estimate the probability of occurrence of this risk to be unlikely. We classify this risk as a low risk.
Currency, Interest Rate, and Share Price Fluctuation: As a globally operating company, SAP is subject to various financial risks related to currencies, interest rates, and share price fluctuations, which could negatively impact our business, financial position, profit, and cash flows.
Because we operate throughout the world, a significant portion of our business is conducted in foreign currencies. In 2019, approximately 72.6% of our revenue was attributable to operations in foreign currencies. This foreign currency business therefore gets translated into our reporting currency, the euro.
This could lead to the following risks, among others:
– Period-over-period fluctuations
– Exchange rate risks with currency appreciation or depreciation, or risks related to currency devaluation (legal and/or administrative changes to currency regimes)
– Interest rate fluctuation
– Share price fluctuation impacting cash outflows for share-based compensation payments
Any one or more of these events could have an adverse effect on our business, financial position, profit, and cash flows.
SAP has established measures to address and mitigate the described risks and adverse effects, such as:
– Continuous monitoring of our exposure to all these financial risks
– Group-wide foreign exchange risk management strategy to hedge balance sheet items and expected cash flows in foreign currencies by using derivative financial instruments as appropriate
– Balanced maturity profile and mixture of fixed and floating interest rate arrangements to hedge against interest rate risk
– Use of derivative instruments to reduce some of the impact of our share-based compensation plans on our income statement and cash flow
We cannot exclude the possibility that if the risk were to occur, it could have a major impact on our operations, financial position, profit, and cash flows. However, we estimate the probability of occurrence of this risk to be remote. We classify this risk as a low risk.
For more information about risks arising from financial instruments, including our currency, interest rate, and equity price risks, and our related hedging activity, see the Notes to the Consolidated Financial Statements section, Notes (A.2, E.3, and F.1).
Insurance: Our insurance coverage might not be sufficient and uninsured losses may occur.
We maintain insurance coverage to protect us against a broad range of risks, at levels we believe are appropriate and consistent with current industry practice. Our objective is to exclude or minimize risk of financial loss at reasonable cost.
Nevertheless, we could still be subject to risks in the following areas, among others:
– Losses that might be beyond the limits, or outside the scope of coverage of our insurance and that may limit or prevent indemnification under our insurance policies
– Inability to maintain adequate insurance coverage on commercially reasonable terms in the future
– Certain categories of risks that are currently not insurable at reasonable cost
– No assurance of the financial ability of the insurance companies to meet their claim payment obligations
Any one or more of these events could have an adverse effect on our business, financial position, profit, and cash flows.
SAP has established measures to address and mitigate the described risks and adverse effects, such as:
– Maintaining a scope of insurance coverage that is as broad as possible
– Selection of financially stable and reputable insurers
– Constant review of our insurance programs in relation to our risk profile and breadth of insurance coverage
We cannot exclude the possibility that if the risk were to occur, it could have a business-critical impact on our operations, financial position, profit, and cash flows. However, we estimate the probability of occurrence of this risk to be remote. We classify this risk as a medium risk.
Venture Capital: We could incur significant losses in connection with venture capital investments.
Through Sapphire Ventures, our consolidated venture investment funds, we plan to continue investing in new and promising technology businesses.
This could lead to risks in the following areas, among others:
116 | | Risk Management and Risks |
To Our | Combined Group | Consolidated Financial | Further Information on Economic, | Additional |
Stakeholders | Management Report | Statements IFRS | Environmental, and Social Performance | Information |
– Investments could generate net losses and/or require additional expenditures from their investors.
– Changes to planned business operations might affect the performance of companies in which Sapphire Ventures holds investments.
– Tax deductibility of capital losses and impairment in connection with equity securities are often restricted and could therefore have an adverse effect on our effective tax rate.
Any one or more of these events could have an adverse effect on our business, financial position, profit, and cash flows.
Sapphire Ventures has established measures to address and mitigate the described risks and adverse effects, such as:
– Diversify the portfolio and actively manage our investments
– Balance the volume and scope of our venture capital activities
We cannot exclude the possibility that if the risk were to occur, it could have a minor impact on our operations, financial position, profit, and cash flows. However, we estimate the probability of occurrence of this risk to be remote. We classify this risk as a low risk.
Human Capital Risks
Human Workforce: If we are unable to attract, develop, retain, and effectively manage our geographically dispersed workforce, we might not be able to run our business and operations efficiently and successfully, or develop successful new solutions and services.
Our success is dependent on appropriate alignment of our planning processes for our highly skilled and specialized workforce and leaders, both male and female, adequate resource allocation, and our location strategy with our general strategy. In certain regions and specific technology and solution areas, we continue to set very high growth targets, depending on short-term and long-term skill requirements, taking infrastructure needs as well as local legal or tax regulations in consideration. Successful retention and expansion of our highly skilled and specialized workforce in identified strategic areas, are key success factors for our transition to become the Experience Company powered by the Intelligent Enterprise. The availability of such personnel as well as business experts is limited and, as a result, competition in our industry is intense.
We could face risks in the following areas, among others:
– Failure to apply workforce planning processes, adequate resource allocation, and location strategy in alignment with our general strategy
– Failure to identify, attract, develop, motivate, adequately compensate, and retain well-qualified and engaged personnel to scale to targeted markets
– Failure to successfully maintain, upskill, and expand our highly skilled and specialized workforce
– Poor succession management or failure to find adequate replacements
– Loss of key personnel of acquired business
– Failure to meet short-term and long-term workforce and skill requirements including achievement of internal gender diversity objectives
– Lack of appropriate or inadequately executed benefit and compensation programs
– Lack of availability and scalability of business experts and consultants
– Mismatch of expenses and revenue due to changes in headcount and infrastructure needs, as well as local legal or tax regulations
– Challenges with effectively managing a large distribution network of third-party companies
Any one or more of these events could reduce our ability to attract, develop, retain, and effectively manage our geographically dispersed workforce, which in turn could have an adverse effect on our business, financial position, profit, and cash flows.
SAP has established measures to address and mitigate the described risks and adverse effects, such as:
– Workforce planning (aiming to achieve diversity and the right mix of talent while considering demographic changes) and legally compliant mobility planning, utilizing the integration of our Concur travel solutions to support the challenges of a global workforce
– Utilization of external advisory services to address complexity in legal requirements while ensuring adequate resource allocation
– Utilization of SAP solutions to support compliance and streamline processes
– Career management (including, but not limited to, opportunity offerings for short-term assignments as well as skill, competencies, and qualification advancements)
– Building employee and leadership strengths through a range of targeted professional development, learning, mentoring, coaching, together with a gender diversity program to take the changes in a global workforce into consideration
– Strong focus on succession planning for leadership and key positions to ensure sustainable leadership and safeguard the business from impacts through staff turnover
– Strong focus on expanding our talent landscape and reach through our diversity and inclusion efforts, including but not limited to neuro-diverse talent, which provides a vibrant channel of talent with relevant skill sets required to compete successfully
– Extended benefit and long-term incentive programs, which will enable us to hire and retain talents internationally
– Utilization of outsourcing or external short-term staffing
We cannot exclude the possibility that if the risk were to occur, it could have a major impact on our operations, financial position, profit, and cash flows. However, we estimate the probability of occurrence of this risk to be unlikely. We classify this risk as a medium risk. For more information, see the Employees and Social Investments section.
Operational Business Risks
Sales and Services: Sales and implementation of SAP software and services, including cloud, are subject to a number of significant risks sometimes beyond our direct control.
A core element of our business is the successful implementation of software and service solutions. The implementation of SAP
Risk Management and Risks | | 117 |
To Our | Combined Group | Consolidated Financial | Further Information on Economic, | Additional |
Stakeholders | Management Report | Statements IFRS | Environmental, and Social Performance | Information |
software and cloud-based service deliveries is led by SAP, by partners, by customers, or by a combination thereof.
However, we might encounter risks in the following areas, among others:
– Implementation risks, if, for example, implementations take longer than planned, or fail to generate the profit originally expected, scope deviations, solution complexity, individual integration and migration needs or functional requirement changes, or insufficient milestone management and tracking leading to delays in timeline, maybe even exceeding maintenance cycles of solutions in scope
– Insufficient or incorrect information provided by the customer, subsequently leading to requirement or technology mismatches
– Insufficient customer expectation management, including scope, integration capabilities and aspects, as well as lack in purposeful selection, implementation, and utilization of SAP solutions
– Lack of customer commitments and respective engagements, including lack of commitment of resources, leading to delays or deviations from recommended best practices
– Challenges to effectively implement acquired technologies
– Challenges to achieve a seamlessly integrated and aligned service delivery in complex deliveries or implementations, for example due to lack of insights especially in the event of limited project involvement of SAP
– Protracted installation or significant third-party consulting costs
– Improper calculations or estimates leading to costs exceeding the fees agreed in fixed-price contracts
– Unrenderable services committed during the sales stage
– Delayed customer payments due to differing perception on project outcome/results or customer solvency challenges
– Inadequate contracting and consumption models based on subscription models for services, support, and application management
– Deviations from standard terms and conditions, which may lead to an increased risk exposure
– Statements on solution developments might be misperceived by customers as commitments on future software functionalities
Any one or more of these events could have an adverse effect on our business, financial position, profit, and cash flows.
SAP has established measures to address and mitigate the described risks and adverse effects, such as:
– Projects include risk management processes as part of SAP’s project management methods intended to safeguard implementations with coordinated risk and quality management programs
– Scope reviews and monitoring are conducted with required adaptations through a clearly defined change request process to support successful implementations together with respective project governance and steering
– Recommended project approaches, guidance, and best practices for customers to optimize their IT solutions in a non-disruptive manner
– Adequate financial planning provisions for the remaining risks
– Continuous project monitoring and controlling activities
– Established escalation management process
– Ongoing development of new commercial models to address customer flexibility needs
– Simplification, alignment, and enforcement of contractual standard terms and conditions while conducting legal and operational assessments in case deviations are required
– A policy that clearly outlines communication rules on future functionalities as well as legal requirements for commitments to customers
We cannot exclude the possibility that if the risk were to occur, it could have a major impact on our operations, financial position, profit, and cash flows. However, we estimate the probability of occurrence of this risk to be unlikely. We classify this risk as a medium risk.
Partner Ecosystem: If we are unable to scale, maintain, and enhance an effective partner ecosystem, revenue might not increase as expected.
An open and vibrant partner ecosystem is a fundamental pillar of our success and growth strategy. We have entered into partnership agreements that drive co-innovation on our platforms, profitably expand all our routes to market to optimize market coverage, optimize cloud delivery, and provide high-quality services capacity in all market segments. Partners play a key role in driving market adoption of our entire solutions portfolio, by co-innovating on our platforms, embedding our technology, and reselling and/or implementing our software.
These partnerships could lead to risks in the following areas, among others:
– Failure to establish and enable a network of qualified partners supporting our scalability needs
– Failure to get the full commitment of our partners, which might reduce speed and impact in market reach
– Products or services model being less strategic and/or attractive compared to our competition
– Partners might not renew agreements with us, or not enter into new agreements on terms acceptable to us or at all or start competing with SAP
– Failure to enable or train sufficient partner resources to promote, sell, and support to scale to targeted markets
– Partners might not develop a sufficient number of new solutions and content on our platforms or might not provide high-quality products or services to meet customer expectations.
– Partners might not embed our solutions sufficiently enough to profitably drive product adoption, especially with innovations such as SAP S/4HANA, SAP C/4HANA, and SAP Cloud Platform.
– Partners might not adhere to applicable legal and compliance regulations.
– Partners and their products might not meet quality requirements expected by our customers or SAP.
– Partners might not transform their business model in accordance with the transformation of SAP’s business model in a timely manner.
– Partners might not be able or might not have capacity to meet customer expectations in terms of service provisioning.
– Partners might fail to comply with contract terms in embargoed or high-risk countries.
If one or more of these risks materialize, this might have an adverse effect on the demand for our products and services as well as the partner’s loyalty and ability to deliver. As a result, we might
118 | | Risk Management and Risks |
To Our | Combined Group | Consolidated Financial | Further Information on Economic, | Additional |
Stakeholders | Management Report | Statements IFRS | Environmental, and Social Performance | Information |
not be able to scale our business to compete successfully with other vendors, which could have an adverse effect on our reputation, business, financial position, profit, and cash flows.
SAP has established measures to address and mitigate the described risks and adverse effects, such as:
– Invest in long-term, mutually-beneficial relationships and agreements with partners
– Continue to develop and enhance a wide range of partner programs to retain existing and attract new partners of all types
– Enable and encourage partners to leverage SAP technology, by providing guidance about business opportunities, architecture, and technology for example, through demo solutions, to enable partners to lead business value discussions on cloud and on-premise solutions with customers
– Offer training opportunities on a wide range of resources for our partners, and provide safeguarding services to customers and partners
– Introduction of the Partner Delivery Quality Framework to monitor and safeguard the success of partner-led projects while ensuring that SAP quality criteria are met
– Maintain certification process for third-party solutions to ensure consistent high-quality and seamless integration
– Provide customer guidance and support as required during partner dissolutions
We cannot exclude the possibility that if the risk were to occur, it could have a major impact on our operations, financial position, profit, and cash flows. However, we estimate the probability of occurrence of this risk to be unlikely. We classify this risk as a medium risk.
Cloud Operations: We may not be able to properly protect and safeguard our critical information and assets, business operations, cloud offerings and portfolio presentation, and related infrastructure against disruption or poor performance.
SAP is highly dependent on the availability of our infrastructure, and the software used in our cloud portfolio is inherently complex.
This could lead to risks impacting successful cloud operations, such as:
– Capacity shortage and SAP’s inability to deliver and operate cloud services in a timely and efficient manner as expected by or committed to our customers
– Customer concerns about the ability to scale operations for large enterprise customers
– Incomplete cloud portfolio representation or strategic directions of cloud operations that may not fully meet customer demands and potentially lead to a disconnected customer orientation
– Lack of hyperscaler availability and/or infrastructure stability, which may lead to challenges in meeting Service Level Agreement (SLA) commitments
– Lack of sufficient ‘future skills’ for delivering and operating hybrid environments
– Lack of tools to manage and optimize operations while providing a seamless end-to-end experience to customers
– Local legal requirements or changes to data sovereignty may lead to customers considering a reallocation of their primary or disaster recovery landscapes to a different data center
– Defects or disruption to data center operations or system stability and availability
– The certification provisioning may not always be exhaustively published in the SAP Trust Center and subsequently lead to incorrect customer perceptions
– Interruptions in the availability of SAP’s cloud applications portfolio could potentially impact customer service level agreements
– System outages or downtimes, failure of the SAP network due to human or other errors, security breaches, or variability in user traffic for cloud applications
– Hardware failures or system errors resulting in data loss, corruption, or incompletion of the collected information
– Loss of the right to use hardware purchased or leased from third parties could result in delays in our ability to provide our cloud applications
– Scalability demands on infrastructure and operation could lead to cost increase and margin impacts
– Non-adherence to our quality standards in the context of partner co-location of data centers
– Increased Total Cost of Ownership (TCO) for SAP
– Customers’ cloud service demands might not match our data center capacity investments
– Non-compliance with applicable certification requirements, such as Payment Card Industry Data Security Standard (PCI DSS)
Any one or more of these events could have a material adverse effect on our business, financial position, profit, and cash flows.
SAP has established measures to address and mitigate the described risks and adverse effects, such as:
– Consolidation and harmonization of our data centers and our data protection measures, including implementation of security information and event management solutions as well as network access control enforcement
– Significant investment in infrastructure and processes in an effort to ensure secure operations of our cloud solutions while continuously improving resistance, resilience, and scalability towards a standardized and harmonized portfolio
– Continuous enhancement of infrastructure landscape capabilities including harmonized, efficient, and highly repetitive migration services
– Adherence to stringent SLAs with hyperscalers to ensure a high-quality customer experience
– Increased transparency through our continuously enhanced and expanded SAP Trust Center, ensuring appropriate level of information, for example with regards to planned patching activities and associated downtimes
– Monitoring and investment to continuously enhance our disaster recovery and business continuity capabilities
– Continuous aim for a homogeneous landscape that supports the complex infrastructure, application, and security requirements so that we can deliver the required service level for cloud services
– Physical access control systems at facilities, multilevel access controls, closed-circuit television surveillance, security personnel in all critical areas, and recurring social engineering tests for SAP premises and data centers
– Access to information and information systems is controlled using authorization concepts. Managers and employees are regularly sensitized to the issues and given mandatory security and compliance training
Risk Management and Risks | | 119 |
To Our | Combined Group | Consolidated Financial | Further Information on Economic, | Additional |
Stakeholders | Management Report | Statements IFRS | Environmental, and Social Performance | Information |
– Adaptation of our cloud service delivery to local and/or specific market requirements (such as local or regional data centers) and compliance with all local legal regulations regarding data protection and privacy as well as data security
– Contracts that require third-party data centers to have appropriate security and data protection and privacy terms in place. We establish contracts and service level agreements with our public cloud partners to ensure that data security and privacy measures meet local regulatory and compliance standards and SAP’s own standards for data security and privacy
– Strict internal policies and controls concerning utilization of partner’s cloud infrastructure, including people, process and technology standards required to ensure compliance
– Close monitoring of data center utilization, capacity, and pipeline for subsequent investment planning
– Regular risks reviews, disclosure requests, and audits to ensure public cloud providers meet SAP’s data privacy and security standards
– PCI validated compliance by successful PCI DSS audits
– Investment in training and certifications concerning hyperscalers and related next-generation technologies
– Implementation of best-of-breed tools for IT operations management and automation
We cannot exclude the possibility that if the risk were to occur, it could have a business-critical impact on our operations, financial position, profit, and cash flows. However, we estimate the probability of occurrence of this risk to be unlikely. We classify this risk as a medium risk.
Cybersecurity and Security: A cybersecurity attack or breach, or cybersecurity vulnerabilities in our products, infrastructure, or services, or economic espionage could result in significant legal and financial exposure and have a material adverse effect on our customers, partners, financial performance, profit, cash flows, operations, brand, reputation, competitive position, the perception of our products and services by current and prospective customers, and our business in general.
As we continue to grow organically and through acquisitions, deliver a full portfolio of solutions via the cloud, host or manage elements of our customers’ businesses in the cloud, process large amounts of data and offer more mobile solutions to users, in each case either directly or through partners and other third parties, we face a progressively more complex and threatening cybersecurity environment. The severity of the challenges posed by this cybersecurity environment is amplified due to the increasingly sophisticated and malicious global cybersecurity threat landscape in which we operate, including third-party data, products, and services that we incorporate into SAP products and services, and the continually evolving and increasingly advanced techniques employed by threat actors targeting IT products and businesses in general. Such threat actors include, but are not limited to, highly sophisticated parties such as nation-states and organized criminal syndicates. As a leading cloud company and service provider to some of the largest and best-known customers in the world, we are naturally a prominent target for cybersecurity attacks. We have observed increased threat activity to our products and systems, and we experience cybersecurity attacks of varying types and degrees on a regular basis. When we become aware of unauthorized access to our systems, we take steps intended to identify and remediate the source and impact of the incursions, and steps to comply with related necessary notification and disclosure obligations. To date, none of the incursions we have identified has had a material adverse effect on our business. However, we do not have visibility into all unauthorized incursions, and our systems may be experiencing ongoing incursions of which we are not aware. In addition, while we are continually taking steps to enhance our cybersecurity defenses, increased investments, coordination, and resources are required to achieve our objective of ensuring over time that our cybersecurity infrastructure meets or exceeds evolving industry standards. Achieving this objective will require continued effort and vigilance, including sustained investment of money and management resources in order to support the ongoing development and maintenance of systems that meet these standards. As a result, we are subject to risks and associated consequences in the following areas, among others:
– Identified or undetected cybersecurity defects and vulnerabilities
– Increased complexity and risk of exploitation due to utilization of open-source software components
– Exposure of our business operations and service delivery due to a number of threats, including virtual attack, disruption, damage, and/or unauthorized access, theft, destruction, industrial and/or economic espionage, serious or organized crime, and other illegal activities, as well as violent extremism and terrorism
– Abuse of data, social engineering, misuse, or trespassers in our facilities, or systems being rendered unusable
– State-driven economic espionage or competitor-driven industrial espionage, and criminal activities including, but not limited to, cyberattacks and breaches against cloud services and hosted on-premise software, whether managed by us or our customers, partners, or other third parties
– Disruptions to back-up, disaster recovery, or business continuity management processes
– Disruptions due to exposure of our network systems to cybersecurity attacks via defects and vulnerabilities in the IT systems of our customers, or in the systems of third parties that facilitate our business activities such as cloud service providers, including those that are beyond SAP’s cybersecurity infrastructure and protocols
– Failure to securely and successfully deliver cloud services by any cloud service provider could have a negative impact on customer trust in cloud solutions
– Cybersecurity threats for SAP and customers due to delayed or insufficient responses to identified cybersecurity issues attributable to complexity, interdependencies or other factors
– Challenges in effectively synchronizing cybersecurity processes across our various lines of business in a heterogeneous environment
– Insufficient or ineffective asset management potentially endangering secure operations
– Customer systems or systems operated by SAP being compromised by vulnerabilities due to threat actor exploitation
– Operational disruptions due to an increasing number of destructive malware, ransomware, or other cybersecurity attacks
120 | | Risk Management and Risks |
To Our | Combined Group | Consolidated Financial | Further Information on Economic, | Additional |
Stakeholders | Management Report | Statements IFRS | Environmental, and Social Performance | Information |
– Breach of cybersecurity measures due to, for example but not limited to, employee error or wrongdoing, system vulnerabilities, malfunctions, or attempts of third parties to fraudulently induce employees, users, partners, or customers to gain access to our systems, data, or customers’ data
– Failure to maintain a sufficient complement of personnel with sufficient levels of knowledge, experience, and training in cybersecurity matters necessary to support SAP’s evolving cybersecurity needs and commensurate with the increasingly complex and sophisticated threat landscape
– Increased challenges due to an expanding and morphing cyber-attack surface attributable to interconnected technologies such as Internet of Things (IoT) accompanied by an elevation of entry and endpoints
– Expansion of cybersecurity attack surface due to increased connectivity of operational data
– Material recovery costs as well as significant contractual and legal claims by customers, partners, authorities (including state, federal, and non-U.S.), and third-party service providers which could expose us to significant expense and liability and/or result in the issuance of orders, judgments, or consent decrees that could require us to modify our business practices
– Material costs to attempt to detect, prevent, and mitigate any successful attacks, including but not limited to the costs of third-party legal and cybersecurity experts and consultants, insurance costs, additional personnel and technologies, organizational changes, and incentives to customers and partners to compensate for any losses and/or retain their business
– Increasing sophistication, proliferation, and escalation in frequency, severity, and impact of cybersecurity attacks
– Inability to discover a cybersecurity breach or a loss of information either fully, in a timely manner, for a significant amount of time after the breach, or at all
– Inability to anticipate attacks or implement sufficient mitigating measures
– Insufficient investment, coordination, or resources to achieve our objective of ensuring over time that our cybersecurity infrastructure meets or exceeds evolving industry standards, and defending against the ever-evolving and emerging threat landscape
– Material costs and time associated with enhancing our cybersecurity infrastructure, which may impact the ongoing pace of development and delivery of our products and services, and our financial performance
– Failure to integrate SAP’s cybersecurity infrastructure and protocols with other network systems obtained through acquisition, including addressing cybersecurity defects and vulnerabilities in acquired systems
– Failure to maintain SAP’s cybersecurity infrastructure and protocols in connection with the divestiture of businesses and network systems from SAP
– Inaccurate or incomplete third-party or SAP audit results, certifications, or representations concerning the adequacy of our cybersecurity infrastructure and protocols
– Customer concerns and loss of confidence in the current or future security and reliability of our products and services, including cloud solutions, and the resulting termination of key contracts by customers and partners
Any one or more of these events could have a material adverse effect on our business, financial position, profit, and cash flows.
In response to the increasing number of cybersecurity attacks and because we anticipate threat actor techniques to continue to evolve in our complex and threatening cybersecurity landscape, SAP has expended significant resources to enhance its cybersecurity program, has increased the Board’s governance of and involvement in cybersecurity matters, and continues to investigate and remediate vulnerabilities. In particular, SAP has established measures intended to address the described risks and adverse effects, such as:
– Software security development lifecycle as a mandatory, integral part of our software development process, including checks on open-source component coverage
– For the Applications, Technology & Services segment, we strive to align our software security development lifecycle to the recommendations of ISO/IEC 27034, applying methods to develop secure software.
– Customers are provided with security certifications (such as ISO/IEC 27001), security white papers, and reports from independent auditors and certification bodies.
– Review/audit of our certifications and representations to customers concerning our cybersecurity infrastructure and protocols
– An SAP Global Security Policy that is mandatory for all employees and supported by documented security standards, procedures, and good practices including specific security training curricula for our developers
– Product standard requirements such as mandatory non-erroneous modeling taking into account software dependencies
– Disaster recovery and business continuity plans to protect our key IT infrastructure (especially our data centers) include implementation of data redundancies and daily data backup strategies.
– Corporate headquarters, which house certain critical business functions, are located in the German state of Baden-Württemberg, an area that is historically free of natural disasters.
– Certification of IT-related organizations to the internationally recognized Business Continuity Management standard with regards to the Applications, Technology & Services segment
– We have a responsible disclosure process in place to detect vulnerabilities and have implemented security patch days to rapidly respond to customer security needs and provide fixes.
– Increased investments, coordination, and resources, including various internal initiatives, to achieve SAP’s objective of ensuring over time that our cybersecurity infrastructure meets or exceeds evolving industry standards
– Improved monitoring with respect to implementing enhancements to our cybersecurity infrastructure
– Improved roll-out procedures for security-relevant notes, patches, and service packs to ensure easy and fast consumption on the customer side
– Continuous vigilance, adaptation, standardization, and modification of our security procedures, such as security risk identification, threat modeling, advanced threat defense, a comprehensive security testing strategy, container security enhancements, mandatory security training for all developers,
Risk Management and Risks | | 121 |
To Our | Combined Group | Consolidated Financial | Further Information on Economic, | Additional |
Stakeholders | Management Report | Statements IFRS | Environmental, and Social Performance | Information |
and security validation of our critical components, products, patches, and services before shipment
– Focus on development and implementation of heightened cybersecurity measures designed to further safeguard SAP’s most strategic assets
– Continuous enhancement of holistic assessment methodologies and means in order to keep pace with technology
– Continuous enhancement of cloud-based central DNS (Domain Name System) filtering capabilities, managing endpoints, malware filtering, and data leakage prevention
– Measures such as technical IT security measures, identity and access management, and mandatory security and compliance training
– Investment in data and asset governance of SAP’s global asset repository
– Physical security measures such as access control systems and employee identification
– Focus on increased coordination across our various lines of business with respect to our ability to detect, identify, and respond in a timely manner to unauthorized incursions in our systems
– Focus on increased hiring, training, development, and retention of skilled personnel in SAP’s cybersecurity and product security workforce
– Increased employee, contractor, third-party, and partner awareness through campaigns and cybersecurity awareness training courses and projects
– Local and regional crisis management teams to respond and minimize possible losses in case of crisis situations
– Engagement of experts to advise on appropriate cybersecurity protocols and to further increase attention and awareness to cybersecurity protocols and protections
As we continuously observe and investigate an increase in malicious cyber-attacks, we subsequently increase the probability of occurrence of this risk to highly-likely while we cannot exclude the possibility that risks that have materialized, alone or in combination with other risks that may materialize, could have a business-critical impact on our customers, our partners, our operations, financial position, our reputation, and our business in general. We classify this increased risk as a high risk. For more information, see the Security, Data Protection, and Privacy section.
Technology and Products: Our technology and/or products may experience undetected defects, coding or configuration errors, may not integrate as expected, or may not meet customer expectations.
Our product strategy and development investment, including new product launches and enhancements, are subject to risks in the following areas, among others:
– Software products and services might not fully meet market needs or customer expectations
– Software products and services from acquired companies might not fully comply with SAP quality standards
– We might not be as fast as expected in integrating our platforms and solutions, enabling the complete product and cloud service portfolio, harmonizing our user interface design and technology, integrating acquired technologies and products, or bringing packages, services, or new solutions based on the SAP HANA platform as well as SAP Cloud Platform to the market.
– New products, services, and cloud offerings, including third-party technologies, might not comply with local standards and requirements or might contain defects or might not be mature enough from the customer’s point of view for business-critical solutions after shipment despite all the due diligence SAP puts into quality.
– Inability to define and provide adequate solution packages and scope for all customer segments
– Inability of algorithms to correctly adapt to evolving circumstances may lead to adverse decision-making processes in the context of artificial intelligence related technologies
– Inability to fulfil expectations of customers regarding time and quality in the defect resolution process
– Lack of customer references for new products and solutions
Any one or more of these events could have an adverse effect on our business, financial position, profit, and cash flows.
SAP has established measures to address and mitigate the described risks and adverse effects, such as:
– Increased focus on localization needs to further meet customer demands
– A broad range of techniques, including project management, project monitoring, product standards and governance, and rigid and regular quality assurance measures certified to ISO 9001:2015, applicable to the Applications, Technology & Services segment
– Threat modelling at the beginning of every development project to identify potential risks including but not limited to using centrally provided tools
– A holistic testing strategy to validate the state of quality and security for every product before market introduction
– Regular direct customer feedback is considered in the market release decision process
– Continue to maintain the high quality level of our products, (which is made transparent in the defined KPIs for quality transparency and confirmed by our constantly high customer satisfaction ratings as measured by our customer survey)
– Continue to drive the integration and convergence of our technology platform offerings SAP S/4HANA and SAP C/4HANA, as well as acquired technologies
– Enable our current product portfolio for SAP HANA, develop new solutions based on SAP HANA, and offer comprehensive cloud-based services, extendable with SAP Cloud Platform
– A comprehensive certification program designed to ensure that relevant third-party solutions are of consistently high quality
We cannot exclude the possibility that if the risk were to occur, it could have a business-critical impact on our operations, financial position, profit, and cash flows. However, we estimate the probability of occurrence of this risk to be unlikely. We classify this risk as a medium risk.
122 | | Risk Management and Risks |
To Our | Combined Group | Consolidated Financial | Further Information on Economic, | Additional |
Stakeholders | Management Report | Statements IFRS | Environmental, and Social Performance | Information |
Strategic Risks
Market Share and Profit: Our market share and profit could decline due to increased competition, market consolidation, technological innovation, and new business models in the software industry.
The market for cloud computing is increasing and shows strong growth relative to the market for on-premise solutions. To maintain or improve our operating results in the cloud business, it is important that our customers renew their agreements with us when the initial contract term expires and purchase additional modules or additional capacity, as well as for us to attract new customers. Additionally, we need to bring new solutions based on the SAP HANA business data platform, new technologies, as well as SAP Cloud Platform to the market in line with demands and ahead of our competitors. In particular, innovative applications supporting the Intelligent Enterprise such as SAP S/4HANA, SAP C/4HANA, or newer technologies such as Internet of Things, machine learning, robotic process automation (RPA), which automates rule-based, repetitive tasks, digital assistants (including voice recognition and interaction), and blockchain.
Factoring in the aforementioned, this could lead to risks in the following areas, among others:
– Inability to successfully engage with on-premise customers on their cloud transformation journey with fully suitable solutions and transformation services
– Inability to successfully execute our strategy for integrating hyperscalers
– Adverse revenue effects due to increasing cloud business and conversions from on-premise licenses to cloud subscriptions from existing SAP customers, which could have an adverse effect on related maintenance and services revenue
– Insufficient solution and service adoption together with increased complexity, as well as failures during the execution of our intelligent enterprise strategy in the context of our portfolio for solutions and services could lead to a loss of SAP’s position as a leading cloud company and subsequently to reduced customer adoption.
– Customers and partners might be reluctant or unwilling to migrate and adapt to the cloud, or they might consider cloud offerings from our competitors.
– Existing customers might cancel or not renew their contracts (such as maintenance or cloud subscriptions) or decide not to buy additional products and services.
– The market for cloud business might not develop further, or it might develop more slowly than anticipated.
– Strategic alliances among competitors and/or their growth-related efficiency gains in the cloud area could lead to significantly increased competition in the market with regards to pricing and ability to integrate solutions.
– Price pressure, cost increases, and loss of market share through traditional, new, and especially cooperating competitors and hyperscalers
– Inability to achieve the planned margin increase in time as planned
Any one or more of these events could have an adverse effect on our business, financial position, profit, and cash flows.
SAP has established measures to address and mitigate the described risks and adverse effects. For example, we:
– Share our overall long-term cloud strategy and our integration road map with our customers, and continuously implement improvements to enhance our cloud solutions through our intelligent enterprise strategy, also covering the integration of experiential and operational data
– Demonstrate the benefits of our solution and services portfolio through end-to-end integration scenarios, homogeneous and compelling user interfaces, intelligent technologies, customer references, and success stories
– Enable and support our customers in their transition path from on-premise to cloud, for example through the cloud extension policy and our SAP S/4HANA Movement program, a cross-departmental initiative to promote the migration of our existing ERP customers to the intelligent enterprise
– Balance the distribution of our strategic investments by evolving and protecting our core businesses and simultaneously developing new solutions, technologies, and business models for markets, such as those in analytics, applications, and database and technology
– Engage with our customers and offer a broader range of services to support and drive the digital transformation for our customers, for example with our premium service offerings
– Place strong focus on providing our cloud services efficiently and to customer expectations, including service provisioning, quality, security, and data protection and privacy
– Drive the integration and convergence of our technology platform offerings SAP S/4HANA and SAP C/4HANA, and acquired technologies
– Enable our current product portfolio for SAP HANA, develop new solutions based on SAP HANA, and offer comprehensive cloud-based services, extendable with SAP Cloud Platform and intelligent technologies
– Enable our portfolio for hyperscalers in order to extend customer reach and further meet customer expectations
– Deliver standard software and product packages that are fast and easy to install, as well as financially attractive financing and subscription models
– Enable and encourage partners to leverage SAP technology, by providing guidance about business opportunities, architecture, and technology, as well as a comprehensive certification program designed to ensure that relevant third-party solutions are of consistently high quality
– Continue to move SAP HANA Enterprise Cloud towards full-stack offering, and increase the share of high-value cloud application services to further improve the margin
We cannot exclude the possibility that if the risk were to occur, it could have a business-critical impact on our operations, financial position, profit, and cash flows. However, we estimate the probability of occurrence of this risk to be unlikely. We classify this risk as a medium risk.
Mergers and Acquisitions: We might not acquire and integrate companies effectively or successfully.
To expand our business, we acquire businesses, products, and technologies, and we expect to continue doing so in the future. Over time, certain of these acquisitions have increased in size and in
Risk Management and Risks | | 123 |
To Our | Combined Group | Consolidated Financial | Further Information on Economic, | Additional |
Stakeholders | Management Report | Statements IFRS | Environmental, and Social Performance | Information |
strategic importance for SAP. Management negotiation of potential acquisitions and the integration of acquired businesses, products, or technologies demands time, focus, and resources of both management and workforce, and exposes us to unpredictable operational difficulties.
Acquiring businesses, products, and technologies may present risks to SAP, including risks related to the following areas, among others:
– Incorrect information or assumptions during the due diligence process for the acquisition (including information or assumptions related to the business environment and/or business and licensing models)
– Failure to integrate acquired technologies or solutions successfully and profitably into SAP’s solution portfolio and strategy
– Failure to successfully integrate acquired entities, operations, cultures, or languages, all within the constraints of applicable local laws
– Unfulfilled needs of the acquired company’s customers or partners
– Material unidentified liabilities of acquired companies (including legal, tax, IP)
– Failure in implementing, restoring, or maintaining internal controls, disclosure controls and procedures, and policies within acquired companies
– Incompatible practices or policies (compliance requirements)
– Insufficient integration of the acquired company’s accounting, HR, and other administrative systems
– Failure to coordinate or successfully integrate the acquired company’s research and development (R&D), sales, marketing activities, and security and cybersecurity protocols
– Debt incurrence or significant unexpected cash expenditures
– Non-compliance with existing SAP standards including applicable product standards such as our open source product standards
– Impairment of goodwill and other intangible assets acquired in business combinations
– Non-compliance of the acquired company with regulatory requirements, for example accounting standards, export control laws, and trade sanctions, for which SAP with and by the acquisition assumes responsibility and liability, including potential fines and the obligation to remedy the non-compliance
Any one or more of these events could have an adverse effect on our business, financial position, profit, and cash flows.
SAP has established measures to address and mitigate risks and adverse effects associated with acquisitions, such as:
– Technical, operational, financial, and legal due diligence on the company or assets to be acquired
– A holistic evaluation of material transaction and integration risks
– Identification, implementation, and tracking of risk mitigation measures for material transactions or integration risks
– A standardized methodology for detailed integration planning, which is carried out by a dedicated integration team
– Process, risk, and control analyses accompanied by subsequent integration into SAP’s processes and control framework, and supported by mitigations as required by any specific circumstances to subsequently increase adherence to SAP’s standards and policies
As we continue to grow through our recent significant and innovative acquisitions, we concurrently observe a logically connected increase in the complexity of our associated integration activities. Consequently, we increase our estimate of the occurrence of this Mergers and Acquisitions risk to be likely and we cannot exclude the possibility that if the risk were to occur, it could have a major impact on our operations, financial position, profit, and cash flows. We classify this increased risk as a medium risk.
Innovation: We might not be able to compete effectively if we strategize our solution portfolio ineffectively or if we are unable to keep up with rapid technological and product innovations, enhancements, new business models, and changing market expectations.
Our future success depends on our ability to keep pace with technological and process innovations and new business models, as well as on our ability to develop new products and services, enhance and expand our existing products and services portfolio, and integrate products and services we obtain through acquisitions. To be successful, we are required to adapt our products and our go-to-market approach to a cloud-based delivery and consumption model to satisfy increasing customer demand and to ensure an appropriate level of adoption, customer satisfaction, and retention.
Considering preceding dependencies, this could lead to risks in the following areas, among others:
– Inability to bring new business models, solutions, solution enhancements, intelligent technologies, integrations and interfaces, and/or services to market before our competitors or at equally favorable terms
– Inability to develop and sell new cloud products spanning various organizations on time and in line with market demands due to complexity in heterogeneous technical environments
– Inability to anticipate and develop technological improvements or succeed in adapting SAP products, services, processes, and business models to technological change, changing regulatory requirements, emerging industry standards, and changing requirements of our customers and partners (especially with innovations such as SAP S/4HANA, SAP C/4HANA, and SAP Cloud Platform) to support the intelligent enterprise strategy
– Uncertainties regarding new SAP solutions, technologies, and business models as well as delivery and consumption models might lead customers to wait for proofs of concept or holistic integration scenarios through reference customers or more mature versions
– Lower level of adoption of our new solutions, technologies, business models, and flexible consumption models, or no adoption at all
– Our product and technology strategy might not be successful, or our customers and partners might not adopt our technology platforms, applications, or cloud services quickly enough or they might consider other competing solutions in the market, or our strategy might not match customers’ expectations, specifically in the context of expanding the product portfolio into additional markets.
– Increasing competition from open source software initiatives, or comparable models in which competitors might provide software and intellectual property free and/or at terms and conditions unfavorable for SAP.
124 | | Risk Management and Risks |
To Our | Combined Group | Consolidated Financial | Further Information on Economic, | Additional |
Stakeholders | Management Report | Statements IFRS | Environmental, and Social Performance | Information |
– Inability to drive growth of references through customer use cases and demo systems
Any one or more of these events could have an adverse effect on our business, financial position, profit, and cash flows.
SAP has established measures to address and mitigate the described risks and adverse effects. For example, we:
– Align our organization, processes, products, delivery and consumption models, and services to changing markets and customer and partner demands
– Develop new technology and new solutions such as the next-generation suite SAP S/4HANA, SAP C/4HANA, or the next-generation SAP Analytics Cloud solution
– Explore future trends as well as the latest technologies, for example through our network of innovation centers as part of the Technology and Innovation board area, and adapt these to the market if there is a clear business opportunity for SAP and value to our customers
– Conduct wide-ranging market and technology analyses and research projects, often in close cooperation with our customers and partners, to remain competitive
– Make strategic acquisitions with the potential to drive innovation and contribute to achieving our growth target
We cannot exclude the possibility that if the risk were to occur, it could have a business-critical impact on our operations, financial position, profit, and cash flows. However, we estimate the probability of occurrence of this risk to be remote. We classify this risk as a medium risk.
Consolidated Risk Profile
We consolidate and aggregate relevant risks identified by the different business units and functions following our risk management policy, monitored by a Group-wide risk management governance function.
Based on our aggregation approach, we recognized only minor changes in 2019 in the percentages of all reported risks categorized as “high” or “medium” in our risk level matrix. The number of risks categorized as “high” accounted for 27% (2018: 27%) of all reported risks, while the risks categorized as “medium” accounted for 45% (2018: 45%) of all risks reported in the Risk Factors section.
In our view, considering their impact level and likelihood of occurrence, the risks described in our aggregated risk report do not individually or cumulatively threaten our ability to continue as a going concern. Management remains confident that the Group’s earnings strength forms a solid basis for our future business development and provides the necessary resource to pursue the opportunities available to the Group. Because of our structured processes for early risk identification, we are confident that we can continue to counter the challenges arising from the risks in our risk profile in 2020.
Risk Management and Risks | | 125 |
To Our | Combined Group | Consolidated Financial | Further Information on Economic, | Additional |
Stakeholders | Management Report | Statements IFRS | Environmental, and Social Performance | Information |
Expected Developments and Opportunities
Future Trends in the Global Economy
The recovery in global economic activity is expected to be mild in 2020, according to the European Central Bank (ECB) in its December 2019 Economic Bulletin.1) The main influences will be a deceleration of growth in advanced economies and China, and a moderate recovery in some emerging economies (even if less dynamic than previously expected).
In the Europe, Middle East, and Africa (EMEA) region, the ECB predicts that the ongoing weakness of international trade will weigh on the euro area economy in 2020 due to persistent global uncertainties. However, the ECB’s economic data, while remaining weak overall, points to a stabilization in the slowdown of economic growth in the euro area. The ECB expects the euro area economy to grow by 1.1% in 2020 and by 1.4% in both 2021 and 2022. At the same time, economic growth is projected to remain buoyant in central and eastern European countries over the projection horizon. In Russia, the medium-term outlook will be shaped primarily by fiscal and structural policy implementation, global oil market developments, and the scope of the international sanctions regime.
Looking at the Americas region, the ECB expects economic activity in the United States to remain resilient in the near term, but to decelerate in the medium term to growth rates of just below 2%. This will, however, depend on the outcome of continuing trade talks with China and many other countries. In Brazil, medium-to-long term growth will be significantly influenced by the degree to which necessary fiscal reforms are going to be implemented.
For the Asia Pacific Japan (APJ) region, the ECB projects that economic activity in Japan will grow moderately over the medium term, but weaken temporarily following the value-added tax hike in October 2019. A recently announced fiscal stimulus package could provide some support to economic growth further ahead. The gradual transition of China to a lower growth path will weigh on the global economy as a whole in the coming years. However, the Chinese economy might pick up marginally in 2021 and 2022, supported by policy actions and the implementation of structural reforms.
With regard to growth rates, the International Monetary Fund (IMF) projects the following economic trends for the mid-term horizon until the end of 2020:
Economic Trends | | | |
GDP Growth Year Over Year | | | |
% | 2018 | 2019e | 2020p |
World | 3.6 | 2.9 | 3.3 |
Advanced economies | 2.2 | 1.7 | 1.6 |
Developing and emerging economies | 4.5 | 3.7 | 4.4 |
Regions (according to new IMF taxonomy) | | | |
Euro area | 1.9 | 1.2 | 1.3 |
Germany | 1.5 | 0.5 | 1.1 |
Emerging and Developing Europe | 3.1 | 1.8 | 2.6 |
Middle East and Central Asia | 1.9 | 0.8 | 2.8 |
Sub-Saharan Africa | 3.2 | 3.3 | 3.5 |
United States | 2.9 | 2.3 | 2.0 |
Canada | 1.9 | 1.5 | 1.8 |
Latin America and the Caribbean | 1.1 | 0.1 | 1.6 |
Japan | 0.3 | 1.0 | 0.7 |
Emerging and Developing Asia | 6.4 | 5.6 | 5.8 |
China | 6.6 | 6.1 | 6.0 |
e = estimate, p = projection | | | |
Source: International Monetary Fund (IMF), World Economic Outlook Update January 2020, Tentative Stabilization, Sluggish Recovery?
(https://www.imf.org/~/media/Files/Publications/WEO/2020/January/English/text.ashx?la=en), p. 9.
The IMF changed the taxonomy and grouping of countries and regions in October 2019.
The IT Market:
Outlook for 2020 and Beyond
International Data Corporation (IDC), a U.S.-based market research firm, predicts that within the next four years, the global economy will reach “digital supremacy”2): More than half of all global GDP will then be driven by products and services from digitally transformed enterprises. Digital apps and services will be created and enhanced many times faster than today, in much greater numbers, and based on massively expanded digital supply chains. In addition, by 2024 more than 50% of all IT spending will be directed toward digital transformation and innovation, which means an annual growth rate of 17% compared to 2% for the rest of IT (for example, maintenance of existing systems). The largest growth, however, will be in data intelligence and analytics, 48% of this represented by the Internet of Things (IoT) alone.3)
Along with this development, IDC expects a strong market concentration over the coming years: By 2023, the top five public cloud platforms will make up at least 75% of infrastructure- and
126 | | Expected Developments and Opportunities |
To Our | Combined Group | Consolidated Financial | Further Information on Economic, | Additional |
Stakeholders | Management Report | Statements IFRS | Environmental, and Social Performance | Information |
platform-as-a-service (IaaS/PaaS) market share (62% in 2018). At the same time, the top ten pure-play software-as-a-service (SaaS) vendors will generate an average of nearly 20% of revenue from expanding their PaaS solutions coming along with their apps (4% in 2018).2)
In recent publications, IDC puts particular emphasis on the importance of artificial intelligence (AI), which it believes will become “inescapable” over the coming years. It expects investments in Big Data analytics and cognitive AI to reach over $265 billion in 2023 ($124 billion in 2019).3) Investments in AI solutions alone might grow by 38% annually until 2022, by which time revenue could reach $79.2 billion.4)
By 2025, at least 90% of new enterprise apps will embed AI, and over half of all user interface transactions will use technologies such as computer vision, natural language processing, and gesture control, says IDC.2) Already by 2022, over 75% of enterprise application suppliers might have connected their business apps to create a digital core that enable them to analyze different types of data from numerous sources.4) What’s more, by 2025, 50% of business applications could have functionality that does not yet exist, making them far more efficient than today’s offerings and requiring significantly less human intervention.4
Sources:
1) European Central Bank, Economic Bulletin, Issue 8/2019, Publication Date: December 27, 2019 (https://www.ecb.europa.eu/pub/pdf/ecbu/eb201908.en.pdf)
2) IDC FutureScape: Worldwide IT Industry 2020 Predictions, Doc #US45599219, October 2019
3) IDC FutureScape: Worldwide Digital Transformation 2020 Predictions, Doc #US45569118, October 2019
4) IDC FutureScape: Worldwide Intelligent ERP 2020 Predictions, Doc US44646019, October 2019
Impact on SAP
The digital transformation of the global economy is in full swing, and SAP’s broad solution portfolio and innovation strategy are playing a key role in this evolution. Though current macroeconomic uncertainties are holding back individual countries and sectors, the majority of enterprises is taking advantage of the latest technological developments to restructure their business models, win market share, and increase efficiency.
SAP’s innovative applications and our offerings for next-generation technologies such as machine learning, AI, blockchain, and the IoT are convincing more customers of the power and efficiency of our portfolio and our technology platform. We also offer our customers unparalleled flexibility options for using our software – on premise, in the cloud, or hybrid.
We continue to expect solid growth going forward, particularly with respect to our cloud solutions, which remain in high demand.
Financial Targets and Prospects
Revenue and Operating Profit Targets and Prospects (Non-IFRS)
Outlook 2020
The Company is providing the following 2020 outlook:
– Non-IFRS cloud revenue is expected to be in a range of €8.7 billion to €9.0 billion at constant currencies (2019: €7.01 billion), up 24% to28% at constant currencies.
– Non-IFRS cloud and software revenue is expected to be in a range of €24.7 billion to €25.1 billion at constant currencies (2019: €23.09 billion), up 7% to 9% at constant currencies.
– Non-IFRS total revenue is expected to be in a range of €29.2 billion to €29.7 billion at constant currencies (2019: €27.63 billion), up 6% to 8% at constant currencies.
– Non-IFRS operating profit is expected to be in a range of €8.9 billion to €9.3 billion at constant currencies (2019: €8.21 billion), up 8% to13% at constant currencies.
– The share of more predictable revenue (defined as the total of cloud revenue and software support revenue) is expected to be approximately 70%.
We expect that, in 2020, the gross margin from our Intelligent Spend Group segment will be higher than 80% (2019: 78%).
We expect that, in 2020, the gross margin from our public cloud offerings will reach approximately 70% (2019: 68%), and expand to about 80% over the course of the two years thereafter.
We expect the gross margin from our private cloud offerings to be in a range of approximately 30% to 35% by 2020 (2019: 29%).
We continue to expect the cloud gross margin to be approximately 71% by 2020.
We expect the 2020 gross margin for our software licenses and support to remain at a similar level to 2019 (2019: 87%).
In addition, we expect our 2020 gross margin for services to remain at a similar level to 2019 (2019: 25%).
As we look to increase our profitability through 2020, our cost ratios (cost as a percentage of total revenue) are expected to develop as follows through 2020: Research and development is expected to remain at the current level; sales and marketing as well as general and administration are expected to decline slightly.
Further, we expect the segment profit to increase in all our reportable segments.
While SAP’s full-year 2020 business outlook is at constant currencies, actual currency reported figures are expected to be impacted by currency exchange rate fluctuations throughout the year. See the table below for the full-year 2020 expected currency impacts. These currency expectations for the full-year 2020 are based on the December 2019 level.
In percentage points | 2020 |
Cloud subscriptions and support | –1pp to +1pp |
Cloud and software | –1pp to +1pp |
Operating profit | 0pp to +2pp |
The following table shows the estimates of the items that represent the differences between our non-IFRS financial measures and our IFRS financial measures.
Non-IFRS Measures | | |
€ millions | Estimated | Actual |
| Amounts for | Amounts |
| 2020 | for 2019 |
Revenue adjustments | 0–30 | 81 |
Share-based payment expenses | 1,200–1,600 | 1,835 |
Acquisition-related charges | 580–690 | 689 |
Restructuring | 10–20 | 1,130 |
Expected Developments and Opportunities | | 127 |
To Our | Combined Group | Consolidated Financial | Further Information on Economic, | Additional |
Stakeholders | Management Report | Statements IFRS | Environmental, and Social Performance | Information |
The Company expects a full-year 2020 effective tax rate (IFRS) of 27.0% to 28.0% (2019: 26.7%) and an effective tax rate (non-IFRS) of 26.5% to 27.5% (2019: 26.2%).
Proposed Dividend
In line with our dividend policy of distributing at least a dividend totaling 40% or more of the prior year’s profit after tax, we intend to pay a dividend of €1.58 per share (subject to shareholder approval at the Annual General Shareholders meeting in May 2020). Besides this, the Company intends to repurchase shares with a volume of €1.5 billion by December 31, 2020. For more information, see the Financial Performance: Review and Analysis section.
Organizational Changes
At the beginning of 2020, SAP modified its organizational structure to strengthen the focus on customer success and employee engagement while driving innovation and simplicity. The set-up moving forward aims at raising synergies, reducing complexity while initiating key steps towards further integration. The organizational changes will also affect SAP’s segment reporting. SAP has already started the process of redefining its management reporting under the new organizational structure, which the segment reporting will follow.
Medium-Term Prospects
In this section, all numbers are based exclusively on non-IFRS measures.
SAP expects to grow our more predictable revenue while steadily increasing operating profit. Our strategic objectives are focused primarily on our main financial and non-financial objectives: growth, profitability, customer loyalty, and employee engagement.
At the beginning of 2019, we introduced a 2023 ambition. Over the period from 2018 through 2023, SAP continues to expect to:
– More than triple our non-IFRS cloud revenue (2018: € 5.03 billion)
– Grow our non-IFRS total revenue to more than €35 billion (2018: €24.74 billion)
– Approach a share of more predictable revenue of 80%.
– Reach a non-IFRS cloud gross margin of 75%
– Increase the non-IFRS operating margin by one percentage point (pp) per year on average, representing a total expansion of approximately 500 basis points. We expect to achieve this result based on the following effects:
An adverse revenue mix effect of approximately minus 4pp.
Our cloud gross margin expansion will add approximately 5pp.
Our services margin expansion will add approximately 0.5pp.
Reduction of our sales and marketing expense ratio will add between 2.5pp and 3pp (2018: 25%).
Reduction of our general and administration expense ratio will add between 0.5pp and 1pp(2018: 4%).
The gross margin for our software licenses and support (2018: 87%) as well as our research and development cost ratio (2018: 14%) is expected to remain at a similar level to 2018.
Investment Goals
Our planned investment expenditures for 2020 and 2021, other than for business combinations, consist primarily of the purchase of IT infrastructure and the construction activities described in the Assets (IFRS) section of this report. We expect investments in IT infrastructure of approximately €591 million and in construction activities of approximately €235 million in 2020. In 2020, we expect total capital expenditures of approximately €1.1 billion. In 2021, capital expenditures are expected to stay at a similar level as in 2020.
Goals for Liquidity and Finance
As at December 31, 2019, we had a net debt of €8,286 million. We believe that our liquid assets, combined with our undrawn credit facilities, are sufficient to meet our operating financing needs in 2020 as well, and, together with expected cash flows from operations, will support debt repayments and our currently planned capital expenditure requirements over the near and medium term.
In 2020, compared to 2019, we expect lower cash outflows for restructuring and extraordinary taxes. Together with a positive impact from our operating activity, we expect about €6 billion in operating cash flow for 2020. Free cash flow (as redefined in response to IFRS 16) is expected to increase to a level of €4.5 billion. For 2023, we expect around €8 billion in free cash flow.
We intend to repay €1,150 million in Eurobonds and US$290 million in U.S. Private Placements in 2020. In addition, we might refinance the full or portions of the currently outstanding €2.0 billion Qualtrics acquisition term loan with additional capital market transactions. The ratio of net debt as at December 31, 2020, of around €7 billion divided by the total of operating profit (IFRS) plus depreciation and amortization should be below 0.9. From 2020 to 2023, we expect to reduce net debt due to scheduled debt repayments of around €6.2 billion.
Non-Financial Goals 2020 and Ambitions for 2023
In addition to our financial goals, we also focus on three non-financial targets: customer loyalty, employee engagement, and carbon emissions.
For 2020 throughout to 2023, we aim to lift employee engagement, as measured by the Employee Engagement Index, and keep it between 84% and 86%. (2019: 83%).
We measure customer loyalty using the Customer Net Promoter Score (NPS). We are targeting to increase the Customer NPS by 3 points to 5 points in 2020 and to steadily increase the Customer NPS in 2021 and beyond. (2019: –6).
We aim to decrease carbon emissions to 238 kt in 2020 (2019: 300 kt) with a steady decrease further on, reaching 95kt by 2023. Our overarching ambition is to achieve a net-zero carbon footprint of SAP’s operations by 2025.
Premises on Which Our Outlook and Prospects Are Based
In preparing our outlook and prospects, we have taken into account all events known to us at the time we prepared this report that could influence SAP’s business going forward.
Outlook for SAP SE
The primary source of revenue for SAP SE is the license fees it charges subsidiaries for the right to market and maintain SAP software solutions. Consequently, the performance of SAP SE in operating terms is closely tied to the cloud and the software revenue of the SAP Group.
128 | | Expected Developments and Opportunities |
To Our | Combined Group | Consolidated Financial | Further Information on Economic, | Additional |
Stakeholders | Management Report | Statements IFRS | Environmental, and Social Performance | Information |
Despite the increase in cloud and software revenue expected for the SAP Group in 2020, we expect product revenue for SAP SE in 2020 to remain at the level of 2019. This is due to the reduction of the license fees on cloud solutions payable to SAP SE by its subsidiaries which was implemented per August 2019.
Considering the € 603 million in restructuring costs in 2019 and that no major restructuring is planned for 2020, we expect SAP SE’s operating profit to increase strongly in 2020, assuming that there are no significant effects from acquisitions or other unforeseeable occurences.
The financial ambitions of the SAP Group for the years 2021 to 2023 provide for further growth of revenue and profit. We expect that such growth will also result in further revenue and profit growth for SAP SE to the same degree.
We expect that SAP SE will continue to receive investment income in the form of profit transfers and dividends from its subsidiaries. The growth we expect for the SAP Group should have a positive effect on this investment income.
The outlook for the SAP Group in respect to liquidity, finance, investment, and dividend are equally applicable to SAP SE.
Among the assumptions underlying this outlook are those presented above concerning the economy and our expectations for the performance of the SAP Group.
Opportunities
Our customers rely on SAP as the trusted partner in their digital business transformations, not only for providing a Business Technology Platform for business process automation, standardized cloud and on-premise solutions, and access to business networks, but also for enabling business model innovations. SAP believes in continuous, agile innovation to exceed customer and market expectations, such as the embedding of intelligent technologies and Experience Management (XM) into our solution portfolio.
We have established a framework for opportunity management by evaluating and analyzing four key areas: current markets, competitive landscapes, external scenarios, and technological trends. We have also delved into customer and product segmentation, growth drivers, and industry-specific success factors. Based on these combined insights, our Executive Board defines our market strategies. Our shareholder value relies heavily upon a fine balance of risk mitigation and value-driven opportunities. Therefore, our strong governance model ensures that decisions are based on return, investment required, and risk mitigation. We rely on the talent and resources within SAP and our entire ecosystem.
As far as opportunities are likely to occur, we have incorporated them into our business plans, our outlook for 2020, and our medium-term prospects outlined in this report. Therefore, the following section focuses on future trends or events that might result in an uplift of our outlook and medium-term prospects, if they develop better than we have anticipated in our forecasts.
SAP SE is the parent company of the SAP Group and earns most of its revenue from subscription fees, software license fees, and dividends paid by affiliates. Consequently, the opportunities described below also apply – directly or indirectly – to SAP SE.
Opportunities from Economic Conditions
Economic conditions have a clear influence on our business, financial position, profit, and cash flows. Should the global economy experience more sustained growth than is reflected in our plans today, our revenue and profit may exceed our current outlook and medium-term prospects.
Our medium-term planning is based on unchanged market conditions in emerging markets. Should their stability increase again, this would be an upside to our medium-term planning.
For more information about future trends in the global economy and the IT market outlook, as well as their potential influence on SAP, see the beginning of Expected Developments and Opportunities section.
Opportunities Through Innovation
Our continued growth through innovation is based on our ability to leverage research and development (R&D) resources effectively. We continue to improve our development processes through design thinking and lean methodologies. We are accelerating innovation cycles, especially in the area of cloud solutions, and engaging more closely with our customers to enable success. In addition, we continue to expand open innovation initiatives to support long-term innovation in strategic opportunity areas, supporting talented innovators both inside (employees, for example) and outside (startups, for example) of SAP.
In addition to speed of innovation, we also focus on ease of adoption, so our customers can receive the benefits from our software applications and technologies at reduced time to value. Enabling our customers to adopt our innovations faster, for example, accelerated adoption of the SAP S/4HANA suite through our SAP S/4HANA Movement program, or enabling greater customer success through our Customer First program, may positively impact our revenue, profit, and cash flows, and result in their exceeding our stated medium-term prospects.
For more information about future opportunities in research and development for SAP, see the Products, Research & Development, and Services section.
Opportunities from Our Strategy for Profitable Growth
SAP strives to generate profitable growth across our portfolio of products, solutions, and services to keep or improve our market position. Our aim is to continue to expand our addressable market through the extension of our portfolio and our new technologies and innovations. Moreover, higher efficiency in our cloud delivery may positively affect the profitability of our cloud business.
With the acquisition of Qualtrics, we see growth opportunities from creating a highly differentiated offering for businesses to deliver superior customer, employee, product, and brand experiences. With Qualtrics software, SAP will accelerate the new XM category by combining experience data and operational data to power the experience economy. For more information about the acquisition of Qualtrics, see the Strategy and Business Model section.
We also see opportunities in growing product and market areas, such as in the enhancement of business processes with intelligent technologies, which are key to our Intelligent Enterprise strategy. Capabilities including machine learning and artificial intelligence, predictive analytics, the Internet of Things and distributed
Expected Developments and Opportunities | | 129 |
To Our | Combined Group | Consolidated Financial | Further Information on Economic, | Additional |
Stakeholders | Management Report | Statements IFRS | Environmental, and Social Performance | Information |
computing, as well as blockchain, are also driving digital business transformation.
We also see additional opportunities arising through new collaborations, such as the partnership with Microsoft Azure, Amazon Web Services (AWS), and Google Cloud, which were announced in May 2019 under the “Embrace” program. This collaboration is aimed at the transition of customers from on-premise editions of ERP to SAP S/4HANA Cloud solutions on a common reference architecture, which we believe will drive faster innovation as well as consumption of SAP cloud services by facilitating access to state-of-art technologies of leading cloud providers.
Furthermore, SAP seeks to establish new business models and leverage our expanding ecosystem of partners to achieve scale and maximize opportunities. As an example of this, SAP has entered an innovative partnership with business-to-business platform Alibaba to market SAP solutions in its cloud marketplace.
Our strong assets in applications and analytics, as well as database and technology, continue to offer solid multiyear growth opportunities as we bring innovative technologies with simplified consumption to our installed base and continue to acquire new customers. Specifically, SAP C/4HANA, SAP HANA, cloud offerings, and SAP S/4HANA could create more demand than is reflected in our stated outlook and medium-term prospects.
Opportunities from Our Partner Ecosystem
SAP’s partner ecosystem is defined by the interdependent relationships of our customers, our employees, our suppliers, our partners, and our competition. Partners are adding value to key components of customer sales, implementation, and renewal cycles with SAP, and are primarily involved in new SAP customer acquisition through the entire range of customer segments.
With the launch of the Next-Generation Partnering initiative in 2019, we sharpened our focus on supporting growth and delivering quality across all our partner channels. Our partner program will reflect evolving partnering models and will introduce a new unified governance model to support the complete partner journey, including streamlined enablement, simplified certification, and new commercial models.
SAP is also refreshing our independent software vendor (ISV) business models, offering more transparency around our portfolio road maps to enable an exponential ecosystem of innovation around our core technologies. With the launch of new commercial models such as the Build engagement model in the SAP PartnerEdge program and SAP Endorsed Apps, these programs are putting partner solutions at the heart of our go-to-market motions, enabling a greater fit of SAP solutions for customers and increasing share of SAP customers using partner innovation.
Partners continue to increase indirect revenue for SAP with new names, installed base conversion, and partner innovation capabilities for SAP customers. With Next-Generation Partnering, SAP will help partners run intelligent solutions and technologies. The interaction of all these measures may positively impact our revenue, profit, and cash flows, and result in their exceeding our stated medium-term prospects.
Opportunities from Our Employees
Our employees drive our innovation, provide value to our customers, and consistently enable our growth and profitability. In 2019, we continued to support our growth ambitions by increasing the number of employees (in full-time equivalents), especially in key strategic areas. As described in the Employees and Social Investments section, we continuously invest in our talents to retain their high level of engagement, knowledge, collaboration, social involvement, and health. By doing so, we anticipate improvements in our employee productivity and innovation capabilities.
Our outlook and medium-term prospects are based on certain assumptions regarding employee turnover and our Business Health Culture Index (as defined in the Employees and Social Investments section). Should these develop better than expected, there might be a gain in employee productivity and engagement. A stronger-than-expected increase in the Employee Engagement Index can therefore be an opportunity which could positively impact our revenue, profit, and cash flows, and result in their exceeding our stated medium-term prospects.
For more information about future opportunities from our employees, see the Employees and Social Investments section.
130 | | Expected Developments and Opportunities |
To Our | Combined Group | Consolidated Financial | Further Information on Economic, | Additional |
Stakeholders | Management Report | Statements IFRS | Environmental, and Social Performance | Information |
Consolidated Financial Statements IFRS
Primary Financial Statements | |
Consolidated Income Statements, Consolidated Statements of Comprehensive Income, Consolidated Statements of Financial Position, Consolidated Statements of Changes in Equity, Consolidated Statements of Cash Flows | 133 - 137 |
| | |
Notes | |
(IN.1) | Basis for Preparation | 138 |
| | |
Section A – Customers | 141 |
(A.1) | Revenue | 141 |
(A.2) | Trade and Other Receivables | 144 |
(A.3) | Capitalized Cost from Contracts with Customers | 145 |
(A.4) | Customer-Related Provisions | 146 |
| | |
Section B – Employees | 147 |
(B.1) | Employee Headcount | 147 |
(B.2) | Employee Benefits Expenses | 147 |
(B.3) | Share-Based Payments | 147 |
(B.4) | Pension Plans and Similar Obligations | 152 |
(B.5) | Other Employee-Related Obligations | 154 |
(B.6) | Restructuring | 154 |
| | |
Section C – Financial Results | 156 |
(C.1) | Results of Segments | 156 |
(C.2) | Reconciliation of Segment Measures to the Consolidated Income Statements | 160 |
(C.3) | Other Non-Operating Income/Expense, Net | 161 |
(C.4) | Financial Income, Net | 161 |
(C.5) | Income Taxes | 161 |
(C.6) | Earnings per Share | 163 |
| | |
Section D – Invested Capital | 164 |
(D.1) | Business Combinations | 164 |
(D.2) | Goodwill | 167 |
(D.3) | Intangible Assets | 170 |
(D.4) | Property, Plant, and Equipment | 172 |
(D.5) | Equity Investments | 172 |
(D.6) | Non-Current Assets by Region | 173 |
(D.7) | Purchase Obligations | 173 |
(D.8) | Adoption of IFRS 16 | 174 |
| | |
Section E – Capital Structure, Financing, and Liquidity | 175 |
(E.1) | Capital Structure Management | 175 |
(E.2) | Total Equity | 175 |
(E.3) | Liquidity | 177 |
| | |
Section F – Management of Financial Risk Factors | 182 |
(F.1) | Financial Risk Factors and Risk Management | 182 |
(F.2) | Fair Value Disclosures on Financial Instruments | 191 |
| | |
Section G – Other Disclosures | 197 |
(G.1) | Prepaid Expenses and Other Tax Assets | 197 |
(G.2) | Other Tax Liabilities | 197 |
(G.3) | Other Litigation, Claims, and Legal Contingencies | 197 |
Consolidated Financial Statements IFRS | 131 |
To Our | Combined Group | Consolidated Financial | Further Information on Economic, | Additional |
Stakeholders | Management Report | Statements IFRS | Environmental, and Social Performance | Information |
(G.4) | Board of Directors | 199 |
(G.5) | Executive and Supervisory Board Compensation | 201 |
(G.6) | Related Party Transactions Other Than Board Compensation | 201 |
(G.7) | Principal Accountant Fees and Services | 202 |
(G.8) | Events After the Reporting Period | 202 |
(G.9) | Scope of Consolidation, Subsidiaries and Other Equity Investments | 202 |
(G.10) | German Code of Corporate Governance | 209 |
| | |
Management’s Annual Report on Internal Control over Financial Reporting in the Consolidated Financial Statements | 211 |
132 | Consolidated Financial Statements IFRS |
To Our | Combined Group | Consolidated Financial | Further Information on Economic, | Additional |
Stakeholders | Management Report | Statements IFRS | Environmental, and Social Performance | Information |
 Consolidated Income Statements of SAP Group for the Years Ended December 31 Consolidated Income Statements of SAP Group for the Years Ended December 31
| |
€ millions, unless otherwise stated | Notes | 2019 | 2018 | 2017 |
| Cloud | | 6,933 | 4,993 | 3,769 |
| Software licenses | | 4,533 | 4,647 | 4,872 |
| Software support | | 11,547 | 10,981 | 10,908 |
| Software licenses and support | | 16,080 | 15,628 | 15,780 |
| Cloud and software | | 23,012 | 20,622 | 19,549 |
| Services | | 4,541 | 4,086 | 3,912 |
Total revenue | (A.1), (C.2) | 27,553 | 24,708 | 23,461 |
| | | | | |
| Cost of cloud | | –2,534 | –2,068 | –1,660 |
| Cost of software licenses and support | | –2,159 | –2,092 | –2,234 |
| Cost of cloud and software | | –4,692 | –4,160 | –3,893 |
| Cost of services | | –3,662 | –3,302 | –3,158 |
| Total cost of revenue | | –8,355 | –7,462 | –7,051 |
| Gross profit | | 19,199 | 17,246 | 16,410 |
| Research and development | | –4,292 | –3,624 | –3,352 |
| Sales and marketing | | –7,693 | –6,781 | –6,924 |
| General and administration | | –1,629 | –1,098 | –1,075 |
| Restructuring | (B.6) | –1,130 | –19 | –182 |
| Other operating income/expense, net | | 18 | –20 | 1 |
Total operating expenses | | –23,081 | –19,005 | –18,584 |
Operating profit | | 4,473 | 5,703 | 4,877 |
| | | | | |
Other non-operating income/expense, net | (C.3) | –74 | –56 | –36 |
| Finance income | | 787 | 371 | 476 |
| Finance costs | | –589 | –418 | –288 |
Financial income, net | (C.4) | 198 | –47 | 188 |
Profit before tax | (C.2) | 4,596 | 5,600 | 5,029 |
| | | | | |
| Income tax expense | (C.5) | –1,226 | –1,511 | –983 |
Profit after tax | | 3,370 | 4,088 | 4,046 |
| Attributable to owners of parent | | 3,321 | 4,083 | 4,008 |
| Attributable to non-controlling interests | | 50 | 6 | 38 |
| | | | | |
Earnings per share, basic (in €) | (C.6) | 2.78 | 3.42 | 3.35 |
Earnings per share, diluted (in €) | (C.6) | 2.78 | 3.42 | 3.35 |
The accompanying Notes are an integral part of these Consolidated Financial Statements.
Under the adoption methods we chose for IFRS 9, 15, and 16, prior-year numbers are not restated to conform to the new accounting policies. For more information, see Note (IN.1).
Consolidated Financial Statements IFRS | | 133 |
To Our | Combined Group | Consolidated Financial | Further Information on Economic, | Additional |
Stakeholders | Management Report | Statements IFRS | Environmental, and Social Performance | Information |
Consolidated Statements of Comprehensive Income of SAP Group for the Years Ended December 31 |
€ millions | Notes | 2019 | 2018 | 2017 |
 Profit after tax Profit after tax
| | 3,370 | 4,088 | 4,046 |
Items that will not be reclassified to profit or loss | | | | |
| | Remeasurements on defined benefit pension plans, before tax | | –57 | 12 | 29 |
| | Income taxes relating to remeasurements on defined benefit pension plans | | 5 | –1 | –7 |
| Remeasurements on defined benefit pension plans, net of tax | | –52 | 11 | 22 |
Other comprehensive income for items that will not be reclassified to profit or loss, net of tax | | –52 | 11 | 22 |
Items that will be reclassified subsequently to profit or loss | | | | |
| | | Gains (losses) on exchange differences on translation, before tax | | 537 | 910 | –2,730 |
| | | Reclassification adjustments on exchange differences on translation, before tax | | 0 | 0 | 0 |
| | Exchange differences, before tax | | 537 | 910 | –2,730 |
| | Income taxes relating to exchange differences on translation | | 0 | 0 | –2 |
| Exchange differences, net of tax | (E.2) | 537 | 910 | –2,732 |
| | | Gains (losses) on remeasuring available-for-sale financial assets, before tax | | 0 | 0 | 114 |
| | | Reclassification adjustments on available-for-sale financial assets, before tax | | 0 | 0 | –250 |
| | Available-for-sale financial assets, before tax | | 0 | 0 | –136 |
| | Income taxes relating to available-for-sale financial assets | | 0 | 0 | 1 |
| Available-for-sale financial assets, net of tax | | 0 | 0 | –135 |
| | | Gains (losses) on cash flow hedges/cost of hedging, before tax | | –24 | –10 | 81 |
| | | Reclassification adjustments on cash flow hedges/cost of hedging, before tax | | 22 | –22 | –41 |
| | Cash flow hedges/cost of hedging, before tax | (F.1) | –2 | –32 | 39 |
| | Income taxes relating to cash flow hedges/cost of hedging | | 0 | 9 | –10 |
| Cash flow hedges/cost of hedging, net of tax | (E.2) | –1 | –23 | 29 |
Other comprehensive income for items that will be reclassified to profit or loss, net of tax | | 536 | 887 | –2,838 |
Other comprehensive income, net of tax | | 483 | 898 | –2,816 |
Total comprehensive income | | 3,854 | 4,986 | 1,229 |
| Attributable to owners of parent | | 3,804 | 4,980 | 1,191 |
| Attributable to non-controlling interests | | 50 | 6 | 38 |
The accompanying Notes are an integral part of these Consolidated Financial Statements.
Under the adoption methods we chose for IFRS 9, 15, and 16, prior-year numbers are not restated to conform to the new accounting policies. For more information, see Note (IN.1).
134 | | Consolidated Financial Statements IFRS |
To Our | Combined Group | Consolidated Financial | Further Information on Economic, | Additional |
Stakeholders | Management Report | Statements IFRS | Environmental, and Social Performance | Information |
 Consolidated Statements of Financial Position of SAP Group as at December 31 Consolidated Statements of Financial Position of SAP Group as at December 31
| | |
€ millions | Notes | 2019 | 2018 |
| | Cash and cash equivalents | (E.3) | 5,314 | 8,627 |
| | Other financial assets | (D.5), (E.3) | 297 | 448 |
| | Trade and other receivables | (A.2) | 7,908 | 6,362 |
| | Other non-financial assets | (A.3), (G.1) | 1,188 | 889 |
| | Tax assets | | 506 | 293 |
| Total current assets | | 15,213 | 16,620 |
| | Goodwill | (D.2) | 29,162 | 23,736 |
| | Intangible assets | (D.3) | 4,491 | 3,227 |
| | Property, plant, and equipment | (D.4), (D.8) | 5,496 | 3,553 |
| | Other financial assets | (D.5), (E.3) | 2,336 | 1,536 |
| | Trade and other receivables | (A.2) | 129 | 118 |
| | Other non-financial assets | (A.3), (G.1) | 1,701 | 1,301 |
| | Tax assets | | 435 | 397 |
| | Deferred tax assets | (C.5) | 1,251 | 1,014 |
| Total non-current assets | | 45,002 | 34,881 |
Total assets | | 60,215 | 51,502 |
| | | | | | |
| | | Trade and other payables | | 1,581 | 1,491 |
| | | Tax liabilities | | 255 | 611 |
| | | Financial liabilities | (E.3), (D.8) | 3,273 | 1,125 |
| | | Other non-financial liabilities | (B.3), (B.5), (G.2) | 4,818 | 4,120 |
| | | Provisions | (A.4), (B.4), (B.5), (B.6) | 268 | 110 |
| | | Contract liabilities | (A.1) | 4,266 | 3,028 |
| | Total current liabilities | | 14,462 | 10,486 |
| | | Trade and other payables | | 8 | 129 |
| | | Tax liabilities | | 538 | 495 |
| | | Financial liabilities | (E.3), (D.8) | 12,923 | 10,553 |
| | | Other non-financial liabilities | (B.3), (B.5), (G.2) | 814 | 501 |
| | | Provisions | (A.4), (B.4), (B.5), (B.6) | 478 | 270 |
| | | Deferred tax liabilities | (C.5) | 82 | 102 |
| | | Contract liabilities | (A.1) | 89 | 88 |
| | Total non-current liabilities | | 14,931 | 12,138 |
| Total liabilities | | 29,393 | 22,624 |
| | | Issued capital | | 1,229 | 1,229 |
| | | Share premium | | 545 | 543 |
| | | Retained earnings | | 28,783 | 27,407 |
| | | Other components of equity | | 1,770 | 1,234 |
| | | Treasury shares | | –1,580 | –1,580 |
| | Equity attributable to owners of parent | | 30,746 | 28,832 |
| | Non-controlling interests | | 76 | 45 |
| Total equity | (E.2) | 30,822 | 28,877 |
Total equity and liabilities | | 60,215 | 51,502 |
The accompanying Notes are an integral part of these Consolidated Financial Statements.
Under the adoption method we chose for IFRS 16, prior-year numbers are not restated to conform to the new accounting policies. For more information, see Note (IN.1).
Consolidated Financial Statements IFRS | | 135 |
To Our | Combined Group | Consolidated Financial | Further Information on Economic, | Additional |
Stakeholders | Management Report | Statements IFRS | Environmental, and Social Performance | Information |
Consolidated Statements of Changes in Equity of SAP Group for the Years Ended December 31 |
€ millions | | | | Equity Attributable to Owners of Parent | Non- | Total Equity |
| Issued
Capital | Share
Premium | Retained
Earnings | Other
Components
of Equity | Treasury
Shares | Total | Controlling
Interests | |
Notes | (E.2) | (E.2) | | (E.2) | (E.2) | | | |
1/1/2017 | 1,229 | 599 | 22,287 | 3,346 | –1,099 | 26,361 | 21 | 26,383 |
 Profit after tax Profit after tax
| | | 4,008 | | | 4,008 | 38 | 4,046 |
Other comprehensive income | | | 22 | –2,838 | | –2,816 | | –2,816 |
Comprehensive income | | | 4,029 | –2,838 | | 1,191 | 38 | 1,229 |
Share-based payments | | –43 | | | | –43 | | –43 |
Dividends | | | –1,499 | | | –1,499 | –66 | –1,565 |
Purchase of treasury shares | | | | | –500 | –500 | | –500 |
Reissuance of treasury shares under share-based payments | | 13 | | | 8 | 22 | | 22 |
Hyperinflation | | | –17 | | | –17 | | –17 |
Additions from business combinations | | | –33 | | | –33 | 35 | 2 |
Other changes | | | 2 | | | 2 | 2 | 4 |
12/31/2017 | 1,229 | 570 | 24,769 | 508 | –1,591 | 25,484 | 31 | 25,515 |
Adoption of IFRS 15 | | | 83 | | | 83 | | 83 |
Adoption of IFRS 9 | | | 135 | –160 | | –25 | | –25 |
1/1/2018 | 1,229 | 570 | 24,987 | 347 | –1,591 | 25,542 | 31 | 25,573 |
Profit after tax | | | 4,083 | | | 4,083 | 6 | 4,088 |
Other comprehensive income | | | 11 | 887 | | 898 | | 898 |
Comprehensive income | | | 4,093 | 887 | | 4,980 | 6 | 4,986 |
Share-based payments | | –40 | | | | –40 | | –40 |
Dividends | | | –1,671 | | | –1,671 | –13 | –1,684 |
Reissuance of treasury shares under share-based payments | | 13 | | | 11 | 24 | | 24 |
Shares to be issued | | | 7 | | | 7 | | 7 |
Hyperinflation | | | –8 | | | –8 | | –8 |
Changes in non-controlling interests | | | | | | 0 | 19 | 19 |
Other changes | | | –2 | | | –2 | 3 | 1 |
 12/31/2018 12/31/2018
| 1,229 | 543 | 27,407 | 1,234 | –1,580 | 28,832 | 45 | 28,877 |
Adoption of IFRS 16 | | | –71 | | | –71 | | –71 |
1/1/2019 | 1,229 | 543 | 27,336 | 1,234 | –1,580 | 28,761 | 45 | 28,807 |
 Profit after tax Profit after tax
| | | 3,321 | | | 3,321 | 50 | 3,370 |
Other comprehensive income | | | –52 | 536 | | 483 | | 483 |
Comprehensive income | | | 3,268 | 536 | | 3,804 | 50 | 3,854 |
Share-based payments | | 2 | | | | 2 | | 2 |
Dividends | | | –1,790 | | | –1,790 | –19 | –1,810 |
Hyperinflation | | | –29 | | | –29 | | –29 |
Other changes | | | –2 | | | –2 | 0 | –2 |
 12/31/2019 12/31/2019
| 1,229 | 545 | 28,783 | 1,770 | –1,580 | 30,746 | 76 | 30,822 |
The accompanying Notes are an integral part of these Consolidated Financial Statements. Under the adoption methods we chose for IFRS 9, 15, and 16, prior-year numbers are not restated to conform to the new accounting policies. For more information, see Note (IN.1).
136 | Consolidated Financial Statements IFRS |
To Our | Combined Group | Consolidated Financial | Further Information on Economic, | Additional |
Stakeholders | Management Report | Statements IFRS | Environmental, and Social Performance | Information |
Consolidated Statements of Cash Flows of SAP Group for the Years Ended December 31 | |
€ millions | Notes | 2019 | 2018 | 2017 |
Profit after tax | | 3,370 | 4,088 | 4,046 |
Adjustments to reconcile profit after tax to net cash flow from operating activities: | | | | |
Depreciation and amortization | (D.2)–(D.4) | 1,872 | 1,362 | 1,272 |
Share-based payment expense | (B.3) | 1,835 | 830 | 1,120 |
Income tax expense | (C.5) | 1,226 | 1,511 | 983 |
Financial income, net | (C.4) | –198 | 47 | –188 |
Decrease/increase in allowances on trade receivables | | 14 | –67 | –32 |
Other adjustments for non-cash items | | –54 | 3 | –9 |
Decrease/increase in trade and other receivables | | –1,469 | 136 | –309 |
Decrease/increase in other assets | | –583 | –477 | –325 |
Increase/decrease in trade payables, provisions, and other liabilities | | 328 | 240 | 63 |
Increase/decrease in contract liabilities | | 984 | –561 | 718 |
Share-based payments | | –1,257 | –971 | –849 |
Interest paid | | –341 | –251 | –200 |
Interest received | | 97 | 99 | 88 |
Income taxes paid, net of refunds | | –2,329 | –1,687 | –1,332 |
Net cash flows from operating activities | | 3,496 | 4,303 | 5,045 |
Cash flows for business combinations, net of cash and cash equivalents acquired | (D.1) | –6,215 | –2,140 | –291 |
Proceeds from sale of subsidiaries or businesses | | 61 | 0 | 0 |
Purchase of intangible assets and property, plant, and equipment | | –817 | –1,458 | –1,275 |
Proceeds from sales of intangible assets or property, plant, and equipment | | 71 | 57 | 97 |
Purchase of equity or debt instruments of other entities | | –900 | –1,013 | –2,914 |
Proceeds from sales of equity or debt instruments of other entities | | 778 | 1,488 | 3,272 |
Net cash flows from investing activities | | –7,021 | –3,066 | –1,112 |
Dividends paid | (E.2) | –1,790 | –1,671 | –1,499 |
Dividends paid on non-controlling interests | | –17 | –7 | –45 |
Purchase of treasury shares | (E.2) | 0 | 0 | –500 |
Proceeds from borrowings | (E.3) | 3,622 | 6,368 | 27 |
Repayments of borrowings | (E.3) | –1,309 | –1,407 | –1,391 |
Payments of lease liabilities | | –403 | 0 | 0 |
Transactions with non-controlling interests | | 0 | 0 | 2 |
Net cash flows from financing activities | | 102 | 3,283 | –3,406 |
Effect of foreign currency rates on cash and cash equivalents | | 110 | 97 | –218 |
Net decrease/increase in cash and cash equivalents | | ��3,313 | 4,617 | 309 |
 Cash and cash equivalents at the beginning of the period Cash and cash equivalents at the beginning of the period
| (E.3) | 8,627 | 4,011 | 3,702 |
Cash and cash equivalents at the end of the period | (E.3) | 5,314 | 8,627 | 4,011 |
The accompanying Notes are an integral part of these Consolidated Financial Statements.
Under the adoption methods we chose for IFRS 9, 15, and 16, prior-year numbers are not restated to conform to the new accounting policies. For more information, see Note (IN.1).
Consolidated Financial Statements IFRS | 137 |
To Our | Combined Group | Consolidated Financial | Further Information on Economic, | Additional |
Stakeholders | Management Report | Statements IFRS | Environmental, and Social Performance | Information |
Notes
(IN.1) Basis for Preparation
General Information
The registered seat of SAP SE is in Walldorf, Germany (Commercial Register of the Lower Court of Mannheim HRB 719915). The Consolidated Financial Statements for 2019 of SAP SE and its subsidiaries (collectively, “we,” “us,” “our,” “SAP,” “Group,” and “Company”) have been prepared in accordance with International Financial Reporting Standards (IFRS).
We have applied all IFRS standards and interpretations that were effective on and endorsed by the European Union (EU) as at December 31, 2019. There were no standards or interpretations as at December 31, 2019, impacting our Consolidated Financial Statements for the years ended December 31, 2019, 2018, and 2017, that were effective but not yet endorsed. Therefore, our Consolidated Financial Statements comply with both, IFRS as issued by the International Accounting Standards Board (IASB) and IFRS as endorsed by the EU.
Our Executive Board approved the Consolidated Financial Statements on February 18, 2020, for submission to our Supervisory Board which approved the Consolidated Financial Statements on February 19, 2020.
All amounts included in the Consolidated Financial Statements are reported in millions of euros (€ millions) except where otherwise stated. As figures are rounded, numbers presented throughout this document may not add up precisely to the totals we provide and percentages may not precisely reflect the absolute figures.
Amounts disclosed in the Notes that are taken directly from our  Consolidated Income Statements or our
  Consolidated Statements of Financial Position are marked with the symbols
  and
and  , respectively.
Comparative Figures
Effective January 1, 2018, we started to apply IFRS 15 ‘Revenue from Contracts with Customers’ retrospectively, using the cumulative catch-up approach and the practical expedient to apply the new standard only to contracts that were not completed as at January 1, 2018. On adopting IFRS 15, SAP changed several of its accounting policies. Under the cumulative catch-up approach, the amounts for the financial year 2017 presented in the financial statements were not restated to conform to these policies.
Also effective January 1, 2018, we started to apply IFRS 9 ‘Financial Instruments’ using the exception from full retrospective application. The impact from a different classification of financial assets, the new impairment rules, and the different treatment of cost of hedging were recognized in retained earnings of the opening balance sheet on January 1, 2018. Comparative figures for the financial year 2017 presented in the financial statements were not restated.
Effective January 1, 2019 we apply IFRS 16 ‘Leases’ using the modified retrospective transition approach. We recognized the cumulative effect of the initial application of the standard as an adjustment to the opening balance of retained earnings on the date of initial application while the prior-year figures for the financial years 2018 and 2017 were not adjusted. For more information about the application of IFRS 16, see Note (D.8).
Accounting Policies, Management Judgments, and Sources of Estimation Uncertainty
How We Present Our Accounting Policies, Judgments, and Estimates
To ease the understanding of our financial statements, we present the accounting policies, management judgments, and sources of estimation uncertainty (hereafter: accounting policies, judgments, and estimates) on a given subject together with other disclosures related to the same subject in the Note that deals with this subject. Accounting policies, judgments, and estimates that do not relate to a specific subject are presented in the following section.
For easier identification of our accounting policies, judgments, and estimates, the respective disclosures are marked with the symbol  and highlighted with a light gray box. They focus on the accounting choices made within the framework of the prevailing IFRS and refrain from repeating the underlying promulgated IFRS guidance, unless we consider it particularly important to the understanding of a Note’s content.
To Our | Combined Group | Consolidated Financial | Further Information on Economic, | Additional |
Stakeholders | Management Report | Statements IFRS | Environmental, and Social Performance | Information |
The following table provides an overview of where our accounting policies, management judgments, and estimates are disclosed:
Note |  Accounting Policies, Judgments, and Estimates Accounting Policies, Judgments, and Estimates
|
(IN.1) | Basis for Preparation |
(A.1) | Revenue |
(A.2) | Trade and Other Receivables |
(A.3) | Capitalized Cost from Contracts with Customers |
(A.4) | Customer-Related Provisions |
(B.3) | Share-Based Payments |
(B.4) | Pension Plans and Similar Obligations |
(B.5) | Other Employee-Related Obligations |
(B.6) | Restructuring |
(C.1) | Results of Segments |
(C.5) | Income Taxes |
(D.1) | Business Combinations |
(D.2) | Goodwill |
(D.3) | Intangible Assets |
(D.4) | Property, Plant, and Equipment |
(D.5) | Equity Investments |
(D.8) | Adoption of IFRS 16 |
(E.3) | Liquidity |
(F.1) | Financial Risk Factors and Risk Management |
(F.2) | Fair Value Disclosures on Financial Instruments |
(G.1) | Prepaid Expenses and Other Tax Assets |
(G.3) | Other Litigation, Claims, and Legal Contingencies |
(G.5) | Executive and Supervisory Board Compensation |
General Accounting Policies |
|
 Bases of Measurement Bases of Measurement
|
|
The Consolidated Financial Statements have been prepared on the historical cost basis except for the following: |
|
– Derivative financial instruments, liabilities for cash-settled share-based payments, and financial assets with cash flows that are not solely payments of principal or interest are measured at fair value. |
|
– Post-employment benefits are measured at the present value of the defined benefit obligations less the fair value of the plan assets. |
|
– Monetary assets and liabilities denominated in foreign currencies are translated at period-end exchange rates. |
|
– The financial statements of our subsidiaries to which hyperinflation accounting applies. |
Foreign Currencies and Hyperinflation
Income and expenses and operating cash flows of our foreign subsidiaries that use a functional currency other than the Euro are translated at average rates of foreign exchange (FX) computed on a monthly basis. Exchange differences resulting from foreign currency transactions are recognized in other non-operating income/expense, net.
We apply hyperinflation accounting for our subsidiaries in Argentina and Venezuela by restating the financial statements of these subsidiaries for the current period to account for changes in the general purchasing power of the local currency based on relevant price indexes at the reporting date. The restated financial statements of our subsidiaries in Argentina and Venezuela are translated at closing rates.
The exchange rates of key currencies affecting the Company were as follows:
Exchange Rates
Equivalent to €1 | | | Middle Rate
as at 12/31 | Annual Average Exchange Rate |
| | 2019 | 2018 | 2019 | 2018 | 2017 |
U.S. dollar | USD | 1.1234 | 1.1450 | 1.1196 | 1.1815 | 1.1315 |
Japanese yen | JPY | 121.94 | 125.85 | 122.06 | 130.41 | 126.85 |
Pound sterling | GBP | 0.8508 | 0.8945 | 0.8773 | 0.8847 | 0.8770 |
Swiss franc | CHF | 1.0854 | 1.1269 | 1.1127 | 1.1549 | 1.1159 |
Canadian dollar | CAD | 1.4598 | 1.5605 | 1.4857 | 1.5302 | 1.4644 |
Australian dollar | AUD | 1.5995 | 1.6220 | 1.6106 | 1.5799 | 1.4794 |
Cost Classification
Cost of Cloud and Software
Cost of cloud and software includes the costs incurred in producing the goods and providing the services that generate cloud and software revenue. Consequently, this line item primarily includes employee expenses relating to these services, amortization of acquired intangibles, fees for third-party licenses, depreciation of our property, plant, and equipment (for example, of our data centers in which we host our cloud solutions), and costs for third-party hosting services.
Cost of Services
Cost of services includes the costs incurred in providing the services that generate service revenue. Consequently, this line item primarily includes employee expenses and related training, system, and system administration costs, costs for third-party resources, and
To Our | Combined Group | Consolidated Financial | Further Information on Economic, | Additional |
Stakeholders | Management Report | Statements IFRS | Environmental, and Social Performance | Information |
costs for enabling mobile information and mobile commerce services.
Research and Development
Research and development includes the costs incurred by activities related to the development of software solutions (new products, updates, and enhancements) including resource and hardware costs for the development systems. For more information about the recognition of internally generated intangible assets from development, see Note (D.3).
Sales and Marketing
Sales and marketing includes the costs incurred for the selling activities (such as sales commissions and amortization of capitalized sales commissions) and marketing activities related to our software and cloud solutions and our service portfolio.
General and Administration
General and administration includes the costs related to finance and administrative functions, human resources, and general management as long as they are not directly attributable to one of the other operating expense line items.
 Management Judgments and Sources of Estimation Uncertainty
The preparation of the Consolidated Financial Statements requires our management to make judgments, estimates, and assumptions that affect the application of accounting policies and the reported amounts of assets, liabilities, revenues, and expenses, as well as disclosure of contingent liabilities.
We base our judgments, estimates, and assumptions on historical and forecast information, and on regional and industry economic conditions in which we or our customers operate. Changes to these conditions could adversely affect our estimates. Although we believe we have made reasonable estimates about the ultimate resolution of the underlying uncertainties, no assurance can be given that the final outcome of these matters will be consistent with what is reflected in our recognized assets, liabilities, revenues, and expenses and disclosed contingent liabilities. Actual results could differ from original estimates.
The accounting policies that most frequently or significantly require us to make judgments, estimates, and assumptions, and therefore are critical to understanding our results of operations, include the following:
Note | Significant Accounting Policies |
(A.1) | Revenue recognition |
(A.2) | Valuation of trade receivables |
(A.4), (G.3) | Accounting for legal contingencies |
(B.3) | Accounting for share-based payments |
(C.5) | Accounting for income taxes |
(D.1) | Accounting for business combinations |
(D.2) | Accounting for goodwill |
(D.3) | Accounting for intangible assets (including recognition of internally generated intangible assets from development) |
Our management periodically discusses these significant accounting policies with the Audit Committee of our Supervisory Board.
New Accounting Standards Not Yet Adopted
The IASB has – on top of a new conceptual framework – issued various amendments to IFRS standards (such as IFRS 3 (definition of a business), and IFRS 9 (benchmark reform)) that are relevant for SAP but not yet effective. We are currently in the process of assessing the impact on SAP, but do not expect material effects on our financial position or results of operations.
To Our | Combined Group | Consolidated Financial | Further Information on Economic, | Additional |
Stakeholders | Management Report | Statements IFRS | Environmental, and Social Performance | Information |
Section A – Customers
This section discusses disclosures related to contracts with our customers. These include but are not limited to explanations of how we recognize revenue, revenue disaggregation, and information about our trade receivables and customer-related obligations.
(A.1) Revenue
 Accounting for Revenue from Contracts with Customers Accounting for Revenue from Contracts with Customers
Classes of Revenue We derive our revenue from fees charged to our customers for the use of our hosted cloud offerings, for licenses to our on-premise software products, and for standardized and premium support services, consulting, customer-specific software developments, training, and other services. Cloud and software revenue, as presented in our Consolidated Income Statements, is the sum of our cloud revenue, our software license revenue, and our software support revenue. – Cloud revenue represents fees earned from providing customers with any of the following: ¡ Software as a service (SaaS), that is, a right to use software functionality (including standard functionalities and custom cloud applications and extensions) in a cloud-based infrastructure hosted by SAP or third parties engaged by SAP, where the customer does not have the right to terminate the hosting contract and take possession of the software to either run it on its own IT infrastructure or to engage a third-party provider unrelated to SAP to host and manage the software; SaaS also includes transaction and agent fees for transactions that customers of our network business execute on our cloud-based transaction platforms. ¡ Platform as a service (PaaS), that is, access to a cloud-based infrastructure to develop, run, and manage applications ¡ Infrastructure as a service (IaaS), that is, hosting and related application management services for software hosted by SAP or third parties engaged by SAP ¡ Premium cloud support beyond the regular support that is embedded in the basic cloud subscription fees – Software license revenue represents fees earned from the sale or license of software to customers for use on the customer’s premises, in other words, where the customer has the right to take possession of the software for installation on the customer’s premises or on hardware of third-party hosting providers unrelated to SAP (on-premise software). Software license revenue includes revenue from both the sale of our standard software products and customer-specific on-premise-software development agreements. – Software support revenue represents fees earned from providing customers with standardized support services that comprise unspecified future software updates, upgrades, and enhancements as well as technical product support services for on-premise software products. Services revenue primarily represents fees earned from professional consulting services, premium support services, training services, and messaging services. Identification of Contract We frequently enter into multiple contracts with the same customer. For accounting purposes, we treat these contracts as a single contract if they are entered into at or near the same time and are economically interrelated. We do not combine contracts with closing days more than three months apart because we do not consider them being entered into near the same time. Judgment is required in evaluating whether various contracts are interrelated, which includes considerations as to whether they were negotiated as a package with a single commercial objective, whether the amount of consideration on one contract is dependent on the performance of the other contract, or if some or all goods in the contracts are a single performance obligation. New arrangements with existing customers can be either a new contract or the modification of prior contracts with the customer. Our respective judgment in making this determination considers whether there is a connection between the new arrangement and the pre-existing contracts, whether the goods and services under the new arrangement are highly interrelated with the goods and services sold under prior contracts, and how the goods and services under the new arrangement are priced. In determining whether a change in transaction price represents a contract modification or a change in variable consideration, we examine whether the change in price results from changing the contract or from applying unchanged existing contract provisions. Identification of Performance Obligations Our customer contracts often include various products and services. Typically, the products and services outlined in the Classes of Revenue section qualify as separate performance obligations and the portion of the contractual fee allocated to them is recognized separately. Judgment is required, however, in determining whether a good or service is considered a separate performance obligation. In particular for our professional services and implementation activities, judgment is required to evaluate whether such services significantly integrate, customize, or modify the on-premise software or cloud service to which they relate. In this context, we consider the nature of the services and their volume relative to the volume of the on-premise software or cloud service to which they relate. In general, the implementation services for our cloud services go beyond pure setup activities and qualify as separate performance obligations. Similarly, our on-premise implementation services and our custom development services typically qualify as separate performance obligations. Non-distinct goods and services are combined into one |
Section A – Customers | | 141 |
To Our | Combined Group | Consolidated Financial | Further Information on Economic, | Additional |
Stakeholders | Management Report | Statements IFRS | Environmental, and Social Performance | Information |
distinct bundle of goods and services (combined performance obligation). When selling goods or services, we frequently grant customers options to acquire additional goods or services (for example, renewals of renewable offerings, or additional volumes of purchased software). We apply judgment in determining whether such options provide a material right to the customer that the customer would not receive without entering into that contract (material right options). In this judgment, we consider, for example, whether the options entitle the customer to a discount that exceeds the discount granted for the respective goods or services sold together with the option. Determination of Transaction Price We apply judgment in determining the amount to which we expect to be entitled in exchange for transferring promised goods or services to a customer. This includes estimates as to whether and to what extent subsequent concessions or payments may be granted to customers and whether the customer is expected to pay the contractual fees. In this judgment, we consider our history both with the respective customer and more broadly. Our typical cloud services do not provide the customer with a software license because the customer does not have the right to terminate the hosting contract and take possession of the software. Consequently, cloud fees that are based on transaction volumes are considered in the transaction price based on estimates rather than being accounted for as sales-based license royalties. Only very rarely do our contracts include significant financing components. We do not account for financing components if the period between when SAP transfers the promised goods or services to the customer and when the customer pays for those goods or services is one year or less. Allocation of Transaction Price We have established a hierarchy to identify the standalone selling prices (SSPs) that we use to allocate the transaction price of a customer contract to the performance obligations in the contract. – Where standalone selling prices for an offering are observable and reasonably consistent across customers (that is, not highly variable), our SSP estimates are derived from our respective pricing history. Typically, our standardized support offerings and our professional service offerings follow this approach. – Where sales prices for an offering are not directly observable or highly variable across customers, we use estimation techniques. For renewable offerings with highly variable pricing, these techniques consider the individual contract’s expected renewal price as far as this price is substantive. Typically, our cloud offerings follow this approach. For non-renewable offerings, these estimations follow a cost-plus-margin approach. – For offerings that lack renewals, have highly variable pricing, and lack substantial direct costs to estimate based on a cost-plus-margin approach, we allocate the transaction price by applying a residual approach. We use this technique in particular for our standard on-premise software offerings. Judgment is required when estimating SSPs. To judge whether the historical pricing of our goods and services is highly variable, we have established thresholds of pricing variability. For judging whether contractual renewal prices are substantive, we have established floor prices that we use as SSPs whenever the contractual renewal prices are below these floor prices. In judging whether contracts are expected to renew at their contractual renewal prices, we rely on our respective renewal history. The SSPs of material right options depend on the probability of option exercise. In estimating these probabilities, we apply judgment considering historical exercise patterns. We review the SSPs periodically or whenever facts and circumstances change to ensure the most objective input parameters available are used. Recognition of Revenue Cloud revenue is recognized over time as the services are performed. Where our performance obligation is the grant of a right to continuously access and use a cloud offering for a certain term, revenue is recognized based on time elapsed and thus ratably over this term. Software revenue is recognized at a point in time or over time depending on whether we deliver standard software, customer-specific software, or software subscription contracts that combine the delivery of software and the obligation to deliver, in the future, unspecified software products: – Licenses for our standard on-premise software products are typically delivered by providing the customer with access to download the software. The license period starts when such access is granted. We recognize revenue for these on-premise licenses at the point in time when the customer has access to and thus control over the software. In judging whether our on-premise software offerings grant customers a right to use, rather than a right to access, our intellectual property, we have considered the usefulness of our software without subsequent updates to it. – Typically, our customer-specific on-premise software development agreements: ¡ Are for software developed for specific needs of individual customers and therefore it does not have any alternative use for us ¡ Provide us with an enforceable right to payment for performance completed to date For such development agreements, we recognize revenue over time as the software development progresses. Judgment is required in identifying an appropriate method to measure the progress toward complete satisfaction of such performance obligations. We typically measure progress of our development agreements based on the direct costs incurred to date in developing the software as a percentage of the total reasonably estimated direct costs to fully complete the development work (percentage-of-completion method). This method of measuring progress faithfully depicts the transfer of the development services to the customer, as substantially all of these costs are cost of the staff or third parties performing the development work. In estimating the total cost to fully complete the development work, we consider our history with similar projects. |
142 | | Section A – Customers |
To Our | Combined Group | Consolidated Financial | Further Information on Economic, | Additional |
Stakeholders | Management Report | Statements IFRS | Environmental, and Social Performance | Information |
– For agreements that combine the delivery of software and the obligation to deliver, in the future, unspecific software products, we recognize revenue at a point in time for licenses that are made immediately accessible to the customer. We recognize revenue ratably over the term of the software subscription contract for the unspecified software products, as our performance obligation is to stand ready to deliver such products on a when-and-if-available basis. Software support revenue is typically recognized based on time elapsed and thus ratably over the term of the support arrangement. Under our standardized support services, our performance obligation is to stand ready to provide technical product support and unspecified updates, upgrades, and enhancements on a when-and-if-available basis. Our customers simultaneously receive and consume the benefits of these support services as we perform. Service revenue is typically recognized over time. Where we stand ready to provide the service (such as access to learning content), we recognize revenue based on time elapsed and thus ratably over the service period. Consumption-based services (such as separately identifiable consulting services and premium support services, messaging services, and classroom training services) are recognized over time as the services are utilized, typically following the percentage-of-completion method or ratably. When using the percentage-of-completion method, we typically measure the progress toward complete satisfaction of the performance obligation in the same way and with the same reasoning and judgment as we do for customer-specific on-premise software development agreements. We apply judgment in determining whether a service qualifies as a stand-ready service or as a consumption-based service. Revenue for combined performance obligations is recognized over the longest period of all promises in the combined performance obligation. Judgment is also required to determine whether revenue is to be recognized at a point in time or over time. For performance obligations satisfied over time, we need to measure progress using the method that best reflects SAP’s performance. When using cost incurred as a measure of progress for recognizing revenue over time, we apply judgment in estimating the total cost to satisfy the performance obligation. All of the judgments and estimates mentioned above can significantly impact the timing and amount of revenue to be recognized. Contract Balances We recognize trade receivables for performance obligations satisfied over time gradually as the performance obligation is satisfied and in full once the invoice is due. Judgment is required in determining whether a right to consideration is unconditional and thus qualifies as a receivable. Contract liabilities primarily reflect invoices due or payments received in advance of revenue recognition. Typically, we invoice fees for on-premise standard software on contract closure and software delivery. Periodic fixed fees for cloud subscription services, software support services, and other multi-period agreements are typically invoiced yearly or quarterly in advance. Such fee prepayments account for the majority of our contract liability balance. Fees based on actual transaction volumes for cloud subscriptions and fees charged for non-periodical services are invoiced as the services are delivered. While payment terms and conditions vary by contract type and region, our terms typically require payment within 30 to 60 days. |
Geographic Information
The amounts for revenue by region in the following tables are based on the location of customers. The regions in the following table are EMEA (Europe, Middle East, and Africa), Americas (North America and Latin America), and APJ (Asia Pacific Japan).
Total Revenue by Region
€ millions | 2019 | 2018 | 2017 |
Germany | 3,948 | 3,658 | 3,352 |
Rest of EMEA | 8,158 | 7,446 | 7,063 |
EMEA | 12,105 | 11,104 | 10,415 |
United States | 9,085 | 7,880 | 7,436 |
Rest of Americas | 2,109 | 1,832 | 1,911 |
Americas | 11,194 | 9,713 | 9,347 |
Japan | 1,180 | 963 | 885 |
Rest of APJ | 3,074 | 2,928 | 2,814 |
APJ | 4,254 | 3,891 | 3,699 |
 SAP Group SAP Group
| 27,553 | 24,708 | 23,461 |
Major Revenue Classes by Region
€ millions | Cloud Revenue | Cloud and Software Revenue |
| 2019 | 2018 | 2017 | 2019 | 2018 | 2017 |
EMEA | 2,115 | 1,441 | 1,029 | 10,211 | 9,339 | 8,759 |
Americas | 3,945 | 2,941 | 2,321 | 9,172 | 7,973 | 7,666 |
APJ | 872 | 611 | 419 | 3,629 | 3,310 | 3,124 |
SAP Group | 6,933 | 4,993 | 3,769 | 23,012 | 20,622 | 19,549 |
For information about the breakdown of revenue by segment and segment revenue by region, see Note (C.1).
Section A – Customers | | 143 |
To Our | Combined Group | Consolidated Financial | Further Information on Economic, | Additional |
Stakeholders | Management Report | Statements IFRS | Environmental, and Social Performance | Information |
Remaining Performance Obligations
Amounts of a customer contract’s transaction price that are allocated to the remaining performance obligations represent contracted revenue that has not yet been recognized. They include amounts recognized as contract liabilities and amounts that are contracted but not yet due.
The transaction price allocated to performance obligations that are unsatisfied or partially unsatisfied as at December 31, 2019, is €35.5 billion (December 31, 2018: €31.3 billion). This amount mostly comprises obligations to provide software support or cloud subscriptions services, as the respective contracts typically have durations of one or multiple years.
The majority of this amount is expected to be recognized as revenue over the next 12 months following the respective balance sheet date. This estimate is based on our best judgment, as it needs to consider estimates of possible future contract modifications. The amount of transaction price allocated to the remaining performance obligations, and changes in this amount over time, are impacted by, among others:
– Currency fluctuations
– The contract period of our cloud and software support contracts remaining at the balance sheet date and thus by the timing of contract renewals
Performance Obligations Satisfied in Previous Years
Revenue recognized in the reporting period for performance obligations satisfied in earlier periods was €77 million (December 31, 2018: €132 million), mainly resulting from changes in estimates related to percentage-of-completion-based contracts and changes in estimates of variable considerations.
Contract Balances
Contract liabilities as at December 31, 2019, were €4.4 billion (December 31, 2018: €3.1 billion).
Increases in contract liabilities mainly result from billing and invoices becoming due (€9.0 billion). Decreases in contract liabilities mainly result from satisfying performance obligations (€8.0 billion). The Qualtrics acquisition contributed to the increase in the contract liabilities balance (for more information, see Note (D.1)).
The amount of revenue recognized in the reporting period that was included in the contract liability balance at the beginning of the reporting period was €2.6 billion (December 31, 2018: €3.2 billion).
(A.2) Trade and Other Receivables
 Accounting for Trade and Other Receivables Accounting for Trade and Other Receivables
We measure trade receivables and contract assets from contracts with customers at amortized cost less expected credit losses. We account for expected credit losses by recording an allowance on a portfolio basis. We apply the simplified impairment approach in that, on initial measurement of the receivables, we consider all credit losses that are expected to occur during the lifetime of the receivables. We use a provision matrix to estimate these losses. Additionally, we recognize allowances for individual receivables if there is objective evidence of credit impairment. Account balances are written off either partially or in full if we judge that the likelihood of recovery is remote. For information about how the default risk for trade receivables is analyzed and managed, how the loss rates for the provision matrix are determined, how credit impairment is determined and what our criteria for write-offs are, see the section on credit risk in Note (F.1). In our Consolidated Income Statements, net gains/losses include income/expenses from expected credit loss allowances from applying the provision matrix, from credit-impaired customer balances, and from write-offs and related reversals which are included in other operating income/expense, net. Gains/losses from foreign currency exchange rate fluctuations are included in Other non-operating income/expense, net. Determining our expected credit loss allowance involves significant judgment. In this judgment, we primarily consider our historical experience with credit losses in the respective provision matrix risk class and current data on overdue receivables. We expect that our historical default rates represent a reasonable approximation for future expected customer defaults. Besides historical data, our judgment used in developing the provision matrix considers reasonable and supportable forward-looking information (for example, changes in country risk ratings, and fluctuations in credit default swaps of the countries in which our customers are located). The assessment of whether a receivable is collectible involves the use of judgment and requires us to make assumptions about customer defaults that could change significantly. In applying this judgment, we evaluate available information about a particular customer’s financial situation to determine whether it is probable that a credit loss had occurred and, if so, whether the amount of the loss is reasonably estimable. If it is, an allowance for that specific account is then necessary. Basing the expected credit loss allowance for the remaining receivables primarily on our historical loss experience likewise requires judgment, as history may not be indicative of future development. Also, including reasonable and supportable forward-looking information in the loss rates of the expected credit loss allowance requires judgment, as they may not provide a reliable prognosis for future development. |
To Our | Combined Group | Consolidated Financial | Further Information on Economic, | Additional |
Stakeholders | Management Report | Statements IFRS | Environmental, and Social Performance | Information |
Trade and Other Receivables | | | | | | |
€ millions | | | 2019 | | | 2018 |
| Current | Non-Current | Total | Current | Non-Current | Total |
Trade receivables, net | 7,561 | 21 | 7,582 | 6,182 | 6 | 6,188 |
Other receivables | 346 | 108 | 454 | 180 | 112 | 293 |
 Total Total
| 7,908 | 129 | 8,037 | 6,362 | 118 | 6,480 |
Contract assets as at December 31, 2019, were €234 million (December 31, 2018: €116 million).
For more information about financial risk, how we manage credit risk, and details of our trade receivables and contract assets allowances, see Note (F.1).
(A.3) Capitalized Cost from Contracts with Customers
 Costs of Obtaining Customer Contracts Costs of Obtaining Customer Contracts
Capitalized costs from customer contracts are classified as Other non-financial assets in our statement of financial position. The capitalized assets for the incremental costs of obtaining a customer contract primarily consist of sales commissions earned by our sales force. Judgment is required in determining the amounts to be capitalized, particularly where the commissions are based on cumulative targets and where commissions relate to multiple performance obligations in one customer contract. We capitalize such cumulative target commissions for all customer contracts that count towards the cumulative target but only if nothing other than obtaining customer contracts can contribute to achieving the cumulative target. Commissions for contracts with multiple performance obligations or for probable renewals thereof are allocated to these performance obligations and probable renewals relative to the respective standalone selling price. Typically, we either do not pay sales commissions for customer contract renewals or such commissions are not commensurate with the commissions paid for new contracts. Thus, the commissions paid for renewable new contracts also relate to expected renewals of these contracts. Consequently, we amortize sales commissions paid for new customer contracts on a straight-line basis over the expected contract life including probable contract renewals. Judgment is required in estimating these contract lives. In exercising this judgment, we consider our respective renewal history adjusted for indications that the renewal history is not fully indicative of future renewals. The amortization periods range from 18 months to 12 years depending on the type of offering. In 2019, the amortization period for commissions granted for on premise support contracts was adjusted from eight years to 12 years based on changes in our renewal history. Amortization of the capitalized costs of obtaining customer contracts is classified as sales and marketing expense. We expense incremental costs of obtaining a customer contract as incurred if we expect an amortization period of one year or less. Costs to Fulfill Customer Contracts Capitalized costs incurred to fulfill customer contracts mainly consist of direct costs for custom cloud development contracts as far as these costs are not in scope of other standards than IFRS 15. These costs are amortized after completion of the development on a straight-line basis over the expected life of the cloud subscription contract and including expected renewals. Judgment is required in evaluating whether costs are direct or indirect and in estimating contract lives. Derived from our respective history, the amortization period is typically six years. Amortization of capitalized costs to fulfill contracts for custom cloud applications and extensions is included in the cost of cloud. |
Capitalized Cost from Contracts with Customers |
€ millions | | | 2019 | | | 2018 |
| Current | Non-
Current | Total | Current | Non-
Current | Total |
Capitalized cost of obtaining customer contracts | 414 | 1,318 | 1,732 | 326 | 1,006 | 1,332 |
Capitalized cost to fulfill customer contracts | 66 | 117 | 183 | 35 | 66 | 101 |
Capitalized contract cost | 480 | 1,435 | 1,915 | 361 | 1,072 | 1,433 |
 Other non- financial assets Other non- financial assets
| 1,188 | 1,701 | 2,889 | 889 | 1,301 | 2,191 |
Capitalized contract cost as % of other non-financial assets | 40 | 84 | 66 | 41 | 82 | 65 |
Amortization Expense | | |
€ millions | 2019 | 2018 |
Capitalized cost of obtaining customer contracts | 367 | 231 |
Capitalized cost to fulfill customer contracts | 81 | 50 |
To Our | Combined Group | Consolidated Financial | Further Information on Economic, | Additional |
Stakeholders | Management Report | Statements IFRS | Environmental, and Social Performance | Information |
(A.4) Customer-Related Provisions
 Expected Contract Losses Expected Contract Losses
Customer-related provisions mainly include expected contract losses. We adjust these provisions as further information becomes available and as circumstances change. Non-current provisions are measured at the present value of their expected settlement amounts as at the reporting date. Customer-Related Litigation and Claims Furthermore, these provisions also include obligations resulting from customer-related litigation and claims. We are currently confronted with various claims and legal proceedings, including claims that relate to customers demanding indemnification for proceedings initiated against them based on their use of SAP software, and occasionally claims that relate to customers being dissatisfied with the products and services that we have delivered to them. The obligations arising from customer-related litigation and claims comprise cases in which we indemnify our customers against liabilities arising from a claim that our products infringe a third party’s patent, copyright, trade secret, or other proprietary rights. Due to uncertainties relating to these matters, provisions are based on the best information available. Significant judgment is required in the determination of whether a provision is to be recorded and what the appropriate amount for such provision should be. Notably, judgment is required in the following: – Determining whether an obligation exists – Determining the probability of outflow of economic benefits – Determining whether the amount of an obligation is reliably estimable – Estimating the amount of the expenditure required to settle the present obligation At the end of each reporting period, we reassess the potential obligations related to our pending claims and litigation and adjust our respective provisions to reflect the current best estimate. In addition, we monitor and evaluate new information that we receive after the end of the respective reporting period, but before the Consolidated Financial Statements are authorized for issue, to determine whether this provides additional information regarding conditions that existed at the end of the reporting period. Changes to the estimates and assumptions underlying our accounting for legal contingencies, and outcomes that differ from these estimates and assumptions, could require material adjustments to the carrying amounts of the respective provisions recorded and additional provisions. The expected timing or amounts of any outflows of economic benefits resulting from these lawsuits and claims is uncertain and not estimable, as they generally depend on the duration of the legal proceedings and settlement negotiations required to resolve the litigation and claims and the unpredictability of the outcomes of legal disputes in several jurisdictions. |
Contingent liabilities exist in respect of customer-related litigation and claims for which no provision has been recognized. It is not practicable to estimate the financial impact of these contingent liabilities due to the uncertainties around these lawsuits and claims as outlined above.
To Our | Combined Group | Consolidated Financial | Further Information on Economic, | Additional |
Stakeholders | Management Report | Statements IFRS | Environmental, and Social Performance | Information |
Section B – Employees
This section provides financial insights into our employee benefit arrangements. It should be read in conjunction with the compensation disclosures for key management personnel in Note (G.5) as well as SAP’s Compensation Report.
(B.1) Employee Headcount
The following table provides an overview of employee headcount, broken down by function and by the regions EMEA (Europe, Middle East, and Africa), Americas (North America and Latin America), and APJ (Asia Pacific Japan).
Employee Headcount by Region and Function
Full-time equivalents | | | 12/31/2019 | | | 12/31/2018 | | | 12/31/2017 |
EMEA | Americas | APJ | Total | EMEA | Americas | APJ | Total | EMEA | Americas | APJ | Total |
Cloud and software | 6,501 | 4,426 | 5,361 | 16,288 | 6,341 | 4,268 | 5,374 | 15,983 | 5,869 | 3,895 | 4,719 | 14,482 |
Services | 8,250 | 6,018 | 5,971 | 20,239 | 8,120 | 5,736 | 5,620 | 19,476 | 7,536 | 4,878 | 4,965 | 17,379 |
Research and development | 12,710 | 5,793 | 9,131 | 27,634 | 12,478 | 5,651 | 8,930 | 27,060 | 11,349 | 5,250 | 8,273 | 24,872 |
Sales and marketing | 10,205 | 10,368 | 5,209 | 25,781 | 9,843 | 9,452 | 4,918 | 24,213 | 9,196 | 9,169 | 4,854 | 23,219 |
General and administration | 3,161 | 2,123 | 1,246 | 6,530 | 2,906 | 1,970 | 1,147 | 6,024 | 2,676 | 1,781 | 1,047 | 5,504 |
Infrastructure | 2,220 | 984 | 654 | 3,859 | 2,160 | 951 | 631 | 3,742 | 1,732 | 855 | 501 | 3,087 |
SAP Group (12/31) | 43,048 | 29,712 | 27,571 | 100,330 | 41,848 | 28,029 | 26,620 | 96,498 | 38,357 | 25,827 | 24,359 | 88,543 |
Thereof acquisitions | 338 | 1,638 | 137 | 2,113 | 657 | 952 | 434 | 2,043 | 149 | 133 | 7 | 289 |
SAP Group (months’ end average) | 42,697 | 29,368 | 27,092 | 99,157 | 40,496 | 27,454 | 25,759 | 93,709 | 37,512 | 25,459 | 24,029 | 86,999 |
(B.2) Employee Benefits Expenses
Components of Employee Benefits Expenses
€ millions | 2019 | 2018 | 2017 |
Salaries | 10,031 | 9,025 | 8,693 |
Social security expenses | 1,477 | 1,339 | 1,281 |
Share-based payment expenses | 1,835 | 830 | 1,120 |
Pension expenses | 369 | 330 | 312 |
Employee-related restructuring expenses | 1,111 | 19 | 180 |
Termination benefits outside of restructuring plans | 47 | 52 | 57 |
Employee benefits expenses | 14,870 | 11,595 | 11,643 |
(B.3) Share-Based Payments
 Accounting for Share-Based Payments Accounting for Share-Based Payments
Classification in the Income Statement Share-based payments cover cash-settled and equity-settled awards issued to our employees. The respective expenses are recognized as employee benefits and classified in our Consolidated Income Statements according to the activities that the employees perform. Where we economically hedge our exposure to cash-settled awards, changes in the fair value of the respective hedging instruments are also recognized as employee benefits expenses in profit or loss. The fair values of hedging instruments are based on market data reflecting current market expectations. For more information about the equity price risk, see Note (F.1). Valuation, Judgment, and Sources of Estimation Uncertainty We use certain assumptions in estimating the fair values for our share-based payments, including expected share price volatility and expected award life (which represents our estimate of the average remaining life until the awards are exercised or expire unexercised). In addition, the final payout for plans also depends on the achievement of performance indicators and on our share price on |
To Our | Combined Group | Consolidated Financial | Further Information on Economic, | Additional |
Stakeholders | Management Report | Statements IFRS | Environmental, and Social Performance | Information |
the respective exercise dates. Changes to these assumptions and outcomes that differ from these assumptions could require material adjustments to the carrying amount of the liabilities we have recognized for these share-based payments. The fair value of the share units granted under the LTI 2016 Plan are dependent on our performance against a group of peer companies (Peer Group Index), the volatility, and the expected correlation between the price of the index and our share price. We believe that the expected volatility is the most sensitive assumption we use in estimating the fair values of our share options. Regarding future payout under our cash-settled plans, the SAP share price is the most relevant factor. With respect to our LTI 2016 Plan, we believe that future payout will be significantly impacted not only by our share price but also by the relative performance against the Peer Group Index. Changes in these factors could significantly affect the estimated fair values as calculated by the valuation model, and the future payout. Under certain programs, we grant our employees discounts on purchases of SAP shares. Since those discounts are not dependent on future services to be provided by our employees, the discount is recognized as an expense when the discounts are granted. Presentation in the Statements of Cash Flows Unlike in previous years, we present the payments of our share-based payment plans separately in our Statements of Cash Flows under cash flows from operating activities. As a result, the changes in other assets and in other liabilities presented in the reconciliation of operating cash flow no longer consider share-based payment-related assets or liabilities. Prior-period numbers were adjusted to conform to the new presentation. |
The operating expense line items in our income statement include the following share-based payment expenses:
Share-Based Payment Expenses by Functional Area
€ millions | 2019 | 2018 | 2017 |
Cost of cloud and software | 138 | 78 | 115 |
Cost of services | 246 | 142 | 158 |
Research and development | 429 | 210 | 269 |
Sales and marketing | 562 | 312 | 442 |
General and administration | 461 | 88 | 135 |
Share-based payment expenses | 1,835 | 830 | 1,120 |
Thereof cash-settled share-based payments | 1,664 | 674 | 963 |
Thereof equity-settled share-based payments | 171 | 156 | 157 |
In 2019, we paid €79 million in share-based payments that became fully vested because of terminations due to operational reasons in connection with our restructuring plan. These payments as well as the expense portion initially allocated to future services were classified as share-based payments and not as restructuring expenses.
a) Cash-Settled Share-Based Payments
Our major share-based payment plans are described below.
Long-Term Incentive 2016 Plan (LTI 2016 Plan)
The purpose of the LTI 2016 Plan is to reward our Executive Board members for the annual achievement of SAP’s operating profit (non-IFRS, at constant currency) targets, to ensure long-term retention of our Executive Board members, and to reward them for the long-term SAP share price performance as compared to its main peer group (Peer Group).
The virtual share program came into effect on January 1, 2016. An LTI tranche is granted annually and has a term of four years (2016–2019 tranches). Each grant starts with determining a grant amount in euros. The grant amount is based on the Executive Board members’ contractual LTI target amount and the operating profit target achievement for the previous year. The Supervisory Board sets the grant amount at a level between 80% and 120% of the contractual LTI target amount, taking into account the operating profit target achievement. This grant amount is converted into virtual shares, referred to as share units, by dividing the grant amount by the grant price. The grant price is the arithmetic mean of the XETRA closing prices of the SAP share on the 20 trading days following the publication of SAP’s fourth-quarter results.
All share units granted in this way, comprising 60% Performance Share Units (PSUs) and 40% Retention Share Units (RSUs), have a vesting period of approximately four years. At the end of the vesting period, the corresponding share units are non-forfeitable. The payout price used for the settlement is the arithmetic mean of the XETRA closing prices of the SAP share on the 20 trading days following the publication of SAP’s fourth-quarter results subsequent to the end of the vesting period. The payout price is capped at 300% of the grant price. The LTI tranche is cash-settled and paid in euros after the Annual General Shareholders’ Meeting of the corresponding year.
The number of PSUs ultimately paid out depends on the performance of the SAP share – absolute and relative to the Peer Group Index. In contrast, the final number of RSUs is fixed. SAP’s absolute share price performance is measured by comparing the grant price against the payout price. If the SAP share price performance equals the Peer Group Index performance over the same period, the performance factor is set at 100%. If the SAP share price performs better than the Peer Group Index (measured as difference between SAP share price performance and Peer Group Index performance), the performance factor is increased by the percentage point of the outperformance of the SAP share price. The percentage point is doubled if, additionally, the payout price is higher than the grant price. The performance factor is capped at 150%. If the Peer Group Index performs better than the SAP share price, the performance factor is decreased by the percentage point of the outperformance of the Peer Group Index. All PSUs lapse if the performance factor is below 50%.
If an Executive Board member’s service contract is terminated before the end of the third year following the year in which the share units were granted, both the RSUs and PSUs are forfeited in whole or in part, depending on the circumstances of the relevant resignation from office or termination of the service contract.
To Our | Combined Group | Consolidated Financial | Further Information on Economic, | Additional |
Stakeholders | Management Report | Statements IFRS | Environmental, and Social Performance | Information |
SAP Stock Option Plan 2010 (SOP 2010)
Under the SOP 2010, we granted virtual stock options to members of the Senior Leadership Team, Global Executives, employees with an exceptional rating, and high potentials between 2010 and 2015, and only in 2010 and 2011 to members of the Executive Board.
The grant base value was based on the average closing price of the SAP share over the five trading days prior to the Executive Board resolution date.
The options granted under the SOP 2010 give the employees the right to receive a certain amount of cash by exercising the options. After a three-year vesting period (four years for members of the Executive Board), the plan provides for 11 predetermined exercise dates every calendar year (one date per month except for April) until the rights lapse six years after the grant date (seven years for members of the Executive Board). Employees can exercise their options only if they are employed by SAP; if they leave the Company, the options forfeit. Executive Board members’ options are non-forfeitable once granted – if the service agreement ends in the grant year, the number of options is reduced pro rata temporis. Any options not exercised up to the end of their term expire.
The exercise price is 110% of the grant base value, which is €59.85 for the 2013 tranche, €60.96 for the 2014 tranche, and €72.18 for the 2015 tranche. The weighted average exercise price of exercised options in 2019 was €66.42 (2018: €67.59) and of outstanding options at year end 2019 was €69.15 (2018: €67.62).
Monetary benefits will be capped at 100% of the exercise price.
Restricted Stock Unit Plan Including Move SAP Plan (RSU Plan)
To retain and motivate executives and certain employees, we grant virtual shares representing a contingent right to receive a cash payment determined by the SAP share price and the number of share units that ultimately vest.
Granted share units will vest in different tranches, either:
– Over a one-to-three-year service period only, or
– Over a three-year service period and upon achieving certain key performance indicators (KPIs)
The number of performance-based share units (PSUs) that will vest under the different tranches were contingent upon achievement of the operating profit (non-IFRS, at constant currency) KPI target in the year of grant. Depending on performance, the number of PSUs vesting ranges between 0% and 200% of the number initially granted. Performance against the KPI target was 118.7% in 2019 (2018: 106.7%; 2017: 78.2%). All share units are paid out in cash upon vesting.
Qualtrics Cash-Settled Awards Replacing Pre-Acquisition Qualtrics Awards (Qualtrics Rights)
In conjunction with the acquisition of Qualtrics in 2019, under the terms of the acquisition agreement, SAP exchanged unvested Restricted Share Awards (RSAs), Restricted Share Units (RSUs), and Performance Share Units (PSUs), and options held by employees of Qualtrics into cash-settled share-based payment awards of SAP (Qualtrics Rights).
The replacement awards closely mirror the terms of the replaced awards except that:
– –The replaced awards were planned to be settled by issuing equity instruments, whereas the replacement awards are settled in cash.
– –RSAs, RSUs, PSUs, and options granted before 2018 and unvested as at the closing date of the Qualtrics acquisition were converted into the right to receive, at the originally agreed vesting dates, an amount in cash equal to the number of RSAs and RSUs held as at the vesting date multiplied by US$35.00 per share. The respective amount of options equals the number of options held as at the vesting date multiplied by US$35.00 per share less the originally-agreed exercise price.
– –RSUs, PSUs, and options granted in 2018 and thereafter and unvested as at the closing date of the Qualtrics acquisition were converted into awards that are indexed to SAP’s share price as follows: SAP’s consideration per share (US$35.00) was divided by the average closing price of the SAP share over the five trading days on the closing date (€91.28), translated into US$ (US$103.75), and the result (Equity Award Exchange Ratio of 0.3373) was multiplied by the average closing price of the SAP share over the five trading days prior to the exercise or vesting date.
There were 24.7 million unvested RSAs, RSUs, PSUs, and options as at the closing date of the Qualtrics acquisition, representing a fair value of €793 million after considering expected forfeitures dependent on grant dates and remaining vesting periods. Of the total fair value, €237 million was allocated to consideration transferred, while €556 million was allocated to future services to be provided. Post-acquisition compensation expense will be recognized as the awards vest over the remainder of the original vesting terms. The remaining vesting periods for such Qualtrics Rights are in a range of up to five years from closing date.
The unvested RSUs include grants as at the closing date of 6.1 million replacement RSUs. These RSUs have a two-year service period.
From January 23, 2019, through December 31, 2019, 7.8 million Qualtrics Rights vested. The unrecognized expense related to Qualtrics Rights was €225 million as at December 31, 2019, and will be recognized over a remaining vesting period of up to four years.
To Our | Combined Group | Consolidated Financial | Further Information on Economic, | Additional |
Stakeholders | Management Report | Statements IFRS | Environmental, and Social Performance | Information |
The valuation of our outstanding cash-settled plans was based on the following parameters and assumptions:
Fair Value and Parameters Used at Year End 2019 for Cash-Settled Plans
€, unless otherwise stated | LTI 2016 Plan | SOP 2010 | RSU Plan | Qualtrics |
| (2016–2019 | (2014–2015 | (2016–2019 | Rights |
| Tranches) | Tranches) | Tranches) | |
Weighted average fair value as at 12/31/2019 | 94.06 | 49.51 | 118.72 | 37.55 |
Information how fair value was measured at measurement date | | | | |
Option pricing model used | Monte Carlo | Monte Carlo | Other1) | Other1) |
Share price | 120.32 | 120.32 | 120.32 | 120.32 |
Risk-free interest rate, depending on maturity (in %) | –0.68 to –0.57 | –0.25 to –0.08 | –0.68 to –0.31 | –0.55 to –0.35 |
Expected volatility (in %) | 20.4 to 24.8 | 27.4 to 35.8 | NA | NA |
Expected dividend yield (in %) | 1.26 | 1.26 | 1.26 | 1.26 |
Weighted average remaining life of awards outstanding as at 12/31/2019 (in years) | 1.9 | 0.3 | 1.0 | 1.7 |
1) For these awards, the fair value is calculated by subtracting the net present value of expected future dividend payments, if any, until maturity of the respective award from the prevailing share price as at the valuation date.
Fair Value and Parameters Used at Year End 2018 for Cash-Settled Plans
€, unless otherwise stated | LTI 2016 Plan | SOP 2010 | RSU Plan | LTI 2015 Plan |
| (2016–2018 | (2013–2015 | (2015–2018 | (2015 |
| Tranches) | Tranches) | Tranches) | Tranche) |
Weighted average fair value as at 12/31/2018 | 65.89 | 20.67 | 85.24 | 86.93 |
Information how fair value was measured at measurement date | | | | |
Option pricing model used | Monte Carlo | Monte Carlo | Other1) | Other1) |
Share price | 86.93 | 86.93 | 86.93 | 86.93 |
Risk-free interest rate, depending on maturity (in %) | –0.70 to –0.55 | –0.67 to –0.25 | –0.69 to –0.31 | NA |
Expected volatility (in %) | 17.9 to 21.4 | 22.8 to 38.5 | NA | NA |
Expected dividend yield (in %) | 1.63 | 1.63 | 1.63 | NA |
Weighted average remaining life of awards outstanding as at 12/31/2018 (in years) | 2.4 | 1.2 | 1.0 | 0.1 |
1) For these awards, the fair value is calculated by subtracting the net present value of expected future dividend payments, if any, until maturity of the respective award from the prevailing share price as at the valuation date.
For the SOP 2010, expected volatility of the SAP share price is based on a blend of implied volatility from traded options with corresponding remaining lives and exercise prices as well as historical volatility with the same expected life as the options granted.
For the LTI 2016 Plan valuation, the Peer Group Index price on December 31, 2019, was US$363.63 (2018: US$277.92); the expected dividend yield of the index of 1.17% (2018: 1.30%), the expected volatility of the index of 18% to 22% (2018: 19% to 24%), and the expected correlation of the SAP share price and the index price of 38% to 40% (2018: 36% to 42%) are based on historical data for the SAP share price and index price.
The expected remaining life of the options reflects both the contractual term and the expected, or historical, exercise behavior. The risk-free interest rate is derived from German government bonds with a similar duration. The SAP dividend yield is based on expected future dividends.
To Our | Combined Group | Consolidated Financial | Further Information on Economic, | Additional |
Stakeholders | Management Report | Statements IFRS | Environmental, and Social Performance | Information |
Changes in Outstanding Awards Under Our Cash-Settled Plans
Thousands, unless otherwise stated | LTI 2016 Plan | LTI 2015 Plan | SOP 2010 | RSU Plan | Qualtrics |
| (2016–2019 | (2014–2015 | (2012–2015 | (2015–2019 | Rights |
| Tranches) | Tranches) | Tranches) | Tranches) | |
12/31/2017 | 631 | 531 | 14,472 | 13,520 | NA |
Granted | 295 | 0 | 0 | 8,512 | NA |
Adjustment based upon KPI target achievement | NA | 0 | NA | 49 | NA |
Exercised | 0 | –146 | –6,913 | –5,840 | NA |
Forfeited | 0 | 0 | –473 | –977 | NA |
12/31/2018 | 926 | 385 | 7,086 | 15,264 | NA |
Granted1) | 344 | 0 | 0 | 9,339 | 24,666 |
Adjustment based upon KPI target achievement | NA | 0 | NA | 122 | NA |
Exercised | 0 | –385 | –3,904 | –7,540 | –7,776 |
Forfeited | –160 | 0 | –144 | –1,057 | –883 |
12/31/2019 | 1,110 | 0 | 3,039 | 16,128 | 16,007 |
1) Granted includes additions from business combinations | | | | | |
Outstanding awards exercisable as at | | | | | |
12/31/2018 | 0 | 0 | 7,086 | 0 | NA |
12/31/2019 | 0 | 0 | 3,039 | 0 | 0 |
| | | | | |
Total carrying amount (in € millions) of liabilities as at | | | | | |
12/31/2018 | 30 | 35 | 146 | 774 | NA |
12/31/2019 | 73 | 0 | 150 | 1,100 | 377 |
| | | | | |
Total intrinsic value of vested awards (in € millions) as at | | | | | |
12/31/2018 | 3 | 34 | 137 | 0 | NA |
12/31/2019 | 51 | 0 | 155 | 0 | 0 |
| | | | | |
Weighted average share price (in €) for awards exercised in | | | | | |
2018 | NA | 88.27 | 100.61 | 88.67 | NA |
2019 | NA | 90.75 | 111.58 | 98.11 | 106.15 |
| | | | | |
Total expense (in € millions) recognized in | | | | | |
2017 | 14 | 9 | 221 | 712 | NA |
2018 | 8 | –3 | 43 | 611 | NA |
2019 | 44 | –1 | 66 | 1,087 | 461 |
To Our | Combined Group | Consolidated Financial | Further Information on Economic, | Additional |
Stakeholders | Management Report | Statements IFRS | Environmental, and Social Performance | Information |
Share-Based Payment Balances |
€ millions | | | 2019 | | | 2018 |
| Current | Non-Current | Total | Current | Non-Current | Total |
Share-based payment liabilities | 1,130 | 605 | 1,735 | 714 | 316 | 1,030 |
 Other non-financial liabilities Other non-financial liabilities
| 4,818 | 814 | 5,632 | 4,120 | 501 | 4,622 |
Share-based payment liabilities as % of other non-financial liabilities | 23 | 74 | 31 | 17 | 63 | 22 |
| | | | | | |
Derivatives – Call options for share-based payments | 95 | 0 | 95 | 68 | 0 | 68 |
Other financial assets | 297 | 2,336 | 2,633 | 448 | 1,536 | 1,984 |
Derivatives – Call options for share-based payments as % of other financial assets | 32 | 0 | 4 | 15 | 0 | 3 |
For more information about the derivatives, see Note (F.1).
b) Equity-Settled Share-Based Payments
Own SAP Plan (Own)
Under Own, employees have the opportunity to purchase, on a monthly basis, SAP shares without any required holding period. The investment per each eligible employee is limited to a percentage of the respective employee’s monthly base salary. SAP matches the employee investment by 40% and adds a subsidy of €20 per month for non-executives. This plan is not open to members of the Executive Board.
Number of Shares Purchased |
Millions | 2019 | 2018 | 2017 |
Own | 5.2 | 5.3 | 5.0 |
As a result of our equity-settled share-based payments transactions, we have commitments to grant SAP shares to employees. We intend to meet these commitments by reissuing treasury shares or through an agent who administers the equity-settled programs and purchases shares on the open market. We have fulfilled the obligations of Own through an agent.
Recognized Expense for Equity-Settled Plans |
€ millions | 2019 | 2018 | 2017 |
Own | 171 | 149 | 140 |
(B.4) Pension Plans and Similar Obligations
 Defined Contribution Plans
Amounts for domestic and foreign defined contribution plans are based on a percentage of the employees’ salaries or on the amount of contributions made by employees. In Germany and some other countries, we make contributions to public pension schemes that are operated by national or local government or similar institutions. Expenses for such local state pension plans are recognized as short-term employee benefits, that is, social security expenses.
 Defined Benefit Pension Plans
The discount rates used in measuring our post-employment benefit assets and liabilities are derived from rates available on high-quality corporate bonds and government bonds for which the timing and amounts of payments match the timing and the amounts of our projected pension payments. Net interest expense and other expenses related to defined benefit plans are recognized as employee benefits expenses and classified in our Consolidated Income Statements according to the activities that the employees owning the awards perform. Since our domestic defined benefit pension plans primarily consist of an employee-financed post-retirement plan that is fully financed with qualifying insurance policies, current service cost may become a credit as a result of adjusting the defined benefit liability’s carrying amount to the fair value of the qualifying plan assets. Such adjustments are recorded in service cost. Total expenses on defined benefit pension plans comprise related current and past service costs as well as interest income and expense.
Total Expense of Pension Plans |
€ millions | 2019 | 2018 | 2017 |
Defined contribution plans | 314 | 280 | 260 |
Defined benefit pension plans | 55 | 50 | 52 |
Pension expenses | 369 | 330 | 312 |
To Our | Combined Group | Consolidated Financial | Further Information on Economic, | Additional |
Stakeholders | Management Report | Statements IFRS | Environmental, and Social Performance | Information |
Defined Benefit Plans
Present Value of the Defined Benefit Obligations (DBO) and the Fair Value of the Plan Assets
€ millions | Domestic Plans | | Foreign Plans | Other Foreign Post-
Employment Plans | | Total |
| 2019 | 2018 | 2019 | 2018 | 2019 | 2018 | 2019 | 2018 |
Present value of the DBO | 1,026 | 886 | 533 | 418 | 156 | 132 | 1,715 | 1,436 |
Fair value of the plan assets | 1,009 | 878 | 411 | 355 | 65 | 59 | 1,485 | 1,292 |
Net defined benefit liability (asset) | 17 | 8 | 122 | 63 | 91 | 73 | 230 | 144 |
Net defined benefit liability (asset) as % of: | | | | | | | | |
 Non-current other financial assets Non-current other financial assets
| 0 | 0 | 0 | 0 | 0 | 0 | 0 | 0 |
Non-current provisions | 4 | 3 | 26 | 24 | 19 | 27 | 49 | 54 |
Of the present value of the DBO of our domestic plans, €951 million (2018: €824 million) relate to plans that provide for lump-sum payments not based on final salary; of the present value of the DBO of our foreign plans, €459 million (2018: €356 million) relate to plans that provide for annuity payments not based on final salary.
The following significant weighted average assumptions were used for the actuarial valuation of our domestic and foreign pension liabilities as well as other post-employment benefit obligations as at the respective measurement date:
Significant Actuarial Assumptions | | | | | | | | | |
Percent | | Domestic Plans | | Foreign Plans | Other Foreign Post-Employment Plans |
| 2019 | 2018 | 2017 | 2019 | 2018 | 2017 | 2019 | 2018 | 2017 |
Discount rate | 0.8 | 2.3 | 2.3 | 0.3 | 1.0 | 0.8 | 3.7 | 4.2 | 3.9 |
| | | | | | | | | | |
The sensitivity analysis table below shows how the present value of all defined benefit obligations would have been influenced by reasonably possible changes to significant actuarial assumptions. The sensitivity analysis considers change in discount rate assumptions, holding all other actuarial assumptions constant.
Sensitivity Analysis | | | | | | | | | | | | |
€ millions | | Domestic Plans | | Foreign Plans | | Other Foreign Post-
Employment Plans | | | Total |
| 2019 | 2018 | 2017 | 2019 | 2018 | 2017 | 2019 | 2018 | 2017 | 2019 | 2018 | 2017 |
Present value of all defined benefit obligations if: | | | | | | | | | | | | |
Discount rate was 50 basis points higher | 968 | 836 | 806 | 495 | 391 | 357 | 154 | 126 | 114 | 1,617 | 1,353 | 1,277 |
Discount rate was 50 basis points lower | 1,090 | 940 | 912 | 576 | 450 | 411 | 159 | 141 | 123 | 1,825 | 1,531 | 1,446 |
Investments in Plan Assets
Our investment strategy on domestic benefit plans is to invest all contributions in stable insurance policies.
Our investment strategies for foreign benefit plans vary according to the conditions in the country in which the respective benefit plans are situated. We have adopted a long-term investment horizon for all major foreign benefit plans. Although our policy is to invest in a risk-diversified portfolio consisting of a mix of assets, both the defined benefit obligation and plan assets can fluctuate over time, which exposes the Group to actuarial and market (investment) risks. Depending on the statutory requirements in each country, it might be necessary to reduce any underfunding by addition of liquid assets.
To Our | Combined Group | Consolidated Financial | Further Information on Economic, | Additional |
Stakeholders | Management Report | Statements IFRS | Environmental, and Social Performance | Information |
Plan Asset Allocation | | | | |
€ millions | | 2019 | | 2018 |
| Quoted in an
Active Market | Not Quoted in an
Active Market | Quoted in an
Active Market | Not Quoted in an
Active Market |
Total plan assets | 445 | 1,040 | 387 | 905 |
Thereof: Asset category | | | | |
Equity investments | 137 | 0 | 116 | 0 |
Corporate bonds | 156 | 0 | 142 | 0 |
Insurance policies | 6 | 1,040 | 5 | 905 |
Our expected contribution in 2020 to our domestic and foreign defined benefit pension plans is immaterial. The weighted duration of our defined benefit plans amounted to 13 years as at December 31, 2019, and 12 years as at December 31, 2018.
Total future benefit payments from our defined benefit plans as at December 31, 2019, are expected to be €1,831 million (2018: €1,783 million). Of this amount, 77% (2018: 80%) has maturities of over five years, and 61% (2018: 66%) relates to domestic plans.
(B.5) Other Employee-Related Obligations
 Accounting Policy
As far as the provision for long-term employee benefits is secured by pledged reinsurance coverage, it is offset with the relating plan asset.
Other Employee-Related Liabilities | | | | | | |
€ millions | | | 2019 | | | 2018 |
| Current | Non-Current | Total | Current | Non-Current | Total |
Other employee-related liabilities | 3,038 | 209 | 3,247 | 2,866 | 185 | 3,051 |
Other non-financial liabilities | 4,818 | 814 | 5,632 | 4,120 | 501 | 4,622 |
Other employee-related liabilities as % of other non-financial liabilities | 63 | 26 | 58 | 70 | 37 | 66 |
Other employee-related liabilities mainly relate to bonus and sales commission obligations, vacation obligations, and employee-related social security obligations.
Other Employee-Related Provisions | |
€ millions | | | 2019 |
| Current | Non-
Current | Total |
Other employee-related provisions as at 1/1/2019 | 25 | 52 | 77 |
Addition | 53 | 137 | 190 |
Utilization | –52 | –43 | –95 |
Release | –5 | –3 | –8 |
Other employee-related provisions as at 12/31/2019 | 21 | 143 | 164 |
Provisions | 268 | 478 | 746 |
Other employee-related provisions as % of provisions | 8 | 30 | 22 |
| | | | |
Employee-related provisions primarily comprise obligations for time credits accumulated in the working time account, severance payments outside restructuring programs, and jubilee expenses. While most of these employee-related provisions could be claimed within the next 12 months, we do not expect the related cash outflows within this time period.
(B.6) Restructuring
 Recognition of Restructuring Provisions Recognition of Restructuring Provisions
We only recognize provisions for restructuring if and when the following occurs: – SAP has designed a program that materially changes the scope of one of our businesses or the manner in which the business is conducted, and – A detailed and documented restructuring plan has been approved by our Executive Board, a member thereof, or a direct report of an Executive Board member, and – The program established is planned to start shortly after the program plan is approved and is expected to be capable of being completed within 12 months, and – The program has been announced to the parties affected or has commenced. We consider whether a change in business is material based on the business affected rather than for SAP as a whole. In judging whether a unit qualifies as a business for restructuring purposes, we consider if the unit has its own management team, has access to all inputs and processes necessary to provide outputs, and generates or could generate revenues. The materiality of a change to a business is assessed based on both the size and the nature of the change and therefore does not necessarily involve a material quantitative impact on our financial statements. |
To Our | Combined Group | Consolidated Financial | Further Information on Economic, | Additional |
Stakeholders | Management Report | Statements IFRS | Environmental, and Social Performance | Information |
In early 2019, we launched a Company-wide restructuring program to further increase our focus on our key strategic growth areas. The program is aimed at further simplifying Company structures and processes and to ensure that SAP’s organizational setup, skillsets, and resource allocation continue to meet evolving customer demand. The main features of the restructuring plan were announced on January 29, 2019. Substantially all restructuring expenses recognized in 2019 result from this program. Cash outflows related to restructuring were €0.9 billion in 2019 (2018: €0.1 billion).
In total, approximately 4,000 employees will leave or have already left the Company under the plan. Restructuring expenses primarily include the following components:
Restructuring Expenses | | | |
€ millions | 2019 | 2018 | 2017 |
Employee-related restructuring expenses | –1,111 | –19 | –180 |
Onerous contract-related restructuring expenses and restructuring-related impairment losses | –19 | 0 | –2 |
 Restructuring expenses Restructuring expenses
| –1,130 | –19 | –182 |
Restructuring provisions are predominantly short-term in nature. They primarily include employee termination benefits. For more information about the accounting treatment of share-based compensation in connection with the restructuring program, see Note (B.3).
Restructuring Provisions | |
€ millions | Restructuring Provisions |
1/1/2019 | 24 |
Addition | 1,125 |
Utilization | –938 |
Release | –4 |
Currency impact | 1 |
12/31/2019 | 208 |
Total provisions | 746 |
Restructuring provisions as % of total provisions | 28 |
If not presented separately in our income statement, restructuring expenses would have been classified in the different expense items in our income statement as follows:
Restructuring Expenses by Functional Area |
€ millions | 2019 | 2018 | 2017 |
Cost of cloud and software | –138 | –3 | –55 |
Cost of services | –154 | –3 | –118 |
Research and development | –467 | –3 | –9 |
Sales and marketing | –299 | –11 | –2 |
General and administration | –71 | 0 | 2 |
Restructuring expenses | –1,130 | –19 | –182 |
To Our | Combined Group | Consolidated Financial | Further Information on Economic, | Additional |
Stakeholders | Management Report | Statements IFRS | Environmental, and Social Performance | Information |
Section C – Financial Results
This section provides insight into the financial results of SAP’s reportable segments and of SAP overall as far as not already covered by previous sections. This includes but is not limited to segment results, income taxes, and earnings per share.
(C.1) Results of Segments
General Information
At year end 2019, SAP had four operating segments that are regularly reviewed by the Executive Board, which is responsible for assessing the performance of the Company and for making resource allocation decisions as our chief operating decision maker (CODM). The operating segments are largely organized and managed separately according to their product and service offerings, notably whether the products and services relate to our business network activities, experience management activities, or communication offerings, or cover other activities of our business.
The Applications, Technology & Services segment derives its revenues primarily from the sale of software licenses and cloud subscriptions (as far as not included in one of the other segments), and from the sale of related services (mainly support services, various professional services, premium support services, implementation services for our software products, and education services on the use of our products).
The former SAP Business Network segment was renamed during 2019 without any changes in the composition of this segment. The new name is Intelligent Spend Group. The Intelligent Spend Group segment derives its revenues mainly from transaction fees charged for the use of SAP’s cloud-based collaborative business networks and from the sale of subscriptions to the Intelligent Spend Group’s cloud offerings (mainly SAP Ariba, SAP Concur, and SAP Fieldglass offerings) and of related professional and educational services.
The Qualtrics segment derives its revenues mainly from the sale of experience management cloud solutions (offerings of Qualtrics) that run front-office functions across the experience data and from the sale of related services. Before we acquired Qualtrics on January 23, 2019, this segment was called Customer Experience and included our customer experience offerings. Following the Qualtrics acquisition, we combined our existing customer experience solutions with the Qualtrics business and renamed the Customer Experience segment to Customer and Experience Management. The customer experience offerings continued to belong to this segment until they became part of the Applications, Technology & Services segment in October 2019 through splitting and partial integration into other company functions. The segment was thereafter renamed to Qualtrics. The expenses reflected in the Qualtrics segment, however, do not comprise the full impact of the acquisition due to the fact that some functions of Qualtrics mostly affecting general and administration expense have already been integrated into SAP’s corporate functions. There are no prior-period numbers for the Qualtrics segment presented, since we acquired Qualtrics on January 23, 2019.
Further, we changed the composition of our non-reportable Digital Interconnect segment through integration of telephony, video chat, and routing offerings, which formerly were included in the Applications, Technology & Services segment and former Customer Experience segment. Due to its size, however, Digital Interconnect continues to not qualify as a reportable segment.
The segment information for 2019 and the comparative prior periods were both restated to conform with the new segment composition of the Applications, Technology & Services segment, the Qualtrics segment, and the Digital Interconnect segment.
 Segment Reporting Policies Segment Reporting Policies
Our management reporting system, and hence our segment reporting system, reports our intersegment services as cost reductions and does not track them as internal revenue. Intersegment services mainly represent utilization of human resources of one segment by another segment on a project basis. Intersegment services are charged based on internal cost rates including certain indirect overhead costs but excluding a profit margin. Most of our depreciation and amortization expense affecting segment profits is allocated to the segments as part of broader infrastructure allocations and is thus not tracked separately on the operating segment level. Depreciation and amortization expense that is directly allocated to the operating segments is immaterial in all segments presented. Our management reporting system produces a variety of reports that differ by the currency exchange rates used in the accounting for foreign-currency transactions and operations, where both actual and constant currency numbers are reported to and used by our CODM. Reports based on actual currencies use the same currency rates as are used in our financial statements. Reports based on constant currencies report revenues and expenses using the average exchange rates from the previous year’s corresponding period. We use an operating profit indicator to measure the performance of our operating segments. However, the accounting policies applied in the measurement of operating segment revenue and profit differ as follows from the IFRS accounting principles used to determine the operating profit measure in our income statement: – The measurements of segment revenue and results include the recurring revenues that would have been recorded by acquired entities had they remained stand-alone entities but which are not recorded as revenue under IFRS due to fair value accounting for customer contracts in effect at the time of an acquisition. – The expense measures exclude: ¡ Acquisition-related charges such as amortization expense and impairment charges for intangibles acquired in business combinations and certain stand-alone acquisitions of intellectual property (including purchased in-process research and development), settlements of pre-existing business |
156 | Section C – Financial Results |
To Our | Combined Group | Consolidated Financial | Further Information on Economic, | Additional |
Stakeholders | Management Report | Statements IFRS | Environmental, and Social Performance | Information |
relationships in connection with a business combination, and acquisition-related third-party expenses ¡ Share-based payment expenses ¡ Restructuring expenses – Certain activities are exclusively managed on corporate level, including finance, accounting, legal, human resources, global business operations, and global marketing. They are not included in the results of our reportable segments. Revenues and expenses of our operating but non-reportable segment, and the certain activities managed on corporate level, as outlined above, are presented under the Other revenue and Other expenses items in the reconciliation in Note (C.2). Information about assets and liabilities and additions to non-current assets by segment are not regularly provided to our Executive Board. Goodwill by segment is disclosed in Note (D.2). |
Applications, Technology & Services | | | | | |
€ millions | | 2019 | | 2018 | 2017 |
| Actual
Currency | Constant
Currency3) | Actual
Currency | Constant
Currency3) | Actual
Currency |
Cloud – SaaS/PaaS1) | 3,243 | 3,152 | 2,347 | 2,424 | 1,593 |
Cloud – IaaS2) | 695 | 673 | 488 | 506 | 328 |
Cloud | 3,938 | 3,825 | 2,835 | 2,929 | 1,922 |
Software licenses | 4,523 | 4,422 | 4,645 | 4,875 | 4,869 |
Software support | 11,532 | 11,269 | 10,969 | 11,478 | 10,890 |
Software licenses and support | 16,054 | 15,691 | 15,614 | 16,353 | 15,760 |
Cloud and software | 19,993 | 19,516 | 18,449 | 19,283 | 17,681 |
Services | 3,551 | 3,464 | 3,305 | 3,577 | 3,176 |
Total segment revenue | 23,544 | 22,980 | 21,753 | 22,859 | 20,857 |
Cost of cloud – SaaS/PaaS1) | –1,126 | –1,092 | –948 | –992 | –676 |
Cost of cloud – IaaS2) | –493 | –481 | –428 | –441 | –305 |
Cost of cloud | –1,620 | –1,573 | –1,377 | –1,433 | –981 |
Cost of software licenses and support | –1,972 | –1,933 | –1,924 | –2,056 | –1,998 |
Cost of cloud and software | –3,592 | –3,505 | –3,300 | –3,489 | –2,978 |
Cost of services | –2,636 | –2,583 | –2,523 | –2,694 | –2,434 |
Total cost of revenue | –6,228 | –6,089 | –5,823 | –6,183 | –5,412 |
Segment gross profit | 17,316 | 16,892 | 15,931 | 16,677 | 15,445 |
Other segment expenses | –7,448 | –7,294 | –7,008 | –7,318 | –6,858 |
Segment profit | 9,868 | 9,597 | 8,922 | 9,359 | 8,587 |
1) Software as a service/platform as a service
2) Infrastructure as a service
3) The 2019 constant currency amounts are only comparable to 2018 actual currency amounts; 2018 constant currency amounts are only comparable to 2017 actual currency amounts.
Section C – Financial Results | 157 |
To Our | Combined Group | Consolidated Financial | Further Information on Economic, | Additional |
Stakeholders | Management Report | Statements IFRS | Environmental, and Social Performance | Information |
Intelligent Spend Group | | | | | |
€ millions | | 2019 | | 2018 | 2017 |
| Actual
Currency | Constant
Currency2) | Actual
Currency | Constant
Currency2) | Actual
Currency |
Cloud – SaaS/PaaS1) | 2,693 | 2,585 | 2,178 | 2,265 | 1,840 |
Cloud | 2,693 | 2,585 | 2,178 | 2,265 | 1,840 |
Software licenses | 0 | 0 | 0 | 0 | –1 |
Software support | 15 | 14 | 16 | 16 | 18 |
Software licenses and support | 15 | 14 | 16 | 17 | 17 |
Cloud and software | 2,708 | 2,599 | 2,193 | 2,282 | 1,857 |
Services | 476 | 458 | 436 | 451 | 404 |
Total segment revenue | 3,184 | 3,057 | 2,629 | 2,733 | 2,261 |
Cost of cloud – SaaS/PaaS1) | –591 | –569 | –483 | –503 | –428 |
Cost of cloud | –591 | –569 | –483 | –503 | –428 |
Cost of software licenses and support | –11 | –10 | –6 | –7 | –5 |
Cost of cloud and software | –601 | –579 | –489 | –510 | –433 |
Cost of services | –352 | –340 | –324 | –338 | –292 |
Total cost of revenue | –953 | –919 | –813 | –847 | –725 |
Segment gross profit | 2,231 | 2,138 | 1,816 | 1,886 | 1,536 |
Other segment expenses | –1,534 | –1,477 | –1,285 | –1,341 | –1,148 |
Segment profit | 696 | 661 | 531 | 545 | 388 |
1) Software as a service/platform as a service
2) The 2019 constant currency amounts are only comparable to 2018 actual currency amounts; 2018 constant currency amounts are only comparable to 2017 actual currency amounts.
158 | Section C – Financial Results |
To Our | Combined Group | Consolidated Financial | Further Information on Economic, | Additional |
Stakeholders | Management Report | Statements IFRS | Environmental, and Social Performance | Information |
Qualtrics | | | | | |
€ millions | | 2019 | | 20182) | 20172) |
| Actual
Currency | Constant
Currency | Actual
Currency | Constant
Currency | Actual
Currency |
Cloud – SaaS/PaaS1) | 371 | 353 | NA | NA | NA |
Cloud | 371 | 353 | NA | NA | NA |
Software licenses | 0 | 0 | NA | NA | NA |
Software support | 0 | 0 | NA | NA | NA |
Software licenses and support | 0 | 0 | NA | NA | NA |
Cloud and software | 371 | 353 | NA | NA | NA |
Services | 137 | 130 | NA | NA | NA |
Total segment revenue | 508 | 483 | NA | NA | NA |
Cost of cloud – SaaS/PaaS1) | –33 | –31 | NA | NA | NA |
Cost of cloud | –33 | –31 | NA | NA | NA |
Cost of software licenses and support | 0 | 0 | NA | NA | NA |
Cost of cloud and software | –33 | –31 | NA | NA | NA |
Cost of services | –78 | –74 | NA | NA | NA |
Total cost of revenue | –110 | –106 | NA | NA | NA |
Segment gross profit | 398 | 377 | NA | NA | NA |
Other segment expenses | –389 | –368 | NA | NA | NA |
Segment profit | 8 | 9 | NA | NA | NA |
1) Software as a service/platform as a service
2) There are no prior-period numbers for the Qualtrics segment presented, since we acquired Qualtrics in 2019.
Segment Revenue by Region | | | | | | | | | |
€ millions | Applications, Technology
& Services | Intelligent Spend Group | | | Qualtrics | Total Reportable Segments |
| | 2019 | 2018 | | 2019 | 2018 | | 2019 | 2018 | | 2019 | 2018 |
| Actual
Currency | Constant
Currency | Actual
Currency | Actual
Currency | Constant
Currency | Actual
Currency | Actual
Currency | Constant
Currency | Actual
Currency | Actual
Currency | Constant
Currency | Actual
Currency |
EMEA | 11,279 | 11,152 | 10,610 | 612 | 594 | 443 | 68 | 65 | NA | 11,959 | 11,811 | 11,053 |
Americas | 8,463 | 8,158 | 7,604 | 2,216 | 2,115 | 1,915 | 403 | 383 | NA | 11,081 | 10,655 | 9,519 |
APJ | 3,802 | 3,669 | 3,539 | 356 | 348 | 271 | 37 | 36 | NA | 4,196 | 4,053 | 3,810 |
Total segment revenue | 23,544 | 22,980 | 21,753 | 3,184 | 3,057 | 2,629 | 508 | 483 | NA | 27,236 | 26,520 | 24,383 |
| | | | | | | | | | | | | |
For a breakdown of revenue by region for the SAP Group, see Note (A.1).
Section C – Financial Results | 159 |
To Our | Combined Group | Consolidated Financial | Further Information on Economic, | Additional |
Stakeholders | Management Report | Statements IFRS | Environmental, and Social Performance | Information |
(C.2) Reconciliation of Segment Measures to the Consolidated Income Statements |
€ millions | | 2019 | | 2018 | 2017 |
| Actual
Currency | Constant
Currency1) | Actual
Currency | Constant
Currency1) | Actual
Currency |
Applications, Technology & Services | 23,544 | 22,980 | 21,753 | 22,859 | 20,857 |
Intelligent Spend Group | 3,184 | 3,057 | 2,629 | 2,733 | 2,261 |
Qualtrics | 508 | 483 | NA | NA | NA |
Total segment revenue for reportable segments | 27,236 | 26,520 | 24,383 | 25,593 | 23,118 |
Other revenue | 398 | 385 | 359 | 368 | 345 |
Adjustment for currency impact | 0 | 728 | 0 | –1,219 | 0 |
Adjustment of revenue under fair value accounting | –81 | –81 | –33 | –33 | –3 |
 Total revenue Total revenue
| 27,553 | 27,553 | 24,708 | 24,708 | 23,461 |
| | | | | |
Applications, Technology & Services | 9,868 | 9,597 | 8,922 | 9,359 | 8,587 |
Intelligent Spend Group | 696 | 661 | 531 | 545 | 388 |
Qualtrics | 8 | 9 | NA | NA | NA |
Total segment profit for reportable segments | 10,573 | 10,268 | 9,453 | 9,904 | 8,975 |
Other revenue | 398 | 385 | 359 | 368 | 345 |
Other expenses | –2,763 | –2,700 | –2,649 | –2,791 | –2,551 |
Adjustment for currency impact | 0 | 255 | 0 | –317 | 0 |
Adjustment for | | | | | |
Revenue under fair value accounting | –81 | –81 | –33 | –33 | –3 |
Acquisition-related charges | –689 | –689 | –577 | –577 | –587 |
Share-based payment expenses | –1,835 | –1,835 | –830 | –830 | –1,120 |
Restructuring | –1,130 | –1,130 | –19 | –19 | –182 |
Operating profit | 4,473 | 4,473 | 5,703 | 5,703 | 4,877 |
Other non-operating income/expense, net | –74 | –74 | –56 | –56 | –36 |
Financial income, net | 198 | 198 | –47 | –47 | 188 |
Profit before tax | 4,596 | 4,596 | 5,600 | 5,600 | 5,029 |
1) The 2019 constant currency amounts are only comparable to 2018 actual currency amounts; 2018 constant currency amounts are only comparable to 2017 actual currency amounts.
160 | Section C – Financial Results |
To Our | Combined Group | Consolidated Financial | Further Information on Economic, | Additional |
Stakeholders | Management Report | Statements IFRS | Environmental, and Social Performance | Information |
(C.3) Other Non-Operating Income/Expense, Net
€ millions | | 2019 | 2018 | 2017 | |
Foreign currency exchange gain/loss, net | | –51 | –31 | –12 | |
Thereof from financial assets at fair value through profit or loss | | 358 | 444 | 615 | |
Thereof from financial assets at amortized cost (2017: loans and receivables) | | 194 | 148 | 96 | |
Thereof from financial liabilities at fair value through profit or loss | | –396 | –415 | –435 | |
Thereof from financial liabilities at amortized cost | | –176 | –202 | –317 | |
Miscellaneous income/expense, net | | –23 | –25 | –24 | |
 Other non-operating income/expense, net Other non-operating income/expense, net
| | –74 | –56 | –36 | |
(C.4) Financial Income, Net
€ millions | | 2019 | 2018 | 2017 | |
Finance income | | 787 | 371 | 476 | |
Thereof gains from financial assets at fair value through profit or loss (2017: from available-for-sale financial assets) | | 596 | 227 | 382 | |
Finance costs | | –589 | –418 | –288 | |
Thereof interest expense from financial liabilities at amortized cost | | –207 | –106 | –89 | |
Thereof interest expense from financial liabilities at fair value through profit or loss (2017: from available-for-sale financial liabilities) | | –155 | –206 | –116 | |
Financial income, net | | 198 | –47 | 188 | |
(C.5) Income Taxes
 Judgments and Estimates Judgments and Estimates
We are subject to changing tax laws in multiple jurisdictions within the countries in which we operate. Our ordinary business activities also include transactions where the ultimate tax outcome is uncertain due to different interpretations of tax laws, such as those involving revenue sharing and cost reimbursement arrangements between SAP Group entities. In addition, the amount of income taxes we pay is generally subject to ongoing audits by domestic and foreign tax authorities. In determining our worldwide income tax provisions, judgment is involved in assessing whether to consider each uncertain tax treatment separately or together with one or more other uncertain tax treatments and whether to reflect the respective effect of uncertainty based on the most likely amount or the expected value. In applying these judgments, we consider the nature and the individual facts and circumstances of each uncertain tax treatment as well as the specifics of the respective jurisdiction, including applicable tax laws and our interpretation thereof. The assessment whether a deferred tax asset is impaired requires judgment, as we need to estimate future taxable profits to determine whether the utilization of the deferred tax asset is probable. In evaluating our ability to utilize our deferred tax assets, we consider all available positive and negative evidence, including the level of historical taxable income and projections for future taxable income over the periods in which the deferred tax assets are recoverable. Our judgment regarding future taxable income is based on assumptions about future market conditions and future profits of SAP. Judgment is also required in evaluating whether interest or penalties related to income taxes meet the definition of income taxes, and, if not, whether it is of financial nature. In this judgment, we particularly consider applicable local tax laws and interpretations on IFRS by national standard setters in the area of group financial reporting. |
Tax Expense by Geographic Location
€ millions | | 2019 | 2018 | 2017 | |
Current tax expense | | | | | |
Germany | | 625 | 733 | 935 | |
Foreign | | 1,153 | 1,019 | 716 | |
Total current tax expense | | 1,778 | 1,752 | 1,651 | |
Deferred tax expense/income | | | | | |
Germany | | –3 | 57 | –584 | |
Foreign | | –549 | –298 | –84 | |
Total deferred tax income | | –552 | –241 | –668 | |
 Total income tax expense Total income tax expense
| | 1,226 | 1,511 | 983 | |
Section C – Financial Results | 161 |
To Our | Combined Group | Consolidated Financial | Further Information on Economic, | Additional |
Stakeholders | Management Report | Statements IFRS | Environmental, and Social Performance | Information |
Major Components of Tax Expense
€ millions | | 2019 | 2018 | 2017 | |
Current tax expense/income | | | | | |
Tax expense for current year | | 1,818 | 1,665 | 1,623 | |
Taxes for prior years | | –40 | 87 | 28 | |
Total current tax expense | | 1,778 | 1,752 | 1,651 | |
Deferred tax expense/income | | | | | |
Origination and reversal of temporary differences | | –710 | –501 | –891 | |
Unused tax losses, research and development tax credits, and foreign tax credits | | 158 | 260 | 223 | |
Total deferred tax income | | –552 | –241 | –668 | |
Total income tax expense | | 1,226 | 1,511 | 983 | |
Profit Before Tax by Geographic Location
€ millions | | 2019 | 2018 | 2017 | |
Germany | | 2,012 | 3,106 | 2,788 | |
Foreign | | 2,584 | 2,494 | 2,241 | |
Total | | 4,596 | 5,600 | 5,029 | |
The following table reconciles the expected income tax expense, computed by applying our combined German tax rate of 26.4% (2018: 26.4%; 2017: 26.4%), to the actual income tax expense. Our 2019 combined German tax rate includes a corporate income tax rate of 15.0% (2018: 15.0%; 2017: 15.0%), plus a solidarity surcharge of 5.5% (2018: 5.5%; 2017: 5.5%) thereon, and trade taxes of 10.6% (2018: 10.6%; 2017: 10.6%).
Relationship Between Tax Expense and Profit Before Tax
€ millions, unless otherwise stated | | 2019 | 2018 | 2017 | |
Profit before tax | | 4,596 | 5,600 | 5,029 | |
Tax expense at applicable tax rate of 26.4% (2018: 26.4%; 2017: 26.4%) | | 1,212 | 1,478 | 1,327 | |
Tax effect of: | | | | | |
Foreign tax rates | | –209 | –147 | –403 | |
Changes in tax laws and tax rates | | 10 | 0 | –212 | |
Non-deductible expenses | | 116 | 106 | 82 | |
Tax-exempt income | | –93 | –38 | –95 | |
Withholding taxes | | 138 | 91 | 131 | |
Research and development and foreign tax credits | | –89 | –33 | –26 | |
Prior-year taxes | | 80 | –17 | –26 | |
Reassessment of deferred tax assets, research and development tax credits, and foreign tax credits | | 48 | 58 | 185 | |
Other | | 13 | 13 | 20 | |
Total income tax expense | | 1,226 | 1,511 | 983 | |
Effective tax rate (in %) | | 26.7 | 27.0 | 19.5 | |
Components of Recognized Deferred Tax Assets and Liabilities
€ millions | 2019 | 2018 | |
Deferred tax assets | | | |
Intangible assets | 504 | 668 | |
Property, plant, and equipment | 19 | 28 | |
Other financial assets | 11 | 11 | |
Trade and other receivables | 61 | 55 | |
Pension provisions | 135 | 116 | |
Share-based payments | 268 | 140 | |
Other provisions and obligations | 1,330 | 424 | |
Contract liabilities | 553 | 229 | |
Carryforwards of unused tax losses | 131 | 150 | |
Research and development and foreign tax credits | 56 | 21 | |
Other | 152 | 181 | |
Total deferred tax assets | 3,220 | 2,023 | |
Deferred tax liabilities | | | |
Intangible assets | 1,006 | 628 | |
Property, plant, and equipment | 544 | 95 | |
Other financial assets | 224 | 139 | |
Trade and other receivables | 148 | 153 | |
Pension provisions | 13 | 12 | |
Share-based payments | 1 | 0 | |
Other provisions and obligations | 50 | 18 | |
Contract liabilities | 6 | 23 | |
Other | 59 | 43 | |
Total deferred tax liabilities | 2,051 | 1,111 | |
Total deferred tax assets, net | 1,169 | 912 | |
The increase in deferred tax assets for other provisions and obligations mainly results from deferred intercompany income and the adoption of IFRS 16 ‘Leases’, the latter leading also to a corresponding increase in deferred tax liabilities for property, plant, and equipment. Furthermore, the deferred tax assets for contract liabilities increased mainly because of deferred revenue, and the deferred tax liabilities for intangible assets increased mainly due to our business combination in 2019.
162 | Section C – Financial Results |
To Our | Combined Group | Consolidated Financial | Further Information on Economic, | Additional |
Stakeholders | Management Report | Statements IFRS | Environmental, and Social Performance | Information |
Items Not Resulting in a Deferred Tax Asset
€ millions | | 2019 | 2018 | 2017 | |
Unused tax losses | | | | | |
Not expiring | | 688 | 575 | 375 | |
Expiring in the following year | | 63 | 7 | 9 | |
Expiring after the following year | | 373 | 476 | 535 | |
Total unused tax losses | | 1,124 | 1,058 | 919 | |
Deductible temporary differences | | 538 | 509 | 524 | |
Unused research and development and foreign tax credits | | | | | |
Not expiring | | 28 | 54 | 38 | |
Expiring in the following year | | 0 | 0 | 2 | |
Expiring after the following year | | 17 | 18 | 34 | |
Total unused tax credits | | 45 | 72 | 74 | |
Of the unused tax losses, €187 million (2018: €213 million; 2017: €263 million) relate to U.S. state tax loss carryforwards.
We have not recognized a deferred tax liability on approximately €17.41 billion (2018: €14.04 billion) for undistributed profits of our subsidiaries, because we are in a position to control the timing of the reversal of the temporary difference and it is probable that such differences will not reverse in the foreseeable future.
Income Tax-Related Litigation
We are subject to ongoing tax audits by domestic and foreign tax authorities. Currently, we are in dispute mainly with the German and only a few foreign tax authorities. The German dispute is in respect of intercompany financing matters and certain secured capital investments, while the few foreign disputes are in respect of the deductibility of intercompany royalty payments and intercompany services. In all cases, we expect that a favorable outcome can only be achieved through litigation. For all of these matters, we have not recorded a provision as we believe that the tax authorities’ claims have no merit and that no adjustment is warranted. If, contrary to our view, the tax authorities were to prevail in their arguments before the court, we would expect to have an additional expense of approximately €2,013 million (2018: €1,746 million) in total (including related interest expenses and penalties of €982 million (2018: €842 million)).
(C.6) Earnings per Share
€ millions, unless otherwise stated | | 2019 | 2018 | 2017 | |
Profit attributable to equity holders of SAP SE | | 3,321 | 4,083 | 4,008 | |
Issued ordinary shares1) | | 1,229 | 1,229 | 1,229 | |
Effect of treasury shares1) | | –35 | –35 | –31 | |
Weighted average shares outstanding, basic1) | | 1,194 | 1,194 | 1,197 | |
Dilutive effect of share-based payments1) | | 0 | 0 | 1 | |
Weighted average shares outstanding, diluted1) | | 1,194 | 1,194 | 1,198 | |
Earnings per share, basic, attributable to equity holders of SAP SE (in €) | | 2.78 | 3.42 | 3.35 | |
Earnings per share, diluted, attributable to equity holders of SAP SE (in €) | | 2.78 | 3.42 | 3.35 | |
1) Number of shares in millions
Section C – Financial Results | 163 |
To Our | Combined Group | Consolidated Financial | Further Information on Economic, | Additional |
Stakeholders | Management Report | Statements IFRS | Environmental, and Social Performance | Information |
Section D – Invested Capital
This section highlights our non-current assets including investments that form the basis of our operating activities. Additions to invested capital include separate asset acquisitions or business combinations. Further, we disclose information about purchase obligations and capital contributions.
For more information about the effects resulting from the application of IFRS 16 ‘Leases’, see Note (D.8).
(D.1) Business Combinations
 Measuring Non-Controlling Interests and Allocation of Consideration Transferred Measuring Non-Controlling Interests and Allocation of Consideration Transferred
We decide for each business combination whether to measure the non-controlling interest in the acquiree at fair value or at the proportionate share of the acquiree’s identifiable net assets. We classify costs related to executing business combinations as general and administration expense. In our accounting for business combinations, judgment is required in determining whether an intangible asset is identifiable, and should be recorded separately from goodwill. Additionally, estimating the acquisition-date fair values of the identifiable assets acquired and liabilities assumed involves considerable judgment. The necessary measurements are based on information available on the acquisition date and are based on expectations and assumptions that have been deemed reasonable by management. These judgments, estimates, and assumptions can materially affect our financial position and profit for several reasons, including the following: – Fair values assigned to assets subject to depreciation and amortization affect the amounts of depreciation and amortization to be recorded in operating profit in the periods following the acquisition. – Subsequent negative changes in the estimated fair values of assets may result in additional expense from impairment charges. – Subsequent changes in the estimated fair values of liabilities and provisions may result in additional expense (if increasing the estimated fair value) or additional income (if decreasing the estimated fair value). |
We acquire businesses in specific areas of strategic interest to us, particularly to broaden our product and service portfolio.
2019 Acquisitions
On January 23, 2019, we concluded the acquisition of Qualtrics, following satisfaction of applicable regulatory and other approvals (also see Note (G.9) of our 2018 Consolidated Financial Statements).
Qualtrics is a leading provider of experience management solutions. By combining Qualtrics products and SAP products, we aim to deliver an end-to-end experience and operational management system to our customers.
We acquired 100% of the Qualtrics shares for approx. US$35 per share, representing consideration transferred in cash of approximately US$7.1 billion. In addition to the cash payments, SAP also incurs liabilities and post-closing expenses relating to assumed share-based payment awards amounting to approximately US$0.9 billion.
The operating results and assets and liabilities of Qualtrics are reflected in our consolidated financial statements from January 23, 2019, onward.
Qualtrics Acquisition: Consideration Transferred
€ millions | |
Cash paid | 6,212 |
Liabilities incurred | 237 |
Total consideration transferred | 6,449 |
The liabilities incurred relate to the earned portion of unvested share-based payment awards. These liabilities were incurred by replacing, upon acquisition, equity-settled share-based payment awards held by employees of Qualtrics with cash-settled share-based payment awards, which are subject to forfeiture. The respective liabilities represent the portion of the replacement awards that relates to pre-acquisition services provided by the acquiree’s employees and were measured at the fair value determined under IFRS 2 (also see Note (B.3)).
Measurement period adjustments recorded in 2019 (which were not material) mostly relate to intangible assets (finalization of the fair value calculation) and tax-related assets and liabilities.
The following table summarizes the values of identifiable assets acquired and liabilities assumed in connection with the acquisition of Qualtrics, as at the acquisition date.
164 | Section D – Invested Capital |
To Our | Combined Group | Consolidated Financial | Further Information on Economic, | Additional |
Stakeholders | Management Report | Statements IFRS | Environmental, and Social Performance | Information |
Qualtrics Acquisition: Recognized Assets and Liabilities
€ millions | |
Cash and cash equivalents | 138 |
Other financial assets | 1 |
Trade and other receivables | 37 |
Other non-financial assets | 20 |
Property, plant, and equipment | 75 |
Intangible assets | 1,803 |
Thereof acquired technology | 575 |
Thereof customer relationship and other intangibles | 1,226 |
Thereof software and database licenses | 2 |
Total identifiable assets | 2,074 |
Trade and other payables | 97 |
Financial liabilities | 53 |
Current and deferred tax liabilities | 320 |
Provisions and other non-financial liabilities | 41 |
Contract liabilities | 129 |
Total identifiable liabilities | 640 |
Total identifiable net assets | 1,434 |
Goodwill | 5,015 |
Total consideration transferred | 6,449 |
In general, the goodwill arising from our acquisitions consists largely of the synergies and the know-how and technical skills of the acquired businesses’ workforces.
Qualtrics goodwill is attributed to expected synergies from the acquisition, particularly in the following areas:
– Cross-selling opportunities to existing SAP customers across all regions, using SAP’s sales organization
– Creation of new offerings by combining Qualtrics products and SAP products to deliver an end-to-end experience and operational management system to the customers
– Improved profitability in Qualtrics sales and operations
The allocation of the goodwill resulting from the Qualtrics acquisition to our operating segments depends on how our operating segments actually benefit from the synergies of the Qualtrics business combination. For more information, see Note (D.2).
For more information about our segments and about the changes in our segment structure, see Note (C.1).
Impact of the Business Combination on Our Financial Statements
The amounts of revenue and profit or loss of the Qualtrics business acquired in 2019 since the acquisition date are included in our consolidated income statements for the reporting period as follows:
Qualtrics Acquisition: Impact on SAP’s Financials
€ millions | 2019
as Reported | Contribution
of Qualtrics |
 Revenue Revenue
| 27,553 | 429 |
Profit after tax | 3,370 | –526 |
Had Qualtrics been consolidated as at January 1, 2019, our revenue and profit after tax for the reporting period would not have been materially different.
2018 Acquisitions
On April 5, 2018, following satisfaction of applicable regulatory and other approvals, we acquired 100% of the shares of Callidus (NDSQ: CALD), a leading provider of customer relationship management (CRM) solutions. SAP paid US$36 per share, representing consideration transferred in cash of approximately US$2.4 billion. The acquisition aimed to accelerate and strengthen SAP’s position and solution offerings in the sales performance management (SPM) and configure-price-quote (CPQ) spaces.
Callidus Acquisition: Consideration Transferred
€ millions | |
Cash paid | 1,957 |
Liabilities incurred | 47 |
Total consideration transferred | 2,004 |
The liabilities incurred related to the earned portion of unvested share-based payment awards. These liabilities were incurred by replacing, upon acquisition, equity-settled share-based payment awards held by employees of Callidus with cash-settled share-based payment awards, which are subject to forfeiture. The respective liabilities represented the portion of the replacement awards that relates to pre-acquisition services provided by the acquiree’s employees and were measured at the fair value determined under IFRS 2.
Measurement period adjustments recorded in both 2018 and 2019 were not material.
Section D – Invested Capital | 165 |
To Our | Combined Group | Consolidated Financial | Further Information on Economic, | Additional |
Stakeholders | Management Report | Statements IFRS | Environmental, and Social Performance | Information |
The following table summarizes the values of identifiable assets acquired and liabilities assumed in connection with the acquisition of Callidus, as at the acquisition date:
Callidus Acquisition: Recognized Assets and Liabilities
€ millions | |
Cash and cash equivalents | 63 |
Other financial assets | 64 |
Trade and other receivables | 32 |
Other non-financial assets | 11 |
Property, plant, and equipment | 26 |
Intangible assets | 515 |
Thereof acquired technology | 121 |
Thereof customer relationship and other intangibles | 390 |
Thereof software and database licenses | 4 |
Total identifiable assets | 711 |
Trade and other payables | 59 |
Current and deferred tax liabilities | 71 |
Provisions and other non-financial liabilities | 15 |
Contract liabilities/deferred income | 55 |
Total identifiable liabilities | 200 |
Total identifiable net assets | 511 |
Goodwill | 1,493 |
Total consideration transferred | 2,004 |
The goodwill arising from our acquisitions consists largely of synergies and the know-how and technical skills of the acquired businesses’ workforces.
For the Callidus acquisition, synergies particularly relate to the following areas:
– Cross-selling opportunities of Callidus products to existing SAP customers across all regions, using SAP’s sales organization
– Integrating Callidus products into SAP C/4HANA to strengthen SAP’s customer experience suite of solutions
– Improved profitability in Callidus sales and operations
After the acquisition, we had allocated the Callidus goodwill and intangibles to the newly established Customer Experience segment. For more information about our segments and about the changes in our segment structure after the allocation, see Note (C.1).
Impact of the Business Combination on Our Financial Statements
The amounts of revenue and profit or loss of the Callidus business acquired in 2018 since the acquisition date are included in the consolidated income statements for the reporting period as follows:
Callidus Acquisition: Impact on SAP’s Financials
€ millions | 2018
as Reported | Contribution
of Callidus |
Revenue | 24,708 | 180 |
 Profit after tax Profit after tax
| 4,088 | –60 |
Had Callidus been consolidated as at January 1, 2018, our estimated pro forma revenue for the reporting period would have been €24,766 million, and pro forma profit after tax would have been €4,071 million.
These amounts were calculated after applying SAP’s accounting policies and after adjusting the results for Callidus to reflect significant effects from, for example:
– Additional depreciation and amortization that would have been charged assuming the fair value adjustment to property, plant, and equipment, and to intangible assets had been applied from January 1, 2018
– The impact of fair value adjustments on contract liabilities/deferred income on a cumulative basis
– The borrowing costs on the funding levels and debt/equity position of SAP after the business combination
– Employee benefits, such as share-based compensation
– Transaction expenses incurred as part of the acquisition
– Related income taxes
These pro forma numbers have been prepared for comparative purposes only. The pro forma revenue and profit numbers are not necessarily indicative either of the results of operations that would have actually occurred had the acquisition been in effect at the beginning of the respective period, or of future results.
166 | Section D – Invested Capital |
To Our | Combined Group | Consolidated Financial | Further Information on Economic, | Additional |
Stakeholders | Management Report | Statements IFRS | Environmental, and Social Performance | Information |
(D.2) Goodwill
 Goodwill and Intangible Asset Impairment Testing Goodwill and Intangible Asset Impairment Testing
The annual goodwill impairment test is performed at the level of our operating segments, since there are no lower levels in SAP at which goodwill is monitored for internal management purposes. In general, the test is performed at the same time (at the beginning of the fourth quarter) for all operating segments. In making impairment assessments for our goodwill and intangible assets, the outcome of these tests is highly dependent on management’s assumptions regarding future cash flow projections and economic risks, which require significant judgment and assumptions about future developments. They can be affected by a variety of factors, including: – Changes in business strategy – Internal forecasts – Estimation of weighted-average cost of capital Changes to the assumptions underlying our goodwill and intangible assets impairment assessments could require material adjustments to the carrying amount of our recognized goodwill and intangible assets as well as the amounts of impairment charges recognized in profit or loss. The outcome of goodwill impairment tests may also depend on the allocation of goodwill to our operating segments. This allocation involves judgment as it is based on our estimates regarding which operating segments are expected to benefit from the synergies of business combinations. Changes in our segment structure result in the reallocation of goodwill with the reallocated goodwill being calculated based on relative values (if a direct allocation is not possible). |
Goodwill | |
€ millions | |
Historical cost | |
1/1/2018 | 21,371 |
Foreign currency exchange differences | 847 |
Additions from business combinations | 1,620 |
12/31/2018 | 23,838 |
Foreign currency exchange differences | 417 |
Additions from business combinations | 5,017 |
Retirements/disposals | –9 |
12/31/2019 | 29,263 |
| |
Accumulated amortization | |
1/1/2018 | 100 |
Foreign currency exchange differences | 2 |
12/31/2018 | 102 |
Foreign currency exchange differences | –1 |
12/31/2019 | 101 |
| |
Carrying amount | |
12/31/2018 | 23,736 |
12/31/2019 | 29,162 |
For more information about our segments and the changes in 2019, see Note (C.1).
For impairment testing purposes, the carrying amount of goodwill is allocated to the operating segments expected to benefit from goodwill as follows:
Goodwill by Operating Segment | | | | | |
€ millions | Applications,
Technology &
Services | Intelligent
Spend Group
(Formerly
SAP Business
Network) | Qualtrics
(Formerly
Customer and
Experience
Management)1) | Other | Total |
12/31/2018 | 13,498 | 6,925 | 3,304 | 9 | 23,736 |
12/31/2019 | 18,509 | 7,762 | 2,882 | 9 | 29,162 |
1) The Customer Experience segment existing at the end of 2018 was renamed to Customer and Experience Management following the addition of Qualtrics at the beginning of 2019.
Based on the expected synergies, the goodwill added through the Qualtrics acquisition (see Note (D.1) for more information) was partially allocated to the Applications, Technology & Services (€1,509 million) and the Intelligent Spend Group (€734 million) segments, with the residual amount being allocated to the Qualtrics segment.
Due to the changes in our segments in 2019, the former Customer Experience segment goodwill of €3,438 million was moved to the Applications, Technology & Services segment.
Section D – Invested Capital | 167 |
To Our | Combined Group | Consolidated Financial | Further Information on Economic, | Additional |
Stakeholders | Management Report | Statements IFRS | Environmental, and Social Performance | Information |
Goodwill Impairment Test
The key assumptions on which management based its cash flow projections for the period covered by the underlying business plans are as follows:
Key Assumption | Basis for Determining Values Assigned to Key Assumption |
Budgeted revenue growth | Revenue growth rate achieved in the current year, adjusted for an expected increase in SAP’s addressable cloud and database markets; expected growth in the established software applications and analytics markets. Values assigned reflect our past experience and our expectations regarding an increase in the addressable markets. |
Budgeted operating margin | Operating margin budgeted for a given budget period equals the operating margin achieved in the current year, increased by expected efficiency gains. Values assigned reflect past experience, except for efficiency gains. |
Discount rates | Our estimated cash flow projections are discounted to present value using discount rates (after-tax rates). Discount rates are based on the weighted average cost of capital (WACC) approach. |
Terminal growth rate | Our estimated cash flow projections for periods beyond the business plan were extrapolated using segment-specific terminal growth rates. These growth rates do not exceed the long-term average growth rates for the markets in which our segments operate. |
Key Assumptions and Detailed Planning Period |
Percent, unless otherwise stated | Applications, Technology & | Intelligent Spend Group2) | | Qualtrics3) |
| | Services2) | (Formerly SAP Business Network) | (Formerly Customer and |
| | | | | Experience Management)1) |
| 2019 | 2018 | 2019 | 2018 | 2019 | 20184) |
Budgeted revenue growth (average of the budgeted period) | 3.0 | 4.8 | 13.3 | 13.8 | 22.6 | NA |
Pre-tax discount rate | NA | 11.0 | NA | 11.5 | NA | NA |
After-tax discount rate | 9.1 | 8.6 | 10.4 | 9.0 | 11.1 | NA |
Terminal growth rate | 3.0 | 3.0 | 3.0 | 3.0 | 3.0 | NA |
Detailed planning period (in years) | 5 | 5 | 9 | 9 | 13 | NA |
| | | | | | | |
1) The Customer Experience segment existing at the end of 2018 was renamed to Customer and Experience Management following the addition of Qualtrics at the beginning of 2019.
2) Testing date: October 1
3) Testing date: December 1
4) See below for information about the assumptions used for the former Customer Experience segment – given the segment changes, comparability to the previous year is limited.
On October 1, 2019, we performed a goodwill impairment test for the Applications, Technology & Services and Intelligent Spend Group (formerly SAP Business Network) reportable segments as well as for the part of the Customer and Experience Management segment that was moved to the Applications, Technology & Services segment in October (given the proximity of the move to the testing date, the tests coincided). At the beginning of October, we had not yet completed the synergy identification/valuation and thus tested Qualtrics at the beginning of December (after completion of the synergy identification/valuation).
Goodwill Impairment Test Performed on October 1
Applications, Technology & Services Segment and Intelligent Spend Group Segment
The recoverable amount of these segments was determined based on fair value less costs of disposal calculation (in 2018, a value-in-use calculation was performed for the Applications, Technology & Services segment). The fair value measurement was categorized as a Level 3 fair value based on the inputs used in the valuation. The cash flow projections were based on actual operating results and specific estimates covering a detailed planning period and the terminal growth rate thereafter. The projected results were determined based on management’s estimates and are consistent with the assumptions a market participant would make (target operating margins of 35.9% (Applications, Technology & Services) and 30.6% (Intelligent Spend Group) were used in the valuation).
We believe that no reasonably possible change in any of the above key assumptions would cause the carrying amount of our Applications, Technology & Services segment and Intelligent Spend Group segment to exceed the recoverable amount.
Customer and Experience Management Segment
The Customer Experience offerings that continued to belong to the Customer and Experience Management segment during the first three quarters of 2019 became part of the Applications, Technology
168 | Section D – Invested Capital |
To Our | Combined Group | Consolidated Financial | Further Information on Economic, | Additional |
Stakeholders | Management Report | Statements IFRS | Environmental, and Social Performance | Information |
& Services segment in October 2019 through splitting and partial integration into other company functions (for more information, see Note (C.1)). The impairment test at the time of the transfer coincided with the impairment test on October 1.
When performing the impairment test, the recoverable amount was determined based on fair value less costs of disposal calculation (in 2018, a value-in-use calculation was performed). The fair value measurement was categorized as a Level 3 fair value based on the inputs used in the valuation. The cash flow projections were based on actual operating results and specific estimates covering a detailed planning period and the terminal growth rate thereafter. The projected results were determined based on management’s estimates and are consistent with the assumptions a market participant would make (a target operating margin of 22.6% was used in the valuation).
The following key assumptions were factored into the calculation of the recoverable amount (percent, unless otherwise stated):
– Budgeted revenue growth: 18.6 (2018: 32.9)
– Pre-tax discount rate: NA (2018: 11.7)
– After-tax discount rate: 9.0 (2018: 9.4)
– Terminal growth rate: 3.0 (2018: 3.0)
– Detailed planning period in years: 9 (2018: 5)
Given the fact that the Customer Experience part of the former Customer and Experience Management segment has still not reached a steady state, we have used a longer and more detailed planning period than one would apply in a more mature segment.
Based on these key assumptions, at the time of the transfer, the recoverable amount exceeded the carrying amount by €4,574 million (2018: €8,476 million).
The following table shows the amounts by which the key assumptions could – at the time of the impairment test – have changed individually (that is, without changing the other key assumptions) for the recoverable amount to be at least equal to the carrying amount. For budgeted revenue growth sensitivity, the cost structure was not adjusted, hence leading to a modified terminal operating margin:
Sensitivity to Change in Assumptions |
| Customer Experience Part of
the Customer and Experience
Management Segment |
| 2019 | 2018 |
Budgeted revenue growth (change in pp) | –1.9 | –8.3 |
After-tax discount rate (change in pp) | 4.9 | 8.7 |
Pre-tax discount rate (change in pp) | NA | 10.2 |
Target operating margin at the end of the budgeted period (change in pp) | –13 | –28 |
Goodwill Impairment Test Performed on December 1
Applications, Technology & Services Segment and Intelligent Spend Group Segment
The goodwill impairment test on October 1 resulted in a headroom that is significantly higher than the portion of the goodwill that – at the beginning of December – was allocated to the segments respectively. Thus, there is no impairment risk resulting from the partial allocation of the Qualtrics goodwill.
Qualtrics
For more information about the Qualtrics segment, see Note (C.1).
The impairment test for the Qualtrics segment was performed on December 1 because at that time, we had finalized the initial allocation of the Qualtrics goodwill to our segments. The test already reflects the allocation of parts of the Qualtrics goodwill to the Applications, Technology & Services segment and Intelligent Spend Group segment.
The recoverable amount was determined based on fair value less costs of disposal calculation. The fair value measurement was categorized as a Level 3 fair value based on the inputs used in the valuation. The cash flow projections were based on actual operating results and specific estimates covering a detailed planning period and the terminal growth rate thereafter. The projected results were determined based on management’s estimates and are consistent with the assumptions a market participant would make (a target operating margin of 21.5% was used in the valuation).
Given the fact that the Qualtrics segment is expected to show disproportionate growth in the coming years and has not yet reached a steady state, we have used a longer and more detailed planning period than one would apply in a more mature segment.
The recoverable amount exceeded the carrying amount by €4,071 million.
The following table shows the amounts by which the key assumptions would need to change individually (that is, without changing the other key assumptions) for the recoverable amount to be equal to the carrying amount. For budgeted revenue growth sensitivity, the cost structure was not adjusted, hence leading to a modified terminal operating margin:
Sensitivity to Change in Assumptions | |
| | Qualtrics |
| 2019 | 20185) |
Budgeted revenue growth (change in pp) | –1.6 | NA |
After-tax discount rate (change in pp) | 6.3 | NA |
Target operating margin at the end of the budgeted period (change in pp) | –15 | NA |
5) See above for more information about the sensitivity analysis performed for the former Customer Experience segment – given the segment changes, comparability to the previous year is limited.
Section D – Invested Capital | 169 |
To Our | Combined Group | Consolidated Financial | Further Information on Economic, | Additional |
Stakeholders | Management Report | Statements IFRS | Environmental, and Social Performance | Information |
(D.3) Intangible Assets
 Recognition of Intangibles Recognition of Intangibles
Whereas in general, expenses for internally generated intangibles are expensed as incurred, development expenses incurred on standard-related customer development projects (for which the IAS 38 criteria are met cumulatively) are capitalized on a limited scale with those amounts being amortized over the estimated useful life of up to 12 years. Determining whether internally generated intangible assets from development qualify for recognition requires significant judgment, particularly in the following areas: – Determining whether activities should be considered research activities or development activities – Determining whether the conditions for recognizing an intangible asset are met requires assumptions about future market conditions, customer demand, and other developments. – The term “technical feasibility” is not defined in IFRS, and therefore determining whether the completion of an asset is technically feasible requires judgment and a company-specific approach. – Determining the future ability to use or sell the intangible asset arising from the development and the determination of the probability of future benefits from sale or use – Determining whether a cost is directly or indirectly attributable to an intangible asset and whether a cost is necessary for completing a development These judgments impact the total amount of intangible assets that we present in our balance sheet as well as the timing of recognizing development expenses in profit or loss.  Measurement of Intangibles Measurement of Intangibles
All our purchased intangible assets other than goodwill have finite useful lives. They are initially measured at acquisition cost and subsequently amortized based on the expected consumption of economic benefits over their estimated useful lives ranging from two to 20 years. Acquired in-process research and development project assets are typically amortized over five to seven years (starting upon completion / marketing of the respective projects). Judgment is required in determining the following: – The useful life of an intangible asset, as this is based on our estimates regarding the period over which the intangible asset is expected to produce economic benefits to us – The amortization method, as IFRS requires the straight-line method to be used unless we can reliably determine the pattern in which the asset’s future economic benefits are expected to be consumed by us Both the amortization period and the amortization method have an impact on the amortization expense that is recorded in each period. Classification of Intangibles We classify intangible assets according to their nature and use in our operations. Software and database licenses consist primarily of technology for internal use, whereas acquired technology consists primarily of purchased software to be incorporated into our product offerings and in-process research and development (IPRD). Customer relationship and other intangibles consist primarily of customer relationships and acquired trademark licenses. Amortization expenses of intangible assets are classified as cost of cloud, cost of services, research and development, sales and marketing, and general and administration, depending on the use of the respective intangible assets. |
170 | Section D – Invested Capital |
To Our | Combined Group | Consolidated Financial | Further Information on Economic, | Additional |
Stakeholders | Management Report | Statements IFRS | Environmental, and Social Performance | Information |
Intangible Assets | | | | |
€ millions | Software and | Acquired | Customer | Total |
| Database Licenses | Technology/IPRD | Relationship and | |
| | | Other Intangibles | |
Historical cost | | | | |
1/1/2018 | 809 | 1,992 | 4,631 | 7,432 |
Foreign currency exchange differences | 8 | 100 | 204 | 312 |
Additions from business combinations | 4 | 148 | 410 | 562 |
Other additions | 193 | 0 | 36 | 229 |
Retirements/disposals | –43 | –62 | –41 | –146 |
Transfers | 25 | 0 | –28 | –3 |
12/31/2018 | 996 | 2,178 | 5,212 | 8,386 |
Foreign currency exchange differences | 4 | 48 | 100 | 152 |
Additions from business combinations | 2 | 574 | 1,226 | 1,802 |
Other additions | 84 | 0 | 68 | 152 |
Retirements/disposals | –182 | –48 | –166 | –396 |
Transfers | 25 | 0 | –25 | 0 |
12/31/2019 | 929 | 2,752 | 6,415 | 10,096 |
| | | | |
Accumulated amortization | | | | |
1/1/2018 | 601 | 1,544 | 2,306 | 4,451 |
Foreign currency exchange differences | 6 | 77 | 87 | 170 |
Additions amortization | 95 | 216 | 337 | 648 |
Retirements/disposals | –23 | –62 | –25 | –110 |
12/31/2018 | 679 | 1,775 | 2,705 | 5,159 |
Foreign currency exchange differences | 5 | 33 | 39 | 77 |
Additions amortization | 94 | 271 | 395 | 760 |
Retirements/disposals | –180 | –48 | –163 | –391 |
12/31/2019 | 598 | 2,031 | 2,976 | 5,605 |
| | | | |
Carrying amount | | | | |
12/31/2018 | 317 | 403 | 2,507 | 3,227 |
12/31/2019 | 331 | 721 | 3,439 | 4,491 |
Significant Intangible Assets | | | |
€ millions, unless otherwise stated | | Carrying Amount | Remaining Useful |
| | | Life |
| 2019 | 2018 | (in years) |
Sybase – Customer relationships | 131 | 179 | 2 to 4 |
SuccessFactors – Customer relationships | 184 | 225 | 6 |
Ariba – Customer relationships | 273 | 323 | 6 to 8 |
Concur – Customer relationships | 955 | 1,033 | 11 to 15 |
Callidus – Customer relationships | 336 | 384 | 9 to 13 |
Qualtrics – Acquired technologies | 495 | 0 | 6 |
Qualtrics – Customer relationships | 1,152 | 0 | 13 to 18 |
Total significant intangible assets | 3,526 | 2,144 | |
Section D – Invested Capital | 171 |
To Our | Combined Group | Consolidated Financial | Further Information on Economic, | Additional |
Stakeholders | Management Report | Statements IFRS | Environmental, and Social Performance | Information |
(D.4) Property, Plant, and Equipment
 Depreciation of Property, Plant and Equipment
Property, plant, and equipment are typically depreciated using the straight-line method. Judgment is required in estimating the useful life of the assets. In this assessment we consider, among others, our history with similar assets and current and future changes in technology.
Changed Estimates of Useful Lives
At the beginning of 2019, we changed our estimate of the expected useful lives of certain information technology equipment. This change from four to five years is still within the range of two to six years. This change reduces our depreciation expense by €93 million in the year 2019 (thereof €65 million in cost of cloud).
Useful Lives of Property, Plant, and Equipment |
Buildings | Predominantly
25 to 50 years |
Leased assets and leasehold improvements | Based on the term of the
lease contract |
Information technology equipment | 2 to 6 years |
Office furniture | 4 to 20 years |
Automobiles | 4 to 5 years |
Property, Plant, and Equipment
€ millions | Land and Buildings | Land and Buildings | Other Property, | Other Property, | Advance Payments | Total |
| | Leased | Plant, and | Plant, and | and Construction in | |
| | | Equipment | Equipment Leased | Progress | |
12/31/2018 | 1,344 | - | 1,985 | - | 224 | 3,553 |
12/31/2019 | 1,537 | 1,929 | 1,956 | 38 | 36 | 5,496 |
| | | | | | |
Additions | | | | | | |
2018 | 199 | - | 1,026 | - | 77 | 1,302 |
2019 | 85 | 360 | 586 | 19 | 17 | 1,067 |
The additions (other than from business combinations) relate primarily to the replacement and purchase of information technology equipment and the construction and leasing of buildings and data centers. For more information about the effect of the adoption of IFRS 16, see Note (D.8).
(D.5) Equity Investments
 Accounting Policies, Judgments, and Estimates
As we do not designate financial assets as “at fair value through profit or loss,” we generally classify financial assets into the following categories: at amortized cost (AC), at fair value through other comprehensive income (FVOCI), and at fair value through profit or loss (FVTPL), depending on the contractual cash flows of and our business model for holding the respective asset.
For equity securities, as the cash flow characteristics are typically other than solely principal and interest, we take an investment-by-investment decision whether to classify as FVTPL or FVOCI. Judgment is required particularly in estimating the fair values of equity securities that are not listed publicly.
Gains/losses on equity securities at FVTPL include gains/losses from fair value fluctuations, from disposals as well as dividends, while gains/losses on equity securities at FVOCI only include dividends, all of which are shown in Financial Income, net. Regular way purchases and sales are recorded as at the trade date.
Equity Investments | | | | | | |
€ millions | | | 2019 | | | 2018 |
| Current | Non-Current | Total | Current | Non-Current | Total |
Equity securities | 0 | 1,996 | 1,996 | 0 | 1,248 | 1,248 |
Investments in associates | 0 | 16 | 16 | 0 | 26 | 26 |
Equity investments | 0 | 2,012 | 2,012 | 0 | 1,274 | 1,274 |
 Other financial assets Other financial assets
| 297 | 2,336 | 2,633 | 448 | 1,536 | 1,984 |
Equity investments as % of other financial assets | 0 | 86 | 76 | 0 | 83 | 64 |
For a list of the names of other equity investments, see Note (G.9).
172 | Section D – Invested Capital |
To Our | Combined Group | Consolidated Financial | Further Information on Economic, | Additional |
Stakeholders | Management Report | Statements IFRS | Environmental, and Social Performance | Information |
Financial Commitments in Venture Capital Funds
€ millions | | 2019 | 2018 |
Investments in venture capital funds | | 206 | 187 |
SAP invests and holds interests in unrelated parties that manage investments in venture capital. On December 31, 2019, total commitments to make such investments amounted to €517 million (2018: €418 million), of which €312 million had been drawn (2018: €232 million). By investing in such venture capital funds, we are exposed to the risks inherent in the business areas in which the entities operate. Our maximum exposure to loss is the amount invested plus contractually committed future capital contributions.
Maturities | |
€ millions | 12/31/2019 |
| Investments |
| in Venture |
| Capital Funds |
Due 2020 | 206 |
Total | 206 |
(D.6) Non-Current Assets by Region
The table below shows non-current assets excluding financial instruments, deferred tax assets, post-employment benefit assets, and rights arising under insurance contracts.
Non-Current Assets by Region
€ millions | 2019 | 2018 |
Germany | 4,486 | 4,184 |
Rest of EMEA | 5,386 | 4,742 |
EMEA | 9,872 | 8,926 |
United States | 29,744 | 22,133 |
Rest of Americas | 411 | 258 |
Americas | 30,154 | 22,391 |
APJ | 1,276 | 922 |
SAP Group | 41,302 | 32,239 |
For a breakdown of our employee headcount by region, see Note (B.1), and for a breakdown of revenue by region, see Note (A.1).
(D.7) Purchase Obligations
€ millions | 2019 | 2018 |
Contractual obligations for acquisition of property, plant, and equipment and intangible assets | 342 | 123 |
Other purchase obligations | 2,251 | 2,010 |
Purchase obligations | 2,592 | 2,133 |
The contractual obligations for acquisition of property, plant, and equipment and intangible assets relate primarily to the construction of new and existing facilities and to the purchase of hardware, software, patents, office equipment, and vehicles. The remaining obligations relate mainly to marketing, consulting, maintenance, license agreements, cloud services, and other third-party agreements. The increase is mainly due to new purchase obligations related to cloud services and obligations to purchase hardware. Historically, the majority of such purchase obligations have been realized.
Of the other purchase obligations reported in 2018, €205 million contain lease components which are now in the scope of IFRS 16. Those purchase obligations can be seen in the reconciliation table in Note (D.8).
Maturities | |
€ millions | 12/31/2019 |
| Purchase Obligations |
Due 2020 | 1,251 |
Due 2021 to 2024 | 1,298 |
Due thereafter | 43 |
Total | 2,592 |
Section D – Invested Capital | 173 |
To Our | Combined Group | Consolidated Financial | Further Information on Economic, | Additional |
Stakeholders | Management Report | Statements IFRS | Environmental, and Social Performance | Information |
(D.8) Adoption of IFRS 16
 Accounting Policies, Judgments, and Estimates
On January 1, 2019, we adopted IFRS 16 ‘Leases’ using the modified retrospective transition approach. This approach requires that the cumulative effect of initially applying the standard be recognized as an adjustment to the opening balance of retained earnings on the date of initial application while the prior-year figures are not adjusted. The new standard impacts our lease accounting as, in general, all leases need to be recognized on the lessee’s balance sheet. A lessee recognizes a right-of-use asset representing its right to use the underlying asset and a lease liability representing its obligation to make lease payments. The nature of expenses related to those leases has now changed because we recognize depreciation expense for right-of-use assets and interest expense on lease liabilities. These changes apply to leases that had previously been classified as operating leases under IAS 17. We have used practical expedients offered by the standard (such as non-capitalization of short-term leases and low-value leases, and the use of hindsight when determining the lease term if the contract contains options to extend or terminate the lease). For measuring our right-of-use assets for pre-existing leases, we have applied the retrospective approach for our most significant leases (primarily facility and data center leases), while smaller leases were measured at an amount equal to the lease liability and adjusted by the amount of any prepaid or accrued lease payments existing immediately prior to the date of initial application.
Upon IFRS 16 adoption, lease liabilities from pre-existing leases were discounted at the incremental borrowing rates as at January 1, 2019. The weighted average discount rate applied to the lease liabilities on January 1, 2019, was 2.5%. The following reconciliation to the opening balance for the lease liabilities as at January 1, 2019, is based upon the operating lease obligations disclosed as at December 31, 2018:
€ millions | |
Purchase obligations relevant to IFRS 16 as at 12/31/2018 | 205 |
Financial commitments as at 12/31/2018 | 1,442 |
Lease related commitments as at 12/31/2018 | 1,647 |
(Less): commitments starting in 2019 | (51) |
(Less): non-lease components | (238) |
Add: data updates | 108 |
Adjusted commitments | 1,466 |
Add: adjustments as a result of different treatment of extension and termination options | 953 |
Discounting using the Company’s incremental borrowing rate | (279) |
Lease liabilities recognized as at 1/1/2019 | 2,140 |
Leases are shown as follows in the balance sheet as at December 31, 2019, and in the income statement for the year:
Leases in the Balance Sheet
€ millions | 12/31/2019 |
Right-of-use assets | |
Right-of-use assets – land and buildings | 1,929 |
Right-of-use assets – other property, plant, and equipment | 38 |
Total right-of-use assets | 1,967 |
Non-current assets | 45,002 |
Right-of-use assets as % of non-current assets | 4 |
| |
Lease liabilities | |
Current lease liabilities | 389 |
Current financial liabilities | 3,273 |
Current lease liabilities as % of current financial liabilities | 12 |
| |
Non-current lease liabilities | 1,814 |
Non-current financial liabilities | 12,923 |
Non-current lease liabilities as % of non-current financial liabilities | 14 |
| |
Leases in the Income Statement | |
€ millions | 2019 |
Lease expenses within operating profit | |
Depreciation of right-of-use assets | 396 |
| |
Lease expenses within finance income, net | |
Interest expense on lease liabilities | 55 |
IFRS 16 also affects SAP’s cash flow statement for the year ended 2019: operating cash flow increased by €319 million and cash flow from financing activities decreased by €319 million.
The adjustments to the opening balances resulting from the initial application of IFRS 16 as at January 1, 2019, were as follows:
– Property, plant, and equipment – increased by €1.9 billion
– Trade and other payables – decreased by €0.1 billion
– Financial liabilities – increased by €2.1 billion
The net impact on retained earnings on January 1, 2019, was a decrease of €0.1 billion.
For more information about right-of-use asset additions, see Note (D.4), and for a maturity analysis of lease liabilities, see Note (F.1). For more information about the cash flow related to lease liabilities, see the “Reconciliation of Liabilities Arising from Financing Activities” table within Note (E.3).
174 | Section D – Invested Capital |
To Our | Combined Group | Consolidated Financial | Further Information on Economic, | Additional |
Stakeholders | Management Report | Statements IFRS | Environmental, and Social Performance | Information |
Section E – Capital Structure, Financing, and Liquidity
This section describes how SAP manages its capital structure. Our capital management is based on a high equity ratio, modest financial leverage, a well-balanced maturity profile, and deep debt capacity.
(E.1) Capital Structure Management
The primary objective of our capital structure management is to maintain a strong financial profile for investor, creditor, and customer confidence, and to support the growth of our business. We seek to maintain a capital structure that will allow us to cover our funding requirements through the capital markets on reasonable terms and, in so doing, ensure a high level of independence, confidence, and financial flexibility.
SAP SE’s long-term credit rating is “A2” by Moody’s and “A” by Standard & Poor’s, both with stable outlook.
| | 12/31/2019 | | 12/31/2018 | |
| € millions | % of | € millions | % of | Δ in % |
| | Total Equity and | | Total Equity and | |
| | Liabilities | | Liabilities | |
Equity | 30,822 | 51 | 28,877 | 56 | 7 |
Current liabilities | 14,462 | 24 | 10,486 | 20 | 38 |
Non-current liabilities | 14,931 | 25 | 12,138 | 24 | 23 |
Liabilities | 29,393 | 49 | 22,624 | 44 | 30 |
Thereof financial debt | 13,668 | 23 | 11,331 | 22 | 21 |
Thereof lease liabilities | 2,203 | 4 | 0 | 0 | |
Total equity and liabilities | 60,215 | 100 | 51,502 | 100 | 17 |
Upon IFRS 16 adoption, liabilities and assets increased by €2,203 million, representing 4pp of the increase in total equity and liabilities.
In 2019, we drew €2,500 million of an acquisition term loan for Qualtrics, whereof we repaid €500 million. At maturity, we repaid €750 million in Eurobonds. We refinanced €1,100 million through the issuance of commercial papers. Thus, the ratio of total nominal volume of financial debt to total equity and liabilities increased by 1pp.
(E.2) Total Equity
Issued Capital
SAP SE has issued no-par value bearer shares with a calculated nominal value of €1 per share. All of the shares issued are fully paid.
Number of Shares | | |
Millions | Issued | Treasury |
| Capital | Shares |
1/1/2017 | 1,228.5 | –29.9 |
Purchase of treasury shares | 0 | –5.4 |
Reissuance of treasury shares under share-based payments | 0 | 0.2 |
12/31/2017 | 1,228.5 | –35.1 |
Reissuance of treasury shares under share-based payments | 0 | 0.2 |
12/31/2018 | 1,228.5 | –34.9 |
12/31/2019 | 1,228.5 | –34.9 |
Section E – Capital Structure, Financing, and Liquidity | 175 |
To Our | Combined Group | Consolidated Financial | Further Information on Economic, | Additional |
Stakeholders | Management Report | Statements IFRS | Environmental, and Social Performance | Information |
Authorized Shares
The Articles of Incorporation authorize the Executive Board to increase the issued capital as follows:
– By up to a total amount of €250 million by issuing new no-par value bearer shares against contributions in cash until May 19, 2020 (Authorized Capital I). The issuance is subject to the statutory subscription rights of existing shareholders.
– By up to a total amount of €250 million by issuing new no-par value bearer shares against contributions in cash or in kind until May 19, 2020 (Authorized Capital II). Subject to the consent of the Supervisory Board, the Executive Board is authorized to exclude the shareholders’ statutory subscription rights in certain cases.
Contingent Shares
SAP SE’s share capital is subject to a contingent capital increase, which may be effected only to the extent that the holders or creditors of convertible bonds or stock options issued or guaranteed by SAP SE or any of its directly or indirectly controlled subsidiaries under certain share-based payments exercise their conversion or subscription rights, and no other methods for servicing these rights are used. As at December 31, 2019, €100 million, representing 100 million shares, was still available for issuance (2018: €100 million).
Other Components of Equity | | | | |
€ millions | Exchange Differences | Available-for-Sale
Financial Assets | Cash Flow Hedges/Cost
of Hedging | Total |
1/1/2017 | 3,062 | 292 | –8 | 3,345 |
Other comprehensive income for items that will be reclassified to profit or loss, net of tax | –2,732 | –135 | 29 | –2,838 |
12/31/2017 | 330 | 157 | 21 | 508 |
Adoption of IFRS 9 | 0 | –158 | –3 | –160 |
1/1/2018 | 330 | 0 | 18 | 347 |
Other comprehensive income for items that will be reclassified to profit or loss, net of tax | 910 | 0 | –23 | 887 |
12/31/2018 | 1,239 | 0 | –5 | 1,234 |
Other comprehensive income for items that will be reclassified to profit or loss, net of tax | 537 | 0 | –1 | 536 |
12/31/2019 | 1,776 | 0 | –6 | 1,770 |
Treasury Shares
By resolution of SAP SE’s General Meeting of Shareholders held on May 17, 2018, the authorization granted by the General Meeting of Shareholders on June 4, 2013, regarding the acquisition of treasury shares was revoked to the extent it had not been exercised at that time, and replaced by a new authorization of the Executive Board of SAP SE to acquire, on or before May 16, 2023, shares of SAP SE representing a pro rata amount of capital stock of up to €120 million in aggregate, provided that the shares purchased under the authorization, together with any other shares in the Company previously acquired and held by, or attributable to, SAP SE do not account for more than 10% of SAP SE’s issued share capital. Although treasury shares are legally considered outstanding, there are no dividend or voting rights associated with them. We may redeem or resell shares held in treasury, or we may use treasury shares for the purpose of servicing option or conversion rights under the Company’s share-based payment plans. Also, we may use shares held in treasury as consideration in connection with mergers with, or acquisitions of, other companies.
Distribution Policy and Dividends
Our general intention is to remain in a position to return liquidity to our shareholders by distributing annual dividends totaling 40% or more of our profit after tax and by potentially repurchasing treasury shares in future. We intend to repurchase shares with a volume of €1.5 billion in 2020.
In 2019, we distributed €1,790 million (€1.50 per share) in dividends for 2018 compared to €1,671 million (€1.40 per share) paid in 2018 for 2017 and €1,499 million (€1.25 per share) paid in 2017 for 2016. Aside from the distributed dividend, in 2017, we also returned €500 million to our shareholders by repurchasing treasury shares.
The total dividend available for distribution to SAP SE shareholders is based on the profits of SAP SE as reported in its statutory financial statements prepared under the accounting rules in the German Commercial Code (Handelsgesetzbuch). For the year ended December 31, 2019, the Executive Board intends to propose that a dividend of €1.58 per share (that is, an estimated total dividend of €1,886 million), be paid from the profits of SAP SE.
176 | | Section E – Capital Structure, Financing, and Liquidity |
To Our | Combined Group | Consolidated Financial | Further Information on Economic, | Additional |
Stakeholders | Management Report | Statements IFRS | Environmental, and Social Performance | Information |
(E.3) Liquidity
 Accounting for Non-Derivative Financial Instruments Accounting for Non-Derivative Financial Instruments
Classification and Measurement of Non-Derivative Financial Debt Investments Our non-derivative financial debt investments comprise cash at banks and cash equivalents (highly liquid investments with original maturities of three months or less, such as time deposits and money-market funds), loans and other financial receivables, and acquired debt securities. As we do not designate financial assets as “at fair value through profit or loss,” we generally classify financial assets as: at amortized cost (AC), at fair value through other comprehensive income (FVOCI), or at fair value through profit or loss (FVTPL), depending on the contractual cash flows of, and our business model for, holding the respective asset. Financial assets having cash flow characteristics other than solely principal and interest such as money market and similar funds are generally classified as FVTPL. Generally, all other financial assets with cash flows consisting solely of principal and interest are classified as AC because we follow a conservative investment approach, safeguarding our liquidity by ensuring the safety of principal investment amounts. Gains/losses on non-derivative financial debt investments at FVTPL are reported in Financial income, net and show interest income/expenses separately from other gains/losses which include gains/losses from fair value fluctuations and disposals. Gains/losses on non-derivative financial debt investments at AC are reported in Financial income, net and show interest income/expenses separately from other gains/losses which include gains/losses disposals and changes in expected and incurred credit losses. Gains/losses from foreign currency exchange rate fluctuations are included in Other non-operating income/expense, net. Regular way purchases and sales are recorded as at the trade date. Impairment of Non-Derivative Financial Debt Investments For these financial assets, we apply considerable judgment by employing the general impairment approach as follows: – For cash at banks, time deposits, and debt securities such as acquired bonds and commercial paper, we apply the low credit risk exception, as it is our policy to invest only in high-quality assets of issuers with a minimum rating of at least investment grade to minimize the risk of credit losses. Thus, these assets are always allocated to stage 1 of the three-stage credit loss model, and we record a loss allowance at an amount equal to 12-month expected credit losses. This loss allowance is calculated based on our exposure at the respective reporting date, the loss given default for this exposure, and the credit default swap spread as a measure for the probability of default. Even though we invest only in assets of at least investment-grade, we also closely observe the development of credit default swap spreads as a measure of market participants’ assessments of the creditworthiness of a debtor to evaluate probable significant increases in credit risk to timely react to changes should these manifest. Among others, we consider cash at banks, time deposits, and debt securities to be in default when the counterparty is unlikely to pay its obligations in full, when there is information about a counterparty’s financial difficulties or if there is a drastic increase in a counterparty’s credit default swap spread for a prolonged time period while the overall market environment remains generally stable. Such financial assets are written off either partially or in full if the likelihood of recovery is considered remote, which might be evidenced, for example, by the bankruptcy of a counterparty of such financial assets. – Loans and other financial receivables are monitored based on borrower-specific internal and external information to determine whether there has been a significant increase in credit risk since initial recognition. We consider such assets to be in default if they are significantly beyond their due date or if the borrower is unlikely to pay its obligation. A write-off occurs when the likelihood of recovery is considered remote, for example when bankruptcy proceedings have been finalized or when all enforcement efforts have been exhausted. Non-Derivative Financial Liabilities Non-derivative financial liabilities include bank loans, issued bonds, private placements, and other financial liabilities. Included in other financial liabilities are customer funding liabilities which are funds we draw from and make payments on behalf of our customers for customers’ employee expense reimbursements, related credit card payments, and vendor payments. We present these funds in cash and cash equivalents and record our obligation to make these expense reimbursements and payments on behalf of our customers as customer funding liabilities. As we do not designate financial liabilities as FVTPL, we generally classify non-derivative financial liabilities as AC. Expenses and gains or losses on financial liabilities at AC mainly consist of interest expense which is shown in Financial income, net. Gains/losses from foreign currency exchange rate fluctuations are included in Other non-operating income/expense, net. Group Liquidity, Financial Debt, and Net Debt Group liquidity consists of cash at banks, money market and other funds, time deposits, and debt securities (both with remaining maturities of less than one year). Financial debt is defined as the nominal volume of bank loans, commercial papers, private placements, and bonds. Net debt is group liquidity less financial debt. |
Section E – Capital Structure, Financing, and Liquidity | | 177 |
To Our | Combined Group | Consolidated Financial | Further Information on Economic, | Additional |
Stakeholders | Management Report | Statements IFRS | Environmental, and Social Performance | Information |
Group Liquidity and Net Debt | | |
€ millions | 2019 | 2018 | ∆ |
 Cash and cash equivalents Cash and cash equivalents
| 5,314 | 8,627 | –3,313 |
Current time deposits and debt securities | 67 | 211 | –144 |
Group liquidity | 5,382 | 8,838 | –3,456 |
Current financial debt | –2,529 | –759 | –1,770 |
Non-current financial debt | –11,139 | –10,572 | –567 |
Financial debt | –13,668 | –11,331 | –2,337 |
Net debt (–) | –8,286 | –2,493 | –5,793 |
While we continuously monitor the ratios presented in the capital structure table, we actively manage our liquidity and structure of our financial indebtedness based on the ratios group liquidity and net debt.
Cash and Cash Equivalents | | | | | | |
€ millions | | | 2019 | | | 2018 |
| Current | Non-Current | Total | Current | Non-Current | Total |
Cash at banks | 2,877 | 0 | 2,877 | 2,918 | 0 | 2,918 |
Time deposits | 1,093 | 0 | 1,093 | 4,117 | 0 | 4,117 |
Money market and other funds | 1,347 | 0 | 1,347 | 1,195 | 0 | 1,195 |
Debt securities | 0 | 0 | 0 | 400 | 0 | 400 |
Expected credit loss allowance | –3 | 0 | –3 | –3 | 0 | –3 |
Cash and cash equivalents | 5,314 | 0 | 5,314 | 8,627 | 0 | 8,627 |
Non-Derivative Financial Debt Investments | | | | | |
€ millions | | | 2019 | | | 2018 |
| Current | Non-Current | Total | Current | Non-Current | Total |
Time deposits | 44 | 0 | 44 | 137 | 0 | 137 |
Debt securities | 27 | 0 | 27 | 77 | 0 | 77 |
Financial instruments related to employee benefit plans | 0 | 183 | 183 | 0 | 165 | 165 |
Loans and other financial receivables | 100 | 117 | 217 | 57 | 91 | 147 |
Expected credit loss allowance | –3 | 0 | –3 | –3 | 0 | –3 |
Non-derivative financial debt investments | 167 | 300 | 467 | 268 | 256 | 524 |
Other financial assets | 297 | 2,336 | 2,633 | 448 | 1,536 | 1,984 |
Non-derivative financial debt investments as % of other financial assets | 56 | 13 | 18 | 60 | 17 | 26 |
Time deposits and debt securities with original maturity of three months or less are presented as cash and cash equivalents, and those with original maturities of greater than three months (investments considered in group liquidity) are presented as other financial assets. Debt securities consist of commercial papers and acquired bonds of mainly financial and non-financial corporations and municipalities.
For more information about financial risk and the nature of risk, see Note (F.1).
178 | | Section E – Capital Structure, Financing, and Liquidity |
To Our | Combined Group | Consolidated Financial | Further Information on Economic, | Additional |
Stakeholders | Management Report | Statements IFRS | Environmental, and Social Performance | Information |
Financial Debt | | | | | | | | | | |
€ millions | | | | | 2019 | | | | | 2018 |
| Nominal Volume | | Carrying Amount | Nominal Volume | | Carrying Amount |
| Current | Non- | Current | Non-Current | Total | Current | Non- | Current | Non- | Total |
| | Current | | | | | Current | | Current | |
Bonds | 1,150 | 8,367 | 1,150 | 8,283 | 9,433 | 750 | 9,512 | 759 | 9,445 | 10,204 |
Private placement transactions | 258 | 772 | 259 | 808 | 1,067 | 0 | 1,011 | 0 | 1,041 | 1,041 |
Commercial Papers | 1,100 | 0 | 1,100 | 0 | 1,100 | NA | NA | NA | NA | NA |
Bank loans | 21 | 2,000 | 22 | 1,995 | 2,017 | 9 | 49 | 9 | 49 | 58 |
Financial debt | 2,529 | 11,139 | 2,531 | 11,086 | 13,617 | 759 | 10,572 | 768 | 10,535 | 11,303 |
Financial liabilities | | | 3,273 | 12,923 | 16,196 | | | 1,125 | 10,553 | 11,678 |
Financial debt as % of financial liabilities | | | 77 | 86 | 84 | | | 68 | 100 | 97 |
Financial liabilities are unsecured, except for the retention of title and similar rights customary in our industry. Effective interest rates on our financial debt (including the effects from interest rate swaps) were 1.09% in 2019, 1.33% in 2018, and in 1.29% 2017.
For information about the risk associated with our financial liabilities, see Note (F.1). For information about fair values, see Note (F.2).
Bonds | | | | | | | |
| | | | | | 2019 | 2018 |
| Maturity | Issue Price | Coupon Rate | Effective
Interest Rate | Nominal Volume
(in respective
currency in
millions) | Carrying
Amount
(in € millions) | Carrying
Amount
(in € millions) |
Eurobond 6 – 2012 | 2019 | 99.307% | 2.125% (fix) | 2.29% | €750 | 0 | 759 |
Eurobond 8 – 2014 | 2023 | 99.478% | 1.125% (fix) | 1.24% | €1,000 | 997 | 996 |
Eurobond 9 – 2014 | 2027 | 99.284% | 1.750% (fix) | 1.87% | €1,000 | 985 | 992 |
Eurobond 11 – 2015 | 2020 | 100.000% | 0.000% (var.) | 0.07% | €650 | 650 | 649 |
Eurobond 12 – 2015 | 2025 | 99.264% | 1.000% (fix) | 1.13% | €600 | 596 | 595 |
Eurobond 14 – 2018 | 2021 | 100.519% | 0.000% (var.) | –0.15% | €500 | 501 | 502 |
Eurobond 15 – 2018 | 2026 | 99.576% | 1.000% (fix) | 1.06% | €500 | 498 | 498 |
Eurobond 16 – 2018 | 2030 | 98.687% | 1.375% (fix) | 1.50% | €500 | 491 | 494 |
Eurobond 17 – 2018 | 2020 | 100.024% | 0.000% (var.) | –0.01% | €500 | 500 | 500 |
Eurobond 18 – 2018 | 2022 | 99.654% | 0.250% (fix) | 0.36% | €900 | 898 | 897 |
Eurobond 19 – 2018 | 2024 | 99.227% | 0.750% (fix) | 0.89% | €850 | 844 | 843 |
Eurobond 20 – 2018 | 2028 | 98.871% | 1.250% (fix) | 1.38% | €1,000 | 982 | 988 |
Eurobond 21 – 2018 | 2031 | 98.382% | 1.625% (fix) | 1.78% | €1,250 | 1,224 | 1,229 |
Eurobonds | | | | | | 9,166 | 9,942 |
USD bond – 2018 | 2025 | 100.000% | 2.607% (var.) | 2.46% | US$300 | 267 | 262 |
Bonds | | | | | | 9,433 | 10,204 |
All of our Eurobonds are listed for trading on the Luxembourg Stock Exchange.
Section E – Capital Structure, Financing, and Liquidity | | 179 |
To Our | Combined Group | Consolidated Financial | Further Information on Economic, | Additional |
Stakeholders | Management Report | Statements IFRS | Environmental, and Social Performance | Information |
Private Placements | | | | | | |
| | | | | 2019 | 2018 |
| Maturity | Coupon Rate | Effective
Interest Rate | Nominal Volume
(in respective
currency in
millions) | Carrying
Amount
(in € millions) | Carrying Amount
(in € millions) |
U.S. private placements | | | | | | |
Tranche 6 – 2012 | 2020 | 2.82% (fix) | 2.86% | US$290 | 259 | 251 |
Tranche 7 – 2012 | 2022 | 3.18% (fix) | 3.22% | US$444.5 | 406 | 395 |
Tranche 8 – 2012 | 2024 | 3.33% (fix) | 3.37% | US$323 | 305 | 299 |
Tranche 9 – 2012 | 2027 | 3.53% (fix) | 3.57% | US$100 | 97 | 96 |
Private placements | | | | | 1,067 | 1,041 |
The U.S. private placement notes were issued by one of our subsidiaries that has the U.S. dollar as its functional currency.
Commercial Paper
The net proceeds from our commercial paper program (“Commercial Paper”) are being used for general corporate purposes, including dividends and share repurchases. As at December 31, 2019, we had €1,099.5 million of Commercial Paper outstanding with maturities generally less than six months and the carrying amount amounted to €1,100.5 million (December 31, 2018: NA). The weighted average interest rate of our Commercial Paper was –0.38% as at December 31, 2019 (December 31, 2018: NA).
180 | | Section E – Capital Structure, Financing, and Liquidity |
To Our | Combined Group | Consolidated Financial | Further Information on Economic, | Additional |
Stakeholders | Management Report | Statements IFRS | Environmental, and Social Performance | Information |
Reconciliation of Liabilities Arising from Financing Activities
The changes in our financial debts are reconciled to the cash flows from borrowings included in the cash flow from financing activities.
€ millions | 1/1/2019 | Cash Flows | Business
Combinations | Foreign Currency | Fair Value Changes | Other | 12/31/2019 |
Current financial debt | 759 | –188 | 0 | –6 | 0 | 1,963 | 2,529 |
Non-current financial debt | 10,572 | 2,500 | 0 | 30 | 0 | –1,963 | 11,139 |
Financial debt (nominal volume) | 11,331 | 2,312 | 0 | 25 | 0 | 0 | 13,668 |
Basis adjustment | 42 | 0 | 0 | 1 | –30 | 0 | 13 |
Transaction costs | –70 | 0 | 0 | 0 | 0 | 5 | –64 |
Financial debt (carrying amount) | 11,303 | 2,312 | 0 | 25 | –30 | 5 | 13,616 |
Accrued interest | 47 | 0 | 0 | 1 | 0 | 19 | 67 |
Interest rate swaps | –7 | 0 | 0 | 0 | 14 | 0 | 7 |
Lease1) | 2,168 | –403 | 52 | 38 | 0 | 348 | 2,204 |
Total liabilities from financing activities | 13,512 | 1,910 | 52 | 64 | –16 | 373 | 15,895 |
1) Other includes new lease liabilities | | | | | | | |
| | | | | | | |
€ millions | 1/1/2018 | Cash Flows | Business
Combinations | Foreign
Currency | Fair Value
Changes | Other | 12/31/2018 |
Current financial debt | 1,299 | –1,300 | 7 | 3 | 0 | 750 | 759 |
Non-current financial debt | 4,965 | 6,308 | 0 | 49 | 0 | –750 | 10,572 |
Financial debt (nominal volume) | 6,264 | 5,008 | 7 | 51 | 0 | 0 | 11,331 |
Basis adjustment | 62 | 0 | 0 | –1 | –19 | 0 | 42 |
Transaction costs | –26 | –48 | 0 | 0 | 0 | 3 | –70 |
Financial debt (carrying amount) | 6,301 | 4,961 | 7 | 50 | –19 | 3 | 11,303 |
Accrued interest | 34 | 0 | 0 | –1 | 0 | 14 | 47 |
Interest rate swaps | –24 | 0 | 0 | –1 | 17 | 0 | –7 |
Total liabilities from financing activities | 6,311 | 4,961 | 7 | 48 | –1 | 18 | 11,343 |
Section E – Capital Structure, Financing, and Liquidity | 181 |
To Our | Combined Group | Consolidated Financial | Further Information on Economic, | Additional |
Stakeholders | Management Report | Statements IFRS | Environmental, and Social Performance | Information |
Section F – Management of Financial Risk Factors
This section discusses financial risk factors and risk management regarding foreign currency exchange rate risk, interest rate risk, equity price risk, credit risk, and liquidity risk. Further, it contains information about financial instruments.
(F.1) Financial Risk Factors and Risk Management
 Accounting for Derivative Financial Instruments Accounting for Derivative Financial Instruments
We use derivatives to hedge foreign currency risk or interest rate risk and designate them as cash flow or fair value hedges if they qualify for hedge accounting under IFRS 9, which involves judgment. Derivatives Not Designated as Hedging Instruments Many transactions constitute economic hedges, and therefore contribute effectively to the securing of financial risks but do not qualify for hedge accounting under IFRS 9. To hedge currency risks inherent in foreign-currency denominated and recognized monetary assets and liabilities, we do not designate our held-for-trading derivative financial instruments as accounting hedges, because the profits and losses from the underlying transactions are recognized in profit or loss in the same periods as the profits or losses from the derivatives. In addition, we occasionally have contracts that contain foreign currency embedded derivatives that are required to be accounted for separately. Fair value fluctuations in the spot component of such derivatives at FVTPL are included in Other non-operating income/expense, net while the forward element is shown in Financial income, net. Derivatives Designated as Hedging Instruments a) Cash Flow Hedge In general, we apply cash flow hedge accounting to the foreign currency risk of highly probable forecasted transactions. With regard to foreign currency risk, hedge accounting relates to the spot price and the intrinsic values of the derivatives designated and qualifying as cash flow hedges. Accordingly, the effective portion of these components determined on a present value basis is recorded in other comprehensive income. The forward element and time element as well as foreign currency basis spreads excluded from the hedging relationship are recorded as cost of hedging in a separate position in other comprehensive income. As the amounts are not material, they are presented together with the effective portion of the cash flow hedges in our consolidated statements of comprehensive income and consolidated statements of changes in equity. All other components including counterparty credit risk adjustments of the derivative and the ineffective portion are immediately recognized in Financial Income, net in profit or loss. Amounts accumulated in other comprehensive income are reclassified to profit or loss to Other non-operating income/expense, net and Financial income, net in the same period when the hedged item affects profit or loss. b) Fair Value Hedge We apply fair value hedge accounting for certain of our fixed-rate financial liabilities and show the fair value fluctuations in Financial income, net. c) Valuation and Testing of Effectiveness At inception of a designated hedging relationship, we document our risk management strategy and the economic relationship between hedged item and hedging instrument. The existence of an economic relationship is demonstrated as well as the effectiveness of the hedging relationship tested prospectively by applying the critical terms match for our foreign currency hedges, since currencies, maturities, and the amounts are closely aligned for the forecasted transactions and for the spot element of the forward exchange rate contract or intrinsic value of the currency options, respectively. For interest rate swaps, effectiveness is tested prospectively using statistical methods in the form of a regression analysis, by which the validity and extent of the relationship between the change in value of the hedged items as the independent variable and the fair value change of the derivatives as the dependent variable is determined. The main sources of ineffectiveness are: – The effect of the counterparty and our own credit risk on the fair value of the forward exchange contracts and interest rate swaps, which is not reflected in the respective hedged item, and – Differences in the timing of hedged item and hedged transaction in our cash flow hedges. |
We are exposed to various financial risks, such as market risks (that is, foreign currency exchange rate risk, interest rate risk, and equity price risk), credit risk, and liquidity risk.
We manage market risks, credit risk, and liquidity risk on a Group-wide basis through our global treasury department, global risk management, and global credit management. Risk management policies are established to identify risks, to set appropriate risk limits, and to monitor risks. Risk management policies and hedging strategies are laid out in our internal guidelines (for example, treasury guideline and other internal guidelines), and are subject to continuous internal review and analysis to reflect changes in market conditions and our business.
We only purchase derivative financial instruments to reduce risks and not for speculation, which is defined as entering into derivative instruments without a corresponding underlying transaction.
182 | Section F – Management of Financial Risk Factors |
To Our | Combined Group | Consolidated Financial | Further Information on Economic, | Additional |
Stakeholders | Management Report | Statements IFRS | Environmental, and Social Performance | Information |
Foreign Currency Exchange Rate Risk
Foreign Currency Exchange Rate Risk Factors
As we are active worldwide, our ordinary operations are subject to risks associated with fluctuations in foreign currencies. Since the Group’s entities mainly conduct their operating business in their own functional currencies, our risk of exchange rate fluctuations from ongoing ordinary operations is not considered significant. However, SAP occasionally generates foreign-currency-denominated receivables, payables, and other monetary items by transacting in a currency other than the functional currency. To mitigate the extent of the associated foreign currency exchange rate risk, the majority of these transactions are hedged as described below.
In rare circumstances, transacting in a currency other than the functional currency also leads to embedded foreign currency derivatives being separated and measured at fair value through profit or loss.
In addition, the intellectual property (IP) holders in the SAP Group are exposed to risks associated with forecasted intercompany cash flows in foreign currencies. These cash flows arise out of royalty payments from subsidiaries to the respective IP holder. The royalties are linked to the subsidiaries’ external revenue. This arrangement leads to a concentration of the foreign currency exchange rate risk with the IP holders, as the royalties are mostly denominated in the subsidiaries’ local currencies, while the functional currency of the IP holders with the highest royalty volume is the euro. The highest foreign currency exchange rate exposure of this kind relates to the currencies of subsidiaries with significant operations, for example the U.S. dollar, the pound sterling, the Japanese yen, the Swiss franc, and the Australian dollar.
Generally, we are not exposed to any significant foreign currency exchange rate risk with regard to our investing and financing activities, as such activities are normally conducted in the functional currency of the investing or borrowing entity.
Foreign Currency Exchange Rate Risk Management
We continuously monitor our exposure to currency fluctuation risks based on monetary items and forecasted transactions and pursue a Group-wide strategy to manage foreign currency exchange rate risk, using derivative financial instruments, primarily foreign exchange forward contracts, as appropriate, with the primary aim of reducing profit or loss volatility. Most of the hedging instruments are not designated as being in a hedge accounting relationship.
Currency Hedges Designated as Hedging Instruments (Cash Flow Hedges)
We enter into derivative financial instruments, primarily foreign exchange forward contracts, to hedge significant forecasted cash flows (royalties) from foreign subsidiaries denominated in foreign currencies with a hedge ratio of 1:1 and a hedge horizon of up to 12 months, which is also the maximum maturity of the foreign exchange derivatives we use.
For all years presented, no previously highly-probable transaction designated as a hedged item in a foreign currency cash flow hedge relationship ceased to be probable. Therefore, we did not discontinue any of our cash flow hedge relationships. Also, ineffectiveness was either not material or non-existent in all years reported. Generally, the cash flows of the hedged forecasted transactions are expected to occur and to be recognized in profit or loss monthly within a time frame of 12 months from the date of the statement of financial position.
The amounts as at December 31, 2019, relating to items designated as hedged items were as follows:
Designated Hedged Items in Foreign Currency Exchange Rate Hedges
| Forecasted License Payments |
€ millions | 2019 |
Change in value used for calculating hedge ineffectiveness | –7 |
Cash flow hedge | –7 |
Cost of hedging | –2 |
Balances remaining in cash flow hedge reserve for which hedge accounting is no longer applied | 0 |
The amounts as at December 31, 2019, designated as hedging instruments were as follows:
Designated Hedging Instruments in Foreign Currency Exchange Rate Hedges
| Forecasted License Payments |
€ millions | 2019 |
Nominal amount | 518 |
Carrying amount | |
Other financial assets | 3 |
Other financial liabilities | –11 |
Change in value recognized in OCI | 7 |
Hedge ineffectiveness recognized in finance income, net | 0 |
Cost of hedging recognized in OCI | 2 |
Amount reclassified from cash flow hedge in OCI to other non-operating income, net | –22 |
Amount reclassified from cost of hedging in OCI to finance income, net | –6 |
Section F – Management of Financial Risk Factors | 183 |
To Our | Combined Group | Consolidated Financial | Further Information on Economic, | Additional |
Stakeholders | Management Report | Statements IFRS | Environmental, and Social Performance | Information |
On December 31, 2019, we held the following instruments to hedge exposures to changes in foreign currency:
Details on Hedging Instruments in Foreign Currency Exchange Rate Hedges
| | Maturity |
| | 2019 |
| 1 to 6 months | 7 to 12 months |
Forward exchange contracts | | |
Net exposure in € millions | 324 | 193 |
Average EUR:GBP forward rate | 88.77 | 89.84 |
Average EUR:JPY forward rate | 121.97 | 119.32 |
Average EUR:CHF forward rate | 1.11 | 1.09 |
Average EUR:AUD forward rate | 1.63 | 1.65 |
Foreign Currency Exchange Rate Exposure
Our risk exposure is based on the following assumptions:
– The SAP Group’s entities generally operate in their functional currencies. In exceptional cases and limited economic environments, operating transactions are denominated in currencies other than the functional currency, leading to a foreign currency exchange rate risk for the related monetary instruments. Where material, this foreign currency exchange rate risk is hedged. Therefore, fluctuations in foreign currency exchange rates do not have a significant impact on either profit or other comprehensive income with regard to our non-derivative monetary financial instruments and related income or expenses.
– Our free-standing derivatives designed for hedging foreign currency exchange rate risks almost completely balance the changes in the fair values of the hedged item attributable to exchange rate movements in the Consolidated Income Statements in the same period. As a consequence, the hedged items and the hedging instruments are not exposed to foreign currency exchange rate risks, and thereby have no effect on profit.
Consequently, we are only exposed to significant foreign currency exchange rate fluctuations with regard to the following:
– The spot component of derivatives held within a designated cash flow hedge relationship affecting other comprehensive income
– Foreign currency embedded derivatives affecting other non-operating expense, net
Thus, our foreign currency exposure (and our average/high/low exposure) as at December 31, 2019, was as follows:
Foreign Currency Exposure
€ billions | 2019 | 2018 |
Year-end exposure toward all our major currencies | 1.0 | 6.3 |
Average exposure | 0.7 | 2.1 |
Highest exposure | 1.0 | 6.3 |
Lowest exposure | 0.6 | 0.7 |
Foreign Currency Exchange Rate Sensitivity
We calculate our sensitivity on an upward/downward shift of +/– 10% of the foreign currency exchange rate between the euro and all major currencies (2018: +/–10% of the foreign currency exchange rate between the euro and all other major currencies; 2017: +/–10% of the foreign currency exchange rate between the euro and all other major currencies). If, on December 31, 2019, 2018, and 2017, the foreign currency exchange rates had been higher/lower as described above, this would have had the following effects on other non-operating expense, net and other comprehensive income:
Foreign Currency Sensitivity
€ millions | Effects on Other Non-Operating Expense,
Net | Effects on Other Comprehensive Income |
| 2019 | 2018 | 2017 | 2019 | 2018 | 2017 |
Derivatives held within a designated cash flow hedge relationship | | | | | | |
All major currencies –10% (2018: all major currencies –10%; 2017: all major currencies –10%) | | | | 53 | 62 | 71 |
All major currencies +10% (2018: all major currencies +10%; 2017: all major currencies +10%) | | | | –53 | –62 | –71 |
Embedded derivatives | | | | | | |
All currencies –10% | 53 | 11 | 15 | | | |
All currencies +10% | –53 | –11 | –15 | | | |
FX option held in connection with the acquisition of Qualtrics | | | | | | |
USD –10% | 0 | –29 | 0 | | | |
USD +10% | 0 | 559 | 0 | | | |
184 | Section F – Management of Financial Risk Factors |
To Our | Combined Group | Consolidated Financial | Further Information on Economic, | Additional |
Stakeholders | Management Report | Statements IFRS | Environmental, and Social Performance | Information |
Interest Rate Risk
Interest Rate Risk Factors
We are exposed to interest rate risk as a result of our investing and financing activities mainly in euros and U.S. dollars, since a large part of our investments are based on variable rates and/or short maturities (2019: 80%; 2018: 48%) and most of our financing transactions are based on fixed rates and long maturities (2019: 69%; 2018: 83%).
Interest Rate Risk Management
The aim of our interest rate risk management is to reduce profit or loss volatility and optimize our interest result by creating a balanced structure of fixed and variable cash flows. We therefore manage interest rate risks by adding interest-rate-related derivative instruments to a given portfolio of investments and debt financing. The desired fixed-floating mix of our net debt is set by the Treasury Committee.
Derivatives Designated as Hedging Instruments (Fair Value Hedges)
To match the interest rate risk from our financing transactions to our investments, we use receiver interest rate swaps to convert certain fixed-rate financial liabilities to floating, and by this means secure the fair value of the swapped financing transactions on a 1:1 ratio. Including interest rate swaps, 35% (2018: 71%) of our total interest-bearing financial liabilities outstanding as at December 31, 2019, had a fixed interest rate.
The amounts as at December 31, 2019, relating to items designated as hedged items were as follows:
Designated Hedged Items in Interest Rate Hedges
| | 2019 |
€ millions | Fixed-Rate Borrowing
in EUR | Fixed-Rate Borrowing
in USD |
Notional amount | 3,750 | 545 |
Carrying amount | 3,707 | 545 |
Accumulated fair value adjustments in Other financial liabilities | 25 | –38 |
Change in fair value used for measuring ineffectiveness | 25 | –11 |
Accumulated amount of fair value hedge adjustments for hedged items ceased to be adjusted for hedging gains/losses | 0 | –28 |
The amounts as at December 31, 2019, designated as hedging instruments were as follows:
Designated Hedging Instruments in Interest Rate Hedges
| | 2019 |
€ millions | Interest Rate Swaps for
EUR Borrowing | Interest Rate Swaps for
USD Borrowing |
Notional amount | 3,750 | 545 |
Carrying amount | | |
Other financial assets | 0 | 9 |
Other financial liabilities | –16 | 0 |
Change in fair value used for measuring ineffectiveness | –16 | 9 |
As at December 31, 2019, we held the following instruments to hedge exposures to changes in interest rates:
Details on Hedging Instruments in Interest Rate Hedges
| | | | | | | 2019 |
| | | | | | | Maturity |
€ millions | 2020 | 2022 | 2024 | 2027 | 2028 | 2030 | 2031 |
EUR interest rate swaps | | | | | | | |
Nominal amounts | | | | 1,000 | 1,000 | 500 | 1,250 |
Average variable interest rate | | | | 1.528% | 0.952% | 0.927% | 1.090% |
USD interest rate swaps | | | | | | | |
Nominal amounts | 258 | 198 | 89 | | | | |
Average variable interest rate | 2.516% | 2.491% | 2.370% | | | | |
None of the fair value adjustment from the receiver swaps, the basis adjustment on the underlying hedged items held in fair value hedge relationships, and the difference between the two recognized in financial income, net, is material in any of the years presented.
Section F – Management of Financial Risk Factors | 185 |
To Our | Combined Group | Consolidated Financial | Further Information on Economic, | Additional |
Stakeholders | Management Report | Statements IFRS | Environmental, and Social Performance | Information |
Interest Rate Exposure
Our interest rate exposure (and our average/high/low exposure) as at December 31 was as follows:
Interest Rate Risk Exposure
€ billions | | | | 2019 | | | | 2018 |
| Year-End | Average | High | Low | Year-End | Average | High | Low |
Fair value interest rate risk | | | | | | | | |
From investments | 0.03 | 0.05 | 0.07 | 0.03 | 0.08 | 0.09 | 0.10 | 0.08 |
Cash flow interest rate risk | | | | | | | | |
From investments (including cash) | 4.32 | 4.32 | 5.04 | 3.89 | 4.24 | 4.16 | 5.65 | 3.50 |
From financing | 3.92 | 4.25 | 4.43 | 3.92 | 1.96 | 2.08 | 2.32 | 1.45 |
From interest rate swaps | 4.29 | 3.05 | 5.06 | 1.28 | 1.28 | 1.31 | 1.36 | 1.27 |
Interest Rate Sensitivity
A sensitivity analysis is provided to show the impact of our interest rate risk exposure on profit or loss and equity in accordance with IFRS 7, considering the following:
– Changes in interest rates only affect the accounting for non-derivative fixed-rate financial instruments if they are recognized at fair value. Therefore, such interest rate changes do not change the carrying amounts of our non-derivative fixed-rate financial liabilities, as we account for them at amortized cost. Investments in fixed-rate financial assets classified as fair value through profit or loss were not material at each year end reported. Thus, we do not consider any fixed-rate instruments in the equity-related sensitivity calculation.
– Income or expenses recorded in connection with non-derivative financial instruments with variable interest rates are subject to interest rate risk if they are not hedged items in an effective hedge relationship. Thus, we take into consideration interest rate changes relating to our variable-rate financing and our investments in money market instruments in the profit-related sensitivity calculation.
– The designation of interest rate receiver swaps in a fair value hedge relationship leads to interest rate changes affecting financial income, net. The fair value movements related to the interest rate swaps are not reflected in the sensitivity calculation, as they offset the fixed interest rate payments for the bonds and private placements as hedged items. However, changes in market interest rates affect the amount of interest payments from the interest rate swap. As a consequence, we include those effects of market interest rates on interest payments in the profit-related sensitivity calculation.
Due to the different interest rate expectations for the U.S. dollar and the euro area, we base our sensitivity analyses on a yield curve upward shift of +50/+10 basis points (bps) for the U.S. dollar/euro area (2018: +100/+30bps for the U.S. dollar/euro area; 2017: +100/+25bps for the U.S. dollar/euro area), and a yield curve downward shift of –50/–20bps for the U.S. dollar/euro area (2018: – 25/–10bps for the U.S. dollar/euro area; 2017: –25bps).
If, on December 31, 2019, 2018, and 2017, interest rates had been higher/lower as described above, this would not have had a material effect on financial income, net, for our variable interest rate investments and would have had the following effects on financial income, net.
Interest Rate Sensitivity
€ millions | Effects on Financial Income, Net |
| 2019 | 2018 | 2017 |
Derivatives held within a designated fair value hedge relationship | | | |
Interest rates +50bps for U.S. dollar area/+10bps for euro area (2018: +100/+30bps for U.S. dollar/euro area; 2017: +100/+25bps for U.S. dollar/euro area) | –41 | –20 | –26 |
Interest rates –50bps for U.S. dollar/–20bps for euro area (2018: –25 /–10bps for U.S. dollar/euro area; 2017: –25bps for U.S. dollar/euro area) | 76 | 5 | 9 |
Variable-rate financing | | | |
Interest rates +50bps for U.S. dollar area/+10bps for euro area (2018: +100/+30bps for U.S. dollar/euro area; 2017: +25bps for euro area) | –8 | –24 | –5 |
Interest rates –50bps for U.S. dollar/–20bps for for euro area (2018: –25/–10bps for U.S. dollar/euro area; 2017: –25bps for euro area) | 8 | 4 | 0 |
186 | Section F – Management of Financial Risk Factors |
To Our | Combined Group | Consolidated Financial | Further Information on Economic, | Additional |
Stakeholders | Management Report | Statements IFRS | Environmental, and Social Performance | Information |
Equity Price Risk
Equity Price Risk Factors
We are exposed to equity price risk with regard to our investments in equity securities and our share-based payments plans.
Equity Price Risk Management
Our listed equity investments are monitored based on the current market value that is affected by the fluctuations in the volatile stock markets worldwide. Unlisted equity investments are monitored based on detailed financial information provided by the investees. The fair value of our listed equity investments depends on the equity prices, while the fair value of the unlisted equity investments is influenced by various unobservable input factors.
We also monitor the exposure with regard to our share-based payment plans. To reduce resulting profit or loss volatility, we hedge certain cash flow exposures associated with these plans by purchasing derivative instruments, but we do not establish a designated hedge relationship.
Equity Price Exposure
On December 31, 2019, our exposure from our investments in equity securities was €1,996 million (2018: €1,248 million; 2017: €827 million).
For information about the exposure from our share-based payments plans, see Note (B.3).
Equity Price Sensitivity
In our sensitivity analysis for our share-based payments plans, we include the hedging instruments and the underlying share-based payments even though the latter are scoped out of IFRS 7, as we believe that taking only the derivative instrument into account would not properly reflect our equity price risk exposure.
Our sensitivity towards a fluctuation in equity prices is as follows:
Equity Price Sensitivity
€ millions | 2019 | 2018 | 2017 |
Investments in equity securities | | | |
Increase in equity prices and respective unobservable inputs of 10% - increase of financial income, net by | 156 | 65 | 56 |
Decrease in equity prices and respective unobservable inputs of 10% - decrease of financial income, net by | –156 | –65 | –56 |
Share-based payments | | | |
Increase in equity prices of 20% | | | |
Increase of share-based payment expenses by | –298 | –279 | –371 |
Increase of offsetting gains from hedging instruments by | 48 | 57 | 65 |
Decrease in equity prices of 20% | | | |
Decrease of share-based payment expenses by | 307 | 262 | 337 |
Decrease of offsetting gains from hedging instruments by | –46 | –44 | –46 |
Credit Risk
Credit Risk Factors
To reduce the credit risk in investments, we arrange to receive rights to collateral for certain investing activities in the full amount of the investment volume, which we would be allowed to make use of only in the case of default of the counterparty to the investment. In the absence of other significant agreements to reduce our credit risk exposure, the total amounts recognized as cash and cash equivalents, current investments, loans, and other financial receivables, trade receivables, and derivative financial assets represent our maximum exposure to credit risks, except for the agreements mentioned above.
Credit Risk Management
Cash at Banks, Time Deposits, and Debt Securities
To mitigate the credit risk from our investing activities and derivative financial assets, we conduct all our activities only with approved major financial institutions and issuers that carry high external ratings, as required by our internal treasury guideline. Among its stipulations, the guideline requires that we invest only in assets from issuers with a minimum rating of at least “BBB flat.” We only invest in issuers with a lower rating in exceptional cases. Such investments were not material in 2019 and 2018. The weighted average rating of our financial assets is in the range A to A–. We pursue a policy of cautious investments characterized by predominantly current investments, standard investment instruments, as well as a wide portfolio diversification by doing business with a variety of counterparties.
To further reduce our credit risk, we require collateral for certain investments in the full amount of the investment volume, which we would be allowed to make use of in the case of default of the counterparty to the investment. As such collateral, we only accept bonds with at least investment-grade rating level.
In addition, the concentration of credit risk that exists when counterparties are involved in similar activities by instrument, sector, or geographic area is further mitigated by diversification of counterparties throughout the world and adherence to an internal limit system for each counterparty. This internal limit system stipulates that the business volume with individual counterparties is restricted to a defined limit that depends on the lowest official long-term credit rating available by at least one of the major rating agencies, the Tier 1 capital of the respective financial institution, or participation in the German Depositors’ Guarantee Fund or similar protection schemes. We continuously monitor strict compliance with these counterparty limits. As the premium for credit default swaps mainly depends on market participants’ assessments of the creditworthiness of a debtor, we also closely observe the development of credit default swap spreads in the market to evaluate probable risk developments and react in a timely manner to changes should these manifest.
For cash at banks, time deposits, and debt securities such as acquired bonds or commercial paper, we apply the general impairment approach. As it is our policy to only invest in high-quality assets of issuers with a minimum rating of at least investment grade so as to minimize the risk of credit losses, we use the low credit risk exception. Thus, these assets are always allocated to stage 1 of the three-stage credit loss model and we record a loss allowance for an amount equal to 12-month expected credit losses. This loss
Section F – Management of Financial Risk Factors | 187 |
To Our | Combined Group | Consolidated Financial | Further Information on Economic, | Additional |
Stakeholders | Management Report | Statements IFRS | Environmental, and Social Performance | Information |
allowance is calculated based on our exposure as at the respective reporting date, the loss given default for this exposure, and the credit default swap spread as a measure for the probability of default. To ensure that during their lifetime our investments always fulfill the requirement of being investment-grade, we monitor changes in credit risk by tracking published external credit ratings. Among other things, we consider cash at banks, time deposits, and debt securities to be in default when the counterparty is unlikely to pay its obligations in full, when there is information about a counterparty’s financial difficulties, or in case of a drastic increase in the credit default swap spread of a counterparty for a prolonged time period while the overall market environment remains rather stable. Such financial assets are written off either partially or in full if the likelihood of recovery is considered remote, which might be evidenced, for example, by the bankruptcy of a counterparty of such financial assets.
Trade Receivables
The default risk of our trade receivables is managed separately, mainly based on assessing the creditworthiness of customers through external ratings and on our past experience with the customers concerned. Based on this assessment, individual credit limits are established for each customer and deviations from such credit limits need to be approved by management.
We apply the simplified impairment approach using a provision matrix for all trade receivables and contract assets to take into account any lifetime expected credit losses already at initial recognition. For the purpose of the provision matrix, customers are clustered into different risk classes, mainly based on market information such as the country risk assessment of their country of origin. Loss rates used to reflect lifetime expected credit losses are determined using a roll-rate method based on the probability of a receivable progressing through different stages of being overdue and on our actual credit loss experience over the past years. These loss rates are enhanced by forward-looking information to reflect differences between economic conditions during the period over which the historical data has been collected, current conditions, and the expected changes in the economic conditions over the expected life of the receivables. Forward-looking information is based on changes in country risk ratings, or fluctuations in credit default swaps of countries of the customers we do business with. We continuously monitor outstanding receivables locally to assess whether there is objective evidence that our trade receivables and contract assets are credit-impaired. Evidence that trade receivables and contract assets are credit-impaired include, among the trade receivables being past due, information about significant financial difficulty of the customer or non-adherence to a payment plan. We consider receivables to be in default when the counterparty is unlikely to pay its obligations in full, However, a delay of payments (for example, more than 90 days past due) in the normal course of business alone does not necessarily indicate a customer default. We write off account balances either partially or in full if we judge that the likelihood of recovery is remote, which might be evidenced, for example, when bankruptcy proceedings for a customer are finalized or when all enforcement efforts have been exhausted.
The impact of default on our trade receivables from individual customers is mitigated by our large customer base and its distribution across many different industries, company sizes, and countries worldwide. For more information about our trade receivables, see Note (A.2.).
Credit Risk Exposure
Cash, Time Deposits, and Debt Securities
As at December 31, 2019, our exposure to credit risk from cash, time deposits, and debt securities was as follows:
Credit Risk Exposure from Cash, Time Deposits, and Debt Securities
€ millions, unless
otherwise stated | | | | | 2019 |
| Equivalent to External | Weighted Average Loss | Gross Carrying Amount | Gross Carrying Amount | ECL Allowance |
| Rating | Rate | Not Credit-Impaired | Credit-Impaired | |
Risk class 1 - low risk | AAA to BBB– | -0.1% | 3,838 | 0 | –3 |
Risk class 2 - high risk | BB to D | 0.0% | 23 | 0 | 0 |
Risk class 3 - unrated | NA | -5.0% | 52 | 0 | –3 |
Total | | -0.2% | 3,913 | 0 | –6 |
€ millions, unless
otherwise stated | | | | | 2018 |
| Equivalent to External | Weighted Average Loss | Gross Carrying Amount | Gross Carrying Amount | ECL Allowance |
| Rating | Rate | Not Credit-Impaired | Credit-Impaired | |
Risk class 1 - low risk | AAA to BBB– | -0.1% | 7,406 | 0 | –5 |
Risk class 2 - high risk | BB to D | 0.0% | 34 | 0 | 0 |
Risk class 3 - unrated | NA | -3.3% | 30 | 0 | –1 |
Total | | -0.1% | 7,470 | 0 | –6 |
188 | Section F – Management of Financial Risk Factors |
To Our | Combined Group | Consolidated Financial | Further Information on Economic, | Additional |
Stakeholders | Management Report | Statements IFRS | Environmental, and Social Performance | Information |
As at December 31, 2019, the major part of our time deposits, other loans, and other financial receivables was concentrated in Germany. There were no time deposits, loans, or other financial receivables past due but not impaired and we had no indications of impairments of such assets that were not past due and not impaired as at that date.
Trade Receivables and Contract Assets
As at December 31, 2019, our exposure to credit risk from trade receivables was as follows:
Credit Risk Exposure from Trade Receivables and Contract Assets
€ millions, unless otherwise
stated | | | | 2019 |
| Weighted Average Loss Rate | Gross Carrying Amount | Gross Carrying Amount | ECL Allowance |
| | Not Credit-Impaired | Credit-Impaired | |
AR not due and due | -0.2% | 5,226 | 0 | –9 |
AR overdue 1 to 30 days | -0.5% | 733 | 36 | –4 |
AR overdue 30 to 90 days | -0.8% | 668 | 23 | –5 |
AR overdue more than 90 days | –11.1% | 869 | 158 | –114 |
TOTAL | -1.7% | 7,496 | 217 | –131 |
€ millions, unless otherwise
stated | | | | 2018 |
| Weighted Average Loss Rate | Gross Carrying Amount | Gross Carrying Amount | ECL Allowance |
| | Not Credit-Impaired | Credit-Impaired | |
AR not due and due | -0.3% | 4,288 | 0 | –13 |
AR overdue 1 to 30 days | -0.3% | 749 | 15 | –2 |
AR overdue 30 to 90 days | -0.5% | 551 | 8 | –3 |
AR overdue more than 90 days | –13.0% | 558 | 125 | –89 |
TOTAL | -1.7% | 6,146 | 148 | –107 |
For 2019, the movement in the ECL allowance for trade receivables and contract assets is as follows:
Movement in ECL Allowance for Trade Receivables and Contract Assets
| 2019 | 2018 |
€ millions | ECL Allowance | ECL Allowance |
Balance as at 1/1 under IFRS 9 | –107 | –99 |
Net credit losses recognized | –38 | –18 |
Amounts written off | 13 | 10 |
Balance as at 12/31 | –131 | –107 |
Section F – Management of Financial Risk Factors | 189 |
To Our | Combined Group | Consolidated Financial | Further Information on Economic, | Additional |
Stakeholders | Management Report | Statements IFRS | Environmental, and Social Performance | Information |
Liquidity Risk
Liquidity Risk Factors
We are exposed to liquidity risk from our obligations towards suppliers, employees, and financial institutions.
Liquidity Risk Management
Our liquidity is managed by our global treasury department with the primary aim of maintaining liquidity at a level that is adequate to meet our financial obligations.
Generally, our primary source of liquidity is funds generated from our business operations. Our global treasury department manages liquidity centrally for all subsidiaries. Where possible, we pool their cash surplus so that we can use liquidity centrally for our business operations, for subsidiaries’ funding requirements, or to invest any net surplus in the market. With this strategy, we seek to optimize yields, while ensuring liquidity, by investing only with counterparties and issuers of high credit quality, as explained before. Hence, high levels of liquid assets and marketable securities provide a strategic reserve, helping keep SAP flexible, sound, and independent.
Apart from effective working capital and cash management, we have reduced the liquidity risk inherent in managing our day-to-day operations and meeting our financing responsibilities by arranging an adequate volume of available credit facilities with various financial institutions on which we can draw if necessary.
In order to retain high financial flexibility, in 2017, SAP SE entered into a €2.5 billion syndicated credit facility agreement with a term until 2024. The use of the facility is not restricted by any financial covenants. Borrowings under the facility bear interest of EURIBOR or LIBOR for the respective currency plus a margin of 17bps. We are also required to pay a commitment fee of 5.95bps per annum on the unused available credit. We have not drawn on the facility.
In September 2019, we initiated a commercial paper program (“Commercial Paper”). As at December 31, 2019, we had €1,099.5 million of Commercial Paper outstanding with maturities generally less than six months.
Additionally, as at December 31, 2019, and 2018, we had available lines of credit totaling €430 million and €445 million, respectively. There were immaterial borrowings outstanding under these lines of credit in all years presented.
Liquidity Risk Exposure
The table below is an analysis of the remaining contractual maturities of all our financial liabilities held as at December 31, 2019. Financial liabilities for which repayment can be requested by the contract partner at any time are assigned to the earliest possible period. Variable interest payments were calculated using the latest relevant interest rate fixed as at December 31, 2019. As we generally settle our derivative contracts gross, we show the pay and receive legs separately for all our currency and interest rate derivatives, whether or not the fair value of the derivative is negative. The cash outflows for the currency derivatives are translated using the applicable spot rate.
Contractual Maturities of Non-Derivative Financial Liabilities
€ millions | Carrying
Amount | | | | Contractual Cash Flows |
| 12/31/2019 | 2020 | 2021 | 2022 | 2023 | 2024 | Thereafter |
Non-derivative financial liabilities | | | | | | | |
Trade payables | –1,283 | –1,283 | 0 | 0 | 0 | 0 | 0 |
Lease liabilities | –2,203 | –431 | –363 | –284 | –224 | –190 | –1,019 |
Other financial liabilities | –13,912 | –2,888 | –630 | –3,414 | –1,095 | –1,231 | –5,467 |
Total of non-derivative financial liabilities | –17,398 | –4,602 | –993 | –3,698 | –1,319 | –1,421 | –6,486 |
| | | | | | | |
€ millions | Carrying
Amount | | | | Contractual Cash Flows |
| 12/31/2018 | 2019 | 2020 | 2021 | 2022 | 2023 | Thereafter |
Non-derivative financial liabilities | | | | | | | |
Trade payables | –1,265 | –1,265 | 0 | 0 | 0 | 0 | 0 |
Financial liabilities | –11,602 | –1,149 | –1,585 | –622 | –1,410 | –1,097 | –6,689 |
Total of non-derivative financial liabilities | –12,866 | –2,414 | –1,585 | –622 | –1,410 | –1,097 | –6,689 |
190 | Section F – Management of Financial Risk Factors |
To Our | Combined Group | Consolidated Financial | Further Information on Economic, | Additional |
Stakeholders | Management Report | Statements IFRS | Environmental, and Social Performance | Information |
Contractual Maturities of Derivative Financial Liabilities and Financial Assets | | |
€ millions | Carrying | Contractual Cash Flows | Carrying | Contractual Cash Flows |
| Amount | | | Amount | | |
| 12/31/2019 | 2020 | Thereafter | 12/31/2018 | 2019 | Thereafter |
Derivative financial liabilities and assets | | | | | | |
Derivative financial liabilities | | | | | | |
Currency derivatives not designated as hedging instruments | –55 | | | –64 | | |
Cash outflows | | –2,865 | –3 | | –2,111 | –11 |
Cash inflows | | 2,816 | 0 | | 2,062 | 0 |
Currency derivatives designated as hedging instruments | –11 | | | –9 | | |
Cash outflows | | –415 | 0 | | –340 | 0 |
Cash inflows | | 401 | 0 | | 330 | 0 |
Interest rate derivatives designated as hedging instruments | –16 | | | –3 | | |
Cash outflows | | –28 | –536 | | –15 | –27 |
Cash inflows | | 36 | 515 | | 13 | 26 |
Total of derivative financial liabilities | –82 | –55 | –24 | –76 | –61 | –12 |
Derivative financial assets | | | | | | |
Currency derivatives not designated as hedging instruments | 33 | | | 100 | | |
Cash outflows | | –3,442 | 0 | | –4,025 | 0 |
Cash inflows | | 3,468 | 0 | | 4,076 | 0 |
Currency derivatives designated as hedging instruments | 3 | | | 2 | | |
Cash outflows | | –114 | 0 | | –203 | 0 |
Cash inflows | | 117 | 0 | | 202 | 0 |
Interest rate derivatives designated as hedging instruments | 9 | | | 11 | | |
Cash outflows | | –14 | –18 | | –8 | –14 |
Cash inflows | | 17 | 24 | | 19 | 15 |
Total of derivative financial assets | 44 | 32 | 6 | 113 | 61 | 1 |
Total of derivative financial liabilities and assets | –37 | –23 | –18 | 37 | 0 | –11 |
| | | | | | | |
(F.2) Fair Value Disclosures on Financial Instruments
 Level Transfers
It is our policy that transfers between the different levels of the fair value hierarchy are deemed to have occurred at the beginning of the period of the event or change in circumstances that caused the transfer.
Fair Value of Financial Instruments
We use various types of financial instruments in the ordinary course of business, which are classified as either amortized cost (AC) or fair value through profit or loss (FVTPL). For those financial instruments measured at fair value or for which fair value must be disclosed, we have categorized the financial instruments into a three-level fair value hierarchy depending on the inputs used to determine fair value and their significance for the valuation techniques.
Section F – Management of Financial Risk Factors | 191 |
To Our | Combined Group | Consolidated Financial | Further Information on Economic, | Additional |
Stakeholders | Management Report | Statements IFRS | Environmental, and Social Performance | Information |
Fair Values of Financial Instruments and Classification Within the Fair Value Hierarchy |
€ millions | Category | | | | | | | 12/31/2019 |
| | Carrying | Measurement Categories | | | | Fair Value |
| | Amount | At | At Fair | Level 1 | Level 2 | Level 3 | Total |
| | | Amortized | Value | | | | |
| | | Cost | | | | | |
Assets | | | | | | | | |
Cash and cash equivalents | | 5,314 | | | | | | |
Cash at banks1) | AC | 2,877 | 2,877 | | | | | |
Time deposits1) | AC | 1,090 | 1,090 | | | | | |
Money market and similar funds | FVTPL | 1,347 | | 1,347 | 1,347 | | | 1,347 |
Trade and other receivables | | 8,037 | | | | | | |
Trade receivables1) | AC | 7,582 | 7,582 | | | | | |
Other receivables2) | – | 454 | | | | | | |
Other financial assets | | 2,633 | | | | | | |
Debt securities | AC | 27 | 27 | | 27 | | | 27 |
Equity securities | FVTPL | 1,996 | | 1,996 | 25 | 89 | 1,882 | 1,996 |
Investments in associates2) | – | 16 | | | | | | |
Time deposits | AC | 41 | 41 | | | 41 | | 41 |
Financial instruments related to employee benefit plans2) | – | 183 | | | | | | |
Loans and other financial receivables | AC | 217 | 217 | | | 217 | | 217 |
Derivative assets | | | | | | | | |
Designated as hedging instrument | | | | | | | | |
FX forward contracts | – | 3 | | 3 | | 3 | | 3 |
Interest rate swaps | – | 9 | | 9 | | 9 | | 9 |
Not designated as hedging instrument | | | | | | | | |
FX forward contracts | FVTPL | 33 | | 33 | | 33 | | 33 |
Call options for share-based payments | FVTPL | 95 | | 95 | | 95 | | 95 |
Call option on equity shares | FVTPL | 15 | | 15 | | | 15 | 15 |
Liabilities | | | | | | | | |
Trade and other payables | | –1,589 | | | | | | |
Trade payables1) | AC | –1,283 | –1,283 | | | | | |
Other payables2) | – | –306 | | | | | | |
Financial liabilities | | –16,196 | | | | | | |
Non-derivative financial liabilities | | | | | | | | |
Loans | AC | –3,116 | –3,116 | | | –3,116 | | –3,116 |
Bonds | AC | –9,433 | –9,433 | | –10,003 | | | –10,003 |
Private placements | AC | –1,067 | –1,067 | | | –1,078 | | –1,078 |
Other non-derivative financial liabilities3) | AC | –2,498 | –2,498 | | | –296 | | –296 |
Derivatives | | | | | | | | |
Designated as hedging instrument | | | | | | | | |
FX forward contracts | – | –11 | | –11 | | –11 | | –11 |
Interest rate swaps | – | –16 | | –16 | | –16 | | –16 |
Not designated as hedging instrument | | | | | | | | |
FX forward contracts | FVTPL | –55 | | –55 | | –55 | | –55 |
Total financial instruments, net | | –1,801 | –5,564 | 3,416 | –8,604 | –4,086 | 1,896 | –10,793 |
192 | Section F – Management of Financial Risk Factors |
To Our | Combined Group | Consolidated Financial | Further Information on Economic, | Additional |
Stakeholders | Management Report | Statements IFRS | Environmental, and Social Performance | Information |
Fair Values of Financial Instruments and Classification Within the Fair Value Hierarchy |
€ millions | Category | | | | | | | 12/31/2018 |
| | Carrying | Measurement Categories | | | | Fair Value |
| | Amount | At | At Fair | Level 1 | Level 2 | Level 3 | Total |
| | | Amortized | Value | | | | |
| | | Cost | | | | | |
Assets | | | | | | | | |
Cash and cash equivalents | | 8,627 | | | | | | |
Cash at banks1) | AC | 2,918 | 2,918 | | | | | |
Time deposits1) | AC | 4,514 | 4,514 | | | | | |
Money market and similar funds | FVTPL | 1,195 | | 1,195 | 1,195 | | | 1,195 |
Trade and other receivables | | 6,480 | | | | | | |
Trade receivables1) | AC | 6,188 | 6,188 | | | | | |
Other receivables2) | – | 293 | | | | | | |
Other financial assets | | 1,984 | | | | | | |
Debt securities | AC | 77 | 77 | | 77 | | | 77 |
Equity securities | FVTPL | 1,248 | | 1,248 | 52 | | 1,196 | 1,248 |
Investments in associates2) | – | 26 | | | | | | |
Time deposits | AC | 134 | 134 | | | 134 | | 134 |
Financial instruments related to employee benefit plans2) | – | 165 | | | | | | |
Loans and other financial receivables | AC | 147 | 147 | | | 147 | | 147 |
Derivative assets | | | | | | | | |
Designated as hedging instrument | | | | | | | | |
FX forward contracts | – | 2 | | 2 | | 2 | | 2 |
Interest rate swaps | – | 11 | | 11 | | 11 | | 11 |
Not designated as hedging instrument | | | | | | | | |
FX forward contracts | FVTPL | 100 | | 100 | | 100 | | 100 |
Call options for share-based payments | FVTPL | 68 | | 68 | | 68 | | 68 |
Call option on equity shares | FVTPL | 5 | | 5 | | | 5 | 5 |
Liabilities | | | | | | | | |
Trade and other payables | | –1,614 | | | | | | |
Trade payables1) | AC | –1,265 | –1,265 | | | | | |
Other payables2) | – | –350 | | | | | | |
Financial liabilities | | –11,678 | | | | | | |
Non-derivative financial liabilities | | | | | | | | |
Loans | AC | –58 | –58 | | | –58 | | –58 |
Bonds | AC | –10,204 | –10,204 | | –10,365 | | | –10,365 |
Private placements | AC | –1,041 | –1,041 | | | –1,035 | | –1,035 |
Other non-derivative financial liabilities | AC | –298 | –298 | | | –298 | | –298 |
Derivatives | | | | | | | | |
Designated as hedging instrument | | | | | | | | |
FX forward contracts | – | –9 | | –9 | | –9 | | –9 |
Interest rate swaps | – | –3 | | –3 | | –3 | | –3 |
Not designated as hedging instrument | | | | | | | | |
FX forward contracts | FVTPL | –65 | | –65 | | –65 | | –65 |
Total financial instruments, net | | 3,798 | 1,112 | 2,553 | –9,041 | –1,006 | 1,201 | –8,845 |
1) | We do not separately disclose the fair value for cash and cash equivalents, trade receivables, and accounts payable as their carrying amounts are a reasonable approximation of their fair values. |
2) | Since the line items trade receivables, trade payables, and other financial assets contain both financial and non-financial assets or liabilities (such as other taxes or advance payments), the carrying amounts of non-financial assets or liabilities are shown to allow a reconciliation to the corresponding line items in the Consolidated Statements of Financial Position. |
3) | For lease liabilities, included in the line item other non-derivative financial liabilities, separate disclosure of fair value is not required. |
Section F – Management of Financial Risk Factors | 193 |
To Our | Combined Group | Consolidated Financial | Further Information on Economic, | Additional |
Stakeholders | Management Report | Statements IFRS | Environmental, and Social Performance | Information |
Fair Values of Financial Instruments by Instrument Classification | | |
€ millions | Category | | | 12/31/2019 |
| | Carrying Amount | At Amortized Cost | At Fair Value |
Financial assets | | | | |
At fair value through profit or loss | FVTPL | 3,486 | | 3,486 |
At amortized cost | AC | 11,834 | 11,834 | |
Financial liabilities | | | | |
At fair value through profit or loss | FVTPL | –55 | | –55 |
At amortized cost | AC | –17,398 | –17,398 | |
Fair Values of Financial Instruments by Instrument Classification |
€ millions | Category | | | 12/31/2018 |
| | Carrying Amount | At Amortized Cost | At Fair Value |
Financial assets | | | | |
At fair value through profit or loss | FVTPL | 2,617 | | 2,617 |
At amortized cost | AC | 13,978 | 13,978 | |
Financial liabilities | | | | |
At fair value through profit or loss | FVTPL | –65 | | –65 |
At amortized cost | AC | –12,866 | –12,866 | |
194 | Section F – Management of Financial Risk Factors |
To Our | Combined Group | Consolidated Financial | Further Information on Economic, | Additional |
Stakeholders | Management Report | Statements IFRS | Environmental, and Social Performance | Information |
Determination of Fair Values
A description of the valuation techniques and the inputs used in the fair value measurement is given below:
Financial Instruments Measured at Fair Value on a Recurring Basis
| Type | Fair Value
Hierarchy | Determination of Fair Value/
Valuation Technique | Significant Unobservable Inputs | Interrelationship Between
Significant Unobservable
Inputs and Fair Value
Measurement |
Other financial assets | | | | |
| Money-market and similar funds | Level 1 | Quoted prices in an active market | NA | NA |
| Debt securities | Level 1 | Quoted prices in an active market | NA | NA |
| Listed equity securities | Level 1 | Quoted prices in an active market | NA | NA |
| Level 2 | Quoted prices in an active market deducting a discount for the disposal restriction derived from the premium for a respective put option. | NA | NA |
| Unlisted equity securities | Level 3 | Market approach. Comparable company valuation using revenue multiples derived from companies comparable to the investee. | Peer companies used (revenue multiples range from 3.0 to 9.1)
Revenues of investees Discounts for lack of marketability (10% to 30%) | The estimated fair value would increase (decrease) if: - The revenue multiples were higher (lower) - The investees’ revenues were higher (lower) - The liquidity discounts were lower (higher) |
| | | Market approach. Venture capital method evaluating a variety of quantitative and qualitative factors such as actual and forecasted results, cash position, recent or planned transactions, and market comparable companies. | NA | NA |
| | | Last financing round valuations | NA | NA |
| | | Liquidation preferences | NA | NA |
| | | Net asset value/fair market value as reported by the respective funds | NA | NA |
| Call options for share- based payment plans | Level 2 | Monte Carlo model. Calculated considering risk-free interest rates, the remaining term of the derivatives, the dividend yields, the share price, and the volatility of our share. | NA | NA |
| Call option on equity shares | Level 3 | 2018: Market approach. Company valuation using revenue multiples based on actual results derived from the investee. | 2018: Revenue multiples used revenue of the investee | 2018: The estimated fair value would increase (decrease) if: - The revenue multiples were higher (lower) - The investees’ revenue were higher (lower) |
| | | 2019: Market approach. Venture capital method evaluating a variety of quantitative and qualitative factors such as actual and forecasted results, cash position, recent or planned transactions, and market comparable companies. | NA | NA |
Other financial assets/ Financial liabilities | | |
| FX forward contracts | Level 2 | Discounted cash flow using par method. Expected future cash flows based on forward exchange rates are discounted over the respective remaining term of the contracts using the respective deposit interest rates and spot rates. | NA | NA |
| Interest rate swaps | Level 2 | Discounted cash flow. Expected future cash flows are estimated based on forward interest rates from observable yield curves and contract interest rates, discounted at a rate that reflects the credit risk of the counterparty. | NA | NA |
Section F – Management of Financial Risk Factors | 195 |
To Our | Combined Group | Consolidated Financial | Further Information on Economic, | Additional |
Stakeholders | Management Report | Statements IFRS | Environmental, and Social Performance | Information |
Financial Instruments Not Measured at Fair Value
| Type | Fair Value Hierarchy | Determination of Fair Value/Valuation Technique |
Financial liabilities | | | |
| Fixed-rate bonds (financial liabilities) | Level 1 | Quoted prices in an active market |
| Fixed-rate private placements/ loans (financial liabilities) | Level 2 | Discounted cash flows Future cash outflows for fixed interest and principal are discounted over the term of the respective contracts using the market interest rates as at the reporting date. |
For other non-derivative financial assets/liabilities and variable rate financial debt, it is assumed that their carrying value reasonably approximates their fair values.
Transfers Between Levels 1 and 2
Transfers of equity securities from Level 2 to Level 1, which occurred because disposal restrictions lapsed and deducting a discount for such restriction was no longer necessary, were €5 million in 2019 (2018: €46 million), while transfers from Level 1 to Level 2 did not occur at all.
Level 3 Fair Value Disclosures
The following table shows the reconciliation of fair values from the opening to the closing balances for our unlisted equity securities and call options on equity shares classified as Level 3 fair values:
Reconciliation of Level 3 Fair Values
€ millions | 2019 | 2018 |
1/1 | 1,202 | 742 |
Transfers | | |
Into Level 3 | 0 | 0 |
Out of Level 3 | –39 | –12 |
Purchases | 487 | 409 |
Sales | –183 | –143 |
Gains/losses | | |
Included in financial income, net in profit or loss | 411 | 168 |
Included in exchange differences in other comprehensive income | 18 | 38 |
12/31 | 1,896 | 1,202 |
Change in unrealized gains/losses in profit or loss for equity investments held at the end of the reporting period | 318 | 117 |
Transfers out of Level 3 are due to initial public offerings of the respective investee. Changing the unobservable inputs to reflect reasonably possible alternative assumptions would not have a material impact on the fair values of our unlisted equity securities held as FVTPL as at the reporting date.
196 | Section F – Management of Financial Risk Factors |
To Our | Combined Group | Consolidated Financial | Further Information on Economic, | Additional |
Stakeholders | Management Report | Statements IFRS | Environmental, and Social Performance | Information |
Section G – Other Disclosures
This section provides additional disclosures on miscellaneous topics, including information pertaining to the Executive Board, Supervisory Board, related party transactions, and other corporate governance topics.
(G.1) Prepaid Expenses and Other Tax Assets
€ millions | | | 2019 | | | 2018 |
| Current | Non-Current | Total | Current | Non-Current | Total |
Prepaid expenses | 427 | 179 | 606 | 305 | 131 | 436 |
Other tax assets | 225 | 87 | 312 | 170 | 98 | 268 |
Total | 652 | 266 | 918 | 475 | 229 | 704 |
 Other non-financial assets Other non-financial assets
| 1,188 | 1,701 | 2,889 | 889 | 1,301 | 2,191 |
Prepaid expenses and other tax assets as % of other non-financial assets other non-financial assets | 55 | 16 | 32 | 53 | 18 | 32 |
Prepaid expenses primarily consist of prepayments for operating leases, support services, and software royalties. Other tax assets primarily consist of VAT.
(G.2) Other Tax Liabilities
€ millions | | | 2019 | | | 2018 |
| Current | Non-Current | Total | Current | Non-Current | Total |
Other tax liabilities | 650 | 0 | 650 | 541 | 0 | 541 |
 Other non-financial liabilities Other non-financial liabilities
| 4,818 | 814 | 5,632 | 4,120 | 501 | 4,622 |
Other tax liabilities as % of  other non-financial liabilities other non-financial liabilities | 13 | 0 | 12 | 13 | 0 | 12 |
Other tax liabilities primarily consist of VAT, payroll tax, sales tax, and withholding tax.
(G.3) Other Litigation, Claims, and Legal Contingencies
This Note discloses information about intellectual property-related litigation and claims, tax-related litigation other than income tax-related litigation (see Note (C.5)), and anti-bribery and export control matters.
 Uncertainty in Context of Legal Matters
The policies outlined in Note (A.4) for customer-related provisions, which include provisions for customer-related litigation cases and claims, equally apply to our other litigation, claims, and legal contingencies disclosed in this Note.
The outcome of litigation and claims is intrinsically subject to considerable uncertainty. Management’s view of these matters may also change in the future. Actual outcomes of litigation and claims may differ from the assessments made by management in prior periods, which could result in a material impact on our business, financial position, profit, cash flows, or reputation. Most of the lawsuits and claims are of a very individual nature and claims are either not quantified by the claimants or the claim amounts quantified are, based on historical evidence, not expected to be a good proxy for the expenditure that would be required to resolve the case concerned. The specifics of the jurisdictions where most of the claims are located further impair the predictability of the outcome of the cases. Therefore, it is typically not practicable to reliably estimate the financial effect that these lawsuits and claims would have if SAP were to incur expenditure for these cases.
Further, the expected timing of any resulting outflows of economic benefits from these lawsuits and claims is typically uncertain and not estimable, as it depends generally on the duration of the legal proceedings and settlement negotiations required to resolve them.
We are subject to a variety of claims and lawsuits that arise from time to time in the ordinary course of our business, including proceedings and claims that relate to companies we have acquired. We will continue to vigorously defend against all claims and lawsuits against us. The provisions recorded for these claims and lawsuits as
Section G – Other Disclosures | 197 |
To Our | Combined Group | Consolidated Financial | Further Information on Economic, | Additional |
Stakeholders | Management Report | Statements IFRS | Environmental, and Social Performance | Information |
at December 31, 2019, are neither individually nor in the aggregate material to SAP.
Among the claims and lawsuits disclosed in this Note are the following classes:
Intellectual Property-Related Litigation and Claims
Intellectual property-related litigation and claims are cases in which third parties have threatened or initiated litigation claiming that SAP violates one or more intellectual property rights that they possess. Such intellectual property rights may include patents, copyrights, and other similar rights.
Contingent liabilities exist from intellectual property-related litigation and claims for which no provision has been recognized. Generally, it is not practicable to estimate the financial impact of these contingent liabilities due to the uncertainties around the litigation and claims, as outlined above. The total amounts claimed by plaintiffs in those intellectual property-related lawsuits or claims in which a claim has been quantified were not material to us as at December 31, 2019 and 2018. Based on our past experience, most of the intellectual property-related litigation and claims tend to be either dismissed in court or settled out of court for amounts significantly below the originally claimed amounts. We currently believe that resolving the intellectual property-related claims and lawsuits pending as at December 31, 2019, will neither individually nor in the aggregate have a material adverse effect on our business, financial position, profit, or cash flows.
Individual cases of intellectual property-related litigation and claims include the following:
In June 2018, Teradata Corporation, Teradata US, Inc. and Teradata Operations, Inc. (collectively “Teradata”) filed a civil lawsuit against SAP SE, SAP America, Inc. and SAP Labs, LLC in U.S. federal court in California. Teradata alleges that SAP misappropriated trade secrets of Teradata, infringed Teradata’s copyrights, and violated U.S. antitrust laws. Teradata seeks unspecified monetary damages and injunctive relief. Trial is scheduled for late 2021.
In February 2010, United States-based TecSec, Inc. (TecSec) instituted legal proceedings in the United States against SAP (including its subsidiary Sybase) and many other defendants. TecSec alleged that SAP’s and Sybase’s products infringe one or more of the claims in five patents held by TecSec. In its complaint, TecSec seeks unspecified monetary damages and permanent injunctive relief. The trial for SAP (including its subsidiary Sybase) has not yet been scheduled, but is anticipated for 2020.
Tax-Related Litigation
We are subject to ongoing audits by domestic and foreign tax authorities. In respect of non-income taxes, we are involved in various proceedings with only a few foreign tax authorities regarding assessments and litigation matters on intercompany royalty payments and intercompany services. The total potential amount in dispute related to these matters for all applicable years is approximately €189 million (2018: €95 million). We have not recorded a provision for these matters, as we believe that we will prevail.
For information about income tax-related litigation, see Note (C.5).
Anti-Bribery and Export Control Matters
SAP has received communications and whistleblower information alleging conduct that may violate anti-bribery laws in the United States (including the U.S. Foreign Corrupt Practices Act (FCPA)), and other countries. The Office of Ethics and Compliance (OEC), formerly the Legal Compliance and Integrity Office, of SAP is conducting investigations with the assistance of an external law firm and voluntarily advised the U.S. Securities and Exchange Commission (U.S. SEC) and the U.S. Department of Justice (U.S. DOJ), as well as local authorities where potential violations are being investigated. The investigations and dialogue between SAP and the local authorities and the U.S. SEC and U.S. DOJ are ongoing.
The alleged conduct may result in monetary penalties or other sanctions under the FCPA and/or other anti-bribery laws. In addition, SAP’s ability to conduct business in certain jurisdictions could be negatively impacted. The comprehensive and exhaustive investigations and the corresponding remediation activities are still ongoing. Considering the complexity of individual factors and the large number of open questions, it is impossible at this point in time to assess the risk of a financial impact.
Furthermore, we continue to investigate separate allegations regarding conduct that certain SAP partners violated SAP contractual terms and sold SAP products and services in embargoed countries. These SAP partners presumably did not adhere to SAP’s strict procedures for indirect business activities. To the extent any company independent from SAP chooses not to follow SAP’s licensing procedures, SAP is ultimately limited in its ability to stop their activities. SAP devotes considerable resources to prevent and mitigate such activities should they occur. We are also investigating allegations regarding direct sales from SAP to certain customers, who may have engaged in unauthorized activities in embargoed countries. The investigations are being conducted by SAP’s OEC and SAP’s Export Control team, with the assistance of an external law firm and forensic advisors.
In this context, SAP voluntarily self-disclosed potential export controls and economic sanctions violations to the U.S. DOJ and the U.S. Department of Treasury’s Office of Foreign Assets Control (OFAC) in September 2017. At the same time, SAP provided notification to the U.S. SEC and responded to an SEC comment letter on export restriction matters in October 2017. SAP has also provided disclosure to the U.S. Department of Commerce’s Bureau of Industry and Security (BIS) based on the same alleged facts. Finally, pursuant to Section 219 of the U.S. Iran Threat Reduction and Syria Human Rights Act of 2012 and Section 13(r) of the U.S. Securities Exchange Act of 1934, SAP has filed the required Iran Notice with the U.S. SEC. The alleged conduct may result in monetary penalties or other sanctions under U.S. sanctions and export control laws.
The comprehensive and exhaustive investigations and the corresponding remediation activities are ongoing, and considering the complexity of individual factors and the large number of open questions, it is impossible at this point in time to assess the risks.
For the reasons outlined above, it is impossible at this point in time to determine whether the potential anti-bribery law violations and the potential export restriction violations represent present obligations of SAP and, if so, to reliably estimate the amount of these obligations. As a consequence, no provisions have been recognized for these potential violations in our consolidated financial statements 2019. It is also not practicable to estimate the financial effect of any contingent liabilities that may result from these potential violations.
198 | Section G – Other Disclosures |
To Our | Combined Group | Consolidated Financial | Further Information on Economic, | Additional |
Stakeholders | Management Report | Statements IFRS | Environmental, and Social Performance | Information |
(G.4) Board of Directors
Executive Board
Memberships on supervisory boards and other comparable governing bodies of enterprises, other than subsidiaries of SAP, on December 31, 2019
Christian Klein
Co-Chief Executive Officer
Intelligent Enterprise Group
Global Business Operations, IT Services
Jennifer Morgan
Co-Chief Executive Officer
Cloud Business Group
Intelligent Spend Group, Qualtrics, CX Product Engineering and Product Management
Board of Directors, Bank of New York Mellon, New York, NY, United States
Adaire Fox-Martin
Global Customer Operations
Global Sales, Regional Field Organizations, Line of Business
Solutions Sales
Board of Directors, Equinix, Inc., Redwood City, CA, United States (from January 1, 2020)
Michael Kleinemeier
SAP Digital Business Services
Global Services Delivery, Regional Field Services
Supervisory Board, innogy SE, Essen, Germany (until October 4, 2019)
Board of Partners, E. Merck KG, Darmstadt, Germany (from January 27, 2019)
Supervisory Board, Merck KGaA, Darmstadt, Germany (from April 26, 2019)
Luka Mucic
Chief Financial Officer
Global Finance and Administration including Investor Relations, Internal Audit, and Data Protection & Privacy
Supervisory Board, HeidelbergCement AG (from May 9, 2019)
Jürgen Müller (from January 1, 2019)
Chief Technology Officer
Technology & Innovation
Technology and Innovation Strategy, SAP HANA,
SAP Cloud Platform, SAP Leonardo, SAP Analytics
Stefan Ries
Chief Human Resources Officer, Labor Relations Director
HR Strategy, Business Transformation, Leadership Development, Talent Development
Supervisory Board, Rhein-Neckar Loewen GmbH, Kronau, Germany
Thomas Saueressig (from November 1, 2019)
SAP Product Engineering
Global Responsibility for all SAP Applications, Product Development and Delivery as well as Product Management for SAP S/4HANA, Supply Chain, SME, and Industry Solutions
Executive Board Members Who Left During 2019
Robert Enslin (until April 5, 2019)
Bernd Leukert (until March 31, 2019)
Bill McDermott (until November 15, 2019)
Supervisory Board
Memberships on supervisory boards and other comparable governing bodies of enterprises, other than subsidiaries of SAP, on December 31, 2019
Prof. Dr. h.c. mult. Hasso Plattner 2), 4), 6)
Chairman
Margret Klein-Magar 1), 2), 3)
Deputy Chairperson
Vice President, Head of SAP Alumni Relations
Chairperson of the Spokespersons’ Committee of Senior Managers of SAP SE
Pekka Ala-Pietilä 2), 6), 7)
Chairman of the Board of Directors, Huhtamäki Oyj, Espoo, Finland
Chairman of the Board of Directors, Sanoma Corporation, Helsinki, Finland
Chairman of the Board of Directors, Netcompany A/S, Copenhagen, Denmark (until August 20, 2019)
Panagiotis Bissiritsas 1), 2), 3), 5)
Member of SAP SE Works Council and Member of SAP SE Works Council (Europe)
Aicha Evans 2), 4), 7)
Chief Executive Officer and Member of the Board of Directors, Zoox, Inc., Foster City, CA, United States
Section G – Other Disclosures | 199 |
To Our | Combined Group | Consolidated Financial | Further Information on Economic, | Additional |
Stakeholders | Management Report | Statements IFRS | Environmental, and Social Performance | Information |
Diane Greene 4), 6)
Board of Directors, Stripe Inc., San Francisco, CA, United States
Board of Directors, Alphabet, Inc., Mountain View, CA, United States (until June 19, 2019)
Prof. Dr. Gesche Joost 4), 7)
Professor for Design Research and Head of the Design Research Lab, University of Arts Berlin
Supervisory Board, Ottobock SE & Co. KGaA, Duderstadt, Germany
Supervisory Board, ING-DiBa AG, Frankfurt, Germany
Monika Kovachka-Dimitrova (from May 15, 2019) 1), 4), 7)
Chief Project Expert Development
Member of SAP SE Works Council (Europe)
Lars Lamadé 1), 2), 4)
Head of Sponsorships Europe and Asia
Supervisory Board, Rhein-Neckar Loewen GmbH, Kronau, Germany
Bernard Liautaud 2), 4), 6)
Managing Partner Balderton Capital, London, United Kingdom
Board of Directors, nlyte Software Ltd., London, United Kingdom
Board of Directors, Vestiaire Collective SA, Levallois-Perret, France
Board of Directors, Dashlane, Inc., New York, NY, United States
Board of Directors, Recorded Future, Inc., Cambridge, MA, United States (until July 3, 2019)
Board of Directors, eWise Group, Inc., Redwood City, CA, United States
Board of Directors, Qubit Digital Ltd., London, United Kingdom
Board of Directors, Aircall.io, New York City, NY, United States
Board of Directors, Virtuo Technologies, Paris, France
Board of Directors, The Hut Group, Manchester, United Kingdom
Board of Directors, Peakon Aps, Copenhagen, Denmark
Board of Directors, Tim Talent SAS, Paris, France
Board of Directors, Citymapper Ltd., London, United Kingdom
Board of Directors, Toucan Toco SAS, Paris, France (from November 14, 2019)
Board of Directors, Containous SAS, Lyon, France (from December 16, 2019)
Gerhard Oswald (from January 1, 2019) 3), 4), 5), 7)
Managing Director of Oswald Consulting GmbH, Walldorf, Germany
Advisory Board, TSG 1899 Hoffenheim Fußball-Spielbetriebs GmbH, Sinsheim, Germany
Christine Regitz 1), 2), 4), 5)
Vice President User Experience
Chief Product Expert
Dr. Friederike Rotsch 2), 3), 5)
Group General Counsel and Head of Group Legal & Compliance, Merck KGaA, Darmstadt, Germany
Heike Steck (from May 15, 2019) 1), 4), 7)
Senior Operations Manager
Member of SAP SE Works Council and Member of SAP SE Works Council (Europe)
Christa Vergien-Knopf (from May 15, 2019) 1), 4, 7)
Member of SAP SE Works Council and Member of SAP SE Works Council (Europe)
Dr. Gunnar Wiedenfels (from May 15, 2019) 3), 5)
Chief Financial Officer, Discovery Communications, Inc., New York, NY, United States
Board of Directors, Motor Trend Group, LLC, El Segundo, CA, United States
Board of Directors, OWN LLC, West Hollywood, CA, United States
Board of Directors, Scripps Networks Interactive (Asia) Pte. Ltd., Singapore (until April 1, 2019)
James Wright (from May 15, 2019) 1), 3), 4), 5)
Chairman of SAP SE Works Council (Europe)
Ralf Zeiger (from May 15, 2019) 1), 2), 7)
Chairman of SAP SE Works Council and Member of SAP SE Works Council (Europe)
Supervisory Board Members Who Left During 2019
Martin Duffek (until May 15, 2019)
Andreas Hahn (until May 15, 2019)
Dr. Erhard Schipporeit (until May 15, 2019)
Robert Schuschnig-Fowler (until May 15, 2019)
Dr. Sebastian Sick (until May 15, 2019)
Pierre Thiollet (until May 15, 2019)
1) Appointed by the SAP SE Works Council (Europe)
2) Member of the Company’s General and Compensation Committee
3) Member of the Company’s Audit Committee
4) Member of the Company’s Technology and Strategy Committee
5) Member of the Company’s Finance and Investment Committee
6) Member of the Company’s Nomination Committee
7) Member of the Company’s People and Organization Committee
200 | Section G – Other Disclosures |
To Our | Combined Group | Consolidated Financial | Further Information on Economic, | Additional |
Stakeholders | Management Report | Statements IFRS | Environmental, and Social Performance | Information |
(G.5) Executive and Supervisory Board Compensation
 Accounting Policy Accounting Policy
The share-based payment amounts disclosed below in the table “Executive Board Compensation” are based on the grant date fair value of the restricted share units (RSUs) and performance share units (PSUs), respectively, issued to Executive Board members during the reporting period under the LTI 2016 Plan. In the table “Share-Based Payment for Executive Board Members,” the share-based payment expense is the amount recorded in profit or loss under IFRS 2 (Share-Based Payment) in the respective period. |
The total compensation of the Executive Board members for each of the years 2019, 2018, and 2017 was as follows:
Executive Board Compensation
€ thousands | 2019 | 2018 | 2017 |
Short-term employee benefits | 17,378 | 18,652 | 16,634 |
Share-based payment1) | 32,393 | 23,646 | 25,723 |
Subtotal1) | 49,771 | 42,298 | 42,357 |
Post-employment benefits | 2,825 | 1,106 | 1,312 |
Thereof defined-benefit | 2,056 | 250 | 423 |
Thereof defined-contribution | 769 | 856 | 889 |
Total1) | 52,596 | 43,404 | 43,669 |
1) Portion of total executive compensation allocated to the respective year
Share-Based Payment for Executive Board Members
| 2019 | 2018 | 2017 |
Number of RSUs granted | 137,619 | 118,072 | 117,929 |
Number of PSUs granted | 206,428 | 177,106 | 176,886 |
Total expense in € thousands | 44,447 | 8,054 | 19,068 |
The defined benefit obligation (DBO) for pensions to Executive Board members and the annual pension entitlement of the members of the Executive Board on reaching age 62 based on entitlements from performance-based and salary-linked plans were as follows:
Retirement Pension Plan for Executive Board Members
€ thousands | 2019 | 2018 | 2017 |
DBO 12/31 | 5,497 | 3,441 | 3,191 |
Annual pension entitlement | 215 | 192 | 148 |
The total annual compensation of the Supervisory Board members is as follows:
Supervisory Board Compensation
€ thousands | 2019 | 2018 | 2017 |
Total compensation | 3,770 | 3,702 | 3,663 |
Thereof fixed compensation | 3,218 | 3,162 | 3,135 |
Thereof committee remuneration | 553 | 540 | 528 |
The Supervisory Board members do not receive any share-based payment for their services. As far as members who are employee representatives on the Supervisory Board receive share-based payment, such compensation is for their services as employees only and is unrelated to their status as members of the Supervisory Board.
Payments to/DBO for Former Executive Board Members
€ thousands | 2019 | 2018 | 2017 |
Payments | 2,081 | 2,054 | 1,997 |
DBO 12/31 | 44,586 | 38,374 | 39,993 |
SAP did not grant any compensation advance or credit to, or enter into any commitment for the benefit of, any member of the Executive Board or Supervisory Board in 2019, 2018, or 2017.
Detailed information about the different elements of the compensation are disclosed in the Compensation Report, which is part of our Integrated Report and of our Annual Report on Form 20-F, both of which are available on SAP’s Web site.
(G.6) Related Party Transactions Other Than Board Compensation
Certain Supervisory Board members of SAP SE currently hold, or held within the last year, positions of significant responsibility with other entities. We have relationships with certain of these entities in the ordinary course of business, whereby we buy and sell products, assets, and services at prices believed to be consistent with those negotiated at arm’s length between unrelated parties.
Companies controlled by Hasso Plattner, Chairman of the Supervisory Board of SAP SE and Chief Software Advisor of SAP, engaged in the following transactions with SAP: providing consulting services to SAP, receiving sport sponsoring from SAP, making purchases of SAP products and services, and purchasing a house from SAP.
Occasionally, members of the Executive Board of SAP SE obtain services from SAP for which they pay a consideration consistent with those negotiated at arm’s length between unrelated parties.
All amounts related to the abovementioned transactions were immaterial to SAP in all periods presented.
In total, we sold products and services to companies controlled by members of the Supervisory Board in the amount of €9 million (2018: €37 million), we bought products and services from such companies in the amount of €2 million (2018: €3 million), and we provided sponsoring and other financial support to such companies
Section G – Other Disclosures | 201 |
To Our | Combined Group | Consolidated Financial | Further Information on Economic, | Additional |
Stakeholders | Management Report | Statements IFRS | Environmental, and Social Performance | Information |
in the amount of €4 million (2018: €4 million). Outstanding balances at year end from transactions with such companies were €0 million (2018: €3 million) for amounts owed to such companies and €0 million (2018: €28 million) for amounts owed by such companies. All of these balances are unsecured and interest-free and settlement is expected to occur in cash. Commitments (the longest of which is for four years) made by us to purchase further goods or services from these companies and to provide further sponsoring and other financial support amount to €14 million as at December 31, 2019 (2018: €191 million).
In total, we sold services to members of the Executive Board and the Supervisory Board in the amount of €0 million (2018: €0 million), and we received services from members of the Supervisory Board (including services from employee representatives on the Supervisory Board in their capacity as employees of SAP) in the amount of €2 million (2018: €1 million). Amounts owed, but not yet paid, to Supervisory Board members from these transactions were €0 million as at December 31, 2019 (2018: €0 million). All of these balances are unsecured and interest-free and settlement is expected to occur in cash.
For information about the compensation of our Executive Board and Supervisory Board members, see Note (G.5).
(G.7) Principal Accountant Fees and Services
At the Annual General Meeting of Shareholders held on May 15, 2019, our shareholders elected KPMG AG Wirtschaftsprüfungsgesellschaft (KPMG) as SAP’s independent auditor for 2019. KPMG has been the Company’s principal auditor since the fiscal year 2002. Bodo Rackwitz has signed as auditor responsible for audit of the financial reporting and the group reporting of SAP SE since the fiscal year 2018. KPMG and other firms in the global KPMG network charged the following fees to SAP for audit and other professional services related to 2019 and the previous years:
€ millions | | | 2019 | | | 2018 | | | 2017 |
| KPMG AG | Foreign | Total | KPMG AG | Foreign | Total | KPMG AG | Foreign | Total |
| (Germany) | KPMG Firms | | (Germany) | KPMG Firms | | (Germany) | KPMG Firms | |
Audit fees | 3 | 7 | 10 | 3 | 6 | 9 | 3 | 7 | 10 |
Audit-related fees | 0 | 1 | 1 | 0 | 0 | 0 | 0 | 0 | 0 |
Tax fees | 0 | 0 | 0 | 0 | 0 | 0 | 0 | 0 | 0 |
All other fees | 0 | 0 | 0 | 0 | 0 | 0 | 0 | 0 | 0 |
Total | 3 | 8 | 10 | 3 | 6 | 9 | 3 | 7 | 10 |
Audit fees are the aggregate fees charged by KPMG for auditing our consolidated financial statements and the statutory financial statements of SAP SE and its subsidiaries. Audit-related fees are fees charged by KPMG for assurance and related services that are reasonably related to the performance of the audit as well as fees charged by KPMG for service organization attestation procedures.
(G.8) Events After the Reporting Period
At the beginning of 2020, SAP modified its organizational structure to strengthen the focus on customer success and employee engagement while driving innovation and simplicity. The set-up moving forward aims at raising synergies, reducing complexity while initiating key steps towards further integration. The organizational changes will also affect SAP’s segment reporting. SAP has already started the process of redefining its management reporting under the new organizational structure, which the segment reporting will follow.
Other than that, no events have occurred since December 31, 2019, that have a material impact on the Company’s Consolidated Financial Statements.
(G.9) Scope of Consolidation, Subsidiaries and Other Equity Investments
Entities Consolidated in the Financial Statements
| Total |
12/31/2017 | 227 |
Additions | 59 |
Disposals | –21 |
12/31/2018 | 265 |
Additions | 20 |
Disposals | –21 |
12/31/2019 | 264 |
The additions relate to legal entities added in connection with acquisitions and foundations. The disposals are mainly due to mergers and liquidations of legal entities.
202 | Section G – Other Disclosures |
To Our | Combined Group | Consolidated Financial | Further Information on Economic, | Additional |
Stakeholders | Management Report | Statements IFRS | Environmental, and Social Performance | Information |
Subsidiaries
Major Subsidiaries
Name and Location of Company | Ownership | Total Revenue | Profit/Loss (–) | Total Equity as | Number of | Foot note |
| | in 20191) | After Tax | at 12/31/20191) | Employees as at | |
| | | for 20191) | | 12/31/20192) | |
| % | € thousands | € thousands | € thousands | | |
Ariba, Inc., Palo Alto, CA, United States | 100.0 | 1,304,139 | 332,200 | 4,376,579 | 1,928 | |
Concur Technologies, Inc., Bellevue, WA, United States | 100.0 | 1,804,158 | 258,770 | 7,680,075 | 3,788 | |
LLC SAP CIS, Moscow, Russia | 100.0 | 482,524 | –21,171 | 47,192 | 822 | |
Qualtrics, LLC, Wilmington, DE, United States | 100.0 | 418,420 | –535,867 | 6,124,414 | 2,112 | 4) |
SAP (Schweiz) AG, Biel, Switzerland | 100.0 | 924,676 | 99,481 | 145,085 | 769 | |
SAP (UK) Limited, Feltham, United Kingdom | 100.0 | 1,246,454 | 41,886 | 10,166 | 1,762 | 10) |
SAP America, Inc., Newtown Square, PA, United States | 100.0 | 6,152,418 | –781,584 | 19,587,457 | 8,162 | |
SAP Argentina S.A., Buenos Aires, Argentina | 100.0 | 158,007 | –34,937 | 16,846 | 918 | 16) |
SAP Asia Pte Ltd, Singapore, Singapore | 100.0 | 515,034 | –32,511 | –14,925 | 1,178 | 16) |
SAP Australia Pty Ltd, Sydney, Australia | 100.0 | 738,223 | –11,496 | 28,411 | 1,274 | |
SAP Brasil Ltda, São Paulo, Brazil | 100.0 | 556,269 | –35,373 | –216 | 2,029 | |
SAP Canada Inc., Toronto, Canada | 100.0 | 965,891 | 38,905 | 507,722 | 2,946 | |
SAP China Co., Ltd., Shanghai, China | 100.0 | 1,019,778 | –4,633 | –196,735 | 5,619 | 16) |
SAP Deutschland SE & Co. KG, Walldorf, Germany | 100.0 | 4,538,364 | 750,926 | 1,614,340 | 4,763 | 7), 9) |
SAP España – Sistemas, Aplicaciones y Productos en la Informática, S.A., Madrid, Spain | 100.0 | 542,651 | 34,834 | 271,147 | 724 | |
SAP France, Levallois Perret, France | 100.0 | 1,151,489 | 124,438 | 1,588,563 | 1,503 | |
SAP Hungary Rendszerek, Alkalmazások és Termékek az Adatfeldolgozásban Informatikai Kft., Budapest, Hungary | 100.0 | 124,890 | –572 | 19,270 | 952 | |
SAP India Private Limited, Bangalore, India | 100.0 | 637,052 | 71,940 | 382,053 | 2,045 | |
SAP Industries, Inc., Newtown Square, PA, United States | 100.0 | 679,636 | 174,268 | 879,257 | 323 | |
SAP Italia Sistemi Applicazioni Prodotti in Data Processing S.p.A., Vimercate, Italy | 100.0 | 582,698 | 29,934 | 336,995 | 720 | |
SAP Japan Co., Ltd., Tokyo, Japan | 100.0 | 1,167,363 | 108,649 | 290,021 | 1,291 | |
SAP Labs India Private Limited, Bangalore, India | 100.0 | 577,030 | 43,225 | 173,224 | 8,466 | |
SAP Labs, LLC, Palo Alto, CA, United States | 100.0 | 649,577 | –61,161 | 426,810 | 1,803 | |
SAP México S.A. de C.V., Mexico City, Mexico | 100.0 | 427,159 | 19,211 | 37,109 | 886 | |
SAP National Security Services, Inc., Newtown Square, PA, United States | 100.0 | 699,688 | 169,664 | 496,277 | 475 | |
SAP Nederland B.V., ’s-Hertogenbosch, the Netherlands | 100.0 | 670,660 | 356,717 | 195,122 | 589 | 11) |
SAP Service and Support Centre (Ireland) Limited, Dublin, Ireland | 100.0 | 201,427 | 16,186 | 81,315 | 1,615 | |
SuccessFactors, Inc., South San Francisco, CA, United States | 100.0 | 881,532 | 510,682 | 4,182,900 | 941 | |
Section G – Other Disclosures | 203 |
To Our | Combined Group | Consolidated Financial | Further Information on Economic, | Additional |
Stakeholders | Management Report | Statements IFRS | Environmental, and Social Performance | Information |
Other Subsidiaries3)
Name and Location of Company | Ownership | Footnote |
| % | |
“SAP Kazakhstan” LLP, Almaty, Kazakhstan | 100.0 | |
110405, Inc., Newtown Square, PA, United States | 100.0 | |
Abakus Ukraine Limited Liability Company, Kiev, Ukraine | 100.0 | |
Ambin Properties Proprietary Limited, Johannesburg, South Africa | 100.0 | |
Apex Expert Solutions LLC, Arlington, VA, United States | 100.0 | |
Ariba Czech s.r.o., Prague, Czech Republic | 100.0 | |
Ariba India Private Limited, Gurgaon, India | 100.0 | |
Ariba International Holdings, Inc., Wilmington, DE, United States | 100.0 | |
Ariba International Singapore Pte Ltd, Singapore, Singapore | 100.0 | |
Ariba International, Inc., Wilmington, DE, United States | 100.0 | |
Ariba Slovak Republic, s.r.o., Košice, Slovakia | 100.0 | |
Ariba Software Technology Services (Shanghai) Co., Ltd., Shanghai, China | 100.0 | |
Ariba Technologies India Private Limited, Bangalore, India | 100.0 | |
Ariba Technologies Netherlands B.V., ’s-Hertogenbosch, the Netherlands | 100.0 | 11) |
Beijing Zhang Zhong Hu Dong Information Technology Co., Ltd., Beijing, China | 0 | 5) |
Business Objects Holding B.V., ’s-Hertogenbosch, the Netherlands | 100.0 | 11) |
Business Objects Option LLC, Wilmington, DE, United States | 100.0 | |
Business Objects Software Limited, Dublin, Ireland | 100.0 | |
Callidus Software Inc., Dublin, CA, United States | 100.0 | |
Callidus Software Ltd., London, United Kingdom | 100.0 | 10) |
Callidus Software Pty. Ltd., Sydney, Australia | 100.0 | |
CallidusCloud (India) Pvt. Ltd., Hyderabad, India | 100.0 | |
CallidusCloud (Malaysia) Sdn. Bhd., Kuala Lumpur, Malaysia | 100.0 | |
CallidusCloud Holdings Pty. Ltd., Sydney, Australia | 100.0 | |
CallidusCloud Pty. Ltd., Sydney, Australia | 100.0 | |
Christie Partners Holding C.V., ’s-Hertogenbosch, the Netherlands | 100.0 | |
C-Learning Pty. Ltd., Sydney, Australia | 100.0 | |
ClearTrip Inc. (Mauritius), Ebene, Mauritius | 100.0 | |
ClearTrip Inc., George Town, Cayman Islands | 57.0 | |
Cleartrip MEA FZ LLC, Dubai, United Arab Emirates | 100.0 | |
Cleartrip Packages and Tours Private Limited, Mumbai, India | 100.0 | |
ClearTrip Private Limited, Mumbai, India | 100.0 | |
Cleartrip Travel & Holidays LLC, Dubai, United Arab Emirates | 49.0 | 4), 5) |
Clicktools Limited, Dorset, United Kingdom | 100.0 | 10) |
CNQR Operations Mexico S. de. R.L. de. C.V., San Pedro Garza Garcia, Mexico | 100.0 | |
Concur (Canada), Inc., Toronto, Canada | 100.0 | |
Concur (France) SAS, Paris, France | 100.0 | |
Concur (Germany) GmbH, Frankfurt am Main, Germany | 100.0 | 8), 9) |
Concur (Japan) Ltd., Tokyo, Japan | 73.6 | |
Concur (New Zealand) Limited, Wellington, New Zealand | 100.0 | 14) |
Concur (Philippines) Inc., Makati City, Philippines | 100.0 | |
Concur (Switzerland) GmbH, Zurich, Switzerland | 100.0 | 13) |
Concur Czech (s.r.o.), Prague, Czech Republic | 100.0 | |
Concur Holdings (France) SAS, Paris, France | 100.0 | |
Concur Holdings (Netherlands) B.V., Amsterdam, the Netherlands | 100.0 | 11) |
Concur Technologies (Australia) Pty. Limited, Sydney, Australia | 100.0 | |
Concur Technologies (Hong Kong) Limited, Hong Kong, China | 100.0 | |
Concur Technologies (India) Private Limited, Bangalore, India | 100.0 | |
Concur Technologies (Singapore) Pte Ltd, Singapore, Singapore | 100.0 | 16) |
Concur Technologies (UK) Limited, London, United Kingdom | 100.0 | 10) |
ConTgo Consulting Limited, London, United Kingdom | 100.0 | 10) |
ConTgo Limited, London, United Kingdom | 100.0 | 10) |
ConTgo Pty. Ltd., Sydney, Australia | 100.0 | |
Crystal Decisions (Ireland) Limited, Dublin, Ireland | 100.0 | 12) |
Crystal Decisions Holdings Limited, Dublin, Ireland | 100.0 | 12) |
Crystal Decisions UK Limited, London, United Kingdom | 100.0 | 10) |
Datahug Limited, Dublin, Ireland | 100.0 | |
Delighted, LLC, Wilmington, DE, United States | 100.0 | 4) |
Dorset Acquisition Corp., Dublin, CA, United States | 100.0 | |
Ebreez Egypt LLC, Cairo, Egypt | 100.0 | |
204 | Section G – Other Disclosures |
To Our | Combined Group | Consolidated Financial | Further Information on Economic, | Additional |
Stakeholders | Management Report | Statements IFRS | Environmental, and Social Performance | Information |
Name and Location of Company | Ownership | Footnote |
| % | |
EssCubed Procurement Pty. Ltd., Johannesburg, South Africa | 100.0 | |
Extended Systems, Inc., San Ramon, CA, United States | 100.0 | |
Fieldglass Europe Limited, London, United Kingdom | 100.0 | 10) |
Financial Fusion, Inc., San Ramon, CA, United States | 100.0 | |
Flyin Holding Limited, Dubai, United Arab Emirates | 100.0 | |
Flyin Travel and Tourism Private Limited, Hyderabad, India | 100.0 | |
Flyin Travel Limited, Limassol, Cyprus | 100.0 | |
Flyin Travel S.A.E, Cairo, Egypt | 100.0 | |
FreeMarkets Ltda., São Paulo, Brazil | 100.0 | |
Gigya UK Ltd, London, United Kingdom | 100.0 | 10), 16) |
GlobalExpense Limited, London, United Kingdom | 100.0 | 10) |
Hipmunk, Inc., San Francisco, CA, United States | 100.0 | |
hybris (US) Corp., Wilmington, DE, United States | 100.0 | |
hybris GmbH, Munich, Germany | 100.0 | 8), 9) |
Inxight Federal Systems Group, Inc., Wilmington, DE, United States | 100.0 | |
IP Asset Holdings, LLC, Provo, UT, United States | 100.0 | 4) |
LeadFormix, Inc., Dublin, CA, United States | 100.0 | |
Learning Heroes Ltd., Cheshire, United Kingdom | 100.0 | 10) |
Learning Seat Borrowings Pty. Ltd., Sydney, Australia | 100.0 | |
Learning Seat Group Pty. Ltd., Sydney, Australia | 100.0 | |
Learning Seat Holdings Pty. Ltd., Sydney, Australia | 100.0 | |
Learning Seat Pty. Ltd., Sydney, Australia | 100.0 | |
LLC “SAP Labs”, Moscow, Russia | 100.0 | |
LLC “SAP Ukraine”, Kiev, Ukraine | 100.0 | 16) |
Merlin Systems Oy, Espoo, Finland | 100.0 | |
Nihon Ariba K.K., Tokyo, Japan | 100.0 | |
Noteshark, LLC, Chantilly, VA, United States | 51.0 | |
OrientDB Limited, London, United Kingdom | 100.0 | 10) |
Outerjoin, Inc., Dublin, CA, United States | 100.0 | |
OutlookSoft Deutschland GmbH, Walldorf, Germany | 100.0 | 8), 9) |
Plat.One Inc., Palo Alto, CA, United States | 100.0 | |
Plat.One Lab Srl, Bogliasco, Italy | 100.0 | |
PT SAP Indonesia, Jakarta, Indonesia | 99.0 | |
Q (AGF2) Inc., Wilmington, DE, United States | 100.0 | 4) |
QAL Technologies Pty Ltd, Sydney, Australia | 100.0 | 4) |
QCL Techonologies Ltd., Toronto, Canada | 100.0 | 4) |
QDL Technologies GmbH, Munich, Germany | 100.0 | 4) |
QFL Technologies Sarl, Paris, France | 100.0 | 4) |
QIL Technologies Limited, Dublin, Ireland | 100.0 | 4) |
QPL Technologies sp. z o.o., Kraków, Poland | 100.0 | 4) |
QSL Technologies Pte. Ltd., Singapore, Singapore | 100.0 | 4) |
Quadrem Africa Pty. Ltd., Johannesburg, South Africa | 100.0 | |
Quadrem Brazil Ltda., Rio de Janeiro, Brazil | 100.0 | |
Quadrem Chile Ltda., Santiago de Chile, Chile | 100.0 | |
Quadrem International Ltd., Hamilton, Bermuda | 100.0 | |
Quadrem Netherlands B.V., Amsterdam, the Netherlands | 100.0 | 11) |
Quadrem Overseas Cooperatief U.A., Amsterdam, the Netherlands | 100.0 | 11) |
Quadrem Peru S.A.C., Lima, Peru | 100.0 | |
Qualtrics International Inc., Wilmington, DE, United States | 100.0 | 4) |
Qualtrics Japan LLC, Tokyo, Japan | 100.0 | 4) |
Qualtrics Sweden AB, Stockholm, Sweden | 100.0 | 4) |
Qualtrics Technologies Spain, S.L.U., Madrid, Spain | 100.0 | 4) |
QUL Technologies Limited, London, United Kingdom | 100.0 | 4), 10) |
SAP (Beijing) Software System Co., Ltd., Beijing, China | 100.0 | |
SAP Andina y del Caribe C.A., Caracas, Venezuela | 100.0 | 16) |
SAP AZ LLC, Baku, Azerbaijan | 100.0 | |
SAP Belgium – Systems, Applications and Products SA, Brussels, Belgium | 100.0 | |
SAP Beteiligungs GmbH, Walldorf, Germany | 100.0 | |
SAP Bulgaria EOOD, Sofia, Bulgaria | 100.0 | |
SAP Business Services Center Nederland B.V., ’s- Hertogenbosch, the Netherlands | 100.0 | 11) |
SAP Chile Limitada, Santiago, Chile | 100.0 | 16) |
SAP China Holding Co., Ltd., Beijing, China | 100.0 | |
SAP Colombia S.A.S., Bogotá, Colombia | 100.0 | 16) |
SAP Commercial Services Ltd., Valletta, Malta | 100.0 | |
SAP Costa Rica, S.A., San José, Costa Rica | 100.0 | 16) |
SAP ČR, spol. s r.o., Prague, Czech Republic | 100.0 | |
Section G – Other Disclosures | 205 |
To Our | Combined Group | Consolidated Financial | Further Information on Economic, | Additional |
Stakeholders | Management Report | Statements IFRS | Environmental, and Social Performance | Information |
Name and Location of Company | Ownership | Footnote |
| % | |
SAP Cyprus Limited, Nicosia, Cyprus | 100.0 | |
SAP d.o.o., Zagreb, Croatia | 100.0 | |
SAP Danmark A/S, Copenhagen, Denmark | 100.0 | |
SAP Dritte Beteiligungs- und Vermögensverwaltungs GmbH, Walldorf, Germany | 100.0 | |
SAP East Africa Limited, Nairobi, Kenya | 100.0 | 16) |
SAP Egypt LLC, Cairo, Egypt | 100.0 | 16) |
SAP EMEA Inside Sales S.L., Madrid, Spain | 100.0 | |
SAP Erste Beteiligungs- und Vermögensverwaltungs GmbH, Walldorf, Germany | 100.0 | 8), 9) |
SAP Estonia OÜ, Tallinn, Estonia | 100.0 | |
SAP Financial, Inc., Toronto, Canada | 100.0 | |
SAP Finland Oy, Espoo, Finland | 100.0 | |
SAP Foreign Holdings GmbH, Walldorf, Germany | 100.0 | |
SAP France Holding, Levallois Perret, France | 100.0 | |
SAP Global Marketing, Inc., New York, NY, United States | 100.0 | |
SAP Hellas S.A., Athens, Greece | 100.0 | |
SAP Hong Kong Co., Ltd., Hong Kong, China | 100.0 | 16) |
SAP Hosting Beteiligungs GmbH, St. Leon-Rot, Germany | 100.0 | 8), 9) |
SAP India (Holding) Pte Ltd, Singapore, Singapore | 100.0 | |
SAP International Panama, S.A., Panama City, Panama | 100.0 | |
SAP International, Inc., Miami, FL, United States | 100.0 | |
SAP Investments, Inc., Wilmington, DE, United States | 100.0 | |
SAP Ireland Limited, Dublin, Ireland | 100.0 | 12) |
SAP Ireland US - Financial Services Designated Activity Company, Dublin, Ireland | 100.0 | |
SAP Israel Ltd., Ra’anana, Israel | 100.0 | 16) |
SAP Korea Ltd., Seoul, South Korea | 100.0 | |
SAP Labs Bulgaria EOOD, Sofia, Bulgaria | 100.0 | |
SAP Labs Finland Oy, Espoo, Finland | 100.0 | |
SAP Labs France SAS, Mougins, France | 100.0 | |
SAP Labs Israel Ltd., Ra’anana, Israel | 100.0 | |
SAP Labs Korea, Inc., Seoul, South Korea | 100.0 | |
SAP Latvia SIA, Riga, Latvia | 100.0 | |
SAP Malaysia Sdn. Bhd., Kuala Lumpur, Malaysia | 100.0 | |
SAP Malta Investments Ltd., Valletta, Malta | 100.0 | |
SAP MENA FZ L.L.C., Dubai, United Arab Emirates | 100.0 | |
SAP Middle East and North Africa L.L.C., Dubai, United Arab Emirates | 49.0 | 5), 16) |
SAP Nederland Holding B.V., ‘s-Hertogenbosch, the Netherlands | 100.0 | 11) |
SAP New Zealand Limited, Auckland, New Zealand | 100.0 | |
SAP Norge AS, Lysaker, Norway | 100.0 | |
SAP North West Africa Ltd, Casablanca, Morocco | 100.0 | 16) |
SAP Österreich GmbH, Vienna, Austria | 100.0 | |
SAP Perú S.A.C., Lima, Peru | 100.0 | 16) |
SAP Philippines, Inc., Makati, Philippines | 100.0 | 16) |
SAP Polska Sp. z o.o., Warsaw, Poland | 100.0 | |
SAP Portals Europe GmbH, Walldorf, Germany | 100.0 | |
SAP Portals Holding Beteiligungs GmbH, Walldorf, Germany | 100.0 | |
SAP Portals Israel Ltd., Ra’anana, Israel | 100.0 | |
SAP Portugal – Sistemas, Aplicações e Produtos Informáticos, Sociedade Unipessoal, Lda., Porto Salvo, Portugal | 100.0 | |
SAP Projektverwaltungs- und Beteiligungs GmbH, Walldorf, Germany | 100.0 | |
SAP Public Services, Inc., Washington, DC, United States | 100.0 | |
SAP Puerto Rico GmbH, Walldorf, Germany | 100.0 | 8), 9), 16) |
SAP Retail Solutions Beteiligungsgesellschaft mbH, Walldorf, Germany | 100.0 | |
SAP Romania SRL, Bucharest, Romania | 100.0 | |
SAP Saudi Arabia Software Services Ltd, Riyadh, Kingdom of Saudi Arabia | 100.0 | |
SAP Saudi Arabia Software Trading Ltd, Riyadh, Kingdom of Saudi Arabia | 75.0 | |
SAP Sechste Beteiligungs- und Vermögensverwaltungs GmbH, Walldorf, Germany | 100.0 | 8), 9) |
SAP Services s.r.o., Prague, Czech Republic | 100.0 | |
SAP Siebte Beteiligungs- und Vermögensverwaltungs GmbH, Walldorf, Germany | 100.0 | 8), 9) |
SAP sistemi, aplikacije in produkti za obdelavo podatkov d.o.o., Ljubljana, Slovenia | 100.0 | |
SAP Slovensko s.r.o., Bratislava, Slovakia | 100.0 | |
SAP Software and Services LLC, Doha, Qatar | 49.0 | 5), 16) |
SAP Svenska Aktiebolag, Stockholm, Sweden | 100.0 | |
SAP System Application and Products Asia Myanmar Limited, Yangon, Myanmar | 100.0 | |
SAP Systems, Applications and Products in Data Processing (Thailand) Ltd., Bangkok, Thailand | 100.0 | |
206 | Section G – Other Disclosures |
To Our | Combined Group | Consolidated Financial | Further Information on Economic, | Additional |
Stakeholders | Management Report | Statements IFRS | Environmental, and Social Performance | Information |
Name and Location of Company | Ownership | Footnote |
| % | |
SAP Taiwan Co., Ltd., Taipei, Taiwan | 100.0 | |
SAP Technologies Inc., Palo Alto, CA, United States | 100.0 | |
SAP Training and Development Institute FZCO, Dubai, United Arab Emirates | 100.0 | |
SAP Türkiye Yazilim Üretim ve Ticaret A.Ş., Istanbul, Turkey | 100.0 | |
SAP UAB, Vilnius, Lithuania | 100.0 | |
SAP Ventures Investment GmbH, Walldorf, Germany | 100.0 | 8), 9) |
SAP Vierte Beteiligungs- und Vermögensverwaltungs GmbH, Walldorf, Germany | 100.0 | |
SAP Vietnam Company Limited, Ho Chi Minh City, Vietnam | 100.0 | |
SAP West Balkans d.o.o., Belgrade, Serbia | 100.0 | |
SAP Zweite Beteiligungs- und Vermögensverwaltungs GmbH, Walldorf, Germany | 100.0 | 8), 9) |
SAP.io Fund, L.P., San Francisco, CA, United States | 0 | 6) |
Sapphire Fund Investments II Holdings, LLC, Palo Alto, CA, United States | 100.0 | 6) |
Sapphire Fund Investments II, L.P., Palo Alto, CA, United States | 0 | 6) |
Sapphire Fund Investments III, L.P., Palo Alto, CA, United States | 0 | 6) |
Sapphire SAP HANA Fund of Funds, L.P., Palo Alto, CA, United States | 0 | 6) |
Sapphire Ventures Fund I, L.P., Palo Alto, CA, United States | 0 | 6) |
Sapphire Ventures Fund II, L.P., Palo Alto, CA, United States | 0 | 6) |
Sapphire Ventures Fund III, L.P., Palo Alto, CA, United States | 0 | 6) |
Sapphire Ventures Fund IV, L.P., Palo Alto, CA, United States | 0 | 6) |
SAPV (Mauritius), Ebene, Mauritius | 100.0 | 6) |
Saudi Ebreez Company for Electronic Services LLC, Riyadh, Kingdom of Saudi Arabia | 100.0 | |
Statwing, LLC, Wilmington, DE, United States | 100.0 | 4) |
SuccessFactors (Philippines), Inc., Pasig City, Philippines | 100.0 | 16) |
SuccessFactors Cayman, Ltd., Grand Cayman, Cayman Islands | 100.0 | |
Sybase 365 Ltd., Tortola, British Virgin Islands | 100.0 | |
Sybase 365, LLC, San Ramon, CA, United States | 100.0 | |
Sybase Angola, LDA, Luanda, Angola | 100.0 | 15), 16) |
Sybase Iberia S.L., Madrid, Spain | 100.0 | |
Sybase India Ltd., Mumbai, India | 100.0 | |
Sybase International Holdings Corporation, LLC, San Ramon, CA, United States | 100.0 | |
Sybase Philippines, Inc., Makati City, Philippines | 100.0 | |
Sybase Software (India) Private Ltd., Mumbai, India | 100.0 | |
Sybase, Inc., San Ramon, CA, United States | 100.0 | |
Systems Applications Products (Africa Region) Proprietary Limited, Johannesburg, South Africa | 100.0 | |
Systems Applications Products (Africa) Proprietary Limited, Johannesburg, South Africa | 100.0 | |
Systems Applications Products (South Africa) Proprietary Limited, Johannesburg, South Africa | 70.0 | 16) |
Systems Applications Products Nigeria Limited, Victoria Island, Nigeria | 100.0 | 16) |
Technology Management Associates Inc., Herndon, VA, United States | 100.0 | |
Temkin Group, LLC, Wilmington, DE, United States | 100.0 | 4) |
TM Property Holdings, LLC, Wilmington, DE, United States | 100.0 | 4) |
TomorrowNow, Inc., Bryan, TX, United States | 100.0 | |
TRX Europe Limited, London, United Kingdom | 100.0 | 10) |
TRX Technologies India Private Limited, Raman Nagar, India | 100.0 | |
TRX UK Limited, London, United Kingdom | 100.0 | 10) |
TRX, Inc., Bellevue, WA, United States | 100.0 | |
Volume Integration, Inc., VA, United States | 100.0 | |
Webcom, Inc., Dublin, CA, United States | 100.0 | |
1) These figures are based on our local IFRS financial statements prior to eliminations resulting from consolidation and therefore do not reflect the contribution of these companies included in the Consolidated Financial Statements. The translation of the equity into Group currency is based on period-end closing exchange rates, and on average exchange rates for revenue and net income/loss.
2) As at December 31, 2019, including managing directors, in FTE.
3) Figures for profit/loss after tax and total equity pursuant to HGB, section 285 and section 313 are not disclosed if they are of minor significance for a fair presentation of the profitability, liquidity, capital resources, and financial position of SAP SE, pursuant to HGB, section 313 (2) sentence 3 no. 4 and section 286 (3) sentence 1 no. 1.
4) Consolidated for the first time in 2019.
5) Agreements with the other shareholders provide that SAP SE fully controls the entity.
6) SAP SE has the following structured entities: SAP.io Fund, L.P., Sapphire Fund Investments II Holdings, LLC, Sapphire Fund Investments II, L.P., Sapphire Fund Investments III, L.P., Sapphire SAP HANA Fund of Funds, L.P., Sapphire Ventures Fund I, L.P., Sapphire Ventures Fund II, L.P., Sapphire Ventures Fund III, L.P, Sapphire Ventures Fund IV, L.P., SAPV (Mauritius). The results of operations of these entities are included in SAP’s consolidated financial statements in accordance with IFRS 10 (Consolidated Financial Statements).
7) Entity whose personally liable partner is SAP SE.
8) Entity with (profit and) loss transfer agreement.
9) Pursuant to HGB, section 264 (3) or section 264b, the subsidiary is exempt from applying certain legal requirements to their statutory stand-alone financial statements including the requirement to prepare notes to the financial
Section G – Other Disclosures | 207 |
To Our | Combined Group | Consolidated Financial | Further Information on Economic, | Additional |
Stakeholders | Management Report | Statements IFRS | Environmental, and Social Performance | Information |
statements and a review of operations, the requirement of independent audit, and the requirement of public disclosure.
10) Pursuant to sections 479A to 479C of the UK Companies Act 2006, the entity is exempt from having its financial statements audited on the basis that SAP SE has provided a guarantee of the entity’s liabilities in respect of its financial year ended December 31, 2019, or in respect of its financial year ended September 30, 2019, respectively.
11) Pursuant to article 2:403 of the Dutch Civil Code, the entity is exempt from applying certain legal requirements to their statutory stand-alone financial statements including the requirement to prepare the financial statements, the requirement of independent audit, and the requirement of public disclosure, on the basis that SAP SE has provided a guarantee of the entity’s liabilities in respect of its financial year ended December 31, 2019, or in respect of its financial year ended September 30, 2019, respectively.
12) Pursuant to Irish Companies Act 2014, chapter 16 of Part 6, section 365, the entity is exempt from having its financial statements audited on the grounds that the entity is entitled to the benefits from a dormant entity exemption in respect of its financial year ended December 31, 2019.
13) Pursuant to article 727a, paragraph 2 of the Swiss Code of Obligations, the entity is exempt from having its financial statements audited in respect of its financial year ended December 31, 2019, or in respect of its financial year ended September 30, 2019, respectively.
14) Pursuant to section 211 (3) of the New Zealand Companies Act 1993 and section 45 (2) of the Financial Reporting Act 2013, the entity had approved exclusions and is not required to lodge audited financial statements in respect of its financial year ended September 30, 2019.
15) Pursuant to Angola Tax Law and Presidential Decree no. 147/13 of October 1, 2013, the entity does not qualify as being a Large Taxpayer and therefore is exempt from having its financial statements audited in respect of its financial year ended December 31, 2019.
16) Entity with support letter issued by SAP SE.
Other Equity Investments
Name and Location of Company | Ownership |
| % |
Joint Arrangements and Investments in Associates | |
China DataCom Corporation Limited, Guangzhou, China | 28.30 |
Convercent, Inc., Denver, CO, United States | 37.12 |
Procurement Negócios Eletrônicos S/A, Rio de Janeiro, Brazil | 17.00 |
Visage Mobile, Inc., Milwaukee, WI, United States | 4.50 |
Name and Location of Company |
Equity Investments with Ownership of at Least 5% |
83North IV, L.P., Hertzalia, Israel |
Alation, Inc., Redwood City, CA, United States |
Alchemist Accelerator Fund I LLC, San Francisco, CA, United States |
All Tax Platform - Solucoes Tributarias S.A., São Paulo, Brazil |
Amplify Partners II L.P., Menlo Park, CA, United States |
Amplify Partners III, L.P., Menlo Park, CA, United States |
Amplify Partners, L.P., Menlo Park, CA, United States |
AP Opportunity Fund, LLC, Menlo Park, CA, United States |
Auth0, Inc., Bellevue, WA, United States |
Blue Yard Capital I GmbH & Co. KG, Berlin, Germany |
Brightfield Holdings, Inc., New York, NY, United States |
BY Capital 2 GmbH & Co. KG, Berlin, Germany |
Catchpoint Systems, Inc., New York, NY, United States |
Char Software, Inc., Boston, MA, United States |
Clari, Inc., Sunnyvale, CA, United States |
Contentful GmbH, Berlin, Germany |
Costanoa Venture Capital II L.P., Palo Alto, CA, United States |
Costanoa Venture Capital III L.P., Palo Alto, CA, United States |
Costanoa Venture Capital QZ, LLC, Palo Alto, CA, United States |
Culture Amp, Inc., San Francisco, CA, United States |
Data Collective II L.P., San Francisco, CA, United States |
Data Collective III L.P., San Francisco, CA, United States |
Data Collective IV, L.P., San Francisco, CA, United States |
DataRobot, Inc., Boston, MA, United States |
Dharma Platform, Inc., Washington DC, United States |
Digital Hub Rhein-Neckar GmbH, Ludwigshafen, Germany |
EIT ICT Labs Germany GmbH, Berlin, Germany |
FeedZai S.A., Lisbon, Portugal |
Felix Capital Fund III, L.P., London, United Kingdom |
Follow Analytics, Inc., San Francisco, CA, United States |
Greater Pacific Capital (Cayman) L.P., Grand Cayman, Cayman Islands |
Haystack Ventures V, L.P., Mill Valley, CA, United States |
IDG Ventures USA III, L.P., San Francisco, CA, United States |
IEX Group, Inc., New York, NY, United States |
InfluxData, Inc., San Francisco, CA, United States |
InnovationLab GmbH, Heidelberg, Germany |
innoWerft Technologie- und Gründerzentrum Walldorf Stiftung GmbH, Walldorf, Germany |
JFrog, Ltd., Netanya, Israel |
Kaltura, Inc., New York, NY, United States |
Kavacha TopCo LLC, New York, NY, United States |
Landlog Limited, Tokyo, Japan |
LeanData, Inc., Sunnyvale, CA, United States |
Local Globe VII, L.P., St. Peter Port, Guernsey, Channel Islands |
Local Globe VIII, L.P., St. Peter Port, Guernsey, Channel Islands |
Localglobe X Limited, Guernsey, Channel Islands |
Mango Capital 2018, L.P., Los Altos, CA, United States |
Matillion Ltd., Altrincham, United Kingdom |
Mosaic Ventures I, L.P., London, United Kingdom |
MVP Strategic Partnership Fund GmbH & Co. KG, Munich, Germany |
Narrative Science, Inc., Chicago, IL, United States |
Nor1, Inc., Santa Clara, CA, United States |
Notation Capital II, L.P., Brooklyn, NY, United States |
Notation Capital, L.P., Brooklyn, NY, United States |
OpenX Software Limited, Pasadena, CA, United States |
208 | Section G – Other Disclosures |
To Our | Combined Group | Consolidated Financial | Further Information on Economic, | Additional |
Stakeholders | Management Report | Statements IFRS | Environmental, and Social Performance | Information |
Name and Location of Company |
OpsRamp, Inc., San Jose, CA, United States |
Outreach Corporation, Seattle, WA, United States |
Pendo.io, Inc., Raleigh, NC, United States |
Pheonix Labs Canada, ULC, Burnaby, BC, Canada |
PivotNorth Early Fund I, L.P., Atherton, CA, United States |
Point Nine Annex GmbH & Co. KG, Berlin, Germany |
Point Nine Capital Fund II GmbH & Co. KG, Berlin, Germany |
Point Nine Capital Fund III GmbH & Co. KG, Berlin, Germany |
Point Nine Capital Fund IV GmbH & Co. KG, Berlin, Germany |
Portworx Inc., Los Altos, CA, United States |
Project 44, Inc., Chicago, IL, United States |
PubNub, Inc., San Francisco, CA, United States |
Punchh, Inc., San Mateo, CA, United States |
Realize Corporation, Tokyo, Japan |
Reltio, Inc., Redwood Shores, CA, United States |
Ridge Ventures IV, L.P., San Francisco, CA, United States |
SASS Labs, Inc., Palo Alto, CA, United States |
Scryer, Inc., New York, NY, United States |
Side, Inc., San Francisco, CA, United States |
Smart City Planning, Inc., Tokyo, Japan |
SportsTech Fund, L.P., Palo Alto, CA, United States |
SportsTech Parallel Fund, L.P., Palo Alto, CA, United States |
Spring Mobile Solutions, Inc., Reston, VA, United States |
Storm Ventures V, L.P., Menlo Park, CA, United States |
SumoLogic, Inc., Redwood City, CA, United States |
Sun Basket, Inc., San Francisco, CA, United States |
SV Angel IV, L.P., San Francisco, CA, United States |
T3C Inc., San Jose, CA, United States |
The Currency Cloud Group Limited, London, United Kingdom |
The SaaStr Fund, L.P., Palo Alto, CA, United States |
Third Kind Venture Capital II, L.P., New York, NY, United States |
UJET, Inc., San Francisco, CA, United States |
Upfront V, L.P., Santa Monica, CA, United States |
Wandera, Inc., San Francisco, CA, United States |
(G.10) German Code of Corporate Governance
The German federal government published the German Code of Corporate Governance in February 2002 and introduced a commission that amends the Code from time to time. The Code contains statutory requirements and a number of recommendations and suggestions. Only the legal requirements are binding for German companies. With regard to the recommendations, the German Stock Corporation Act, section 161, requires that every year, listed companies publicly state the extent to which they have implemented them. Companies can deviate from the suggestions without having to make any public statements.
In 2019 and 2018, the Executive Board and Supervisory Board of SAP SE issued the required declarations of implementation. The declaration for 2019 was issued at the end of October 2019. These statements are available on our Web site: www.sap.com/corporate/en/investors/governance.
Section G – Other Disclosures | 209 |
To Our | Combined Group | Consolidated Financial | Further Information on Economic, | Additional |
Stakeholders | Management Report | Statements IFRS | Environmental, and Social Performance | Information |
Walldorf, February 18, 2020 | |
SAP SE | |
Walldorf, Baden | |
The Executive Board | |
| |
| |
| |
| |
Christian Klein | Jennifer Morgan |
| |
| |
| |
Adaire Fox-Martin | Michael Kleinemeier |
| |
| |
| |
Luka Mucic | Jürgen Müller |
| |
| |
| |
Stefan Ries | Thomas Saueressig |
Section G – Other Disclosures | 210 |
To Our | Combined Group | Consolidated Financial | Further Information on Economic, | Additional |
Stakeholders | Management Report | Statements IFRS | Environmental, and Social Performance | Information |
Management’s Annual Report on Internal Control over Financial Reporting in the Consolidated Financial Statements
U.S. law requires that management submit a report on the effectiveness of internal control over financial reporting in the consolidated financial statements. For 2019, that report is as follows:
The management of SAP is responsible for establishing and maintaining adequate internal control over financial reporting as such term is defined in Rules 13a–15(f) and 15d–15(f) under the U.S. Securities Exchange Act of 1934. SAP’s internal control over financial reporting is a process designed under the supervision of SAP’s Co-CEOs and CFO to provide reasonable assurance regarding the reliability of financial reporting and the preparation of financial statements for external reporting purposes in accordance with International Financial Reporting Standards as issued by the International Accounting Standards Board.
SAP’s management assessed the effectiveness of the Company’s internal control over financial reporting as at December 31, 2019. In making this assessment, it used the criteria set forth by the Committee of Sponsoring Organizations of the Treadway Commission in Internal Control – Integrated Framework (2013).
Based on the assessment under these criteria, SAP management has concluded that, as at December 31, 2019, the Company’s internal control over financial reporting was effective.
KPMG AG Wirtschaftsprüfungsgesellschaft, our independent registered public accounting firm, has issued its attestation report on the effectiveness of SAP’s internal control over financial reporting. It is included in the independent auditor’s report on the Consolidated Financial Statements as at December 31, 2019.
Management’s Annual Report on Internal Control over Financial Reporting in the Consolidated Financial Statements | 211 |
To Our | Combined Group | Consolidated Financial | Further Information on Economic, | Additional |
Stakeholders | Management Report | Statements IFRS | Environmental, and Social Performance | Information |
Further Information on Economic, Environmental, and Social Performance
About This Further Information on Economic, Environmental, and Social Performance | 213 |
Connectivity of Financial and Non-Financial Indicators | 214 |
Materiality | 221 |
Stakeholder Engagement | 223 |
Sustainability Management and Policies | 224 |
Our Contribution to the UN Sustainable Development Goals | 226 |
Human Rights and Labor Standards | 228 |
Sustainable Procurement | 230 |
Waste and Water | 232 |
Public Policy | 234 |
Memberships | 235 |
Non-Financial Notes: Social Performance | 236 |
Non-Financial Notes: Environmental Performance | 237 |
GRI Index and UN Global Compact Communication on Progress | 242 |
Task Force on Climate-Related Financial Disclosure (TCFD) | 247 |
Management’s Acknowledgement of the SAP Integrated Report 2019 | 248 |
Assurance Report of the Independent Auditor regarding Sustainability Information | 249 |
212 | Further Information on Economic, Environmental, and Social Performance |
To Our | Combined Group | Consolidated Financial | Further Information on Economic, | Additional |
Stakeholders | Management Report | Statements IFRS | Environmental, and Social Performance | Information |
About This Further Information on Economic, Environmental, and Social Performance
The social and environmental data and information included in the SAP Integrated Report has been prepared in accordance with the GRI Standards: Core option. This option indicates that a report contains the minimum information needed to understand the nature of the organization, its material topics and related impacts, and how these are managed.
The Further Information on Economic, Environmental, and Social Performance includes information that is required to comply with the GRI Standards. In addition, we present our Connectivity model that shows the interrelations between social, environmental, and financial performance. We also report on our contribution towards the United Nations Sustainable Development Goals (SDGs).
About This Further Information on Economic, Environmental, and Social Performance | 213 |
To Our | Combined Group | Consolidated Financial | Further Information on Economic, | Additional |
Stakeholders | Management Report | Statements IFRS | Environmental, and Social Performance | Information |
Connectivity of Financial and Non-Financial Indicators
Where We Come From: Putting a Value on Non-Financial Performance Indicators
At SAP, we put a monetary value on how selected non-financial indicators have impacted our operating profit. For example, how well we engage with our employees and inspire them to commit to our purpose and strategy, support a healthy business culture, and succeed in reducing our carbon emissions.
Figure 1: Connectivity Between Social, Environmental, and Economic Performance. SAP’s main KPIs are marked in orange.
To achieve this, we created cause-and-effect chains that show how specific actions we take at SAP lead to shifts in behavior. This behavior impacts on our business and has a financial consequence.
By doing so, we established more than just a correlation between non-financial and financial indicators. It also reveals why and how something such as employee engagement ultimately leads to gains or losses in business performance. We believe that such insights are a prerequisite for fully modeling the financial impact of non-financial performance.
Magnitude of Financial Impact
From 2014 to 2018, SAP used techniques such as linear regression analysis to document the financial impact of four non-financial indicators: Business Health Culture Index, Employee Engagement Index, Employee Retention, and Carbon Emissions. In the past, we assessed each indicator to see what a change of one percentage point (pp) (or 1% for carbon emissions) would mean for our operating profit. The results for 2018, for example, showed that a 1pp change in the Business Health Culture Index affected our operating profit by €90 million to €100 million (non-IFRS).
Having illustrated this impact with concrete numbers, we are now turning our focus to a broader perspective of impact (for example, see Our Contribution to the UN Sustainable Development Goals and The Next Logical Step). We still strongly believe in the fundamental conclusions of the analysis, but do not see a need to continuously update specific monetary values on the well-established connections, since the values have not been subject to any large fluctuations over the years. Instead, they have increased steadily, as expected.
What We Have Achieved: Promoting Sustainability Measures as a Way to Boost Financial Performance
Documenting the financial impact of non-financial indicators has helped us move closer to achieving our sustainability goals. Rather than simply stating the business case for social or environmental change, we also have the numbers to back it up.
Our findings have helped us shift the conversation for managers, investors, employees, and other key stakeholders, and firmly establish non-financial indicators as playing a crucial role in our financial success. As a result, engaging employees or reducing our emissions is no longer seen as a nice-to-have, but rather as essential to carrying out a successful business strategy.
By embedding this approach into our decision-making and quarterly business reviews, our sustainability performance steers our business alongside factors such as revenue and profit. Our goal is for all senior managers and experts at SAP to recognize – and be held accountable for – the fact that improving such measures as employee engagement also boosts financial performance.
Embedding Non-Financial Performance Indicators into Our Solutions
We will continue to share our approach and methodology with our customers to help them win in the marketplace. We believe that companies achieve higher profits – resulting from both greater cost efficiency as well as revenue growth – by addressing economic, social, and environmental considerations in a holistic and integrated manner. More importantly, these companies are better equipped to lead in the future, as they navigate the world’s most pressing challenges and help to bring about long-term sustainable change.
Using the connectivity model, we have been able to embed non-financial KPIs into our solutions, including, for example, SAP Digital Boardroom. This integrated approach to financial and non-financial performance therefore not only helps SAP but also our customers.
214 | Connectivity of Financial and Non-Financial Indicators |
To Our | Combined Group | Consolidated Financial | Further Information on Economic, | Additional |
Stakeholders | Management Report | Statements IFRS | Environmental, and Social Performance | Information |
A New and Broader Focus
So far, our connectivity model has focused primarily on the cause-and-effect chains at SAP. However, we are working to enhance our model to include the social, environmental, and economic impacts of SAP software and services when they are used by our customers. In 2017, we conducted a research project to identify and quantify examples of relevant external (societal) impacts along SAP’s value chain. For example, we estimate that our purchases of goods and services from suppliers generated employment for approximately 120,000 fulltime equivalents (FTEs) in 2017 in these suppliers. Furthermore, total carbon emissions from our supply chain were approximated to cumulated annual societal costs of approximately €160 million in 2017.
The Next Logical Step
Building on our many years of experience in connecting financial and non-financial measures and documenting their impact on corporate steering, we co-founded the “Value Balancing Alliance (VBA)” in June 2019 as the next logical step in our approach.
The VBA was founded by eight international companies: BASF, Bosch, Deutsche Bank, LafargeHolcim, Novartis, Philip Morris International, SAP, and SK. It is supported by Deloitte, EY, KPMG, PwC, the Organisation for Economic Co-operation and Development (OECD), and leading universities, together with stakeholders from governments, civil societies, and standard-setting organizations. Targeting widespread adoption by other companies, VBA will make its work available to the public.
Its objective is to create a standard for measuring and disclosing the environmental, human, social, and financial value that companies provide to society.
Being part of this alliance will allow SAP to work with like-minded companies to create the foundation to transform the way businesses measure and value their overall societal impacts, dependencies along the value chain, and monetary effect on a company’s value. The move is a further step forward in delivering on SAP’s purpose to help the world run better and improve people’s lives.
Details: How Our Non-Financial and Financial Performance Indicators Are Interconnected
Employee Engagement
Employee engagement is the level of employee commitment, pride, and loyalty, as well as the feeling of employees of being advocates for their company.
Capability Building > Employee Engagement
Because it is closely linked to how much a company develops its employees and supports their careers, internal hiring to management and expert positions positively affects employees’ commitment and loyalty. This hypothesis was confirmed by a study by Bedarkar & Pandita (2014), which identified “career opportunities” as the key driver of employee engagement.1)
Social Investment > Employee Engagement
By engaging our employees in social sabbaticals, their creating of significant social impact led to increased employee engagement.
Mueller et al. (2012) have found that employees’ perception of a company’s commitment to corporate social responsibility is positively linked to their own commitment to the organization.2)
Employee Engagement > Profitability
From 2014 to 2018, we used real data from SAP to analyze and proof the financial impact of employee engagement. We showed what a change by 1pp of employee engagement would mean for SAP’s operating profit.
Profitability > Employee Engagement
In our view, a high operating profit, as great business news, can raise employee morale, encourage identification with our purpose, and thus drive employee engagement. On the other hand, we believe that a high profit can also have a negative impact on employee engagement. For example, if cost savings and budget cuts are implemented to reach an ambitious profit target, employees might feel constrained and dissatisfied.
Business Health Culture Index (BHCI) > Employee Engagement
Since 2014, we have been using real data from SAP to analyze and prove the financial impact of the BHCI. We have been able to prove a significant positive correlation between the BHCI and employee engagement. The BHCI positively influences the Leadership Trust Index, which positively influences the Employee Engagement Index; all correlations are significant. This hypothesis was also confirmed by several studies, for example by Johnson, Sheena et al. (2018).3)
Employee Engagement > Employee Retention
From 2014 to 2018, we used real data from SAP to analyze and prove the financial impact of employee engagement. We were able to prove a significant positive correlation between employee engagement and employee retention.
Carbon Emissions > Employee Engagement
We believe that lowering SAP’s carbon emissions can have a positive impact on employee engagement because loyalty should rise as employees see their company act responsibly towards the environment. However, because lowering emissions also brings certain restrictions, such as on business travel, it may also have a negative impact on employee engagement.
Employee Engagement > Carbon Emissions
We believe that engaged employees are more likely to want to help SAP achieve our own target in lowering carbon emissions. Yet another possible outcome is that a higher level of employee engagement may lead to more business activity requiring travel, and therefore could lead to an increase in carbon emissions.
Employee Engagement > Growth
From 2014 to 2018, we used real data from SAP to analyze and prove the financial impact of employee engagement. We were able to prove a significant positive correlation between employee engagement and revenue.
Growth > Employee Engagement
We believe that higher revenue has a positive impact on a company’s work environment, thereby increasing employee pride and loyalty. This is also stated in a study of Harter et al. (2010),
Connectivity of Financial and Non-Financial Indicators | 215 |
To Our | Combined Group | Consolidated Financial | Further Information on Economic, | Additional |
Stakeholders | Management Report | Statements IFRS | Environmental, and Social Performance | Information |
which states that improving financial performance appears to increase general satisfaction and some specific work perceptions.4)
Business Health Culture Index (BHCI)
Our Business Health Culture Index assesses the health of both our organizational culture and our employees.
Women in Management > BHCI
We believe that a balance of men and women in management roles helps create a more balanced working environment, one in which diversity is valued and people feel free to express their individual styles. It is our expectation that such an environment will positively affect our BHCI.
BHCI > Women in Management
McKinsey (2013) found that different elements of the BHCI, such as flexible working hours, the ability to work from home, and career flexibility, can make it easier for employees to balance work and family life.5) This leads us to conclude that the higher our BHCI, the more attractive SAP becomes to women who are also seeking management positions.
BHCI > Profitability
From 2014 to 2018, we used real data from SAP to analyze and prove the financial impact of the BHCI. We showed what a change by 1pp of the BHCI would mean for SAP’s operating profit.
Social Investment > BHCI
We believe that by supporting our employees in engaging in activities with a positive social impact, such as skills-based volunteering, we are enhancing the meaning they find in work. This sense of purpose can help create a richer and more rewarding work environment that reduces stress and promotes satisfaction and well-being. Additionally, volunteering can increase overall employee health, which is shown in a study by S. S. Johnson (2017).6)
BHCI > Employee Engagement
From 2014 to 2018, we used real data from SAP to analyze and prove the financial impact of the BHCI. We were able to prove a significant positive correlation between the BHCI and employee engagement. The BHCI positively influences the Leadership Trust Index, which positively influences the Employee Engagement Index; all correlations are significant. This hypothesis was also confirmed by several studies, for example by Johnson, Sheena et al. (2018).7)
BHCI > Growth
From 2014 to 2018, we used real data from SAP to analyze and prove the financial impact of the BHCI. We were able to prove a significant positive correlation between the BHCI and revenue.
Carbon Emissions > BHCI
Many of SAP’s carbon emissions are caused by business travel and commuting, which we believe can have both negative and positive impacts on employee health. Some people may experience greater stress from more travel because they have less time to spend at home, suffer from jetlag, or lose valuable working time; others may enjoy travel because it enables them to experience other places and cultures as well as meet new people. Studies show that business travel potentially increases stress and poses a threat to employees’ mental and physical health: see, for example, the study by Rundle, Revenson & Friedman (2017).8)
BHCI > Customer Loyalty
From 2014 to 2018, we used real data from SAP to analyze and prove the financial impact of the BHCI. We were able to prove a significant positive correlation between the BHCI and customer loyalty. Recent studies, for example by Reed, Goolsby & Johnston (2016) also suggest this correlation.9)
Employee Retention
Employee retention is the ratio of the average headcount (expressed in full-time equivalents), minus employee-initiated terminations (turnover), divided by the average headcount, taking into account the past 12 months.
Capability Building > Employee Retention
According to the Global Workforce Study (2012), the “chances to advance the career” is the second-most important driver of employee retention.10) By promoting and thus growing from within, SAP creates career opportunities for our employees. In turn, it is our expectation that this opportunity leads to an increase in employee retention.
Employee Engagement > Employee Retention
From 2014 to 2018, we used real data from SAP to analyze and prove the financial impact of employee engagement. We were able to prove a significant positive correlation between employee engagement and employee retention.
Employee Retention > Growth
Meifert (2005) stated a clear relationship between employee retention and a company’s revenue and margin.11)
Employee Retention > Customer Loyalty
Koys (2001) has found evidence that employee turnover has a negative impact on customer satisfaction.12) We believe this effect stems from the fact that experienced employees work more efficiently, have better product knowledge, and can build trusting relationships with colleagues and customers, so therefore have the ability to better serve customers’ needs.
Employee Retention > Profitability
We used real data from SAP to analyze and prove the financial impact of employee retention. We showed what a change by 1pp of employee retention would mean for SAP’s operating profit.
Women in Management
“Women in Management” means the share of women in management positions (managing teams, managing managers, board members) as compared to the total number of managers.
Capability Building > Women in Management
Like many of our IT industry peers, SAP has less women than men in senior positions. Given our significant pool of talent, we assume that internal promotions will increase the percentage of women in management positions.
Women in Management > BHCI
We believe that a balance of men and women in management helps create a more balanced working environment, one in which diversity is valued and people feel free to express their individual styles. It is our expectation that such an environment will positively affect our BHCI.
216 | Connectivity of Financial and Non-Financial Indicators |
To Our | Combined Group | Consolidated Financial | Further Information on Economic, | Additional |
Stakeholders | Management Report | Statements IFRS | Environmental, and Social Performance | Information |
BHCI > Women in Management
McKinsey (2013) found that different elements of the BHCI, such as flexible working hours, the ability to work from home, and career flexibility, can make it easier for employees to balance work and family life.13) This leads us to conclude that the higher our BHCI, the more attractive SAP becomes to women who are also seeking management positions.
Women in Management > Growth
Studies show that companies with a relatively high percentage of women in upper management or as board members achieve stronger financial performance compared to those with a relatively low percentage (Catalyst, 2013).14) We believe that having a higher share of women in management positions will increase our revenue as it helps us better serve our diverse customer base.
Women in Management > Customer Loyalty
Diversity programs – including those focused on the promotion of women to management positions – have a direct and positive impact on customer satisfaction (Catalyst, 2013).15)
Women in Management > Profitability
Studies show that companies with a high level of gender diversity outperform companies with an average level in terms of return on equity (11.4% versus an average 10.3%); operating results (EBIT 11.1% versus 5.8%); and stock price increases (64% versus 47% over the period 2005–2007) (McKinsey, 2007).16) It is therefore likely that having a higher share of women in management positions will result in higher profit for SAP.
Social Investment
Social investment reflects SAP’s activities in volunteering and technology as well as cash donations.
Social Investment > BHCI
We believe that by supporting our employees in engaging in activities with a positive social impact, such as skills-based volunteering, we are enhancing the meaning they find in work. This sense of purpose helps create a richer and more rewarding work environment that reduces stress and promotes satisfaction and well-being. Additionally, volunteering can increase overall employee health, which is shown in a study by S. S. Johnson (2017).17)
Social Investment > Employee Engagement
By engaging our employees in social sabbaticals, their creating of significant social impact led to increased employee engagement.
Mueller et al. (2012) have found that employees’ perception of a company’s commitment to corporate social responsibility is positively linked to their own commitment to the organization.18)
Social Investment > Growth
A study by Muritala (2013) suggests that corporate social responsibility (or what we characterize as social investment) is likely to have a positive impact on an organization’s financial performance.19) In our experience, social investments do, in fact, have a positive impact on our ability to acquire new customers, especially in emerging markets.
Profitability > Social Investment
It is a common practice for companies to invest a certain percentage of their annual profits in programs and activities that create a positive social impact. We believe that higher profit is therefore likely to lead SAP to make greater social investments.
Capability Building
Capability building is the internal hiring rate (promotions only) into management or expert positions as compared to the external hiring rate into such positions.
Capability Building > Employee Retention
According to the Global Workforce Study (2012), the “chances to advance the career” is the second-most important driver of employee retention.20) By promoting and thus growing from within, SAP creates career opportunities for our employees. In turn, it is our expectation that this opportunity leads to an increase in employee retention.
Capability Building > Employee Engagement
Because it is closely linked to how much a company develops its employees and supports their careers, internal hiring to management and expert positions positively affects employees’ commitment and loyalty. This hypothesis was confirmed by a study by Bedarkar & Pandita (2014), which identified “career opportunities” as the key driver of employee engagement.21)
Capability Building > Women in Management
Like many of our IT industry peers, SAP has less women than men in senior positions. Given our significant pool of talent, we assume that internal promotions will increase the percentage of women in management positions.
Growth
Growth is one of our strategic objectives. We measure it through several KPIs, for example total revenue that SAP receives from the sale of our products and services.
Social Investment > Growth
A study by Muritala (2013) suggests that corporate social responsibility (or what we characterize as social investment) is likely to have a positive impact on an organization’s financial performance.22) In our experience, social investments do, in fact, have a positive impact on our ability to acquire new customers, especially in emerging markets.
Women in Management > Growth
Studies show that companies with a relatively high percentage of women in upper management ranks or as board members achieve stronger financial performance compared to those with a relatively low percentage (Catalyst, 2013).23) We believe that having a higher share of women in management positions will increase our revenue as it helps us to better serve our diverse customer base.
BHCI > Growth
From 2014 to 2018, we used real data from SAP to analyze and prove the financial impact of the BHCI. We were able to prove a significant positive correlation between the BHCI and revenue.
Employee Retention > Growth
Meifert (2005) stated a clear relationship between employee retention and the company’s revenue and margin.24)
Connectivity of Financial and Non-Financial Indicators | 217 |
To Our | Combined Group | Consolidated Financial | Further Information on Economic, | Additional |
Stakeholders | Management Report | Statements IFRS | Environmental, and Social Performance | Information |
Carbon Emissions > Growth
Lowering SAP’s carbon emissions could have a positive impact on SAP’s revenue because customers increasingly ask their suppliers to act sustainably. This reasoning is supported by a study by PwC (2013) confirming the existence of a positive correlation between a company’s environmental performance and financial performance.25) On the other hand, where additional travel is conducted to generate additional business, the resulting increase in SAP’s carbon emissions could have positive impact on growth.
Employee Engagement > Growth
From 2014 to 2018, we used real data from SAP to analyze and prove the financial impact of employee engagement. We were able to prove a significant positive correlation between employee engagement and revenue.
Growth > Employee Engagement
We believe that a higher revenue will have a positive impact on a company’s work environment, thereby increasing employee pride and loyalty. This is also stated in a study of Harter et al. (2010), stating that improving financial performance appears to increase general satisfaction and some specific work perceptions.26)
Customer Loyalty > Growth
Reichheld (2003) found a strong correlation between companies’ Customer NPS results and their revenue growth rates.27) We support this view, as we believe that loyal SAP customers are likely to recommend SAP products to other companies, which is likely to result in increased sales and stronger revenue.
Growth > Profitability
Profit (or loss) is the total of income less expenses; if revenue as the main part of total income grows at a higher rate than costs, it will lead to greater profit.
Profitability
Profitability is one of our strategic objectives. We measure it through operating profit. Profit (or loss) is the total of income less expenses.
BHCI > Profitability
From 2014 to 2018, we used real data from SAP to analyze and prove the financial impact of the BHCI. We showed what a change by 1pp of the BHCI would mean for SAP’s operating profit.
Employee Engagement > Profitability
From 2014 to 2018, we used real data from SAP to analyze and prove the financial impact of employee engagement. We showed what a change by 1pp of employee engagement would mean for SAP’s operating profit.
Profitability > Employee Engagement
In our view, high profits, as great business news, can raise employee morale, encourage identification with our purpose, and help increase employee engagement. On the other hand, we believe that a high profit expectation can also have a negative impact on employee engagement. If cost savings and budget cuts are implemented to reach an ambitious profit target, employees might feel constrained and dissatisfied.
Women in Management > Profitability
Studies show that companies with a high level of gender diversity outperform companies with an average level in terms of return on equity (11.4% versus an average 10.3%); operating results (EBIT 11.1% versus 5.8%); and stock price increases (64% versus 47% over the period 2005–2007) (McKinsey, 2007).28) It is therefore likely that having a higher share of women in management positions will result in higher profit for SAP.
Profitability > Social Investment
It is a common practice for companies to invest a certain percentage of their annual profits in programs and activities that create a positive social impact. We believe that a higher profit is therefore likely to lead SAP to make greater social investments.
Employee Retention > Profitability
We used real data from SAP to analyze and prove the financial impact of employee retention. We showed what a change by 1pp of employee retention would mean for SAP’s operating profit.
Total Energy Consumed > Profitability
We have found that reduced energy consumption is strongly correlated with a reduction in costs. Therefore, any cost avoidance achieved has a positive impact on our profit.
Growth > Profitability
Profit (or loss) is the total of income less expenses; if revenue as the main part of total income grows at a higher rate than costs, it will lead to greater profit.
Customer Loyalty > Profitability
We believe that positive experiences among our customers can significantly increase business with existing customers, as well as help attract new customers. Both results can lower the cost of sales, thereby increasing our profit.
Carbon Emissions > Profitability
We are using real data from SAP to analyze and prove the financial impact of our carbon emissions, as detailed in the Energy and Emissions section.
Customer Loyalty
Customer loyalty is measured with the Net Promoter Score: Percentage of customers that are likely to recommend SAP to friends or colleagues minus the percentage of customers that are unlikely to do so.
Women in Management > Customer Loyalty
Diversity programs – including those focused on the promotion of women to management positions – have a direct and positive impact on customer satisfaction (Catalyst, 2013).29)
Employee Retention > Customer Loyalty
Koys (2001) has found evidence that employee turnover has a negative impact on customer satisfaction.30) We believe this effect stems from the fact that experienced employees work more efficiently, have better product knowledge, and can build trusting relationships with colleagues and customers, so therefore have the ability to better serve customers’ needs.
218 | Connectivity of Financial and Non-Financial Indicators |
To Our | Combined Group | Consolidated Financial | Further Information on Economic, | Additional |
Stakeholders | Management Report | Statements IFRS | Environmental, and Social Performance | Information |
Carbon Emissions > Customer Loyalty
We believe that lowering SAP’s carbon emissions has a positive reputational effect, thereby enhancing SAP’s standing with its customers.
Customer Loyalty > Growth
Reichheld (2003) found a strong correlation between companies’ Customer NPS results and their revenue growth rates.31) We support this view, as we believe that loyal SAP customers are likely to recommend SAP products to other companies, which is likely to result in increased sales and stronger revenue.
Customer Loyalty > Profitability
We believe that positive experiences among our customers can significantly increase business with existing customers, as well as help attract new customers. Both results can lower the cost of sales, thereby increasing our profit.
BHCI > Customer Loyalty
From 2014 to 2018, we have been using real data from SAP to analyze and prove the financial impact of the BHCI. We have been able to prove a significant positive correlation between the BHCI and customer loyalty. Recent studies, for example by Reed, Goolsby & Johnston (2016) also suggest this correlation.32)
Carbon Emissions
Our carbon emissions are the sum of all greenhouse gas emissions measured and reported, including renewable energy and third-party reductions, for example, offsets.
Carbon Emissions > BHCI
Many of SAP’s carbon emissions are caused by business travel and commuting, which we believe can have both negative and positive impacts on employee health. Some people may experience greater stress from more travel because they have less time to spend at home, suffer from jetlag, or lose valuable working time; others may enjoy travel because it enables them to experience other places and cultures as well as meet new people. Studies show that business travel potentially increases stress and poses a threat to employees’ mental and physical health, see for example the study by Rundle, Revenson & Friedman (2017).33)
Carbon Emissions > Employee Engagement
We believe that lowering SAP’s carbon emissions can have a positive impact on employee engagement because loyalty should rise as employees see their company act responsibly towards the environment. However, because lowering emissions also brings certain restrictions, such as on business travel, it may also have a negative impact on employee engagement.
Employee Engagement > Carbon Emissions
We believe that engaged employees are likely to want to help SAP achieve our target in lowering carbon emissions. Yet another possible outcome is that a higher level of employee engagement may lead to more business activity requiring travel, and therefore could lead to an increase in carbon emissions.
Carbon Emissions > Growth
Lowering SAP’s carbon emissions could have a positive impact on SAP’s revenue because customers increasingly ask their suppliers to act sustainably. This reasoning is supported by a study by PwC (2013) confirming the existence of a positive correlation between a company’s environmental performance and financial performance.34) On the other hand, where additional travel is conducted to generate additional business, the resulting increase in SAP’s carbon emissions could have positive impact on growth.
Carbon Emissions > Customer Loyalty
We believe that lowering SAP’s carbon emissions has a positive effect on our reputation, thereby enhancing SAP’s standing with our customers.
Total Energy Consumed > Carbon Emissions
The emissions caused by SAP’s energy consumption add directly to the corporate carbon emissions if they are not reduced through offsets or – for electricity consumption – renewable energy certificates (RECs).
Carbon Emissions > Profitability
We are using real data from SAP to analyze and prove the financial impact of the carbon emissions, as detailed in the Energy and Emissions section.
Total Energy Consumed
Total energy consumed is the sum of all energy consumed through SAP’s own operations, including energy from renewable sources.
Total Energy Consumed > Profitability
We have found that reduced energy consumption is strongly correlated with a reduction in costs. The cost avoidance thus achieved has a positive impact on our profit.
Total Energy Consumed > Carbon Emissions
The emissions caused by SAP’s energy consumption add directly to the corporate carbon emissions if they are not reduced through offsets or – for electricity consumption – renewable energy certificates (RECs).
1) Bedarkar, M., Pandita, D. (2014): A Study on the drivers of employee engagement impacting employee performance. In: Procedia – Social and Behavioral Sciences, Vol. 133, pp. 106–115.
2) Mueller, K., Hattrup, K., Spiess, S., Lin-Hi, N. (2012): The effects of corporate social responsibility on employees’ affective commitment: A cross-cultural investigation. In: Journal of Applied Psychology, Vol. 97(6), pp. 1186–1200.
3) Johnson, Sheena et al. (2018): WELL-BEING: Productivity and Happiness at Work 2. ed. 2018., Cham: Springer International Publishing Imprint: Palgrave Macmillan.
4) Harter, J., Schmidt, F., Asplund, J., Kilham, E., Agrawal, S. (2010): Causal Impact of Employee Work Perceptions on the Bottom Line of Organizations. In: Perspectives on Psychological Science, Vol. 5(4), pp. 378–389.
5) McKinsey & Company (2013): Women Matter. Gender diversity in top management: Moving corporate culture, moving boundaries. Available at: http://www.mckinsey.com/~/media/McKinsey/Global%20Themes/Women%20 matter/WomenMatter%202013%20Report%20(8).ashx [Accessed December 16, 2016].
6) Johnson, S.S. (2017): The Art of Health Promotion ideas for improving health outcomes. American Journal of Health Promotion, 31(2), pp. 163–164.
7) Johnson, Sheena et al. (2018): WELL-BEING: Productivity and Happiness at Work 2. ed. 2018., Cham: Springer International Publishing Imprint: Palgrave Macmillan.
8) Rundle, A. G., Revenson T. A. & Friedman, M. (2017): Business travel and behavioral and mental health. Journal of Occupational and Environmental Medicine,1 DOI: 10.1097/JOM.0000000000001262.
9) Reed, Goolsby & Johnston (2016): Listening in and out: Listening to customers and employees to strengthen an integrated market-oriented system. Journal of Business Research, 69(9), pp. 3591–3599.
Connectivity of Financial and Non-Financial Indicators | 219 |
To Our | Combined Group | Consolidated Financial | Further Information on Economic, | Additional |
Stakeholders | Management Report | Statements IFRS | Environmental, and Social Performance | Information |
10) Towers Watson (2012): Global Workforce Study. Geld, Karriere, Sicherheit? Was Mitarbeiter motiviert und in ihrem Unternehmen hält. Available at: https://www.towerswatson.com/de-AT/Insights/IC-Types/Survey-Research- Results/2012/07/Towers-Watson-Global-Workforce-Study-2012- Deutschlandergebnisse [Accessed December 16, 2016].
11) Meifert, M. (2005): Mitarbeiterbindung: eine empirische Analyse betrieblicher Weiterbildner in deutschen Großunternehmen. München and Mering: Hampp Verlag.
12) Koys, D. (2001): The effects of employee satisfaction, organizational citizenship behavior, and turnover on organizational effectiveness: A unit-level, longitudinal study. In: Personnel Psychology, Vol. 54(1), pp. 101–114.
13) McKinsey & Company (2013): Women Matter. Gender diversity in top management: Moving corporate culture, moving boundaries. Available at: http://www.mckinsey.com/~/media/McKinsey/Global%20Themes/Women%20 matter/WomenMatter%202013%20Report%20(8).ashx [Accessed December 16, 2016].
14) Catalyst Information Center (2013): Why Diversity Matters. Available at: http://www.catalyst.org/system/files/why_diversity_matters_catalyst_0.pdf [Accessed December 16, 2016].
15) Catalyst Information Center (2013): Why Diversity Matters. Available at: http://www.catalyst.org/system/files/why_diversity_matters_catalyst_0.pdf [Accessed December 16, 2016].
16) McKinsey & Company (2007): Women Matter. Gender diversity, a corporate performance driver. Available at:
http://www.mckinsey.com/~/media/McKinsey/Business%20Functions/Organization/Our%20Insights/Women%20matter/ Women_matter_oct2007_english.ashx [Accessed December 16, 2016].
17) Johnson, S.S. (2017): The Art of Health Promotion ideas for improving health outcomes. American Journal of Health Promotion, 31(2), pp. 163–164.
18) Mueller, K., Hattrup, K., Spiess, S., Lin-Hi, N. (2012): The effects of corporate social responsibility on employees’ affective commitment: A cross-cultural investigation. In: Journal of Applied Psychology, Vol. 97(6), pp. 1186–1200.
19) Muritala, T. (2013): Does CSR Improve Organization Financial Performance? Evidence from Nigeria Using Triangulation Analysis. In: Economics and Applied Informatics, Issue 3, pp. 41–46.
20) Towers Watson (2012): Global Workforce Study. Geld, Karriere, Sicherheit? Was Mitarbeiter motiviert und in ihrem Unternehmen hält. Available at: https://www.towerswatson.com/de-AT/Insights/IC-Types/Survey-Research- Results/2012/07/Towers-Watson-Global-Workforce-Study-2012- Deutschlandergebnisse [Accessed December 16, 2016].
21) Bedarkar, M., Pandita, D. (2014): A Study on the drivers of employee engagement impacting employee performance. In: Procedia – Social and Behavioral Sciences, Vol. 133, pp. 106–115.
22) Muritala, T. (2013): Does CSR Improve Organization Financial Performance? Evidence from Nigeria Using Triangulation Analysis. In: Economics and Applied Informatics, Issue 3, pp. 41–46.
23) Catalyst Information Center (2013): Why Diversity Matters. Available at: http://www.catalyst.org/system/files/why_diversity_matters_catalyst_0.pdf [Accessed December 16, 2016].
24) Meifert, M. (2005): Mitarbeiterbindung: eine empirische Analyse betrieblicher Weiterbildner in deutschen Großunternehmen. München and Mering: Hampp Verlag.
25) PwC (2013): Busting the carbon budget – Low Carbon Economy Index 2013. Available at: https://www.pwc-wissen.de/pwc/de/shop/publikationen/Low+Carbon+Economy+Index+2013/?card=12994 [Accessed December 16, 2016].
26) Harter, J., Schmidt, F., Asplund, J., Kilham, E., Agrawal, S. (2010): Causal Impact of Employee Work Perceptions on the Bottom Line of Organizations. In: Perspectives on Psychological Science, Vol. 5(4), pp. 378–389.
27) Reichheld, F. (2003): The One Number You Need to Grow. In: Harvard Business Review, Vol. 81(12), pp. 46–54.
28) McKinsey & Company (2007): Women Matter. Gender diversity, a corporate performance driver. Available at: http://www.mckinsey.com/~/media/McKinsey/Business%20Functions/Organization/Our%20Insights/Women%20matter/ Women_matter_oct2007_english.ashx [Accessed December 16, 2016].
29) Catalyst Information Center (2013): Why Diversity Matters. Available at: http://www.catalyst.org/system/files/why_diversity_matters_catalyst_0.pdf [Accessed December 16, 2016].
30) Koys, D. (2001): The effects of employee satisfaction, organizational citizenship behavior, and turnover on organizational effectiveness: A unit-level, longitudinal study. In: Personnel Psychology, Vol. 54(1), pp. 101–114.
31) Reichheld, F. (2003): The One Number You Need to Grow. In: Harvard Business Review, Vol. 81(12), pp. 46–54.
32) Reed, Goolsby & Johnston (2016): Listening in and out: Listening to customers and employees to strengthen an integrated market-oriented system. Journal of Business Research, 69(9), pp. 3591–3599.
33) Rundle, A. G., Revenson T. A. & Friedman, M. (2017): Business travel and behavioral and mental health. Journal of Occupational and Environmental Medicine,1 DOI: 10.1097/JOM.0000000000001262.
34) PwC (2013): Busting the carbon budget – Low Carbon Economy Index 2013. Available at: https://www.pwc-wissen.de/pwc/de/shop/publikationen/Low+Carbon+Economy+Index+2013/?card=12994 [Accessed December 16, 2016].
220 | Connectivity of Financial and Non-Financial Indicators |
To Our
Stakeholders | Combined Group
Management Report | Consolidated Financial
Statements IFRS | Further Information on Economic,
Environmental, and Social Performance | Additional
Information |
Materiality
Defining Key Priorities for Our Non-Financial Reporting
By understanding which environmental, social, and governance issues are key priorities for our stakeholders, we are better able to allocate time, budget, and resources accordingly within our integrated reporting. In 2016, we completed our latest comprehensive materiality assessment to help identify and validate those topics which are the most relevant to our stakeholders such as employees, investors, and customers. The assessment also highlights those topics which contribute most to value creation both in our own operations and in those of our customers.
Our materiality assessment process combined the GRI G4 guidelines for sustainability reporting and the International Integrated Reporting Framework. Key stages of the process are detailed below.
While the last systematic materiality process took place in 2016, we continuously update our strategy and engagement focus internally.
Identification
During this stage, we drew up a long list of potential topics based on guidance from GRI G4 and the Sustainability Accounting Standards Board (SASB), as well as our existing material topics. We also considered a materiality assessment for the ICT industry by the Global E-Sustainability Initiative (GeSI) as well as the United Nations’ Sustainable Development Goals (SDGs).
When identifying our key topics and their boundaries, we looked first at areas related to our operations and supply chain. Second, we looked at topics related to how our software can help our customers contribute to the achievement of the SDGs.
Prioritization
During the prioritization stage, we looked at the extent to which each individual topic affects our ability to create value at SAP. We assessed whether this value was financial, operational, strategic, reputational, or regulatory. All topics that were identified as delivering value in three or more areas were then included on our short list of seven categories, as follows:
– Business conduct
– Climate and energy
– Financial performance
– Human and digital rights
– Human capital
– Innovation and customer loyalty
– Impact on society
Next, we conducted semi-structured interviews with selected stakeholders to validate the shortlisted topics. We asked stakeholders to rate topics on a scale from 0 to 5 (where 0 is not important at all and 5 is very important) based on the following questions for the first six categories:
– To what degree does this topic influence SAP’s ability to create value?
– How important is that topic for you to engage in a business relationship with SAP?
To assess the category “impact on society,” we asked stakeholders the following questions:
– How high is the potential of SAP to enable our customers to achieve the SDGs?
– How important is our ability to do this for you to engage in a business relationship with SAP?
We have included in our materiality matrix all topics with stakeholder ratings in the upper 50% for both questions respectively.
Validation
As part of our materiality assessment process in 2016, the results of the materiality analysis were reviewed and confirmed by our steering committee for integrated reporting and our sustainability advisory panel. The results were also reviewed by our chief financial officer, who is the board sponsor for sustainability and integrated reporting.
Review
Feedback on and analysis of the SAP Integrated Report will serve as an input for future materiality assessments.
Results

Materiality Matrix Non-Financial Topics (the chart only shows topics with high or very high scores)
To Our
Stakeholders | Combined Group
Management Report | Consolidated Financial
Statements IFRS | Further Information on Economic,
Environmental, and Social Performance | Additional
Information |
Key points of our materiality assessment results include:
– Stakeholders saw financial performance as a mandatory part of reporting. As a result, in several interviews, its materiality was not expressly discussed. However, this category received high individual scores.
– The innovation and customer loyalty, business conduct, and human capital categories received the highest scores and response rates.
– The climate and energy category, which looks at the way in which SAP reduces emissions and energy consumption in our own operations, had the lowest response rates and scores. Despite these results, we acknowledge that societal awareness and expectations related to climate change have increased since 2016. This is why we have strengthened our environmental targets (climate-neutral by 2025; science-based target) in recent years and will also make our carbon impact relevant for Executive Board compensation starting 2020. For more information, see the Energy and Emissions and Performance Management System sections.
– In evaluating our impact on society through the SAP portfolio, our stakeholders identified seven SDGs as material:
¡ SDG 9 Industry, innovation, and infrastructure
¡ SDG 3 Good health and well-being
¡ SDG 8 Decent work and economic growth
¡ SDG 13 Climate action
¡ SDG 17 Global partnerships
¡ SDG 12 Responsible consumption and production
¡ SDG 4 Quality education
To Our
Stakeholders | Combined Group
Management Report | Consolidated Financial
Statements IFRS | Further Information on Economic,
Environmental, and Social Performance | Additional
Information |
Stakeholder Engagement
For SAP, stakeholder engagement and collaboration are deeply embedded into our process of innovation and the development of our products and services. Before we can design a new solution, we must first understand the issue we are addressing. For this reason, design thinking and co-innovation are essential.
To be able to innovate, we regularly engage with the stakeholder groups described below, including our sustainability advisory panel. We selected these groups as they are critical to our value creation.
Customers
For more information about our customer engagement programs, see the Customers section.
Employees
We survey employees annually. For the results of our latest employee survey and action items resulting from it, see the Employees and Social Investments section.
Our Supervisory Board comprises 50% employee representation, and we strive for constructive labor relations across the world, working within each country’s requirements. We currently have works councils in place in Belgium, France, Germany, Israel, the Netherlands, Slovakia, Slovenia, and Spain. In Italy, there is a union representative in place. In the United Kingdom and Ireland, employee consultation forums represent the employees’ interests. In Romania and Sweden, union stewards serve this purpose. The majority of the SAP employees in Canada is represented by a Joint Health & Safety Committee. Furthermore, employee representatives are in place at SAP Japan Co. Limited. Employees of SAP Austria decided to be represented by an ombudsteam. In the Czech Republic, labor unions have been established in all SAP entities. In China, a trade union for employees employed under the SAP China Beijing branch has been formed. At SAP Korea, a labor union has been established. In addition, we have an SE Works Council Europe that represents SAP employees in the 28 countries of the European Economic Area.
These employee representation bodies consist of elected union members and non-union members, and are consulted by SAP management on topics that define the work environment and work processes. These topics include HR initiatives, talent development, payment and benefits, equal opportunities, changes in work or IT processes, privacy, and health and safety protection.
Collective bargaining agreements with unions are only made in countries where legally required. Overall, about 52% of our employees are represented by works councils, an independent trade union, or are covered by collective bargaining agreements.
In addition, the Executive Board answers employees’ questions in quarterly all-hands meetings. In regular coffee corner sessions, senior executives explain our strategy to employees and answer their questions directly.
Financial Analysts and Investors
For more information about our dialog with investors, see the Investor Relations section.
Governments
For more information about our dialog with governments, see the Public Policy section.
Industry Analysts
Our Analyst Relations team, the Executive Board, and executives have strong relations and work strategically with IT analysts on a frequent basis. We engage with these analysts on key SAP topics including Intelligent Enterprise in the experience economy, SAP HANA, ERP and SAP S/4HANA, CRM and SAP C/4HANA on SAP Cloud Platform, SAP Leonardo, industry solutions, cloud solutions, ecosystem, and services. The latest industry-positioning material integrates economic, social, and environmental impact creation.
Non-Governmental Organizations (NGOs), Non-Profit Organizations (NPOs), and Academia
Our dialog with NGOs, NPOs, and academic institutions helps us understand how we can address today’s most pressing issues with our solutions and what is expected from us as a corporation. For more information about how we engage with NGOs and academia, see the Employees and Social Investments section.
Partners
With more than 20,000 partners around the world, the SAP ecosystem is vital to our success. We take a multifaceted approach to partner engagement that begins with the dedicated, interactive partner portal, SAPPartnerEdge.com. Partners receive a weekly, customized newsletter with the latest announcements, training offers, and thought leadership information relevant to their specific partnership type. Additionally, partner-dedicated focus groups and events such as the SAP Global Partner Summit are held throughout the year, around the globe, to educate partners and further gauge their feedback on how SAP can continuously improve. For more information about our ecosystem, see the section Products, Research & Development, and Services.
Sustainability Advisory Panel
Our sustainability advisory panel consists of expert representatives from our customers, investors, partners, NGOs, and academia. In 2019, members of the panel attended our external stakeholder dialogue event to celebrate the 10th anniversary of SAP’s sustainability journey. Together with other speakers and participants, they discussed with us, for example, how to better embed sustainability into our core business.
Stakeholder Engagement | 223 |
To Our
Stakeholders | Combined Group
Management Report | Consolidated Financial
Statements IFRS | Further Information on Economic,
Environmental, and Social Performance | Additional
Information |
Sustainability Management and Policies
Putting Sustainability at the Heart of Our Strategy
At SAP, we believe that it is not enough to simply have a sustainability strategy but that, instead, our overall corporate strategy must itself be sustainable. Only by achieving this can we fulfill our purpose to help the world run better and improve people’s lives. We therefore strive to promote sustainability across our entire business.
Led by our chief sustainability officer, a dedicated team works to embed sustainability into our corporate strategy and drives new sustainability initiatives across the organization. We also aim to integrate measures with positive economic, social, and environmental impacts within our existing solutions, processes, and operations.
Our CFO is the sponsor for sustainability on the Executive Board, and we also have at least one dedicated senior executive in charge of sustainability in each Board area. These individuals form our Sustainability Council and are responsible for embedding sustainability in their business practices, for example, by setting relevant targets and implementing related programs. The members of the Sustainability Council are held accountable for their achievements, in review meetings with the CFO and the chief sustainability officer that take place twice a year.
Managing Our Response to Our Material and Other Reported Topics
SAP has dedicated personnel addressing the material topics identified in our materiality analysis. For each topic, we look at ways in which we can manage our response, and how we can evaluate whether our approach is effective.
Business Conduct
For information about our compliance management approach, see the Business Conduct section.
Climate and Energy
For information about our climate and energy management approach, see the Energy and Emissions section.
Financial Performance
The Executive Board retains ultimate responsibility for revenue growth, profitability, and the financial stability of SAP. For more information, see the Corporate Governance Report and the Report by the Supervisory Board.
Human and Digital Rights
For information about our management approach on human and digital rights, see the Security, Data Protection, and Privacy section and the Human Rights and Labor Standards section.
Human Capital
Our key policies include a global health and safety management policy and a diversity and inclusion policy. The global health and safety management policy aims to nurture our employees’ long-term employability, engagement, and creativity by integrating health, occupational safety, well-being, and stress management topics. The diversity and inclusion policy provides a framework for an inclusive working environment.
For more information about our human capital management approach, see the Employees and Social Investments section.
Impact on Society
When assessing our impact on society, we consider two key areas: Firstly, we look at the contribution we make towards the fulfilment of the United Nations Sustainable Development Goals (SDGs, also called UN Global Goals) through our software solutions; and secondly, we consider our efforts to make the world a better place through our corporate social responsibility (CSR) and other programs.
Our contribution to the SDGs is a cross-company effort driven by experts from almost every board area. These experts are connected through an SDG Network to align and consolidate initiatives and create synergies. We illustrate examples of our existing engagement with customers and other activities contributing to the SDGs in our continuously updated Web book SAP and the UN Global Goals and the 2019 Run with Purpose brochure. While we are committed to the UN Global Goals framework as a whole, we recognize the importance of focusing on SDGs that have a material link to our own operational activities or the use of our software by customers (for more information see the Our Contribution to the UN Sustainable Development Goals section). For example, goal 12 “responsible consumption and production,” is a priority based on our ambition to drive resource productivity with an aspiration to a zero-waste, circular economy.
In addition, we pursue partnerships with the World Economic Forum (WEF), UNICEF, United Nations Technology Innovation Labs (UNTIL), UN Development Program, UN Women, UN Global Compact, and the Ellen MacArthur Foundation, as well as other organizations and non-governmental organizations. In this way, we drive ideas, innovation, execution, and adoption for solutions to achieve the UN’s 2030 Agenda for Sustainable Development.
Our global CSR policy offers all SAP employees the opportunity to volunteer for up to eight working hours each year at a CSR event. For more information about our CSR governance, events, and activities, see the Employees and Social Investments section.
Innovation and Customer Loyalty
Every Executive Board member is responsible for innovation in their area. For more information about our software and services innovation efforts, see the Products, Research & Development, and Services section.
224 | Sustainability Management and Policies |
To Our
Stakeholders | Combined Group
Management Report | Consolidated Financial
Statements IFRS | Further Information on Economic,
Environmental, and Social Performance | Additional
Information |
For more information about customer loyalty and our efforts to improve the customer experience, see the Customers section.
Changing Our Behavior and Culture
Employee engagement is essential, as the ideas and commitment of our staff help drive change throughout SAP. We run a number of programs to help employees understand how sustainability is engrained in our purpose, and how they can contribute.
In 2019, we ran a campaign to celebrate the 10th anniversary of SAP’s sustainability journey, leveraging the occasion to review achievements and lessons learned while inviting employees and external stakeholders alike to join the dialogue about shaping our roadmap for the next decade. Our campaign encompassed live and virtual events, mails, blogs, or polls.
SAP continues to include sustainability in its onboarding training for new hires. Furthermore, employees can take openSAP online courses on sustainability including the latest one on “Sustainability: Learning from Leading Companies,” which are also available to the general public.
We have encouraged employee engagement through ongoing initiatives such as an online SDG quiz or the “What’s your goal?” challenge, with SAP staff submitting stories about how they contribute to the SDGs. Furthermore, programs such as the “Bike to Work” and “Fit@SAP” schemes connect health and environmental goals by linking fitness activities with financial contributions to organizations such as Plant-for-the-Planet, which educates people about climate change.
Focusing on Transparency and Building Awareness
Change starts with transparency and awareness. To gain a holistic overview of our performance, our Executive Board and Supervisory Board have access to our SAP Digital Boardroom solution that includes key financial and non-financial data such as human capital indicators.
In addition, employees can access a dashboard detailing the environmental and social performance for our company as a whole, single sites, or departments. For example, data on employee retention and women in management helps create transparency with regard to the social performance of our company. Our environmental performance is shown through greenhouse gas emissions. A personalized app also provides employees with statistics about their personal environmental and financial impact through driving a company car.
We measure the success of our initiatives through our annual employee engagement survey, under the theme “#Unfiltered.” In 2019, 94% of our employees agreed with the statement “It is important for SAP to pursue sustainability.” This was slightly up from 93% in 2018 (2009: 77%). Furthermore, 87% of our employees stated “I actively contribute to sustainability goals at SAP.” This is up from 83% in 2018 and up from 47% in 2009 when we introduced the question.
Results of the Employee Engagement Survey
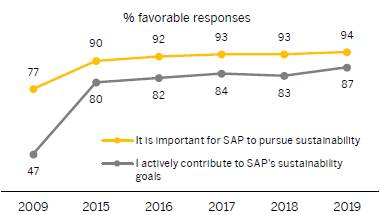
Nurturing a Network of Sustainability Champions
To help drive progress in our sustainability initiatives, we need the support of employees in every part of SAP. We have a global internal network of more than 200 sustainability champions who represent different regions and areas of the business at SAP. Not only do they act as role models, they also tailor sustainability engagement activities to local and lines-of-business needs and interests and share best practices.
Sustainability Management and Policies | 225 |
To Our | Combined Group | Consolidated Financial | Further Information on Economic, | Additional |
Stakeholders | Management Report | Statements IFRS | Environmental, and Social Performance | Information |
Our Contribution to the UN Sustainable Development Goals
The 17 United Nations Sustainable Development Goals (SDGs) provide a globally accepted framework which we use for communicating our purpose to “help the world run better and improve people’s lives.” We strive to execute on this purpose by being a role model for sustainable, purpose-led operations and by enabling our customers to operate in a sustainable way.
Following the adoption of the SDGs by world leaders in September 2015, we identified and aligned existing initiatives with all 17 SDGs. For example, we looked at the environmental and social impacts of customers using SAP technology and applications, linking these impacts to the SDGs. The resulting Web book (www.sap.com/unglobalgoals) was published in early 2016 and has been updated regularly.
To validate and refine the focus of our impact through our operations and solutions, we included the SDGs in our 2016 materiality analysis and discussed them with our external sustainability advisory panel. This highlighted the importance of focusing on SDGs for which there is a tangible and material link between our own operational activities or the use of our software by customers. For more information, see the Materiality section.
The following table describes the potential positive and negative direct or indirect impacts of our company and of our products and services related to SDGs that have received a high ranking in our materiality analysis. We use “direct” when we refer to impacts through our own operations; “indirect” describes impacts through the use of our solutions and technology or in our ecosystem.
Our Potential Direct and Indirect Impact | | Our KPIs and
Targets | | Our Policies and Selected Activities and
Programs to Enhance Positive Impacts and
Mitigate Negative Impacts | | Where You Can Find More
Information in the SAP
Integrated Report and Other
Sources |
SDG 9 Industry, Innovation, and Infrastructure | | | | |
Direct: + Increase inclusive and sustainable industrialization through SAP’s investments in research and development (including in developing countries) Indirect: + Support providers of infrastructure, financial services and clean technologies + Provide “Best Practice” business processes through standard software solutions + Integrate small and medium-sized enterprises into global value chains and markets | | NA | | Direct: SAP Labs Network; One Billion Lives initiative fostering purpose-driven innovation Indirect: SAP support for startups through various programs | | Products, Research & Development, and Services Employees and Social Investments SAP & SDG9 SAP Innovation SAP Partnering with Social Enterprise Forum One Billion Lives Initiative SAP.io |
SDG 3 Good Health and Well-Being | | | | | | |
Direct: + Provide access to a healthy lifestyle and a safe and healthy working environment for our employees Indirect: + Enhance safe and healthy working conditions, healthcare, and personalized medicine on a global scale – Increase transparency of physical, medical, and health conditions of individuals, which might be abused | | Business Health Culture Index | | Direct: Global Health and Safety Management Policy; Employee Assistance Program; Corporate Oncology Program for Employees Indirect: SAP Solutions for Healthcare, SAP Environment, Health and Safety Management, SAP SuccessFactors Well-Being Management by Virgin Pulse | | Employees and Social Investments SAP & SDG3 Healthcare SAP Environment, Health and Safety Management SAP SuccessFactors Well-Being Management by Virgin Pulse |
SDG 8 Decent Work and Economic Growth | | | | |
Direct: + Create decent jobs at SAP through our growth plans, specifically in developing markets Indirect: + Create three million jobs in our ecosystem (based on a 2017 study by SAP and PwC) + Enable an inclusive economy | | Number of employees | | Direct: SAP recruiting programs; Diversity & Inclusion policy and programs including EDGE certification Indirect: SAP Rural Sourcing Management; SAP Ariba Supplier Risk in cooperation with Made In A Free World; Partnership with Social Enterprise UK | | Employees and Social Investments Sustainable Procurement SAP & SDG8 Diversity & Inclusion Powering Opportunity Through Digital Inclusion SAP Rural Sourcing Management SAP Ariba SAP Ariba and Social Enterprise UK |
226 | | Our Contribution to the UN Sustainable Development Goals |
To Our | Combined Group | Consolidated Financial | Further Information on Economic, | Additional |
Stakeholders | Management Report | Statements IFRS | Environmental, and Social Performance | Information |
Our Potential Direct and Indirect Impact | | Our KPIs and
Targets | | Our Policies and Selected Activities and
Programs to Enhance Positive Impacts and
Mitigate Negative Impacts | | Where You Can Find More
Information in the SAP
Integrated Report and Other
Sources |
+ Combat forced and child labor throughout supply chains – Fuel negative effects on employment through digitalization and automation; potentially increase precarious jobs – Decouple societal groups from entire areas of employment through an accelerated digital divide and lack of digital skills | | | | | | |
SDG 13 Climate Action | | | | | | |
Direct: + Assume responsibility for products in use-related emissions by running customer applications in the SAP green Cloud – Emit greenhouse gases Indirect: + Contribute to climate change mitigation and strengthen resilience and adaptive capacity to climate-related hazards and natural disasters of our customers + Enable holistic operational steering by integrating climate change relevant parameter – Increase customers’ energy consumption through use of software | | Become carbon neutral by 2025 | | Direct: Global Environmental Policy; Report and reduce CO2 emissions and energy consumption; Procure 100% renewable electricity; Carbon impact relevance for Executive Board compensation Indirect: Green Cloud; Business ambition for 1.5°C | | Energy and Emissions Compensation Report Environmental Policy SAP & SDG13 Climate Change: What SAP Is Doing SAP sets 1.5°C science-based emissions reduction targets aligned with a net-zero future |
SDG 17 Partnerships for the Goals | | | | | | |
Direct: + Build capacity throughout our broader ecosystem | | NA | | Engage in UN Global Compact, UN Development Program, UNICEF, Social World Enterprise Forum, UN Technology and Innovation Labs (UNTIL), Global Alliance for YOUth, Value Balancing Alliance, Ocean Plastics Leadership Summit, Global Partnership for Development Data, IMPACT 2030, WEF Platform for Accelerating the Circular Economy, Global Battery Alliance, SDG Ambition | | Employees and Social Investment SAP & SDG17 SAP & UNICEF SAP & UNTIL SAP Founding Member of Value Balancing Alliance Ocean Plastics Leadership Summit SAP joined the Global Alliance for YOUth Global Battery Alliance Platform for Accelerating the Circular Economy SDG Ambition |
SDG 12 Responsible Consumption and Production | | | | |
Direct: + Drive sustainable business practices and integrated reporting – Use energy, water, and resources; produce waste Indirect: + Decouple economic prosperity from resource consumption by enabling transparency and optimizing resource productivity in linear or circular economies – Increase absolute resource and energy consumption because efficiency gains through automation may be counteracted (rebound effect) | | We drive resource productivity with an aspiration to a world with zero waste. | | Direct: Beyond single-use plastic initiative; Supplier Code of Conduct; Sustainable Procurement; e-waste recycling Indirect: SAP Plastics Challenge | | Energy and Emissions Waste and Water Sustainable Procurement SAP & SDG12 SAP Leonardo Plastics Challenge New marketplace for recycled plastics and plastics alternatives SAP and Google Cloud Circular Economy 2030 Challenge Phase out single-use plastics |
SDG 4 Quality Education | | | | | | |
Direct: + Train and educate SAP employees Indirect: + Build capability in our ecosystem and among our customers | | Engaging four million children, youth, and young adults in digital skills and coding programs by 2020 | | Direct: Cloud-based learning management system for employees Indirect: openSAP; CSR digital literacy programs | | Employees and Social Investments SAP & SDG4 SAP Learning for Life Powering Opportunity Through Digital Inclusion |
Our Contribution to the UN Sustainable Development Goals | | 227 |
To Our | Combined Group | Consolidated Financial | Further Information on Economic, | Additional |
Stakeholders | Management Report | Statements IFRS | Environmental, and Social Performance | Information |
Human Rights and Labor Standards
Upholding High Standards
Whether within SAP, across our extended supply chain, or through the impact of our solutions, we are committed to respecting human rights. We maintain high ethical standards and establish fairness, diversity, and inclusion across our business operations. In this way, we believe we can better attract and keep top talent, increase innovation and productivity, and enhance our reputation. SAP is a signatory of the United Nations (UN) Global Compact initiative. This is a voluntary undertaking to align our strategy and operations with universal principles on human rights, labor, the environment, and anticorruption.
By integrating human rights considerations into our standard business practices, we also support the values of the Universal Declaration of Human Rights, the OECD Guidelines for Multinational Enterprises, and the International Labor Organization Declaration on Fundamental Principles and Rights at Work. To ensure that our commitment to human rights translates into practice, we take guidance from the UN “Protect, Respect and Remedy” framework.
Making a Commitment
The SAP Global Human Rights Commitment Statement details our response to the international standards mentioned above and is our public commitment to becoming a role model of sustainability. Based on the SAP Code of Business Conduct and approved by our Executive Board, the statement focuses on three main areas: our employees, our ecosystem of partners and suppliers, and our solutions.
Our commitment statement applies to all our operations and SAP entities globally and is reviewed every two years. It also contains references to our other guidelines such as health and safety management, and data protection and privacy. To communicate and enforce this commitment statement, SAP established a governance structure for human rights. This includes a steering committee and allocates responsibility for maintaining human rights standards across Board areas.
Understanding Our Strengths and Weaknesses
SAP undertook a human rights risk and capacity assessment in 2017 to analyze processes and ongoing due diligence activity. With help from an external consulting company, we reviewed and mapped SAP documents against best-practice human rights initiatives and frameworks. We conducted internal consultations and external stakeholder interviews to identify key strengths and opportunities for improvement.
SAP firmly believes that our software solutions should be designed in a way that prevents possible human rights violations. In 2019, we started a pilot project with our product development to analyze the status quo and suggest possible changes.
We have started to use the SAP Ariba Supplier Risk solution to continuously monitor suppliers’ exposure to social, environmental, reputational, compliance, financial, and operational risks.
To understand how effective our human rights due diligence is, grievance mechanisms must be accessible and simple. Therefore, we reviewed our grievance mechanisms to ensure that external groups have access.
Enforcing Our Standards
To assess our human rights measures, we consider external benchmarks, performance ratings, audit results, and stakeholder feedback. In addition, since 2012, we have conducted regular internal audits to check internal compliance with our policies and verify that our subsidiaries adhere to our human rights standards.
In 2019, we conducted labor audits in Mexico and Colombia, in which we reviewed labor conditions, wages and hours, health and safety, the environment, management system, and business practices. While we did not encounter any labor rights abuses, the audits revealed inadequate emergency health processes as well as security concerns in Colombia, and lack of sufficient HR process preparedness to fulfill upcoming Mexican labor laws. We took steps to address these shortcomings by initiating a change in office locations and creating a management plan to address new regulations.
This year, we also used our own SAP Qualtrics solution during the audits to survey as many local employees as possible. This way we get a more complete picture of the local working conditions.
Respecting the Rights of Our Employees
We have a long-standing policy of nondiscrimination in dealings with all employees and provide training on human rights issues that are most relevant to our business. These include security, privacy, and antidiscrimination.
We encourage all employees, including vulnerable groups such as temporary external staff, who feel they are subjected to conduct that violates our antidiscrimination policies to report it. Employees can reach out confidentially to their managers, HR officers, compliance officers, or colleagues who are trained to be part of our internal mediation pool. In addition, since 2019 every affected person can now use an e-mail inbox as well as a Compliance Hotline to report human rights violations to SAP globally.
Our global ombudsperson also receives employee complaints and mediates fair settlements. The ombudsperson also helps the Executive Board analyze HR-related complaints and consider ways to address potential issues before they occur.
Maintaining High Standards Across Our Supply Chain
We expect all our business partners to respect human rights and to avoid complicity in human rights abuses. Our codes of conduct for suppliers and partners require them to uphold labor rights and to provide a safe and healthy work environment for all employees. In addition, we carry out due diligence regularly to assess their human rights performance.
228 | | Human Rights and Labor Standards |
To Our | Combined Group | Consolidated Financial | Further Information on Economic, | Additional |
Stakeholders | Management Report | Statements IFRS | Environmental, and Social Performance | Information |
Respecting Human Rights Throughout Our Product Lifecycle
As reflected in our human rights risk assessment, we are committed to respecting human rights throughout the lifecycle of our products – from design through development to use. We develop innovative solutions that help customers embed human rights standards into their business and supply chain strategies. For example, our customers can use the SAP Ariba Supplier Risk solution to gain the intelligence and transparency they need to understand human rights risks within their supply chains. They can then make informed procurement decisions that may improve lives.
SAP is also looking at the ethical and societal implications of the latest advances in technology, such as artificial intelligence (AI), and is contributing to the public debate about these subjects. Our objective is to continue creating software that allows users to reach their full intellectual potential. Hence, SAP has created a set of guiding principles on AI that are intended to steer the development and deployment of our AI software. These guidelines were formulated through the expertise of an internal group of SAP executives and will continue to be evaluated and updated in conjunction with an external advisory panel. Our guiding principles mark a starting point for a deep and continuous engagement with the wider challenges of AI and are an evolving reflection on these discussions and the ever-changing technological landscape.
SAP sees a responsibility to lead a broad social discourse on the handling of innovative digital technologies. Thus, SAP supports the efforts of the German Federal Ministry of Justice and Consumer Protection in developing guidelines and principles for corporate digital responsibility.
When designing any software solutions, our development teams ensure that the product complies with standards that respect or support human rights. For example, accessibility is a key area of focus and we follow Web content accessibility guidelines such as the Section 508 standards to ensure inclusive design in all our software. The protection of personal information is another key area of focus for our development teams. To help ensure that our products enable our customers to respect digital rights, we adhere to robust privacy and security standards. These are defined in our global product development, quality, product standards, and data protection and privacy policies.
Human Rights and Labor Standards | | 229 |
To Our | Combined Group | Consolidated Financial | Further Information on Economic, | Additional |
Stakeholders | Management Report | Statements IFRS | Environmental, and Social Performance | Information |
Sustainable Procurement
Making Our Supply Chain More Sustainable
A significant part of our social and environmental impact is delivered through our supply chain. At SAP, we work hard to minimize any negative impacts associated with our supply chain. From eliminating single-use plastics, decreasing CO2 emissions, and reducing oversized packages to an asset upcycling model for our cloud assets, close collaboration with our supplier network is paramount in ensuring that our supply chain is sustainable.
What We Buy and Where We Buy It From
We consider our suppliers to be key partners in our business success. In 2019, we spent approximately €5.3 billion in purchases from more than 18,500 suppliers worldwide (2018: approximately €5.9 billion from more than 17,000 suppliers worldwide). Within our five categories and our Sourcing Excellence Champions unit, we approach sustainability from different angles: Workplace Infrastructure (example: reduced plastics and packaging), Professional Services (example: CO2-reduced mobility concepts, electronic contracts), Marketing & Travel (example: sustainable merchandise and events), IT Infrastructure (example: sustainable cooling of data centers), and Car Fleet (example: sustainable mobility concepts). 1)
Suppliers by Category (Tier 1)

Supplier Locations
Procuring with Purpose
Understanding the importance of purpose-driven topics such as diversity and sustainability, we believe that diverse and sustainable businesses bring significant added value to SAP, for example through their flexibility and high innovation potential.
Establishing an inclusive supplier network – that is, minority enterprises defined by gender, ethnicity, disability, sexual orientation, and other characteristics – has become a key priority for SAP. We believe that our commitment to an inclusive, bias-free culture in our workplace must be mirrored in our approach to our supplier base.
Driven by our Global Procurement Organization (GPO), our supplier diversity program is an integral part of our supplier management program. It strives to ensure that diverse businesses have a fair chance at competing for contracts and are treated equally with other SAP suppliers.
Targeted to reach a 5% spend ratio for diversity suppliers in selected countries by 2020, GPO proactively involves diversity suppliers in all categories into our sourcing process.
In 2018, based on a successful pilot, GPO implemented a supplier diversity task force that comprises dedicated buyers from all categories, aimed at identifying and including potential diversity-certified suppliers for all requests for proposals. Currently, we are investigating an extension of our supplier diversity program to also include Tier 2 suppliers into our supplier diversity program and further enhance our fraction of diversity suppliers.
As part of its current supplier diversity program, SAP is currently a corporate member of the following minority supplier certification organizations in 2019:
– National Minority Supplier Development Council (NMSDC)
– WEConnect International
– US Business Leadership Network (USBLN)
Leveraging our partnership with the Social Enterprise World Forum, in April 2019, SAP partnered with Social Enterprise UK (SEUK) to participate in the Buy Social Corporate Challenge, an initiative through which leading corporate entities integrate social enterprises into their supply chains with the aim of achieving a combined £1 billion spend by year end 2020. For SAP, the objective
230 | | Sustainable Procurement |
To Our | Combined Group | Consolidated Financial | Further Information on Economic, | Additional |
Stakeholders | Management Report | Statements IFRS | Environmental, and Social Performance | Information |
of joining this initiative is to improve social welfare and connect corporate buyers with social-enterprise suppliers to help them prosper and grow. Within this partnership, SAP also explores the use of SAP technology to help social enterprises run better.
Upholding High Standards Across Our Supply Chain
Our supplier code of conduct is included in our standard supplier contracts and is an essential part of our supplier registration. This supplier registration ensures that potential suppliers of SAP are aware of SAP’s basic code of acceptable conduct. We review and update our supplier code of conduct regularly to maintain high standards within our supplier network. This strengthens the code’s enforceability and sends a clear signal about its importance for SAP.
In 2019, we updated our Supplier Code of Conduct to include our environmental policy. Our supplier code of conduct also contains provisions on the Modern Slavery Act, diversity and inclusion, and a labor standards chapter that expressly refers to human rights.
Furthermore, we recommend SAP suppliers to deliver goods and services that are accessible to everyone, including people with disabilities.
Improving Sustainability Through Technology
In 2019, we went live with the SAP Ariba Supplier Risk solution to incorporate supplier risk management in our daily business operations. This enables us to identify, manage, mitigate, and avoid sustainability risks within our supply chain. These risks include, for example, workplace discrimination, workplace safety neglect, the use of child labor, human trafficking, and environmental disasters such as oil spills and radioactive contamination.
Additionally, this innovative solution helps SAP measure due diligence activity and report on information-sharing programs across the supply chain. By providing insights into supplier risk, the solution enables us to detect early warning signals, minimize costly disruptions, and proactively monitor risk factors for each supplier. In this way, we can prioritize our corporate responsibilities, quantify the impact we want our business to have, and identify the critical issues affecting the supply chain.
Governance
Similar to our supplier diversity task force, we have also set up a cross-category task force of GPO buyers that is dedicated to actively improving our sustainability practices and initiating close collaboration with suppliers to find new and innovative ways to make our supply chain more sustainable.
Our chief procurement officer and chief sustainability officer meet each quarter to discuss progress and challenges related to embedding sustainability in our procurement practices.
1) Car Fleet includes procurement relating to the global company car fleet. IT Infrastructure procures products and services for SAP’s cloud business such as network services and data center and co-location goods and services. Marketing & Travel supports topics related to SAP’s marketing, events, merchandise, and business travel areas. Professional Services includes application and development services as well as financial and legal services. Sourcing Excellence Champions are responsible for the seamless execution of procurement and sourcing activities and are drivers for customer satisfaction and end user success. Workplace Infrastructure includes procurement for areas such as facility services, client services, and equipment, communication, and collaboration services.
Sustainable Procurement | 231 |
To Our | Combined Group | Consolidated Financial | Further Information on Economic, | Additional |
Stakeholders | Management Report | Statements IFRS | Environmental, and Social Performance | Information |
Waste and Water
Taking a Global Approach
Our waste and water strategy aims to continuously reduce SAP’s impact on the environment. By promoting company-wide initiatives, we dispose less waste and reduce the amount of water we use in locations worldwide. A global approach combined with local targets and initiatives allow for optimizing our environmental performance.
Taking steps to recycle our waste and save water also contributes to our business performance. Through ongoing initiatives at SAP sites, we reduce our operational costs while engaging our employees in our efforts.
Managing Our E-Waste
Our e-waste comes from data center servers and from IT equipment including PCs, peripherals, and mobile devices. In multiple SAP locations, we cooperate with international and local e-waste disposal partners to refurbish and recycle our e-waste.
In addition, we support the reuse of IT equipment internally through used-equipment shops in some country locations.
E-Waste
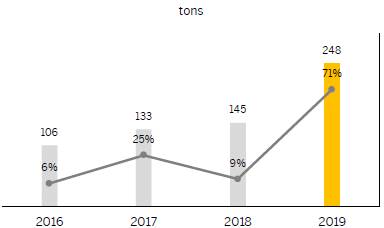
Cutting Down on Landfill Waste
In 2019, we continued to improve waste segregation, evolve our processes, and reduce waste at many offices across the globe. As part of our ISO 14001 program, SAP sites such as Dublin, Sofia, Vancouver, Walldorf, and other locations improved recycling through waste diversion programs or new waste bin systems.
We reduced our paper usage by 43% since 2009. Initiatives such as our global printing optimization have supported this decrease, despite a 110.8% increase in employee headcount over the same period. Among other improvements, this initiative sets printers to produce double-sided, black-and-white printouts by default. In 2019, we continued our approach of paperless contracting. By using the SAP Signature Management application by DocuSign, which enables electronic signatures, we were able to cut down the printing of paper-based contracts by more than 190,000 pages in 2019 (2018: 194,000 pages).
We have also successfully changed working behavior to significantly reduce the number of pages that our employees print. A secure pull-printing system requires that employees bring their ID badges to a printing device to activate a job. This ensures better document security, and makes people think about whether the printout is really needed. More than 89,000 employees are currently using this system. Through all of these initiatives, our printing volume has gone down by 25.8 million pages in total since 2014. SAP employees can access a printing dashboard that shows the company’s progress in reducing paper consumption at global, regional, and country levels.
At our headquarter cafeterias in Walldorf and St. Leon-Rot, we implemented a smart technology to analyze, measure, monitor, and reduce food waste. This allows us to better plan meals. In 2019, we were able to avoid 16.8 tons of food waste. In St. Leon-Rot, we have also collaborated with Foodsharing, an initiative of volunteers who collect leftover food and distribute it in the local communities.
Finding Alternatives to Single-Use Plastic
In 2019, SAP published its latest global environmental policy, which now also includes a goal to phase out single-use plastics by the end of 2020. We therefore launched the ‘beyond single-use plastics’ initiative to identify and eliminate single-use plastics and introduce sustainable alternatives. Successful projects such as the reduction of single-use plastics in Dublin and Galway or the recent introduction of reusable coffee mugs in Buenos Aires and New York City serve as best practices. In October 2019, we launched the ‘no time to waste’ employee campaign to actively involve employees in the project and raise awareness of the global plastics crisis.
Furthermore, we have already been able to reduce the use of plastic water bottles in some of our locations, such as Brussels, Caen, Perth, Walldorf, and St. Leon-Rot. At SAP Perth alone, SAP was able to avoid over 3,000 bottles per year.
To Our | Combined Group | Consolidated Financial | Further Information on Economic, | Additional |
Stakeholders | Management Report | Statements IFRS | Environmental, and Social Performance | Information |
Using Water Efficiently
While our operations are not water-intensive, we continue to use water as efficiently as possible. For example, we use rain and run-off water for irrigation and toilets in our headquarters in Walldorf, Germany, and other office locations.
A number of our offices are located in areas with significant water scarcity. In Johannesburg, South Africa and Manila, Philippines, we have been addressing this issue with dedicated water management efforts. These include, for example, water-saving faucets and boreholes to save clean, fresh water.
Global Water Usage

To Our | Combined Group | Consolidated Financial | Further Information on Economic, | Additional |
Stakeholders | Management Report | Statements IFRS | Environmental, and Social Performance | Information |
Public Policy
SAP has developed trusting relationships with governments worldwide by exploring the potential for information and communications technology (ICT) to spur economic growth, create jobs, and address societal challenges. This includes governments in their role as our customers, by supporting their digital transformation to become more efficient, effective, and citizen-oriented.
SAP engages with governments around the globe on a number of public policy issues, including the creation of reasonable framework conditions for new technologies or business models such as cloud computing, the Internet of Things, and Big Data.
SAP has created an eleven-point plan for the digitalization of Germany. This plan is available at https://discover.sap.com/government-relations/de-de/index.html
(English version: https://assets.dm.ux.sap.com/digitalhub/government_relations/pdfs/sap-politikbrief_jun2019-en.pdf), and calls for the following:
1. Digitalizing Germany’s education system to better prepare people for the future of work
2. Fostering artificial intelligence (AI) as a growth driver while keeping the integrated and human-centric approach of the German government’s AI strategy
3. Improving conditions for startups
4. Expanding the gigabit infrastructure and digital testbeds
5. Making the EU General Data Protection Regulation (GDPR) innovation-friendly and promoting digital business models
6. Harnessing technological potential to benefit data policies in the health sector to improve healthcare
7. Avoiding the overregulation of digital B2B platforms
8. Digitalizing public administration to improve efficiency and citizen-centricity
9. Making enterprise tax law more competitive to encourage innovation and investment
10. Fostering the free flow of data to safeguard the long-term competitiveness of European ICT companies
11. Harmonizing export control standards internationally.
SAP believes in transparency in the political process. Accordingly, we are registered in the European Transparency Register for interest representatives. In the United States, our company is registered and reports in compliance with the Lobbying Disclosure Act.
Political Contributions
In line with the SAP Code of Business Conduct, SAP does not support any political parties. Under the laws of the United States, a number of SAP employees exercise their right to create a political action committee (PAC). The SAP America PAC is an independent, registered, and strictly regulated organization that allows eligible employees in the United States to support political candidates at the state and federal levels. Consistent with U.S. law, SAP exercises no control over or influence on the SAP America PAC. SAP America PAC expenditures are transparent and available on the U.S. Federal Election Commission Web site.
To Our | Combined Group | Consolidated Financial | Further Information on Economic, | Additional |
Stakeholders | Management Report | Statements IFRS | Environmental, and Social Performance | Information |
Memberships
To better understand and enable sustainable performance on a global level, both for our company and customers, SAP subscribes to and routinely engages in a range of third-party organizations, including:
– Advancing Women Executives
– Alliance for Integrity
– Bitkom e.V.
– Business for Social Responsibility
– Cellular Telephone Industries Association
– Deutschland sicher im Netz e.V.
– DIGITALEUROPE
– econsense e.V.
– Federation of German Industries
– Industrial Internet Consortium
– Information Technology Industry Council
– National Chambers of Commerce
– International Integrated Reporting Council
– Mechanical Engineering Industry Association
– Organization for International Investment
– Schmalenbach-Gesellschaft für Betriebswirtschaft e.V.
– Society of Corporate Compliance & Ethics
– The Conference Board, Inc.
– The Sustainability Consortium
– The Wall Street Journal CEO Council
– TRACE International
– Transparency International Germany
– United Nations Global Compact (since 2000)
– Value Balancing Alliance e.V.
– World Economic Forum
To Our | Combined Group | Consolidated Financial | Further Information on Economic, | Additional |
Stakeholders | Management Report | Statements IFRS | Environmental, and Social Performance | Information |
Non-Financial Notes:
Social Performance
General Information About Social Indicators
Boundaries
Our reporting takes two different perspectives into account: SAP as a company, which includes all our legal entities and operations and supply chain, and SAP as a solution provider enabling our customers. These boundaries are listed in detail in the GRI Standard Content Index.
Social Indicators
Data for our social indicators is collected and reported on a quarterly or annual basis and is audited at a reasonable assurance level.
Employee Retention
We define employee retention as a ratio that puts emphasis on employee-initiated turnover – in other words, we seek to measure how many employees choose to stay with SAP. As opposed to keeping a low turnover rate – which companies generally seek to do – we aim to keep our retention rate high. A higher retention rate signifies that fewer employees are choosing to leave SAP. The number of voluntarily departed employees now excludes the voluntary part of restructuring-related departures for more transparency and precise headcount management purposes.
Women in Management
We define “women in management” as the share of women in management positions as compared to the total number of managers.
At SAP, we differentiate between the following categories of managers:
– Managers managing teams: Refers to managing teams of at least one employee or vacant positions
– Managers managing managers: Refers to managing managers who manage teams
– Board members
Business Health Culture Index
The Business Health Culture Index (BHCI) is an indicator of the extent to which SAP successfully offers employees a working environment that promotes health supporting their long-term employability and their active engagement in reaching our ambitious corporate goals. The index covers questions concerning how employees rate their personal well-being and the working conditions at SAP, including our leadership culture.
The BHCI is calculated based on the results of our annual employee survey #Unfiltered powered by Qualtrics. All employees were invited to take part in the 2019 People Survey and approximately 71,783 employees participated (response rate: 71%). The BHCI score for 2014 was recalculated from 70% to 72% based on two updated questions in the survey concerning work-life balance. The changes were carried out to simplify the questionnaire and to better compare against external benchmarks.
Employee Engagement
We define employee engagement as a score for the level of employee commitment, pride, and loyalty, as well as our employees’ feeling of advocacy for SAP.
It is calculated based on the results of our annual employee survey #Unfiltered.
236 | Non-Financial Notes: Social Performance |
To Our | Combined Group | Consolidated Financial | Further Information on Economic, | Additional |
Stakeholders | Management Report | Statements IFRS | Environmental, and Social Performance | Information |
Non-Financial Notes:
Environmental Performance
Environmental Performance
We understand environmental performance as the measurable outcome of SAP’s ability to meet environmental objectives and targets set forth in our environmental policy. In this context, we determine SAP’s greenhouse gas footprint (in the following called carbon emissions), total energy consumed, and data center energy as the three key environmental performance indicators. Furthermore, we realize external reductions by purchasing offsets and renewable energy which is partly self-generated in SAP locations but primarily purchased in the form of Renewable Energy Certificates (RECs). Plus, we identify SAP’s waste and water consumption as additional environmental aspects.
By looking at the energy usage and emissions throughout our entire value chain, we gain insights to help us manage our environmental performance and, in turn, help our customers to do the same.
The activities and trends behind our results for 2019 are detailed below. This includes information about the areas in which we consume the most purchased electricity, as well as the impact caused by the use of our products.
Our net carbon emissions are calculated by deducting purchased renewable energy certificates and carbon offsets from our gross carbon emissions in the respective reporting period. Our gross carbon emissions for 2019 were 794 kilotons of CO2 equivalents (CO2e) (2018: 734 kilotons CO2e), including all carbon emission categories in Scope 1 and 2, as well as selected categories of Scope 3 as outlined in figure 1.
General Information
We consider the principle of Sustainability Context (the performance of the organization in the context of the limits and demands placed on environmental or social resources at the sectoral, local, regional, or global level) in a number of ways, such as by looking at global issues or trends including climate change and demographic shifts. For example, we assess our carbon emissions in the context of the emissions of the entire information and communications technology landscape, with particular focus on the abatement potential of the industry. When it comes to completeness, we recognize that while we comply with this principle in reporting on our own operations, we are still developing methodologies to reliably quantify our impact through our solutions.
Boundaries
Our reporting takes two different perspectives into account: SAP as a company, which includes all our legal entities and operations and supply chain, and SAP as a solution provider enabling our customers. These boundaries are listed in detail in the Content Index of the Global Reporting Initiative (GRI).
Reporting Approach
Data for our environmental indicators is collected and reported on a quarterly basis and is subject to external assurance for annual reporting.
Reporting on total energy consumed and data center energy is based on the data collected for the calculation of our carbon emissions. All numbers are based on the metric system. Whenever we state “tons,” we mean metric tons.
The indicators carbon emissions per employee and total energy consumed per employee are calculated on the basis of an average number of employees. This average is calculated by adding the FTEs at the end of each quarter and then dividing the result by four.
Carbon Emissions
Definition
We define the carbon emissions as the sum of all greenhouse gas emissions measured and reported for SAP, including the compensation with renewable energy or offsets.
Reporting Principles
SAP’s preparation of the carbon emissions is based on the Corporate Accounting and Reporting Standard (Scope 1 and 2) and the Corporate Value Chain (Scope 3) Standard of the World Resources Institute/World Business Council for Sustainable Development. This approach conforms to the requirements of GRI Standard indicators 302-1, 302-2, 305-1, 305-2, and 305-3.
In more detail, SAP reports our net carbon emissions according to the GHG (Greenhouse Gas) Protocol Scope 2. In this context, two different calculation approaches are possible: the classic location-based method and the recently introduced market-based method, which is an amendment to the GHG Protocol Scope 2.
Organizational Boundaries
SAP defines our organizational boundaries by applying the operational control approach as set out in the GHG Protocol.
Operational control is established when SAP has the full authority to introduce and implement its operating policies. The emissions of all operations over which the company has operational control and all owned, leased facilities, co-location data centers, and vehicles that the company occupies or operates are accounted for in the carbon emissions. They are based either on measurements or, where no measured data is available, on estimations and extrapolations.
A portion of SAP’s leased facilities operates under full-service or multitenant leases, where SAP does not have access to actual energy consumption information. SAP includes these facilities in our definition of operational control and accounts for them by estimating related energy consumption.
Non-Financial Notes: Environmental Performance | 237 |
To Our | Combined Group | Consolidated Financial | Further Information on Economic, | Additional |
Stakeholders | Management Report | Statements IFRS | Environmental, and Social Performance | Information |
To support the growing demand for SAP’s cloud offerings, we subcontract computation power in local third-party data centers. Carbon emissions are approximated and included based on the consumed computation power.
In most instances, however, SAP has 100% ownership of its subsidiaries. Accordingly, the difference between applying the control versus the equity approach is about 0.6% based on SAP revenue. If investments in associates were included, the difference would be even smaller, about 0.5%.
Data Consistency
Comparability
SAP uses a significance threshold of 5% for structural or organizational changes and 1% for methodology changes of total current-year emissions. A structural or organizational change that increases or decreases the total carbon inventory by 5% or more will trigger an adjustment of past years. A structural or organizational change that increases or decreases the total inventory by less than 5% will be considered insignificant and thus no adjustment will be made.
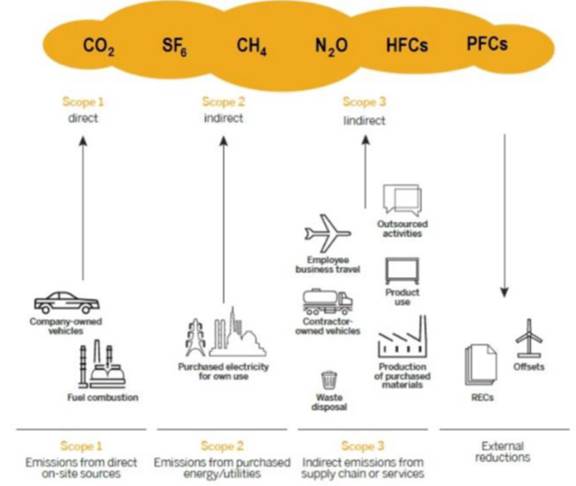
Additionally, we annually measure the cumulative cost avoidance of our carbon emissions, compared to a business-as-usual scenario. Since 2015, we apply a cumulative cost avoidance calculation approach using a triennial rolling method. This leads to additional comparability.
CO2 Emission Factors
The calculation of the carbon emissions is based on factors for conversion and extrapolation provided, among others, by IEA, WRI, US EPA, UK DEFRA, DEHSt, Environment Canada, GHG Protocol, and SAP’s own measurements.
Where relevant, our CO2 emissions factors consider all CO2 equivalents (CO2e) for all greenhouse gases. Global Warming Potential factors are based on the Fifth Assessment Report of the Intergovernmental Panel on Climate Change (IPCC).
Since 2016, we annually update all our emissions and extrapolation factors. Before 2016, the factors were stable each year as they were based on calculations from 2009.
Methodology & Further Details
We are reporting all our carbon emissions in CO2 equivalents (CO2e) including the impact from CH4, N2O, and HFCs in our Scope 1 and 2 emissions. As SF6 and PFCs mainly occur in chemical processes, they are not relevant for us.
Below you will find the different parameters contributing to our carbon emissions. We use CO2 and CO2e as synonyms in the following sections. The methodology explanation will be complemented by activities and trends.
Scope 1
Refers to direct carbon emissions and is defined as emissions from sources that are owned or controlled by the organization. At SAP, the following areas are covered by Scope 1:
– Stationary Combustion Facilities: Emission calculation is based on building gas or oil consumption in kWh. Where no measured data is available, stable values (kWh/m2) are used for extrapolation of buildings (59% data coverage). In cases where no specific information is available, natural gas reported by local sites is assumed to be reported in Lower Heating Value. Besides gas and oil, we also began using wood pellets to produce thermal heat for our buildings. The Scope 1 emissions of wood pellets can be set to net ‘0’, since the wood itself absorbs an equivalent amount of CO2 during the growth phase as the amount of CO2 released through combustion. Still, to ensure complete accounting for all emissions caused, we document the direct carbon dioxide impact of burning wood pellets as ‘outside of scopes’ CO2 emissions. In 2019, these emissions accounted for 872 tons of CO2.
– Refrigerants Facilities: Refrigerant data is reported for completeness of our carbon emissions, but HFC emissions are fully estimated (0% data coverage) based on the number of server units and office space with an air conditioning (A/C) system; all refrigerants are assumed to be HFC134a.
– Mobile Combustion Corporate Cars: In the context of carbon reporting, the term company car refers to all cars for which SAP covers the fuel costs. Emission calculation is based on fuel consumption. In 2019, 26 countries reported actual fuel data (92% data coverage); for other countries, stable values (liters/car) are used for extrapolation based on the number of corporate cars reported. The stable values for extrapolation are based on SAP’s 2018 carbon emissions data.
– Refrigerants Corporate Cars: Refrigerant emissions are based on an estimate of HFC emissions per car and are extrapolated based on the number of corporate cars reported (0% data coverage).
– Mobile Combustion Corporate Jets: Emission calculation for SAP’s own jets is based on actual fuel consumption (100% data coverage).
Consumption of fuel for our company cars remains the single greatest contributor to our Scope 1 emissions. In 2019, we continued to enhance our car policy by linking emissions caps to efficiency improvements of the automotive industry. In addition, we focused on greater shifts in commuting habits. We continued the global rollout of TwoGo by SAP, our car-sharing solution, which is now available in 119 SAP locations worldwide. To increase the scale and attractiveness of TwoGo, we make the solution available to the public free of charge. As part of our initiative to increase the proportion of electric vehicles in our car fleet to 20% by 2020, we
238 | Non-Financial Notes: Environmental Performance |
To Our | Combined Group | Consolidated Financial | Further Information on Economic, | Additional |
Stakeholders | Management Report | Statements IFRS | Environmental, and Social Performance | Information |
continue to offer incentives to our employees to purchase electrical cars. As an example of additional transportation alternatives for our employees, we offer a company bike program in Germany, where employees can now also use a bicycle in addition to their company car to commute to work. A further commuting alternative to a company car in Germany is participation in a national reduced train fare program called “BahnCard 100.”
Scope 2
Refers to indirect carbon emissions and is defined as emissions from the consumption of purchased electricity, steam, or other sources of energy generated upstream from the organization. At SAP, the following areas are covered by Scope 2:
– Electricity Office: Calculation of emissions is based on building electricity consumption. Emission factors are updated annually. Where no measured data is available, stable values (kWh/m2) based on SAP’s 2018 carbon emissions data are used for extrapolation (73% data coverage).
– Electricity Data Centers: This category refers to SAP-owned and SAP-managed data centers coming from acquisitions. Calculation of emissions is based on data center electricity consumption. Emission factors are updated annually. Where no data is available, electricity consumption for internal data centers is extrapolated based on the number of server units (95% data coverage). The stable values are based on SAP’s 2018 carbon emissions data.
– Purchased Chilled and Hot Water, Steam: Calculation of emissions is based on consumption of district heating. Emission factors are updated annually. Where no measured data is available, stable values (kWh/m2) based on SAP’s 2018 carbon emissions data are used for extrapolation (62% data coverage).
We continued a wide range of efficiency projects to reduce our electricity usage, including facility upgrades and new LEED certifications. We also expanded the management of our environmental performance through ISO 14001. In addition, we are one of the global corporations that have signed on to the RE100 initiative. Led by The Climate Group in partnership with CDP (formerly Carbon Disclosure Project), the goal of the RE100 campaign is to have 100 of the world’s most influential businesses committed to 100% renewable electricity.
Scope 3
Refers to other indirect carbon emissions and is defined as emissions that are a consequence of operations of an organization, but are not directly owned or controlled by the organization. Scope 3 emissions are divided into upstream and downstream emissions.
Only selected upstream emissions are measured directly and hence included in our corporate target. The additional upstream emissions such as products and services or grey energy of our buildings are based on an estimate. Together, our upstream emissions including these estimates are responsible for about 12% of SAP’s total carbon emissions.
The following Scope 3 carbon emissions are included in our corporate carbon target:
– Business Flights: Calculation of emissions is based on actual distance travelled and actual costs spent (55% data coverage). This data is used to determine average emission factors for short, medium, and long-haul flights. For CO2 calculation, these factors are applied to actual controlling costs for business flights. Emission factors for business flights do not consider the radiative forcing factors.
– Rental Cars: Average emission factors from rental cars are calculated based on actual distance and actual costs spent (78% data coverage). These factors are used for extrapolation based on the controlling costs.
– Train Travel: Average emission factors from train travel are calculated based on actual distance traveled and actual costs spent (36% data coverage). These factors are used for extrapolation based on the controlling costs.
– Business Trips with Private Cars: Carbon calculation is based on distance traveled with a private car; extrapolation is based on FTE (100% data coverage). Company car trips are excluded from this activity type.
– Employee Commuting: A system-integrated commuting survey about the distance to work and the mode of transport is regularly conducted for SAP globally. Approximately 28,000 employees responded to the survey in 2018. These survey responses are the basis for carbon calculation of employee commuting in 2019. Commuting data for non-responding employees and quarterly updates are extrapolated based on the number of FTEs excluding those employees who own a company car (26% data coverage).
– Electricity External Data Centers: An external data center (co-location) is a local computing center with server units running SAP software that is operated by an external partner. CO2 conversion factors are updated annually based on country specific grid factors and include CH4 and N2O factors. Electricity consumption for external data centers is extrapolated based on the data center capacity, a utilization factor, and a power usage effectiveness (PUE) factor. As the utilization and PUE factors are not available for all external data centers, average factors are determined as follows: The utilization factor for external data centers is calculated as the sum of all actual consumptions divided by the sum of contracted server power of these data centers. The average PUE is calculated as the sum of all provided PUEs divided by the number of data centers that have provided this factor (100% data coverage).
– Electricity Hyperscale Data Centers: Hyperscale data centers enable massive, efficient, and robust scalability of computing, system, and server architecture in order to respond to the increasing demand for cloud computing and Big Data solutions. Electricity consumption is calculated based on the average allocated server memory size (RAM) of all hyperscale services. A power conversion factor is used to convert the allocated RAM value into a server power value. Data center utilization factor and PUE factors are used to extrapolate the total hyperscale service electricity. As these factors are not known, the average factors of external data centers are used (100% data coverage).
– Logistics: Calculation is based on the actual number of parcels and mail sent from our logistics center in Germany and is extrapolated globally (22% data coverage).
– Data Download: Due to missing data in 2019, carbon calculation is extrapolated based on the data volume downloaded by our customers globally in the previous year (0% data coverage).
– Paper Consumption: Calculation of emissions caused by the consumption of printing paper is based on printer tracker data (100% data coverage). The emissions factor for paper was
Non-Financial Notes: Environmental Performance | 239 |
To Our | Combined Group | Consolidated Financial | Further Information on Economic, | Additional |
Stakeholders | Management Report | Statements IFRS | Environmental, and Social Performance | Information |
updated in 2019 due to a new assessment methodology applied by the Environmental Paper Network (whose emissions calculation tool we use). As a result, the factor has increased by about 3.5 times.
Additionally, each year we measure and publish the following Scope 3 carbon emissions based on the GHG Protocol’s Corporate Value Chain (Scope 3) Accounting and Reporting Standard. These emissions are not included in our corporate target and are meant for indicative purposes only.
Upstream
Due to the link of our upstream emissions to operating expenses, for 2019, we extrapolated our upstream figures by multiplying our four key contributors to our upstream emissions from 2018 with the year-over-year increase of operating expenses between 2018 and 2019.
Downstream
– Use of Sold Products: The vast majority of our overall emissions stem from the use of our software. When SAP software runs on our customers’ hardware and on their premises, the resulting carbon emissions are about 40 times the size of our own net carbon emissions (12.1 million tons in 2019). SAP is eager to cooperate with customers to optimize their on-premise landscapes. However, given that we have no control over our customers’ IT landscapes as they usually contain a lot of third-party products, we share this responsibility with others. Resource need per year is determined using a landscape simulation. It is extrapolated globally based on the number of productive installations and power usage effectiveness (PUE). We use a PUE factor of 1.58, which is the average PUE of our external data centers. Emissions are calculated using a global electricity emission factor. Due to the special characteristics of software products, we chose an assessment of resource need per year. This deviates from the minimum boundaries as defined by the GHG Protocol’s Corporate Value Chain (Scope 3) Accounting and Reporting Standard, which requires assessment and disclosure of “direct use-phase emissions of sold products over their expected lifetime.” The calculation covers all of our major solutions, including on-premise software. Cloud solutions are not included, as they are part of our Scope 2 emissions. Mobile solutions (for example, SAP apps running on customer IT equipment) are also not included. Calculation parameters will be adapted when significant technology changes occur.
– Other Scope 3 Emissions Not Included: Upstream Transportation and Distribution (due to data complexity and de minimis); Upstream Leased Assets (not applicable); Processing of Sold Products (not applicable); End-of-Life Treatment of Sold Products (not applicable); Downstream Leased Assets (not applicable); Franchises (not applicable); and investments (not applicable).
External Reduction
SAP uses external reductions, such as purchases of renewable energy and certified voluntary “offsets,” to achieve its carbon targets. Emission reductions are subtracted from gross Scope 1 to 3 emissions to achieve a net carbon inventory.
Renewable Electricity
We define renewable energy as electricity coming from renewable energy sources such as wind, solar, hydro, and geothermal. The shares of renewable energy used by SAP are calculated by adding the amount of renewable energy specifically sourced, produced onsite by our own solar cells, and covered by Renewable Energy Certificates (RECs). We have developed a quality standard that defines key criteria for the procurement of RECs to drive change in the electricity market and to avoid the risk caused by low-quality products. The key characteristics of our renewable energy purchasing guidelines are as follows:
– Type of Renewable Electricity: SAP considers solar, wind, biogas, geothermal, and hydro power as renewable electricity. In 2019, we sourced only wind and solar energy.
– Installation: The power plant producing the renewable energy shall not be older than 10 years. In case of a renovation of an old power plant, the 10-year rule applies only to the additional electricity output due to efficiency increase. Furthermore, SAP does not consider RECs from government supported power plants.
– Vintage: The renewable electricity must be produced in the same year or the year preceding the reporting period to which it will be applied.
– Accounting: SAP uses the grid-specific emissions factor to calculate the carbon reduction achieved by the RECs. As RECs are considered independently to the electricity achieved through their procurement, they can be allocated to any location globally
All energy outside the aforementioned categories falls within conventional energy. We define conventional energy as electricity coming from the standard electricity grid. The electricity grid provides a country-specific energy mix including all available sources, either fossil, nuclear, or renewable. Energy from renewable sources as part of the local grid is calculated as conventional energy and not displayed as part of renewable energy.
To calculate the carbon reductions of the RECs, the amount of purchased electricity is multiplied by the grid-specific carbon factor derived from the location where the renewable energy was produced. However, data is only valid with an official certificate or written confirmation of the electricity supplier (100% data coverage).
In the net carbon emissions, the purchased as well as the produced renewable electricity is already deducted from our Scope 2 emissions.
Offsets
We compensate our Scope 3 emissions by investing in the Livelihood Funds and their high-quality carbon credits, which are included in our overall net carbon emissions. By using this investment, the Fund aims to abate emissions or sequester carbon from the atmosphere, while at the same time ensuring additional social benefits for developing countries.
On top of this, SAP invests in carbon emission offsets for air travel by charging an internal carbon price which is later invested in sustainable projects worldwide. Furthermore, for employees who own a so-called climate neutral fuel card for their company car, SAP pays a small additional fee per liter gas purchased, which is then invested in Gold Standard certified compensation projects or equivalent very high quality standards.
240 | Non-Financial Notes: Environmental Performance |
To Our | Combined Group | Consolidated Financial | Further Information on Economic, | Additional |
Stakeholders | Management Report | Statements IFRS | Environmental, and Social Performance | Information |
The investments in sustainable projects are equivalent to a certain amount of carbon reductions.
A requirement for carbon offsets is the application of the Voluntary Carbon Standard (VCS) and equally very high quality standards. SAP ensures that the quantified carbon emission reductions from offsets are credible and that they meet four key accounting principles:
– Real: The carbon reductions represent actual emission reductions that have already occurred.
– Additional: The carbon reductions are surplus to regulation and would not have happened without the offset.
– Permanent: The carbon reductions are permanent or have guarantees to ensure that any losses are replaced in the future.
– Verifiable: The performance of the carbon reduction projects can be readily and accurately quantified, monitored, and verified.
In the net carbon emissions, purchased offsets are already deducted from our gross emissions.
Total Energy Consumed
We define total energy consumed as the sum of all energy consumed through SAP-own operations, including energy from renewable sources. It is calculated based on the consumption data obtained through our measurements for the carbon emissions and is the sum of energy consumption from stationary combustion facilities, mobile combustion corporate cars, mobile combustion corporate jets, electricity offices, electricity data centers, purchased chilled water, purchased hot water, and purchased steam.
Data Center Electricity
We define data center electricity as the sum of electricity consumed to provide internal and external computation power in SAP data centers, contracted third-party data centers, and hyperscale data centers. A data center is any global, regional, or local computing center (location with any number of server units) that is part of our global IT infrastructure strategy. In 2019, we continued to analyze and report internal and external data center energy consumption intensity against our non-IFRS revenue.
Data center energy consumption per euro is calculated by dividing the electricity consumption of all internal and external data centers measured for the calculation of our carbon emissions by our revenue.
We will continuously improve the data quality of energy consumption of external data centers.
As we expect that emissions from external data centers will continue to grow in the future, SAP committed to a green cloud strategy and to compensate the emissions with renewable electricity certificates. By referring to the green cloud, we mean that SAP’s cloud is carbon neutral due to purchasing 100% renewable electricity certificates and compensation by offsets.
Additional Environmental Aspects
Water
By water, we mean the total amount of freshwater withdrawn for our facilities. Data is based on estimations from sites and is largely extrapolated. Data was provided (estimated) for 53% of the total space; remaining data is extrapolated based on square meter footage.
E-Waste
By e-waste, we mean any discarded electric devices used in our offices and data centers. Data is based on the weight of the devices (96% data coverage).
Non-Financial Notes: Environmental Performance | 241 |
To Our | Combined Group | Consolidated Financial | Further Information on Economic, | Additional |
Stakeholders | Management Report | Statements IFRS | Environmental, and Social Performance | Information |
GRI Index and UN Global Compact Communication on Progress
The social and environmental data and information included in the SAP Integrated Report 2019 has been prepared in accordance with the GRI Standards: Core option.
General | | External | UN Global |
Standard | Links and Content | Assurance | Compact |
Disclosures | | | Principles |
102-1 | Strategy and Business Model | √ | |
102-2 | Strategy and Business Model | √ | |
102-3 | Strategy and Business Model | √ | |
102-4 | Strategy and Business Model | √ | |
102-5 | Strategy and Business Model | √ | |
| Financial Performance: Review and Analysis; | √ | |
| | | |
102-6 | Strategy and Business Model; | √ | |
| www.sap.com/industries.html | | |
102-7 | Headcount and Personnel Expense; | √ | |
Scope of Consolidation, Subsidiaries and Other Equity Investments; | √ | |
Consolidated Financial Statements IFRS; | √ | |
Financial Performance: Review and Analysis | √ | |
102-8 | Chart Generator; | | 6 |
Non-Financial Notes | √ |
102-9 | Sustainable Procurement | √ | 3 |
102-10 | There were no changes with significant impacts regarding our own organization or our supply chain. | √ | |
Strategy and Business Model | √ | |
Assets (IFRS) | √ | |
Sustainable Procurement | √ | |
| We support a precautionary approach towards environmental management. While we see little apparent risk for our own operations, we do see an opportunity to help our customers anticipate and manage this risk in a more agile and responsive fashion through effective product lifecycle management and sustainable design. | √ | |
102-11 | Risk Management and Risks | √ | 7 |
| Sustainability Management and Policies | √ | |
| Strategy and Business Model | √ | |
102-12 | Memberships | √ | |
102-13 | Memberships | √ | |
102-14 | Letter from the Co-CEOs | | |
102-16 | Business Conduct; | √ | 10 |
Employees and Social Investments | √ |
102-18 | Corporate Governance Report; | | |
Sustainability Management and Policies | √ | |
102-40 | Stakeholder Engagement | √ | |
102-41 | Stakeholder Engagement | √ | |
102-42 | Stakeholder Engagement | √ | |
102-43 | Stakeholder Engagement; | √ | |
Customers | √ | |
242 | | GRI Index and UN Global Compact Communication on Progress |
To Our | Combined Group | Consolidated Financial | Further Information on Economic, | Additional |
Stakeholders | Management Report | Statements IFRS | Environmental, and Social Performance | Information |
| Stakeholder Engagement; | | | | √ | |
102-44 | Customers; | | | | √ | |
| Employees and Social Investments | | | | √ | |
102-45 | Scope of Consolidation, Subsidiaries and Other Equity Investments | | | √ | |
| All entities are covered by the report. | | | | |
102-46 | Materiality; | | | | √ | |
| Non-Financial Notes | | | | √ | |
102-47 | Materiality | | | | √ | |
102-48 | Non-Financial Notes | | | | √ | |
102-49 | Non-Financial Notes | | | | √ | |
102-50 | About This Report | | | | √ | |
102-51 | February 28, 2019 | | | | √ | |
102-52 | Annual Reporting Cycle | | | | √ | |
102-53 | Investor Services | | | | | |
102-54 | About This Report | | | | √ | |
102-55 | GRI Content Index | | | | √ | |
| Independent Assurance Report; | | | | √ | |
102-56 | Management’s Acknowledgement of the SAP Integrated Report 2019; | | | | |
| About This Report | | | | √ | |
Topic | Links and Content | Omissions | Boundaries | External | Sustainable | UN Global |
Specific | | | | Assurance | Development | Compact |
Disclosures | | | | | Goal | Principles |
Material Topic: Business Conduct | | | | | |
103-1 | Business Conduct; | | | √ | | |
GRI Index | | | √ | | |
103-2 | Business Conduct | | | √ | | 10 |
103-3 | Business Conduct | | | √ | | |
205-1 | Business Conduct; | | | √ | | |
Risk Management and Risks | | SAP | √ | 16 | 10 |
206-1 | Other Litigation, Claims, and Legal | | | √ | | |
Contingencies | | SAP | | 16 | |
415-1 | Public Policy | | | √ | 16 | 10 |
Material Topic: Climate and Energy | |
103-1 | Energy and Emissions; | | | √ | | |
GRI Index | | | √ | | |
103-2 | Energy and Emissions; | | | √ | | 7, 8 |
Sustainability Management and Policies | | | √ | | |
103-3 | Energy and Emissions; | | | √ | | |
Sustainability Management and Policies | | | √ | | |
302-1 | Energy and Emissions; | | SAP | √ | 7, 8, 12, 13 | 7, 8 |
| Non-Financial Notes; | | | √ | | |
| Chart Generator | | | | | |
302-2 | Energy and Emissions; | | SAP + | √ | 7, 8, 12, 13 | 7, 8 |
| Non-Financial Notes | | external | √ | | |
| | | parties | | | |
302-3 | Energy and Emissions; | | SAP | √ | 7, 8, 12, 13 | 8 |
| Non-Financial Notes; | | | √ | | |
| Chart Generator; | | | | | |
| Five-Year Summary | | | | | |
| The ratio uses only energy consumption within the organization. | | | √ | | |
| | | | | | | |
GRI Index and UN Global Compact Communication on Progress | | 243 |
To Our | Combined Group | Consolidated Financial | Further Information on Economic, | Additional |
Stakeholders | Management Report | Statements IFRS | Environmental, and Social Performance | Information |
302-4 | Energy and Emissions; | | SAP | √ | 7, 8, 13 | 8 |
| | | | | | |
| Non-Financial Notes | | | √ | | |
305-1 | Energy and Emissions; | | SAP | √ | 3, 12, 13, 14, 15 | 7, 8 |
| | | | | | |
| Non-Financial Notes; | | | √ | | |
| Chart Generator | | | | | |
305-2 | Energy and Emissions; | | SAP | √ | 3, 12, 13, 14, 15 | 7, 8 |
| | | | | | |
| Non-Financial Notes; | | | √ | | |
| Chart Generator | | | | | |
305-3 | Energy and Emissions; | | External
parties | √ | 3, 12, 13, 14, 15 | 7, 8 |
| | | | | |
| Non-Financial Notes; | | √ | | |
| Chart Generator | | | | | |
305-4 | Chart Generator; | | SAP +
external
parties | | 13, 14, 15 | 8 |
| Non-Financial Notes | | | | |
| | | √ | | |
305-5 | Energy and Emissions; | | SAP +
external
parties | √ | 13, 14, 15 | 8, 9 |
| | | | | |
| Non-Financial Notes; | | √ | | |
| Chart Generator | | | | |
305-6 | | The emission of ozone- depleting substances (ODS) is not material to us as a software company. | | √ | 3, 12, 13 | |
Material Topic: Financial Performance | | | | | |
103-1 | Not only do we create financial value for SAP and our shareholders, we also create wealth for a broad range of stakeholders. We do this through employee wages and benefits, payments to our value chain and ecosystem, and tax payments to local governments and economies, for example. We are working on understanding the impact our solutions have on our customers’ success, and we document this impact in case studies. SAP does not conduct community assessment programs. | | | √ | | |
| GRI Index | | | √ | | |
| Sustainability Management and Policies; | | | √ | | |
| | | | | | |
103-2 | Expected Developments and Opportunities; | | | √ | | |
| Report by the Supervisory Board | | | | | |
103-3 | Report by the Supervisory Board | | | | | |
Growth and Profitability | Financial Performance: Review and Analysis | | SAP | √ | | |
| | |
203-1 | | The amount of these investments is not material for SAP. | | | | |
203-2 | Strategy and Business Model; | | External
parties | √ | 1, 3, 8 | 9 |
| www.sap.com/corporate/en/purpose.html | | |
Material Topic: Human Capital | | | | | |
103-1 | Nothing has a greater impact on our long-term success than the creativity, talent, and commitment of our people. Their ability to innovate and understand the needs of our customers delivers sustainable value to our company and our society. | | | √ | | |
| GRI Index | | | √ | | |
103-2 | Sustainability Management and Policies; | | | √ | | 1, 2, 6 |
| Employees and Social Investments | | | √ | | |
103-3 | Sustainability Management and Policies; | | | √ | | |
| Employees and Social Investments | | | √ | | |
Employee Engagement | Employees and Social Investments | | SAP | √ | | 6 |
| |
| | | | | | | |
244 | | GRI Index and UN Global Compact Communication on Progress |
To Our | Combined Group | Consolidated Financial | Further Information on Economic, | Additional |
Stakeholders | Management Report | Statements IFRS | Environmental, and Social Performance | Information |
Business Health Culture Index | Employees and Social Investments | Injuries, diseases, lost days, or absenteeism are not a material issue for SAP, as we track our Business Health Culture Index on a global basis. | SAP | √ | 3 | |
Leadership | Employees and Social Investments | | SAP | √ | | 6 |
403-1 | | Workers’ representation in formal joint management/worker health and safety committees is not a material topic to SAP, as there are no workers with a high number of incidences or high risk of diseases due to their work within SAP. | SAP | √ | 8 | |
403-3 | There are no workers with a high number of incidences or a high risk of diseases due to their work within SAP. | | | | 3, 8 | |
405-1 | Corporate Governance Statement; | | SAP | | 5, 8 | |
| www. sap. com/investors/en/investors/governa | | | | | |
| nce.html | | | | | |
| Chart Generator | | | | | |
Material Topic: Innovation and Customer Loyalty | | | | | |
103-1 | At SAP, we are committed to our purpose of helping the world run better and improving people’s lives. To help achieve this, we create innovations that help accelerate economic prosperity, drive positive social impact, and safeguard the planet. Our customers inspire what we do, from the first spark of innovation to the design and completion of new products, not to mention the way in which we serve their needs over time. | | | √ | | |
| Strategy and Business Model; | | | √ | | |
| GRI Index | | | √ | | |
| Sustainability Management and Policies; | | | √ | | |
| | | | | | |
103-2 | Customers; | | | √ | | |
| Stakeholder Engagement | | | √ | | |
| Sustainability Management and Policies; | | | √ | | |
| | | | | | |
103-3 | Customers; | | | √ | | |
| Performance Management System | | | √ | | |
404-1 | Employees and Social Investments | Training hours split by gender and employee category are not a material issue for SAP, as we align our training activities according to the needs of each employee and do not tolerate discrimination. | SAP | √ | 4, 5, 8, 10 | |
404-2 | Employees and Social Investments | | SAP | √ | 8 | |
| For continued employability issues and managing career endings, SAP has dedicated staff to support generational intelligence. These experts work to continuously improve processes and design programs that sustain employability for as long as possible. They provide training for cross-generation collaboration, facilitate flexible career endings for employees (for example, part- time options), and keep employees connected with the company after retirement. SAP also participates in external research studies and networks on workforce demographics to share and learn about best practices in this field. | | | | | |
GRI Index and UN Global Compact Communication on Progress | | 245 |
To Our | Combined Group | Consolidated Financial | Further Information on Economic, | Additional |
Stakeholders | Management Report | Statements IFRS | Environmental, and Social Performance | Information |
404-3 | Employees and Social Investments | The split by gender is | SAP | √ | 5, 8, 10 | |
| | proprietary information for | | | | |
| | SAP. | | | | |
R&D and | Products, Research & Development, and | | SAP | √ | | |
Local | Services | | | | | |
Innovation | | | | | | |
Material Topic: Human and Digital Rights | | | | | |
| Security, Data Protection, and Privacy; | | | √ | | |
103-1 | Human Rights and Labor Standards; | | | √ | | |
| GRI Index | | | √ | | |
103-2 | Security, Data Protection, and Privacy; | | | √ | 8, 16 | |
| Human Rights and Labor Standards | | | √ | | |
103-3 | Security, Data Protection, and Privacy; | | | √ | | |
| Human Rights and Labor Standards | | | √ | | |
418-1 | Security, Data Protection, and Privacy | | SAP + | √ | 16 | |
| | | external | | | |
| | | parties | | | |
407-1 | Human Rights and Labor Standards | | SAP | √ | 8 | 3 |
| We are not aware of any operations or suppliers | | | | | |
| in which the right to exercise freedom of | | | | | |
| association and collective bargaining may be at | | | | | |
| significant risk. | | | | | |
408-1 | Human Rights and Labor Standards | | SAP | √ | 8, 16 | 5 |
| We are not aware of any operations or suppliers | | | | | |
| as having significant risk for incidents of child | | | | | |
| labor. | | | | | |
409-1 | Human Rights and Labor Standards | | SAP | √ | 8 | 4 |
| We are not aware of any operations or suppliers | | | | | |
| as having significant risk for incidents of forced | | | | | |
| or compulsory labor. | | | | | |
Material Topic: Impact on Society | | | | | |
| We believe that digital technologies will help | | | | | |
| companies and organizations contribute to the | | | | | |
| United Nations’ 17 SDGs. We provide our | | | | | |
| customers and partners with the solutions that | | | | | |
| help them make a difference. This may be | | | | | |
| through empowering those disadvantaged in | | | | | |
| society, by offering financial services, building | | | | | |
| infrastructure, or combating climate change. | | | | | |
103-1 | As well as creating positive impacts through our | | | | | |
| solutions, SAP is deeply committed to | | | | | |
| empowering the world’s youth, working adults, | | | | | |
| differently-abled people, and the unemployed | | | | | |
| with the right skills they need to thrive in the | | | | | |
| digital economy. | | | | | |
| Strategy and Business Model; | | | √ | | |
| Powering Opportunity Through Digital Inclusion | | | √ | | |
| GRI Index | | | √ | | |
103-2 | Sustainability Management and Policies | | | √ | | |
103-3 | Sustainability Management and Policies | | | √ | | |
UN | Strategy and Business Model; | | External | √ | 1 to 17 | |
Sustainable | Our Contribution to the UN SDGs | | parties | | | |
Development | | | | | | |
Goals | | | | | | |
Social | Employees and Social Investments | | SAP + | √ | | |
Investments | | | external | | | |
| | | parties | | | |
246 | | GRI Index and UN Global Compact Communication on Progress |
To Our | Combined Group | Consolidated Financial | Further Information on Economic, | Additional |
Stakeholders | Management Report | Statements IFRS | Environmental, and Social Performance | Information |
Task Force on Climate-Related
Financial Disclosure (TCFD)
The TCFD recommends companies to disclose their climate-related financial risks to investors, lenders, insurers, and other stakeholders. SAP started to report in alignment with the TCFD recommendations in 2018. For more information, see the table below.
Area | Content | Chapter |
Governance | SAP’s governance of climate-related risks and opportunities. | Energy and Emissions |
| | |
| | |
Strategy | Actual and potential impacts of climate-related risks and opportunities on SAP’s | Risk Management and Risks; |
| businesses, strategy, and financial planning where such information is material. | Strategy and Business Model; |
| | Energy and Emissions |
| | |
Risk Management | How does SAP identify, assess, and manage climate-related risks? | Risk Management and Risks |
| | |
| | |
| | |
Metrics and Targets | Metrics and targets that SAP uses to assess and manage relevant climate-related risks | Energy and Emissions; |
| and opportunities where such information is material. | Risk Management and Risks; |
| | Chart Generator |
Task Force on Climate-Related Financial Disclosure (TCFD) | | 247 |
To Our | Combined Group | Consolidated Financial | Further Information on Economic, | Additional |
Stakeholders | Management Report | Statements IFRS | Environmental, and Social Performance | Information |
Management’s Acknowledgement of
the SAP Integrated Report 2019
The International Integrated Reporting (<IR>) Framework launched by the International Integrated Reporting Council in December 2013 has a provision that an integrated report should include a statement in which management acknowledges its responsibility for the report. Our respective statement for 2019 is as follows:
The Executive Board is aware of its responsibility to ensure the integrity of the SAP Integrated Report 2019. The members of the Executive Board have applied their collective mind to the preparation and presentation of our integrated report.
Similar to previous reports, we have applied the Guiding Principles of the <IR> Framework, but we also must ensure our compliance with legal requirements, such as the provisions regarding financial reporting in the German Commercial Code as set out in detail in the German Accounting Standard 20 Group Management Report, while balancing other reporting standards such as the GRI Standards of the Global Sustainability Standards Board, with the <IR> Framework.
Our Executive Board has reviewed the SAP Integrated Report 2019, including the consolidated financial statements, the combined management report, and the further information on economic, environmental, and social performance.
Our Executive Board believes that this integrated report is presented in accordance with the <IR> Framework as far as possible given the aforementioned restrictions. Should the aforementioned restrictions ever cease to apply, we will continue to strive for further alignment with the <IR> Framework in future reports.
248 | | Management’s Acknowledgement of the SAP Integrated Report 2019 |
To Our | Combined Group | Consolidated Financial | Further Information on Economic, | Additional |
Stakeholders | Management Report | Statements IFRS | Environmental, and Social Performance | Information |
Assurance Report of the Independent
Auditor regarding Sustainability
Information
To the Executive Board of SAP SE, Walldorf
We have been engaged to perform an independent assurance engagement on selected qualitative and quantitative sustainability disclosures as well as on selected quantitative sustainability indicators included in the Integrated Report (further “Report”) for the business year from January 1 to December 31, 2019 of SAP SE, Walldorf (further “SAP”), published under https://www.sap.com/integrated-reports/2019/en.html.
For the selected quantitative sustainability indicators Business Health Culture Index; Employee Engagement Index; Employee Retention Rate; Ratio of Women in Management; Total Gross and Net Carbon Emissions (Scope 1, Scope 2 and selected Scope 3 emissions); Renewable Energy Certificates; Total Energy Consumption; and Customer Net Promoter Score, including the explanatory notes supplementing these indicators (further “sustainability indicators”), a reasonable assurance engagement was performed.
For the following selected qualitative and quantitative sustainability disclosures included in About This Report, in the ‘Combined Management Report’ (sections: SAP’s Impact; Security, Data Protection, and Privacy; Employees and Social Investments; Energy and Emissions; and Business Conduct), in ‘Further Information on Economic, Environmental, and Social Performance’ (sections: Materiality; Stakeholder Engagement; Sustainability Management and Policies; Human Rights and Labor Standards; Sustainable Procurement; Waste and Water; Public Policy; GRI Index), including the Non-Financial Notes: Social Performance and the Non-Financial Notes: Environmental Performance (further “sustainability disclosures”) a limited assurance engagement was performed.
Selected sustainability disclosures included in the scope of our assurance engagement are marked in the GRI Content Index with the following symbol: „√”.
Management´s Responsibility
The legal representatives of SAP are responsible for the preparation of the Report in accordance with the Reporting Criteria. SAP applies the principles and standard disclosures of the Global Reporting Initiative (GRI) Sustainability Reporting Standards, the Corporate Accounting and Reporting Standard (Scope 1 and 2) and the Corporate Value Chain (Scope 3) Standard of the Greenhouse Gas Protocol Initiative by the World Resources Institute and the World Business Council for Sustainable Development, in combination with internal guidelines, as described in the ‘Non-Financial Notes: Social Performance’ and the ‘Non-Financial Notes: Environmental Performance’ as Reporting Criteria (further: “Reporting Criteria”).
This responsibility of the legal representatives includes the selection and application of appropriate methods to prepare the Report and the use of assumptions and estimates for individual qualitative and quantitative sustainability disclosures, which are reasonable under the circumstances. Furthermore, this responsibility includes designing, implementing and maintaining systems and processes relevant for the preparation of the Report in a way that is free of – intended or unintended – material misstatements.
Independence and quality assurance on the part of the auditing firm
We are independent from the entity in accordance with the requirements of independence and quality assurance set out in legal provisions and professional pronouncements and have fulfilled our additional professional obligations in accordance with these requirements.
Our audit firm applies the national statutory provisions and professional pronouncements for quality assurance, in particular the Professional Code for German Public Auditors and Chartered Accountants (in Germany) and the quality assurance standard of the German Institute of Public Auditors (Institut der Wirtschaftsprüfer, IDW) regarding quality assurance requirements in audit practice (IDW QS 1).
Practitioner’s Responsibility
Our responsibility is to express a conclusion based on our work performed on the aforementioned sustainability indicators and the sustainability disclosures.
We conducted our work in accordance with the International Standard on Assurance Engagements (ISAE) 3000 (Revised): “Assurance Engagements other than Audits or Reviews of Historical Financial Information” of the International Auditing and Assurance Standards Board (IAASB).
This standard requires that we plan and perform the assurance engagement to obtain reasonable assurance that the aforementioned sustainability indicators for the business year January 1 to December 31, 2019 have been prepared, in all material respects, in accordance with the Reporting Criteria; and to obtain limited assurance whether no matters have come to our attention that cause us to believe that the sustainability disclosures of the entity for the business year January 1 to December 31, 2019 have not been prepared, in all material respects, in accordance with the Reporting Criteria. We do not, however, provide a separate conclusion on each disclosure. In a limited assurance engagement
Assurance Report of the Independent Auditor regarding Sustainability Information | | 249 |
To Our | Combined Group | Consolidated Financial | Further Information on Economic, | Additional |
Stakeholders | Management Report | Statements IFRS | Environmental, and Social Performance | Information |
the evidence gathering procedures are more limited than in a reasonable assurance engagement and therefore significantly less assurance is obtained than in a reasonable assurance engagement. The choice of assurance procedures is subject to the auditor’s own judgement.
Within the scope of our engagement, we performed amongst others the following assurance procedures:
– Inquiries of personnel on corporate level, who are responsible for the materiality analysis, in order to gain an understanding of the processes for determining material sustainability topics and respective reporting boundaries of SAP
– A risk analysis, including a media search, to identify relevant sustainability information on SAP’s sustainability performance in the reporting period
– Interviewing management at corporate level responsible for sustainability performance goal setting and monitoring process
– Assessing the suitability of the internally developed Reporting Criteria
– Evaluation of the design and implementation of the systems and processes for the collection, processing and monitoring of the sustainability indicators and sustainability disclosures included in the scope of this engagement
– Inquiries of personnel on corporate level responsible who are responsible for providing the data, for conducting internal controls and consolidation of the sustainability indicators, including the ‘Non-Financial Notes’
– Analytical evaluation of data and trends of the sustainability indicators and sustainability disclosures
– Reviewing the consistency of GRI Standard’s in accordance with ‘Core Option’ as declared by SAP with sustainability performance information presented in the Report
– Performing control-based assurance procedures to assess the design, implementation and effectiveness of internal controls used to collect and process data reported for the sustainability indicators, including the consolidation of the data on corporate and site level
– Substantive assurance procedures using internal and external documentation in order to determine in detail whether the sustainability indicators correspond to relevant underlying sources
– Conducting site visits to Walldorf, St. Leon Rot (both Germany) and Newtown Square (USA) to assess the quality of information management systems and the reliability of the data as reported to corporate level.
Conclusions
Based on the procedures performed and evidence received to obtain reasonable assurance, the sustainability indicators for the business year from January 1 to December 31, 2019, published in the Report, including the Non-Financial Notes supplementing these indicators, are, in all material respects, presented in accordance with the Reporting Criteria.
Based on the procedures performed and evidence received to obtain limited assurance, nothing has come to our attention that causes us to believe that the sustainability disclosures for the business year from January 1 to December 31, 2019, published in the Report, are not prepared, in all material respects, in accordance with the Reporting Criteria.
Restriction of use / Clause on General Engagement Terms
This report is issued for purposes of the Executive Board of SAP SE, Walldorf, only. We assume no responsibility with regard to any third parties.
Our assignment for the Executive Board of SAP SE, Walldorf, and professional liability is governed by the General Engagement Terms for Wirtschaftsprüfer and Wirtschaftsprüfungsgesellschaften (Allgemeine Auftragsbedingungen für Wirtschaftsprüfer und Wirtschaftsprüfungsgesellschaften) in the version dated January 1, 2017 (https://www.kpmg.de/bescheinigungen/lib/aab_english.pdf).
By reading and using the information contained in this report, each recipient confirms notice of provisions of the General Engagement Terms (including the limitation of our liability for negligence to EUR 4 million as stipulated in No. 9) and accepts the validity of the General Engagement Terms with respect to us.
Munich, February 19, 2020
KPMG AG Wirtschaftsprüfungsgesellschaft
250 | | Assurance Report of the Independent Auditor regarding Sustainability Information |
To Our
Stakeholders | Combined Group
Management Report | Consolidated Financial
Statements IFRS | Further Information on Economic,
Environmental, and Social Performance | Additional
Information |
Additional Information
Five-Year Summary | 252 |
Glossary (Abridged) | 256 |
Financial Calendar and Addresses | 268 |
Financial and Sustainability Publications | 269 |
Publication Details | 270 |
Additional Information | 251 |
To Our
Stakeholders | Combined Group
Management Report | Consolidated Financial
Statements IFRS | Further Information on Economic,
Environmental, and Social Performance | Additional
Information |
Five-Year Summary1)
€ millions, unless otherwise stated | 2019 | 2018 | 2017 | 2016 | 2015 |
Revenues | | | | | |
Cloud (IFRS) | 6,933 | 4,993 | 3,769 | 2,993 | 2,286 |
Non-IFRS adjustments | 81 | 33 | 2 | 2 | 10 |
Cloud (non-IFRS) | 7,013 | 5,027 | 3,771 | 2,995 | 2,296 |
Software licenses (IFRS) | 4,533 | 4,647 | 4,872 | 4,859 | 4,835 |
Non-IFRS adjustments | 0 | 0 | 0 | 2 | 1 |
Software licenses (non-IFRS) | 4,533 | 4,647 | 4,872 | 4,862 | 4,836 |
Software support (IFRS) | 11,547 | 10,981 | 10,908 | 10,571 | 10,093 |
Non-IFRS adjustments | 0 | 0 | 0 | 1 | 0 |
Software support (non-IFRS) | 11,548 | 10,982 | 10,908 | 10,572 | 10,094 |
Cloud and software (IFRS) | 23,012 | 20,622 | 19,549 | 18,424 | 17,214 |
Non-IFRS adjustments | 81 | 33 | 3 | 3 | 11 |
Cloud and software (non-IFRS) | 23,093 | 20,655 | 19,552 | 18,427 | 17,226 |
Services (IFRS = non-IFRS) | 4,541 | 4,086 | 3,912 | 3,639 | 3,579 |
Total revenue (IFRS) | 27,553 | 24,708 | 23,461 | 22,062 | 20,793 |
Non-IFRS adjustments | 81 | 33 | 3 | 5 | 11 |
Total revenue (non-IFRS) | 27,634 | 24,741 | 23,464 | 22,067 | 20,805 |
Share of more predictable revenue (IFRS, in %) | 67 | 65 | 63 | 61 | 60 |
Share of more predictable revenue (non-IFRS, in %) | 67 | 65 | 63 | 61 | 60 |
| | | | | |
Operating Expenses | | | | | |
Cost of cloud (IFRS) | –2,534 | –2,068 | –1,660 | –1,313 | –1,022 |
Non-IFRS adjustments | 305 | 213 | 233 | 247 | 232 |
Cost of cloud (non-IFRS) | –2,228 | –1,855 | –1,427 | –1,066 | –789 |
Cost of software licenses and support (IFRS) | –2,159 | –2,092 | –2,234 | –2,182 | –2,291 |
Non-IFRS adjustments | 141 | 130 | 190 | 238 | 283 |
Cost of software licenses and support (non-IFRS) | –2,018 | –1,962 | –2,044 | –1,944 | –2,008 |
Cost of cloud and software (IFRS) | –4,692 | –4,160 | –3,893 | –3,495 | –3,313 |
Non-IFRS adjustments | 446 | 343 | 423 | 485 | 516 |
Cost of cloud and software (non-IFRS) | –4,247 | –3,817 | –3,471 | –3,010 | –2,797 |
Cost of services (IFRS) | –3,662 | –3,302 | –3,158 | –3,089 | –2,932 |
Non-IFRS adjustments | 254 | 151 | 166 | 113 | 167 |
Cost of services (non-IFRS) | –3,408 | –3,151 | –2,991 | –2,976 | –2,765 |
Total cost of revenue (IFRS) | –8,355 | –7,462 | –7,051 | –6,583 | –6,245 |
Non-IFRS adjustments | 700 | 494 | 589 | 598 | 683 |
Total cost of revenue (non-IFRS) | –7,655 | –6,969 | –6,462 | –5,985 | –5,562 |
Research and development (IFRS) | –4,292 | –3,624 | –3,352 | –3,044 | –2,845 |
Research and development (in % of total revenue, IFRS) | 15.6 | 14.7 | 14.3 | 13.8 | 13.7 |
Research and development (in % of total operating expenses, IFRS) | 18.6 | 19.1 | 18.0 | 18.0 | 17.2 |
Sales and marketing (IFRS) | –7,693 | –6,781 | –6,924 | –6,265 | –5,782 |
General and administration (IFRS) | –1,629 | –1,098 | –1,075 | –1,005 | –1,048 |
Depreciation and amortization (IFRS) | –1,872 | –1,362 | –1,272 | –1,268 | –1,289 |
To Our
Stakeholders | Combined Group
Management Report | Consolidated Financial
Statements IFRS | Further Information on Economic,
Environmental, and Social Performance | Additional
Information |
€ millions, unless otherwise stated | 2019 | 2018 | 2017 | 2016 | 2015 |
Profits and Margins | | | | | |
Cloud gross margin (in % of corresponding revenue, IFRS) | 63.5 | 58.6 | 56.0 | 56.1 | 55.3 |
Cloud gross margin (in % of corresponding revenue, non-IFRS) | 68.2 | 63.1 | 62.2 | 64.4 | 65.6 |
Cloud and software gross margin (in % of corresponding revenue, IFRS) | 79.6 | 79.8 | 80.1 | 81.0 | 80.8 |
Cloud and software gross margin (in % of corresponding revenue, non-IFRS) | 81.6 | 81.5 | 82.2 | 83.7 | 83.8 |
Services gross margin (in % of corresponding revenue, IFRS) | 19.4 | 19.2 | 19.3 | 15.1 | 18.1 |
Services gross margin (in % of corresponding revenue, non-IFRS) | 25.0 | 22.9 | 23.5 | 18.2 | 22.7 |
Software and support gross margin (IFRS, in %) | 86.6 | 86.6 | 85.8 | 85.9 | 84.7 |
Software and support gross margin (non-IFRS, in %) | 87.4 | 87.4 | 87.0 | 87.4 | 86.6 |
Gross margin (in % of total revenue, IFRS) | 69.7 | 69.8 | 69.9 | 70.2 | 70.0 |
Gross margin (in % of total revenue, non-IFRS) | 72.3 | 71.8 | 72.5 | 72.9 | 73.3 |
Operating profit (IFRS) | 4,473 | 5,703 | 4,877 | 5,135 | 4,252 |
Non-IFRS adjustments | 3,735 | 1,459 | 1,892 | 1,498 | 2,095 |
Operating profit (non-IFRS) | 8,208 | 7,163 | 6,769 | 6,633 | 6,348 |
Operating margin (in % of total revenue, IFRS) | 16.2 | 23.1 | 20.8 | 23.3 | 20.5 |
Operating margin (in % of total revenue, non-IFRS) | 29.7 | 29.0 | 28.9 | 30.1 | 30.5 |
Financial income, net | 198 | –47 | 188 | –29 | –5 |
Profit before tax (PBT) | 4,596 | 5,600 | 5,029 | 4,872 | 3,991 |
PBT margin (in % of revenues) | 16.7 | 22.7 | 21.4 | 22.1 | 19.2 |
Income tax expense | –1,226 | –1,511 | –983 | –1,242 | –935 |
Profit after tax | 3,370 | 4,088 | 4,046 | 3,629 | 3,056 |
Effective tax rate (IFRS, in %) | 26.7 | 27.0 | 19.5 | 25.5 | 23.4 |
Effective tax rate (non-IFRS, in %) | 26.2 | 26.3 | 22.8 | 26.9 | 26.1 |
Return on equity (profit after tax in percentage of average equity) | 11 | 15 | 16 | 15 | 14 |
| | | | | |
Order Entry | | | | | |
New cloud bookings | 2,268 | 1,814 | 1,448 | 1,147 | 874 |
Orders – number of on-premise software deals (in transactions) | 52,584 | 58,530 | 59,147 | 57,291 | 57,439 |
Share of software orders greater than €5 million (in % of total software order entry) | 32 | 29 | 30 | 29 | 27 |
Share of software orders less than €1 million (in % of total software order entry) | 35 | 39 | 40 | 38 | 40 |
| | | | | |
Non-IFRS Adjustments | | | | | |
Revenue adjustments | 81 | 33 | 3 | 5 | 11 |
Adjustment for acquisition-related charges | 689 | 577 | 587 | 680 | 738 |
Adjustment for share-based payment expenses | 1,835 | 830 | 1,120 | 785 | 724 |
Adjustment for restructuring | 1,130 | 19 | 182 | 28 | 621 |
| | | | | |
Segment Results | | | | | |
Applications, Technology & Services | | | | | |
Segment revenue | 23,544 | 21,753 | 20,857 | 19,847 | 18,854 |
Segment gross margin (in % of corresponding revenue) | 74 | 73 | 74 | 75 | 75 |
Segment profit | 9,868 | 8,922 | 8,587 | 8,510 | 8,159 |
Segment margin (Segment profit in % of Segment revenue) | 42 | 41 | 41 | 43 | 43 |
Intelligent Spend Group | | | | | |
Segment revenue | 3,184 | 2,629 | 2,261 | 1,925 | 1,616 |
Segment gross margin (in % of corresponding revenue) | 70 | 69 | 68 | 68 | 68 |
Segment profit | 696 | 531 | 388 | 340 | 317 |
To Our
Stakeholders | Combined Group
Management Report | Consolidated Financial
Statements IFRS | Further Information on Economic,
Environmental, and Social Performance | Additional
Information |
€ millions, unless otherwise stated | 2019 | 2018 | 2017 | 2016 | 2015 |
Segment margin (Segment profit in % of Segment revenue) | 22 | 20 | 17 | 18 | 20 |
Qualtrics | | | | | |
Segment revenue | 508 | NA | NA | NA | NA |
Segment gross margin (in % of corresponding revenue) | 78 | NA | NA | NA | NA |
Segment profit | 8 | NA | NA | NA | NA |
Segment margin (Segment profit in % of Segment revenue) | 2 | NA | NA | NA | NA |
| | | | | |
Liquidity and Cash Flow | | | | | |
Net cash flows from operating activities | 3,496 | 4,303 | 5,045 | 4,628 | 3,638 |
Net cash flows from investing activities | –7,021 | –3,066 | –1,112 | –1,799 | –334 |
Net cash flows from financing activities | 102 | 3,283 | –3,406 | –2,705 | –3,356 |
Capital expenditure | –817 | –1,458 | –1,275 | –1,001 | –636 |
Free cash flow10) | 2,276 | 2,844 | 3,770 | 3,627 | 3,001 |
Free cash flow in % of total revenue | 8 | 12 | 16 | 16 | 14 |
Cash conversion rate
(net cash flows from operating activities in % of profit after tax) | 104 | 105 | 125 | 128 | 119 |
Cash and cash equivalents | 5,314 | 8,627 | 4,011 | 3,702 | 3,411 |
Short-term investments | 67 | 211 | 774 | 971 | 148 |
Group liquidity
(cash and cash equivalents/short-term investments/restricted cash) | 5,382 | 8,838 | 4,785 | 4,673 | 3,559 |
Financial debts | –13,668 | –11,331 | –6,264 | –7,826 | –9,174 |
Net liquidity (net debt) | –8,286 | –2,493 | –1,479 | –3,153 | –5,615 |
Days sales outstanding (DSO, in days) | 71 | 70 | 70 | 74 | 71 |
| | | | | |
Assets, Equity and Liabilities | | | | | |
Trade and other receivables | 8,037 | 6,480 | 6,017 | 6,050 | 5,362 |
Total current assets | 15,213 | 16,620 | 11,930 | 11,564 | 9,739 |
Goodwill | 29,162 | 23,736 | 21,271 | 23,311 | 22,689 |
Total non-current assets | 45,002 | 34,881 | 30,554 | 32,713 | 31,651 |
Total current liabilities (including contract liabilities/deferred income) | 14,462 | 10,486 | 10,210 | 9,674 | 7,867 |
Total non-current liabilities (including contract liabilities/deferred income) | 14,931 | 12,138 | 6,759 | 8,205 | 10,228 |
Total equity (including contract liabilities/deferred income) | 30,822 | 28,877 | 25,515 | 26,397 | 23,295 |
Total assets | 60,215 | 51,502 | 42,484 | 44,277 | 41,390 |
Contract liabilities/Deferred income – current (IFRS)7) | 4,266 | 3,028 | 2,771 | 2,383 | 2,001 |
Equity ratio (total equity in % of total assets) | 51 | 56 | 60 | 60 | 56 |
Debt ratio (total liabilities2) in % of total assets) | 49 | 44 | 40 | 40 | 44 |
Investments in goodwill, intangible assets, or property, plant, and equipment
(including capitalizations due to acquisitions) | 8,090 | 3,715 | 1,630 | 1,145 | 676 |
| | | | | |
Key SAP Stock Facts | | | | | |
Issued shares7) (in millions) | 1,229 | 1,229 | 1,229 | 1,229 | 1,229 |
Earnings per share, basic (in €) | 2.78 | 3.42 | 3.35 | 3.04 | 2.56 |
Earnings per share, basic (non-IFRS, in €) | 5.11 | 4.35 | 4.43 | 3.77 | 3.77 |
Earnings per share, diluted (in €) | 2.78 | 3.42 | 3.35 | 3.04 | 2.56 |
Dividend per share3) (in €) | 1.58 | 1.50 | 1.40 | 1.25 | 1.15 |
Total dividend distributed3) | 1,886 | 1,790 | 1,671 | 1,498 | 1,378 |
Total dividend distributed3) (in % of profit after tax) | 56 | 44 | 41 | 41 | 45 |
SAP share price7) (in €) | 120.32 | 86.93 | 93.45 | 82.81 | 73.38 |
SAP share price – peak (in €) | 124.72 | 108.02 | 100.35 | 82.81 | 74.85 |
To Our
Stakeholders | Combined Group
Management Report | Consolidated Financial
Statements IFRS | Further Information on Economic,
Environmental, and Social Performance | Additional
Information |
€ millions, unless otherwise stated | 2019 | 2018 | 2017 | 2016 | 2015 |
SAP share price – low (in €) | 84.31 | 82.47 | 82.43 | 64.90 | 54.53 |
Market capitalization7) (in € billions) | 147.81 | 106.80 | 114.80 | 101.73 | 90.18 |
Return on SAP shares4), 1-year investment period (in %) | 38.4 | –7.0 | 12.8 | 14.7 | 25.9 |
Return on SAP shares4), 5-year investment period (in %) | 15.6 | 6.9 | 9.0 | 17.3 | 14.0 |
Return on SAP shares4), 10-year investment period (in %) | 13.9 | 13.2 | 10.2 | 9.2 | 6.7 |
| | | | | |
Employees and Personnel Expenses | | | | | |
Number of employees5 ), 7) | 100,330 | 96,498 | 88,543 | 84,183 | 76,986 |
Number of employees, annual average5) | 99,157 | 93,709 | 86,999 | 80,609 | 75,180 |
Number of employees in research and development5), 7) | 27,634 | 27,060 | 24,872 | 23,363 | 20,938 |
Personnel expenses | 14,870 | 11,595 | 11,643 | 10,229 | 10,170 |
Personnel expenses – excluding share-based payments | 13,035 | 10,765 | 10,523 | 9,444 | 9,446 |
Personnel expenses per employee – excluding share-based payments (in € thousands) | 131 | 115 | 121 | 117 | 126 |
Operating profit per employee (in € thousands) | 45 | 61 | 56 | 64 | 57 |
Women working at SAP (in %) | 33.5 | 33.0 | 32.8 | 32.4 | 31.0 |
Women in management7) (total, in % of total number of employees) | 26.4 | 25.7 | 25.4 | 24.5 | 23.6 |
Women managing managers6), 7) (in %) | 22.5 | 21.1 | 21.7 | 20.8 | 19.2 |
Women managing teams6), 7) (in %) | 27.8 | 27.5 | 26.8 | 25.9 | 25.3 |
Employee Engagement Index (in %) | 83 | 84 | 85 | 85 | 82 |
Business Health Culture Index (BHCI, in %) | 80 | 78 | 79 | 78 | 75 |
Leadership Trust Index (LTI, as NPS) | 59 | 60 | 61 | 57 | 52 |
Employee retention (in %) | 93.3 | 93.9 | 94.6 | 94.3 | 92.9 |
Total turnover rate (in %) | 10.7 | 7.6 | 7.9 | 7.7 | 11.1 |
| | | | | |
Customer | | | | | |
Customer Net Promoter Score9) | –6.0 | –5.0 | 17.8 | 19.2 | 22.4 |
| | | | | |
Environment | | | | | |
Net greenhouse gas emissions (in kilotons) | 300 | 310 | 325 | 380 | 455 |
Greenhouse gas emissions per employee5) (in tons) | 3.0 | 3.3 | 3.8 | 4.7 | 6.0 |
Greenhouse gas emissions per € revenue (in grams) | 10.9 | 12.6 | 13.9 | 17.3 | 21.9 |
Total energy consumption (in GWh) | 955 | 919 | 920 | 950 | 965 |
Energy consumed per employee5) (in kWh) | 9,600 | 9,800 | 10,600 | 11,800 | 12,500 |
Total data center electricity (in GWh) | 338 | 318 | 265 | 243 | 249 |
Data center energy per € revenue8) (in Wh) | 12 | 13 | 11 | 11 | 12 |
Renewable energy sourced (in %) | 100 | 100 | 100 | 100 | 100 |
1) SAP Group. Amounts according to IFRS, unless otherwise stated.
2) As sum of current and non-current liability
3) Numbers are based on the proposed dividend and on level of treasury stock at year end.
4) Average annual return assuming all dividends are reinvested.
5) Full-time equivalents
6) Relates to different levels of management position.
7) Numbers at year end.
8) Data center energy consumption normalized against € revenuerepresents the required energy to develop and operate solutions in internal and external data center.
9) Due to changes in sampling in 2018, Customer NPS is not fully comparable to the prior-years scores.
10) As at January 1, 2019, we changed our free cash flow definition to avoid effects resulting from the adoption of IFRS 16.
To Our | Combined Group | Consolidated Financial | Further Information on Economic, | Additional |
Stakeholders | Management Report | Statements IFRS | Environmental, and Social Performance | Information |
Glossary (Abridged)
A
accessibility – Umbrella term for our efforts to ensure that the environment at SAP and large global events hosted by SAP are accessible for differently-abled people, such as by adding live and closed captioning on videos and keynote screens. We also endeavor to ensure that our software is accessible to the differently-abled.
Americas’ SAP Users’ Group (ASUG) – Non-profit organization comprising customer companies dedicated to providing educational and networking opportunities in support of SAP software and implementation. User groups are established in regions around the world to share knowledge and influence SAP development efforts. ASUG is the largest user group with more than 100,000 members from thousands of companies across the SAP ecosystem.
analytics – Discovery and communication of meaningful patterns in data. It is applied to business data to describe, predict, and improve business performance; recommend action; and guide decision making across all organizations and functions in a company. Analytics helps companies gain new insight and understanding of their business performance based on data and statistical methods. See “SAP Analytics” and “SAP Analytics Cloud.”
Ariba – See “SAP Ariba.”
Ariba Network – Business commerce network where companies of all sizes can connect to their trading partners anywhere, at any time from any application or device to buy, sell, and manage their cash more efficiently and effectively than ever before. Companies around the world use Ariba Network to simplify interenterprise commerce and enhance the results they deliver. In 2019, partnerships with Barclaycard Commercial Payments, American Express, and Standard Chartered Bank helped establish new payment and financial supply chain solutions on Ariba Network. See “SAP Business Network.”
artificial intelligence (AI) – The standard definition of AI refers to the simulation of human intelligence processes by machines and computer systems. These processes include learning through the acquisition of information and rules for using information; reasoning through using the rules to reach approximate or definite conclusions; and by self-correction. AI capabilities are built into SAP’s intelligent technologies. See “SAP Leonardo Artificial Intelligence” and “intelligent technologies.”
Autism at Work – Outreach program connects people on the autism spectrum with SAP employment resources with an emphasis on careers in technology. In 2019, SAP onboarded people with autism in 27 different roles, in 14 countries, and 31 locations through this program.
B
best practices – A management concept that involves devising a method of process that most effectively produces a desired outcome. SAP applications use business best practices to help customers automate common business processes through software and technology. See “SAP Best Practices.”
Big Data – In general, the term refers to the large volume of data created by billions of connected devices and people generating a tremendous amount of information about their behavior, location, and activity. This availability of massive amounts of data requires companies to rethink technology architecture and database structures. SAP technology can help manage Big Data through distributed storage and computing, real-time insight discovery, and insights embedded into business processes. See “SAP Cloud Platform Big Data Services.”
blockchain – Based on distributed ledgers, blockchain technology securely records information across peer-to-peer networks. Although originally created for trading Bitcoin, the potential of blockchain reaches far beyond cryptocurrency. Blockchain ledgers can include land titles, loans, identities, logistics manifests – almost anything of value. The technology is still developing and areas for business application are growing. See “SAP Leonardo Blockchain.”
Build Customers for Life – Program that helps harmonize the customer experience in postsales with ongoing implementation projects, including customer success management, customer service management, outage management, and one customer portal. See “SAP for Me.”
business data platform – See “SAP HANA.”
Business Health Culture Index (BHCI) – Score for the general cultural conditions in an organization that enable employees to stay healthy and balanced. The index is calculated based on the results of regular employee surveys.
business intelligence (BI) – Software that enables users to analyze an organization’s raw data and make fact-based decisions. BI-related processes include data mining, analytical processing, querying, and reporting. BI offerings from SAP include SAP BusinessObjects BI solutions, SAP Crystal Reports, as well as the SAP BusinessObjects BI platform. See “SAP BusinessObjects Business Intelligence.”
business process – Set of logically related activities performed within an organization to complete a defined business task. SAP provides software and technology that enable and support business processes. Order processing and payroll are typical examples. SAP offers solutions that address end-to-end business processes. See “end-to-end process.”
Business Technology Platform – Introduced in 2019, this portfolio represents a set of applications, services, technology, analytics, intelligent technologies, and tools. It addresses four key technology areas: database and data management; application development and integration; intelligent technologies; and an open cloud platform. It helps customers manage data orchestration across their entire landscape, providing real-time visibility into distributed data silos with data management solutions as well as an open cloud platform for integration and business process innovation. It is a core element of SAP’s Intelligent
To Our | Combined Group | Consolidated Financial | Further Information on Economic, | Additional |
Stakeholders | Management Report | Statements IFRS | Environmental, and Social Performance | Information |
Enterprise strategy. See “SAP Cloud Platform” and “Intelligent Enterprise.”
C
CallidusCloud – See “Callidus Software.”
Callidus Software – Sales performance management company acquired by SAP in April 2018 known for lead-to-cash and configure, price, quote (CPQ) solutions. Former CallidusCloud solutions are now part of the broader SAP C/4HANA suite, most available in SAP Sales Cloud. See “SAP C/4HANA” and “SAP Sales Cloud.”
Call to Lead – SAP program that brings together thought leaders and executives from across industries to share personal experiences and best practices for creating and supporting diverse and inclusive communities. Call to Lead Unplugged is the companion event series for executives to network and share their stories about thought leadership and customer experience.
carbon credit – A tradable certificate that allows the holder to emit one ton of CO2 or the respective equivalent of any other greenhouse gas.
carbon emission offset – Unit of carbon dioxide-equivalent (CO2 equivalent) that is reduced, avoided, or sequestered to compensate for emissions occurring elsewhere.
carbon impact – Term used for SAP’s ambitious short-term and long-term carbon reduction targets. We measure our net carbon footprint according to Greenhouse Gas (GHG) Protocol. The net carbon footprint is calculated by deducting emission savings such as renewable electricity and carbon offsets from our gross carbon footprint.
carbon neutral – Goal or state of emitting net zero greenhouse gases for certain activities. This includes reducing emissions, but also using renewable electricity certificates or carbon credits.
cloud computing – Generic term for flexible, IT-related services available through, or hosted on, the Internet for consumers and business, including storage, computing power, software development environments, and applications, combined with service delivery. Accessed as needed “in the cloud,” these services eliminate the need for in-house IT resources. See “cloud service.”
cloud credit(s) – As part of the consumption-based commercial model for SAP Cloud Platform, cloud credits are the monetary value for prepaid service consumption. These credits are acquired through the SAP Cloud Platform Enterprise Agreement through a pre-investment. With cloud credits as a payment equivalent, customers can consume the cloud services they need. See “SAP Cloud Platform” and “SAP Cloud Platform Enterprise Agreement.”
Cloud ERP – See “Intelligent ERP.”
Cloud Foundry – Open source platform as a service backed by the largest technology companies in the world, including Cisco, Dell EMC, Google, Hewlett Packard Enterprise, IBM, Microsoft, Pivotal, SAP, and SUSE. Its container-based architecture runs apps in any language on any choice of cloud platform; a Cloud Foundry environment is available for SAP Cloud Platform. See “platform as a service (PaaS).”
cloud service – “As-a-service” offerings where cloud services are offered as infrastructure as a service (IaaS), platform as a service (PaaS), or software as a service (SaaS). Also called cloud service model.
cloud solutions from SAP – Category used to communicate all of SAP offerings and efforts related to the cloud, including platform, managed services, solutions, technology, and infrastructure.
Code of Business Conduct – Global compliance document communicated to all SAP employees globally that contains a fundamental set of rules that define how we conduct our business and require the highest levels of integrity and ethics. The Code sets the standard for our dealings with customers, partners, competitors, and vendors, and each of our employees is bound by it. It is adapted locally and translated into local languages. We also expect our partners and suppliers to commit to meeting our high standards of integrity and sustainability through the SAP Partner Code of Conduct and the SAP Supplier Code of Conduct.
Concur Technologies – see “SAP Concur.”
connectivity – Framework that describes the interrelatedness of SAP’s social, environmental, and financial performance. Based on statistical analysis, it allowed us to quantify the impact of non-financial measures on the operating profit offering a holistic understanding of SAP’s value creation. We do not quantify financial impact in the SAP Integrated Report 2019.
continuous success – Category of services from SAP Digital Business Services that support our cloud solutions and on-premise software to help customers move to the cloud and make SAP S/4HANA their Intelligent ERP of choice.
Coresystems – Crowd sourcing and field service management company acquired by SAP in November 2018. Coresystems software is now integrated in SAP offerings. See “SAP C/4HANA”, SAP Field Service Management,” and “SAP Leonardo IoT.”
Corporate Oncology Program for Employees – Available in Australia, Canada, Germany, United Kingdom, and the United States, the program provides SAP employees facing cancer with access to an individual molecular genetic tumor analysis and interpretation.
corporate social responsibility (CSR) – see “SAP Corporate Social Responsibility.”
Customer First – Global cross-Board initiative that focuses on efforts to improve the way everyone at SAP works and cares for our customers by ensuring we provide a consistent, positive, end-to-end experience that delivers successful outcomes.
Customer Net Promoter Score (NPS) – Metric that describes the willingness of customers to recommend or promote an organization or company to others. It is defined as the percentage of customers that are likely to recommend an organization or company to friends or colleagues (promoters) minus the percentage of customers that are unlikely to do so.
D
data center energy – Amount of energy consumed in SAP’s own and external data centers. An external data center is a local computing center with server units running SAP software that is operated by an external partner.
data platform (as a service) – See “SAP HANA Cloud.”
data warehouse/data warehousing – Electronic collection of information organized for easy access by computer programs. See “SAP Business Warehouse” and “SAP BW/4HANA.”
digital core – See “Intelligent ERP.”
digital transformation – Concept that refers to the changes associated with the application of digital technology in all aspects of
To Our | Combined Group | Consolidated Financial | Further Information on Economic, | Additional |
Stakeholders | Management Report | Statements IFRS | Environmental, and Social Performance | Information |
society. Digital technologies empower customers and consumers in a way they never could before, transforming their relationship with brands and products. Businesses need to meet these new challenges or will miss the potential business success to be realized in the digital economy.
DSAG – Abbreviation for Deutschsprachige SAP-Anwendergruppe (German-Speaking SAP Users’ Group), with more than 60,000 members in more than 3,500-member companies in German-speaking countries (Austria, Germany, and Switzerland).
E
ecosystem – Construct encompassing SAP and our customers and partners that extends the value SAP can provide. By bringing together community-based insight, innovative partner solutions, and industry-leading collaboration and co-innovation, the ecosystem enables customers to extract the greatest possible value from their SAP investments. Our ecosystem currently consists of more than 20,000 partners worldwide that build, sell, service, and run SAP solutions and technology.
Embrace – A collaborative initiative between SAP, Microsoft, and global strategic service partners to help bring existing SAP ERP customers to an SAP S/4HANA-centric application landscape in the cloud.
Employee Engagement Index – Score for the level of employee commitment, pride, and loyalty, as well as the feeling of employees of being advocates for their company. The index is calculated based on the results of regular employee surveys.
employee retention – The ratio of the average number of employees minus the employees who voluntarily departed (excluding restructuring-related terminations) to the average number of employees (in full-time equivalents or FTEs).
end-to-end process – Set of activities supporting defined management, core, or support processes. Customers can use these activities as a reference to map their own processes. See “business process.”
engagement survey – SAP’s annual engagement survey under the theme of #Unfiltered in 2019 started a new era of feedback experience using Qualtrics technology. Formerly called “People Survey.”
enterprise resource planning – See “SAP ERP.”
e-waste (electronic waste) – Any discarded electric devices used in our offices and data centers, such as computers, computer monitors, or mobile devices.
Experience Company powered by the Intelligent Enterprise – The SAP strategy that asserts every digital interaction is an opportunity for a company to positively influence someone. Through these interactions, companies can measure “experiences” – such as customer satisfaction, employee engagement, partner collaboration, and brand impact, for example. We want to help every SAP customer thrive in the “experience economy” by equipping them with the technologies they need to become intelligent enterprises. See “Intelligent Enterprise.”
experience data (X-data) – Data that shows you what your customers feel about your products and services. See “Experience Management (XM).”
Experience Management (XM) – Experience Management (XM) solutions combine experience data (X-data) and operational data (O-data) to measure and improve the experiences provided to customers and stakeholders. The term refers to both the technology as well as the discipline of seeking out and closing the gaps found in the four core experiences of business – customer, product, employee, and brand. See “Qualtrics XM Platform.”
F
Fieldglass – See “SAP Fieldglass.”
G
General Data Protection Regulation (GDPR) – Set of laws that came into force on May 25, 2018, which affects data privacy practices throughout the European Union (EU).
Gigya – Company acquired by SAP in 2017 that offers customer identity technology and access management solutions designed to meet privacy, compliance, and security best practices. Gigya solutions are now included in the SAP Customer Data Cloud solution as part of the SAP C/4HANA suite. See “SAP C/4HANA” and “SAP Customer Data Cloud.”
Global Customer Reference Program – Program offering detailed information about reference customers from around the world using a database that channel partners can access to help close a deal with a new SAP customer. Reference customers have agreed to participate in one or more reference activities on behalf of SAP.
green cloud – Term to describe our strategy to run all internal, external, and hyperscale data centers with 100% renewable electricity through the purchase of Renewable Energy Certificates. See “Renewable Energy Certificates (RECs).”
H
Hasso Plattner Founders’ Award – Introduced in 2014, this award represents the most prestigious employee recognition at SAP for delivering our vision and strategy, presented annually to an individual or a team. The award is named after one of the original founders of SAP and current chairman of the SAP Supervisory Board, Prof. Dr. Hasso Plattner.
“How We Run” – Corporate behaviors (core values) that describe how we get things done at SAP and what makes our culture unique. These five behaviors are a cornerstone of our value-driven culture: tell it like it is; stay curious; embrace differences; keep the promise; build bridges, not silos.
hybrid cloud – Deployment model that uses resources comprised of a mix of two or more distinct cloud deployment models that are integrated by standardized or proprietary technology enabling data and application portability. Also called “hybrid cloud deployment model.”
hybrid landscape – Mix of on-premise and any cloud deployment models. Alternatively referred to as an “on premise to cloud” or “hybrid environment.”
I
industry – An economic sector characterized by a typical value chain, business processes, and set of products and services that the companies operating in it have in common. At SAP, “industries” is also used as a term to differentiate between line-of-business functions such as marketing, procurement, and finance, and those functions specific to an industry. The SAP portfolio addresses the
To Our | Combined Group | Consolidated Financial | Further Information on Economic, | Additional |
Stakeholders | Management Report | Statements IFRS | Environmental, and Social Performance | Information |
needs of 25 industries and additional subsegments. See “industry segment.”
industry cluster – A broad economic sector whose industries have certain aspects of their value chain, business processes, or a set of products and services in common. Examples include consumer or discrete manufacturing.
Industry 4.0 – Current trend of automation and data exchange in manufacturing technologies. It includes cyberphysical systems, the Internet of Things (IoT), industrial IoT (IIoT), cloud computing, cognitive computing, and artificial intelligence. See “Industry 4.Now.”
Industry 4.Now – Board-sponsored and funded program aims to refocus SAP’s market presence and increase revenue in the areas covered by Industry 4.0 and to grow awareness of SAP solutions in this space. The program includes go-to-market strategy and further software development.
industry portfolios – Software portfolios that address the business needs of 25 different industries. These portfolios are included under their separate names, starting with “SAP for Aerospace & Defense (SAP for A&D).”
industry segment – An economic subsector within an industry that is characterized by a typical value chain, business processes, and set of products and services that the companies operating in it have in common. Examples include agribusiness and fashion.
infrastructure as a service (IaaS) – Term referring to the processing, storage, network, and other computing resources as well as a defined level of support for consumers to deploy software (such as operating systems and applications). IaaS consumers do not manage underlying cloud infrastructure but may control networking components (such as host firewalls).
in-memory computing – Major advance in information technology that creates a dramatic change in computing, analytics, and data storage. Combining advances in multicore processing with more affordable servers, in-memory computing allows information to be stored in the main memory rather than in relational databases to greatly accelerate processing times. It disrupts the traditional IT stack comprised of hardware, middleware, and software, where disk-based relational databases can become bottlenecks.
in-memory database – Database that keeps all active records in main memory rather than on disk. Accessing in-memory records is considerably faster than retrieving them from the disk, significantly increasing performance. SAP HANA is a groundbreaking database that allows businesses to take advantage of in-memory computing. See “SAP HANA.”
innovation – SAP invests in three types of product and service innovation: continuous innovation, which involves incremental improvements to existing offerings; adjacent innovation, which are enhancements to the existing portfolio using new technologies or applying existing knowledge to new markets; and transformative innovation, which occurs as a result of new trends, technologies, and business models.
Innovation Score – Measure from our yearly employee survey that focuses on how the innovation culture at SAP is perceived by our employees.
Insight to Actions – A cross-Board collaboration that identified over 20 initiatives to address systemic customer feedback. See “Experience Management (XM)”
Intelligent Enterprise – SAP’s strategy for an event-driven, real-time business powered by technology that includes machine learning, blockchain, Internet of Things, and analytics capabilities to help scale innovation. Our software, technologies, and services address the core elements of experience, intelligence, and operations for the 25 industries and the 12 lines of business (LoBs) we serve with our portfolio. See “intelligent suite,” “Business Technology Platform,” and “Experience Management (XM).”
Intelligent ERP – Term is used to message our ERP offerings that now go beyond core ERP and enterprise management to include functionality from selected finance and digital supply chain solutions. It speaks to the added value and differentiator of our on-premise and cloud-based ERP solutions, including SAP ERP, SAP S/4HANA, and SAP S/4HANA Cloud. It replaces the terms “digital core” and “Cloud ERP” used in the past. It is not the name of an individual product, suite, or portfolio.
Intelligent Spend Management – A program and initiative that brings together the best from SAP Ariba, SAP Fieldglass, and SAP Concur solutions in the areas of finance, sourcing, and procurement. The term refers to the capture of every source of spend, across each category (such as direct and indirect spending, travel and expense spending, as well as services and external labor spending), for one unified view; freeing businesses to focus on more important challenges.
intelligent suite – Suite of LoB applications that include ERP and digital supply chain management, as well as solutions for customer experience, intelligent spend management, and human experience management. The suite is differentiated through industry-specific business processes for end-to-end scenarios. It is a core element of SAP’s Intelligent Enterprise strategy. See “Intelligent Enterprise.”
intelligent technologies – Term used to describe tools and technology designed to turn intelligence and insight into business outcomes such as machine learning, artificial intelligence, Internet of Things, and blockchain. Intelligent technologies are embedded within our intelligent suite of applications and applied to processes that integrate both SAP and third-party data and applications. Formerly called SAP Leonardo intelligent technologies.
K
key performance indicator (KPI) – Performance figure for which threshold values are defined and against which validation is executed.
L
Leadership Trust Score – Based on the Net Promoter Score (NPS) methodology that results from a question in our annual global employee survey that gauges employees’ trust in our leaders. It measures our collective effort to foster a work environment based on trust. We use this score to further enhance accountability for our leaders and executive management.
Learning for Life – Program for all skill building initiatives from SAP Corporate Social Responsibility (SAP CSR). This program helps support future workforce needs, reskilling efforts, and underserved people in the education/tech space including: women and those from culturally diverse backgrounds.
line of business (LoB) – Internal organizational area or business unit in a company (division) that combines all responsibilities for a product, group, or set of processes, such as sales, purchasing, human resources, finance, marketing, and so on. SAP organizes its
To Our | Combined Group | Consolidated Financial | Further Information on Economic, | Additional |
Stakeholders | Management Report | Statements IFRS | Environmental, and Social Performance | Information |
functional areas currently into 12 LoBs: asset management, commerce, finance, human resources, manufacturing, marketing, R&D/engineering, sales, service, sourcing and procurement, supply chain management, and sustainability.
M
machine learning – Technology that teaches computers how to perform tasks by learning from data – instead of being explicitly programmed. It uses sophisticated algorithms to “learn” from massive volumes of Big Data. Machine learning describes algorithms that learn from data and support employees to focus on higher value work, thus empowering enterprises to scale innovative solutions and make their organization intelligent.
managed cloud – Deployment model that implies resources are dedicated to one customer and accessed through a VPN. The infrastructure is owned, managed, and operated by the cloud provider in the cloud provider’s data center. SAP HANA Enterprise Cloud is SAP’s managed cloud service. See “SAP HANA Enterprise Cloud.”
N
Next Generation Partnering – A multiyear transformative movement with new initiatives, programs, tools and a magnified focus on the ecosystem. Empowering partners to innovate, with unparalleled economic opportunity and a frictionless business experience is our priority. We will help our joint customers realize the power of the intelligent enterprise and lead the experience economy together.
O
on demand – Model of software deployment whereby providers license software for use as a service, usually in the cloud, so customers can use it when they need it, that is, “on demand.” It eliminates the need for IT resources to manage infrastructure and thereby reduces operational expenses. See “cloud solutions from SAP.”
on premise – Deployment model where a software license is purchased and deployed on the servers at a customer location. The customer manages and controls the software. SAP uses “on premise” as its standard term and not “on premises”.
open source – Software based on the concept of software developers coming together to build a virtual community and solving a common problem by developing working software that everyone has a right to change. Successful development projects under the open source model include Linux, a free operating system supported by SAP.
operational data (O-data) – Data that shows what is happening in your business. See “Experience Management (XM).”
Own SAP – Share purchase plan for SAP employees. In 2019, 68% of our employees participated in Own SAP purchasing a total of 5.2 million shares.
P
People Survey – See “engagement survey.”
platform as a service (PaaS) – Cloud infrastructure, operating system, programming languages, libraries, services, tools and typically a defined level of support for consumers to deploy consumer-created or acquired applications. PaaS consumers do not manage underlying cloud infrastructure but have control over deployed applications. SAP Cloud Platform is the PaaS offering from SAP. See “SAP Cloud Platform.”
powered by SAP HANA – An SAP offering powered by SAP HANA runs on the SAP HANA database. Partner solutions or applications that are powered by SAP HANA are certified by SAP to run on SAP HANA. These applications take advantage of distinctive capabilities that deliver key benefits, such as simpler administration, reduced overhead, and better business intelligence over conventional and traditional technology platforms. See “SAP HANA.”
premium success – Category of services from SAP Digital Business Services that supports large-scale transformation initiatives through a single, strategic, and customized on-site engagement. See “SAP Digital Business Services.”
private edition – See “single tenant edition.”
private option – See “single tenant edition.”
project success – Category of services from SAP Digital Business Services that supports the adoption of SAP products and technologies, use of emerging technologies and implementation of or transition to SAP S/4HANA.
public cloud – Cloud deployment that provides consumers access to a provider’s software applications running in a cloud infrastructure. The resources are located on the premises of the cloud provider, not of the customer, and are shared by multiple customers accessing them through the Internet.
Q
Qualtrics – SAP acquired Qualtrics International, Inc., in January 2019, the global pioneer of Experience Management (XM) software. The company, with headquarters in Provo, Utah, and Seattle, Washington, serves more than 9,000 enterprises worldwide with a technology platform that organizations use to collect, manage, and act on experience data. More than 11,000 customers in over 100 countries currently use Qualtrics software. See “Experience Management (XM).”
Qualtrics BrandXM – Solution that aims to make visible consumer sentiment towards a brand.
Qualtrics CoreXM – Solution that provides a foundation for experience management (XM) and is designed to help customers analyze experience data (X-data), improve feedback quality, and take real-time action on insights.
Qualtrics CustomerXM – Solution that has capabilities to support specific use cases and help process customer feedback.
Qualtrics Developer Platform – Business platform that helps organizations embed Qualtrics solutions into existing software installations, automate business processes, and bring experience data (X-data) from other channels into Qualtrics.
Qualtrics EmployeeXM – Solution that has capabilities to gather employee feedback and propose actions for HR to help improve the employee experience.
Qualtrics Partner Network – Group of partners carefully selected for their deep industry knowledge, unique expertise, experience and insights. This group has been expanded to more than 120 member companies, including EY, Deloitte Digital, and Korn Ferry.
To Our
Stakeholders | Combined Group
Management Report | Consolidated Financial
Statements IFRS | Further Information on Economic,
Environmental, and Social Performance | Additional
Information |
Qualtrics ProductXM – Solution that identifies consumers’ favorite products, based on feedback from users.
Qualtrics XM Platform – The technology platform from Qualtrics.
R
Renewable Electricity Certificates (RECs) – Certificates that prove that energy has been generated from renewable sources such as solar or wind power. Each REC represents the environmental benefits of 1MWh of renewable energy generation. By purchasing RECs, renewable energy is generated on your behalf.
renewable energy – Shares and types of electricity obtained from renewable sources such as hydro, wind, solar, geothermal, and biomass. It is calculated by adding the amount of renewable energy specifically sourced, produced on-site by our own solar cells and covered by Renewable Energy Certificates (RECs). See “Renewable Energy Certificates (RECs).”
S
SAP Alumni Network – Network and online community that provides a platform to reconnect with former colleagues and to unleash the power of a trusted network for the benefit of SAP and our ecosystem. In 2019, community members included 8,091 former and 4,243 current SAP employees.
SAP Analytics – Portfolio of solutions that includes offerings for business intelligence (BI), including data visualization; cloud analytics; enterprise performance management (EPM); governance, risk, and compliance (GRC); and predictive analytics. It provides business analytics tools that help customers get insights to enable them to adapt their businesses in real time.
SAP Analytics Cloud – Cloud analytics solution running on SAP HANA that brings together business intelligence (BI), predictive capabilities, and enterprise planning. The solution allows customers to discover, analyze, plan, and predict in one solution and make end-to-end business decisions with AI-driven insights. subscribe to SAP Analytics Cloud as a single solution with specific capabilities that can be licensed separately or together. It is one of the offerings in the SAP HANA Cloud Services suite. The SAP Digital Boardroom solution is based on SAP Analytics Cloud. See “SAP HANA Cloud Services” and “SAP Digital Boardroom.”
SAP Analytics Hub – Solution that provides a single access point to all analytics offerings from SAP and our ecosystem partners within a company in a portal-like interface. Users can describe, categorize, and promote reports as well as get personalized recommendations from the solution on cloud and on-premise offerings.
SAP App Center – One-stop shop (www.sapappcenter.com) where customers, partners, and developers can find, buy, and sell solutions developed on SAP HANA. It provides links to SAP Store, where transactions take place. Formerly called SAP HANA App Center.
SAP AppHaus – Co-innovation and training workplace for developers and business professionals with a focus on creative and agile work methodologies and workshops. SAP AppHaus has locations in Germany, Korea, and the United States. Formerly called SAP Design AppHaus.
SAP Ariba – Our portfolio of cloud solutions for procurement, financials, and sourcing and the signature Ariba Network. SAP Ariba solutions offer an online business-to-business marketplace connecting more than 4.6 million sellers in more than 190 countries. See “Ariba Network.”
SAP Best Practices – Packages that provide proven methods and tools for organizations to implement best business practices in key areas and a range of industries using SAP software. The packages deliver methodology, documentation, and preconfiguration that enable rapid, reliable deployment with quick return on investment. See “best practices.”
SAP Business All-in-One – Comprehensive and flexible business management solution targeted to midsize companies with up to 2,500 employees that are looking for a comprehensive, integrated industry-specific ERP solution with built-in best practices.
SAP Business ByDesign – Complete, integrated business solution delivered in the cloud, ideally suited for growing small to midsize companies and subsidiaries. The affordable suite connects and runs all business processes, including financials, HR, sales, procurement, customer service, and supply chain. The solution is available through a monthly software-as-a-service (SaaS) model. See “Intelligent ERP.”
SAP Business Network – Online service that integrates non-SAP and SAP data (including that from SAP Ariba, SAP Concur, SAP Fieldglass, and other on-premise and cloud solutions from SAP) across systems and across companies, offering a complete view of global B2B commerce. The network is available as a platform as a service on Amazon AWS and (in the future) on SAP Cloud Platform so that application developers, partners, and customers can use SAP Business Network services to create innovative solutions and applications that meet the ever-changing needs of our global customer base. See “Ariba Network.”
SAP BusinessObjects Business Intelligence – Suite of business intelligence (BI) solutions and a BI platform that provides flexible and scalable self-service BI tools, designed to give customers discovery and insights in real time.
SAP Business One – ERP solution designed for small businesses with up to 100 employees, providing a single, integrated solution for managing the entire business across all functions. A cloud version is available as SAP Business One Cloud and is addressed by our “Intelligent ERP” efforts.
SAP Business Warehouse (SAP BW) – Application that provides a complete view of a company and the tools needed to make the right decisions, optimize processes, and measure strategic success, such as business-critical factors and benchmarks.
SAP BW/4HANA – Data warehouse solution built entirely on SAP HANA that includes an analytics layer that processes data directly in- memory on the database instead of at the application layer, as is the case with traditional analytical engines.
SAP C/4HANA – Fourth-generation, in-memory suite of customer experience (CX) solutions. It brings together customer data, machine learning technology, and microservices to power real-time customer engagements across sales, service, marketing, commerce, customer data, and beyond. SAP C/4HANA comprises five cloud solution portfolios: SAP Customer Data Cloud; SAP Marketing Cloud; SAP Commerce Cloud; SAP Sales Cloud; and SAP Service Cloud. The suite includes individual offerings from acquired companies Callidus Software, Coresystems, and Gigya. See “SAP Customer Experience.”
To Our
Stakeholders | Combined Group
Management Report | Consolidated Financial
Statements IFRS | Further Information on Economic,
Environmental, and Social Performance | Additional
Information |
SAP Cloud – See “cloud solutions from SAP.”
SAP Cloud Platform – An open cloud platform that provides an integration and extension platform for customers to build solutions as cloud services, with intuitive tools and support to address industry and LoB processes. SAP Cloud Platform is available by subscription or through a consumption-based commercial model. See “SAP Cloud Platform Enterprise Agreement” and “cloud credit(s).”
SAP Cloud Platform Big Data Services – Managed cloud services that meets rigorous demands for reliability, scalability, and security in a full-service cloud based on Hadoop and Spark.
SAP Cloud Platform Blockchain service – Embedded in SAP Cloud Platform, this service provides registered customers with an easy way to use distributed ledger technology to build block applications or networks. By eliminating the need for a large upfront capital investment, it offers a gateway to enterprise blockchain adoption.
SAP Cloud Platform Enterprise Agreement – Agreement between SAP and customers use to purchase cloud credits as part of the consumption-based commercial model for SAP Cloud Platform. See “cloud credit(s).”
SAP Cloud Platform Extension Factory – Enterprise-class extension framework that helps reduce the complexity of configuring and managing cloud solutions. Customers use one framework to connect systems and extend cloud applications from SAP using the capabilities of SAP Cloud Platform, allowing them to focus on business logic and user experience to build extensions without disruption to the business.
SAP Cloud Platform Integration Suite – Umbrella term for all SAP Cloud Platform Integration offerings. This suite integrates cloud applications, data, devices, and people with on-premise and cloud solutions from SAP and third-party vendors. Users with different skillsets can apply a variety of integration approaches, intuitive tools, and prepackaged content to achieve results faster and to gain business agility with this versatile, dynamic, and enterprise-grade cloud integration platform.
SAP Commerce Cloud – One of the five solution categories within the SAP Customer Experience portfolio and in the SAP C/4HANA suite. This digital business solution helps integrate digital and physical customer touchpoints onto a single, robust platform, helping companies deliver a superior omnichannel commerce experience with state-of-the-art security and authentication technology. Individual offerings combine capabilities for product and Web content management, order management, personalization, bundling, and accelerators – all through a built-in omnichannel storefront. Formerly called SAP Hybris Commerce Cloud. See “SAP C/4HANA.”
SAP Concur – Cloud solutions that help deliver a connected spend management system encompassing travel, expense, invoice, compliance, and risk. Close to 66 million users worldwide use SAP Concur solutions today.
SAP Corporate Social Responsibility (SAP CSR) – Organization and overall efforts for corporate social responsibility (CSR) and related social investments at SAP that puts our purpose to help the world run better and improve people’s lives into action through its mission – powering opportunity through digital inclusion. SAP CSR efforts focus on three strategic program pillars: building digital skills; accelerating best-run non-profits and social enterprises; and connecting employees with purpose. See “SAP4Good.”
SAP Customer Data Cloud – One of the five solution categories within the SAP Customer Experience portfolio and in the SAP C/4HANA suite. It encompasses all products across the customer experience that enable the collection, transparency, and harnessing of customer information. Individual offerings within this portfolio include solutions from acquired company Gigya, renamed SAP Customer Consent, SAP Customer Identity, and SAP Customer Profile. See “Gigya” and “SAP C/4HANA.”
SAP Customer Experience – Extensible portfolio of customer experience solutions that speaks directly to the business benefits we seek to deliver to our C-suite audiences and shows category of solutions has evolved from traditional customer relationship management (CRM) to greater customer centricity. Launched at SAPPHIRE NOW in 2018, this portfolio brings together our SAP Hybris, CallidusCloud, Gigya, and Coresystems solutions under one umbrella, SAP C/4HANA is the name of the unified, front-office suite of customer experience solutions that is the basis for this portfolio. See “SAP C/4HANA.”
SAP data center – Physical facilities around the world used to house computer systems and associated components and meet the highest security standards. Comprised of various interconnected elements, a data center is the nerve center of a company. SAP data centers are currently located in Australia, Brazil, China, Europe, Japan, the Middle East, and across the United States.
SAP Data Hub – On-premise data management solution that enables data orchestration, pipelining, and governance as well as agile sharing of all data across a connected data landscape. This solution enables businesses to manage data from numerous sources – SAP or third party – without having to centralize data into one location. The solution lets companies safely and effectively move and share their data to enable agile data operations across the enterprise. A cloud service is available as “SAP Data Intelligence.” See “SAP Data Intelligence.”
SAP Data Intelligence – Cloud service designed to help businesses connect their siloed data assets and manage the discovery, refinement, governance, and orchestration of all data across a distributed data landscape. It is one of the SAP solutions for enterprise information management. See “SAP Data Hub.”
SAP Data Warehouse Cloud – Data warehouse solution in the cloud designed for business and IT users with capabilities for data integration, database, data warehousing, and analytics. reduced deployment complexity, flexible pricing with integration to solutions in the intelligent suite, SAP Analytics Cloud, SAP Cloud Platform services, partner solutions, and open source technologies. It is one of the offerings in the SAP HANA Cloud Services suite. See “SAP HANA Cloud Services.”
SAP Design Thinking – Methodology for routine innovation that brings together the right side of the brain (creative) with the left side of the brain (analytical).
SAP Digital Boardroom – Premier solution that contextualizes the boardroom, business locations, and devices into a real-time digital experience. Powered by SAP HANA with capabilities from SAP S/4HANA and SAP Analytics Cloud, it gives top decision makers real-time, accessible insight into integrated LoB data from SAP and third-party applications. See “SAP Analytics Cloud.”
To Our
Stakeholders | Combined Group
Management Report | Consolidated Financial
Statements IFRS | Further Information on Economic,
Environmental, and Social Performance | Additional
Information |
SAP Digital Business Services – Portfolio of services and support offerings (and organization of the same name) that helps customers maximize the value of their SAP solutions in on-premise, cloud, and hybrid environments. In 2019, we continued the simplification process begun in 2017 to bring our offerings into three categories (premium success, project success, and continuous success). We also expanded our range of intelligent tools to underpin services and support offerings for intelligent enterprises, including XM services. See “premium success,” “project success,” and “continuous success.”
SAP Digital Supply Chain – Portfolio offering enterprises an integrated set of digital supply chain solutions to plan, design, manufacture, deliver, and operate their products. With these solutions, customers can blend the physical and the digital world throughout the complete supply chain – from design, planning, and manufacturing to logistics and ongoing maintenance – embedding intelligence and ensuring their customers are central to every phase of their business. The SAP Leonardo Internet of Things (IoT) solution and related IoT offerings are no longer part of this portfolio. SAP Digital Supply Chain is also the name of the organization responsible for this portfolio.
SAP Early Talent – A global internal program at SAP that identifies, hires, and trains new employees with up to two years post-graduation and non-professional experience to become successful in the SAP community and to give them a high-level overview of SAP. The SAP Early Talent program provides a common platform that aligns with SAP’s digital strategy and to build aspiration for continued success, develop key skills and competencies, interact with each other, and learn about SAP’s strategy, products, and customers.
SAP Endorsed Apps – Web or mobile apps developed by independent software vendors and endorsed by SAP to support and complete our vision of the Intelligent Enterprise and are sold on SAP App Center with post-royalty expense revenues coming back to SAP.
SAP ERP – Application designed to optimize business and IT processes by reducing IT complexity, increasing adaptability, and delivering more IT value at a lower cost than traditional ERP solutions. It can support mission-critical, end-to-end business processes for finance, human capital management, asset management, sales, procurement, and other essential corporate functions. SAP ERP can also support industry-specific processes by providing industry-specific business functions that can be activated selectively via the switch framework, keeping the application core stable and helping ensure maximum performance.
SAP Executive Board – The official governing body of SAP, overseeing and deciding on the activities of the company. Subject to the requirements of stock corporation law, the SAP Executive Board is committed to the interests of SAP and bound by company policy. It provides the SAP Supervisory Board with regular, prompt, and comprehensive reports about all essential issues of business, corporate strategy, and potential risks. Membership in the SAP Executive Board is included in the official titles for these members.
SAP Fieldglass – Cloud-based applications for contingent workforce management and services procurement, including the signature SAP Fieldglass Vendor Management System. In 2019, SAP Fieldglass solutions connected customers with 6.5 million active external workers and more than 162,000 suppliers in over 180 countries and territories. See “Intelligent Spend Management.”
SAP Field Service Management – This cloud solution from acquired company Coresystems supports field service technicians with real-time, automated workforce scheduling, planning, and dispatching for employees and provides self-service options for field service needs. The offering provides customer businesses with an end-to-end field service management solution that lets end users discover answers on their own, schedule appointments, and get estimated time of arrival (ETA) data on technician status. It also grants managers more visibility into their field service teams.
SAP Fiori – First developed as a set of extensible HTML5 apps specific to key user roles, offering a seamless user experience across devices using responsive design principles. SAP Fiori apps target all employees of existing SAP customers, addressing the most common business functions, such as workflow approvals, information lookups, and self-service tasks. A free launchpad allows users to access their SAP Fiori apps from one single entry point. A cloud version is available as SAP Fiori Cloud.
SAP Fiori user experience (UX) – Umbrella term for the user experience for SAP software. Based on modern design principles, it represents a consumer-like, consistent experience across devices, including tablets and smartphones.
SAP for Aerospace & Defense (SAP for A&D) – Solution portfolio specifically designed to meet the needs of the aerospace and defense industry. It offers capabilities for maintenance, repair and overhaul, airline operations, defense, manufacturing, contract and program management, and business acquisitions.
SAP for Automotive – Solution portfolio designed to meet the specific needs of the automotive industry. Its capabilities help link complex business processes into a logical flow, maximizing efficiency and profitability and satisfying customers’ expectations.
SAP for Banking – Solution portfolio that enables banks to obtain all customer information at a glance and offers a full complement of high-performance capabilities for strategic planning, financial accounting, costing, and enterprise-wide control. It also features key industry-specific applications for profitability management, risk management, customer relationship management, and integrated customer account systems.
SAP for Chemicals – Solution portfolio that delivers support for specific processes and tools that chemical companies require. Industry-specific capabilities include recipe management, batch management, and version control.
SAP for Consumer Products – Solution portfolio that supports the integration of every step of the consumer product value chain – from suppliers to consumers. Key capabilities include mobile and Internet sales, trade promotion management, inventory management, brand and channel management, and demand signal management.
SAP for Defense & Security – Solution portfolio that offers a variety of capabilities that meet the critical needs of the defense and security sector. Key industry-specific capabilities include acquisition and materials management; force planning; maintenance, repair, and overhaul (MRO); personnel and organization; infrastructure management; planning and support for deployed operations; in-service support; and line maintenance.
SAP for Engineering, Construction & Operations (SAP for EC&O) – Solution portfolio designed to meet the specific requirements of project-oriented enterprises that offers capabilities for industrial plant construction, construction of commercial and private buildings, and shipbuilding.
To Our
Stakeholders | Combined Group
Management Report | Consolidated Financial
Statements IFRS | Further Information on Economic,
Environmental, and Social Performance | Additional
Information |
SAP for Healthcare – Solution portfolio that aims to help healthcare institutions and providers improve patient outcomes, while providing cost-effective care through a digital network. A consumer-centric healthcare ecosystem helps transform healthcare for patients and providers alike with offerings addressing patient care and care collaboration, as well as healthcare analytics and research. Formerly called SAP Health.
SAP for Higher Education and Research (SAP for HE&R) – Solution portfolio that supports organizational processes and unique needs of public and private universities, multicampus institutions, research agencies, and medical colleges, including campus management, grants management, student lifecycle management, financials, operations, human capital management, procurement, analytics, research, and asset management.
SAP for High Tech – Solution portfolio that meets the demands of high-tech industries, including RosettaNet support.
SAP for Industrial Machinery & Components (SAP for IM&C) – Solution portfolio that coordinates the entire scope of business activities (estimating, order entry, project management, and production planning) for the industrial sector and supports areas ranging from maintenance and services to billing and profitability analysis.
SAP for Insurance – Solution portfolio that integrates steps in the insurance business process, including capabilities for customer contact, policy and product management, collections and disbursement, and claims management.
SAP for Life Sciences – Solution portfolio that meets the requirements of pharmaceutical, biotechnology, and diagnostics companies, as well as manufacturers of medical devices and products.
SAP for Me – Portal that gives SAP customers information about their software portfolio and helps them with such processes as provisioning, outage notifications, contract and licenses management. It also offers recommendations for SAP events, learning paths, trial options, and other SAP products. Introduced as part of the Build Customers for Life program. See “Build Customers for Life.”
SAP for Media – Solution portfolio that supports processes specific to the media industry with capabilities that include sales and distribution, advertising management, product development, and intellectual property management.
SAP for Mill Products – Solution portfolio for manufacturers of building materials, the paper and timber industry, metal and primary metal producers, and textile and furniture manufacturers.
SAP for Mining – Solution portfolio that supports processes specific to the mining industry, including mining operations and asset performance; sales and supply chain management; operational risk and compliance; as well as human resources; finance; procurement; and IT management.
SAP for Oil & Gas (SAP for O&G) – Solution portfolio that meets the demands of oil and gas companies of all sizes.
SAP for Professional Services – Solution portfolio that delivers integrated tools, best practices, and support for automated processes designed specifically for the demands of the professional services industry, including management consultancies as well as accounting and legal firms.
SAP for Public Sector – Solution portfolio for public administration, providing an electronic framework that enables online communication through various applications for the public, government authorities, and related entities.
SAP for Retail – Solution portfolio that offers multichannel applications designed specifically to provide the best retail services to a large customer base.
SAP for Sports & Entertainment – Solution portfolio that comprises solutions for sports teams, leagues, and venues, designed to help them deepen fan engagement, drive on-field performance, and optimize business efficiency.
SAP for Telecommunications – Solution portfolio that provides telecommunications enterprises of all types and sizes a range of industry-specific capabilities, including support for convergent invoicing and contract accounting.
SAP for Travel & Transportation – Solution portfolio that covers the unique business needs of postal services, railways, airlines, and toll collection companies, as well as logistics service providers, to optimize supply chain and planning.
SAP for Utilities – Solution portfolio for all supply and energy industries, with capabilities ranging from call centers and Internet communications to consumption billing.
SAP for Wholesale Distribution – Solution portfolio that addresses the needs of midsize and large wholesale distribution businesses in a wide range of segments. Industry-specific capabilities support new business models and strategies that meet the needs of an important supply sector.
SAP4Good – Name used in social media channels to communicate the activities of the SAP Corporate Social Responsibility as well as the work SAP is doing in areas such as sustainability, diversity, and inclusion. See “SAP Corporate Social Responsibility.”
SAP Global Partner Summit – Exclusive event held for all SAP partners on the day prior to SAPPHIRE NOW. A day full of practical business-building insights, strategies, innovations, enablement, business opportunities, and networking dedicated to all things partner, helping maximize the SAP partnership.
SAP HANA – SAP’s flagship in-memory database, available both on premise and as a service in the cloud with SAP Cloud Platform. The innovative architecture in SAP HANA allows both transactional processing for data capture and retrieval and analytical processing for business intelligence and reporting as well as reduces time-consuming database and data management tasks. It enables businesses to process and analyze live data and make business decisions based on the most up-to-date information, a requirement in today’s digital economy. Released in 2019, SAP HANA innovations include enhanced capabilities in data anonymization and hyperconverged infrastructure (HCI) certification. See “SAP HANA Cloud.”
SAP HANA Cloud – SAP’s next-generation data platform-as-a-service. It brings the power and performance of SAP HANA and offers it natively in the cloud with full capabilities to manage data storage and federation as well as run powerful applications. SAP HANA Cloud connects customers to all of their information without requiring it to be loaded into a single storage solution. It is one of the offerings in the SAP HANA Cloud Services suite. See “SAP HANA Cloud Services.”
SAP HANA Cloud Services – A suite of data management and analytics products designed to simplify access to heterogeneous data landscapes providing a single gateway to all data. The suite comprises three offerings: SAP Analytics Cloud, SAP Data
To Our
Stakeholders | Combined Group
Management Report | Consolidated Financial
Statements IFRS | Further Information on Economic,
Environmental, and Social Performance | Additional
Information |
Warehouse Cloud, and SAP HANA Cloud, which together offer a set of interconnected services to solve decision-making needs by connecting many elements of data-centric processing which can be deployed on premise, in the cloud, or hybrid to deliver real business outcomes.
SAP HANA Data Management Suite – See “SAP HANA Cloud Services.”
SAP HANA Enterprise Cloud – This service enables customers to access solutions in the cloud. It contains managed cloud applications, in-memory infrastructure, managed services, and through an additional license, SAP Cloud Platform to build custom applications in the cloud. On-premise applications from SAP can be delivered to customers through SAP HANA Enterprise Cloud.
SAP Hybris – See “SAP Customer Experience.”
SAP Integrated Business Planning for Supply Chain – Powered by SAP HANA, this solution delivers real-time supply chain planning capabilities for sales and operations, demand and supply planning, and inventory optimization in the cloud. It provides the necessary information to make business decisions using embedded analytics, simulation, prediction, and decision support.
SAP Intelligent Asset Management – A group of five SAP solutions that help organizations define, plan, and monitor a service and maintenance strategy for physical products and assets along the manufacturing lifecycle. The five offerings are SAP Asset Intelligence Network; SAP Predictive Maintenance and Service; SAP Mobile Asset Management; SAP Asset Strategy and Performance Management; and SAP Predictive Engineering Insights.
SAP.iO – SAP’s startup incubation engine and related program that helps innovators inside and outside of SAP build products, find customers, and ultimately change industries. The SAP.iO team works with the best entrepreneurs, developers, designers, and data scientists to upend how business works.
SAP.iO Fund – Managed by Sapphire Ventures, this fund focuses on strategic early-stage investments in enterprise software startups. SAP has committed to invest up to 40% of the investable capital in underrepresented groups to foster diversity and inclusion, including startups founded by women. See “Sapphire Ventures.”
SAP.iO Venture Studio – This initiative identifies high-potential entrepreneurial employees at SAP and helps develop them into successful leaders, with the objective to build new ventures that will have a massive impact on business and society. In 2019, the SAP.iO Venture Studio engaged more than 7,500 employees and were able to jump-start close to 400 venture ideas.
SAP Leonardo – Name given to the initiative as well as technology and services launched in 2017 to address innovative technologies and capabilities for analytics, artificial intelligence, blockchain, Big Data, data intelligence, Internet of Things, and machine learning. In 2019, the intelligent technologies marketed under SAP Leonardo are now mostly embedded in our individual solutions and innovative technology. See “intelligent technologies,” “SAP Leonardo Artificial Intelligence,” “SAP Leonardo Blockchain,” and “SAP Leonardo Internet of Things.”
SAP Leonardo Analytics – See “SAP Analytics.”
SAP Leonardo Artificial Intelligence – SAP’s artificial intelligence (AI) functionality has been integrated in the SAP portfolio, providing intelligent capabilities in SAP S/4HANA, SAP C/4HANA, SAP Concur, SAP Fieldglass, and SAP SuccessFactors solutions, among others. See “intelligent technologies.”
SAP Leonardo Blockchain – Innovative technology designed to enable open business collaboration across company boundaries in decentralized networks. These blockchain capabilities are integrated into SAP Cloud Platform.
SAP Leonardo Internet of Things – Solution that provides industry-specific business services and capabilities, designed to embed device and telemetry data into SAP applications. It offers prepackaged scenarios in the SAP Field Service Management solution in the SAP C/4HANA suite, business scenario content templates, and interoperability with hyperscalers, such as Amazon Web Services IoT Core and Microsoft Azure IoT Hub.
SAP Marketing Cloud – One of the five solution categories within the SAP Customer Experience portfolio and in the SAP C/4HANA suite. It includes all marketing solutions to support developing a single view of the customer, gaining deeper customer insights, enabling consent-based marketing, delivering individualized marketing experiences, lead and account management, and optimizing marketing through closed loop planning, execution, and measurement. See “SAP C/4HANA.”
SAP Next-Gen – Program that enables corporations, governments, and NGOs to connect with academic thought leaders and researchers, students, startups, accelerators, tech community partners, venture firms, purpose-driven partners, futurists, and SAP experts. This purpose-driven innovation university and community supports SAP’s commitment to the 17 UN Global Goals for sustainable development, providing an innovation platform that comprises more than 3,700 educational institutions in 116 countries. It manages more than 110 SAP Next-Gen Labs at universities and at partner and SAP locations, and more than 90 SAP Next-Gen Chapters. The SAP Next-Gen program has been extended beyond enterprises and universities to citizens, partners, and young thinkers.
SAP One Billion Lives – Program that invites SAP colleagues to propose and gain support for projects that would benefit the public sector, specifically in the areas of education, health care, and disaster management and response. “SAP 1BLives” is used to refer to the program on social media.
SAP PartnerEdge – Global, partner-to-partner business collaboration network where SAP partners can share expertise, development capabilities, solutions, and knowledge to extend their market reach. Available online at www.sappartneredge.com, the site gives partners access to information, product and business news, tools, training, and business resources to order products. Partners can also manage their relationship with SAP and collaborate with other SAP partners through SAP PartnerEdge.
SAPPHIRE NOW – SAP’s signature business technology event and the largest SAP customer-driven conference is held annually in several locations around the globe. The global event in the United States is co-located with the Americas’ SAP Users’ Group (ASUG) annual conference. Attendees discover new initiatives, solutions, products, and services, as well as unique access to the latest business strategies and industry best practices from SAP customers, partners, executives, and industry experts to help them drive business results across all levels.
Sapphire Ventures – SAP supports entrepreneurs that aspire to build industry-leading businesses through venture capital funds managed by Sapphire Ventures. Sapphire Ventures pursues opportunities where it can help fuel enterprise growth by adding expertise, relationships, geographic reach, and capital.
To Our | Combined Group | Consolidated Financial | Further Information on Economic, | Additional |
Stakeholders | Management Report | Statements IFRS | Environmental, and Social Performance | Information |
SAP Sales Cloud – One of the five solution categories within the SAP Customer Experience portfolio and in the SAP C/4HANA suite. Individual offerings help companies improve sales with better selling experiences, enhancing sales reps’ daily work experience, while improving customer experiences and accelerating the buying process. It includes the former SAP Cloud for Sales solution. See “SAP C/4HANA.”
SAP Service Cloud – One of the five solution categories within the SAP Customer Experience portfolio and in the SAP C/4HANA suite. It encompasses all products across the customer experience that help secure customer satisfaction in support of ongoing loyalty. Individual offerings target sales and service organizations with designed-in social collaboration to help transform social media conversations into business insight. See “SAP C/4HANA.”
SAP S/4HANA – SAP’s next-generation Intelligent ERP suite runs on SAP HANA and includes intelligent technologies and integrated business processes with real-time analytics to support rapid decision-making. The suite provides capabilities for HR, sales, service, procurement, manufacturing, asset management, as well as research and development. More than 13,800 customers across 25 industries have chosen the suite to support their digital transformation. In 2019, we updated the definition of SAP S/4HANA to more closely reflect categories covered by ERP by including elements of digital supply chain management, finance, and risk management. SAP S/4HANA is available in various deployments: software as a service (SaaS), on premise, in a private cloud, or as a hybrid. See “Intelligent ERP” and “SAP S/4HANA Cloud.”
SAP S/4HANA Cloud – SAP’s flagship next-generation Intelligent ERP suite in the cloud provides functionality that allows companies to run integrated and intelligent digital businesses in real time. SAP S/4HANA Cloud is built on SAP Cloud Platform with an open architecture that helps connect it to the wider SAP portfolio. SAP S/4HANA Cloud offers the advantages of SaaS, such as scalability and quarterly innovation updates. See “SAP S/4HANA” and “Intelligent ERP.”
SAP S/4HANA Enterprise Management – Core on-premise solution in the SAP S/4HANA suite covering all mission-critical processes of an enterprise. It is natively built on SAP HANA and designed with SAP Fiori UX.
SAP S/4HANA Finance – Global financial solution available in the SAP S/4HANA suite as one of the SAP S/4HANA Line-of-Business (LoB) Solutions.
SAP S/4HANA Line-of-Business Solutions – Solutions that combine the core capabilities included in the SAP S/4HANA Enterprise Management solution with the solutions in the SAP portfolio (on premise and cloud) for a specific line of business, such as asset management, finance, manufacturing, sales, sourcing and procurement, and supply chain. See “SAP S/4HANA Finance.”
SAP S/4HANA Movement – SAP program and initiative to promote and accelerate adoption of SAP S/4HANA. This is an easy-to-use adoption starter engagement that helps customers structure and assess their transformation to SAP S/4HANA.
SAP Social Sabbatical – Umbrella name for an SAP CSR program that allow SAP employees to contribute their time and talent to helping entrepreneurs and small businesses in various markets. Program options exist for global, local, and regional engagement. In 2019, we expanded the program to include an option for executive engagement where selected strategic customers and partners were invited to join.
SAP Solution Manager – End-to-end application lifecycle management solution to help streamline business processes and proactively address improvement options, increasing efficiency and decreasing risk with the SAP maintenance agreement. Customers can centralize, enhance, automate, and improve the management of their entire system landscape (SAP and third party), thus reducing total cost of ownership. The solution includes features such as diagnostics, testing, root cause analysis, and solution monitoring.
SAP solutions for enterprise information management (EIM) – these solutions provide capabilities to understand, integrate, cleanses, manage, associate, and archive data. The data landscape can include SAP software systems (such as SAP S/4HANA, SAP C/4HANA, and SAP BW/4HANA. See “SAP Data Hub” and “SAP Data Intelligence.”
SAP solutions for small businesses and midsize companies – Category of solutions that combine business management and business intelligence software for small and midsize enterprises (SMEs). It currently includes Intelligent ERP solutions, Edge editions of SAP BusinessObjects BI solutions, and other SME services. As with large enterprises, SMEs seek to streamline business processes, cut costs, drive growth, and increase profitability by receiving the right information at the right time – across all operations.
SAP solutions for sustainability – Category of solutions that helps companies measure sustainability key performance indicators; energy and carbon management; and environment, health, and safety. SAP solutions for sustainability help organizations tackle energy consumption and greenhouse gas emissions, as well as support efforts in product safety, healthcare, and sustainability performance management.
SAP SuccessFactors – Cloud solutions that help organizations increase the value of their workforce by developing, managing, engaging, and empowering their people. These solutions address all aspects of human resources (HR), from core HR, payroll, and talent management to people analytics and workforce planning. See “SAP SuccessFactors Human Experience Management Suite.”
SAP SuccessFactors Employee Central – Solution that is the foundation of the SAP SuccessFactors HXM Suite, offering core HR software delivered securely as a service from the cloud. It offers one global system of record, complete workforce overview combining HR and talent data, powerful analytics, and social collaboration fine-tuned to meet local needs. See “SAP SuccessFactors Human Experience Management Suite.”
SAP SuccessFactors Employee Central Payroll – Cloud solution that extends the SAP SuccessFactors HXM Suite to include payroll accounting and management. See “SAP SuccessFactors Human Experience Management Suite.”
SAP SuccessFactors HCM Suite – See “SAP SuccessFactors Human Experience Management Suite.”
SAP SuccessFactors Human Experience Management (HXM) Suite – In 2019, SAP changed the name of SAP SuccessFactors Human Capital Management Suite to SAP SuccessFactors Human Experience (HXM) Suite to include employee experience capabilities and XM functionality from Qualtrics. This suite of HR solutions includes offerings for core HR and payroll, talent management, employee experience, people analytics, and workforce planning.
SAP Together – Global internal program that uses the Benivity online platform to help SAP employees engage in social causes. It is part of SAP CSR efforts.
To Our | Combined Group | Consolidated Financial | Further Information on Economic, | Additional |
Stakeholders | Management Report | Statements IFRS | Environmental, and Social Performance | Information |
SAP Women Forward – Externally-facing women’s initiative (https://discover.sap.com/women-forward/en-us/index.html) that includes an online community, newsletter, and annual events (#WomenForward).
Scope 1 (emissions) – Direct greenhouse gas emissions from sources that are owned or controlled by the reporting company, for example, fuel burned in corporate cars.
Scope 2 (emissions) – Indirect greenhouse gas emissions from consumption of purchased electricity, heat, or steam.
Scope 3 (emissions) – Indirect emissions that are a consequence of the activities of the reporting company but occur from sources owned or controlled by another company, such as business flights.
single tenant edition – Deployment model that implies resources are dedicated to one customer and accessed through the Internet. The infrastructure is owned, managed and operated by the customer, a third-party, or both, and is on the premises of the customer, cloud provider, or a third party. Formerly called private option or private edition.
software as a service (SaaS) – Software that is provided literally “as a service.” Software applications are delivered and managed remotely over a secure Internet connection and a standard Web browser. Access is charged on a subscription basis usually on a dedicated time basis and with expandable feature access options. Typically, a defined level of support is included. See “cloud computing.”
solution – Business software that enables a customer to meet a challenge or take advantage of an opportunity and are built or assembled by flexibly combining software products and technology. SAP solutions may include support for best business practices and be aided by consulting and ongoing support. They may also be enhanced or extended by applications and services from partners.
SuccessFactors – See “SAP SuccessFactors.”
sustainability – Concept to create positive social, environmental, and economic value for long-term business success and responsible global development.
T
technology platform – Technical foundation for a business-driven software architecture that increases the adaptability, flexibility, openness, and cost-efficiency of IT operations and enables organizations to become more agile in responding to change. See “Business Technology Platform.”
total energy consumed – Sum of all energy consumed through SAP’s own operations, including energy from renewable sources. It covers all Scope 1 and Scope 2 emissions.
U
UN Protect, Respect and Remedy – Framework provided by the United Nations, which offers states and companies guidance regarding the fulfillment of their duty to protect, respect and remedy human rights.
UN Sustainable Development Goals (SDGs or UN Global Goals) – Set of 17 global development goals by the United Nations, which are aimed to ensure an environmentally, socially, and economically sustainable future by tackling adverse challenges to humanity like poverty, hunger, and inequality.
user experience (UX) – In general terms, UX represents the quality of a user’s interaction with and perceptions of a system. UX at SAP is a characteristic of solutions or products that use SAP Fiori UX technology and follow SAP Fiori UX guidelines to offer a next-generation experience to our users. See “SAP Fiori user experience.”
W
women in management – Term used to refer to the percentage of women in management positions (managing teams, managing managers, executive boards) as compared to the total number of managers, expressed by the number of individuals and not full-time equivalents (FTEs). Throughout 2019, SAP sponsored and hosted events to attract, develop, and support women around the world. Ongoing initiatives include Women’s Professional Growth Webinar series, our grassroots Business Women’s Network, and our Women@SAP online community.
works council – As dictated by the German Works Council Constitution Act, a works council is a legal body for representing employees’ interests to the employer and codetermining the works in private companies. On June 21, 2006, the SAP AG employees working in Germany elected its first works council. A European works council was created in the spring of 2012. The SAP AG works council evolved to become the SAP SE works council in 2014 to reflect the legal entity of SAP SE.
To Our | Combined Group | Consolidated Financial | Further Information on Economic, | Additional |
Stakeholders | Management Report | Statements IFRS | Environmental, and Social Performance | Information |
Financial Calendar and Addresses
Financial Calendar
2020
April 21
Results for the first quarter of 2020
May 20
Annual General Meeting of Shareholders, Mannheim, Germany
May 26
Dividend payment
July 27
Results for the second quarter and half-year 2020
October 26
Results for the third quarter of 2020
2021
January 29
Results for the fourth quarter and full-year 2020
Addresses
Group Headquarters
SAP SE
Dietmar-Hopp-Allee 16
69190 Walldorf
Germany
Tel. +49 6227 74 74 74
Fax +49 6227 75 75 75
E-mail info@sap.com
Web site www.sap.com
The addresses of all our international subsidiaries and sales partners are available on our public Web site at www.sap.com/directory/main.html.
For more information about the matters discussed in the report, contact:
Investor Relations
Tel. +49 6227 76 73 36
Fax +49 6227 74 08 05
E-mail investor@sap.com
Web site www.sap.com/investor
Press
Tel. +49 6227 74 63 15
E-mail press@sap.com
Web site www.sap.com/press
268 | Financial Calendar and Addresses |
To Our | Combined Group | Consolidated Financial | Further Information on Economic, | Additional |
Stakeholders | Management Report | Statements IFRS | Environmental, and Social Performance | Information |
Financial and Sustainability Publications
We present our financial, social, and environmental performance in the SAP Integrated Report 2019, which is available at www.sapintegratedreport.com. This SAP Integrated Report 2019 comprises all of the information required by accounting and disclosure standards applicable to us.
The following publications are available in English at www.sap.com/investor, or in German at www.sap.de/investor:
– Annual Report on Form 20-F (IFRS, in English)
– SAP Integrated Report (PDF)
– SAP SE Statutory Financial Statements and Review of Operations (HGB, in German)
– Half-Year Reports (in English and German)
– SAP INVESTOR, SAP’s quarterly shareholder magazine (in German)
Complete information on the governance of SAP is available at www.sap.com/corpgovernance. Materials include:
– Information about the management of the company, including the members of the Executive Board and the Supervisory Board and their curriculum vitae
– Details of the managers’ transactions in SAP shares
– Shareholder meeting documents and ballot results
– Articles of Incorporation
– Agreement on the Involvement of Employees in SAP SE
– German Code of Corporate Governance
– Declaration of Implementation pursuant to the German Stock Corporation Act, Section 161
– Code of Business Conduct for Employees
– Corporate Governance Statement pursuant to the German Commercial Code, Section 289f
– Corporate Governance Report
– Rules of Procedure for the Supervisory Board
– Profile of Skills and Expertise for the Supervisory Board
Additional SAP policies are made public at www.sap.com/corporate-sustainability:
– SAP Human Rights Commitment Statement
– SAP Global Health and Safety Management Policy
– SAP Environmental Policy
– SAP Global Anti-Discrimination Policy
– SAP Global Diversity and Inclusion Commitment Statement
– SAP ‘s Guiding Principles for Artificial Intelligence
– SAP Supplier Code of Conduct
– SAP Partner Code of Conduct
Financial and Sustainability Publications | 269 |
To Our | Combined Group | Consolidated Financial | Further Information on Economic, | Additional |
Stakeholders | Management Report | Statements IFRS | Environmental, and Social Performance | Information |
Publication Details
In Memoriam
We dedicate this report to our dear colleague Sabine Vogler, a valued member of the SAP Integrated Report project team for many years. She passed away suddenly and unexpectedly in January 2020. She will be dearly missed.
Publisher
SAP SE
Investor Relations
Concept and Realization
SAP Integrated Report project team with the support of SAP software
Printing
ABC Druck, Heidelberg, Germany
Copyright
SAP SE
Dietmar-Hopp-Allee 16
69190 Walldorf
Germany
© 2020 SAP SE or an SAP affiliate company. All rights reserved. No part of this publication may be reproduced or transmitted in any form or for any purpose without the express permission of SAP SE or an SAP affiliate company.
SAP and other SAP products and services mentioned herein as well as their respective logos are trademarks or registered trademarks of SAP SE (or an SAP affiliate company) in Germany and other countries. All other product and service names mentioned are the trademarks of their respective companies. Please see www.sap.com/about/legal/copyright.html for additional trademark information and notices.