Exhibit 99.1
| Quarterly Statement Q4 2020 |  |
Topline Exceeds Full Year Outlook
Operating Profit and Free Cash Flow Up Strongly “RISE with SAP” To Drive Customers’ Business Transformation in the Cloud |
| · | IFRS Cloud Revenue Up 17%, Non-IFRS Cloud Revenue Up 18% At Constant Currencies in FY 2020 |
| · | Current Cloud Backlog of €7.2 Billion, Up 14% At Constant Currencies |
| · | IFRS Cloud Gross Margin 66.5%, Up 3.1pp; Non-IFRS Cloud Gross Margin Reaches 69.6%, Up 1.3pp At Constant Currencies in FY2020 |
| · | IFRS Operating Profit Up 48%; Non-IFRS Operating Profit Up 4% At Constant Currencies in FY 2020 |
| · | IFRS EPS Up 56%; Non-IFRS EPS Up 6% in FY 2020 |
| · | Operating Cash Flow At €7.2 Billion, Approximately Doubling Year over Year; Free Cash Flow at €6.0 Billion in FY 2020, Significantly Exceeding Raised Outlook |
| · | Customer Net Promoter Score Up Sharply; Employee Engagement Index at Record High |
| · | 2021 Outlook Reflects Expedited Move to Cloud |
| · | Successful IPO of Qualtrics |
| „ The world's leading companies are turning to SAP to become intelligent enterprises. We are reinventing how businesses run by accelerating our customers’ transformation in the cloud. Our strong finish to the year and the launch of RISE with SAP, our new holistic business transformation offering, position us well to meet our new outlook targets.” | | „ In a uniquely challenging environment, 2020 was a record year for cash flow in every single quarter and the full year. Our better-than-anticipated top line performance combined with our quick response on the cost side drove strong operating profit. SAP’s expedited shift to the cloud will drive long-term, sustainable growth while significantly increasing the resiliency and predictability of our business.” |
| Christian Klein, CEO | | Luka Mucic, CFO |
| SAP Quarterly Statement Q4 2020 | 1 |
Walldorf, Germany – January 29, 2021
SAP SE (NYSE: SAP) today announced its financial results for the fourth quarter and the full year ended December 31, 2020.
Business Update
SAP’s business performance sequentially improved in the fourth quarter even as the COVID-19 crisis persisted and lockdowns were reintroduced in many regions. Cloud revenue in the fourth quarter continued to be impacted by lower pay-as-you-go transactional revenue, mainly Concur business travel related. However, continued high demand for e-commerce, Business Technology Platform, and Qualtrics solutions along with several competitive wins – particularly for SuccessFactors Human Experience Management – produced a strong finish to the year for SAP’s cloud business. SAP also saw strong early take up of its new holistic business transformation offering “RISE with SAP” among pilot customers, contributing to the cloud performance in the fourth quarter. Both North America and Europe experienced a better-than-expected performance in cloud order entry as well as software licenses revenue reflecting strong demand for SAP’s digital supply chain solutions in particular. In addition, SAP had significant competitive wins in ERP.
Recent Highlights:
| · | SAP launched “RISE with SAP” on January 27, 2021, a simplified pathway for customers to transition their mission critical systems to the cloud and transform their business, delivered as a holistic commercial package with one subscription fee. |
| · | Successful IPO of Qualtrics on January 28, 2021, maximizing Qualtrics’ opportunity to expand their business and build the best talent while SAP retains majority ownership. At IPO, the company was valued at almost $18 billion, more than double the original acquisition price. Qualtrics shares moved even higher on the first day of trading, ending the day with a gain of just over +50%. |
| · | Completed the acquisition of Emarsys on November 4th, 2020, a leading omnichannel customer engagement platform provider. |
| · | Deepened business process intelligence capabilities with the acquisition of Signavio. |
| · | Expanded Microsoft relationship around Teams integration, Industry 4.0 and simplification of SAP ERP migration to the cloud on Azure. |
| · | Announced a new partnership with Europe’s leading industrial companies, car manufacturers and their suppliers to build the automotive network of the future. |
Throughout the COVID-19 crisis, SAP continues to serve its customers effectively with an embedded virtual sales and remote implementation strategy. The company retains a disciplined approach to hiring and discretionary spend while capturing natural savings e. g. from lower travel, facility-related costs and virtual events. In combination with the strong topline performance these actions drove higher operating profit and operating margin (both in IFRS and non-IFRS at constant currencies) despite the challenging macro environment.
SAP also continues to be a key technology partner in helping customers and the broader community address COVID-19 challenges. Initiatives include:
| · | Launched a vaccine collaboration hub (VCH) for Life Sciences organizations to better manage vaccine supply distribution, and to help governments and their industry partners coordinate and successfully deploy mass vaccination programs. |
| · | The "Corona Warn App", SAP's contact track and trace app, has now been downloaded more than 25 million times helping to curb the virus spread. |
| · | Co-innovation with Parkland Health & Hospital System to tackle urgent needs related to COVID-19: a command center dashboard to make essential decisions; a critical inventory tracker to help ensure real-time accurate tracking and availability of critical inventory such as ventilators; an online, self-service, multilingual symptom checker chatbot enabling patients to go through an initial COVID-19 screening thereby reducing load on its overwhelmed call center and reducing face-to-face interactions to improve safety. |
| · | Partnered with Mercy Technology Services, the IT division of St. Louis-based health system Mercy, to harness the power of data analytics to produce real-world evidence (RWE) for more informed patient care. |
| SAP Quarterly Statement Q4 2020 | 2 |
Financial Performance1
Full-Year 2020
SAP exceeded all of its revised 2020 revenue targets and hit the high end of its revised operating profit outlook range.
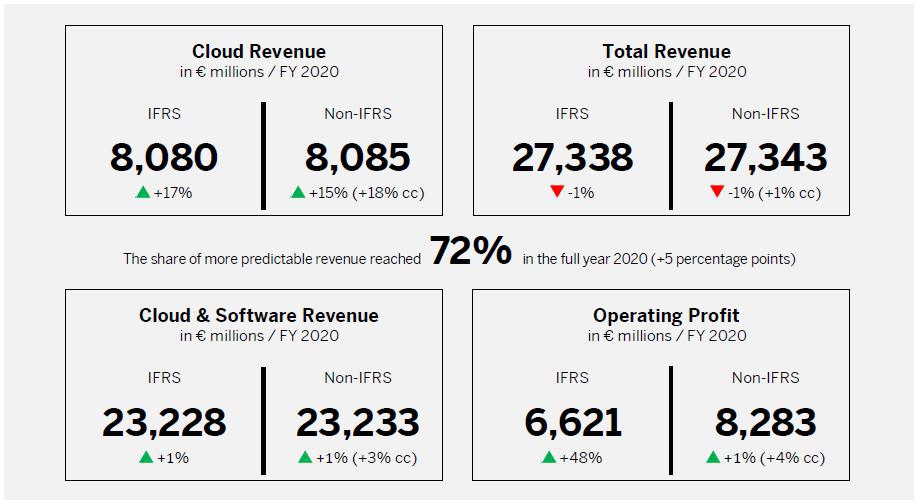
For the full year current cloud backlog was up 7% year over year to €7.15 billion (up 14% at constant currencies) amid continued COVID-19 effects on SAP’s cloud business. Cloud revenue grew by 17% year over year to €8.08 billion (IFRS), up 15% to €8.09 billion (non-IFRS) and up 18% to €8.24 billion (non-IFRS at constant currencies), exceeding the revised full year outlook (€8.0 to €8.2 billion non-IFRS at constant currencies). Continued lower transactional revenues, particularly in Concur, negatively impacted cloud growth by 4 percentage points. Cloud revenue from SAP’s SaaS/PaaS offerings, that do not belong to Intelligent Spend, and its IaaS offering grew by 27% and 23% (non-IFRS at constant currencies), respectively. Software licenses revenue was down 20% year over year to €3.64 billion (IFRS and non-IFRS) and down 17% (non-IFRS at constant currencies). Cloud and software revenue was up 1% year over year to €23.23 billion (IFRS and non-IFRS) and up 3% to €23.72 billion (non-IFRS at constant currencies), exceeding the revised full year outlook (€23.1 – 23.6 billion). Total revenue was down 1% year over year to €27.34 billion (IFRS and non-IFRS) and up 1% to €27.90 billion (non-IFRS at constant currencies), also exceeding the revised full year outlook (€27.2 – 27.8 billion).
The share of more predictable revenue grew by 5 percentage points year over year to 72% for the full year 2020.
Cloud gross margin increased 3.1 percentage points year over year to 66.5% (IFRS) and increased by 1.4 percentage points year over year to 69.6% (non-IFRS).
For the full year, IFRS operating profit and operating margin were positively impacted by significantly lower restructuring charges as well as lower share-based compensation expenses compared to 2019. Operating profit increased by 48% year over year to €6.62 billion (IFRS) and was up 1% to €8.28 billion (non-IFRS) and up 4% to €8.50 billion (non-IFRS at constant currencies), hitting the high end of the revised full year outlook (€8.1 – 8.5 billion). Operating margin increased 8.0 percentage points year over year to 24.2% (IFRS) and increased 0.6 percentage points year over year to 30.3% (non-IFRS) and 0.8 percentage points to 30.5% (non-IFRS at constant currencies) for the full year.
Earnings per share increased 56% to €4.35 (IFRS) and increased 6% to €5.41 (non-IFRS) reflecting a strong contribution from Sapphire Ventures.
Operating cash flow for the full year was € 7.19 billion, approximately doubling year over year and significantly above the raised outlook of approximately €6.0 billion. Free cash flow increased 164% year over year to €6.00 billion, significantly above the raised outlook of above €4.5 billion. Cash flow was positively impacted by lower tax and restructuring payments and a successful working capital management. At year end, net debt was –€6.50 billion.
Fourth Quarter 2020
In the fourth quarter, cloud revenue grew 8% year over year to €2.04 billion (IFRS), up 7% to €2.04 billion (non-IFRS) and up 13% (non-IFRS at constant currencies). Continued lower transactional revenues, particularly in Concur, negatively impacted cloud growth by 2 percentage points. Cloud revenue from SAP’s SaaS/PaaS offerings, that do not belong to Intelligent Spend, and its IaaS offering grew by 22% and 17% (non-IFRS at constant currencies), respectively. Software licenses revenue was down 15% year over year to €1.70 billion (IFRS and non-IFRS) and down 11% (non-IFRS at constant currencies). Cloud and software revenue was down 4% year over year to €6.58 billion (IFRS and non-IFRS) and up 1% (non-IFRS at constant currencies). Total revenue was down 6% year over year to €7.54 billion (IFRS and non-IFRS) and down 2% (non-IFRS at constant currencies).
Cloud gross margin increased 2.1 percentage points year over year to 67.2% (IFRS) and increased by 0.5 percentage points year over year to 70.0% (non-IFRS).
In the fourth quarter, IFRS operating profit and operating margin were positively impacted by lower share-based compensation expenses compared to the prior year period. Operating profit increased by 26% year over year to €2.66 billion (IFRS) and was down 3% to €2.77 billion (non-IFRS) and up 3% (non-IFRS at constant currencies). Operating margin increased by 9.1 percentage points year over year to 35.2% (IFRS) and increased 1.4 percentage points year over year to 36.7% (non-IFRS) and 1.5 percentage points to 36.8% (non-IFRS at constant currencies).
EPS was up 19% year over year to €1.62 (IFRS) and down 7% year over year to €1.69 (non-IFRS).
1 The full year and Q4 2020 results were also impacted by other effects. For details, please refer to the disclosures on page 34 of this document.
| SAP Quarterly Statement Q4 2020 | 3 |
Non-Financial Performance 2020
SAP also showed a strong performance in non-financial metrics. Customer Net Promoter Score (NPS) increased ten points year-on-year to +4 in 2020, exceeding the outlook. This strong positive result reverses a four-year downward trend and is a result of the Company’s focus on implementing customer feedback, harmonizing customer interactions, and integration across the product portfolio.
SAP’s Employee Engagement Index increased 3 percentage points to a record 86%, at the upper end of the outlook. SAP’s retention rate was 95.3% (2019: 93.3%). Further the proportion of women in management increased to 27.5% (2019: 26.4%).
Greenhouse gas emissions were below the revised outlook from October 2020. In 2020 SAP’s greenhouse gas emissions were 135 kilotons, down 165 kt year-on-year. In addition to the Company’s measures to decrease carbon emissions, the continued travel restrictions due to the COVID-19 pandemic contributed significantly to the decrease.
Segment Performance Fourth Quarter 2020
SAP’s four reportable segments “Applications, Technology & Support”, “Concur”, “Qualtrics” and “Services” showed the following performance:
Applications, Technology & Support (AT&S)
In the fourth quarter, segment revenue in AT&S was down 4% to €6.21 billion year over year (up 1% at constant currencies). Solutions which contributed to this growth are listed below.
SAP S/4HANA
SAP S/4HANA is an intelligent, integrated ERP system that runs on SAP’s real time in-memory platform, SAP HANA. It addresses industry-specific requirements with proven best practices for 25 verticals and enables new business models as marketplaces evolve. It revolutionizes business processes with intelligent automation, supported by artificial intelligence and robotic process automation. It helps users make better decisions faster with embedded analytics, a conversational interface, and digital assistants.
Approximately 900 SAP S/4HANA customers were added in the quarter, taking total adoption to approximately 16,000 customers, up 16% year over year, of which more than 8,700 are live. In the fourth quarter, approximately 40% of the additional SAP S/4HANA customers were net new.
In the fourth quarter, world-class organizations such as L’Oréal, Shell, Schwarz IT KG (Lidl), Co-op, Unilever, s.Oliver Group, Gilead Sciences, and Saudi Aramco chose SAP S/4HANA. Boehringer Ingelheim went live with SAP S/4HANA in 41 Countries simultaneously. BT Group, A. P. Møller-Mærsk, Beijing Energy, the Coca-Cola Bottling Company of Egypt, and Bertelsmann also went live. A fast-growing number of companies of all sizes such as CureVac, Zespri, Oxford University Press, The Not Company, Nippon Cargo Airlines, BMW, Atos, and I-PEX chose SAP S/4HANA Cloud.
Human Experience Management (HXM)
The SAP SuccessFactors Human Experience Management (HXM) Suite provides solutions for core HR and payroll, talent management, employee experience management and people analytics. Built as a highly scalable platform it meets complex cross border requirements, delivering tax regulation and HR policy updates in 101 specific countries, 42 languages and payroll in 46 countries.
HXM is designed around what employees need, how they work, and what motivates them. It empowers employees and enables HR leaders to accelerate business growth.
SAP SuccessFactors HXM solutions leverage Qualtrics solutions allowing customers to capture insights from employees and link them with operational data to see what is happening, understand why and take action. More than 900 customers have selected these solutions.
BIC, City of Houston, Vodafone Idea Limited, Mitsubishi Chemical Corporation, Fujitsu Ltd., and NORD/LB were some of many competitive wins. Klosterfrau Healthcare Group and FC Bayern München went live in Q4.
SAP was ranked as a leader in the IDC MarketScape for Worldwide Talent Acquisition Suites for Large Enterprise, and the Gartner Magic Quadrant for Cloud HCM Suites for 1,000+ Employee Enterprises.
SAP Customer Experience
SAP Customer Experience (CX) combines leading solutions for commerce, service, marketing, sales, and customer data, enabling companies to manage and deliver personalized customer experiences across touchpoints and channels based on a
| SAP Quarterly Statement Q4 2020 | 4 |
complete view of the customer. As part of the Intelligent Enterprise, SAP CX suite integrates with SAP S/4HANA from demand signals to fulfillment in one end-to-end process.
SAP CX solutions also use the benefits of Qualtrics Customer Experience Management to understand the wants and needs of customers. This enables organizations to combine customer feedback and operational data to listen, understand and take action in the moment to improve the customer experience.
In the fourth quarter, SAP’s e-commerce solution showed a strong performance, more than doubling cloud revenue year over year.
Carrefour, Mindray, Miele & Cie. KG, Sundiro Honda Motorcycle Co., Ltd., Piaggio & C. S.p.A., and VINCI Energies chose SAP Customer Experience solutions, with Beiersdorf, Deutsche Börse and Mondi AG going live.
SAP was recently named a leader in the IDC MarketScape: Worldwide Retail Commerce Platform Software Providers 2020 Vendor Assessment report.
SAP Business Technology Platform
SAP Business Technology Platform powers customers to become intelligent enterprises and is a central element of SAP’s new “RISE with SAP” offering. Its leading technologies like SAP HANA, SAP Analytics Cloud, SAP Integration Suite and SAP Extension Suite enable customers to build, integrate and extend applications, while turning their data into business value. Its easy access to the ecosystem ensures development agility and speed. SAP Business Technology Platform supports cloud, on-premise and hybrid customer landscapes, offering seamless interoperability with other platform technologies to deliver a high level of scalability, flexibility and efficiency.
Deutsches Rotes Kreuz (German Red Cross), Nomad Foods Europe Ltd., and Enel selected SAP Business Technology Platform and SAP Analytics Cloud solutions.
In the fourth quarter, SAP further strengthened the Business Technology Platform as the engine for our customers business transformation with new tools and functionalities for low-code and no-code process automation.
SAP was recently named as a leader in both the Gartner “Magic Quadrant for Metadata Management Solutions” and its “Magic Quadrant for Cloud Database Management Systems”.
Ariba & Fieldglass
SAP Ariba provides collaborative commerce capabilities from sourcing and orders through invoice and payment along with expertise to help customers optimize their spend. The solutions drive simple, intelligent exchanges between millions of buyers and suppliers across both direct and indirect expense categories.
SAP launched Qualtrics XM for Suppliers, a new solution that combines data from an organization’s SAP Ariba, SAP Fieldglass and SAP S/4HANA solutions with real-time supplier insights and AI-driven intelligence from Qualtrics, to empower organizations to identify key areas of improvement across the source-to-pay process to help secure critical supply, increase cost savings, mitigate risk and improve business agility.
SAP Ariba and SAP Fieldglass, together with SAP Concur, represent SAP’s intelligent spend platform, the largest commerce platform in the world with over $4.1 trillion in global commerce annually transacted in more than 180 countries.
Esselunga S.p.A., Nestlé, General Motors, Ecopetrol, Los Angeles Unified School District, and Sony Picture Networks India chose SAP Ariba solutions in the fourth quarter.
SAP was recently named a leader for its SAP Ariba and SAP Fieldglass integrated solutions in the Gartner 2020 Magic Quadrant for Procure-to-Pay Suites report.
SAP Fieldglass is the leader in external workforce management and services procurement. The solutions help organizations find, engage, and manage all types of flexible resources including contingent workers, consultants and freelancers. SAP Fieldglass added more than 1 million new external workers during the fourth quarter. Chevron chose SAP Fieldglass solutions in the fourth quarter.
SAP Fieldglass solutions were recently positioned as a Market Leader in the Ardent Partners 2020 Vendor Management System Technology Advisor report.
Concur
In the fourth quarter, Concur segment revenue was down 20% to €341 million year over year (down 15% at constant currencies) due to lower pay-as-you-go transactional revenue as a result of significantly reduced business travel related to the COVID-19 crisis.
| SAP Quarterly Statement Q4 2020 | 5 |
SAP Concur provides integrated travel, expense, and invoice management solutions that simplify and automate these everyday processes. The SAP Concur mobile app guides employees through business trips, charges are effortlessly populated into expense reports, and invoice approvals are automated. By integrating near real-time data and using AI to analyze 100% of transactions, the SAP Concur spend management solution provides better visibility to help efficiently control employee-driven spend.
Canadian Pacific Railway Company, Nikkei, Inc., and Software AG were among the organizations who chose SAP Concur solutions in the fourth quarter.
Qualtrics
In the fourth quarter, Qualtrics segment revenue was up 17% to €183 million year over year (up 26% at constant currencies).
With Qualtrics, SAP combines market leadership in Experience Management (XM) with end-to-end operational power in 25 industries to help organizations design and improve the four core experiences of business: customer, employee, product and brand.
The Qualtrics XM Platform™ is trusted by over 13,000 customers as mission-critical software that enables breakthrough design and continuous improvement that allows all four experiences to be managed on a single, connected platform.
In the fourth quarter, Deutsche Bank, Burton Snowboards, Bank of Montreal, Uber Singapore, University of Auckland, Rosetta Stone, HSBC, GE Healthcare, Hongkong and Shanghai Hotels, and many others selected Qualtrics to move beyond systems of record to new systems of action and achieve breakthrough results.
Services
In the fourth quarter, Services segment revenue was down 16% to €758 million year over year (down 11% at constant currencies). The services implementation business continues to demonstrate its resilience and flexibility with SAP’s shift to remote delivery, and SAP’s premium services remain in high demand. However, SAP’s training business continues to be impacted due to delays in re-opening of global training centers.
Segment Results at a Glance
Segment Performance Fourth Quarter 2020
| | Applications, Technology &
Support | Concur | Qualtrics | Services |
€ million, unless otherwise stated (Non-IFRS) | Actual Currency | ∆ in % | ∆ in % const. curr. | Actual Currency | ∆ in % | ∆ in % const. curr. | Actual Currency | ∆ in % | ∆ in % const. curr. | Actual Currency | ∆ in % | ∆ in % const. curr. |
| Cloud revenue | 1,592 | 11 | 17 | 295 | –19 | –14 | 139 | 26 | 36 | 0 | NA | NA |
| Segment revenue | 6,207 | –4 | 1 | 341 | –20 | –15 | 183 | 17 | 26 | 758 | –16 | –11 |
| Segment profit (loss) | 3,038 | –3 | 2 | 121 | –30 | –26 | 10 | <-100 | <-100 | 124 | 5 | 8 |
| Cloud gross margin (in %) | 66.3 | 3.2pp | 2.9pp | 87.2 | –1.4pp | –1.6pp | 89.4 | –0.7pp | –0.6pp | NM1) | NM1) | NM1) |
| Segment margin (in %) | 48.9 | 0.6pp | 0.6pp | 35.7 | –5.3pp | –5.3pp | 5.4 | 11.9pp | 10.9pp | 16.3 | 3.1pp | 2.9pp |
1) NM = not meaningful
Regional Revenue Performance Full Year 2020
SAP had a solid year in all regions.
In the EMEA region cloud and software revenue increased 1% (IFRS) and 3% (non-IFRS at constant currencies). Cloud revenue increased 23% (IFRS) and 25% (non-IFRS at constant currencies) with Germany, Switzerland and France being highlights. Saudi Arabia and Sweden had a strong year in software licenses revenue.
In the Americas region, cloud and software revenue increased 1% (IFRS) and was up 3% (non-IFRS at constant currencies). Cloud revenue increased 13% (IFRS and non-IFRS at constant currencies) with Canada a highlight while the United States and Mexico had a robust performance. The United States, Brazil and Mexico held up well in software licenses revenue.
In the APJ region, cloud and software revenue was flat (IFRS) and up 2% (non-IFRS at constant currencies). Cloud revenue increased 18% (IFRS) and 21% (non-IFRS at constant currencies) with Japan, South Korea and Singapore being highlights. Japan, Australia and India had a robust performance in software licenses revenue.
| SAP Quarterly Statement Q4 2020 | 6 |
Financial Results at a Glance
Fourth Quarter 2020
| | IFRS | Non-IFRS1) |
| € million, unless otherwise stated | Q4 2020 | Q4 2019 | ∆ in % | Q4 2020 | Q4 2019 | ∆ in % | ∆ in % const. curr. |
| Current cloud backlog2) | NA | NA | NA | 7,155 | 6,681 | 7 | 14 |
| Cloud revenue | 2,041 | 1,896 | 8 | 2,044 | 1,907 | 7 | 13 |
| Software licenses and support revenue | 4,538 | 4,950 | –8 | 4,538 | 4,950 | –8 | –4 |
| Cloud and software revenue | 6,579 | 6,846 | –4 | 6,582 | 6,857 | –4 | 1 |
| Total revenue | 7,538 | 8,041 | –6 | 7,541 | 8,052 | –6 | –2 |
| Share of more predictable revenue (in %) | 65 | 60 | 4pp | 65 | 60 | 4pp | |
| Operating profit (loss) | 2,655 | 2,102 | 26 | 2,768 | 2,839 | –3 | 3 |
| Profit (loss) after tax | 1,932 | 1,637 | 18 | 2,022 | 2,190 | –8 | |
| Basic earnings per share (in €) | 1.62 | 1.36 | 19 | 1.69 | 1.82 | –7 | |
| Number of employees (FTE, December 31) | 102,430 | 100,330 | 2 | NA | NA | NA | NA |
1) For a breakdown of the individual adjustments see table “Non-IFRS Adjustments by Functional Areas” in this Quarterly Statement.
2) As this is an order entry metric, there is no IFRS equivalent.
Due to rounding, numbers may not add up precisely.
Full Year 2020
| | IFRS | Non-IFRS1) |
| € million, unless otherwise stated | Q1–Q4 2020 | Q1–Q4 2019 | ∆ in % | Q1–Q4 2020 | Q1–Q4 2019 | ∆ in % | ∆ in % const. curr. |
| Current cloud backlog2) | NA | NA | NA | 7,155 | 6,681 | 7 | 14 |
| Cloud revenue | 8,080 | 6,933 | 17 | 8,085 | 7,013 | 15 | 18 |
| Software licenses and support revenue | 15,148 | 16,080 | –6 | 15,148 | 16,080 | –6 | –4 |
| Cloud and software revenue | 23,228 | 23,012 | 1 | 23,233 | 23,093 | 1 | 3 |
| Total revenue | 27,338 | 27,553 | –1 | 27,343 | 27,634 | –1 | 1 |
| Share of more predictable revenue (in %) | 72 | 67 | 5pp | 72 | 67 | 4pp | |
| Operating profit (loss) | 6,621 | 4,473 | 48 | 8,283 | 8,208 | 1 | 4 |
| Profit (loss) after tax | 5,280 | 3,370 | 57 | 6,529 | 6,152 | 6 | |
| Basic earnings per share (in €) | 4.35 | 2.78 | 56 | 5.41 | 5.11 | 6 | |
| Number of employees (FTE, December 31) | 102,430 | 100,330 | 2 | NA | NA | NA | NA |
1) For a breakdown of the individual adjustments see table “Non-IFRS Adjustments by Functional Areas” in this Quarterly Statement.
2) As this is an order entry metric, there is no IFRS equivalent.
Due to rounding, numbers may not add up precisely.
| SAP Quarterly Statement Q4 2020 | 7 |
Business Outlook 2021
SAP provides the following full-year 2021 outlook reflecting its solid business momentum and current estimates concerning the timing and pace of recovery from the COVID-19 crisis. This outlook assumes the COVID-19 crisis will begin to recede as vaccine programs roll out globally, leading to a gradually improving demand environment in the second half of 2021.
| · | SAP expects €9.1 – 9.5 billion non-IFRS cloud revenue at constant currencies (2020: €8.09 billion), up 13% to 18% at constant currencies |
| · | SAP expects €23.3 – 23.8 billion non-IFRS cloud and software revenue at constant currencies (2020: €23.23 billion), flat to up 2% at constant currencies |
| · | SAP expects €7.8 – 8.2 billion non-IFRS operating profit at constant currencies (2020: €8.28 billion), down 1% to 6% at constant currencies |
| · | The share of more predictable revenue (defined as the total of cloud revenue and software support revenue) is expected to reach approximately 75% (2020: 72%). |
Following a record cash flow performance in 2020, the company expects operating cash flow of approximately €6.0 billion (2020 €7.2 billion) primarily reflecting moderately lower profit, higher expected income tax payments, and adverse currency exchange movements. Free cash flow is expected above €4.5 billion (2020 €6.0 billion), also impacted by a modest increase in capex.
While SAP’s full-year 2021 business outlook is at constant currencies, actual currency reported figures are expected to be impacted by currency exchange rate fluctuations as the Company progresses through the year. See the table below for the Q1 and FY 2021 expected currency impacts.
| Expected Currency Impact Based on December 2020 Level for the Rest of the Year |
| In percentage points | Q1 | FY |
| Cloud revenue | -6pp to -8pp | -3pp to -5pp |
| Cloud and software revenue | -5pp to -7pp | -2pp to -4pp |
| Operating profit | -7pp to -9pp | -2pp to -4pp |
SAP also confirms its mid-term ambition which was previously published in its Q3 2020 Quarterly Statement.
In addition to the financial goals, SAP also focuses on three non-financial targets for 2021: customer loyalty, employee engagement, and carbon emissions. SAP aims to achieve a Customer Net Promoter Score score of 5 to 10 in 2021. The Company targets an Employee Engagement Index in a range of 84% to 86%. Further, the Company targets greenhouse gas emissions of 145 kt in 2021.
| SAP Quarterly Statement Q4 2020 | 8 |
Additional Information
This Quarterly Statement and all information therein is unaudited.
The 2019 comparative numbers for full year only include Qualtrics revenues and profits from acquisition date of January 23rd.
The SAP Integrated Report 2020 and Annual Report on Form 20-F will be published on March 4th, 2021, and will be available for download at www.sapintegratedreport.com.
Definition of key growth metrics
Current cloud backlog (CCB) is the contractually committed cloud revenue we expect to recognize over the upcoming 12 months as of a specific key date. Thus, it is a subcomponent of our overall remaining performance obligations following IFRS 15.120. For CCB, we take into consideration committed deals only. CCB can be regarded as a lower boundary for cloud revenue to be recognized over the next 12 months, as it excludes utilization-based models without pre-commitments and committed deals, both new and renewal, closed after the key date. For our committed cloud business, we believe the expansion of CCB over a period is a valuable indicator of go-to market success, as it reflects both new contracts closed as well as existing contracts renewed.
Share of more predictable revenue is the total of non-IFRS cloud revenue and non-IFRS software support revenue as a percentage of total revenue.
Global commerce is the total commerce volume transacted on the SAP Ariba, SAP Concur and SAP Fieldglass Networks in the trailing 12 months. SAP Ariba commerce includes procurement and sourcing spend.
For explanations on other key growth metrics please refer the performance management section of SAP’s Integrated Report 2019 and Half-Year Report, which can be found at www.sap.com/investor.
Webcast
SAP senior management will host a virtual press conference today, January 29th at 10:00 AM (CET) /9:00 AM (GMT) / 4:00 AM (Eastern) / 1:00 AM (Pacific), followed by a financial analyst conference call at 2:00 PM (CET) / 1:00 PM (GMT) / 8:00 AM (Eastern) / 5:00 AM (Pacific). Both conferences will be webcast live on the Company’s website at www.sap.com/investor and will be available for replay. Supplementary financial information pertaining to the full-year and quarterly results can be found at www.sap.com/investor.
Financial Analyst and Investor Conference
Following the “RISE with SAP” launch held on January 27th, SAP is planning to host an event for financial analysts and investors in the coming months, in conjunction with the company’s annual SAPPHIRE NOW conference.
About SAP
SAP’s strategy is to help every business run as an intelligent enterprise. As a market leader in enterprise application software, we help companies of all sizes and in all industries run at their best: 77% of the world’s transaction revenue touches an SAP® system. Our machine learning, Internet of Things (IoT), and advanced analytics technologies help turn customers’ businesses into intelligent enterprises. SAP helps give people and organizations deep business insight and fosters collaboration that helps them stay ahead of their competition. We simplify technology for companies so they can consume our software the way they want – without disruption. Our end-to-end suite of applications and services enables business and public customers across 25 industries globally to operate profitably, adapt continuously, and make a difference. With a global network of customers, partners, employees, and thought leaders, SAP helps the world run better and improve people’s lives. For more information, visit www.sap.com.
For more information, financial community only:
| Stefan Gruber | +49 (6227) 7-44872 | investor@sap.com, CET |
| Follow SAP Investor Relations on Twitter at @sapinvestor. | |
For more information, press only:
| Joellen Perry | +1 (650) 445-6780 | joellen.perry@sap.com, PT |
| Daniel Reinhardt | +49 (6227) 7-40201 | daniel.reinhardt@sap.com, CET |
For customers interested in learning more about SAP products:
| Global Customer Center: | +49 180 534-34-24 |
| United States Only: | +1 (800) 872-1SAP (+1-800-872-1727) |
| SAP Quarterly Statement Q4 2020 | 9 |
Note to editors:
To preview and download broadcast-standard stock footage and press photos digitally, please visit www.sap.com/photos. On this platform, you can find high resolution material for your media channels. To view video stories on diverse topics, visit www.sap-tv.com. From this site, you can embed videos into your own Web pages, share video via e-mail links and subscribe to RSS feeds from SAP TV.
Any statements contained in this document that are not historical facts are forward-looking statements as defined in the U.S. Private Securities Litigation Reform Act of 1995. Words such as “anticipate,” “believe,” “estimate,” “expect,” “forecast,” “intend,” “may,” “plan,” “project,” “predict,” “should” and “will” and similar expressions as they relate to SAP are intended to identify such forward-looking statements. SAP undertakes no obligation to publicly update or revise any forward-looking statements. All forward-looking statements are subject to various risks and uncertainties that could cause actual results to differ materially from expectations. The factors that could affect SAP's future financial results are discussed more fully in SAP's filings with the U.S. Securities and Exchange Commission ("SEC"), including SAP's most recent Annual Report on Form 20-F filed with the SEC as supplemented by SAP’s Half Year Report furnished with the SEC on Form 6-K. Readers are cautioned not to place undue reliance on these forward-looking statements, which speak only as of their dates.
© 2021 SAP SE. All rights reserved.
No part of this publication may be reproduced or transmitted in any form or for any purpose without the express permission of SAP SE. The information contained herein may be changed without prior notice.
Some software products marketed by SAP SE and its distributors contain proprietary software components of other software vendors. National product specifications may vary.
These materials are provided by SAP SE and its affiliated companies ("SAP Group") for informational purposes only, without representation or warranty of any kind, and SAP Group shall not be liable for errors or omissions with respect to the materials. The only warranties for SAP Group products and services are those that are set forth in the express warranty statements accompanying such products and services, if any. Nothing herein should be construed as constituting an additional warranty.
SAP and other SAP products and services mentioned herein as well as their respective logos are trademarks or registered trademarks of SAP SE (or an SAP affiliate company) in Germany and other countries. All other product and service names mentioned are the trademarks of their respective companies. Please see www.sap.com/about/legal/copyright.html for additional trademark information and notice.
| SAP Quarterly Statement Q4 2020 | 10 |
Contents
| Financial and Non-Financial Key Facts (IFRS and Non-IFRS) | 12 |
| Primary Financial Statements of SAP Group (IFRS) | 14 |
| (A) | Consolidated Income Statements | 14 |
| | (A.1) | Consolidated Income Statements – Quarter | 14 |
| | (A.2) | Consolidated Income Statements – Year-to-Date | 15 |
| (B) | Consolidated Statements of Financial Position | 16 |
| (C) | Consolidated Statements of Cash Flows | 17 |
| Non-IFRS Numbers | 18 |
| (D) | Basis of Non-IFRS Presentation | 18 |
| (E) | Reconciliation from Non-IFRS Numbers to IFRS Numbers | 19 |
| | (E.1) | Reconciliation from Non-IFRS Numbers to IFRS Numbers – Quarter | 19 |
| | (E.2) | Reconciliation from Non-IFRS Numbers to IFRS Numbers – Year-to-Date | 20 |
| (F) | Non-IFRS Adjustments – Actuals and Estimates | 21 |
| (G) | Non-IFRS Adjustments by Functional Areas | 21 |
| Disaggregations | 23 |
| (H) | Segment Reporting | 23 |
| | (H.1) | Segment Policies and Segment Changes | 23 |
| | (H.2) | Segment Reporting – Quarter | 23 |
| | (H.3) | Segment Reporting – Year-to-Date | 27 |
| (I) | Revenue by Region (IFRS and Non-IFRS) | 30 |
| | (I.1) | Revenue by Region (IFRS and Non-IFRS) – Quarter | 30 |
| | (I.2) | Revenue by Region (IFRS and Non-IFRS) – Year-to-Date | 31 |
| (J) | Employees by Region and Functional Areas | 32 |
| Other Disclosures | 33 |
| (K) | Financial Income, Net | 33 |
| (L) | Divestments | 33 |
| SAP Quarterly Statement Q4 2020 | 11 |
Financial and Non-Financial Key Facts
(IFRS and Non-IFRS)
| € millions, unless otherwise stated | | Q1 2019 | | Q2 2019 | | Q3 2019 | | Q4 2019 | | TY 2019 | | Q1 2020 | | Q2 2020 | | Q3 2020 | | Q4 2020 | | TY 2020 |
| Revenues | | | | | | | | | | | | | | | | | | | | |
| Cloud (IFRS) | | 1,555 | | 1,692 | | 1,789 | | 1,896 | | 6,933 | | 2,011 | | 2,044 | | 1,984 | | 2,041 | | 8,080 |
| Cloud (non-IFRS) | | 1,581 | | 1,717 | | 1,807 | | 1,907 | | 7,013 | | 2,012 | | 2,044 | | 1,984 | | 2,044 | | 8,085 |
| % change – yoy | | 48 | | 40 | | 37 | | 35 | | 40 | | 27 | | 19 | | 10 | | 7 | | 15 |
| % change constant currency – yoy | | 41 | | 35 | | 33 | | 32 | | 35 | | 25 | | 18 | | 14 | | 13 | | 18 |
| Software licenses (IFRS) | | 650 | | 948 | | 932 | | 2,002 | | 4,533 | | 451 | | 773 | | 714 | | 1,703 | | 3,642 |
| Software licenses (non-IFRS) | | 650 | | 948 | | 932 | | 2,002 | | 4,533 | | 451 | | 773 | | 714 | | 1,703 | | 3,642 |
| % change – yoy | | 4 | | –5 | | –1 | | –4 | | –2 | | –31 | | –18 | | –23 | | –15 | | –20 |
| % change constant currency – yoy | | 1 | | –6 | | –4 | | –6 | | –5 | | –31 | | –18 | | –19 | | –11 | | –17 |
| Software support (IFRS) | | 2,838 | | 2,854 | | 2,907 | | 2,948 | | 11,547 | | 2,934 | | 2,892 | | 2,845 | | 2,835 | | 11,506 |
| Software support (non-IFRS) | | 2,838 | | 2,854 | | 2,907 | | 2,948 | | 11,548 | | 2,934 | | 2,892 | | 2,845 | | 2,835 | | 11,506 |
| % change – yoy | | 7 | | 4 | | 5 | | 4 | | 5 | | 3 | | 1 | | –2 | | –4 | | 0 |
| % change constant currency – yoy | | 4 | | 2 | | 3 | | 2 | | 3 | | 2 | | 2 | | 1 | | 0 | | 1 |
| Software licenses and support (IFRS) | | 3,489 | | 3,802 | | 3,839 | | 4,950 | | 16,080 | | 3,386 | | 3,665 | | 3,559 | | 4,538 | | 15,148 |
| Software licenses and support (non-IFRS) | | 3,489 | | 3,802 | | 3,840 | | 4,950 | | 16,080 | | 3,386 | | 3,665 | | 3,559 | | 4,538 | | 15,148 |
| % change – yoy | | 6 | | 2 | | 4 | | 1 | | 3 | | –3 | | –4 | | –7 | | –8 | | –6 |
| % change constant currency – yoy | | 3 | | 0 | | 1 | | –1 | | 1 | | –4 | | –3 | | –4 | | –4 | | –4 |
| Cloud and software (IFRS) | | 5,044 | | 5,495 | | 5,629 | | 6,846 | | 23,012 | | 5,397 | | 5,709 | | 5,544 | | 6,579 | | 23,228 |
| Cloud and software (non-IFRS) | | 5,070 | | 5,520 | | 5,647 | | 6,857 | | 23,093 | | 5,398 | | 5,709 | | 5,544 | | 6,582 | | 23,233 |
| % change – yoy | | 16 | | 11 | | 13 | | 8 | | 12 | | 6 | | 3 | | –2 | | –4 | | 1 |
| % change constant currency – yoy | | 12 | | 8 | | 10 | | 6 | | 9 | | 5 | | 3 | | 2 | | 1 | | 3 |
| Total revenue (IFRS) | | 6,091 | | 6,631 | | 6,791 | | 8,041 | | 27,553 | | 6,521 | | 6,743 | | 6,535 | | 7,538 | | 27,338 |
| Total revenue (non-IFRS) | | 6,118 | | 6,656 | | 6,809 | | 8,052 | | 27,634 | | 6,522 | | 6,744 | | 6,535 | | 7,541 | | 27,343 |
| % change – yoy | | 16 | | 11 | | 13 | | 8 | | 12 | | 7 | | 1 | | –4 | | –6 | | –1 |
| % change constant currency – yoy | | 12 | | 8 | | 10 | | 6 | | 9 | | 5 | | 1 | | 0 | | –2 | | 1 |
| Share of more predictable revenue (IFRS, in %) | | 72 | | 69 | | 69 | | 60 | | 67 | | 76 | | 73 | | 74 | | 65 | | 72 |
| Share of more predictable revenue (non-IFRS, in %) | | 72 | | 69 | | 69 | | 60 | | 67 | | 76 | | 73 | | 74 | | 65 | | 72 |
| | | | | | | | | | | | | | | | | | | | | |
| Profits | | | | | | | | | | | | | | | | | | | | |
| Operating profit (loss) (IFRS) | | –136 | | 827 | | 1,679 | | 2,102 | | 4,473 | | 1,210 | | 1,284 | | 1,473 | | 2,655 | | 6,621 |
| Operating profit (loss) (non-IFRS) | | 1,467 | | 1,816 | | 2,086 | | 2,839 | | 8,208 | | 1,482 | | 1,964 | | 2,069 | | 2,768 | | 8,283 |
| % change | | 19 | | 11 | | 20 | | 12 | | 15 | | 1 | | 8 | | –1 | | –3 | | 1 |
| % change constant currency | | 13 | | 8 | | 15 | | 9 | | 11 | | 0 | | 7 | | 4 | | 3 | | 4 |
| Profit (loss) after tax (IFRS) | | –108 | | 582 | | 1,259 | | 1,637 | | 3,370 | | 811 | | 885 | | 1,652 | | 1,932 | | 5,280 |
| Profit (loss) after tax (non-IFRS) | | 1,080 | | 1,317 | | 1,564 | | 2,190 | | 6,152 | | 1,015 | | 1,395 | | 2,098 | | 2,022 | | 6,529 |
| % change | | 25 | | 12 | | 15 | | 22 | | 18 | | –6 | | 6 | | 34 | | –8 | | 6 |
| | | | | | | | | | | | | | | | | | | | | |
| Margins | | | | | | | | | | | | | | | | | | | | |
| Cloud gross margin (IFRS, in %) | | 61.2 | | 62.6 | | 64.5 | | 65.1 | | 63.5 | | 66.4 | | 66.0 | | 66.4 | | 67.2 | | 66.5 |
| Cloud gross margin (non-IFRS, in %) | | 66.2 | | 67.9 | | 69.0 | | 69.5 | | 68.2 | | 69.3 | | 69.5 | | 69.7 | | 70.0 | | 69.6 |
| Software license and support gross margin (IFRS, in %) | | 84.6 | | 86.0 | | 87.0 | | 88.1 | | 86.6 | | 85.2 | | 86.4 | | 86.7 | | 88.2 | | 86.7 |
| Software license and support gross margin (non-IFRS, in %) | | 85.7 | | 87.1 | | 87.6 | | 88.8 | | 87.4 | | 85.7 | | 87.4 | | 87.6 | | 88.4 | | 87.4 |
| Cloud and software gross margin (IFRS, in %) | | 77.4 | | 78.8 | | 79.9 | | 81.7 | | 79.6 | | 78.2 | | 79.1 | | 79.4 | | 81.7 | | 79.7 |
| Cloud and software gross margin (non-IFRS, in %) | | 79.6 | | 81.1 | | 81.7 | | 83.4 | | 81.6 | | 79.6 | | 81.0 | | 81.2 | | 82.7 | | 81.2 |
| Gross margin (IFRS, in %) | | 66.5 | | 68.2 | | 70.3 | | 72.8 | | 69.7 | | 68.3 | | 69.9 | | 71.1 | | 74.8 | | 71.2 |
| Gross margin (non-IFRS, in %) | | 69.5 | | 71.4 | | 72.3 | | 75.2 | | 72.3 | | 69.8 | | 72.6 | | 73.7 | | 75.8 | | 73.1 |
| Operating margin (IFRS, in %) | | –2.2 | | 12.5 | | 24.7 | | 26.1 | | 16.2 | | 18.6 | | 19.0 | | 22.5 | | 35.2 | | 24.2 |
| Operating margin (non-IFRS, in %) | | 24.0 | | 27.3 | | 30.6 | | 35.3 | | 29.7 | | 22.7 | | 29.1 | | 31.7 | | 36.7 | | 30.3 |
| AT&S segment – Cloud gross margin (in %) | | 61.1 | | 62.5 | | 63.1 | | 63.1 | | 62.5 | | 64.4 | | 65.2 | | 65.5 | | 66.3 | | 65.4 |
| AT&S segment – Segment gross margin (in %) | | 78.4 | | 80.0 | | 80.3 | | 82.8 | | 80.5 | | 78.3 | | 80.0 | | 80.5 | | 82.7 | | 80.5 |
| AT&S segment – Segment margin (in %) | | 36.9 | | 42.9 | | 44.7 | | 48.3 | | 43.6 | | 36.6 | | 43.7 | | 43.5 | | 48.9 | | 43.5 |
| Services segment – Services gross margin (in %) | | 21.7 | | 25.2 | | 31.7 | | 29.6 | | 27.2 | | 27.5 | | 33.9 | | 36.8 | | 31.3 | | 32.3 |
| SAP Quarterly Statement Q4 2020 | 12 |
| € millions, unless otherwise stated | | Q1 2019 | | Q2 2019 | | Q3 2019 | | Q4 2019 | | TY 2019 | | Q1 2020 | | Q2 2020 | | Q3 2020 | | Q4 2020 | | TY 2020 |
| Services segment – Segment gross margin (in %) | | 17.7 | | 22.3 | | 29.0 | | 26.5 | | 24.1 | | 23.8 | | 31.2 | | 34.0 | | 27.9 | | 29.1 |
| Services segment – Segment margin (in %) | | 3.9 | | 7.4 | | 16.8 | | 13.1 | | 10.5 | | 10.9 | | 16.3 | | 20.4 | | 16.3 | | 15.8 |
| Concur segment – Cloud gross margin (in %) | | 84.9 | | 86.5 | | 86.9 | | 88.7 | | 86.8 | | 88.1 | | 88.4 | | 88.3 | | 87.2 | | 88.0 |
| Concur segment – Segment gross margin (in %) | | 76.8 | | 77.5 | | 77.9 | | 80.6 | | 78.3 | | 79.8 | | 79.1 | | 79.0 | | 77.1 | | 78.8 |
| Concur segment – Segment margin (in %) | | 36.4 | | 35.9 | | 40.4 | | 41.0 | | 38.5 | | 38.1 | | 36.5 | | 39.6 | | 35.7 | | 37.5 |
| Qualtrics segment – Cloud gross margin (in %) | | 91.4 | | 92.0 | | 91.4 | | 90.1 | | 91.1 | | 90.8 | | 91.0 | | 90.9 | | 89.4 | | 90.5 |
| Qualtrics segment – Segment gross margin (in %) | | 81.4 | | 79.9 | | 78.6 | | 74.9 | | 78.3 | | 75.4 | | 78.6 | | 79.1 | | 77.4 | | 77.6 |
| Qualtrics segment – Segment margin (in %) | | 7.9 | | 5.6 | | 3.2 | | –6.5 | | 1.6 | | –7.5 | | 4.3 | | 8.6 | | 5.4 | | 2.8 |
| | | | | | | | | | | | | | | | | | | | | |
| Key Profit Ratios | | | | | | | | | | | | | | | | | | | | |
| Effective tax rate (IFRS, in %) | | 23.2 | | 28.6 | | 26.1 | | 26.2 | | 26.7 | | 27.7 | | 33.1 | | 20.2 | | 28.6 | | 26.9 |
| Effective tax rate (non-IFRS, in %) | | 26.1 | | 27.0 | | 25.8 | | 25.9 | | 26.2 | | 27.2 | | 30.3 | | 21.3 | | 28.2 | | 26.5 |
| | | | | | | | | | | | | | | | | | | | | |
| Earnings per share, basic (IFRS, in €) | | –0.10 | | 0.48 | | 1.04 | | 1.36 | | 2.78 | | 0.68 | | 0.73 | | 1.32 | | 1.62 | | 4.35 |
| Earnings per share, basic (non-IFRS, in €) | | 0.90 | | 1.09 | | 1.30 | | 1.82 | | 5.11 | | 0.85 | | 1.17 | | 1.70 | | 1.69 | | 5.41 |
| | | | | | | | | | | | | | | | | | | | | |
| Order Entry and current cloud backlog | | | | | | | | | | | | | | | | | | | | |
| Current cloud backlog | | 5,328 | | 5,520 | | 5,995 | | 6,681 | | 6,681 | | 6,634 | | 6,638 | | 6,599 | | 7,155 | | 7,155 |
| % change – yoy | | NA | | NA | | NA | | NA | | NA | | 25 | | 20 | | 10 | | 7 | | 7 |
| % change constant currency – yoy | | NA | | NA | | NA | | NA | | NA | | 24 | | 21 | | 16 | | 14 | | 14 |
| Orders – number of cloud deals (in transactions) | | 2,961 | | 3,624 | | 3,717 | | 5,377 | | 15,679 | | 3,113 | | 3,755 | | 3,975 | | 6,045 | | 16,888 |
| Share of cloud orders greater than €5 million based on total cloud order entry volume (in %) | | 26 | | 26 | | 29 | | 35 | | 31 | | 28 | | 28 | | 28 | | 31 | | 29 |
| Share of cloud orders smaller than €1 million based on total cloud order entry volume (in %) | | 39 | | 34 | | 33 | | 28 | | 32 | | 37 | | 35 | | 36 | | 32 | | 34 |
| Orders – number of on-premise software deals (in transactions) | | 12,229 | | 12,522 | | 12,270 | | 15,563 | | 52,584 | | 10,517 | | 9,175 | | 11,006 | | 14,918 | | 45,616 |
| Share of orders greater than €5 million based on total software order entry volume (in %) | | 28 | | 28 | | 31 | | 35 | | 32 | | 24 | | 34 | | 30 | | 29 | | 30 |
| Share of orders smaller than €1 million based on total software order entry volume (in %) | | 42 | | 36 | | 39 | | 31 | | 35 | | 42 | | 38 | | 37 | | 32 | | 36 |
| | | | | | | | | | | | | | | | | | | | | |
| Liquidity and Cash Flow | | | | | | | | | | | | | | | | | | | | |
| Net cash flows from operating activities | | 2,802 | | –122 | | 638 | | 178 | | 3,496 | | 2,984 | | 788 | | 1,321 | | 2,100 | | 7,193 |
| Capital expenditure | | –359 | | –180 | | –164 | | –114 | | –817 | | –333 | | –164 | | –155 | | –164 | | –816 |
| Payments of lease liabilities | | –78 | | –106 | | –104 | | –115 | | –403 | | –72 | | –84 | | –115 | | –107 | | –378 |
| Free cash flow | | 2,365 | | –409 | | 370 | | –50 | | 2,276 | | 2,580 | | 540 | | 1,052 | | 1,829 | | 6,000 |
| % of total revenue (IFRS) | | 39 | | –6 | | 5 | | –1 | | 8 | | 40 | | 8 | | 16 | | 24 | | 22 |
| % of profit after tax (IFRS) | | –2,198 | | –70 | | 29 | | –3 | | 68 | | 318 | | 61 | | 64 | | 95 | | 114 |
| Group liquidity | | 7,673 | | 5,280 | | 5,597 | | 5,382 | | 5,382 | | 7,872 | | 7,401 | | 7,760 | | 6,781 | | 6,781 |
| Financial debt (–) | | –13,866 | | –13,833 | | –13,874 | | –13,668 | | –13,668 | | –13,700 | | –14,855 | | –14,649 | | –13,283 | | –13,283 |
| Net debt (–) | | –6,193 | | –8,553 | | –8,277 | | –8,286 | | –8,286 | | –5,827 | | –7,454 | | –6,889 | | –6,503 | | –6,503 |
| Days sales outstanding (DSO, in days)1) | | 69 | | 70 | | 71 | | 71 | | 71 | | 73 | | 76 | | 78 | | 78 | | 78 |
| | | | | | | | | | | | | | | | | | | | | |
| Financial Position | | | | | | | | | | | | | | | | | | | | |
| Cash and cash equivalents | | 7,332 | | 5,168 | | 5,525 | | 5,314 | | 5,314 | | 7,816 | | 6,205 | | 7,434 | | 5,311 | | 5,311 |
| Goodwill | | 29,160 | | 28,853 | | 29,904 | | 29,159 | | 29,159 | | 29,731 | | 29,214 | | 28,184 | | 27,560 | | 27,560 |
| Total assets | | 60,860 | | 57,874 | | 59,963 | | 60,212 | | 60,212 | | 62,947 | | 60,709 | | 59,278 | | 58,476 | | 58,476 |
| Contract liabilities (current) | | 6,068 | | 5,558 | | 4,400 | | 4,266 | | 4,266 | | 6,726 | | 5,791 | | 4,237 | | 4,150 | | 4,150 |
| Equity ratio (total equity in % of total assets) | | 48 | | 48 | | 50 | | 51 | | 51 | | 49 | | 48 | | 50 | | 51 | | 51 |
| | | | | | | | | | | | | | | | | | | | | |
| Non-Financials | | | | | | | | | | | | | | | | | | | | |
| Number of employees (quarter end)2) | | 98,659 | | 98,332 | | 99,710 | | 100,330 | | 100,330 | | 101,150 | | 101,379 | | 101,450 | | 102,430 | | 102,430 |
| Employee retention (in %, rolling 12 months) | | 93.8 | | 93.5 | | 93.3 | | 93.3 | | 93.3 | | 93.3 | | 93.9 | | 94.8 | | 95.3 | | 95.3 |
| Women in management (in %, quarter end) | | 26.0 | | 26.2 | | 26.3 | | 26.4 | | 26.4 | | 26.8 | | 27.3 | | 27.3 | | 27.5 | | 27.5 |
| Greenhouse gas emissions (in kilotons) | | 110 | | 75 | | 65 | | 50 | | 300 | | 65 | | 25 | | 25 | | 20 | | 135 |
1) Days sales outstanding measures the average number of days from the raised invoice to cash receipt from the customer. We calculate DSO by dividing the average invoiced trade receivables balance of the last 12 months by the average monthly cash receipt of the last 12 months.
2) In full-time equivalents.
Due to rounding, numbers may not add up precisely.
| SAP Quarterly Statement Q4 2020 | 13 |
Primary Financial Statements of SAP Group (IFRS)
| (A) | Consolidated Income Statements |
| (A.1) | Consolidated Income Statements – Quarter |
| € millions, unless otherwise stated | | | | Q4 2020 | | Q4 2019 | | ∆ in % |
| Cloud | | | | 2,041 | | 1,896 | | 8 |
| Software licenses | | | | 1,703 | | 2,002 | | –15 |
| Software support | | | | 2,835 | | 2,948 | | –4 |
| Software licenses and support | | | | 4,538 | | 4,950 | | –8 |
| Cloud and software | | | | 6,579 | | 6,846 | | –4 |
| Services | | | | 960 | | 1,195 | | –20 |
| Total revenue | | | | 7,538 | | 8,041 | | –6 |
| | | | | | | | | |
| Cost of cloud | | | | –669 | | –662 | | 1 |
| Cost of software licenses and support | | | | –538 | | –591 | | –9 |
| Cost of cloud and software | | | | –1,206 | | –1,253 | | –4 |
| Cost of services | | | | –696 | | –933 | | –25 |
| Total cost of revenue | | | | –1,903 | | –2,186 | | –13 |
| Gross profit | | | | 5,636 | | 5,855 | | –4 |
| Research and development | | | | –1,134 | | –1,203 | | –6 |
| Sales and marketing | | | | –1,743 | | –2,086 | | –16 |
| General and administration | | | | –281 | | –411 | | –32 |
| Restructuring | | | | 7 | | –29 | | <-100 |
| Other operating income/expense, net | | | | 171 | | –23 | | <-100 |
| Total operating expenses | | | | –4,884 | | –5,938 | | –18 |
| Operating profit (loss) | | | | 2,655 | | 2,102 | | 26 |
| | | | | | | | | |
| Other non-operating income/expense, net | | | | –58 | | –11 | | >100 |
| Finance income | | | | 331 | | 248 | | 33 |
| Finance costs | | | | –223 | | –121 | | 85 |
| Financial income, net | | | | 107 | | 127 | | –16 |
| Profit (loss) before tax | | | | 2,705 | | 2,219 | | 22 |
| | | | | | | | | |
| Income tax expense | | | | –773 | | –582 | | 33 |
| Profit (loss) after tax | | | | 1,932 | | 1,637 | | 18 |
| Attributable to owners of parent | | | | 1,906 | | 1,620 | | 18 |
| Attributable to non-controlling interests | | | | 26 | | 17 | | 49 |
| | | | | | | | | |
| Earnings per share, basic (in €)1) | | | | 1.62 | | 1.36 | | 19 |
| Earnings per share, diluted (in €)1) | | | | 1.62 | | 1.36 | | 19 |
1) For the three months ended December 31, 2020 and 2019, the weighted average number of shares was 1,180 million (diluted 1,180 million) and 1,194 million (diluted: 1,194 million), respectively (treasury stock excluded).
Due to rounding, numbers may not add up precisely.
| SAP Quarterly Statement Q4 2020 | 14 |
(A.2) Consolidated Income Statements – Year-to-Date
| € millions, unless otherwise stated | | | | Q1–Q4 2020 | | Q1–Q4 2019 | | ∆ in % |
| Cloud | | | | 8,080 | | 6,933 | | 17 |
| Software licenses | | | | 3,642 | | 4,533 | | –20 |
| Software support | | | | 11,506 | | 11,547 | | 0 |
| Software licenses and support | | | | 15,148 | | 16,080 | | –6 |
| Cloud and software | | | | 23,228 | | 23,012 | | 1 |
| Services | | | | 4,110 | | 4,541 | | –9 |
| Total revenue | | | | 27,338 | | 27,553 | | –1 |
| | | | | | | | | |
| Cost of cloud | | | | –2,706 | | –2,534 | | 7 |
| Cost of software licenses and support | | | | –2,008 | | –2,159 | | –7 |
| Cost of cloud and software | | | | –4,715 | | –4,692 | | 0 |
| Cost of services | | | | –3,172 | | –3,662 | | –13 |
| Total cost of revenue | | | | –7,886 | | –8,355 | | –6 |
| Gross profit | | | | 19,452 | | 19,199 | | 1 |
| Research and development | | | | –4,457 | | –4,292 | | 4 |
| Sales and marketing | | | | –7,106 | | –7,693 | | –8 |
| General and administration | | | | –1,355 | | –1,629 | | –17 |
| Restructuring | | | | 3 | | –1,130 | | <-100 |
| Other operating income/expense, net | | | | 84 | | 18 | | >100 |
| Total operating expenses | | | | –20,717 | | –23,081 | | –10 |
| Operating profit (loss) | | | | 6,621 | | 4,473 | | 48 |
| | | | | | | | | |
| Other non-operating income/expense, net | | | | –179 | | –74 | | >100 |
| Finance income | | | | 1,473 | | 787 | | 87 |
| Finance costs | | | | –697 | | –589 | | 18 |
| Financial income, net | | | | 776 | | 198 | | >100 |
| Profit (loss) before tax | | | | 7,218 | | 4,596 | | 57 |
| | | | | | | | | |
| Income tax expense | | | | –1,938 | | –1,226 | | 58 |
| Profit (loss) after tax | | | | 5,280 | | 3,370 | | 57 |
| Attributable to owners of parent | | | | 5,143 | | 3,321 | | 55 |
| Attributable to non-controlling interests | | | | 138 | | 50 | | >100 |
| | | | | | | | | |
| Earnings per share, basic (in €)1) | | | | 4.35 | | 2.78 | | 56 |
| Earnings per share, diluted (in €)1) | | | | 4.35 | | 2.78 | | 56 |
1) For the twelve months ended December 31, 2020 and 2019, the weighted average number of shares was 1,182 million (diluted: 1,182 million) and 1,194 million
(diluted: 1,194 million), respectively (treasury stock excluded).
Due to rounding, numbers may not add up precisely.
| SAP Quarterly Statement Q4 2020 | 15 |
(B) Consolidated Statements of Financial Position
| as at 12/31/2020 and 12/31/2019 |
| € millions | | | | 2020 | | 2019 |
| Cash and cash equivalents | | | | 5,311 | | 5,314 |
| Other financial assets | | | | 1,635 | | 297 |
| Trade and other receivables | | | | 6,593 | | 7,908 |
| Other non-financial assets | | | | 1,333 | | 1,188 |
| Tax assets | | | | 212 | | 506 |
| Total current assets | | | | 15,085 | | 15,213 |
| Goodwill | | | | 27,560 | | 29,159 |
| Intangible assets | | | | 3,784 | | 4,491 |
| Property, plant, and equipment | | | | 5,042 | | 5,496 |
| Other financial assets | | | | 3,512 | | 2,336 |
| Trade and other receivables | | | | 131 | | 129 |
| Other non-financial assets | | | | 1,926 | | 1,701 |
| Tax assets | | | | 270 | | 435 |
| Deferred tax assets | | | | 1,167 | | 1,251 |
| Total non-current assets | | | | 43,392 | | 44,999 |
| Total assets | | | | 58,476 | | 60,212 |
| |
| € millions | | | | 2020 | | 2019 |
| Trade and other payables | | | | 1,213 | | 1,581 |
| Tax liabilities | | | | 429 | | 255 |
| Financial liabilities | | | | 2,348 | | 3,273 |
| Other non-financial liabilities | | | | 4,654 | | 4,839 |
| Provisions | | | | 73 | | 247 |
| Contract liabilities | | | | 4,150 | | 4,266 |
| Total current liabilities | | | | 12,868 | | 14,462 |
| Trade and other payables | | | | 98 | | 8 |
| Tax liabilities | | | | 649 | | 538 |
| Financial liabilities | | | | 13,606 | | 12,923 |
| Other non-financial liabilities | | | | 768 | | 957 |
| Provisions | | | | 368 | | 335 |
| Deferred tax liabilities | | | | 158 | | 79 |
| Contract liabilities | | | | 36 | | 89 |
| Total non-current liabilities | | | | 15,684 | | 14,929 |
| Total liabilities | | | | 28,552 | | 29,390 |
| Issued capital | | | | 1,229 | | 1,229 |
| Share premium | | | | 545 | | 545 |
| Retained earnings | | | | 32,022 | | 28,783 |
| Other components of equity | | | | –1,011 | | 1,770 |
| Treasury shares | | | | –3,072 | | –1,580 |
| Equity attributable to owners of parent | | | | 29,713 | | 30,746 |
| | | | | | | |
| Non-controlling interests | | | | 211 | | 76 |
| Total equity | | | | 29,925 | | 30,822 |
| Total equity and liabilities | | | | 58,476 | | 60,212 |
Due to rounding, numbers may not add up precisely.
| SAP Quarterly Statement Q4 2020 | 16 |
(C) Consolidated Statements of Cash Flows
| € millions | | Q1–Q4 2020 | | Q1–Q4 2019 |
| Profit (loss) after tax | | 5.280 | | 3.370 |
| Adjustments to reconcile profit (loss) after tax to net cash flows from operating activities: | | | | |
| Depreciation and amortization | | 1.831 | | 1.872 |
| Share-based payment expense | | 1.082 | | 1.835 |
| Income tax expense | | 1.938 | | 1.226 |
| Financial income, net | | –776 | | –198 |
| Decrease/increase in allowances on trade receivables | | 68 | | 14 |
| Other adjustments for non-cash items | | –198 | | –54 |
| Decrease/increase in trade and other receivables | | 826 | | –1.469 |
| Decrease/increase in other assets | | –664 | | –583 |
| Increase/decrease in trade payables, provisions, and other liabilities | | 304 | | 328 |
| Increase/decrease in contract liabilities | | 128 | | 984 |
| Share-based payments | | –1.310 | | –1.257 |
| Interest paid | | –244 | | –341 |
| Interest received | | 122 | | 97 |
| Income taxes paid, net of refunds | | –1.194 | | –2.329 |
| Net cash flows from operating activities | | 7.193 | | 3.496 |
| Business combinations, net of cash and cash equivalents acquired | | –662 | | –6.215 |
| Proceeds from sales of subsidiaries or other businesses | | 203 | | 61 |
| Purchase of intangible assets or property, plant, and equipment | | –816 | | –817 |
| Proceeds from sales of intangible assets or property, plant, and equipment | | 88 | | 71 |
| Purchase of equity or debt instruments of other entities | | –2.535 | | –900 |
| Proceeds from sales of equity or debt instruments of other entities | | 735 | | 778 |
| Net cash flows from investing activities | | –2.986 | | –7.021 |
| Dividends paid | | –1.864 | | –1.790 |
| Dividends paid on non-controlling interests | | –2 | | –17 |
| Purchase of treasury shares | | –1.492 | | 0 |
| Proceeds from changes in ownership interests in subsidiaries that do not result in the loss of control | | 95 | | 0 |
| Proceeds from borrowings | | 2.132 | | 3.622 |
| Repayments of borrowings | | –2.430 | | –1.309 |
| Payments of lease liabilities | | –378 | | –403 |
| Transactions with non-controlling interests | | –59 | | 0 |
| Net cash flows from financing activities | | –3.997 | | 102 |
| Effect of foreign currency rates on cash and cash equivalents | | –214 | | 110 |
| Net decrease/increase in cash and cash equivalents | | –4 | | –3313 |
| Cash and cash equivalents at the beginning of the period | | 5.314 | | 8.627 |
| Cash and cash equivalents at the end of the period | | 5.311 | | 5.314 |
| Due to rounding, numbers may not add up precisely. |
| SAP Quarterly Statement Q4 2020 | 17 |
Non-IFRS Numbers
(D) Basis of Non-IFRS Presentation
We disclose certain financial measures such as revenue (non-IFRS), expense (non-IFRS), and profit measures (non-IFRS) that are not prepared in accordance with IFRS and are therefore considered non-IFRS financial measures.
For a more detailed description of all of SAP’s non-IFRS measures and their limitations as well as our constant currency and free cash flow figures, see Explanation of Non-IFRS Measures online.
| SAP Quarterly Statement Q4 2020 | 18 |
(E) Reconciliation from Non-IFRS Numbers to IFRS Numbers
(E.1) Reconciliation from Non-IFRS Numbers to IFRS Numbers – Quarter
| € millions, unless otherwise stated | Q4 2020 | Q4 2019 | ∆ in % |
| IFRS | Adj. | Non-
IFRS | Currency Impact | Non-IFRS
Constant
Currency | IFRS | Adj. | Non-
IFRS | IFRS | Non-
IFRS | Non-IFRS
Constant
Currency1) |
| Revenue Numbers | | | | | | | | | | | |
| Cloud | 2,041 | 3 | 2,044 | 117 | 2,161 | 1,896 | 11 | 1,907 | 8 | 7 | 13 |
| Software licenses | 1,703 | 0 | 1,703 | 86 | 1,789 | 2,002 | 0 | 2,002 | –15 | –15 | –11 |
| Software support | 2,835 | 0 | 2,835 | 128 | 2,962 | 2,948 | 0 | 2,948 | –4 | –4 | 0 |
| Software licenses and support | 4,538 | 0 | 4,538 | 213 | 4,751 | 4,950 | 0 | 4,950 | –8 | –8 | –4 |
| Cloud and software | 6,579 | 3 | 6,582 | 330 | 6,912 | 6,846 | 11 | 6,857 | –4 | –4 | 1 |
| Services | 960 | 0 | 960 | 48 | 1,008 | 1,195 | 0 | 1,195 | –20 | –20 | –16 |
| Total revenue | 7,538 | 3 | 7,541 | 378 | 7,920 | 8,041 | 11 | 8,052 | –6 | –6 | –2 |
| | | | | | | | | | | | |
| Operating Expense Numbers | | | | | | | | | | | |
| Cost of cloud | –669 | 55 | –614 | | | –662 | 80 | –582 | 1 | 6 | |
| Cost of software licenses and support | –538 | 13 | –524 | | | –591 | 38 | –553 | –9 | –5 | |
| Cost of cloud and software | –1,206 | 68 | –1,138 | | | –1,253 | 118 | –1,135 | –4 | 0 | |
| Cost of services | –696 | 12 | –684 | | | –933 | 73 | –860 | –25 | –20 | |
| Total cost of revenue | –1,903 | 80 | –1,823 | | | –2,186 | 191 | –1,995 | –13 | –9 | |
| Gross profit | 5,636 | 83 | 5,719 | | | 5,855 | 202 | 6,057 | –4 | –6 | |
| Research and development | –1,134 | 18 | –1,116 | | | –1,203 | 129 | –1,073 | –6 | 4 | |
| Sales and marketing | –1,743 | 106 | –1,637 | | | –2,086 | 261 | –1,825 | –16 | –10 | |
| General and administration | –281 | –21 | –303 | | | –411 | 116 | –295 | –32 | 3 | |
| Restructuring | 7 | –7 | 0 | | | –29 | 29 | 0 | <-100 | NA | |
| Other operating income/expense, net | 171 | –66 | 105 | | | –23 | 0 | –23 | <-100 | <-100 | |
| Total operating expenses | –4,884 | 110 | –4,774 | –230 | –5,004 | –5,938 | 726 | –5,212 | –18 | –8 | –4 |
| | | | | | | | | | | | |
| Profit Numbers | | | | | | | | | | | |
| Operating profit (loss) | 2,655 | 113 | 2,768 | 148 | 2,916 | 2,102 | 737 | 2,839 | 26 | –3 | 3 |
| Other non-operating income/expense, net | –58 | 0 | –58 | | | –11 | 0 | –11 | >100 | >100 | |
| Finance income | 331 | 0 | 331 | | | 248 | 0 | 248 | 33 | 33 | |
| Finance costs | –223 | 0 | –223 | | | –121 | 0 | –121 | 85 | 85 | |
| Financial income, net | 107 | 0 | 107 | | | 127 | 0 | 127 | –16 | –16 | |
| Profit (loss) before tax | 2,705 | 113 | 2,817 | | | 2,219 | 737 | 2,956 | 22 | –5 | |
| Income tax expense | –773 | –23 | –795 | | | –582 | –184 | –766 | 33 | 4 | |
| Profit (loss) after tax | 1,932 | 90 | 2,022 | | | 1,637 | 553 | 2,190 | 18 | –8 | |
| Attributable to owners of parent | 1,906 | 90 | 1,996 | | | 1,620 | 553 | 2,173 | 18 | –8 | |
| Attributable to non-controlling interests | 26 | 0 | 26 | | | 17 | 0 | 17 | 49 | 49 | |
| | | | | | | | | | | | |
| Key Ratios | | | | | | | | | | | |
| Operating margin (in %) | 35.2 | | 36.7 | | 36.8 | 26.1 | | 35.3 | 9.1pp | 1.4pp | 1.5pp |
| Effective tax rate (in %)2) | 28.6 | | 28.2 | | | 26.2 | | 25.9 | 2.4pp | 2.3pp | |
| Earnings per share, basic (in €) | 1.62 | | 1.69 | | | 1.36 | | 1.82 | 19 | –7 | |
1) Constant currency period-over-period changes are calculated by comparing the current year's non-IFRS constant currency numbers with the non-IFRS numbers of the previous year's respective period.
2) The difference between our effective tax rate (IFRS) and effective tax rate (non-IFRS) in Q4 2020 mainly resulted from tax effects of acquisition-related charges and share-based payment expenses. The difference between our effective tax rate (IFRS) and effective tax rate (non-IFRS) in Q4 2019 mainly resulted from tax effects of share-based payment expenses and acquisition-related charges.
Due to rounding, numbers may not add up precisely.
| SAP Quarterly Statement Q4 2020 | 19 |
(E.2) Reconciliation from Non-IFRS Numbers to IFRS Numbers – Year-to-Date
| € millions, unless otherwise stated | Q1–Q4 2020 | Q1–Q4 2019 | ∆ in % |
| IFRS | Adj. | Non-
IFRS | Currency Impact | Non-IFRS Constant Currency | IFRS | Adj. | Non-
IFRS | IFRS | Non-
IFRS | Non-IFRS Constant Currency1) |
| Revenue Numbers | | | | | | | | | | | |
| Cloud | 8,080 | 5 | 8,085 | 155 | 8,241 | 6,933 | 81 | 7,013 | 17 | 15 | 18 |
| Software licenses | 3,642 | 0 | 3,642 | 128 | 3,770 | 4,533 | 0 | 4,533 | –20 | –20 | –17 |
| Software support | 11,506 | 0 | 11,506 | 206 | 11,712 | 11,547 | 0 | 11,548 | 0 | 0 | 1 |
| Software licenses and support | 15,148 | 0 | 15,148 | 334 | 15,482 | 16,080 | 0 | 16,080 | –6 | –6 | –4 |
| Cloud and software | 23,228 | 5 | 23,233 | 490 | 23,722 | 23,012 | 81 | 23,093 | 1 | 1 | 3 |
| Services | 4,110 | 0 | 4,110 | 65 | 4,174 | 4,541 | 0 | 4,541 | –9 | –9 | –8 |
| Total revenue | 27,338 | 5 | 27,343 | 554 | 27,897 | 27,553 | 81 | 27,634 | –1 | –1 | 1 |
| | | | | | | | | | | | |
| Operating Expense Numbers | | | | | | | | | | | |
| Cost of cloud | –2,706 | 248 | –2,458 | | | –2,534 | 305 | –2,228 | 7 | 10 | |
| Cost of software licenses and support | –2,008 | 97 | –1,911 | | | –2,159 | 141 | –2,018 | –7 | –5 | |
| Cost of cloud and software | –4,715 | 345 | –4,369 | | | –4,692 | 446 | –4,247 | 0 | 3 | |
| Cost of services | –3,172 | 178 | –2,993 | | | –3,662 | 254 | –3,408 | –13 | –12 | |
| Total cost of revenue | –7,886 | 523 | –7,363 | | | –8,355 | 700 | –7,655 | –6 | –4 | |
| Gross profit | 19,452 | 528 | 19,980 | | | 19,199 | 781 | 19,979 | 1 | 0 | |
| Research and development | –4,457 | 303 | –4,153 | | | –4,292 | 438 | –3,854 | 4 | 8 | |
| Sales and marketing | –7,106 | 734 | –6,371 | | | –7,693 | 909 | –6,784 | –8 | –6 | |
| General and administration | –1,355 | 164 | –1,191 | | | –1,629 | 477 | –1,152 | –17 | 3 | |
| Restructuring | 3 | –3 | 0 | | | –1,130 | 1,130 | 0 | <-100 | NA | |
| Other operating income/expense, net | 84 | –66 | 18 | | | 18 | 0 | 18 | >100 | 1 | |
| Total operating expenses | –20,717 | 1,657 | –19,060 | –337 | –19,397 | –23,081 | 3,654 | –19,426 | –10 | –2 | 0 |
| | | | | | | | | | | | |
| Profit Numbers | | | | | | | | | | | |
| Operating profit (loss) | 6,621 | 1,661 | 8,283 | 217 | 8,500 | 4,473 | 3,735 | 8,208 | 48 | 1 | 4 |
| Other non-operating income/expense, net | –179 | 0 | –179 | | | –74 | 0 | –74 | >100 | >100 | |
| Finance income | 1,473 | 0 | 1,473 | | | 787 | 0 | 787 | 87 | 87 | |
| Finance costs | –697 | 0 | –697 | | | –589 | 0 | –589 | 18 | 18 | |
| Financial income, net | 776 | 0 | 776 | | | 198 | 0 | 198 | >100 | >100 | |
| Profit (loss) before tax | 7,218 | 1,661 | 8,880 | | | 4,596 | 3,735 | 8,331 | 57 | 7 | |
| Income tax expense | –1,938 | –412 | –2,350 | | | –1,226 | –954 | –2,180 | 58 | 8 | |
| Profit (loss) after tax | 5,280 | 1,249 | 6,529 | | | 3,370 | 2,781 | 6,152 | 57 | 6 | |
| Attributable to owners of parent | 5,143 | 1,249 | 6,392 | | | 3,321 | 2,781 | 6,102 | 55 | 5 | |
| Attributable to non-controlling interests | 138 | 0 | 138 | | | 50 | 0 | 50 | >100 | >100 | |
| Key Ratios | | | | | | | | | | | |
| Operating margin (in %) | 24.2 | | 30.3 | | 30.5 | 16.2 | | 29.7 | 8.0pp | 0.6pp | 0.8pp |
| Effective tax rate (in %)2) | 26.9 | | 26.5 | | | 26.7 | | 26.2 | 0.2pp | 0.3pp | |
| Earnings per share, basic (in €) | 4.35 | | 5.41 | | | 2.78 | | 5.11 | 56 | 6 | |
| | | | | | | | | | | | |
1) Constant-currency period-over-period changes are calculated by comparing the current year's non-IFRS constant-currency numbers with the non-IFRS number of the previous year's respective period.
2) The difference between our effective tax rate (IFRS) and effective tax rate (non-IFRS) in 2020 mainly resulted from tax effects of share-based payment expenses and acquisition-related charges. The difference between our effective tax rate (IFRS) and effective tax rate (non-IFRS) in 2019 mainly resulted from tax effects of share-based payment expenses, acquisition-related charges and restructuring expenses.
Due to rounding, numbers may not add up precisely.
| SAP Quarterly Statement Q4 2020 | 20 |
(F) Non-IFRS Adjustments – Actuals and Estimates
| € millions | Estimated Amounts for Full Year 2021 | Q1–Q4 2020 | Q4 2020 | Q1–Q4 2019 | Q4 2019 |
| Operating profit (loss) (IFRS) | | 6,621 | 2,655 | 4,473 | 2,102 |
| Revenue adjustments | 0–30 | 5 | 3 | 81 | 11 |
| Adjustment for acquisition-related charges | 540–640 | 577 | 99 | 689 | 174 |
| Adjustment for share-based payment expenses | 2,000–2,500 | 1,082 | 18 | 1,835 | 523 |
| Adjustment for restructuring | 150–200 | –3 | –7 | 1,130 | 29 |
| Operating expense adjustments | | 1,657 | 110 | 3,654 | 726 |
| Operating profit (loss) adjustments | | 1,661 | 113 | 3,735 | 737 |
| Operating profit (loss) (non-IFRS) | | 8,283 | 2,768 | 8,208 | 2,839 |
Due to rounding, numbers may not add up precisely.
(G) Non-IFRS Adjustments by Functional Areas
| € millions | Q4 2020 | Q4 2019 |
| IFRS | Acquisition- Related | SBP1) | Restruc- turing | Non-IFRS | IFRS | Acquisition- Related | SBP1) | Restruc- turing | Non-IFRS |
| Cost of cloud | –669 | 52 | 3 | 0 | –614 | –662 | 63 | 17 | 0 | –582 |
| Cost of software licenses and support | –538 | 10 | 3 | 0 | –524 | –591 | 15 | 23 | 0 | –553 |
| Cost of services | –696 | 0 | 11 | 0 | –684 | –933 | 5 | 69 | 0 | –860 |
| Research and development | –1,134 | 1 | 17 | 0 | –1,116 | –1,203 | 2 | 128 | 0 | –1,073 |
| Sales and marketing | –1,743 | 95 | 11 | 0 | –1,637 | –2,086 | 89 | 172 | 0 | –1,825 |
| General and administration | –281 | 6 | –27 | 0 | –303 | –411 | 2 | 114 | 0 | –295 |
| Restructuring | 7 | 0 | 0 | –7 | 0 | –29 | 0 | 0 | 29 | 0 |
| Other operating income/expense, net | 171 | –66 | 0 | 0 | 105 | –23 | 0 | 0 | 0 | –23 |
| Total operating expenses | –4,884 | 99 | 18 | –7 | –4,774 | –5,938 | 174 | 523 | 29 | –5,212 |
| € millions | Q1–Q4 2020 | Q1–Q4 2019 |
| IFRS | Acquisition- Related | SBP1) | Restruc- turing | Non-IFRS | IFRS | Acquisition- Related | SBP1) | Restruc- turing | Non-IFRS |
| Cost of cloud | –2,706 | 208 | 40 | 0 | –2,458 | –2,534 | 249 | 56 | 0 | –2,228 |
| Cost of software licenses and support | –2,008 | 42 | 55 | 0 | –1,911 | –2,159 | 59 | 82 | 0 | –2,018 |
| Cost of services | –3,172 | 3 | 175 | 0 | –2,993 | –3,662 | 9 | 246 | 0 | –3,408 |
| Research and development | –4,457 | 7 | 296 | 0 | –4,153 | –4,292 | 9 | 429 | 0 | –3,854 |
| Sales and marketing | –7,106 | 375 | 359 | 0 | –6,371 | –7,693 | 348 | 562 | 0 | –6,784 |
| General and administration | –1,355 | 9 | 156 | 0 | –1,191 | –1,629 | 16 | 461 | 0 | –1,152 |
| Restructuring | 3 | 0 | 0 | –3 | 0 | –1,130 | 0 | 0 | 1,130 | 0 |
| Other operating income/expense, net | 84 | –66 | 0 | 0 | 18 | 18 | 0 | 0 | 0 | 18 |
| Total operating expenses | –20,717 | 577 | 1,082 | –3 | –19,060 | –23,081 | 689 | 1,835 | 1,130 | –19,426 |
1) Share-based Payments
Due to rounding, numbers may not add up precisely.
| SAP Quarterly Statement Q4 2020 | 21 |
If not presented in a separate line item in our income statement, the restructuring expenses would break down as follows:
| € millions | Q4 2020 | Q1–Q4 2020 | Q4 2019 | Q1–Q4 2019 |
| Cost of cloud | 0 | 0 | –11 | –20 |
Cost of software licenses and support | 2 | 1 | 9 | –118 |
| Cost of services | 0 | –3 | 13 | –154 |
| Research and development | 3 | 1 | –19 | –467 |
| Sales and marketing | 2 | 3 | –15 | –299 |
| General and administration | 0 | 2 | –6 | –71 |
| Restructuring expenses | 7 | 3 | –29 | –1,130 |
Due to rounding, numbers may not add up precisely.
| SAP Quarterly Statement Q4 2020 | 22 |
Disaggregations
| (H.1) | Segment Policies and Segment Changes |
SAP has four reportable segments: the Applications, Technology & Support segment, the Services segment, the Concur segment, and the Qualtrics segment.
For a more detailed description of SAP’s segment reporting, see Note (C.1) “Results of Segments” of our Half-Year Report 2020.
| (H.2) | Segment Reporting – Quarter |
Applications, Technology & Support
€ millions, unless otherwise stated (Non-IFRS) | | Q4 2020 | | Q4 2019 | | ∆ in % | | ∆ in % |
| | Actual Currency | | Constant Currency | | Actual Currency | | Actual Currency | | Constant Currency |
| Cloud | | 1,592 | | 1,678 | | 1,431 | | 11 | | 17 |
| Software licenses | | 1,703 | | 1,788 | | 2,001 | | –15 | | –11 |
| Software support | | 2,833 | | 2,961 | | 2,946 | | –4 | | 1 |
| Software licenses and support | | 4,535 | | 4,749 | | 4,947 | | –8 | | –4 |
| Cloud and software | | 6,128 | | 6,427 | | 6,378 | | –4 | | 1 |
| Services | | 79 | | 82 | | 98 | | –19 | | –16 |
| Total segment revenue | | 6,207 | | 6,509 | | 6,476 | | –4 | | 1 |
| Cost of cloud | | –536 | | –571 | | –528 | | 2 | | 8 |
| Cost of software licenses and support | | –462 | | –483 | | –526 | | –12 | | –8 |
| Cost of cloud and software | | –999 | | –1,053 | | –1,054 | | –5 | | 0 |
| Cost of services | | –75 | | –78 | | –57 | | 31 | | 35 |
| Total cost of revenue | | –1,074 | | –1,131 | | –1,112 | | –3 | | 2 |
| Segment gross profit | | 5,133 | | 5,378 | | 5,364 | | –4 | | 0 |
| Other segment expenses | | –2,095 | | –2,194 | | –2,237 | | –6 | | –2 |
| Segment profit (loss) | | 3,038 | | 3,183 | | 3,128 | | –3 | | 2 |
| Margins | | | | | | | | | | |
| Cloud gross margin (in %) | | 66.3 | | 66.0 | | 63.1 | | 3.2pp | | 2.9pp |
| Segment gross margin (in %) | | 82.7 | | 82.6 | | 82.8 | | –0.1pp | | –0.2pp |
| Segment margin (in %) | | 48.9 | | 48.9 | | 48.3 | | 0.6pp | | 0.6pp |
Due to rounding, numbers may not add up precisely.
| SAP Quarterly Statement Q4 2020 | 23 |
Services
€ millions, unless otherwise stated (Non-IFRS) | | Q4 2020 | | Q4 2019 | | ∆ in % | | ∆ in % |
| | Actual Currency | | Constant Currency | | Actual Currency | | Actual Currency | | Constant Currency |
| Cloud | | 0 | | 0 | | 0 | | NA | | NA |
| Software licenses | | 0 | | 0 | | 0 | | NA | | NA |
| Software support | | 2 | | 2 | | 1 | | 24 | | 25 |
| Software licenses and support | | 2 | | 2 | | 1 | | 38 | | 40 |
| Cloud and software | | 2 | | 2 | | 1 | | 98 | | >100 |
| Services | | 756 | | 793 | | 897 | | –16 | | –12 |
| Total segment revenue | | 758 | | 795 | | 898 | | –16 | | –11 |
| Cost of cloud | | –17 | | –18 | | –15 | | 15 | | 22 |
| Cost of software licenses and support | | –10 | | –11 | | –14 | | –29 | | –25 |
| Cost of cloud and software | | –27 | | –28 | | –29 | | –7 | | –1 |
| Cost of services | | –519 | | –545 | | –631 | | –18 | | –14 |
| Total cost of revenue | | –546 | | –574 | | –660 | | –17 | | –13 |
| Segment gross profit | | 212 | | 221 | | 238 | | –11 | | –7 |
| Other segment expenses | | –88 | | –94 | | –120 | | –26 | | –22 |
| Segment profit (loss) | | 124 | | 128 | | 118 | | 5 | | 8 |
| Margins | | | | | | | | | | |
| Services gross margin (in %) | | 31.3 | | 31.2 | | 29.6 | | 1.7pp | | 1.7pp |
| Segment gross margin (in %) | | 27.9 | | 27.8 | | 26.5 | | 1.5pp | | 1.4pp |
| Segment margin (in %) | | 16.3 | | 16.1 | | 13.1 | | 3.1pp | | 2.9pp |
Due to rounding, numbers may not add up precisely.
Concur
€ millions, unless otherwise stated (Non-IFRS) | | Q4 2020 | | Q4 2019 | | ∆ in % | | ∆ in % |
| | Actual Currency | | Constant Currency | | Actual Currency | | Actual Currency | | Constant Currency |
| Cloud | | 295 | | 314 | | 363 | | –19 | | –14 |
| Software licenses | | 0 | | 0 | | 0 | | NA | | NA |
| Software support | | 0 | | 0 | | 0 | | NA | | NA |
| Software licenses and support | | 0 | | 0 | | 0 | | NA | | NA |
| Cloud and software | | 295 | | 314 | | 363 | | –19 | | –14 |
| Services | | 46 | | 49 | | 61 | | –25 | | –20 |
| Total segment revenue | | 341 | | 363 | | 424 | | –20 | | –15 |
| Cost of cloud | | –38 | | –41 | | –41 | | –9 | | –1 |
| Cost of software licenses and support | | 0 | | 0 | | 0 | | NA | | NA |
| Cost of cloud and software | | –38 | | –41 | | –41 | | –8 | | –1 |
| Cost of services | | –40 | | –43 | | –41 | | –1 | | 4 |
| Total cost of revenue | | –78 | | –83 | | –82 | | –5 | | 2 |
| Segment gross profit | | 263 | | 279 | | 342 | | –23 | | –18 |
| Other segment expenses | | –141 | | –150 | | –168 | | –16 | | –11 |
| Segment profit (loss) | | 121 | | 129 | | 174 | | –30 | | –26 |
| Margins | | | | | | | | | | |
| Cloud gross margin (in %) | | 87.2 | | 87.1 | | 88.7 | | –1.4pp | | –1.6pp |
| Segment gross margin (in %) | | 77.1 | | 77.0 | | 80.6 | | –3.6pp | | –3.6pp |
| Segment margin (in %) | | 35.7 | | 35.7 | | 41.0 | | –5.3pp | | –5.3pp |
Due to rounding, numbers may not add up precisely.
| SAP Quarterly Statement Q4 2020 | 24 |
Qualtrics
€ millions, unless otherwise stated (Non-IFRS) | | Q4 2020 | | Q4 2019 | | ∆ in % | | ∆ in % |
| | Actual Currency | | Constant Currency | | Actual Currency | | Actual Currency | | Constant Currency |
| Cloud | | 139 | | 149 | | 110 | | 26 | | 36 |
| Software licenses | | 0 | | 0 | | 0 | | NA | | NA |
| Software support | | 0 | | 0 | | 0 | | NA | | NA |
| Software licenses and support | | 0 | | 0 | | 0 | | NA | | NA |
| Cloud and software | | 139 | | 149 | | 110 | | 26 | | 36 |
| Services | | 44 | | 48 | | 46 | | –3 | | 4 |
| Total segment revenue | | 183 | | 197 | | 156 | | 17 | | 26 |
| Cost of cloud | | –15 | | –16 | | –11 | | 35 | | 44 |
| Cost of software licenses and support | | 0 | | 0 | | 0 | | NA | | NA |
| Cost of cloud and software | | –15 | | –16 | | –11 | | 35 | | 44 |
| Cost of services | | –26 | | –28 | | –28 | | –6 | | 0 |
| Total cost of revenue | | –41 | | –44 | | –39 | | 5 | | 12 |
| Segment gross profit | | 141 | | 153 | | 117 | | 21 | | 31 |
| Other segment expenses | | –132 | | –144 | | –127 | | 4 | | 14 |
| Segment profit (loss) | | 10 | | 9 | | –10 | | <-100 | | <-100 |
| Margins | | | | | | | | | | |
| Cloud gross margin (in %) | | 89.4 | | 89.5 | | 90.1 | | –0.7pp | | –0.6pp |
| Segment gross margin (in %) | | 77.4 | | 77.7 | | 74.9 | | 2.6pp | | 2.8pp |
| Segment margin (in %) | | 5.4 | | 4.5 | | –6.5 | | 11.9pp | | 10.9pp |
Due to rounding, numbers may not add up precisely.
| SAP Quarterly Statement Q4 2020 | 25 |
Reconciliation of Cloud Revenues and Margins
€ millions, unless otherwise stated (Non-IFRS) | | Q4 2020 | | Q4 2019 | | ∆ in % | | ∆ in % |
| | Actual Currency | | Constant Currency | | Actual Currency | | Actual Currency | | Constant Currency |
| Cloud revenue – SaaS/PaaS1) | Intelligent Spend3) | 661 | | 703 | | 701 | | –6 | | 0 |
| Thereof Concur segment | 295 | | 314 | | 363 | | –19 | | –14 |
| Other4) | 1,170 | | 1,233 | | 1,013 | | 15 | | 22 |
| Total | 1,831 | | 1,937 | | 1,714 | | 7 | | 13 |
| Cloud revenue – IaaS2) | | 213 | | 224 | | 192 | | 11 | | 17 |
| Cloud revenue | | 2,044 | | 2,161 | | 1,907 | | 7 | | 13 |
| Cloud gross margin – SaaS/PaaS1) (in %) | Intelligent Spend3) | 79.2 | | 78.9 | | 78.0 | | 1.1pp | | 0.9pp |
| Thereof Concur segment | 87.2 | | 87.1 | | 88.7 | | –1.4pp | | –1.6pp |
| Other4) | 70.8 | | 70.7 | | 70.0 | | 0.8pp | | 0.7pp |
| Total | 73.8 | | 73.7 | | 73.3 | | 0.5pp | | 0.4pp |
| Cloud gross margin – IaaS2) (in %) | | 36.9 | | 35.9 | | 35.7 | | 1.2pp | | 0.2pp |
| Cloud gross margin (in %) | | 70.0 | | 69.8 | | 69.5 | | 0.5pp | | 0.3pp |
1) Software as a service/platform as a service
2) Infrastructure as a service; completely included in the Applications, Technology & Support segment
3) Intelligent Spend includes the Concur segment and further Intelligent Spend offerings mainly included in the Applications, Technology & Support segment.
4) Other includes all other SaaS/PaaS offerings that do not belong to Intelligent Spend.
The individual revenue and margin numbers for segments are disclosed on the previous pages.
Due to rounding, numbers may not add up precisely.
| SAP Quarterly Statement Q4 2020 | 26 |
(H.3) Segment Reporting – Year-to-Date
Applications, Technology & Support
€ millions, unless otherwise stated (Non-IFRS) | | Q1–Q4 2020 | | Q1–Q4 2019 | | ∆ in % | | ∆ in % |
| | Actual Currency | | Constant Currency | | Actual Currency | | Actual Currency | | Constant Currency |
| Cloud | | 6,254 | | 6,379 | | 5,259 | | 19 | | 21 |
| Software licenses | | 3,637 | | 3,765 | | 4,523 | | –20 | | –17 |
| Software support | | 11,502 | | 11,707 | | 11,542 | | 0 | | 1 |
| Software licenses and support | | 15,138 | | 15,472 | | 16,064 | | –6 | | –4 |
| Cloud and software | | 21,392 | | 21,852 | | 21,323 | | 0 | | 2 |
| Services | | 288 | | 292 | | 341 | | –16 | | –14 |
| Total segment revenue | | 21,680 | | 22,144 | | 21,664 | | 0 | | 2 |
| Cost of cloud | | –2,165 | | –2,218 | | –1,972 | | 10 | | 12 |
| Cost of software licenses and support | | –1,756 | | –1,789 | | –1,910 | | –8 | | –6 |
| Cost of cloud and software | | –3,920 | | –4,006 | | –3,882 | | 1 | | 3 |
| Cost of services | | –308 | | –313 | | –332 | | –7 | | –6 |
| Total cost of revenue | | –4,228 | | –4,320 | | –4,214 | | 0 | | 2 |
| Segment gross profit | | 17,451 | | 17,824 | | 17,450 | | 0 | | 2 |
| Other segment expenses | | –8,020 | | –8,183 | | –7,996 | | 0 | | 2 |
| Segment profit (loss) | | 9,431 | | 9,641 | | 9,454 | | 0 | | 2 |
| Margins | | | | | | | | | | |
| Cloud gross margin (in %) | | 65.4 | | 65.2 | | 62.5 | | 2.9pp | | 2.7pp |
| Segment gross margin (in %) | | 80.5 | | 80.5 | | 80.5 | | –0.1pp | | –0.1pp |
| Segment margin (in %) | | 43.5 | | 43.5 | | 43.6 | | –0.1pp | | –0.1pp |
Due to rounding, numbers may not add up precisely.
Services
€ millions, unless otherwise stated (Non-IFRS) | | Q1–Q4 2020 | | Q1–Q4 2019 | | ∆ in % | | ∆ in % |
| | Actual Currency | | Constant Currency | | Actual Currency | | Actual Currency | | Constant Currency |
| Cloud | | 0 | | 1 | | 0 | | NA | | NA |
| Software licenses | | 0 | | 0 | | 0 | | NA | | NA |
| Software support | | 4 | | 4 | | 5 | | –8 | | –8 |
| Software licenses and support | | 4 | | 4 | | 5 | | –10 | | –10 |
| Cloud and software | | 5 | | 5 | | 5 | | 1 | | 3 |
| Services | | 3,153 | | 3,203 | | 3,442 | | –8 | | –7 |
| Total segment revenue | | 3,157 | | 3,208 | | 3,447 | | –8 | | –7 |
| Cost of cloud | | –70 | | –72 | | –57 | | 23 | | 26 |
| Cost of software licenses and support | | –33 | | –34 | | –55 | | –41 | | –39 |
| Cost of cloud and software | | –103 | | –106 | | –112 | | –8 | | –6 |
| Cost of services | | –2,136 | | –2,179 | | –2,506 | | –15 | | –13 |
| Total cost of revenue | | –2,239 | | –2,284 | | –2,618 | | –14 | | –13 |
| Segment gross profit | | 919 | | 924 | | 829 | | 11 | | 11 |
| Other segment expenses | | –419 | | –428 | | –467 | | –10 | | –8 |
| Segment profit (loss) | | 500 | | 495 | | 362 | | 38 | | 37 |
| Margins | | | | | | | | | | |
| Services gross margin (in %) | | 32.3 | | 32.0 | | 27.2 | | 5.0pp | | 4.8pp |
| Segment gross margin (in %) | | 29.1 | | 28.8 | | 24.1 | | 5.0pp | | 4.7pp |
| Segment margin (in %) | | 15.8 | | 15.4 | | 10.5 | | 5.3pp | | 4.9pp |
Due to rounding, numbers may not add up precisely.
| SAP Quarterly Statement Q4 2020 | 27 |
Concur
€ millions, unless otherwise stated (Non-IFRS) | | Q1–Q4 2020 | | Q1–Q4 2019 | | ∆ in % | | ∆ in % |
| | Actual Currency | | Constant Currency | | Actual Currency | | Actual Currency | | Constant Currency |
| Cloud | | 1,288 | | 1,306 | | 1,373 | | –6 | | –5 |
| Software licenses | | 0 | | 0 | | 0 | | NA | | NA |
| Software support | | 0 | | 0 | | 0 | | NA | | NA |
| Software licenses and support | | 0 | | 0 | | 0 | | NA | | NA |
| Cloud and software | | 1,288 | | 1,306 | | 1,373 | | –6 | | –5 |
| Services | | 217 | | 221 | | 236 | | –8 | | –7 |
| Total segment revenue | | 1,505 | | 1,526 | | 1,609 | | –6 | | –5 |
| Cost of cloud | | –154 | | –158 | | –181 | | –15 | | –13 |
| Cost of software licenses and support | | 0 | | 0 | | 0 | | NA | | NA |
| Cost of cloud and software | | –154 | | –158 | | –181 | | –15 | | –13 |
| Cost of services | | –164 | | –167 | | –169 | | –3 | | –1 |
| Total cost of revenue | | –319 | | –325 | | –350 | | –9 | | –7 |
| Segment gross profit | | 1,186 | | 1,201 | | 1,260 | | –6 | | –5 |
| Other segment expenses | | –622 | | –631 | | –640 | | –3 | | –1 |
| Segment profit (loss) | | 564 | | 570 | | 620 | | –9 | | –8 |
| Margins | | | | | | | | | | |
| Cloud gross margin (in %) | | 88.0 | | 87.9 | | 86.8 | | 1.2pp | | 1.1pp |
| Segment gross margin (in %) | | 78.8 | | 78.7 | | 78.3 | | 0.5pp | | 0.4pp |
| Segment margin (in %) | | 37.5 | | 37.3 | | 38.5 | | –1.0pp | | –1.2pp |
Due to rounding, numbers may not add up precisely.
Qualtrics
€ millions, unless otherwise stated (Non-IFRS) | | Q1–Q4 2020 | | Q1–Q4 2019 | | ∆ in % | | ∆ in % |
| | Actual Currency | | Constant Currency | | Actual Currency | | Actual Currency | | Constant Currency |
| Cloud | | 518 | | 529 | | 371 | | 40 | | 42 |
| Software licenses | | 0 | | 0 | | 0 | | NA | | NA |
| Software support | | 0 | | 0 | | 0 | | NA | | NA |
| Software licenses and support | | 0 | | 0 | | 0 | | NA | | NA |
| Cloud and software | | 518 | | 529 | | 371 | | 40 | | 42 |
| Services | | 162 | | 166 | | 137 | | 19 | | 22 |
| Total segment revenue | | 681 | | 696 | | 508 | | 34 | | 37 |
| Cost of cloud | | –49 | | –50 | | –33 | | 50 | | 53 |
| Cost of software licenses and support | | 0 | | 0 | | 0 | | NA | | NA |
| Cost of cloud and software | | –49 | | –50 | | –33 | | 50 | | 53 |
| Cost of services | | –103 | | –105 | | –78 | | 33 | | 35 |
| Total cost of revenue | | –152 | | –155 | | –110 | | 38 | | 40 |
| Segment gross profit | | 528 | | 541 | | 398 | | 33 | | 36 |
| Other segment expenses | | –509 | | –521 | | –389 | | 31 | | 34 |
| Segment profit (loss) | | 19 | | 20 | | 8 | | >100 | | >100 |
| Margins | | | | | | | | | | |
| Cloud gross margin (in %) | | 90.5 | | 90.5 | | 91.1 | | –0.7pp | | –0.7pp |
| Segment gross margin (in %) | | 77.6 | | 77.7 | | 78.3 | | –0.6pp | | –0.6pp |
| Segment margin (in %) | | 2.8 | | 2.8 | | 1.6 | | 1.2pp | | 1.2pp |
Due to rounding, numbers may not add up precisely.
| SAP Quarterly Statement Q4 2020 | 28 |
Reconciliation of Cloud Revenues and Margins
€ millions, unless otherwise stated (Non-IFRS) | | | Q1–Q4 2020 | | Q1–Q4 2019 | | ∆ in % | | ∆ in % |
| | Actual Currency | | Constant Currency | | Actual Currency | | Actual Currency | | Constant Currency |
| Cloud revenue – SaaS/PaaS1) | Intelligent Spend3) | | 2,722 | | 2,772 | | 2,692 | | 1 | | 3 |
| Thereof Concur segment | | 1,288 | | 1,306 | | 1,373 | | –6 | | –5 |
| Other4) | | 4,522 | | 4,611 | | 3,625 | | 25 | | 27 |
| Total | | 7,244 | | 7,383 | | 6,317 | | 15 | | 17 |
| Cloud revenue – IaaS2) | | | 841 | | 857 | | 695 | | 21 | | 23 |
| Cloud revenue | | | 8,085 | | 8,241 | | 7,013 | | 15 | | 18 |
| Cloud gross margin – SaaS/PaaS1) (in %) | Intelligent Spend3) | | 78.9 | | 78.9 | | 78.1 | | 0.9pp | | 0.8pp |
| Thereof Concur segment | | 88.0 | | 87.9 | | 86.8 | | 1.2pp | | 1.1pp |
| Other4) | | 70.5 | | 70.5 | | 68.5 | | 2.1pp | | 2.1pp |
| Total | | 73.7 | | 73.7 | | 72.6 | | 1.1pp | | 1.1pp |
| Cloud gross margin – IaaS2) (in %) | | | 34.3 | | 33.8 | | 28.9 | | 5.4pp | | 4.9pp |
| Cloud gross margin (in %) | | | 69.6 | | 69.5 | | 68.2 | | 1.4pp | | 1.3pp |
1) Software as a service/platform as a service
2) Infrastructure as a service; completely included in the Applications, Technology & Support segment
3) Intelligent Spend includes the Concur segment and further Intelligent Spend offerings mainly included in the Applications, Technology & Support segment.
4) Other includes all other SaaS/PaaS offerings that do not belong to Intelligent Spend.
The individual revenue and margin numbers for segments are disclosed on the previous pages.
Due to rounding, numbers may not add up precisely.
| SAP Quarterly Statement Q4 2020 | 29 |
(I) Revenue by Region (IFRS and Non-IFRS)
(I.1) Revenue by Region (IFRS and Non-IFRS) – Quarter
| € millions | | Q4 2020 | | Q4 2019 | | ∆ in % |
| | | IFRS | | Adj. | | Non-IFRS | | Currency Impact | | Non-IFRS Constant Currency | | IFRS | | Adj. | | Non-IFRS | | IFRS | | Non-IFRS | | Non-IFRS Constant Currency1) |
| Cloud Revenue by Region | | | | | | | | | | | | |
| EMEA | | 672 | | 2 | | 674 | | 20 | | 694 | | 608 | | 0 | | 608 | | 11 | | 11 | | 14 |
| Americas | | 1,087 | | 1 | | 1,088 | | 86 | | 1,174 | | 1,047 | | 11 | | 1,058 | | 4 | | 3 | | 11 |
| APJ | | 282 | | 0 | | 282 | | 12 | | 293 | | 241 | | 0 | | 241 | | 17 | | 17 | | 22 |
| Cloud revenue | | 2,041 | | 3 | | 2,044 | | 117 | | 2,161 | | 1,896 | | 11 | | 1,907 | | 8 | | 7 | | 13 |
| | | | | | | | | | | | | | | | | | | | | | | |
| Cloud and Software Revenue by Region | | | | | | | | | | | | |
| EMEA | | 3,073 | | 2 | | 3,075 | | 71 | | 3,146 | | 3,173 | | 0 | | 3,173 | | –3 | | –3 | | –1 |
| Americas | | 2,480 | | 1 | | 2,481 | | 217 | | 2,698 | | 2,610 | | 11 | | 2,621 | | –5 | | –5 | | 3 |
| APJ | | 1,025 | | 0 | | 1,025 | | 43 | | 1,068 | | 1,063 | | 0 | | 1,063 | | –4 | | –4 | | 0 |
| Cloud and software revenue | | 6,579 | | 3 | | 6,582 | | 330 | | 6,912 | | 6,846 | | 11 | | 6,857 | | –4 | | –4 | | 1 |
| | | | | | | | | | | | | | | | | | | | | | | |
| Total Revenue by Region | | | | | | | | | | | | |
| Germany | | 1,217 | | 1 | | 1,218 | | 1 | | 1,219 | | 1,222 | | 0 | | 1,222 | | 0 | | 0 | | 0 |
| Rest of EMEA | | 2,282 | | 1 | | 2,283 | | 78 | | 2,361 | | 2,465 | | 0 | | 2,465 | | –7 | | –7 | | –4 |
| Total EMEA | | 3,499 | | 2 | | 3,501 | | 79 | | 3,580 | | 3,686 | | 0 | | 3,686 | | –5 | | –5 | | –3 |
| United States | | 2,366 | | 1 | | 2,367 | | 181 | | 2,549 | | 2,496 | | 11 | | 2,507 | | –5 | | –6 | | 2 |
| Rest of Americas | | 519 | | 0 | | 519 | | 70 | | 589 | | 627 | | 0 | | 627 | | –17 | | –17 | | –6 |
| Total Americas | | 2,885 | | 1 | | 2,886 | | 251 | | 3,137 | | 3,122 | | 11 | | 3,133 | | –8 | | –8 | | 0 |
| Japan | | 347 | | 0 | | 347 | | 13 | | 359 | | 341 | | 0 | | 341 | | 2 | | 2 | | 5 |
| Rest of APJ | | 807 | | 0 | | 807 | | 35 | | 843 | | 891 | | 0 | | 891 | | –9 | | –9 | | –5 |
| Total APJ | | 1,154 | | 0 | | 1,154 | | 48 | | 1,202 | | 1,232 | | 0 | | 1,232 | | –6 | | –6 | | –2 |
| Total revenue | | 7,538 | | 3 | | 7,541 | | 378 | | 7,920 | | 8,041 | | 11 | | 8,052 | | –6 | | –6 | | –2 |
1) Constant currency period-over-period changes are calculated by comparing the current year's non-IFRS constant currency numbers with the non-IFRS numbers of the previous year's respective period.
Due to rounding, numbers may not add up precisely.
| SAP Quarterly Statement Q4 2020 | 30 |
(I.2) Revenue by Region (IFRS and Non-IFRS) – Year-to-Date
| € millions | | Q1–Q4 2020 | | Q1–Q4 2019 | | ∆ in % |
| | | IFRS | | Adj. | | Non-IFRS | | Currency Impact | | Non-IFRS Constant Currency | | IFRS | | Adj. | | Non-IFRS | | IFRS | | Non-IFRS | | Non-IFRS Constant Currency1) |
| Cloud Revenue by Region | | | | | | | | | | | | |
| EMEA | | 2,608 | | 2 | | 2,610 | | 26 | | 2,636 | | 2,115 | | 0 | | 2,115 | | 23 | | 23 | | 25 |
| Americas | | 4,439 | | 3 | | 4,442 | | 110 | | 4,552 | | 3,945 | | 81 | | 4,026 | | 13 | | 10 | | 13 |
| APJ | | 1,033 | | 0 | | 1,033 | | 19 | | 1,052 | | 872 | | 0 | | 872 | | 18 | | 18 | | 21 |
| Cloud revenue | | 8,080 | | 5 | | 8,085 | | 155 | | 8,241 | | 6,933 | | 81 | | 7,013 | | 17 | | 15 | | 18 |
| | | | | | | | | | | | | | | | | | | | | | | |
| Cloud and Software Revenue by Region | | | | | | | | | | | | |
| EMEA | | 10,364 | | 2 | | 10,366 | | 110 | | 10,476 | | 10,211 | | 0 | | 10,211 | | 1 | | 2 | | 3 |
| Americas | | 9,239 | | 3 | | 9,242 | | 303 | | 9,545 | | 9,172 | | 81 | | 9,253 | | 1 | | 0 | | 3 |
| APJ | | 3,625 | | 0 | | 3,625 | | 77 | | 3,702 | | 3,629 | | 0 | | 3,629 | | 0 | | 0 | | 2 |
| Cloud and software revenue | | 23,228 | | 5 | | 23,233 | | 490 | | 23,722 | | 23,012 | | 81 | | 23,093 | | 1 | | 1 | | 3 |
| | | | | | | | | | | | | | | | | | | | | | | |
| Total Revenue by Region | | | | | | | | | | | | |
| Germany | | 4,015 | | 1 | | 4,016 | | 1 | | 4,017 | | 3,948 | | 0 | | 3,948 | | 2 | | 2 | | 2 |
| Rest of EMEA | | 8,052 | | 1 | | 8,053 | | 122 | | 8,175 | | 8,158 | | 0 | | 8,158 | | –1 | | –1 | | 0 |
| Total EMEA | | 12,067 | | 2 | | 12,069 | | 123 | | 12,192 | | 12,105 | | 0 | | 12,105 | | 0 | | 0 | | 1 |
| United States | | 9,110 | | 3 | | 9,113 | | 184 | | 9,297 | | 9,085 | | 81 | | 9,166 | | 0 | | –1 | | 1 |
| Rest of Americas | | 1,996 | | 0 | | 1,996 | | 161 | | 2,157 | | 2,109 | | 0 | | 2,109 | | –5 | | –5 | | 2 |
| Total Americas | | 11,106 | | 3 | | 11,109 | | 345 | | 11,454 | | 11,194 | | 81 | | 11,275 | | –1 | | –1 | | 2 |
| Japan | | 1,305 | | 0 | | 1,305 | | 1 | | 1,307 | | 1,180 | | 0 | | 1,180 | | 11 | | 11 | | 11 |
| Rest of APJ | | 2,859 | | 0 | | 2,859 | | 85 | | 2,944 | | 3,074 | | 0 | | 3,074 | | –7 | | –7 | | –4 |
| Total APJ | | 4,165 | | 0 | | 4,165 | | 86 | | 4,251 | | 4,254 | | 0 | | 4,254 | | –2 | | –2 | | 0 |
| Total revenue | | 27,338 | | 5 | | 27,343 | | 554 | | 27,897 | | 27,553 | | 81 | | 27,634 | | –1 | | –1 | | 1 |
1) Constant-currency period-over-period changes are calculated by comparing the current year's non-IFRS constant-currency numbers with the non-IFRS number of the previous year's respective period.
Due to rounding, numbers may not add up precisely.
| SAP Quarterly Statement Q4 2020 | 31 |
(J) Employees by Region and Functional Areas
| Full-time equivalents | | 12/31/2020 | | 12/31/2019 |
| | | EMEA | | Americas | | APJ | | Total | | EMEA | | Americas | | APJ | | Total |
| Cloud and software | | 6,278 | | 4,589 | | 5,525 | | 16,392 | | 6,501 | | 4,426 | | 5,361 | | 16,288 |
| Services | | 8,175 | | 5,934 | | 5,733 | | 19,842 | | 8,250 | | 6,018 | | 5,971 | | 20,239 |
| Research and development | | 13,705 | | 6,094 | | 9,781 | | 29,580 | | 12,710 | | 5,793 | | 9,131 | | 27,634 |
| Sales and marketing | | 10,348 | | 10,485 | | 5,000 | | 25,834 | | 10,205 | | 10,368 | | 5,209 | | 25,781 |
| General and administration | | 3,285 | | 2,161 | | 1,243 | | 6,689 | | 3,161 | | 2,123 | | 1,246 | | 6,530 |
| Infrastructure | | 2,291 | | 1,107 | | 696 | | 4,094 | | 2,220 | | 984 | | 654 | | 3,859 |
| SAP Group (12/31) | | 44,082 | | 30,369 | | 27,979 | | 102,430 | | 43,048 | | 29,712 | | 27,571 | | 100,330 |
| Thereof acquisitions1) | | 609 | | 97 | | 75 | | 781 | | 338 | | 1,638 | | 137 | | 2,113 |
| SAP Group (twelve months' end average) | | 43,340 | | 30,306 | | 27,830 | | 101,476 | | 42,697 | | 29,368 | | 27,092 | | 99,157 |
| 1) Acquisitions closed between January 1 and December 31 of the respective year |
| SAP Quarterly Statement Q4 2020 | 32 |
Other Disclosures
(K) Financial Income, Net
In the fourth quarter 2020, finance income mainly consists of gains from disposal or IFRS 9-related fair value adjustments of equity securities totaling €312 million (Q4/2019: €182 million) and €1,360 million in the full year 2020 (TY 2019: €587 million) respectively.
In the fourth quarter 2020, finance costs mainly consist of losses from disposal or IFRS 9-related fair value adjustments of equity securities totaling €139 million (Q4/2019: €26 million) and €341 million in the full year 2020 (TY 2019: €151 million) respectively, and interest expense on financial liabilities including lease liabilities amounting to €44 million in the fourth quarter 2020 (Q4/2019: €50 million) and €179 million in the full year 2020 (TY 2019: €207 million) respectively.
For more information about Financial Income, Net, see the Notes to the 2020 Consolidated Half-Year Financial Statements, Note (C.3).
(L) Divestments
On May 5, 2020, SAP and Sinch AB, Stockholm, Sweden (hereafter “Sinch”) announced that they had entered into an agreement for Sinch to acquire the SAP Digital Interconnect group. The purchase price amounts to €225 million (on a cash-free, debt-free basis). The disposal gain of €194 million (IFRS) and €128 million (non-IFRS) is included in “Other operating income/expense, net”. The transaction closed on November 1, 2020, following satisfaction of applicable regulatory and other approvals.
For more information about divestments, see the Notes to the 2020 Consolidated Half-Year Financial Statements, Note (D.1).
| SAP Quarterly Statement Q4 2020 | 33 |