Exhibit 99.1
Quarterly Statement Q3 2021 |  |
SAP Cloud Momentum Accelerates Significantly
Strong Surge in ‘RISE with SAP’ Adoption
| · | Current Cloud Backlog Up 24% (Up 22% At Constant Currencies) |
| · | S/4HANA Current Cloud Backlog Up 60% (Up 58% At Constant Currencies) |
| · | Cloud Revenue Up 20% (Up 20% At Constant Currencies) |
| · | IFRS Operating Profit Down 15%; Non-IFRS Operating Profit Up 2% (Up 2% At Constant Currencies) |
| · | Raises Full Year Revenue and Profit Outlook On The Basis of Strong Third Quarter |
Our strategy is clearly working. Customers are choosing SAP for their business transformation in the cloud. We see record adoption of our applications and our platform. This has resulted in strong acceleration of our cloud growth.
Christian Klein, CEO |
This has been an excellent quarter across all key financial metrics. We are seeing sustained, strong progress in SAP's transformation. Our cloud business is growing at an accelerating pace and has led to our improved full year outlook.
Luka Mucic, CFO
|

| SAP Quarterly Statement Q3 2021 | 1 |
Walldorf, Germany – October 21, 2021
SAP SE (NYSE: SAP) today announced its financial results for the third quarter ended September 30, 2021.
Business Update Third Quarter 2021
Businesses around the world are reevaluating their business models with increased urgency given the dramatic changes due to the pandemic and the ongoing focus on digital transformation. Customers are choosing SAP for its clearly differentiated capabilities. In addition to helping customers manage their technical migrations, SAP is helping customers redefine and optimize their core end-to-end business processes. This expertise is based on SAP’s unmatched knowledge of industry best practices from working with customers of all sizes across industries and geographies. This is reflected in SAP’s strong third quarter results which were above market expectations.
SAP is seeing continued strong demand and adoption of its ‘RISE with SAP’ offering which customers of all sizes, including an increasing number of large clients, are selecting to manage their business transformation. As more customers adopt this holistic subscription offering, software licenses revenue decreased as anticipated.
SAP is seeing strong growth in current cloud backlog across its cloud portfolio, in particular with S/4HANA Cloud. SAP’s cloud revenue growth also accelerated sequentially.
Highlights
| · | ‘RISE with SAP’ continued to gain traction after a successful launch in January. SAP saw strong demand from companies of all sizes and closed deals with more than 300 customers in the third quarter. Large customers such as Asda Stores Ltd. and EG Group selected ‘RISE with SAP’. Additional wins included Cirque du Soleil, Philips Domestic Appliances Netherlands, HCL, Röhm, Etihad Water and Electricity, Tate & Lyle Americas, KTM Fahrrad, Ingram Micro, and Sky Italia. |
| · | More than 500 S/4HANA customers were added in the quarter, taking total adoption to more than 17,500 customers, up 16% year over year, of which more than 11,400 are live. In the third quarter, approximately 60% of the additional S/4HANA customers were net new. |
| · | Signavio continued to show outstanding performance as part of SAP’s Business Process Intelligence (BPI) segment. Current cloud backlog grew in triple digits. SAP’s BPI solutions are key to our customers’ business transformation and acceleration to the cloud. DB Schenker and many others chose SAP BPI solutions in the third quarter. |
| · | Business Technology Platform, SAP’s PaaS offering, is the foundation of the Intelligent Enterprise, providing a single platform for integration and extensibility across the SAP portfolio and non-SAP solutions, as well as deriving insights from data. Gartner named SAP a Leader in its Magic Quadrant for its Enterprise Integration PaaS report for the second year in a row, ahead of key competitors. Current cloud backlog grew in strong double digits. Dufry International, Yamaha Corporation, SoftBank, Office Depot Mexico, and Reckitt chose this offering in the third quarter. |
| · | SAP aims to make sustainability profitable and profitability sustainable, with solutions that provide unparalleled levels of transparency and understanding across data and processes. SAP launched SAP Product Footprint Management, which will help customers reduce their supply-chain carbon footprints. Forthcoming products include SAP Responsible Design and Production, which is designed to enable customers to build sustainable outcomes into product design, and SAP Sustainability Control Tower, which lets companies report effectively on their progress to net zero. |
| · | Key customer wins across SAP’s solutions portfolio included: Continental, Adidas, Bayer, Robert Bosch, U.S. Department of Defense, Siemens Energy, University of Florida, VMware, The Football Association, FAW-Volkswagen Automotive, and People’s Insurance Company of China (PICC). Lycamobile, E.ON, Atos, and Generali China Life Insurance all went live on SAP solutions in the third quarter. |
| · | Google Cloud and SAP partnered to accelerate business transformations in the cloud. The expanded partnership will help customers execute business transformations, migrate critical business systems to the cloud and augment existing business systems. |
| · | In September SAP and Dediq launched SAP Fioneer, a joint venture for the financial services industry. SAP Fioneer will help banking and insurance companies meet their needs for speed, scalability and cost-efficiency. |
| · | Qualtrics closed its acquisition of Clarabridge, a leader in omnichannel conversational analytics capabilities, on October 1st. This will further accelerate Qualtrics’ growth and position as the world’s #1 experience management platform. |
| SAP Quarterly Statement Q3 2021 | 2 |
Financial Performance Third Quarter 20211
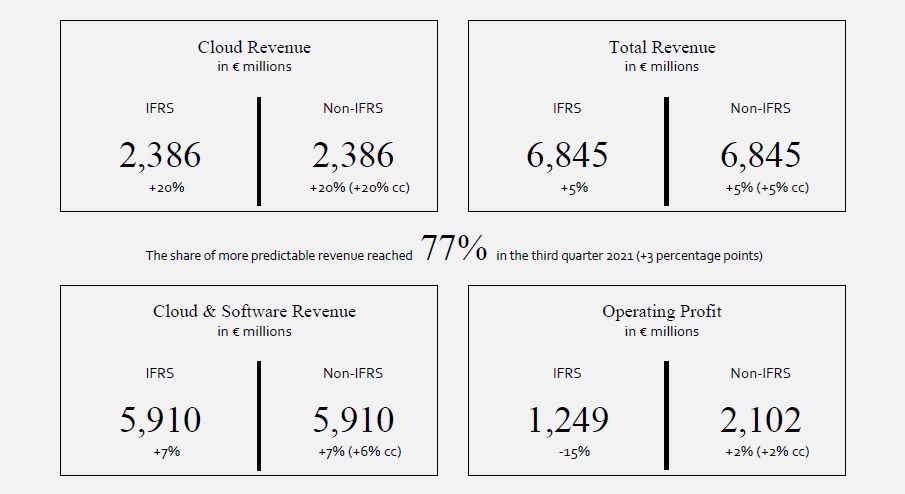
SAP’s cloud momentum further accelerated in the third quarter with sequential growth in both current cloud backlog and cloud revenue. Current cloud backlog was up 24% to €8.17 billion and up 22% (at constant currencies). Concur’s backlog remained flat and weighed 3 percentage points on overall backlog growth. Cloud revenue was up 20% to €2.39 billion and up 20% (at constant currencies). SaaS/PaaS cloud revenue outside the Intelligent Spend business was up 27% and up 27% (at constant currencies). Software licenses revenue was down 8% year over year to €0.66 billion and down 8% (at constant currencies). Cloud and software revenue was up 7% to €5.91 billion and up 6% (at constant currencies). Services revenue was down 6% year over year to €0.93 billion and down 6% (at constant currencies). This revenue decline is primarily attributable to the November 2020 divestiture of SAP Digital Interconnect which contributed approximately €81 million of services revenue in the third quarter of 2020. Total revenue was up 5% year over year to €6.84 billion and up 5% (at constant currencies).
The share of more predictable revenue grew by 3 percentage points year over year to 77% in the third quarter.
IFRS Operating profit decreased 15% to €1.25 billion and IFRS Operating margin decreased by 4.3 percentage points to 18.2% mainly due to higher share-based compensation expenses (primarily related to Qualtrics). Non-IFRS Operating profit increased 2% to €2.10 billion (up 2% at constant currencies) and Non-IFRS Operating margin decreased by 0.9 percentage points to 30.7% (down 0.7 percentage points at constant currencies). IFRS and Non-IFRS Operating profit includes a disposal gain of €77 million related to the launch of SAP Fioneer, a dedicated Financial Services Industry unit jointly owned by SAP and Dediq.
IFRS Earnings per share decreased 10% to €1.19 and Non-IFRS Earning per share increased 2% to €1.74, including another strong contribution from Sapphire Ventures.
Operating cash flow for the first nine months was down 3% year over year to €4.95 billion. Free cash flow decreased by 1% year over year to €4.13 billion. Positive effects from lower share-based compensation and lower restructuring payments were compensated by higher income taxes paid net of refunds. At quarter end, net debt was –€3.62 billion.
Expanded Financial Disclosure – SAP’s Accelerated Cloud Transition
Beginning in 2021, SAP expanded its financial disclosure to provide investors with transparency on the transition of its core ERP business to the cloud. Specifically, the Company discloses current cloud backlog and cloud revenue contributed by SAP S/4HANA Cloud, along with nominal and constant currencies year-over-year growth rates.
In the third quarter, S/4HANA current cloud backlog was up 60% (Non-IFRS) to €1.28 billion and up 58% (at constant currencies). S/4HANA cloud revenue growth accelerated as anticipated, up 46% to €276 million and up 46% (at constant currencies).
SAP S/4HANA Cloud represents SAP’s cloud offering for core ERP processes. It mainly includes cloud solutions for financial management, supply chain management, engineering and manufacturing, order management and asset management, as well as associated data management, analytics, development and integration capabilities.
‘RISE with SAP’, SAP’s holistic offering for business transformation in the cloud, is an important driver of S/4HANA Cloud and Business Technology Platform adoption.
1 The Q3 2021 results were also impacted by other effects. For details please refer to the disclosures on page 30 of this document.
| SAP Quarterly Statement Q3 2021 | 3 |
Segment Performance Third Quarter 2021
SAP’s three reportable segments “Applications, Technology & Support”, “Qualtrics” and “Services” showed the following performance:
Applications, Technology & Support (AT&S)
Segment revenue in AT&S was up 5% at € 5.76 billion year over year and up 5% (at constant currencies). Segment performance was driven by strong double-digit cloud revenue growth in S/4HANA Cloud, Digital Supply Chain, Business Technology Platform, and Customer Experience, in particular ecommerce. Software licenses revenue decreased as anticipated due to strong adoption of ‘RISE with SAP’. Segment support revenues were up 1% year over year (at constant currencies) reflecting high retention rates coupled with the shift of some support revenue to cloud.
Qualtrics
Qualtrics segment revenue was up 38% to €233 million year over year, up 39% (at constant currencies). The continued strong growth was driven by robust renewal rates and expansions as customers increase their usage and acquire additional modules of Qualtrics to measure all four experience areas: customer, employee, product, and brand. L.L.Bean, State of Colorado Department of Personnel and Administration/Dept. of Health, Kyoto University, DoorDash, Dish Network Corporation, ServiceNow, Peloton, Zoom, and NASCAR, among others, selected Qualtrics Experience Management Solutions.
Services
Services segment revenue was down 1% to €803 million year over year, down 1% (at constant currencies). While SAP continues to see solid growth in its Premium Engagement revenue on the basis of a very resilient business model, consulting revenue declined year over year.
Segment Results at a Glance
Segment Performance Third Quarter 2021
| Applications, Technology & Support | Qualtrics | Services | |||||||
€ million, unless otherwise stated (Non-IFRS) | Actual Currency | ∆ in % | ∆ in % const. curr. | Actual Currency | ∆ in % | ∆ in % const. curr. | Actual Currency | ∆ in % | ∆ in % const. curr. |
| Cloud revenue | 2,155 | 16 | 16 | 189 | 46 | 47 | 0 | NA | NA |
| Segment revenue | 5,762 | 5 | 5 | 233 | 38 | 39 | 803 | –1 | –1 |
| Segment profit (loss) | 2,406 | 3 | 4 | 14 | 71 | 68 | 201 | 5 | 5 |
| Cloud gross margin (in %) | 68.4 | –0.9pp | –1.0pp | 91.6 | 0.7pp | 0.7pp | NM1) | NM1) | NM1) |
| Segment margin (in %) | 41.8 | –0.7pp | –0.6pp | 5.9 | 1.1pp | 1.0pp | 25.0 | 1.3pp | 1.5pp |
1) NM = not meaningful
Regional Revenue Performance Third Quarter 2021
SAP had a strong cloud performance across all of its regions.
In the EMEA region, cloud and software revenue increased 8% and 7% (at constant currencies). Cloud revenue increased 29% and 28% (at constant currencies) with Germany, the UK and France being highlights.
In the Americas region, cloud and software revenue increased 6% and was up 6% (at constant currencies). Cloud revenue increased 14% and was up 14% (at constant currencies) with a robust performance in the U.S., Canada, Brazil and Mexico. The United States, SAP’s largest market, had another strong sequential acceleration in cloud revenue growth.
In the APJ region, cloud and software revenue increased 6% and 6% (at constant currencies). Cloud revenue increased 23% and 25% (at constant currencies) with Japan, Singapore and South Korea being highlights.
| SAP Quarterly Statement Q3 2021 | 4 |
Financial Results at a Glance
Third Quarter 2021
| IFRS | Non-IFRS1) | ||||||
| € million, unless otherwise stated | Q3 2021 | Q3 2020 | ∆ in % | Q3 2021 | Q3 2020 | ∆ in % | ∆ in % const. curr. |
| Current cloud backlog2) | NA | NA | NA | 8,171 | 6,599 | 24 | 22 |
| Thereof SAP S/4HANA Current Cloud Backlog2) | NA | NA | NA | 1,283 | 801 | 60 | 58 |
| Cloud revenue | 2,386 | 1,984 | 20 | 2,386 | 1,984 | 20 | 20 |
| Thereof SAP S/4HANA Cloud revenue | 276 | 189 | 46 | 276 | 189 | 46 | 46 |
| Software licenses and support revenue | 3,524 | 3,559 | –1 | 3,524 | 3,559 | –1 | –1 |
| Cloud and software revenue | 5,910 | 5,544 | 7 | 5,910 | 5,544 | 7 | 6 |
| Total revenue | 6,845 | 6,535 | 5 | 6,845 | 6,535 | 5 | 5 |
| Share of more predictable revenue (in %) | 77 | 74 | 3pp | 77 | 74 | 3pp | |
| Operating profit (loss) | 1,249 | 1,473 | –15 | 2,102 | 2,069 | 2 | 2 |
| Profit (loss) after tax | 1,418 | 1,652 | –14 | 2,129 | 2,098 | 1 | |
| Basic earnings per share (in €) | 1.19 | 1.32 | –10 | 1.74 | 1.70 | 2 | |
| Number of employees (FTE, September 30) | 105,015 | 101,450 | 4 | NA | NA | NA | NA |
1) For a breakdown of the individual adjustments see table “Non-IFRS Adjustments by Functional Areas” in this Quarterly Statement.
2) As this is an order entry metric, there is no IFRS equivalent.
Due to rounding, numbers may not add up precisely.
Nine months ended September 2021
| IFRS | Non-IFRS1) | ||||||
| € million, unless otherwise stated | Q1–Q3 2021 | Q1–Q3 2020 | ∆ in % | Q1–Q3 2021 | Q1–Q3 2020 | ∆ in % | ∆ in % const. curr. |
| Current Cloud Backlog2) | NA | NA | NA | 8,171 | 6,599 | 24 | 22 |
| Thereof SAP S/4HANA Current Cloud Backlog2) | NA | NA | NA | 1,283 | 801 | 60 | 58 |
| Cloud revenue | 6,806 | 6,039 | 13 | 6,806 | 6,041 | 13 | 17 |
| Thereof SAP S/4HANA Cloud revenue | 761 | 550 | 38 | 761 | 550 | 38 | 42 |
| Software licenses and support revenue | 10,281 | 10,610 | –3 | 10,281 | 10,610 | –3 | –1 |
| Cloud and software revenue | 17,088 | 16,649 | 3 | 17,088 | 16,651 | 3 | 6 |
| Total revenue | 19,861 | 19,800 | 0 | 19,861 | 19,801 | 0 | 3 |
| Share of more predictable revenue (in %) | 77 | 74 | 3pp | 77 | 74 | 3pp | |
| Operating profit (loss) | 3,193 | 3,967 | –20 | 5,762 | 5,515 | 4 | 8 |
| Profit (loss) after tax | 3,936 | 3,348 | 18 | 6,063 | 4,507 | 35 | |
| Basic earnings per share (in €) | 3.22 | 2.74 | 18 | 4.88 | 3.71 | 31 | |
| Number of employees (FTE, September 30) | 105,015 | 101,450 | 4 | NA | NA | NA | NA |
1) For a breakdown of the individual adjustments see table “Non-IFRS Adjustments by Functional Areas” in this Quarterly Statement.
2) As this is an order entry metric, there is no IFRS equivalent.
Due to rounding, numbers may not add up precisely.
| SAP Quarterly Statement Q3 2021 | 5 |
Business Outlook 2021
SAP is raising its full-year 2021 outlook, reflecting the strong business performance which is expected to continue to accelerate cloud revenue growth. The Company continues to expect software licenses revenue to decline for the full year as more customers turn to the ‘RISE with SAP’ subscription offering for their mission-critical core processes. This outlook also continues to assume the COVID-19 crisis will continue to recede as vaccine programs roll out globally.
SAP now expects:
| · | €9.4 – 9.6 billion Non-IFRS cloud revenue at constant currencies (2020: €8.09 billion), up 16% to 19% at constant currencies. The previous range was €9.3 – 9.5 billion at constant currencies. | |
| · | €23.8 – 24.2 billion Non-IFRS cloud and software revenue at constant currencies (2020: €23.23 billion), up 2% to 4% at constant currencies. The previous range was €23.6 – 24.0 billion at constant currencies. | |
| · | €8.1 – 8.3 billion Non-IFRS operating profit at constant currencies (2020: €8.29 billion), down 2% to flat at constant currencies. The previous range was €7.95 – 8.25 billion at constant currencies. |
SAP continues to expect the share of more predictable revenue to reach approximately 75% (2020: 72%).
SAP continues to expect operating cash flow of approximately €6.0 billion (2020 €7.2 billion) and free cash flow above €4.5 billion (2020 €6.0 billion).
SAP now expects a full-year 2021 effective tax rate (IFRS) of 21.0% to 22.0% (previously: 21.5% to 23.0%) and an effective tax rate (non-IFRS) of 20.0% to 21.0% (previously: 20.0% to 21.5%).
While SAP’s full-year 2021 business outlook is at constant currencies, actual currency reported figures are expected to be impacted by currency exchange rate fluctuations as the Company progresses through the year. See the table below for the Q4 and FY 2021 expected currency impacts.
| Expected Currency Impact Based on September 2021 Level for the Rest of the Year (Non-IFRS) | ||
| In percentage points | Q4 | FY |
| Cloud revenue growth | 0pp to 2pp | -4pp to -2pp |
| Cloud and software revenue growth | 0pp to 2pp | -3pp to -1pp |
| Operating profit growth | 0pp to 2pp | -3pp to -1pp |
SAP is focusing on three non-financial indicators: customer loyalty, employee engagement, and carbon emissions.
In 2021 SAP continues to aim for:
| · | a Customer Net Promoter Score of 5 to 10 (2020: 4) | |
| · | an Employee Engagement Index in a range of 84% to 86% (2020: 86%) | |
| · | Carbon emissions in a range of 90 to 110 kt (2020: 135 kt) |
| SAP Quarterly Statement Q3 2021 | 6 |
Additional Information
This Quarterly Statement and all information therein is unaudited.
Definition of key growth metrics
Current cloud backlog (CCB) is the contractually committed cloud revenue we expect to recognize over the upcoming 12 months as of a specific key date. Thus, it is a subcomponent of our overall remaining performance obligations following IFRS 15.120. For CCB, we take into consideration committed deals only. CCB can be regarded as a lower boundary for cloud revenue to be recognized over the next 12 months, as it excludes utilization-based models without pre-commitments and committed deals, both new and renewal, closed after the key date. For our committed cloud business, we believe the CCB is a valuable indicator of go-to-market success, as it reflects both new contracts closed as well as existing contracts renewed.
Share of more predictable revenue is the total of cloud revenue and software support revenue as a percentage of total revenue.
For explanations on other key growth metrics please refer to the performance management section of SAP’s Integrated Report 2020 and SAP’s Half-Year Report 2021, which can be found at www.sap.com/investor.
Webcast
SAP senior management will host a financial analyst conference call on Thursday, October 21, at 2:00 PM (CEST) / 1:00 PM (BST) / 8:00 AM (Eastern) / 5:00 AM (Pacific). The conference will be webcast live on the Company’s website at www.sap.com/investor and will be available for replay. Supplementary financial information pertaining to the third quarter results can be found at www.sap.com/investor.
About SAP
SAP’s strategy is to help every business run as an intelligent enterprise. As a market leader in enterprise application software, we help companies of all sizes and in all industries run at their best. Our machine learning, Internet of Things (IoT), and advanced analytics technologies help turn customers’ businesses into intelligent enterprises. SAP helps to give people and organizations deep business insight and fosters collaboration that helps them stay ahead of their competition. We simplify technology for companies so they can consume our software the way they want – without disruption. Our end-to-end suite of applications and services enables business and public customers across 25 industries globally to operate profitably, adapt continuously, and make a difference. With a global network of customers, partners, employees, and thought leaders, SAP helps the world run better and improve people’s lives. For more information, visit http://www.sap.com.
For more information, financial community only:
| Anthony Coletta | +49 (6227) 7-44872 | investor@sap.com, CET |
Follow SAP Investor Relations on Twitter at @sapinvestor.
For more information, press only:
| Joellen Perry | +1 (650) 445-6780 | joellen.perry@sap.com, PT |
| Daniel Reinhardt | +49 (6227) 7-40201 | daniel.reinhardt@sap.com, CET |
For customers interested in learning more about SAP products:
| Global Customer Center: | +49 180 534-34-24 |
| United States Only: | +1 (800) 872-1SAP (+1-800-872-1727) |
Note to editors:
To preview and download broadcast-standard stock footage and press photos digitally, please visit www.sap.com/photos. On this platform, you can find high resolution material for your media channels. To view video stories on diverse topics, visit www.sap-tv.com. From this site, you can embed videos into your own Web pages, share video via e-mail links and subscribe to RSS feeds from SAP TV.
| SAP Quarterly Statement Q3 2021 | 7 |
Any statements contained in this document that are not historical facts are forward-looking statements as defined in the U.S. Private Securities Litigation Reform Act of 1995. Words such as “anticipate,” “believe,” “estimate,” “expect,” “forecast,” “intend,” “may,” “plan,” “project,” “predict,” “should” and “will” and similar expressions as they relate to SAP are intended to identify such forward-looking statements. SAP undertakes no obligation to publicly update or revise any forward-looking statements. All forward-looking statements are subject to various risks and uncertainties that could cause actual results to differ materially from expectations. The factors that could affect SAP's future financial results are discussed more fully in SAP's filings with the U.S. Securities and Exchange Commission ("SEC"), including SAP's most recent Annual Report on Form 20-F filed with the SEC. Readers are cautioned not to place undue reliance on these forward-looking statements, which speak only as of their dates.
© 2021 SAP SE. All rights reserved.
No part of this publication may be reproduced or transmitted in any form or for any purpose without the express permission of SAP SE. The information contained herein may be changed without prior notice.
Some software products marketed by SAP SE and its distributors contain proprietary software components of other software vendors. National product specifications may vary.
These materials are provided by SAP SE and its affiliated companies ("SAP Group") for informational purposes only, without representation or warranty of any kind, and SAP Group shall not be liable for errors or omissions with respect to the materials. The only warranties for SAP Group products and services are those that are set forth in the express warranty statements accompanying such products and services, if any. Nothing herein should be construed as constituting an additional warranty.
SAP and other SAP products and services mentioned herein as well as their respective logos are trademarks or registered trademarks of SAP SE (or an SAP affiliate company) in Germany and other countries. All other product and service names mentioned are the trademarks of their respective companies. Please see www.sap.com/about/legal/copyright.html for additional trademark information and notice.
| SAP Quarterly Statement Q3 2021 | 8 |
Contents
| Financial and Non-Financial Key Facts (IFRS and Non-IFRS) | 10 |
| Primary Financial Statements of SAP Group (IFRS) | 12 |
| (A) | Consolidated Income Statements | 12 |
| (A.1) | Consolidated Income Statements – Quarter | 12 | ||
| (A.2) | Consolidated Income Statements – Year-to-Date | 13 |
| (B) | Consolidated Statements of Financial Position | 14 | |
| (C) | Consolidated Statements of Cash Flows | 15 |
| Non-IFRS Numbers | 16 | ||
| (D) | Basis of Non-IFRS Presentation | 16 | |
| (E) | Reconciliation from Non-IFRS Numbers to IFRS Numbers | 17 |
| (E.1) | Reconciliation from Non-IFRS Numbers to IFRS Numbers – Quarter | 17 | ||
| (E.2) | Reconciliation from Non-IFRS Numbers to IFRS Numbers – Year-to-Date | 18 |
| (F) | Non-IFRS Adjustments – Actuals and Estimates | 19 | |
| (G) | Non-IFRS Adjustments by Functional Areas | 19 |
| Disaggregations | 21 | ||
| (H) | Segment Reporting | 21 |
| (H.1) | Segment Policies and Segment Changes | 21 | ||
| (H.2) | Segment Reporting – Quarter | 21 | ||
| (H.3) | Segment Reporting – Year-to-Date | 23 |
| (I) | Reconciliation of Cloud Revenues and Margins | 25 |
| (I.1) | Reconciliation of Cloud Revenues and Margins – Quarter | 25 | ||
| (I.2) | Reconciliation of Cloud Revenues and Margins – Year-to-Date | 25 |
| (J) | Revenue by Region (IFRS and Non-IFRS) | 26 |
| (J.1) | Revenue by Region (IFRS and Non-IFRS) – Quarter | 26 | ||
| (J.2) | Revenue by Region (IFRS and Non-IFRS) – Year-to-Date | 27 |
| (K) | Employees by Region and Functional Areas | 28 |
| Other Disclosures | 29 | ||
| (L) | Financial Income, Net | 29 | |
| (M) | Business Combinations and Divestments | 29 | |
| (M.1) | Business Combinations | 29 | ||
| (M.2) | Divestments | 29 |
| (N) | Qualtrics Initial Public Offering (IPO) | 29 | |
| (O) | Share Based Payments | 29 | |
| (P) | Financial Liabilities | 30 | |
| (Q) | Change in non-IFRS revenue measures | 30 |
| SAP Quarterly Statement Q3 2021 | 9 |
Financial and Non-Financial Key Facts
(IFRS and Non-IFRS)
| € millions, unless otherwise stated | Q1 2020 | Q2 2020 | Q3 2020 | Q4 2020 | TY 2020 | Q1 2021 | Q2 2021 | Q3 2021 |
| Revenues | ||||||||
| Cloud (IFRS) | 2,011 | 2,044 | 1,984 | 2,041 | 8,080 | 2,145 | 2,276 | 2,386 |
| Cloud (non-IFRS) | 2,012 | 2,044 | 1,984 | 2,044 | 8,085 | 2,145 | 2,276 | 2,386 |
| % change – yoy | 27 | 19 | 10 | 7 | 15 | 7 | 11 | 20 |
| % change constant currency – yoy | 25 | 18 | 14 | 13 | 18 | 13 | 17 | 20 |
| SAP S/4HANA Cloud (IFRS) | 168 | 193 | 189 | NA | NA | 227 | 257 | 276 |
| SAP S/4HANA Cloud (non-IFRS) | 168 | 193 | 189 | NA | NA | 227 | 257 | 276 |
| % change – yoy | NA | NA | NA | NA | NA | 36 | 33 | 46 |
| % change constant currency – yoy | NA | NA | NA | NA | NA | 43 | 39 | 46 |
| Software licenses (IFRS) | 451 | 773 | 714 | 1,703 | 3,642 | 483 | 650 | 657 |
| Software licenses (non-IFRS) | 451 | 773 | 714 | 1,703 | 3,642 | 483 | 650 | 657 |
| % change – yoy | –31 | –18 | –23 | –15 | –20 | 7 | –16 | –8 |
| % change constant currency – yoy | –31 | –18 | –19 | –11 | –17 | 11 | –13 | –8 |
| Software support (IFRS) | 2,934 | 2,892 | 2,845 | 2,835 | 11,506 | 2,801 | 2,823 | 2,867 |
| Software support (non-IFRS) | 2,934 | 2,892 | 2,845 | 2,835 | 11,506 | 2,801 | 2,823 | 2,867 |
| % change – yoy | 3 | 1 | –2 | –4 | 0 | –5 | –2 | 1 |
| % change constant currency – yoy | 2 | 2 | 1 | 0 | 1 | 0 | 1 | 1 |
| Software licenses and support (IFRS) | 3,386 | 3,665 | 3,559 | 4,538 | 15,148 | 3,283 | 3,474 | 3,524 |
| Software licenses and support (non-IFRS) | 3,386 | 3,665 | 3,559 | 4,538 | 15,148 | 3,283 | 3,474 | 3,524 |
| % change – yoy | –3 | –4 | –7 | –8 | –6 | –3 | –5 | –1 |
| % change constant currency – yoy | –4 | –3 | –4 | –4 | –4 | 1 | –2 | –1 |
| Cloud and software (IFRS) | 5,397 | 5,709 | 5,544 | 6,579 | 23,228 | 5,428 | 5,750 | 5,910 |
| Cloud and software (non-IFRS) | 5,398 | 5,709 | 5,544 | 6,582 | 23,233 | 5,428 | 5,750 | 5,910 |
| % change – yoy | 6 | 3 | –2 | –4 | 1 | 1 | 1 | 7 |
| % change constant currency – yoy | 5 | 3 | 2 | 1 | 3 | 6 | 5 | 6 |
| Total revenue (IFRS) | 6,521 | 6,743 | 6,535 | 7,538 | 27,338 | 6,348 | 6,669 | 6,845 |
| Total revenue (non-IFRS) | 6,522 | 6,744 | 6,535 | 7,541 | 27,343 | 6,348 | 6,669 | 6,845 |
| % change – yoy | 7 | 1 | –4 | –6 | –1 | –3 | –1 | 5 |
| % change constant currency – yoy | 5 | 1 | 0 | –2 | 1 | 2 | 3 | 5 |
| Share of more predictable revenue (IFRS, in %) | 76 | 73 | 74 | 65 | 72 | 78 | 76 | 77 |
| Share of more predictable revenue (non-IFRS, in %) | 76 | 73 | 74 | 65 | 72 | 78 | 76 | 77 |
| Profits | ||||||||
| Operating profit (loss) (IFRS) | 1,210 | 1,284 | 1,473 | 2,657 | 6,623 | 960 | 984 | 1,249 |
| Operating profit (loss) (non-IFRS) | 1,482 | 1,964 | 2,069 | 2,772 | 8,287 | 1,738 | 1,922 | 2,102 |
| % change | 1 | 8 | –1 | –2 | 1 | 17 | –2 | 2 |
| % change constant currency | 0 | 7 | 4 | 3 | 4 | 24 | 3 | 2 |
| Profit (loss) after tax (IFRS) | 811 | 885 | 1,652 | 1,934 | 5,283 | 1,070 | 1,449 | 1,418 |
| Profit (loss) after tax (non-IFRS) | 1,015 | 1,395 | 2,098 | 2,026 | 6,534 | 1,720 | 2,214 | 2,129 |
| % change | –6 | 6 | 34 | –7 | 6 | 70 | 59 | 1 |
| Margins | ||||||||
| Cloud gross margin (IFRS, in %) | 66.4 | 66.0 | 66.4 | 67.6 | 66.6 | 67.2 | 67.5 | 67.0 |
| Cloud gross margin (non-IFRS, in %) | 69.3 | 69.5 | 69.7 | 70.3 | 69.7 | 69.5 | 70.0 | 69.4 |
| Software license and support gross margin (IFRS, in %) | 85.2 | 86.4 | 86.7 | 88.2 | 86.7 | 85.7 | 86.5 | 87.1 |
| Software license and support gross margin (non-IFRS, in %) | 85.7 | 87.4 | 87.6 | 88.5 | 87.4 | 86.3 | 87.3 | 87.8 |
| Cloud and software gross margin (IFRS, in %) | 78.2 | 79.1 | 79.4 | 81.8 | 79.7 | 78.4 | 79.0 | 79.0 |
| Cloud and software gross margin (non-IFRS, in %) | 79.6 | 81.0 | 81.2 | 82.8 | 81.2 | 79.7 | 80.5 | 80.4 |
| Gross margin (IFRS, in %) | 68.3 | 69.9 | 71.1 | 74.8 | 71.2 | 70.3 | 70.8 | 71.4 |
| Gross margin (non-IFRS, in %) | 69.8 | 72.6 | 73.7 | 75.8 | 73.1 | 72.3 | 73.4 | 73.6 |
| Operating margin (IFRS, in %) | 18.6 | 19.0 | 22.5 | 35.2 | 24.2 | 15.1 | 14.8 | 18.2 |
| Operating margin (non-IFRS, in %) | 22.7 | 29.1 | 31.7 | 36.8 | 30.3 | 27.4 | 28.8 | 30.7 |
| AT&S segment – Cloud gross margin (in %) | 69.1 | 69.2 | 69.3 | 69.6 | 69.3 | 68.7 | 69.2 | 68.4 |
| SAP Quarterly Statement Q3 2021 | 10 |
| € millions, unless otherwise stated | Q1 2020 | Q2 2020 | Q3 2020 | Q4 2020 | TY 2020 | Q1 2021 | Q2 2021 | Q3 2021 |
| AT&S segment – Segment gross margin (in %) | 78.6 | 80.1 | 80.6 | 82.6 | 80.6 | 78.9 | 79.5 | 79.7 |
| AT&S segment – Segment margin (in %) | 35.7 | 42.3 | 42.5 | 47.7 | 42.3 | 39.2 | 40.6 | 41.8 |
| Qualtrics segment – Cloud gross margin (in %) | 90.8 | 91.0 | 90.9 | 94.1 | 91.8 | 92.2 | 92.4 | 91.6 |
| Qualtrics segment – Segment gross margin (in %) | 75.4 | 78.4 | 79.1 | 77.4 | 77.6 | 79.5 | 80.3 | 80.7 |
| Qualtrics segment – Segment margin (in %) | –10.1 | 0.8 | 4.7 | 0.9 | –0.6 | 6.2 | 6.3 | 5.9 |
| Services segment – Services gross margin (in %) | 30.1 | 36.0 | 39.0 | 33.3 | 34.5 | 36.6 | 37.0 | 39.1 |
| Services segment – Segment gross margin (in %) | 26.6 | 33.4 | 36.3 | 29.9 | 31.4 | 33.0 | 34.2 | 36.4 |
| Services segment – Segment margin (in %) | 14.6 | 19.4 | 23.7 | 19.0 | 19.1 | 21.5 | 22.7 | 25.0 |
| Key Profit Ratios | ||||||||
| Effective tax rate (IFRS, in %) | 27.7 | 33.1 | 20.2 | 28.5 | 26.8 | 20.0 | 19.7 | 18.9 |
| Effective tax rate (non-IFRS, in %) | 27.2 | 30.3 | 21.3 | 28.2 | 26.5 | 18.7 | 19.2 | 18.2 |
| Earnings per share, basic (IFRS, in €) | 0.68 | 0.73 | 1.32 | 1.62 | 4.35 | 0.88 | 1.15 | 1.19 |
| Earnings per share, basic (non-IFRS, in €) | 0.85 | 1.17 | 1.70 | 1.70 | 5.41 | 1.40 | 1.75 | 1.74 |
| Order Entry and current cloud backlog | ||||||||
| Current cloud backlog | 6,634 | 6,638 | 6,599 | 7,155 | 7,155 | 7,628 | 7,766 | 8,171 |
| % change – yoy | 25 | 20 | 10 | 7 | 7 | 15 | 17 | 24 |
| % change constant currency – yoy | 24 | 21 | 16 | 14 | 14 | 19 | 20 | 22 |
| SAP S/4HANA Current cloud backlog | 744 | 780 | 801 | NA | NA | 1,036 | 1,130 | 1,283 |
| % change – yoy | NA | NA | NA | NA | NA | 39 | 45 | 60 |
| % change constant currency – yoy | NA | NA | NA | NA | NA | 43 | 48 | 58 |
| Orders – number of cloud deals (in transactions) | 3,145 | 3,844 | 4,044 | 6,137 | 17,166 | 4,132 | 5,064 | 4,960 |
| Share of cloud orders greater than €5 million based on total cloud order entry volume (in %) | 28 | 28 | 28 | 31 | 29 | 27 | 34 | 40 |
| Share of cloud orders smaller than €1 million based on total cloud order entry volume (in %) | 37 | 36 | 37 | 32 | 34 | 39 | 32 | 31 |
| Orders – number of on-premise software deals (in transactions) | 10,517 | 9,175 | 11,006 | 14,918 | 45,616 | 9,687 | 10,033 | 9,321 |
| Share of orders greater than €5 million based on total software order entry volume (in %) | 24 | 34 | 30 | 29 | 30 | 23 | 22 | 31 |
| Share of orders smaller than €1 million based on total software order entry volume (in %) | 42 | 38 | 37 | 32 | 36 | 42 | 43 | 41 |
| Liquidity and Cash Flow | ||||||||
| Net cash flows from operating activities | 2,984 | 788 | 1,321 | 2,100 | 7,194 | 3,085 | 686 | 1,183 |
| Capital expenditure | –333 | –164 | –155 | –164 | –816 | –153 | –191 | –202 |
| Payments of lease liabilities | –72 | –84 | –115 | –107 | –378 | –84 | –92 | –99 |
| Free cash flow | 2,580 | 540 | 1,052 | 1,829 | 6,000 | 2,848 | 403 | 881 |
| % of total revenue (IFRS) | 40 | 8 | 16 | 24 | 22 | 45 | 6 | 13 |
| % of profit after tax (IFRS) | 318 | 61 | 64 | 95 | 114 | 266 | 28 | 62 |
| Group liquidity | 7,872 | 7,401 | 7,760 | 6,781 | 6,781 | 11,573 | 8,548 | 9,375 |
| Financial debt (–) | –13,700 | –14,855 | –14,649 | –13,283 | –13,283 | –14,230 | –13,116 | –12,994 |
| Net debt (–) | –5,827 | –7,454 | –6,889 | –6,503 | –6,503 | –2,658 | –4,568 | –3,619 |
| Financial Position | ||||||||
| Cash and cash equivalents | 7,816 | 6,205 | 7,434 | 5,311 | 5,311 | 10,332 | 7,764 | 7,943 |
| Goodwill | 29,731 | 29,214 | 28,184 | 27,554 | 27,554 | 29,382 | 29,073 | 29,654 |
| Total assets | 62,947 | 60,709 | 59,278 | 58,465 | 58,465 | 66,479 | 63,076 | 65,030 |
| Contract liabilities (current) | 6,726 | 5,791 | 4,237 | 4,150 | 4,150 | 6,796 | 6,175 | 4,846 |
| Equity ratio (total equity in % of total assets) | 49 | 48 | 50 | 51 | 51 | 52 | 54 | 57 |
| Non-Financials | ||||||||
| Number of employees (quarter end)1) | 101,150 | 101,379 | 101,450 | 102,430 | 102,430 | 103,142 | 103,876 | 105,015 |
| Employee retention (in %, rolling 12 months) | 93.3 | 93.9 | 94.8 | 95.3 | 95.3 | 95.4 | 94.8 | 93.7 |
| Women in management (in %, quarter end) | 26.8 | 27.3 | 27.3 | 27.5 | 27.5 | 27.6 | 27.9 | 28.2 |
| Greenhouse gas emissions (in kilotons) | 65 | 25 | 25 | 20 | 135 | 30 | 20 | 25 |
1) In full-time equivalents.
Due to rounding, numbers may not add up precisely.
| SAP Quarterly Statement Q3 2021 | 11 |
Primary Financial Statements of SAP Group (IFRS)
(A) Consolidated Income Statements
(A.1) Consolidated Income Statements – Quarter
| € millions, unless otherwise stated | Q3 2021 | Q3 2020 | ∆ in % | ||||
| Cloud | 2,386 | 1,984 | 20 | ||||
| Software licenses | 657 | 714 | –8 | ||||
| Software support | 2,867 | 2,845 | 1 | ||||
| Software licenses and support | 3,524 | 3,559 | –1 | ||||
| Cloud and software | 5,910 | 5,544 | 7 | ||||
| Services | 935 | 992 | –6 | ||||
| Total revenue | 6,845 | 6,535 | 5 | ||||
| Cost of cloud | –788 | –667 | 18 | ||||
| Cost of software licenses and support | –454 | –472 | –4 | ||||
| Cost of cloud and software | –1,242 | –1,140 | 9 | ||||
| Cost of services | –716 | –750 | –5 | ||||
| Total cost of revenue | –1,958 | –1,890 | 4 | ||||
| Gross profit | 4,887 | 4,646 | 5 | ||||
| Research and development | –1,300 | –1,113 | 17 | ||||
| Sales and marketing | –1,845 | –1,678 | 10 | ||||
| General and administration | –576 | –345 | 67 | ||||
| Restructuring | 13 | 8 | 55 | ||||
| Other operating income/expense, net | 70 | –46 | <-100 | ||||
| Total operating expenses | –5,596 | –5,063 | 11 | ||||
| Operating profit (loss) | 1,249 | 1,473 | –15 | ||||
| Other non-operating income/expense, net | 16 | –19 | <-100 | ||||
| Finance income | 716 | 736 | –3 | ||||
| Finance costs | –233 | –120 | 94 | ||||
| Financial income, net | 484 | 616 | –21 | ||||
| Profit (loss) before tax | 1,749 | 2,070 | –16 | ||||
| Income tax expense | –331 | –418 | –21 | ||||
| Profit (loss) after tax | 1,418 | 1,652 | –14 | ||||
| Attributable to owners of parent | 1,406 | 1,556 | –10 | ||||
| Attributable to non-controlling interests | 12 | 96 | –88 | ||||
| Earnings per share, basic (in €)1) | 1.19 | 1.32 | –10 | ||||
| Earnings per share, diluted (in €)1) | 1.19 | 1.32 | –10 |
1) For the three months ended September 30, 2021 and 2020, the weighted average number of shares was 1,180 million (diluted 1,180 million) and 1,180 million
(diluted: 1,180 million), respectively (treasury stock excluded).
Due to rounding, numbers may not add up precisely.
| SAP Quarterly Statement Q3 2021 | 12 |
(A.2) Consolidated Income Statements – Year-to-Date
| € millions, unless otherwise stated | Q1–Q3 2021 | Q1–Q3 2020 | ∆ in % | |||||
| Cloud | 6,806 | 6,039 | 13 | |||||
| Software licenses | 1,790 | 1,939 | –8 | |||||
| Software support | 8,491 | 8,671 | –2 | |||||
| Software licenses and support | 10,281 | 10,610 | –3 | |||||
| Cloud and software | 17,088 | 16,649 | 3 | |||||
| Services | 2,774 | 3,150 | –12 | |||||
| Total revenue | 19,861 | 19,800 | 0 | |||||
| Cost of cloud | –2,232 | –2,037 | 10 | |||||
| Cost of software licenses and support | –1,393 | –1,471 | –5 | |||||
| Cost of cloud and software | –3,625 | –3,508 | 3 | |||||
| Cost of services | –2,163 | –2,475 | –13 | |||||
| Total cost of revenue | –5,788 | –5,983 | –3 | |||||
| Gross profit | 14,073 | 13,816 | 2 | |||||
| Research and development | –3,778 | –3,323 | 14 | |||||
| Sales and marketing | –5,336 | –5,362 | 0 | |||||
| General and administration | –1,674 | –1,074 | 56 | |||||
| Restructuring | –151 | –4 | >100 | |||||
| Other operating income/expense, net | 58 | –86 | <-100 | |||||
| Total operating expenses | –16,668 | –15,833 | 5 | |||||
| Operating profit (loss) | 3,193 | 3,967 | –20 | |||||
| Other non-operating income/expense, net | 45 | –122 | <-100 | |||||
| Finance income | 2,265 | 1,142 | 98 | |||||
| Finance costs | –614 | –474 | 30 | |||||
| Financial income, net | 1,651 | 669 | >100 | |||||
| Profit (loss) before tax | 4,890 | 4,514 | 8 | |||||
| Income tax expense | –954 | –1,166 | –18 | |||||
| Profit (loss) after tax | 3,936 | 3,348 | 18 | |||||
| Attributable to owners of parent | 3,802 | 3,237 | 17 | |||||
| Attributable to non-controlling interests | 134 | 112 | 20 | |||||
| Earnings per share, basic (in €)1) | 3.22 | 2.74 | 18 | |||||
| Earnings per share, diluted (in €)1) | 3.22 | 2.74 | 18 |
1) For the nine months ended September 30, 2021 and 2020, the weighted average number of shares was 1,180 million (diluted: 1,180 million) and 1,183 million
(diluted: 1,183 million), respectively (treasury stock excluded).
Due to rounding, numbers may not add up precisely.
| SAP Quarterly Statement Q3 2021 | 13 |
(B) Consolidated Statements of Financial Position
| as at 9/30/2021 and 12/31/2020 | |||
| € millions | 2021 | 2020 | |
| Cash and cash equivalents | 7,943 | 5,311 | |
| Other financial assets | 1,557 | 1,635 | |
| Trade and other receivables | 5,030 | 6,593 | |
| Other non-financial assets | 1,640 | 1,321 | |
| Tax assets | 757 | 210 | |
| Total current assets | 16,927 | 15,069 | |
| Goodwill | 29,654 | 27,554 | |
| Intangible assets | 3,810 | 3,784 | |
| Property, plant, and equipment | 4,834 | 5,041 | |
| Other financial assets | 5,789 | 3,512 | |
| Trade and other receivables | 100 | 137 | |
| Other non-financial assets | 2,243 | 1,926 | |
| Tax assets | 279 | 271 | |
| Deferred tax assets | 1,394 | 1,173 | |
| Total non-current assets | 48,103 | 43,396 | |
| Total assets | 65,030 | 58,465 | |
| € millions | 2021 | 2020 | |
| Trade and other payables | 1,142 | 1,213 | |
| Tax liabilities | 265 | 414 | |
| Financial liabilities | 4,205 | 2,348 | |
| Other non-financial liabilities | 3,966 | 4,643 | |
| Provisions | 87 | 73 | |
| Contract liabilities | 4,846 | 4,150 | |
| Total current liabilities | 14,511 | 12,842 | |
| Trade and other payables | 118 | 98 | |
| Tax liabilities | 823 | 667 | |
| Financial liabilities | 11,342 | 13,605 | |
| Other non-financial liabilities | 722 | 770 | |
| Provisions | 386 | 362 | |
| Deferred tax liabilities | 252 | 158 | |
| Contract liabilities | 51 | 36 | |
| Total non-current liabilities | 13,695 | 15,696 | |
| Total liabilities | 28,207 | 28,537 | |
| Issued capital | 1,229 | 1,229 | |
| Share premium | 1,605 | 545 | |
| Retained earnings | 34,492 | 32,026 | |
| Other components of equity | 949 | –1,011 | |
| Treasury shares | –3,072 | –3,072 | |
| Equity attributable to owners of parent | 35,203 | 29,717 | |
| Non-controlling interests | 1,621 | 211 | |
| Total equity | 36,823 | 29,928 | |
| Total equity and liabilities | 65,030 | 58,465 | |
Due to rounding, numbers may not add up precisely.
| SAP Quarterly Statement Q3 2021 | 14 |
(C) Consolidated Statements of Cash Flows
| € millions | Q1–Q3 2021 | Q1–Q3 2020 |
| Profit (loss) after tax | 3,936 | 3,348 |
| Adjustments to reconcile profit (loss) after tax to net cash flows from operating activities: | ||
| Depreciation and amortization | 1,308 | 1,369 |
| Share-based payment expense | 1,961 | 1,064 |
| Income tax expense | 954 | 1,166 |
| Financial income, net | –1,651 | –669 |
| Decrease/increase in allowances on trade receivables | –17 | 64 |
| Other adjustments for non-cash items | 15 | –5 |
| Decrease/increase in trade and other receivables | 1,718 | 1,950 |
| Decrease/increase in other assets | –370 | –504 |
| Increase/decrease in trade payables, provisions, and other liabilities | –689 | –675 |
| Increase/decrease in contract liabilities | 500 | 183 |
| Share-based payments | –923 | –1,119 |
| Interest paid | –142 | –202 |
| Interest received | 35 | 102 |
| Income taxes paid, net of refunds | –1,682 | –977 |
| Net cash flows from operating activities | 4,954 | 5,094 |
| Business combinations, net of cash and cash equivalents acquired | –1,017 | –61 |
| Proceeds from sales of subsidiaries or other businesses | –47 | 0 |
| Purchase of intangible assets or property, plant, and equipment | –546 | –652 |
| Proceeds from sales of intangible assets or property, plant, and equipment | 69 | 63 |
| Purchase of equity or debt instruments of other entities | –2,393 | –786 |
| Proceeds from sales of equity or debt instruments of other entities | 2,264 | 416 |
| Net cash flows from investing activities | –1,668 | –1,019 |
| Dividends paid | –2,182 | –1,864 |
| Dividends paid on non-controlling interests | –19 | –2 |
| Purchase of treasury shares | 0 | –742 |
| Proceeds from changes in ownership interests in subsidiaries that do not result in the loss of control | 1,847 | 0 |
| Proceeds from borrowings | 1,600 | 2,115 |
| Repayments of borrowings | –1,949 | –1,082 |
| Payments of lease liabilities | –276 | –271 |
| Transactions with non-controlling interests | 0 | –59 |
| Net cash flows from financing activities | –979 | –1,904 |
| Effect of foreign currency rates on cash and cash equivalents | 326 | –51 |
| Net decrease/increase in cash and cash equivalents | 2,633 | 2,119 |
| Cash and cash equivalents at the beginning of the period | 5,311 | 5,314 |
| Cash and cash equivalents at the end of the period | 7,943 | 7,434 |
| Due to rounding, numbers may not add up precisely. | ||
| SAP Quarterly Statement Q3 2021 | 15 |
Non-IFRS Numbers
(D) Basis of Non-IFRS Presentation
We disclose certain financial measures such as revenue (non-IFRS), expense (non-IFRS), and profit measures (non-IFRS) that are not prepared in accordance with IFRS and are therefore considered non-IFRS financial measures.
For a more detailed description of all of SAP’s non-IFRS measures and their limitations as well as our constant currency and free cash flow figures, see Explanation of Non-IFRS Measures online.
| SAP Quarterly Statement Q3 2021 | 16 |
(E) Reconciliation from Non-IFRS Numbers to IFRS Numbers
(E.1) Reconciliation from Non-IFRS Numbers to IFRS Numbers – Quarter
| € millions, unless otherwise stated | Q3 2021 | Q3 2020 | ∆ in % | ||||||||
| IFRS | Adj. | Non- IFRS | Currency Impact | Non-IFRS Constant Currency | IFRS | Adj. | Non- IFRS | IFRS | Non- IFRS | Non-IFRS Constant Currency1) | |
| Revenue Numbers | |||||||||||
| Cloud | 2,386 | 0 | 2,386 | –1 | 2,384 | 1,984 | 0 | 1,984 | 20 | 20 | 20 |
| Software licenses | 657 | 0 | 657 | –3 | 654 | 714 | 0 | 714 | –8 | –8 | –8 |
| Software support | 2,867 | 0 | 2,867 | –4 | 2,863 | 2,845 | 0 | 2,845 | 1 | 1 | 1 |
| Software licenses and support | 3,524 | 0 | 3,524 | –8 | 3,517 | 3,559 | 0 | 3,559 | –1 | –1 | –1 |
| Cloud and software | 5,910 | 0 | 5,910 | –9 | 5,901 | 5,544 | 0 | 5,544 | 7 | 7 | 6 |
| Services | 935 | 0 | 935 | –2 | 933 | 992 | 0 | 992 | –6 | –6 | –6 |
| Total revenue | 6,845 | 0 | 6,845 | –10 | 6,834 | 6,535 | 0 | 6,535 | 5 | 5 | 5 |
| Operating Expense Numbers | |||||||||||
| Cost of cloud | –788 | 58 | –730 | –667 | 65 | –602 | 18 | 21 | |||
| Cost of software licenses and support | –454 | 25 | –430 | –472 | 31 | –441 | –4 | –3 | |||
| Cost of cloud and software | –1,242 | 82 | –1,160 | –1,140 | 97 | –1,043 | 9 | 11 | |||
| Cost of services | –716 | 71 | –645 | –750 | 71 | –679 | –5 | –5 | |||
| Total cost of revenue | –1,958 | 153 | –1,805 | –1,890 | 168 | –1,722 | 4 | 5 | |||
| Gross profit | 4,887 | 153 | 5,040 | 4,646 | 168 | 4,814 | 5 | 5 | |||
| Research and development | –1,300 | 145 | –1,155 | –1,113 | 122 | –990 | 17 | 17 | |||
| Sales and marketing | –1,845 | 267 | –1,578 | –1,678 | 240 | –1,438 | 10 | 10 | |||
| General and administration | –576 | 302 | –274 | –345 | 74 | –270 | 67 | 1 | |||
| Restructuring | 13 | –13 | 0 | 8 | –8 | 0 | 55 | NA | |||
| Other operating income/expense, net | 70 | 0 | 70 | –46 | 0 | –46 | <-100 | <-100 | |||
| Total operating expenses | –5,596 | 853 | –4,742 | 27 | –4,716 | –5,063 | 596 | –4,466 | 11 | 6 | 6 |
| Profit Numbers | |||||||||||
| Operating profit (loss) | 1,249 | 853 | 2,102 | 16 | 2,119 | 1,473 | 597 | 2,069 | –15 | 2 | 2 |
| Other non-operating income/expense, net | 16 | 0 | 16 | –19 | 0 | –19 | <-100 | <-100 | |||
| Finance income | 716 | 0 | 716 | 736 | 0 | 736 | –3 | –3 | |||
| Finance costs | –233 | 0 | –233 | –120 | 0 | –120 | 94 | 94 | |||
| Financial income, net | 484 | 0 | 484 | 616 | 0 | 616 | –21 | –21 | |||
| Profit (loss) before tax | 1,749 | 853 | 2,602 | 2,070 | 597 | 2,666 | –16 | –2 | |||
| Income tax expense | –331 | –142 | –474 | –418 | –150 | –568 | –21 | –17 | |||
| Profit (loss) after tax | 1,418 | 711 | 2,129 | 1,652 | 446 | 2,098 | –14 | 1 | |||
| Attributable to owners of parent | 1,406 | 644 | 2,050 | 1,556 | 446 | 2,002 | –10 | 2 | |||
| Attributable to non-controlling interests | 12 | 67 | 79 | 96 | 0 | 96 | –88 | –18 | |||
| Key Ratios | |||||||||||
| Operating margin (in %) | 18.2 | 30.7 | 31.0 | 22.5 | 31.7 | –4.3pp | –0.9pp | –0.7pp | |||
| Effective tax rate (in %)2) | 18.9 | 18.2 | 20.2 | 21.3 | –1.3pp | –3.1pp | |||||
| Earnings per share, basic (in €) | 1.19 | 1.74 | 1.32 | 1.70 | –10 | 2 | |||||
1) Constant currency period-over-period changes are calculated by comparing the current year's non-IFRS constant currency numbers with the non-IFRS numbers of the previous year's respective period.
2) The difference between our effective tax rate (IFRS) and effective tax rate (non-IFRS) in Q3 2021 and Q3 2020 mainly resulted from tax effects of share-based payment expenses and acquisition-related charges.
Due to rounding, numbers may not add up precisely.
| SAP Quarterly Statement Q3 2021 | 17 |
(E.2) Reconciliation from Non-IFRS Numbers to IFRS Numbers – Year-to-Date
| € millions, unless otherwise stated | Q1–Q3 2021 | Q1–Q3 2020 | ∆ in % | ||||||||
| IFRS | Adj. | Non-IFRS | Currency Impact | Non-IFRS Constant Currency | IFRS | Adj. | Non-IFRS | IFRS | Non-IFRS | Non-IFRS Constant Currency1) | |
| Revenue Numbers | |||||||||||
| Cloud | 6,806 | 0 | 6,806 | 253 | 7,060 | 6,039 | 2 | 6,041 | 13 | 13 | 17 |
| Software licenses | 1,790 | 0 | 1,790 | 36 | 1,826 | 1,939 | 0 | 1,939 | –8 | –8 | –6 |
| Software support | 8,491 | 0 | 8,491 | 225 | 8,716 | 8,671 | 0 | 8,671 | –2 | –2 | 1 |
| Software licenses and support | 10,281 | 0 | 10,281 | 261 | 10,542 | 10,610 | 0 | 10,610 | –3 | –3 | –1 |
| Cloud and software | 17,088 | 0 | 17,088 | 514 | 17,602 | 16,649 | 2 | 16,651 | 3 | 3 | 6 |
| Services | 2,774 | 0 | 2,774 | 86 | 2,859 | 3,150 | 0 | 3,150 | –12 | –12 | –9 |
| Total revenue | 19,861 | 0 | 19,861 | 600 | 20,461 | 19,800 | 2 | 19,801 | 0 | 0 | 3 |
| Operating Expense Numbers | |||||||||||
| Cost of cloud | –2,232 | 166 | –2,066 | –2,037 | 193 | –1,844 | 10 | 12 | |||
| Cost of software licenses and support | –1,393 | 74 | –1,319 | –1,471 | 84 | –1,387 | –5 | –5 | |||
| Cost of cloud and software | –3,625 | 240 | –3,385 | –3,508 | 277 | –3,231 | 3 | 5 | |||
| Cost of services | –2,163 | 210 | –1,953 | –2,475 | 166 | –2,309 | –13 | –15 | |||
| Total cost of revenue | –5,788 | 450 | –5,338 | –5,983 | 443 | –5,540 | –3 | –4 | |||
| Gross profit | 14,073 | 450 | 14,523 | 13,816 | 445 | 14,261 | 2 | 2 | |||
| Research and development | –3,778 | 396 | –3,382 | –3,323 | 285 | –3,037 | 14 | 11 | |||
| Sales and marketing | –5,336 | 749 | –4,587 | –5,362 | 628 | –4,734 | 0 | –3 | |||
| General and administration | –1,674 | 823 | –850 | –1,074 | 186 | –888 | 56 | –4 | |||
| Restructuring | –151 | 151 | 0 | –4 | 4 | 0 | >100 | NA | |||
| Other operating income/expense, net | 58 | 0 | 58 | –86 | 0 | –86 | <-100 | <-100 | |||
| Total operating expenses | –16,668 | 2,569 | –14,100 | –389 | –14,489 | –15,833 | 1,547 | –14,286 | 5 | –1 | 1 |
| Profit Numbers | |||||||||||
| Operating profit (loss) | 3,193 | 2,569 | 5,762 | 210 | 5,972 | 3,967 | 1,548 | 5,515 | –20 | 4 | 8 |
| Other non-operating income/expense, net | 45 | 0 | 45 | –122 | 0 | –122 | <-100 | <-100 | |||
| Finance income | 2,265 | 0 | 2,265 | 1,142 | 0 | 1,142 | 98 | 98 | |||
| Finance costs | –614 | 0 | –614 | –474 | 0 | –474 | 30 | 30 | |||
| Financial income, net | 1,651 | 0 | 1,651 | 669 | 0 | 669 | >100 | >100 | |||
| Profit (loss) before tax | 4,890 | 2,569 | 7,459 | 4,514 | 1,548 | 6,062 | 8 | 23 | |||
| Income tax expense | –954 | –442 | –1,396 | –1,166 | –389 | –1,555 | –18 | –10 | |||
| Profit (loss) after tax | 3,936 | 2,126 | 6,063 | 3,348 | 1,159 | 4,507 | 18 | 35 | |||
| Attributable to owners of parent | 3,802 | 1,955 | 5,757 | 3,237 | 1,159 | 4,396 | 17 | 31 | |||
| Attributable to non-controlling interests | 134 | 171 | 306 | 112 | 0 | 112 | 20 | >100 | |||
| Key Ratios | |||||||||||
| Operating margin (in %) | 16.1 | 29.0 | 29.2 | 20.0 | 27.9 | –4.0pp | 1.2pp | 1.3pp | |||
| Effective tax rate (in %)2) | 19.5 | 18.7 | 25.8 | 25.6 | –6.3pp | –6.9pp | |||||
| Earnings per share, basic (in €) | 3.22 | 4.88 | 2.74 | 3.71 | 18 | 31 | |||||
1) Constant-currency period-over-period changes are calculated by comparing the current year's non-IFRS constant-currency numbers with the non-IFRS number of the previous year's respective period.
2) The difference between our effective tax rate (IFRS) and effective tax rate (non-IFRS) in the first nine months of 2021 mainly resulted from tax effects of share-based payment expenses, acquisition-related charges and restructuring expenses. The difference between our effective tax rate (IFRS) and effective tax rate (non-IFRS) in the first nine months of 2020 mainly resulted from tax effects of share-based payment expenses and acquisition-related charges.
Due to rounding, numbers may not add up precisely.
| SAP Quarterly Statement Q3 2021 | 18 |
(F) Non-IFRS Adjustments – Actuals and Estimates
| € millions | Estimated Amounts for Full Year 2021
| Q1–Q3 2021 | Q3 2021 | Q1–Q3 2020 | Q3 2020 | |
| Operating profit (loss) (IFRS) | 3,193 | 1,249 | 3,967 | 1,473 | ||
| Revenue adjustments | NA | 0 | 0 | 2 | 0 | |
| Adjustment for acquisition-related charges | 560–660 | 457 | 161 | 478 | 153 | |
| Adjustment for share-based payment expenses | 2,300–2,800 | 1,961 | 705 | 1,064 | 452 | |
| Adjustment for restructuring | 150–200 | 151 | –13 | 4 | –8 | |
| Operating expense adjustments | 2,569 | 853 | 1,547 | 596 | ||
| Operating profit (loss) adjustments | 2,569 | 853 | 1,548 | 597 | ||
| Operating profit (loss) (non-IFRS) | 5,762 | 2,102 | 5,515 | 2,069 |
Due to rounding, numbers may not add up precisely.
(G) Non-IFRS Adjustments by Functional Areas
| € millions | Q3 2021 | Q3 2020 | ||||||||
| IFRS | Acquisition- Related | SBP1) | Restruc- turing | Non-IFRS | IFRS | Acquisition- Related | SBP1) | Restruc- turing | Non-IFRS | |
| Cost of cloud | –788 | 42 | 16 | 0 | –730 | –667 | 50 | 15 | 0 | –602 |
| Cost of software licenses and support | –454 | 8 | 16 | 0 | –430 | –472 | 10 | 21 | 0 | –441 |
| Cost of services | –716 | 5 | 66 | 0 | –645 | –750 | 1 | 70 | 0 | –679 |
| Research and development | –1,300 | 2 | 142 | 0 | –1,155 | –1,113 | 2 | 121 | 0 | –990 |
| Sales and marketing | –1,845 | 91 | 175 | 0 | –1,578 | –1,678 | 89 | 151 | 0 | –1,438 |
| General and administration | –576 | 12 | 289 | 0 | –274 | –345 | 1 | 73 | 0 | –270 |
| Restructuring | 13 | 0 | 0 | –13 | 0 | 8 | 0 | 0 | –8 | 0 |
| Other operating income/expense, net | 70 | 0 | 0 | 0 | 70 | –46 | 0 | 0 | 0 | –46 |
| Total operating expenses | –5,596 | 161 | 705 | –13 | –4,742 | –5,063 | 153 | 452 | –8 | –4,466 |
| € millions | Q1–Q3 2021 | Q1–Q3 2020 | ||||||||
| IFRS | Acquisition- Related | SBP1) | Restruc- turing | Non-IFRS | IFRS | Acquisition- Related | SBP1) | Restruc- turing | Non-IFRS | |
| Cost of cloud | –2,232 | 122 | 44 | 0 | –2,066 | –2,037 | 156 | 38 | 0 | –1,844 |
| Cost of software licenses and support | –1,393 | 24 | 50 | 0 | –1,319 | –1,471 | 32 | 52 | 0 | –1,387 |
| Cost of services | –2,163 | 15 | 195 | 0 | –1,953 | –2,475 | 2 | 164 | 0 | –2,309 |
| Research and development | –3,778 | 6 | 390 | 0 | –3,382 | –3,323 | 6 | 279 | 0 | –3,037 |
| Sales and marketing | –5,336 | 272 | 477 | 0 | –4,587 | –5,362 | 280 | 348 | 0 | –4,734 |
| General and administration | –1,674 | 18 | 805 | 0 | –850 | –1,074 | 3 | 183 | 0 | –888 |
| Restructuring | –151 | 0 | 0 | 151 | 0 | –4 | 0 | 0 | 4 | 0 |
| Other operating income/expense, net | 58 | 0 | 0 | 0 | 58 | –86 | 0 | 0 | 0 | –86 |
| Total operating expenses | –16,668 | 457 | 1,961 | 151 | –14,100 | –15,833 | 478 | 1,064 | 4 | –14,286 |
1) Share-based Payments
Due to rounding, numbers may not add up precisely.
| SAP Quarterly Statement Q3 2021 | 19 |
If not presented in a separate line item in our income statement, the restructuring expenses would break down as follows:
| € millions | Q3 2021 | Q1–Q3 2021 | Q3 2020 | Q1–Q3 2020 |
| Cost of cloud | 5 | –125 | 0 | 0 |
Cost of software licenses and support | 0 | –3 | 2 | –1 |
| Cost of services | 1 | –14 | 1 | –4 |
| Research and development | 1 | –10 | 3 | –2 |
| Sales and marketing | 5 | 2 | 1 | 1 |
| General and administration | 0 | –1 | 2 | 1 |
| Restructuring expenses | 13 | –151 | 8 | –4 |
Due to rounding, numbers may not add up precisely.
| SAP Quarterly Statement Q3 2021 | 20 |
Disaggregations
(H) Segment Reporting
(H.1) Segment Policies and Segment Changes
SAP has three reportable segments: the Applications, Technology & Support segment, the Qualtrics segment, and the Services segment.
For a more detailed description of SAP’s segment reporting, see Note (C.1) “Results of Segments” of our Consolidated Half-Year Report 2021.
(H.2) Segment Reporting – Quarter
Applications, Technology & Support
€ millions, unless otherwise stated (non-IFRS) | Q3 2021 | Q3 2020 | ∆ in % | ∆ in % | |
Actual Currency | Constant Currency | Actual Currency | Actual Currency | Constant Currency | |
| Cloud | 2,155 | 2,153 | 1,853 | 16 | 16 |
| Software licenses | 655 | 652 | 714 | –8 | –9 |
| Software support | 2,867 | 2,863 | 2,844 | 1 | 1 |
| Software licenses and support | 3,522 | 3,515 | 3,559 | –1 | –1 |
| Cloud and software | 5,677 | 5,667 | 5,411 | 5 | 5 |
| Services | 85 | 85 | 62 | 37 | 37 |
| Total segment revenue | 5,762 | 5,752 | 5,473 | 5 | 5 |
| Cost of cloud | –681 | –682 | –569 | 20 | 20 |
| Cost of software licenses and support | –394 | –393 | –406 | –3 | –3 |
| Cost of cloud and software | –1,076 | –1,074 | –975 | 10 | 10 |
| Cost of services | –96 | –95 | –87 | 10 | 10 |
| Total cost of revenue | –1,171 | –1,170 | –1,062 | 10 | 10 |
| Segment gross profit | 4,590 | 4,582 | 4,412 | 4 | 4 |
| Other segment expenses | –2,184 | –2,173 | –2,085 | 5 | 4 |
| Segment profit (loss) | 2,406 | 2,410 | 2,327 | 3 | 4 |
| Margins | |||||
| Cloud gross margin (in %) | 68.4 | 68.3 | 69.3 | –0.9pp | –1.0pp |
| Segment gross margin (in %) | 79.7 | 79.7 | 80.6 | –0.9pp | –0.9pp |
| Segment margin (in %) | 41.8 | 41.9 | 42.5 | –0.7pp | –0.6pp |
Due to rounding, numbers may not add up precisely.
| SAP Quarterly Statement Q3 2021 | 21 |
Qualtrics
€ millions, unless otherwise stated (non-IFRS) | Q3 2021 | Q3 2020 | ∆ in % | ∆ in % | |||||
Actual Currency | Constant Currency | Actual Currency | Actual Currency | Constant Currency | |||||
| Cloud | 189 | 191 | 129 | 46 | 47 | ||||
| Cloud and software | 189 | 191 | 129 | 46 | 47 | ||||
| Services | 43 | 43 | 39 | 10 | 10 | ||||
| Total segment revenue | 233 | 234 | 169 | 38 | 39 | ||||
| Cost of cloud | –16 | –16 | –12 | 35 | 36 | ||||
| Cost of software licenses and support | 0 | 0 | 0 | NA | NA | ||||
| Cost of cloud and software | –16 | –16 | –12 | 35 | 36 | ||||
| Cost of services | –29 | –29 | –24 | 23 | 24 | ||||
| Total cost of revenue | –45 | –45 | –35 | 27 | 28 | ||||
| Segment gross profit | 188 | 189 | 134 | 41 | 42 | ||||
| Other segment expenses | –174 | –176 | –125 | 39 | 40 | ||||
| Segment profit (loss) | 14 | 13 | 8 | 71 | 68 | ||||
| Margins | |||||||||
| Cloud gross margin (in %) | 91.6 | 91.6 | 90.9 | 0.7pp | 0.7pp | ||||
| Segment gross margin (in %) | 80.7 | 80.7 | 79.1 | 1.6pp | 1.7pp | ||||
| Segment margin (in %) | 5.9 | 5.7 | 4.7 | 1.1pp | 1.0pp | ||||
Due to rounding, numbers may not add up precisely.
Services
€ millions, unless otherwise stated (non-IFRS) | Q3 2021 | Q3 2020 | ∆ in % | ∆ in % | |||||
Actual Currency | Constant Currency | Actual Currency | Actual Currency | Constant Currency | |||||
| Cloud and software | 0 | 0 | 1 | <-100 | <-100 | ||||
| Services | 803 | 801 | 808 | –1 | –1 | ||||
| Total segment revenue | 803 | 801 | 809 | –1 | –1 | ||||
| Cost of cloud | –18 | –18 | –17 | 7 | 7 | ||||
| Cost of software licenses and support | –4 | –4 | –6 | –33 | –33 | ||||
| Cost of cloud and software | –21 | –21 | –22 | –3 | –4 | ||||
| Cost of services | –489 | –488 | –493 | –1 | –1 | ||||
| Total cost of revenue | –511 | –509 | –515 | –1 | –1 | ||||
| Segment gross profit | 292 | 292 | 294 | –1 | –1 | ||||
| Other segment expenses | –91 | –91 | –102 | –10 | –11 | ||||
| Segment profit (loss) | 201 | 201 | 192 | 5 | 5 | ||||
| Margins | |||||||||
| Services gross margin (in %) | 39.1 | 39.1 | 39.0 | 0.1pp | 0.2pp | ||||
| Segment gross margin (in %) | 36.4 | 36.5 | 36.3 | 0.1pp | 0.2pp | ||||
| Segment margin (in %) | 25.0 | 25.1 | 23.7 | 1.3pp | 1.5pp | ||||
Due to rounding, numbers may not add up precisely.
| SAP Quarterly Statement Q3 2021 | 22 |
(H.3) Segment Reporting – Year-to-Date
Applications, Technology & Support
€ millions, unless otherwise stated (non-IFRS) | Q1–Q3 2021 | Q1–Q3 2020 | ∆ in % | ∆ in % | |||||
Actual Currency | Constant Currency | Actual Currency | Actual Currency | Constant Currency | |||||
| Cloud | 6,179 | 6,399 | 5,654 | 9 | 13 | ||||
| Software licenses | 1,787 | 1,823 | 1,934 | –8 | –6 | ||||
| Software support | 8,490 | 8,715 | 8,669 | –2 | 1 | ||||
| Software licenses and support | 10,277 | 10,537 | 10,603 | –3 | –1 | ||||
| Cloud and software | 16,455 | 16,937 | 16,257 | 1 | 4 | ||||
| Services | 239 | 245 | 209 | 14 | 17 | ||||
| Total segment revenue | 16,694 | 17,181 | 16,466 | 1 | 4 | ||||
| Cost of cloud | –1,930 | –2,006 | –1,742 | 11 | 15 | ||||
| Cost of software licenses and support | –1,214 | –1,243 | –1,294 | –6 | –4 | ||||
| Cost of cloud and software | –3,144 | –3,248 | –3,035 | 4 | 7 | ||||
| Cost of services | –299 | –306 | –295 | 2 | 4 | ||||
| Total cost of revenue | –3,443 | –3,555 | –3,330 | 3 | 7 | ||||
| Segment gross profit | 13,251 | 13,626 | 13,136 | 1 | 4 | ||||
| Other segment expenses | –6,479 | –6,641 | –6,511 | 0 | 2 | ||||
| Segment profit (loss) | 6,772 | 6,985 | 6,625 | 2 | 5 | ||||
| Margins | |||||||||
| Cloud gross margin (in %) | 68.8 | 68.7 | 69.2 | –0.4pp | –0.5pp | ||||
| Segment gross margin (in %) | 79.4 | 79.3 | 79.8 | –0.4pp | –0.5pp | ||||
| Segment margin (in %) | 40.6 | 40.7 | 40.2 | 0.3pp | 0.4pp | ||||
Due to rounding, numbers may not add up precisely.
Qualtrics
€ millions, unless otherwise stated (non-IFRS) | Q1–Q3 2021 | Q1–Q3 2020 | ∆ in % | ∆ in % | ||||||
Actual Currency | Constant Currency | Actual Currency | Actual Currency | Constant Currency | ||||||
| Cloud | 522 | 554 | 380 | 38 | 46 | |||||
| Cloud and software | 522 | 554 | 380 | 38 | 46 | |||||
| Services | 123 | 130 | 118 | 4 | 10 | |||||
| Total segment revenue | 645 | 685 | 498 | 30 | 38 | |||||
| Cost of cloud | –42 | –44 | –35 | 20 | 26 | |||||
| Cost of software licenses and support | 0 | 0 | 0 | NA | NA | |||||
| Cost of cloud and software | –42 | –44 | –35 | 20 | 26 | |||||
| Cost of services | –86 | –91 | –77 | 13 | 18 | |||||
| Total cost of revenue | –128 | –134 | –111 | 15 | 21 | |||||
| Segment gross profit | 517 | 551 | 387 | 34 | 42 | |||||
| Other segment expenses | –478 | –513 | –393 | 22 | 31 | |||||
| Segment profit (loss) | 39 | 38 | –6 | <-100 | <-100 | |||||
| Margins | ||||||||||
| Cloud gross margin (in %) | 92.1 | 92.1 | 90.9 | 1.1pp | 1.2pp | |||||
| Segment gross margin (in %) | 80.2 | 80.4 | 77.7 | 2.5pp | 2.7pp | |||||
| Segment margin (in %) | 6.1 | 5.5 | –1.2 | 7.3pp | 6.7pp | |||||
Due to rounding, numbers may not add up precisely.
| SAP Quarterly Statement Q3 2021 | 23 |
Services
€ millions, unless otherwise stated (non-IFRS) | Q1–Q3 2021 | Q1–Q3 2020 | ∆ in % | ∆ in % | ||||||
Actual Currency | Constant Currency | Actual Currency | Actual Currency | Constant Currency | ||||||
| Cloud and software | 0 | 0 | 3 | –95 | –96 | |||||
| Services | 2,398 | 2,470 | 2,568 | –7 | –4 | |||||
| Total segment revenue | 2,398 | 2,470 | 2,571 | –7 | –4 | |||||
| Cost of cloud | –60 | –62 | –56 | 7 | 11 | |||||
| Cost of software licenses and support | –14 | –15 | –22 | –36 | –33 | |||||
| Cost of cloud and software | –74 | –77 | –78 | –5 | –2 | |||||
| Cost of services | –1,497 | –1,538 | –1,673 | –11 | –8 | |||||
| Total cost of revenue | –1,571 | –1,614 | –1,751 | –10 | –8 | |||||
| Segment gross profit | 828 | 856 | 820 | 1 | 4 | |||||
| Other segment expenses | –275 | –282 | –330 | –17 | –15 | |||||
| Segment profit (loss) | 553 | 574 | 490 | 13 | 17 | |||||
| Margins | ||||||||||
| Services gross margin (in %) | 37.6 | 37.7 | 34.8 | 2.7pp | 2.9pp | |||||
| Segment gross margin (in %) | 34.5 | 34.6 | 31.9 | 2.6pp | 2.8pp | |||||
| Segment margin (in %) | 23.0 | 23.2 | 19.1 | 4.0pp | 4.2pp | |||||
Due to rounding, numbers may not add up precisely.
| SAP Quarterly Statement Q3 2021 | 24 |
| (I) | Reconciliation of Cloud Revenues and Margins |
| (I.1) | Reconciliation of Cloud Revenues and Margins – Quarter |
€ millions, unless otherwise stated
| Q3 2021 | Q3 2020 | ∆ in % | |||||||||
| IFRS | Adj. | Non- IFRS | Currency Impact | Non-IFRS Constant Currency | IFRS | Adj. | Non-IFRS | IFRS | Non- IFRS | Non-IFRS Constant Currency3) | ||
| Cloud revenue – SaaS/PaaS1) | Intelligent Spend | 714 | 0 | 714 | 1 | 715 | 650 | 0 | 650 | 10 | 10 | 10 |
| Other | 1,434 | 0 | 1,434 | –3 | 1,431 | 1,127 | 0 | 1,127 | 27 | 27 | 27 | |
| Total | 2,148 | 0 | 2,148 | –1 | 2,146 | 1,777 | 0 | 1,777 | 21 | 21 | 21 | |
| Cloud revenue – IaaS2) | 238 | 0 | 238 | 0 | 238 | 208 | 0 | 208 | 15 | 15 | 15 | |
| Cloud revenue | 2,386 | 0 | 2,386 | –1 | 2,384 | 1,984 | 0 | 1,984 | 20 | 20 | 20 | |
| Cloud gross margin – SaaS/PaaS1) (in %) | Intelligent Spend | 79.4 | 80.0 | 79.9 | 78.2 | 78.3 | 1.2pp | 1.7pp | 1.7pp | |||
| Other | 66.2 | 69.8 | 69.7 | 65.9 | 71.4 | 0.4pp | –1.6pp | –1.7pp | ||||
| Total | 70.6 | 73.2 | 73.1 | 70.4 | 73.9 | 0.2pp | –0.7pp | –0.8pp | ||||
| Cloud gross margin – IaaS2) (in %) | 34.3 | 35.3 | 35.3 | 32.2 | 33.4 | 2.1pp | 2.0pp | 1.9pp | ||||
| Cloud gross margin (in %) | 67.0 | 69.4 | 69.3 | 66.4 | 69.7 | 0.6pp | –0.3pp | –0.4pp |
1) Software as a Service/Platform as a Service
2) Infrastructure as a Service
3) Constant currency period-over-period changes are calculated by comparing the current year's non-IFRS constant currency numbers with the non-IFRS numbers of the previous year's respective period.
Due to rounding, numbers may not add up precisely.
(I.2) Reconciliation of Cloud Revenues and Margins – Year-to-Date
| € millions, unless otherwise stated | Q1–Q3 2021 | Q1–Q3 2020 | ∆ in % | |||||||||
| IFRS | Adj. | Non- IFRS | Currency Impact | Non-IFRS Constant Currency | IFRS | Adj. | Non-IFRS | IFRS | Non- IFRS | Non-IFRS Constant Currency3) | ||
| Cloud revenue – SaaS/PaaS1) | Intelligent Spend | 2,066 | 0 | 2,066 | 93 | 2,159 | 2,061 | 0 | 2,061 | 0 | 0 | 5 |
| Other | 4,063 | 0 | 4,063 | 134 | 4,198 | 3,350 | 2 | 3,352 | 21 | 21 | 25 | |
| Total | 6,129 | 0 | 6,129 | 227 | 6,356 | 5,411 | 2 | 5,413 | 13 | 13 | 17 | |
| Cloud revenue – IaaS2) | 677 | 0 | 677 | 26 | 703 | 628 | 0 | 628 | 8 | 8 | 12 | |
| Cloud revenue | 6,806 | 0 | 6,806 | 253 | 7,060 | 6,039 | 2 | 6,041 | 13 | 13 | 17 | |
| Cloud gross margin – SaaS/PaaS1) (in %) | Intelligent Spend | 78.7 | 79.3 | 79.3 | 78.7 | 79.0 | 0.0pp | 0.3pp | 0.3pp | |||
| Other | 66.9 | 70.5 | 70.4 | 64.9 | 70.4 | 1.9pp | 0.1pp | 0.0pp | ||||
| Total | 70.9 | 73.4 | 73.4 | 70.2 | 73.7 | 0.7pp | –0.2pp | –0.2pp | ||||
| Cloud gross margin – IaaS2) (in %) | 34.2 | 35.3 | 34.8 | 32.5 | 33.5 | 1.6pp | 1.8pp | 1.4pp | ||||
| Cloud gross margin (in %) | 67.2 | 69.6 | 69.6 | 66.3 | 69.5 | 0.9pp | 0.2pp | 0.1pp |
1) Software as a Service/Platform as a Service
2) Infrastructure as a Service
3) Constant currency period-over-period changes are calculated by comparing the current year's non-IFRS constant currency numbers with the non-IFRS numbers of the previous year's respective period.
Due to rounding, numbers may not add up precisely.
| SAP Quarterly Statement Q3 2021 | 25 |
| (J) | Revenue by Region (IFRS and Non-IFRS) |
| (J.1) | Revenue by Region (IFRS and Non-IFRS) – Quarter |
| € millions | Q3 2021 | Q3 2020 | ∆ in % | ||||||||
| IFRS | Adj. | Non-IFRS | Currency Impact | Non-IFRS Constant Currency | IFRS | Adj. | Non-IFRS | IFRS | Non- IFRS | Non-IFRS Constant Currency1) | |
| Cloud Revenue by Region | |||||||||||
| EMEA | 850 | 0 | 850 | –7 | 843 | 659 | 0 | 659 | 29 | 29 | 28 |
| Americas | 1,228 | 0 | 1,228 | 3 | 1,231 | 1,076 | 0 | 1,077 | 14 | 14 | 14 |
| APJ | 308 | 0 | 308 | 3 | 310 | 249 | 0 | 249 | 23 | 23 | 25 |
| Cloud revenue | 2,386 | 0 | 2,386 | –1 | 2,384 | 1,984 | 0 | 1,984 | 20 | 20 | 20 |
| Cloud and Software Revenue by Region | |||||||||||
| EMEA | 2,642 | 0 | 2,642 | –17 | 2,625 | 2,451 | 0 | 2,451 | 8 | 8 | 7 |
| Americas | 2,338 | 0 | 2,338 | 5 | 2,343 | 2,214 | 0 | 2,214 | 6 | 6 | 6 |
| APJ | 930 | 0 | 930 | 3 | 933 | 879 | 0 | 879 | 6 | 6 | 6 |
| Cloud and software revenue | 5,910 | 0 | 5,910 | –9 | 5,901 | 5,544 | 0 | 5,544 | 7 | 7 | 6 |
| Total Revenue by Region | |||||||||||
| Germany | 1,087 | 0 | 1,087 | 0 | 1,087 | 952 | 0 | 952 | 14 | 14 | 14 |
| Rest of EMEA | 1,956 | 0 | 1,956 | –20 | 1,936 | 1,908 | 0 | 1,908 | 3 | 3 | 1 |
| Total EMEA | 3,043 | 0 | 3,043 | –20 | 3,024 | 2,860 | 0 | 2,860 | 6 | 6 | 6 |
| United States | 2,224 | 0 | 2,224 | 16 | 2,240 | 2,167 | 0 | 2,168 | 3 | 3 | 3 |
| Rest of Americas | 518 | 0 | 518 | –10 | 508 | 494 | 0 | 494 | 5 | 5 | 3 |
| Total Americas | 2,742 | 0 | 2,742 | 6 | 2,748 | 2,661 | 0 | 2,662 | 3 | 3 | 3 |
| Japan | 324 | 0 | 324 | 14 | 338 | 317 | 0 | 317 | 2 | 2 | 7 |
| Rest of APJ | 735 | 0 | 735 | –10 | 725 | 696 | 0 | 696 | 6 | 6 | 4 |
| Total APJ | 1,059 | 0 | 1,059 | 4 | 1,063 | 1,013 | 0 | 1,013 | 5 | 5 | 5 |
| Total revenue | 6,845 | 0 | 6,845 | –10 | 6,834 | 6,535 | 0 | 6,535 | 5 | 5 | 5 |
1) Constant currency period-over-period changes are calculated by comparing the current year's non-IFRS constant currency numbers with the non-IFRS numbers of the previous year's respective period.
Due to rounding, numbers may not add up precisely.
| SAP Quarterly Statement Q3 2021 | 26 |
(J.2) Revenue by Region (IFRS and Non-IFRS) – Year-to-Date
| € millions | Q1–Q3 2021 | Q1–Q3 2020 | ∆ in % | ||||||||||||||||||||
| IFRS | Adj. | Non-IFRS | Currency Impact | Non-IFRS Currency | IFRS | Adj. | Non-IFRS | IFRS | Non- IFRS | Non-IFRS Currency1) | |||||||||||||
| Cloud Revenue by Region | |||||||||||||||||||||||
| EMEA | 2,397 | 0 | 2,397 | 22 | 2,420 | 1,936 | 0 | 1,936 | 24 | 24 | 25 | ||||||||||||
| Americas | 3,519 | 0 | 3,519 | 205 | 3,723 | 3,352 | 2 | 3,354 | 5 | 5 | 11 | ||||||||||||
| APJ | 890 | 0 | 890 | 26 | 917 | 751 | 0 | 751 | 18 | 18 | 22 | ||||||||||||
| Cloud revenue | 6,806 | 0 | 6,806 | 253 | 7,060 | 6,039 | 2 | 6,041 | 13 | 13 | 17 | ||||||||||||
| Cloud and Software Revenue by Region | |||||||||||||||||||||||
| EMEA | 7,692 | 0 | 7,692 | 49 | 7,740 | 7,291 | 0 | 7,291 | 5 | 5 | 6 | ||||||||||||
| Americas | 6,674 | 0 | 6,674 | 386 | 7,061 | 6,759 | 2 | 6,761 | –1 | –1 | 4 | ||||||||||||
| APJ | 2,722 | 0 | 2,722 | 79 | 2,801 | 2,599 | 0 | 2,599 | 5 | 5 | 8 | ||||||||||||
| Cloud and software revenue | 17,088 | 0 | 17,088 | 514 | 17,602 | 16,649 | 2 | 16,651 | 3 | 3 | 6 | ||||||||||||
| Total Revenue by Region | |||||||||||||||||||||||
| Germany | 3,044 | 0 | 3,044 | 3 | 3,047 | 2,798 | 0 | 2,798 | 9 | 9 | 9 | ||||||||||||
| Rest of EMEA | 5,854 | 0 | 5,854 | 52 | 5,906 | 5,770 | 0 | 5,770 | 1 | 1 | 2 | ||||||||||||
| Total EMEA | 8,898 | 0 | 8,898 | 54 | 8,952 | 8,568 | 0 | 8,568 | 4 | 4 | 4 | ||||||||||||
| United States | 6,390 | 0 | 6,390 | 393 | 6,783 | 6,744 | 2 | 6,746 | –5 | –5 | 1 | ||||||||||||
| Rest of Americas | 1,492 | 0 | 1,492 | 63 | 1,555 | 1,477 | 0 | 1,477 | 1 | 1 | 5 | ||||||||||||
| Total Americas | 7,882 | 0 | 7,882 | 456 | 8,338 | 8,221 | 2 | 8,223 | –4 | –4 | 1 | ||||||||||||
| Japan | 952 | 0 | 952 | 70 | 1,022 | 959 | 0 | 959 | –1 | –1 | 7 | ||||||||||||
| Rest of APJ | 2,129 | 0 | 2,129 | 19 | 2,149 | 2,052 | 0 | 2,052 | 4 | 4 | 5 | ||||||||||||
| Total APJ | 3,081 | 0 | 3,081 | 90 | 3,171 | 3,011 | 0 | 3,011 | 2 | 2 | 5 | ||||||||||||
| Total revenue | 19,861 | 0 | 19,861 | 600 | 20,461 | 19,800 | 2 | 19,801 | 0 | 0 | 3 | ||||||||||||
1) Constant-currency period-over-period changes are calculated by comparing the current year's non-IFRS constant-currency numbers with the non-IFRS number of the previous year's respective period.
Due to rounding, numbers may not add up precisely.
| SAP Quarterly Statement Q3 2021 | 27 |
(K) Employees by Region and Functional Areas
| Full-time equivalents | 9/30/2021 | 9/30/2020 | |||||||||||||||
| EMEA | Americas | APJ | Total | EMEA | Americas | APJ | Total | ||||||||||
| Cloud and software | 6,037 | 4,536 | 5,154 | 15,726 | 6,241 | 4,496 | 5,469 | 16,205 | |||||||||
| Services | 8,138 | 5,582 | 6,038 | 19,758 | 8,119 | 6,013 | 5,869 | 20,001 | |||||||||
| Research and development | 14,769 | 6,103 | 10,330 | 31,202 | 13,176 | 6,115 | 9,664 | 28,955 | |||||||||
| Sales and marketing | 10,852 | 11,047 | 5,149 | 27,048 | 10,303 | 10,501 | 5,028 | 25,832 | |||||||||
| General and administration | 3,310 | 2,130 | 1,158 | 6,598 | 3,165 | 2,149 | 1,225 | 6,538 | |||||||||
| Infrastructure | 2,590 | 1,289 | 805 | 4,683 | 2,187 | 1,060 | 671 | 3,918 | |||||||||
| SAP Group (9/30) | 45,696 | 30,685 | 28,634 | 105,015 | 43,190 | 30,334 | 27,925 | 101,450 | |||||||||
| Thereof acquisitions1) | 390 | 63 | 45 | 498 | 0 | 0 | 0 | 0 | |||||||||
| SAP Group (nine months' end average) | 45,006 | 30,422 | 28,187 | 103,616 | 43,169 | 30,285 | 27,801 | 101,255 | |||||||||
| 1) Acquisitions closed between January 1 and September 30 of the respective year | |||||||||||||||||
| SAP Quarterly Statement Q3 2021 | 28 |
Other Disclosures
| (L) | Financial Income, Net |
Finance income mainly consists of gains from disposals and fair value adjustments of equity securities totaling €704 million in the third quarter of 2021 (Q3/2020: €715 million) and €2,219 million in the first nine months of 2021 (Q1-Q3/2020: €1,048 million).
Finance cost were primarily impacted by losses from disposals and fair value adjustments of equity securities totaling €171 million in the third quarter of 2021 (Q3/2020: €44 million) and €399 million in the first nine months of 2021 (Q1-Q3/2020: €203 million).
For more information about Financial Income, Net, see the Notes to the 2021 Consolidated Half-Year Financial Statements, Note (C.3).
| (M) | Business Combinations and Divestments |
| (M.1) | Business Combinations |
Signavio GmbH
In January 2021, SAP announced it had entered into an agreement to acquire Signavio GmbH (Berlin, Germany) (“Signavio”), a leader in the enterprise business process intelligence and process management space. The purchase price was €949 million. The transaction closed on March 5th, following satisfaction of regulatory and other approvals; the operating results and assets and liabilities are reflected in our consolidated financial statements starting on that date (the initial accounting for the Signavio acquisition is still incomplete, thus the amounts recorded for some assets and liabilities are regarded provisional as of September 30, 2021).
For more information about Business Combinations, see the Notes to the 2021 Consolidated Half-Year Financial Statements, Note (D.1).
Clarabridge Inc.
On October 1, 2021 (after receipt of required regulatory approvals and satisfaction or waiver of other customary closing conditions), Qualtrics completed its previously announced acquisition of Clarabridge, Inc. (“Clarabridge”), a customer experience management software company headquartered in Reston, Virginia, USA, pursuant to an Agreement and Plan of Reorganization and Merger. The number of Qualtrics class A common stock issued to the sellers was fixed based on a valuation of US$1.125 billion (subject to certain adjustments) – the assumed Qualtrics share price was US$37.33. The consideration transferred will be calculated based on the acquisition date fair value of the common stock. Pursuant to joinder and lockup agreements signed by Clarabridge’s stockholders, the sale of the Qualtrics shares by the Clarabridge stockholders is subject to certain restrictions. The issuance of shares for this transaction will further dilute SAP’s ownership in Qualtrics to approximately 78%.
In addition, pursuant to the terms of the Merger Agreement, Qualtrics has (1) assumed, amended and restated Clarabridge stock plans, and (2) converted the assumed options to purchase shares of Clarabridge stock outstanding into corresponding Qualtrics options. Qualtrics will grant equity incentive awards to certain continuing employees of Clarabridge and its subsidiaries under their own Qualtrics equity plan at Qualtrics’ sole discretion.
Due to the timing of the close of the Clarabridge acquisition, the initial accounting for the business combination is incomplete and a preliminary allocation of purchase consideration cannot be estimated.
| (M.2) | Divestments |
As a result of the close of the transaction in September (following satisfaction of all closing conditions including regulatory approvals), SAP and investment company Dediq GmbH (“Dediq”) now jointly own the new “SAP Fioneer” entity (with SAP owning a minority share). SAP and SAP Fioneer have executed transition service and go-to-market agreements, among others. The disposal gain relating to the transfer of the business (predominantly IP and employees) was recorded in SAP’s “Other operating income/expense, net” (€77 million for both IFRS and non-IFRS).
| (N) | Qualtrics Initial Public Offering (IPO) |
On January 28, 2021, Qualtrics International Inc. successfully issued 12% of its shares on the Nasdaq Stock Market (NASDAQ). The IPO related cash inflow amounted to €1,847 million and the initial value of non-controlling interests in net assets was €909 million.
| (O) | Share Based Payments |
In the first nine months of 2021, 73.0 million equity-settled Qualtrics RSU (Retention Share Units) awards were granted to encourage and enable Qualtrics executives and employees to acquire an ownership interest in Qualtrics.
Upon completion of a voluntary exchange offer for eligible Qualtrics employees in conjunction with the IPO on January 28, 2021, 5.4 million of Qualtrics rights and 1.3 million SAP RSU awards were exchanged into 12.8 million Qualtrics RSU awards. The terms and conditions of the
| SAP Quarterly Statement Q3 2021 | 29 |
voluntary exchange offer, including the exchange ratio, were designed to preserve the intrinsic value of the Qualtrics rights and SAP RSUs that were tendered. The modification date fair value of the Qualtrics RSU awards was US$30.00.
| (P) | Financial Liabilities |
In March 2021, SAP drew two short-term bank loans of €950 million and €500 million with tenors of one year. The loans can be repaid flexibly over time and bear interest at the Euribor reference rate plus 0.08% and 0.05%, respectively. In the same month, we repaid €500 million in Eurobonds. In June 2021, we repaid the outstanding €1,250 million of a term loan drawn in 2019 for the acquisition of Qualtrics. As at June 30, 2021, we had issued €1,080 million under our Commercial Paper (CP) program with short-term maturities, of which € 740 million were repaid during the third quarter of 2021. Additionally, as at September 30, 2021, we had issued further EUR 590 million under our Commercial Papers (CP) program with short-term maturities.
| (Q) | Change in non-IFRS revenue measures |
In the second quarter of 2021 and effective for the full year 2021, we changed our non-IFRS definition. We no longer adjust our IFRS revenue measures by including the full amount of recurring revenue that is not recognized under IFRS due to fair value accounting for the contracts in effect at the time of the respective acquisitions. The adjustment amounts were immaterial for the first nine months of 2021.
Thus, our IFRS revenue is equal to our non-IFRS revenue at actual currencies. Stated 2020 results are based on our 2020 non-IFRS definition.
The adjustment of our non-IFRS definition also impacts our operating profit (non-IFRS), profit before tax (non-IFRS), profit after tax (non-IFRS), and our non-IFRS key ratios such as operating margin, effective tax rate, and earnings per share, basic.
| SAP Quarterly Statement Q3 2021 | 30 |