Exhibit 99.1

SAP Announces Q3 2022 Results
| ● | Cloud momentum continues to accelerate |
| ● | Cloud revenue up 38% and up 25% at constant currencies |
| ● | Current cloud backlog up 38% and up 26% at constant currencies |
| ● | SAP S/4HANA current cloud backlog up 108% and up 90% at constant currencies |
| ● | IFRS cloud gross profit up 44%, non-IFRS cloud gross profit up 42% and up 30% at constant currencies |
| ● | IFRS operating profit down 1%, non-IFRS operating profit flat and down 8% at constant currencies |
in € millions, unless otherwise stated
| |  Christian Klein, CEO: “Our cloud solutions are the answer, as customers turn to us to help them future-proof their businesses. This trust in SAP is reflected in our accelerating cloud momentum. With a recurring revenue share of more than 80%, it’s clear that our transformation has reached an important inflection point, paving the way for continued growth in the future.” Christian Klein, CEO: “Our cloud solutions are the answer, as customers turn to us to help them future-proof their businesses. This trust in SAP is reflected in our accelerating cloud momentum. With a recurring revenue share of more than 80%, it’s clear that our transformation has reached an important inflection point, paving the way for continued growth in the future.” | |  Luka Mucic, CFO: “We have delivered a strong cloud quarter with accelerating momentum across all key cloud indicators. We’re at an important inflection point in our transformation which we anticipate will lead to accelerating revenue growth and double-digit operating profit growth in 2023.” Luka Mucic, CFO: “We have delivered a strong cloud quarter with accelerating momentum across all key cloud indicators. We’re at an important inflection point in our transformation which we anticipate will lead to accelerating revenue growth and double-digit operating profit growth in 2023.”
| |
Walldorf, Germany – October 25, 2022.
SAP SE (NYSE: SAP) today announced its financial results for the third quarter ended September 30, 2022. |
|  | Financial Performance |
| Group results at a glance – Third quarter 2022 |
| | IFRS | | Non-IFRS1 |
| € million, unless otherwise stated | Q3 2022 | Q3 2021 | ∆ in % | | Q3 2022 | Q3 2021 | ∆ in % | ∆ in %
const.
curr. |
| Cloud revenue | 3,288 | 2,386 | 38 | | 3,288 | 2,386 | 38 | 25 |
| Software licenses | 406 | 657 | –38 | | 406 | 657 | –38 | –42 |
| Software support | 3,016 | 2,867 | 5 | | 3,016 | 2,867 | 5 | –2 |
| Software licenses and support revenue | 3,422 | 3,524 | –3 | | 3,422 | 3,524 | –3 | –9 |
| Cloud and software revenue | 6,710 | 5,910 | 14 | | 6,710 | 5,910 | 14 | 5 |
| Total revenue | 7,841 | 6,845 | 15 | | 7,841 | 6,845 | 15 | 5 |
| Share of more predictable revenue (in %) | 80 | 77 | 4pp | | 80 | 77 | 4pp | |
| Operating profit (loss) | 1,239 | 1,249 | –1 | | 2,094 | 2,102 | 0 | –8 |
| Profit (loss) after tax | 547 | 1,418 | –61 | | 1,263 | 2,129 | –41 | |
| Earnings per share - Basic (in €) | 0.57 | 1.19 | –52 | | 1.12 | 1.74 | –36 | |
| Earnings per share - Diluted (in €) | 0.57 | 1.19 | –52 | | | | | |
| Net cash flows from operating activities | 849 | 1,183 | –28 | | | | | |
| Free cash flow | | | | | 464 | 881 | –47 | |
| Number of employees (FTE, September 30) | 112,632 | 105,015 | 7 | | | | | |
1 For a breakdown of the individual adjustments see table “Non-IFRS Adjustments by Functional Areas” in this Quarterly Statement.
Due to rounding, numbers may not add up precisely.
| Group results at a glance – Nine months ended September 2022 |
| | IFRS | | Non-IFRS1 |
| € million, unless otherwise stated | Q1–Q3 2022 | Q1–Q3 2021 | ∆ in % | | Q1–Q3 2022 | Q1–Q3 2021 | ∆ in % | ∆ in %
const.
curr. |
| Cloud revenue | 9,164 | 6,806 | 35 | | 9,164 | 6,806 | 35 | 25 |
| Software licenses | 1,149 | 1,790 | –36 | | 1,149 | 1,790 | –36 | –39 |
| Software support | 8,916 | 8,491 | 5 | | 8,916 | 8,491 | 5 | 0 |
| Software licenses and support revenue | 10,065 | 10,281 | –2 | | 10,065 | 10,281 | –2 | –7 |
| Cloud and software revenue | 19,229 | 17,088 | 13 | | 19,229 | 17,088 | 13 | 6 |
| Total revenue | 22,435 | 19,861 | 13 | | 22,435 | 19,861 | 13 | 6 |
| Share of more predictable revenue (in %) | 81 | 77 | 4pp | | 81 | 77 | 4pp | |
| Operating profit (loss) | 2,965 | 3,193 | –7 | | 5,452 | 5,762 | –5 | –10 |
| Profit (loss) after tax | 1,382 | 3,936 | –65 | | 3,522 | 6,063 | –42 | |
| Earnings per share - Basic (in €) | 1.49 | 3.22 | –54 | | 3.08 | 4.88 | –37 | |
| Earnings per share - Diluted (in €) | 1.48 | 3.22 | –54 | | | | | |
| Net cash flows from operating activities | 3,598 | 4,954 | –27 | | | | | |
| Free cash flow | | | | | 2,543 | 4,132 | –38 | |
| Number of employees (FTE, September 30) | 112,632 | 105,015 | 7 | | | | | |
1 For a breakdown of the individual adjustments see table “Non-IFRS Adjustments by Functional Areas” in this Quarterly Statement.
Due to rounding, numbers may not add up precisely
Financial Highlights
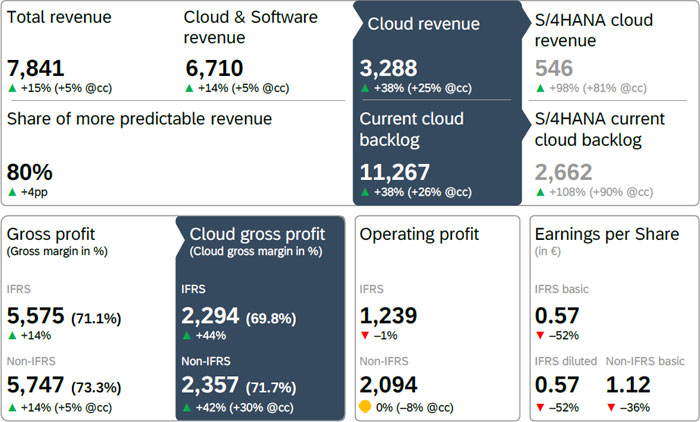
Current cloud backlog continued to build momentum and expanded to €11.27 billion, accelerating growth to 38% and 26% at constant currencies.
Driven by double-digit growth across the SaaS and PaaS portfolio, cloud revenue was up 38% to €3.29 billion, up 25% at constant currencies.
Cloud gross profit was up 44% (IFRS), 42% (non-IFRS) and 30% (non-IFRS at constant currencies). Year-over-year, cloud gross margin was up 2.8 percentage points to 69.8% (IFRS) and up 2.3 percentage points to 71.7% (non-IFRS). This was mainly driven by a strong increase of the SaaS margin, with efficiency gains overcompensating increased investments into the next generation cloud delivery program.
IFRS operating profit decreased 1% to €1.24 billion and IFRS operating margin decreased by 2.4 percentage points to 15.8%. Non-IFRS operating profit was flat at €2.09 billion and decreased 8% at constant currencies. Non-IFRS operating margin decreased by 4.0 percentage points to 26.7% and was down by 3.8 percentage points at constant currencies. As in previous quarters, this was mainly driven by a reduced contribution from software licenses revenue as well as accelerated investments into research & development and sales & marketing to capture current and future growth opportunities. In addition, prior year third quarter IFRS and non-IFRS operating profit included a disposal gain of €77 million related to the launch of SAP Fioneer.
IFRS earnings per share decreased 52% to €0.57 and non-IFRS earnings per share decreased 36% to €1.12. The year-over-year decline of earnings per share reflects a contribution to financial income by Sapphire Ventures that, due to current market conditions, was significantly lower than in the same period last year. Effective tax rate was 35.7% (IFRS) and 26.0% (non-IFRS). The year-over-year increase mainly resulted from changes in tax exempt income related to Sapphire Ventures.
Free cash flow for the first nine months was down 38% to €2.54 billion. The decrease versus last year is mainly attributable to the development of profitability and adverse impacts in working capital. In the fourth quarter, we continue to expect a more favorable cash flow development due to a focus on working capital management and lower payouts for cash taxes, share-based compensation, and capex. However, based on our year-to-date position, we are adjusting the free cash flow outlook for the year to approximately €4.5 billion (previously: “above €4.5 billion”).
On July 21, SAP announced its second share buyback program for 2022, which was completed on September 6. Under the program, SAP repurchased 5,715,512 shares at an average price of €87.50 with a purchase value of approximately €500 million. Repurchased shares will primarily be used to service awards granted under share-based compensation plans for employees.
Impact of War in Ukraine
In the first nine months, SAP’s business was impacted by the war in Ukraine and SAP’s decision to wind down its business operations in Russia and Belarus.
At the end of the third quarter current cloud backlog was approximately €64 million lower due to the termination of existing cloud engagements in Russia and Belarus, reducing current cloud backlog growth by approximately 1 percentage point at constant currencies. The impact on third quarter IFRS operating profit was approximately €20 million (first nine months: approximately €370 million) and approximately €20 million (first nine months: approximately €250 million) on non-IFRS operating profit, mainly due to reduced revenues.
For the full year, we expect a total revenue impact of approximately €250 million at constant currencies from lack of new business and discontinuation of existing business. For non-IFRS operating profit we expect an impact of approximately €300 million at constant currencies from the revenue gaps mentioned above and other expense items.
Other impacts due to this evolving situation are currently unknown and could potentially subject our business to materially adverse consequences should the situation escalate beyond its current scope.
|  | Business Highlights |
In the third quarter, customers around the globe chose “RISE with SAP” to drive end-to-end business transformation, including Alpargatas, Assaí Atacadista, Center for Pandemic Vaccines and Therapeutics (ZEPAI) at the Paul-Ehrlich-Institut, Dabur India Limited, Fonterra, HELLENiQ ENERGY, Nikon Corporation, Prada, RICOH CO., Roborock, Salzburg AG, Schneider Electric, Wistron Corporation and 11teamsports. BioNTech, Birlasoft, Bosch BASF Smart Farming, Dufry International, NBA, Petrobras and Wipro went live on SAP S/4HANA Cloud in the third quarter. Key customer wins across SAP’s solution portfolio included: Allianz Technology, Cognizant, DB Schenker, Domino’s Pizza Enterprises, Endress+Hauser, Fujitsu Limited, Grupo Energía Bogotá, Gustavo Gusto, Hapag-Lloyd, L.L.Bean, Salzgitter, Schiphol Nederland, Siemens Energy, The Pennsylvania State University, The State of Missouri, Trent Limited and Valio. SAP’s cloud revenue performance for the quarter was very strong across all regions. The U.S. and Germany had an outstanding cloud revenue performance while Brazil, China, India and Switzerland were particularly strong. On July 21, SAP announced that it has acquired Askdata, a startup focused on search-driven analytics. With the acquisition of Askdata, SAP strengthens its ability to help organizations take better-informed decisions by leveraging AI-driven natural language searches. On August 17, SAP and Francisco Partners (FP) announced that FP has signed a definitive agreement with SAP America Inc. under which FP will acquire SAP Litmos from SAP. The transaction is expected to close in the fourth quarter of 2022 and is subject to customary regulatory clearances. On August 31, SAP announced that the SAP Supervisory Board has appointed Dominik Asam as CFO and member of the Executive Board of SAP SE. He will start on March 7, 2023. Currently he is the CFO and a member of the Executive Committee at Airbus. He will succeed Luka Mucic, who will remain a member of the Executive Board until March 31, 2023. On September 13, SAP announced that SAP SuccessFactors unveiled new modules for its Human Experience Management (HXM) Suite to create a powerful way for organizations to execute on an integrated talent development strategy and create a future-ready workforce. The new capabilities are the most significant developments that SuccessFactors has had in the last decade. On October 20, Taulia and Standard Chartered Bank signed a partner agreement to collaborate across a range of working capital finance solutions primarily in APJ and emerging markets. Further to this, Taulia has signed an agreement with Mastercard to provide embedded payment capabilities by integrating with the Mastercard Virtual Card platform which facilitates access to multiple global banks to fund the Taulia/Mastercard Virtual Card solution. Among other accolades, in the third quarter SAP was: |
| | |
| ● | named a Leader in 2022 Gartner® Magic Quadrant™ for Digital Commerce1 |
| ● | recognized as a Leader in 2022 Gartner® Magic Quadrant™ for Data Integration Tools |
| ● | named a leader in The Forrester Wave™: Digital Operations Platforms for Manufacturing and Distribution and |
| ● | SAP SuccessFactors was named a Leader in IDC MarketScape: for Worldwide Modern Talent Acquisition Suites 2022 Vendor Assessment |
1 Gartner does not endorse any vendor, product or service depicted in its research publications, and does not advise technology users to select only those vendors with the highest ratings or other designation. Gartner research publications consist of the opinions of Gartner’s research organization and should not be construed as statements of fact. Gartner disclaims all warranties, expressed or implied, with respect to this research, including any warranties of merchantability or fitness for a particular purpose. SAP is not responsible for the content of third-party research reports.
Segment Results at a Glance
SAP’s two reportable segments showed the following performance:
| Applications, Technology & Services1 | Q3 2022 | Q1-Q3 2022 |
€ million, unless otherwise stated (Non-IFRS) | Actual Currency | ∆ in % | ∆ in % Constant
Currency | Actual Currency | ∆ in % | ∆ in % Constant
Currency |
| SaaS2 | 2,037 | 37 | 24 | 5,658 | 32 | 23 |
| PaaS3 | 389 | 53 | 42 | 1,064 | 50 | 41 |
| IaaS4 | 252 | 5 | –3 | 751 | 10 | 3 |
| Cloud revenue | 2,678 | 35 | 23 | 7,474 | 32 | 23 |
| Segment revenue | 7,160 | 12 | 4 | 20,558 | 11 | 4 |
| Segment profit (loss) | 2,268 | –4 | –10 | 6,080 | –8 | –12 |
| SaaS2 (in %) | 70.7 | 3.2pp | 3.5pp | 69.5 | 2.0pp | 2.1pp |
| PaaS3 (in %) | 77.4 | –1.4pp | 0.6pp | 78.3 | –1.6pp | –0.1pp |
| IaaS4 (in %) | 21.0 | –12.7pp | –7.3pp | 26.0 | –8.1pp | –4.6pp |
| Cloud gross margin (in %) | 67.0 | 2.2pp | 3.2pp | 66.4 | 1.3pp | 2.0pp |
| Segment margin (in %) | 31.7 | –5.2pp | –4.7pp | 29.6 | –6.0pp | –5.6pp |
1 Segment information for comparative prior periods were restated to conform with the new segment composition.
2 Software as a service
3 Platform as a service
4 Infrastructure as a service
Segment revenue in AT&S was up 12% to €7.16 billion year-over-year, up 4% at constant currencies, due primarily to strong cloud revenue growth, driven by SAP S/4HANA as well as Business Technology Platform. Software licenses revenue decreased due to the shift to the cloud as more customers are choosing our ‘RISE with SAP’ offering. Segment support revenue was up 5% to €3.02 billion year-over-year and down 2% at constant currencies.
| Qualtrics | Q3 2022 | Q1-Q3 2022 |
€ million, unless otherwise stated (Non-IFRS) | Actual Currency | ∆ in % | ∆ in % Constant
Currency | Actual Currency | ∆ in % | ∆ in % Constant
Currency |
| Cloud revenue – SaaS2 | 322 | 70 | 47 | 870 | 67 | 49 |
| Segment revenue | 384 | 65 | 42 | 1,033 | 60 | 43 |
| Segment profit (loss) | 34 | >100 | >100 | 60 | 52 | 65 |
| Cloud gross margin – SaaS2 (in %) | 88.9 | –2.7pp | –2.9pp | 89.0 | –3.0pp | –3.1pp |
| Segment margin (in %) | 9.0 | 3.1pp | 5.0pp | 5.8 | –0.3pp | 1.0pp |
Qualtrics segment revenue was up 65% to €384 million year-over-year, up 42% at constant currencies. The continued strong growth was driven by robust renewal rates and expansions.
| | Q3 2022 | Q1 - Q3 2022 |
€ millions, unless otherwise stated (non-IFRS) | Actual
Currency | ∆ in % | ∆ in %
Constant
Currency | Actual
Currency | ∆ in % | ∆ in %
Constant
Currency |
| Current Cloud Backlog | | | | | | |
| Total | 11,267 | 38 | 26 | 11,267 | 38 | 26 |
| Thereof SAP S/4HANA | 2,662 | 108 | 90 | 2,662 | 108 | 90 |
| Cloud Revenue | | | | | | |
| SaaS1 | 2,621 | 39 | 26 | 7,279 | 35 | 25 |
| PaaS2 | 415 | 56 | 44 | 1,134 | 54 | 45 |
| IaaS3 | 252 | 5 | –3 | 752 | 10 | 3 |
| Total | 3,288 | 38 | 25 | 9,164 | 35 | 25 |
| Thereof SAP S/4HANA | 546 | 98 | 81 | 1,422 | 87 | 75 |
| Thereof Qualtrics | 322 | 70 | 47 | 870 | 67 | 49 |
| Cloud Gross Profit | | | | | | |
| SaaS1 | 1,978 | 45 | 31 | 5,434 | 39 | 28 |
| PaaS2 | 325 | 54 | 46 | 898 | 52 | 46 |
| IaaS3 | 53 | –34 | –24 | 196 | –16 | –10 |
| Total | 2,357 | 42 | 30 | 6,527 | 38 | 28 |
| Thereof Qualtrics | 286 | 65 | 42 | 775 | 61 | 44 |
| Cloud Gross Margin (in %) | | | | | | |
| SaaS1 (in %) | 75.5 | 2.9pp | 2.9pp | 74.7 | 2.0pp | 1.8pp |
| PaaS2 (in %) | 78.3 | –1.0pp | 0.9pp | 79.2 | –1.1pp | 0.4pp |
| IaaS3 (in %) | 21.0 | –12.7pp | –7.3pp | 26.0 | –8.1pp | –4.5pp |
| Total | 71.7 | 2.3pp | 2.8pp | 71.2 | 1.6pp | 1.9pp |
| Thereof Qualtrics | 88.9 | –2.7pp | –2.9pp | 89.0 | –3.0pp | –3.1pp |
1 Software as a service
2 Platform as a service
3 Infrastructure as a service
Due to rounding, numbers may not add up precisely
The Q1-Q3 2022 results were also impacted by other effects. For details, please refer to the disclosure on page 30 of this document.
|  | Business Outlook 2022 |
SAP is executing on its cloud-led strategy, which is driving accelerated cloud growth through both new business and cloud adoption by existing customers. The pace and scale of SAP’s cloud momentum places the Company well on track towards its mid-term ambition.
Financial Outlook
For 2022, SAP continues to expect:
| ● | €11.55 – 11.85 billion cloud revenue at constant currencies (2021: €9.42 billion), up 23% to 26% at constant currencies. |
| ● | €25.0 – 25.5 billion cloud and software revenue at constant currencies (2021: €24.08 billion), up 4% to 6% at constant currencies. |
| ● | €7.6 – 7.9 billion non-IFRS operating profit at constant currencies (2021: €8.23 billion), down 4% to 8% at constant currencies. |
| ● | The share of more predictable revenue (defined as the total of cloud revenue and software support revenue) is expected to reach approximately 78% (2021: 75%). |
For 2022, SAP now expects:
| ● | Free cash flow of approximately €4.5 billion (2021: €5.01 billion). The previous outlook was above €4.5 billion. |
The current market environment and volatility in capital markets also lead to a lower level of predictability regarding the full-year 2022 effective tax rate outlook (IFRS and non-IFRS). Based on current estimates, we now expect a full-year 2022 effective tax rate for IFRS of around 45.0% (previously: 34.0% to 38.0%) and for non-IFRS of around 30.0% (previously: 23.0% to 27.0%). As the further development of our effective tax rate (IFRS and non-IFRS) strongly depends on the 2022 financial income contribution of Sapphire Ventures, we may face major deviations from the current estimate in either direction given current market conditions.
While SAP’s full-year 2022 business outlook is at constant currencies, actual currency reported figures are expected to be impacted by currency exchange rate fluctuations as the Company progresses through the year.
See the table below for the Q4 and FY 2022 expected currency impacts.
| Expected Currency Impact Assuming September 2022 Rates Apply for the Rest of the Year |
| In percentage points | Q4 2022 | FY 2022 |
| Cloud revenue growth | +10pp to +12pp | +9pp to +11pp |
| Cloud and software revenue growth | +6pp to +8pp | +6pp to +8pp |
| Operating profit growth (non-IFRS) | +6pp to +8pp | +4pp to +6pp |
Non-Financial Outlook
For 2022, SAP continues to expect:
| ● | Employee Engagement Index to be in a range of 80% to 84% (2021: 83%) |
For 2022, SAP now expects:
| ● | Customer Net Promoter Score of 3 to 8 (2021: 10) after reviewing the year-to-date survey results. The previous range was 11 to 15. |
| ● | Net carbon emissions of 90 to 95 kt (2021: 110 kt). The previous value was 70 kt. |
Ambition 2025
SAP reiterates its mid-term ambition published in its Q3 2020 Quarterly Statement including the commitment to double-digit growth of operating profit in 2023. In light of its strong cloud momentum and most recent favorable currency exchange rate development, SAP expects to update its mid-term ambition in the upcoming quarters.
 | Additional Information |
This press release and all information therein is preliminary and unaudited.
SAP Performance Measures
For more information about our key growth metrics and performance measures, their calculation, their usefulness, and their limitation, please refer to the following document on our Investor Relations website: SAP Performance Measures.
Webcast
SAP senior management will host a financial analyst conference call on Tuesday, October 25th at 2:00 PM (CET) / 1:00 PM (GMT) / 8:00 AM (Eastern) / 5:00 AM (Pacific). The conference will be webcast live on the Company’s website at www.sap.com/investor and will be available for replay. Supplementary financial information pertaining to the third quarter can be found at www.sap.com/investor.
About SAP
SAP’s strategy is to help every business run as an intelligent enterprise. As a market leader in enterprise application software, we help companies of all sizes and in all industries run at their best: SAP customers generate 87% of total global commerce. Our machine learning, Internet of Things (IoT), and advanced analytics technologies help turn customers’ businesses into intelligent enterprises. SAP helps give people and organizations deep business insight and fosters collaboration that helps them stay ahead of their competition. We simplify technology for companies so they can consume our software the way they want – without disruption. Our end-to-end suite of applications and services enables business and public customers across 25 industries globally to operate profitably, adapt continuously, and make a difference. With a global network of customers, partners, employees, and thought leaders, SAP helps the world run better and improve people’s lives. For more information, visit www.sap.com.
For more information, financial community only:
| Anthony Coletta | +49 (6227) 7-60437 | investor@sap.com, CET |
| Follow SAP Investor Relations on Twitter at @sapinvestor. |
For more information, press only:
| Joellen Perry | +1 (650) 445-6780 | joellen.perry@sap.com, PT |
| Daniel Reinhardt | +49 (6227) 7-40201 | daniel.reinhardt@sap.com, CET |
For customers interested in learning more about SAP products:
| Global Customer Center: | +49 180 534-34-24 | |
| United States Only: | +1 (800) 872-1SAP (+1-800-872-1727) |
Note to editors:
To preview and download broadcast-standard stock footage and press photos digitally, please visit www.sap.com/photos. On this platform, you can find high resolution material for your media channels. To view video stories on diverse topics, visit www.sap-tv.com. From this site, you can embed videos into your own Web pages, share video via email links, and subscribe to RSS feeds from SAP TV.
This document contains forward-looking statements, which are predictions, projections, or other statements about future events. These statements are based on current expectations, forecasts, and assumptions that are subject to risks and uncertainties that could cause actual results and outcomes to materially differ. Additional information regarding these risks and uncertainties may be found in our filings with the Securities and Exchange Commission, including but not limited to the risk factors section of SAP’s 2021 Annual Report on Form 20-F.
© 2022 SAP SE. All rights reserved.
SAP and other SAP products and services mentioned herein as well as their respective logos are trademarks or registered trademarks of SAP SE in Germany and other countries. Please see https://www.sap.com/copyright for additional information.
Contents
Financial and Non-Financial Key Facts
(IFRS and Non-IFRS)
| € millions, unless otherwise stated | Q1 2021 | Q2 2021 | Q3 2021 | Q4 2021 | TY 2021 | Q1 2022 | Q2 2022 | Q3 2022 |
| Revenues | | | | | | | | |
| Cloud | 2,145 | 2,276 | 2,386 | 2,611 | 9,418 | 2,820 | 3,056 | 3,288 |
| % change – yoy | 7 | 11 | 20 | 28 | 17 | 31 | 34 | 38 |
| % change constant currency – yoy | 13 | 17 | 20 | 24 | 19 | 25 | 24 | 25 |
| SAP S/4HANA Cloud | 227 | 257 | 276 | 329 | 1,090 | 404 | 472 | 546 |
| % change – yoy | 36 | 33 | 46 | 65 | 46 | 78 | 84 | 98 |
| % change constant currency – yoy | 43 | 39 | 46 | 61 | 47 | 71 | 72 | 81 |
| Software licenses | 483 | 650 | 657 | 1,458 | 3,248 | 317 | 426 | 406 |
| % change – yoy | 7 | –16 | –8 | –14 | –11 | –34 | –34 | –38 |
| % change constant currency – yoy | 11 | –13 | –8 | –17 | –11 | –36 | –38 | –42 |
| Software support | 2,801 | 2,823 | 2,867 | 2,920 | 11,412 | 2,923 | 2,977 | 3,016 |
| % change – yoy | –5 | –2 | 1 | 3 | –1 | 4 | 5 | 5 |
| % change constant currency – yoy | 0 | 1 | 1 | 1 | 1 | 1 | 0 | –2 |
| Software licenses and support | 3,283 | 3,474 | 3,524 | 4,379 | 14,660 | 3,240 | 3,403 | 3,422 |
| % change – yoy | –3 | –5 | –1 | –4 | –3 | –1 | –2 | –3 |
| % change constant currency – yoy | 1 | –2 | –1 | –6 | –2 | –4 | –7 | –9 |
| Cloud and software | 5,428 | 5,750 | 5,910 | 6,990 | 24,078 | 6,060 | 6,459 | 6,710 |
| % change – yoy | 1 | 1 | 7 | 6 | 4 | 12 | 12 | 14 |
| % change constant currency – yoy | 6 | 5 | 6 | 3 | 5 | 7 | 5 | 5 |
| Total revenue | 6,348 | 6,669 | 6,845 | 7,981 | 27,842 | 7,077 | 7,517 | 7,841 |
| % change – yoy | –3 | –1 | 5 | 6 | 2 | 11 | 13 | 15 |
| % change constant currency – yoy | 2 | 3 | 5 | 3 | 3 | 7 | 5 | 5 |
| Share of more predictable revenue (in %) | 78 | 76 | 77 | 69 | 75 | 81 | 80 | 80 |
| Profits | | | | | | | | |
| Operating profit (loss) (IFRS) | 960 | 984 | 1,249 | 1,463 | 4,656 | 1,053 | 673 | 1,239 |
| Operating profit (loss) (non-IFRS) | 1,738 | 1,922 | 2,102 | 2,468 | 8,230 | 1,677 | 1,680 | 2,094 |
| % change | 17 | –2 | 2 | –11 | –1 | –4 | –13 | 0 |
| % change constant currency | 24 | 3 | 2 | –12 | 1 | –7 | –16 | –8 |
| Profit (loss) after tax (IFRS) | 1,070 | 1,449 | 1,418 | 1,440 | 5,376 | 632 | 203 | 547 |
| Profit (loss) after tax (non-IFRS) | 1,720 | 2,214 | 2,129 | 2,274 | 8,337 | 1,166 | 1,093 | 1,263 |
| % change | 70 | 59 | 1 | 12 | 28 | –32 | –51 | –41 |
| Margins | | | | | | | | |
| Cloud gross margin (IFRS, in %) | 67.2 | 67.5 | 67.0 | 66.6 | 67.0 | 68.2 | 69.8 | 69.8 |
| Cloud gross margin (non-IFRS, in %) | 69.5 | 70.0 | 69.4 | 69.0 | 69.5 | 70.0 | 71.9 | 71.7 |
| Software license and support gross margin (IFRS, in %) | 85.7 | 86.5 | 87.1 | 87.9 | 86.9 | 87.0 | 87.7 | 87.8 |
| Software license and support gross margin (non-IFRS, in %) | 86.3 | 87.3 | 87.8 | 88.5 | 87.6 | 87.5 | 88.5 | 88.6 |
| Cloud and software gross margin (IFRS, in %) | 78.4 | 79.0 | 79.0 | 79.9 | 79.1 | 78.2 | 79.2 | 79.0 |
| Cloud and software gross margin (non-IFRS, in %) | 79.7 | 80.5 | 80.4 | 81.2 | 80.5 | 79.4 | 80.6 | 80.3 |
| Gross margin (IFRS, in %) | 70.3 | 70.8 | 71.4 | 73.0 | 71.5 | 70.3 | 70.7 | 71.1 |
| Gross margin (non-IFRS, in %) | 72.3 | 73.4 | 73.6 | 75.1 | 73.7 | 72.0 | 73.1 | 73.3 |
| Operating margin (IFRS, in %) | 15.1 | 14.8 | 18.2 | 18.3 | 16.7 | 14.9 | 8.9 | 15.8 |
| Operating margin (non-IFRS, in %) | 27.4 | 28.8 | 30.7 | 30.9 | 29.6 | 23.7 | 22.4 | 26.7 |
| ATS segment – Cloud gross margin (in %) | 65.1 | 65.3 | 64.8 | 64.3 | 64.8 | 65.0 | 67.0 | 67.0 |
| ATS segment – Segment gross margin (in %) | 72.2 | 73.2 | 73.7 | 74.2 | 73.4 | 70.9 | 72.1 | 71.9 |
| ATS segment – Segment margin in % | 34.1 | 35.5 | 36.8 | 35.9 | 35.6 | 29.1 | 27.9 | 31.7 |
| Qualtrics segment – Cloud gross margin (in %) | 92.2 | 92.4 | 91.6 | 90.1 | 91.5 | 89.6 | 88.6 | 88.9 |
| Qualtrics segment – Segment gross margin (in %) | 79.5 | 80.3 | 80.7 | 78.1 | 79.6 | 78.8 | 77.4 | 77.5 |
| Qualtrics segment – Segment margin (in %) | 6.2 | 6.3 | 5.9 | 1.4 | 4.7 | 2.9 | 4.9 | 9.0 |
| Key Profit Ratios | | | | | | | | |
| Effective tax rate (IFRS, in %) | 20.0 | 19.7 | 18.9 | 26.4 | 21.5 | 33.1 | 62.2 | 35.7 |
| Effective tax rate (non-IFRS, in %) | 18.7 | 19.2 | 18.2 | 23.2 | 20.0 | 25.7 | 29.3 | 26.0 |
| € millions, unless otherwise stated | Q1 2021 | Q2 2021 | Q3 2021 | Q4 2021 | TY 2021 | Q1 2022 | Q2 2022 | Q3 2022 |
| Earnings per share, basic (IFRS, in €) | 0.88 | 1.15 | 1.19 | 1.23 | 4.46 | 0.63 | 0.29 | 0.57 |
| Earnings per share, basic (non-IFRS, in €) | 1.40 | 1.75 | 1.74 | 1.85 | 6.73 | 1.00 | 0.96 | 1.12 |
| Order Entry and current cloud backlog | | | | | | | | |
| Current cloud backlog | 7,628 | 7,766 | 8,171 | 9,447 | 9,447 | 9,731 | 10,403 | 11,267 |
| % change – yoy | 15 | 17 | 24 | 32 | 32 | 28 | 34 | 38 |
| % change constant currency – yoy | 19 | 20 | 22 | 26 | 26 | 23 | 25 | 26 |
| SAP S/4HANA Current cloud backlog | 1,036 | 1,130 | 1,283 | 1,707 | 1,707 | 1,925 | 2,258 | 2,662 |
| % change – yoy | 39 | 45 | 60 | 84 | 84 | 86 | 100 | 108 |
| % change constant currency – yoy | 43 | 48 | 58 | 76 | 76 | 79 | 87 | 90 |
| Share of cloud orders greater than €5 million based on total cloud order entry volume (in %)3 | 25 | 29 | 38 | 45 | 41 | 41 | 48 | 44 |
| Share of cloud orders smaller than €1 million based on total cloud order entry volume (in %)3 | 45 | 38 | 35 | 27 | 28 | 31 | 28 | 24 |
| Share of orders greater than €5 million based on total software order entry volume (in %) | 23 | 22 | 31 | 24 | 25 | 40 | 33 | 28 |
| Share of orders smaller than €1 million based on total software order entry volume (in %) | 42 | 43 | 41 | 36 | 39 | 33 | 40 | 49 |
| Liquidity and Cash Flow | | | | | | | | |
| Net cash flows from operating activities | 3,085 | 686 | 1,183 | 1,269 | 6,223 | 2,482 | 268 | 849 |
| Capital expenditure | –153 | –191 | –202 | –255 | –800 | –221 | –235 | –281 |
| Payments of lease liabilities | –84 | –92 | –99 | –98 | –374 | –95 | –120 | –103 |
| Free cash flow | 2,848 | 403 | 881 | 916 | 5,049 | 2,165 | –86 | 464 |
| % of total revenue | 45 | 6 | 13 | 11 | 18 | 31 | –1 | 6 |
| % of profit after tax (IFRS) | 266 | 28 | 62 | 64 | 94 | 343 | –42 | 85 |
| Group liquidity | 11,573 | 8,548 | 9,375 | 11,530 | 11,530 | 11,283 | 8,256 | 8,577 |
| Financial debt (–) | –14,230 | –13,116 | –12,994 | –13,094 | –13,094 | –12,171 | –12,282 | –12,282 |
| Net debt (–) | –2,658 | –4,568 | –3,619 | –1,563 | –1,563 | –888 | –4,026 | –3,705 |
| Financial Position | | | | | | | | |
| Cash and cash equivalents | 10,332 | 7,764 | 7,943 | 8,898 | 8,898 | 8,942 | 7,492 | 7,340 |
| Goodwill | 29,328 | 29,020 | 29,600 | 31,089 | 31,089 | 32,170 | 33,911 | 35,699 |
| Total assets | 66,477 | 63,075 | 65,029 | 71,174 | 71,174 | 76,515 | 75,807 | 78,234 |
| Contract liabilities (current) | 6,568 | 5,958 | 4,627 | 4,431 | 4,431 | 7,630 | 6,883 | 5,487 |
| Equity ratio (total equity in % of total assets) | 52 | 54 | 57 | 58 | 58 | 56 | 56 | 59 |
| Non-Financials | | | | | | | | |
| Number of employees (quarter end)1 | 103,142 | 103,876 | 105,015 | 107,415 | 107,415 | 109,798 | 110,409 | 112,632 |
| Employee retention (in %, rolling 12 months) | 95.4 | 94.8 | 93.7 | 92.8 | 92.8 | 92.1 | 91.6 | 91.8 |
| Women in management (in %, quarter end) | 27.6 | 27.9 | 28.2 | 28.3 | 28.3 | 28.6 | 28.8 | 29.1 |
| Net carbon emissions2 (in kilotons) | 30 | 20 | 25 | 35 | 110 | 20 | 25 | 25 |
1 In full-time equivalents.
2 In CO2 equivalents
3 To conform to refined calculation logic prior quarters have been adjusted
Due to rounding, numbers may not add up precisely.
Primary Financial Statements of SAP Group (IFRS)
| (A) | Consolidated Income Statements |
| (A.1) | Consolidated Income Statements – Quarter |
| € millions, unless otherwise stated | | Q3 2022 | Q3 2021 | ∆ in % |
| Cloud | | 3,288 | 2,386 | 38 |
| Software licenses | | 406 | 657 | –38 |
| Software support | | 3,016 | 2,867 | 5 |
| Software licenses and support | | 3,422 | 3,524 | –3 |
| Cloud and software | | 6,710 | 5,910 | 14 |
| Services | | 1,131 | 935 | 21 |
| Total revenue | | 7,841 | 6,845 | 15 |
| | | | | |
| Cost of cloud | | –994 | –788 | 26 |
| Cost of software licenses and support | | –418 | –454 | –8 |
| Cost of cloud and software | | –1,412 | –1,242 | 14 |
| Cost of services | | –854 | –716 | 19 |
| Total cost of revenue | | –2,266 | –1,958 | 16 |
| Gross profit | | 5,575 | 4,887 | 14 |
| Research and development | | –1,574 | –1,300 | 21 |
| Sales and marketing | | –2,257 | –1,845 | 22 |
| General and administration | | –521 | –576 | –9 |
| Restructuring | | 8 | 13 | –34 |
| Other operating income/expense, net | | 8 | 70 | –88 |
| Total operating expenses | | –6,602 | –5,596 | 18 |
| Operating profit (loss) | | 1,239 | 1,249 | –1 |
| | | | | |
| Other non-operating income/expense, net | | –58 | 16 | <-100 |
| Finance income | | 166 | 716 | –77 |
| Finance costs | | –497 | –233 | >100 |
| Financial income, net | | –331 | 484 | <-100 |
| Profit (loss) before tax | | 850 | 1,749 | –51 |
| | | | | |
| Income tax expense | | –304 | –331 | –8 |
| Profit (loss) after tax | | 547 | 1,418 | –61 |
| Attributable to owners of parent | | 669 | 1,406 | –52 |
| Attributable to non-controlling interests | | –123 | 12 | <-100 |
| | | | | |
| Earnings per share, basic (in €)1 | | 0.57 | 1.19 | –52 |
| Earnings per share, diluted (in €)1 | | 0.57 | 1.19 | –52 |
1 For the three months ended September 30, 2022 and 2021, the weighted average number of shares was 1,168 million (diluted 1,173 million) and 1,180 million (diluted: 1,180 million), respectively (treasury stock excluded).
Due to rounding, numbers may not add up precisely.
(A.2) Consolidated Income Statements – Year-to-Date
| € millions, unless otherwise stated | | Q1–Q3 2022 | Q1–Q3 2021 | ∆ in % |
| Cloud | | 9,164 | 6,806 | 35 |
| Software licenses | | 1,149 | 1,790 | –36 |
| Software support | | 8,916 | 8,491 | 5 |
| Software licenses and support | | 10,065 | 10,281 | –2 |
| Cloud and software | | 19,229 | 17,088 | 13 |
| Services | | 3,205 | 2,774 | 16 |
| Total revenue | | 22,435 | 19,861 | 13 |
| | | | | |
| Cost of cloud | | –2,816 | –2,232 | 26 |
| Cost of software licenses and support | | –1,259 | –1,393 | –10 |
| Cost of cloud and software | | –4,075 | –3,625 | 12 |
| Cost of services | | –2,489 | –2,163 | 15 |
| Total cost of revenue | | –6,563 | –5,788 | 13 |
| Gross profit | | 15,871 | 14,073 | 13 |
| Research and development | | –4,544 | –3,778 | 20 |
| Sales and marketing | | –6,587 | –5,336 | 23 |
| General and administration | | –1,555 | –1,674 | –7 |
| Restructuring | | –111 | –151 | –27 |
| Other operating income/expense, net | | –110 | 58 | <-100 |
| Total operating expenses | | –19,470 | –16,668 | 17 |
| Operating profit (loss) | | 2,965 | 3,193 | –7 |
| | | | | |
| Other non-operating income/expense, net | | –127 | 45 | <-100 |
| Finance income | | 687 | 2,265 | –70 |
| Finance costs | | –1,192 | –614 | 94 |
| Financial income, net | | –505 | 1,651 | <-100 |
| Profit (loss) before tax | | 2,333 | 4,890 | –52 |
| | | | | |
| Income tax expense | | –951 | –954 | 0 |
| Profit (loss) after tax | | 1,382 | 3,936 | –65 |
| Attributable to owners of parent | | 1,743 | 3,802 | –54 |
| Attributable to non-controlling interests | | –362 | 134 | <-100 |
| | | | | |
| Earnings per share, basic (in €)1 | | 1.49 | 3.22 | –54 |
| Earnings per share, diluted (in €)1 | | 1.48 | 3.22 | –54 |
1 For the nine months ended September 30, 2022 and 2021, the weighted average number of shares was 1,172 million (diluted: 1,175 million) and 1,180 million (diluted: 1,180 million), respectively (treasury stock excluded).
Due to rounding, numbers may not add up precisely.
(B) Consolidated Statements of Financial Position
| as at 09/30/2022 and 12/31/2021 |
| € millions | 2022 | 2021 |
| Cash and cash equivalents | 7,340 | 8,898 |
| Other financial assets | 1,482 | 2,758 |
| Trade and other receivables | 8,774 | 6,352 |
| Other non-financial assets | 2,235 | 1,633 |
| Tax assets | 1,008 | 403 |
| Total current assets | 20,839 | 20,044 |
| Goodwill | 35,699 | 31,089 |
| Intangible assets | 4,328 | 3,965 |
| Property, plant, and equipment | 5,032 | 4,977 |
| Other financial assets | 6,921 | 6,275 |
| Trade and other receivables | 111 | 147 |
| Other non-financial assets | 3,214 | 2,628 |
| Tax assets | 290 | 263 |
| Deferred tax assets | 1,800 | 1,786 |
| Total non-current assets | 57,395 | 51,130 |
| Total assets | 78,234 | 71,174 |
| |
| € millions | 2022 | 2021 |
| Trade and other payables | 1,926 | 1,580 |
| Tax liabilities | 285 | 304 |
| Financial liabilities | 8,579 | 4,528 |
| Other non-financial liabilities | 3,831 | 5,203 |
| Provisions | 126 | 89 |
| Contract liabilities | 5,487 | 4,431 |
| Total current liabilities | 20,233 | 16,136 |
| Trade and other payables | 95 | 122 |
| Tax liabilities | 948 | 827 |
| Financial liabilities | 9,565 | 11,042 |
| Other non-financial liabilities | 611 | 860 |
| Provisions | 406 | 355 |
| Deferred tax liabilities | 295 | 296 |
| Contract liabilities | 35 | 13 |
| Total non-current liabilities | 11,955 | 13,515 |
| Total liabilities | 32,188 | 29,650 |
| Issued capital | 1,229 | 1,229 |
| Share premium | 2,834 | 1,918 |
| Retained earnings | 35,764 | 37,022 |
| Other components of equity | 7,543 | 1,756 |
| Treasury shares | –4,420 | –3,072 |
| Equity attributable to owners of parent | 42,950 | 38,852 |
| | | |
| Non-controlling interests | 3,096 | 2,670 |
| Total equity | 46,046 | 41,523 |
| Total equity and liabilities | 78,234 | 71,174 |
Due to rounding, numbers may not add up precisely.
(C) Consolidated Statements of Cash Flows
| € millions | Q1–Q3 2022 | Q1–Q3 2021 |
| Profit (loss) after tax | 1,382 | 3,936 |
| Adjustments to reconcile profit (loss) after tax to net cash flows from operating activities: | | |
| Depreciation and amortization | 1,425 | 1,308 |
| Share-based payment expense | 1,873 | 1,961 |
| Income tax expense | 951 | 954 |
| Financial income, net | 505 | –1,651 |
| Decrease/increase in allowances on trade receivables | 80 | –17 |
| Other adjustments for non-cash items | –5 | 15 |
| Decrease/increase in trade and other receivables | 1,352 | 1,718 |
| Decrease/increase in other assets | –765 | –370 |
| Increase/decrease in trade payables, provisions, and other liabilities | –1,115 | –689 |
| Increase/decrease in contract liabilities | 537 | 500 |
| Share-based payments | –1,064 | –923 |
| Interest paid | –173 | –142 |
| Interest received | 88 | 35 |
| Income taxes paid, net of refunds | –1,473 | –1,682 |
| Net cash flows from operating activities | 3,598 | 4,954 |
| Business combinations, net of cash and cash equivalents acquired | –642 | –1,017 |
| Proceeds from sales of subsidiaries or other businesses | 0 | –47 |
| Purchase of intangible assets or property, plant, and equipment | –738 | –546 |
| Proceeds from sales of intangible assets or property, plant, and equipment | 70 | 69 |
| Purchase of equity or debt instruments of other entities | –2,772 | –2,393 |
| Proceeds from sales of equity or debt instruments of other entities | 4,164 | 2,264 |
| Cash flows from advances (supply chain financing)1 | –1,745 | 0 |
| Net cash flows from investing activities | –1,662 | –1,668 |
| Dividends paid | –2,865 | –2,182 |
| Dividends paid on non-controlling interests | –13 | –19 |
| Purchase of treasury shares | –1,500 | 0 |
| Proceeds from changes in ownership interests in subsidiaries that do not result in the loss of control | 33 | 1,847 |
| Payments for taxes related to net share settlement of equity awards | –250 | 0 |
| Proceeds from borrowings | 38 | 1,600 |
| Repayments of borrowings | –1,016 | –1,949 |
| Payments of lease liabilities | –318 | –276 |
| Cash flows with funders (supply chain financing)1 | 1,726 | 0 |
| Net cash flows from financing activities | –4,166 | –979 |
| Effect of foreign currency rates on cash and cash equivalents | 671 | 326 |
| Net decrease/increase in cash and cash equivalents | –1,558 | 2,633 |
| Cash and cash equivalents at the beginning of the period | 8,898 | 5,311 |
| Cash and cash equivalents at the end of the period | 7,340 | 7,943 |
| 1 For more information, see Note (L). |
| Due to rounding, numbers may not add up precisely. |
Non-IFRS Numbers
(D) Basis of Non-IFRS Presentation
We disclose certain financial measures such as revenue (non-IFRS), expense (non-IFRS), and profit measures (non-IFRS) that are not prepared in accordance with IFRS and are therefore considered non-IFRS financial measures.
For a more detailed description of all of SAP’s non-IFRS measures and their limitations as well as our constant currency and free cash flow figures, see Explanation of Non-IFRS Measures online.
(E) Reconciliation from Non-IFRS Numbers to IFRS Numbers
(E.1) Reconciliation from Non-IFRS Numbers to IFRS Numbers – Quarter
| € millions, unless otherwise stated | Q3 2022 | Q3 2021 | ∆ in % |
| IFRS | Adj. | Non-IFRS | Currency Impact | Non-IFRS
Constant
Currency | IFRS | Adj. | Non-IFRS | IFRS | Non-IFRS | Non-IFRS
Constant
Currency1 |
| Revenue Numbers | | | | | | | | | | | |
| Cloud | 3,288 | | 3,288 | –310 | 2,978 | 2,386 | | 2,386 | 38 | 38 | 25 |
| Software licenses | 406 | | 406 | –28 | 378 | 657 | | 657 | –38 | –38 | –42 |
| Software support | 3,016 | | 3,016 | –195 | 2,821 | 2,867 | | 2,867 | 5 | 5 | –2 |
| Software licenses and support | 3,422 | | 3,422 | –223 | 3,199 | 3,524 | | 3,524 | –3 | –3 | –9 |
| Cloud and software | 6,710 | | 6,710 | –533 | 6,177 | 5,910 | | 5,910 | 14 | 14 | 5 |
| Services | 1,131 | | 1,131 | –94 | 1,037 | 935 | | 935 | 21 | 21 | 11 |
| Total revenue | 7,841 | | 7,841 | –627 | 7,214 | 6,845 | | 6,845 | 15 | 15 | 5 |
| | | | | | | | | | | | |
| Operating Expense Numbers | | | | | | | | | | | |
| Cost of cloud | –994 | 62 | –932 | | | –788 | 58 | –730 | 26 | 28 | |
| Cost of software licenses and support | –418 | 28 | –390 | | | –454 | 25 | –430 | –8 | –9 | |
| Cost of cloud and software | –1,412 | 90 | –1,321 | | | –1,242 | 82 | –1,160 | 14 | 14 | |
| Cost of services | –854 | 81 | –773 | | | –716 | 71 | –645 | 19 | 20 | |
| Total cost of revenue | –2,266 | 172 | –2,094 | | | –1,958 | 153 | –1,805 | 16 | 16 | |
| Gross profit | 5,575 | 172 | 5,747 | | | 4,887 | 153 | 5,040 | 14 | 14 | |
| Research and development | –1,574 | 159 | –1,416 | | | –1,300 | 145 | –1,155 | 21 | 23 | |
| Sales and marketing | –2,257 | 330 | –1,927 | | | –1,845 | 267 | –1,578 | 22 | 22 | |
| General and administration | –521 | 203 | –318 | | | –576 | 302 | –274 | –9 | 16 | |
| Restructuring | 8 | –8 | 0 | | | 13 | –13 | 0 | –34 | NA | |
| Other operating income/expense, net | 8 | 0 | 8 | | | 70 | 0 | 70 | –88 | –88 | |
| Total operating expenses | –6,602 | 855 | –5,746 | 473 | –5,274 | –5,596 | 853 | –4,742 | 18 | 21 | 11 |
| | | | | | | | | | | | |
| Profit Numbers | | | | | | | | | | | |
| Operating profit (loss) | 1,239 | 855 | 2,094 | –154 | 1,940 | 1,249 | 853 | 2,102 | –1 | 0 | –8 |
| Other non-operating income/expense, net | –58 | 0 | –58 | | | 16 | 0 | 16 | <-100 | <-100 | |
| Finance income | 166 | 0 | 166 | | | 716 | 0 | 716 | –77 | –77 | |
| Finance costs | –497 | 0 | –497 | | | –233 | 0 | –233 | >100 | >100 | |
| Financial income, net | –331 | 0 | –331 | | | 484 | 0 | 484 | <-100 | <-100 | |
| Profit (loss) before tax | 850 | 855 | 1,705 | | | 1,749 | 853 | 2,602 | –51 | –34 | |
| Income tax expense | –304 | –139 | –443 | | | –331 | –142 | –474 | –8 | –7 | |
| Profit (loss) after tax | 547 | 716 | 1,263 | | | 1,418 | 711 | 2,129 | –61 | –41 | |
| Attributable to owners of parent | 669 | 634 | 1,303 | | | 1,406 | 644 | 2,050 | –52 | –36 | |
| Attributable to non-controlling interests | –123 | 82 | –41 | | | 12 | 67 | 79 | <-100 | <-100 | |
| | | | | | | | | | | | |
| Key Ratios | | | | | | | | | | | |
| Operating margin (in %) | 15.8 | | 26.7 | | 26.9 | 18.2 | | 30.7 | –2.4pp | –4.0pp | –3.8pp |
| Effective tax rate (in %)2 | 35.7 | | 26.0 | | | 18.9 | | 18.2 | 16.8pp | 7.8pp | |
| Earnings per share, basic (in €) | 0.57 | | 1.12 | | | 1.19 | | 1.74 | –52 | –36 | |
1 Constant currency period-over-period changes are calculated by comparing the current year's non-IFRS constant currency numbers with the non-IFRS numbers of the previous year's respective period.
2 The difference between our effective tax rate (IFRS) and effective tax rate (non-IFRS) in Q3 2022 and Q3 2021 mainly resulted from tax effects of share-based payment expenses and acquisition-related charges.
Due to rounding, numbers may not add up precisely.
(E.2) Reconciliation from Non-IFRS Numbers to IFRS Numbers – Year-to-Date
| € millions, unless otherwise stated | Q1–Q3 2022 | Q1–Q3 2021 | ∆ in % |
| IFRS | Adj. | Non-IFRS | Currency Impact | Non-IFRS
Constant Currency | IFRS | Adj. | Non-IFRS | IFRS | Non-IFRS | Non-IFRS Constant Currency1 |
| Revenue Numbers | | | | | | | | | | | |
| Cloud | 9,164 | | 9,164 | –671 | 8,493 | 6,806 | | 6,806 | 35 | 35 | 25 |
| Software licenses | 1,149 | | 1,149 | –64 | 1,086 | 1,790 | | 1,790 | –36 | –36 | –39 |
| Software support | 8,916 | | 8,916 | –446 | 8,470 | 8,491 | | 8,491 | 5 | 5 | 0 |
| Software licenses and support | 10,065 | | 10,065 | –509 | 9,556 | 10,281 | | 10,281 | –2 | –2 | –7 |
| Cloud and software | 19,229 | | 19,229 | –1,180 | 18,049 | 17,088 | | 17,088 | 13 | 13 | 6 |
| Services | 3,205 | | 3,205 | –202 | 3,003 | 2,774 | | 2,774 | 16 | 16 | 8 |
| Total revenue | 22,435 | | 22,435 | –1,382 | 21,053 | 19,861 | | 19,861 | 13 | 13 | 6 |
| | | | | | | | | | | | |
| Operating Expense Numbers | | | | | | | | | | | |
| Cost of cloud | –2,816 | 179 | –2,637 | | | –2,232 | 166 | –2,066 | 26 | 28 | |
| Cost of software licenses and support | –1,259 | 73 | –1,186 | | | –1,393 | 74 | –1,319 | –10 | –10 | |
| Cost of cloud and software | –4,075 | 252 | –3,823 | | | –3,625 | 240 | –3,385 | 12 | 13 | |
| Cost of services | –2,489 | 215 | –2,274 | | | –2,163 | 210 | –1,953 | 15 | 16 | |
| Total cost of revenue | –6,563 | 466 | –6,097 | | | –5,788 | 450 | –5,338 | 13 | 14 | |
| Gross profit | 15,871 | 466 | 16,338 | | | 14,073 | 450 | 14,523 | 13 | 12 | |
| Research and development | –4,544 | 442 | –4,102 | | | –3,778 | 396 | –3,382 | 20 | 21 | |
| Sales and marketing | –6,587 | 850 | –5,737 | | | –5,336 | 749 | –4,587 | 23 | 25 | |
| General and administration | –1,555 | 618 | –937 | | | –1,674 | 823 | –850 | –7 | 10 | |
| Restructuring | –111 | 111 | 0 | | | –151 | 151 | 0 | –27 | NA | |
| Other operating income/expense, net | –110 | 0 | –110 | | | 58 | 0 | 58 | <-100 | <-100 | |
| Total operating expenses | –19,470 | 2,487 | –16,983 | 1,101 | –15,882 | –16,668 | 2,569 | –14,100 | 17 | 20 | 13 |
| | | | | | | | | | | | |
| Profit Numbers | | | | | | | | | | | |
| Operating profit (loss) | 2,965 | 2,487 | 5,452 | –281 | 5,171 | 3,193 | 2,569 | 5,762 | –7 | –5 | –10 |
| Other non-operating income/expense, net | –127 | 0 | –127 | | | 45 | 0 | 45 | <-100 | <-100 | |
| Finance income | 687 | 0 | 687 | | | 2,265 | 0 | 2,265 | –70 | –70 | |
| Finance costs | –1,192 | 0 | –1,192 | | | –614 | 0 | –614 | 94 | 94 | |
| Financial income, net | –505 | 0 | –505 | | | 1,651 | 0 | 1,651 | <-100 | <-100 | |
| Profit (loss) before tax | 2,333 | 2,487 | 4,820 | | | 4,890 | 2,569 | 7,459 | –52 | –35 | |
| Income tax expense | –951 | –347 | –1,298 | | | –954 | ���442 | –1,396 | 0 | –7 | |
| Profit (loss) after tax | 1,382 | 2,140 | 3,522 | | | 3,936 | 2,126 | 6,063 | –65 | –42 | |
| Attributable to owners of parent | 1,743 | 1,866 | 3,609 | | | 3,802 | 1,955 | 5,757 | –54 | –37 | |
| Attributable to non-controlling interests | –362 | 274 | –88 | | | 134 | 171 | 306 | <-100 | <-100 | |
| | | | | | | | | | | | |
| Key Ratios | | | | | | | | | | | |
| Operating margin (in %) | 13.2 | | 24.3 | | 24.6 | 16.1 | | 29.0 | –2.9pp | –4.7pp | –4.4pp |
| Effective tax rate (in %)2 | 40.8 | | 26.9 | | | 19.5 | | 18.7 | 21.3pp | 8.2pp | |
| Earnings per share, basic (in €) | 1.49 | | 3.08 | | | 3.22 | | 4.88 | –54 | –37 | |
1 Constant-currency period-over-period changes are calculated by comparing the current year's non-IFRS constant-currency numbers with the non-IFRS number of the previous year's respective period.
2 The difference between our effective tax rate (IFRS) and effective tax rate (non-IFRS) in the first nine months of 2022 and 2021 mainly resulted from tax effects of share-based payment expenses, acquisition-related charges and restructuring expenses.
Due to rounding, numbers may not add up precisely.
(F) Non-IFRS Adjustments – Actuals and Estimates
| € millions | Estimated
Amounts for Full Year 2022 | Q1–Q3
2022 | Q3 2022 | Q1–Q3 2021 | Q3 2021 |
| Operating profit (loss) (IFRS) | | 2,965 | 1,239 | 3,193 | 1,249 |
| Adjustment for acquisition-related charges | 580–660 | 503 | 175 | 457 | 161 |
| Adjustment for share-based payment expenses | 2,500–2,700 | 1,873 | 689 | 1,961 | 705 |
| Adjustment for restructuring | 110–130 | 111 | –8 | 151 | –13 |
| Operating expense adjustments | | 2,487 | 855 | 2,569 | 853 |
| Operating profit (loss) (non-IFRS) | | 5,452 | 2,094 | 5,762 | 2,102 |
Due to rounding, numbers may not add up precisely.
(G) Non-IFRS Adjustments by Functional Areas
| € millions | Q3 2022 | Q3 2021 |
| IFRS | Acquisition-Related | SBP1 | Restruc-turing | Non-IFRS | IFRS | Acquisition-Related | SBP1 | Restruc-turing | Non-IFRS |
| Cost of cloud | –994 | 45 | 17 | 0 | –932 | –788 | 42 | 16 | 0 | –730 |
| Cost of software licenses and support | –418 | 8 | 20 | 0 | –390 | –454 | 8 | 16 | 0 | –430 |
| Cost of services | –854 | 6 | 76 | 0 | –773 | –716 | 5 | 66 | 0 | –645 |
| Research and development | –1,574 | 3 | 156 | 0 | –1,416 | –1,300 | 2 | 142 | 0 | –1,155 |
| Sales and marketing | –2,257 | 110 | 220 | 0 | –1,927 | –1,845 | 91 | 175 | 0 | –1,578 |
| General and administration | –521 | 2 | 201 | 0 | –318 | –576 | 12 | 289 | 0 | –274 |
| Restructuring | 8 | 0 | 0 | –8 | 0 | 13 | 0 | 0 | –13 | 0 |
| Other operating income/expense, net | 8 | 0 | 0 | 0 | 8 | 70 | 0 | 0 | 0 | 70 |
| Total operating expenses | –6,602 | 175 | 689 | –8 | –5,746 | –5,596 | 161 | 705 | –13 | –4,742 |
| € millions | Q1–Q3 2022 | Q1–Q3 2021 |
| IFRS | Acquisition- Related | SBP1 | Restruc-turing | Non-IFRS | IFRS | Acquisition- Related | SBP1 | Restruc-turing | Non-IFRS |
| Cost of cloud | –2,816 | 131 | 48 | 0 | –2,637 | –2,232 | 122 | 44 | 0 | –2,066 |
| Cost of software licenses and support | –1,259 | 24 | 49 | 0 | –1,186 | –1,393 | 24 | 50 | 0 | –1,319 |
| Cost of services | –2,489 | 17 | 198 | 0 | –2,274 | –2,163 | 15 | 195 | 0 | –1,953 |
| Research and development | –4,544 | 8 | 435 | 0 | –4,102 | –3,778 | 6 | 390 | 0 | –3,382 |
| Sales and marketing | –6,587 | 315 | 535 | 0 | –5,737 | –5,336 | 272 | 477 | 0 | –4,587 |
| General and administration | –1,555 | 9 | 609 | 0 | –937 | –1,674 | 18 | 805 | 0 | –850 |
| Restructuring | –111 | 0 | 0 | 111 | 0 | –151 | 0 | 0 | 151 | 0 |
| Other operating income/expense, net | –110 | 0 | 0 | 0 | –110 | 58 | 0 | 0 | 0 | 58 |
| Total operating expenses | –19,470 | 503 | 1,873 | 111 | –16,983 | –16,668 | 457 | 1,961 | 151 | –14,100 |
1 Share-based Payments
Due to rounding, numbers may not add up precisely.
If not presented in a separate line item in our income statement, the restructuring expenses would break down as follows:
| € millions | Q3 2022 | Q1–Q3 2022 | Q3 2021 | Q1–Q3 2021 |
| Cost of cloud | 7 | 20 | 5 | –125 |
| Cost of software licenses and support | 0 | –4 | 0 | –3 |
| Cost of services | 0 | –61 | 1 | –14 |
| Research and development | 1 | –6 | 1 | –10 |
| Sales and marketing | 0 | –57 | 5 | 2 |
| General and administration | 0 | –3 | 0 | –1 |
| Restructuring expenses | 8 | –111 | 13 | –151 |
Due to rounding, numbers may not add up precisely.
Disaggregations
(H) Segment Reporting
(H.1) Segment Policies and Segment Changes
SAP has two reportable segments: the Applications, Technology & Services segment and the Qualtrics segment.
In the third quarter 2022, changes to the composition of our operating segments occurred due to internal reorganizations. By bringing together product development, marketing and solutions, and go-to-market functions into two organizational units, new operating segments, the Business Network segment and the Sustainability segment, were established. Due to its size, these segments are non-reportable.
The Business Network segment combines SAP’s network offerings, covering procurement, logistics, asset management, and industry-specific solutions spanning end-to-end value chains. The segment generates revenues from cloud application subscriptions, transactional fees and services (including professional and educational services).
The Sustainability segment bundles a portfolio of sustainability-related solutions which enables SAP’s customers to record and report financial and non-financial metrics and to act on improving their Sustainability footprint across all ESG (Environmental, Social, and Governance) dimensions.
For a more detailed description of SAP’s segment reporting, see Note (C.1) “Results of Segments” of our Consolidated Half-Year Financial Statements 2022.
(H.2) Segment Reporting – Quarter
Applications, Technology & Services1
€ millions, unless otherwise stated (non-IFRS) | Q3 2022 | Q3 2021 | ∆ in % | ∆ in % |
Actual Currency | Constant Currency | Actual Currency | Actual Currency | Constant Currency |
| Cloud – SaaS2 | 2,037 | 1,849 | 1,487 | 37 | 24 |
| Cloud – PaaS3 | 389 | 360 | 254 | 53 | 42 |
| Cloud – IaaS4 | 252 | 232 | 239 | 5 | –3 |
| Cloud | 2,678 | 2,441 | 1,981 | 35 | 23 |
| Software licenses | 406 | 377 | 655 | –38 | –42 |
| Software support | 3,015 | 2,821 | 2,867 | 5 | –2 |
| Software licenses and support | 3,421 | 3,198 | 3,522 | –3 | –9 |
| Cloud and software | 6,099 | 5,639 | 5,503 | 11 | 2 |
| Services | 1,061 | 977 | 886 | 20 | 10 |
| Total segment revenue | 7,160 | 6,615 | 6,389 | 12 | 4 |
| Cost of cloud | –884 | –781 | –697 | 27 | 12 |
| Cost of software licenses and support | –407 | –379 | –399 | 2 | –5 |
| Cost of cloud and software | –1,291 | –1,161 | –1,096 | 18 | 6 |
| Cost of services | –722 | –669 | –587 | 23 | 14 |
| Total cost of revenue | –2,013 | –1,829 | –1,683 | 20 | 9 |
| Cloud gross profit – SaaS2 | 1,440 | 1,312 | 1,003 | 44 | 31 |
| Cloud gross profit – PaaS3 | 301 | 286 | 200 | 50 | 43 |
| Cloud gross profit – IaaS4 | 53 | 61 | 81 | –34 | –24 |
| Cloud gross profit | 1,794 | 1,659 | 1,284 | 40 | 29 |
| Segment gross profit | 5,147 | 4,786 | 4,706 | 9 | 2 |
| Other segment expenses | –2,879 | –2,659 | –2,352 | 22 | 13 |
| Segment profit (loss) | 2,268 | 2,127 | 2,354 | –4 | –10 |
| SAP S/4 HANA | | | | | |
| SAP S/4HANA Cloud revenue | 546 | 501 | 276 | 98 | 81 |
| SAP S/4HANA Current cloud backlog | 2,662 | 2,438 | 1,283 | >100 | 90 |
| Margins | | | | | |
| Cloud gross margin – SaaS2 (in %) | 70.7 | 71.0 | 67.4 | 3.2pp | 3.5pp |
| Cloud gross margin – PaaS3 (in %) | 77.4 | 79.4 | 78.8 | –1.4pp | 0.6pp |
| Cloud gross margin – IaaS4 (in %) | 21.0 | 26.4 | 33.7 | –12.7pp | –7.3pp |
| Cloud gross margin (in %) | 67.0 | 68.0 | 64.8 | 2.2pp | 3.2pp |
| Segment gross margin (in %) | 71.9 | 72.3 | 73.7 | –1.8pp | –1.3pp |
| Segment margin (in %) | 31.7 | 32.1 | 36.8 | –5.2pp | –4.7pp |
Due to rounding, numbers may not add up precisely.
1 Segment information for comparative prior periods were restated to conform with the new segment composition.
2 Software as a service
3 Platform as a service
4 Infrastructure as a service
Qualtrics
€ millions, unless otherwise stated (non-IFRS) | Q3 2022 | Q3 2021 | ∆ in % | ∆ in % |
Actual Currency | Constant Currency | Actual Currency | Actual Currency | Constant Currency |
| Cloud – SaaS1 | 322 | 277 | 189 | 70 | 47 |
| Cloud and software | 322 | 277 | 189 | 70 | 47 |
| Services | 62 | 53 | 43 | 44 | 23 |
| Total segment revenue | 384 | 330 | 233 | 65 | 42 |
| Cost of cloud | –36 | –31 | –16 | >100 | 97 |
| Cost of cloud and software | –36 | –31 | –16 | >100 | 97 |
| Cost of services | –51 | –44 | –29 | 75 | 52 |
| Total cost of revenue | –86 | –75 | –45 | 92 | 68 |
| Cloud gross profit – SaaS1 | 286 | 246 | 173 | 65 | 42 |
| Segment gross profit | 298 | 255 | 188 | 59 | 36 |
| Other segment expenses | –263 | –219 | –174 | 51 | 26 |
| Segment profit (loss) | 34 | 36 | 14 | >100 | >100 |
| Margins | | | | | |
| Cloud gross margin – SaaS1 (in %) | 88.9 | 88.7 | 91.6 | –2.7pp | –2.9pp |
| Segment gross margin (in %) | 77.5 | 77.2 | 80.7 | –3.2pp | –3.5pp |
| Segment margin (in %) | 9.0 | 10.9 | 5.9 | 3.1pp | 5.0pp |
Due to rounding, numbers may not add up precisely.
1 Software as a service
Reconciliation of Cloud Revenues and Margins – Quarter
€ millions, unless otherwise stated (Non-IFRS) | Q3 2022 | Q3 2021 | ∆ in % |
| Actual currency | Currency Impact | Constant Currency | Actual currency | Actual currency | Constant Currency4 |
| Cloud revenue – SaaS1 | 2,621 | –259 | 2,361 | 1,879 | 39 | 26 |
| Cloud revenue – PaaS2 | 415 | –30 | 385 | 267 | 56 | 44 |
| Cloud revenue – IaaS3 | 252 | –21 | 232 | 239 | 5 | –3 |
| Cloud revenue | 3,288 | –310 | 2,978 | 2,386 | 38 | 25 |
| Cloud gross margin – SaaS1 (in %) | 75.5 | | 75.4 | 72.6 | 2.9pp | 2.9pp |
| Cloud gross margin – PaaS2 (in %) | 78.3 | | 80.2 | 79.3 | –1.0pp | 0.9pp |
| Cloud gross margin – IaaS3 (in %) | 21.0 | | 26.4 | 33.7 | –12.7pp | –7.3pp |
| Cloud gross margin (in %) | 71.7 | | 72.2 | 69.4 | 2.3pp | 2.8pp |
1 Software as a service
2 Platform as a service
3 Infrastructure as a service
4 Constant currency period-over-period changes are calculated by comparing the current year's non-IFRS constant currency numbers with the non-IFRS numbers of the previous year's respective period.
As of Q1 2022, the allocation of cloud revenues and -expenses to cloud service models has been aligned to internal reporting structures. Presented 2021 comparable periods have been updated accordingly.
Due to rounding, numbers may not add up precisely.
(H.3) Segment Reporting – Year-to-Date
Applications, Technology & Services1
€ millions, unless otherwise stated (non-IFRS) | Q1–Q3 2022 | Q1–Q3 2021 | ∆ in % | ∆ in % |
Actual Currency | Constant Currency | Actual Currency | Actual Currency | Constant Currency |
| Cloud – SaaS2 | 5,658 | 5,253 | 4,282 | 32 | 23 |
| Cloud – PaaS3 | 1,064 | 1,000 | 710 | 50 | 41 |
| Cloud – IaaS4 | 751 | 704 | 682 | 10 | 3 |
| Cloud | 7,474 | 6,958 | 5,674 | 32 | 23 |
| Software licenses | 1,146 | 1,083 | 1,787 | –36 | –39 |
| Software support | 8,915 | 8,469 | 8,490 | 5 | 0 |
| Software licenses and support | 10,061 | 9,551 | 10,277 | –2 | –7 |
| Cloud and software | 17,534 | 16,509 | 15,951 | 10 | 4 |
| Services | 3,024 | 2,842 | 2,633 | 15 | 8 |
| Total segment revenue | 20,558 | 19,351 | 18,583 | 11 | 4 |
| Cost of cloud | –2,512 | –2,292 | –1,982 | 27 | 16 |
| Cost of software licenses and support | –1,216 | –1,151 | –1,231 | –1 | –6 |
| Cost of cloud and software | –3,728 | –3,444 | –3,213 | 16 | 7 |
| Cost of services | –2,098 | –1,985 | –1,801 | 16 | 10 |
| Total cost of revenue | –5,826 | –5,429 | –5,014 | 16 | 8 |
| Cloud gross profit – SaaS2 | 3,933 | 3,659 | 2,892 | 36 | 27 |
| Cloud gross profit – PaaS3 | 833 | 799 | 567 | 47 | 41 |
| Cloud gross profit – IaaS4 | 195 | 208 | 232 | –16 | –11 |
| Cloud gross profit | 4,962 | 4,665 | 3,692 | 34 | 26 |
| Segment gross profit | 14,732 | 13,922 | 13,569 | 9 | 3 |
| Other segment expenses | –8,652 | –8,121 | –6,966 | 24 | 17 |
| Segment profit (loss) | 6,080 | 5,801 | 6,603 | –8 | –12 |
| SAP S/4 HANA | | | | | |
| SAP S/4HANA Cloud revenue | 1,422 | 1,331 | 761 | 87 | 75 |
| SAP S/4HANA Current cloud backlog | 2,662 | 2,438 | 1,283 | >100 | 90 |
| Margins | | | | | |
| Cloud gross margin – SaaS2 (in %) | 69.5 | 69.7 | 67.5 | 2.0pp | 2.1pp |
| Cloud gross margin – PaaS3 (in %) | 78.3 | 79.8 | 79.9 | –1.6pp | –0.1pp |
| Cloud gross margin – IaaS4 (in %) | 26.0 | 29.5 | 34.1 | –8.1pp | –4.6pp |
| Cloud gross margin (in %) | 66.4 | 67.1 | 65.1 | 1.3pp | 2.0pp |
| Segment gross margin (in %) | 71.7 | 71.9 | 73.0 | –1.4pp | –1.1pp |
| Segment margin (in %) | 29.6 | 30.0 | 35.5 | –6.0pp | –5.6pp |
Due to rounding, numbers may not add up precisely.
1 Segment information for comparative prior periods were restated to conform with the new segment composition.
2 Software as a service
3 Platform as a service
4 Infrastructure as a service
Qualtrics
€ millions, unless otherwise stated (non-IFRS) | Q1–Q3 2022 | Q1–Q3 2021 | ∆ in % | ∆ in % |
Actual Currency | Constant Currency | Actual Currency | Actual Currency | Constant Currency |
| Cloud – SaaS1 | 870 | 777 | 523 | 67 | 49 |
| Cloud and software | 870 | 777 | 523 | 67 | 49 |
| Services | 162 | 144 | 123 | 32 | 17 |
| Total segment revenue | 1,033 | 921 | 645 | 60 | 43 |
| Cost of cloud | –95 | –86 | –42 | >100 | >100 |
| Cost of cloud and software | –95 | –86 | –42 | >100 | >100 |
| Cost of services | –133 | –119 | –86 | 54 | 39 |
| Total cost of revenue | –228 | –206 | –128 | 79 | 61 |
| Cloud gross profit – SaaS1 | 775 | 691 | 481 | 61 | 44 |
| Segment gross profit | 804 | 715 | 517 | 55 | 38 |
| Other segment expenses | –744 | –650 | –478 | 56 | 36 |
| Segment profit (loss) | 60 | 65 | 39 | 52 | 65 |
| Margins | | | | | |
| Cloud gross margin – SaaS1 (in %) | 89.0 | 88.9 | 92.1 | –3.0pp | –3.1pp |
| Segment gross margin (in %) | 77.9 | 77.7 | 80.2 | –2.3pp | –2.5pp |
| Segment margin (in %) | 5.8 | 7.1 | 6.1 | –0.3pp | 1.0pp |
Due to rounding, numbers may not add up precisely.
1 Software as a service
Reconciliation of Cloud Revenues and Margins – Year-to-Date
€ millions, unless otherwise stated (Non-IFRS) | Q1 - Q3 2022 | Q1 - Q3 2021 | ∆ in % |
| Actual currency | Currency Impact | Constant Currency | Actual currency | Actual currency | Constant Currency4 |
| Cloud revenue – SaaS1 | 7,279 | –558 | 6,721 | 5,388 | 35 | 25 |
| Cloud revenue – PaaS2 | 1,134 | –66 | 1,068 | 737 | 54 | 45 |
| Cloud revenue – IaaS3 | 752 | –47 | 705 | 682 | 10 | 3 |
| Cloud revenue | 9,164 | –671 | 8,493 | 6,806 | 35 | 25 |
| Cloud gross margin – SaaS1 (in %) | 74.7 | | 74.5 | 72.7 | 2.0pp | 1.8pp |
| Cloud gross margin – PaaS2 (in %) | 79.2 | | 80.6 | 80.2 | –1.1pp | 0.4pp |
| Cloud gross margin – IaaS3 (in %) | 26.0 | | 29.5 | 34.1 | –8.1pp | –4.5pp |
| Cloud gross margin (in %) | 71.2 | | 71.6 | 69.6 | 1.6pp | 1.9pp |
1 Software as a service
2 Platform as a service
3 Infrastructure as a service
4 Constant currency period-over-period changes are calculated by comparing the current year's non-IFRS constant currency numbers with the non-IFRS numbers of the previous year's respective period.
Due to rounding, numbers may not add up precisely.
(I) Revenue by Region (IFRS and Non-IFRS)
(I.1) Revenue by Region (IFRS and Non-IFRS) – Quarter
| € millions | Q3 2022 | Q3 2021 | ∆ in % |
| IFRS | Non-IFRS | Currency Impact | Non-IFRS Constant Currency | IFRS | Non-IFRS | IFRS | Non-IFRS | Non-IFRS Constant Currency1 |
| Cloud Revenue by Region | | | | | |
| EMEA | 1,085 | 1,085 | –44 | 1,042 | 850 | 850 | 28 | 28 | 23 |
| Americas | 1,791 | 1,791 | –247 | 1,545 | 1,228 | 1,228 | 46 | 46 | 26 |
| APJ | 411 | 411 | –19 | 392 | 308 | 308 | 34 | 34 | 27 |
| Cloud revenue | 3,288 | 3,288 | –310 | 2,978 | 2,386 | 2,386 | 38 | 38 | 25 |
| Cloud and Software Revenue by Region | | | | | |
| EMEA | 2,732 | 2,732 | –75 | 2,658 | 2,642 | 2,642 | 3 | 3 | 1 |
| Americas | 2,962 | 2,962 | –415 | 2,548 | 2,338 | 2,338 | 27 | 27 | 9 |
| APJ | 1,015 | 1,015 | –43 | 972 | 930 | 930 | 9 | 9 | 5 |
| Cloud and software revenue | 6,710 | 6,710 | –533 | 6,177 | 5,910 | 5,910 | 14 | 14 | 5 |
| Total Revenue by Region | | | | | |
| Germany | 1,086 | 1,086 | –3 | 1,083 | 1,087 | 1,087 | 0 | 0 | 0 |
| Rest of EMEA | 2,091 | 2,091 | –84 | 2,007 | 1,956 | 1,956 | 7 | 7 | 3 |
| Total EMEA | 3,178 | 3,178 | –88 | 3,090 | 3,043 | 3,043 | 4 | 4 | 2 |
| United States | 2,862 | 2,862 | –402 | 2,459 | 2,224 | 2,224 | 29 | 29 | 11 |
| Rest of Americas | 644 | 644 | –87 | 557 | 518 | 518 | 24 | 24 | 7 |
| Total Americas | 3,506 | 3,506 | –490 | 3,016 | 2,742 | 2,742 | 28 | 28 | 10 |
| Japan | 314 | 314 | 21 | 336 | 324 | 324 | –3 | –3 | 4 |
| Rest of APJ | 843 | 843 | –71 | 772 | 735 | 735 | 15 | 15 | 5 |
| Total APJ | 1,157 | 1,157 | –50 | 1,108 | 1,059 | 1,059 | 9 | 9 | 5 |
| Total revenue | 7,841 | 7,841 | –627 | 7,214 | 6,845 | 6,845 | 15 | 15 | 5 |
1) Constant currency period-over-period changes are calculated by comparing the current year's non-IFRS constant currency numbers with the non-IFRS numbers of the previous year's respective period.
Due to rounding, numbers may not add up precisely.
(I.2) Revenue by Region (IFRS and Non-IFRS) – Year-to-Date
| € millions | Q1–Q3 2022 | Q1–Q3 2021 | ∆ in % |
| IFRS | Non-IFRS | Currency Impact | Non-IFRS Constant Currency | IFRS | Non-IFRS | IFRS | Non-IFRS | Non-IFRS Constant Currency1 |
| Cloud Revenue by Region | | | | | |
| EMEA | 3,121 | 3,121 | –101 | 3,021 | 2,397 | 2,397 | 30 | 30 | 26 |
| Americas | 4,885 | 4,885 | –529 | 4,356 | 3,519 | 3,519 | 39 | 39 | 24 |
| APJ | 1,158 | 1,158 | –41 | 1,116 | 890 | 890 | 30 | 30 | 25 |
| Cloud revenue | 9,164 | 9,164 | –671 | 8,493 | 6,806 | 6,806 | 35 | 35 | 25 |
| Cloud and Software Revenue by Region | | | | | |
| EMEA | 8,087 | 8,087 | –174 | 7,913 | 7,692 | 7,692 | 5 | 5 | 3 |
| Americas | 8,228 | 8,228 | –903 | 7,325 | 6,674 | 6,674 | 23 | 23 | 10 |
| APJ | 2,914 | 2,914 | –103 | 2,811 | 2,722 | 2,722 | 7 | 7 | 3 |
| Cloud and software revenue | 19,229 | 19,229 | –1,180 | 18,049 | 17,088 | 17,088 | 13 | 13 | 6 |
| Total Revenue by Region | | | | | |
| Germany | 3,215 | 3,215 | –6 | 3,209 | 3,044 | 3,044 | 6 | 6 | 5 |
| Rest of EMEA | 6,202 | 6,202 | –198 | 6,004 | 5,854 | 5,854 | 6 | 6 | 3 |
| Total EMEA | 9,417 | 9,417 | –204 | 9,213 | 8,898 | 8,898 | 6 | 6 | 4 |
| United States | 7,889 | 7,889 | –859 | 7,031 | 6,390 | 6,390 | 23 | 23 | 10 |
| Rest of Americas | 1,805 | 1,805 | –202 | 1,603 | 1,492 | 1,492 | 21 | 21 | 7 |
| Total Americas | 9,694 | 9,694 | –1,061 | 8,633 | 7,882 | 7,882 | 23 | 23 | 10 |
| Japan | 927 | 927 | 41 | 968 | 952 | 952 | –3 | –3 | 2 |
| Rest of APJ | 2,396 | 2,396 | –157 | 2,239 | 2,129 | 2,129 | 13 | 13 | 5 |
| Total APJ | 3,323 | 3,323 | –117 | 3,207 | 3,081 | 3,081 | 8 | 8 | 4 |
| Total revenue | 22,435 | 22,435 | –1,382 | 21,053 | 19,861 | 19,861 | 13 | 13 | 6 |
1 Constant-currency period-over-period changes are calculated by comparing the current year's non-IFRS constant-currency numbers with the non-IFRS number of the previous year's respective period.
Due to rounding, numbers may not add up precisely.
| (J) | Employees by Region and Functional Areas |
| Full-time equivalents | 9/30/2022 | 9/30/2021 |
| | EMEA | Americas | APJ | Total | EMEA | Americas | APJ | Total |
| Cloud and software | 5,795 | 4,646 | 5,333 | 15,774 | 6,037 | 4,536 | 5,154 | 15,726 |
| Services | 8,302 | 5,518 | 5,961 | 19,781 | 8,138 | 5,582 | 6,038 | 19,758 |
| Research and development | 16,418 | 6,544 | 11,166 | 34,129 | 14,769 | 6,103 | 10,330 | 31,202 |
| Sales and marketing | 12,211 | 12,660 | 5,882 | 30,752 | 10,852 | 11,047 | 5,149 | 27,048 |
| General and administration | 3,498 | 2,259 | 1,294 | 7,050 | 3,310 | 2,130 | 1,158 | 6,598 |
| Infrastructure | 2,810 | 1,432 | 904 | 5,147 | 2,590 | 1,289 | 805 | 4,683 |
| SAP Group (9/30) | 49,033 | 33,059 | 30,540 | 112,632 | 45,696 | 30,685 | 28,634 | 105,015 |
| Thereof acquisitions1 | 188 | 214 | 8 | 410 | 390 | 63 | 45 | 498 |
| SAP Group (nine months' end average) | 48,181 | 32,591 | 29,804 | 110,576 | 45,006 | 30,422 | 28,187 | 103,616 |
1 Acquisitions closed between January 1 and September 30 of the respective year |
Other Disclosures
In the third quarter of 2022, finance income mainly consisted of gains from disposals and fair value adjustments of equity securities totaling €91 million (Q3/2021: €704 million) and €554 million in the first nine months of 2022 (Q1-Q3/2021: €2,219 million), and interest income from loans and receivables, other financial assets (cash, cash equivalents, and current investments) as well as from derivatives amounting to €61 million in the third quarter of 2022 (Q3/2021: €18 million) and €127 million in the first nine months of 2022 (Q1-Q3/2021: €50 million).
In the third quarter of 2022, finance costs were primarily impacted by losses from disposals and fair value adjustments of equity securities amounting to €397 million (Q3/2021: €171 million) and €940 million in the first nine months of 2022 (Q1-Q3/2021: €399 million), and interest expense on financial liabilities including lease liabilities and negative effects from derivatives amounting to €67 million in the third quarter of 2022 (Q3/2021: €50 million) and €165 million in the first nine months of 2022 (Q1-Q3/2021: €159 million).
In the third quarter of 2022, the Executive Board proposed, and the Supervisory Board consented to, the financing of a new Sapphire Ventures fund (“SAPPHIRE Ventures Fund VII”). SAP’s total volume committed for SAPPHIRE Ventures Fund VII is US$1.25 billion.
Taulia
On January 27, 2022, SAP announced its intent to acquire a majority stake of Taulia, a leading provider of working capital management solutions. The acquisition closed on March 9, 2022, following satisfaction of customary closing conditions and regulatory approvals; the operating results and assets and liabilities are reflected in our consolidated financial statements starting on that date. The acquisition is expected to further expand SAP’s business network capabilities and strengthen SAP’s solutions for the CFO office. Consideration transferred amounted to €0.7 billion.
In the third quarter of 2022, the contribution of Taulia to revenue was approx. €18 million, to operating profit approx. -€13 million (IFRS) and approx. -€4 million (Non-IFRS).
We are still in the process of identifying and measuring the Taulia opening balance sheet assets and liabilities. Thus, the accounting for the Taulia acquisition is incomplete. This relates primarily to intangible assets and tax assets and liabilities but also to the accounting for the supply chain financing transactions offered by Taulia. The supply chain financing related assets and liabilities are included in SAP’s consolidated “Trade and other receivables” as well as current “Financial liabilities” (September 30, 2022: approximately €3.4 billion each). In general, the funds received by Taulia from the banks participating in the financing transactions as investors are classified as “cash flow from financing activities” and the cash routed through Taulia upon settlement of the receivables subject to supply chain financing on the maturity date are classified as “cash flow from investing activities”.
Starting in 2022, most of the granted share units under the Move SAP plan will vest after a waiting period of six months and ratably thereafter for ten quarters. Under our previous policy, we serviced obligations arising from the plan with cash payments, but we have since decided to settle future share units predominantly in shares.
In the first nine months of 2022, we granted 17.5 million (first nine months of 2021: 11.7 million) share units. This includes 14.9 million (first nine months of 2021: 0) share units which we intend to settle in shares. In the first nine months of 2022 we delivered 2.1 million treasury shares (first nine months of 2021: 0) to settle share units. The dilutive effect of outstanding equity-settled share units is reflected in the calculation of earnings per share, diluted.
Obligations from outstanding share units granted before 2022 under the Move SAP plan will continue to be settled in cash and the settlement methods of SAP’s other plans remain unchanged.
Under the Own SAP plan, employees can purchase, on a monthly basis, SAP shares without any required holding period. As part of SAP’s 50th anniversary celebration SAP's contribution was doubled from 40% to 80% from January to March 2022. The number of shares purchased by our employees under this plan was 6.9 million in the first nine months of 2022 (first nine month of 2021: 4.3 million).
During the third quarter the stock price of Qualtrics International Inc. further declined compared to the second quarter. We closely monitor the impairment risks and potential triggering events for the Qualtrics segment. While we note the decline of the stock price as one aspect in our holistic assessment, we did not evaluate it to be the sole indicator that could imply a triggering event.
Share price fluctuations will be closely monitored and assessed continuously until year-end.