Exhibit 99.1

SAP Announces Q4 and FY 2022 Results
| ● | All financial outlook metrics met in FY 2022 |
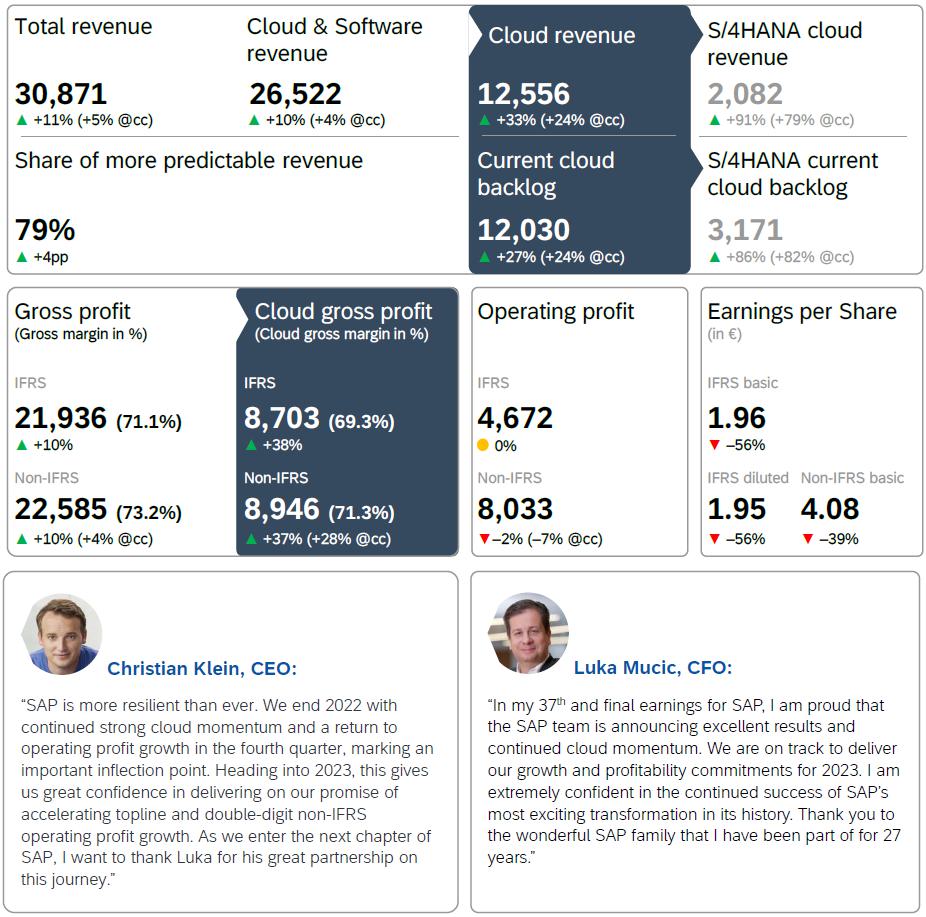
| ● | Cloud revenue up 33% and up 24% at constant currencies in FY 2022. Q4 S/4HANA cloud revenue further accelerates, up 101% and up 90% at constant currencies |
| ● | Current cloud backlog exceeds €12 billion, up 27% and up 24% at constant currencies |
| ● | IFRS cloud gross profit up 38%, non-IFRS cloud gross profit up 37% and up 28% at constant currencies in FY 2022 |
| ● | IFRS operating profit flat, non-IFRS operating profit down 2% and down 7% at constant currencies in FY 2022. Q4 IFRS operating profit up 17%, non-IFRS operating profit up 5% and up 2% at constant currencies |
| ● | 2023 outlook anticipates accelerating topline and double-digit non-IFRS operating profit growth |
| ● | Targeted restructuring in 2023 reflects focus on strategic growth areas and accelerated cloud transformation |
| ● | SAP has decided to explore a sale of its stake in Qualtrics |
FY 2022 | in € millions, unless otherwise stated
Walldorf, Germany – January 26, 2023.
SAP SE (NYSE: SAP) today announced its financial results for the fourth quarter and fiscal year ended December 31, 2022. |
|  | Financial Performance |
| Group results at a glance – Fourth quarter 2022 |
| | IFRS | | Non-IFRS1 |
| € million, unless otherwise stated | Q4 2022 | Q4 2021 | ∆ in % | | Q4 2022 | Q4 2021 | ∆ in % | ∆ in %
const.
curr. |
| Cloud revenue | 3,392 | 2,611 | 30 | | 3,392 | 2,611 | 30 | 22 |
| Software licenses | 907 | 1,458 | –38 | | 907 | 1,458 | –38 | –39 |
| Software support | 2,993 | 2,920 | 3 | | 2,993 | 2,920 | 3 | –1 |
| Software licenses and support revenue | 3,900 | 4,379 | –11 | | 3,900 | 4,379 | –11 | –14 |
| Cloud and software revenue | 7,292 | 6,990 | 4 | | 7,292 | 6,990 | 4 | 0 |
| Total revenue | 8,436 | 7,981 | 6 | | 8,436 | 7,981 | 6 | 1 |
| Share of more predictable revenue (in %) | 76 | 69 | 6pp | | 76 | 69 | 6pp | |
| Operating profit (loss) | 1,707 | 1,463 | 17 | | 2,581 | 2,468 | 5 | 2 |
| Profit (loss) after tax | 332 | 1,440 | –77 | | 1,028 | 2,274 | –55 | |
| Earnings per share - Basic (in €) | 0.47 | 1.23 | –62 | | 1.00 | 1.85 | –46 | |
| Earnings per share - Diluted (in €) | 0.47 | 1.23 | –62 | | | | | |
| Net cash flows from operating activities | 2,048 | 1,269 | 61 | | | | | |
| Free cash flow | | | | | 1,805 | 916 | 97 | |
| Number of employees (FTE, December 31) | 111,961 | 107,415 | 4 | | | | | |
1 For a breakdown of the individual adjustments see table “Non-IFRS Adjustments by Functional Areas” in this Quarterly Statement.
Due to rounding, numbers may not add up precisely.
| Group results at a glance – Full year 2022 |
| | IFRS | | Non-IFRS1 |
| € million, unless otherwise stated | Q1–Q4 2022 | Q1–Q4 2021 | ∆ in % | | Q1–Q4 2022 | Q1–Q4 2021 | ∆ in % | ∆ in %
const.
curr. |
| Cloud revenue | 12,556 | 9,418 | 33 | | 12,556 | 9,418 | 33 | 24 |
| Software licenses | 2,056 | 3,248 | –37 | | 2,056 | 3,248 | –37 | –39 |
| Software support | 11,909 | 11,412 | 4 | | 11,909 | 11,412 | 4 | 0 |
| Software licenses and support revenue | 13,965 | 14,660 | –5 | | 13,965 | 14,660 | –5 | –9 |
| Cloud and software revenue | 26,522 | 24,078 | 10 | | 26,522 | 24,078 | 10 | 4 |
| Total revenue | 30,871 | 27,842 | 11 | | 30,871 | 27,842 | 11 | 5 |
| Share of more predictable revenue (in %) | 79 | 75 | 4pp | | 79 | 75 | 4pp | |
| Operating profit (loss) | 4,672 | 4,656 | 0 | | 8,033 | 8,230 | –2 | –7 |
| Profit (loss) after tax | 1,714 | 5,376 | –68 | | 4,549 | 8,337 | –45 | |
| Earnings per share - Basic (in €) | 1.96 | 4.46 | –56 | | 4.08 | 6.73 | –39 | |
| Earnings per share - Diluted (in €) | 1.95 | 4.46 | –56 | | | | | |
| Net cash flows from operating activities | 5,646 | 6,223 | –9 | | | | | |
| Free cash flow | | | | | 4,348 | 5,049 | –14 | |
| Number of employees (FTE, December 31) | 111,961 | 107,415 | 4 | | | | | |
1 For a breakdown of the individual adjustments see table “Non-IFRS Adjustments by Functional Areas” in this Quarterly Statement.
Due to rounding, numbers may not add up precisely.
|  | Financial Highlights1 |
Fourth Quarter 2022
In the fourth quarter, cloud revenue was up 30% to €3.39 billion and up 22% at constant currencies. SAP S/4HANA cloud revenue further accelerated and was up 101% to €0.66 billion and up 90% at constant currencies.
Software licenses revenue was down 38% to €0.91 billion and down 39% at constant currencies. Cloud and software revenue was up 4% to €7.29 billion and flat at constant currencies. Services revenue was up 15% to €1.14 billion and up 10% at constant currencies. Total revenue was up 6% to €8.44 billion and up 1% at constant currencies.
The share of more predictable revenue increased by 6 percentage points to 76% in the fourth quarter.
Cloud gross profit was up 36% (IFRS), up 34% (non-IFRS) and up 27% (non-IFRS at constant currencies). Cloud gross margin was up 2.9 percentage points to 69.4% (IFRS), up 2.3 percentage points to 71.3% (non-IFRS) and up 2.7 percentage points to 71.6% (non-IFRS at constant currencies). This increase was driven by expanding gross margins across all cloud business models, with efficiency gains overcompensating increased investments into our next generation cloud delivery program.
IFRS operating profit increased 17% to €1.71 billion and IFRS operating margin increased by 1.9 percentage points to 20.2%. Non-IFRS operating profit was up 5% to €2.58 billion and up 2% at constant currencies. Non-IFRS operating margin decreased by 0.3 percentage points to 30.6% and was up 0.3 percentage points to 31.2% at constant currencies. The increase in profitability was supported by disciplined spend management in the fourth quarter. In addition, IFRS operating profit included a disposal gain of €175 million and non-IFRS operating profit of €109 million related to the sale of the SAP Litmos business.
IFRS earnings per share decreased 62% to €0.47 and non-IFRS earnings per share decreased 46% to €1.00. The year-over-year decline of earnings per share reflects a contribution to financial income by Sapphire Ventures that, mainly due to market conditions, was significantly lower than in the same period last year. The effective tax rate was 56.3% (IFRS) and 37.0% (non-IFRS). The year-over-year increase mainly resulted from changes in tax-exempt income related to Sapphire Ventures, which were partly compensated by changes in non-deductible expenses in IFRS.
Full Year 2022
SAP met all of its financial outlook metrics as follows:
| | Actual 2021 | Revised 2022 Outlook
(as of October 25) | Actual 2022 |
| Cloud revenue (at constant currencies) | €9.42 billion | €11.55 – 11.85 billion | €11.68 billion |
| Cloud and software revenue (at constant currencies) | €24.08 billion | €25.0 – 25.5 billion | €25.02 billion |
| Operating profit (non-IFRS, at constant currencies) | €8.23 billion | €7.6 – 7.9 billion | €7.68 billion |
| Share of more predictable revenue | 75% | approx. 78% | 79% |
| Free cash flow | €5.05 billion | approx. €4.5 billion | €4.35 billion |
| Effective tax rate (IFRS) | 21.5% | around 45.0% | 44.6% |
| Effective tax rate (non-IFRS) | 20.0% | around 30.0% | 29.5% |
At year end, current cloud backlog expanded to €12.03 billion, growing by 27% and 24% at constant currencies. Current cloud backlog growth was negatively impacted by approximately 1.5 percentage points from the divestiture of our Litmos business and the wind down of our business operations in Russia and Belarus. SAP S/4HANA current cloud backlog was up 86% to €3.17 billion and up 82% at constant currencies.
As of December 31, total cloud backlog – which is defined as the contractually committed cloud revenue we expect to recognize in future periods – was up 35% to €34.2 billion.
1 The Q4 and full-year 2022 results were also impacted by other effects. For details, please refer to the disclosures on page 32 of this document.
For the full year, cloud revenue was up 33% to €12.56 billion and up 24% at constant currencies, driven by double-digit growth across the SaaS and PaaS portfolio. SAP S/4HANA cloud revenue was up 91% to €2.08 billion and up 79% at constant currencies.
Software licenses revenue was down 37% to €2.06 billion and down 39% at constant currencies. Despite lower software licenses revenue, cloud and software revenue was up 10% to €26.52 billion and up 4% at constant currencies. Services revenue was up 16% to €4.35 billion and up 9% at constant currencies. Total revenue was up 11% to €30.87 billion and up 5% at constant currencies.
The share of more predictable revenue increased by 4 percentage points year over year to 79% for the full year 2022.
Cloud gross profit was up 38% (IFRS), 37% (non-IFRS) and 28% (non-IFRS at constant currencies). Cloud gross margin was up 2.3 percentage points to 69.3% (IFRS), up 1.8 percentage points to 71.3% (non-IFRS) and up 2.1 percentage points to 71.6% (non-IFRS at constant currencies). This 2.1 percentage point increase was driven by expanding gross margins across all cloud business models, with efficiency gains overcompensating increased investments into the next generation cloud delivery program.
IFRS operating profit was flat at €4.67 billion and IFRS operating margin decreased by 1.6 percentage points to 15.1%. Non-IFRS operating profit decreased 2% to €8.03 billion and decreased 7% at constant currencies and non-IFRS operating margin decreased by 3.5 percentage points to 26.0% and was down 3.2 percentage points to 26.4% at constant currencies. Operating profit performance was impacted by the decision to wind down business operations in Russia and Belarus, and a reduced contribution from software licenses revenue as well as accelerated investments into research and development and sales & marketing to capture current and future growth opportunities.
IFRS earnings per share decreased 56% to €1.96 and non-IFRS earnings per share decreased 39% to €4.08. The year-over-year decline of earnings per share reflects a contribution to financial income by Sapphire Ventures that, due to market conditions faced throughout the year, was significantly lower than in the same period last year. Effective tax rate was 44.6% (IFRS) and 29.5% (non-IFRS). The year-over-year increase mainly resulted from changes in tax-exempt income related to Sapphire Ventures.
Free cash flow for the full year was down 14% to €4.35 billion, in line with the revised outlook of approximately €4.5 billion. This is predominantly due to lower profitability and adverse working capital impacts in other assets. While tax payments developed positively, smaller negative impacts came from share-based payments as well as capital expenditures and leasing. In addition, the increased volume of trade receivables sold in 2022 amounting to €0.8 billion versus €0.5 billion in 2021 had a positive impact on free cash flow. At year end, net debt was €2.07 billion.
Impact of War in Ukraine
In 2022, SAP’s business was impacted by the war in Ukraine and SAP’s decision to wind down its business operations in Russia and Belarus.
At the end of the fourth quarter, current cloud backlog was approximately €62 million lower due to the termination of existing cloud engagements in Russia and Belarus, reducing current cloud backlog growth by approximately half a percentage point at constant currencies. The impact on full-year IFRS operating profit was approximately €410 million (fourth quarter: €70 million) and approximately €290 million (fourth quarter: €70 million) on non-IFRS operating profit, mainly due to reduced revenues and bad debt provisions.
Other impacts due to this evolving situation are currently unknown and could potentially subject our business to materially adverse consequences should the situation escalate beyond its current scope.
Non-Financial Performance 2022
Customer Net Promoter Score (NPS) decreased 7 points year over year to 3 in 2022, achieving the lower end of the revised outlook range.
SAP’s Employee Engagement Index decreased 3 percentage points to 80%, reflecting a continued high level of engagement at the low end of the revised outlook range. SAP’s retention rate was 92.3%, closely aligning with 2021 at 92.8%. The proportion of women in management increased to 29.4%, an increase of 1.1 percentage points year over year. In the fourth quarter, the Company also reached 35% of women in the workforce.
Net carbon emissions continued to decrease, at 95 kilotons in 2022, down 15 kt year over year. This result is at the upper end of the revised outlook range.
|  | Business Highlights |
In the fourth quarter, customers around the globe continued to choose “RISE with SAP” to drive their end-to-end business transformations. These customers included Al-Futtaim Group, City of Vancouver, ExxonMobil, Fujitsu Limited, German Football Association (DFB), Imperial Brands, Kanton Aargau, Lockheed Martin, Merck KGaA, Munich Leukemia Laboratory (MLL), Lenovo, Lumen Technologies, Natuzzi, PETRONAS, Port of Rotterdam, Renault Group, Swarovski, Warsteiner Brauerei, and ZF Friedrichshafen AG. Accenture, Canon Production Printing, Daimler Truck AG, Ducati Motor Holding, Mahindra Group, Walgreens Boots Alliance, and Zespri went live on SAP S/4HANA Cloud in the fourth quarter. Key customer wins across SAP’s solution portfolio included: ArcelorMittal Europe, C6 Bank, Caixabank Tech, Euronews, Groupe SEB, Groupe TF1, Fressnapf, Haier, Hisense, Macquarie Banking and Financial Services, NBA, DOUGLAS, Qualcomm, Robert Bosch, SCOTT Sports, Soriana, Technical University of Munich, Transport for London, VINCI ENERGIES. In the fourth quarter, SAP’s cloud revenue performance was strong across all regions. Brazil, Germany and Japan had outstanding cloud revenue performances while China, India, the Netherlands, Switzerland, and the United States were particularly strong.
For the full year, Germany, the United States, and Japan all had outstanding performances while Brazil, Chile, China, Italy, Saudi Arabia, South Korea, and Switzerland were particularly strong. On November 15, 2022, SAP launched SAP Build which enables business users to integrate systems; intelligently monitor, analyze and automate processes; and build applications using SAP BTP and business application data from SAP – all without moving data to an external system. In addition, SAP also announced a partnership with Coursera to empower a new generation of developers. On December 1, SAP announced that Francisco Partners had completed the acquisition of SAP’s Litmos business. On December 5, SAP and PwC announced a new co-innovation strategy to make sustainability an integral part of standard business operations to help organizations achieve their ESG and net zero target. Among other recognitions, in the fourth quarter SAP was: ● named a Leader in 2022 Gartner® Magic Quadrant™ for Configure, Price, and Quote Application Suites2 ● named a Leader in Forrester Wave™: Digital Operations Platforms for Manufacturing & Distribution in Q3 2022 ● recognized as a Leader in IDC MarketScape: Worldwide Holistic Supply Chain Planning 2022 Vendor Assessment3 As of January 1, 2023, SAP maintained its position as an industry leader in the software industry in the S&P Global Corporate Sustainability Assessment for the 16th consecutive year. On January 18, SAP was named one of the 100 most sustainable companies in the world, joining the Corporate Knights Global 100 once again. On January 25, BMW Group chose RISE with SAP together with additional cloud solutions from SAP to support their transformation to S/4HANA as well as their strategic cloud transformation. Further, through a Platinum Partnership, BMW and SAP are creating a joint approach for the entire automotive industry and related digital end-to-end processes. |
| | |
2 Gartner does not endorse any vendor, product or service depicted in its research publications, and does not advise technology users to select only those vendors with the highest ratings or other designation. Gartner research publications consist of the opinions of Gartner’s research organization and should not be construed as statements of fact. Gartner disclaims all warranties, expressed or implied, with respect to this research, including any warranties of merchantability or fitness for a particular purpose. Gartner and Magic Quadrant are registered trademarks and service marks of Gartner, Inc. and/or its affiliates in the U.S. and internationally and is used herein with permission. All rights reserved. The Gartner content described herein, (the "Gartner Content") represent(s) research opinion or viewpoints published, as part of a syndicated subscription service, by Gartner, Inc. ("Gartner"), and are not representations of fact. Gartner Content speaks as of its original publication date (and not as of the date of this Quarterly Statement) and the opinions expressed in the Gartner Content are subject to change without notice.
3 IDC MarketScape: Worldwide Holistic Supply Chain Planning, September 2022, IDC #US49578717
SAP is not responsible for the content of third-party research reports.
Segment Results at a Glance
SAP’s two reportable segments showed the following performance:
| Applications, Technology & Services1 | Q4 2022 | Q1-Q4 2022 |
€ million, unless otherwise stated (Non-IFRS) | Actual Currency | ∆ in % | ∆ in % Constant
Currency | Actual Currency | ∆ in % | ∆ in % Constant
Currency |
| SaaS2 | 2,137 | 31 | 23 | 7,848 | 33 | 24 |
| PaaS3 | 423 | 50 | 43 | 1,487 | 50 | 41 |
| IaaS4 | 205 | –16 | –19 | 905 | –2 | –8 |
| Cloud revenue | 2,765 | 28 | 21 | 10,239 | 31 | 22 |
| Segment revenue | 7,741 | 4 | –1 | 28,298 | 9 | 3 |
| Segment profit (loss) | 2,734 | 2 | –1 | 8,812 | –5 | –9 |
| SaaS2 (in %) | 67.8 | 0.3pp | –0.0pp | 68.6 | 1.1pp | 1.1pp |
| PaaS3 (in %) | 79.5 | 1.6pp | 2.3pp | 78.6 | –0.7pp | 0.5pp |
| IaaS4 (in %) | 27.9 | 1.3pp | 9.7pp | 27.8 | –4.3pp | 0.5pp |
| Cloud gross margin (in %) | 66.6 | 2.4pp | 2.8pp | 66.5 | 1.6pp | 2.2pp |
| Segment margin (in %) | 35.3 | –0.6pp | –0.0pp | 31.1 | –4.5pp | –4.0pp |
1 Segment information for comparative prior periods were restated to conform with the new segment composition. 2 Software as a service 3 Platform as a service 4 Infrastructure as a service |
In the fourth quarter, segment revenue in AT&S was up 4% to €7.74 billion year-over-year, down 1% at constant currencies, primarily due to strong cloud revenue growth, supported by SAP S/4HANA as well as Business Technology Platform. Software licenses revenue decreased due to the shift to the cloud as more customers chose our ‘RISE with SAP’ offering. Segment support revenue was up 2% to €2.99 billion year-over-year and down 1% at constant currencies.
| |
| Qualtrics | Q4 2022 | Q1-Q4 2022 |
€ million, unless otherwise stated (Non-IFRS) | Actual Currency | ∆ in % | ∆ in % Constant
Currency | Actual Currency | ∆ in % | ∆ in % Constant
Currency |
| Cloud revenue – SaaS2 | 328 | 40 | 25 | 1,198 | 58 | 41 |
| Segment revenue | 389 | 37 | 22 | 1,423 | 53 | 37 |
| Segment profit (loss) | 34 | >100 | >100 | 95 | >100 | >100 |
| Cloud gross margin – SaaS2 (in %) | 88.6 | –1.6pp | –1.7pp | 88.9 | –2.6pp | –2.7pp |
| Segment margin (in %) | 8.7 | 7.1pp | 9.3pp | 6.7 | 1.9pp | 3.4pp |
Qualtrics segment revenue was up 37% to €389 million year-over-year, up 22% at constant currencies in the fourth quarter. The continued strong growth was driven by robust renewal rates and expansions.
| | Q4 2022 | Q1 - Q4 2022 |
€ millions, unless otherwise stated (non-IFRS) | Actual
currency | ∆ in % | ∆ in %
Constant
currency | Actual
currency | ∆ in % | ∆ in %
Constant
currency |
| Current Cloud Backlog | | | | | | |
| Total | 12,030 | 27 | 24 | 12,030 | 27 | 24 |
| Thereof SAP S/4HANA | 3,171 | 86 | 82 | 3,171 | 86 | 82 |
| Cloud Revenue | | | | | | |
| SaaS1 | 2,735 | 32 | 24 | 10,066 | 35 | 25 |
| PaaS2 | 452 | 51 | 44 | 1,586 | 53 | 45 |
| IaaS3 | 205 | –16 | –19 | 905 | –2 | –8 |
| Total | 3,392 | 30 | 22 | 12,556 | 33 | 24 |
| Thereof SAP S/4HANA | 660 | 101 | 90 | 2,082 | 91 | 79 |
| Thereof Qualtrics | 328 | 40 | 25 | 1,198 | 58 | 41 |
| Cloud Gross Profit | | | | | | |
| SaaS1 | 2,000 | 33 | 24 | 7,435 | 37 | 27 |
| PaaS2 | 363 | 55 | 49 | 1,260 | 53 | 46 |
| IaaS3 | 57 | –11 | 11 | 252 | –15 | –6 |
| Total | 2,420 | 34 | 27 | 8,946 | 37 | 28 |
| Thereof Qualtrics | 291 | 37 | 23 | 1,065 | 54 | 37 |
| Cloud Gross Margin (in %) | | | | | | |
| SaaS1 (in %) | 73.1 | 0.5pp | 0.2pp | 73.9 | 1.2pp | 1.0pp |
| PaaS2 (in %) | 80.3 | 1.7pp | 2.4pp | 79.4 | –0.3pp | 0.9pp |
| IaaS3 (in %) | 28.0 | 1.3pp | 9.7pp | 27.8 | –4.3pp | 0.5pp |
| Total | 71.3 | 2.3pp | 2.7pp | 71.3 | 1.8pp | 2.1pp |
| Thereof Qualtrics | 88.6 | -1,6pp | -1,7pp | 88.9 | –2.6pp | –2.7pp |
Due to rounding, numbers may not add up precisely
The full-year 2022 results were also impacted by other effects. For details, please refer to the disclosure on page 32 of this document.
|  | Business Outlook |
Financial Outlook 2023
For the full-year 2023, SAP expects:
| ● | €15.3 – 15.7 billion cloud revenue at constant currencies (2022: €12.56 billion), up 22% to 25% at constant currencies. |
| ● | €28.2 – 28.7 billion cloud and software revenue at constant currencies (2022: €26.52 billion), up 6% to 8% at constant currencies. |
| ● | €8.8 – 9.1 billion non-IFRS operating profit at constant currencies (2022: €8.03 billion), up 10% to 13% at constant currencies. |
| ● | The share of more predictable revenue (defined as the total of cloud revenue and software support revenue divided by total revenue) is expected to reach approximately 83% (2022: 79%). |
| ● | Free cash flow of approximately €5.0 billion (2022: €4.35 billion). |
| ● | A full-year effective tax rate (IFRS) of 28.0% to 32.0% (2022: 44.6%) and an effective tax rate (non-IFRS) of 26.0% to 28.0% (2022: 29.5%), strongly depending on the development of Sapphire Ventures’ investments. |
While SAP’s full-year 2023 business outlook is at constant currencies, actual currency reported figures are expected to be impacted by currency exchange rate fluctuations as the Company progresses through the year. See the table below.
Currency Impact Assuming December 2022 Rates Apply for 2023
| In percentage points | Q1 2023 | FY 2023 |
| Cloud revenue growth | +2pp to +4pp | 0pp to –2pp |
| Cloud and software revenue growth | +1pp to +3pp | 0pp to –2pp |
| Operating profit growth (non-IFRS) | 0pp to –2pp | –1pp to –3pp |
Non-Financial Outlook 2023
SAP is focusing on three non-financial indicators: customer loyalty, employee engagement, and carbon emissions.
In 2023, SAP expects:
| ● | a Customer Net Promoter Score of 8 to 124. |
| ● | an Employee Engagement Index to be in a range of 76% to 80%. |
| ● | Net carbon emissions of 0kt, meaning the Company will be carbon neutral in its own operations. |
Ambition 2025
By 2025, SAP continues to expect:
| ● | More than €22 billion cloud revenue. |
| ● | More than €36 billion total revenue. |
| ● | More than €11.5 billion non-IFRS operating profit. |
| ● | A non-IFRS cloud gross margin of approximately 80%. |
| ● | A significant expansion of the Company’s more predictable revenue share to approximately 85%. |
| ● | A free cash flow of approximately €8 billion. |
SAP expects to update its mid-term ambition in the first half of 2023.
For 2025 non-financial performance SAP continues to aim for:
| ● | Employee Engagement Index between 84% and 86%. |
| ● | Steadily increasing the Customer Net Promoter Score through 2025. |
| ● | Maintaining net carbon emissions in our own operations of 0 kt. Further, SAP is also committed to achieving net-zero along our value chain by 2030. |
Increased Focus on Strategic Growth Areas and Accelerated Cloud Transformation
In 2023, SAP will conduct a targeted restructuring program in selected areas of the company. The purpose is to further focus on strategic growth areas by aligning our operating models and go-to-market approach with our accelerated cloud transformation. Furthermore, SAP intends to strengthen its core business and improve overall process efficiency. The program is expected to affect approximately 2.5% of SAP’s employees. The vast majority of the €250 million to €300 million restructuring costs associated with the program is expected to be recognized in the first quarter 2023, impacting IFRS operating profit. The program is expected to provide a moderate cost benefit in 2023 and €300 million to €350 million in annual cost savings as of 2024, impacting both IFRS and Non-IFRS operating profit which will help to fuel investments into strategic growth areas. The expected cost savings and reinvestments are fully reflected in SAP’s financial outlook for 2023 and 2025 ambitions.
4 The guidance is based on an adjusted methodology for 2023 to better reflect the business priorities of the company. The baseline for 2022 calculated using the new methodology is 7.
SAP to Explore a Sale of its Stake in Qualtrics
In line with SAP’s strategic initiative to streamline its portfolio, SAP has decided to explore a sale of its stake in Qualtrics.
This would be a continuation of the strategy we set at the time of the Qualtrics IPO in 2021. SAP believes that this potential transaction could unlock significant value for both companies and their shareholders: for SAP, to focus more on its core cloud growth and profitability; for Qualtrics, to extend its leadership in the XM category that it pioneered.
Since the acquisition, Qualtrics has increased revenue by 3.5x to ~ $1.5 billion while delivering profitability, and has significantly expanded its offerings and enterprise customer adoption. In the event of a successful transaction, SAP intends to remain a go-to-market and technology partner, servicing its joint customers and contributing to its growth and category leadership.
A final decision on any transaction, its conditions and timing is subject to market conditions, agreement on acceptable terms, regulatory approvals and the approval of the SAP SE Supervisory Board. SAP has retained Morgan Stanley as financial advisor to assist in the exploration of the sale of its stake in Qualtrics.
 | Additional Information |
This press release and all information therein is preliminary and unaudited.
New consensus provider
As of February 1st, 2023, Visible Alpha will replace VARA Research as new consensus provider. Analysts and Investors will be able to access the official consensus for SAP SE directly on our website by using the following link: https://www.sap.com/investors/consensus
The consensus estimates published by VARA Research are no longer used for official consensus measurements.
SAP Annual General Meeting of Shareholders
The Annual General Meeting of Shareholders will take place on May 11, 2023, as a physical event in the SAP Arena in Mannheim, Germany. The whole event will be webcast on the Company’s website and online voting options will be available. Further details will be published at https://www.sap.com/agm in early April.
SAP Performance Measures
For more information about our key growth metrics and performance measures, their calculation, their usefulness, and their limitation, please refer to the following document on our Investor Relations website: https://www.sap.com/investors/performance-measures
Webcast
SAP senior management will host a press conference on Thursday, January 26th at 10:00 AM (CET) / 9:00 AM (GMT) / 4:00 AM (Eastern) / 1:00 AM (Pacific), followed by a financial analyst conference call at 2:00 PM (CET) / 1:00 PM (GMT) / 8:00 AM (Eastern) / 5:00 AM (Pacific). Both conferences will be webcast on the Company’s website at https://www.sap.com/investor and will be available for replay. Supplementary financial information pertaining to the full-year and quarterly results can be found at https://www.sap.com/investor.
About SAP
SAP’s strategy is to help every business run as an intelligent enterprise. As a market leader in enterprise application software, we help companies of all sizes and in all industries run at their best: SAP customers generate 87% of total global commerce. Our machine learning, Internet of Things (IoT), and advanced analytics technologies help turn customers’ businesses into intelligent enterprises. SAP helps give people and organizations deep business insight and fosters collaboration that helps them stay ahead of their competition. We simplify technology for companies so they can consume our software the way they want – without disruption. Our end-to-end suite of applications and services enables business and public customers across 25 industries globally to operate profitably, adapt continuously, and make a difference. With a global network of customers, partners, employees, and thought leaders, SAP helps the world run better and improve people’s lives. For more information, visit www.sap.com.
For more information, financial community only:
| Anthony Coletta | +49 (6227) 7-60437 | investor@sap.com, CET |
| Follow SAP Investor Relations on Twitter at @sapinvestor. |
For more information, press only:
| Joellen Perry | +1 (650) 445-6780 | joellen.perry@sap.com, PT |
| Daniel Reinhardt | +49 (6227) 7-40201 | daniel.reinhardt@sap.com, CET |
For customers interested in learning more about SAP products:
| Global Customer Center: | +49 180 534-34-24 | |
| United States Only: | +1 (800) 872-1SAP (+1-800-872-1727) |
Note to editors:
To preview and download broadcast-standard stock footage and press photos digitally, please visit www.sap.com/photos. On this platform, you can find high resolution material for your media channels. To view video stories on diverse topics, visit www.sap-tv.com. From this site, you can embed videos into your own Web pages, share video via email links, and subscribe to RSS feeds from SAP TV.
This document contains forward-looking statements, which are predictions, projections, or other statements about future events. These statements are based on current expectations, forecasts, and assumptions that are subject to risks and uncertainties that could cause actual results and outcomes to materially differ. Additional information regarding these risks and uncertainties may be found in our filings with the Securities and Exchange Commission, including but not limited to the risk factors section of SAP’s 2021 Annual Report on Form 20-F.
© 2023 SAP SE. All rights reserved.
SAP and other SAP products and services mentioned herein as well as their respective logos are trademarks or registered trademarks of SAP SE in Germany and other countries. Please see https://www.sap.com/copyright for additional trademark information and notices.
Contents
Financial and Non-Financial Key Facts
(IFRS and Non-IFRS)
| € millions, unless otherwise stated | Q1 2021 | Q2 2021 | Q3 2021 | Q4 2021 | TY 2021 | Q1 2022 | Q2 2022 | Q3 2022 | Q4 2022 | TY 2022 |
| Revenues | | | | | | | | | | |
| Cloud | 2,145 | 2,276 | 2,386 | 2,611 | 9,418 | 2,820 | 3,056 | 3,288 | 3,392 | 12,556 |
| % change – yoy | 7 | 11 | 20 | 28 | 17 | 31 | 34 | 38 | 30 | 33 |
| % change constant currency – yoy | 13 | 17 | 20 | 24 | 19 | 25 | 24 | 25 | 22 | 24 |
| SAP S/4HANA Cloud | 227 | 257 | 276 | 329 | 1,090 | 404 | 472 | 546 | 660 | 2,082 |
| % change – yoy | 36 | 33 | 46 | 65 | 46 | 78 | 84 | 98 | 101 | 91 |
| % change constant currency – yoy | 43 | 39 | 46 | 61 | 47 | 71 | 72 | 81 | 90 | 79 |
| Software licenses | 483 | 650 | 657 | 1,458 | 3,248 | 317 | 426 | 406 | 907 | 2,056 |
| % change – yoy | 7 | –16 | –8 | –14 | –11 | –34 | –34 | –38 | –38 | –37 |
| % change constant currency – yoy | 11 | –13 | –8 | –17 | –11 | –36 | –38 | –42 | –39 | –39 |
| Software support | 2,801 | 2,823 | 2,867 | 2,920 | 11,412 | 2,923 | 2,977 | 3,016 | 2,993 | 11,909 |
| % change – yoy | –5 | –2 | 1 | 3 | –1 | 4 | 5 | 5 | 3 | 4 |
| % change constant currency – yoy | 0 | 1 | 1 | 1 | 1 | 1 | 0 | –2 | –1 | 0 |
| Software licenses and support | 3,283 | 3,474 | 3,524 | 4,379 | 14,660 | 3,240 | 3,403 | 3,422 | 3,900 | 13,965 |
| % change – yoy | –3 | –5 | –1 | –4 | –3 | –1 | –2 | –3 | –11 | –5 |
| % change constant currency – yoy | 1 | –2 | –1 | –6 | –2 | –4 | –7 | –9 | –14 | –9 |
| Cloud and software | 5,428 | 5,750 | 5,910 | 6,990 | 24,078 | 6,060 | 6,459 | 6,710 | 7,292 | 26,522 |
| % change – yoy | 1 | 1 | 7 | 6 | 4 | 12 | 12 | 14 | 4 | 10 |
| % change constant currency – yoy | 6 | 5 | 6 | 3 | 5 | 7 | 5 | 5 | 0 | 4 |
| Total revenue | 6,348 | 6,669 | 6,845 | 7,981 | 27,842 | 7,077 | 7,517 | 7,841 | 8,436 | 30,871 |
| % change – yoy | –3 | –1 | 5 | 6 | 2 | 11 | 13 | 15 | 6 | 11 |
| % change constant currency – yoy | 2 | 3 | 5 | 3 | 3 | 7 | 5 | 5 | 1 | 5 |
| Share of more predictable revenue (in %) | 78 | 76 | 77 | 69 | 75 | 81 | 80 | 80 | 76 | 79 |
| Profits | | | | | | | | | | |
| Operating profit (loss) (IFRS) | 960 | 984 | 1,249 | 1,463 | 4,656 | 1,053 | 673 | 1,239 | 1,707 | 4,672 |
| Operating profit (loss) (non-IFRS) | 1,738 | 1,922 | 2,102 | 2,468 | 8,230 | 1,677 | 1,680 | 2,094 | 2,581 | 8,033 |
| % change | 17 | –2 | 2 | –11 | –1 | –4 | –13 | 0 | 5 | –2 |
| % change constant currency | 24 | 3 | 2 | –12 | 1 | –7 | –16 | –8 | 2 | –7 |
| Profit (loss) after tax (IFRS) | 1,070 | 1,449 | 1,418 | 1,440 | 5,376 | 632 | 203 | 547 | 332 | 1,714 |
| Profit (loss) after tax (non-IFRS) | 1,720 | 2,214 | 2,129 | 2,274 | 8,337 | 1,166 | 1,093 | 1,263 | 1,028 | 4,549 |
| % change | 70 | 59 | 1 | 12 | 28 | –32 | –51 | –41 | –55 | –45 |
| Margins | | | | | | | | | | |
| Cloud gross margin (IFRS, in %) | 67.2 | 67.5 | 67.0 | 66.6 | 67.0 | 68.2 | 69.8 | 69.8 | 69.4 | 69.3 |
| Cloud gross margin (non-IFRS, in %) | 69.5 | 70.0 | 69.4 | 69.0 | 69.5 | 70.0 | 71.9 | 71.7 | 71.3 | 71.3 |
| Software license and support gross margin (IFRS, in %) | 85.7 | 86.5 | 87.1 | 87.9 | 86.9 | 87.0 | 87.7 | 87.8 | 88.8 | 87.9 |
| Software license and support gross margin (non-IFRS, in %) | 86.3 | 87.3 | 87.8 | 88.5 | 87.6 | 87.5 | 88.5 | 88.6 | 89.6 | 88.6 |
| Cloud and software gross margin (IFRS, in %) | 78.4 | 79.0 | 79.0 | 79.9 | 79.1 | 78.2 | 79.2 | 79.0 | 79.8 | 79.1 |
| Cloud and software gross margin (non-IFRS, in %) | 79.7 | 80.5 | 80.4 | 81.2 | 80.5 | 79.4 | 80.6 | 80.3 | 81.1 | 80.4 |
| Gross margin (IFRS, in %) | 70.3 | 70.8 | 71.4 | 73.0 | 71.5 | 70.3 | 70.7 | 71.1 | 71.9 | 71.1 |
| Gross margin (non-IFRS, in %) | 72.3 | 73.4 | 73.6 | 75.1 | 73.7 | 72.0 | 73.1 | 73.3 | 74.1 | 73.2 |
| Operating margin (IFRS, in %) | 15.1 | 14.8 | 18.2 | 18.3 | 16.7 | 14.9 | 8.9 | 15.8 | 20.2 | 15.1 |
| Operating margin (non-IFRS, in %) | 27.4 | 28.8 | 30.7 | 30.9 | 29.6 | 23.7 | 22.4 | 26.7 | 30.6 | 26.0 |
| ATS segment – Cloud gross margin (in %) | 65.1 | 65.3 | 64.8 | 64.3 | 64.8 | 65.0 | 67.0 | 67.0 | 66.6 | 66.5 |
| ATS segment – Segment gross margin (in %) | 72.2 | 73.2 | 73.7 | 74.2 | 73.4 | 70.9 | 72.1 | 71.9 | 73.1 | 72.1 |
| ATS segment – Segment margin in % | 34.1 | 35.5 | 36.8 | 35.9 | 35.6 | 29.1 | 27.9 | 31.7 | 35.3 | 31.1 |
| Qualtrics segment – Cloud gross margin (in %) | 92.2 | 92.4 | 91.6 | 90.2 | 91.5 | 89.6 | 88.6 | 88.9 | 88.6 | 88.9 |
| Qualtrics segment – Segment gross margin (in %) | 79.5 | 80.3 | 80.7 | 78.1 | 79.6 | 78.9 | 77.5 | 77.5 | 77.7 | 77.9 |
| Qualtrics segment – Segment margin (in %) | 6.3 | 6.3 | 6.0 | 1.6 | 4.8 | 3.1 | 5.1 | 9.1 | 8.7 | 6.7 |
| Key Profit Ratios | | | | | | | | | | |
| Effective tax rate (IFRS, in %) | 20.0 | 19.7 | 18.9 | 26.4 | 21.5 | 33.1 | 62.2 | 35.7 | 56.3 | 44.6 |
| Effective tax rate (non-IFRS, in %) | 18.7 | 19.2 | 18.2 | 23.2 | 20.0 | 25.7 | 29.3 | 26.0 | 37.0 | 29.5 |
| € millions, unless otherwise stated | Q1 2021 | Q2 2021 | Q3 2021 | Q4 2021 | TY 2021 | Q1 2022 | Q2 2022 | Q3 2022 | Q4 2022 | TY 2022 |
| Earnings per share, basic (IFRS, in €) | 0.88 | 1.15 | 1.19 | 1.23 | 4.46 | 0.63 | 0.29 | 0.57 | 0.47 | 1.96 |
| Earnings per share, basic (non-IFRS, in €) | 1.40 | 1.75 | 1.74 | 1.85 | 6.73 | 1.00 | 0.96 | 1.12 | 1.00 | 4.08 |
| Order Entry and current cloud backlog | | | | | | | | | | |
| Current cloud backlog | 7,628 | 7,766 | 8,171 | 9,447 | 9,447 | 9,731 | 10,403 | 11,267 | 12,030 | 12,030 |
| % change – yoy | 15 | 17 | 24 | 32 | 32 | 28 | 34 | 38 | 27 | 27 |
| % change constant currency – yoy | 19 | 20 | 22 | 26 | 26 | 23 | 25 | 26 | 24 | 24 |
| SAP S/4HANA Current cloud backlog | 1,036 | 1,130 | 1,283 | 1,707 | 1,707 | 1,925 | 2,258 | 2,662 | 3,171 | 3,171 |
| % change – yoy | 39 | 45 | 60 | 84 | 84 | 86 | 100 | 108 | 86 | 86 |
| % change constant currency – yoy | 43 | 48 | 58 | 76 | 76 | 79 | 87 | 90 | 82 | 82 |
| Share of cloud orders greater than €5 million based on total cloud order entry volume (in %)3 | 25 | 29 | 38 | 45 | 41 | 41 | 48 | 44 | 50 | 48 |
| Share of cloud orders smaller than €1 million based on total cloud order entry volume (in %)3 | 45 | 38 | 35 | 27 | 28 | 31 | 28 | 24 | 20 | 25 |
| Share of on-premise orders greater than €5 million based on total software order entry volume (in %) | 23 | 22 | 31 | 24 | 25 | 40 | 33 | 28 | 29 | 31 |
| Share of on-premise orders smaller than €1 million based on total software order entry volume (in %) | 42 | 43 | 41 | 36 | 39 | 33 | 40 | 49 | 37 | 40 |
| Liquidity and Cash Flow | | | | | | | | | | |
| Net cash flows from operating activities | 3,085 | 686 | 1,183 | 1,269 | 6,223 | 2,482 | 268 | 849 | 2,048 | 5,646 |
| Capital expenditure | –153 | –191 | –202 | –255 | –800 | –221 | –235 | –281 | –136 | –874 |
| Payments of lease liabilities | –84 | –92 | –99 | –98 | –374 | –95 | –120 | –103 | –107 | –424 |
| Free cash flow | 2,848 | 403 | 881 | 916 | 5,049 | 2,165 | –86 | 464 | 1,805 | 4,348 |
| % of total revenue | 45 | 6 | 13 | 11 | 18 | 31 | –1 | 6 | 21 | 14 |
| % of profit after tax (IFRS) | 266 | 28 | 62 | 64 | 94 | 343 | –42 | 85 | 544 | 254 |
| Group liquidity | 11,573 | 8,548 | 9,375 | 11,530 | 11,530 | 11,283 | 8,256 | 8,577 | 9,693 | 9,693 |
| Financial debt (–) | –14,230 | –13,116 | –12,994 | –13,094 | –13,094 | –12,171 | –12,282 | –12,282 | –11,764 | –11,764 |
| Net debt (–) | –2,658 | –4,568 | –3,619 | –1,563 | –1,563 | –888 | –4,026 | –3,705 | –2,071 | –2,071 |
| Financial Position | | | | | | | | | | |
| Cash and cash equivalents | 10,332 | 7,764 | 7,943 | 8,898 | 8,898 | 8,942 | 7,492 | 7,316 | 9,006 | 9,006 |
| Goodwill | 29,328 | 29,020 | 29,600 | 31,089 | 31,089 | 32,168 | 33,909 | 35,696 | 33,106 | 33,106 |
| Total assets | 66,477 | 63,075 | 65,029 | 71,174 | 71,174 | 73,754 | 72,605 | 74,840 | 72,160 | 72,160 |
| Contract liabilities (current) | 6,568 | 5,958 | 4,627 | 4,431 | 4,431 | 7,630 | 6,883 | 5,487 | 5,357 | 5,357 |
| Equity ratio (total equity in % of total assets) | 52 | 54 | 57 | 58 | 58 | 58 | 59 | 62 | 59 | 59 |
| Non-Financials | | | | | | | | | | |
| Number of employees (quarter end)1 | 103,142 | 103,876 | 105,015 | 107,415 | 107,415 | 109,798 | 110,409 | 112,632 | 111,961 | 111,961 |
| Employee retention (in %, rolling 12 months) | 95.4 | 94.8 | 93.7 | 92.8 | 92.8 | 92.1 | 91.6 | 91.8 | 92.3 | 92.3 |
| Women in management (in %, quarter end) | 27.6 | 27.9 | 28.2 | 28.3 | 28.3 | 28.6 | 28.8 | 29.1 | 29.4 | 29.4 |
| Net carbon emissions2 (in kilotons) | 30 | 20 | 25 | 35 | 110 | 20 | 25 | 25 | 25 | 95 |
1 In full-time equivalents.
2 In CO2 equivalents
³ To conform to refined calculation logic prior quarters have been adjusted
Due to rounding, numbers may not add up precisely.
Primary Financial Statements of SAP Group (IFRS)
(A) Consolidated Income Statements
(A.1) Consolidated Income Statements – Quarter
| € millions, unless otherwise stated | | Q4 2022 | Q4 2021 | ∆ in % |
| Cloud | | 3,392 | 2,611 | 30 |
| Software licenses | | 907 | 1,458 | –38 |
| Software support | | 2,993 | 2,920 | 3 |
| Software licenses and support | | 3,900 | 4,379 | –11 |
| Cloud and software | | 7,292 | 6,990 | 4 |
| Services | | 1,144 | 991 | 15 |
| Total revenue | | 8,436 | 7,981 | 6 |
| | | | | |
| Cost of cloud | | –1,037 | –873 | 19 |
| Cost of software licenses and support | | –436 | –531 | –18 |
| Cost of cloud and software | | –1,473 | –1,405 | 5 |
| Cost of services | | –900 | –753 | 19 |
| Total cost of revenue | | –2,372 | –2,157 | 10 |
| Gross profit | | 6,064 | 5,823 | 4 |
| Research and development | | –1,621 | –1,412 | 15 |
| Sales and marketing | | –2,356 | –2,169 | 9 |
| General and administration | | –517 | –757 | –32 |
| Restructuring | | –27 | –6 | >100 |
| Other operating income/expense, net | | 164 | –16 | <-100 |
| Total operating expenses | | –6,729 | –6,518 | 3 |
| Operating profit (loss) | | 1,707 | 1,463 | 17 |
| | | | | |
| Other non-operating income/expense, net | | –68 | –29 | >100 |
| Finance income | | 133 | 858 | –84 |
| Finance costs | | –1,013 | –335 | >100 |
| Financial income, net | | –880 | 523 | <-100 |
| Profit (loss) before tax | | 759 | 1,958 | –61 |
| | | | | |
| Income tax expense | | –427 | –517 | –17 |
| Profit (loss) after tax | | 332 | 1,440 | –77 |
| Attributable to owners of parent | | 547 | 1,454 | –62 |
| Attributable to non-controlling interests | | –215 | –14 | >100 |
| | | | | |
| Earnings per share, basic (in €)1 | | 0.47 | 1.23 | –62 |
| Earnings per share, diluted (in €)1 | | 0.47 | 1.23 | –62 |
1 For the three months ended December 31, 2022 and 2021, the weighted average number of shares was 1,166 million (diluted 1,172 million) and 1,180 million (diluted: 1,180 million), respectively (treasury stock excluded).
Due to rounding, numbers may not add up precisely.
(A.2) Consolidated Income Statements – Year-to-Date
| € millions, unless otherwise stated | Q1–Q4 2022 | Q1–Q4 2021 | ∆ in % |
| Cloud | 12,556 | 9,418 | 33 |
| Software licenses | 2,056 | 3,248 | –37 |
| Software support | 11,909 | 11,412 | 4 |
| Software licenses and support | 13,965 | 14,660 | –5 |
| Cloud and software | 26,522 | 24,078 | 10 |
| Services | 4,350 | 3,764 | 16 |
| Total revenue | 30,871 | 27,842 | 11 |
| | | | |
| Cost of cloud | –3,853 | –3,105 | 24 |
| Cost of software licenses and support | –1,694 | –1,925 | –12 |
| Cost of cloud and software | –5,547 | –5,030 | 10 |
| Cost of services | –3,388 | –2,916 | 16 |
| Total cost of revenue | –8,936 | –7,946 | 12 |
| Gross profit | 21,936 | 19,897 | 10 |
| Research and development | –6,165 | –5,190 | 19 |
| Sales and marketing | –8,943 | –7,505 | 19 |
| General and administration | –2,072 | –2,431 | –15 |
| Restructuring | –138 | –157 | –12 |
| Other operating income/expense, net | 55 | 43 | 27 |
| Total operating expenses | –26,199 | –23,186 | 13 |
| Operating profit (loss) | 4,672 | 4,656 | 0 |
| | | | |
| Other non-operating income/expense, net | –195 | 17 | <-100 |
| Finance income | 820 | 3,123 | –74 |
| Finance costs | –2,205 | –949 | >100 |
| Financial income, net | –1,385 | 2,174 | <-100 |
| Profit (loss) before tax | 3,092 | 6,847 | –55 |
| | | | |
| Income tax expense | –1,378 | –1,471 | –6 |
| Profit (loss) after tax | 1,714 | 5,376 | –68 |
| Attributable to owners of parent | 2,290 | 5,256 | –56 |
| Attributable to non-controlling interests | –576 | 121 | <-100 |
| | | | |
| Earnings per share, basic (in €)1 | 1.96 | 4.46 | –56 |
| Earnings per share, diluted (in €)1 | 1.95 | 4.46 | –56 |
1 For the twelve months ended December 31, 2022 and 2021, the weighted average number of shares was 1,170 million (diluted: 1,175 million) and 1,180 million (diluted: 1,180 million), respectively (treasury stock excluded).
Due to rounding, numbers may not add up precisely.
(B) Consolidated Statements of Financial Position
| as at 12/31/2022 and 12/31/2021 |
| € millions | 2022 | 2021 |
| Cash and cash equivalents | 9,006 | 8,898 |
| Other financial assets | 856 | 2,758 |
| Trade and other receivables | 6,258 | 6,352 |
| Other non-financial assets | 2,152 | 1,633 |
| Tax assets | 297 | 403 |
| Total current assets | 18,570 | 20,044 |
| Goodwill | 33,106 | 31,089 |
| Intangible assets | 3,835 | 3,965 |
| Property, plant, and equipment | 4,934 | 4,977 |
| Other financial assets | 5,626 | 6,275 |
| Trade and other receivables | 169 | 147 |
| Other non-financial assets | 3,546 | 2,628 |
| Tax assets | 324 | 263 |
| Deferred tax assets | 2,051 | 1,786 |
| Total non-current assets | 53,590 | 51,130 |
| Total assets | 72,160 | 71,174 |
| |
| € millions | 2022 | 2021 |
| Trade and other payables | 2,106 | 1,580 |
| Tax liabilities | 278 | 304 |
| Financial liabilities | 4,824 | 4,528 |
| Other non-financial liabilities | 4,799 | 5,203 |
| Provisions | 90 | 89 |
| Contract liabilities | 5,357 | 4,431 |
| Total current liabilities | 17,452 | 16,136 |
| Trade and other payables | 79 | 122 |
| Tax liabilities | 890 | 827 |
| Financial liabilities | 9,547 | 11,042 |
| Other non-financial liabilities | 705 | 860 |
| Provisions | 359 | 355 |
| Deferred tax liabilities | 242 | 296 |
| Contract liabilities | 33 | 13 |
| Total non-current liabilities | 11,856 | 13,515 |
| Total liabilities | 29,308 | 29,650 |
| Issued capital | 1,229 | 1,229 |
| Share premium | 3,080 | 1,918 |
| Retained earnings | 36,368 | 37,022 |
| Other components of equity | 3,800 | 1,756 |
| Treasury shares | –4,341 | –3,072 |
| Equity attributable to owners of parent | 40,135 | 38,852 |
| | | |
| Non-controlling interests | 2,717 | 2,670 |
| Total equity | 42,852 | 41,523 |
| Total equity and liabilities | 72,160 | 71,174 |
Due to rounding, numbers may not add up precisely.
(C) Consolidated Statements of Cash Flows
| € millions | Q1–Q4 2022 | Q1–Q4 2021 |
| Profit (loss) after tax | 1,714 | 5,376 |
| Adjustments to reconcile profit (loss) after tax to net cash flows from operating activities: | | |
| Depreciation and amortization | 1,896 | 1,775 |
| Share-based payment expense | 2,612 | 2,794 |
| Income tax expense | 1,378 | 1,471 |
| Financial income, net | 1,385 | –2,174 |
| Decrease/increase in allowances on trade receivables | 89 | –11 |
| Other adjustments for non-cash items | –174 | 39 |
| Decrease/increase in trade and other receivables | 128 | 414 |
| Decrease/increase in other assets | –1,294 | –706 |
| Increase/decrease in trade payables, provisions, and other liabilities | 120 | 475 |
| Increase/decrease in contract liabilities | 733 | 100 |
| Share-based payments | –1,182 | –1,120 |
| Interest paid | –248 | –202 |
| Interest received | 166 | 56 |
| Income taxes paid, net of refunds | –1,675 | –2,063 |
| Net cash flows from operating activities | 5,646 | 6,223 |
| Business combinations, net of cash and cash equivalents acquired | –679 | –1,142 |
| Proceeds from sales of subsidiaries or other businesses | 289 | –72 |
| Purchase of intangible assets or property, plant, and equipment | –874 | –800 |
| Proceeds from sales of intangible assets or property, plant, and equipment | 60 | 91 |
| Purchase of equity or debt instruments of other entities | –2,320 | –4,368 |
| Proceeds from sales of equity or debt instruments of other entities | 4,190 | 3,229 |
| Net cash flows from investing activities | 667 | –3,063 |
| Dividends paid | –2,865 | –2,182 |
| Dividends paid on non-controlling interests | –12 | –54 |
| Purchase of treasury shares | –1,500 | 0 |
| Proceeds from changes in ownership interests in subsidiaries that do not result in the loss of control | 33 | 2,828 |
| Payments for taxes related to net share settlement of equity awards | –282 | 0 |
| Proceeds from borrowings | 158 | 1,680 |
| Repayments of borrowings | –1,445 | –1,952 |
| Payments of lease liabilities | –424 | –374 |
| Transactions with non-controlling interests | 0 | –2 |
| Net cash flows from financing activities | –6,337 | –56 |
| Effect of foreign currency rates on cash and cash equivalents | 133 | 484 |
| Net decrease/increase in cash and cash equivalents | 108 | 3,587 |
| Cash and cash equivalents at the beginning of the period | 8,898 | 5,311 |
| Cash and cash equivalents at the end of the period | 9,006 | 8,898 |
| We do no longer show cash flows linked to the supply chain financing (SCF) transactions from Taulia in investing/financing cash flow separately. For more information see Note (L). |
| Due to rounding, numbers may not add up precisely. |
Non-IFRS Numbers
(D) Basis of Non-IFRS Presentation
We disclose certain financial measures such as revenue (non-IFRS), expense (non-IFRS), and profit measures (non-IFRS) that are not prepared in accordance with IFRS and are therefore considered non-IFRS financial measures.
For a more detailed description of all of SAP’s non-IFRS measures and their limitations as well as our constant currency and free cash flow figures, see Explanation of Non-IFRS Measures online.
(E) Reconciliation from Non-IFRS Numbers to IFRS Numbers
(E.1) Reconciliation from Non-IFRS Numbers to IFRS Numbers – Quarter
| € millions, unless otherwise stated | Q4 2022 | Q4 2021 | ∆ in % |
| IFRS | Adj. | Non-
IFRS | Currency Impact | Non-IFRS
Constant
Currency | IFRS | Adj. | Non-
IFRS | IFRS | Non-
IFRS | Non-IFRS
Constant
Currency1 |
| Revenue Numbers | | | | | | | | | | | |
| Cloud | 3,392 | | 3,392 | –203 | 3,189 | 2,611 | | 2,611 | 30 | 30 | 22 |
| Software licenses | 907 | | 907 | –20 | 886 | 1,458 | | 1,458 | –38 | –38 | –39 |
| Software support | 2,993 | | 2,993 | –99 | 2,894 | 2,920 | | 2,920 | 3 | 3 | –1 |
| Software licenses and support | 3,900 | | 3,900 | –120 | 3,780 | 4,379 | | 4,379 | –11 | –11 | –14 |
| Cloud and software | 7,292 | | 7,292 | –323 | 6,969 | 6,990 | | 6,990 | 4 | 4 | 0 |
| Services | 1,144 | | 1,144 | –56 | 1,088 | 991 | | 991 | 15 | 15 | 10 |
| Total revenue | 8,436 | | 8,436 | –379 | 8,057 | 7,981 | | 7,981 | 6 | 6 | 1 |
| | | | | | | | | | | | |
| Operating Expense Numbers | | | | | | | | | | | |
| Cost of cloud | –1,037 | 64 | –973 | | | –873 | 63 | –810 | 19 | 20 | |
| Cost of software licenses and support | –436 | 31 | –405 | | | –531 | 29 | –502 | –18 | –19 | |
| Cost of cloud and software | –1,473 | 95 | –1,378 | | | –1,405 | 92 | –1,312 | 5 | 5 | |
| Cost of services | –900 | 89 | –811 | | | –753 | 76 | –677 | 19 | 20 | |
| Total cost of revenue | –2,372 | 184 | –2,189 | | | –2,157 | 168 | –1,990 | 10 | 10 | |
| Gross profit | 6,064 | 184 | 6,248 | | | 5,823 | 168 | 5,991 | 4 | 4 | |
| Research and development | –1,621 | 193 | –1,429 | | | –1,412 | 128 | –1,285 | 15 | 11 | |
| Sales and marketing | –2,356 | 344 | –2,012 | | | –2,169 | 276 | –1,892 | 9 | 6 | |
| General and administration | –517 | 191 | –326 | | | –757 | 427 | –331 | –32 | –1 | |
| Restructuring | –27 | 27 | 0 | | | –6 | 6 | 0 | >100 | NA | |
| Other operating income/expense, net | 164 | –65 | 99 | | | –16 | 0 | –16 | <-100 | <-100 | |
| Total operating expenses | –6,729 | 873 | –5,856 | 311 | –5,545 | –6,518 | 1,005 | –5,513 | 3 | 6 | 1 |
| | | | | | | | | | | | |
| Profit Numbers | | | | | | | | | | | |
| Operating profit (loss) | 1,707 | 873 | 2,581 | –69 | 2,512 | 1,463 | 1,005 | 2,468 | 17 | 5 | 2 |
| Other non-operating income/expense, net | –68 | 0 | –68 | | | –29 | 0 | –29 | >100 | >100 | |
| Finance income | 133 | 0 | 133 | | | 858 | 0 | 858 | –84 | –84 | |
| Finance costs | –1,013 | 0 | –1,013 | | | –335 | 0 | –335 | >100 | >100 | |
| Financial income, net | –880 | 0 | –880 | | | 523 | 0 | 523 | <-100 | <-100 | |
| Profit (loss) before tax | 759 | 873 | 1,632 | | | 1,958 | 1,005 | 2,962 | –61 | –45 | |
| Income tax expense | –427 | –178 | –605 | | | –517 | –171 | –688 | –17 | –12 | |
| Profit (loss) after tax | 332 | 696 | 1,028 | | | 1,440 | 834 | 2,274 | –77 | –55 | |
| Attributable to owners of parent | 547 | 622 | 1,168 | | | 1,454 | 733 | 2,187 | –62 | –47 | |
| Attributable to non-controlling interests | –215 | 74 | –141 | | | –14 | 101 | 87 | >100 | <-100 | |
| | | | | | | | | | | | |
| Key Ratios | | | | | | | | | | | |
| Operating margin (in %) | 20.2 | | 30.6 | | 31.2 | 18.3 | | 30.9 | 1.9pp | –0.3pp | 0.3pp |
| Effective tax rate (in %)2 | 56.3 | | 37.0 | | | 26.4 | | 23.2 | 29.8pp | 13.8pp | |
| Earnings per share, basic (in €) | 0.47 | | 1.00 | | | 1.23 | | 1.85 | –62 | –46 | |
1 Constant currency period-over-period changes are calculated by comparing the current year's non-IFRS constant currency numbers with the non-IFRS numbers of the previous year's respective period.
2 The difference between our effective tax rate (IFRS) and effective tax rate (non-IFRS) in Q4 2022 and Q4 2021 mainly resulted from tax effects of share-based payment expenses and acquisition-related charges.
Due to rounding, numbers may not add up precisely.
(E.2) Reconciliation from Non-IFRS Numbers to IFRS Numbers – Year-to-Date
| € millions, unless otherwise stated | Q1–Q4 2022 | Q1–Q4 2021 | ∆ in % |
| IFRS | Adj. | Non-
IFRS | Currency Impact | Non-IFRS Constant Currency | IFRS | Adj. | Non-
IFRS | IFRS | Non-
IFRS | Non-IFRS Constant Currency1 |
| Revenue Numbers | | | | | | | | | | | |
| Cloud | 12,556 | | 12,556 | –874 | 11,682 | 9,418 | | 9,418 | 33 | 33 | 24 |
| Software licenses | 2,056 | | 2,056 | –84 | 1,972 | 3,248 | | 3,248 | –37 | –37 | –39 |
| Software support | 11,909 | | 11,909 | –545 | 11,364 | 11,412 | | 11,412 | 4 | 4 | 0 |
| Software licenses and support | 13,965 | | 13,965 | –629 | 13,336 | 14,660 | | 14,660 | –5 | –5 | –9 |
| Cloud and software | 26,522 | | 26,522 | –1,503 | 25,019 | 24,078 | | 24,078 | 10 | 10 | 4 |
| Services | 4,350 | | 4,350 | –259 | 4,091 | 3,764 | | 3,764 | 16 | 16 | 9 |
| Total revenue | 30,871 | | 30,871 | –1,762 | 29,110 | 27,842 | | 27,842 | 11 | 11 | 5 |
| | | | | | | | | | | | |
| Operating Expense Numbers | | | | | | | | | | | |
| Cost of cloud | –3,853 | 243 | –3,610 | | | –3,105 | 229 | –2,876 | 24 | 26 | |
| Cost of software licenses and support | –1,694 | 104 | –1,591 | | | –1,925 | 103 | –1,822 | –12 | –13 | |
| Cost of cloud and software | –5,547 | 347 | –5,201 | | | –5,030 | 332 | –4,698 | 10 | 11 | |
| Cost of services | –3,388 | 303 | –3,085 | | | –2,916 | 286 | –2,630 | 16 | 17 | |
| Total cost of revenue | –8,936 | 650 | –8,286 | | | –7,946 | 617 | –7,328 | 12 | 13 | |
| Gross profit | 21,936 | 650 | 22,585 | | | 19,897 | 617 | 20,514 | 10 | 10 | |
| Research and development | –6,165 | 635 | –5,530 | | | –5,190 | 524 | –4,667 | 19 | 19 | |
| Sales and marketing | –8,943 | 1,194 | –7,749 | | | –7,505 | 1,025 | –6,479 | 19 | 20 | |
| General and administration | –2,072 | 809 | –1,263 | | | –2,431 | 1,250 | –1,181 | –15 | 7 | |
| Restructuring | –138 | 138 | 0 | | | –157 | 157 | 0 | –12 | NA | |
| Other operating income/expense, net | 55 | –65 | –10 | | | 43 | 0 | 43 | 27 | <-100 | |
| Total operating expenses | –26,199 | 3,360 | –22,838 | 1,412 | –21,427 | –23,186 | 3,573 | –19,613 | 13 | 16 | 9 |
| | | | | | | | | | | | |
| Profit Numbers | | | | | | | | | | | |
| Operating profit (loss) | 4,672 | 3,360 | 8,033 | –350 | 7,683 | 4,656 | 3,573 | 8,230 | 0 | –2 | –7 |
| Other non-operating income/expense, net | –195 | 0 | –195 | | | 17 | 0 | 17 | <-100 | <-100 | |
| Finance income | 820 | 0 | 820 | | | 3,123 | 0 | 3,123 | –74 | –74 | |
| Finance costs | –2,205 | 0 | –2,205 | | | –949 | 0 | –949 | >100 | >100 | |
| Financial income, net | –1,385 | 0 | –1,385 | | | 2,174 | 0 | 2,174 | <-100 | <-100 | |
| Profit (loss) before tax | 3,092 | 3,360 | 6,452 | | | 6,847 | 3,573 | 10,421 | –55 | –38 | |
| Income tax expense | –1,378 | –525 | –1,903 | | | –1,471 | –613 | –2,084 | –6 | –9 | |
| Profit (loss) after tax | 1,714 | 2,835 | 4,549 | | | 5,376 | 2,960 | 8,337 | –68 | –45 | |
| Attributable to owners of parent | 2,290 | 2,488 | 4,778 | | | 5,256 | 2,687 | 7,943 | –56 | –40 | |
| Attributable to non-controlling interests | –576 | 348 | –229 | | | 121 | 273 | 394 | <-100 | <-100 | |
| | | | | | | | | | | | |
| Key Ratios | | | | | | | | | | | |
| Operating margin (in %) | 15.1 | | 26.0 | | 26.4 | 16.7 | | 29.6 | –1.6pp | –3.5pp | –3.2pp |
| Effective tax rate (in %)2 | 44.6 | | 29.5 | | | 21.5 | | 20.0 | 23.1pp | 9.5pp | |
| Earnings per share, basic (in €) | 1.96 | | 4.08 | | | 4.46 | | 6.73 | –56 | –39 | |
1 Constant-currency period-over-period changes are calculated by comparing the current year's non-IFRS constant-currency numbers with the non-IFRS number of the previous year's respective period.
2 The difference between our effective tax rate (IFRS) and effective tax rate (non-IFRS) in 2022 and 2021 mainly resulted from tax effects of share-based payment expenses, acquisition-related charges and restructuring expenses.
Due to rounding, numbers may not add up precisely.
(F) Non-IFRS Adjustments – Actuals and Estimates
| € millions | Estimated
Amounts for Full Year 2023 | Q1–Q4
2022 | Q4 2022 | Q1–Q4 2021 | Q4 2021 |
| Operating profit (loss) (IFRS) | | 4,672 | 1,707 | 4,656 | 1,463 |
| Adjustment for acquisition-related charges | 580–660 | 610 | 107 | 622 | 166 |
| Adjustment for share-based payment expenses | 2,550–2,850 | 2,612 | 739 | 2,794 | 833 |
| Adjustment for restructuring | 250–300 | 138 | 27 | 157 | 6 |
| Operating expense adjustments | | 3,360 | 873 | 3,573 | 1,005 |
| Operating profit (loss) (non-IFRS) | | 8,033 | 2,581 | 8,230 | 2,468 |
Due to rounding, numbers may not add up precisely.
(G) Non-IFRS Adjustments by Functional Areas
| € millions | Q4 2022 | Q4 2021 |
| IFRS | Acquisition-
Related | SBP1 | Restruc-
turing | Non-IFRS | IFRS | Acquisition- Related | SBP1 | Restruc-
turing | Non-IFRS |
| Cost of cloud | –1,037 | 44 | 20 | 0 | –973 | –873 | 47 | 16 | 0 | –810 |
| Cost of software licenses and support | –436 | 10 | 20 | 0 | –405 | –531 | 9 | 20 | 0 | –502 |
| Cost of services | –900 | 5 | 83 | 0 | –811 | –753 | 5 | 71 | 0 | –677 |
| Research and development | –1,621 | 3 | 190 | 0 | –1,429 | –1,412 | 4 | 123 | 0 | –1,285 |
| Sales and marketing | –2,356 | 107 | 237 | 0 | –2,012 | –2,169 | 98 | 178 | 0 | –1,892 |
| General and administration | –517 | 2 | 189 | 0 | –326 | –757 | 2 | 424 | 0 | –331 |
| Restructuring | –27 | 0 | 0 | 27 | 0 | –6 | 0 | 0 | 6 | 0 |
| Other operating income/expense, net | 164 | –65 | 0 | 0 | 99 | –16 | 0 | 0 | 0 | –16 |
| Total operating expenses | –6,729 | 107 | 739 | 27 | –5,856 | –6,518 | 165 | 833 | 6 | –5,513 |
| € millions | Q1–Q4 2022 | Q1–Q4 2021 |
| IFRS | Acquisition- Related | SBP1 | Restruc-
turing | Non-IFRS | IFRS | Acquisition-
Related | SBP1 | Restruc-
turing | Non-IFRS |
| Cost of cloud | –3,853 | 175 | 68 | 0 | –3,610 | –3,105 | 169 | 59 | 0 | –2,876 |
| Cost of software licenses and support | –1,694 | 34 | 70 | 0 | –1,591 | –1,925 | 33 | 70 | 0 | –1,822 |
| Cost of services | –3,388 | 22 | 281 | 0 | –3,085 | –2,916 | 20 | 266 | 0 | –2,630 |
| Research and development | –6,165 | 11 | 624 | 0 | –5,530 | –5,190 | 10 | 513 | 0 | –4,667 |
| Sales and marketing | –8,943 | 423 | 772 | 0 | –7,749 | –7,505 | 370 | 655 | 0 | –6,479 |
| General and administration | –2,072 | 11 | 798 | 0 | –1,263 | –2,431 | 20 | 1,230 | 0 | –1,181 |
| Restructuring | –138 | 0 | 0 | 138 | 0 | –157 | 0 | 0 | 157 | 0 |
| Other operating income/expense, net | 55 | –65 | 0 | 0 | –10 | 43 | 0 | 0 | 0 | 43 |
| Total operating expenses | –26,199 | 610 | 2,612 | 138 | –22,838 | –23,186 | 622 | 2,794 | 157 | –19,613 |
1 Share-based Payments
Due to rounding, numbers may not add up precisely.
If not presented in a separate line item in our income statement, the restructuring expenses would break down as follows:
| € millions | Q4 2022 | Q1–Q4 2022 | Q4 2021 | Q1–Q4 2021 |
| Cost of cloud | 0 | 20 | –2 | –127 |
| Cost of software licenses and support | –5 | –9 | –2 | –5 |
| Cost of services | –9 | –70 | 1 | –13 |
| Research and development | –10 | –16 | –3 | –12 |
| Sales and marketing | –2 | –58 | 1 | 3 |
| General and administration | –2 | –4 | –1 | –2 |
| Restructuring expenses | –27 | –138 | –6 | –157 |
Due to rounding, numbers may not add up precisely.
Disaggregations
(H) Segment Reporting
(H.1) Segment Policies and Segment Changes
SAP has two reportable segments: the Applications, Technology & Services segment and the Qualtrics segment.
For a more detailed description of SAP’s segment reporting, see Note (C.1) “Results of Segments” of our Consolidated Half-Year Financial Statements 2022.
(H.2) Segment Reporting – Quarter
Applications, Technology & Services1
€ millions, unless otherwise stated (non-IFRS) | Q4 2022 | Q4 2021 | ∆ in % | ∆ in % |
Actual Currency | Constant Currency | Actual Currency | Actual Currency | Constant Currency |
| Cloud – SaaS2 | 2,137 | 2,017 | 1,635 | 31 | 23 |
| Cloud – PaaS3 | 423 | 403 | 282 | 50 | 43 |
| Cloud – IaaS4 | 205 | 197 | 243 | –16 | –19 |
| Cloud | 2,765 | 2,616 | 2,161 | 28 | 21 |
| Software licenses | 907 | 886 | 1,458 | –38 | –39 |
| Software support | 2,992 | 2,892 | 2,920 | 2 | –1 |
| Software licenses and support | 3,898 | 3,779 | 4,377 | –11 | –14 |
| Cloud and software | 6,664 | 6,395 | 6,538 | 2 | –2 |
| Services | 1,077 | 1,027 | 933 | 15 | 10 |
| Total segment revenue | 7,741 | 7,422 | 7,471 | 4 | –1 |
| Cost of cloud | –922 | –861 | –772 | 19 | 12 |
| Cost of software licenses and support | –406 | –388 | –505 | –20 | –23 |
| Cost of cloud and software | –1,329 | –1,249 | –1,277 | 4 | –2 |
| Cost of services | –750 | –716 | –648 | 16 | 10 |
| Total cost of revenue | –2,079 | –1,965 | –1,925 | 8 | 2 |
| Cloud gross profit – SaaS2 | 1,450 | 1,361 | 1,104 | 31 | 23 |
| Cloud gross profit – PaaS3 | 336 | 323 | 220 | 53 | 47 |
| Cloud gross profit – IaaS4 | 57 | 71 | 65 | –11 | 11 |
| Cloud gross profit | 1,843 | 1,755 | 1,389 | 33 | 26 |
| Segment gross profit | 5,663 | 5,457 | 5,545 | 2 | –2 |
| Other segment expenses | –2,929 | –2,796 | –2,864 | 2 | –2 |
| Segment profit (loss) | 2,734 | 2,661 | 2,681 | 2 | –1 |
| SAP S/4 HANA | | | | | |
| SAP S/4HANA Cloud revenue | 660 | 624 | 329 | >100 | 90 |
| SAP S/4HANA Current cloud backlog | 3,171 | 3,103 | 1,707 | 86 | 82 |
| Margins | | | | | |
| Cloud gross margin – SaaS2 (in %) | 67.8 | 67.5 | 67.5 | 0.3pp | –0.0pp |
| Cloud gross margin – PaaS3 (in %) | 79.5 | 80.2 | 77.9 | 1.6pp | 2.3pp |
| Cloud gross margin – IaaS4 (in %) | 27.9 | 36.3 | 26.6 | 1.3pp | 9.7pp |
| Cloud gross margin (in %) | 66.6 | 67.1 | 64.3 | 2.4pp | 2.8pp |
| Segment gross margin (in %) | 73.1 | 73.5 | 74.2 | –1.1pp | –0.7pp |
| Segment margin (in %) | 35.3 | 35.9 | 35.9 | –0.6pp | –0.0pp |
Due to rounding, numbers may not add up precisely.
1 Segment information for comparative prior periods were restated to conform with the new segment composition.
2 Software as a service
3 Platform as a service
4 Infrastructure as a service
Qualtrics
€ millions, unless otherwise stated (non-IFRS) | Q4 2022 | Q4 2021 | ∆ in % | ∆ in % |
Actual Currency | Constant Currency | Actual Currency | Actual Currency | Constant Currency |
| Cloud – SaaS1 | 328 | 294 | 235 | 40 | 25 |
| Cloud and software | 328 | 294 | 235 | 40 | 25 |
| Services | 60 | 54 | 49 | 22 | 9 |
| Total segment revenue | 389 | 348 | 284 | 37 | 22 |
| Cost of cloud | –38 | –34 | –23 | 62 | 47 |
| Cost of cloud and software | –38 | –34 | –23 | 62 | 47 |
| Cost of services | –49 | –45 | –39 | 25 | 14 |
| Total cost of revenue | –87 | –78 | –62 | 39 | 26 |
| Cloud gross profit – SaaS1 | 291 | 260 | 212 | 37 | 23 |
| Segment gross profit | 302 | 270 | 222 | 36 | 21 |
| Other segment expenses | –268 | –232 | –218 | 23 | 7 |
| Segment profit (loss) | 34 | 38 | 5 | >100 | >100 |
| Margins | | | | | |
| Cloud gross margin – SaaS1 (in %) | 88.6 | 88.5 | 90.2 | –1.6pp | –1.7pp |
| Segment gross margin (in %) | 77.7 | 77.5 | 78.1 | –0.4pp | –0.6pp |
| Segment margin (in %) | 8.7 | 10.8 | 1.6 | 7.1pp | 9.3pp |
Due to rounding, numbers may not add up precisely.
1 Software as a service
Reconciliation of Cloud Revenues and Margins – Quarter
€ millions, unless otherwise stated (Non-IFRS) | Q4 2022 | Q4 2021 | ∆ in % |
Actual currency | Currency
impact | Constant currency | Actual currency | Actual
currency | Constant currency4 |
| Cloud revenue – SaaS1 | 2,735 | –174 | 2,561 | 2,070 | 32 | 24 |
| Cloud revenue – PaaS2 | 452 | –21 | 431 | 299 | 51 | 44 |
| Cloud revenue – IaaS3 | 205 | –8 | 197 | 243 | –16 | –19 |
| Cloud revenue | 3,392 | –203 | 3,189 | 2,611 | 30 | 22 |
| Cloud gross margin – SaaS1 (in %) | 73.1 | | 72.8 | 72.6 | 0.5pp | 0.2pp |
| Cloud gross margin – PaaS2 (in %) | 80.3 | | 81.0 | 78.6 | 1.7pp | 2.4pp |
| Cloud gross margin – IaaS3 (in %) | 28.0 | | 36.3 | 26.6 | 1.3pp | 9.7pp |
| Cloud gross margin (in %) | 71.3 | | 71.6 | 69.0 | 2.3pp | 2.7pp |
1 Software as a service
2 Platform as a service
3 Infrastructure as a service
4 Constant currency period-over-period changes are calculated by comparing the current year's non-IFRS constant currency numbers with the non-IFRS numbers of the previous year's respective period.
As of Q1 2022, the allocation of cloud revenues and -expenses to cloud service models has been aligned to internal reporting structures. Presented 2021 comparable periods have been updated accordingly.
Due to rounding, numbers may not add up precisely.
(H.3) Segment Reporting – Year-to-Date
Applications, Technology & Services1
€ millions, unless otherwise stated (non-IFRS) | Q1–Q4 2022 | Q1–Q4 2021 | ∆ in % | ∆ in % |
Actual Currency | Constant Currency | Actual Currency | Actual Currency | Constant Currency |
| Cloud – SaaS2 | 7,848 | 7,318 | 5,918 | 33 | 24 |
| Cloud – PaaS3 | 1,487 | 1,403 | 992 | 50 | 41 |
| Cloud – IaaS4 | 905 | 853 | 924 | –2 | –8 |
| Cloud | 10,239 | 9,574 | 7,835 | 31 | 22 |
| Software licenses | 2,053 | 1,969 | 3,244 | –37 | –39 |
| Software support | 11,906 | 11,361 | 11,410 | 4 | 0 |
| Software licenses and support | 13,959 | 13,330 | 14,654 | –5 | –9 |
| Cloud and software | 24,199 | 22,905 | 22,488 | 8 | 2 |
| Services | 4,099 | 3,867 | 3,565 | 15 | 8 |
| Total segment revenue | 28,298 | 26,772 | 26,054 | 9 | 3 |
| Cost of cloud | –3,434 | –3,153 | –2,754 | 25 | 14 |
| Cost of software licenses and support | –1,623 | –1,540 | –1,736 | –7 | –11 |
| Cost of cloud and software | –5,057 | –4,693 | –4,490 | 13 | 5 |
| Cost of services | –2,848 | –2,701 | –2,449 | 16 | 10 |
| Total cost of revenue | –7,905 | –7,394 | –6,939 | 14 | 7 |
| Cloud gross profit – SaaS2 | 5,385 | 5,022 | 3,996 | 35 | 26 |
| Cloud gross profit – PaaS3 | 1,169 | 1,121 | 787 | 48 | 42 |
| Cloud gross profit – IaaS4 | 251 | 278 | 297 | –15 | –6 |
| Cloud gross profit | 6,805 | 6,421 | 5,080 | 34 | 26 |
| Segment gross profit | 20,393 | 19,378 | 19,114 | 7 | 1 |
| Other segment expenses | –11,581 | –10,917 | –9,830 | 18 | 11 |
| Segment profit (loss) | 8,812 | 8,461 | 9,284 | –5 | –9 |
| SAP S/4 HANA | | | | | |
| SAP S/4HANA Cloud revenue | 2,082 | 1,955 | 1,090 | 91 | 79 |
| SAP S/4HANA Current cloud backlog | 3,171 | 3,103 | 1,707 | 86 | 82 |
| Margins | | | | | |
| Cloud gross margin – SaaS2 (in %) | 68.6 | 68.6 | 67.5 | 1.1pp | 1.1pp |
| Cloud gross margin – PaaS3 (in %) | 78.6 | 79.9 | 79.3 | –0.7pp | 0.5pp |
| Cloud gross margin – IaaS4 (in %) | 27.8 | 32.6 | 32.1 | –4.3pp | 0.5pp |
| Cloud gross margin (in %) | 66.5 | 67.1 | 64.8 | 1.6pp | 2.2pp |
| Segment gross margin (in %) | 72.1 | 72.4 | 73.4 | –1.3pp | –1.0pp |
| Segment margin (in %) | 31.1 | 31.6 | 35.6 | –4.5pp | –4.0pp |
Due to rounding, numbers may not add up precisely.
1 Segment information for comparative prior periods were restated to conform with the new segment composition.
2 Software as a service
3 Platform as a service
4 Infrastructure as a service
Qualtrics
€ millions, unless otherwise stated (non-IFRS) | Q1–Q4 2022 | Q1–Q4 2021 | ∆ in % | ∆ in % |
Actual Currency | Constant Currency | Actual Currency | Actual Currency | Constant Currency |
| Cloud – SaaS1 | 1,198 | 1,071 | 757 | 58 | 41 |
| Cloud and software | 1,198 | 1,071 | 757 | 58 | 41 |
| Services | 225 | 200 | 173 | 30 | 16 |
| Total segment revenue | 1,423 | 1,271 | 930 | 53 | 37 |
| Cost of cloud | –133 | –120 | –65 | >100 | 86 |
| Cost of cloud and software | –133 | –120 | –65 | >100 | 86 |
| Cost of services | –182 | –164 | –125 | 45 | 31 |
| Total cost of revenue | –315 | –284 | –190 | 66 | 50 |
| Cloud gross profit – SaaS1 | 1,065 | 951 | 693 | 54 | 37 |
| Segment gross profit | 1,108 | 986 | 740 | 50 | 33 |
| Other segment expenses | –1,013 | –882 | –696 | 46 | 27 |
| Segment profit (loss) | 95 | 104 | 44 | >100 | >100 |
| Margins | | | | | |
| Cloud gross margin – SaaS1 (in %) | 88.9 | 88.8 | 91.5 | –2.6pp | –2.7pp |
| Segment gross margin (in %) | 77.9 | 77.6 | 79.6 | –1.7pp | –1.9pp |
| Segment margin (in %) | 6.7 | 8.2 | 4.8 | 1.9pp | 3.4pp |
Due to rounding, numbers may not add up precisely.
1 Software as a service
Reconciliation of Cloud Revenues and Margins – Year-to-Date
€ millions, unless otherwise stated (Non-IFRS) | Q1 - Q4 2022 | Q1 - Q4 2021 | ∆ in % |
Actual
currency | Currency
impact | Constant
currency | Actual currency | Actual
currency | Constant
currency4 |
| Cloud revenue – SaaS1 | 10,066 | –735 | 9,330 | 7,458 | 35 | 25 |
| Cloud revenue – PaaS2 | 1,586 | –87 | 1,499 | 1,035 | 53 | 45 |
| Cloud revenue – IaaS3 | 905 | –52 | 853 | 924 | –2 | –8 |
| Cloud revenue | 12,556 | –874 | 11,682 | 9,418 | 33 | 24 |
| Cloud gross margin – SaaS1 (in %) | 73.9 | | 73.7 | 72.7 | 1.2pp | 1.0pp |
| Cloud gross margin – PaaS2 (in %) | 79.4 | | 80.6 | 79.7 | –0.3pp | 0.9pp |
| Cloud gross margin – IaaS3 (in %) | 27.8 | | 32.6 | 32.1 | –4.3pp | 0.5pp |
| Cloud gross margin (in %) | 71.3 | | 71.6 | 69.5 | 1.8pp | 2.1pp |
1 Software as a service
2 Platform as a service
3 Infrastructure as a service
4 Constant currency period-over-period changes are calculated by comparing the current year's non-IFRS constant currency numbers with the non-IFRS numbers of the previous year's respective period.
Due to rounding, numbers may not add up precisely.
(I) Revenue by Region (IFRS and Non-IFRS)
(I.1) Revenue by Region (IFRS and Non-IFRS) – Quarter
| € millions | Q4 2022 | Q4 2021 | ∆ in % |
| Actual currency | Currency Impact | Constant Currency | Actual currency | Actual
currency | Constant Currency1 |
| Cloud Revenue by Region | | | |
| EMEA | 1,172 | –26 | 1,146 | 910 | 29 | 26 |
| Americas | 1,803 | –179 | 1,624 | 1,375 | 31 | 18 |
| APJ | 417 | 2 | 419 | 326 | 28 | 28 |
| Cloud revenue | 3,392 | –203 | 3,189 | 2,611 | 30 | 22 |
| Cloud and Software Revenue by Region | | | |
| EMEA | 3,149 | –37 | 3,112 | 3,240 | –3 | –4 |
| Americas | 3,106 | –297 | 2,809 | 2,674 | 16 | 5 |
| APJ | 1,037 | 11 | 1,048 | 1,076 | –4 | –3 |
| Cloud and software revenue | 7,292 | –323 | 6,969 | 6,990 | 4 | 0 |
| Total Revenue by Region | | | |
| Germany | 1,289 | –3 | 1,286 | 1,298 | –1 | –1 |
| Rest of EMEA | 2,374 | –43 | 2,330 | 2,392 | –1 | –3 |
| Total EMEA | 3,663 | –46 | 3,617 | 3,690 | –1 | –2 |
| United States | 2,923 | –300 | 2,623 | 2,480 | 18 | 6 |
| Rest of Americas | 679 | –46 | 633 | 607 | 12 | 4 |
| Total Americas | 3,602 | –346 | 3,256 | 3,087 | 17 | 5 |
| Japan | 315 | 33 | 347 | 349 | –10 | –1 |
| Rest of APJ | 857 | –20 | 837 | 855 | 0 | –2 |
| Total APJ | 1,171 | 13 | 1,184 | 1,204 | –3 | –2 |
| Total revenue | 8,436 | –379 | 8,057 | 7,981 | 6 | 1 |
1) Constant currency period-over-period changes are calculated by comparing the current year's non-IFRS constant currency numbers with the non-IFRS numbers of the previous year's respective period.
Due to rounding, numbers may not add up precisely.
(I.2) Revenue by Region (IFRS and Non-IFRS) – Year-to-Date
| € millions | Q1–Q4 2022 | Q1–Q4 2021 | ∆ in % |
Actual
currency | Currency Impact | Constant Currency | Actual currency | Actual currency | Constant Currency1 |
| Cloud Revenue by Region | | | |
| EMEA | 4,293 | –127 | 4,166 | 3,308 | 30 | 26 |
| Americas | 6,688 | –708 | 5,980 | 4,894 | 37 | 22 |
| APJ | 1,575 | –40 | 1,536 | 1,217 | 29 | 26 |
| Cloud revenue | 12,556 | –874 | 11,682 | 9,418 | 33 | 24 |
| Cloud and Software Revenue by Region | | | |
| EMEA | 11,236 | –212 | 11,024 | 10,931 | 3 | 1 |
| Americas | 11,334 | –1,199 | 10,135 | 9,348 | 21 | 8 |
| APJ | 3,952 | –92 | 3,860 | 3,798 | 4 | 2 |
| Cloud and software revenue | 26,522 | –1,503 | 25,019 | 24,078 | 10 | 4 |
| Total Revenue by Region | | | |
| Germany | 4,504 | –9 | 4,495 | 4,343 | 4 | 4 |
| Rest of EMEA | 8,576 | –241 | 8,334 | 8,246 | 4 | 1 |
| Total EMEA | 13,080 | –251 | 12,829 | 12,589 | 4 | 2 |
| United States | 10,812 | –1,159 | 9,653 | 8,870 | 22 | 9 |
| Rest of Americas | 2,484 | –248 | 2,236 | 2,099 | 18 | 7 |
| Total Americas | 13,297 | –1,407 | 11,889 | 10,969 | 21 | 8 |
| Japan | 1,242 | 73 | 1,315 | 1,301 | –5 | 1 |
| Rest of APJ | 3,253 | –177 | 3,076 | 2,984 | 9 | 3 |
| Total APJ | 4,495 | –104 | 4,391 | 4,285 | 5 | 2 |
| Total revenue | 30,871 | –1,762 | 29,110 | 27,842 | 11 | 5 |
1 Constant-currency period-over-period changes are calculated by comparing the current year's non-IFRS constant-currency numbers with the non-IFRS number of the previous year's respective period.
Due to rounding, numbers may not add up precisely.
(J) Employees by Region and Functional Areas
| Full-time equivalents | 12/31/2022 | 12/31/2021 |
| | EMEA | Americas | APJ | Total | EMEA | Americas | APJ | Total |
| Cloud and software | 5,672 | 4,617 | 5,247 | 15,536 | 5,947 | 4,586 | 5,113 | 15,646 |
| Services | 8,247 | 5,580 | 5,841 | 19,669 | 8,229 | 5,491 | 5,924 | 19,644 |
| Research and development | 16,606 | 6,416 | 11,100 | 34,122 | 15,347 | 6,326 | 10,571 | 32,244 |
| Sales and marketing | 12,207 | 12,511 | 5,831 | 30,548 | 11,136 | 11,598 | 5,481 | 28,215 |
| General and administration | 3,466 | 2,186 | 1,280 | 6,932 | 3,374 | 2,306 | 1,199 | 6,879 |
| Infrastructure | 2,800 | 1,440 | 914 | 5,154 | 2,609 | 1,353 | 824 | 4,786 |
| SAP Group (12/31) | 48,999 | 32,749 | 30,213 | 111,961 | 46,641 | 31,660 | 29,113 | 107,415 |
| Thereof acquisitions1 | 188 | 214 | 8 | 410 | 462 | 407 | 45 | 914 |
| SAP Group (twelve months' end average) | 48,408 | 32,668 | 29,939 | 111,015 | 45,359 | 30,651 | 28,354 | 104,364 |
1 Acquisitions closed between January 1 and December 31 of the respective year Due to rounding, numbers may not add up precisely. |
Other Disclosures
(K) Financial Income, Net
In the fourth quarter of 2022, finance income mainly consisted of gains from disposals and fair value adjustments of equity securities totaling €54 million (Q4/2021: €847 million) and €608 million in the full year 2022 (Q1-Q4/2021: €3,067 million), and interest income from loans and receivables, other financial assets (cash, cash equivalents, and current investments) as well as from derivatives amounting to €75 million in the fourth quarter of 2022 (Q4/2021: €14 million) and €202 million in the full year 2022 (Q1-Q4/2021: €64 million).
In the fourth quarter of 2022, finance costs were primarily impacted by losses from disposals and fair value adjustments of equity securities amounting to €862 million (Q4/2021: €255 million) and €1,802 million in the full year 2022 (Q1-Q4/2021: €654 million), and interest expense on financial liabilities including lease liabilities and negative effects from derivatives amounting to €111 million in the fourth quarter of 2022 (Q4/2021: €51 million) and €276 million in the full year 2022 (Q1-Q4/2021: €210 million).
In the third quarter of 2022, the Executive Board proposed, and the Supervisory Board consented to, the financing of a new Sapphire Ventures fund (“SAPPHIRE Ventures Fund VII”). SAP’s total volume committed for SAPPHIRE Ventures Fund VII is US$1.25 billion.
(L) Business Combinations and Divestitures
Taulia Acquisition
On January 27, 2022, SAP announced its intent to acquire a majority stake of Taulia, a leading provider of cloud-based working capital management solutions. The acquisition closed on March 9, 2022, following satisfaction of customary closing conditions and regulatory approvals; the operating results as well as assets and liabilities are reflected in our consolidated financial statements starting on that date. The acquisition is expected to further expand SAP’s business network capabilities and strengthen SAP’s solutions for the CFO office. Consideration transferred amounted to €705 million.
In the fourth quarter of 2022, the contribution of Taulia to revenue was approximately €19 million, to operating profit approximately -€20 million (IFRS) and approximately -€7 million (Non-IFRS).
We have completed our accounting assessment relating to the supply chain financing (SCF) transactions offered by Taulia prior to December 31, 2022. We concluded we do not control the receivables/liabilities resulting from the SCF activities (that are siloed in so called compartments/series) in terms of IFRS 10 (due to the setup of the compartments/series and the contractual/founding agreements). Thus, we are no longer including the respective items into our balance sheet and do also no longer show cash flows linked to the SCF transactions in investing/financing cash flow.
SAP Litmos Divestiture
On August 17, 2022, SAP and Francisco Partners (FP) announced that FP signed a definitive agreement with SAP America, Inc. under which FP will acquire SAP Litmos from SAP. The transaction closed on December 1, 2022, following satisfaction of applicable regulatory and other approvals. The disposal gain of €175 million (IFRS) and €109 million (non-IFRS) is included in Other operating income/expense, net.
(M) Share Based Payments
Starting in 2022, most of the granted share units under the Move SAP plan will vest after a waiting period of six months and ratably thereafter for ten quarters. Under our previous policy, we serviced obligations arising from the plan with cash payments, but we have since decided to settle future share units predominantly in shares.
In the full year 2022, we granted 18.4 million (full year 2021: 12.2 million) share units. This includes 15.6 million (full year 2021: 0) share units which we intend to settle in shares. In the full year 2022 we delivered 3.3 million treasury shares (full year 2021: 0) to settle share units. The dilutive effect of outstanding equity-settled share units is reflected in the calculation of earnings per share, diluted.
Obligations from outstanding share units granted before 2022 under the Move SAP plan will continue to be settled in cash and the settlement methods of SAP’s other plans remain unchanged.
Under the Own SAP plan, employees can purchase, on a monthly basis, SAP shares without any required holding period. As part of SAP’s 50th anniversary celebration SAP's contribution was doubled from 40% to 80% from January to March 2022. The number of shares purchased by our employees under this plan was 9.0 million in the full year 2022 (full year 2021: 5.7 million).
(N) Qualtrics Goodwill
During the fourth quarter the stock price of Qualtrics International Inc. remained on a similar level compared to the third quarter. We closely monitor the impairment risks and potential triggering events for the Qualtrics segment. While we note the decline of the stock price in 2022 as one aspect in our holistic assessment, we did not evaluate it to be the sole indicator that could imply a triggering event.
Share price fluctuations will be closely monitored and assessed continuously in future quarters.
(O) Factors impacting our Cost of Cloud
Several factors positively contributed to an increased efficiency of our cloud delivery operations in 2022. This enabled us to implement a reorganization within our customer success organization, under which cloud delivery resources were re-allocated to sales roles focused on the implementation of our LACE (land-adopt-consume-expand) strategy. This reorganization reduced the 2022 cost of cloud and as a consequence increased sales and marketing expenses by approximately €40 million.
Starting January 1, 2023, all activities related to changes in the code of our cloud and on-premise solutions will be considered development-related activities. Some of those activities, specifically code corrections, were previously considered support-related activities. This change implies an update of our cost allocation policy, resulting in an increase of the cloud gross margin by 0.5 to 1.0 percentage points and an increase of the software license and support gross margin by approximately 2 percentage points. It also implies an increase of our R&D ratio, defined as R&D expenses divided by total revenue, by approximately 1 percentage point.
We believe this update aligns our accounting policy with market standards and increases comparability to our peers.
In 2023, this adjustment is expected to decrease cost of cloud by approximately €100 million and cost of support by approximately €300 million, while in consequence increasing our R&D expense by approximately €400 million.
Had we applied this accounting policy in 2022, our cost of cloud, cost of software licenses and support and R&D expense would have been as follows:
| € millions | IFRS | Non-IFRS |
| Q1 | Q2 | Q3 | Q4 | FY 2022 | Q1 | Q2 | Q3 | Q4 | FY 2022 |
| Cost of cloud | -879 | -900 | -970 | -1,015 | -3,765 | -826 | -837 | -908 | -951 | -3,522 |
| Cost of software licenses and support | -347 | -339 | -341 | -358 | -1,385 | -333 | -316 | -319 | -334 | -1,303 |
| Research and development expenses | -1,518 | -1,649 | -1,675 | -1,721 | -6,563 | -1,413 | -1,461 | -1,511 | -1,521 | -5,906 |
| | | | | | | | | | | |
Due to rounding, numbers may not add up precisely.