Exhibit 99.1

SAP Announces Q2 2023 Results
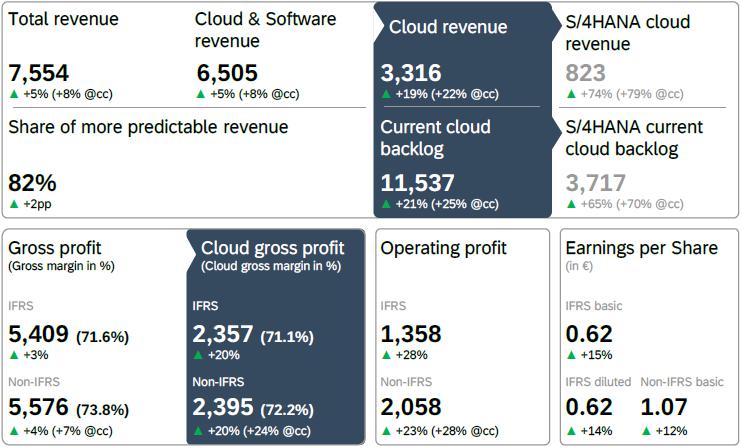
| · | Cloud revenue up 19% and up 22% at constant currencies. SAP S/4HANA cloud revenue up 74% and accelerates to 79% at constant currencies |
| · | Current cloud backlog up 21% and up 25% constant currencies |
| · | IFRS cloud gross profit up 20%, non-IFRS cloud gross profit up 20% and up 24% at constant currencies, supported by completion of SAP's next-generation cloud delivery program |
| · | IFRS operating profit up 28%, non-IFRS operating profit up 23% and up 28% at constant currencies |
| · | SAP updates its 2023 revenue and operating profit outlook |
| · | Expands market opportunity through new SAP Business AI and premium AI offerings |
in € millions, unless otherwise stated; based on SAP group results from continuing operations
 | Christian Klein, CEO: | |  | Dominik Asam, CFO: |
"This has been another strong quarter. We see significant opportunities ahead, in particular through the transformative power of AI. We are focused on delivering SAP Business AI that's relevant, reliable, and responsible and we see significant possibilities for market expansion through these technologies and new premium offerings." | | "We are very pleased with our first half results. The revenue growth and increased profitability, combined with sustained growth of our cloud backlog, demonstrate the strength of our business model. Q2 performance puts us on the right trajectory and allows us to raise our cloud and software revenue, as well as the operating profit outlook for the year." |
Walldorf, Germany – July 20, 2023.
SAP SE (NYSE: SAP) today announced its financial results for the second quarter ended June 30, 2023.
In Q1 2023, the Qualtrics consolidated group ("Qualtrics") was classified as discontinued operations under IFRS 5. Consequently, the contribution from Qualtrics is not included in the reporting of SAP's continuing operations. See section (M) Discontinued Operations. All figures in this statement are based on SAP group results from continuing operations unless otherwise noted.
 | Financial Performance |
| Group results at a glance – Second quarter 2023 |
| | IFRS | | Non-IFRS1 |
| € million, unless otherwise stated | Q2 2023 | Q2 2022 | ∆ in % | | Q2 2023 | Q2 2022 | ∆ in % | ∆ in %
const.
curr. |
| Cloud revenue | 3,316 | 2,796 | 19 | | 3,316 | 2,796 | 19 | 22 |
| Thereof SAP S/4HANA Cloud revenue | 823 | 472 | 74 | | 823 | 472 | 74 | 79 |
| Software licenses | 316 | 426 | –26 | | 316 | 426 | –26 | –24 |
| Software support | 2,873 | 2,977 | –3 | | 2,873 | 2,977 | –3 | –1 |
| Software licenses and support revenue | 3,189 | 3,403 | –6 | | 3,189 | 3,403 | –6 | –4 |
| Cloud and software revenue | 6,505 | 6,199 | 5 | | 6,505 | 6,199 | 5 | 8 |
| Total revenue | 7,554 | 7,207 | 5 | | 7,554 | 7,207 | 5 | 8 |
| Share of more predictable revenue (in %) | 82 | 80 | 2pp | | 82 | 80 | 2pp | |
| Operating profit (loss) | 1,358 | 1,060 | 28 | | 2,058 | 1,678 | 23 | 28 |
| Profit (loss) after tax from continuing operations | 724 | 613 | 18 | | 1,249 | 1,098 | 14 | |
| Profit (loss) after tax² | 3,381 | 203 | >100 | | 3,460 | 1,093 | >100 | |
| Earnings per share - Basic (in €) from continuing operations | 0.62 | 0.54 | 15 | | 1.07 | 0.95 | 12 | |
| Earnings per share - Diluted (in €) from continuing operations | 0.62 | 0.54 | 14 | | | | | |
| Earnings per share - Basic (in €)² | 2.96 | 0.29 | >100 | | 3.14 | 0.96 | >100 | |
| Earnings per share - Diluted (in €)² | 2.93 | 0.28 | >100 | | | | | |
| Net cash flows from operating activities from continuing operations | 848 | 301 | >100 | | | | | |
| Free cash flow | | | | | 604 | –10 | <–100 | |
| Number of employees (FTE, June 30) | 105,328 | 104,988 | 0 | | | | | |
1 For a breakdown of the individual adjustments see table “Non-IFRS Adjustments by Functional Areas” in this Quarterly Statement.
2 From continuing and discontinued operations.
Due to rounding, numbers may not add up precisely.
| | Group results at a glance – Six months ended June 2023 |
| | IFRS | | Non-IFRS1 |
| € million, unless otherwise stated | Q1–Q2 2023 | Q1–Q2 2022 | ∆ in % | | Q1–Q2 2023 | Q1–Q2 2022 | ∆ in % | ∆ in %
const.
curr. |
| Cloud revenue | 6,493 | 5,362 | 21 | | 6,493 | 5,362 | 21 | 22 |
| Thereof SAP S/4HANA Cloud revenue | 1,539 | 876 | 76 | | 1,539 | 876 | 76 | 77 |
| Software licenses | 591 | 743 | –20 | | 591 | 743 | –20 | –19 |
| Software support | 5,778 | 5,900 | –2 | | 5,778 | 5,900 | –2 | –1 |
| Software licenses and support revenue | 6,369 | 6,643 | –4 | | 6,369 | 6,643 | –4 | –3 |
| Cloud and software revenue | 12,863 | 12,005 | 7 | | 12,863 | 12,005 | 7 | 8 |
| Total revenue | 14,995 | 13,980 | 7 | | 14,995 | 13,980 | 7 | 8 |
| Share of more predictable revenue (in %) | 82 | 81 | 1pp | | 82 | 81 | 1pp | |
| | IFRS | | Non-IFRS1 |
| € million, unless otherwise stated | Q1–Q2 2023 | Q1–Q2 2022 | ∆ in % | | Q1–Q2 2023 | Q1–Q2 2022 | ∆ in % | ∆ in %
const.
curr. |
| Operating profit (loss) | 2,161 | 2,531 | –15 | | 3,933 | 3,354 | 17 | 20 |
| Profit (loss) after tax from continuing operations | 1,128 | 1,629 | –31 | | 2,502 | 2,269 | 10 | |
| Profit (loss) after tax2 | 3,890 | 835 | >100 | | 5,047 | 2,259 | >100 | |
| Earnings per share - Basic (in €) from continuing operations | 0.97 | 1.41 | –31 | | 2.15 | 1.96 | 10 | |
| Earnings per share - Diluted (in €) from continuing operations | 0.97 | 1.41 | –32 | | | | | |
| Earnings per share - Basic (in €)2 | 3.37 | 0.92 | >100 | | 4.41 | 1.96 | >100 | |
| Earnings per share - Diluted (in €)2 | 3.34 | 0.91 | >100 | | | | | |
| Net cash flows from operating activities from continuing operations | 3,160 | 2,766 | 14 | | | | | |
| Free cash flow | | | | | 2,559 | 2,149 | 19 | |
| Number of employees (FTE, June 30) | 105,328 | 104,988 | 0 | | | | | |
1 For a breakdown of the individual adjustments see table “Non-IFRS Adjustments by Functional Areas” in this Quarterly Statement.
2 From continuing and discontinued operations.
Due to rounding, numbers may not add up precisely.
 | Financial Highlights1 |
Second Quarter 2023
Current cloud backlog grew by 21% to €11.54 billion and was up 25% at constant currencies. SAP S/4HANA current cloud backlog was up 65% to €3.72 billion and up 70% at constant currencies.
In the second quarter, cloud revenue was up 19% to €3.32 billion and up 22% at constant currencies. SAP S/4HANA cloud revenue was up 74% to €823 million and up 79% at constant currencies.
Software licenses revenue decreased by 26% to €316 million and was down 24% at constant currencies. Cloud and software revenue was up 5% to €6.50 billion and up 8% at constant currencies. Services revenue was up 4% to €1.05 billion and up 7% at constant currencies. Total revenue was up 5% to €7.55 billion and up 8% at constant currencies.
The share of more predictable revenue increased by 2 percentage points to 82% in the second quarter.
Supported by the successful completion of the next-generation cloud delivery program, cloud gross profit was up 20% (IFRS) to €2.36 billion, up 20% to €2.40 billion (non-IFRS), and up 24% (non-IFRS at constant currencies).
IFRS operating profit increased 28% to €1.36 billion. Non-IFRS operating profit was up 23% to €2.06 billion and up 28% at constant currencies. The increase was mainly driven by cloud revenue growth, finalization of the next generation cloud delivery program, as well as efficiency gains. In addition, operating profit in the second quarter of last year was negatively impacted by SAP’s decision to wind down its business operations in Russia and Belarus. Beyond that, Q2 IFRS operating profit growth benefitted from the restructuring expenses we reported in Q2 last year. On the other hand, it was negatively affected by higher share-based compensation expenses primarily due to the share-price development over the second quarter of this year.
IFRS earnings per share (basic) increased 15% to €0.62. Non-IFRS earnings per share (basic) increased 12% to €1.07. The effective tax rate was 33.8% (IFRS) and 30.4% (non-IFRS).
Free cash flow in the second quarter increased significantly to €604 million, driven by the strong expansion of operating profit and a reduction of payments for, amongst others, share-based compensation, capex and leasing. For the first six months, free cash flow was up 19% to €2.56 billion.
Completion of Qualtrics divestiture
On June 28, SAP announced the completion of the sale of its stake in Qualtrics at a price of US$18.15 in cash per share. The closing of the transaction contributed an after-tax gain on sale of approximately €3.2 billion (IFRS) and approximately €2.6 billion (Non-IFRS) to SAP’s results. The cash inflow resulting from the purchase price was €7.1 billion (€6.4 billion net of
1 The Q2 2023 results were also impacted by other effects. For details, please refer to the disclosures on page 29 of this document.
cash and cash equivalents held by Qualtrics). All contributions from the Qualtrics divestiture are reflected in results from discontinued operations. For details, please refer to section M in other disclosures on page 30 of this document.
Completion of next-generation cloud delivery program
Early in the second quarter, SAP successfully completed the migration of its cloud customer base to its state-of-the-art, harmonized cloud infrastructure. More than 20,000 customers and half a million tenants were migrated as part of the program, which was initiated at the beginning of 2021.
 | Business Highlights |
In the second quarter, customers around the globe continued to choose “RISE with SAP” to drive their end-to-end business transformations. These customers included ARAG, Bacardi-Martini, Bayer, DFS Deutsche Flugsicherung, Empresas Polar, Foodstuffs South Island, GOL, McBride, Municipality of Utrecht, and Sochor.
ABN AMRO Bank, Cirque du Soleil, HanesBrands, Levi’s, Tech Mahindra, Versuni, went live on SAP S/4HANA Cloud in the second quarter.
The Brenda Strafford Foundation, in-tech GmbH, NKK Switches, Onyx Renewable Partners, StepLock, and Sunny Sky Products chose “GROW with SAP”, a new offering helping midsize customers adopt cloud ERP with speed, predictability and continuous innovation.
Key customer wins across SAP’s solution portfolio included: Breakthru Beverage, Deutsche Börse, Endress+Hauser InfoServe, La Poste, LB Group, Sabadell Digital, Santander, TATA Projects and Visa. Numerous customers have also gone live with SAP solutions, including: Asahi Kasei Corporation, Coca-Cola HBC, Falabella Financiero, González Byass, Fujitsu, NTT, and OMV.
In the second quarter, SAP’s cloud revenue performance was strong across all regions. Germany, Brazil and India had outstanding cloud revenue growth while the United States, the Netherlands, France, China and Chile performed particularly strong.
On April 26, 2023, SAP and HP Inc. announced an expansion of its strategic relationship as HP invested in the RISE with SAP solution to support its focus on driving digital transformation, portfolio optimization and operational efficiency. The software will provide a platform for combining hardware, software and services to deliver flexible workforce solutions.
On May 11, SAP and Google Cloud announced an extensive expansion of their partnership, introducing a comprehensive open data offering designed to simplify data landscapes and unleash the power of business data.
On May 11, SAP also announced that the Annual General Meeting of Shareholders of SAP SE elected Dr. h.c. Punit Renjen as new member of the company’s Supervisory Board and designated successor to Prof. Dr. h.c. mult. Hasso Plattner in his role as the Chairman of the Supervisory Board. In addition, Jennifer Li and Dr. Qi Lu were reelected as members of the Supervisory Board. The AGM also approved all other proposals of the Executive Board and Supervisory Board. That includes the compensation system for Executive Board members, which incorporates revisions based on shareholder feedback, and the approval to buy back treasury shares. Furthermore, the dividend proposal of €2.05 per share for fiscal year 2022 was approved.
On May 15, SAP announced the next step in its long-standing partnership with Microsoft, using the latest in enterprise-ready generative AI innovation to help solve customers’ most fundamental business challenges. The companies will collaborate on integrating SAP SuccessFactors solutions with Microsoft 365 Copilot and Copilot in Viva Learning, as well as Microsoft’s Azure OpenAI Service to access powerful language models that analyze and generate natural language.
On May 16, SAP announced a new share repurchase program with a volume of up to €5 billion. The program is scheduled to start in the second half of 2023 and is expected to be fully executed by the end of 2025.
SAP advances vision of Business Artificial Intelligence (AI)
On May 2, SAP and IBM announced that IBM Watson technology will be embedded into a broad range of SAP solutions to provide new AI-driven insights and automation to help accelerate innovation and create more efficient and effective user experiences across the SAP application portfolio.
On July 11, Sapphire Ventures announced that it is deepening its commitment to AI by investing more than US$1 billion in AI-powered enterprise technology startups, including those specializing in generative AI. The commitment builds on
Sapphire’s history of investing in and scaling enterprise AI startups and will focus on all areas of the emerging AI tech stack including foundation models, enablers and middleware, and next-gen AI applications.
On July 18, SAP announced the next step in its commitment to deliver Business AI that is relevant, reliable, and responsible with strategic direct investments in three leading generative AI companies. The investments in Aleph Alpha, Anthropic and Cohere reinforce SAP’s open ecosystem approach to AI, leveraging the best technology to embed AI across SAP’s portfolio. They build on a series of AI partnerships and enterprise use cases announced in May and complement the above-mentioned commitment from Sapphire Ventures.
| Segment Results at a Glance |
SAP’s reportable segment showed the following performance:
| Applications, Technology & Services1 | Q2 2023 |
€ million, unless otherwise stated (Non-IFRS) | Actual Currency | ∆ in % | ∆ in % Constant Currency |
| Cloud revenue – SaaS2 | 2,325 | 20 | 23 |
| Cloud revenue – PaaS3 | 521 | 42 | 45 |
| Cloud revenue – IaaS4 | 191 | –23 | –21 |
| Cloud revenue | 3,037 | 19 | 22 |
| Cloud gross profit – SaaS2 | 1,620 | 21 | 25 |
| Cloud gross profit – PaaS3 | 437 | 47 | 50 |
| Cloud gross profit – IaaS4 | 70 | –35 | –36 |
| Cloud gross profit | 2,127 | 22 | 25 |
| Segment revenue | 7,269 | 5 | 7 |
| Segment profit (loss) | 2,346 | 22 | 26 |
| Segment margin (in %) | 32.3 | 4.6pp | 4.9pp |
1 Segment information for comparative prior periods were restated to conform with the new segment composition.
2 Software as a service
3 Platform as a service
4 Infrastructure as a service
In the second quarter, segment revenue in AT&S was up 5% to €7.27 billion and up 7% at constant currencies, primarily due to rapid cloud revenue growth, which was supported by SAP S/4HANA as well as Business Technology Platform. Operating Expenses of the segment decreased by 2% and remained flat at constant currencies, resulting in a segment margin of 32.3% and 32.6% at constant currencies. This implies a growth of 4.6 percentage points and 4.9 percentage points at constant currencies compared to the second quarter of the prior year.
| | Q2 2023 | Q1–Q2 2023 |
€ millions, unless otherwise stated (non-IFRS) | Actual
Currency | ∆ in % | ∆ in %
Constant
Currency | Actual
Currency | ∆ in % | ∆ in %
Constant
Currency |
| Current Cloud Backlog | | | | | | |
| Total | 11,537 | 21 | 25 | 11,537 | 21 | 25 |
| Thereof SAP S/4HANA | 3,717 | 65 | 70 | 3,717 | 65 | 70 |
| Cloud Revenue | | | | | | |
| SaaS1 | 2,604 | 19 | 22 | 5,099 | 22 | 22 |
| PaaS2 | 521 | 42 | 45 | 1,003 | 45 | 45 |
| IaaS3 | 191 | –23 | –21 | 391 | –18 | –17 |
| Total | 3,316 | 19 | 22 | 6,493 | 21 | 22 |
| Thereof SAP S/4HANA | 823 | 74 | 79 | 1,539 | 76 | 77 |
| | Q2 2023 | Q1–Q2 2023 |
€ millions, unless otherwise stated (non-IFRS) | Actual
Currency | ∆ in % | ∆ in %
Constant
Currency | Actual
Currency | ∆ in % | ∆ in %
Constant
Currency |
| Cloud Gross Profit | | | | | | |
| SaaS1 | 1,888 | 19 | 23 | 3,675 | 22 | 23 |
| PaaS2 | 437 | 47 | 50 | 843 | 50 | 51 |
| IaaS3 | 70 | –35 | –36 | 146 | –16 | –14 |
| Total | 2,395 | 20 | 24 | 4,664 | 24 | 25 |
| Cloud Gross Margin (in %) | | | | | | |
| SaaS1 (in %) | 72.5 | –0.1pp | 0.1pp | 72.1 | 0.0pp | 0.3pp |
| PaaS2 (in %) | 83.9 | 2.6pp | 2.6pp | 84.1 | 3.1pp | 3.3pp |
| IaaS3 (in %) | 36.6 | –6.7pp | –8.1pp | 37.3 | 0.6pp | 1.2pp |
| Total | 72.2 | 1.1pp | 1.1pp | 71.8 | 1.7pp | 2.0pp |
1 Software as a service: SaaS comprises all other offerings which are not shown as PaaS and IaaS.
2 Platform as a service: PaaS primarily includes SAP Business Technology Platform and SAP Signavio.
3 Infrastructure as a service: A major portion of IaaS comes from SAP HANA Enterprise Cloud.
Due to rounding, numbers may not add up precisely.
 | Business Outlook |
Financial Outlook 2023
For 2023, SAP is updating its revenue and operating profit outlook and now expects:
| · | €14.0 – 14.2 billion cloud revenue at constant currencies (2022: €11.43 billion), up 23% to 24% at constant currencies, narrowing the range by €200 million. The previous range was €14.0 – 14.4 billion at constant currencies. |
| · | €27.0 – 27.4 billion cloud and software revenue at constant currencies (2022: €25.39 billion), up 6% to 8% at constant currencies, narrowing the range by €100 million. The previous range was €26.9 – 27.4 billion at constant currencies. |
| · | €8.65 – 8.95 billion non-IFRS operating profit at constant currencies (2022: €7.99 billion), up 8% to 12% at constant currencies, raising the operating profit outlook by €50 million. The previous range was €8.6 – 8.9 billion at constant currencies. |
SAP continues to expect:
| · | A share of more predictable revenue of approximately 82% (2022: 79%). It is defined as the total of cloud revenue and software support revenue divided by total revenue. |
| · | Free cash flow of approximately €4.9 billion (2022: €4.4 billion) |
| · | An effective tax rate (IFRS) of 28.0% to 32.0% (2022: 32.0%) and an effective tax rate (non-IFRS) of 26.0% to 28.0% (2022: 29.6%). |
While SAP’s 2023 financial outlook is at constant currencies, actual currency reported figures are expected to be impacted by currency exchange rate fluctuations as the Company progresses through the year. See the table below.
Currency Impact Assuming June 2023 Rates Apply for 2023
| In percentage points | Q3 2023 | FY 2023 |
| Cloud revenue growth | –7pp to –5pp | –4pp to –2pp |
| Cloud and software revenue growth | –6pp to –4pp | –3.5pp to –1.5pp |
| Operating profit growth (non-IFRS) | –6.5pp to –4.5pp | –4.5pp to –2.5pp |
Non-Financial Outlook 2023
SAP continues to focus on three non-financial indicators: customer loyalty, employee engagement, and carbon emissions.
In 2023, SAP continues to expect:
| · | a Customer Net Promoter Score of 8 to 122. |
| · | an Employee Engagement Index to be in a range of 76% to 80%. |
| · | Net carbon emissions of 0kt, meaning the Company will be carbon neutral in its own operations. |
Ambition 2025
Demonstrating its strong business momentum and reflecting the divestiture of Qualtrics, SAP updated its mid-term ambition on May 16, 2023, and expects:
| · | Cloud revenue of more than €21.5bn |
| · | Total revenue of more than €37.5bn |
| · | Non-IFRS cloud gross profit of approximately €16.3bn |
| · | Non-IFRS operating profit of approximately €11.5bn |
| · | A share of more predictable revenue of approximately 86% |
| · | Free cash flow of approximately €7.5bn |
The 2025 ambition is based on an exchange rate of 1.10 USD per EUR.
2 The guidance is based on an adjusted methodology for 2023 to better reflect the business priorities of the company.
 | Additional Information |
This press release and all information therein is preliminary and unaudited.
SAP Performance Measures
For more information about our key growth metrics and performance measures, their calculation, their usefulness, and their limitation, please refer to the following document on our Investor Relations website: https://www.sap.com/investors/performance-measures
Webcast
SAP senior management will host a financial analyst conference call on Thursday, June 20th at 7:00 PM (CEST) / 6:00 PM (BST) / 1:00 PM (Eastern) / 10:00 AM (Pacific). The conference will be webcast on the Company’s website at https://www.sap.com/investor and will be available for replay. Supplementary financial information pertaining to the second quarter results can be found at https://www.sap.com/investor.
About SAP
SAP’s strategy is to help every business run as an intelligent enterprise. As a market leader in enterprise application software, we help companies of all sizes and in all industries run at their best: SAP customers generate 87% of total global commerce. Our machine learning, Internet of Things (IoT), and advanced analytics technologies help turn customers’ businesses into intelligent enterprises. SAP helps give people and organizations deep business insight and fosters collaboration that helps them stay ahead of their competition. We simplify technology for companies so they can consume our software the way they want – without disruption. Our end-to-end suite of applications and services enables business and public customers across 25 industries globally to operate profitably, adapt continuously, and make a difference. With a global network of customers, partners, employees, and thought leaders, SAP helps the world run better and improve people’s lives. For more information, visit www.sap.com.
For more information, financial community only:
| Anthony Coletta | +49 (6227) 7-60437 | investor@sap.com, CET |
Follow SAP Investor Relations on Twitter at @sapinvestor.
For more information, press only:
| Joellen Perry | +1 (650) 445-6780 | joellen.perry@sap.com, PT |
| Daniel Reinhardt | +49 (6227) 7-40201 | daniel.reinhardt@sap.com, CET |
For customers interested in learning more about SAP products:
| Global Customer Center: | +49 180 534-34-24 |
| United States Only: | +1 (800) 872-1SAP (+1-800-872-1727) |
Note to editors:
To preview and download broadcast-standard stock footage and press photos digitally, please visit www.sap.com/photos. On this platform, you can find high resolution material for your media channels. To view video stories on diverse topics, visit www.sap-tv.com. From this site, you can embed videos into your own Web pages, share video via email links, and subscribe to RSS feeds from SAP TV.
This document contains forward-looking statements, which are predictions, projections, or other statements about future events. These statements are based on current expectations, forecasts, and assumptions that are subject to risks and uncertainties that could cause actual results and outcomes to materially differ. Additional information regarding these risks and uncertainties may be found in our filings with the Securities and Exchange Commission, including but not limited to the risk factors section of SAP’s 2022 Annual Report on Form 20-F.
© 2023 SAP SE. All rights reserved.
SAP and other SAP products and services mentioned herein as well as their respective logos are trademarks or registered trademarks of SAP SE in Germany and other countries. Please see https://www.sap.com/copyright for additional trademark information and notices.
Contents
Financial and Non-Financial Key Facts
(IFRS and Non-IFRS)
| € millions, unless otherwise stated | Q1 2022 | Q2 2022 | Q3 2022 | Q4 2022 | TY 2022 | Q1 2023 | Q2 2023 |
| Revenues | | | | | | | |
| Cloud | 2,565 | 2,796 | 2,986 | 3,078 | 11,426 | 3,178 | 3,316 |
| % change – yoy | 29 | 32 | 36 | 29 | 31 | 24 | 19 |
| % change constant currency – yoy | 23 | 23 | 23 | 21 | 23 | 22 | 22 |
| SAP S/4HANA Cloud | 404 | 472 | 546 | 660 | 2,081 | 716 | 823 |
| % change – yoy | 78 | 84 | 98 | 101 | 91 | 77 | 74 |
| % change constant currency – yoy | 71 | 72 | 81 | 90 | 79 | 75 | 79 |
| Software licenses | 317 | 426 | 406 | 907 | 2,056 | 276 | 316 |
| % change – yoy | –34 | –34 | –38 | –38 | –37 | –13 | –26 |
| % change constant currency – yoy | –36 | –38 | –42 | –39 | –39 | –13 | –24 |
| Software support | 2,923 | 2,977 | 3,016 | 2,993 | 11,909 | 2,905 | 2,873 |
| % change – yoy | 4 | 5 | 5 | 3 | 4 | –1 | –3 |
| % change constant currency – yoy | 1 | 0 | –2 | –1 | 0 | –1 | –1 |
| Software licenses and support | 3,240 | 3,403 | 3,422 | 3,900 | 13,965 | 3,180 | 3,189 |
| % change – yoy | –1 | –2 | –3 | –11 | –5 | –2 | –6 |
| % change constant currency – yoy | –4 | –7 | –9 | –14 | –9 | –2 | –4 |
| Cloud and software | 5,806 | 6,199 | 6,408 | 6,978 | 25,391 | 6,358 | 6,505 |
| % change – yoy | 10 | 11 | 12 | 3 | 9 | 10 | 5 |
| % change constant currency – yoy | 6 | 4 | 3 | –1 | 3 | 8 | 8 |
| Total revenue | 6,773 | 7,207 | 7,476 | 8,064 | 29,520 | 7,441 | 7,554 |
| % change – yoy | 10 | 11 | 13 | 5 | 10 | 10 | 5 |
| % change constant currency – yoy | 6 | 5 | 4 | 0 | 4 | 9 | 8 |
| Share of more predictable revenue (in %) | 81 | 80 | 80 | 75 | 79 | 82 | 82 |
| Profits | | | | | | | |
| Operating profit (loss) (IFRS) | 1,471 | 1,060 | 1,557 | 2,002 | 6,090 | 803 | 1,358 |
| Operating profit (loss) (non-IFRS) | 1,676 | 1,678 | 2,075 | 2,560 | 7,989 | 1,875 | 2,058 |
| % change | –3 | –12 | –1 | 3 | –3 | 12 | 23 |
| % change constant currency | –6 | –15 | –8 | 1 | –7 | 12 | 28 |
| Profit (loss) after tax (IFRS) | 1,016 | 613 | 839 | 600 | 3,068 | 403 | 724 |
| Profit (loss) after tax (non-IFRS) | 1,171 | 1,098 | 1,240 | 1,008 | 4,517 | 1,254 | 1,249 |
| % change | –29 | –50 | –42 | –56 | –45 | 7 | 14 |
| Margins | | | | | | | |
| Cloud gross margin (IFRS, in %) | 68.2 | 70.2 | 69.8 | 69.2 | 69.4 | 70.5 | 71.1 |
| Cloud gross margin (non-IFRS, in %) | 68.9 | 71.2 | 70.8 | 70.3 | 70.3 | 71.4 | 72.2 |
| Software license and support gross margin (IFRS, in %) | 89.3 | 90.1 | 90.0 | 90.8 | 90.1 | 88.6 | 90.1 |
| Software license and support gross margin (non-IFRS, in %) | 89.7 | 90.7 | 90.7 | 91.4 | 90.7 | 89.2 | 90.5 |
| Cloud and software gross margin (IFRS, in %) | 80.0 | 81.1 | 80.6 | 81.3 | 80.8 | 79.5 | 80.3 |
| Cloud and software gross margin (non-IFRS, in %) | 80.5 | 81.9 | 81.4 | 82.1 | 81.5 | 80.3 | 81.2 |
| Gross margin (IFRS, in %) | 72.2 | 72.7 | 72.8 | 73.4 | 72.8 | 71.0 | 71.6 |
| Gross margin (non-IFRS, in %) | 73.1 | 74.3 | 74.4 | 75.1 | 74.3 | 72.9 | 73.8 |
| Operating margin (IFRS, in %) | 21.7 | 14.7 | 20.8 | 24.8 | 20.6 | 10.8 | 18.0 |
| Operating margin (non-IFRS, in %) | 24.8 | 23.3 | 27.8 | 31.7 | 27.1 | 25.2 | 27.2 |
| ATS segment – Segment gross margin (in %) | 72.5 | 73.7 | 73.3 | 74.5 | 73.5 | 72.3 | 73.3 |
| ATS segment – Segment margin in % | 28.9 | 27.6 | 31.4 | 35.0 | 30.9 | 29.6 | 32.3 |
| Key Profit Ratios | | | | | | | |
| Effective tax rate (IFRS, in %) | 25.5 | 34.2 | 28.3 | 42.8 | 32.0 | 40.5 | 33.8 |
| Effective tax rate (non-IFRS, in %) | 25.4 | 29.1 | 26.6 | 37.2 | 29.6 | 28.3 | 30.4 |
| Earnings per share, basic (IFRS, in €) from continuing operations | 0.87 | 0.54 | 0.75 | 0.63 | 2.80 | 0.35 | 0.62 |
| Earnings per share, basic (non-IFRS, in €) from continuing operations | 1.00 | 0.95 | 1.10 | 0.98 | 4.03 | 1.08 | 1.07 |
| Earnings per share, basic (IFRS, in €)4 | 0.63 | 0.29 | 0.57 | 0.46 | 1.95 | 0.41 | 2.96 |
| € millions, unless otherwise stated | Q1 2022 | Q2 2022 | Q3 2022 | Q4 2022 | TY 2022 | Q1 2023 | Q2 2023 |
| Earnings per share, basic (non-IFRS, in €)4 | 1.00 | 0.96 | 1.12 | 1.00 | 4.08 | 1.27 | 3.14 |
| Order Entry and current cloud backlog | | | | | | | |
| Current cloud backlog | 8,937 | 9,543 | 10,334 | 11,024 | 11,024 | 11,148 | 11,537 |
| % change – yoy | 25 | 32 | 36 | 27 | 27 | 25 | 21 |
| % change constant currency – yoy | 21 | 23 | 24 | 24 | 24 | 25 | 25 |
| SAP S/4HANA Current cloud backlog | 1,925 | 2,258 | 2,662 | 3,171 | 3,171 | 3,418 | 3,717 |
| % change – yoy | 86 | 100 | 108 | 86 | 86 | 78 | 65 |
| % change constant currency – yoy | 79 | 87 | 90 | 82 | 82 | 79 | 70 |
| Share of cloud orders greater than €5 million based on total cloud order entry volume (in %)3 | 43 | 49 | 42 | 55 | 50 | 45 | 46 |
| Share of cloud orders smaller than €1 million based on total cloud order entry volume (in %)3 | 29 | 25 | 26 | 18 | 23 | 26 | 25 |
| Share of on-premise orders greater than €5 million based on total software order entry volume (in %) | 40 | 33 | 28 | 29 | 31 | 26 | 22 |
| Share of on-premise orders smaller than €1 million based on total software order entry volume (in %) | 33 | 40 | 49 | 37 | 40 | 50 | 50 |
| Liquidity and Cash Flow | | | | | | | |
| Net cash flows from operating activities | 2,465 | 301 | 887 | 2,022 | 5,675 | 2,311 | 848 |
| Capital expenditure | –212 | –196 | –277 | –193 | –877 | –257 | –156 |
| Payments of lease liabilities | –93 | –116 | –97 | –103 | –410 | –99 | –89 |
| Free cash flow | 2,159 | –10 | 513 | 1,726 | 4,388 | 1,955 | 604 |
| % of total revenue | 32 | 0 | 7 | 21 | 15 | 26 | 8 |
| % of profit after tax (IFRS) | 213 | –2 | 61 | 288 | 143 | 485 | 83 |
| Group liquidity | 11,267 | 8,236 | 8,554 | 9,694 | 9,694 | 9,700 | 14,326 |
| Financial debt (–) | –12,171 | –12,282 | –12,282 | –11,764 | –11,764 | –10,751 | –10,146 |
| Net debt (–) | –904 | –4,046 | –3,728 | –2,070 | –2,070 | –1,050 | 4,180 |
| Financial Position5 | | | | | | | |
| Cash and cash equivalents | 8,927 | 7,472 | 7,316 | 9,008 | 9,008 | 8,766 | 14,142 |
| Goodwill | 32,140 | 33,879 | 35,664 | 33,077 | 33,077 | 28,563 | 28,581 |
| Total assets | 73,754 | 72,605 | 74,840 | 72,159 | 72,159 | 73,533 | 69,719 |
| Contract liabilities (current) | 7,630 | 6,883 | 5,487 | 5,309 | 5,309 | 7,547 | 6,743 |
| Equity ratio (total equity in % of total assets) | 58 | 59 | 62 | 59 | 59 | 58 | 61 |
| Non-Financials | | | | | | | |
| Number of employees (quarter end)1 | 104,670 | 104,988 | 106,912 | 106,312 | 106,312 | 105,132 | 105,328 |
| Employee retention (in %, rolling 12 months) | 92.5 | 92.0 | 92.2 | 92.8 | 92.8 | 93.8 | 95.1 |
| Women in management (in %, quarter end) | 28.6 | 28.9 | 29.2 | 29.3 | 29.3 | 29.4 | 29.5 |
| Net carbon emissions2 (in kilotons) | 20 | 20 | 20 | 20 | 85 | 0 | 0 |
1 In full-time equivalents
2 In CO2 equivalents. SAP’s carbon emission numbers are rounded to the nearest 5 kt. Therefore, the rounded full-year totals may not precisely equal the sum of the rounded quarterly numbers.
³ To conform to refined calculation logic, prior quarters have been adjusted.
4 From continuing and discontinued operations.
5 According to IFRS 5, comparison quarters 2022 for our continuing operations is unchanged from what previously has been reported.
Due to rounding, numbers may not add up precisely.
Primary Financial Statements of SAP Group (IFRS)
(A) Consolidated Income Statements
(A.1) Consolidated Income Statements – Quarter
| € millions, unless otherwise stated | | Q2 2023 | Q2 2022 | ∆ in % |
| Cloud | | 3,316 | 2,796 | 19 |
| Software licenses | | 316 | 426 | –26 |
| Software support | | 2,873 | 2,977 | –3 |
| Software licenses and support | | 3,189 | 3,403 | –6 |
| Cloud and software | | 6,505 | 6,199 | 5 |
| Services | | 1,050 | 1,007 | 4 |
| Total revenue | | 7,554 | 7,207 | 5 |
| | | | | |
| Cost of cloud | | –959 | –833 | 15 |
| Cost of software licenses and support | | –324 | –339 | –4 |
| Cost of cloud and software | | –1,282 | –1,172 | 9 |
| Cost of services | | –863 | –795 | 8 |
| Total cost of revenue | | –2,145 | –1,967 | 9 |
| Gross profit | | 5,409 | 5,240 | 3 |
| Research and development | | –1,565 | –1,514 | 3 |
| Sales and marketing | | –2,165 | –2,100 | 3 |
| General and administration | | –322 | –341 | –6 |
| Restructuring | | 3 | –130 | <-100 |
| Other operating income/expense, net | | –3 | –95 | –97 |
| Total operating expenses | | –6,196 | –6,147 | 1 |
| Operating profit (loss) | | 1,358 | 1,060 | 28 |
| | | | | |
| Other non-operating income/expense, net | | –89 | –11 | >100 |
| Finance income | | 187 | 178 | 6 |
| Finance costs | | –363 | –295 | 23 |
| Financial income, net | | –175 | –118 | 49 |
| Profit (loss) before tax from continuing operations | | 1,093 | 930 | 18 |
| | | | | |
| Income tax expense | | –369 | –318 | 16 |
| Profit (loss) after tax from continuing operations | | 724 | 613 | 18 |
| Attributable to owners of parent | | 728 | 634 | 15 |
| Attributable to non-controlling interests | | –4 | –21 | –82 |
| Profit (loss) after tax from discontinued operations | | 2,656 | –409 | <-100 |
| Profit (loss) after tax2 | | 3,381 | 203 | >100 |
| Attributable to owners of parent2 | | 3,455 | 334 | >100 |
| Attributable to non-controlling interests2 | | –74 | –131 | –44 |
| | | | | |
| Earnings per share, basic (in €)1 from continuing operations | | 0.62 | 0.54 | 15 |
| Earnings per share, basic (in €)1, 2 | | 2.96 | 0.29 | >100 |
| Earnings per share, diluted (in €)1 from continuing operations | | 0.62 | 0.54 | 14 |
| Earnings per share, diluted (in €)1, 2 | | 2.93 | 0.28 | >100 |
1 For the three months ended June 30, 2023 and 2022, the weighted average number of shares was 1,169 million (diluted 1,180 million) and 1,171 million (diluted: 1,174 million), respectively (treasury stock excluded).
2 From continuing and discontinued operations.
Due to rounding, numbers may not add up precisely.
(A.2) Consolidated Income Statements – Year-to-Date
| € millions, unless otherwise stated | | Q1–Q2 2023 | Q1–Q2 2022 | ∆ in % |
| Cloud | | 6,493 | 5,362 | 21 |
| Software licenses | | 591 | 743 | –20 |
| Software support | | 5,778 | 5,900 | –2 |
| Software licenses and support | | 6,369 | 6,643 | –4 |
| Cloud and software | | 12,863 | 12,005 | 7 |
| Services | | 2,132 | 1,974 | 8 |
| Total revenue | | 14,995 | 13,980 | 7 |
| | | | | |
| Cost of cloud | | –1,897 | –1,650 | 15 |
| Cost of software licenses and support | | –687 | –686 | 0 |
| Cost of cloud and software | | –2,584 | –2,336 | 11 |
| Cost of services | | –1,718 | –1,516 | 13 |
| Total cost of revenue | | –4,301 | –3,852 | 12 |
| Gross profit | | 10,693 | 10,127 | 6 |
| Research and development | | –3,138 | –2,910 | 8 |
| Sales and marketing | | –4,457 | –3,842 | 16 |
| General and administration | | –670 | –610 | 10 |
| Restructuring | | –257 | –119 | >100 |
| Other operating income/expense, net | | –10 | –115 | –91 |
| Total operating expenses | | –12,834 | –11,449 | 12 |
| Operating profit (loss) | | 2,161 | 2,531 | –15 |
| | | | | |
| Other non-operating income/expense, net | | –103 | –63 | 64 |
| Finance income | | 369 | 520 | –29 |
| Finance costs | | –656 | –692 | –5 |
| Financial income, net | | –287 | –173 | 66 |
| Profit (loss) before tax from continuing operations | | 1,771 | 2,295 | –23 |
| | | | | |
| Income tax expense | | –643 | –666 | –3 |
| Profit (loss) after tax from continuing operations | | 1,128 | 1,629 | –31 |
| Attributable to owners of parent | | 1,135 | 1,657 | –31 |
| Attributable to non-controlling interests | | –7 | –28 | –74 |
| Profit (loss) after tax from discontinued operations | | 2,763 | –794 | <-100 |
| Profit (loss) after tax2 | | 3,890 | 835 | >100 |
| Attributable to owners of parent2 | | 3,933 | 1,074 | >100 |
| Attributable to non-controlling interests2 | | –43 | –239 | –82 |
| | | | | |
| Earnings per share, basic (in €)1 from continuing operations | | 0.97 | 1.41 | –31 |
| Earnings per share, basic (in €)1, 2 | | 3.37 | 0.92 | >100 |
| Earnings per share, diluted (in €)1 from continuing operations | | 0.97 | 1.41 | –32 |
| Earnings per share, diluted (in €)1, 2 | | 3.34 | 0.91 | >100 |
1 For the six months ended June 30, 2023 and 2023, the weighted average number of shares was 1,168 million (diluted: 1,176 million) and 1,174 million (diluted: 1,174 million), respectively (treasury stock excluded).
2 From continuing and discontinued operations
Due to rounding, numbers may not add up precisely.
(B) Consolidated Statements of Financial Position
| as at 6/30/2023 and 12/31/2022 |
| € millions | 2023 | 20221 |
| Cash and cash equivalents | 14,142 | 9,008 |
| Other financial assets | 480 | 853 |
| Trade and other receivables | 5,594 | 6,236 |
| Other non-financial assets | 2,371 | 2,139 |
| Tax assets | 403 | 287 |
| Total current assets | 22,990 | 18,522 |
| Goodwill | 28,581 | 33,077 |
| Intangible assets | 2,259 | 3,835 |
| Property, plant, and equipment | 4,361 | 4,934 |
| Other financial assets | 5,513 | 5,626 |
| Trade and other receivables | 121 | 169 |
| Other non-financial assets | 3,397 | 3,580 |
| Tax assets | 315 | 323 |
| Deferred tax assets | 2,182 | 2,095 |
| Total non-current assets | 46,730 | 53,638 |
| Total assets | 69,719 | 72,159 |
| |
| € millions | 2023 | 20221 |
| Trade and other payables | 1,584 | 2,147 |
| Tax liabilities | 582 | 283 |
| Financial liabilities | 3,068 | 4,808 |
| Other non-financial liabilities | 3,859 | 4,818 |
| Provisions | 339 | 90 |
| Contract liabilities | 6,743 | 5,309 |
| Total current liabilities | 16,176 | 17,453 |
| Trade and other payables | 57 | 79 |
| Tax liabilities | 901 | 893 |
| Financial liabilities | 9,169 | 9,547 |
| Other non-financial liabilities | 677 | 705 |
| Provisions | 336 | 359 |
| Deferred tax liabilities | 146 | 241 |
| Contract liabilities | 28 | 33 |
| Total non-current liabilities | 11,314 | 11,858 |
| Total liabilities | 27,490 | 29,311 |
| Issued capital | 1,229 | 1,229 |
| Share premium | 1,552 | 3,081 |
| Retained earnings | 40,225 | 36,418 |
| Other components of equity | 3,100 | 3,801 |
| Treasury shares | –4,159 | –4,341 |
| Equity attributable to owners of parent | 41,946 | 40,186 |
| | | |
| Non-controlling interests | 283 | 2,662 |
| Total equity | 42,229 | 42,848 |
| Total equity and liabilities | 69,719 | 72,159 |
1 According to IFRS 5, Consolidated Statements of Financial Position as of 12/31/2022 for our continuing operations is unchanged from what previously has been reported.
Due to rounding, numbers may not add up precisely.
(C) Consolidated Statements of Cash Flows
| € millions | Q1–Q2 2023 | Q1–Q2 20221 |
| Profit (loss) after tax | 3,890 | 835 |
| Adjustments to reconcile profit (loss) after tax to net cash flows from operating activities: | | |
| (Profit) loss after tax from discontinued operations | –2,763 | 794 |
| Depreciation and amortization | 714 | 774 |
| Share-based payment expense | 1,167 | 513 |
| Income tax expense | 643 | 666 |
| Financial income, net | 287 | 173 |
| Decrease/increase in allowances on trade receivables | 5 | 104 |
| Other adjustments for non-cash items | 76 | 11 |
| Decrease/increase in trade and other receivables | 396 | 865 |
| Decrease/increase in other assets | –600 | –600 |
| Increase/decrease in trade payables, provisions, and other liabilities | –896 | –1,240 |
| Increase/decrease in contract liabilities | 2,109 | 2,073 |
| Share-based payments | –697 | –927 |
| Interest paid | –244 | –138 |
| Interest received | 197 | 44 |
| Income taxes paid, net of refunds | –1,127 | –1,181 |
| Net cash flows from operating activities – continuing operations | 3,160 | 2,766 |
| Net cash flows from operating activities – discontinued operations | 80 | –14 |
| Net cash flows from operating activities | 3,240 | 2,752 |
| Business combinations, net of cash and cash equivalents acquired | 0 | –664 |
| Cash flows from derivative financial instruments related to the sale of subsidiaries or businesses | –91 | 0 |
| Purchase of intangible assets or property, plant, and equipment | –413 | –408 |
| Proceeds from sales of intangible assets or property, plant, and equipment | 43 | 46 |
| Purchase of equity or debt instruments of other entities | –220 | –2,256 |
| Proceeds from sales of equity or debt instruments of other entities | 722 | 4,005 |
| Net cash flows from investing activities – continuing operations | 41 | 723 |
| Net cash flows from investing activities – discontinued operations | 6,323 | –15 |
| Net cash flows from investing activities | 6,364 | 708 |
| Dividends paid | –2,395 | –2,865 |
| Dividends paid on non-controlling interests | –18 | –3 |
| Purchase of treasury shares | 0 | –1,000 |
| Proceeds from borrowings | 0 | 38 |
| Repayments of borrowings | –1,724 | –944 |
| Payments of lease liabilities | –188 | –209 |
| Transactions with non-controlling interests | 43 | 0 |
| Net cash flows from financing activities – continuing operations | –4,283 | –4,982 |
| Net cash flows from financing activities – discontinued operations | 24 | –209 |
| Net cash flows from financing activities | –4,259 | –5,191 |
| Effect of foreign currency rates on cash and cash equivalents | –212 | 305 |
| Net decrease/increase in cash and cash equivalents | 5,134 | –1,427 |
| Cash and cash equivalents at the beginning of the period | 9,008 | 8,898 |
| Cash and cash equivalents at the end of the period | 14,142 | 7,472 |
1 We do no longer show cash flows linked to the supply chain financing (SCF) transactions from Taulia in investing/financing cash flow separately and therefore adjusted the comparative figures accordingly.
Due to rounding, numbers may not add up precisely.
Non-IFRS Numbers
| (D) | Basis of Non-IFRS Presentation |
SAP disclose certain financial measures such as expense (non-IFRS) and profit measures (non-IFRS) that are not prepared in accordance with IFRS and are therefore considered non-IFRS financial measures.
For a more detailed description of all of SAP’s non-IFRS measures and their limitations as well as SAP’s constant currency and free cash flow figures, see Explanation of Non-IFRS Measures online.
| (E) | Reconciliation from Non-IFRS Numbers to IFRS Numbers |
| (E.1) | Reconciliation of Non-IFRS Revenue – Quarter |
| € millions, unless otherwise stated | Q2 2023 | Q2 2022 | ∆ in % |
| IFRS | Currency Impact | Non-IFRS Constant Currency | IFRS | IFRS | Non-IFRS Constant Currency1 |
| Revenue Numbers | | | | | | |
| Cloud | 3,316 | 86 | 3,401 | 2,796 | 19 | 22 |
| Software licenses | 316 | 10 | 325 | 426 | –26 | –24 |
| Software support | 2,873 | 73 | 2,947 | 2,977 | –3 | –1 |
| Software licenses and support | 3,189 | 83 | 3,272 | 3,403 | –6 | –4 |
| Cloud and software | 6,505 | 169 | 6,673 | 6,199 | 5 | 8 |
| Services | 1,050 | 27 | 1,076 | 1,007 | 4 | 7 |
| Total revenue | 7,554 | 196 | 7,750 | 7,207 | 5 | 8 |
1 Constant currency period-over-period changes are calculated by comparing the current year's non-IFRS constant currency numbers with the IFRS numbers of the previous year's respective period.
Due to rounding, numbers may not add up precisely.
| (E.2) | Reconciliation of Non-IFRS Operating Expenses – Quarter |
| € millions, unless otherwise stated | Q2 2023 | Q2 2022 | ∆ in % |
| IFRS | Adj. | Non-IFRS | Currency Impact | Non-IFRS Constant Currency | IFRS | Adj. | Non-IFRS | IFRS | Non-IFRS | Non-IFRS Constant Currency1 |
| Operating Expense Numbers | | | | | | | | | | | |
| Cost of cloud | –959 | 38 | –920 | | | –833 | 28 | –806 | 15 | 14 | |
| Cost of software licenses and support | –324 | 21 | –302 | | | –339 | 22 | –316 | –4 | –4 | |
| Cost of cloud and software | –1,282 | 60 | –1,223 | | | –1,172 | 50 | –1,122 | 9 | 9 | |
| Cost of services | –863 | 107 | –756 | | | –795 | 69 | –726 | 8 | 4 | |
| Total cost of revenue | –2,145 | 166 | –1,978 | | | –1,967 | 118 | –1,849 | 9 | 7 | |
| Gross profit | 5,409 | 166 | 5,576 | | | 5,240 | 118 | 5,358 | 3 | 4 | |
| Research and development | –1,565 | 204 | –1,361 | | | –1,514 | 122 | –1,393 | 3 | –2 | |
| Sales and marketing | –2,165 | 296 | –1,869 | | | –2,100 | 209 | –1,891 | 3 | –1 | |
| General and administration | –322 | 36 | –285 | | | –341 | 40 | –301 | –6 | –5 | |
| Restructuring | 3 | –3 | 0 | | | –130 | 130 | 0 | <-100 | NA | |
| Other operating income/expense, net | –3 | 0 | –3 | | | –95 | 0 | –95 | –97 | –97 | |
| Total operating expenses | –6,196 | 700 | –5,496 | –107 | –5,604 | –6,147 | 618 | –5,529 | 1 | –1 | 1 |
1 Constant currency period-over-period changes are calculated by comparing the current year's non-IFRS constant currency numbers with the non-IFRS numbers of the previous year's respective period.
Due to rounding, numbers may not add up precisely.
| (E.3) | Reconciliation of Non-IFRS Profit Figures, Income Tax, and Key Ratios – Quarter |
| € millions, unless otherwise stated | Q2 2023 | Q2 2022 | ∆ in % |
| IFRS | Adj. | Non-IFRS | Currency Impact | Non-IFRS Constant Currency | IFRS | Adj. | Non-IFRS | IFRS | Non-IFRS | Non-IFRS Constant Currency1 |
| Profit Numbers | | | | | | | | | | | |
| Operating profit (loss) | 1,358 | 700 | 2,058 | 88 | 2,146 | 1,060 | 618 | 1,678 | 28 | 23 | 28 |
| Profit (loss) before tax from continuing operations | 1,093 | 700 | 1,794 | | | 930 | 618 | 1,548 | 18 | 16 | |
| Income tax expense | –369 | –176 | –545 | | | –318 | –133 | –451 | 16 | 21 | |
| Profit (loss) after tax from continuing operations | 724 | 524 | 1,249 | | | 613 | 485 | 1,098 | 18 | 14 | |
| Attributable to owners of parent | 728 | 523 | 1,252 | | | 634 | 483 | 1,117 | 15 | 12 | |
| Attributable to non-controlling interests | –4 | 1 | –3 | | | –21 | 2 | –19 | –82 | –85 | |
| Profit (loss) after tax3 | 3,381 | 79 | 3,460 | | | 203 | 890 | 1,093 | >100 | >100 | |
| Attributable to owners of parent3 | 3,455 | 210 | 3,665 | | | 334 | 794 | 1,128 | >100 | >100 | |
| Attributable to non-controlling interests3 | –74 | –131 | –205 | | | –131 | 96 | –35 | –44 | >100 | |
| | | | | | | | | | | | |
| Key Ratios | | | | | | | | | | | |
| Operating margin (in %) | 18.0 | | 27.2 | | 27.7 | 14.7 | | 23.3 | 3.3pp | 4.0pp | 4.4pp |
| Effective tax rate (in %)2 | 33.8 | | 30.4 | | | 34.2 | | 29.1 | –0.4pp | 1.3pp | |
| Earnings per share, basic (in €) from continuing operations | 0.62 | | 1.07 | | | 0.54 | | 0.95 | 15 | 12 | |
| Earnings per share, basic (in €)3 | 2.96 | | 3.14 | | | 0.29 | | 0.96 | >100 | >100 | |
1 Constant currency period-over-period changes are calculated by comparing the current year's non-IFRS constant currency numbers with the non-IFRS numbers of the previous year's respective period.
2 The difference between our effective tax rate (IFRS) and effective tax rate (non-IFRS) in Q2 2023 mainly resulted from tax effects of share-based payment expenses and acquisition-related charges. The difference between our effective tax rate (IFRS) and effective tax rate (non-IFRS) in Q2 2022 mainly resulted from tax effects of share-based payment expenses, restructuring expenses and acquisition-related charges.
3 From continuing and discontinued operations
Due to rounding, numbers may not add up precisely.
| (E.4) | Reconciliation of Non-IFRS Revenue – Year-to-Date |
| € millions, unless otherwise stated | Q1–Q2 2023 | Q1–Q2 2022 | ∆ in % |
| IFRS | Currency Impact | Non-IFRS Constant Currency | IFRS | IFRS | Non-IFRS Constant Currency1 |
| Revenue Numbers | | | | | | |
| Cloud | 6,493 | 39 | 6,532 | 5,362 | 21 | 22 |
| Software licenses | 591 | 10 | 601 | 743 | –20 | –19 |
| Software support | 5,778 | 54 | 5,832 | 5,900 | –2 | –1 |
| Software licenses and support | 6,369 | 64 | 6,433 | 6,643 | –4 | –3 |
| Cloud and software | 12,863 | 103 | 12,965 | 12,005 | 7 | 8 |
| Services | 2,132 | 15 | 2,147 | 1,974 | 8 | 9 |
| Total revenue | 14,995 | 117 | 15,112 | 13,980 | 7 | 8 |
1 Constant currency period-over-period changes are calculated by comparing the current year's non-IFRS constant currency numbers with the IFRS numbers of the previous year's respective period.
Due to rounding, numbers may not add up precisely.
| (E.5) | Reconciliation of Non-IFRS Operating Expenses – Year-to-Date |
| € millions, unless otherwise stated | Q1–Q2 2023 | Q1–Q2 2022 | ∆ in % |
| IFRS | Adj. | Non-IFRS | Currency Impact | Non-IFRS Constant Currency | IFRS | Adj. | Non-IFRS | IFRS | Non-IFRS | Non-IFRS Constant Currency1 |
| Operating Expense Numbers | | | | | | | | | | | |
| Cost of cloud | –1,897 | 68 | –1,829 | | | –1,650 | 46 | –1,604 | 15 | 14 | |
| Cost of software licenses and support | –687 | 42 | –645 | | | –686 | 36 | –650 | 0 | –1 | |
| Cost of cloud and software | –2,584 | 110 | –2,474 | | | –2,336 | 82 | –2,254 | 11 | 10 | |
| Cost of services | –1,718 | 199 | –1,519 | | | –1,516 | 97 | –1,420 | 13 | 7 | |
| Total cost of revenue | –4,301 | 309 | –3,992 | | | –3,852 | 179 | –3,674 | 12 | 9 | |
| Gross profit | 10,693 | 309 | 11,002 | | | 10,127 | 179 | 10,306 | 6 | 7 | |
| Research and development | –3,138 | 374 | –2,764 | | | –2,910 | 167 | –2,743 | 8 | 1 | |
| Sales and marketing | –4,457 | 734 | –3,723 | | | –3,842 | 310 | –3,532 | 16 | 5 | |
| General and administration | –670 | 97 | –573 | | | –610 | 49 | –561 | 10 | 2 | |
| Restructuring | –257 | 257 | 0 | | | –119 | 119 | 0 | >100 | NA | |
| Other operating income/expense, net | –10 | 0 | –10 | | | –115 | 0 | –115 | –91 | –91 | |
| Total operating expenses | –12,834 | 1,772 | –11,062 | –20 | –11,083 | –11,449 | 823 | –10,626 | 12 | 4 | 4 |
1 Constant currency period-over-period changes are calculated by comparing the current year's non-IFRS constant currency numbers with the non-IFRS numbers of the previous year's respective period.
Due to rounding, numbers may not add up precisely.
| (E.6) | Reconciliation of Non-IFRS Profit Figures, Income Tax, and Key Ratios – Year-to-Date |
| € millions, unless otherwise stated | Q1–Q2 2023 | Q1–Q2 2022 | ∆ in % |
| IFRS | Adj. | Non-IFRS | Currency Impact | Non-IFRS Constant Currency | IFRS | Adj. | Non-IFRS | IFRS | Non-IFRS | Non-IFRS Constant Currency1 |
| Profit Numbers | | | | | | | | | | | |
| Operating profit (loss) | 2,161 | 1,772 | 3,933 | 97 | 4,029 | 2,531 | 823 | 3,354 | –15 | 17 | 20 |
| Profit (loss) before tax from continuing operations | 1,771 | 1,772 | 3,543 | | | 2,295 | 823 | 3,119 | –23 | 14 | |
| Income tax expense | –643 | –397 | –1,040 | | | –666 | –183 | –850 | –3 | 22 | |
| Profit (loss) after tax from continuing operations | 1,128 | 1,375 | 2,502 | | | 1,629 | 640 | 2,269 | –31 | 10 | |
| Attributable to owners of parent | 1,135 | 1,373 | 2,508 | | | 1,657 | 638 | 2,295 | –31 | 9 | |
| Attributable to non-controlling interests | –7 | 2 | –5 | | | –28 | 2 | –26 | –74 | –80 | |
| Profit (loss) after tax3 | 3,890 | 1,156 | 5,047 | | | 835 | 1,424 | 2,259 | >100 | >100 | |
| Attributable to owners of parent3 | 3,933 | 1,220 | 5,153 | | | 1,074 | 1,232 | 2,306 | >100 | >100 | |
| Attributable to non-controlling interests3 | –43 | –64 | –107 | | | –239 | 192 | –47 | ���82 | >100 | |
| | | | | | | | | | | | |
| Key Ratios | | | | | | | | | | | |
| Operating margin (in %) | 14.4 | | 26.2 | | 26.7 | 18.1 | | 24.0 | –3.7pp | 2.2pp | 2.7pp |
| Effective tax rate (in %)2 | 36.3 | | 29.4 | | | 29.0 | | 27.2 | 7.3pp | 2.1pp | |
| Earnings per share, basic (in €) from continuing operations | 0.97 | | 2.15 | | | 1.41 | | 1.96 | –31 | 10 | |
| Earnings per share, basic (in €)3 | 3.37 | | 4.41 | | | 0.92 | | 1.96 | >100 | >100 | |
1 Constant currency period-over-period changes are calculated by comparing the current year's non-IFRS constant currency numbers with the non-IFRS numbers of the previous year's respective period.
2 The difference between our effective tax rate (IFRS) and effective tax rate (non-IFRS) in the first half of 2023 mainly resulted from tax effects of share-based payment expenses and restructuring expenses. The difference between our effective tax rate (IFRS) and effective tax rate (non-IFRS) in the first half of 2022 mainly resulted from tax effects of share-based payment expenses and acquisition-related charges.
3 From continuing and discontinued operations
Due to rounding, numbers may not add up precisely.
| (F) | Non-IFRS Adjustments – Actuals and Estimates |
| € millions | Estimated Amounts
for Full Year 2023 | Q1–Q2 2023 | Q2 2023 | Q1–Q2 2022 | Q2 2022 |
| Operating profit (loss) (IFRS) | | 2,161 | 1,358 | 2,531 | 1,060 |
| Adjustment for acquisition-related charges | 300–380 | 177 | 89 | 191 | 95 |
| Adjustment for share-based payment expenses | 1,850–2,250 | 1,167 | 614 | 513 | 394 |
| Adjustment for restructuring | 250–300 | 257 | –3 | 119 | 130 |
| Adjustment for regulatory compliance matter expenses | 170 | 170 | - | - | - |
| Operating expense adjustments | | 1,772 | 700 | 823 | 618 |
| Operating profit (loss) (non-IFRS) | | 3,933 | 2,058 | 3,354 | 1,678 |
Due to rounding, numbers may not add up precisely.
| (G) | Non-IFRS Adjustments by Functional Areas |
| € millions | Q2 2023 | Q2 2022 |
| IFRS | Acquisition -Related | SBP1 | Restruc-
turing | RCM2 | Non-
IFRS | IFRS | Acquisition-
Related | SBP1 | Restruc-
turing | RCM2 | Non-
IFRS |
| Cost of cloud | –959 | 11 | 27 | 0 | 0 | –920 | –833 | 13 | 14 | 0 | - | –806 |
| Cost of software licenses and support | –324 | 11 | 11 | 0 | 0 | –302 | –339 | 8 | 14 | 0 | - | –316 |
| Cost of services | –863 | 0 | 107 | 0 | 0 | –756 | –795 | 0 | 68 | 0 | - | –726 |
| Research and development | –1,565 | 2 | 202 | 0 | 0 | –1,361 | –1,514 | 3 | 119 | 0 | - | –1,393 |
| Sales and marketing | –2,165 | 64 | 232 | 0 | 0 | –1,869 | –2,100 | 70 | 139 | 0 | - | –1,891 |
| General and administration | –322 | 0 | 36 | 0 | 0 | –285 | –341 | 1 | 39 | 0 | - | –301 |
| Restructuring | 3 | 0 | 0 | –3 | 0 | 0 | –130 | 0 | 0 | 130 | - | 0 |
| Other operating income/expense, net | –3 | 0 | 0 | 0 | 0 | –3 | –95 | 0 | 0 | 0 | - | –95 |
| Total operating expenses | –6,196 | 89 | 614 | –3 | 0 | –5,496 | –6,147 | 95 | 394 | 130 | - | –5,529 |
1 Share-based Payments
2 Regulatory Compliance Matters
Due to rounding, numbers may not add up precisely.
| € millions | Q1–Q2 2023 | Q1–Q2 2022 |
| IFRS | Acqui- sition- Related | SBP1 | Restruc-
turing | RCM2 | Non-IFRS | IFRS | Acqui- sition- Related | SBP1 | Restruc-
turing | RCM2 | Non-
IFRS |
| Cost of cloud | –1,897 | 21 | 47 | 0 | 0 | –1,829 | –1,650 | 27 | 19 | 0 | - | –1,604 |
| Cost of software licenses and support | –687 | 22 | 20 | 0 | 0 | –645 | –686 | 15 | 21 | 0 | - | –650 |
| Cost of services | –1,718 | 0 | 198 | 0 | 0 | –1,519 | –1,516 | 0 | 96 | 0 | - | –1,420 |
| Research and development | –3,138 | 4 | 371 | 0 | 0 | –2,764 | –2,910 | 5 | 162 | 0 | - | –2,743 |
| Sales and marketing | –4,457 | 129 | 435 | 0 | 170 | –3,723 | –3,842 | 139 | 171 | 0 | - | –3,532 |
| General and administration | –670 | 1 | 96 | 0 | 0 | –573 | –610 | 6 | 43 | 0 | - | –561 |
| Restructuring | –257 | 0 | 0 | 257 | 0 | 0 | –119 | 0 | 0 | 119 | - | 0 |
| Other operating income/expense, net | –10 | 0 | 0 | 0 | 0 | –10 | –115 | 0 | 0 | 0 | - | –115 |
| Total operating expenses | –12,834 | 177 | 1,167 | 257 | 170 | –11,062 | –11,449 | 191 | 513 | 119 | - | –10,626 |
1 Share-based Payments
2 Regulatory Compliance Matters
Due to rounding, numbers may not add up precisely.
If not presented in a separate line item in our income statement, the restructuring expenses would break down as follows:
| € millions | Q2 2023 | Q1–Q2 2023 | Q2 2022 | Q1–Q2 2022 |
| Cost of cloud | 1 | 6 | 5 | –12 |
| Cost of software licenses and support | 0 | 11 | 3 | 4 |
| Cost of services | –1 | 34 | 59 | 61 |
| Research and development | 3 | 40 | 4 | 7 |
| Sales and marketing | –9 | 150 | 56 | 57 |
| General and administration | 3 | 16 | 2 | 3 |
| Restructuring expenses | –3 | 257 | 130 | 119 |
Due to rounding, numbers may not add up precisely.
Disaggregations
| (H.1) | Segment Policies and Segment Changes |
SAP has one reportable segment: the Applications, Technology & Services segment.
At the end of the second quarter 2023, we sold Qualtrics, formerly a reportable segment which derived its revenues mainly from the sale of experience management cloud solutions. For more information related to the sale of Qualtrics, see Note (M) in this quarterly statement.
For a more detailed description of SAP’s segment reporting, see Note (C.1) “Results of Segments” of our Consolidated Half-Year Financial Statements 2023.
| (H.2) | Segment Reporting – Quarter |
Applications, Technology & Services1
€ millions, unless otherwise stated (non-IFRS) | Q2 2023 | Q2 2022 | ∆ in % | ∆ in % |
Actual Currency | Constant Currency | Actual Currency | Actual Currency | Constant Currency |
| Cloud – SaaS2 | 2,325 | 2,388 | 1,935 | 20 | 23 |
| Cloud – PaaS3 | 521 | 533 | 366 | 42 | 45 |
| Cloud – IaaS4 | 191 | 195 | 246 | –23 | –21 |
| Cloud | 3,037 | 3,116 | 2,548 | 19 | 22 |
| Software licenses | 316 | 325 | 426 | –26 | –24 |
| Software support | 2,873 | 2,946 | 2,977 | –4 | –1 |
| Software licenses and support | 3,188 | 3,271 | 3,403 | –6 | –4 |
| Cloud and software | 6,225 | 6,387 | 5,951 | 5 | 7 |
| Services | 1,046 | 1,073 | 1,004 | 4 | 7 |
| Total segment revenue | 7,269 | 7,457 | 6,953 | 5 | 7 |
| Cost of cloud | –910 | –930 | –802 | 13 | 16 |
| Cost of software licenses and support | –289 | –294 | –328 | –12 | –10 |
| Cost of cloud and software | –1,199 | –1,223 | –1,130 | 6 | 8 |
| Cost of services | –739 | –759 | –700 | 6 | 8 |
| Total cost of revenue | –1,938 | –1,982 | –1,830 | 6 | 8 |
| Cloud gross profit – SaaS2 | 1,620 | 1,671 | 1,341 | 21 | 25 |
| Cloud gross profit – PaaS3 | 437 | 447 | 298 | 47 | 50 |
| Cloud gross profit – IaaS4 | 70 | 69 | 107 | –35 | –36 |
| Cloud gross profit | 2,127 | 2,186 | 1,745 | 22 | 25 |
| Segment gross profit | 5,331 | 5,475 | 5,123 | 4 | 7 |
| Other segment expenses | –2,984 | –3,048 | –3,201 | –7 | –5 |
| Segment profit (loss) | 2,346 | 2,428 | 1,922 | 22 | 26 |
| SAP S/4 HANA5 | | | | | |
| SAP S/4HANA Cloud revenue | 823 | 844 | 472 | 74 | 79 |
| SAP S/4HANA Current cloud backlog | 3,717 | 3,850 | 2,258 | 65 | 70 |
| Margins | | | | | |
| Segment gross margin (in %) | 73.3 | 73.4 | 73.7 | –0.3pp | –0.3pp |
| Segment margin (in %) | 32.3 | 32.6 | 27.6 | 4.6pp | 4.9pp |
1 Segment information for comparative prior periods were restated to conform with the new segment composition.
2 Software as a service: SaaS comprises all other offerings which are not shown as PaaS and IaaS.
3 Platform as a service: PaaS primarily includes SAP Business Technology Platform and SAP Signavio.
4 Infrastructure as a service: A major portion of IaaS comes from SAP HANA Enterprise Cloud.
5 Mainly derived from Applications, Technology & Services segment.
Due to rounding, numbers may not add up precisely.
Reconciliation of Cloud Revenues – Quarter
€ millions, unless otherwise stated (Non-IFRS) | Q2 2023 | Q2 2022 | ∆ in % |
Actual
Currency | Currency
Impact | Constant
Currency | Actual
Currency | Actual
Currency | Constant
Currency4 |
| Cloud revenue – SaaS1 | 2,604 | 70 | 2,674 | 2,184 | 19 | 22 |
| Cloud revenue – PaaS2 | 521 | 11 | 533 | 366 | 42 | 45 |
| Cloud revenue – IaaS3 | 191 | 4 | 195 | 246 | –23 | –21 |
| Cloud revenue | 3,316 | 86 | 3,401 | 2,796 | 19 | 22 |
| Cloud gross profit – SaaS1 | 1,888 | 56 | 1,945 | 1,586 | 19 | 23 |
| Cloud gross profit – PaaS2 | 437 | 9 | 447 | 298 | 47 | 50 |
| Cloud gross profit – IaaS³ | 70 | –1 | 69 | 107 | –35 | –36 |
| Cloud gross profit | 2,395 | 65 | 2,460 | 1,990 | 20 | 24 |
1 Software as a service: SaaS comprises all other offerings which are not shown as PaaS and IaaS.
2 Platform as a service PaaS primarily includes SAP Business Technology Platform and SAP Signavio.
3 Infrastructure as a service: A major portion of IaaS comes from SAP HANA Enterprise Cloud.
4 Constant currency period-over-period changes are calculated by comparing the current year's non-IFRS constant currency numbers with the non-IFRS numbers of the previous year's respective period.
Due to rounding, numbers may not add up precisely.
| (H.3) | Segment Reporting – Year-to-Date |
Applications, Technology & Services1
€ millions, unless otherwise stated (non-IFRS) | Q1–Q2 2023 | Q1–Q2 2022 | ∆ in % | ∆ in % |
Actual Currency | Constant Currency | Actual Currency | Actual Currency | Constant Currency |
| Cloud – SaaS2 | 4,546 | 4,575 | 3,717 | 22 | 23 |
| Cloud – PaaS3 | 1,003 | 1,009 | 694 | 45 | 45 |
| Cloud – IaaS4 | 391 | 394 | 475 | –18 | –17 |
| Cloud | 5,940 | 5,978 | 4,885 | 22 | 22 |
| Software licenses | 591 | 601 | 743 | –20 | –19 |
| Software support | 5,777 | 5,831 | 5,900 | –2 | –1 |
| Software licenses and support | 6,369 | 6,432 | 6,643 | –4 | –3 |
| Cloud and software | 12,309 | 12,410 | 11,529 | 7 | 8 |
| Services | 2,124 | 2,139 | 1,967 | 8 | 9 |
| Total segment revenue | 14,429 | 14,544 | 13,492 | 7 | 8 |
| Cost of cloud | –1,806 | –1,802 | –1,589 | 14 | 13 |
| Cost of software licenses and support | –624 | –624 | –661 | –6 | –5 |
| Cost of cloud and software | –2,430 | –2,426 | –2,249 | 8 | 8 |
| Cost of services | –1,492 | –1,503 | –1,380 | 8 | 9 |
| Total cost of revenue | –3,922 | –3,929 | –3,629 | 8 | 8 |
| Cloud gross profit – SaaS2 | 3,144 | 3,176 | 2,561 | 23 | 24 |
| Cloud gross profit – PaaS3 | 843 | 850 | 562 | 50 | 51 |
| Cloud gross profit – IaaS4 | 146 | 149 | 174 | –16 | –14 |
| Cloud gross profit | 4,134 | 4,176 | 3,297 | 25 | 27 |
| Segment gross profit | 10,507 | 10,615 | 9,863 | 7 | 8 |
| Other segment expenses | –6,042 | –6,072 | –6,054 | 0 | 0 |
| Segment profit (loss) | 4,465 | 4,543 | 3,809 | 17 | 19 |
| SAP S/4 HANA5 | | | | | |
| SAP S/4HANA Cloud revenue | 1,539 | 1,552 | 876 | 76 | 77 |
| SAP S/4HANA Current cloud backlog | 3,717 | 3,850 | 2,258 | 65 | 70 |
| Margins | | | | | |
| Segment gross margin (in %) | 72.8 | 73.0 | 73.1 | –0.3pp | –0.1pp |
| Segment margin (in %) | 30.9 | 31.2 | 28.2 | 2.7pp | 3.0pp |
Due to rounding, numbers may not add up precisely.
1 Segment information for comparative prior periods were restated to conform with the new segment composition.
2 Software as a service: SaaS comprises all other offerings which are not shown as PaaS and IaaS.
3 Platform as a service: PaaS primarily includes SAP Business Technology Platform and SAP Signavio.
4 Infrastructure as a service: A major portion of IaaS comes from SAP HANA Enterprise Cloud.
5 Mainly derived from Applications, Technology & Services segment.
Reconciliation of Cloud Revenues and Gross Profit – Year-to-Date
€ millions, unless otherwise stated (non-IFRS) | Q1–Q2 2023 | Q1–Q2 2022 | ∆ in % |
Actual
Currency | Currency
Impact | Constant
Currency | Actual Currency | Actual
Currency | Constant
Currency4 |
| Cloud revenue – SaaS1 | 5,099 | 30 | 5,130 | 4,193 | 22 | 22 |
| Cloud revenue – PaaS2 | 1,003 | 6 | 1,009 | 694 | 45 | 45 |
| Cloud revenue – IaaS3 | 391 | 3 | 394 | 475 | –18 | –17 |
| Cloud revenue | 6,493 | 39 | 6,532 | 5,362 | 21 | 22 |
| Cloud gross profit – SaaS1 | 3,675 | 34 | 3,709 | 3,021 | 22 | 23 |
| Cloud gross profit – PaaS2 | 843 | 7 | 850 | 562 | 50 | 51 |
| Cloud gross profit – IaaS3 | 146 | 3 | 149 | 174 | –16 | –14 |
| Cloud gross profit | 4,664 | 45 | 4,709 | 3,758 | 24 | 25 |
1 Software as a service: SaaS comprises all other offerings which are not shown as PaaS and IaaS.
2 Platform as a service: PaaS primarily includes SAP Business Technology Platform and SAP Signavio.
3 Infrastructure as a service: A major portion of IaaS comes from SAP HANA Enterprise Cloud.
4 Constant currency period-over-period changes are calculated by comparing the current year's non-IFRS constant currency numbers with the non-IFRS numbers of the previous year's respective period.
Due to rounding, numbers may not add up precisely.
| (I) | Revenue by Region (IFRS and Non-IFRS) |
| (I.1) | Revenue by Region (IFRS and Non-IFRS) – Quarter |
| € millions | Q2 2023 | Q2 2022 | ∆ in % |
| Actual currency | Currency Impact | Constant Currency | Actual currency | Actual currency | Constant Currency1 |
| Cloud Revenue by Region | | | |
| EMEA | 1,267 | 16 | 1,283 | 1,015 | 25 | 26 |
| Americas | 1,622 | 40 | 1,662 | 1,417 | 14 | 17 |
| APJ | 427 | 30 | 457 | 364 | 17 | 25 |
| Cloud revenue | 3,316 | 86 | 3,401 | 2,796 | 19 | 22 |
| Cloud and Software Revenue by Region | | | |
| EMEA | 2,878 | 34 | 2,912 | 2,689 | 7 | 8 |
| Americas | 2,646 | 67 | 2,713 | 2,558 | 3 | 6 |
| APJ | 980 | 68 | 1,048 | 953 | 3 | 10 |
| Cloud and software revenue | 6,505 | 169 | 6,673 | 6,199 | 5 | 8 |
| Total Revenue by Region | | | |
| Germany | 1,146 | 0 | 1,146 | 1,060 | 8 | 8 |
| Rest of EMEA | 2,200 | 40 | 2,240 | 2,071 | 6 | 8 |
| Total EMEA | 3,346 | 40 | 3,386 | 3,131 | 7 | 8 |
| United States | 2,477 | 55 | 2,532 | 2,388 | 4 | 6 |
| Rest of Americas | 628 | 24 | 652 | 601 | 4 | 8 |
| Total Americas | 3,105 | 79 | 3,184 | 2,990 | 4 | 6 |
| Japan | 313 | 25 | 339 | 296 | 6 | 15 |
| Rest of APJ | 790 | 51 | 841 | 790 | 0 | 7 |
| Total APJ | 1,103 | 76 | 1,180 | 1,085 | 2 | 9 |
| Total revenue | 7,554 | 196 | 7,750 | 7,207 | 5 | 8 |
1 Constant currency period-over-period changes are calculated by comparing the current year's constant currency numbers with the actual currency numbers of the previous year's respective period.
Due to rounding, numbers may not add up precisely.
| (I.2) | Revenue by Region (IFRS and Non-IFRS) – Year-to-Date |
| € millions | Q1–Q2 2023 | Q1–Q2 2022 | ∆ in % |
| Actual Currency | Currency Impact | Constant Currency | Actual Currency | Actual Currency | Constant Currency1 |
| Cloud Revenue by Region | | | |
| EMEA | 2,458 | 16 | 2,474 | 1,966 | 25 | 26 |
| Americas | 3,194 | –19 | 3,176 | 2,695 | 19 | 18 |
| APJ | 841 | 42 | 883 | 701 | 20 | 26 |
| Cloud revenue | 6,493 | 39 | 6,532 | 5,362 | 21 | 22 |
| Cloud and Software Revenue by Region | | | |
| EMEA | 5,660 | 39 | 5,699 | 5,285 | 7 | 8 |
| Americas | 5,283 | –33 | 5,250 | 4,866 | 9 | 8 |
| APJ | 1,919 | 97 | 2,016 | 1,853 | 4 | 9 |
| Cloud and software revenue | 12,863 | 103 | 12,965 | 12,005 | 7 | 8 |
| Total Revenue by Region | | | |
| Germany | 2,283 | –1 | 2,282 | 2,114 | 8 | 8 |
| Rest of EMEA | 4,338 | 45 | 4,383 | 4,049 | 7 | 8 |
| Total EMEA | 6,621 | 44 | 6,666 | 6,163 | 7 | 8 |
| United States | 4,974 | –47 | 4,927 | 4,566 | 9 | 8 |
| Rest of Americas | 1,233 | 9 | 1,242 | 1,136 | 9 | 9 |
| Total Americas | 6,207 | –38 | 6,169 | 5,702 | 9 | 8 |
| Japan | 616 | 52 | 668 | 602 | 2 | 11 |
| Rest of APJ | 1,550 | 59 | 1,609 | 1,513 | 2 | 6 |
| Total APJ | 2,166 | 111 | 2,277 | 2,115 | 2 | 8 |
| Total revenue | 14,995 | 117 | 15,112 | 13,980 | 7 | 8 |
1 Constant-currency period-over-period changes are calculated by comparing the current year's non-IFRS constant-currency numbers with the non-IFRS number of the previous year's respective period.
Due to rounding, numbers may not add up precisely.
| (J) | Employees by Region and Functional Areas |
| Full-time equivalents | 6/30/2023 | 6/30/2022 |
| | EMEA | Americas | APJ | Total | EMEA | Americas | APJ | Total |
| Cloud and software | 4,010 | 4,083 | 4,000 | 12,093 | 4,497 | 3,979 | 4,403 | 12,879 |
| Services | 7,993 | 5,000 | 5,476 | 18,469 | 8,193 | 5,061 | 5,811 | 19,065 |
| Research and development | 17,910 | 5,872 | 12,318 | 36,100 | 17,075 | 5,730 | 11,379 | 34,185 |
| Sales and marketing | 11,778 | 10,121 | 5,303 | 27,202 | 11,454 | 10,649 | 5,347 | 27,450 |
| General and administration | 3,475 | 1,765 | 1,281 | 6,521 | 3,337 | 1,867 | 1,208 | 6,411 |
| Infrastructure | 2,800 | 1,284 | 859 | 4,943 | 2,774 | 1,350 | 874 | 4,997 |
| SAP Group (6/30) | 47,966 | 28,125 | 29,237 | 105,328 | 47,331 | 28,636 | 29,022 | 104,988 |
| Thereof acquisitions1 | 0 | 0 | 0 | 0 | 173 | 189 | 8 | 370 |
| SAP Group (six months' end average) | 47,917 | 28,127 | 29,337 | 105,380 | 46,834 | 28,650 | 28,991 | 104,475 |
1 Acquisitions closed between January 1 and June 30 of the respective year
Due to rounding numbers may not add up precisely
Other Disclosures
In the second quarter of 2023, finance income mainly consisted of gains from disposals and fair value adjustments of equity securities totaling €82 million (Q2/2022: €146 million) and €186 million in the first half of 2023 (HY1/2022: €463 million), and interest income from loans and receivables, other financial assets (cash, cash equivalents, and current investments) as well as from derivatives amounting to €103 million in the second quarter of 2023 (Q2/2022: €39 million) and €190 million in the first half of 2023 (HY1/2022: €65 million).
In the second quarter of 2023, finance costs were primarily impacted by losses from disposals and fair value adjustments of equity securities amounting to €93 million (Q2/2022: €225 million) and €226 million in the first half of 2023 (HY1/2022: €543 million) and interest expense on financial liabilities including lease liabilities and negative effects from derivatives amounting to €238 million in the second quarter of 2023 (Q2/2022: €50 million) and €370 million in the first half of 2023 (HY1/2022: €97 million).
| (L) | Updated Cost Allocation Policy |
Starting January 1, 2023, all activities related to changes in the code of SAP’s cloud and on-premise solutions are treated as development-related activities. Some of those activities, specifically code corrections, were previously considered as support-related activities. SAP believes this update aligns SAP’s accounting policy with market standards and increases comparability to its peers.
In the second quarter 2023, this update of our cost allocation policy resulted in an increase of the cloud gross profit by approximately €25 million, an increase of the software license and support gross profit by approximately €60 million, and an increase of our R&D expenses by approximately €85 million.
In the first half of 2023, the update of our cost allocation policy led to an increase of the cloud gross profit by approximately €50 million, an increase of the software license and support gross profit by approximately €130 million, and an increase of our R&D expenses by approximately €180 million.
For the full year 2023, the updated cost allocation policy is expected to result in decreased cost of cloud by approximately €100 million and cost of support by approximately €300 million, while in consequence increased R&D expenses by approximately €400 million.
Had SAP applied this accounting policy in 2022, its cost of cloud, cost of software licenses and support and R&D expense would have been as follows:
| € millions | IFRS | Non-IFRS |
| Q1 2022 | Q2 2022 | Q3 2022 | Q4 2022 | FY 2022 | Q1 2022 | Q2 2022 | Q3 2022 | Q4 2022 | FY 2022 |
| Cost of cloud | –817 | –833 | –902 | –947 | –3,499 | –798 | –806 | –873 | –915 | –3,391 |
| Cost of software licenses and support | –347 | –339 | –341 | –358 | –1,384 | –334 | –316 | –319 | –334 | –1,302 |
| Research and development expenses | –1,396 | –1,514 | –1,571 | –1,598 | –6,080 | –1,351 | –1,393 | –1,437 | –1,449 | –5,629 |
Due to rounding, numbers may not add up precisely.
| (M) | Discontinued Operations |
On March 13, resulting from a process that was initiated on January 26, SAP announced it had agreed to sell all of its 423 million shares of Qualtrics International Inc. as part of the acquisition of Qualtrics by funds affiliated with Silver Lake as well as the Canada Pension Plan Investment Board. The sale closed on June 28, 2023, following satisfaction of customary closing conditions and regulatory approvals. At a purchase price of US$18.15 in cash per share, SAP’s stake was acquired for approximately US$7.7 billion. At the time Qualtrics was classified as a discontinued operation (following IFRS 5), there was no indication of an impairment (as the fair value less cost of disposal (calculated based on share prices) significantly exceeded the carrying amount).
SAP will remain a close go-to-market and technology partner for Qualtrics.
SAP’s financial results present Qualtrics as a discontinued operation (given the qualitative and quantitative significance for SAP), in accordance with IFRS 5 (the comparative figures have been adjusted accordingly). The Qualtrics disposal group was previously included in the Qualtrics reportable segment.
The pre-tax disposal gain included into discontinued operations (€3.7 billion) was calculated by adjusting the purchase price less cost of disposal (€7.0 billion) for net assets leaving the SAP Group (-€5.8 billion, mostly goodwill (-€4.0 billion) and other intangible assets (-€1.3 billion)) and the corresponding non-controlling interests (€2.4 billion) and amounts of other comprehensive income (€0.1 billion). SAP incurred taxes amounting to €0.5 billion in connection with the transaction.
The cash inflow resulting from the purchase price (€7.1 billion) was offset by cash and cash equivalents of €0.7 billion leaving the SAP group.
SAP continues to provide rental guarantees for certain offices used by Qualtrics. Qualtrics is obligated to indemnify SAP with respect to the guarantees.
Additional financial information relating to Qualtrics is presented in the following tables (revenues and expenses are presented after consolidation of transactions between Qualtrics and SAP’s continuing operations):
| € billion, unless otherwise stated | Q2 2023 | Q1–Q2 2023 | Q2 2022 | Q1–Q2 2022 |
| Consolidated Income Statements | | | | |
| Cloud revenue | 0.3 | 0.6 | 0.3 | 0.5 |
| Total revenue | 0.4 | 0.7 | 0.3 | 0.6 |
| Cost of cloud | –0.0 | –0.1 | –0.1 | –0.1 |
| Total cost of revenue | –0.1 | –0.2 | –0.1 | –0.2 |
| Total operating expenses (including total cost of revenue) | –0.5 | –1.2 | –0.7 | –1.4 |
| Disposal gain before tax | 3.7 | 3.7 | 0.0 | 0.0 |
| Operating profit | 3.5 | 3.2 | –0.4 | –0.8 |
| Profit (loss) before tax | 3.5 | 3.3 | –0.4 | –0.8 |
| Income tax expense1 | –0.9 | –0.5 | –0.0 | 0.0 |
| Profit (loss) after tax | 2.7 | 2.8 | –0.4 | –0.8 |
| Attributable to owners of parent | 2.7 | 2.8 | –0.3 | –0.6 |
| | | | | |
| Earnings per share, basic (IFRS, in €)2 | 2.33 | 2.40 | –0.26 | –0.50 |
| Earnings per share, diluted (IFRS, in €)2 | 2.31 | 2.38 | –0.26 | –0.50 |
| Earnings per share, basic (non-IFRS, in €)2 | 2.06 | 2.26 | 0.01 | 0.01 |
| | | | | |
| Consolidated Statements of Cash Flow | | | | |
| Net operating cash flow | 0.0 | 0.1 | 0.0 | –0.0 |
| Net investing cash flow | 6.3 | 6.3 | –0.0 | –0.0 |
| Net financing cash flow | 0.0 | 0.0 | –0.0 | –0.2 |
1 For 2023, € 0.5 billion is relating to the gain on sale of discontinued operations.
2 For the three months ended June 30, 2023 and 2022, the weighted average number of shares was 1,169 million (diluted 1,180 million) and 1,171 million (diluted: 1,174 million), respectively (treasury stock excluded).
For the six months ended June 30, 2023 and 2022, the weighted average number of shares was 1,168 million (diluted 1,176 million) and 1,174 million (diluted: 1,174 million), respectively (treasury stock excluded).
Due to rounding, numbers may not add up precisely.
| € billion, unless otherwise stated | Q2 2023 | Q1–Q2 2023 | Q2 2022 | Q1–Q2 2022 |
| Profit (loss) after tax (IFRS) | 2.7 | 2.8 | –0.4 | –0.8 |
| Adjustment for acquisition related charges | –0.8 | –0.8 | 0.1 | 0.1 |
| Adjustment for share-based payment expenses | 0.2 | 0.4 | 0.3 | 0.7 |
| Adjustment for restructuring expenses | 0.0 | 0.0 | 0 | 0 |
| Adjustment for tax impact of non-IFRS adjustments | 0.2 | 0.2 | 0.0 | –0.0 |
| Profit (loss) after tax (non-IFRS) | 2.2 | 2.5 | –0.0 | –0.0 |
| Attributable to owners of parent | 2.4 | 2.6 | 0.0 | 0.0 |
Due to rounding, numbers may not add up precisely.