Exhibit 99.1

SAP Announces Q3 2023 Results
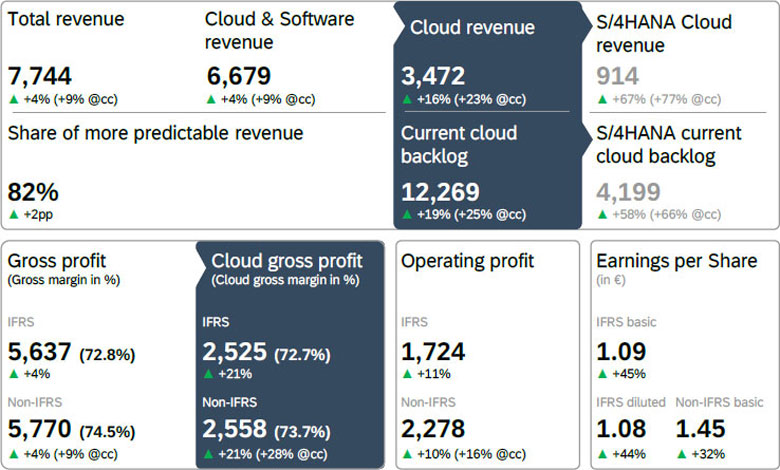
| ● | Cloud revenue up 16% and up 23% at constant currencies |
| ● | Current cloud backlog of €12.3 billion up 19% and up 25% at constant currencies |
| ● | IFRS cloud gross profit up 21%, non-IFRS cloud gross profit up 21% and up 28% at constant currencies, supported by the expansion of cloud gross margin |
| ● | IFRS operating profit up 11%, non-IFRS operating profit up 10% and up 16% at constant currencies |
| ● | SAP reaffirms 2023 outlook |
in € millions, unless otherwise stated; based on SAP group results from continuing operations
 | Christian Klein, CEO: |  | Dominik Asam, CFO: | |
"Our Q3 results are yet another proof point that we have entered the next phase of our transformation. We accelerated cloud growth across our portfolio and significantly expanded our cloud gross margins. Our strong focus on innovation, including our latest SAP Business AI capabilities, ensure SAP's continued resiliency in the face of tough macroeconomic conditions and increasing geopolitical tensions."
| "Our Q3 results demonstrate strong execution and the resilience of our business, including sustained cloud growth in spite of persisting macro headwinds. Also, we carefully balance growth and profitability at all times. In combination, this allows us to boost our bottom-line with the aim to achieve double-digit operating profit growth this year." | |||
1/29
Walldorf, Germany – October 18, 2023.
SAP SE (NYSE: SAP) today announced its financial results for the third quarter ended September 30, 2023.
All figures in this statement are based on SAP group results from continuing operations unless otherwise noted. See section (M) Discontinued Operations.
 | Financial Performance |
Group results at a glance – Third quarter 2023
| IFRS | Non-IFRS1 | |||||||
| € million, unless otherwise stated | Q3 2023 | Q3 2022 | ∆ in % | Q3 2023 | Q3 2022 | ∆ in % | ∆ in % const. curr. | |
| Cloud revenue | 3,472 | 2,986 | 16 | 3,472 | 2,986 | 16 | 23 | |
| Thereof SAP S/4HANA Cloud revenue | 914 | 546 | 67 | 914 | 546 | 67 | 77 | |
| Software licenses | 335 | 406 | –17 | 335 | 406 | –17 | –14 | |
| Software support | 2,872 | 3,016 | –5 | 2,872 | 3,016 | –5 | –1 | |
| Software licenses and support revenue | 3,208 | 3,422 | –6 | 3,208 | 3,422 | –6 | –2 | |
| Cloud and software revenue | 6,679 | 6,408 | 4 | 6,679 | 6,408 | 4 | 9 | |
| Total revenue | 7,744 | 7,476 | 4 | 7,744 | 7,476 | 4 | 9 | |
| Share of more predictable revenue (in %) | 82 | 80 | 2pp | 82 | 80 | 2pp | ||
| Operating profit (loss) | 1,724 | 1,557 | 11 | 2,278 | 2,075 | 10 | 16 | |
| Profit (loss) after tax from continuing operations | 1,272 | 839 | 52 | 1,687 | 1,240 | 36 | ||
| Profit (loss) after tax² | 1,272 | 547 | >100 | 1,687 | 1,263 | 34 | ||
| Earnings per share - Basic (in €) from continuing operations | 1.09 | 0.75 | 45 | 1.45 | 1.10 | 32 | ||
| Earnings per share - Diluted (in €) from continuing operations | 1.08 | 0.75 | 44 | |||||
| Earnings per share - Basic (in €)² | 1.09 | 0.57 | 91 | 1.45 | 1.12 | 30 | ||
| Earnings per share - Diluted (in €)² | 1.08 | 0.57 | 90 | |||||
| Net cash flows from operating activities from continuing operations | 1,124 | 887 | 27 | |||||
| Free cash flow | 865 | 513 | 69 | |||||
| Number of employees (FTE, September 30) | 106,495 | 106,912 | 0 | |||||
1 For a breakdown of the individual adjustments see table “Non-IFRS Adjustments by Functional Areas” in this Quarterly Statement.
2 From continuing and discontinued operations.
Group results at a glance – Nine months ended September 2023
| IFRS | Non-IFRS1 | |||||||
| € million, unless otherwise stated | Q1–Q3 2023 | Q1–Q3 2022 | ∆ in % | Q1–Q3 2023 | Q1–Q3 2022 | ∆ in % | ∆ in % const. curr. | |
| Cloud revenue | 9,965 | 8,348 | 19 | 9,965 | 8,348 | 19 | 22 | |
| Thereof SAP S/4HANA Cloud revenue | 2,453 | 1,422 | 72 | 2,453 | 1,422 | 72 | 77 | |
| Software licenses | 927 | 1,149 | –19 | 927 | 1,149 | –19 | –17 | |
| Software support | 8,651 | 8,916 | –3 | 8,651 | 8,916 | –3 | –1 | |
| Software licenses and support revenue | 9,577 | 10,065 | –5 | 9,577 | 10,065 | –5 | –3 | |
| Cloud and software revenue | 19,542 | 18,413 | 6 | 19,542 | 18,413 | 6 | 9 | |
| Total revenue | 22,739 | 21,456 | 6 | 22,739 | 21,456 | 6 | 8 | |
| Share of more predictable revenue (in %) | 82 | 80 | 1pp | 82 | 80 | 1pp | ||
| Operating profit (loss) | 3,885 | 4,088 | –5 | 6,211 | 5,429 | 14 | 19 | |
| Profit (loss) after tax from continuing operations | 2,399 | 2,468 | –3 | 4,189 | 3,508 | 19 | ||
| Profit (loss) after tax2 | 4,671 | 1,382 | >100 | 6,243 | 3,522 | 77 | ||
2/29
| Earnings per share - Basic (in €) from continuing operations | 2.07 | 2.17 | –5 | 3.60 | 3.05 | 18 | ||
| Earnings per share - Diluted (in €) from continuing operations | 2.05 | 2.16 | –5 | |||||
| Earnings per share - Basic (in €)2 | 4.13 | 1.49 | >100 | 5.53 | 3.08 | 80 | ||
| Earnings per share - Diluted (in €)2 | 4.09 | 1.48 | >100 | |||||
| Net cash flows from operating activities from continuing operations | 4,284 | 3,653 | 17 | |||||
| Free cash flow | 3,423 | 2,662 | 29 | |||||
| Number of employees (FTE, September 30) | 106,495 | 106,912 | 0 |
1 For a breakdown of the individual adjustments see table “Non-IFRS Adjustments by Functional Areas” in this Quarterly Statement.
2 From continuing and discontinued operations.
 | Financial Highlights1 |
Third Quarter 2023
Current cloud backlog grew by 19% to €12.27 billion and was up 25% at constant currencies. SAP S/4HANA current cloud backlog was up 58% to €4.20 billion and up 66% at constant currencies.
In the third quarter, cloud revenue was up 16% to €3.47 billion and up 23% at constant currencies, mainly driven by the growth of SAP’s combined SaaS and PaaS portfolio, which was up 19% and up 26% at constant currencies. SAP S/4HANA cloud revenue was up 67% to €914 million and up 77% at constant currencies.
Supported by a few major transactions, software licenses revenue decreased by 17% to €335 million and was down 14% at constant currencies. Cloud and software revenue was up 4% to €6.68 billion and up 9% at constant currencies. Services revenue was flat at €1.07 billion and up 4% at constant currencies. Total revenue was up 4% to €7.74 billion and up 9% at constant currencies.
The share of more predictable revenue increased by 2 percentage points to 82% in the third quarter.
Cloud gross profit was up 21% (IFRS) to €2.53 billion, up 21% to €2.56 billion (non-IFRS), and up 28% (non-IFRS at constant currencies). Cloud gross profit growth was supported by a strong increase in cloud gross margins. IFRS cloud gross margin was up 2.9 percentage points to 72.7%, non-IFRS cloud gross margin up 2.9 percentage points to 73.7% and up 2.9 percentage points at constant currencies.
IFRS operating profit increased 11% to €1.72 billion. Non-IFRS operating profit was up 10% to €2.28 billion and up 16% at constant currencies. The increase was supported by the resilience of our on-premise business as well as continued operational discipline, which overcompensated the negative impact of an accelerated amortization of capitalized sales commissions related to the on-premise business (see section (O) Capitalized Cost from Contracts with Customers – Costs of Obtaining Customer Contracts).
IFRS earnings per share (basic) increased 45% to €1.09. Non-IFRS earnings per share (basic) increased 32% to €1.45. The effective tax rate was 27.8% (IFRS) and 27.1% (non-IFRS).
Free cash flow in the third quarter increased by 69% to €865 million. While payments for taxes and share-based compensation increased, the positive development was driven by SAP’s profitability, improvements in working capital and lower payments for capex and leasing. For the first nine months, free cash flow was up 29% to €3.42 billion.
Share Repurchase Program
On May 16, SAP announced a new share repurchase program with an aggregate volume of up to €5 billion and a term until December 31, 2025. As of September 29, SAP had repurchased 7,190,252 shares at an average price of €125.49 with a purchased value of approximately €902 million under the program.
1 The Q3 2023 results were also impacted by other effects. For details, please refer to the disclosures on page 29 of this document.
3/29
 | Business Highlights |
In the third quarter, customers around the globe continued to choose “RISE with SAP” to drive their end-to-end business transformations. These customers included ADAC, Alnatura, BC Hydro, Bobst Mex, Constellium, Graybar, Hitachi Zosen Corporation, KAESER KOMPRESSOREN, LG Electronics, LG Energy Solution, PUMA, Siemens Healthineers, and University of Leeds.
BMW Group, Celltrion Healthcare, City of Vancouver, Schneider Electric, Toll Group, and UPL Limited went live on SAP S/4HANA Cloud in the third quarter.
Atria, elobau, Leanin’ Tree, Northstar Clean Technologies, PERSSA, Phoenix Global, Tait International, and Ziegler Holding chose “GROW with SAP”, a new offering helping midsize customers adopt cloud ERP with speed, predictability, and continuous innovation.
Key customer wins across SAP’s solution portfolio included: Accenture, Adobe, BVG (Berlin public transport), Ecovacs, freenet DLS, Fressnapf, Heidelberger Druckmaschinen, Hyundai Motor Company / Kia, Jollibee Foods Corporation, Lenovo, RICOH, Salling Group, and thyssenkrupp Steel Europe.
Ducati Motor Holding, Gilead Sciences, Hunkemöller, The KaDeWe Group, Swiss Federal Railways, and SCOTT Sports went live on SAP solutions.
In the third quarter, SAP’s cloud revenue performance was particularly strong in APJ and EMEA and solid in the Americas region. Brazil, India, and the Netherlands had outstanding cloud revenue growth while Canada, China, France, Germany, Japan, and Switzerland performed particularly strong.
On July 4, 2023, SAP was informed that Standard and Poor’s (S&P) upgraded its credit rating to A+ from A, citing SAP’s sound cloud transition execution, its track record of deleveraging quickly and its high cash generation.
On July 18, SAP announced the next step in its commitment to deliver Business AI that is relevant, reliable, and responsible with strategic investments in three leading generative AI companies. The investments in Aleph Alpha, Anthropic, and Cohere reinforce SAP’s open ecosystem approach to AI, leveraging the best technology to embed AI across SAP’s portfolio.
On August 29, SAP announced that Gina Vargiu-Breuer has been appointed to the Executive Board of SAP as Chief People Officer and labor director, effective from February 1, 2024. She will succeed Sabine Bendiek, who will be leaving the company at her own request upon the end of her term on December 31, 2023.
On August 29, SAP and Google Cloud announced an expanded partnership to help enterprises harness the power of data and generative AI. The companies will combine their integrated open data cloud using the SAP Datasphere solution with Vertex AI to launch new generative AI-powered industry solutions starting with automotive and to introduce new capabilities to help customers improve sustainability performance.
On September 1, SAP announced the appointment of Walter Sun as Global Head of Artificial Intelligence. Sun joined SAP from Microsoft where he served as vice president of Copilot Applied Artificial Intelligence for business applications.
On September 7, SAP and LeanIX GmbH announced that SAP has entered into an agreement to acquire LeanIX, a leader in enterprise architecture management (EAM) software. The planned acquisition is expected to help SAP expand its business transformation portfolio, giving customers access to the full suite of tools required for continuous business transformation and facilitating AI-enabled process optimization. The transaction is expected to close in the fourth quarter of 2023, subject to customary closing conditions and regulatory approvals.
On September 26, SAP announced Joule, a natural-language, generative AI copilot. Joule will be embedded throughout SAP’s cloud enterprise portfolio, delivering proactive and contextualized insights from across the breadth and depth of SAP solutions and third-party sources.
4/29
Segment Results at a Glance
SAP’s reportable segment showed the following performance:
| Applications, Technology & Services1 | Q3 2023 | ||
€ million, unless otherwise stated (Non-IFRS) | Actual Currency | ∆ in % | ∆ in % Constant Currency |
| Cloud revenue – SaaS2 | 2,448 | 17 | 24 |
| Cloud revenue – PaaS3 | 558 | 39 | 46 |
| Cloud revenue – IaaS4 | 186 | –20 | –16 |
| Cloud revenue | 3,192 | 17 | 24 |
| Cloud gross profit – SaaS2 | 1,750 | 18 | 26 |
| Cloud gross profit – PaaS3 | 473 | 48 | 55 |
| Cloud gross profit – IaaS4 | 70 | 1 | –3 |
| Cloud gross profit | 2,292 | 23 | 30 |
| Segment revenue | 7,460 | 3 | 9 |
| Segment profit (loss) | 2,666 | 18 | 24 |
| Segment margin (in %) | 35.7 | 4.3pp | 4.4pp |
1 Segment information for comparative prior periods were restated to conform with the new segment composition.
2 Software as a service: SaaS comprises all other offerings which are not shown as PaaS and IaaS.
3 Platform as a service: PaaS primarily includes SAP Business Technology Platform and SAP Signavio.
4 Infrastructure as a service: A major portion of IaaS comes from SAP HANA Enterprise Cloud.
In the third quarter, segment revenue in AT&S was up 3% to €7.46 billion and up 9% at constant currencies, primarily due to strong cloud revenue growth, which was supported by SAP S/4HANA as well as Business Technology Platform. Operating Expenses of the segment decreased by 3% and increased by 2% at constant currencies, resulting in a segment margin of 35.7% and 35.8% at constant currencies. This implies a growth of 4.3 percentage points and 4.4 percentage points at constant currencies compared to the third quarter of the prior year.
Cloud Performance
| Q3 2023 | Q1–Q3 2023 | ||||||
€ millions, unless otherwise stated (non-IFRS) | Actual Currency | ∆ in % | ∆ in % Constant Currency | Actual Currency | ∆ in % | ∆ in % Constant Currency | |
| Current Cloud Backlog | |||||||
| Total | 12,269 | 19 | 25 | 12,269 | 19 | 25 | |
| Thereof SAP S/4HANA | 4,199 | 58 | 66 | 4,199 | 58 | 66 | |
| Cloud Revenue | |||||||
| SaaS1 | 2,727 | 16 | 23 | 7,827 | 20 | 22 | |
| PaaS2 | 558 | 39 | 46 | 1,561 | 43 | 46 | |
| IaaS3 | 186 | –20 | –16 | 577 | –18 | –17 | |
| Total | 3,472 | 16 | 23 | 9,965 | 19 | 22 | |
| Thereof SAP S/4HANA | 914 | 67 | 77 | 2,453 | 72 | 77 | |
| Cloud Gross Profit | |||||||
| SaaS1 | 2,016 | 17 | 24 | 5,688 | 20 | 23 | |
| PaaS2 | 473 | 48 | 55 | 1,316 | 49 | 53 | |
| IaaS3 | 70 | 1 | –3 | 219 | –11 | –11 | |
| Total | 2,558 | 21 | 28 | 7,222 | 23 | 26 | |
| Cloud Gross Margin (in %) | |||||||
| SaaS1 (in %) | 73.9 | 0.6pp | 0.7pp | 72.7 | 0.2pp | 0.4pp | |
| PaaS2 (in %) | 84.7 | 5.0pp | 5.0pp | 84.3 | 3.8pp | 3.9pp | |
5/29
| Q3 2023 | Q1–Q3 2023 | ||||||
€ millions, unless otherwise stated (non-IFRS) | Actual Currency | ∆ in % | ∆ in % Constant Currency | Actual Currency | ∆ in % | ∆ in % Constant Currency | |
| IaaS3 (in %) | 37.4 | 7.9pp | 4.6pp | 37.9 | 3.0pp | 2.4pp | |
| Total | 73.7 | 2.9pp | 2.9pp | 72.5 | 2.1pp | 2.3pp | |
1 Software as a service: SaaS comprises all other offerings which are not shown as PaaS and IaaS.
2 Platform as a service: PaaS primarily includes SAP Business Technology Platform and SAP Signavio.
3 Infrastructure as a service: A major portion of IaaS comes from SAP HANA Enterprise Cloud.
Due to rounding, numbers may not add up precisely.
 | Business Outlook |
Financial Outlook 2023
For 2023, SAP continues to expect:
| ● | €14.0 – 14.2 billion cloud revenue at constant currencies (2022: €11.43 billion), up 23% to 24% at constant currencies. |
| ● | €27.0 – 27.4 billion cloud and software revenue at constant currencies (2022: €25.39 billion), up 6% to 8% at constant currencies. |
| €8.65 – 8.95 billion non-IFRS operating profit at constant currencies (2022: €7.99 billion), up 8% to 12% at constant currencies. |
| ● | A share of more predictable revenue of approximately 82% (2022: 79%). |
| ● | Free cash flow of approximately €4.9 billion (2022: €4.4 billion). |
| ● | An effective tax rate (IFRS) of 28.0% to 32.0% (2022: 32.0%) and an effective tax rate (non-IFRS) of 26.0% to 28.0% (2022: 29.6%). |
While SAP’s 2023 financial outlook is at constant currencies, actual currency reported figures are expected to be impacted by currency exchange rate fluctuations as the Company progresses through the year. See the table below.
Currency Impact Assuming September 2023 Rates Apply for 2023
| In percentage points | Q4 2023 | FY 2023 |
| Cloud revenue growth | –5pp to –3pp | –4pp to –2pp |
| Cloud and software revenue growth | –4pp to –2pp | –4pp to –2pp |
| Operating profit growth (non-IFRS) | –4pp to –2pp | –5pp to –3pp |
Non-Financial Outlook 2023
SAP continues to focus on three non-financial indicators: customer loyalty, employee engagement, and carbon emissions.
In 2023, SAP continues to expect:
| ● | a Customer Net Promoter Score of 8 to 122. |
| ● | an Employee Engagement Index to be in a range of 76% to 80%. |
| ● | Net carbon emissions of 0kt, meaning the Company will be carbon neutral in its own operations. |
2 The guidance is based on an adjusted methodology for 2023 to better reflect the business priorities of the company.
6/29
 | Additional Information |
This press release and all information therein is preliminary and unaudited. Due to rounding, numbers may not add up precisely.
SAP Performance Measures
For more information about our key growth metrics and performance measures, their calculation, their usefulness, and their limitations, please refer to the following document on our Investor Relations website: https://www.sap.com/investors/performance-measures
Webcast
SAP senior management will host a financial analyst conference call on Wednesday, October 18th at 11:00 PM (CEST) / 10:00 PM (BST) / 5:00 PM (EDT) / 2:00 PM (PDT). The conference will be webcast on the Company’s website at https://www.sap.com/investor and will be available for replay. Supplementary financial information pertaining to the third quarter results can be found at https://www.sap.com/investor.
About SAP
SAP’s strategy is to help every business run as an intelligent enterprise. As a market leader in enterprise application software, we help companies of all sizes and in all industries run at their best: SAP customers generate 87% of total global commerce. Our machine learning, Internet of Things (IoT), and advanced analytics technologies help turn customers’ businesses into intelligent enterprises. SAP helps give people and organizations deep business insight and fosters collaboration that helps them stay ahead of their competition. We simplify technology for companies so they can consume our software the way they want – without disruption. Our end-to-end suite of applications and services enables business and public customers across 25 industries globally to operate profitably, adapt continuously, and make a difference. With a global network of customers, partners, employees, and thought leaders, SAP helps the world run better and improve people’s lives. For more information, visit www.sap.com.
For more information, financial community only:
| Anthony Coletta | +49 (6227) 7-60437 | investor@sap.com, CET |
Follow SAP Investor Relations on X at @sapinvestor.
For more information, press only:
| Joellen Perry | +1 (650) 445-6780 | joellen.perry@sap.com, PT |
| Daniel Reinhardt | +49 (6227) 7-40201 | daniel.reinhardt@sap.com, CET |
For customers interested in learning more about SAP products:
| Global Customer Center: | +49 180 534-34-24 |
| United States Only: | +1 (800) 872-1SAP (+1-800-872-1727) |
Note to editors:
To preview and download broadcast-standard stock footage and press photos digitally, please visit www.sap.com/photos. On this platform, you can find high resolution material for your media channels. To view video stories on diverse topics, visit www.sap-tv.com. From this site, you can embed videos into your own Web pages, share video via email links, and subscribe to RSS feeds from SAP TV.
This document contains forward-looking statements, which are predictions, projections, or other statements about future events. These statements are based on current expectations, forecasts, and assumptions that are subject to risks and uncertainties that could cause actual results and outcomes to materially differ. Additional information regarding these risks and uncertainties may be found in our filings with the Securities and Exchange Commission, including but not limited to the risk factors section of SAP’s 2022 Annual Report on Form 20-F.
© 2023 SAP SE. All rights reserved.
SAP and other SAP products and services mentioned herein as well as their respective logos are trademarks or registered trademarks of SAP SE in Germany and other countries. Please see https://www.sap.com/copyright for additional trademark information and notices.
7/29
Contents
8/29
Financial and Non-Financial Key Facts
(IFRS and Non-IFRS)
| € millions, unless otherwise stated | Q1 2022 | Q2 2022 | Q3 2022 | Q4 2022 | TY 2022 | Q1 2023 | restated 20231 | Q3 2023 |
| Revenues | ||||||||
| Cloud | 2,565 | 2,796 | 2,986 | 3,078 | 11,426 | 3,178 | 3,316 | 3,472 |
| % change – yoy | 29 | 32 | 36 | 29 | 31 | 24 | 19 | 16 |
| % change constant currency – yoy | 23 | 23 | 23 | 21 | 23 | 22 | 22 | 23 |
| SAP S/4HANA Cloud | 404 | 472 | 546 | 660 | 2,081 | 716 | 823 | 914 |
| % change – yoy | 78 | 84 | 98 | 101 | 91 | 77 | 74 | 67 |
| % change constant currency – yoy | 71 | 72 | 81 | 90 | 79 | 75 | 79 | 77 |
| Software licenses | 317 | 426 | 406 | 907 | 2,056 | 276 | 316 | 335 |
| % change – yoy | –34 | –34 | –38 | –38 | –37 | –13 | –26 | –17 |
| % change constant currency – yoy | –36 | –38 | –42 | –39 | –39 | –13 | –24 | –14 |
| Software support | 2,923 | 2,977 | 3,016 | 2,993 | 11,909 | 2,905 | 2,873 | 2,872 |
| % change – yoy | 4 | 5 | 5 | 3 | 4 | –1 | –3 | –5 |
| % change constant currency – yoy | 1 | 0 | –2 | –1 | 0 | –1 | –1 | –1 |
| Software licenses and support | 3,240 | 3,403 | 3,422 | 3,900 | 13,965 | 3,180 | 3,189 | 3,208 |
| % change – yoy | –1 | –2 | –3 | –11 | –5 | –2 | –6 | –6 |
| % change constant currency – yoy | –4 | –7 | –9 | –14 | –9 | –2 | –4 | –2 |
| Cloud and software | 5,806 | 6,199 | 6,408 | 6,978 | 25,391 | 6,358 | 6,505 | 6,679 |
| % change – yoy | 10 | 11 | 12 | 3 | 9 | 10 | 5 | 4 |
| % change constant currency – yoy | 6 | 4 | 3 | –1 | 3 | 8 | 8 | 9 |
| Total revenue | 6,773 | 7,207 | 7,476 | 8,064 | 29,520 | 7,441 | 7,554 | 7,744 |
| % change – yoy | 10 | 11 | 13 | 5 | 10 | 10 | 5 | 4 |
| % change constant currency – yoy | 6 | 5 | 4 | 0 | 4 | 9 | 8 | 9 |
| Share of more predictable revenue (in %) | 81 | 80 | 80 | 75 | 79 | 82 | 82 | 82 |
| Profits | ||||||||
| Operating profit (loss) (IFRS) | 1,471 | 1,060 | 1,557 | 2,002 | 6,090 | 803 | 1,358 | 1,724 |
| Operating profit (loss) (non-IFRS) | 1,676 | 1,678 | 2,075 | 2,560 | 7,989 | 1,875 | 2,058 | 2,278 |
| % change | –3 | –12 | –1 | 3 | –3 | 12 | 23 | 10 |
| % change constant currency | –6 | –15 | –8 | 1 | –7 | 12 | 28 | 16 |
| Profit (loss) after tax (IFRS) | 1,016 | 613 | 839 | 600 | 3,068 | 403 | 724 | 1,272 |
| Profit (loss) after tax (non-IFRS) | 1,171 | 1,098 | 1,240 | 1,008 | 4,517 | 1,254 | 1,249 | 1,687 |
| % change | –29 | –50 | –42 | –56 | –45 | 7 | 14 | 36 |
| Margins | ||||||||
| Cloud gross margin (IFRS, in %) | 68.2 | 70.2 | 69.8 | 69.2 | 69.4 | 70.5 | 71.1 | 72.7 |
| Cloud gross margin (non-IFRS, in %) | 68.9 | 71.2 | 70.8 | 70.3 | 70.3 | 71.4 | 72.2 | 73.7 |
| Software license and support gross margin (IFRS, in %) | 89.3 | 90.1 | 90.0 | 90.8 | 90.1 | 88.6 | 90.1 | 90.0 |
| Software license and support gross margin (non-IFRS, in %) | 89.7 | 90.7 | 90.7 | 91.4 | 90.7 | 89.2 | 90.5 | 90.4 |
| Cloud and software gross margin (IFRS, in %) | 80.0 | 81.1 | 80.6 | 81.3 | 80.8 | 79.5 | 80.3 | 81.0 |
| Cloud and software gross margin (non-IFRS, in %) | 80.5 | 81.9 | 81.4 | 82.1 | 81.5 | 80.3 | 81.2 | 81.7 |
| Gross margin (IFRS, in %) | 72.2 | 72.7 | 72.8 | 73.4 | 72.8 | 71.0 | 71.6 | 72.8 |
| Gross margin (non-IFRS, in %) | 73.1 | 74.3 | 74.4 | 75.1 | 74.3 | 72.9 | 73.8 | 74.5 |
| Operating margin (IFRS, in %) | 21.7 | 14.7 | 20.8 | 24.8 | 20.6 | 10.8 | 18.0 | 22.3 |
| Operating margin (non-IFRS, in %) | 24.8 | 23.3 | 27.8 | 31.7 | 27.1 | 25.2 | 27.2 | 29.4 |
| ATS segment – Segment gross margin (in %) | 72.5 | 73.7 | 73.3 | 74.5 | 73.5 | 72.3 | 73.3 | 74.3 |
| ATS segment – Segment margin in % | 28.9 | 27.6 | 31.4 | 35.0 | 30.9 | 29.6 | 32.3 | 35.7 |
| Key Profit Ratios | ||||||||
| Effective tax rate (IFRS, in %) | 25.5 | 34.2 | 28.3 | 42.8 | 32.0 | 40.5 | 33.8 | 27.8 |
9/29
| € millions, unless otherwise stated | Q1 2022 | Q2 2022 | Q3 2022 | Q4 2022 | TY 2022 | Q1 2023 | restated 20231 | Q3 2023 |
| Effective tax rate (non-IFRS, in %) | 25.4 | 29.1 | 26.6 | 37.2 | 29.6 | 28.3 | 30.4 | 27.1 |
| Earnings per share, basic (IFRS, in €) from continuing operations | 0.87 | 0.54 | 0.75 | 0.63 | 2.80 | 0.35 | 0.62 | 1.09 |
| Earnings per share, basic (non-IFRS, in €) from continuing operations | 1.00 | 0.95 | 1.10 | 0.98 | 4.03 | 1.08 | 1.07 | 1.45 |
| Earnings per share, basic (IFRS, in €)1,2 | 0.63 | 0.29 | 0.57 | 0.46 | 1.95 | 0.41 | 2.63 | 1.09 |
| Earnings per share, basic (non-IFRS, in €)1,2 | 1.00 | 0.96 | 1.12 | 1.00 | 4.08 | 1.27 | 2.81 | 1.45 |
| Order Entry and current cloud backlog | ||||||||
| Current cloud backlog | 8,937 | 9,543 | 10,334 | 11,024 | 11,024 | 11,148 | 11,537 | 12,269 |
| % change – yoy | 25 | 32 | 36 | 27 | 27 | 25 | 21 | 19 |
| % change constant currency – yoy | 21 | 23 | 24 | 24 | 24 | 25 | 25 | 25 |
| SAP S/4HANA Current cloud backlog | 1,925 | 2,258 | 2,662 | 3,171 | 3,171 | 3,418 | 3,717 | 4,199 |
| % change – yoy | 86 | 100 | 108 | 86 | 86 | 78 | 65 | 58 |
| % change constant currency – yoy | 79 | 87 | 90 | 82 | 82 | 79 | 70 | 66 |
| Share of cloud orders greater than €5 million based on total cloud order entry volume (in %)3 | 43 | 49 | 42 | 55 | 50 | 45 | 46 | 49 |
| Share of cloud orders smaller than €1 million based on total cloud order entry volume (in %)3 | 29 | 25 | 26 | 18 | 23 | 26 | 25 | 21 |
| Share of on-premise orders greater than €5 million based on total software order entry volume (in %) | 40 | 33 | 28 | 29 | 31 | 26 | 22 | 21 |
| Share of on-premise orders smaller than €1 million based on total software order entry volume (in %) | 33 | 40 | 49 | 37 | 40 | 50 | 50 | 44 |
| Liquidity and Cash Flow | ||||||||
| Net cash flows from operating activities | 2,465 | 301 | 887 | 2,022 | 5,675 | 2,311 | 848 | 1,124 |
| Capital expenditure | –212 | –196 | –277 | –193 | –877 | –257 | –156 | –182 |
| Payments of lease liabilities | –93 | –116 | –97 | –103 | –410 | –99 | –89 | –78 |
| Free cash flow | 2,159 | –10 | 513 | 1,726 | 4,388 | 1,955 | 604 | 865 |
| % of total revenue | 32 | 0 | 7 | 21 | 15 | 26 | 8 | 11 |
| % of profit after tax (IFRS) | 213 | –2 | 61 | 288 | 143 | 485 | 83 | 68 |
| Group liquidity | 11,267 | 8,236 | 8,554 | 9,694 | 9,694 | 9,700 | 14,326 | 12,122 |
| Financial debt (–) | –12,171 | –12,282 | –12,282 | –11,764 | –11,764 | –10,751 | –10,146 | –8,445 |
| Net debt (–) | –904 | –4,046 | –3,728 | –2,070 | –2,070 | –1,050 | 4,180 | 3,677 |
| Financial Position | ||||||||
| Cash and cash equivalents | 8,927 | 7,472 | 7,316 | 9,008 | 9,008 | 8,766 | 14,142 | 9,378 |
| Goodwill | 32,140 | 33,879 | 35,664 | 33,077 | 33,077 | 28,563 | 28,581 | 29,144 |
| Total assets | 73,754 | 72,605 | 74,840 | 72,159 | 72,159 | 73,533 | 69,719 | 68,011 |
| Contract liabilities (current) | 7,630 | 6,883 | 5,487 | 5,309 | 5,309 | 7,547 | 6,743 | 5,256 |
| Equity ratio (total equity in % of total assets)1 | 58 | 59 | 62 | 59 | 59 | 58 | 60 | 64 |
| Non-Financials | ||||||||
| Number of employees (quarter end)4 | 104,670 | 104,988 | 106,912 | 106,312 | 106,312 | 105,132 | 105,328 | 106,495 |
| Employee retention (in %, rolling 12 months) | 92.5 | 92.0 | 92.2 | 92.8 | 92.8 | 93.8 | 95.1 | 96.0 |
| Women in management (in %, quarter end) | 28.6 | 28.9 | 29.2 | 29.3 | 29.3 | 29.4 | 29.5 | 29.5 |
| Net carbon emissions5 (in kilotons) | 20 | 20 | 20 | 20 | 85 | 0 | 0 | 0 |
1 During the third quarter 2023, SAP identified a need for an error correction in the accounting related to the divestiture of Qualtrics as reported in Q2. The affected financial statement line items have been restated. The error correction is limited to SAP’s discontinued operations. SAP’s continuing operations net income as well as total operating, investing, or financing cash flows for the second quarter ended June 30, 2023, were not impacted. For details, please refer to section (N) Correction of Q2 2023 Qualtrics divestiture reporting in this quarterly statement.
2 From continuing and discontinued operations.
3 To conform to refined calculation logic, prior quarters have been adjusted.
4 In full-time equivalents.
5 In CO2 equivalents. SAP’s carbon emission numbers are rounded to the nearest 5 kt. Therefore, the rounded full-year totals may not precisely equal the sum of the rounded quarterly numbers.
10/29
Primary Financial Statements of SAP Group (IFRS)
(A) Consolidated Income Statements
(A.1) Consolidated Income Statements – Quarter
| € millions, unless otherwise stated | Q3 2023 | Q3 2022 | ∆ in % | |
| Cloud | 3,472 | 2,986 | 16 | |
| Software licenses | 335 | 406 | –17 | |
| Software support | 2,872 | 3,016 | –5 | |
| Software licenses and support | 3,208 | 3,422 | –6 | |
| Cloud and software | 6,679 | 6,408 | 4 | |
| Services | 1,065 | 1,069 | 0 | |
| Total revenue | 7,744 | 7,476 | 4 | |
| Cost of cloud | –946 | –902 | 5 | |
| Cost of software licenses and support | –321 | –341 | –6 | |
| Cost of cloud and software | –1,268 | –1,242 | 2 | |
| Cost of services | –840 | –795 | 6 | |
| Total cost of revenue | –2,108 | –2,037 | 3 | |
| Gross profit | 5,637 | 5,439 | 4 | |
| Research and development | –1,515 | –1,571 | –4 | |
| Sales and marketing | –2,105 | –1,997 | 5 | |
| General and administration | –327 | –333 | –2 | |
| Restructuring | 36 | 8 | >100 | |
| Other operating income/expense, net | –2 | 10 | <-100 | |
| Total operating expenses | –6,020 | –5,919 | 2 | |
| Operating profit (loss) | 1,724 | 1,557 | 11 | |
| Other non-operating income/expense, net | 112 | –54 | <-100 | |
| Finance income | 204 | 163 | 25 | |
| Finance costs | –279 | –496 | –44 | |
| Financial income, net | –75 | –333 | –77 | |
| Profit (loss) before tax from continuing operations | 1,761 | 1,170 | 50 | |
| Income tax expense | –489 | –332 | 47 | |
| Profit (loss) after tax from continuing operations | 1,272 | 839 | 52 | |
| Attributable to owners of parent | 1,278 | 880 | 45 | |
| Attributable to non-controlling interests | –6 | –42 | –85 | |
| Profit (loss) after tax from discontinued operations | 0 | –292 | –100 | |
| Profit (loss) after tax2 | 1,272 | 547 | >100 | |
| Attributable to owners of parent2 | 1,278 | 669 | 91 | |
| Attributable to non-controlling interests2 | –6 | –123 | –95 | |
| Earnings per share, basic (in €)1 from continuing operations | 1.09 | 0.75 | 45 | |
| Earnings per share, basic (in €)1, 2 | 1.09 | 0.57 | 91 | |
| Earnings per share, diluted (in €)1 from continuing operations | 1.08 | 0.75 | 44 | |
| Earnings per share, diluted (in €)1, 2 | 1.08 | 0.57 | 90 |
1 For the three months ended September 30, 2023 and 2022, the weighted average number of shares was 1,168 million (diluted 1,180 million) and 1,168 million (diluted: 1,173 million), respectively (treasury stock excluded).
2 From continuing and discontinued operations
11/29
(A.2) Consolidated Income Statements – Year-to-Date
| € millions, unless otherwise stated | Q1–Q3 2023 | Q1–Q3 2022 | ∆ in % | |
| Cloud | 9,965 | 8,348 | 19 | |
| Software licenses | 927 | 1,149 | –19 | |
| Software support | 8,651 | 8,916 | –3 | |
| Software licenses and support | 9,577 | 10,065 | –5 | |
| Cloud and software | 19,542 | 18,413 | 6 | |
| Services | 3,197 | 3,043 | 5 | |
| Total revenue | 22,739 | 21,456 | 6 | |
| Cost of cloud | –2,843 | –2,552 | 11 | |
| Cost of software licenses and support | –1,008 | –1,027 | –2 | |
| Cost of cloud and software | –3,852 | –3,578 | 8 | |
| Cost of services | –2,557 | –2,311 | 11 | |
| Total cost of revenue | –6,409 | –5,889 | 9 | |
| Gross profit | 16,330 | 15,567 | 5 | |
| Research and development | –4,653 | –4,481 | 4 | |
| Sales and marketing | –6,562 | –5,838 | 12 | |
| General and administration | –997 | –943 | 6 | |
| Restructuring | –221 | –111 | 100 | |
| Other operating income/expense, net | –12 | –105 | –89 | |
| Total operating expenses | –18,854 | –17,368 | 9 | |
| Operating profit (loss) | 3,885 | 4,088 | –5 | |
| Other non-operating income/expense, net | 9 | –117 | <-100 | |
| Finance income | 573 | 683 | –16 | |
| Finance costs | –935 | –1,188 | –21 | |
| Financial income, net | –363 | –506 | –28 | |
| Profit (loss) before tax from continuing operations | 3,532 | 3,466 | 2 | |
| Income tax expense | –1,132 | –998 | 13 | |
| Profit (loss) after tax from continuing operations | 2,399 | 2,468 | –3 | |
| Attributable to owners of parent | 2,413 | 2,537 | –5 | |
| Attributable to non-controlling interests | –13 | –69 | –81 | |
| Profit (loss) after tax from discontinued operations | 2,272 | –1,086 | <-100 | |
| Profit (loss) after tax2 | 4,671 | 1,382 | >100 | |
| Attributable to owners of parent2 | 4,826 | 1,743 | >100 | |
| Attributable to non-controlling interests2 | –155 | –362 | –57 | |
| Earnings per share, basic (in €)1 from continuing operations | 2.07 | 2.17 | –5 | |
| Earnings per share, basic (in €)1, 2 | 4.13 | 1.49 | >100 | |
| Earnings per share, diluted (in €)1 from continuing operations | 2.05 | 2.16 | –5 | |
| Earnings per share, diluted (in €)1, 2 | 4.09 | 1.48 | >100 |
1 For the nine months ended September 30, 2023 and 2022, the weighted average number of shares was 1,168 million (diluted: 1,179 million) and 1,172 million (diluted: 1,175 million), respectively (treasury stock excluded).
2 From continuing and discontinued operations
12/29
(B) Consolidated Statements of Financial Position
| as at 9/30/2023 and 12/31/2022 | ||
| € millions | 2023 | 2022 |
| Cash and cash equivalents | 9,378 | 9,008 |
| Other financial assets | 3,050 | 853 |
| Trade and other receivables | 5,355 | 6,236 |
| Other non-financial assets | 2,375 | 2,139 |
| Tax assets | 660 | 287 |
| Total current assets | 20,817 | 18,522 |
| Goodwill | 29,144 | 33,077 |
| Intangible assets | 2,190 | 3,835 |
| Property, plant, and equipment | 4,402 | 4,934 |
| Other financial assets | 5,631 | 5,626 |
| Trade and other receivables | 117 | 169 |
| Other non-financial assets | 3,421 | 3,580 |
| Tax assets | 334 | 323 |
| Deferred tax assets | 1,954 | 2,095 |
| Total non-current assets | 47,194 | 53,638 |
| Total assets | 68,011 | 72,159 |
| € millions | 2023 | 2022 |
| Trade and other payables | 1,618 | 2,147 |
| Tax liabilities | 312 | 283 |
| Financial liabilities | 1,640 | 4,808 |
| Other non-financial liabilities | 4,289 | 4,818 |
| Provisions | 276 | 90 |
| Contract liabilities | 5,256 | 5,309 |
| Total current liabilities | 13,391 | 17,453 |
| Trade and other payables | 50 | 79 |
| Tax liabilities | 954 | 893 |
| Financial liabilities | 9,228 | 9,547 |
| Other non-financial liabilities | 624 | 705 |
| Provisions | 343 | 359 |
| Deferred tax liabilities | 155 | 241 |
| Contract liabilities | 24 | 33 |
| Total non-current liabilities | 11,379 | 11,858 |
| Total liabilities | 24,771 | 29,311 |
| Issued capital | 1,229 | 1,229 |
| Share premium | 1,675 | 3,081 |
| Retained earnings | 41,102 | 36,418 |
| Other components of equity | 3,775 | 3,801 |
| Treasury shares | –4,821 | –4,341 |
| Equity attributable to owners of parent | 42,959 | 40,186 |
| Non-controlling interests | 281 | 2,662 |
| Total equity | 43,241 | 42,848 |
| Total equity and liabilities | 68,011 | 72,159 |
13/29
(C) Consolidated Statements of Cash Flows
| € millions | Q1–Q3 2023 | Q1–Q3 20221 |
| Profit (loss) after tax | 4,671 | 1,382 |
| Adjustments to reconcile profit (loss) after tax to net cash flows from operating activities: | ||
| (Profit) loss after tax from discontinued operations | –2,272 | 1,086 |
| Depreciation and amortization | 1,042 | 1,180 |
| Share-based payment expense | 1,677 | 937 |
| Income tax expense | 1,132 | 998 |
| Financial income, net | 363 | 506 |
| Decrease/increase in allowances on trade receivables | 12 | 72 |
| Other adjustments for non-cash items | –35 | 2 |
| Decrease/increase in trade and other receivables | 678 | 1,329 |
| Decrease/increase in other assets | –555 | –704 |
| Increase/decrease in trade payables, provisions, and other liabilities | –470 | –1,039 |
| Increase/decrease in contract liabilities | 552 | 523 |
| Share-based payments | –967 | –1,077 |
| Interest paid | –305 | –169 |
| Interest received | 331 | 84 |
| Income taxes paid, net of refunds | –1,570 | –1,457 |
| Net cash flows from operating activities – continuing operations | 4,284 | 3,653 |
| Net cash flows from operating activities – discontinued operations | 80 | –51 |
| Net cash flows from operating activities | 4,364 | 3,602 |
| Business combinations, net of cash and cash equivalents acquired | 0 | –679 |
| Cash flows from derivative financial instruments related to the sale of subsidiaries or businesses | –91 | 0 |
| Purchase of intangible assets or property, plant, and equipment | –595 | –685 |
| Proceeds from sales of intangible assets or property, plant, and equipment | 72 | 65 |
| Purchase of equity or debt instruments of other entities | –2,969 | –2,772 |
| Proceeds from sales of equity or debt instruments of other entities | 865 | 4,164 |
| Net cash flows from investing activities – continuing operations | –2,718 | 94 |
| Net cash flows from investing activities – discontinued operations | 5,625 | –20 |
| Net cash flows from investing activities | 2,907 | 74 |
| Dividends paid | –2,395 | –2,865 |
| Dividends paid on non-controlling interests | –18 | –13 |
| Purchase of treasury shares | –718 | –1,500 |
| Proceeds from borrowings | 0 | 38 |
| Repayments of borrowings | –3,442 | –1,016 |
| Payments of lease liabilities | –266 | –307 |
| Transactions with non-controlling interests | 42 | 0 |
| Net cash flows from financing activities – continuing operations | –6,797 | –5,663 |
| Net cash flows from financing activities – discontinued operations | 24 | –228 |
| Net cash flows from financing activities | –6,773 | –5,891 |
| Effect of foreign currency rates on cash and cash equivalents | –128 | 634 |
| Net decrease/increase in cash and cash equivalents | 370 | –1,582 |
| Cash and cash equivalents at the beginning of the period | 9,008 | 8,898 |
| Cash and cash equivalents at the end of the period | 9,378 | 7,316 |
1 We do no longer show cash flows linked to the supply chain financing (SCF) transactions from Taulia in investing/financing cash flow separately and therefore adjusted the comparative figures accordingly.
Due to rounding, numbers may not add up precisely.
14/29
(D) Basis of Non-IFRS Presentation
SAP disclose certain financial measures such as expense (non-IFRS) and profit measures (non-IFRS) that are not prepared in accordance with IFRS and are therefore considered non-IFRS financial measures.
For a more detailed description of all of SAP’s non-IFRS measures and their limitations as well as SAP’s constant currency and free cash flow figures, see Explanation of Non-IFRS Measures online.
(E) Reconciliation from Non-IFRS Numbers to IFRS Numbers
(E.1) Reconciliation of Non-IFRS Revenue – Quarter
| € millions, unless otherwise stated | Q3 2023 | Q3 2022 | ∆ in % | |||
| IFRS | Currency Impact | Non-IFRS Constant Currency | IFRS | IFRS | Non-IFRS Constant Currency | |
| Revenue Numbers | ||||||
| Cloud | 3,472 | 194 | 3,666 | 2,986 | 16 | 23 |
| Software licenses | 335 | 14 | 349 | 406 | –17 | –14 |
| Software support | 2,872 | 126 | 2,998 | 3,016 | –5 | –1 |
| Software licenses and support | 3,208 | 140 | 3,348 | 3,422 | –6 | –2 |
| Cloud and software | 6,679 | 335 | 7,014 | 6,408 | 4 | 9 |
| Services | 1,065 | 51 | 1,116 | 1,069 | 0 | 4 |
| Total revenue | 7,744 | 385 | 8,130 | 7,476 | 4 | 9 |
(E.2) Reconciliation of Non-IFRS Operating Expenses – Quarter
| € millions, unless otherwise stated | Q3 2023 | Q3 2022 | ∆ in % | ||||||||
| IFRS | Adj. | Non-IFRS | Currency Impact | Non-IFRS Constant Currency | IFRS | Adj. | Non-IFRS | IFRS | Non-IFRS | Non-IFRS Constant Currency | |
| Operating Expense Numbers | |||||||||||
| Cost of cloud | –946 | 33 | –914 | –902 | 29 | –873 | 5 | 5 | |||
| Cost of software licenses and support | –321 | 13 | –309 | –341 | 22 | –319 | –6 | –3 | |||
| Cost of cloud and software | –1,268 | 45 | –1,223 | –1,242 | 51 | –1,191 | 2 | 3 | |||
| Cost of services | –840 | 89 | –751 | –795 | 72 | –722 | 6 | 4 | |||
| Total cost of revenue | –2,108 | 134 | –1,974 | –2,037 | 123 | –1,914 | 3 | 3 | |||
| Gross profit | 5,637 | 134 | 5,770 | 5,439 | 123 | 5,563 | 4 | 4 | |||
| Research and development | –1,515 | 165 | –1,350 | –1,571 | 134 | –1,437 | –4 | –6 | |||
| Sales and marketing | –2,105 | 255 | –1,850 | –1,997 | 222 | –1,774 | 5 | 4 | |||
| General and administration | –327 | 37 | –291 | –333 | 46 | –287 | –2 | 1 | |||
| Restructuring | 36 | –36 | 0 | 8 | –8 | 0 | >100 | NA | |||
| Other operating income/expense, net | –2 | 0 | –2 | 10 | 0 | 10 | <-100 | <-100 | |||
| Total operating expenses | –6,020 | 554 | –5,466 | –254 | –5,720 | –5,919 | 518 | –5,401 | 2 | 1 | 6 |
15/29
(E.3) Reconciliation of Non-IFRS Profit Figures, Income Tax, and Key Ratios – Quarter
| € millions, unless otherwise stated | Q3 2023 | Q3 2022 | ∆ in % | ||||||||
| IFRS | Adj. | Non-IFRS | Currency Impact | Non-IFRS Constant Currency | IFRS | Adj. | Non-IFRS | IFRS | Non-IFRS | Non-IFRS Constant Currency | |
| Profit Numbers | |||||||||||
| Operating profit (loss) | 1,724 | 554 | 2,278 | 131 | 2,409 | 1,557 | 518 | 2,075 | 11 | 10 | 16 |
| Profit (loss) before tax from continuing operations | 1,761 | 554 | 2,315 | 1,170 | 518 | 1,688 | 50 | 37 | |||
| Income tax expense | –489 | –139 | –628 | –332 | –117 | –448 | 47 | 40 | |||
| Profit (loss) after tax from continuing operations | 1,272 | 415 | 1,687 | 839 | 401 | 1,240 | 52 | 36 | |||
| Attributable to owners of parent | 1,278 | 414 | 1,692 | 880 | 398 | 1,279 | 45 | 32 | |||
| Attributable to non-controlling interests | –6 | 1 | –5 | –42 | 2 | –39 | –85 | –87 | |||
| Profit (loss) after tax1 | 1,272 | 415 | 1,687 | 547 | 716 | 1,263 | >100 | 34 | |||
| Attributable to owners of parent1 | 1,278 | 414 | 1,692 | 669 | 634 | 1,303 | 91 | 30 | |||
| Attributable to non-controlling interests1 | –6 | 1 | –5 | –123 | 82 | –41 | –95 | –87 | |||
| Key Ratios | |||||||||||
| Operating margin (in %) | 22.3 | 29.4 | 29.6 | 20.8 | 27.8 | 1.4pp | 1.7pp | 1.9pp | |||
| Effective tax rate (in %)2 | 27.8 | 27.1 | 28.3 | 26.6 | –0.6pp | 0.6pp | |||||
| Earnings per share, basic (in €) from continuing operations | 1.09 | 1.45 | 0.75 | 1.10 | 45 | 32 | |||||
| Earnings per share, basic (in €)1 | 1.09 | 1.45 | 0.57 | 1.12 | 91 | 30 | |||||
1 From continuing and discontinued operations
2 The difference between our effective tax rate (IFRS) and effective tax rate (non-IFRS) in Q3 2023 and Q3 2022 mainly resulted from tax effects of share-based payment expenses, restructuring expenses and acquisition-related charges.
(E.4) Reconciliation of Non-IFRS Revenue – Year-to-Date
| € millions, unless otherwise stated | Q1–Q3 2023 | Q1–Q3 2022 | ∆ in % | |||
| IFRS | Currency Impact | Non-IFRS Constant Currency | IFRS | IFRS | Non-IFRS Constant Currency | |
| Revenue Numbers | ||||||
| Cloud | 9,965 | 233 | 10,198 | 8,348 | 19 | 22 |
| Software licenses | 927 | 24 | 950 | 1,149 | –19 | –17 |
| Software support | 8,651 | 180 | 8,830 | 8,916 | –3 | –1 |
| Software licenses and support | 9,577 | 204 | 9,781 | 10,065 | –5 | –3 |
| Cloud and software | 19,542 | 437 | 19,979 | 18,413 | 6 | 9 |
| Services | 3,197 | 65 | 3,263 | 3,043 | 5 | 7 |
| Total revenue | 22,739 | 503 | 23,242 | 21,456 | 6 | 8 |
16/29
(E.5) Reconciliation of Non-IFRS Operating Expenses – Year-to-Date
| € millions, unless otherwise stated | Q1–Q3 2023 | Q1–Q3 2022 | ∆ in % | ||||||||
| IFRS | Adj. | Non-IFRS | Currency Impact | Non-IFRS Constant Currency | IFRS | Adj. | Non-IFRS | IFRS | Non-IFRS | Non-IFRS Constant Currency | |
| Operating Expense Numbers | |||||||||||
| Cost of cloud | –2,843 | 101 | –2,743 | –2,552 | 75 | –2,477 | 11 | 11 | |||
| Cost of software licenses and support | –1,008 | 55 | –954 | –1,027 | 58 | –969 | –2 | –2 | |||
| Cost of cloud and software | –3,852 | 155 | –3,696 | –3,578 | 133 | –3,445 | 8 | 7 | |||
| Cost of services | –2,557 | 287 | –2,270 | –2,311 | 169 | –2,142 | 11 | 6 | |||
| Total cost of revenue | –6,409 | 443 | –5,966 | –5,889 | 302 | –5,587 | 9 | 7 | |||
| Gross profit | 16,330 | 443 | 16,773 | 15,567 | 302 | 15,869 | 5 | 6 | |||
| Research and development | –4,653 | 539 | –4,113 | –4,481 | 301 | –4,180 | 4 | –2 | |||
| Sales and marketing | –6,562 | 989 | –5,573 | –5,838 | 532 | –5,306 | 12 | 5 | |||
| General and administration | –997 | 134 | –864 | –943 | 95 | –848 | 6 | 2 | |||
| Restructuring | –221 | 221 | 0 | –111 | 111 | 0 | 100 | NA | |||
| Other operating income/expense, net | –12 | 0 | –12 | –105 | 0 | –105 | –89 | –89 | |||
| Total operating expenses | –18,854 | 2,326 | –16,528 | –274 | –16,803 | –17,368 | 1,341 | –16,027 | 9 | 3 | 5 |
(E.6) Reconciliation of Non-IFRS Profit Figures, Income Tax, and Key Ratios – Year-to-Date
| € millions, unless otherwise stated | Q1–Q3 2023 | Q1–Q3 2022 | ∆ in % | ||||||||
| IFRS | Adj. | Non-IFRS | Currency Impact | Non-IFRS Constant Currency | IFRS | Adj. | Non-IFRS | IFRS | Non-IFRS | Non-IFRS Constant Currency | |
| Profit Numbers | |||||||||||
| Operating profit (loss) | 3,885 | 2,326 | 6,211 | 228 | 6,439 | 4,088 | 1,341 | 5,429 | –5 | 14 | 19 |
| Profit (loss) before tax from continuing operations | 3,532 | 2,326 | 5,857 | 3,466 | 1,341 | 4,807 | 2 | 22 | |||
| Income tax expense | –1,132 | –536 | –1,668 | –998 | –300 | –1,298 | 13 | 28 | |||
| Profit (loss) after tax from continuing operations | 2,399 | 1,790 | 4,189 | 2,468 | 1,041 | 3,508 | –3 | 19 | |||
| Attributable to owners of parent | 2,413 | 1,787 | 4,200 | 2,537 | 1,037 | 3,574 | –5 | 18 | |||
| Attributable to non-controlling interests | –13 | 3 | –11 | –69 | 4 | –65 | –81 | –84 | |||
| Profit (loss) after tax1 | 4,671 | 1,571 | 6,243 | 1,382 | 2,140 | 3,522 | >100 | 77 | |||
| Attributable to owners of parent1 | 4,826 | 1,634 | 6,460 | 1,743 | 1,866 | 3,609 | >100 | 79 | |||
| Attributable to non-controlling interests1 | –155 | –63 | –217 | –362 | 274 | –88 | –57 | >100 | |||
| Key Ratios | |||||||||||
| Operating margin (in %) | 17.1 | 27.3 | 27.7 | 19.1 | 25.3 | –2.0pp | 2.0pp | 2.4pp | |||
| Effective tax rate (in %)2 | 32.1 | 28.5 | 28.8 | 27.0 | 3.3pp | 1.5pp | |||||
| Earnings per share, basic (in €) from continuing operations | 2.07 | 3.60 | 2.17 | 3.05 | –5 | 18 | |||||
| Earnings per share, basic (in €)1 | 4.13 | 5.53 | 1.49 | 3.08 | >100 | 80 | |||||
1 From continuing and discontinued operations
2 The difference between our effective tax rate (IFRS) and effective tax rate (non-IFRS) in the first nine months of 2023 and 2022 mainly resulted from tax effects of share-based payment expenses, restructuring expenses and acquisition-related charges.
17/29
(F) Non-IFRS Adjustments – Actuals and Estimates
| € millions | Estimated Amounts Full Year 2023 | Q1–Q3 2023 | Q3 2023 | Q1–Q3 2022 | Q3 2022 |
| Operating profit (loss) (IFRS) | 3,885 | 1,724 | 4,088 | 1,557 | |
| Adjustment for acquisition-related charges | 300–380 | 257 | 80 | 293 | 102 |
| Adjustment for share-based payment expenses | 2,000–2,250 | 1,677 | 510 | 937 | 424 |
| Adjustment for restructuring | 200–240 | 221 | –36 | 111 | –8 |
| Adjustment for regulatory compliance matter expenses | 170 | 170 | - | - | - |
| Operating expense adjustments | 2,326 | 554 | 1,341 | 518 | |
| Operating profit (loss) (non-IFRS) | 6,211 | 2,278 | 5,429 | 2,075 |
(G) Non-IFRS Adjustments by Functional Areas
| € millions | Q3 2023 | Q3 2022 | ||||||||||
| IFRS | Acquisition- Related | SBP1 | Restruc- turing | RCM2 | Non- IFRS | IFRS | Acquisition- Related | SBP1 | Restruc- turing | RCM2 | Non- IFRS | |
| Cost of cloud | –946 | 10 | 23 | 0 | 0 | –914 | –902 | 14 | 16 | 0 | - | –873 |
| Cost of software licenses and support | –321 | 4 | 9 | 0 | 0 | –309 | –341 | 8 | 13 | 0 | - | –319 |
| Cost of services | –840 | 0 | 88 | 0 | 0 | –751 | –795 | 0 | 72 | 0 | - | –722 |
| Research and development | –1,515 | 2 | 163 | 0 | 0 | –1,350 | –1,571 | 3 | 131 | 0 | - | –1,437 |
| Sales and marketing | –2,105 | 64 | 191 | 0 | 0 | –1,850 | –1,997 | 75 | 148 | 0 | - | –1,774 |
| General and administration | –327 | 0 | 36 | 0 | 0 | –291 | –333 | 2 | 44 | 0 | - | –287 |
| Restructuring | 36 | 0 | 0 | –36 | 0 | 0 | 8 | 0 | 0 | –8 | - | 0 |
| Other operating income/expense, net | –2 | 0 | 0 | 0 | 0 | –2 | 10 | 0 | 0 | 0 | - | 10 |
| Total operating expenses | –6,020 | 80 | 510 | –36 | 0 | –5,466 | –5,919 | 102 | 424 | –8 | - | –5,401 |
1 Share-based Payments
2 Regulatory Compliance Matters
| € millions | Q1–Q3 2023 | Q1–Q3 2022 | ||||||||||
| IFRS | Acquisition- Related | SBP1 | Restruc- turing | RCM2 | Non- IFRS | IFRS | Acquisition- Related | SBP1 | Restruc- turing | RCM2 | Non- IFRS | |
| Cost of cloud | –2,843 | 31 | 70 | 0 | 0 | –2,743 | –2,552 | 40 | 35 | 0 | - | –2,477 |
| Cost of software licenses and support | –1,008 | 26 | 29 | 0 | 0 | –954 | –1,027 | 24 | 34 | 0 | - | –969 |
| Cost of services | –2,557 | 1 | 287 | 0 | 0 | –2,270 | –2,311 | 1 | 169 | 0 | - | –2,142 |
| Research and development | –4,653 | 6 | 534 | 0 | 0 | –4,113 | –4,481 | 8 | 294 | 0 | - | –4,180 |
| Sales and marketing | –6,562 | 193 | 626 | 0 | 170 | –5,573 | –5,838 | 213 | 319 | 0 | - | –5,306 |
| General and administration | –997 | 1 | 132 | 0 | 0 | –864 | –943 | 8 | 88 | 0 | - | –848 |
| Restructuring | –221 | 0 | 0 | 221 | 0 | 0 | –111 | 0 | 0 | 111 | - | 0 |
| Other operating income/expense, net | –12 | 0 | 0 | 0 | 0 | –12 | –105 | 0 | 0 | 0 | - | –105 |
| Total operating expenses | –18,854 | 257 | 1,677 | 221 | 170 | –16,528 | –17,368 | 293 | 937 | 111 | - | –16,027 |
1 Share-based Payments
2 Regulatory Compliance Matters
18/29
If not presented in a separate line item in our income statement, the restructuring expenses would break down as follows:
| € millions | Q3 2023 | Q1–Q3 2023 | Q3 2022 | Q1–Q3 2022 |
| Cost of cloud | 9 | 2 | 7 | 20 |
| Cost of software licenses and support | 2 | –9 | 0 | –4 |
| Cost of services | 8 | –26 | 0 | –61 |
| Research and development | –4 | –44 | 1 | –6 |
| Sales and marketing | 22 | –128 | 0 | –57 |
| General and administration | –1 | –16 | 0 | –3 |
| Restructuring expenses | 36 | –221 | 8 | –111 |
19/29
(H.1) Segment Policies and Segment Changes
SAP has one reportable segment: the Applications, Technology & Services segment.
At the end of the second quarter 2023, we sold Qualtrics, formerly a reportable segment which derived its revenues mainly from the sale of experience management cloud solutions. For more information related to the sale of Qualtrics, see Note (M) in this quarterly statement.
For a more detailed description of SAP’s segment reporting, see Note (C.1) “Results of Segments” of our Consolidated Half-Year Financial Statements 2023.
(H.2) Segment Reporting – Quarter
Applications, Technology & Services1
€ millions, unless otherwise stated (non-IFRS) | Q3 2023 | Q3 2022 | ∆ in % | ∆ in % | |
Actual Currency | Constant Currency | Actual Currency | Actual Currency | Constant Currency | |
| Cloud – SaaS2 | 2,448 | 2,588 | 2,094 | 17 | 24 |
| Cloud – PaaS3 | 558 | 586 | 401 | 39 | 46 |
| Cloud – IaaS4 | 186 | 196 | 233 | –20 | –16 |
| Cloud | 3,192 | 3,370 | 2,728 | 17 | 24 |
| Software licenses | 335 | 349 | 406 | –17 | –14 |
| Software support | 2,872 | 2,998 | 3,016 | –5 | –1 |
| Software licenses and support | 3,207 | 3,348 | 3,422 | –6 | –2 |
| Cloud and software | 6,400 | 6,718 | 6,150 | 4 | 9 |
| Services | 1,060 | 1,110 | 1,061 | 0 | 5 |
| Total segment revenue | 7,460 | 7,828 | 7,211 | 3 | 9 |
| Cost of cloud | –900 | –950 | –863 | 4 | 10 |
| Cost of software licenses and support | –299 | –312 | –336 | –11 | –7 |
| Cost of cloud and software | –1,199 | –1,262 | –1,199 | 0 | 5 |
| Cost of services | –715 | –743 | –724 | –1 | 3 |
| Total cost of revenue | –1,914 | –2,005 | –1,923 | 0 | 4 |
| Cloud gross profit – SaaS2 | 1,750 | 1,857 | 1,477 | 18 | 26 |
| Cloud gross profit – PaaS3 | 473 | 497 | 320 | 48 | 55 |
| Cloud gross profit – IaaS4 | 70 | 67 | 69 | 1 | –3 |
| Cloud gross profit | 2,292 | 2,420 | 1,866 | 23 | 30 |
| Segment gross profit | 5,546 | 5,824 | 5,289 | 5 | 10 |
| Other segment expenses | –2,880 | –3,019 | –3,022 | –5 | 0 |
| Segment profit (loss) | 2,666 | 2,804 | 2,267 | 18 | 24 |
| SAP S/4 HANA | |||||
| SAP S/4HANA Cloud revenue | 914 | 967 | 546 | 67 | 77 |
| SAP S/4HANA Current cloud backlog | 4,199 | 4,423 | 2,662 | 58 | 66 |
| Margins | |||||
| Segment gross margin (in %) | 74.3 | 74.4 | 73.3 | 1.0pp | 1.1pp |
| Segment margin (in %) | 35.7 | 35.8 | 31.4 | 4.3pp | 4.4pp |
1 Segment information for comparative prior periods were restated to conform with the new segment composition.
2 Software as a service: SaaS comprises all other offerings which are not shown as PaaS and IaaS.
3 Platform as a service: PaaS primarily includes SAP Business Technology Platform and SAP Signavio.
4 Infrastructure as a service: A major portion of IaaS comes from SAP HANA Enterprise Cloud.
5 Mainly derived from Applications, Technology & Services segment.
20/29
Reconciliation of Cloud Revenues – Quarter
€ millions, unless otherwise stated (Non-IFRS) | Q3 2023 | Q3 2022 | ∆ in % | |||
| Actual Currency | Currency Impact | Constant Currency | Actual Currency | Actual Currency | Constant Currency | |
| Cloud revenue – SaaS1 | 2,727 | 157 | 2,884 | 2,351 | 16 | 23 |
| Cloud revenue – PaaS2 | 558 | 28 | 586 | 401 | 39 | 46 |
| Cloud revenue – IaaS3 | 186 | 10 | 196 | 233 | –20 | –16 |
| Cloud revenue | 3,472 | 194 | 3,666 | 2,986 | 16 | 23 |
| Cloud gross profit – SaaS1 | 2,016 | 121 | 2,136 | 1,724 | 17 | 24 |
| Cloud gross profit – PaaS2 | 473 | 24 | 497 | 320 | 48 | 55 |
| Cloud gross profit – IaaS3 | 70 | –3 | 67 | 69 | 1 | –3 |
| Cloud gross profit | 2,558 | 142 | 2,700 | 2,113 | 21 | 28 |
1 Software as a service: SaaS comprises all other offerings which are not shown as PaaS and IaaS.
2 Platform as a service PaaS primarily includes SAP Business Technology Platform and SAP Signavio.
3 Infrastructure as a service: A major portion of IaaS comes from SAP HANA Enterprise Cloud
21/29
| (H.3) | Segment Reporting – Year-to-Date |
Applications, Technology & Services1
€ millions, unless otherwise stated (non-IFRS) | Q1–Q3 2023 | Q1–Q3 2022 | ∆ in % | ∆ in % | |
Actual Currency | Constant Currency | Actual Currency | Actual Currency | Constant Currency | |
| Cloud – SaaS2 | 6,994 | 7,163 | 5,810 | 20 | 23 |
| Cloud – PaaS3 | 1,561 | 1,595 | 1,096 | 43 | 46 |
| Cloud – IaaS4 | 577 | 589 | 708 | –18 | –17 |
| Cloud | 9,132 | 9,348 | 7,614 | 20 | 23 |
| Software licenses | 926 | 950 | 1,149 | –19 | –17 |
| Software support | 8,650 | 8,829 | 8,916 | –3 | –1 |
| Software licenses and support | 9,576 | 9,780 | 10,065 | –5 | –3 |
| Cloud and software | 18,708 | 19,128 | 17,679 | 6 | 8 |
| Services | 3,180 | 3,245 | 3,025 | 5 | 7 |
| Total segment revenue | 21,888 | 22,373 | 20,704 | 6 | 8 |
| Cost of cloud | –2,707 | –2,751 | –2,451 | 10 | 12 |
| Cost of software licenses and support | –922 | –936 | –996 | –7 | –6 |
| Cost of cloud and software | –3,629 | –3,687 | –3,448 | 5 | 7 |
| Cost of services | –2,207 | –2,247 | –2,104 | 5 | 7 |
| Total cost of revenue | –5,836 | –5,934 | –5,552 | 5 | 7 |
| Cloud gross profit – SaaS2 | 4,891 | 5,030 | 4,034 | 21 | 25 |
| Cloud gross profit – PaaS3 | 1,316 | 1,347 | 882 | 49 | 53 |
| Cloud gross profit – IaaS4 | 219 | 219 | 247 | –11 | –11 |
| Cloud gross profit | 6,426 | 6,596 | 5,162 | 24 | 28 |
| Segment gross profit | 16,053 | 16,439 | 15,152 | 6 | 8 |
| Other segment expenses | –8,923 | –9,093 | –9,076 | –2 | 0 |
| Segment profit (loss) | 7,130 | 7,346 | 6,076 | 17 | 21 |
| SAP S/4 HANA | |||||
| SAP S/4HANA Cloud revenue | 2,453 | 2,519 | 1,422 | 72 | 77 |
| SAP S/4HANA Current cloud backlog | 4,199 | 4,423 | 2,662 | 58 | 66 |
| Margins | |||||
| Segment gross margin (in %) | 73.3 | 73.5 | 73.2 | 0.2pp | 0.3pp |
| Segment margin (in %) | 32.6 | 32.8 | 29.3 | 3.2pp | 3.5pp |
1 Segment information for comparative prior periods were restated to conform with the new segment composition.
2 Software as a service: SaaS comprises all other offerings which are not shown as PaaS and IaaS.
3 Platform as a service: PaaS primarily includes SAP Business Technology Platform and SAP Signavio.
4 Infrastructure as a service: A major portion of IaaS comes from SAP HANA Enterprise Cloud.
5 Mainly derived from Applications, Technology & Services segment.
22/29
Reconciliation of Cloud Revenues and Gross Profit – Year-to-Date
€ millions, unless otherwise stated (non-IFRS) | Q1–Q3 2023 | Q1-Q3 2022 | ∆ in % | |||
| Actual Currency | Currency Impact | Constant Currency | Actual Currency | Actual Currency | Constant Currency | |
| Cloud revenue – SaaS1 | 7,827 | 187 | 8,014 | 6,544 | 20 | 22 |
| Cloud revenue – PaaS2 | 1,561 | 34 | 1,595 | 1,096 | 43 | 46 |
| Cloud revenue – IaaS3 | 577 | 13 | 589 | 708 | –18 | –17 |
| Cloud revenue | 9,965 | 233 | 10,198 | 8,348 | 19 | 22 |
| Cloud gross profit – SaaS1 | 5,688 | 155 | 5,842 | 4,742 | 20 | 23 |
| Cloud gross profit – PaaS2 | 1,316 | 31 | 1,347 | 882 | 49 | 53 |
| Cloud gross profit – IaaS3 | 219 | 1 | 219 | 247 | –11 | –11 |
| Cloud gross profit | 7,222 | 186 | 7,408 | 5,871 | 23 | 26 |
1 Software as a service: SaaS comprises all other offerings which are not shown as PaaS and IaaS.
2 Platform as a service: PaaS primarily includes SAP Business Technology Platform and SAP Signavio.
3 Infrastructure as a service: A major portion of IaaS comes from SAP HANA Enterprise Cloud.
23/29
| (I) | Revenue by Region (IFRS and Non-IFRS) |
| (I.1) | Revenue by Region (IFRS and Non-IFRS) – Quarter |
| € millions | Q3 2023 | Q3 2022 | ∆ in % | |||
| Actual currency | Currency Impact | Constant Currency | Actual currency | Actual currency | Constant Currency | |
| Cloud Revenue by Region | ||||||
| EMEA | 1,352 | 21 | 1,373 | 1,043 | 30 | 32 |
| Americas | 1,678 | 125 | 1,803 | 1,556 | 8 | 16 |
| APJ | 442 | 48 | 490 | 386 | 14 | 27 |
| Cloud revenue | 3,472 | 194 | 3,666 | 2,986 | 16 | 23 |
| Cloud and Software Revenue by Region | ||||||
| EMEA | 3,010 | 22 | 3,031 | 2,690 | 12 | 13 |
| Americas | 2,696 | 205 | 2,902 | 2,727 | –1 | 6 |
| APJ | 973 | 107 | 1,081 | 990 | –2 | 9 |
| Cloud and software revenue | 6,679 | 335 | 7,014 | 6,408 | 4 | 9 |
| Total Revenue by Region | ||||||
| Germany | 1,212 | 1 | 1,213 | 1,076 | 13 | 13 |
| Rest of EMEA | 2,280 | 23 | 2,303 | 2,055 | 11 | 12 |
| Total EMEA | 3,492 | 24 | 3,516 | 3,131 | 12 | 12 |
| United States | 2,506 | 195 | 2,701 | 2,588 | –3 | 4 |
| Rest of Americas | 651 | 44 | 696 | 629 | 4 | 11 |
| Total Americas | 3,157 | 240 | 3,397 | 3,217 | –2 | 6 |
| Japan | 297 | 38 | 335 | 308 | –4 | 9 |
| Rest of APJ | 798 | 83 | 882 | 820 | –3 | 8 |
| Total APJ | 1,095 | 121 | 1,216 | 1,128 | –3 | 8 |
| Total revenue | 7,744 | 385 | 8,130 | 7,476 | 4 | 9 |
24/29
| (I.2) | Revenue by Region (IFRS and Non-IFRS) – Year-to-Date |
| € millions | Q1–Q3 2023 | Q1–Q3 2022 | ∆ in % | |||
| Actual Currency | Currency Impact | Constant Currency | Actual Currency | Actual Currency | Constant Currency | |
| Cloud Revenue by Region | ||||||
| EMEA | 3,810 | 37 | 3,846 | 3,009 | 27 | 28 |
| Americas | 4,873 | 107 | 4,979 | 4,251 | 15 | 17 |
| APJ | 1,282 | 90 | 1,373 | 1,087 | 18 | 26 |
| Cloud revenue | 9,965 | 233 | 10,198 | 8,348 | 19 | 22 |
| Cloud and Software Revenue by Region | ||||||
| EMEA | 8,670 | 61 | 8,731 | 7,975 | 9 | 9 |
| Americas | 7,979 | 172 | 8,151 | 7,594 | 5 | 7 |
| APJ | 2,892 | 205 | 3,097 | 2,844 | 2 | 9 |
| Cloud and software revenue | 19,542 | 437 | 19,979 | 18,413 | 6 | 9 |
| Total Revenue by Region | ||||||
| Germany | 3,495 | 1 | 3,496 | 3,190 | 10 | 10 |
| Rest of EMEA | 6,619 | 68 | 6,687 | 6,104 | 8 | 10 |
| Total EMEA | 10,113 | 69 | 10,182 | 9,294 | 9 | 10 |
| United States | 7,480 | 148 | 7,628 | 7,154 | 5 | 7 |
| Rest of Americas | 1,884 | 53 | 1,938 | 1,765 | 7 | 10 |
| Total Americas | 9,364 | 202 | 9,566 | 8,919 | 5 | 7 |
| Japan | 913 | 90 | 1,003 | 910 | 0 | 10 |
| Rest of APJ | 2,348 | 142 | 2,491 | 2,333 | 1 | 7 |
| Total APJ | 3,261 | 232 | 3,493 | 3,243 | 1 | 8 |
| Total revenue | 22,739 | 503 | 23,242 | 21,456 | 6 | 8 |
| (J) | Employees by Region and Functional Areas |
| Full-time equivalents | 9/30/2023 | 9/30/2022 | ||||||
| EMEA | Americas | APJ | Total | EMEA | Americas | APJ | Total | |
| Cloud and software1 | 4,150 | 4,193 | 4,181 | 12,523 | 4,308 | 4,030 | 4,553 | 12,891 |
| Services | 8,124 | 5,044 | 5,502 | 18,669 | 8,180 | 5,074 | 5,889 | 19,143 |
| Research and development1 | 17,952 | 5,907 | 12,698 | 36,557 | 17,574 | 5,871 | 11,900 | 35,345 |
| Sales and marketing | 11,796 | 10,166 | 5,311 | 27,272 | 11,661 | 10,775 | 5,500 | 27,935 |
| General and administration | 3,518 | 1,772 | 1,305 | 6,595 | 3,408 | 1,860 | 1,247 | 6,514 |
| Infrastructure | 2,786 | 1,244 | 849 | 4,878 | 2,806 | 1,376 | 902 | 5,085 |
| SAP Group (9/30) | 48,325 | 28,324 | 29,846 | 106,495 | 47,936 | 28,985 | 29,991 | 106,912 |
| Thereof acquisitions2 | 7 | 0 | 0 | 7 | 188 | 189 | 8 | 385 |
| SAP Group (nine months’ end average) | 47,967 | 28,170 | 29,487 | 105,624 | 47,147 | 28,773 | 29,313 | 105,233 |
1 to the updated cost allocation policy described in Note (L), headcount numbers for the comparative period were adjusted accordingly.
2 Acquisitions closed between January 1 and September 30 of the respective year.
25/29
In the third quarter of 2023, finance income mainly consisted of gains from disposals and fair value adjustments of equity securities totaling €53 million (Q3/2022: €91 million) and €239 million in the first nine months of 2023 (Q1-Q3/2022: €554 million), and interest income from loans and receivables, other financial assets (cash, cash equivalents, and current investments) as well as from derivatives amounting to €153 million in the third quarter of 2023 (Q3/2022: €58 million) and €343 million in the first nine months of 2023 (Q1-Q3/2022: €123 million).
In the third quarter of 2023, finance costs were primarily impacted by losses from disposals and fair value adjustments of equity securities amounting to €103 million (Q3/2022: €397 million) and €329 million in the first nine months of 2023 (Q1-Q3/2022: €940 million) and interest expense on financial liabilities including lease liabilities and negative effects from derivatives amounting to €134 million in the third quarter of 2023 (Q3/2022: €65 million) and €504 million in the nine months of 2023 (Q1-Q3/2022: €162 million).
(L) Updated Cost Allocation Policy
Starting January 1, 2023, all activities related to changes in the code of SAP’s cloud and on-premise solutions are treated as development-related activities. Some of those activities, specifically code corrections, were previously considered as support-related activities. SAP believes this update aligns SAP’s accounting policy with market standards and increases comparability to its peers.
In the third quarter 2023, this update of our cost allocation policy resulted in an increase of the cloud gross profit by approximately €25 million, an increase of the software license and support gross profit by approximately €65 million, and an increase of our R&D expenses by approximately €85 million.
In the first nine months of 2023, the update of our cost allocation policy led to an increase of the cloud gross profit by approximately €70 million, an increase of the software license and support gross profit by approximately €195 million, and an increase of our R&D expenses by approximately €265 million.
For the full year 2023, the updated cost allocation policy is expected to result in decreased cost of cloud by approximately €95 million and cost of support by approximately €260 million, while in consequence increased R&D expenses by approximately €355 million.
Had SAP applied this accounting policy in 2022, its cost of cloud, cost of software licenses and support and R&D expense would have been as follows:
| € millions | IFRS | Non-IFRS | ||||||||
| Q1 2022 | Q2 2022 | Q3 2022 | Q4 2022 | FY 2022 | Q1 2022 | Q2 2022 | Q3 2022 | Q4 2022 | FY 2022 | |
| Cost of cloud | –817 | –833 | –902 | –947 | –3,499 | –798 | –806 | –873 | –915 | –3,391 |
| Cost of software licenses and support | –347 | –339 | –341 | –358 | –1,384 | –334 | –316 | –319 | –334 | –1,302 |
| Research and development expenses | –1,396 | –1,514 | –1,571 | –1,598 | –6,080 | –1,351 | –1,393 | –1,437 | –1,449 | –5,629 |
The sale of Qualtrics has closed in Q2 2023. For the full disclosure, please refer to section (M) Discontinued Operations in SAP’s quarterly statement Q2 2023. During the third quarter 2023, SAP identified a need for an error correction in the accounting related to the divestiture of Qualtrics as reported in Q2. The affected financial statement line items have been restated. For details, please refer to section (N) Correction of Q2 2023 Qualtrics divestiture reporting in this quarterly statement.
The P&L line item “Profit (loss) from discontinued operation” still reflects the Qualtrics activities up to the date of the sale (the comparative figures have been adjusted accordingly). In the third quarter 2023, tax payment of €0,7bn relating to the gain on the sale of Qualtrics were made. These payments were recognized in SAP’s discontinued operations, reducing the investing cash flow. Financial information relating to Qualtrics is presented in the following tables (revenues and expenses are presented after consolidation of transactions between Qualtrics and SAP’s continuing operations):
26/29
| € billion, unless otherwise stated | Q1–Q3 2023 | Q1–Q3 2022 |
| Consolidated Income Statements | ||
| Cloud revenue | 0.6 | 0.8 |
| Total revenue | 0.7 | 1.0 |
| Cost of cloud | –0.1 | –0.2 |
| Total cost of revenue | –0.2 | –0.4 |
| Total operating expenses (including total cost of revenue) | –1.2 | –2.1 |
| Disposal gain before tax | 3.6 | 0.0 |
| Operating profit | 3.2 | –1.1 |
| Profit (loss) before tax | 3.2 | –1.1 |
| Income tax expense1 | –0.9 | 0.0 |
| Profit (loss) after tax | 2.3 | –1.1 |
| Attributable to owners of parent | 2.4 | –0.8 |
| Earnings per share, basic (IFRS, in €)2 | 2.07 | –0.68 |
| Earnings per share, diluted (IFRS, in €)2 | 2.05 | –0.68 |
| Earnings per share, basic (non-IFRS, in €)2 | 1.94 | 0.03 |
| Consolidated Statements of Cash Flow | ||
| Net operating cash flow | 0.1 | –0.1 |
| Net investing cash flow | 5.6 | –0.0 |
| Net financing cash flow | 0.0 | –0.2 |
1 For 2023, € 0.9 billion is relating to the gain on sale of discontinued operations.
2 For the nine months ended September 30, 2023 and 2022, the weighted average number of shares was 1,168 million (diluted 1,179 million) and 1,172 million (diluted: 1,175 million), respectively (treasury stock excluded).
| € billion, unless otherwise stated | Q1–Q3 2023 | Q1–Q3 2022 |
| Profit (loss) after tax (IFRS) | 2.3 | –1.1 |
| Adjustment for acquisition related charges | –0.8 | 0.2 |
| Adjustment for share-based payment expenses | 0.4 | 0.9 |
| Adjustment for restructuring expenses | 0.0 | 0.0 |
| Adjustment for tax impact of non-IFRS adjustments | 0.2 | –0.0 |
| Profit (loss) after tax (non-IFRS) | 2.1 | 0.0 |
| Attributable to owners of parent | 2.3 | 0.0 |
(N) Correction of Q2 2023 Qualtrics divestiture reporting
During the third quarter 2023, SAP identified a need for an error correction in the accounting related to the divestiture of Qualtrics as reported in Q2. The error correction is limited to SAP’s discontinued operations. SAP’s continuing operations net income as well as total operating, investing, or financing cash flows for the second quarter ended June 30, 2023, were not impacted.
Specifically, the taxable gain was determined to be incorrect, with the adjustment leading to an increase in tax expenses from discontinued operations of €0.4 billion. In addition, the distribution of income taxes to the owners of parent and non-controlling interests was adjusted. The error correction has been addressed by restating each of the affected financial statement line items for the second quarter as well as half-year 2023 information. The following tables summarize the impacts on the Group’s consolidated financial statements.
27/29
Impact of adjustments on consolidated statements of financial position
| € millions | as at 6/30/2023 | ||
| As previously reported | Adjustments | As restated | |
| Total current assets | 22,990 | 22,990 | |
| Total non-current assets | 46,730 | 46,730 | |
| Total Assets | 69,719 | 69,719 | |
| Tax liabilities | 582 | 398 | 980 |
| Total current liabilities | 16,176 | 398 | 16,574 |
| Total non-current liabilities | 11,314 | 11,314 | |
| Total liabilities | 27,490 | 398 | 27,888 |
| Retained earnings | 40,225 | –399 | 39,826 |
| Other components of equity | 3,100 | 1 | 3,101 |
| Total equity | 42,229 | –398 | 41,831 |
| Total equity and liabilities | 69,719 | 69,719 | |
Impact of adjustments on consolidated income statements
| € millions, unless otherwise stated | Q2 2023 | Q1-Q2 2023 | |||||
| As previously reported | Adjustments | As restated | As previously reported | Adjustments | As restated | ||
| Profit (loss) after tax from continuing operations | 724 | 724 | 1,128 | 1,128 | |||
| Profit attributable to owners of parent | 728 | 728 | 1,135 | 1,135 | |||
| Profit attributable to non-controlling interests | –4 | –4 | –7 | –7 | |||
| Profit (loss) after tax from discontinued operations | 2,656 | –490 | 2,166 | 2,763 | –490 | 2,272 | |
| Profit (loss) after tax1 | 3,381 | –490 | 2,890 | 3,890 | –490 | 3,400 | |
| Profit attributable to owners of parent1 | 3,455 | –385 | 3,070 | 3,933 | –385 | 3,548 | |
| Profit attributable to non-controlling interests1 | –74 | –105 | –179 | –43 | –105 | –149 | |
| Key Ratios | |||||||
| Operating margin (in %) | 18.0 | 18,0 | 14,4 | 14,4 | |||
| Effective tax rate (in %) | 33.8 | 33,8 | 36,3 | 36,3 | |||
| Earnings per share, basic (in €) from continuing operations2 | 0.62 | 0.62 | 0.97 | 0.97 | |||
| Earnings per share, basic (in €)1,2 | 2.96 | –0.33 | 2.63 | 3.37 | –0.33 | 3.04 | |
| Earnings per share, diluted (in €) from continuing operations2 | 0.62 | 0.62 | 0.97 | 0.97 | |||
| Earnings per share, diluted (in €)1,2 | 2.93 | –0.33 | 2.60 | 3.34 | –0.33 | 3.02 | |
1 From continuing and discontinued operations
2 For the three months ended June 30, 2023, the weighted average number of shares was 1,169 million (diluted 1,180 million), treasury stock excluded. For the six months ended June 30, 2023, the weighted average number of shares was 1,168 million (diluted 1,176 million), treasury stock excluded.
28/29
Impact of adjustments on consolidated income statements – discontinued operations
| € billion, unless otherwise stated | Q2 2023 | Q1-Q2 2023 | |||||
| As previously reported | Adjustments | As restated | As previously reported | Adjustments | As restated | ||
| Cloud revenue | 0.3 | 0.3 | 0.6 | 0.6 | |||
| Total revenue | 0.4 | 0.4 | 0.7 | 0.7 | |||
| Cost of cloud | –0.0 | –0.0 | –0.1 | –0.1 | |||
| Total cost of revenue | –0.1 | –0.1 | –0.2 | –0.2 | |||
| Total operating expenses (including total cost of revenue) | –0.5 | –0.5 | –1.2 | –1.2 | |||
| Disposal gain before tax | 3.7 | –0.1 | 3.6 | 3.7 | –0.1 | 3.6 | |
| Operating profit | 3.5 | –0.1 | 3.4 | 3.2 | –0.1 | 3.2 | |
| Profit (loss) before tax | 3.5 | –0.1 | 3.4 | 3.3 | –0.1 | 3.2 | |
| Income tax expense1 | –0.9 | –0.4 | –1.3 | –0.5 | –0.4 | –0.9 | |
| Profit (loss) after tax | 2.7 | –0.5 | 2.2 | 2.8 | –0.5 | 2.3 | |
| Attributable to owners of parent | 2.7 | –0.4 | 2.3 | 2.8 | –0.4 | 2.4 | |
| Earnings per share, basic (IFRS, in €)2 | 2.33 | –0.33 | 2.00 | 2.40 | –0.33 | 2.07 | |
| Earnings per share, diluted (IFRS, in €)2 | 2.31 | –0.33 | 1.98 | 2.38 | –0.33 | 2.05 | |
1 For 2023. €0.9 billion relates to the gain on sale of discontinued operations.
2 For the three months ended June 30, 2023, the weighted average number of shares was 1,169 million (diluted 1,180 million), treasury stock excluded. For the six months ended June 30, 2023, the weighted average number of shares was 1,168 million (diluted 1,176 million), treasury stock excluded.
| (O) | Capitalized Cost from Contracts with Customers – Costs of Obtaining Customer Contracts |
As disclosed in Consolidated Financial Statements for 2022, Note (A.3), the determination of the amortization period for capitalized sales commissions requires judgement. In exercising this judgment, we consider our expectation about future contract renewals which we evaluate periodically to confirm that the resulting amortization period properly reflects the expected contract life or if there are potential indicators of impairment. The latest review of the amortization periods resulted in a shorter contract life for on-premise support contracts. As a result of this assessment, we have impaired the related capitalized sales commissions in the amount of €65 million as of September 30, 2023. For Q4 2023 SAP estimates this change in contract life to result in higher amortization costs of approximately €61 million and resulting in an estimated impact for the full year 2024 of €126 million. The amortization periods now range from 18 months to seven years depending on the type of offering.
29/29