Exhibit 99.1
 | Quarterly Statement Q1 2024 |
SAP Announces Q1 2024 Results
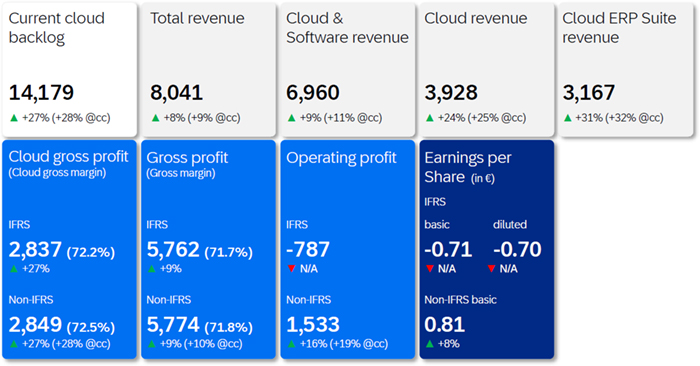
| • | Cloud revenue up 24% and up 25% at constant currencies, supported by 32% Cloud ERP Suite revenue growth at constant currencies |
| • | Current cloud backlog of €14.2 billion, up 27% and up 28% at constant currencies |
| • | IFRS cloud gross profit up 27%, non-IFRS cloud gross profit up 27% and up 28% at constant currencies |
| • | IFRS operating loss of –€0.8 billion due to a €2.2 billion restructuring provision |
| • | Non-IFRS operating profit up 16% and up 19% at constant currencies even including higher share-based compensation resulting from strong share price increase |
| • | Outlook 2024 reaffirmed |
in € millions, unless otherwise stated; based on SAP group results from continuing operations
1/20
| Quarterly Statement Q1 2024 |
Walldorf, Germany – April 22, 2024.
SAP SE (NYSE: SAP) announced today its financial results for the first quarter ended March 31, 2024.
Christian Klein, CEO: We’re off to a great start in 2024 and we’re confident we’ll achieve our goals for the year. Looking ahead, we have powerful growth drivers in place – Business AI, cross-selling across our cloud portfolio, and winning new customers particularly in the midmarket. The strength of our current cloud backlog reaching a record growth rate is a testament to that momentum. Our transformation program is also well on track and will help us to capture this growth and increase efficiency. |
Dominik Asam, CFO: In the first quarter we successfully kicked off the implementation of our transformation program thereby allowing us to focus our investments on the Business AI opportunity while decoupling expense from revenue growth. We are also very pleased by the unabated growth momentum of the Cloud ERP Suite, reflecting the market’s secular shift towards integrated cloud solutions. |
All figures in this statement are based on SAP group results from continuing operations unless otherwise noted.
Financial Performance
Group results at a glance – First quarter 2024
| IFRS | Non-IFRS1 | |||||||
| € million, unless otherwise stated | Q1 2024 | Q1 2023 | ∆ in % | Q1 2024 | Q1 2023 | ∆ in % | ∆ in % const. curr. | |
| SaaS/PaaS | 3,764 | 2,980 | 26 | 3,764 | 2,980 | 26 | 28 | |
| Thereof Cloud ERP Suite2 | 3,167 | 2,422 | 31 | 3,167 | 2,422 | 31 | 32 | |
| Thereof Extension Suite3 | 597 | 558 | 7 | 597 | 558 | 7 | 8 | |
| IaaS4 | 164 | 197 | –17 | 164 | 197 | –17 | –15 | |
| Cloud revenue | 3,928 | 3,178 | 24 | 3,928 | 3,178 | 24 | 25 | |
| Cloud and software revenue | 6,960 | 6,358 | 9 | 6,960 | 6,358 | 9 | 11 | |
| Total revenue | 8,041 | 7,441 | 8 | 8,041 | 7,441 | 8 | 9 | |
| Share of more predictable revenue (in %) | 84 | 82 | 2pp | 84 | 82 | 2pp | ||
| Cloud gross profit | 2,837 | 2,239 | 27 | 2,849 | 2,249 | 27 | 28 | |
| Gross profit | 5,762 | 5,284 | 9 | 5,774 | 5,305 | 9 | 10 | |
| Operating profit (loss) | –787 | 803 | N/A | 1,533 | 1,321 | 16 | 19 | |
| Profit (loss) after tax from continuing operations | –824 | 403 | N/A | 944 | 868 | 9 | ||
| Profit (loss) after tax5 | –824 | 509 | N/A | 944 | 1,012 | –7 | ||
| Earnings per share - Basic (in €) from continuing operations | –0.71 | 0.35 | N/A | 0.81 | 0.75 | 8 | ||
| Earnings per share - Basic (in €)5 | –0.71 | 0.41 | N/A | 0.81 | 0.83 | –3 | ||
| Net cash flows from operating activities from continuing operations | 2,757 | 2,311 | 19 | |||||
| Free cash flow | 2,492 | 1,955 | 28 | |||||
1 For a breakdown of the individual adjustments see table “Non-IFRS Operating Expense Adjustments by Functional Areas” in this Quarterly Statement.
2 Cloud ERP Suite references the portfolio of strategic Software-as-a-Service (SaaS) and Platform-as-a-Service (PaaS) solutions that are tightly integrated with our core ERP solutions and are included in key commercial packages, such as RISE with SAP. The following offerings contribute to Cloud ERP Suite revenue: SAP S/4HANA Cloud, SAP Business Technology Platform, and core solutions for HR and payroll, spend management, commerce, customer data solutions, business process transformation, and working capital management. For additional information and historical data on Cloud ERP Suite, see SAP’s Reporting Framework.
3 Extension Suite references SAP’s remaining SaaS and PaaS solutions that supplement and extend the functional coverage of the Cloud ERP Suite.
4 Infrastructure as a service (IaaS): The major portion of IaaS comes from SAP HANA Enterprise Cloud.
5 From continuing and discontinued operations.
2/20
| Quarterly Statement Q1 2024 |
Financial Highlights1
First Quarter 2024
In the first quarter, SAP’s cloud momentum further accelerated with a sequential growth rate increase in current cloud backlog of 1 percentage point at constant currencies. Current cloud backlog grew by 27% to €14.18 billion and was up 28% at constant currencies, the fastest growth on record. Cloud revenue was up 24% to €3.93 billion and up 25% at constant currencies, mainly driven by Cloud ERP Suite revenue, which was up 31% and up 32% at constant currencies.
Software licenses revenue decreased by 26% to €203 million and was down 25% at constant currencies. Cloud and software revenue was up 9% to €6.96 billion and up 11% at constant currencies. Services revenue was flat at €1.08 billion and up 1% at constant currencies. Total revenue was up 8% to €8.04 billion and up 9% at constant currencies.
The share of more predictable revenue increased by 2 percentage points to 84% in the first quarter.
Cloud gross profit was up 27% (IFRS) to €2.84 billion, up 27% to €2.85 billion (non-IFRS), and up 28% (non-IFRS at constant currencies).
IFRS operating profit in the first quarter was impacted by a €2.2 billion restructuring provision associated with the 2024 transformation program. This resulted in an IFRS operating loss of –€787 million. Non-IFRS operating profit was up 16% to €1.53 billion and was up 19% at constant currencies. Non-IFRS operating profit growth was negatively affected by a €0.1 billion increase in share-based compensation, predominately driven by the strong share price increase over the course of the first quarter.
IFRS earnings per share (basic) were –€0.71 and non-IFRS earnings per share (basic) increased 8% to €0.81. IFRS effective tax rate was 16.0% (Q1/2023: 40.5%) and non-IFRS effective tax rate 32.4% (Q1/2023: 29.1%). Both year-over-year changes mainly resulted from a temporary inability to offset withholding taxes in Germany due to tax losses in 2024 resulting from restructuring. This adverse impact was partially compensated by changes in non-deductible expenses.
Free cash flow in the first quarter increased by 28% to €2.49 billion. While increased payouts mainly resulted from compliance-related matters and interest, the positive development was primarily attributable to increased profitability, improvements in working capital and lower payments for capex and leasing.
Share Repurchase Program
In May 2023, SAP announced a share repurchase program with an aggregate volume of up to €5 billion and a term until December 31, 2025. As of March 31, 2024, SAP had repurchased 10,024,841 shares at an average price of €137.62 resulting in payouts of approximately €1.38 billion under the program.
2024 Transformation Program: Focus on scalability of operations and key strategic growth areas
In 2024, SAP is further increasing its focus on key strategic growth areas, in particular business AI. It is transforming its operational setup to capture organizational synergies and AI-driven efficiencies, and to prepare the company for highly scalable future revenue growth.
To this end, as announced in January, SAP is executing a company-wide restructuring program which is anticipated to conclude in early 2025. The restructuring is intended to ensure that SAP’s skillset and resources continue to meet future business needs and is expected to affect approximately 8,000 positions, a majority of which will be covered by voluntary leave programs and internal re-skilling measures. Reflecting re-investments into strategic growth areas, SAP expects to exit 2024 at a headcount similar to year-end 2023.
In the first quarter, a restructuring provision of €2.2 billion was recorded, which is expected to cover the vast majority of the program’s total restructuring expenses. The provision includes incremental expenses driven by the impact of the first quarter’s share price increase on share-based compensation of leavers, as well as the positive reception of the voluntary early retirement program amongst eligible employees in the US.
Since acceptance rates and precise conditions of voluntary measures in some geographies, particularly Germany, are currently still unknown, SAP expects to provide an update on restructuring expenses and cash outflows once program implementation has further progressed.
1 The Q1 2024 results were also impacted by other effects. For details, please refer to the disclosures on page 20 of this document.
3/20
| Quarterly Statement Q1 2024 |
Business Highlights
In the first quarter, customers around the globe continued to choose “RISE with SAP” to drive their end-to-end business transformations. These customers included: Brussels Regional Public Service, Clearway Energy Group, Curtiss-Wright, Fresenius, Ineos Europe, Lindt & Sprüngli, LyondellBasell, MAHLE International, Public Power Corporation, SKF Group, Sumitomo Heavy Industries, Sutherland, Velliv, ZF Friedrichshafen, and Zoetis. Foodstuffs South Island, Havells India, PureTech Scientific, Randoncorp, and Stuttgart Netze, went live on SAP S/4HANA Cloud in the first quarter. Aleron Shared Resources, American Printing House for the Blind, Centrale del Latte di Roma, Churchill Downs Incorporated, Climeworks, Ironwood Pharmaceuticals, MaxiTRANS, SFC Energy, and Unico chose “GROW with SAP”, an offering helping midsize customers adopt cloud ERP with speed, predictability, and continuous innovation. Key customer wins across SAP’s solution portfolio included: Cintas, FrieslandCampina, LEONI, Maersk, Rabobank, Schaeffler Group, Sky, and Vaillant Group. ALDO Group, BARMER, Coca-Cola Europacific Partners, Dell, and Korea Chamber of Commerce and Industry went live on SAP solutions. In the first quarter, SAP’s cloud revenue performance was particularly strong in APJ and EMEA and robust in the Americas region. Brazil, Canada, Germany, Italy, the United Arab Emirates, India, and South Korea had outstanding performances in cloud revenue growth while the U.S., Japan and Spain were particularly strong. SAP proposed a dividend of €2.20 per share for fiscal year 2023 representing a year-over-year increase of 7% compared to the regular dividend paid for fiscal year 2022. The dividend is subject to shareholder approval at the upcoming AGM scheduled for May 15, 2024. On February 11, SAP announced that the Supervisory Board of SAP SE nominated Mr. Pekka Ala-Pietilä to stand for election as a new member of the Supervisory Board and proposes Mr. Ala-Pietilä as the designated successor to Chairman Prof. Dr. Hasso Plattner. On February 29, SAP announced that it filed the SAP Annual Report on Form 20-F for the year ended December 31, 2023, with the U.S. Securities and Exchange Commission (SEC), and that the SAP Integrated Report 2023 is available and accessible online at www.sapintegratedreport.com. On March 6, SAP announced transformative data innovations that will help customers harness the full power of their data to drive deeper insights, faster growth, and more efficiency in the era of AI. New capabilities in the SAP Datasphere solution, including new generative-AI features, transform enterprise planning through simplified data landscapes and more-intuitive data interaction. On March 15, Taulia and Visa announced a new partnership to make embedded finance accessible to businesses worldwide. On March 18, SAP and NVIDIA announced a partnership expansion focused on accelerating enterprise customers’ ability to harness the transformative power of data and generative AI across SAP’s portfolio of cloud solutions and applications. On March 20, SAP was informed that Moody's upgraded its long-term issuer rating to A1 from A2, its senior unsecured rating to A1 from A2 and its senior unsecured MTN program rating to (P)A1 from (P)A2. Concurrently, Moody's affirmed its P-1 short term issuer ratings. The outlook changed to stable from positive. |
4/20
| Quarterly Statement Q1 2024 |
Segment Results at a Glance
SAP’s reportable segment showed the following performance:
| Applications, Technology & Services1 | Q1 2024 | ||
€ million, unless otherwise stated (Non-IFRS) | Actual Currency | ∆ in % | ∆ in % Constant Currency |
| Cloud revenue | 3,863 | 24 | 25 |
| Cloud gross profit | 2,804 | 27 | 29 |
| Segment revenue | 7,971 | 8 | 9 |
| Segment profit (loss) | 2,198 | 13 | 15 |
| Segment margin (in %) | 27.6 | 1.2pp | 1.4pp |
1 Segment information for comparative prior periods were restated to conform with the new segment composition.
In the first quarter, segment revenue in AT&S was up 8% to €7.97 billion and up 9% at constant currencies, primarily due to strong cloud revenue growth, which was supported by Cloud ERP Suite. Operating Expenses of the segment increased by 6% and by 7% at constant currencies, resulting in a segment margin of 27.6% and 27.8% at constant currencies. This implies an increase of 1.2 percentage points and 1.4 percentage points at constant currencies compared to the first quarter of the prior year.
Financial Outlook 2024
SAP’s financial outlook 2024 is based on SAP’s updated non-IFRS definition of profit measures which, beginning in 2024, include share-based compensation expenses and exclude gains and losses from equity securities, net. For more details, please refer to the Reporting Framework section on our Investor Relations website: https://www.sap.com/investors/en/reports/reporting-framework.html.
For 2024, SAP continues to expect:
| • | €17.0 – 17.3 billion cloud revenue at constant currencies (2023: €13.66 billion), up 24% to 27% at constant currencies. |
| • | €29.0 – 29.5 billion cloud and software revenue at constant currencies (2023: €26.92 billion), up 8% to 10% at constant currencies. |
| • | €7.6 – 7.9 billion non-IFRS operating profit at constant currencies (2023: €6.51 billion based on updated non-IFRS operating profit definition), up 17% to 21% at constant currencies. |
| • | Free cash flow of approximately €3.5 billion (2023: €5.09 billion). |
| • | An effective tax rate (non-IFRS) of approximately 32% (2023: 30.3% based on updated tax rate definition (non-IFRS))2. |
2 The effective tax rate (non-IFRS) is a non-IFRS financial measure and is presented for supplemental informational purposes only. We do not provide an outlook for the effective tax rate (IFRS) due to the uncertainty and potential variability of gains and losses associated with equity securities, which are reconciling items between the two effective tax rates (non-IFRS and IFRS). These items cannot be provided without unreasonable efforts but could have a significant impact on our future effective tax rate (IFRS).
5/20
| Quarterly Statement Q1 2024 |
While SAP’s 2024 financial outlook is at constant currencies, actual currency reported figures are expected to be impacted by currency exchange rate fluctuations as the Company progresses through the year. See the table below.
Currency Impact Assuming March 2024 Rates Apply for 2024
| In percentage points | Q2 2024 | FY 2024 |
| Cloud revenue growth | –1.5pp to +0.5pp | –1.5pp to +0.5pp |
| Cloud and software revenue growth | –1.5pp to +0.5pp | –1.5pp to +0.5pp |
| Operating profit growth (non-IFRS) | –2 pp to 0pp | –2pp to 0pp |
Non-Financial Outlook 2024
In 2024, SAP continues to expect:
| • | A customer net promoter score of 9 to 13. |
| • | The employee engagement index in the range of 76% to 80%. |
| • | To steadily decrease carbon emissions across the relevant value chain, in line with our target of achieving Net Zero carbon emissions by 2030. |
| • | To steadily increase the number of women in executive roles in line with our end of year 2027 target to achieve 25%. |
6/20
| Quarterly Statement Q1 2024 |
Additional Information
This press release and all information therein is preliminary and unaudited. Due to rounding, numbers may not add up precisely.
Financial Analyst and Investor Conference
SAP will hold a financial analyst event on Wednesday, June 5th, in conjunction with its annual SAP Sapphire conference.
SAP Performance Measures
For more information about our key growth metrics and performance measures, their calculation, their usefulness, and their limitations, please refer to the following document on our Investor Relations website: https://www.sap.com/investors/performance-measures
Webcast
SAP senior management will host a financial analyst conference call on Monday, April 22nd at 11:00 PM (CEST) / 10:00 PM (BST) / 5:00 PM (EDT) / 2:00 PM (PDT). The conference will be webcast on the Company’s website at https://www.sap.com/investor and will be available for replay. Supplementary financial information pertaining to the first quarter results can be found at https://www.sap.com/investor
About SAP
As a global leader in enterprise applications and business AI, SAP (NYSE: SAP) stands at the nexus of business and technology. For over 50 years, organizations have trusted SAP to bring out their best by uniting business-critical operations spanning finance, procurement, HR, supply chain, and customer experience. For more information, visit www.sap.com.
For more information, financial community only:
| Anthony Coletta | +49 (6227) 7-60437 | investor@sap.com, CET |
Follow SAP Investor Relations on LinkedIn at SAP Investor Relations.
For more information, press only:
| Joellen Perry | +1 (650) 445-6780 | joellen.perry@sap.com, PT |
| Daniel Reinhardt | +49 (6227) 7-40201 | daniel.reinhardt@sap.com, CET |
For customers interested in learning more about SAP products:
| Global Customer Center: | +49 180 534-34-24 |
| United States Only: | +1 (800) 872-1SAP (+1-800-872-1727) |
Note to editors:
To preview and download broadcast-standard stock footage and press photos digitally, please visit www.sap.com/photos. On this platform, you can find high resolution material for your media channels.
This document contains forward-looking statements, which are predictions, projections, or other statements about future events. These statements are based on current expectations, forecasts, and assumptions that are subject to risks and uncertainties that could cause actual results and outcomes to materially differ. Additional information regarding these risks and uncertainties may be found in our filings with the Securities and Exchange Commission, including but not limited to the risk factors section of SAP’s 2023 Annual Report on Form 20-F.
© 2024 SAP SE. All rights reserved.
SAP and other SAP products and services mentioned herein as well as their respective logos are trademarks or registered trademarks of SAP SE in Germany and other countries. Please see https://www.sap.com/copyright for additional trademark information and notices.
7/20
| Quarterly Statement Q1 2024 |
Contents
| Financial and Non-Financial Key Facts (IFRS and Non-IFRS) | 9 | ||
| Primary Financial Statements of SAP Group (IFRS) | 11 | ||
| (A) | Consolidated Income Statements | 11 | |
| (B) | Consolidated Statements of Financial Position | 12 | |
| (C) | Consolidated Statements of Cash Flows | 13 | |
| Non-IFRS Numbers | 14 | ||
| (D) | Basis of Non-IFRS Presentation | 14 | |
| (E) | Reconciliation from Non-IFRS Numbers to IFRS Numbers | 14 | |
| (F) | Non-IFRS Adjustments – Actuals and Estimates | 17 | |
| (G) | Non-IFRS Operating Expense Adjustments by Functional Areas | 17 | |
| Disaggregations | 18 | ||
| (H) | Segment Reporting | 18 | |
| (I) | Revenue by Region (IFRS and Non-IFRS) | 19 | |
| (J) | Employees by Region and Functional Areas | 19 | |
| Other Disclosures | 20 | ||
| (K) | Share-Based Payments | 20 | |
8/20
| Quarterly Statement Q1 2024 |
Financial and Non-Financial Key Facts
(IFRS and Non-IFRS)
| € millions, unless otherwise stated | Q1 2023 | Q2 2023 | Q3 2023 | Q4 2023 | TY 2023 | Q1 2024 |
| Revenues | ||||||
| Cloud | 3,178 | 3,316 | 3,472 | 3,699 | 13,664 | 3,928 |
| % change – yoy | 24 | 19 | 16 | 20 | 20 | 24 |
| % change constant currency – yoy | 22 | 22 | 23 | 25 | 23 | 25 |
| Cloud ERP Suite | 2,422 | 2,562 | 2,711 | 2,931 | 10,626 | 3,167 |
| % change – yoy | 35 | 30 | 26 | 28 | 29 | 31 |
| % change constant currency – yoy | 33 | 33 | 34 | 33 | 33 | 32 |
| Software licenses | 276 | 316 | 335 | 838 | 1,764 | 203 |
| % change – yoy | –13 | –26 | –17 | –8 | –14 | –26 |
| % change constant currency – yoy | –13 | –24 | –14 | –6 | –12 | –25 |
| Software support | 2,905 | 2,873 | 2,872 | 2,846 | 11,496 | 2,829 |
| % change – yoy | –1 | –3 | –5 | –5 | –3 | –3 |
| % change constant currency – yoy | –1 | –1 | –1 | –1 | –1 | –1 |
| Software licenses and support | 3,180 | 3,189 | 3,208 | 3,683 | 13,261 | 3,031 |
| % change – yoy | –2 | –6 | –6 | –6 | –5 | –5 |
| % change constant currency – yoy | –2 | –4 | –2 | –2 | –3 | –4 |
| Cloud and software | 6,358 | 6,505 | 6,679 | 7,382 | 26,924 | 6,960 |
| % change – yoy | 10 | 5 | 4 | 6 | 6 | 9 |
| % change constant currency – yoy | 8 | 8 | 9 | 10 | 9 | 11 |
| Total revenue | 7,441 | 7,554 | 7,744 | 8,468 | 31,207 | 8,041 |
| % change – yoy | 10 | 5 | 4 | 5 | 6 | 8 |
| % change constant currency – yoy | 9 | 8 | 9 | 9 | 9 | 9 |
| Share of more predictable revenue (in %) | 82 | 82 | 82 | 77 | 81 | 84 |
| Profits | ||||||
| Operating profit (loss) (IFRS) | 803 | 1,371 | 1,723 | 1,902 | 5,799 | –787 |
| Operating profit (loss) (non-IFRS) | 1,321 | 1,457 | 1,767 | 1,969 | 6,514 | 1,533 |
| % change | –15 | 14 | 7 | 1 | 1 | 16 |
| % change constant currency | –15 | 19 | 13 | 5 | 5 | 19 |
| Profit (loss) after tax (IFRS) | 403 | 724 | 1,272 | 1,201 | 3,600 | –824 |
| Profit (loss) after tax (non-IFRS) | 868 | 799 | 1,352 | 1,302 | 4,321 | 944 |
| % change | –20 | –9 | 13 | –10 | –6 | 9 |
| Margins | ||||||
| Cloud gross margin (IFRS, in %) | 70.5 | 71.1 | 72.7 | 71.9 | 71.6 | 72.2 |
| Cloud gross margin (non-IFRS, in %) | 70.8 | 71.4 | 73.0 | 72.2 | 71.9 | 72.5 |
| Software license and support gross margin (IFRS, in %) | 88.6 | 89.8 | 90.0 | 89.8 | 89.6 | 89.2 |
| Software license and support gross margin (non-IFRS, in %) | 88.9 | 90.2 | 90.1 | 89.8 | 89.8 | 89.2 |
| Cloud and software gross margin (IFRS, in %) | 79.5 | 80.3 | 81.0 | 80.8 | 80.4 | 79.6 |
| Cloud and software gross margin (non-IFRS, in %) | 79.9 | 80.6 | 81.2 | 81.0 | 80.7 | 79.8 |
| Gross margin (IFRS, in %) | 71.0 | 71.6 | 72.8 | 73.3 | 72.2 | 71.7 |
| Gross margin (non-IFRS, in %) | 71.3 | 71.9 | 73.0 | 73.4 | 72.4 | 71.8 |
| Operating margin (IFRS, in %) | 10.8 | 18.2 | 22.2 | 22.5 | 18.6 | –9.8 |
| Operating margin (non-IFRS, in %) | 17.8 | 19.3 | 22.8 | 23.3 | 20.9 | 19.1 |
9/20
| Quarterly Statement Q1 2024 |
| € millions, unless otherwise stated | Q1 2023 | Q2 2023 | Q3 2023 | Q4 2023 | TY 2023 | Q1 2024 |
| Key Profit Ratios | ||||||
| Effective tax rate (IFRS, in %) | 40.5 | 33.8 | 27.8 | 33.6 | 32.6 | 16.0 |
| Effective tax rate (non-IFRS, in %) | 29.1 | 33.0 | 27.1 | 32.5 | 30.3 | 32.4 |
| Earnings per share, basic (IFRS, in €) from continuing operations | 0.35 | 0.62 | 1.09 | 1.05 | 3.11 | –0.71 |
| Earnings per share, basic (non-IFRS, in €) from continuing operations | 0.75 | 0.69 | 1.16 | 1.12 | 3.72 | 0.81 |
| Earnings per share, basic (IFRS, in €)1 | 0.41 | 2.70 | 1.09 | 1.05 | 5.26 | –0.71 |
| Earnings per share, basic (non-IFRS, in €)1 | 0.83 | 2.40 | 1.16 | 1.12 | 5.51 | 0.81 |
| Order Entry and current cloud backlog | ||||||
| Current cloud backlog | 11,148 | 11,537 | 12,269 | 13,745 | 13,745 | 14,179 |
| % change – yoy | 25 | 21 | 19 | 25 | 25 | 27 |
| % change constant currency – yoy | 25 | 25 | 25 | 27 | 27 | 28 |
| Share of cloud orders greater than €5 million based on total cloud order entry volume (in %) | 45 | 46 | 49 | 62 | 55 | 52 |
| Share of cloud orders smaller than €1 million based on total cloud order entry volume (in %) | 26 | 25 | 21 | 14 | 19 | 21 |
| Liquidity and Cash Flow | ||||||
| Net cash flows from operating activities | 2,311 | 848 | 1,124 | 1,926 | 6,210 | 2,757 |
| Purchase of intangible assets and property, plant, and equipment | –257 | –156 | –182 | –190 | –785 | –187 |
| Payments of lease liabilities | –99 | –89 | –78 | –66 | –332 | –78 |
| Free cash flow | 1,955 | 604 | 865 | 1,670 | 5,093 | 2,492 |
| % of total revenue | 26 | 8 | 11 | 20 | 16 | 31 |
| % of profit after tax (IFRS) | 485 | 83 | 68 | 142 | 143 | N/A |
| Cash and cash equivalents | 8,766 | 14,142 | 9,378 | 8,124 | 8,124 | 9,295 |
| Group liquidity | 9,700 | 14,326 | 12,122 | 11,275 | 11,275 | 13,411 |
| Financial debt (–) | –10,751 | –10,146 | –8,445 | –7,755 | –7,755 | –7,770 |
| Net liquidity (+) / Net debt(–) | –1,050 | 4,180 | 3,677 | 3,521 | 3,521 | 5,641 |
| Non-Financials | ||||||
| Number of employees (quarter end)2 | 105,132 | 105,328 | 106,495 | 107,602 | 107,602 | 108,133 |
| Employee retention (in %, rolling 12 months) | 93.8 | 95.1 | 96.0 | 96.4 | 96.4 | 96.6 |
| Women in management (in %, quarter end) | 29.4 | 29.5 | 29.5 | 29.7 | 29.7 | 29.8 |
| Women in executive roles (in %, quarter end) | 21.8 | 21.9 | 22.1 | 22.2 | 22.2 | 21.7 |
Gross greenhouse gas emissions (scope 1, 2, 3 / market-based)3 (in million tons CO2 equivalents) | 6.9 | 1.8 |
1 From continuing and discontinued operations.
2 In full-time equivalents.
3 Our gross greenhouse gas emissions (GHG) - which cover scope 1, scope 2, and scope 3 (market based) - include the total lifecycle emissions resulting from the use of our on-premise software. A projection over the next 12 months amounts to 5.7m tons CO2e. To facilitate quarterly comparisons, we have divided this number by four and included the resulting figure in our quarterly gross GHG emissions. The calculation of use of sold products emissions is based on the number of active maintenance contracts at quarter end. Therefore, the emissions for individual quarters will not add up to the total sum of GHG emissions at year end.
10/20
| Quarterly Statement Q1 2024 |
Primary Financial Statements of SAP Group (IFRS)
| (A) | Consolidated Income Statements |
| (A.1) | Consolidated Income Statements – Quarter |
| € millions, unless otherwise stated | Q1 2024 | Q1 2023 | ∆ in % | |
| Cloud | 3,928 | 3,178 | 24 | |
| Software licenses | 203 | 276 | –26 | |
| Software support | 2,829 | 2,905 | –3 | |
| Software licenses and support | 3,031 | 3,180 | –5 | |
| Cloud and software | 6,960 | 6,358 | 9 | |
| Services | 1,081 | 1,083 | 0 | |
| Total revenue | 8,041 | 7,441 | 8 | |
| Cost of cloud | –1,091 | –938 | 16 | |
| Cost of software licenses and support | –326 | –363 | –10 | |
| Cost of cloud and software | –1,417 | –1,301 | 9 | |
| Cost of services | –862 | –855 | 1 | |
| Total cost of revenue | –2,279 | –2,156 | 6 | |
| Gross profit | 5,762 | 5,284 | 9 | |
| Research and development | –1,665 | –1,573 | 6 | |
| Sales and marketing | –2,278 | –2,291 | –1 | |
| General and administration | –360 | –348 | 3 | |
| Restructuring | –2,242 | –260 | >100 | |
| Other operating income/expense, net | –4 | –8 | –53 | |
| Total operating expenses | –8,828 | –6,637 | 33 | |
| Operating profit (loss) | –787 | 803 | N/A | |
| Other non-operating income/expense, net | –148 | –14 | >100 | |
| Finance income | 199 | 182 | 9 | |
| Finance costs | –244 | –293 | –17 | |
| Financial income, net | –45 | –112 | –60 | |
| Profit (loss) before tax from continuing operations | –980 | 677 | N/A | |
| Income tax expense | 157 | –274 | N/A | |
| Profit (loss) after tax from continuing operations | –824 | 403 | N/A | |
| Attributable to owners of parent | –828 | 407 | N/A | |
| Attributable to non-controlling interests | 4 | –3 | N/A | |
| Profit (loss) after tax from discontinued operations | 0 | 106 | N/A | |
| Profit (loss) after tax2 | –824 | 509 | N/A | |
| Attributable to owners of parent2 | –828 | 479 | N/A | |
| Attributable to non-controlling interests2 | 4 | 31 | –86 | |
| Earnings per share, basic (in €)1 from continuing operations | –0.71 | 0.35 | N/A | |
| Earnings per share, basic (in €)1, 2 | –0.71 | 0.41 | N/A | |
| Earnings per share, diluted (in €)1 from continuing operations | –0.70 | 0.35 | N/A | |
| Earnings per share, diluted (in €)1, 2 | –0.70 | 0.41 | N/A |
1 For the three months ended March 31, 2024 and 2023, the weighted average number of shares was 1,167 million (diluted 1,179 million) and 1,167 million (diluted: 1,174 million), respectively (treasury stock excluded).
2 From continuing and discontinued operations
11/20
| Quarterly Statement Q1 2024 |
| (B) | Consolidated Statements of Financial Position |
| as at 03/31/2024 and 12/31/2023 | ||
| € millions | 2024 | 2023 |
| Cash and cash equivalents | 9,295 | 8,124 |
| Other financial assets | 4,312 | 3,344 |
| Trade and other receivables | 7,435 | 6,322 |
| Other non-financial assets | 2,394 | 2,374 |
| Tax assets | 360 | 407 |
| Total current assets | 23,796 | 20,571 |
| Goodwill | 29,558 | 29,088 |
| Intangible assets | 2,449 | 2,505 |
| Property, plant, and equipment | 4,264 | 4,276 |
| Other financial assets | 5,687 | 5,543 |
| Trade and other receivables | 120 | 203 |
| Other non-financial assets | 3,555 | 3,573 |
| Tax assets | 362 | 382 |
| Deferred tax assets | 3,124 | 2,193 |
| Total non-current assets | 49,119 | 47,764 |
| Total assets | 72,915 | 68,335 |
| € millions | 2024 | 2023 |
| Trade and other payables | 1,926 | 1,783 |
| Tax liabilities | 623 | 266 |
| Financial liabilities | 1,659 | 1,735 |
| Other non-financial liabilities | 4,557 | 5,648 |
| Provisions | 2,320 | 235 |
| Contract liabilities | 7,994 | 4,975 |
| Total current liabilities | 19,078 | 14,642 |
| Trade and other payables | 32 | 39 |
| Tax liabilities | 773 | 877 |
| Financial liabilities | 7,940 | 7,941 |
| Other non-financial liabilities | 1,014 | 698 |
| Provisions | 426 | 433 |
| Deferred tax liabilities | 274 | 265 |
| Contract liabilities | 41 | 33 |
| Total non-current liabilities | 10,501 | 10,287 |
| Total liabilities | 29,579 | 24,928 |
| Issued capital | 1,229 | 1,229 |
| Share premium | 2,048 | 1,845 |
| Retained earnings | 41,630 | 42,457 |
| Other components of equity | 3,183 | 2,368 |
| Treasury shares | –5,011 | –4,741 |
| Equity attributable to owners of parent | 43,079 | 43,157 |
| Non-controlling interests | 257 | 249 |
| Total equity | 43,336 | 43,406 |
| Total equity and liabilities | 72,915 | 68,335 |
12/20
| Quarterly Statement Q1 2024 |
| (C) | Consolidated Statements of Cash Flows |
| € millions | Q1 2024 | Q1 2023 |
| Profit (loss) after tax | –824 | 509 |
| Adjustments to reconcile profit (loss) after tax to net cash flows from operating activities: | ||
| (Profit) loss after tax from discontinued operations | 0 | –106 |
| Depreciation and amortization | 313 | 365 |
| Share-based payment expense | 688 | 553 |
| Income tax expense | –157 | 274 |
| Financial income, net | 45 | 112 |
| Decrease/increase in allowances on trade receivables | –22 | 10 |
| Other adjustments for non-cash items | 141 | 17 |
| Decrease/increase in trade and other receivables | –960 | –657 |
| Decrease/increase in other assets | 33 | –279 |
| Increase/decrease in trade payables, provisions, and other liabilities | 1,194 | –779 |
| Increase/decrease in contract liabilities | 2,990 | 2,873 |
| Share-based payments | –143 | –118 |
| Interest paid | –265 | –141 |
| Interest received | 144 | 88 |
| Income taxes paid, net of refunds | –420 | –409 |
| Net cash flows from operating activities – continuing operations | 2,757 | 2,311 |
| Net cash flows from operating activities – discontinued operations | 0 | 62 |
| Net cash flows from operating activities | 2,757 | 2,373 |
| Business combinations, net of cash and cash equivalents acquired | –19 | 0 |
| Purchase of intangible assets and property, plant, and equipment | –187 | –257 |
| Proceeds from sales of intangible assets and property, plant, and equipment | 27 | 24 |
| Purchase of equity or debt instruments of other entities | –4,248 | –358 |
| Proceeds from sales of equity or debt instruments of other entities | 3,297 | 101 |
| Net cash flows from investing activities – continuing operations | –1,129 | –489 |
| Net cash flows from investing activities – discontinued operations | 0 | –9 |
| Net cash flows from investing activities | –1,129 | –499 |
| Dividends paid on non-controlling interests | 0 | –8 |
| Purchase of treasury shares | –432 | 0 |
| Proceeds from borrowings | 1 | 0 |
| Repayments of borrowings | –13 | –1,119 |
| Payments of lease liabilities | –78 | –99 |
| Net cash flows from financing activities – continuing operations | –522 | –1,226 |
| Net cash flows from financing activities – discontinued operations | 0 | 13 |
| Net cash flows from financing activities | –522 | –1,213 |
| Effect of foreign currency rates on cash and cash equivalents | 65 | –161 |
| Net decrease/increase in cash and cash equivalents | 1,170 | 500 |
| Cash and cash equivalents at the beginning of the period | 8,124 | 9,008 |
| Cash and cash equivalents at the end of the period | 9,295 | 9,507 |
| Less: Cash and cash equivalents from discontinued operations at the end of the period | 0 | 742 |
| Cash and cash equivalents at the end of the period (Consolidated Statements of Financial Position) | 9,295 | 8,766 |
13/20
| Quarterly Statement Q1 2024 |
Non-IFRS Numbers
| (D) | Basis of Non-IFRS Presentation |
SAP disclose certain financial measures such as expense (non-IFRS) and profit measures (non-IFRS) that are not prepared in accordance with IFRS and are therefore considered non-IFRS financial measures.
For a more detailed description of all of SAP’s non-IFRS measures and their limitations as well as SAP’s constant currency and free cash flow figures, see Explanation of Non-IFRS Measures.
| (E) | Reconciliation from Non-IFRS Numbers to IFRS Numbers |
| (E.1) | Reconciliation of Non-IFRS Revenue – Quarter |
| € millions, unless otherwise stated | Q1 2024 | Q1 2023 | ∆ in % | |||
| IFRS | Currency Impact | Non-IFRS Constant Currency | IFRS | IFRS | Non-IFRS Constant Currency | |
| Revenue Numbers | ||||||
| Cloud | 3,928 | 50 | 3,978 | 3,178 | 24 | 25 |
| Software licenses | 203 | 3 | 206 | 276 | –26 | –25 |
| Software support | 2,829 | 33 | 2,862 | 2,905 | –3 | –1 |
| Software licenses and support | 3,031 | 37 | 3,068 | 3,180 | –5 | –4 |
| Cloud and software | 6,960 | 86 | 7,046 | 6,358 | 9 | 11 |
| Services | 1,081 | 10 | 1,091 | 1,083 | 0 | 1 |
| Total revenue | 8,041 | 96 | 8,137 | 7,441 | 8 | 9 |
14/20
| Quarterly Statement Q1 2024 |
| (E.2) | Reconciliation of Non-IFRS Operating Expenses – Quarter |
| € millions, unless otherwise stated | Q1 2024 | Q1 2023 | ∆ in % | ||||||||
| IFRS | Adj. | Non- IFRS | Currency Impact | Non-IFRS Constant Currency | IFRS | Adj. | Non- IFRS | IFRS | Non-IFRS | Non-IFRS Constant Currency | |
| Operating Expense Numbers | |||||||||||
| Cost of cloud | –1,091 | 12 | –1,079 | –938 | 10 | –929 | 16 | 16 | |||
| Cost of software licenses and support | –326 | 0 | –326 | –363 | 11 | –352 | –10 | –7 | |||
| Cost of cloud and software | –1,417 | 12 | –1,405 | –1,301 | 21 | –1,281 | 9 | 10 | |||
| Cost of services | –862 | 0 | –862 | –855 | 0 | –855 | 1 | 1 | |||
| Total cost of revenue | –2,279 | 12 | –2,267 | –2,156 | 21 | –2,135 | 6 | 6 | |||
| Gross profit | 5,762 | 12 | 5,774 | 5,284 | 21 | 5,305 | 9 | 9 | |||
| Research and development | –1,665 | 2 | –1,663 | –1,573 | 2 | –1,572 | 6 | 6 | |||
| Sales and marketing | –2,278 | 64 | –2,214 | –2,291 | 235 | –2,057 | –1 | 8 | |||
| General and administration | –360 | 1 | –360 | –348 | 0 | –348 | 3 | 3 | |||
| Restructuring | –2,242 | 2,242 | 0 | –260 | 260 | 0 | >100 | N/A | |||
| Other operating income/expense, net | –4 | 0 | –4 | –8 | 0 | –8 | –53 | –53 | |||
| Total operating expenses | –8,828 | 2,321 | –6,507 | –52 | –6,559 | –6,637 | 518 | –6,119 | 33 | 6 | 7 |
| (E.3) | Reconciliation of Non-IFRS Profit Figures, Income Tax, and Key Ratios – Quarter |
| € millions, unless otherwise stated | Q1 2024 | Q1 2023 | ∆ in % | ||||||||
| IFRS | Adj. | Non- IFRS | Currency Impact | Non-IFRS Constant Currency | IFRS | Adj. | Non- IFRS | IFRS | Non-IFRS | Non-IFRS Constant Currency | |
| Profit Numbers | |||||||||||
| Operating profit (loss) | –787 | 2,321 | 1,533 | 44 | 1,578 | 803 | 518 | 1,321 | N/A | 16 | 19 |
| Other non-operating income/expense, net | –148 | 0 | –148 | –14 | 0 | –14 | >100 | >100 | |||
| Finance income | 199 | –32 | 166 | 182 | –104 | 77 | 9 | >100 | |||
| Finance costs | –244 | 88 | –155 | –293 | 133 | –161 | –17 | –3 | |||
| Financial income, net | –45 | 56 | 11 | –112 | 29 | –83 | –60 | N/A | |||
| Profit (loss) before tax from continuing operations | –980 | 2,377 | 1,396 | 677 | 547 | 1,224 | N/A | 14 | |||
| Income tax expense | 157 | –609 | –452 | –274 | –82 | –357 | N/A | 27 | |||
| Profit (loss) after tax from continuing operations | –824 | 1,768 | 944 | 403 | 464 | 868 | N/A | 9 | |||
| Attributable to owners of parent | –828 | 1,768 | 940 | 407 | 463 | 870 | N/A | 8 | |||
| Attributable to non-controlling interests | 4 | 0 | 4 | –3 | 1 | –2 | N/A | N/A | |||
| Profit (loss) after tax1 | –824 | 1,768 | 944 | 509 | 502 | 1,012 | N/A | –7 | |||
| Attributable to owners of parent1 | –828 | 1,768 | 940 | 479 | 490 | 968 | N/A | –3 | |||
| Attributable to non-controlling interests1 | 4 | 0 | 4 | 31 | 12 | 43 | –86 | –90 | |||
| Key Ratios | |||||||||||
| Operating margin (in %) | –9.8 | 19.1 | 19.4 | 10.8 | 17.8 | –20.6pp | 1.3pp | 1.6pp | |||
| Effective tax rate (in %)2 | 16.0 | 32.4 | 40.5 | 29.1 | –24.5pp | 3.3pp | |||||
| Earnings per share, basic (in €) from continuing operations | –0.71 | 0.81 | 0.35 | 0.75 | N/A | 8 | |||||
| Earnings per share, basic (in €)1 | –0.71 | 0.81 | 0.41 | 0.83 | N/A | –3 | |||||
1 From continuing and discontinued operations
2 The difference between our effective tax rate (IFRS) and effective tax rate (non-IFRS) in Q1 2024 and Q1 2023 mainly resulted from tax effects of restructuring expenses.
15/20
| Quarterly Statement Q1 2024 |
| (E.4) | Reconciliation of Free Cash Flow |
| € millions, unless otherwise stated | Q1 2024 | Q1 2023 |
| Net cash flows from operating activities – continuing operations | 2,757 | 2,311 |
| Purchase of intangible assets and property, plant, and equipment | –187 | –257 |
| Payments of lease liabilities | –78 | –99 |
| Free cash flow | 2,492 | 1,955 |
| Net cash flows from investing activities – continuing operations | –1,129 | –489 |
| Net cash flows from financing activities – continuing operations | –522 | –1,226 |
16/20
| Quarterly Statement Q1 2024 |
(F) Non-IFRS Adjustments – Actuals and Estimates
| € millions, unless otherwise stated | Estimated Amounts for Full Year 2024 | Q1 2024 | Q1 2023 |
| Profit (loss) before tax from continuing operations (IFRS) | –980 | 677 | |
| Adjustment for acquisition-related charges | 280–360 | 79 | 88 |
| Adjustment for restructuring | at least €2.2 bn | 2,242 | 260 |
| Adjustment for regulatory compliance matter expenses | 0 | 0 | 170 |
| Adjustment for gains and losses from equity securities, net | N/A1 | 56 | 29 |
| Profit (loss) before tax from continuing operations (non-IFRS) | 1,396 | 1,224 |
1 Due to the uncertainty and potential variability of gains and losses from equity securities, we cannot provide an estimate for the full year without unreasonable efforts. This item could however have a material impact on our non-IFRS measures below operating profit.
(G) Non-IFRS Operating Expense Adjustments by Functional Areas
| € millions | Q1 2024 | Q1 2023 | ||||||||
| IFRS | Acquisition -Related | Restructuring | RCM1 | Non-IFRS | IFRS | Acquisition -Related | Restructuring | RCM1 | Non-IFRS | |
| Cost of cloud | –1,091 | 12 | 0 | 0 | –1,079 | –938 | 10 | 0 | 0 | –929 |
| Cost of software licenses and support | –326 | 0 | 0 | 0 | –326 | –363 | 11 | 0 | 0 | –352 |
| Cost of services | –862 | 0 | 0 | 0 | –862 | –855 | 0 | 0 | 0 | –855 |
| Research and development | –1,665 | 2 | 0 | 0 | –1,663 | –1,573 | 2 | 0 | 0 | –1,572 |
| Sales and marketing | –2,278 | 64 | 0 | 0 | –2,214 | –2,291 | 65 | 0 | 170 | –2,057 |
| General and administration | –360 | 1 | 0 | 0 | –360 | –348 | 0 | 0 | 0 | –348 |
| Restructuring | –2,242 | 0 | 2,242 | 0 | 0 | –260 | 0 | 260 | 0 | 0 |
| Other operating income/expense, net | –4 | 0 | 0 | 0 | –4 | –8 | 0 | 0 | 0 | –8 |
| Total operating expenses | –8,828 | 79 | 2,242 | 0 | –6,507 | –6,637 | 88 | 260 | 170 | –6,119 |
1 Regulatory Compliance Matters
If not presented in a separate line item in our income statement, the restructuring expenses would break down as follows:
| € millions | Q1 2024 | Q1 2023 |
| Cost of cloud | –67 | –5 |
| Cost of software licenses and support | –56 | –11 |
| Cost of services | –425 | –35 |
| Research and development | –956 | –37 |
| Sales and marketing | –622 | –159 |
| General and administration | –116 | –12 |
| Restructuring expenses | –2,242 | –260 |
17/20
| Quarterly Statement Q1 2024 |
Disaggregations
(H) Segment Reporting
(H.1) Segment Policies and Segment Changes
SAP has one reportable segment: the Applications, Technology & Services segment.
In the first quarter 2024, the non-reportable Business Network segment was dissolved and integrated into the Applications, Technology & Services segment. The segment information for comparative prior periods were restated to conform with the new segment composition.
For a more detailed description of SAP’s segment reporting, see Note (C.1) “Results of Segments” of our Consolidated Financial Statements 2023.
(H.2) Segment Reporting – Quarter
Applications, Technology & Services1
€ millions, unless otherwise stated (non-IFRS) | Q1 2024 | Q1 2023 | ∆ in % | ∆ in % | |
Actual Currency | Constant Currency | Actual Currency | Actual Currency | Constant Currency | |
| Cloud | 3,863 | 3,912 | 3,123 | 24 | 25 |
| Software licenses | 203 | 206 | 276 | –26 | –25 |
| Software support | 2,829 | 2,862 | 2,905 | –3 | –1 |
| Software licenses and support | 3,032 | 3,068 | 3,180 | –5 | –4 |
| Cloud and software | 6,895 | 6,981 | 6,303 | 9 | 11 |
| Services | 1,077 | 1,087 | 1,077 | 0 | 1 |
| Total segment revenue | 7,971 | 8,067 | 7,380 | 8 | 9 |
| Cost of cloud | –1,058 | –1,070 | –913 | 16 | 17 |
| Cost of software licenses and support | –315 | –317 | –344 | –9 | –8 |
| Cost of cloud and software | –1,373 | –1,387 | –1,257 | 9 | 10 |
| Cost of services | –836 | –842 | –815 | 3 | 3 |
| Total cost of revenue | –2,209 | –2,229 | –2,072 | 7 | 8 |
| Cloud gross profit | 2,804 | 2,842 | 2,211 | 27 | 29 |
| Segment gross profit | 5,762 | 5,839 | 5,308 | 9 | 10 |
| Other segment expenses | –3,564 | –3,596 | –3,361 | 6 | 7 |
| Segment profit (loss) | 2,198 | 2,242 | 1,947 | 13 | 15 |
| Margins | |||||
| Segment gross margin (in %) | 72.3 | 72.4 | 71.9 | 0.4pp | 0.4pp |
| Segment margin (in %) | 27.6 | 27.8 | 26.4 | 1.2pp | 1.4pp |
1 Segment information for comparative prior periods were restated to conform with the new segment composition.
18/20
| Quarterly Statement Q1 2024 |
(I) Revenue by Region (IFRS and Non-IFRS)
(I.1) Revenue by Region (IFRS and Non-IFRS) – Quarter
| € millions | Q1 2024 | Q1 2023 | ∆ in % | |||
| Actual currency | Currency Impact | Constant Currency | Actual currency | Actual currency | Constant Currency | |
| Cloud Revenue by Region | ||||||
| EMEA | 1,557 | –3 | 1,555 | 1,191 | 31 | 31 |
| Americas | 1,847 | 18 | 1,865 | 1,573 | 17 | 19 |
| APJ | 524 | 34 | 558 | 414 | 27 | 35 |
| Cloud revenue | 3,928 | 50 | 3,978 | 3,178 | 24 | 25 |
| Cloud and Software Revenue by Region | ||||||
| EMEA | 3,109 | –5 | 3,105 | 2,783 | 12 | 12 |
| Americas | 2,864 | 26 | 2,890 | 2,637 | 9 | 10 |
| APJ | 987 | 64 | 1,051 | 939 | 5 | 12 |
| Cloud and software revenue | 6,960 | 86 | 7,046 | 6,358 | 9 | 11 |
| Total Revenue by Region | ||||||
| Germany | 1,237 | 0 | 1,237 | 1,137 | 9 | 9 |
| Rest of EMEA | 2,359 | –7 | 2,353 | 2,139 | 10 | 10 |
| Total EMEA | 3,596 | –7 | 3,590 | 3,275 | 10 | 10 |
| United States | 2,668 | 31 | 2,699 | 2,497 | 7 | 8 |
| Rest of Americas | 669 | 0 | 669 | 605 | 11 | 10 |
| Total Americas | 3,337 | 30 | 3,367 | 3,102 | 8 | 9 |
| Japan | 325 | 41 | 366 | 303 | 7 | 21 |
| Rest of APJ | 783 | 31 | 814 | 760 | 3 | 7 |
| Total APJ | 1,107 | 73 | 1,180 | 1,063 | 4 | 11 |
| Total revenue | 8,041 | 96 | 8,137 | 7,441 | 8 | 9 |
(J) Employees by Region and Functional Areas
| Full-time equivalents | 03/31/2024 | 03/31/2023 | ||||||
| EMEA | Americas | APJ | Total | EMEA | Americas | APJ | Total | |
| Cloud and software | 4,398 | 4,266 | 4,458 | 13,122 | 3,860 | 3,803 | 3,743 | 11,405 |
| Services | 8,265 | 4,989 | 5,509 | 18,763 | 8,070 | 5,081 | 5,716 | 18,867 |
| Research and development | 18,115 | 5,935 | 12,489 | 36,540 | 17,980 | 5,780 | 12,391 | 36,150 |
| Sales and marketing | 12,302 | 10,330 | 5,400 | 28,032 | 11,747 | 10,213 | 5,321 | 27,282 |
| General and administration | 3,624 | 1,792 | 1,307 | 6,723 | 3,433 | 1,773 | 1,255 | 6,461 |
| Infrastructure | 2,829 | 1,252 | 872 | 4,953 | 2,813 | 1,285 | 870 | 4,968 |
| SAP Group (03/31) | 49,532 | 28,565 | 30,036 | 108,133 | 47,902 | 27,934 | 29,295 | 105,132 |
| Thereof acquisitions1 | 0 | 0 | 0 | 0 | 0 | 0 | 0 | 0 |
| SAP Group (three months' end average) | 49,404 | 28,543 | 29,986 | 107,934 | 47,879 | 28,206 | 29,404 | 105,490 |
1 Acquisitions closed between January 1 and March 31 of the respective year.
19/20
| Quarterly Statement Q1 2024 |
Other Disclosures
(K) Share-Based Payment Expenses
SAP’s share-based payment expenses included in our non-IFRS operating expenses break down as follows:
| € millions | Q1 2024 | Q1 2023 |
| Cost of cloud | –39 | –20 |
| Cost of software licenses and support | –12 | –9 |
| Cost of services | –102 | –92 |
| Research and development | –212 | –169 |
| Sales and marketing | –258 | –203 |
| General and administration | –66 | –60 |
| Share-based payment expenses | –688 | –553 |
Additionally in the first quarter of 2024, SAP recognized €82 million (Q1/2023: €0 million) of accelerated share-based payment expenses triggered by the transformation program. These expenses are included in the restructuring expenses in our IFRS income statements.
20/20