Exhibit 99.1
 | Quarterly Statement Q2 2024 |
SAP Announces Q2 2024 Results
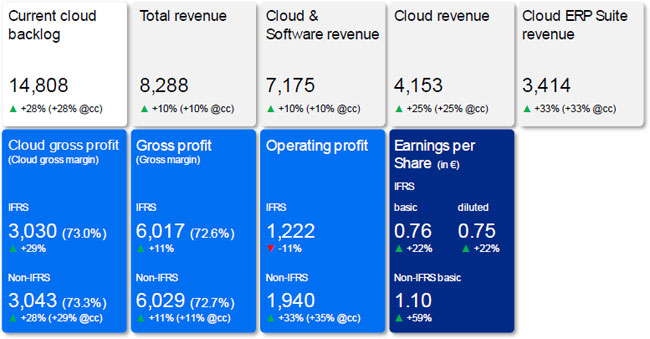
| • | Current cloud backlog of €14.8 billion, up 28%, both at nominal and constant currencies |
| • | Cloud revenue up 25%, underpinned by 33% Cloud ERP Suite revenue growth, all at nominal and constant currencies |
| • | Total revenue up 10%, both at nominal and constant currencies |
| • | IFRS cloud gross profit up 29%, non-IFRS cloud gross profit up 28% and up 29% at constant currencies |
| • | IFRS operating profit down 11% due to restructuring expenses of €0.6 billion. Non-IFRS operating profit up 33% and up 35% at constant currencies |
| • | 2024 financial outlook reiterated. 2025 operating profit ambition increased to reflect anticipated incremental efficiency gains from expanded transformation program |
in € millions, unless otherwise stated; based on SAP group results from continuing operations
| 1 | /27 |
| Quarterly Statement Q2 2024 |
Walldorf, Germany – July 22, 2024
SAP SE (NYSE: SAP) announced today its financial results for the second quarter ended June 30, 2024.
Christian Klein, CEO:
Our cloud growth momentum remained strong in Q2, with Business AI enabling many deals. We continue to execute on our transformation with great discipline, leading to an increase in our operating profit ambition for 2025. At the same time, we continue to invest into our transformation to be the leader in Business AI. Given our progress and strong pipeline, we are confident to achieve accelerating topline growth through 2027.
Dominik Asam, CFO:
We are staying squarely focused on delivering our outlook for this year. Our current cloud backlog growth during the second half of 2024, and especially in Q4 will be decisive to lay a solid foundation for our cloud revenue ambition for 2025. At the same time, we’ll continue to execute against our transformation plan to achieve our 2025 free cash flow ambition despite a mid-triple-digit million cash out for restructuring spilling into next year.
All figures in this statement are based on SAP group results from continuing operations unless otherwise noted.
Financial Performance
Group results at a glance – Second quarter 2024
| IFRS | Non-IFRS1 | |||||||
| € million, unless otherwise stated | Q2 2024 | Q2 2023 | ∆ in % | Q2 2024 | Q2 2023 | ∆ in % | ∆ in % const. curr. | |
| SaaS/PaaS | 4,018 | 3,130 | 28 | 4,018 | 3,130 | 28 | 28 | |
| Thereof Cloud ERP Suite2 | 3,414 | 2,562 | 33 | 3,414 | 2,562 | 33 | 33 | |
| Thereof Extension Suite3 | 604 | 568 | 6 | 604 | 568 | 6 | 6 | |
| IaaS4 | 135 | 186 | –27 | 135 | 186 | –27 | –27 | |
| Cloud revenue | 4,153 | 3,316 | 25 | 4,153 | 3,316 | 25 | 25 | |
| Cloud and software revenue | 7,175 | 6,505 | 10 | 7,175 | 6,505 | 10 | 10 | |
| Total revenue | 8,288 | 7,554 | 10 | 8,288 | 7,554 | 10 | 10 | |
| Share of more predictable revenue (in %) | 84 | 82 | 2pp | 84 | 82 | 2pp | ||
| Cloud gross profit | 3,030 | 2,357 | 29 | 3,043 | 2,368 | 28 | 29 | |
| Gross profit | 6,017 | 5,409 | 11 | 6,029 | 5,432 | 11 | 11 | |
| Operating profit (loss) | 1,222 | 1,371 | –11 | 1,940 | 1,457 | 33 | 35 | |
| Profit (loss) after tax from continuing operations | 918 | 724 | 27 | 1,278 | 799 | 60 | ||
| Profit (loss) after tax5 | 918 | 2,982 | –69 | 1,278 | 2,437 | –48 | ||
| Earnings per share - Basic (in €) from continuing operations | 0.76 | 0.62 | 22 | 1.10 | 0.69 | 59 | ||
| Earnings per share - Basic (in €)5 | 0.76 | 2.70 | –72 | 1.10 | 2.40 | –54 | ||
| Net cash flows from operating activities from continuing operations | 1,540 | 848 | 82 | |||||
| Free cash flow | 1,291 | 604 | >100 | |||||
1 For a breakdown of the individual adjustments see table “Non-IFRS Operating Expense Adjustments by Functional Areas” in this Quarterly Statement.
2 Cloud ERP Suite references the portfolio of strategic Software-as-a-Service (SaaS) and Platform-as-a-Service (PaaS) solutions that are tightly integrated with our core ERP solutions and are included in key commercial packages, such as RISE with SAP. The following offerings contribute to Cloud ERP Suite revenue: SAP S/4HANA Cloud, SAP Business Technology Platform, and core solutions for HR and payroll, spend management, commerce, customer data solutions, business process transformation, and working capital management. For additional information and historical data on Cloud ERP Suite, see SAP’s Reporting Framework.
3 Extension Suite references SAP’s remaining SaaS and PaaS solutions that supplement and extend the functional coverage of the Cloud ERP Suite.
4 Infrastructure as a service (IaaS): The major portion of IaaS comes from SAP HANA Enterprise Cloud.
5 From continuing and discontinued operations.
| 2 | /27 |
| Quarterly Statement Q2 2024 |
Group results at a glance – Six months ended June 2024
| IFRS | Non-IFRS1 | |||||||
| € million, unless otherwise stated | Q1–Q2 2024 | Q1–Q2 2023 | ∆ in % | Q1–Q2 2024 | Q1–Q2 2023 | ∆ in % | ∆ in % const. curr. | |
| SaaS/PaaS | 7,782 | 6,110 | 27 | 7,782 | 6,110 | 27 | 28 | |
| Thereof Cloud ERP Suite revenue2 | 6,581 | 4,984 | 32 | 6,581 | 4,984 | 32 | 33 | |
| Thereof Extension Suite revenue3 | 1,202 | 1,126 | 7 | 1,202 | 1,126 | 7 | 7 | |
| IaaS4 | 299 | 383 | –22 | 299 | 383 | –22 | –21 | |
| Cloud revenue | 8,082 | 6,493 | 24 | 8,082 | 6,493 | 24 | 25 | |
| Cloud and software revenue | 14,134 | 12,863 | 10 | 14,134 | 12,863 | 10 | 11 | |
| Total revenue | 16,329 | 14,995 | 9 | 16,329 | 14,995 | 9 | 10 | |
| Share of more predictable revenue (in %) | 84 | 82 | 2pp | 84 | 82 | 2pp | ||
| Cloud gross profit | 5,867 | 4,596 | 28 | 5,892 | 4,617 | 28 | 29 | |
| Gross profit | 11,778 | 10,693 | 10 | 11,803 | 10,737 | 10 | 11 | |
| Operating profit (loss) | 434 | 2,174 | –80 | 3,473 | 2,779 | 25 | 27 | |
| Profit (loss) after tax from continuing operations | 94 | 1,128 | –92 | 2,223 | 1,667 | 33 | ||
| Profit (loss) after tax5 | 94 | 3,491 | –97 | 2,223 | 3,448 | –36 | ||
| Earnings per share - Basic (in €) from continuing operations | 0.05 | 0.97 | –95 | 1.91 | 1.44 | 33 | ||
| Earnings per share - Basic (in €)5 | 0.05 | 3.12 | –98 | 1.91 | 3.23 | –41 | ||
| Net cash flows from operating activities from continuing operations | 4,297 | 3,160 | 36 | |||||
| Free cash flow | 3,784 | 2,559 | 48 | |||||
1 For a breakdown of the individual adjustments see table “Non-IFRS Operating Expense Adjustments by Functional Areas” in this Quarterly Statement.
2 Cloud ERP Suite references the portfolio of strategic Software-as-a-Service (SaaS) and Platform-as-a-Service (PaaS) solutions that are tightly integrated with our core ERP solutions and are included in key commercial packages, such as RISE with SAP. The following offerings contribute to Cloud ERP Suite revenue: SAP S/4HANA Cloud, SAP Business Technology Platform, and core solutions for HR and payroll, spend management, commerce, customer data solutions, business process transformation, and working capital management. For additional information and historical data on Cloud ERP Suite, see SAP’s Reporting Framework.
3 Extension Suite references SAP’s remaining SaaS and PaaS solutions that supplement and extend the functional coverage of the Cloud ERP Suite.
4 Infrastructure as a service (IaaS): The major portion of IaaS comes from SAP HANA Enterprise Cloud.
5 From continuing and discontinued operations.
Financial Highlights1
Second Quarter 2024
In the second quarter, SAP’s strong cloud momentum continued. Current cloud backlog grew by 28% to €14.81 billion and again was up 28% at constant currencies. Cloud revenue was up 25% to €4.15 billion and up 25% at constant currencies, mainly driven by Cloud ERP Suite revenue, which was up 33% to €3.41 billion and up 33% at constant currencies.
Software licenses revenue decreased by 28% to €0.2 billion and was down 27% at constant currencies. Cloud and software revenue was up 10% to €7.17 billion and up 10% at constant currencies. Services revenue was up 6% to €1.11 billion and up 6% at constant currencies. Total revenue was up 10% to €8.29 billion and up 10% at constant currencies.
The share of more predictable revenue increased by 2 percentage points to 84% in the second quarter.
Cloud gross profit was up 29% (IFRS) to €3.03 billion, up 28% to €3.04 billion (non-IFRS), and up 29% (non-IFRS at constant currencies).
IFRS operating profit in the second quarter was down 11% to €1.22 billion. The decrease was driven by restructuring expenses of €0.6 billion associated with the 2024 transformation program. Non-IFRS operating profit was up 33% to €1.94 billion and was up 35% at constant currencies. Non-IFRS operating profit growth was supported by strong revenue growth as well as disciplined execution of the 2024 transformation program.
1 The Q2 2024 results were also impacted by other effects. For details, please refer to the disclosures on page 27 of this document.
| 3 | /27 |
| Quarterly Statement Q2 2024 |
IFRS earnings per share (basic) increased 22% to €0.76. Non-IFRS earnings per share (basic) increased 59% to €1.10. The effective tax rate (IFRS) was 33.8% (Q2/2023: 33.8%) and the effective tax rate (non-IFRS) was 33.6% (Q2/2023: 33.0%). For non-IFRS, the year-over-year increase mainly resulted from a temporary inability to offset withholding taxes in Germany due to tax losses in 2024 resulting from restructuring. For IFRS, the negative effects from withholding taxes were compensated mainly by changes in tax-exempt income and valuation allowances on deferred tax assets.
Free cash flow in the second quarter increased by 114% to €1.3 billion. While around €0.5 billion was paid out for restructuring, the positive development was primarily attributable to increased profitability and enhanced working capital management. For the first six months, free cash flow was up 48% to €3.8 billion.
Share Repurchase Program
In May 2023, SAP announced a share repurchase program with an aggregate volume of up to €5 billion and a term until December 31, 2025. As of June 30, 2024, SAP had repurchased 12,895,525 shares at an average price of €145.20 resulting in a purchased volume of approximately €1.87 billion under the program.
2024 Transformation Program: Focus on scalability of operations and key strategic growth areas
In 2024, SAP is further increasing its focus on key strategic growth areas, in particular business AI. It is transforming its operational setup to capture organizational synergies and AI-driven efficiencies, and to prepare the company for highly scalable future revenue growth.
To this end, as announced in January, SAP is executing a company-wide restructuring program which is anticipated to conclude in early 2025. The restructuring is intended to ensure that SAP’s skillset and resources continue to meet future business needs and is currently expected to affect 9,000 to 10,000 positions, a majority of which will be covered by voluntary leave programs and internal re-skilling measures. Reflecting re-investments into strategic growth areas, SAP still expects to exit 2024 at a headcount similar to year-end 2023.
In the second quarter, additional restructuring expenses of €0.6 billion were recorded, which mainly reflect the positive reception of the voluntary leave programs.
While restructuring expenses recorded in the first half of 2024 total €2.9 billion, the overall expenses associated with the program are now estimated to be approximately €3 billion.
Restructuring payouts in the second quarter and first half of 2024 amounted to €0.5 billion. Overall payouts associated with the program are currently expected at approximately €3 billion, of which a mid-triple-digit million amount is expected to occur in 2025.
| 4 | /27 |
| Quarterly Statement Q2 2024 |
Business Highlights
In the second quarter, customers around the globe continued to choose “RISE with SAP” to drive their end-to-end business transformations. These customers included: Alpargatas, Auckland Council, Blue Diamond Growers, Border States, Copenhagen Airports, ExxonMobil, Navantia, PANDORA, Porsche Informatik, Powerlink Queensland, Prairie Farms Dairy, ProRail, Prysmian, Shiseido Company, Tokio Marine & Nichido Fire Insurance, VistaPrint, Warsaw City Hall, and Xerox.
BMI Group Holdings, Co-op, Fiagril, Pure Storage, UBE Corporation, and Wegmans went live on SAP S/4HANA Cloud in the second quarter.
Consolidated Hospitality Supplies, flatexDEGIRO, Fortera Corporation, La Trobe University, Stern-Wywiol Gruppe, and Trade Capital Corporation chose “GROW with SAP”, an offering helping customers adopt cloud ERP with speed, predictability, and continuous innovation.
Key customer wins across SAP’s solution portfolio included: Accenture, Ambipar, Arca Continental, BASF, Buderus Guss, Carl Zeiss, DACHSER, Endress+Hauser, iHerb, Lenovo, Minor Hotels, New Look, Parle Biscuits, Refresco, U.S. Sugar, Veolia Group, and Zoomlion.
Beiersdorf, E.ON, Gerdau, Hyundai Motor Company, Kia Corporation and SMA Solar Technology went live on SAP solutions.
In the second quarter, SAP’s cloud revenue performance was particularly strong in APJ and EMEA and robust in the Americas region. Brazil, Canada, Germany, India, Japan, and South Korea had outstanding performances in cloud revenue growth while China, the U.S., and Saudi Arabia were particularly strong.
On April 22, SAP announced AI advancements in its supply chain solutions that we anticipate will unleash a transformative wave of productivity, efficiency and precision in manufacturing. AI-driven insights from real-time data will help companies use their own data to make better decisions across supply chains, streamline product development and improve manufacturing efficiency.
On May 6, SAP announced that it had extended the contract of CEO and Member of the Executive Board Christian Klein for three years, until April 2028.
On May 8, SAP and IBM announced their vision for the next era of their collaboration, which includes new generative AI capabilities and industry-specific cloud solutions that can help clients unlock business value.
On May 13, SAP announced that Charoen Pokphand Foods Public Company Limited (“CP Foods”) had selected multiple SAP solutions to drive further growth and competitive advantage and to ensure the sustainability of its products for the future.
On May 15, SAP announced that the Annual General Meeting (AGM) of Shareholders of SAP SE elected Pekka Ala-Pietilä as new member of the company’s Supervisory Board. Subsequently, Ala-Pietilä was also elected the new Chairman of the SAP Supervisory Board, completing the handover from former Chairman of the Board, Prof. Dr. h. c. mult. Hasso Plattner. In addition, Prof. Dr. Ralf Herbrich was elected and Aicha Evans, Gerhard Oswald and Dr. Friederike Rotsch were reelected as members of the Supervisory Board. The AGM also approved all other proposals of the Executive Board and Supervisory Board with strong support. That includes the adjustment of the compensation of the Chairman of the Supervisory Board. Furthermore, the dividend proposal of €2.20 per share for fiscal year 2023 was approved.
On May 29, SAP and Amazon Web Services (AWS), an Amazon.com company, announced an expanded, strategic collaboration to transform modern cloud enterprise resource planning (ERP) experiences and help enterprises drive new capabilities and efficiencies with generative artificial intelligence (AI).
On June 5, SAP and WalkMe Ltd. (Walkme) announced that the companies had entered into a definitive agreement under which SAP will acquire 100% of WalkMe, a leader in digital adoption platforms. The Executive and Supervisory Boards of SAP SE and the board of directors of WalkMe have approved the transaction for US $14.00 per share in an all-cash transaction, representing an equity value of approximately US $1.5 billion. The offer price represents a 45% premium to WalkMe’s closing share price on June 4, 2024. The acquisition is subject to customary closing conditions, including the receipt of WalkMe shareholder approval and necessary regulatory clearances, and is expected to close in the third quarter of 2024.
On June 5, SAP announced that it was adjusting its dividend policy effective immediately. The new policy is to pay a dividend amounting to at least 40% of the group’s non-IFRS profit after tax from continuing operations (previously: at least 40% of the group’s IFRS profit after tax).
| 5 | /27 |
| Quarterly Statement Q2 2024 |
Financial Outlook 2024
SAP’s financial outlook 2024 is based on SAP’s updated non-IFRS definition of profit measures which, beginning in 2024, include share-based compensation expenses and exclude gains and losses from equity securities, net. For more details, please refer to the Reporting Framework section on our Investor Relations website: https://www.sap.com/investors/en/reports/reporting-framework.html.
SAP continues to expect:
| • | €17.0 – 17.3 billion cloud revenue at constant currencies (2023: €13.66 billion), up 24% to 27% at constant currencies. |
| • | €29.0 – 29.5 billion cloud and software revenue at constant currencies (2023: €26.92 billion), up 8% to 10% at constant currencies. |
| • | €7.6 – 7.9 billion non-IFRS operating profit at constant currencies (2023: €6.51 billion), up 17% to 21% at constant currencies. |
| • | Free cash flow of approximately €3.5 billion (2023: €5.09 billion). |
| • | An effective tax rate (non-IFRS) of approximately 32% (2023: 30.3%)2. |
While SAP’s 2024 financial outlook is at constant currencies, actual currency reported figures are expected to be impacted by currency exchange rate fluctuations as the company progresses through the year, as reflected in the table below.
Currency Impact Assuming June 30, 2024 Rates Apply for 2024
| In percentage points | Q3 2024 | FY 2024 |
| Cloud revenue growth | +0.5pp | –0.5pp |
| Cloud and software revenue growth | +0.5pp | –0.5pp |
| Operating profit growth (non-IFRS) | +0.0pp | –1.5pp |
Non-Financial Outlook 2024
SAP now expects the Employee Engagement Index to be in a range of 70% to 74% in 2024 (previously: 76% to 80%).
In 2024, SAP continues to expect:
| • | A Customer Net Promoter Score of 9 to 13. |
| • | To steadily decrease carbon emissions across the relevant value chain, in line with our target of achieving Net Zero carbon emissions by 2030. |
| • | To steadily increase the number of women in executive roles in line with our end of year 2027 target to achieve 25%. |
Ambition 2025
SAP is updating its financial ambition 2025, reflecting the anticipated incremental benefits from the transformation program.
By 2025, SAP now expects:
| • | Non-IFRS operating profit of approximately €10.2 billion (previously: approximately €10 billion). |
SAP continues to expect:
| • | Cloud revenue of more than €21.5 billion. |
| • | Total revenue of more than €37.5 billion. |
| • | Non-IFRS cloud gross profit of approximately €16.2 billion. |
| • | Free cash flow of approximately €8.0 billion (now including an anticipated mid-triple-digit million Euro restructuring payout in 2025 associated with the 2024 transformation program). |
2 The effective tax rate (non-IFRS) is a non-IFRS financial measure and is presented for supplemental informational purposes only. We do not provide an outlook for the effective tax rate (IFRS) due to the uncertainty and potential variability of gains and losses associated with equity securities, which are reconciling items between the two effective tax rates (non-IFRS and IFRS). These items cannot be provided without unreasonable efforts but could have a significant impact on our future effective tax rate (IFRS).
| 6 | /27 |
| Quarterly Statement Q2 2024 |
| • | A share of more predictable revenue of approximately 86%. |
The 2025 financial ambition is based on an exchange rate of 1.10 USD per EUR.
Non-Financial Ambition 2025
For 2025, SAP now aims to increase the Employee Engagement Index (previously: Steadily increasing the Employee Engagement Index).
SAP continues to aim for
| • | Steadily increasing the Customer Net Promoter Score. |
The 2025 non-financial ambitions are in addition to our medium-term targets of achieving Net Zero carbon emissions across the value chain by 2030 and reaching 25% women in executive roles by the end of 2027.
| 7 | /27 |
| Quarterly Statement Q2 2024 |
Additional Information
This press release and all information therein is preliminary and unaudited. Due to rounding, numbers may not add up precisely.
SAP Performance Measures
For more information about our key growth metrics and performance measures, their calculation, their usefulness, and their limitations, please refer to the following document on our Investor Relations website: https://www.sap.com/investors/performance-measures
Webcast
SAP senior management will host a financial analyst conference call on Monday, July 22nd at 11:00 PM (CEST) / 10:00 PM (BST) / 5:00 PM (EDT) / 2:00 PM (PDT). The conference will be webcast on the Company’s website at https://www.sap.com/investor and will be available for replay. Supplementary financial information pertaining to the second quarter results can be found at https://www.sap.com/investor
About SAP
As a global leader in enterprise applications and business AI, SAP (NYSE: SAP) stands at the nexus of business and technology. For over 50 years, organizations have trusted SAP to bring out their best by uniting business-critical operations spanning finance, procurement, HR, supply chain, and customer experience. For more information, visit www.sap.com.
For more information, financial community only:
| Alexandra Steiger | +49 (6227) 7-767336 | investor@sap.com, CET |
Follow SAP Investor Relations on LinkedIn at SAP Investor Relations.
For more information, press only:
| Joellen Perry | +1 (650) 445-6780 | joellen.perry@sap.com, PT |
| Daniel Reinhardt | +49 (6227) 7-40201 | daniel.reinhardt@sap.com, CET |
For customers interested in learning more about SAP products:
| Global Customer Center: | +49 180 534-34-24 |
| United States Only: | +1 (800) 872-1SAP (+1-800-872-1727) |
Note to editors:
To preview and download broadcast-standard stock footage and press photos digitally, please visit www.sap.com/photos. On this platform, you can find high resolution material for your media channels.
This document contains forward-looking statements, which are predictions, projections, or other statements about future events. These statements are based on current expectations, forecasts, and assumptions that are subject to risks and uncertainties that could cause actual results and outcomes to materially differ. Additional information regarding these risks and uncertainties may be found in our filings with the Securities and Exchange Commission, including but not limited to the risk factors section of SAP’s 2023 Annual Report on Form 20-F.
© 2024 SAP SE. All rights reserved.
SAP and other SAP products and services mentioned herein as well as their respective logos are trademarks or registered trademarks of SAP SE in Germany and other countries. Please see https://www.sap.com/copyright for additional trademark information and notices
| 8 | /27 |
| Quarterly Statement Q2 2024 |
Contents
| 9 | /27 |
| | Quarterly Statement Q2 2024 |
Financial and Non-Financial Key Facts
(IFRS and Non-IFRS)
| € millions, unless otherwise stated | Q1 2023 | Q2 2023 | Q3 2023 | Q4 2023 | TY 2023 | Q1 2024 | Q2 2024 |
| Revenues | |||||||
| Cloud | 3,178 | 3,316 | 3,472 | 3,699 | 13,664 | 3,928 | 4,153 |
| % change – yoy | 24 | 19 | 16 | 20 | 20 | 24 | 25 |
| % change constant currency – yoy | 22 | 22 | 23 | 25 | 23 | 25 | 25 |
| Cloud ERP Suite | 2,422 | 2,562 | 2,711 | 2,931 | 10,626 | 3,167 | 3,414 |
| % change – yoy | 35 | 30 | 26 | 28 | 29 | 31 | 33 |
| % change constant currency – yoy | 33 | 33 | 34 | 33 | 33 | 32 | 33 |
| Software licenses | 276 | 316 | 335 | 838 | 1,764 | 203 | 229 |
| % change – yoy | –13 | –26 | –17 | –8 | –14 | –26 | –28 |
| % change constant currency – yoy | –13 | –24 | –14 | –6 | –12 | –25 | –27 |
| Software support | 2,905 | 2,873 | 2,872 | 2,846 | 11,496 | 2,829 | 2,792 |
| % change – yoy | –1 | –3 | –5 | –5 | –3 | –3 | –3 |
| % change constant currency – yoy | –1 | –1 | –1 | –1 | –1 | –1 | –3 |
| Software licenses and support | 3,180 | 3,189 | 3,208 | 3,683 | 13,261 | 3,031 | 3,021 |
| % change – yoy | –2 | –6 | –6 | –6 | –5 | –5 | –5 |
| % change constant currency – yoy | –2 | –4 | –2 | –2 | –3 | –4 | –5 |
| Cloud and software | 6,358 | 6,505 | 6,679 | 7,382 | 26,924 | 6,960 | 7,175 |
| % change – yoy | 10 | 5 | 4 | 6 | 6 | 9 | 10 |
| % change constant currency – yoy | 8 | 8 | 9 | 10 | 9 | 11 | 10 |
| Total revenue | 7,441 | 7,554 | 7,744 | 8,468 | 31,207 | 8,041 | 8,288 |
| % change – yoy | 10 | 5 | 4 | 5 | 6 | 8 | 10 |
| % change constant currency – yoy | 9 | 8 | 9 | 9 | 9 | 9 | 10 |
| Share of more predictable revenue (in %) | 82 | 82 | 82 | 77 | 81 | 84 | 84 |
| Profits | |||||||
| Operating profit (loss) (IFRS) | 803 | 1,371 | 1,723 | 1,902 | 5,799 | –787 | 1,222 |
| Operating profit (loss) (non-IFRS) | 1,321 | 1,457 | 1,767 | 1,969 | 6,514 | 1,533 | 1,940 |
| % change | –15 | 14 | 7 | 1 | 1 | 16 | 33 |
| % change constant currency | –15 | 19 | 13 | 5 | 5 | 19 | 35 |
| Profit (loss) after tax (IFRS) | 403 | 724 | 1,272 | 1,201 | 3,600 | –824 | 918 |
| Profit (loss) after tax (non-IFRS) | 868 | 799 | 1,352 | 1,302 | 4,321 | 944 | 1,278 |
| % change | –20 | –9 | 13 | –10 | –6 | 9 | 60 |
| Margins | |||||||
| Cloud gross margin (IFRS, in %) | 70.5 | 71.1 | 72.7 | 71.9 | 71.6 | 72.2 | 73.0 |
| Cloud gross margin (non-IFRS, in %) | 70.8 | 71.4 | 73.0 | 72.2 | 71.9 | 72.5 | 73.3 |
| Software license and support gross margin (IFRS, in %) | 88.6 | 89.8 | 90.0 | 89.8 | 89.6 | 89.2 | 89.7 |
| Software license and support gross margin (non-IFRS, in %) | 88.9 | 90.2 | 90.1 | 89.8 | 89.8 | 89.2 | 89.7 |
| Cloud and software gross margin (IFRS, in %) | 79.5 | 80.3 | 81.0 | 80.8 | 80.4 | 79.6 | 80.0 |
| Cloud and software gross margin (non-IFRS, in %) | 79.9 | 80.6 | 81.2 | 81.0 | 80.7 | 79.8 | 80.2 |
| Gross margin (IFRS, in %) | 71.0 | 71.6 | 72.8 | 73.3 | 72.2 | 71.7 | 72.6 |
| Gross margin (non-IFRS, in %) | 71.3 | 71.9 | 73.0 | 73.4 | 72.4 | 71.8 | 72.7 |
| Operating margin (IFRS, in %) | 10.8 | 18.2 | 22.2 | 22.5 | 18.6 | –9.8 | 14.7 |
| 10 | /27 |
| | Quarterly Statement Q2 2024 |
| € millions, unless otherwise stated | Q1 2023 | Q2 2023 | Q3 2023 | Q4 2023 | TY 2023 | Q1 2024 | Q2 2024 |
| Operating margin (non-IFRS, in %) | 17.8 | 19.3 | 22.8 | 23.3 | 20.9 | 19.1 | 23.4 |
| Key Profit Ratios | |||||||
| Effective tax rate (IFRS, in %) | 40.5 | 33.8 | 27.8 | 33.6 | 32.6 | 16.0 | 33.8 |
| Effective tax rate (non-IFRS, in %) | 29.1 | 33.0 | 27.1 | 32.5 | 30.3 | 32.4 | 33.6 |
| Earnings per share, basic (IFRS, in €) from continuing operations | 0.35 | 0.62 | 1.09 | 1.05 | 3.11 | –0.71 | 0.76 |
| Earnings per share, basic (non-IFRS, in €) from continuing operations | 0.75 | 0.69 | 1.16 | 1.12 | 3.72 | 0.81 | 1.10 |
| Earnings per share, basic (IFRS, in €)1 | 0.41 | 2.70 | 1.09 | 1.05 | 5.26 | –0.71 | 0.76 |
| Earnings per share, basic (non-IFRS, in €)1 | 0.83 | 2.40 | 1.16 | 1.12 | 5.51 | 0.81 | 1.10 |
| Order Entry and current cloud backlog | |||||||
| Current cloud backlog | 11,148 | 11,537 | 12,269 | 13,745 | 13,745 | 14,179 | 14,808 |
| % change – yoy | 25 | 21 | 19 | 25 | 25 | 27 | 28 |
| % change constant currency – yoy | 25 | 25 | 25 | 27 | 27 | 28 | 28 |
| Share of cloud orders greater than €5 million based on total cloud order entry volume (in %) | 45 | 46 | 49 | 62 | 55 | 52 | 52 |
| Share of cloud orders smaller than €1 million based on total cloud order entry volume (in %) | 26 | 25 | 21 | 14 | 19 | 21 | 20 |
| Liquidity and Cash Flow | |||||||
| Net cash flows from operating activities | 2,311 | 848 | 1,124 | 1,926 | 6,210 | 2,757 | 1,540 |
| Purchase of intangible assets and property, plant, and equipment | –257 | –156 | –182 | –190 | –785 | –187 | –178 |
| Payments of lease liabilities | –99 | –89 | –78 | –66 | –332 | –78 | –70 |
| Free cash flow | 1,955 | 604 | 865 | 1,670 | 5,093 | 2,492 | 1,291 |
| % of total revenue | 26 | 8 | 11 | 20 | 16 | 31 | 16 |
| % of profit after tax (IFRS) | 485 | 83 | 68 | 139 | 141 | N/A | 141 |
| Cash and cash equivalents | 8,766 | 14,142 | 9,378 | 8,124 | 8,124 | 9,295 | 7,870 |
| Group liquidity | 9,700 | 14,326 | 12,122 | 11,275 | 11,275 | 13,411 | 11,449 |
| Financial debt (–) | –10,751 | –10,146 | –8,445 | –7,755 | –7,755 | –7,770 | –7,776 |
| Net liquidity (+) / Net debt(–) | –1,050 | 4,180 | 3,677 | 3,521 | 3,521 | 5,641 | 3,674 |
| Non-Financials | |||||||
| Number of employees (quarter end)2 | 105,132 | 105,328 | 106,495 | 107,602 | 107,602 | 108,133 | 105,315 |
| Employee retention (in %, rolling 12 months) | 93.8 | 95.1 | 96.0 | 96.4 | 96.4 | 96.6 | 96.6 |
| Women in management (in %, quarter end) | 29.4 | 29.5 | 29.5 | 29.7 | 29.7 | 29.8 | 29.9 |
| Women in executive roles (in %, quarter end) | 21.8 | 21.9 | 22.1 | 22.2 | 22.2 | 21.7 | 21.9 |
Gross greenhouse gas emissions (scope 1, 2, 3 / market-based)3 (in million tons CO2 equivalents) | 6.9 | 1.8 | 1.8 |
1 From continuing and discontinued operations.
2 In full-time equivalents.
3 Our gross greenhouse gas emissions (GHG) – which cover scope 1, scope 2, and scope 3 (market based) – include the total lifecycle emissions resulting from the use of our on-premise software. A projection over the next 12 months amounts to 5.9 million tons CO2e. The calculation of use of sold products emissions is based on the number of active maintenance contracts at quarter end. Therefore, the emissions for individual quarters will not add up to the total sum of GHG emissions at year end.
| 11 | /27 |
| | Quarterly Statement Q2 2024 |
Primary Financial Statements of SAP Group (IFRS)
| (A) | Consolidated Income Statements |
| (A.1) | Consolidated Income Statements – Quarter |
| € millions, unless otherwise stated | Q2 2024 | Q2 2023 | ∆ in % | |
| Cloud | 4,153 | 3,316 | 25 | |
| Software licenses | 229 | 316 | –28 | |
| Software support | 2,792 | 2,873 | –3 | |
| Software licenses and support | 3,021 | 3,189 | –5 | |
| Cloud and software | 7,175 | 6,505 | 10 | |
| Services | 1,114 | 1,050 | 6 | |
| Total revenue | 8,288 | 7,554 | 10 | |
| Cost of cloud | –1,123 | –959 | 17 | |
| Cost of software licenses and support | –311 | –324 | –4 | |
| Cost of cloud and software | –1,434 | –1,282 | 12 | |
| Cost of services | –837 | –863 | –3 | |
| Total cost of revenue | –2,272 | –2,145 | 6 | |
| Gross profit | 6,017 | 5,409 | 11 | |
| Research and development | –1,605 | –1,565 | 3 | |
| Sales and marketing | –2,217 | –2,165 | 2 | |
| General and administration | –336 | –322 | 4 | |
| Restructuring | –631 | 3 | N/A | |
| Other operating income/expense, net | –5 | 11 | N/A | |
| Total operating expenses | –7,067 | –6,183 | 14 | |
| Operating profit (loss) | 1,222 | 1,371 | –11 | |
| Other non-operating income/expense, net | –5 | –102 | –95 | |
| Finance income | 412 | 187 | >100 | |
| Finance costs | –242 | –363 | –33 | |
| Financial income, net | 170 | –175 | N/A | |
| Profit (loss) before tax from continuing operations | 1,387 | 1,093 | 27 | |
| Income tax expense | –469 | –369 | 27 | |
| Profit (loss) after tax from continuing operations | 918 | 724 | 27 | |
| Attributable to owners of parent | 888 | 728 | 22 | |
| Attributable to non-controlling interests | 30 | –4 | N/A | |
| Profit (loss) after tax from discontinued operations | 0 | 2,257 | N/A | |
| Profit (loss) after tax2 | 918 | 2,982 | –69 | |
| Attributable to owners of parent2 | 888 | 3,161 | –72 | |
| Attributable to non-controlling interests2 | 30 | –179 | N/A | |
| Earnings per share, basic (in €)1 from continuing operations | 0.76 | 0.62 | 22 | |
| Earnings per share, basic (in €)1, 2 | 0.76 | 2.70 | –72 | |
| Earnings per share, diluted (in €)1 from continuing operations | 0.75 | 0.62 | 22 | |
| Earnings per share, diluted (in €)1, 2 | 0.75 | 2.68 | –72 |
1 For the three months ended June 30, 2024 and 2023, the weighted average number of shares was 1,166 million (diluted 1,178 million) and 1,169 million
(diluted: 1,180 million), respectively (treasury stock excluded).
2 From continuing and discontinued operations
| 12 | /27 |
| | Quarterly Statement Q2 2024 |
(A.2) Consolidated Income Statements – Year-to-Date
| € millions, unless otherwise stated | Q1–Q2 2024 | Q1–Q2 2023 | ∆ in % | |
| Cloud | 8,082 | 6,493 | 24 | |
| Software licenses | 432 | 591 | –27 | |
| Software support | 5,621 | 5,778 | –3 | |
| Software licenses and support | 6,053 | 6,369 | –5 | |
| Cloud and software | 14,134 | 12,863 | 10 | |
| Services | 2,195 | 2,132 | 3 | |
| Total revenue | 16,329 | 14,995 | 9 | |
| Cost of cloud | –2,214 | –1,897 | 17 | |
| Cost of software licenses and support | –637 | –687 | –7 | |
| Cost of cloud and software | –2,851 | –2,584 | 10 | |
| Cost of services | –1,699 | –1,718 | –1 | |
| Total cost of revenue | –4,550 | –4,301 | 6 | |
| Gross profit | 11,778 | 10,693 | 10 | |
| Research and development | –3,270 | –3,138 | 4 | |
| Sales and marketing | –4,496 | –4,457 | 1 | |
| General and administration | –696 | –670 | 4 | |
| Restructuring | –2,873 | –257 | >100 | |
| Other operating income/expense, net | –9 | 3 | N/A | |
| Total operating expenses | –15,894 | –12,820 | 24 | |
| Operating profit (loss) | 434 | 2,174 | –80 | |
| Other non-operating income/expense, net | –153 | –116 | 32 | |
| Finance income | 611 | 369 | 65 | |
| Finance costs | –486 | –656 | –26 | |
| Financial income, net | 125 | –287 | N/A | |
| Profit (loss) before tax from continuing operations | 407 | 1,771 | –77 | |
| Income tax expense | –313 | –643 | –51 | |
| Profit (loss) after tax from continuing operations | 94 | 1,128 | –92 | |
| Attributable to owners of parent | 60 | 1,135 | –95 | |
| Attributable to non-controlling interests | 34 | –7 | N/A | |
| Profit (loss) after tax from discontinued operations | 0 | 2,363 | N/A | |
| Profit (loss) after tax2 | 94 | 3,491 | –97 | |
| Attributable to owners of parent2 | 60 | 3,640 | –98 | |
| Attributable to non-controlling interests2 | 34 | –149 | N/A | |
| Earnings per share, basic (in €)1 from continuing operations | 0.05 | 0.97 | –95 | |
| Earnings per share, basic (in €)1, 2 | 0.05 | 3.12 | –98 | |
| Earnings per share, diluted (in €)1 from continuing operations | 0.05 | 0.97 | –95 | |
| Earnings per share, diluted (in €)1, 2 | 0.05 | 3.09 | –98 |
1 For the six months ended June 30, 2024 and 2023, the weighted average number of shares was 1,167 million (diluted: 1,178 million) and 1,168 million (diluted: 1,176 million), respectively (treasury stock excluded).
2 From continuing and discontinued operations
| 13 | /27 |
| | Quarterly Statement Q2 2024 |
(B) Consolidated Statements of Financial Position
| as at 06/30/2024 and 12/31/2023 | ||
| € millions | 2024 | 2023 |
| Cash and cash equivalents | 7,870 | 8,124 |
| Other financial assets | 3,808 | 3,344 |
| Trade and other receivables | 6,148 | 6,322 |
| Other non-financial assets | 2,531 | 2,374 |
| Tax assets | 539 | 407 |
| Total current assets | 20,896 | 20,571 |
| Goodwill | 29,777 | 29,088 |
| Intangible assets | 2,365 | 2,505 |
| Property, plant, and equipment | 4,255 | 4,276 |
| Other financial assets | 6,109 | 5,543 |
| Trade and other receivables | 121 | 203 |
| Other non-financial assets | 3,515 | 3,573 |
| Tax assets | 346 | 382 |
| Deferred tax assets | 2,993 | 2,193 |
| Total non-current assets | 49,482 | 47,763 |
| Total assets | 70,378 | 68,335 |
| € millions | 2024 | 2023 |
| Trade and other payables | 1,875 | 1,783 |
| Tax liabilities | 439 | 266 |
| Financial liabilities | 2,271 | 1,735 |
| Other non-financial liabilities | 4,002 | 5,648 |
| Provisions | 2,341 | 235 |
| Contract liabilities | 7,734 | 4,975 |
| Total current liabilities | 18,662 | 14,642 |
| Trade and other payables | 20 | 39 |
| Tax liabilities | 818 | 877 |
| Financial liabilities | 7,321 | 7,941 |
| Other non-financial liabilities | 850 | 698 |
| Provisions | 444 | 433 |
| Deferred tax liabilities | 267 | 265 |
| Contract liabilities | 55 | 33 |
| Total non-current liabilities | 9,774 | 10,286 |
| Total liabilities | 28,436 | 24,928 |
| Issued capital | 1,229 | 1,229 |
| Share premium | 2,263 | 1,845 |
| Retained earnings | 39,953 | 42,457 |
| Other components of equity | 3,519 | 2,368 |
| Treasury shares | –5,311 | –4,741 |
| Equity attributable to owners of parent | 41,652 | 43,157 |
| Non-controlling interests | 289 | 249 |
| Total equity | 41,942 | 43,406 |
| Total equity and liabilities | 70,378 | 68,335 |
| 14 | /27 |
| | Quarterly Statement Q2 2024 |
(C) Consolidated Statements of Cash Flows
| € millions | Q1–Q2 2024 | Q1–Q2 2023 |
| Profit (loss) after tax | 94 | 3,890 |
| Adjustments to reconcile profit (loss) after tax to net cash flows from operating activities: | ||
| (Profit) loss after tax from discontinued operations | 0 | –2,763 |
| Depreciation and amortization | 626 | 714 |
| Share-based payment expense | 1,280 | 1,167 |
| Income tax expense | 313 | 643 |
| Financial income, net | –125 | 287 |
| Decrease/increase in allowances on trade receivables | –23 | 5 |
| Other adjustments for non-cash items | 110 | 76 |
| Increase/decrease in trade and other receivables | 372 | 396 |
| Decrease/increase in other assets | –17 | –600 |
| Increase/decrease in trade payables, provisions, and other liabilities | 876 | –896 |
| Increase/decrease in contract liabilities | 2,718 | 2,109 |
| Share-based payments | –778 | –697 |
| Interest paid | –378 | –244 |
| Interest received | 287 | 197 |
| Income taxes paid, net of refunds | –1,057 | –1,127 |
| Net cash flows from operating activities – continuing operations | 4,297 | 3,160 |
| Net cash flows from operating activities – discontinued operations | 0 | 80 |
| Net cash flows from operating activities | 4,297 | 3,240 |
| Business combinations, net of cash and cash equivalents acquired | –19 | 0 |
| Cash flows from derivative financial instruments related to the sale of subsidiaries or businesses | 0 | –91 |
| Purchase of intangible assets and property, plant, and equipment | –365 | –413 |
| Proceeds from sales of intangible assets and property, plant, and equipment | 55 | 43 |
| Purchase of equity or debt instruments of other entities | –7,987 | –220 |
| Proceeds from sales of equity or debt instruments of other entities | 7,370 | 722 |
| Net cash flows from investing activities – continuing operations | –947 | 41 |
| Net cash flows from investing activities – discontinued operations | 0 | 6,323 |
| Net cash flows from investing activities | –947 | 6,364 |
| Dividends paid | –2,565 | –2,395 |
| Dividends paid on non-controlling interests | –6 | –18 |
| Purchase of treasury shares | –975 | 0 |
| Proceeds from borrowings | 1 | 0 |
| Repayments of borrowings | –14 | –1,724 |
| Payments of lease liabilities | –148 | –188 |
| Transactions with non-controlling interests | 0 | 43 |
| Net cash flows from financing activities – continuing operations | –3,708 | –4,283 |
| Net cash flows from financing activities – discontinued operations | 0 | 24 |
| Net cash flows from financing activities | –3,708 | –4,259 |
| Effect of foreign currency rates on cash and cash equivalents | 104 | –212 |
| Net decrease/increase in cash and cash equivalents | –254 | 5,134 |
| Cash and cash equivalents at the beginning of the period | 8,124 | 9,008 |
| Cash and cash equivalents at the end of the period | 7,870 | 14,142 |
| 15 | /27 |
| | Quarterly Statement Q2 2024 |
| (D) | Basis of Non-IFRS Presentation |
SAP disclose certain financial measures such as expense (non-IFRS) and profit measures (non-IFRS) that are not prepared in accordance with IFRS and are therefore considered non-IFRS financial measures.
For a more detailed description of all of SAP’s non-IFRS measures and their limitations as well as SAP’s constant currency and free cash flow figures, see Explanation of Non-IFRS Measures.
| (E) | Reconciliation from Non-IFRS Numbers to IFRS Numbers |
| (E.1) | Reconciliation of Non-IFRS Revenue – Quarter |
| € millions, unless otherwise stated | Q2 2024 | Q2 2023 | ∆ in % | |||
| IFRS | Currency Impact | Non-IFRS Constant Currency | IFRS | IFRS | Non-IFRS Constant Currency | |
| Revenue Numbers | ||||||
| Cloud | 4,153 | –1 | 4,153 | 3,316 | 25 | 25 |
| Software licenses | 229 | 1 | 230 | 316 | –28 | –27 |
| Software support | 2,792 | 7 | 2,799 | 2,873 | –3 | –3 |
| Software licenses and support | 3,021 | 8 | 3,029 | 3,189 | –5 | –5 |
| Cloud and software | 7,175 | 7 | 7,182 | 6,505 | 10 | 10 |
| Services | 1,114 | –2 | 1,111 | 1,050 | 6 | 6 |
| Total revenue | 8,288 | 5 | 8,293 | 7,554 | 10 | 10 |
| 16 | /27 |
| | Quarterly Statement Q2 2024 |
(E.2) Reconciliation of Non-IFRS Operating Expenses – Quarter
| € millions, unless otherwise stated | Q2 2024 | Q2 2023 | ∆ in % | ||||||||
| IFRS | Adj. | Non-IFRS | Currency Impact | Non-IFRS Constant Currency | IFRS | Adj. | Non-IFRS | IFRS | Non-IFRS | Non-IFRS Constant Currency | |
| Operating Expense Numbers | |||||||||||
| Cost of cloud | –1,123 | 13 | –1,110 | –959 | 11 | –947 | 17 | 17 | |||
| Cost of software licenses and support | –311 | 0 | –311 | –324 | 11 | –313 | –4 | –1 | |||
| Cost of cloud and software | –1,434 | 13 | –1,422 | –1,282 | 22 | –1,260 | 12 | 13 | |||
| Cost of services | –837 | 0 | –837 | –863 | 0 | –862 | –3 | –3 | |||
| Total cost of revenue | –2,272 | 13 | –2,259 | –2,145 | 22 | –2,122 | 6 | 6 | |||
| Gross profit | 6,017 | 13 | 6,029 | 16 | 6,046 | 5,409 | 22 | 5,432 | 11 | 11 | 11 |
| Research and development | –1,605 | 1 | –1,604 | –1,565 | 2 | –1,562 | 3 | 3 | |||
| Sales and marketing | –2,217 | 65 | –2,153 | –2,165 | 64 | –2,102 | 2 | 2 | |||
| General and administration | –336 | 8 | –328 | –322 | 0 | –321 | 4 | 2 | |||
| Restructuring | –631 | 631 | 0 | 3 | –3 | 0 | N/A | N/A | |||
| Other operating income/expense, net | –5 | 0 | –5 | 11 | 0 | 11 | N/A | N/A | |||
| Total operating expenses | –7,067 | 718 | –6,348 | 18 | –6,331 | –6,183 | 86 | –6,097 | 14 | 4 | 4 |
(E.3) Reconciliation of Non-IFRS Profit Figures, Income Tax, and Key Ratios – Quarter
| € millions, unless otherwise stated | Q2 2024 | Q2 2023 | ∆ in % | ||||||||
| IFRS | Adj. | Non-IFRS | Currency Impact | Non-IFRS Constant Currency | IFRS | Adj. | Non-IFRS | IFRS | Non-IFRS | Non-IFRS Constant Currency | |
| Profit Numbers | |||||||||||
| Operating profit (loss) | 1,222 | 718 | 1,940 | 23 | 1,963 | 1,371 | 86 | 1,457 | –11 | 33 | 35 |
| Other non-operating income/expense, net | –5 | 0 | –5 | –102 | 0 | –102 | –95 | –95 | |||
| Finance income | 412 | –250 | 162 | 187 | –81 | 106 | >100 | 52 | |||
| Finance costs | –242 | 70 | –171 | –363 | 93 | –270 | –33 | –36 | |||
| Financial income, net | 170 | –179 | –9 | –175 | 12 | –163 | N/A | –94 | |||
| Profit (loss) before tax from continuing operations | 1,387 | 539 | 1,926 | 1,093 | 98 | 1,192 | 27 | 62 | |||
| Income tax expense | –469 | –178 | –647 | –369 | –24 | –393 | 27 | 65 | |||
| Profit (loss) after tax from continuing operations | 918 | 361 | 1,278 | 724 | 75 | 799 | 27 | 60 | |||
| Attributable to owners of parent | 888 | 395 | 1,283 | 728 | 80 | 808 | 22 | 59 | |||
| Attributable to non-controlling interests | 30 | –34 | –4 | –4 | –5 | –9 | N/A | –55 | |||
| Profit (loss) after tax1 | 918 | 361 | 1,278 | 2,982 | –545 | 2,437 | –69 | –48 | |||
| Attributable to owners of parent1 | 888 | 395 | 1,283 | 3,161 | –354 | 2,807 | –72 | –54 | |||
| Attributable to non-controlling interests1 | 30 | –34 | –4 | –179 | –191 | –370 | N/A | –99 | |||
| Key Ratios | |||||||||||
| Operating margin (in %) | 14.7 | 23.4 | 23.7 | 18.2 | 19.3 | –3.4pp | 4.1pp | 4.4pp | |||
| Effective tax rate (in %)2 | 33.8 | 33.6 | 33.8 | 33.0 | 0.1pp | 0.7pp | |||||
| Earnings per share, basic (in €) from continuing operations | 0.76 | 1.10 | 0.62 | 0.69 | 22 | 59 | |||||
| Earnings per share, basic (in €)1 | 0.76 | 1.10 | 2.70 | 2.40 | –72 | –54 | |||||
1 From continuing and discontinued operations
2 The difference between our effective tax rate (IFRS) and effective tax rate (non-IFRS) in Q2 2024 mainly resulted from tax effects of restructuring expenses. The difference between our effective tax rate (IFRS) and effective tax rate (non-IFRS) in Q2 2023 mainly resulted from tax effects of acquisition-related charges.
| 17 | /27 |
| | Quarterly Statement Q2 2024 |
(E.4) Reconciliation of Non-IFRS Revenue – Year-to-Date
| € millions, unless otherwise stated | Q1–Q2 2024 | Q1–Q2 2023 | ∆ in % | |||
| IFRS | Currency Impact | Non-IFRS Constant Currency | IFRS | IFRS | Non-IFRS Constant Currency | |
| Revenue Numbers | ||||||
| Cloud | 8,082 | 49 | 8,131 | 6,493 | 24 | 25 |
| Software licenses | 432 | 5 | 436 | 591 | –27 | –26 |
| Software support | 5,621 | 40 | 5,661 | 5,778 | –3 | –2 |
| Software licenses and support | 6,053 | 44 | 6,097 | 6,369 | –5 | –4 |
| Cloud and software | 14,134 | 93 | 14,228 | 12,863 | 10 | 11 |
| Services | 2,195 | 8 | 2,202 | 2,132 | 3 | 3 |
| Total revenue | 16,329 | 101 | 16,430 | 14,995 | 9 | 10 |
(E.5) Reconciliation of Non-IFRS Operating Expenses – Year-to-Date
| € millions, unless otherwise stated | Q1–Q2 2024 | Q1–Q2 2023 | ∆ in % | ||||||||
| IFRS | Adj. | Non-IFRS | Currency Impact | Non-IFRS Constant Currency | IFRS | Adj. | Non-IFRS | IFRS | Non-IFRS | Non-IFRS Constant Currency | |
| Operating Expense Numbers | |||||||||||
| Cost of cloud | –2,214 | 25 | –2,190 | –1,897 | 21 | –1,876 | 17 | 17 | |||
| Cost of software licenses and support | –637 | 0 | –637 | –687 | 22 | –665 | –7 | –4 | |||
| Cost of cloud and software | –2,851 | 25 | –2,827 | –2,584 | 43 | –2,541 | 10 | 11 | |||
| Cost of services | –1,699 | 0 | –1,699 | –1,718 | 0 | –1,717 | –1 | –1 | |||
| Total cost of revenue | –4,550 | 25 | –4,526 | –4,301 | 44 | –4,258 | 6 | 6 | |||
| Gross profit | 11,778 | 25 | 11,803 | 97 | 11,900 | 10,693 | 44 | 10,737 | 10 | 10 | 11 |
| Research and development | –3,270 | 3 | –3,267 | –3,138 | 4 | –3,134 | 4 | 4 | |||
| Sales and marketing | –4,496 | 129 | –4,366 | –4,457 | 299 | –4,158 | 1 | 5 | |||
| General and administration | –696 | 9 | –687 | –670 | 1 | –669 | 4 | 3 | |||
| Restructuring | –2,873 | 2,873 | 0 | –257 | 257 | 0 | >100 | N/A | |||
| Other operating income/expense, net | –9 | 0 | –9 | 3 | 0 | 3 | N/A | N/A | |||
| Total operating expenses | –15,894 | 3,039 | –12,855 | –34 | –12,890 | –12,820 | 604 | –12,216 | 24 | 5 | 6 |
| 18 | /27 |
| | Quarterly Statement Q2 2024 |
(E.6) Reconciliation of Non-IFRS Profit Figures, Income Tax, and Key Ratios – Year-to-Date
| € millions, unless otherwise stated | Q1–Q2 2024 | Q1–Q2 2023 | ∆ in % | ||||||||
| IFRS | Adj. | Non-IFRS | Currency Impact | Non-IFRS Constant Currency | IFRS | Adj. | Non-IFRS | IFRS | Non-IFRS | Non-IFRS Constant Currency | |
| Profit Numbers | |||||||||||
| Operating profit (loss) | 434 | 3,039 | 3,473 | 67 | 3,540 | 2,174 | 604 | 2,779 | –80 | 25 | 27 |
| Other non-operating income/expense, net | –153 | 0 | –153 | –116 | 0 | –116 | 32 | 32 | |||
| Finance income | 611 | –282 | 328 | 369 | –185 | 184 | 65 | 79 | |||
| Finance costs | –486 | 159 | –327 | –656 | 226 | –430 | –26 | –24 | |||
| Financial income, net | 125 | –123 | 2 | –287 | 41 | –247 | N/A | N/A | |||
| Profit (loss) before tax from continuing operations | 407 | 2,916 | 3,322 | 1,771 | 645 | 2,416 | –77 | 37 | |||
| Income tax expense | –313 | –787 | –1,100 | –643 | –106 | –749 | –51 | 47 | |||
| Profit (loss) after tax from continuing operations | 94 | 2,129 | 2,223 | 1,128 | 539 | 1,667 | –92 | 33 | |||
| Attributable to owners of parent | 60 | 2,163 | 2,222 | 1,135 | 543 | 1,678 | –95 | 32 | |||
| Attributable to non-controlling interests | 34 | –34 | 0 | –7 | –4 | –11 | N/A | N/A | |||
| Profit (loss) after tax1 | 94 | 2,129 | 2,223 | 3,491 | –43 | 3,448 | –97 | –36 | |||
| Attributable to owners of parent1 | 60 | 2,163 | 2,222 | 3,640 | 136 | 3,776 | –98 | –41 | |||
| Attributable to non-controlling interests1 | 34 | –34 | 0 | –149 | –179 | –327 | N/A | N/A | |||
| Key Ratios | |||||||||||
| Operating margin (in %) | 2.7 | 21.3 | 21.5 | 14.5 | 18.5 | –11.8pp | 2.7pp | 3.0pp | |||
| Effective tax rate (in %)2 | 76.9 | 33.1 | 36.3 | 31.0 | 40.6pp | 2.1pp | |||||
| Earnings per share, basic (in €) from continuing operations | 0.05 | 1.91 | 0.97 | 1.44 | –95 | 33 | |||||
| Earnings per share, basic (in €)1 | 0.05 | 1.91 | 3.12 | 3.23 | –98 | –41 | |||||
1 From continuing and discontinued operations
2 The difference between our effective tax rate (IFRS) and effective tax rate (non-IFRS) in the first half of 2024 and 2023 mainly resulted from restructuring expenses.
| 19 | /27 |
| | Quarterly Statement Q2 2024 |
| (E.7) | Reconciliation of Free Cash Flow |
| € millions, unless otherwise stated | Q1-Q2 2024 | Q1-Q2 2023 |
| Net cash flows from operating activities – continuing operations | 4,297 | 3,160 |
| Purchase of intangible assets and property, plant, and equipment | –365 | –413 |
| Payments of lease liabilities | –148 | –188 |
| Free cash flow | 3,784 | 2,559 |
| Net cash flows from investing activities – continuing operations | –947 | 41 |
| Net cash flows from financing activities – continuing operations | –3,708 | –4,283 |
| 20 | /27 |
| | Quarterly Statement Q2 2024 |
| (F) | Non-IFRS Adjustments – Actuals and Estimates |
| € millions, unless otherwise stated | Estimated Amounts for Full Year 2024 | Q2 2024 | Q1–Q2 2024 | Q2 2023 | Q1–Q2 2023 |
| Profit (loss) before tax from continuing operations (IFRS) | 1,387 | 407 | 1,093 | 1,771 | |
| Adjustment for acquisition-related charges | 280–360 | 87 | 166 | 89 | 177 |
| Adjustment for restructuring | approximately €3 B | 631 | 2,873 | –3 | 257 |
| Adjustment for regulatory compliance matter expenses | 0 | 0 | 0 | 0 | 170 |
| Adjustment for gains and losses from equity securities, net | N/A1 | –179 | –123 | 12 | 41 |
| Profit (loss) before tax from continuing operations (non-IFRS) | 1,926 | 3,322 | 1,192 | 2,416 |
1 Due to the uncertainty and potential variability of gains and losses from equity securities, we cannot provide an estimate for the full year without unreasonable efforts. This item could however have a material impact on our non-IFRS measures below operating profit.
| (G) | Non-IFRS Operating Expense Adjustments by Functional Areas |
| € millions | Q2 2024 | Q2 2023 | ||||||||
| IFRS | Acquisition- Related | Restruc- turing | RCM1 | Non-IFRS | IFRS | Acquisition- Related | Restruc- turing | RCM1 | Non-IFRS | |
| Cost of cloud | –1,123 | 13 | 0 | 0 | –1,110 | –959 | 11 | 0 | 0 | –947 |
| Cost of software licenses and support | –311 | 0 | 0 | 0 | –311 | –324 | 11 | 0 | 0 | –313 |
| Cost of services | –837 | 0 | 0 | 0 | –837 | –863 | 0 | 0 | 0 | –862 |
| Research and development | –1,605 | 1 | 0 | 0 | –1,604 | –1,565 | 2 | 0 | 0 | –1,562 |
| Sales and marketing | –2,217 | 65 | 0 | 0 | –2,153 | –2,165 | 64 | 0 | 0 | –2,102 |
| General and administration | –336 | 8 | 0 | 0 | –328 | –322 | 0 | 0 | 0 | –321 |
| Restructuring | –631 | 0 | 631 | 0 | 0 | 3 | 0 | –3 | 0 | 0 |
| Other operating income/expense, net | –5 | 0 | 0 | 0 | –5 | 11 | 0 | 0 | 0 | 11 |
| Total operating expenses | –7,067 | 87 | 631 | 0 | –6,348 | –6,183 | 89 | –3 | 0 | –6,097 |
1 Regulatory Compliance Matters
| € millions | Q1–Q2 2024 | Q1–Q2 2023 | ||||||||
| IFRS | Acquisition- Related | Restruc- turing | RCM1 | Non-IFRS | IFRS | Acquisition- Related | Restruc- turing | RCM1 | Non-IFRS | |
| Cost of cloud | –2,214 | 25 | 0 | 0 | –2,190 | –1,897 | 21 | 0 | 0 | –1,876 |
| Cost of software licenses and support | –637 | 0 | 0 | 0 | –637 | –687 | 22 | 0 | 0 | –665 |
| Cost of services | –1,699 | 0 | 0 | 0 | –1,699 | –1,718 | 0 | 0 | 0 | –1,717 |
| Research and development | –3,270 | 3 | 0 | 0 | –3,267 | –3,138 | 4 | 0 | 0 | –3,134 |
| Sales and marketing | –4,496 | 129 | 0 | 0 | –4,366 | –4,457 | 129 | 0 | 170 | –4,158 |
| General and administration | –696 | 9 | 0 | 0 | –687 | –670 | 1 | 0 | 0 | –669 |
| Restructuring | –2,873 | 0 | 2,873 | 0 | 0 | –257 | 0 | 257 | 0 | 0 |
| Other operating income/expense, net | –9 | 0 | 0 | 0 | –9 | 3 | 0 | 0 | 0 | 3 |
| Total operating expenses | –15,894 | 166 | 2,873 | 0 | –12,855 | –12,820 | 177 | 257 | 170 | –12,216 |
1 Regulatory Compliance Matters
| 21 | /27 |
| | Quarterly Statement Q2 2024 |
If not presented in a separate line item in our income statement, the restructuring expenses would break down as follows:
| € millions | Q2 2024 | Q1–Q2 2024 | Q2 2023 | Q1–Q2 2023 |
| Cost of cloud | –28 | –95 | –1 | –6 |
| Cost of software licenses and support | –24 | –80 | 0 | –11 |
| Cost of services | –107 | –533 | 1 | –34 |
| Research and development | –144 | –1,100 | –3 | –40 |
| Sales and marketing | –284 | –906 | 9 | –150 |
| General and administration | –43 | –160 | –3 | –16 |
| Restructuring expenses | –631 | –2,873 | 3 | –257 |
| 22 | /27 |
| | Quarterly Statement Q2 2024 |
| (H) | Segment Reporting |
| (H.1) | Segment Policies and Segment Changes |
In the first quarter of 2024, the non-reportable Business Network segment was dissolved and integrated into the Applications, Technology & Services segment.
Driven by SAP’s continuous transformation into a holistically steered cloud company by a cohesive product portfolio and commercialization of product bundles (such as RISE with SAP and GROW with SAP) as well as resulting changes in Executive Board responsibility in the second quarter of 2024 it was concluded that SAP’s Chief Operating Decision Maker (CODM) steers SAP on a consolidated basis. Consequently, with effect from the second quarter of 2024, SAP has a single operating segment.
For more information about SAP’s operating performance, see the Reconciliation from Non-IFRS Numbers to IFRS Numbers section.
For a more detailed description of SAP’s segment reporting, see Note (C.1) “Results of Segments” of our Consolidated Half-Year Financial Statements 2024.
| 23 | /27 |
| | Quarterly Statement Q2 2024 |
| (I) | Revenue by Region (IFRS and Non-IFRS) |
| (I.1) | Revenue by Region (IFRS and Non-IFRS) – Quarter |
| € millions | Q2 2024 | Q2 2023 | ∆ in % | |||
| Actual currency | Currency Impact | Constant Currency | Actual currency | Actual currency | Constant Currency | |
| Cloud Revenue by Region | ||||||
| EMEA | 1,673 | –9 | 1,664 | 1,267 | 32 | 31 |
| Americas | 1,914 | –14 | 1,901 | 1,622 | 18 | 17 |
| APJ | 566 | 22 | 588 | 427 | 33 | 38 |
| Cloud revenue | 4,153 | –1 | 4,153 | 3,316 | 25 | 25 |
| Cloud and Software Revenue by Region | ||||||
| EMEA | 3,215 | –13 | 3,202 | 2,878 | 12 | 11 |
| Americas | 2,912 | –21 | 2,891 | 2,646 | 10 | 9 |
| APJ | 1,047 | 42 | 1,090 | 980 | 7 | 11 |
| Cloud and software revenue | 7,175 | 7 | 7,182 | 6,505 | 10 | 10 |
| Total Revenue by Region | ||||||
| Germany | 1,283 | 0 | 1,282 | 1,146 | 12 | 12 |
| Rest of EMEA | 2,444 | –16 | 2,428 | 2,200 | 11 | 10 |
| Total EMEA | 3,727 | –16 | 3,711 | 3,346 | 11 | 11 |
| United States | 2,701 | –30 | 2,672 | 2,477 | 9 | 8 |
| Rest of Americas | 690 | 3 | 693 | 628 | 10 | 10 |
| Total Americas | 3,392 | –27 | 3,365 | 3,105 | 9 | 8 |
| Japan | 337 | 37 | 374 | 313 | 7 | 19 |
| Rest of APJ | 833 | 11 | 844 | 790 | 5 | 7 |
| Total APJ | 1,170 | 48 | 1,217 | 1,103 | 6 | 10 |
| Total revenue | 8,288 | 5 | 8,293 | 7,554 | 10 | 10 |
| 24 | /27 |
| | Quarterly Statement Q2 2024 |
| (I.2) | Revenue by Region (IFRS and Non-IFRS) – Year-to-Date |
| € millions | Q1–Q2 2024 | Q1–Q2 2023 | ∆ in % | |||
| Actual Currency | Currency Impact | Constant Currency | Actual Currency | Actual Currency | Constant Currency | |
| Cloud Revenue by Region | ||||||
| EMEA | 3,230 | –12 | 3,219 | 2,458 | 31 | 31 |
| Americas | 3,761 | 5 | 3,766 | 3,194 | 18 | 18 |
| APJ | 1,090 | 56 | 1,146 | 841 | 30 | 36 |
| Cloud revenue | 8,082 | 49 | 8,131 | 6,493 | 24 | 25 |
| Cloud and Software Revenue by Region | ||||||
| EMEA | 6,325 | –18 | 6,306 | 5,660 | 12 | 11 |
| Americas | 5,776 | 5 | 5,781 | 5,283 | 9 | 9 |
| APJ | 2,034 | 107 | 2,140 | 1,919 | 6 | 12 |
| Cloud and software revenue | 14,134 | 93 | 14,228 | 12,863 | 10 | 11 |
| Total Revenue by Region | ||||||
| Germany | 2,520 | 0 | 2,520 | 2,283 | 10 | 10 |
| Rest of EMEA | 4,804 | –23 | 4,781 | 4,338 | 11 | 10 |
| Total EMEA | 7,323 | –23 | 7,301 | 6,621 | 11 | 10 |
| United States | 5,369 | 1 | 5,370 | 4,974 | 8 | 8 |
| Rest of Americas | 1,359 | 3 | 1,362 | 1,233 | 10 | 10 |
| Total Americas | 6,728 | 4 | 6,732 | 6,207 | 8 | 8 |
| Japan | 662 | 78 | 740 | 616 | 7 | 20 |
| Rest of APJ | 1,615 | 42 | 1,658 | 1,550 | 4 | 7 |
| Total APJ | 2,277 | 120 | 2,397 | 2,166 | 5 | 11 |
| Total revenue | 16,329 | 101 | 16,430 | 14,995 | 9 | 10 |
| 25 | /27 |
| | Quarterly Statement Q2 2024 |
| (J) | Employees by Region and Functional Areas |
| Full-time equivalents | 06/30/2024 | 06/30/2023 | ||||||
| EMEA | Americas | APJ | Total | EMEA | Americas | APJ | Total | |
| Cloud and software | 4,434 | 4,148 | 4,448 | 13,029 | 4,010 | 4,083 | 4,000 | 12,093 |
| Services | 8,292 | 4,618 | 5,410 | 18,320 | 7,993 | 5,000 | 5,476 | 18,469 |
| Research and development | 18,073 | 5,441 | 12,331 | 35,844 | 17,910 | 5,872 | 12,318 | 36,100 |
| Sales and marketing | 12,053 | 9,438 | 5,112 | 26,603 | 11,778 | 10,121 | 5,303 | 27,202 |
| General and administration | 3,640 | 1,723 | 1,291 | 6,653 | 3,475 | 1,765 | 1,281 | 6,521 |
| Infrastructure | 2,845 | 1,129 | 890 | 4,865 | 2,800 | 1,284 | 859 | 4,943 |
| SAP Group (06/30) | 49,337 | 26,496 | 29,482 | 105,315 | 47,966 | 28,125 | 29,237 | 105,328 |
| Thereof acquisitions1 | 0 | 0 | 0 | 0 | 0 | 0 | 0 | 0 |
| SAP Group (six months' end average) | 49,414 | 27,689 | 29,745 | 106,848 | 47,917 | 28,127 | 29,337 | 105,380 |
1 Acquisitions closed between January 1 and June 30 of the respective year.
| 26 | /27 |
| | Quarterly Statement Q2 2024 |
| (K) | Share-Based Payment |
SAP’s share-based payment expenses included in our non-IFRS operating expenses break down as follows:
| € millions | Q2 2024 | Q1–Q2 2024 | Q2 2023 | Q1–Q2 2023 |
| Cost of cloud | –34 | –73 | –27 | –47 |
| Cost of software licenses and support | –11 | –22 | –11 | –20 |
| Cost of services | –89 | –192 | –107 | –198 |
| Research and development | –191 | –403 | –202 | –371 |
| Sales and marketing | –218 | –476 | –232 | –435 |
| General and administration | –48 | –114 | –36 | –96 |
| Share-based payment expenses | –592 | –1,280 | –614 | –1,167 |
Additionally in the second quarter of 2024, SAP recognized €107 million (Q2/2023: €0 million), and in the first half of 2024 €189 million (HY1/2023: €0 million), of accelerated share-based payment expenses triggered by the transformation program. These share-based payment expenses are classified as restructuring expenses in SAP’s consolidated income statements.
Associated share-based payments are classified as a decrease in provisions and other liabilities in SAP’s consolidated statements of cash flows. The payment amount in the first half of 2024 was immaterial.
| 27 | /27 |