TABLE OF CONTENTS
INTERIM REPORT JANUARY – SEPTEMBER 2013
Introductory Notes
This interim group report meets the requirements of German Accounting Standard No. 16 “Zwischenberichterstattung” (DRS 16). We prepared the financial data in the Quarterly Financial Statements (Unaudited) section for SAP AG and its subsidiaries in accordance with International Financial Reporting Standards (IFRS). In doing so, we observed the IFRS (including the interpretations by the International Financial Reporting Interpretations Committee (IFRIC)) both as issued by the International Accounting Standards Board (IASB) and as endorsed by the European Union (EU). This does not apply to numbers expressly identified as non-IFRS. For additional IFRS and non-IFRS information, see the Supplementary Financial Information (Unaudited) section.
This quarterly financial report updates our consolidated financial statements 2012, presents significant events and transactions of the third quarter 2013 and the first nine months of 2013, and updates the forward-looking information contained in our Management Report 2012. Both the 2012 consolidated financial statements and the 2012 Management Report are part of our 2012 Integrated Report which is available at www.sapintegratedreport.de.
All of the information in this interim group report is unaudited. This means the information has been subject neither to any audit nor to any review by an independent auditor.
| | |
| INTERIM REPORT JANUARY – SEPTEMBER 2013 | | 3 |
INTERIM MANAGEMENT REPORT
GENERAL INFORMATION
Forward-Looking Statements
This quarterly financial report contains forward-looking statements and information based on the beliefs of, and assumptions made by, our management using information currently available to them. Any statements contained in this report that are not historical facts are forward-looking statements as defined in the U.S. Private Securities Litigation Reform Act of 1995. We have based these forward-looking statements on our current expectations, assumptions, and projections about future conditions and events. As a result, our forward-looking statements and information are subject to uncertainties and risks, many of which are beyond our control. If one or more of these uncertainties or risks materializes, or if management’s underlying assumptions prove incorrect, our actual results could differ materially from those described in or inferred from our forward-looking statements and information.
We describe these risks and uncertainties in the Risk and Opportunity Management section, respectively in the there-mentioned sources.
The words “aim,” “anticipate,” “assume,” “believe,” “continue,” “could,” “counting on,” “development,” “is confident,” “estimate,” “expect,” “forecast,” “future trends,” “guidance,” “intend,” “may,” “might,” “outlook,” “plan,” “project,” “predict,” “seek,” “should,” “strategy,” “want,” “will,” “would,” and similar expressions as they relate to us are intended to identify such forward-looking statements. Such statements include, for example, those made in the Operating Results section, the Risk and Opportunity Management section, our Forecast for SAP, and other forward-looking information appearing in other parts of this quarterly financial report. To fully consider the factors that could affect our future financial results, both our Integrated Report 2012 and Annual Report on Form 20-F for December 31, 2012, should be considered, as well as all of our other filings with the Securities and Exchange Commission (SEC). Readers are cautioned not to place undue reliance on these forward-looking statements, which speak only as of the date specified or the date of this report. Except where legally required, we undertake no obligation to publicly update or revise any forward-looking statements as a result of new information that we receive about conditions that existed upon issuance of this report, future events, or otherwise unless we are required to do so by law.
Statistical Data
This report includes statistical data about the IT industry and global economic trends that comes from information published by sources including International Data Corporation (IDC), a provider of market information and advisory services for the information technology, telecommunications, and consumer technology markets; the European Central Bank (ECB); and the International Monetary Fund (IMF). This type of data represents only the estimates of IDC, ECB, IMF, and other sources of industry data. SAP does not adopt or endorse any of the statistical information provided by sources such as IDC, ECB, IMF, or other similar sources that is contained in this report. In addition, although we believe that data from these sources is generally reliable, this type of data is imprecise. We caution readers not to place undue reliance on this data.
All of the information in this report relates to the situation on September 30, 2013, or the quarter ended on that date unless otherwise stated.
Non-IFRS Financial Information
This quarterly financial report contains non-IFRS measures as well as financial data prepared in accordance with IFRS. We present and discuss the reconciliation of these non-IFRS measures to the respective IFRS measures in the Supplementary Financial Information (Unaudited) section. For more information about non-IFRS measures, see our Web site www.sap.com/corporate-en/investors/newsandreports/reporting-framework.epx under “Non-IFRS Measures and Estimates.”
| | |
| 4 | | INTERIM MANAGEMENT REPORT |
ECONOMIC CONDITIONS
Global Economic Trends
Figures published by the European Central Bank (ECB) indicate that the global economy’s development was restrained, amidst subdued market sentiment in the third quarter of 2013. Once again, there were significant regional differences: Economic growth decelerated in emerging markets but still grew faster than in industrialized economies.
According to the ECB, the economy of the euro area in the Europe, Middle East, and Africa (EMEA) region improved 0.3% compared to the previous quarter, thus enjoying positive growth rates again. Outside the euro area, growth remained steady, with the exception of several Arab countries whose economies were impacted by ongoing political instability. In the Americas region, U.S. economic growth improved 0.6% compared to the previous quarter, while the Latin American economy continued its course of recovery at a slightly reduced pace. In the Asia Pacific Japan (APJ) region, Japan’s economy remained relatively stable, expanding 0.9% compared to the previous quarter according to the ECB. In contrast, Asia’s emerging markets slowed mainly as the result of lower growth rates in China (only 7.5% growth compared to almost double-digit growth rates in the previous year’s quarter).
The IT Market
American market research firm International Data Corporation (IDC) reveals that the global IT market grew by mid-single-digit percentages in the first nine months of 2013, primarily due to continued strong growth rates of smartphones and tablets. As such, it significantly outperformed the global economy as a whole. IDC did, however, scale back its growth forecast slightly for the remainder of the year in view of China’s restrained economic expansion, continuing weakness in Europe’s economy, and declining PC sales. Software revenue continued to grow at a slightly faster rate than the overall IT market average in the third quarter. According to IDC, this was because companies had invested more heavily in virtualization, software as a service (SaaS), data analysis tools, and system and network management.
Since the beginning of the year, the IT market in the EMEA region grew much more slowly than in the previous year, but still outperformed the region’s global economy. The software segment was the strongest performer here, posting an above-average increase in revenue in the mid-single-digit percentage range. In the Americas region,
corporate investments in IT proved to be stable in the first three quarters of 2013; at the same time, federal budget cuts kept government IT spending low. The IT market in the APJ region, meanwhile, was mainly impacted by the declining IT market growth in China, which similar to the region’s global economy, only grew in the single digits since the beginning of the year.
Impact on SAP
Companies are shifting their investments to the cloud and are radically simplifying their IT landscape on in-memory technology. While we are driving this fundamental industry transformation it has also impacted our business. In the third quarter, our software revenue grew only single digit at constant currency. This slowdown resulted from the combination of a mixed macroeconomic environment and the accelerating industry shift to the cloud, which is impacting traditional customer buying patterns. However, cloud subscriptions and support revenue increased triple-digit, so that our software and cloud subscriptions revenue in total increased double-digit. Our regional performance shows how SAP benefits by offering customers a seamless choice of software – on premise or in a public or private cloud. This also helps customers simplify their IT landscape, especially combined with our SAP HANA offering. In addition, they profit from our broad industry expertise and our broad ecosystem.
The Americas region delivered a strong third quarter with 17% growth in software and cloud subscription revenue at constant currencies. This was driven by excellent software revenue performance in Latin America despite challenging economic conditions particularly in Brazil. In North America we continue to benefit from the shift to cloud. Cloud contributed close to 30% of our total software and cloud subscription revenues this quarter. Our cloud business continues to show accelerated synergies between SAP, Ariba and SuccessFactors.
The EMEA region returned to strong growth with 14% in software and cloud subscription revenue at constant currencies despite a mixed market environment. The UK, the Netherlands, Switzerland all had strong double-digit growth in software revenue, while Southern Europe, which was hard hit by the financial crisis, returned to growth. We also saw solid performance in our home market Germany in utilities and retail industries.
| | |
| INTERIM REPORT JANUARY – SEPTEMBER 2013 | | 5 |
The APJ region returned to growth with solid single-digit growth in software and cloud subscription revenue at constant currencies. China recovered strongly, where we saw the benefit of our innovation strategy (particularly SAP HANA), more large transactions, and an increase in strong strategic partnerships.
VISION, MISSION, AND STRATEGY
We did not change our vision, mission, or strategy in the first nine months of 2013. For a detailed description, see our 2012 Integrated Report and item 4 in our 2012 Annual Report on Form 20-F.
| | |
| 6 | | INTERIM MANAGEMENT REPORT |
PORTFOLIO OF SOFTWARE AND SERVICES
In the third quarter of 2013, we made the following enhancements to our portfolio of software and services. For a detailed description of the portfolio of software and services we added in the first half of 2013, see the half-year report 2013. For a detailed description of our complete portfolio, see page 60 and the subsequent pages in our 2012 Integrated Report and item 4 in our 2012 Annual Report on Form 20-F.
Applications
By layering an improved user experience on top of the SAP HANA platform, SAP applications are becoming friendlier, faster, and more attuned to the needs of customers around the world.
At the start of the third quarter, SAP announced a cooperation agreement with Esri, a geographic information system (GIS) and location analytics provider, to integrate GIS solutions with SAP HANA, SAP BusinessObjects analytics, and the SAP Mobile platform.
SAP next unveiled the latest versions of SAP Data Services and SAP Information Steward. These real-time data management software solutions help address the need for better information governance while creating a simpler user experience.
In August, SAP introduced SAP Enterprise Foundation Extension. This offering enables companies new to SAP to implement an ERP system optimized to their specific needs, allowing for scalability at affordable cost.
SAP also offered a new set of enhancement packages for SAP Business Suite applications. These packages consolidate all of the innovations for SAP Business Suite powered by SAP HANA that have been delivered through 180 shipments over the last two years.
At the CRM Evolution event, held August 19 to 21 in New York City, SAP announced the release of the SAP Social Contact Intelligence analytic application. Powered by the SAP HANA platform, the new application allows marketing professionals to incorporate social sentiment insights into their campaigns to more easily identify and target prospects and influencers and help drive sales.
In September, SAP introduced the SAP HANA platform to manufacturing and research and development solutions. The portfolio includes the SAP Overall Equipment Effectiveness Management
application, the 6.0 version of the SAP Portfolio and Project Management application, and the SAP Energy and Environmental Resource Management solution.
In late September, SAP announced two new solutions that enable easier access to downstream demand and usage data. Combined with internal business data, they provide a real-time view of customer demand and sales:
SAP Demand Signal Management powered by the SAP HANA platform is a new Big Data-enabled application for manufacturers that captures large volumes of downstream demand signals, such as retailers’ point-of-sale data, along with market research data and consumer sentiment.
The SAP Enterprise Demand Sensing application helps improve the quality of demand forecasts within the short-term horizon to help reduce stock-outs and ultimately boost sales.
Industry Recognition:
During the quarter, ARC Advisory Group once again named SAP as a leader in the fields of transportation management systems (TMS) and warehouse management systems (WMS).
Gartner positioned SAP as a Leader in the “Magic Quadrant for Utilities Customer Information Systems (CIS),” the “Magic Quadrant for SAP Implementation Service Providers, Worldwide,” and the “Magic Quadrant for Single-Instance ERP for Product-Centric Midmarket Companies.”
Analytics
SAP enables business users to turn big data into valuable information through self-service visualizations and predictive analytics. These capabilities help decision-makers quickly identify untapped opportunities and respond to unforeseen risks. At the same time, SAP aims to simplify IT landscapes with our enterprise business intelligence suite.
At the 2013 SAP BusinessObjects User Conference held September 9 to 11 in Anaheim, SAP announced the general availability of the latest release of SAP BusinessObjects business intelligence (BI) solutions. The release brings both enhancements and important integration features to the core BI product, improving capabilities for SAP NetWeaver Business Warehouse and SAP BusinessObjects customers. The most marked improvements are in mobile solutions, dashboards, collaboration, and support for big data sources.
| | |
| INTERIM REPORT JANUARY – SEPTEMBER 2013 | | 7 |
SAP also announced a free edition of SAP Lumira, its self-service business intelligence (BI) software for data discovery. SAP Lumira helps users analyze Microsoft Excel data by building interactive visualizations in a drag and drop environment.
Industry Recognition:
Nucleus Research ranked SAP a leader in its Corporate Performance Management Technology Value Matrix, based on SAP’s recent innovations in mobile, cloud, and in-memory technology as well as integration with enterprise applications.
Cloud
To showcase our broad Cloud portfolio and feature how it is unlocking new value for customers, SAP launched its first-ever global Cloud ad campaign. SAP Cloud was also prevalent across all SAP events, including multiple industry forums, accompanied by an enhanced presence on www.sap.com/cloud.
During the third quarter, SAP took the next step toward its unified cloud portfolio vision. SAP now offers customers and partners a simple, flexible model for extending current on-premise solutions to cloud applications, including offerings from SAP companies Ariba and SuccessFactors.
Also during the third quarter, SAP announced that the SAP Cloud for Travel solution now offers additional convenience for business travelers by offering new open booking capabilities enabled by integration with Traxo, a Web-based travel management provider, and support for 20 countries.
Industry Recognition:
SuccessFactors, an SAP company, has been positioned as a leader for the fifth consecutive year in the IDC MarketScape Worldwide Integrated Talent Management report. As part of this analysis, SuccessFactors was also recognized as a leader in four separate IDC MarketScape Reports for recruiting, performance management, learning management, and compensation management for the second year in a row.
In the cloud-based collaborative commerce market, Ariba, an SAP company, was positioned as a Leader in the Gartner “Magic Quadrant for Strategic Sourcing,” with the highest placement for its ability to execute.
Also, for the eighth consecutive year, Ariba was named to the Supply & Demand Chain Executive Top 100 – this time for helping companies achieve excellence in the cloud through its applications and business network. Ariba was also named the Most
Innovative P2P technology provider by PayStream Advisors.
Gartner positioned SAP as a “Challenger” in the “Magic Quadrant for Sales Performance Management, 2013.”
Mobile
SAP continues to deliver new and better ways for customers to securely access data and business processes – from anywhere, at any time.
In July, SAP announced the latest release of the SAP BusinessObjects mobile app. Now available in the SAP Store for iOS and Android, the mobile app brings together multiple business intelligence (BI) and analytic applications from SAP into a single app, offering customers the flexibility and freedom to do business better while on the go.
In August, we announced an Internetwork Packet Exchange (IPX) peering agreement with Etisalat UAE, the largest telecom operator in the Middle East and Africa, to deliver LTE roaming traffic to all of its mobile operators. This strategic LTE roaming peering agreement will help Etisalat operator companies interconnect with SAP Mobile Services’ strong IPX customer community and launch LTE roaming quickly.
In September, SAP announced that mobile solutions from SAP will support iOS 7, Apple’s latest mobile operating system version. The new enterprise features will help SAP customers adopt corporate security requirements such as single sign-on, per-app VPN, and app configuration.
Industry Recognition:
During the third quarter, SAP was named the mobile market leader for the twelfth consecutive year by IDC. Based on continued mobile customer adoption, IDC reported that SAP holds the largest market share with a 14% share of the market.
In addition, SAP was positioned by Gartner in the Leaders Quadrant of the “Magic Quadrant for Mobile Application Development Platforms (MADP)” report. This comes on the heels of SAP’s recent leadership position in Gartner’s “Magic Quadrant for Mobile Device Management (MDM)” report. These leadership rankings are based on an evaluation of the SAP Mobile Platform and SAP Mobile Secure portfolio, including SAP Afaria, SAP Mobile Documents, and SAP Mobile App Protection by Mocana. SAP is the only vendor with leadership positions in both the Gartner MADP and MDM Magic Quadrants.
| | |
| 8 | | INTERIM MANAGEMENT REPORT |
The SAP Mobile Banking solution received the “2013 Mobile Banking Award” in Juniper Research’s Future Mobile Awards for Mobile Commerce. SAP also received high commendations for solutions related to mobile consumer payments and mobile coupons.
Database and Technology
The SAP HANA in-memory platform is one of the fastest growing technologies that SAP has ever developed. SAP HANA comprises not only a fast in-memory database but is also a platform with development and analysis tools and an intuitive user interface. SAP HANA is SAP’s cutting edge alternative database offering for the SAP Business Suite.
In early September, SAP announced a new solution that simplifies and speeds adoption of the SAP HANA platform for customers running SAP Business Suite software. The offering automates the process for migrating a relational database to the high-performance SAP HANA database through a series of preconfigured software, implementation services, standardized content, and user enablement.
Expanding on existing partnerships with Intel Corporation and Hortonworks Inc., SAP has signed agreements to redistribute and support Intel Distribution Apache Hadoop and Hortonworks Data Platform with SAP HANA. Customers benefit from an architecture fully supported by SAP and from a fully open source distribution.
At the SAP Americas Partner Leadership Summit held July 28 to 31 in Miami, SAP introduced the SAP PartnerEdge program for Application Development. This program is designed to empower partners to build, market, and sell software applications on top of technology platforms from SAP.
At the same time, our Sybase solutions continue to build momentum in the highly competitive database market.
In July, SAP announced the availability of SAP Sybase Adaptive Server Enterprise (SAP Sybase ASE) service pack 100, a key component of the SAP Real-Time Data Platform. The latest release delivers increased performance and scalability, as well as enhanced monitoring and diagnostic capabilities for very large database environments.
In August, SAP announced new high availability and disaster recovery functionality of SAP Sybase Replication Server for SAP Business Suite software running on SAP Sybase ASE. The new functionality provides disaster recovery, helping SAP Business
Suite applications running on SAP Sybase ASE avoid the cost and business risks of downtime during system disruptions, such as database upgrades, hardware failure, power outages, natural disaster, or human error.
| | |
| INTERIM REPORT JANUARY – SEPTEMBER 2013 | | 9 |
RESEARCH AND DEVELOPMENT
Our total research and development expense rose by 2% to€1,676 million in the first nine months of 2013, compared to€1,638 million in the corresponding period in 2012.
On our IFRS numbers, the portion of total revenue we spent on research and development in the first nine months of 2013 was 14.3%, which decreased by 0.3 percentage points compared to the 14.6% recorded for the first nine months of 2012. At the same time, we’ve brought more innovations to the market. On the non-IFRS numbers, the portion of total revenue we spent on R & D in the first nine months of 2013 was 13.6%, which remained virtually stable from the first nine months of the previous year.
We had 17,718 full-time equivalent (FTE) employees working in research and development teams on September 30, 2013, which increased slightly compared to the prior year (September 30, 2012: 17,495).
ACQUISITIONS
On August 1, 2013, SAP acquired hybris upon regulatory approval and completion of other closing conditions. This acquisition will enable SAP to deliver the next-generation e-commerce platform based on the latest technology, with the choice of on-premise or on-demand deployment. The combination of industry-leading enterprise solutions from SAP with the agile omni-channel commerce solutions of hybris will offer enhanced data access and faster analyses, enabling enterprises to optimize margins and customer loyalty.
In addition, SAP acquired Ticket-Web, KMS Software Company, Camilion Solutions, and SmartOps in March and April, 2013. KXEN was acquired in October 2013.
For more information about acquisitions, see Note (4) in the Notes to the Interim Financial Statements.
EMPLOYEES
Our vision to help the world run better and improve people’s lives relies on the power of human thinking, innovation, and creativity. For this reason, nothing is more critical to the long-term success of SAP and our customers than our employees. They deliver value to our customers and drive our sustainable growth and profitability.
An important factor for our long-term success is our ability to attract and retain talented employees. In the third quarter of 2013, the employee retention rate was 94% (unchanged from the third quarter of 2012). We define employee retention rate as the ratio between the average number of employees less voluntary employee departures (fluctuation) and the average number of employees (in full-time equivalents).
One of SAP’s overall non-financial goals is fostering a diverse workforce, specifically increasing the number of women in management. At the end of the third quarter of 2013, 19.6% of all management positions at SAP were held by women, compared to 19.3% at the end of September 2012. SAP has set a long-term target to increase the share of women in management to 25% by the year 2017.
At September 30, 2013, we had 66,061 full-time equivalent (FTE) employees worldwide (September 30, 2012: 61,344; December 31, 2012: 64,422) – an increase of 1,639 compared to year end 2012, of which 1,057 FTEs are due to acquisitions.
Our overall employee headcount on September 30, 2013, included 16,934 FTEs based in Germany (September 30, 2012: 16,596), and 13,503 FTEs based in the United States (September 30, 2012: 12,273).
ORGANIZATION AND CHANGES IN MANAGEMENT
In March 2013, the Executive Board and Supervisory Board of SAP AG agreed to prepare the conversion of SAP AG to a European Company (SE). The Executive Board and the Supervisory Board believe that the planned change of legal form reflects SAP’s position as a global company with European roots. The European Company legal form also reflects SAP’s European and international business activities. This legal form will allow the Company to optimize its corporate governance structure and the work of its Supervisory and Executive Boards.
As invited by management, SAP employees and their representatives in EU and European Economic Area (EEA) countries elected their delegates to a Special Negotiating Body (SNB). Negotiations between SAP management and the SNB regarding the European employees’ involvement in the SE began in September 2013 and are expected to last six months. SAP intends to seek the required approval of the shareholders to the conversion of legal form at the 2014 Annual General Meeting of
| | |
| 10 | | INTERIM MANAGEMENT REPORT |
Shareholders. If approved, the change of legal form would then take effect upon entry in the commercial register. With the conversion to an SE, shareholders of SAP AG automatically become shareholders of SAP SE. Shareholders’ rights remain unchanged.
On July 21, 2013, the SAP Supervisory Board agreed to propose that co-CEO Jim Hagemann Snabe be elected to the SAP Supervisory Board at the SAP Annual General Meeting of Shareholders in May 2014. This proposal is subject to support by at least 25% of the shareholders. Jim Hagemann Snabe will transition from his current role as co-CEO and member of the SAP Executive Board upon the conclusion of the Annual General Meeting of Shareholders in May 2014.
Lars Dalgaard stepped down from the Executive Board and left the company on June 1, 2013, to join a private equity firm. He continues to play an active role as an advisor to the SAP Cloud business in the Cloud Governance Board. In this context, SAP’s co-CEOs became interim Executive Board sponsors for all aspects of SAP’s cloud business.
To further accelerate the success in SAP’s cloud business, the company consolidated its cloud go-to-market under the leadership of Bob Calderoni. Calderoni is president of Ariba, an SAP company, and member of the Global Managing Board of SAP AG, and continues to lead the Ariba business network activities. He now works closely with Rob Enslin, a fellow member of the Global Managing Board of SAP AG and president of Global Customer Operations responsible for SAP’s worldwide sales and customer operations. The close collaboration between the two SAP managers ensures a stronger market positioning of SAP’s cloud solutions.
In this context, the responsibilities, especially regarding innovation, have changed. SAP consolidated all innovation areas under Vishal Sikka, member of the Executive Board of SAP AG. As of June 1, 2013, all SAP On-Premise Delivery, networks (Ariba), and Cloud unit development leaders report directly to Vishal Sikka. Additionally, the Executive Board nominated Bernd Leukert, executive vice president for Application Innovation, to the Global Managing Board of SAP AG with effect from July 1, 2013. In this capacity, Leukert reports directly to Vishal Sikka.
Luisa Deplazes Delgado, member of the Executive Board of SAP AG, Human Resources, and Labor Relations Director, decided to leave SAP with effect from June 30, 2013, to take on responsibility as CEO of another company.
In addition to his role as chief financial officer of SAP AG, Werner Brandt took on Executive Board responsibility for Human Resources and became the Labor Relations Director in Germany. In this context, Luka Mucic became the new head of Finance to support Brandt in his expanded responsibilities. The Executive Board nominated Mucic to the Global Managing Board of SAP with effect from July 1, 2013. In October 2013, the Supervisory Board of SAP AG has appointed Luka Mucic as Chief Financial Officer of SAP AG, effective July 1, 2014. Luka Mucic is the successor of Werner Brandt, who will, as planned, withdraw from the Executive Board by that time.
| | |
| INTERIM REPORT JANUARY – SEPTEMBER 2013 | | 11 |
ASSETS, FINANCES, AND OPERATING RESULTS
In the sections that follow, our assets, finances, and operating results are discussed in detail.
In the discussion of our assets, finances, and operating results, the financial data presented of 2013 fully contains the revenue and expenses, assets, liabilities, and cash flows from SuccessFactors and Ariba. Comparator amounts contain SuccessFactors numbers on a pro rata basis effective February 21, 2012. Ariba numbers are not included – Ariba was acquired on October 1, 2012.
Performance Against Our Outlook for 2013
(Non-IFRS)
In this section, all discussion of the first nine months’ contribution to target achievement is based exclusively on non-IFRS measures. However, in the following section, the discussion of results refers to IFRS figures only, so those figures are not expressly identified as IFRS figures.
We present, discuss, and explain the reconciliation from IFRS measures to non-IFRS measures in the Supplementary Financial Information (Unaudited) section.
Operational Targets for 2013 (Non-IFRS)
For our outlook based on non-IFRS numbers, see the Forecast for SAP passage in this interim management report.
Key Figures – SAP Group 7/1/ to 9/30/2013 (Non-IFRS)
| | | | | | | | | | | | | | | | |
| | | | | | | | | | | | Non-IFRS | |
| € millions, unless otherwise stated | | 7/1/ – 9/30/2013 | | | 7/1/ – 9/30/2012 | | | Change in % | | | Change in %
(Constant Currency) | |
Software | | | 977 | | | | 1,026 | | | | –5 | | | | 2 | |
Cloud subscriptions and support | | | 197 | | | | 80 | | | | 146 | | | | 162 | |
| Software and cloud subscription | | | 1,174 | | | | 1,106 | | | | 6 | | | | 13 | |
| Support | | | 2,189 | | | | 2,106 | | | | 4 | | | | 11 | |
| Software and software-related service revenue | | | 3,363 | | | | 3,212 | | | | 5 | | | | 12 | |
| Total revenue | | | 4,057 | | | | 3,970 | | | | 2 | | | | 9 | |
| Operating expense | | | –2,761 | | | | –2,731 | | | | 1 | | | | 6 | |
| Operating profit | | | 1,296 | | | | 1,239 | | | | 5 | | | | 15 | |
| Operating margin (in %) | | | 32.0 | | | | 31.2 | | | | 0.8pp | | | | 1.8pp | |
| Profit after tax | | | 933 | | | | 836 | | | | 12 | | | | n.a. | |
| Effective tax rate (in %) | | | 27.6 | | | | 26.7 | | | | 0.9pp | | | | n.a. | |
| Earnings per share, basic (in€) | | | 0.78 | | | | 0.70 | | | | 11 | | | | n.a. | |
| | | | | | | | | | | | | | | | | |
Deferred cloud subscriptions and support revenue (September 30) | | | 382 | | | | 213 | | | | 79 | | | | n.a. | |
Actual Performance in the Third Quarter of 2013 (Non-IFRS)
In the third quarter of 2013, software and software-related service revenue (non-IFRS) increased 12% at constant currencies. At actual currencies, software and software-related service revenue (non-IFRS) was€3,363 million (Q3 2012:€3,212 million), an increase of 5%.
Included in our non-IFRS software and software-related service revenue, our revenue from cloud subscriptions and support was€197 million (Q3 2012:€80 million), an increase of 146% compared to the same period in 2012. The amounts for 2013 include full cloud subscriptions and cloud support revenue from SuccessFactors, Ariba, and a small portion of revenue from hybris; comparator
amounts contain SuccessFactors numbers only. Deferred cloud subscriptions and support revenue was€382 million on September 30, 2013 (September 30, 2012:€213 million).
Non-IFRS total revenue in the same period was€4,057 million (Q3 2012:€3,970 million), an increase of 2%. On a constant currency basis, the increase was 9%.
Non-IFRS operating expense in the third quarter of 2013 was€2,761 million (Q3 2012:€2,731 million), an increase of 1%. On a constant currency basis, the increase was 6%, from this an increase of 4 percentage points came from the acquisitions of Ariba and hybris.
| | |
| 12 | | INTERIM MANAGEMENT REPORT |
Non-IFRS operating profit was €1,296 million (Q3 2012: €1,239 million), an increase of 5% (15% at constant currencies).
Non-IFRS operating margin was 32.0%, an increase of 0.8 percentage points compared to the same period in prior year (Q3 2012: 31.2%). While total revenue increased 2%, operating expenses increased only 1%.
Non-IFRS operating margin for the third quarter of 2013 was affected by the acquisitions of Ariba and hybris, which impacted the operating margin by approximately 50 basis points, compared to the same period in 2012. Non-IFRS operating margin on a constant currency basis was 33%, an increase of 1.8 percentage points.
In the third quarter of 2013, non-IFRS profit after tax was€933 million (Q3 2012:€836 million), an increase of 12%. Non-IFRS basic earnings per share was€0.78 (Q3 2012:€0.70), an increase of 11%.
The non-IFRS effective tax rate in the third quarter of 2013 was 27.6% (Q3 2012: 26.7%). The year over year increase in the effective tax rate mainly resulted from tax effects relating to intercompany financing.
| | |
| INTERIM REPORT JANUARY – SEPTEMBER 2013 | | 13 |
Key Figures – SAP Group 1/1/ to 9/30/2013 (Non-IFRS)
| | | | | | | | | | | | | | | | |
| | | Non-IFRS | |
| € millions, unless otherwise stated | | 1/1/ – 9/30/2013 | | | 1/1/ - 9/30/2012 | | | Change in % | | | Change in %
(Constant Currency) | |
Software | | | 2,616 | | | | 2,722 | | | | –4 | | | | 0 | |
Cloud subscriptions and support | | | 547 | | | | 183 | | | | 198 | | | | 208 | |
| Software and cloud subscription | | | 3,163 | | | | 2,905 | | | | 9 | | | | 14 | |
| Support | | | 6,484 | | | | 6,075 | | | | 7 | | | | 11 | |
| Software and software-related service revenue | | | 9,647 | | | | 8,980 | | | | 7 | | | | 12 | |
| Total revenue | | | 11,784 | | | | 11,243 | | | | 5 | | | | 9 | |
| Operating expense | | | –8,368 | | | | –7,998 | | | | 5 | | | | 7 | |
| Operating profit | | | 3,416 | | | | 3,245 | | | | 5 | | | | 12 | |
| Operating margin (in %) | | | 29.0 | | | | 28.9 | | | | 0.1pp | | | | 0.9pp | |
| Profit after tax | | | 2,498 | | | | 2,249 | | | | 11 | | | | n.a. | |
| Effective tax rate (in %) | | | 25.6 | | | | 26.7 | | | | –1.1pp | | | | n.a. | |
| Earnings per share, basic (in€) | | | 2.09 | | | | 1.89 | | | | 11 | | | | n.a. | |
| | | | | | | | | | | | | | | | | |
Deferred cloud subscriptions and support revenue (September 30) | | | 382 | | | | 213 | | | | 79 | | | | n.a. | |
Actual Performance in the First Nine Months of 2013 (Non-IFRS)
In the first nine months of 2013, software and software-related service revenue (non-IFRS) increased 12% at constant currencies. At actual currencies, software and software-related service revenue (non-IFRS) was€9,647 million (first nine months 2012:€8,980 million), an increase of 7%.
Included in our non-IFRS software and software-related service revenue, our revenue from cloud subscriptions and support was€547 million (first nine months of 2012:€183 million), an increase of 198% compared to the same period in 2012. The amounts for 2013 include full cloud subscriptions and cloud support revenue from SuccessFactors, Ariba, and a small portion of revenue from hybris; comparator amounts contain SuccessFactors numbers on a pro rata basis with effect from February 21, 2012, only.
Non-IFRS total revenue in the same period was€11,784 million (first nine months of 2012:€11,243 million), an increase of 5%. On a constant currency basis, the increase was 9%.
Non-IFRS operating profit was€3,416 million (first nine months of 2012:€3,245 million), an increase of 5% (12% at constant currencies).
The operating margin (non-IFRS) was negatively affected by the acquisitions of SuccessFactors, Ariba, and hybris in the first nine months of 2013 compared to the same period in the prior year. The operating margin thus declined by a total of around
60 basis points. However, Non-IFRS operating margin was 29.0%, an increase of 0.1 percentage points in the first nine months of 2013 (first nine months of 2012: 28.9%). At constant currencies, non-IFRS operating margin was 29.8%, an increase of 0.9 percentage points.
In the first nine months of 2013, non-IFRS profit after tax was€2,498 million (first nine months of 2012:€2.249 million), an increase of 11%. Non-IFRS basic earnings per share was€2.09 (first nine months of 2012:€1.89), an increase of 11%.
The non-IFRS effective tax rate in the first nine months of 2013 was 25.6% (first nine months of 2012: 26.7%). The year over year decrease in the effective tax rate mainly resulted from taxes for prior years which were partly compensated by tax effects relating to intercompany financing.
Overall, during the first nine months our non-IFRS numbers at actual currencies experienced a significant negative currency impact compared to what they would have been if translated at the exchange rates from last year: SSRS revenue was impacted by€384 million and was thus 5% lower than the corresponding constant currency number; total revenue was impacted by€458 million and was thus 4% lower than the corresponding constant currency number. The operating profit was impacted by€229 million and was thus 7% lower than the respective constant currency number. The operating margin was negatively impacted by 80 basis points for the first nine months of 2013.
| | |
| 14 | | INTERIM MANAGEMENT REPORT |
If exchange rates remain at the September 2013 level for the rest of the year, our fourth-quarter and full-year 2013 non-IFRS SSRS and total revenue growth rates will be negatively impacted by approximately 5 percentage points. Our fourth quarter and full-year 2013 Non-IFRS operating profit will be negatively impacted by approximately 7 percentage points, and our non-IFRS operating margin at actual currencies will be approximately 100 basis points lower than the corresponding constant currency margin.
Segment Information
Since the third quarter of 2012, SAP reports under a new segment structure. For more information about the changes to our segment reporting and a description of the activities of our new segments, see the Notes to the Interim Financial Statements section, Note (17).
SAP has two divisions – On-Premise and Cloud, which are further divided into operating segments. Our On-Premise division is comprised of two operating segments: On-Premise Products and On-Premise Services. In the third quarter of 2012, our Cloud division was comprised of one operating segment: Cloud Applications. Following the acquisition of Ariba, we established a second operating segment in the Cloud division, mainly consisting of the acquired Ariba business (Ariba). The operations of Crossgate, which we acquired in 2011, are also included in the operating segment containing the acquired Ariba business. All operating segments are reportable segments.
On August 1, 2013, SAP acquired hybris AG. The acquisition will enable SAP to deliver the next-generation e-commerce platform based on the latest technology, with the choice of on-premise or on-demand deployment. Since the majority of hybris’ activities are currently delivered in an on-premise model, the majority of hybris’ activities are correspondingly reflected in the On-Premise division.
Key Figures in SAP Segment Reporting in the Third Quarter of 2013
In the third quarter of 2013, revenue in the On-Premise division decreased by 2% to€3,805 million (Q3 2012:€3,865 million). Of this,€3,154 million (Q3 2012:€3,129 million) was revenue from the Products segment, representing an increase of 1%. Revenue from the Services segment decreased by 12% to€651 million (Q3 2012:€736 million).
In the third quarter of 2013, segment revenue in the Cloud division achieved€252 million (Q3 2012:
€105 million). Of this,€135 million (Q3 2012:€101 million) was revenue from the Cloud Applications segment,€117 million (Q3 2012:€4 million) was revenue from the Ariba segment.
The Ariba business is showing accelerated synergies with new and upsell application billings growing high double digits. The trailing twelve month Ariba network spend volume was approximately $500 billion. Today Ariba is the world’s largest Web-based business trading community with 1.2 million connected companies.
The annual cloud revenue run rate is already€1,008 million. The annual revenue run rate is the third quarter 2013 Cloud division revenue multiplied by 4.
Segment profit for the On-Premise division was€1,971 million (Q3 2012:€1,967 million). Of this,€1,855 million (Q3 2012:€1,786 million) was from the Products segment and€115 million (Q3 2012:€181 million) was from the Services segment. In the third quarter of 2013, the operating segment margin (ratio of segment profit divided by segment revenue) for the reportable segments was 59% (Q3 2012: 57%) for the Products segment, and 18% (Q3 2012: 25%) for the Services segment. Margin decline in the On-Premise Services segment is mainly caused by a weak development of the consulting business, especially in North America, which is suffering a low bookings level as a result of challenging market conditions. This resulted in an operating margin of 52% (Q3 2012: 51%) for the entire On-Premise division.
Segment profit for the Cloud division was€32 million (Q3 2012: –€22 million) which improved significantly compared to the same period of the prior year. Of this,€1 million (Q3 2012: –€17 million) was from the Cloud Applications segment and€31 million (Q3 2012: –€6 million) was from the Ariba segment. In the third quarter of 2013, the operating segment margin for the reportable segments was 1% (Q3 2012: –16%) for the Cloud Applications segment, and 26% (Q3 2012: –150%) for the Ariba segment. This resulted in an operating margin of 13% (Q3 2012: –21%) for the entire Cloud division.
Key Figures in SAP Segment Reporting in the First Nine Months of 2013
In the first nine months of 2013, revenue in the On-Premise division increased by 1% to€11,075 million (first nine months of 2012:€10,999 million). Of this,€9,064 million (first nine months of 2012:€8,788 million) was revenue from the Products segment, representing an increase of 3%. Revenue from the Services segment decreased by 9% to€2,011 million (first nine months of 2012:€2,210 million).
| | |
| INTERIM REPORT JANUARY – SEPTEMBER 2013 | | 15 |
In the first nine months of 2013, segment revenue in the Cloud division achieved€709 million (first nine months of 2012:€244 million). Of this,€368 million (first nine months of 2012:€231 million) was revenue from the Cloud Applications segment, while€341 million (first nine months of 2012:€13 million) was revenue from the Ariba segment.
Segment profit for the On-Premise division was€5,516 million (first nine months of 2012:€5,430 million, including€5,128 million (first nine months of 2012:€4,949 million) from the Products segment and€388 million (first nine months of 2012:€481 million) from the Services segment. In the first nine months of 2013, the operating segment margin for the reportable segments was 57% (first nine months of 2012: 56%) for the Products segment, and 19% (first nine months of 2012: 22%) for the Services segment. Margin decline in the On-Premise Services segment is
mainly caused by a weak development of the consulting business, especially in North America, which is suffering a low bookings level as a result of challenging market conditions. This resulted in an operating margin of 50% (first nine months of 2012: 49%) for the entire On-Premise division.
Segment profit for the Cloud division was€83 million (first nine months of 2012: –€68 million), which improved significantly compared to the same period of the prior year. Of this, –€9 million (first nine months of 2012: –€55 million) was from the Cloud Applications segment and€92 million (first nine months of 2012: –€13 million) was from the Ariba segment. In the first nine months of 2013, the operating segment margin for the reportable segments was –2% (first nine months of 2012: –24%) for the Cloud Applications segment, and 27% (first nine months of 2012: –100%) for the Ariba segment. This resulted in an operating margin of 12% (first nine months of 2012: –28%) for the entire Cloud division.
| | |
| 16 | | INTERIM MANAGEMENT REPORT |
Key Figures SAP Group in the Third Quarter of 2013 (IFRS)
| | | | | | | | | | | | | | | | |
| € millions, unless otherwise stated | | 7/1/ – 9/30/2013 | | | 7/1/ – 9/30/2012 | | | Change | | | Change in % | |
Software | | | 975 | | | | 1,026 | | | | –51 | | | | –5 | |
Cloud subscriptions and support | | | 191 | | | | 63 | | | | 128 | | | | 203 | |
| Software and cloud subscription | | | 1,167 | | | | 1,089 | | | | 77 | | | | 7 | |
| Support | | | 2,184 | | | | 2,105 | | | | 79 | | | | 4 | |
| Software and software-related service revenue | | | 3,351 | | | | 3,194 | | | | 157 | | | | 5 | |
| Total revenue | | | 4,045 | | | | 3,952 | | | | 93 | | | | 2 | |
| Operating expense | | | –3,003 | | | | –3,031 | | | | 28 | | | | –1 | |
| Operating profit | | | 1,043 | | | | 921 | | | | 122 | | | | 13 | |
| Operating margin (in %) | | | 25.8 | | | | 23.3 | | | | 2.5pp | | | | n.a. | |
| Profit after tax | | | 762 | | | | 618 | | | | 143 | | | | 23 | |
| Effective tax rate (in %) | | | 26.4 | | | | 24.8 | | | | 1.6pp | | | | n.a. | |
| Headcount in full-time equivalents (September 30) | | | 66,061 | | | | 61,344 | | | | 4,717 | | | | 8 | |
| Days sales outstanding in days (September 30) | | | 62 | | | | 60 | | | | 2 | | | | 3 | |
| Earnings per share, basic (in€) | | | 0.64 | | | | 0.52 | | | | 0.12 | | | | 23 | |
| | | | | | | | | | | | | | | | | |
Deferred cloud subscriptions and support revenue (September 30) | | | 376 | | | | 169 | | | | 207 | | | | >100 | |
OPERATING RESULTS IN THE THIRD QUARTER (IFRS)
Orders
The total number of completed transactions for on-premise software in the third quarter of 2013 decreased 6% year on year to 12,774 (Q3 2012: 13,654). In addition, the average value of software orders received for on-premise software deals went down 7% compared to the year before. Of all our software orders received in the third quarter of 2013, 32% were attributable to deals worth more than€5 million (Q3 2012: 38%), while 40% were attributable to deals worth less than€1 million (Q3 2012: 38%).
Revenue
In the third quarter of 2013, software revenue was€975 million (Q3 2012:€1,026 million), a decrease of 5% compared to the same period in 2012. Software revenue in the third quarter of 2013 included€149 million (Q3 2012:€83 million) from SAP HANA.
Our revenue from cloud subscriptions and support was€191 million (Q3 2012:€63 million), an increase of 203% compared to the same period in 2012. The amounts for 2012 include cloud subscriptions and cloud support revenue from SuccessFactors. Ariba and hybris are not included in prior year numbers.
Total revenue was€4,045 million (Q3 2012:€3,952 million), an increase of 2% compared to the same period in 2012.
Operating Expenses
In the third quarter of 2013, our operating expenses decreased 1% to€3,003 million (Q3 2012:€3,031 million).
Our operating expenses remained relatively constant despite increased revenue. The increased expenditure for salaries as a result of the rise in headcount was offset by a decline in expenses relating to our share-based compensation plans.
Operating Profit and Margin
In the third quarter of 2013, operating profit increased 13% compared with the same period in the previous year to€1,043 million (Q3 2012:€921 million).
Our operating margin increased by 2.5 percentage points to 25.8% (Q3 2012: 23.3%).
Profit After Tax and Earnings per Share
In the third quarter of 2013, profit after tax was€762 million (Q3 2012:€618 million), an increase of 23%. Basic earnings per share was€0.64 (Q3 2012:€0.52), an increase of 23%.
The effective tax rate in the third quarter of 2013 was 26.4% (Q3 2012: 24.8%). The year over year increase in the effective tax rate mainly resulted from tax effects relating to intercompany financing.
| | |
| INTERIM REPORT JANUARY – SEPTEMBER 2013 | | 17 |
Key Figures SAP Group in the First Nine Months of 2013 (IFRS)
| | | | | | | | | | | | | | | | |
| € millions, unless otherwise stated | | 1/1/ – 9/30/2013 | | | 1/1/ - 9/30/2012 | | | Change | | | Change in % | |
Software | | | 2,614 | | | | 2,722 | | | | –108 | | | | –4 | |
Cloud subscriptions and support | | | 488 | | | | 144 | | | | 344 | | | | 238 | |
| Software and cloud subscription | | | 3,101 | | | | 2,866 | | | | 236 | | | | 8 | |
| Support | | | 6,470 | | | | 6,071 | | | | 399 | | | | 7 | |
| Software and software-related service revenue | | | 9,571 | | | | 8,937 | | | | 634 | | | | 7 | |
| Total revenue | | | 11,708 | | | | 11,200 | | | | 509 | | | | 5 | |
| Operating expense | | | –9,031 | | | | –8,727 | | | | –304 | | | | 3 | |
| Operating profit | | | 2,677 | | | | 2,473 | | | | 205 | | | | 8 | |
| Operating margin (in %) | | | 22.9 | | | | 22.1 | | | | 0.8pp | | | | n.a. | |
| Profit after tax | | | 2,006 | | | | 1,723 | | | | 284 | | | | 16 | |
| Effective tax rate (in %) | | | 23.4 | | | | 24.9 | | | | –1.5pp | | | | n.a. | |
| Earnings per share, basic (in€) | | | 1.68 | | | | 1.45 | | | | 0.23 | | | | 16 | |
| | | | | | | | | | | | | | | | | |
| Deferred cloud subscriptions and support revenue (September 30) | | | 376 | | | | 169 | | | | 207 | | | | >100 | |
OPERATING RESULTS IN THE FIRST NINE MONTHS (IFRS)
Orders
The total number of completed transactions for on-premise software in the first nine months of 2013 decreased 8% year on year to 38,697 (first nine months of 2012: 41,861). The average value of software orders received for on-premise software showed a small decrease of 2% compared to the previous year. Of all our software orders received in the first nine months of 2013, 23% were attributable to deals worth more than€5 million (first nine months of 2012: 28%), while 46% were attributable to deals worth less than€1 million (first nine months of 2012: 45%).
Revenue
In the first nine months of 2013, software revenue was€2,614 million (first nine months of 2012:€2,722 million), a decrease of 4% compared to the same period in 2012. Software revenue in the first nine months of 2013 included€337 million (first nine months of 2012:€196 million) from SAP HANA.
Our revenue from cloud subscriptions and support was€488 million (first nine months of 2012:€144 million), an increase of 238% compared to the same period in 2012. The amounts for 2012 include cloud subscriptions and cloud support revenue from SuccessFactors since its acquisition date (February 21, 2012). Ariba and hybris are not included in prior year numbers.
Total revenue was€11,708 million (first nine months of 2012:€11,200 million), an increase of 5% compared to the same period in 2012.
Operating Expenses
In the first nine months of 2013, our operating expenses increased 3% to€9,031 million (first nine months of 2012:€8,727 million).
The increase in operating expenses is mainly due to the increased headcount.
Operating Profit and Margin
In the first nine months of 2013, operating profit increased 8% compared with the same period in the previous year to€2,677 million (first nine months of 2012:€2,473 million).
Our operating margin increased by 0.8 percentage points to 22.9% (first nine months of 2012: 22.1%).
Profit After Tax and Earnings per Share
In the first nine months of 2013, profit after tax was€2,006 million (first nine months of 2012:€1,723 million), an increase of 16%. Basic earnings per share was€1.68 (first nine months of 2012:€1.45), an increase of 16%.
The effective tax rate in the first nine months of 2013 was 23.4% (first nine months of 2012: 24.9%). The year over year decrease in the effective tax rate mainly resulted from taxes for prior years which were partly compensated by tax effects relating to intercompany financing.
| | |
| 18 | | INTERIM MANAGEMENT REPORT |
FINANCES (IFRS)
Cash Flow and Liquidity
Operating cash flow for the first nine months of 2013 was€3,040 million (first nine months of 2012:€3,057 million). As such, the consistently strong operating cash flow remained stable compared to the same period in the previous year.
Group liquidity stood at€3,312 million on September 30, 2013 (December 31, 2012:€2,492 million). Group liquidity comprised cash and cash equivalents totaling€3,255 million (December 31, 2012:€2,477 million) and short-term investments totaling€57 million (December 31, 2012:€15 million).
Group Liquidity of SAP Group
| | | | | | | | | | | | |
| € millions | | 9/30/ 2013 | | | 12/31/ 2012 | | | Change | |
| Cash and cash equivalents | | | 3,255 | | | | 2,477 | | | | 778 | |
| Short-term investments | | | 57 | | | | 15 | | | | 42 | |
| Group liquidity - gross | | | 3,312 | | | | 2,492 | | | | 820 | |
| Current bank loans | | | 1,000 | | | | 0 | | | | 1,000 | |
Current private placement
transactions | | | 86 | | | | 0 | | | | 86 | |
| Current bonds | | | 500 | | | | 600 | | | | –100 | |
| Net liquidity 1 | | | 1,726 | | | | 1,892 | | | | –166 | |
Non-current private
placement transactions | | | 1,962 | | | | 2,094 | | | | –132 | |
| Non-current bonds | | | 1,800 | | | | 2,300 | | | | –500 | |
| Net liquidity 2 | | | –2,036 | | | | –2,502 | | | | 466 | |
Net liquidity 1 is total group liquidity minus current bank loans, private placement transactions, and bonds which decreased on a year-to-date basis by€166 million to€1,726 million. The increase in current bank loans relates to the acquisition of hybris: SAP took a short-term bank loan to support the financing.
Net liquidity 2, defined as net liquidity 1 minus non-current private placement transactions, and bonds, was –€2,036 million (December 31, 2012:
–€2,502 million).
Thus, net liquidity improved compared to December 31, 2012: Dividends paid led to cash outflows which were overcompensated by a positive operating cash flow in the first nine months of 2013.
Free Cash Flow and Days’ Sales Outstanding (DSO)
Our free cash flow and our DSO on September 30, 2013, were as follows:
Free Cash Flow
| | | | | | | | | | | | |
| € millions | | 1/1 – 9/30/ 2013 | | | 1/1 – 9/30/ 2012 | | | Change in % | |
| Free cash flow | | | 2,639 | | | | 2,687 | | | | –2 | |
We calculate free cash flow as net cash from operating activities minus purchases of intangible assets and property, plant, and equipment.
Days’ Sales Outstanding
| | | | | | | | | | | | |
| | | 9/30/ 2013 | | | 9/30/ 2012 | | | Change in
Days | |
Days’ sales outstanding
(DSO) in days | | | 62 | | | | 60 | | | | 2 | |
DSO measures the length of time it takes to collect receivables. SAP calculates DSO by dividing the average invoiced accounts receivables balance of the last 12 months by the average monthly sales of the last 12 months.
ASSETS (IFRS)
Analysis of Consolidated Statements of
Financial Position
The total assets of the Group were€27,534 million on September 30, 2013, an increase of€824 million since December 31, 2012, resulting mainly from an increase in cash and cash equivalents from the operating cash flow, compensated by dividends paid. In addition, the acquisition of hybris resulted in an increase in goodwill and intangible assets.
The equity ratio on September 30, 2013, was 54% (December 31, 2012: 53%), which increased slightly compared to year end 2012.
Investments
Investments in intangible assets and property, plant, and equipment decreased significantly in the first nine months of 2013 to€1,633 million (first nine months of 2012:€3,638 million). This decrease is due to our prior year acquisition of SuccessFactors.
Off-Balance-Sheet Financial Instruments
There are no off-balance-sheet financial instruments, such as sale-and-lease-back transactions, asset-backed securities, or liabilities related to special-purpose entities, that are not disclosed in our interim Consolidated Financial Statements. Any factoring contracts are not material in volume.
| | |
| INTERIM REPORT JANUARY – SEPTEMBER 2013 | | 19 |
Competitive Intangibles
The assets that are the basis for our current and future success do not appear on the Consolidated Statements of Financial Position. This is apparent from a comparison of the market capitalization of SAP AG, which was€67.2 billion, with the equity of the SAP Group on the Consolidated Statements of Financial Position, which was€14.9 billion on September 30, 2013 (December 31, 2012:€14.2 billion). This means that the market capitalization of our equity is more than four times higher than the book value.
Customer capital, our employees and their knowledge and skills, our ecosystem of partners, the SAP brand, and our past investments in research and development are some of the most important competitive intangibles that influence our market value.
According to the 2013 Interbrand annual survey of the Top 100 Best Global Brands, SAP is ranked the 25th most valued brand in the world. Interbrand determined a value of US$16.7 billion.
ENERGY AND EMISSIONS
As we create solutions for our customers to better manage resources, we must also look to ourselves and improve our own environmental performance. We also acknowledge greenhouse gas (GHG) emissions as a proxy measure for inefficient operations and excess spending.
SAP’s greenhouse gas (GHG) emissions for the third quarter 2013 totaled 140 kilotons compared to 130 kilotons in the third quarter of 2012. For the first three quarters 2013, SAP’s GHG emissions totaled 420 kilotons – an increase of 14% compared to the first three quarters of 2012. This rise is primarily due to the acquisitions of SuccessFactors and Ariba, an increase in the number of company cars, as well as an increase in energy consumption of our data centers and fewer renewable energy certificates. If our efforts to reduce emissions do not take hold, there is a risk that we might not meet our year-end emissions target of 460 kilotons. Comparator amounts contain SuccessFactors numbers on a pro rata basis with effect from February 21, 2012. Ariba and hybris numbers are not included – Ariba was acquired on October 1, 2012; hybris was acquired on August 1, 2013.
As we measure our emissions per employee and per euro of revenue, we gain insight into our efficiency as we grow. Since 2007, we have
increased our efficiency according to both measures, lowering our emissions per employee by about 28% and per euro of revenue by about 42% at the end of September 2013 (rolling four quarters).
We calculated that, since the beginning of 2008, SAP has achieved a€250 million cost avoidance compared to a business-as-usual scenario, thanks to energy saving and emission reduction initiatives that led to an overall reduction of emissions by 10% (rolling four quarters).
In the third quarter, SAP released an analytic solution based on SAP HANA designed to help manufacturers gain greater insight into energy costs and emissions – and then integrate this insight into their business processes to drive improved performance.
In recognition of the exemplary actions SAP has taken to embed sustainability across its business worldwide, SAP has been ranked the most sustainable software and services company in the Dow Jones Sustainability Index for the seventh consecutive year. We were also included in the Carbon Disclosure Project’s (CDP) Global 500 Climate Disclosure and Performance Leadership Indexes.
| | |
| 20 | | INTERIM MANAGEMENT REPORT |
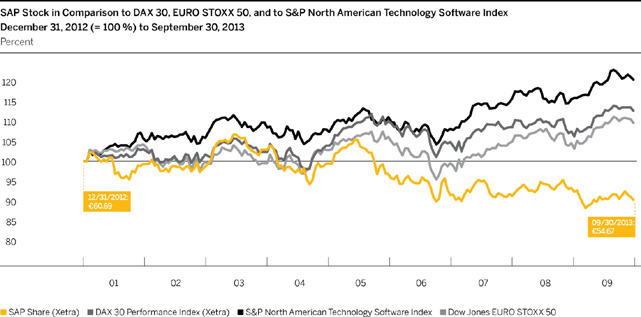
SAP STOCK
SAP AG common stock is listed on the Frankfurt Stock Exchange as well as on a number of other German exchanges. On the New York Stock Exchange (NYSE), SAP American depositary receipts (ADRs), each representing one common share, trade under the symbol SAP. SAP is a component of the DAX (the index of 30 German blue chip companies), the Dow Jones EURO STOXX 50, and the S&P North American Technology Software Index.
Key Facts About SAP Stock / SAP ADRs
| | | | |
Listings | | | | |
Germany | | | Berlin, Frankfurt, Stuttgart | |
United States (ADR) | | | New York Stock Exchange | |
IDs and Symbols | | | | |
WKN/ISIN | | | 716460/DE0007164600 | |
NYSE (ADR) | | | 803054204 (CUSIP) | |
Reuters | | | SAPG.F or .DE | |
Bloomberg | | | SAP GR | |
Weight (%) in Indices at
9/30/2013 | | | | |
DAX 30 | | | 6.81% | |
Prime All Share | | | 5.38% | |
CDAX | | | 5.52% | |
HDAX | | | 5.64% | |
Dow Jones STOXX 50 | | | 1.72% | |
Dow Jones EURO STOXX 50 | | | 2.90% | |
SAP stock declined by 9.9% in the first nine months, while the two major benchmark indices improved: The DAX 30 increased by 12.9% and the EURO STOXX 50 by 9.8%. In the third quarter of 2013, the SAP share price fell 2.8%, whereas the
generally positive market led to an increase in the DAX 30 and EURO STOXX 50, gaining 8.0% and 11.2% respectively.
SAP stock started the quarter with the Xetra closing price of€56.26 on June 30, and developed more or less on a par with the market as a whole in July before falling back to€55.12 on July 23. On July 18, SAP published its second quarter results and communicated the Company’s adjusted revenue outlook for the full year 2013. In July, the SAP Supervisory Board resolved to propose that SAP’s departing co-CEO Jim Hagemann Snabe be elected to the SAP Supervisory Board at the Annual General Meeting of Shareholders in May 2014. In August, the SAP stock traded between€55.82 and€57.80, in a market dampened by concern over the crisis in Syria and uncertainty whether the U.S. Federal Reserve would continue its ultra-loose monetary policy.
The after-effects of SAP’s adjusted revenue outlook, coupled with a general reluctance to invest in the software sector, put additional pressure on SAP stock in September, pushing it down to its year low of€53.42 on September 5. The U.S. Federal Reserve’s surprise announcement that it would continue its liberal fiscal policy, helped the SAP share price recover to€55.60 on September 19, amidst a positive market environment that saw the DAX 30 reach an all-time high of 8,694.18 points. Yet the domestic budget dispute in the United States and the political situation in Italy weighed on global share prices at the end of September again, causing SAP stock to close the quarter at€54.67.
| | |
| INTERIM REPORT JANUARY – SEPTEMBER 2013 | | 21 |
Capital Stock
SAP’s capital stock on September 30, 2013, was€1,228,504,232 (December 31, 2012:€1,228,504,232). It is issued as 1,228,504,232 no-par shares, each with an attributable value of€1 in relation to the capital stock.
Free Float
On September 30, 2013, the proportion of our stock in free float, applying the definition accepted on the Frankfurt Stock Exchange – which excludes treasury stock from the free float – stood at 74.5% (December 31, 2012: 74.4%).
Market Capitalization
With the Xetra closing price at€54.67 on the last trading day in the third quarter, SAP’s market capitalization was€67.2 billion based on 1,228,504,232 million outstanding shares. SAP was therefore the third largest DAX company based on market capitalization.
Deutsche Börse uses the free-float factor to weight companies in the DAX. The free-float factor for SAP was 74.5% on the last trading day in the third quarter, resulting in a free-float market capitalization of approximately€50.0 billion. When measured by its free-float market capitalization, SAP was the sixth-largest company listed on the DAX at the end of the quarter.
For more information about SAP common stock, see the SAP Web site at www.sap.com/investor.
RISK AND OPPORTUNITY MANAGEMENT
We have comprehensive risk-management structures in place, which are intended to enable us to recognize and analyze risks early and to take the appropriate action. For changes in our legal liability risks since our last annual report, see Note 14 in the Notes to the Interim Financial Statements. The other risk factors remain largely unchanged since 2012, and are discussed more fully in our 2012 Integrated Report and our Annual Report on Form 20-F for 2012. We do not believe the risks we have identified jeopardize our ability to continue as a going concern. Opportunities also remain largely unchanged since 2012.
SUPPLEMENTARY REPORT
In October 2013, the Supervisory Board of SAP AG has appointed Luka Mucic as Chief Financial Officer of SAP AG, effective July 1, 2014. Luka Mucic is the successor of Werner Brandt, who will, as planned, withdraw from the Executive Board by that time. For more information, see the Organization and Changes in Management section.
OUTLOOK
Future Trends in the Global Economy
In its current monthly report, the European Central Bank (ECB) predicts that the global economy will gradually pick up speed by the end of 2013. According to IDC, however, economies are
| | |
| 22 | | INTERIM MANAGEMENT REPORT |
expected to develop regionally very differently: Growth prospects will improve slightly, but remain at low levels for key industrialized countries, while emerging nations are expected to slow down. The ECB believes emerging economies will nevertheless continue to outperform industrialized economies.
In the EMEA region, the ECB predicts the euro area economy will slowly improve in the fourth quarter of 2013, albeit with a slight decline in gross domestic product (GDP) for the full year 2013. The ECB anticipates that GDP will not see growth again until 2014, when it’s expected to expand around one percent. The other countries in the region will likewise see some new economic momentum by the end of the year, ECB says. It also forecasts a faster economic recovery in the Americas region, but notes that it is still unclear as to how the American financial sector will develop and thus impact the economy in the upcoming months. In the APJ region, Japan’s economy is expected to grow at low single-digit rates for the remainder of the year. Asia’s emerging markets, on the other hand, are expected to accelerate in the near future, and China’s economy will also get back on track, ECB reports.
Economic Trends – Year-Over-Year GDP Growth
| | | | | | | | | | | | |
| % | | | | | | | | | |
| World | | 2012e | | | 2013p | | | 2014p | |
World | | | 3.2 | | | | 2.9 | | | | 3.6 | |
Advanced economies | | | 1.5 | | | | 1.2 | | | | 2.0 | |
Developing and emerging economies | | | 4.9 | | | | 4.5 | | | | 5.1 | |
Europe, the Middle East, and Africa (EMEA) | | | | | |
European Union | | | – 0.3 | | | | 0.0 | | | | 1.3 | |
Euro area | | | – 0.6 | | | | – 0.4 | | | | 1.0 | |
Germany | | | 0.9 | | | | 0.5 | | | | 1.4 | |
Central and Eastern Europe | | | 1,.4 | | | | 2.3 | | | | 2.7 | |
Middle East and North Africa | | | 4.6 | | | | 2.1 | | | | 3.8 | |
Sub-Saharan Africa | | | 4.9 | | | | 5.0 | | | | 6.0 | |
Americas | | | | | | | | | | | | |
United States | | | 2.8 | | | | 1.6 | | | | 2.6 | |
Canada | | | 1.7 | | | | 1.6 | | | | 2.2 | |
Central and South America, Caribbean | | | 2.9 | | | | 2.7 | | | | 3.1 | |
Asia Pacific Japan | | | | | | | | | | | | |
Asian developing economies | | | 6.4 | | | | 6.3 | | | | 6.5 | |
Japan | | | 2.0 | | | | 2.0 | | | | 1.2 | |
China | | | 7.7 | | | | 7.6 | | | | 7.3 | |
e = Estimate; p = Projection
Source: Internationaler Währungsfonds (IWF), World Economic Outlook October 2013, Transitions and Tensions, p. 2.
Future Trends in the IT Market
International Data Corporation (IDC), a market research firm based in the United States, marginally reduced its full-year outlook for global IT sales growth. Yet it still anticipates growth rates in the mid-single-digit range, which is significantly above the global economic trend. Sales of smartphones and tablets will continue to be the driving force behind the global IT market as the year progresses, IDC adds. It expects the software segment – which includes packaged software as well as application software – will continue to grow in the mid-single digits range. For the hardware segment and the services segment, lower growth rates are expected for the full-year compared to three months ago. In addition, the institute predicts that the SaaS software segment will continue to take over market share from the services segment, which is, however, anticipated to have a slightly higher growth rate in 2013 than in 2012.
Experts rate the growth prospects in the EMEA region for the remainder of 2013 as more restrained compared to the outlook three months ago. The IT market in the Americas region,on the other hand, is expected to improve marginally, which IDC attributes to the booming smartphone and tablet market in the United States. The IT market in the APJ region, meanwhile, will continue to be shaped by the slower growth of the Chinese IT market, and although it is expected to expand faster than the Chinese economy as a whole, growth will remain under 10%. Against this backdrop, IDC predicts a slight downturn for the Japanese IT market.
| | |
| INTERIM REPORT JANUARY – SEPTEMBER 2013 | | 23 |
Trends in the IT Market –
Increased IT Spending Year-Over-Year
| | | | | | | | | | | | |
| % | | | | | | | | | |
| World | | 2012e | | | 2013p | | | 2014p | |
Total IT | | | 5.9 | | | | 4.6 | | | | 4.9 | |
Hardware | | | 7.5 | | | | 5.0 | | | | 5.0 | |
Packaged software | | | 6.2 | | | | 5.5 | | | | 6.2 | |
Applications | | | 6.0 | | | | 5.6 | | | | 6.0 | |
IT services | | | 3.2 | | | | 3.3 | | | | 3.9 | |
Europe, Middle East, Africa (EMEA) | | | | | | | | | | | | |
IT total | | | 5.2 | | | | 2.9 | | | | 4.2 | |
Packaged software | | | 4.7 | | | | 4.5 | | | | 5.3 | |
Applications | | | 4.4 | | | | 4.4 | | | | 5.0 | |
IT services | | | 1.2 | | | | 1.9 | | | | 3.5 | |
Americas | | | | | | | | | | | | |
IT total | | | 4.2 | | | | 5.7 | | | | 5.3 | |
Packaged software | | | 6.8 | | | | 6.0 | | | | 6.7 | |
Applications | | | 6.9 | | | | 6.2 | | | | 6.5 | |
IT services | | | 4.2 | | | | 3.7 | | | | 3.7 | |
Asia Pacific Japan | | | | | | | | | | | | |
IT total | | | 9.0 | | | | 4.7 | | | | 6.6 | |
Packaged software | | | 6.9 | | | | 5.9 | | | | 6.4 | |
Applications | | | 6.0 | | | | 5.7 | | | | 6.4 | |
IT services | | | 4.7 | | | | 5.1 | | | | 5.4 | |
e = Estimate, p = Projection
source: IDC Worldwide Black Book Q2 2013
Impact on SAP
The world is being transformed by the rapid adoption of cloud and in-memory technologies, and this trend became very prominent over the past quarter. Companies are shifting their investments to the cloud and radically simplifying their IT landscape on in-memory technology. In 2010, SAP embarked on a strategy of innovation – in cloud, in-memory, and mobile, all on a stable and consistent core (On Premise). This foresight is now paying off and we are driving this next evolution of the software industry.
As long as they develop as currently forecast, SAP expects to outperform the global economy and IT industry for the remainder of 2013 even though we adjusted our goals for 2013 with our second quarter results announcement. We are confident we can achieve this thanks to our five innovative market categories Applications, Analytics, Mobile, Cloud, and Database and Technology, which give us a competitive edge even in difficult economic environments. In addition, we benefit from our established innovation strategy and clear customer focus in more than 180 countries and 25 industries.
We will continue to invest in countries in which we expect significant growth, such as Brazil, China, India, Russia, and countries in the Middle East and Africa. As such, we see sufficient growth potential, and expect to reach our goals for 2013 as well as our mid-term goals for 2015. For more information, see the Operational Targets for 2013 (non-IFRS) section.
Forecast for SAP
Operational Targets for 2013 (Non-IFRS)
Revenue and Operating Profit Outlook
SAP reiterates the outlook for the full year 2013, which remains unchanged from the outlook provided on July 18, 2013:
The Company expects full year 2013 non-IFRS software and software-related service revenue to increase by at least 10% at constant currencies (2012:€13.25 billion).
The Company expects full year 2013 non-IFRS cloud subscription and support revenue of around€750 million at constant currencies (2012:€343 million)
The Company expects full year 2013 SAP HANA software revenue in a range of€650 –€700 million (2012:€392 million).
The Company expects full-year 2013 non-IFRS operating profit to be in a range of€5.85 billion –€5.95 billion at constant currencies (2012:€5.21 billion).
The Company projects a full-year 2013 IFRS effective tax rate of 24.0% – 25.0% (2012: 26.2%) and a non-IFRS effective tax rate of 25.5% – 26.5% (2012: 27.5%).
If exchange rates remain at the September 2013 level for the rest of the year, the Company expects both the fourth-quarter and full-year 2013 non-IFRS software and software-related service revenue growth rate to be negatively impacted by approximately 5 percentage points from currency and the fourth-quarter and full-year 2013 non-IFRS operating profit growth rate to be negatively impacted by approximately 7 percentage points from currency.
We expect our professional services and other service revenue to decline slightly in 2013 on a constant currency basis. Taking currency effects into account, we also expect to see a slight decline
| | |
| 24 | | INTERIM MANAGEMENT REPORT |
in professional services and other service revenue. We therefore predict that the increase in total revenue in 2013 will be influenced by the expected growth in software and software-related service revenue.
We expect that total revenue (non-IFRS) will continue to depend largely on the revenues from the On-Premise Products segment. In light of the above expectations for professional services and other service revenue, we therefore expect a decline in the On-Premise Services segment.
Since the revenue from Ariba was first consolidated and included in the Cloud Division (comprised of the Cloud Applications and Ariba segments) at the start of the fourth quarter 2012, a particularly strong growth result is expected in this segment.
We expect an increase in segment profit in our On-Premise division with the On-Premise Products segment profit growing faster than the On-Premise Services segment, for which we expect a decline in segment results as compared to 2012. The Cloud division is expected to achieve, for the first time, a positive segment profit resulting from a reduced segment loss in the Cloud Applications segment and a strong increase in the Ariba segment profit.
Total cloud revenue is expected to approach€1 billion in 2013.
Differences Between IFRS and
Non-IFRS Measures
As noted above, our guidance is based on non-IFRS measures at constant currencies. The following provides additional insight into the impact of the constant currency notion and the items by which our IFRS measures and non-IFRS measures differ.
The following amounts represent estimates for 2013 and a comparison of the actual differences between IFRS and non-IFRS measures on operating profit for the first nine months of 2013 and 2012:
Non-IFRS Measures
| | | | | | | | | | | | |
| (€ millions) | | Estimated
amounts for
1/1 –
12/31/20131) | | | Actual
Amounts
from 1/1 –
9/30/2013 | | | Actual
Amounts
from 1/1 –
9/30/2012 | |
| Deferred revenue write-down | |
| Between 85
and 95 |
| | | 76 | | | | 43 | |
| Discontinued activities2) | | | < 10 | | | | 0 | | | | 1 | |
Share-based payment
expenses3),4) | |
| Between 300
and 340 |
| | | 192 | | | | 333 | |
| Acquisition-related charges5) | |
| Between 560
and 600 |
| | | 424 | | | | 387 | |
| Restructuring | |
| Between 50
and 70 |
| | | 47 | | | | 8 | |
1)All adjusting items are partly incurred in currencies other than the euro. Consequently, the amounts are subject to currency volatility. All estimates for 2013 provided in the table are at actual currency and are calculated based on certain assumptions regarding the developments of the different currency exchange rates. Depending on the future development of these exchange rates, the total amounts for 2013 may differ significantly from the estimates provided in the table above. The reader should remember that SAP’s outlook is based on constant currency.
2)We will consider all new information that emerges from further developments of the TomorrowNow lawsuit to determine if the provision should be adjusted in the future, which could result in a change to the estimate provided in the table above.
3) Our share-based payment expenses are subject, among other factors, to share price volatility, volatility in SAP’s performance against the Tech PGI index, anticipated achievement of financial KPI objectives, and fluctuations in SAP’s workforce. The estimates in the table above are based on certain assumptions regarding these factors. Depending on how these factors change in the future, the total expense for 2013 may differ significantly from these estimates.
4)The estimates provided above for share-based compensation expenses include grants under existing programs. New share-based compensation plans or changes to the existing plans may make the total amounts for 2013 differ significantly from these estimates.
5)The estimates provided above for acquisition-related charges are based on the acquisitions performed by SAP until the day of this document. Further acquisitions may make the total amounts for 2013 differ significantly from these estimates.
Goals for Liquidity, Finance, Investments, and Dividends
Our goals for liquidity, finance, investments, and dividends as discussed in our 2012 Integrated Report have changed as follows:
On September 30, 2013, we had a negative net liquidity. We believe that our liquid assets combined with our undrawn credit facilities are sufficient to meet our present operating financing needs in 2013 and, together with expected cash flows from operations, will support our currently planned capital expenditure requirements over the near term and medium term. We intend to reduce our
| | |
| INTERIM REPORT JANUARY – SEPTEMBER 2013 | | 25 |
financial debt as and when the debt falls due. We will consider issuing new debt, such as bonds or U.S. private placements, on an as-needed basis only and if market conditions are advantageous. We currently have no concrete plans for future share buybacks.
Excepting acquisitions, our planned capital expenditures for 2013 and 2014 can be covered in full by operating cash flow and will chiefly be spent on increasing data center capacity in our locations in Newtown Square (United States) and St. Leon-Rot (Germany). New buildings are planned in Potsdam (Germany), Bangalore (India), São Leopoldo (Brazil), and Ra’anana (Israel). We also plan to renovate and expand our office buildings in Vancouver (Canada), London (UK), Paris (France), Madrid (Spain), Stockholm (Sweden), Peking (China), and Palo Alto (United States).
The first two SAP Innovation Centers were opened in the third quarter of 2013 in Potsdam (Germany) and Nanjing (China).
As part of our growth and innovation strategy, we plan to spend around US$2 billion in China by 2015. This demonstrates our long-term strategic commitment to China, the world’s second-largest economy. SAP also continues to invest and increase its presence and market share in countries experiencing high growth.
We plan to continue our dividend policy, which is that the payout ratio should be more than 30%.
Premises on Which Our Outlook Is Based
In preparing our outlook guidance, we have taken into account all events known to us at the time we prepared this report that could influence SAP’s business going forward. Among the premises on which this outlook is based are those presented concerning economic development. This outlook does not take into consideration any effects in 2013 from major acquisitions except that of hybris.
Medium-Term Prospects
Our medium-term prospects as discussed in our 2012 Integrated Report and our 2012 Annual Report on Form 20-F did not change in the first nine months of 2013. We still aim to increase our total revenue to more than€20 billion by 2015. In the same period, we aim to widen our non-IFRS operating margin to 35%. To achieve these goals, we want to further strengthen our position in our five market categories and have one billion users by 2015.
| – | We want to extend our leadership in the applications segment. |
| – | We want to extend our market share in analytics. |
| – | We want to extend our leadership in mobile computing. |
| – | We want to become a profitable market leader in cloud computing, generating around€2 billion total revenue in this segment by 2015. |
Our plan is for indirect sales (partner revenue) to contribute up to 40% of software revenue by 2015.
| | |
| 26 | | INTERIM MANAGEMENT REPORT |
CONSOLIDATED INTERIM FINANCIAL STATEMENTS – IFRS
(Unaudited)
NOTES TO THE CONSOLIDATED INTERIM FINANCIAL STATEMENTS
| | |
| INTERIM REPORT JANUARY – SEPTEMBER 2013 | | 27 |
CONSOLIDATED INCOME STATEMENTS
For the three months ended September 30
| | | | | | | | | | | | | | |
| € millions, unless otherwise stated | | Note | | 2013 | | | 2012 | | | Change in % | |
Software | | | | | 975 | | | | 1,026 | | | | –5 | |
Cloud subscriptions and support | | | | | 191 | | | | 63 | | | | 203 | |
Software and cloud subscriptions | | | | | 1,167 | | | | 1,089 | | | | 7 | |
Support | | | | | 2,184 | | | | 2,105 | | | | 4 | |
Software and software-related service revenue | | | | | 3,351 | | | | 3,194 | | | | 5 | |
Consulting | | | | | 553 | | | | 616 | | | | –10 | |
Other services | | | | | 142 | | | | 142 | | | | 0 | |
Professional services and other service revenue | | | | | 695 | | | | 758 | | | | –8 | |
| Total revenue | | | | | 4,045 | | | | 3,952 | | | | 2 | |
| | | | | | | | | | | | | | | |
Cost of software and software-related services | | | | | –636 | | | | –638 | | | | 0 | |
Cost of professional services and other services | | | | | –605 | | | | –619 | | | | –2 | |
Total cost of revenue | | | | | –1,241 | | | | –1,257 | | | | –1 | |
Gross profit | | | | | 2,804 | | | | 2,695 | | | | 4 | |
Research and development | | | | | –552 | | | | –547 | | | | 1 | |
Sales and marketing | | | | | –986 | | | | –984 | | | | 0 | |
General and administration | | | | | –207 | | | | –232 | | | | –11 | |
Restructuring | | | | | –17 | | | | –4 | | | | >100 | |
TomorrowNow litigation | | | | | 0 | | | | –7 | | | | <-100 | |
Other operating income/expense, net | | | | | 0 | | | | 0 | | | | 19 | |
| Total operating expenses | | | | | –3,003 | | | | –3,031 | | | | –1 | |
| Operating profit | | | | | 1,043 | | | | 921 | | | | 13 | |
| | | | | | | | | | | | | | | |
| Other non-operating income/expense, net | | | | | –1 | | | | –92 | | | | –99 | |
Finance income | | | | | 38 | | | | 34 | | | | 13 | |
Finance costs | | | | | –45 | | | | –41 | | | | 11 | |
| Financial income, net | | | | | –7 | | | | –7 | | | | 1 | |
| Profit before tax | | | | | 1,035 | | | | 822 | | | | 26 | |
| | | | | | | | | | | | | | | |
Income tax expense | | (6) | | | –274 | | | | –204 | | | | 34 | |
| Profit after tax | | | | | 762 | | | | 618 | | | | 23 | |
Profit attributable to non-controlling interests | | | | | 0 | | | | 0 | | | | N/A | |
Profit attributable to owners of parent | | | | | 762 | | | | 618 | | | | 23 | |
| | | | | | | | | | | | | | | |
| Earnings per share, basic (in€)* | | (7) | | | 0.64 | | | | 0.52 | | | | 23 | |
| Earnings per share, diluted (in€)* | | (7) | | | 0.64 | | | | 0.52 | | | | 23 | |
* For the three months ended September 30, 2013 and 2012, the weighted average number of shares was 1,193 million (diluted 1,195 million) and 1,192 million (diluted: 1,193 million), respectively (treasury stock excluded).
| | |
| 28 | | CONSOLIDATED INTERIM FINANCIAL STATEMENTS – IFRS |
CONSOLIDATED STATEMENTS OF COMPREHENSIVE INCOME
For the three months ended September 30
| | | | | | | | |
| € millions | | 2013 | | | 2012 | |
| Profit after tax | | | 762 | | | | 618 | |
| Items that will not be reclassified to profit and loss | | | | | | | | |
Remeasurements on defined benefit pension plans | | | 0 | | | | 1 | |
Income tax relating to items that will not be reclassified | | | 3 | | | | 0 | |
| Other comprehensive income after tax for items that will not be reclassified to profit and loss | | | 3 | | | | 1 | |
| Items that will be reclassified subsequently to profit and loss | | | | | | | | |
Exchange differences on translation | | | –255 | | | | –112 | |
Available-for-sale financial assets | | | –2 | | | | –15 | |
Cash flow hedges | | | –21 | | | | 20 | |
Income tax relating to items that will be reclassified | | | –1 | | | | –9 | |
| Other comprehensive income after tax for items that will be reclassified to profit and loss | | | –279 | | | | –116 | |
| Other comprehensive income net of tax | | | –276 | | | | –115 | |
| Total comprehensive income | | | 486 | | | | 503 | |
– Attributable to owners of parent | | | 486 | | | | 503 | |
– Attributable to non-controlling interests | | | 0 | | | | 0 | |
| | |
| INTERIM REPORT JANUARY – SEPTEMBER 2013 | | 29 |
CONSOLIDATED INCOME STATEMENTS
For the nine months ended September 30
| | | | | | | | | | | | | | |
| € millions, unless otherwise stated | | Note | | 2013 | | | 2012 | | | Change in % | |
Software | | | | | 2,614 | | | | 2,722 | | | | –4 | |
Cloud subscriptions and support | | | | | 488 | | | | 144 | | | | 238 | |
Software and cloud subscriptions | | | | | 3,101 | | | | 2,866 | | | | 8 | |
Support | | | | | 6,470 | | | | 6,071 | | | | 7 | |
Software and software-related service revenue | | | | | 9,571 | | | | 8,937 | | | | 7 | |
Consulting | | | | | 1,689 | | | | 1,830 | | | | –8 | |
Other services | | | | | 448 | | | | 433 | | | | 3 | |
Professional services and other service revenue | | | | | 2,137 | | | | 2,263 | | | | –6 | |
| Total revenue | | | | | 11,708 | | | | 11,200 | | | | 5 | |
| | | | | | | | | | | | | | | |
Cost of software and software-related services | | | | | –1,838 | | | | –1,743 | | | | 5 | |
Cost of professional services and other services | | | | | –1,820 | | | | –1,888 | | | | –4 | |
Total cost of revenue | | | | | –3,658 | | | | –3,631 | | | | 1 | |
Gross profit | | | | | 8,050 | | | | 7,569 | | | | 6 | |
Research and development | | | | | –1,676 | | | | –1,638 | | | | 2 | |
Sales and marketing | | | | | –3,021 | | | | –2,786 | | | | 8 | |
General and administration | | | | | –635 | | | | –664 | | | | –4 | |
Restructuring | | | | | –47 | | | | –8 | | | | >100 | |
TomorrowNow litigation | | | | | 0 | | | | –1 | | | | <-100 | |
Other operating income/expense, net | | | | | 6 | | | | 1 | | | | >100 | |
| Total operating expenses | | | | | –9,031 | | | | –8,727 | | | | 3 | |
| Operating profit | | | | | 2,677 | | | | 2,473 | | | | 8 | |
| | | | | | | | | | | | | | | |
| Other non-operating income/expense, net | | | | | –14 | | | | –145 | | | | –91 | |
Finance income | | | | | 94 | | | | 86 | | | | 10 | |
Finance costs | | | | | –138 | | | | –119 | | | | 16 | |
| Financial income, net | | | | | –44 | | | | –33 | | | | 33 | |
| Profit before tax | | | | | 2,620 | | | | 2,295 | | | | 14 | |
| | | | | | | | | | | | | | | |
Income tax expense | | (6) | | | –614 | | | | –572 | | | | 7 | |
| Profit after tax | | | | | 2,006 | | | | 1,723 | | | | 16 | |
Profit attributable to non-controlling interests | | | | | 0 | | | | 0 | | | | N/A | |
Profit attributable to owners of parent | | | | | 2,006 | | | | 1,723 | | | | 16 | |
| | | | | | | | | | | | | | | |
| Earnings per share, basic (in€)* | | (7) | | | 1.68 | | | | 1.45 | | | | 16 | |
| Earnings per share, diluted (in€)* | | (7) | | | 1.68 | | | | 1.45 | | | | 16 | |
* For the nine months ended September 30, 2013 and 2012, the weighted average number of shares was 1,193 million (diluted 1,195 million) and 1,191 million (diluted: 1,192 million), respectively (treasury stock excluded).
Due to rounding, numbers may not add up precisely.
| | |
| 30 | | CONSOLIDATED INTERIM FINANCIAL STATEMENTS – IFRS |
CONSOLIDATED STATEMENTS OF COMPREHENSIVE INCOME
For the nine months ended September 30
| | | | | | | | |
| € millions | | 2013 | | | 2012 | |
| Profit after tax | | | 2,006 | | | | 1,723 | |
| Items that will not be reclassified to profit and loss | | | | | | | | |
Remeasurements on defined benefit pension plans | | | 3 | | | | –2 | |
Income tax relating to items that will not be reclassified | | | 0 | | | | 1 | |
| Other comprehensive income after tax for items that will not be reclassified to profit and loss | | | 3 | | | | –1 | |
| Items that will be reclassified subsequently to profit and loss | | | | | | | | |
Exchange differences on translation | | | –345 | | | | 59 | |
Available-for-sale financial assets | | | 3 | | | | 18 | |
Cash flow hedges | | | –3 | | | | 26 | |
Income tax relating to items that will be reclassified | | | –3 | | | | –5 | |
| Other comprehensive income after tax for items that will be reclassified to profit and loss | | | –348 | | | | 98 | |
Other comprehensive income net of tax | | | –345 | | | | 97 | |
| Total comprehensive income | | | 1,661 | | | | 1,820 | |
– Attributable to owners of parent | | | 1,661 | | | | 1,820 | |
– Attributable to non-controlling interests | | | 0 | | | | 0 | |
| | |
| INTERIM REPORT JANUARY – SEPTEMBER 2013 | | 31 |
CONSOLIDATED STATEMENTS OF FINANCIAL POSITION
As at September 30, 2013, and December 31, 2012
| | | | | | | | | | |
| € millions | | Notes | | 2013 | | | 2012 | |
Cash and cash equivalents | | | | | 3,255 | | | | 2,477 | |
Other financial assets | | (8) | | | 221 | | | | 154 | |
Trade and other receivables | | (9) | | | 3,052 | | | | 3,917 | |
Other non-financial assets | | | | | 413 | | | | 294 | |
Tax assets | | | | | 256 | | | | 156 | |
Total current assets | | | | | 7,197 | | | | 6,998 | |
Goodwill | | | | | 13,876 | | | | 13,227 | |
Intangible assets | | | | | 3,108 | | | | 3,234 | |
Property, plant, and equipment | | | | | 1,771 | | | | 1,708 | |
Other financial assets | | (8) | | | 524 | | | | 509 | |
Trade and other receivables | | (9) | | | 81 | | | | 88 | |
Other non-financial assets | | | | | 90 | | | | 68 | |
Tax assets | | | | | 192 | | | | 170 | |
Deferred tax assets | | | | | 693 | | | | 708 | |
Total non-current assets | | | | | 20,336 | | | | 19,711 | |
| Total assets | | | | | 27,534 | | | | 26,710 | |
| | |
| 32 | | CONSOLIDATED INTERIM FINANCIAL STATEMENTS – IFRS |
| | | | | | | | | | |
| € millions | | Notes | | 2013 | | | 2012 | |
Trade and other payables | | | | | 793 | | | | 870 | |
Tax liabilities | | | | | 374 | | | | 511 | |
Financial liabilities | | (10) | | | 1,748 | | | | 802 | |
Other non-financial liabilities | | | | | 1,697 | | | | 2,136 | |
Provision TomorrowNow litigation | | | | | 227 | | | | 234 | |
Other provisions | | | | | 357 | | | | 609 | |
Provisions | | | | | 584 | | | | 843 | |
Deferred income | | (11) | | | 2,235 | | | | 1,386 | |
Total current liabilities | | | | | 7,431 | | | | 6,547 | |
Trade and other payables | | | | | 45 | | | | 63 | |
Tax liabilities | | | | | 387 | | | | 388 | |
Financial liabilities | | (10) | | | 3,799 | | | | 4,446 | |
Other non-financial liabilities | | | | | 108 | | | | 98 | |
Provisions | | | | | 277 | | | | 361 | |
Deferred tax liabilities | | | | | 506 | | | | 574 | |
Deferred income | | (11) | | | 64 | | | | 62 | |
Total non-current liabilities | | | | | 5,186 | | | | 5,991 | |
Total liabilities | | | | | 12,618 | | | | 12,538 | |
Issued capital | | | | | 1,229 | | | | 1,229 | |
Share premium | | | | | 532 | | | | 492 | |
Retained earnings | | | | | 14,973 | | | | 13,973 | |
Other components of equity | | | | | –542 | | | | –194 | |
Treasury shares | | | | | –1,284 | | | | –1,337 | |
Equity attributable to owners of parent | | | | | 14,907 | | | | 14,163 | |
Non-controlling interests | | | | | 9 | | | | 8 | |
Total equity | | (12) | | | 14,916 | | | | 14,171 | |
| Equity and liabilities | | | | | 27,534 | | | | 26,710 | |
| | |
| INTERIM REPORT JANUARY – SEPTEMBER 2013 | | 33 |
CONSOLIDATED STATEMENTS OF CHANGES IN EQUITY
For the nine months ended September 30
| | | | | | | | | | | | | | | | | | | | | | | | | | | | | | | | | | | | | | | | |
| € millions | | Equity Attributable to Owners of Parent | | | Non- Controlling
Interests | | | Total
Equity | |
| | | Issued
Capital | | | Share
Premium | | | Retained
Earnings | | | Other Components of Equity | | | Treasury
Shares | | | Total | | | | | | | |
| | | | | | | | | | | | Exchange
Diffe- rences | | | Available-
for-Sale
Financial
Assets | | | Cash Flow
Hedges | | | | | | | | | | | | | |
| 1/1/2012 | | | 1,228 | | | | 419 | | | | 12,466 | | | | –19 | | | | 9 | | | | –27 | | | | –1,377 | | | | 12,699 | | | | 8 | | | | 12,707 | |
| Profit after tax | | | | | | | | | | | 1,723 | | | | | | | | | | | | | | | | | | | | 1,723 | | | | | | | | 1,723 | |
| Other comprehensive income | | | | | | | | | | | –1 | | | | 61 | | | | 18 | | | | 19 | | | | | | | | 97 | | | | | | | | 97 | |
| Comprehensive income | | | | | | | | | | | 1,722 | | | | 61 | | | | 18 | | | | 19 | | | | | | | | 1,820 | | | | | | | | 1,820 | |
| Share-based payments | | | | | | | 25 | | | | | | | | | | | | | | | | | | | | | | | | 25 | | | | | | | | 25 | |
| Dividends | | | | | | | | | | | –1,310 | | | | | | | | | | | | | | | | | | | | –1,310 | | | | | | | | –1,310 | |
| Issuance of shares under share-based payments | | | | | | | 10 | | | | | | | | | | | | | | | | | | | | | | | | 10 | | | | | | | | 10 | |
| Purchase of treasury shares | | | | | | | | | | | | | | | | | | | | | | | | | | | –53 | | | | –53 | | | | | | | | –53 | |
| Reissuance of treasury shares under share-based payments | | | | | | | 17 | | | | | | | | | | | | | | | | | | | | 90 | | | | 107 | | | | | | | | 107 | |
| Other changes | | | | | | | | | | | 2 | | | | | | | | | | | | | | | | | | | | 2 | | | | 1 | | | | 3 | |
| 9/30/2012 | | | 1,228 | | | | 471 | | | | 12,880 | | | | 42 | | | | 27 | | | | –8 | | | | –1,340 | | | | 13,300 | | | | 9 | | | | 13,309 | |
| | | | | | | | | | | | | | | | | | | | | | | | | | | | | | | | | | | | | | | | | |
| 1/1/2013 | | | 1,229 | | | | 492 | | | | 13,973 | | | | –236 | | | | 22 | | | | 20 | | | | –1,337 | | | | 14,163 | | | | 8 | | | | 14,171 | |
| Profit after tax | | | | | | | | | | | 2,006 | | | | | | | | | | | | | | | | | | | | 2,006 | | | | | | | | 2,006 | |
| Other comprehensive income | | | | | | | | | | | 3 | | | | –349 | | | | 3 | | | | –2 | | | | | | | | –345 | | | | | | | | –345 | |
| Comprehensive income | | | | | | | | | | | 2,009 | | | | –349 | | | | 3 | | | | –2 | | | | | | | | 1,661 | | | | | | | | 1,661 | |
| Share-based payments | | | | | | | 12 | | | | | | | | | | | | | | | | | | | | | | | | 12 | | | | | | | | 12 | |
| Dividends | | | | | | | | | | | –1,013 | | | | | | | | | | | | | | | | | | | | –1,013 | | | | | | | | –1,013 | |
| Reissuance of treasury shares under share-based payments | | | | | | | 27 | | | | | | | | | | | | | | | | | | | | 53 | | | | 80 | | | | | | | | 80 | |
| Other changes | | | | | | | | | | | 4 | | | | | | | | | | | | | | | | | | | | 4 | | | | 1 | | | | 5 | |
| 9/30/2013 | | | 1,229 | | | | 532 | | | | 14,973 | | | | –585 | | | | 25 | | | | 18 | | | | –1,284 | | | | 14,907 | | | | 9 | | | | 14,916 | |
| | |
| 34 | | CONSOLIDATED INTERIM FINANCIAL STATEMENTS – IFRS |
CONSOLIDATED STATEMENTS OF CASH FLOWS
For the nine months ended September 30
| | | | | | | | |
| € millions | | 2013 | | | 2012 | |
| Profit after tax | | | 2,006 | | | | 1,723 | |
| Adjustments to reconcile profit after taxes to net cash provided by operating activities: | | | | | | | | |
Depreciation and amortization | | | 714 | | | | 622 | |
Income tax expense | | | 614 | | | | 572 | |
Financial income, net | | | 44 | | | | 33 | |
Decrease/increase in sales and bad debt allowances on trade receivables | | | 44 | | | | 18 | |
Other adjustments for non-cash items | | | 64 | | | | 28 | |
Decrease/increase in trade and other receivables | | | 766 | | | | 588 | |
Decrease/increase in other assets | | | –180 | | | | –109 | |
Decrease/increase in trade payables, provisions, and other liabilities | | | –856 | | | | –345 | |
Decrease/increase in deferred income | | | 898 | | | | 820 | |
| Cash outflows due to TomorrowNow litigation | | | –1 | | | | –8 | |
| Interest paid | | | –101 | | | | –135 | |
| Interest received | | | 50 | | | | 67 | |
| Income taxes paid, net of refunds | | | –1,022 | | | | –817 | |
| Net cash flows from operating activities | | | 3,040 | | | | 3,057 | |
| | | | | | | | | |
| Business combinations, net of cash and cash equivalents acquired | | | –1,131 | | | | –2,757 | |
| Purchase of intangible assets and property, plant, and equipment | | | –401 | | | | –370 | |
| Proceeds from sales of intangible assets or property, plant, and equipment | | | 40 | | | | 30 | |
| Purchase of equity or debt instruments of other entities | | | –1,358 | | | | –905 | |
| Proceeds from sales of equity or debt instruments of other entities | | | 1,311 | | | | 1,517 | |
| Net cash flows from investing activities | | | –1,539 | | | | –2,485 | |
| | | | | | | | | |
| Dividends paid | | | –1,013 | | | | –1,310 | |
| Purchase of treasury shares | | | 0 | | | | –53 | |
| Proceeds from reissuance of treasury shares | | | 36 | | | | 83 | |
| Proceeds from issuing shares (share-based payments) | | | 0 | | | | 15 | |
| Proceeds from borrowings | | | 1,000 | | | | 1,000 | |
| Repayments of borrowings | | | –624 | | | | –1,313 | |
| Net cash flows from financing activities | | | –601 | | | | –1,578 | |
| | | | | | | | | |
| Effect of foreign exchange rates on cash and cash equivalents | | | –122 | | | | –33 | |
| Net decrease/increase in cash and cash equivalents | | | 778 | | | | –1,039 | |
| Cash and cash equivalents at the beginning of the period | | | 2,477 | | | | 4,965 | |
| Cash and cash equivalents at the end of the period | | | 3,255 | | | | 3,926 | |
| | |
| INTERIM REPORT JANUARY – SEPTEMBER 2013 | | 35 |
NOTES TO THE CONSOLIDATED INTERIM FINANCIAL STATEMENTS
(1) General Information About Consolidated Interim Financial Statements
The accompanying Consolidated Interim Financial Statements of SAP AG and its subsidiaries (collectively, “we,” “us,” “our,” “SAP,” “Group,” and “Company”) have been prepared in accordance with the International Financial Reporting Standards (IFRS) and in particular in compliance with International Accounting Standard (IAS) 34. The designation IFRS includes all standards issued by the International Accounting Standards Board (IASB) and related interpretations issued by the International Financial Reporting Interpretations Committee (IFRIC). The variances between the applicable IFRS standards as issued by the IASB and the standards as used by the European Union are not relevant to these financial statements.
Certain information and disclosures normally included in the notes to annual financial statements prepared in accordance with IFRS have been condensed or omitted. We believe that the disclosures made are adequate and that the information gives a true and fair view.
Our business activities are influenced by certain seasonal effects. Historically, our overall revenue tends to be highest in the fourth quarter. Interim results are therefore not necessarily indicative of results for a full year.
Amounts reported in previous years have been reclassified as appropriate to conform to the presentation in this interim report.
These unaudited condensed Consolidated Interim Financial Statements should be read in conjunction with SAP’s audited Consolidated IFRS Financial Statements for the Year Ended December 31, 2012, included in our 2012 Annual Report (extract from the SAP Integrated Report 2012) and our Annual Report 2012 on Form 20-F.
Due to rounding, numbers presented throughout these Interim Financial Statements may not add up precisely to the totals we provide and percentages may not precisely reflect the absolute figures.
(2) Scope of Consolidation
The following table summarizes the change in the number of legal entities included in the Consolidated Financial Statements.
Number of Legal Entities Consolidated in the Financial Statements
| | | | | | | | | | | | |
| | | German | | | Foreign | | | Total | |
| January 1, 2012 | | | 23 | | | | 176 | | | | 199 | |
| Additions | | | 4 | | | | 92 | | | | 96 | |
| Disposals | | | -5 | | | | -23 | | | | -28 | |
| December 31, 2012 | | | 22 | | | | 245 | | | | 267 | |
| Additions | | | 1 | | | | 20 | | | | 21 | |
| Disposals | | | 0 | | | | -15 | | | | -15 | |
| September 30, 2013 | | | 23 | | | | 250 | | | | 273 | |
The additions during the first nine months of 2013 relate to legal entities added in connection with foundations and acquisitions. The disposals are due to mergers and liquidations of operating and non-operating acquired legal entities.
Our changes in the scope of consolidation in the first nine months of 2013 were – except for the acquisition of hybris – not significant to our Consolidated Financial Statements.
For more information about our business combinations and the effect on our Consolidated Financial Statements, see Note (4) and our Consolidated Financial Statements for 2012.
(3) Summary of Significant Accounting Policies
With the exception of the newly adopted accounting standards described below, these Interim Financial Statements were prepared based on the same accounting policies as those applied and described in the Consolidated Financial Statements as at December 31, 2012. Our significant accounting policies are summarized in the Notes to the Consolidated Financial Statements. For more information, see Note (3) in our Annual Report for 2012.
Newly Adopted Accounting Standards
The following accounting standards newly adopted in the first nine months of 2013 were relevant for the group:
| | - | Amendments to IFRS 7 (Financial Instruments: Disclosures): Offsetting financial assets and financial liabilities |
| | |
| 36 | | CONSOLIDATED INTERIM FINANCIAL STATEMENTS – IFRS |
| | - | IFRS 10 (Consolidated Financial Statements), IFRS 11 (Joint Arrangements), and IFRS 12 (Disclosure of Interests in Other Entities) including amendments to the transition guidance for IFRS 10–12 issued in June 2012 (in other words, we adopted the new standards earlier than required by the European Union) |
| | - | IFRS 13 (Fair Value Measurement) |
| | - | Amendments to IAS 1 (Presentation of Financial Statements) |
| | - | Amendments to IAS 19 (Employee Benefits) |
The retrospective application of the revised IAS 19 has resulted in the netting of balance sheet items (mandatory netting of plan assets with time credits and early retirement obligations). Prior year numbers were restated accordingly (netting of financial assets with provisions in the amount of€124 million). Apart from that, the adoption of the standards/amendments does not have a material impact on the Consolidated Financial Statements but does result, for example, in additional disclosures and reclassifications.
New Accounting Standards Not Yet Adopted
For more information about new accounting standards not yet adopted, see Note (3) in our Annual Report for 2012.
(4) Business Combinations
Until the approval of these related Interim Financial Statements, we acquired the following businesses in 2013:
Acquired Businesses
| | | | | | | | |
Acquired
Businesses | | Sector | | Acquisi-
tion Type | | Acquired
Voting
Interest | | Acquisi- tion Date |
Ticket-Web GmbH & Co. KG Wildau, Germany | | Solution provider of ticketing & customer relation- ship manage- ment | | Asset Deal | | n/a | | March 4, 2013 |
KMS Software Company LLC. Los Angeles, CA USA | | Provider of employee onboarding solutions | | Asset Deal | | n/a | | April 1, 2013 |
| Camilion Solutions, Inc., Toronto, Canada | | Solutions for the insurance industry | | Share Deal | | 100% | | April 2, 2013 |
| SmartOps Corporation, Pittsburgh, PA USA | | Provider of inventory and service-level optimization software solutions | | Share Deal | | 100% | | April 12, 2013 |
hybris AG, Rotkreuz, Switzerland | | Provider of independent commerce technology (B2B and B2C) | | Share Deal | | 100% | | August 1, 2013 |
KXEN Inc., San Francisco, CA USA | | Provider of predictive analytics technology for line of business users and analysts | | Share Deal | | 100% | | October 1, 2013 |
We acquire businesses in specific areas of strategic interest to us. All of the acquisitions listed in the above table are neither individually nor in aggregate material to SAP except for the acquisition of hybris AG, for which the additional information is provided below.
SAP acquired hybris AG, a recognized leader in commerce technology on August 1, 2013, after all regulatory evaluations and approvals were received. In the agreement, SAP offered US$95 per share.
| | |
| INTERIM REPORT JANUARY – SEPTEMBER 2013 | | 37 |
This acquistion will combine hybris’ agile omni-channel commerce solution with SAP’s robust enterprise technology and in-memory, cloud, and mobile innovations to help facilitate new levels of customer insight and engagement.
Financial Impact of Our Acquisitions as of the Closing Date
The following table summarizes the consideration transferred and the values for identifiable assets acquired and liabilities assumed of our acquisitions, as of the acquisition date and in detail for the hybris acquisition.
Financial Impact of Our Acquisitions as of the Closing Date
| | | | | | | | |
| € millions | | Total | | | Thereof
hybris | |
| | | | | | | | | |
| Consideration transferred | | | | | | | | |
| Cash | | | 1,092 | | | | 1,011 | |
| Liabilities incurred | | | 25 | | | | 23 | |
| Total consideration transferred | | | 1,117 | | | | 1,034 | |
| | | | | | | | | |
| Acquisition-related costs (includes general and administrative expenses in our income statement) | | | | | | | | |
| Acquisition-related costs recognized in 2013 | | | 8 | | | | 7 | |
| Total acquisition-related costs | | | 8 | | | | 7 | |
| | | | | | | | | |
| Amounts of identifiable assets acquired and liabilities assumed expected to be recognized | | | | | | | | |
| Cash and cash equivalents | | | 15 | | | | 10 | |
| Other financial assets | | | 1 | | | | 1 | |
| Trade and other receivables (net of reserves) | | | 34 | | | | 30 | |
| Other non-financial assets | | | 4 | | | | 3 | |
| Property, plant, and equipment | | | 8 | | | | 7 | |
| Intangible assets | | | 346 | | | | 312 | |
Thereof customer relationship and other intangibles | | | 169 | | | | 159 | |
Customer relationship | | | 152 | | | | 142 | |
Trade name | | | 10 | | | | 10 | |
Other intangible assets | | | 7 | | | | 7 | |
Thereof acquired technology | | | 176 | | | | 152 | |
Thereof software and database licenses | | | 1 | | | | 1 | |
| Current and deferred tax assets | | | 9 | | | | 8 | |
| Total identifiable assets | | | 417 | | | | 371 | |
| | | | | | | | | |
| Trade accounts payable | | | 11 | | | | 9 | |
| Loans and borrowings | | | 25 | | | | 25 | |
| Current and deferred tax liabilities | | | 85 | | | | 77 | |
| Provisions and other non-financial liabilities | | | 32 | | | | 32 | |
Thereof legal and litigation related liabilities | | | 1 | | | | 1 | |
| Deferred revenue | | | 17 | | | | 15 | |
| Total identifiable liabilities | | | 170 | | | | 158 | |
| | | | | | | | | |
| Total identifiable net assets | | | 247 | | | | 213 | |
| | | | | | | | | |
| Goodwill | | | 870 | | | | 821 | |
The goodwill arising from the acquistions consists largely of the synergies and the know-how and technical skills of the acquired entities’ workforces.
We are still evaluating contingent liabilities and tax positions of our acquisitions. We do not expect to have a material impact on these positions.
Acquisitions made in the preceding year, including the acquisition of SuccessFactors on February 21, 2012, and Ariba on October 1, 2012, are described in the Consolidated Financial Statements in our 2012 Annual Report.
| | |
| 38 | | CONSOLIDATED INTERIM FINANCIAL STATEMENTS – IFRS |
(5) Employee Benefits Expense and Headcount
Employee benefits expense comprises the following:
Employee Benefits Expense
| | | | | | | | | | | | | | | | |
| € millions | | Q3 2013 | | | 1/1-9/30/2013 | | | Q3 2012 | | | 1/1-9/30/2012 | |
| Salaries | | | 1,469 | | | | 4,398 | | | | 1,424 | | | | 4,105 | |
| Social security expense | | | 201 | | | | 642 | | | | 190 | | | | 576 | |
| Share-based payments | | | 83 | | | | 192 | | | | 152 | | | | 333 | |
| Pension expense | | | 46 | | | | 159 | | | | 46 | | | | 147 | |
| Termination benefits | | | 9 | | | | 31 | | | | 10 | | | | 53 | |
| Employee-related restructuring expenses | | | 11 | | | | 34 | | | | 1 | | | | 5 | |
| Employee Benefits Expense | | | 1,819 | | | | 5,456 | | | | 1,822 | | | | 5,218 | |
Acquired companies are only included in the employee benefits expense as of the company’s acquisition date. SuccessFactors is therefore included in the employee benefits expense of prior year numbers as of February 21, 2012; Ariba and hybris are not included.
On September 30, 2013, the breakdown of our full-time equivalent employee numbers by function in SAP and by region was as shown in the table below. The increase in headcount in the SAP Group to 66,061 employees is mainly due to additions from business combinations (especially Ariba and hybris).
Number of Employees (in Full-Time Equivalents)
| | | | | | | | | | | | | | | | | | | | | | | | | | | | | | | | |
| | | September 30, 2013 | | | September 30, 2012 | |
| Full-Time Equivalents | | EMEA | | | Americas | | | APJ | | | Total | | | EMEA | | | Americas | | | APJ | | | Total | |
| Software and software-related services | | | 4,707 | | | | 2,861 | | | | 3,435 | | | | 11,003 | | | | 4,432 | | | | 2,300 | | | | 3,237 | | | | 9,969 | |
| Professional services and other services | | | 7,014 | | | | 4,354 | | | | 2,974 | | | | 14,341 | | | | 6,821 | | | | 4,044 | | | | 2,646 | | | | 13,511 | |
| Research and development | | | 8,684 | | | | 3,607 | | | | 5,427 | | | | 17,718 | | | | 8,902 | | | | 3,453 | | | | 5,140 | | | | 17,495 | |
| Sales and marketing | | | 6,408 | | | | 6,509 | | | | 3,079 | | | | 15,995 | | | | 5,560 | | | | 5,630 | | | | 2,867 | | | | 14,057 | |
| General and administration | | | 2,408 | | | | 1,419 | | | | 675 | | | | 4,501 | | | | 2,160 | | | | 1,224 | | | | 622 | | | | 4,006 | |
| Infrastructure | | | 1,383 | | | | 802 | | | | 318 | | | | 2,503 | | | | 1,252 | | | | 772 | | | | 282 | | | | 2,306 | |
| SAP Group (September 30) | | | 30,602 | | | | 19,552 | | | | 15,907 | | | | 66,061 | | | | 29,127 | | | | 17,423 | | | | 14,794 | | | | 61,344 | |
| | | | | | | | | | | | | | | | | | | | | | | | | | | | | | | | | |
| SAP Group (average first nine months) | | | 30,030 | | | | 19,350 | | | | 15,681 | | | | 65,061 | | | | 28,765 | | | | 17,131 | | | | 14,175 | | | | 60,071 | |
| | |
| INTERIM REPORT JANUARY – SEPTEMBER 2013 | | 39 |
The allocations of expenses for share-based payments to the various expense items are as follows:
Share-Based Payments
| | | | | | | | | | | | | | | | |
| € millions | | Q3 2013 | | | 1/1 – 9/30/ 2013 | | | Q3 2012 | | | 1/1 – 9/30/ 2012 | |
| Cost of software and software-related services | | | 12 | | | | 25 | | | | 15 | | | | 33 | |
| Cost of professional services and other services | | | 18 | | | | 38 | | | | 34 | | | | 83 | |
| Research and development | | | 20 | | | | 53 | | | | 38 | | | | 82 | |
| Sales and marketing | | | 23 | | | | 54 | | | | 37 | | | | 82 | |
| General and administration | | | 10 | | | | 21 | | | | 28 | | | | 53 | |
| Share-based payments | | | 83 | | | | 192 | | | | 152 | | | | 333 | |
(6) Income Tax
In the third quarter and in the first nine months of 2013, income taxes and the effective tax rate, each compared with the third quarter and the first nine months of 2012, were as follows:
Income Taxes
| | | | | | | | | | | | | | | | |
€ millions, unless stated otherwise | | Q3 2013 | | | 1/1 – 9/30/ 2013 | | | Q3 2012 | | | 1/1 – 9/30/ 2012 | |
| Profit before income tax | | | 1,035 | | | | 2,620 | | | | 822 | | | | 2,295 | |
| Income tax expense | | | –274 | | | | –614 | | | | –204 | | | | –572 | |
| Effective tax rate in % | | | 26.4 | | | | 23.4 | | | | 24.8 | | | | 24.9 | |
(7) Earnings per Share
Earnings per Share
| | | | | | | | | | | | | | | | |
| € millions, unless otherwise stated | | Q3 2013 | | | 1/1– 9/30/2013 | | | Q3 2012 | | | 1/1– 9/30/2012 | |
| Profit attributable to owners of parent | | | 762 | | | | 2,006 | | | | 618 | | | | 1,723 | |
Issued ordinary shares | | | 1,229 | | | | 1,229 | | | | 1,228 | | | | 1,228 | |
Effect of treasury shares | | | –36 | | | | –36 | | | | –36 | | | | –37 | |
| Weighted average number of shares in millions – basic | | | 1,193 | | | | 1,193 | | | | 1,192 | | | | 1,191 | |
| Dilutive effect of free-matching shares in millions | | | 2 | | | | 2 | | | | 1 | | | | 1 | |
| Weighted average number of shares in millions – diluted | | | 1,195 | | | | 1,195 | | | | 1,193 | | | | 1,192 | |
| Earnings per share, attributable to owners of parent, basic (in€) | | | 0.64 | | | | 1.68 | | | | 0.52 | | | | 1.45 | |
| Earnings per share, attributable to owners of parent, diluted (in€) | | | 0.64 | | | | 1.68 | | | | 0.52 | | | | 1.45 | |
| | |
| 40 | | CONSOLIDATED INTERIM FINANCIAL STATEMENTS – IFRS |
(8) Other Financial Assets
Other financial assets comprise the following:
Other Financial Assets
| | | | | | | | | | | | |
| | | September 30, 2013 | |
| € millions | | Current | | | Non-Current | | | Total | |
| Loans and other financial receivables | | | 68 | | | | 242 | | | | 310 | |
Debt investments | | | 38 | | | | 0 | | | | 38 | |
Equity investments | | | 0 | | | | 233 | | | | 233 | |
| Available-for-sale financial assets | | | 38 | | | | 233 | | | | 271 | |
| Derivatives | | | 115 | | | | 1 | | | | 116 | |
| Investments in associates | | | 0 | | | | 48 | | | | 48 | |
| Total | | | 221 | | | | 524 | | | | 745 | |
| | | |
| | | | | | | | | | | | |
| | | December 31, 2012 | |
| € millions | | Current | | | Non-Current | | | Total | |
| Loans and other financial receivables | | | 35 | | | | 208 | | | | 243 | |
Debt investments | | | 15 | | | | 14 | | | | 29 | |
Equity investments | | | 0 | | | | 201 | | | | 201 | |
| Available-for-sale financial assets | | | 15 | | | | 215 | | | | 230 | |
| Derivatives | | | 104 | | | | 40 | | | | 144 | |
| Investments in associates | | | 0 | | | | 46 | | | | 46 | |
| Total | | | 154 | | | | 509 | | | | 663 | |
(9) Trade and Other Receivables
Trade and other receivables comprise the following:
Trade and Other Receivables
| | | | | | | | | | | | |
| | | September 30, 2013 | |
| € millions | | Current | | | Non-Current | | | Total | |
| Trade receivables, net | | | 3,016 | | | | 0 | | | | 3,016 | |
| Other receivables | | | 36 | | | | 81 | | | | 117 | |
| Total | | | 3,052 | | | | 81 | | | | 3,133 | |
| | | |
| | | | | | | | | | | | | |
| | | December 31, 2012 | |
| € millions | | Current | | | Non-Current | | | Total | |
| Trade receivables, net | | | 3,837 | | | | 0 | | | | 3,837 | |
| Other receivables | | | 80 | | | | 88 | | | | 168 | |
| Total | | | 3,917 | | | | 88 | | | | 4,005 | |
The carrying amounts of our trade receivables and related allowances were as follows:
Carrying Amounts of Trade Receivables
| | | | | | | | |
| € millions | | 9/30/ 2013 | | | 12/31/ 2012 | |
| Gross carrying amount | | | 3,160 | | | | 3,943 | |
| Sales allowances charged to revenue | | | –105 | | | | –73 | |
| Allowance for doubtful accounts charged to expense | | | –39 | | | | –33 | |
| Carrying amount trade receivables, net | | | 3,016 | | | | 3,837 | |
| | |
| INTERIM REPORT JANUARY – SEPTEMBER 2013 | | 41 |
(10) Financial Liabilities
Financial liabilities comprise the following:
Financial Liabilities
| | | | | | | | | | | | |
| | | September 30, 2013 | |
| € millions | | Current | | | Non-Current | | | Total | |
| Bank loans | | | 998 | | | | 0 | | | | 998 | |
| Private placement transactions | | | 86 | | | | 1,957 | | | | 2,043 | |
| Bonds | | | 500 | | | | 1,790 | | | | 2,290 | |
| Other financial liabilities | | | 164 | | | | 52 | | | | 216 | |
| Financial liabilities | | | 1,748 | | | | 3,799 | | | | 5,547 | |
| | | |
| | | | | | | | | | | | | |
| | | December 31, 2012 | |
| € millions | | Current | | | Non-Current | | | Total | |
| Bank loans | | | 0 | | | | 0 | | | | 0 | |
| Private placement transactions | | | 0 | | | | 2,088 | | | | 2,088 | |
| Bonds | | | 600 | | | | 2,287 | | | | 2,887 | |
| Other financial liabilities | | | 202 | | | | 71 | | | | 273 | |
| Financial liabilities | | | 802 | | | | 4,446 | | | | 5,248 | |
(11) Deferred Income
On September 30, 2013, our current deferred income was€2,235 million (December 31, 2012:€1,386 million) and our non-current deferred income was€64 million (December 31, 2012:€62 million). On September 30, 2013, current deferred income includes a total of€376 million in deferred revenue (December 31, 2012:€317 million; September 30, 2012:€169 million), which in future will likely be recognized as revenue from cloud subscriptions and support.
(12) Total Equity
Issued Shares
On September 30, 2013, SAP AG had 1,228,504,232 no-par issued shares (December 31, 2012: 1,228,504,232) issued with a calculated nominal value of€1 per share. Thus, issued shares remain unchanged in the first nine months of 2013. In the first nine months of 2012, the number of issued shares increased by 256,216 shares (Q3 2012: 0), resulting from the exercise of awards granted under certain share-based payments.
Treasury Shares
On September 30, 2013, we held 35 million treasury shares, representing€35 million or 2.84% of capital stock.
In the first nine months of 2013, we did not acquire shares for treasury and disposed 1.4 million (Q3 2013: 1.2 million) shares at an average price of approximately€36.80 (Q3 2013:€36.80) per share.
In the first nine months of 2012, we acquired 1.1 million shares (Q3 2012: 0 million) with a purchase price of approximately€48.14 per share and disposed 2.4 million (Q3 2012: 0.1 million) shares at an average price of approximately€36.65 (Q3 2012:€36.80) per share.
Share purchases and share sales in 2013 and 2012 were in connection with our share-based payments, which are described in Note (27) in the Annual Report for 2012.
Other Comprehensive Income
The component of other comprehensive income before tax that will be reclassified to profit or loss in the future includes the following items for the third quarter:
| | | | | | | | |
| € millions | | Q3 2013 | | | Q3 2012 | |
Gains (losses) on exchange differences on translation | | | –255 | | | | –112 | |
Reclassification adjustments on exchange differences on translation | | | 0 | | | | 0 | |
| Exchange differences on translation | | | –255 | | | | –112 | |
Gains (losses) on remeasuring available-for-sale financial assets | | | 17 | | | | –15 | |
Reclassification adjustments on available-for-sale financial assets | | | –19 | | | | 0 | |
| Available-for-sale financial assets | | | –2 | | | | –15 | |
Gains (losses) on cash flow hedges | | | 3 | | | | 0 | |
Reclassification adjustments on cash flow hedges | | | –24 | | | | 20 | |
| Cash flow hedges | | | –21 | | | | 20 | |
The component of other comprehensive income before tax that will be reclassified to profit or loss in the future includes the following items for the first nine months:
| | |
| 42 | | CONSOLIDATED INTERIM FINANCIAL STATEMENTS – IFRS |
| | | | | | | | |
| € millions | | 1/1– 9/30/20 13 | | | 1/1– 9/30/20 12 | |
Gains (losses) on exchange differences on translation | | | –345 | | | | 59 | |
Reclassification adjustments on exchange differences on translation | | | 0 | | | | 0 | |
| Exchange differences on translation | | | –345 | | | | 59 | |
Gains (losses) on remeasuring available-for-sale financial assets | | | 22 | | | | 17 | |
Reclassification adjustments on available-for-sale financial assets | | | –19 | | | | 1 | |
| Available-for-sale financial assets | | | 3 | | | | 18 | |
Gains (losses) on cash flow hedges | | | 53 | | | | –12 | |
Reclassification adjustments on cash flow hedges | | | –56 | | | | 38 | |
| Cash flow hedges | | | –3 | | | | 26 | |
(13) Contingent Liabilities
For a detailed description of our contingent liabilities, see our Annual Report 2012, Notes to the Consolidated Financial Statements section, Note (22). There have been no significant changes in contingent liabilities since December 31, 2012. For information about contingent liabilities related to litigation, see Note (14).
(14) Litigation and Claims
We are subject to a variety of claims and lawsuits that arise from time to time in the ordinary course of our business, including proceedings and claims that relate to companies we have acquired, and claims that relate to customers demanding indemnification for proceedings initiated against them based on their use of SAP software. We will continue to vigorously defend against all claims and lawsuits against us. We record a provision for such matters when it is probable that we have a present obligation that results from a past event, is reliably estimable, and the settlement of which is probable to require an outflow of resources embodying economic benefits. For the TomorrowNow litigation, we have recorded a provision of US$306 million (US$272 million on December 31, 2011, US$1.3 billion on December 31, 2010). We currently believe that resolving all other claims and lawsuits against us, individually or in the aggregate, did not and will not have a material adverse effect on our business, financial position, profit, or cash flows. Consequently, the provisions currently recorded for these other claims and lawsuits are neither individually nor in aggregate material to SAP.
However, the outcome of litigation and other claims or lawsuits is intrinsically subject to considerable uncertainty. Management’s view of the litigation may also change in the future. Actual outcomes of
litigation and other claims or lawsuits may differ from the assessments made by management in prior periods, which could result in a material impact on our business, financial position, profit, cash flows, or reputation. We cannot reliably estimate the maximum possible loss in case of an unfavorable outcome.
For a description of the development of the provisions recorded for litigation, see our Annual Report 2012, Notes to the Consolidated Financial Statements section, Note (18b).
Among the claims and lawsuits are the following:
Intellectual Property Litigation
In March 2007, United States-based Oracle Corporation and certain of its subsidiaries (Oracle) instituted legal proceedings in the United States against TomorrowNow, Inc., its parent company SAP America, Inc. and SAP America’s parent company SAP AG (SAP). Oracle filed several amended complaints between 2007 and 2009. As amended, the lawsuit alleges copyright infringement, violations of the Federal Computer Fraud and Abuse Act and the California Computer Data Access and Fraud Act, unfair competition, intentional and negligent interference with prospective economic advantage, and civil conspiracy. The lawsuit alleges that SAP unlawfully copied and misappropriated proprietary, copyrighted software products and other confidential materials developed by Oracle to service its own customers. The lawsuit sought injunctive relief and monetary damages, including punitive damages, alleged by Oracle to be in the billions of U.S. dollars. The trial was held in November 2010. Prior to trial, SAP AG, SAP America and TomorrowNow stipulated to liability for certain claims, and SAP agreed to pay Oracle US$120 million for attorneys’ fees. After the trial, the jury returned a damages verdict of US$1.3 billion. The judgment which was issued on February 3, 2011, additionally provided for prejudgment interest of US$15 million. The judgment amount is also subject to post-judgment interest, which accrues from the time judgment is entered.
The jury based its verdict on the theory of a hypothetical license, that is, the value of what TomorrowNow would have paid if it had negotiated with Oracle a license for the copyrights infringed by TomorrowNow. Before and during the course of the trial, various damages amounts had been presented by the parties to the litigation. They included the following:
a) Before the trial, Oracle had requested damages in excess of US$3.5 billion based on alleged “saved acquisition costs,” the court dismissed that damage claim based on a pretrial motion, but Oracle has the right to appeal that dismissal.
| | |
| INTERIM REPORT JANUARY – SEPTEMBER 2013 | | 43 |
b) During the trial, Oracle’s damages experts presented an amount of US$408 million based on lost profits and disgorgement of infringer’s profit.
c) During the trial, members of Oracle management presented, as part of their testimonies, amounts of up to US$5 billion. Oracle’s damages expert presented a damages estimate of “at least” US$1.655 billion under a hypothetical license theory. Oracle’s counsel asked the jury to award “somewhere between US$1.65 and US$3 billion.”
d) During the trial, the damages expert for TomorrowNow and SAP presented an amount of US$28 million based on lost profits and infringer’s profits or, alternatively, US$40.6 million based on a hypothetical license theory. Counsel for SAP and TomorrowNow asked the jury to award US$28 million.
We believed both before and during the trial and continue to believe that the hypothetical license theory is not an appropriate basis for calculating the damages. Instead, we believe that damages should be based on lost profits and infringer’s profits. As such, SAP filed post-trial motions asking the judge to overturn the judgment. A hearing on the post-trial motions was held in July 2011. On September 1, 2011, the trial judge issued an order which set aside the jury verdict and vacated that part of the judgment awarding US$1.3 billion in damages. The trial judge also gave Oracle the choice of accepting reduced damages of US$272 million or having a new trial based on lost profits and infringer’s profits. Oracle filed a motion seeking an early appeal from the ruling vacating the jury’s damages award, which was denied by the judge. Consequently, Oracle elected to proceed with a new trial. In lieu of a new trial, the parties stipulated to a judgment of US$306 million while each preserving all rights for appeal. Both parties have filed their respective notice of appeal. On appeal, Oracle is seeking three forms of relief: (1) reinstatement of the November 2010 $1.3 billion verdict; (2) as a first alternative, a new trial at which Oracle may again seek hypothetical license damages (based in part on evidence of alleged saved development costs) plus SAP’s alleged infringer’s profits without any deduction of expenses (Oracle does not put a number on its claim for the requested new trial); and (3) as a second alternative, increase of the remittitur (alternative to new trial) to $408.7 million (versus the $272 million Oracle had previously rejected). SAP has dismissed its cross-appeal. The hearing is not yet scheduled.
Additionally, in June 2007, SAP became aware that the United States Department of Justice (U.S. DOJ) had opened an investigation concerning related
issues and had issued subpoenas to SAP and TomorrowNow. The DOJ investigation has been resolved by way of a plea agreement which includes TomorrowNow pleading guilty to 11 counts of violations of the Computer Fraud and Abuse Act, one count of criminal copyright infringement, the payment of a US$20 million fine and three years probation. No charges were brought against SAP AG or subsidiaries thereof other than TomorrowNow.
In April 2007, United States-based Versata Software, Inc. (formerly Trilogy Software, Inc.) (Versata) instituted legal proceedings in the United States against SAP. Versata alleged that SAP’s products infringe one or more of the claims in each of five patents held by Versata. In its complaint, Versata sought unspecified monetary damages and permanent injunctive relief. The first trial was held in August 2009. The jury returned a verdict in favor of Versata and awarded Versata US$138.6 million for past damages. In January 2011, the court vacated the jury’s damages award and ordered a new trial on damages. The re-trial was held in May 2011. The jury returned a verdict in favor of Versata and awarded Versata US$345 million for past damages. In September 2011, the judge denied SAP’s post-trial motions with the exception of reducing the damages verdict by US$16 million to approximately US$329 million. The judge also ordered approximately US$60 million in pre-judgment interest. Additionally, the judge granted Versata’s request for a broad injunction which prohibits SAP from 1) selling products in the United States with the infringing functionality, 2) providing maintenance to or accepting maintenance revenue from existing customers in the United States until such customers disable the infringing functionality and verify such disablement, and 3) licensing additional users to existing customers in the United States until such customers disable the infringing functionality and verify such disablement. Finally, the judge stayed the injunction pending the outcome of an appeal. Both parties appealed. The hearing occurred in February 2013 and a decision was issued on May 1, 2013. The three judge panel ruled in Versata’s favor on infringement and damages, leaving both fully intact. The past damages verdict currently stands at approximately $390 million. Regarding the injunction, the court ruled that the injunction was too broad, stating that SAP should be able to provide maintenance or additional seats for prior customers of the infringing products, so long as the maintenance or the additional seat does not involve, or allow access to, the “enjoined capability” where enjoined capability is defined as the capability to execute a pricing procedure using hierarchical access of customer and product data.
| | |
| 44 | | CONSOLIDATED INTERIM FINANCIAL STATEMENTS – IFRS |
SAP filed a petition seeking rehearing by the three-judge panel that issued this decision and/or by the entire appeals court. The appeals court requested that Versata respond to SAP’s petition no later than July 29, 2013. In August 2013, the appeals court denied SAP’s request for rehearing and issued its mandate passing jurisdiction to the district court.
Additionally, SAP filed a petition with the United States Patent Office (USPTO) challenging the validity of the asserted Versata patent. In January 2013, the USPTO granted SAP’s request to reconsider the validity of Versata’s patent and instituted the relevant procedure (transitional post grant review). A decision was issued in June 2013 rendering all challenged patent claims (including all the patent claims SAP was found to have infringed) unpatentable. Versata filed with the USPTO a request seeking reconsideration of the decision on six different grounds. The USPTO invited SAP to file an opposition responding to two of the six grounds. On September 13, 2013, the USPTO denied Versata’s request for reconsideration.
In June 2013, SAP filed a request with the appeals court to stay the litigation pending review of the USPTO decision. That request was denied in early July 2013.
In August 2007, United States-based elcommerce.com, Inc. (elcommerce) instituted legal proceedings in the United States against SAP. elcommerce alleged that SAP’s products infringe one or more of the claims in one patent held by elcommerce. In its complaint, elcommerce sought unspecified monetary damages and permanent injunctive relief. The court in East Texas granted SAP’s request to transfer the litigation from East Texas to Pennsylvania. Subsequent to the Markman ruling by the court, the parties agreed to the entry of final judgment regarding non-infringement by SAP. elcommerce has appealed the court’s Markman ruling. The hearing for the appeal was held in May 2012, and we are awaiting the court’s decision. SAP also filed a reexamination request with the USPTO to invalidate elcommerce’s patent. On September 23, 2013, the USPTO issued a decision invalidating the patent. elcommerce may appeal that decision.
In February 2010, United States-based TecSec, Inc. (TecSec) instituted legal proceedings in the United States against SAP, Sybase, IBM, and many other defendants. TecSec alleged that SAP’s products infringe one or more of the claims in five patents held by TecSec. In its complaint, TecSec seeks unspecified monetary damages and permanent injunctive relief. The trial has not yet been scheduled. The legal proceedings have been stayed against all
defendants pending the outcome of an appeal by TecSec. The appeal hearing occurred in March 2013. The appellate court issued its decision in October, 2013. That decision did not end the litigation and therefore we expect the lawsuit to resume at the district court in the coming months.
In April 2010, SAP instituted legal proceedings (a Declaratory Judgment action) in the United States against Wellogix, Inc. and Wellogix Technology Licensing, LLC (Wellogix). The lawsuit seeks a declaratory judgment that five patents owned by Wellogix are invalid and/or not infringed by SAP. The trial has not yet been scheduled. The legal proceedings have been stayed pending the outcome of six re-examinations filed with the USPTO. In September, 2013, the USPTO issued a decision on four of the six reexaminations, invalidating every claim of each of the four patents. SAP is awaiting a decision on the two remaining reexamination requests.
Other Litigation
In April 2008, South African-based Systems Applications Consultants (PTY) Limited (Securinfo) instituted legal proceedings in South Africa against SAP. Securinfo alleges that SAP has caused one of its subsidiaries to breach a software distribution agreement with Securinfo. In its complaint, Securinfo seeks damages of approximately€610 million plus interest. In September 2009, SAP filed a motion to dismiss which was rejected. A trial date which was scheduled for June 2011 has been postponed.
In November 2012, SAP filed a motion to dismiss based on a procedural aspect of the case. The court followed SAP’s argument and dismissed the claim by Securinfo. Securinfo appealed against this decision on December 19, 2012.
In March 2013, the court dismissed Securinfo’s appeal. Securinfo appealed against this decision to the Supreme Court of South Africa. The Supreme Court granted leave to appeal to the full bench of the court which had originally dismissed Securinfo’s appeals. Securinfo may now apply for an appeal hearing date. Such application must be provided to the court by December 10, 2013.
We are subject to ongoing audits by domestic and foreign tax authorities. Along with many other companies operating in Brazil, we are involved in various proceedings with Brazilian authorities regarding assessments and litigation matters on non-income taxes on intercompany royalty payments and intercompany services. The total potential amount related to these matters for all applicable years is approximately€81 million. We have not recorded a provision for these matters, as we believe that we will prevail on these matters.
| | |
| INTERIM REPORT JANUARY – SEPTEMBER 2013 | | 45 |
For more information about income tax risk-related litigation, see Note (10) in our Annual Report for 2012, which is part of our Integrated Report 2012.
(15) Share-Based Payments
For a detailed description of our share-based payment plans, see our Annual Report 2012, Notes to the Consolidated Financial Statements section, Note (27).
Share Matching Plan 2013 (SMP 2013)
Under the SMP 2013, SAP offered its employees the opportunity to purchase SAP AG shares at a discount of 40%. The number of SAP shares an eligible employee was able to purchase was limited to a percentage of the employee’s annual base salary. After a holding period of three years, the employees receive one SAP share free of charge for every three shares held. The terms for the Global Executives are different. Instead of receiving a discount, Global Executives are granted two bonus shares for every three shares acquired and held during the three-year vesting period. In September 2013, the participants purchased 1.6 million SAP shares in aggregate at a discounted share price of€33.72. The discount of€32.4 million was expensed immediately. The fair value of the right to a bonus share was estimated on the grant date (September 4, 2013) at€51.09 per share, using a risk-free interest rate of 0.43%, a dividend yield of 1.92%, and an expected life of three years.
The outstanding bonus shares under the Share Matching Plan are as follows:
Outstanding Restricted Shares
| | | | | | | | |
| Number in thousands | | 9/30/ 2013 | | | 12/31/ 2012 | |
Share Matching Plan 2011 (Bonus shares) | | | 432 | | | | 448 | |
Share Matching Plan 2012 (Bonus shares) | | | 3,002 | | | | 3,124 | |
Share Matching Plan 2013 (Bonus shares) | | | 573 | | | | 0 | |
Stock Option Plan 2010 (2013 Tranche)
Under the Stock Option Plan 2010 (2013 Tranche), we granted 7.4 million cash-based virtual stock
options to Global Executives and to SAP’s Top Rewards (top talents and top performers) in 2013.
The vesting period is three years and the contractual term of the program is six years. The exercise price is€59.85 and the fair value on the grant date was€9.48.
(16) Other Financial Instruments
A detailed overview of our other financial instruments, financial risk factors, and the management of financial risks are presented in Notes (24) to (26) to our Consolidated Financial Statements for 2012, which are included in our 2012 Integrated Report, and our Annual Report 2012 on Form 20-F.
There have been no significant changes with regards to our financial risk profile since December 31, 2012, except for the following: With regard to the acquisition of hybris and to safeguard our liquidity, SAP AG secured a€1.0 billion dual-currency credit facility agreement with an initial term of 12 months which was drawn down in EUR . Borrowings under the facility bear interest of EURIBOR plus a margin of 60 to 90 basis points.
In the following, we disclose the fair value of financial instruments, valuation techniques and inputs used and the level of the fair value hierarchy within which the fair value measurements are categorized.
Fair Value of Financial Instruments
We use various types of financial instruments in the ordinary course of business which are grouped into the following categories: Loans and receivables (L&R), available-for-sale (AFS), held-for-trading (HFT), and amortized cost (AC). The table below shows the carrying amounts and fair values of financial assets and liabilities by category of financial instrument as well as by category of IAS 39. Since the line items “Trade receivables,” “Trade payables,” and “Other financial assets” contain both financial and non-financial assets or liabilities (such as other taxes or advance payments), the non-financial assets or liabilities are shown in the column headed “Not in Scope of IFRS 7” to allow a reconciliation to the corresponding line items in the Consolidated Statements of Financial Position. The carrying amounts and fair values of our financial instruments as of the reporting date, were as follows:
| | |
| 46 | | CONSOLIDATED INTERIM FINANCIAL STATEMENTS – IFRS |
Fair Values of Financial Instruments
| | | | | | | | | | | | | | | | | | | | | | | | | | | | |
| € millions | | | | | 2013 | |
| | | | | | Book
Value
9/30/ 2013 | | | Measurement Categories | | | Fair Value
9/30/ 2013 | | | Not in
Scope of
IFRS 7 | |
| | | Category | | | | | | At
Amortized
Cost | | | At Cost | | | At Fair
Value | | | | | | | |
| Assets | | | | | | | | | | | | | | | | | | | | | | | | | | | | |
| Cash and cash equivalents | | | L&R | | | | 3,255 | | | | 3,255 | | | | | | | | | | | | 3,255 | | | | | |
| Trade receivables | | | L&R | | | | 3,133 | | | | 3,016 | | | | | | | | | | | | 3,016 | | | | 117 | |
| Other financial assets | | | | | | | 745 | | | | | | | | | | | | | | | | | | | | | |
Debt securities | | | L&R/AFS | | | | | | | | | | | | | | | | 38 | | | | 38 | | | | | |
Equity securities | | | AFS/- | | | | | | | | | | | | 167 | | | | 66 | | | | 66 | | | | 48 | |
Other nonderivative financial assets | | | L&R | | | | | | | | 199 | | | | | | | | | | | | 199 | | | | 111 | |
Derivative assets | | | | | | | | | | | | | | | | | | | | | | | | | | | | |
With hedging relationship | | | - | | | | | | | | | | | | | | | | 28 | | | | 28 | | | | | |
Without hedging relationship | | | HFT | | | | | | | | | | | | | | | | 88 | | | | 88 | | | | | |
| Liabilities | | | | | | | | | | | | | | | | | | | | | | | | | | | | |
| Trade payables | | | AC | | | | –838 | | | | –599 | | | | | | | | | | | | –599 | | | | –239 | |
| Financial liabilities | | | | | | | –5,547 | | | | | | | | | | | | | | | | | | | | | |
Nonderivative financial liabilities | | | AC | | | | | | | | –5,421 | | | | | | | | | | | | –5,499 | | | | | |
Derivatives | | | | | | | | | | | | | | | | | | | | | | | | | | | | |
With hedging relationship | | | - | | | | | | | | | | | | | | | | –4 | | | | –4 | | | | | |
Without hedging relationship | | | HFT | | | | | | | | | | | | | | | | –122 | | | | –122 | | | | | |
| Total financial instruments, net | | | | | | | 748 | | | | 450 | | | | 167 | | | | 94 | | | | 466 | | | | 37 | |
| Aggregation according to IAS 39 | | | | | | | | | | | | | | | | | | | | | | | | | | | | |
| Financial assets | | | | | | | | | | | | | | | | | | | | | | | | | | | | |
At fair value through profit or loss | | | HFT | | | | 88 | | | | | | | | | | | | 88 | | | | 88 | | | | | |
Available-for-sale | | | AFS | | | | 271 | | | | | | | | 167 | | | | 104 | | | | 104 | | | | | |
Loans and receivables | | | L&R | | | | 6,587 | | | | 6,470 | | | | | | | | | | | | 6,470 | | | | 117 | |
| Financial liabilities | | | | | | | | | | | | | | | | | | | | | | | | | | | | |
At fair value through profit or loss | | | HFT | | | | –122 | | | | | | | | | | | | –122 | | | | –122 | | | | | |
At amortized cost | | | AC | | | | –6,259 | | | | –6,020 | | | | | | | | | | | | –6,098 | | | | –239 | |
| Outside scope of IAS 39 | | | | | | | | | | | | | | | | | | | | | | | | | | | | |
Financial instruments related to employee benefit plans | | | | | | | 111 | | | | | | | | | | | | | | | | | | | | 111 | |
Investment in associates | | | | | | | 48 | | | | | | | | | | | | | | | | | | | | 48 | |
Derivatives with hedging relationship | | | | | | | 24 | | | | | | | | | | | | 24 | | | | 24 | | | | | |
| Total financial instruments, net | | | | | | | 748 | | | | 450 | | | | 167 | | | | 94 | | | | 466 | | | | 37 | |
| | |
| INTERIM REPORT JANUARY – SEPTEMBER 2013 | | 47 |
| | | | | | | | | | | | | | | | | | | | | | | | | | | | |
| € millions | | | | | 2012 | |
| | | | | | Book
Value
12/31/ 2012 | | | Measurement Categories | | | Fair Value
12/31/ 2012 | | | Not in
Scope of
IFRS 7 | |
| | | Category | | | | | | At
Amortized
Cost | | | At Cost | | | At Fair
Value | | | | | | | |
| Assets | | | | | | | | | | | | | | | | | | | | | | | | | | | | |
| Cash and cash equivalents | | | L&R | | | | 2,477 | | | | 2,477 | | | | | | | | | | | | 2,477 | | | | | |
| Trade receivables | | | L&R | | | | 4,005 | | | | 3,837 | | | | | | | | | | | | 3,837 | | | | 168 | |
| Other financial assets | | | | | | | 663 | | | | | | | | | | | | | | | | | | | | | |
Debt securities | | | L&R/AFS | | | | | | | | | | | | | | | | 29 | | | | 29 | | | | | |
Equity securities | | | AFS/- | | | | | | | | | | | | 149 | | | | 52 | | | | 52 | | | | 46 | |
Other nonderivative financial assets | | | L&R | | | | | | | | 159 | | | | | | | | | | | | 159 | | | | 84 | |
Derivative assets | | | | | | | | | | | | | | | | | | | | | | | | | | | | |
With hedging relationship | | | - | | | | | | | | | | | | | | | | 29 | | | | 29 | | | | | |
Without hedging relationship | | | HFT | | | | | | | | | | | | | | | | 115 | | | | 115 | | | | | |
| Liabilities | | | | | | | | | | | | | | | | | | | | | | | | | | | | |
| Trade payables | | | AC | | | | –933 | | | | –684 | | | | | | | | | | | | –684 | | | | –249 | |
| Financial liabilities | | | | | | | –5,248 | | | | | | | | | | | | | | | | | | | | | |
Nonderivative financial liabilities | | | AC | | | | | | | | –5,051 | | | | | | | | | | | | –5,228 | | | | | |
Derivatives | | | | | | | | | | | | | | | | | | | | | | | | | | | | |
With hedging relationship | | | - | | | | | | | | | | | | | | | | –2 | | | | –2 | | | | | |
Without hedging relationship | | | HFT | | | | | | | | | | | | | | | | –195 | | | | –195 | | | | | |
| Total financial instruments, net | | | | | | | 964 | | | | 738 | | | | 149 | | | | 28 | | | | 589 | | | | 49 | |
| Aggregation according to IAS 39 | | | | | | | | | | | | | | | | | | | | | | | | | | | | |
| Financial assets | | | | | | | | | | | | | | | | | | | | | | | | | | | | |
At fair value through profit or loss | | | HFT | | | | 115 | | | | | | | | | | | | 115 | | | | 115 | | | | | |
Available-for-sale | | | AFS | | | | 230 | | | | | | | | 149 | | | | 81 | | | | 81 | | | | | |
Loans and receivables | | | L&R | | | | 6,641 | | | | 6,473 | | | | | | | | | | | | 6,473 | | | | 168 | |
| | | | | | | | | | | | | | | | | | | | | | | | | | | | | |
| Financial liabilities | | | | | | | | | | | | | | | | | | | | | | | | | | | | |
At fair value through profit or loss | | | HFT | | | | ���195 | | | | | | | | | | | | –195 | | | | –195 | | | | | |
At amortized cost | | | AC | | | | –5,984 | | | | –5,735 | | | | | | | | | | | | –5,912 | | | | –249 | |
| Outside scope of IAS 39 | | | | | | | | | | | | | | | | | | | | | | | | | | | | |
Financial instruments related to employee benefit plans | | | | | | | 84 | | | | | | | | | | | | | | | | | | | | 84 | |
Investment in associates | | | | | | | 46 | | | | | | | | | | | | | | | | | | | | 46 | |
Derivatives with hedging relationship | | | | | | | 27 | | | | | | | | | | | | 27 | | | | 27 | | | | | |
| Total financial instruments, net | | | | | | | 964 | | | | 738 | | | | 149 | | | | 28 | | | | 589 | | | | 49 | |
Determination of Fair Value
IFRS 13 defines fair value as the price that would be received to sell an asset or paid to transfer a liability in an orderly transaction between market participants on the measurement date.
Accordingly, best evidence of fair value provides quoted prices in an active market. Where market prices are not readily available, valuation techniques have to be used to establish fair value. Depending on the inputs used in and their significance for the valuation techniques, we have categorized our
financial instruments at fair value into a three-level fair value hierarchy as mandated by IFRS 13. The fair value hierarchy gives the highest priority to quoted prices in active markets for identical assets or liabilities (Level 1) and the lowest priority to unobservable inputs (Level 3). The inputs used to measure fair value for one single instrument may fall into different levels of the fair value hierarchy. In such cases, the level in the fair value hierarchy within which the fair value measurement in its entirety falls has been determined based on the lowest level input that is significant to the fair value measurement in its
| | |
| 48 | | CONSOLIDATED INTERIM FINANCIAL STATEMENTS – IFRS |
entirety. Our assessment of the significance of a particular input to the fair value measurement in its entirety requires judgment, and considers factors specific to the asset or liability.
The levels of the fair value hierarchy, its application to our financial assets and liabilities, and the respective determination of fair value are described below:
- Level 1: Quoted prices in active markets for identical assets or liabilities.
| | - | Marketable available-for-sale debt and equity investments: The fair values of these securities are based on quoted market prices on as of the reporting date. |
– Level 2: Inputs other than quoted prices included within Level 1 that are observable for the asset or liability, either directly or indirectly.
| | - | Derivative financial instruments: The fair value of foreign exchange forward contracts is based on discounting the expected future cash flows over the respective remaining term of the contracts, using the respective market interest rates appropriate to the remaining term of the forwards contracts. The fair value of our foreign currency options is calculated taking into account current spot rates and strike prices, the volatility of the respective |
| | currencies, the remaining term of the options, as well as market interest rates. The fair value of the derivatives entered into to hedge our share-based payments are calculated considering risk-free interest rates, the remaining term of the derivatives, the dividend yields, the stock price, and the volatility of our share. |
| | - | Available-for-sale equity investments in public companies: Certain of our equity investments in public companies were restricted from being sold for a limited period. Therefore, fair value is determined based on quoted market prices as of the reporting date, deducting a discount for the disposal restriction based on the premium for a respective put option. |
– Level 3: Unobservable inputs for the assets or liabilities.
The following table allocates those financial assets and liabilities that are measured at fair value in accordance with IAS 39 either through profit or loss or other comprehensive income as of the reporting date, to the three levels of the fair value hierarchy according to IFRS 13.
Classification of Financial Instruments
| | | | | | | | | | | | | | | | | | | | | | | | | | | | | | | | |
| | | September 30, 2013 | | | December 31, 2012 | |
| € millions | | Level 1 | | | Level 2 | | | Level 3 | | | Total | | | Level 1 | | | Level 2 | | | Level 3 | | | Total | |
| Financial assets | | | | | | | | | | | | | | | | | | | | | | | | | | | | | | | | |
Corporate bonds | | | 23 | | | | 0 | | | | 0 | | | | 23 | | | | 27 | | | | 0 | | | | 0 | | | | 27 | |
Government securities | | | 3 | | | | 0 | | | | 0 | | | | 3 | | | | 0 | | | | 0 | | | | 0 | | | | 0 | |
Municipal bonds | | | 12 | | | | 0 | | | | 0 | | | | 12 | | | | 2 | | | | 0 | | | | 0 | | | | 2 | |
Debt investments | | | 38 | | | | 0 | | | | 0 | | | | 38 | | | | 29 | | | | 0 | | | | 0 | | | | 29 | |
Software industry | | | 39 | | | | 27 | | | | 0 | | | | 66 | | | | 52 | | | | 0 | | | | 0 | | | | 52 | |
Equity investments | | | 39 | | | | 27 | | | | 0 | | | | 66 | | | | 52 | | | | 0 | | | | 0 | | | | 52 | |
| Available-for-sale financial assets | | | 77 | | | | 27 | | | | 0 | | | | 104 | | | | 81 | | | | 0 | | | | 0 | | | | 81 | |
FX forward contracts | | | 0 | | | | 70 | | | | 0 | | | | 70 | | | | 0 | | | | 76 | | | | 0 | | | | 76 | |
Call options for share-based payments | | | 0 | | | | 46 | | | | 0 | | | | 46 | | | | 0 | | | | 68 | | | | 0 | | | | 68 | |
| Derivative financial assets | | | 0 | | | | 116 | | | | 0 | | | | 116 | | | | 0 | | | | 144 | | | | 0 | | | | 144 | |
| Total | | | 77 | | | | 143 | | | | 0 | | | | 220 | | | | 81 | | | | 144 | | | | 0 | | | | 225 | |
| Financial liabilities | | | | | | | | | | | | | | | | | | | | | | | | | | | | | | | | |
FX forward contracts | | | 0 | | | | 126 | | | | 0 | | | | 126 | | | | 0 | | | | 197 | | | | 0 | | | | 197 | |
| Derivative financial liabilities | | | 0 | | | | 126 | | | | 0 | | | | 126 | | | | 0 | | | | 197 | | | | 0 | | | | 197 | |
| Total | | | 0 | | | | 126 | | | | 0 | | | | 126 | | | | 0 | | | | 197 | | | | 0 | | | | 197 | |
It is our policy to recognize transfers at the beginning of the respective quarter when the event or change in circumstances occurred that caused the transfer.
| | |
| INTERIM REPORT JANUARY – SEPTEMBER 2013 | | 49 |
(17) Segment and Geographic Information
General Information
Our internal reporting system produces reports in which business activities are presented in a variety of ways, for example, by line of business, geography, and areas of responsibility of the individual Board members. Based on these reports, the Executive Board, which is responsible for assessing the performance of various company components and making resource allocation decisions as our Chief Operating Decision Maker (CODM), evaluates business activities in a number of different ways.
SAP has two divisions – On-Premise and Cloud, which are further divided into operating segments. Our On-Premise division is comprised of two operating segments: On-Premise Products and On-Premise Services, and our Cloud division of two operating segments: Cloud Applications and Ariba. All operating segments are reportable segments.
On August 1, 2013, SAP acquired hybris AG. The acquisition will enable SAP to deliver the next-generation e-commerce platform based on the latest technology, with the choice of on-premise or on-demand deployment. Since the majority of hybris’ activities are currently delivered in an on-premise model, the majority of hybris’ activities are correspondingly reflected in the On-Premise division.
The most important factors we use to identify operating segments are distinctions among our product and service offerings, notably:
| | - | Between divisions, the software delivery model (software to be installed on the customer’s hardware (on-premise software), distinct from software for delivery in the cloud) |
| | - | Within the On-Premise division, the types of services offered |
| | - | Within the Cloud division, the fields in which the cloud applications are used |
The On-Premise division derives its revenues primarily from the sale of on-premise software (that is, software designed for use on hardware on the customer’s premises), mobile software (that is, software designed for use on mobile devices), and services relating to such software. Within the On-Premise division, the On-Premise Products segment is primarily engaged in marketing and licensing our on-premise and mobile software products and providing support services for these software products. The On-Premise Services segment primarily performs various professional services, mainly implementation services of our software products and educational services on the use of our software products.
The Cloud division derives its revenues primarily from the sale of cloud software (that is, software designed for delivery through the cloud) and services relating to such software (including support services, from its cloud-based collaborative business network. Professional services, and educational services). Within the Cloud division, the Cloud Applications segment is primarily engaged in marketing and selling subscriptions to the cloud software offerings developed by SAP and SuccessFactors. The Ariba segment primarily markets and sells the cloud software offerings developed by Ariba and derives revenue.
| | |
| 50 | | CONSOLIDATED INTERIM FINANCIAL STATEMENTS – IFRS |
Information About Profit or Loss, Assets and Liabilities
Operating Segments Revenue and Profit or Loss
| | | | | | | | | | | | | | | | | | | | | | | | | | | | |
| | | On-Premise Division | | | Cloud Division | | | Total | |
| € millions | | On-Premise Products | | | On-Premise Services | | | Division Total | | | Cloud Applications | | | Ariba | | | Division Total | | | | |
| Q3 2013 | | | | | | | | | | | | | | | | | | | | | | | | | | | | |
Software | | | 976 | �� | | | 0 | | | | 976 | | | | 1 | | | | 0 | | | | 1 | | | | 977 | |
Cloud subscriptions and support | | | 0 | | | | 0 | | | | 0 | | | | 109 | | | | 88 | | | | 197 | | | | 197 | |
Software and cloud subscriptions | | | 976 | | | | 0 | | | | 976 | | | | 109 | | | | 88 | | | | 198 | | | | 1,174 | |
Support | | | 2,178 | | | | 0 | | | | 2,178 | | | | 3 | | | | 8 | | | | 11 | | | | 2,189 | |
Software and software-related service revenue | | | 3,154 | | | | 0 | | | | 3,154 | | | | 112 | | | | 96 | | | | 208 | | | | 3,363 | |
Professional services and other service revenue | | | 0 | | | | 651 | | | | 651 | | | | 23 | | | | 21 | | | | 44 | | | | 695 | |
Total revenue | | | 3,154 | | | | 651 | | | | 3,805 | | | | 135 | | | | 117 | | | | 252 | | | | 4,057 | |
Cost of revenue | | | –486 | | | | –536 | | | | –1,022 | | | | –46 | | | | –47 | | | | –93 | | | | –1,115 | |
| Gross profit | | | 2,668 | | | | 115 | | | | 2,783 | | | | 89 | | | | 70 | | | | 159 | | | | 2,942 | |
| Cost of sales and marketing | | | –813 | | | | 0 | | | | –813 | | | | –88 | | | | –39 | | | | –127 | | | | –940 | |
| Reportable segment profit/loss | | | 1,855 | | | | 115 | | | | 1,971 | | | | 1 | | | | 31 | | | | 32 | | | | 2,003 | |
| Q3 2012 | | | | | | | | | | | | | | | | | | | | | | | | | | | | |
Software | | | 1,026 | | | | 0 | | | | 1,026 | | | | 0 | | | | 0 | | | | 0 | | | | 1,026 | |
Cloud subscriptions and support | | | 0 | | | | 0 | | | | 0 | | | | 77 | | | | 3 | | | | 80 | | | | 80 | |
Software and cloud subscription | | | 1,026 | | | | 0 | | | | 1,026 | | | | 77 | | | | 3 | | | | 80 | | | | 1,106 | |
Support | | | 2,103 | | | | 0 | | | | 2,103 | | | | 2 | | | | 0 | | | | 3 | | | | 2,106 | |
Software and software-related service revenue | | | 3,129 | | | | 0 | | | | 3,129 | | | | 79 | | | | 3 | | | | 83 | | | | 3,212 | |
Professional services and other service revenue | | | 0 | | | | 736 | | | | 736 | | | | 22 | | | | 0 | | | | 22 | | | | 758 | |
Total revenue | | | 3,129 | | | | 736 | | | | 3,865 | | | | 101 | | | | 4 | | | | 105 | | | | 3,970 | |
Cost of revenue | | | –497 | | | | –555 | | | | –1,052 | | | | –49 | | | | –7 | | | | –56 | | | | –1,108 | |
| Gross profit | | | 2,632 | | | | 181 | | | | 2,813 | | | | 52 | | | | –4 | | | | 49 | | | | 2,862 | |
| Cost of sales and marketing | | | –846 | | | | 0 | | | | –846 | | | | –69 | | | | –2 | | | | –71 | | | | –917 | |
| Reportable segment profit/loss | | | 1,786 | | | | 181 | | | | 1,967 | | | | –17 | | | | –6 | | | | –22 | | | | 1,945 | |
| | |
| INTERIM REPORT JANUARY – SEPTEMBER 2013 | | 51 |
| | | | | | | | | | | | | | | | | | | | | | | | | | | | |
| 1/1/ – 9/30/2013 | | | | | | | | | | | | | | | | | | | | | | | | | | | | |
Software | | | 2,615 | | | | 0 | | | | 2,615 | | | | 1 | | | | 0 | | | | 1 | | | | 2,616 | |
Cloud subscriptions and support | | | 0 | | | | 0 | | | | 0 | | | | 292 | | | | 255 | | | | 547 | | | | 547 | |
Software and cloud subscriptions | | | 2,615 | | | | 0 | | | | 2,615 | | | | 293 | | | | 255 | | | | 548 | | | | 3,163 | |
Support | | | 6,449 | | | | 0 | | | | 6,449 | | | | 12 | | | | 23 | | | | 35 | | | | 6,484 | |
Software and software-related service revenue | | | 9,064 | | | | 0 | | | | 9,064 | | | | 305 | | | | 278 | | | | 583 | | | | 9,647 | |
Professional services and other service revenue | | | 0 | | | | 2,011 | | | | 2,011 | | | | 63 | | | | 63 | | | | 126 | | | | 2,137 | |
Total revenue | | | 9,064 | | | | 2,011 | | | | 11,075 | | | | 368 | | | | 341 | | | | 709 | | | | 11,784 | |
Cost of revenue | | | –1,414 | | | | –1,623 | | | | –3,038 | | | | –134 | | | | –135 | | | | –269 | | | | –3,307 | |
| Gross profit | | | 7,649 | | | | 388 | | | | 8,037 | | | | 233 | | | | 206 | | | | 440 | | | | 8,477 | |
| Cost of sales and marketing | | | –2,522 | | | | 0 | | | | –2,522 | | | | –242 | | | | –115 | | | | –357 | | | | –2,879 | |
| Reportable segment profit/loss | | | 5,128 | | | | 388 | | | | 5,516 | | | | –9 | | | | 92 | | | | 83 | | | | 5,599 | |
| 1/1/ – 9/30/2012 | | | | | | | | | | | | | | | | | | | | | | | | | | | | |
Software | | | 2,720 | | | | 0 | | | | 2,720 | | | | 1 | | | | 0 | | | | 1 | | | | 2,722 | |
Cloud subscriptions and support | | | 0 | | | | 0 | | | | 0 | | | | 175 | | | | 8 | | | | 183 | | | | 183 | |
Software and cloud subscription | | | 2,720 | | | | 0 | | | | 2,720 | | | | 176 | | | | 9 | | | | 184 | | | | 2,905 | |
Support | | | 6,068 | | | | 0 | | | | 6,068 | | | | 6 | | | | 1 | | | | 7 | | | | 6,075 | |
Software and software-related service revenue | | | 8,788 | | | | 0 | | | | 8,788 | | | | 182 | | | | 9 | | | | 191 | | | | 8,980 | |
Professional services and other service revenue | | | 0 | | | | 2,210 | | | | 2,210 | | | | 49 | | | | 4 | | | | 53 | | | | 2,263 | |
Total revenue | | | 8,788 | | | | 2,210 | | | | 10,999 | | | | 231 | | | | 13 | | | | 244 | | | | 11,243 | |
Cost of revenue | | | –1,400 | | | | –1,729 | | | | –3,129 | | | | –122 | | | | –21 | | | | –142 | | | | –3,270 | |
| Gross profit | | | 7,389 | | | | 481 | | | | 7,870 | | | | 109 | | | | –8 | | | | 102 | | | | 7,973 | |
| Cost of sales and marketing | | | –2,440 | | | | 0 | | | | –2,440 | | | | –164 | | | | –5 | | | | –170 | | | | –2,609 | |
| Reportable segment profit/loss | | | 4,949 | | | | 481 | | | | 5,430 | | | | –55 | | | | –13 | | | | –68 | | | | 5,364 | |
Segment asset/liability information is not regularly provided to our CODM. Goodwill by operating segment is disclosed in our Annual Report 2012, Notes to the Consolidated Financial Statements section, Note (15).
For more information about the measurement and presentation of the segment reporting, see our Annual Report 2012, Notes to the Consolidated Financial Statements section, Note (28).
| | |
| 52 | | CONSOLIDATED INTERIM FINANCIAL STATEMENTS – IFRS |
Reconciliation of Revenues and Segment Results
| | | | | | | | | | | | | | | | |
| € millions | | Q3/2013 | | | 1/1/ – 9/30/2013 | | | Q3/2012 | | | 1/1/ –
9/30/2012 | |
| Total revenues for reportable segments | | | 4,057 | | | | 11,784 | | | | 3,970 | | | | 11,243 | |
| Adjustment recurring revenues | | | –12 | | | | –76 | | | | –18 | | | | –43 | |
Adjustment recurring support revenues | | | –2 | | | | –2 | | | | 0 | | | | 0 | |
Adjustment recurring cloud subscriptions and support revenues | | | –5 | | | | –60 | | | | –17 | | | | –39 | |
Adjustment recurring support revenues | | | –5 | | | | –14 | | | | –1 | | | | –4 | |
| Total revenue | | | 4,045 | | | | 11,708 | | | | 3,952 | | | | 11,200 | |
| | | | | | | | | | | | | | | | | |
| Total profit for reportable segments | | | 2,003 | | | | 5,599 | | | | 1,945 | | | | 5,364 | |
| Adjustment recurring revenues | | | –12 | | | | –76 | | | | –18 | | | | –43 | |
| Research and development expense | | | –521 | | | | –1,607 | | | | –518 | | | | –1,541 | |
| General and administration expense | | | –185 | | | | –581 | | | | –188 | | | | –579 | |
| Other operating income/expense, net | | | 0 | | | | 6 | | | | 0 | | | | 1 | |
| Restructuring | | | –17 | | | | –47 | | | | –4 | | | | –8 | |
| Share-based payment expense | | | –83 | | | | –192 | | | | –152 | | | | –333 | |
| TomorrowNow litigation / Loss from discontinued operations | | | 0 | | | | 0 | | | | –7 | | | | –1 | |
| Acquisition-related charges | | | –142 | | | | –424 | | | | –137 | | | | –387 | |
| Operating profit | | | 1,043 | | | | 2,677 | | | | 921 | | | | 2,473 | |
| Other non-operating income/expense, net | | | –1 | | | | –14 | | | | –92 | | | | –145 | |
| Financial income, net | | | –7 | | | | –44 | | | | –7 | | | | –33 | |
| Profit before tax | | | 1,035 | | | | 2,620 | | | | 822 | | | | 2,295 | |
The research and development expense as well as the general and administration expense presented in the reconciliation differs from the corresponding expense in the consolidated income statement because the portions of share-based payments-related expenses, restructuring expenses, and acquisition-related expenses that are included in the research and development line item respectively the general and administration expense line item in the income statement, are presented as separate items in the reconciliation.
| | |
| INTERIM REPORT JANUARY – SEPTEMBER 2013 | | 53 |
Geographic Information
The tables below show the geographical breakdown of revenue according to specific criteria:
| | - | The management view is the geographic revenue breakdown that the SAP Executive Board, SAP’s chief operating decision-maker, uses primarily when reviewing revenue by sales destination. Under this view, the software revenue from a software contract is attributed to the country in which the contract was negotiated. Such reporting presumes that the software contract was negotiated in the country in which the customer is domiciled. The only circumstances in which this presumption is not applied is where there is objective evidence that all contract negotiations took place in a country other than the domicile of the legal entity contracting on the customer’s behalf. Software revenue from a given software contract is always attributed to a single geographical region; in other words, the software revenue it is not split between geographical regions. Because cloud subscriptions and support revenue is earned largely from contracts that were negotiated in various periods in the past, it is allocated without exception to the country in which the customer is domiciled. |
| | - | In the presentation by customer location, all revenue is attributed to the country in which the customer is domiciled. |
Revenue by Region
Software Revenue by Location Where Contracts Were Negotiated
| | | | | | | | | | | | | | | | |
| € millions | | Q3/2013 | | | 1/1/ – 9/30/2013 | | | Q3/2012 | | | 1/1/ – 9/30/2012 | |
| EMEA | | | 402 | | | | 1,116 | | | | 374 | | | | 1,069 | |
| Americas | | | 398 | | | | 1,043 | | | | 458 | | | | 1,131 | |
| APJ | | | 176 | | | | 454 | | | | 194 | | | | 522 | |
| SAP Group | | | 975 | | | | 2,614 | | | | 1,026 | | | | 2,722 | |
Software Revenue by Location of Negotiation and Cloud Subscription Revenue by Location of Customers
| | | | | | | | | | | | | | | | |
| € millions | | Q3/2013 | | | 1/1/ –
9/30/2013 | | | Q3/2012 | | | 1/1/ –
9/30/2012 | |
| EMEA | | | 433 | | | | 1,197 | | | | 390 | | | | 1,113 | |
| Americas | | | 550 | | | | 1,425 | | | | 502 | | | | 1,222 | |
| APJ | | | 185 | | | | 479 | | | | 197 | | | | 531 | |
| SAP Group | | | 1,167 | | | | 3,101 | | | | 1,089 | | | | 2,866 | |
Software Revenue by Location of Customers
| | | | | | | | | | | | | | | | |
| € millions | | Q3/2013 | | | 1/1/ –
9/30/2013 | | | Q3/2012 | | | 1/1/ –
9/30/2012 | |
| EMEA | | | 422 | | | | 1,138 | | | | 373 | | | | 1,105 | |
| Americas | | | 364 | | | | 1,007 | | | | 459 | | | | 1,090 | |
| APJ | | | 189 | | | | 469 | | | | 194 | | | | 527 | |
| SAP Group | | | 975 | | | | 2,614 | | | | 1,026 | | | | 2,722 | |
Cloud Subscriptions and Support Revenue by Location of Customers
| | | | | | | | | | | | | | | | |
| € millions | | Q3/2013 | | | 1/1/ –
9/30/2013 | | | Q3/2012 | | | 1/1/ –
9/30/2012 | |
| EMEA | | | 31 | | | | 81 | | | | 16 | | | | 44 | |
| Americas | | | 152 | | | | 382 | | | | 44 | | | | 91 | |
| APJ | | | 9 | | | | 25 | | | | 3 | | | | 9 | |
| SAP Group | | | 191 | | | | 488 | | | | 63 | | | | 144 | |
Software and Cloud Subscriptions Revenue by Location of Customers
| | | | | | | | | | | | | | | | |
| € millions | | Q3/2013 | | | 1/1/ –
9/30/2013 | | | Q3/2012 | | | 1/1/ –
9/30/2012 | |
| EMEA | | | 452 | | | | 1,219 | | | | 390 | | | | 1,149 | |
| Americas | | | 516 | | | | 1,389 | | | | 502 | | | | 1,181 | |
| APJ | | | 198 | | | | 493 | | | | 197 | | | | 536 | |
| SAP Group | | | 1,167 | | | | 3,101 | | | | 1,089 | | | | 2,866 | |
Software and Software-Related Service Revenue by Location of Customers
| | | | | | | | | | | | | | | | |
| € millions | | Q3/2013 | | | 1/1/ – 9/30/2013 | | | Q3/2012 | | | 1/1/ – 9/30/2012 | |
| Germany | | | 470 | | | | 1,324 | | | | 438 | | | | 1,245 | |
| Rest of EMEA | | | 1,062 | | | | 3,052 | | | | 957 | | | | 2,845 | |
| Total EMEA | | | 1,531 | | | | 4,376 | | | | 1,395 | | | | 4,090 | |
| United States | | | 931 | | | | 2,692 | | | | 921 | | | | 2,456 | |
| Rest of Americas | | | 357 | | | | 1,002 | | | | 326 | | | | 872 | |
| Total Americas | | | 1,288 | | | | 3,693 | | | | 1,247 | | | | 3,328 | |
| Japan | | | 140 | | | | 403 | | | | 174 | | | | 489 | |
| Rest of APJ | | | 391 | | | | 1,100 | | | | 377 | | | | 1,030 | |
| Total APJ | | | 531 | | | | 1,502 | | | | 552 | | | | 1,519 | |
| SAP Group | | | 3,351 | | | | 9,571 | | | | 3,194 | | | | 8,937 | |
| | |
| 54 | | CONSOLIDATED INTERIM FINANCIAL STATEMENTS – IFRS |
Total Revenue by Location of Customers
| | | | | | | | | | | | | | | | |
| € millions | | Q3/2013 | | | 1/1/ – 9/30/2013 | | | Q3/2012 | | | 1/1/ – 9/30/2012 | |
| Germany | | | 598 | | | | 1,714 | | | | 575 | | | | 1,666 | |
| Rest of EMEA | | | 1,257 | | | | 3,642 | | | | 1,142 | | | | 3,433 | |
| EMEA | | | 1,854 | | | | 5,356 | | | | 1,716 | | | | 5,099 | |
| United States | | | 1,144 | | | | 3,353 | | | | 1,152 | | | | 3,151 | |
| Rest of Americas | | | 430 | | | | 1,226 | | | | 423 | | | | 1,138 | |
| Americas | | | 1,574 | | | | 4,579 | | | | 1,575 | | | | 4,289 | |
| Japan | | | 157 | | | | 453 | | | | 197 | | | | 557 | |
| Rest of APJ | | | 460 | | | | 1,320 | | | | 463 | | | | 1,254 | |
| APJ | | | 617 | | | | 1,774 | | | | 661 | | | | 1,812 | |
| SAP Group | | | 4,045 | | | | 11,708 | | | | 3,952 | | | | 11,200 | |
(18) Related Party Transactions
Certain Executive Board and Supervisory Board members of SAP AG currently hold (or have held within the last year) positions of significant responsibility with other entities (see the SAP Annual Report 2012, Notes to the Consolidated Financial Statements section, Note (29)). We have relationships with certain of these entities in the ordinary course of business whereby we buy and sell a wide variety of services and products at prices believed to be consistent with those negotiated at arm’s length between unrelated parties.
During the reporting period, we had no related party transactions that had a material effect on our business, financial position, or results in the reporting period.
For more information about related party transactions, see the SAP Integrated Report 2012, Notes to the Consolidated Financial Statements section, Note (30).
(19) Subsequent Events
No events have occurred after September 30, 2013, which have a material impact on the Company’s consolidated financial statements.
Release of the Interim Financial Statements
The SAP Chief Financial Officer on behalf of the Executive Board approved these Consolidated Interim Financial Statements for the third quarter of 2013 on October 17, 2013, for submission to the Audit Committee of the Supervisory Board and for subsequent issuance.
| | |
| INTERIM REPORT JANUARY – SEPTEMBER 2013 | | 55 |
SUPPLEMENTARY FINANCIAL INFORMATION
(UNAUDITED)
RECONCILIATION FROM NON-IFRS NUMBERS TO IFRS NUMBERS
The following tables present a reconciliation from our non-IFRS numbers (including our non-IFRS at constant currency numbers) to the respective most comparable IFRS numbers. Note: Our non-IFRS numbers are not prepared under a comprehensive set of accounting rules or principles.
| | | | | | | | | | | | | | | | | | | | | | | | | | | | | | | | | | | | | | | | | | | | |
| | | For the three months ended September 30 | |
| € millions, unless otherwise stated | | 2013 | | | 2012 | | | Change in % | |
| | | IFRS | | | Adj.* | | | Non-IFRS* | | | Currency Impact** | | | Non-IFRS Constant Currency** | | | IFRS | | | Adj.* | | | Non-IFRS* | | | IFRS | | | Non-IFRS* | | | Non-IFRS Constant Currency** | |
| Revenue Numbers | | | | | | | | | | | | | | | | | | | | | | | | | | | | | | | | | | | | | | | | | | | | |
Software | | | 975 | | | | 2 | | | | 977 | | | | 65 | | | | 1,042 | | | | 1,026 | | | | 0 | | | | 1,026 | | | | –5 | | | | –5 | | | | 2 | |
Cloud subscriptions and support | | | 191 | | | | 5 | | | | 197 | | | | 13 | | | | 209 | | | | 63 | | | | 17 | | | | 80 | | | | 203 | | | | 146 | | | | 162 | |
Software and cloud subscriptions | | | 1,167 | | | | 7 | | | | 1,174 | | | | 78 | | | | 1,252 | | | | 1,089 | | | | 17 | | | | 1,106 | | | | 7 | | | | 6 | | | | 13 | |
Support | | | 2,184 | | | | 5 | | | | 2,189 | | | | 142 | | | | 2,331 | | | | 2,105 | | | | 1 | | | | 2,106 | | | | 4 | | | | 4 | | | | 11 | |
Software and software-related service revenue | | | 3,351 | | | | 12 | | | | 3,363 | | | | 220 | | | | 3,583 | | | | 3,194 | | | | 18 | | | | 3,212 | | | | 5 | | | | 5 | | | | 12 | |
Consulting | | | 553 | | | | 0 | | | | 553 | | | | 35 | | | | 588 | | | | 616 | | | | 0 | | | | 616 | | | | –10 | | | | –10 | | | | –5 | |
Other services | | | 142 | | | | 0 | | | | 142 | | | | 9 | | | | 151 | | | | 142 | | | | 0 | | | | 142 | | | | 0 | | | | 0 | | | | 6 | |
Professional services and other service revenue | | | 695 | | | | 0 | | | | 695 | | | | 44 | | | | 739 | | | | 758 | | | | 0 | | | | 758 | | | | –8 | | | | –8 | | | | –3 | |
| Total revenue | | | 4,045 | | | | 12 | | | | 4,057 | | | | 264 | | | | 4,321 | | | | 3,952 | | | | 18 | | | | 3,970 | | | | 2 | | | | 2 | | | | 9 | |
| | | | | | | | | | | | | | | | | | | | | | | | | | | | | | | | | | | | | | | | | | | | | |
| Operating Expense Numbers | | | | | | | | | | | | | | | | | | | | | | | | | | | | | | | | | | | | | | | | | | | | |
Cost of software and software-related services | | | –636 | | | | 92 | | | | –544 | | | | | | | | | | | | –638 | | | | 106 | | | | –532 | | | | 0 | | | | 2 | | | | | |
Cost of professional services and other services | | | –605 | | | | 34 | | | | –571 | | | | | | | | | | | | –619 | | | | 43 | | | | –576 | | | | –2 | | | | –1 | | | | | |
Total cost of revenue | | | –1,241 | | | | 126 | | | | –1,115 | | | | | | | | | | | | –1,257 | | | | 149 | | | | –1,108 | | | | –1 | | | | 1 | | | | | |
Gross profit | | | 2,804 | | | | 138 | | | | 2,942 | | | | | | | | | | | | 2,695 | | | | 167 | | | | 2,862 | | | | 4 | | | | 3 | | | | | |
Research and development | | | –552 | | | | 31 | | | | –521 | | | | | | | | | | | | –547 | | | | 29 | | | | –518 | | | | 1 | | | | 1 | | | | | |
Sales and marketing | | | –986 | | | | 46 | | | | –940 | | | | | | | | | | | | –984 | | | | 67 | | | | –917 | | | | 0 | | | | 2 | | | | | |
General and administration | | | –207 | | | | 21 | | | | –185 | | | | | | | | | | | | –232 | | | | 44 | | | | –188 | | | | –11 | | | | –2 | | | | | |
Restructuring | | | –17 | | | | 17 | | | | 0 | | | | | | | | | | | | –4 | | | | 4 | | | | 0 | | | | >100 | | | | N/A | | | | | |
TomorrowNow litigation | | | 0 | | | | 0 | | | | 0 | | | | | | | | | | | | –7 | | | | 7 | | | | 0 | | | | <-100 | | | | N/A | | | | | |
Other operating income/expense, net | | | 0 | | | | 0 | | | | 0 | | | | | | | | | | | | 0 | | | | 0 | | | | 0 | | | | 19 | | | | 19 | | | | | |
| Total operating expenses | | | –3,003 | | | | 242 | | | | –2,761 | | | | –135 | | | | –2,896 | | | | –3,031 | | | | 300 | | | | –2,731 | | | | –1 | | | | 1 | | | | 6 | |
| | | | | | | | | | | | | | | | | | | | | | | | | | | | | | | | | | | | | | | | | | | | | |
| Profit Numbers | | | | | | | | | | | | | | | | | | | | | | | | | | | | | | | | | | | | | | | | | | | | |
| Operating profit | | | 1,043 | | | | 253 | | | | 1,296 | | | | 129 | | | | 1,425 | | | | 921 | | | | 318 | | | | 1,239 | | | | 13 | | | | 5 | | | | 15 | |
| Other non-operating income/expense, net | | | –1 | | | | 0 | | | | –1 | | | | | | | | | | | | –92 | | | | 0 | | | | –92 | | | | –99 | | | | –99 | | | | | |
Finance income | | | 38 | | | | 0 | | | | 38 | | | | | | | | | | | | 34 | | | | 0 | | | | 34 | | | | 13 | | | | 13 | | | | | |
Finance costs | | | –45 | | | | 0 | | | | –45 | | | | | | | | | | | | –41 | | | | 0 | | | | –41 | | | | 11 | | | | 11 | | | | | |
| Financial income, net | | | –7 | | | | 0 | | | | –7 | | | | | | | | | | | | –7 | | | | 0 | | | | –7 | | | | 1 | | | | 1 | | | | | |
| Profit before tax | | | 1,035 | | | | 253 | | | | 1,289 | | | | | | | | | | | | 822 | | | | 318 | | | | 1,140 | | | | 26 | | | | 13 | | | | | |
Income tax expense | | | –274 | | | | –82 | | | | –355 | | | | | | | | | | | | –204 | | | | –100 | | | | –304 | | | | 34 | | | | 17 | | | | | |
| Profit after tax | | | 762 | | | | 172 | | | | 933 | | | | | | | | | | | | 618 | | | | 218 | | | | 836 | | | | 23 | | | | 12 | | | | | |
Profit attributable to non-controlling interests | | | 0 | | | | 0 | | | | 0 | | | | | | | | | | | | 0 | | | | 0 | | | | 0 | | | | N/A | | | | N/A | | | | | |
Profit attributable to owners of parent | | | 762 | | | | 172 | | | | 933 | | | | | | | | | | | | 618 | | | | 218 | | | | 836 | | | | 23 | | | | 12 | | | | | |
| | | | | | | | | | | | | | | | | | | | | | | | | | | | | | | | | | | | | | | | | | | | | |
| Key Ratios | | | | | | | | | | | | | | | | | | | | | | | | | | | | | | | | | | | | | | | | | | | | |
| Operating margin (in %) | | | 25.8 | | | | | | | | 32.0 | | | | | | | | 33.0 | | | | 23.3 | | | | | | | | 31.2 | | | | 2.5pp | | | | 0.8pp | | | | 1.8pp | |
| Effective tax rate (in %) | | | 26.4 | | | | | | | | 27.6 | | | | | | | | | | | | 24.8 | | | | | | | | 26.7 | | | | 1.6pp | | | | 0.9pp | | | | | |
| Earnings per share, basic (in€)* | | | 0.64 | | | | | | | | 0.78 | | | | | | | | | | | | 0.52 | | | | | | | | 0.70 | | | | 23 | | | | 11 | | | | | |
| | | | | | | | | | | | | | | | | | | | | | | | | | | | | | | | | | | | | | | | | | | | | |
| Deferred cloud subscriptions and support revenue (September 30) | | | 376 | | | | 6 | | | | 382 | | | | | | | | | | | | 169 | | | | 44 | | | | 213 | | | | >100 | | | | 79 | | | | | |
| | |
| 56 | | SUPPLEMENTARY FINANCIAL INFORMATION |
| | | | | | | | | | | | | | | | | | | | | | | | | | | | | | | | | | | | | | | | | | | | |
| | | For the nine months ended September 30 | |
| € millions, unless otherwise stated | | 2013 | | | 2012 | | | Change in % | |
| | | IFRS | | | Adj.* | | | Non-IFRS* | | | Currency Impact** | | | Non-IFRS Constant Currency** | | | IFRS | | | Adj.* | | | Non-IFRS* | | | IFRS | | | Non-IFRS* | | | Non-IFRS Constant Currency** | |
| Revenue Numbers | | | | | | | | | | | | | | | | | | | | | | | | | | | | | | | | | | | | | | | | | | | | |
Software | | | 2,614 | | | | 2 | | | | 2,616 | | | | 117 | | | | 2,732 | | | | 2,722 | | | | 0 | | | | 2,722 | | | | –4 | | | | –4 | | | | 0 | |
Cloud subscriptions and support | | | 488 | | | | 60 | | | | 547 | | | | 18 | | | | 565 | | | | 144 | | | | 39 | | | | 183 | | | | 238 | | | | 198 | | | | 208 | |
Software and cloud subscriptions | | | 3,101 | | | | 62 | | | | 3,163 | | | | 135 | | | | 3,298 | | | | 2,866 | | | | 40 | | | | 2,905 | | | | 8 | | | | 9 | | | | 14 | |
Support | | | 6,470 | | | | 14 | | | | 6,484 | | | | 249 | | | | 6,733 | | | | 6,071 | | | | 4 | | | | 6,075 | | | | 7 | | | | 7 | | | | 11 | |
Software and software-related service revenue | | | 9,571 | | | | 76 | | | | 9,647 | | | | 384 | | | | 10,030 | | | | 8,937 | | | | 43 | | | | 8,980 | | | | 7 | | | | 7 | | | | 12 | |
Consulting | | | 1,689 | | | | 0 | | | | 1,689 | | | | 59 | | | | 1,748 | | | | 1,830 | | | | 0 | | | | 1,830 | | | | –8 | | | | –8 | | | | –4 | |
Other services | | | 448 | | | | 0 | | | | 448 | | | | 15 | | | | 463 | | | | 433 | | | | 0 | | | | 433 | | | | 3 | | | | 3 | | | | 7 | |
Professional services and other service revenue | | | 2,137 | | | | 0 | | | | 2,137 | | | | 74 | | | | 2,211 | | | | 2,263 | | | | 0 | | | | 2,263 | | | | –6 | | | | –6 | | | | –2 | |
| Total revenue | | | 11,708 | | | | 76 | | | | 11,784 | | | | 458 | | | | 12,242 | | | | 11,200 | | | | 43 | | | | 11,243 | | | | 5 | | | | 5 | | | | 9 | |
| | | | | | | | | | | | | | | | | | | | | | | | | | | | | | | | | | | | | | | | | | | | | |
| Operating Expense Numbers | | | | | | | | | | | | | | | | | | | | | | | | | | | | | | | | | | | | | | | | | | | | |
Cost of software and software-related services | | | –1,838 | | | | 266 | | | | –1,572 | | | | | | | | | | | | –1,743 | | | | 253 | | | | –1,490 | | | | 5 | | | | 6 | | | | | |
Cost of professional services and other services | | | –1,820 | | | | 85 | | | | –1,735 | | | | | | | | | | | | –1,888 | | | | 108 | | | | –1,780 | | | | –4 | | | | –3 | | | | | |
Total cost of revenue | | | –3,658 | | | | 351 | | | | –3,307 | | | | | | | | | | | | –3,631 | | | | 361 | | | | –3,270 | | | | 1 | | | | 1 | | | | | |
Gross profit | | | 8,050 | | | | 426 | | | | 8,477 | | | | | | | | | | | | 7,569 | | | | 404 | | | | 7,973 | | | | 6 | | | | 6 | | | | | |
Research and development | | | –1,676 | | | | 69 | | | | –1,607 | | | | | | | | | | | | –1,638 | | | | 97 | | | | –1,541 | | | | 2 | | | | 4 | | | | | |
Sales and marketing | | | –3,021 | | | | 142 | | | | –2,879 | | | | | | | | | | | | –2,786 | | | | 177 | | | | –2,609 | | | | 8 | | | | 10 | | | | | |
General and administration | | | –635 | | | | 55 | | | | –581 | | | | | | | | | | | | –664 | | | | 85 | | | | –579 | | | | –4 | | | | 0 | | | | | |
Restructuring | | | –47 | | | | 47 | | | | 0 | | | | | | | | | | | | –8 | | | | 8 | | | | 0 | | | | >100 | | | | N/A | | | | | |
TomorrowNow litigation | | | 0 | | | | 0 | | | | 0 | | | | | | | | | | | | –1 | | | | 1 | | | | 0 | | | | <-100 | | | | N/A | | | | | |
Other operating income/expense, net | | | 6 | | | | 0 | | | | 6 | | | | | | | | | | | | 1 | | | | 0 | | | | 1 | | | | >100 | | | | >100 | | | | | |
| Total operating expenses | | | –9,031 | | | | 663 | | | | –8,368 | | | | –229 | | | | –8,597 | | | | –8,727 | | | | 729 | | | | –7,998 | | | | 3 | | | | 5 | | | | 7 | |
| | | | | | | | | | | | | | | | | | | | | | | | | | | | | | | | | | | | | | | | | | | | | |
| Profit Numbers | | | | | | | | | | | | | | | | | | | | | | | | | | | | | | | | | | | | | | | | | | | | |
| Operating profit | | | 2,677 | | | | 739 | | | | 3,416 | | | | 229 | | | | 3,645 | | | | 2,473 | | | | 772 | | | | 3,245 | | | | 8 | | | | 5 | | | | 12 | |
| Other non-operating income/expense, net | | | –14 | | | | 0 | | | | –14 | | | | | | | | | | | | –145 | | | | 0 | | | | –145 | | | | –91 | | | | –91 | | | | | |
Finance income | | | 94 | | | | 0 | | | | 94 | | | | | | | | | | | | 86 | | | | 0 | | | | 86 | | | | 10 | | | | 10 | | | | | |
Finance costs | | | –138 | | | | 0 | | | | –138 | | | | | | | | | | | | –119 | | | | 1 | | | | –118 | | | | 16 | | | | 17 | | | | | |
| Financial income, net | | | –44 | | | | 0 | | | | –44 | | | | | | | | | | | | –33 | | | | 1 | | | | –32 | | | | 33 | | | | 38 | | | | | |
| Profit before tax | | | 2,620 | | | | 739 | | | | 3,359 | | | | | | | | | | | | 2,295 | | | | 773 | | | | 3,068 | | | | 14 | | | | 9 | | | | | |
Income tax expense | | | –614 | | | | –248 | | | | –861 | | | | | | | | | | | | –572 | | | | –247 | | | | –819 | | | | 7 | | | | 5 | | | | | |
| Profit after tax | | | 2,006 | | | | 491 | | | | 2,498 | | | | | | | | | | | | 1,723 | | | | 526 | | | | 2,249 | | | | 16 | | | | 11 | | | | | |
Profit attributable to non-controlling interests | | | 0 | | | | 0 | | | | 0 | | | | | | | | | | | | 0 | | | | 0 | | | | 0 | | | | N/A | | | | N/A | | | | | |
Profit attributable to owners of parent | | | 2,006 | | | | 491 | | | | 2,498 | | | | | | | | | | | | 1,723 | | | | 526 | | | | 2,249 | | | | 16 | | | | 11 | | | | | |
| | | | | | | | | | | | | | | | | | | | | | | | | | | | | | | | | | | | | | | | | | | | | |
| Key Ratios | | | | | | | | | | | | | | | | | | | | | | | | | | | | | | | | | | | | | | | | | | | | |
| Operating margin (in %) | | | 22.9 | | | | | | | | 29.0 | | | | | | | | 29.8 | | | | 22.1 | | | | | | | | 28.9 | | | | 0.8pp | | | | 0.1pp | | | | 0.9pp | |
| Effective tax rate (in %) | | | 23.4 | | | | | | | | 25.6 | | | | | | | | | | | | 24.9 | | | | | | | | 26.7 | | | | –1.5pp | | | | –1.1pp | | | | | |
| Earnings per share, basic (in€)* | | | 1.68 | | | | | | | | 2.09 | | | | | | | | | | | | 1.45 | | | | | | | | 1.89 | | | | 16 | | | | 11 | | | | | |
| | | | | | | | | | | | | | | | | | | | | | | | | | | | | | | | | | | | | | | | | | | | | |
| Deferred cloud subscriptions and support revenue (September 30) | | | 376 | | | | 6 | | | | 382 | | | | | | | | | | | | 169 | | | | 44 | | | | 213 | | | | >100 | | | | 79 | | | | | |
* Adjustments in the revenue line items are for support revenue, cloud subscription revenue, and other similarly recurring revenues that entities acquired by SAP would have recognized had they remained stand-alone entities but that SAP is not permitted to recognize as revenue under IFRS as a result of business combination accounting rules. Adjustments in the operating expense line items are for acquisition-related charges, share-based compensation expenses, restructuring expenses, and discontinued activities.
** Constant currency revenue and operating income figures are calculated by translating revenue and operating income of the current period using the average exchange rates from the previous year’s respective period instead of the current period. Constant currency period-over-period changes are calculated by comparing the current year’s non-IFRS constant currency numbers with the non-IFRS number of the previous year’s respective period.
Due to rounding, numbers may not add up precisely.
| | |
| INTERIM REPORT JANUARY – SEPTEMBER 2013 | | 57 |
REVENUE BY REGION
The following table presents our IFRS and non-IFRS revenue by region. Details regarding the different views (based on location of contract negotiation respectively by customer location are described in the note “Segment and Geographic Information” of our Consolidated Financial Statements. The table also presents a reconciliation from our non-IFRS revenue (including our non-IFRS revenue at constant currency) to the respective most comparable IFRS revenue.
Note: Our non- IFRS revenues are not prepared under a comprehensive set of accounting rules or principles.
| | | | | | | | | | | | | | | | | | | | | | | | | | | | | | | | | | | | | | | | | | | | |
Revenues by Region - Management View | | | |
| | | | | | | | | | | | | | | | | | | | | | | | | | | | | | | | | | |
| | | For the three months ended September 30 | |
| € millions | | 2013 | | | 2012 | | | Change in % | |
| | | IFRS | | | Adj.* | | | Non-IFRS* | | | Currency Impact** | | | Non-IFRS Constant Currency** | | | IFRS | | | Adj.* | | | Non-IFRS* | | | IFRS | | | Non-IFRS* | | | Non-IFRS Constant Currency** | |
| Software revenue by region | | | | | | | | | | | | | | | | | | | | | | | | | | | | | | | | | | | | | | | | | | | | |
EMEA | | | 402 | | | | 1 | | | | 403 | | | | 8 | | | | 411 | | | | 374 | | | | 0 | | | | 374 | | | | 7 | | | | 8 | | | | 10 | |
Americas | | | 398 | | | | 0 | | | | 398 | | | | 34 | | | | 432 | | | | 458 | | | | 0 | | | | 458 | | | | –13 | | | | –13 | | | | –6 | |
APJ | | | 176 | | | | 0 | | | | 176 | | | | 23 | | | | 199 | | | | 194 | | | | 0 | | | | 194 | | | | –9 | | | | –9 | | | | 3 | |
| Software revenue | | | 975 | | | | 2 | | | | 977 | | | | 65 | | | | 1,042 | | | | 1,026 | | | | 0 | | | | 1,026 | | | | –5 | | | | –5 | | | | 2 | |
| | | | | | | | | | | | | | | | | | | | | | | | | | | | | | | | | | | | | | | | | | | | | |
| Software revenue by location of negotiation and cloud subscription revenue by region | | | | | | | | | | | | | | | | | | | | | | | | | | | | | | | | | | | | | | | | | | | | |
EMEA | | | 433 | | | | 1 | | | | 434 | | | | 9 | | | | 443 | | | | 390 | | | | 0 | | | | 390 | | | | 11 | | | | 11 | | | | 14 | |
Americas | | | 550 | | | | 5 | | | | 555 | | | | 45 | | | | 600 | | | | 502 | | | | 16 | | | | 518 | | | | 10 | | | | 8 | | | | 17 | |
APJ | | | 185 | | | | 0 | | | | 185 | | | | 24 | | | | 209 | | | | 197 | | | | 0 | | | | 197 | | | | –6 | | | | –6 | | | | 6 | |
| Software revenue by location of negotiation and cloud subscription revenue | | | 1,167 | | | | 7 | | | | 1,174 | | | | 78 | | | | 1,252 | | | | 1,089 | | | | 17 | | | | 1,106 | | | | 7 | | | | 6 | | | | 13 | |
| | | | | | | | | | | | | | | | | | | | | | | | | | | | | | | | | | | | | | | | | | | | | |
| Revenues by Regions – Location of Customers | | | | | | | | | | | | | | | | | | | | | | | | | | | | | | | | | | | | | | | | | | | | |
| | | | | | | | | | | | | | | | | | | | | | | | | | | | | | | | | | |
| | | For the three months ended September 30 | |
| € millions | | 2013 | | | 2012 | | | Change in % | |
| | | IFRS | | | Adj.* | | | Non-IFRS* | | | Currency Impact** | | | Non-IFRS Constant Currency** | | | IFRS | | | Adj.* | | | Non-IFRS* | | | IFRS | | | Non-IFRS* | | | Non-IFRS Constant Currency** | |
| Software revenue by region | | | | | | | | | | | | | | | | | | | | | | | | | | | | | | | | | | | | | | | | | | | | |
EMEA | | | 422 | | | | 1 | | | | 423 | | | | 10 | | | | 433 | | | | 373 | | | | 0 | | | | 373 | | | | 13 | | | | 13 | | | | 16 | |
Americas | | | 364 | | | | 1 | | | | 365 | | | | 32 | | | | 397 | | | | 459 | | | | 0 | | | | 459 | | | | –21 | | | | –20 | | | | –14 | |
APJ | | | 189 | | | | 0 | | | | 189 | | | | 24 | | | | 213 | | | | 194 | | | | 0 | | | | 194 | | | | –3 | | | | –3 | | | | 10 | |
| Software revenue | | | 975 | | | | 2 | | | | 977 | | | | 65 | | | | 1,042 | | | | 1,026 | | | | 0 | | | | 1,026 | | | | –5 | | | | –5 | | | | 2 | |
| | | | | | | | | | | | | | | | | | | | | | | | | | | | | | | | | | | | | | | | | | | | | |
| Cloud subscriptions and support revenue by region | | | | | | | | | | | | | | | | | | | | | | | | | | | | | | | | | | | | | | | | | | | | |
EMEA | | | 31 | | | | 0 | | | | 31 | | | | 1 | | | | 32 | | | | 16 | | | | 0 | | | | 16 | | | | 89 | | | | 89 | | | | 97 | |
Americas | | | 152 | | | | 5 | | | | 157 | | | | 11 | | | | 168 | | | | 44 | | | | 16 | | | | 60 | | | | >100 | | | | >100 | | | | >100 | |
APJ | | | 9 | | | | 0 | | | | 9 | | | | 1 | | | | 10 | | | | 3 | | | | 0 | | | | 3 | | | | >100 | | | | >100 | | | | >100 | |
| Cloud subscriptions and support revenue | | | 191 | | | | 5 | | | | 197 | | | | 13 | | | | 209 | | | | 63 | | | | 17 | | | | 80 | | | | 203 | | | | 146 | | | | 162 | |
| | | | | | | | | | | | | | | | | | | | | | | | | | | | | | | | | | | | | | | | | | | | | |
| Software and cloud subscription revenue by region | | | | | | | | | | | | | | | | | | | | | | | | | | | | | | | | | | | | | | | | | | | | |
EMEA | | | 452 | | | | 2 | | | | 454 | | | | 11 | | | | 465 | | | | 390 | | | | 0 | | | | 390 | | | | 16 | | | | 16 | | | | 19 | |
Americas | | | 516 | | | | 6 | | | | 522 | | | | 42 | | | | 564 | | | | 502 | | | | 17 | | | | 519 | | | | 3 | | | | 1 | | | | 9 | |
APJ | | | 198 | | | | 0 | | | | 198 | | | | 25 | | | | 223 | | | | 197 | | | | 0 | | | | 197 | | | | 1 | | | | 1 | | | | 13 | |
| Software and cloud subscription revenue | | | 1,167 | | | | 7 | | | | 1,174 | | | | 78 | | | | 1,252 | | | | 1,089 | | | | 17 | | | | 1,106 | | | | 7 | | | | 6 | | | | 13 | |
| | |
| 58 | | SUPPLEMENTARY FINANCIAL INFORMATION |
| | | | | | | | | | | | | | | | | | | | | | | | | | | | | | | | | | | | | | | | | | | | |
Software and software-related service revenue by region | | | | | | | | | | | | | | | | | | | | | | | | | | | | | | | | | | | | | | | | | | | | |
Germany | | | 470 | | | | 0 | | | | 470 | | | | 1 | | | | 471 | | | | 438 | | | | 0 | | | | 438 | | | | 7 | | | | 7 | | | | 7 | |
Rest of EMEA | | | 1,062 | | | | 2 | | | | 1,064 | | | | 34 | | | | 1,098 | | | | 957 | | | | 0 | | | | 957 | | | | 11 | | | | 11 | | | | 15 | |
Total EMEA | | | 1,531 | | | | 3 | | | | 1,534 | | | | 34 | | | | 1,568 | | | | 1,395 | | | | 0 | | | | 1,395 | | | | 10 | | | | 10 | | | | 12 | |
United States | | | 931 | | | | 8 | | | | 939 | | | | 53 | | | | 992 | | | | 921 | | | | 18 | | | | 939 | | | | 1 | | | | 0 | | | | 6 | |
Rest of Americas | | | 357 | | | | 1 | | | | 358 | | | | 49 | | | | 407 | | | | 326 | | | | 0 | | | | 326 | | | | 10 | | | | 10 | | | | 25 | |
Total Americas | | | 1,288 | | | | 9 | | | | 1,297 | | | | 102 | | | | 1,399 | | | | 1,247 | | | | 18 | | | | 1,265 | | | | 3 | | | | 3 | | | | 11 | |
Japan | | | 140 | | | | 0 | | | | 140 | | | | 46 | | | | 186 | | | | 174 | | | | 0 | | | | 174 | | | | –20 | | | | –20 | | | | 7 | |
Rest of APJ | | | 391 | | | | 0 | | | | 391 | | | | 38 | | | | 429 | | | | 377 | | | | 0 | | | | 377 | | | | 4 | | | | 4 | | | | 14 | |
Total APJ | | | 531 | | | | 0 | | | | 531 | | | | 84 | | | | 615 | | | | 552 | | | | 0 | | | | 552 | | | | –4 | | | | –4 | | | | 12 | |
Software and software-related service revenue | | | 3,351 | | | | 12 | | | | 3,363 | | | | 220 | | | | 3,583 | | | | 3,194 | | | | 18 | | | | 3,212 | | | | 5 | | | | 5 | | | | 12 | |
| | | | | | | | | | | | | | | | | | | | | | | | | | | | | | | | | | | | | | | | | | | | | |
| Total revenue by region | | | | | | | | | | | | | | | | | | | | | | | | | | | | | | | | | | | | | | | | | | | | |
Germany | | | 598 | | | | 0 | | | | 598 | | | | 0 | | | | 598 | | | | 575 | | | | 0 | | | | 575 | | | | 4 | | | | 4 | | | | 4 | |
Rest of EMEA | | | 1,257 | | | | 2 | | | | 1,259 | | | | 43 | | | | 1,302 | | | | 1,142 | | | | 0 | | | | 1,142 | | | | 10 | | | | 10 | | | | 14 | |
Total EMEA | | | 1,854 | | | | 3 | | | | 1,857 | | | | 43 | | | | 1,900 | | | | 1,716 | | | | 0 | | | | 1,716 | | | | 8 | | | | 8 | | | | 11 | |
United States | | | 1,144 | | | | 8 | | | | 1,152 | | | | 65 | | | | 1,217 | | | | 1,152 | | | | 18 | | | | 1,170 | | | | –1 | | | | –2 | | | | 4 | |
Rest of Americas | | | 430 | | | | 1 | | | | 431 | | | | 57 | | | | 488 | | | | 423 | | | | 0 | | | | 423 | | | | 2 | | | | 2 | | | | 15 | |
Total Americas | | | 1,574 | | | | 9 | | | | 1,583 | | | | 122 | | | | 1,705 | | | | 1,575 | | | | 18 | | | | 1,593 | | | | 0 | | | | –1 | | | | 7 | |
Japan | | | 157 | | | | 0 | | | | 157 | | | | 52 | | | | 209 | | | | 197 | | | | 0 | | | | 197 | | | | –20 | | | | –20 | | | | 6 | |
Rest of APJ | | | 460 | | | | 0 | | | | 460 | | | | 47 | | | | 507 | | | | 463 | | | | 0 | | | | 463 | | | | –1 | | | | –1 | | | | 10 | |
Total APJ | | | 617 | | | | 1 | | | | 618 | | | | 98 | | | | 716 | | | | 661 | | | | 0 | | | | 661 | | | | –7 | | | | –7 | | | | 8 | |
| Total revenue | | | 4,045 | | | | 12 | | | | 4,057 | | | | 264 | | | | 4,321 | | | | 3,952 | | | | 18 | | | | 3,970 | | | | 2 | | | | 2 | | | | 9 | |
| | |
| INTERIM REPORT JANUARY – SEPTEMBER 2013 | | 59 |
| | | | | | | | | | | | | | | | | | | | | | | | | | | | | | | | | | | | | | | | | | | | |
Revenues by Region - Management View | | | |
| | | | | | | | | | | | | | | | | | | | | | | | | | | | | | | | | | |
| | | For the nine months ended September 30 | |
| € millions | | 2013 | | | 2012 | | | Change in % | |
| | | IFRS | | | Adj.* | | | Non-IFRS* | | | Currency Impact** | | | Non-IFRS Constant Currency** | | | IFRS | | | Adj.* | | | Non-IFRS* | | | IFRS | | | Non-IFRS* | | | Non-IFRS Constant Currency** | |
| Software revenue by region | | | | | | | | | | | | | | | | | | | | | | | | | | | | | | | | | | | | | | | | | | | | |
EMEA | | | 1,116 | | | | 2 | | | | 1,118 | | | | 19 | | | | 1,137 | | | | 1,069 | | | | 0 | | | | 1,069 | | | | 4 | | | | 5 | | | | 6 | |
Americas | | | 1,043 | | | | 1 | | | | 1,044 | | | | 58 | | | | 1,102 | | | | 1,131 | | | | 0 | | | | 1,131 | | | | –8 | | | | –8 | | | | –3 | |
APJ | | | 454 | | | | 0 | | | | 454 | | | | 40 | | | | 494 | | | | 522 | | | | 0 | | | | 522 | | | | –13 | | | | –13 | | | | –5 | |
| Software revenue | | | 2,614 | | | | 2 | | | | 2,616 | | | | 117 | | | | 2,732 | | | | 2,722 | | | | 0 | | | | 2,722 | | | | –4 | | | | –4 | | | | 0 | |
| | | | | | | | | | | | | | | | | | | | | | | | | | | | | | | | | | | | | | | | | | | | | |
| Software revenue by location of negotiation and cloud subscription revenue by region | | | | | | | | | | | | | | | | | | | | | | | | | | | | | | | | | | | | | | | | | | | | |
EMEA | | | 1,197 | | | | 2 | | | | 1,199 | | | | 21 | | | | 1,220 | | | | 1,113 | | | | 0 | | | | 1,113 | | | | 8 | | | | 8 | | | | 10 | |
Americas | | | 1,425 | | | | 60 | | | | 1,485 | | | | 73 | | | | 1,558 | | | | 1,222 | | | | 40 | | | | 1,262 | | | | 17 | | | | 18 | | | | 23 | |
APJ | | | 479 | | | | 0 | | | | 479 | | | | 41 | | | | 520 | | | | 531 | | | | 0 | | | | 531 | | | | –10 | | | | –10 | | | | –2 | |
| Software revenue by location of negotiation and cloud subscription revenue | | | 3,101 | | | | 62 | | | | 3,163 | | | | 135 | | | | 3,298 | | | | 2,866 | | | | 39 | | | | 2,905 | | | | 8 | | | | 9 | | | | 14 | |
| | | | | | | | | | | | | | | | | | | | | | | | | | | | | | | | | | | | | | | | | | | | | |
| | | | | | | | | | | | | | | | | | | | | | | | | | | | | | | | | | | | | | | | | | | | | |
| Revenues by Regions – Location of Customers | | | | | | | | | | | | | | | | | | | | | | | | | | | | | | | | | | | | | | | | | | | | |
| | | | | | | | | | | | | | | | | | | | | | | | | | | | | | | | | | |
| | | For the nine months ended September 30 | |
| € millions | | 2013 | | | 2012 | | | Change in % | |
| | | IFRS | | | Adj.* | | | Non-IFRS* | | | Currency Impact** | | | Non-IFRS Constant Currency** | | | IFRS | | | Adj.* | | | Non-IFRS* | | | IFRS | | | Non-IFRS* | | | Non-IFRS Constant Currency** | |
| Software revenue by region | | | | | | | | | | | | | | | | | | | | | | | | | | | | | | | | | | | | | | | | | | | | |
EMEA | | | 1,138 | | | | 1 | | | | 1,139 | | | | 20 | | | | 1,159 | | | | 1,105 | | | | 0 | | | | 1,105 | | | | 3 | | | | 3 | | | | 5 | |
Americas | | | 1,007 | | | | 1 | | | | 1,008 | | | | 55 | | | | 1,063 | | | | 1,090 | | | | 0 | | | | 1,090 | | | | –8 | | | | –8 | | | | –2 | |
APJ | | | 469 | | | | 0 | | | | 469 | | | | 41 | | | | 510 | | | | 527 | | | | 0 | | | | 527 | | | | –11 | | | | –11 | | | | –3 | |
| Software revenue | | | 2,614 | | | | 2 | | | | 2,616 | | | | 117 | | | | 2,732 | | | | 2,722 | | | | 0 | | | | 2,722 | | | | –4 | | | | –4 | | | | 0 | |
| | | | | | | | | | | | | | | | | | | | | | | | | | | | | | | | | | | | | | | | | | | | | |
| Cloud subscriptions and support revenue by region | | | | | | | | | | | | | | | | | | | | | | | | | | | | | | | | | | | | | | | | | | | | |
EMEA | | | 81 | | | | 0 | | | | 81 | | | | 2 | | | | 83 | | | | 44 | | | | 0 | | | | 44 | | | | 84 | | | | 84 | | | | 88 | |
Americas | | | 382 | | | | 59 | | | | 441 | | | | 15 | | | | 456 | | | | 91 | | | | 40 | | | | 131 | | | | >100 | | | | >100 | | | | >100 | |
APJ | | | 25 | | | | 0 | | | | 25 | | | | 1 | | | | 26 | | | | 9 | | | | 0 | | | | 9 | | | | >100 | | | | >100 | | | | >100 | |
| Cloud subscriptions and support revenue | | | 488 | | | | 60 | | | | 547 | | | | 18 | | | | 565 | | | | 144 | | | | 40 | | | | 184 | | | | 238 | | | | 198 | | | | 208 | |
| | | | | | | | | | | | | | | | | | | | | | | | | | | | | | | | | | | | | | | | | | | | | |
| Software and cloud subscription revenue by region | | | | | | | | | | | | | | | | | | | | | | | | | | | | | | | | | | | | | | | | | | | | |
EMEA | | | 1,219 | | | | 1 | | | | 1,220 | | | | 23 | | | | 1,243 | | | | 1,149 | | | | 0 | | | | 1,149 | | | | 6 | | | | 6 | | | | 8 | |
Americas | | | 1,389 | | | | 61 | | | | 1,450 | | | | 70 | | | | 1,520 | | | | 1,181 | | | | 39 | | | | 1,220 | | | | 18 | | | | 19 | | | | 25 | |
APJ | | | 493 | | | | 0 | | | | 493 | | | | 43 | | | | 536 | | | | 536 | | | | 0 | | | | 536 | | | | –8 | | | | –8 | | | | 0 | |
| Software and cloud subscription revenue | | | 3,101 | | | | 62 | | | | 3,163 | | | | 135 | | | | 3,298 | | | | 2,866 | | | | 39 | | | | 2,905 | | | | 8 | | | | 9 | | | | 14 | |
| | |
| 60 | | SUPPLEMENTARY FINANCIAL INFORMATION |
| | | | | | | | | | | | | | | | | | | | | | | | | | | | | | | | | | | | | | | | | | | | |
| Software and software-related service revenue by region | | | | | | | | | | | | | | | | | | | | | | | | | | | | | | | | | | | | | | | | | | | | |
Germany | | | 1,324 | | | | 0 | | | | 1,324 | | | | 0 | | | | 1,324 | | | | 1,245 | | | | 1 | | | | 1,246 | | | | 6 | | | | 6 | | | | 6 | |
Rest of EMEA | | | 3,052 | | | | 2 | | | | 3,054 | | | | 67 | | | | 3,121 | | | | 2,845 | | | | 1 | | | | 2,846 | | | | 7 | | | | 7 | | | | 10 | |
Total EMEA | | | 4,376 | | | | 2 | | | | 4,378 | | | | 67 | | | | 4,445 | | | | 4,090 | | | | 2 | | | | 4,092 | | | | 7 | | | | 7 | | | | 9 | |
United States | | | 2,692 | | | | 71 | | | | 2,763 | | | | 84 | | | | 2,847 | | | | 2,456 | | | | 41 | | | | 2,497 | | | | 10 | | | | 11 | | | | 14 | |
Rest of Americas | | | 1,002 | | | | 1 | | | | 1,003 | | | | 81 | | | | 1,084 | | | | 872 | | | | 0 | | | | 872 | | | | 15 | | | | 15 | | | | 24 | |
Total Americas | | | 3,693 | | | | 73 | | | | 3,766 | | | | 164 | | | | 3,930 | | | | 3,328 | | | | 41 | | | | 3,369 | | | | 11 | | | | 12 | | | | 17 | |
Japan | | | 403 | | | | 0 | | | | 403 | | | | 101 | | | | 504 | | | | 489 | | | | 0 | | | | 489 | | | | –18 | | | | –18 | | | | 3 | |
Rest of APJ | | | 1,100 | | | | 0 | | | | 1,100 | | | | 51 | | | | 1,151 | | | | 1,030 | | | | 0 | | | | 1,030 | | | | 7 | | | | 7 | | | | 12 | |
Total APJ | | | 1,502 | | | | 0 | | | | 1,502 | | | | 153 | | | | 1,655 | | | | 1,519 | | | | 0 | | | | 1,519 | | | | –1 | | | | –1 | | | | 9 | |
| Software and software-related service revenue | | | 9,571 | | | | 76 | | | | 9,647 | | | | 384 | | | | 10,030 | | | | 8,937 | | | | 43 | | | | 8,980 | | | | 7 | | | | 7 | | | | 12 | |
| | | | | | | | | | | | | | | | | | | | | | | | | | | | | | | | | | | | | | | | | | | | | |
| Total revenue by region | | | | | | | | | | | | | | | | | | | | | | | | | | | | | | | | | | | | | | | | | | | | |
Germany | | | 1,714 | | | | 0 | | | | 1,714 | | | | 0 | | | | 1,714 | | | | 1,666 | | | | 1 | | | | 1,667 | | | | 3 | | | | 3 | | | | 3 | |
Rest of EMEA | | | 3,642 | | | | 2 | | | | 3,644 | | | | 83 | | | | 3,727 | | | | 3,433 | | | | 1 | | | | 3,434 | | | | 6 | | | | 6 | | | | 9 | |
Total EMEA | | | 5,356 | | | | 3 | | | | 5,359 | | | | 82 | | | | 5,441 | | | | 5,099 | | | | 2 | | | | 5,101 | | | | 5 | | | | 5 | | | | 7 | |
United States | | | 3,353 | | | | 71 | | | | 3,424 | | | | 102 | | | | 3,526 | | | | 3,151 | | | | 41 | | | | 3,192 | | | | 6 | | | | 7 | | | | 10 | |
Rest of Americas | | | 1,226 | | | | 1 | | | | 1,227 | | | | 97 | | | | 1,324 | | | | 1,138 | | | | 0 | | | | 1,138 | | | | 8 | | | | 8 | | | | 16 | |
Total Americas | | | 4,579 | | | | 72 | | | | 4,651 | | | | 199 | | | | 4,850 | | | | 4,289 | | | | 41 | | | | 4,330 | | | | 7 | | | | 7 | | | | 12 | |
Japan | | | 453 | | | | 0 | | | | 453 | | | | 114 | | | | 567 | | | | 557 | | | | 0 | | | | 557 | | | | –19 | | | | –19 | | | | 2 | |
Rest of APJ | | | 1,320 | | | | 0 | | | | 1,320 | | | | 64 | | | | 1,384 | | | | 1,254 | | | | 0 | | | | 1,254 | | | | 5 | | | | 5 | | | | 10 | |
Total APJ | | | 1,774 | | | | 0 | | | | 1,774 | | | | 177 | | | | 1,951 | | | | 1,812 | | | | 0 | | | | 1,812 | | | | –2 | | | | –2 | | | | 8 | |
| Total revenue | | | 11,708 | | | | 76 | | | | 11,784 | | | | 458 | | | | 12,242 | | | | 11,200 | | | | 43 | | | | 11,243 | | | | 5 | | | | 5 | | | | 9 | |
* Adjustments in the revenue line items are for support revenue, cloud subscription revenue, and other similarly recurring revenues that entities acquired by SAP would have recognized had they remained stand-alone entities but that SAP is not permitted to recognize as revenue under IFRS as a result of business combination accounting rules.
** Constant currency revenue figures are calculated by translating revenue of the current period using the average exchange rates from the previous year’s respective period instead of the current period. Constant currency period-over-period changes are calculated by comparing the current year’s non-IFRS constant currency numbers with the non-IFRS number of the previous year’s respective period.
For a more detailed description of these adjustments and their limitations as well as our constant currency figures, see our Web site www.sap.com/corporate-en/investors/newsandreports/reporting-framework.epx under “Non-IFRS Measures and Estimates.”
Due to rounding, numbers may not add up precisely.
| | |
| INTERIM REPORT JANUARY – SEPTEMBER 2013 | | 61 |
MULTI-QUARTER SUMMARY
(IFRS AND NON-IFRS)
| | | | | | | | | | | | | | | | | | | | | | | | | | | | | | | | |
| € millions, unless otherwise stated | | Q1/2012 | | | Q2/2012 | | | Q3/2012 | | | Q4/2012 | | | TY 2012 | | | Q1/2013 | | | Q2/2013 | | | Q3/2013 | |
| Software (IFRS) | | | 637 | | | | 1,059 | | | | 1,026 | | | | 1,937 | | | | 4,658 | | | | 657 | | | | 982 | | | | 975 | |
Revenue adjustment* | | | 0 | | | | 0 | | | | 0 | | | | 0 | | | | 0 | | | | 0 | | | | 0 | | | | 2 | |
| Software (non-IFRS) | | | 637 | | | | 1,059 | | | | 1,026 | | | | 1,937 | | | | 4,658 | | | | 657 | | | | 982 | | | | 977 | |
| Cloud subscriptions and support (IFRS) | | | 29 | | | | 52 | | | | 63 | | | | 126 | | | | 270 | | | | 137 | | | | 159 | | | | 191 | |
Revenue adjustment* | | | 6 | | | | 17 | | | | 17 | | | | 33 | | | | 73 | | | | 30 | | | | 24 | | | | 5 | |
| Cloud subscriptions and support (non-IFRS) | | | 35 | | | | 69 | | | | 80 | | | | 159 | | | | 343 | | | | 167 | | | | 183 | | | | 197 | |
| Support (IFRS) | | | 1,953 | | | | 2,013 | | | | 2,105 | | | | 2,166 | | | | 8,237 | | | | 2,109 | | | | 2,177 | | | | 2,184 | |
Revenue adjustment* | | | 1 | | | | 1 | | | | 1 | | | | 5 | | | | 9 | | | | 4 | | | | 5 | | | | 5 | |
| Support (non-IFRS) | | | 1,954 | | | | 2,014 | | | | 2,106 | | | | 2,171 | | | | 8,246 | | | | 2,113 | | | | 2,182 | | | | 2,189 | |
| Software and software-related service revenue (IFRS) | | | 2,619 | | | | 3,124 | | | | 3,194 | | | | 4,228 | | | | 13,165 | | | | 2,903 | | | | 3,318 | | | | 3,351 | |
Revenue adjustment* | | | 7 | | | | 18 | | | | 18 | | | | 38 | | | | 81 | | | | 35 | | | | 29 | | | | 12 | |
| Software and software-related service revenue (non-IFRS) | | | 2,626 | | | | 3,142 | | | | 3,212 | | | | 4,266 | | | | 13,246 | | | | 2,937 | | | | 3,347 | | | | 3,363 | |
| | | | | | | | | | | | | | | | | | | | | | | | | | | | | | | | | |
| Total revenue (IFRS) | | | 3,350 | | | | 3,898 | | | | 3,952 | | | | 5,023 | | | | 16,223 | | | | 3,601 | | | | 4,062 | | | | 4,045 | |
Revenue adjustment* | | | 7 | | | | 18 | | | | 18 | | | | 38 | | | | 81 | | | | 35 | | | | 29 | | | | 12 | |
| Total revenue (non-IFRS) | | | 3,357 | | | | 3,916 | | | | 3,970 | | | | 5,062 | | | | 16,304 | | | | 3,636 | | | | 4,091 | | | | 4,057 | |
| | | | | | | | | | | | | | | | | | | | | | | | | | | | | | | | | |
| Operating profit (IFRS) | | | 631 | | | | 921 | | | | 921 | | | | 1,592 | | | | 4,065 | | | | 646 | | | | 988 | | | | 1,043 | |
Revenue adjustment* | | | 7 | | | | 18 | | | | 18 | | | | 38 | | | | 81 | | | | 35 | | | | 29 | | | | 12 | |
Expense adjustment* | | | 196 | | | | 234 | | | | 300 | | | | 338 | | | | 1,067 | | | | 221 | | | | 201 | | | | 242 | |
| Operating profit (non-IFRS) | | | 834 | | | | 1,173 | | | | 1,239 | | | | 1,969 | | | | 5,214 | | | | 901 | | | | 1,219 | | | | 1,296 | |
| | | | | | | | | | | | | | | | | | | | | | | | | | | | | | | | | |
| Operating margin (IFRS) (in %) | | | 18.8 | | | | 23.6 | | | | 23.3 | | | | 31.7 | | | | 25.1 | | | | 17.9 | | | | 24.3 | | | | 25.8 | |
| Operating margin (non-IFRS) (in %) | | | 24.8 | | | | 30.0 | | | | 31.2 | | | | 38.9 | | | | 32.0 | | | | 24.8 | | | | 29.8 | | | | 32.0 | |
| | | | | | | | | | | | | | | | | | | | | | | | | | | | | | | | | |
| Effective tax rate (IFRS) (in %) | | | 26.9 | | | | 23.6 | | | | 24.8 | | | | 28.0 | | | | 26.2 | | | | 16.3 | | | | 24.8 | | | | 26.4 | |
| Effective tax rate (non-IFRS) (in %) | | | 28.1 | | | | 25.6 | | | | 26.7 | | | | 28.7 | | | | 27.5 | | | | 21.4 | | | | 26.8 | | | | 27.6 | |
| | | | | | | | | | | | | | | | | | | | | | | | | | | | | | | | | |
| Earnings per share, basic (IFRS) (in€) | | | 0.37 | | | | 0.55 | | | | 0.52 | | | | 0.92 | | | | 2.37 | | | | 0.44 | | | | 0.61 | | | | 0.64 | |
| Earnings per share, basic (non-IFRS) (in€) | | | 0.49 | | | | 0.70 | | | | 0.70 | | | | 1.14 | | | | 3.03 | | | | 0.58 | | | | 0.73 | | | | 0.78 | |
| | | | | | | | | | | | | | | | | | | | | | | | | | | | | | | | | |
| Net cash flows from operating activities | | | 2,071 | | | | 329 | | | | 657 | | | | 765 | | | | 3,822 | | | | 2,162 | | | | 320 | | | | 558 | |
Purchases of intangible assets, and property, plant and equipment | | | –113 | | | | –162 | | | | –95 | | | | –171 | | | | –541 | | | | –113 | | | | –152 | | | | –136 | |
| Free cash flow | | | 1,958 | | | | 167 | | | | 562 | | | | 594 | | | | 3,281 | | | | 2,049 | | | | 168 | | | | 422 | |
| | | | | | | | | | | | | | | | | | | | | | | | | | | | | | | | | |
| Deferred cloud subscriptions and support revenue (quarter end) (IFRS) | | | 120 | | | | 155 | | | | 169 | | | | 317 | | | | 317 | | | | 344 | | | | 354 | | | | 376 | |
| Revenue adjustment* | | | 72 | | | | 60 | | | | 44 | | | | 40 | | | | 40 | | | | 33 | | | | 7 | | | | 6 | |
| Deferred cloud subscriptions and support revenue (quarter end) (non-IFRS) | | | 193 | | | | 215 | | | | 213 | | | | 358 | | | | 358 | | | | 377 | | | | 361 | | | | 382 | |
| | | | | | | | | | | | | | | | | | | | | | | | | | | | | | | | | |
| Days` sales outstanding (DSO) in days** | | | 60 | | | | 61 | | | | 60 | | | | 59 | | | | 59 | | | | 61 | | | | 62 | | | | 62 | |
| Headcount*** | | | 59,420 | | | | 60,972 | | | | 61,344 | | | | 64,422 | | | | 64,422 | | | | 64,598 | | | | 64,937 | | | | 66,061 | |
Employee retention (in %) (rolling 12 months) | | | 93 | | | | 94 | | | | 94 | | | | 94 | | | | 94 | | | | 94 | | | | 94 | | | | 94 | |
| Women in management (in %) (quarter end) | | | 18.7 | | | | 19.0 | | | | 19.3 | | | | 19.4 | | | | 19.4 | | | | 19.9 | | | | 19.8 | | | | 19.6 | |
| Greenhouse gas emissions in kilotons | | | 130 | | | | 120 | | | | 115 | | | | 120 | | | | 485 | | | | 140 | | | | 135 | | | | 140 | |
| | |
| 62 | | SUPPLEMENTARY FINANCIAL INFORMATION |
* Adjustments in the revenue line items are for support revenue, cloud subscription revenue, and other similarly recurring revenues that entities acquired by SAP would have recognized had they remained stand-alone entities but that SAP is not permitted to recognize as revenue under IFRS as a result of business combination accounting rules. Adjustments in the operating expense line items are for acquisition-related charges, share-based compensation expenses, restructuring expenses, and discontinued activities.
** Days’ Sales Outstanding measures the length of time it takes to collect receivables. SAP calculates DSO by dividing the average invoiced accounts receivables balance of the last 12 months by the average monthly sales of the last 12 months.
*** In full-time equivalents at quarter end
| | |
| INTERIM REPORT JANUARY – SEPTEMBER 2013 | | 63 |
ADDITIONAL INFORMATION
Financial Calendar
January 21, 2014
Fourth-quarter and full-year 2013 preliminary earnings release, telephone conference
May 21, 2014
Annual General Meeting of Shareholders
Mannheim, Germany
Investor Services
Additional information about this interim report is available online at www.sap.com/corporate-en/investors, including the official press release, a presentation about the quarterly results, and a recording of the conference call for financial analysts.
The “Financial Reports” tab under “Financial News and Reports” contains the following publications:
| – | The 2012 Integrated Report (IFRS, www.sapintegratedreport.com) |
| – | The 2012 Annual Report (IFRS, PDF) |
| – | The 2012 Annual Report 20-F (IFRS, PDF) |
| – | The 2012 SAP AG Statutory Financial Statements and Review of Operations (HGB, German only, PDF) |
| – | Interim reports (IFRS, PDF) |
| – | XBRL versions of the Annual and Interim Reports |
A free iPad app containing SAP investor relations publications such as annual and interim reports is available for download from the Apple App Store.
www.sap.com/corporate-en/investors is also the place to look for in-depth information about stock, debt, and corporate governance; financial and event news; and various services designed to help investors find the information they need fast (see “Investor Services”). These include our free SAP INVESTOR magazine, an e-mail and text message news service, and a Twitter feed.
Print versions of the reports listed above can be ordered by phone, e-mail, or online. The SAP Integrated Report is only available online.
You can reach us by phone at +49 6227 7-67336, send a fax to +49 6227 7-40805, or e-mail us at investor@sap.com.
Addresses
SAP AG
Dietmar-Hopp-Allee 16
69190 Walldorf
Germany
Tel. +49 6227 7-47474
Fax +49 6227 7-57575
Internet www.sap.com
E-mail info@sap.com
All international subsidiaries are listed on: www.sap.com/contactsap/directory
Information About Content:
Investor Relations:
Tel. +49 6227 7-67336
Fax +49 6227 7-40805
E-mail investor@sap.com
Twitter @SAPinvestor
Internet www.sap.com/investor
Imprint
Overall Responsibility:
SAP AG
Corporate Financial Reporting
Published on October 21, 2013
Copyright Usage in Collateral
© 2013 SAP AG or an SAP affiliate company. All rights reserved.
No part of this publication may be reproduced or transmitted in any form or for any purpose without the express permission of SAP AG. The information contained herein may be changed without prior notice.
Some software products marketed by SAP AG and its distributors contain proprietary software components of other software vendors. National product specifications may vary.
These materials are provided by SAP AG and its affiliated companies (“SAP Group”) for informational purposes only, without representation or warranty of any kind, and SAP Group shall not be liable for errors or omissions with respect to the materials. The only warranties for SAP Group products and services are those that are set forth in the express warranty statements accompanying such products and services, if any. Nothing herein should be construed as constituting an additional warranty.
| | |
| 64 | | ADDITIONAL INFORMATION |
SAP and other SAP products and services mentioned herein as well as their respective logos are trademarks or registered trademarks of SAP AG in Germany and other countries.
Please see www.sap.com/corporate-en/legal/copyright/ for additional trademark information and notices.
| | |
| INTERIM REPORT JANUARY – SEPTEMBER 2013 | | 65 |