Exhibit 99.1
2013 ANNUAL REPORT
| | |
The Best-Run Businesses Run SAP® | |  |
WHAT WE REPORT
We present our financial, social, and environmental performance in the SAP Integrated Report 2013, which is available at sapintegratedreport.com.
This Annual Report 2013 is an extract from the SAP Integrated Report 2013. It comprises all of the information required by accounting and disclosure standards applicable to us.
Key Facts
Performance Summary
€ millions, unless otherwise stated
| | | | | | | | | | | | |
| | | 2013 | | | 2012 | | | Change in % | |
| Financial key performance indicators | | | | | | | | | | | | |
Software and cloud subscriptions (IFRS) | | | 5,212 | | | | 4,928 | | | | 6 | |
Non-IFRS adjustments | | | 63 | | | | 73 | | | | -14 | |
Software and cloud subscriptions (non-IFRS) | | | 5,275 | | | | 5,001 | | | | 5 | |
Software and software-related service revenue (IFRS) | | | 13,950 | | | | 13,165 | | | | 6 | |
Non-IFRS adjustments | | | 82 | | | | 81 | | | | 1 | |
Software and software-related service revenue (non-IFRS) | | | 14,032 | | | | 13,246 | | | | 6 | |
Total revenue (IFRS) | | | 16,815 | | | | 16,223 | | | | 4 | |
Non-IFRS adjustments | | | 82 | | | | 81 | | | | 1 | |
Total revenue (non-IFRS) | | | 16,897 | | | | 16,304 | | | | 4 | |
Operating profit (IFRS) | | | 4,479 | | | | 4,041 | | | | 11 | |
Non-IFRS adjustments | | | 1,035 | | | | 1,148 | | | | -10 | |
Operating profit (non-IFRS) | | | 5,514 | | | | 5,190 | | | | 6 | |
Operating margin as a percentage (IFRS) | | | 26.6 | | | | 24.9 | | | | 7 | |
Operating margin as a percentage (non-IFRS) | | | 32.6 | | | | 31.8 | | | | 3 | |
Free cash flow | | | 3,266 | | | | 3,281 | | | | 0 | |
Net liquidity | | | -1,467 | | | | -2,502 | | | | 41 | |
Days’ sales outstanding (DSO, in days) | | | 62 | | | | 59 | | | | 5 | |
Equity ratio (total equity as a percentage of total assets) | | | 59 | | | | 54 | | | | 10 | |
| | | |
| Operating expenses | | | | | | | | | | | | |
Research and development | | | 2,282 | | | | 2,261 | | | | 1 | |
Research and development (as a percentage of total revenue) | | | 14 | | | | 14 | | | | 0 | |
Number of employees in research and development at year-end1) | | | 17,804 | | | | 18,012 | | | | -1 | |
| | | |
| Financial performance measures | | | | | | | | | | | | |
Weighted average shares outstanding, basic (in millions) | | | 1,193 | | | | 1,192 | | | | 0 | |
Earnings per share, basic (in €) | | | 2.79 | | | | 2.35 | | | | 19 | |
Dividend per ordinary share (in €) | | | 1.00 | | | | 0.85 | | | | 18 | |
SAP share price at year-end (in €) | | | 62.31 | | | | 60.69 | | | | 3 | |
Market capitalization (in € billions) | | | 76.5 | | | | 74.7 | | | | 2 | |
Performance Summary
€ millions, unless otherwise stated
| | | | | | | | | | | | |
| | | 2013 | | | 2012 | | | Change in % | |
| Employees and personnel expenses | | | | | | | | | | | | |
Number of employees at year-end1) | | | 66,572 | | | | 64,422 | | | | 3 | |
Personnel expenses per employee – excluding share-based payments (in € thousands) | | | 109 | | | | 111 | | | | -1 | |
Women working at SAP (as a percentage) | | | 31 | | | | 30 | | | | 3 | |
Women in management2)(total, as a percentage) | | | 21.2 | | | | 20.8 | | | | 2 | |
Employee Engagement Index (as a percentage) | | | 77 | | | | 79 | | | | -3 | |
Business Health Culture Index (as a percentage) | | | 67 | | | | 66 | | | | 2 | |
Employee retention (as a percentage) | | | 93.5 | | | | 94.0 | | | | -1 | |
| | | |
| Environment | | | | | | | | | | | | |
Greenhouse gas emissions (in kilotons) | | | 545 | | | | 485 | | | | 12 | |
Greenhouse gas emissions per employee1)(in tons) | | | 8.3 | | | | 7.9 | | | | 5 | |
Greenhouse gas emissions per € revenue (in grams) | | | 32.4 | | | | 30.0 | | | | 8 | |
Total energy consumption (in GWh) | | | 910 | | | | 860 | | | | 6 | |
Energy consumed per employee1)(in kWh) | | | 13,900 | | | | 14,000 | | | | -1 | |
Data center energy consumed (in GWh) | | | 173 | | | | 160 | | | | 8 | |
Data center energy per employee1)(in kWh) | | | 2,633 | | | | 2,598 | | | | 1 | |
Renewable energy sourced (as a percentage) | | | 43 | | | | 51 | | | | -16 | |
| | | |
| Customers | | | | | | | | | | | | |
Net Promoter Score (as a percentage) | | | 12.1 | | | | 8.9 | | | | 36 | |
| 2) | Numbers based on year-end |
WHO WE ARE
More than 253,500 customers use SAP innovations such as the SAP HANA platform and SAP Cloud powered by SAP HANA to meet complex business challenges and operate profitably, adapt continuously, and grow sustainably. SAP empowers people and organizations to work together more efficiently and use real-time business insight more effectively. By empowering companies of all sizes and in all industries to make a difference, SAP helps the world run better and improve people’s lives.
Contents
2
3
Overview of
SAP Group
With more than 253,500
customers in over
180 countries, the SAP Group
employs more than
66,500 people in major
countries.
To learn more about the SAP Group please visit www.sapintegratedreport.com
5
Letter from the Co-CEOs
Dear Stakeholders,
In 2010, we launched our customer-centric innovation strategy based on a strong conviction that yesterday’s technologies could not solve tomorrow’s challenges.
We listened to our customers that wanted to adopt innovation faster, analyze unprecedented amounts of data, reach their customers and consumers across all channels, and manage their mobile workers. In response, we expanded our portfolio by investing in cloud-based solutions and mobile technology – and by introducing SAP HANA, our game-changing in-memory technology.
Now, in 2014, it is clear that our strategy was the right one. Today, cloud, mobile, and Big Data are the dominant themes in the IT industry. With four consecutive years of double-digit growth, our success is evident. We are the fastest-growing mega-cap company in the enterprise software industry. For 2013, we reported €16.9 billion non-IFRS total revenue, with 11% constant currency growth in software and cloud subscription revenue (5% at actual currencies). In the same period, our non-IFRS operating margin increased to 33.5% at constant currencies (32.6% at actual currencies). We have more than 253,500 customers from companies of all sizes, across 25 industries, in mature as well as emerging markets.
With the market position and innovation pipeline we have today, we now have a unique opportunity to deliver significantly more value to our customers and reshape the technology landscape for lower cost and higher performance.
The trends we identified in 2010 have only accelerated, and we remain focused and determined to win in rapidly growing areas, especially in cloud and in-memory technology. Our SAP HANA technology has evolved from a real-time database to a true in-memory platform. SAP HANA now allows companies to radically simplify their IT infrastructure. In 2013, we put our entire SAP Business Suite on SAP HANA. Going forward, our software portfolio and the innovations of our partner ecosystem will be built on the foundation of SAP HANA. In the three years since its launch, SAP HANA has generated nearly €1.2 billion in revenue and has become one of the fastest-growing products in the history of enterprise software. In 2013 alone, SAP HANA generated €664 million in revenue, which is an increase of 69% over the previous year at constant currencies.
6 To Our Stakeholders
Cloud computing has now become mainstream and is a widely accepted delivery model in the United States, and increasingly in Asia and Europe. The cloud offers an unprecedented opportunity to simplify software delivery and speed to value as customers get immediate access to innovation. Our annual cloud revenue run rate reached €1.06 billion at the end of 2013. For the year, we reported €757 million non-IFRS cloud subscription and support revenue. Today, SAP Cloud powered by SAP HANA is the broadest cloud portfolio in the industry. More than 35 million users work with our solutions in the cloud, and approximately 1.4 million companies trade over half a trillion U.S. dollars of goods and services through our cloud-based Ariba Network.
Our strategy was always embedded in a higher purpose and vision to “help the world run better and improve people’s lives.” In a world of limited resources, we are proud that, with our solutions, 10 million people in South Africa now have access to banking services with their mobile phones, urban governments in more than 50 countries deliver better services to their citizens, and people in more than 21 countries have easier access to education. In addition, we continue to uphold our commitment to the United Nations Global Compact.
Our non-financial performance indicators remained strong in 2013: We increased our Net Promoter Score by 3.2 percentage points. We also reduced our carbon footprint by 9% since the beginning of 2008. And, for the seventh time in a row, we have been ranked the number one software company in the Dow Jones Sustainability Index. As more customers choose our cloud solutions and our data centers grow, our total energy use will also increase. In 2014, we are addressing this growth by powering all of our data centers with 100% renewable energy. Moreover, we achieved an employee engagement score of 77%, which is among the highest benchmarks for this indicator. We are especially proud of our more than 66,500 employees, and thank them wholeheartedly for their hard work and innovative spirit.
Letter from the Co-CEOs 7
Our momentum and strong foundation allows us to be bold about our future and set ambitious goals. By 2017, we expect to deliver at least €22 billion in total revenue (thereof €3.0–€3.5 billion from our cloud business). To capture the growth in the cloud, we have extended the time horizon for our 35% operating margin target to 2017. Further, we aim to increase customer loyalty by another four percentage points in 2014. In addition, we remain committed to increasing our already high level of employee engagement to 82% by 2015.
In a world of increasing velocity, innovation is imperative. But innovation must never lose sight of the human spirit, which craves simplicity and clarity. That is why our focus now is to “simplify everything so we can do anything.” With this guiding principle, we believe SAP is positioned to deliver profitable growth – and to continue our vision of helping the world run better while improving people’s lives.
Best regards,
| | |
| Bill McDermott | | Jim Hagemann Snabe |
| Co-CEO, SAP AG | | Co-CEO, SAP AG |
8 To Our Stakeholders
Global Managing Board
BILL MCDERMOTT
Co-Chief Executive Officer and
Member of the Executive Board of SAP AG
Joined SAP: 2002
Appointed to Executive Board: 2008
DR. WERNER BRANDT
Chief Financial Officer, Labor Relations Director and
Member of the Executive Board of SAP AG
Joined SAP: 2001
Appointed to Executive Board: 2001
JIM HAGEMANN SNABE
Co-Chief Executive Officer and
Member of the Executive Board of SAP AG
Joined SAP: 1990
Appointed to Executive Board: 2008
ROBERT ENSLIN
Member of the Global Managing Board of SAP AG,
President, Global Customer Operations
Joined SAP: 1992
Global Managing Board 9
BERND LEUKERT
Member of the Global Managing Board of SAP AG,
Head of Application Innovation
Joined SAP: 1994
GERHARD OSWALD
Member of the Executive Board of SAP AG,
Board Area Scale Quality & Support
Joined SAP: 1981
Appointed to Executive Board: 1996
LUKA MUCIC
Member of the Global Managing Board of SAP AG,
Head of Global Finance
Joined SAP: 1996
DR. VISHAL SIKKA
Member of the Executive Board of SAP AG,
Board Area Products & Innovation
Joined SAP: 2002
Appointed to Executive Board: 2010
10 To Our Stakeholders
Investor Relations
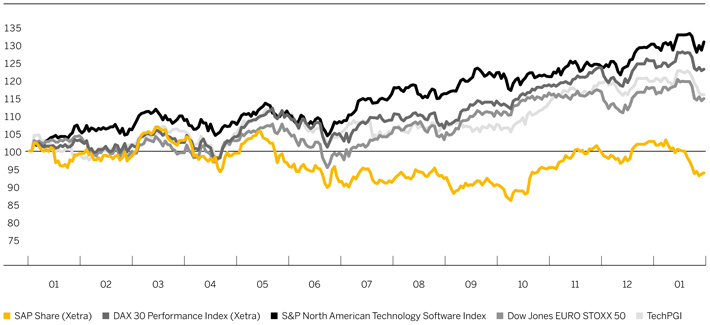
After significantly outperforming the major indexes in 2012, SAP stock increased 2.7% in 2013, while the DAX index increased 25.5%. Throughout the year SAP was in continuous dialog with investors about our strategy for innovation and growth. The key topics discussed were the SAP HANA platform, SAP’s shift to the cloud, the Ariba network business, and the changes to the SAP Executive Board in 2013.
STOCK MARKETS AT RECORD LEVELS
In 2013, the U.S. Federal Reserve’s ultra-loose monetary policy and low base interest rates in Europe boosted stock markets. Liquid financial markets repeatedly sent key indexes such as the U.S. Dow Jones Industrial Average index and Germany’s DAX 30 to record levels.
In 2012, SAP stock gained 48.6%, ahead of major indexes. In 2013, the blue-chip and industry indexes made up ground, while SAP stock rose a further 2.7%. The DAX 30 and the Dow Jones EURO STOXX 50 index of blue-chip stocks in the euro area gained 25.5% and 18% respectively in 2013. The Dow Jones Industrial Average index gained 26.5%, the S&P 500 29.6%, and the S&P North American Technology Software Index 30.2%. SAP stock performed below average compared to other technology stocks: The Technology Peer Group Index (TechPGI), which lists ten major technology companies, rose 19.7%.
SAP STOCK AT HIGHEST PRICE SINCE MARCH 2000
After closing at €60.69 on the Xetra trading system at the end of 2012, SAP stock fell to €57.82 on January 22, 2013, its lowest level for the quarter. The publication of our preliminary final-quarter and full-year results on January 23 put the share price on an upward trajectory. The prospect of the Federal Reserve sticking to its stimulus program and a successful CeBIT for SAP lifted the share price on March 15 to €64.80, its highest value for the year and a level it had not seen since March 2000. In mid-March, the DAX passed the 8,000 point mark for the first time since December 2007.
SAP stock came under pressure at the start of April as the markets weakened. It picked up momentum again after we announced our first-quarter results on April 19, and, with the markets rallying, reached €64.05, its high for the quarter, on May 15. Disappointing economic growth figures for China, the announcement of personnel changes on the SAP Executive Board, and the ex-dividend price adjustment after the Annual General Meeting of Shareholders on June 4 then caused the price to fall. It recovered soon after when SAP announced that it would acquire hybris.
The share price fell in the second half of July, and traded at €55.12 on July 23. On July 18 we published our second-quarter results and adjusted our revenue guidance for 2013, due to the industry transformation in the cloud business. The SAP Supervisory Board proposed Jim Hagemann Snabe, who had announced that he would step down as co-CEO, to the Annual General Meeting of Shareholders in May 2014 as a candidate for Supervisory Board membership. The after-effects of SAP’s adjusted revenue outlook coupled with a general reluctance to invest in the software sector pushed the share price down to €53.42 on September 5, its lowest level of the quarter.
At the beginning of October, investor worries ahead of our third-quarter results and weak market sentiment pushed the share price down to its lowest level for the year of €52.20 on October 9. After we confirmed our outlook guidance on October 21 and announced another quarter of double-digit growth, the share price passed the €60.00 mark in the second half of November. The market also welcomed the news that SAP would tap into China’s cloud market through a joint venture with China Telecom. After profit-taking in early December, a general year-end rally began mid-month that lifted the DAX to a new all-time high on December 27. Buoyed by this, the SAP share price climbed to finish the year at €62.31.
On January 21, 2014, SAP published its preliminary fourth-quarter and full-year results for 2013 and announced it had pushed back the target date for operating margin to help capture growth opportunities in the cloud. SAP now expects to reach its non-IFRS operating margin goal of 35% by 2017 rather than in 2015 as previously stated. Investors reacted to the news with caution, causing SAP stock to fall to €59.62.
Investor Relations 11
SAP Stock in Comparison to DAX 30, Dow Jones EURO STOXX 50, S&P North American Technology Software Index and to TechPGI
December 31, 2012 (=100%) to January 31, 2014
Percent
Key Facts About SAP Stock/SAP ADRs
| | | | |
| Listings | | | | |
Germany | | | Berlin, Frankfurt, Stuttgart | |
United States (ADR) | | | New York Stock Exchange | |
| IDs and symbols | | | | |
WKN/ISIN | | | 716460/DE0007164600 | |
NYSE (ADRs) | | | 803054204 (CUSIP) | |
Reuters | | | SAPG.F or .DE | |
Bloomberg | | | SAP GR | |
| Weight (%) in indexes at 12/31/2013 | | | | |
DAX 30 | | | 7.04% | |
Prime All Share | | | 5.54% | |
CDAX | | | 5.69% | |
HDAX | | | 5.79% | |
Dow Jones STOXX 50 | | | 1.85% | |
Dow Jones EURO STOXX 50 | | | 3.08% | |
DIVIDEND PAYOUT OF €1.00 PER SHARE
We believe our shareholders should benefit appropriately from the profit the Company made in 2013. We wish to continue our dividend policy, which is that the payout ratio should be more than 30% of the profit after tax of the Group.
Therefore, the Executive Board and the Supervisory Board will recommend that the shareholders approve a total dividend of €1.00 per share for fiscal year 2013 at the Annual General Meeting of Shareholders. This corresponds to a year-over-year dividend increase of €0.15. Based on this recommendation, the overall dividend payout ratio (which here means total distributed dividend as a percentage of profit) would be 36% (2012: 36%).
12 To Our Stakeholders
CAPITAL STOCK UNCHANGED
SAP’s capital stock on December 31, 2013, is €1,228,504,232.00 (2012: €1,228,504,232.00). It is issued as 1,228,504,232 no-par shares, each with an attributable value of €1 in relation to the capital stock.
LARGER FREE FLOAT
The proportion of our stock in free float increased again slightly in 2013. Applying the definition accepted on the Frankfurt Stock Exchange – which excludes treasury stock from the free float – on December 31, 2013, the free float stood at 74.7% (December 31, 2012: 74.4%). In January 2014, approximately 22.5% (January 2013: 22.7%) of the stock was under the control of three founders and their trusts and holding companies. U.S. institutions remained the next largest group of shareholders, holding around 18.0% (19.4%) of the stock. Institutions in Ireland and the United Kingdom held about 14.9% (13.6%), followed by Continental European investors outside Germany, who held approximately 13.8% (12.8%). Institutions in Germany held 7.6% (7.8%) and investors from the rest of the world held 2.7% (3.0%) of the stock in January 2014. Private or unidentified investors held 17.6% (17.7%). SAP held 2.8% (3.0%) of the stock in treasury.
Return on SAP Common Stock – WKN 716460/ISIN DE0007164600
Percent, unless otherwise stated
Initial investment €10,000
| | | | | | | | | | | | |
| Date of investment | | | 12/31/2003 | | | | 12/31/2008 | | | | 12/31/2012 | |
| Period of investment | | | 10 years | | | | 5 years | | | | 1 year | |
| Value on 12/31/20131)(in €) | | | 21,381 | | | | 26,808 | | | | 10,419 | |
| Average annual return | | | 7.9 | | | | 21.8 | | | | 4.2 | |
| Performance comparators | | | | | | | | | | | | |
DAX 30 Performance – total return index | | | 9.2 | | | | 14.7 | | | | 25.5 | |
REX General Bond – total return index | | | 4.5 | | | | 4.2 | | | | -0.5 | |
S&P 500 Composite – total return index | | | 6.9 | | | | 19.2 | | | | 32.4 | |
S&P North American Technology Software Index – price index | | | 8.2 | | | | 22.9 | | | | 31.1 | |
| 1) | Assuming all dividends were reinvested |
Source: Datastream
Return on SAP ADRs – 803054204 (CUSIP)
Percent, unless otherwise stated
Initial investment US$10,000
| | | | | | | | | | | | |
| Date of investment | | | 12/31/2003 | | | | 12/31/2008 | | | | 12/31/2012 | |
| Period of investment | | | 10 years | | | | 5 years | | | | 1 year | |
| Value on 12/31/20131)(in US$) | | | 23,207 | | | | 25,646 | | | | 10,990 | |
| Average annual return | | | 8.8 | | | | 20.7 | | | | 9.9 | |
| Performance comparators | | | | | | | | | | | | |
S&P 500 Composite – total return index | | | 7.4 | | | | 17.9 | | | | 32.4 | |
| 1) | Assuming all dividends were reinvested |
Source: Datastream
Investor Relations 13
COMMUNICATION WITH INVESTORS
SAP aims for the greatest possible transparency and openness in a continuous dialog with our shareholders. In several hundred one-on-one meetings held at SAP, during investor road shows worldwide, and at investor events, we answered inquiries from institutional investors and analysts about our business and strategy. We also held telephone conferences and analyst meetings when we published our quarterly results. Investor presentations at the SAPPHIRE NOW conferences, which took place in Beijing, China, and in Orlando, Florida, in the United States, were key elements of our communication with the financial markets. In addition, SAP engages in regular dialog with socially responsible investors (SRIs), by providing insight into SAP’s environmental, social, and corporate governance policies.
COMPREHENSIVE SERVICE FOR PRIVATE INVESTORS
Providing a full service for retail investors is a priority for SAP. Our services for private investors include investor presentations at various retail shareholder events, the shareholder hotline, e-mail contact at investor@sap.com, investor relations information on our public Web site www.sap.com/investor, and a mobile Web site m.sapinvestorrelations.com. We provide a range of information for investors about SAP and SAP stock online, including press releases delivered by e-mail, social media including information provided on our SAP Investor Relations Twitter feed @sapinvestor, our quarterly SAP INVESTOR magazine, which investors can subscribe to free of charge, and a text message service. We also publish an overview of the latest analyst assessments in collaboration with Vara Research. All key events at which members of our Executive Board speak to financial analysts and institutions are broadcast live on the Internet, and we post the presentation materials on the investor relations area of our public Web site.
14 To Our Stakeholders
Corporate Governance Report
RESPONSIBLE MANAGEMENT
We are a global company with numerous subsidiaries around the world and an international shareholder base, so we need good governance. Good corporate governance means managing the Company accountably and transparently to secure long-term value, which is also the purpose of the standards and principles that apply in Germany and the world. We believe our shareholders, business partners, employees, and the financial markets reward good corporate governance with the increased trust they place in our Company.
CORPORATE GOVERNANCE AT SAP
Because SAP is listed on a German stock exchange, our corporate governance is based on the German Stock Corporation Act and on the German Corporate Governance Code (the “Code” in this report). Since SAP is also listed in the United States, we comply with the rules that apply to German companies listed on the New York Stock Exchange (NYSE). These include the requirements, as they apply to foreign private issuers, of the NYSE Corporate Governance Standards, the U.S. Sarbanes-Oxley Act of 2002, and the U.S. Securities and Exchange Commission (SEC). As required by the German Stock Corporation Act, section 161, SAP’s Executive and Supervisory Boards provide the Company’s shareholders with information about our implementation of the German Corporate Governance Code’s recommendations by publishing an annual declaration of implementation. In addition, the Executive Board publishes a corporate governance statement pursuant to the German Commercial Code, section 289 a, describing certain aspects of the Company’s corporate governance in greater detail. In accordance with section 3.10 sentence 1 of the German Corporate Governance Code, the Executive and Supervisory Boards report below about corporate governance at SAP in 2013.
EXECUTIVE BOARD
The SAP Executive Board currently has five members. It is solely responsible for managing the Company. It has a duty to exercise its management powers in the interest of the Company and in pursuit of the sustained growth of corporate value. It discusses and agrees its strategy for the Company with the Supervisory Board, ensures compliance with the requirements of the law throughout the Group, and maintains effective risk management structures and internal risk controls.
GLOBAL MANAGING BOARD
In May 2012, to help with its work the Executive Board set up the Global Managing Board. It currently comprises all of the Executive Board and four other global managers who play a part in directing large sections of the business. These additional members are appointed by the Executive Board with the Supervisory Board’s consent. The Global Managing Board has a coordinating function, advises the Executive Board and helps it make decisions, but the Executive Board retains overall responsibility for everything the Company does. It meets regularly and its meetings are chaired by the co-CEOs.
SUPERVISORY BOARD
The SAP Supervisory Board has 16 members who, in equal numbers, represent the shareholders and the employees. It appoints, monitors, and advises the Executive Board. The Executive Board involves the Supervisory Board in decisions on matters of fundamental importance for the Company. The Supervisory Board has reserved to itself the approval of certain defined transactions of fundamental importance.
COMPOSITION OF THE SUPERVISORY BOARD
In accordance with the recommendation in section 5.4.1, paragraph 2, of the Code, the Supervisory Board has defined the following objectives for its own composition:
| ¡ | | There should never be fewer than two people from the international stage on the shareholder representatives’ side of the Supervisory Board. |
| ¡ | | No Supervisory Board member should be an employee, consultant, or director of a significant SAP competitor. |
Corporate Governance Report 15
| ¡ | | At least four shareholder representatives on the Supervisory Board should be independent members in the meaning of section 5.4.2 of the Code. |
| ¡ | | No member of the Supervisory Board should be older than 75 years. |
| ¡ | | At least one woman should sit on the Supervisory Board as a shareholder representative. |
We believe the current composition of the Supervisory Board fulfills all of these objectives.
The General Meeting of Shareholders elects the shareholders’ side of the Supervisory Board. The Code recommends (at section 5.4.1, third paragraph, first sentence) that when the Supervisory Board proposes candidates for shareholders to elect or re-elect to the Supervisory Board, it should take into account the objectives it set for its own composition. In our Declaration of Implementation dated October 29, 2013, we reported that we did not follow that recommendation. Our Supervisory Board will, of course, have regard to the adopted objectives when seeking to identify suitable persons for candidacy and when preparing its recommendation of candidates to the General Meeting of Shareholders. In the interest of SAP, however, we must be in a position to recommend to the General Meeting of Shareholders those candidates we believe are best suited for the vacant Supervisory Board seats. Ordinarily, one of the suitability criteria will be whether a person’s candidacy is consistent with the defined objectives. However, that need not always be the only decisive criterion for proposing a particular candidate. Company law, which empowers the General Meeting of Shareholders to elect members to the Supervisory Board, requires neither that the Meeting adhere to the Supervisory Board’s objectives nor that it elect the Supervisory Board’s proposed candidates.
The Supervisory Board has regard to the following requirements for its composition:
| ¡ | | The Supervisory Board has at all times to be composed in such a way that its members as a group possess the knowledge, ability, and expert experience required to properly complete its tasks in our global IT company. |
| ¡ | | Pursuant to the German Stock Corporation Act, section 100 (5), the Supervisory Board must at all times have at least one independent member with significant, recent, and relevant financial or auditing experience. |
INDEPENDENCE OF THE SUPERVISORY BOARD
SAP believes a sufficient degree of independence of our Supervisory Board members is essential for effective and responsible corporate management and control. As reported above, our Supervisory Board has a defined objective for its composition regarding the minimum number of independent members on the shareholder representative side, as recommended in the Code, section 5.4.1, paragraph 2. At its meeting on October 10, 2013, the Supervisory Board determined that all of its shareholder representative members are independent in the meaning of the Code, section 5.4.2 and that the number of independent members is sufficient in the meaning of that section. The Audit Committee is chaired by Erhard Schipporeit, who for many years was the chief financial officer of a DAX company that is also listed on a U.S. stock exchange and therefore qualifies as an independent financial expert in the meaning of the German Stock Corporation Act, section 100 (5), and the equivalent U.S. provisions.
DIVERSITY IN THE COMPANY
The Executive Board follows the recommendation in section 4.1.5 of the Code that requires executive boards to have regard to diversity when appointing people to leadership positions, and in particular to employ appropriate numbers of women in such positions. In support of this, we maintain a diversity policy for company leadership appointments. In May 2011, we also set a target to increase the percentage of women in leadership positions from 18% at the beginning of 2011 to 25% in 2017. We believe this is an ambitious target because there are still more men than women studying engineering subjects. It goes without saying that ability is still the primary selection criterion for any position at SAP. Globally, the percentage of women in leadership positions at the end of 2013 was 21.2 %.
16 To Our Stakeholders
Section 5.1.2 of the Code contains the recommendation that supervisory boards should strive for an appropriate representation of women at executive board level as well. The Supervisory Board complies with this provision and has ruled that when a new member is needed for the Executive Board, applications should be sought from within SAP and from outside, and that the shortlist should be 50% women if possible. When we decide whom to appoint, the strengths and performance of the candidates would always be more important than their sex. Another long-term aim of the diversity policy for company leadership appointments mentioned above is to build a diverse pool of potential candidates for future Executive Board vacancies.
As reported above, the Supervisory Board has defined concrete objectives to promote diversity in its own membership and achieve an appropriate percentage of women members, as envisioned in the second paragraph of section 5.4.1 in the Code.
DECLARATION OF IMPLEMENTATION PURSUANT TO THE GERMAN STOCK CORPORATION ACT, SECTION 161
Every year, the Executive Board and Supervisory Board issue a declaration stating whether SAP has implemented and is following the Code’s recommendations, and identifying any recommendations that the Company has not followed – with an explanation of why it has not done so. The declaration of implementation that we filed on October 29, 2013, is on the company Web site at www.sap.com/corporate-en/investors/governance/policies-statutes. Implementation declarations published in previous years are also available on this Web site, and links are provided to current and previous versions of the Code. As reported in the declaration of implementation, we follow all but eight of the 105 recommendations in the current Code. The reasons we do not follow these particular recommendations are described in detail in the declaration of implementation.
We voluntarily follow all six suggestions in the current Code.
CORPORATE GOVERNANCE STATEMENT
The Executive Board published our corporate governance statement for 2013 pursuant to the German Commercial Code, section 289 a, on February 19, 2014. It is available on SAP’s Web site at www.sap.com/corporate-en/investors/governance. It includes the current declaration of implementation pursuant to the German Stock Corporation Act, section 161, certain information on corporate governance practices, and an account of how the Executive Board and the Supervisory Board work, who sits on which Supervisory Board committees, and how those committees work.
CODE OF BUSINESS CONDUCT
SAP’s corporate governance includes our Code of Business Conduct for employees and members of the Executive Board. The Code of Business Conduct expresses the high standards that we require from our employees and Executive Board members and sets out the main principles that guide our business conduct toward customers, business partners, and shareholders. We see our Code of Business Conduct as the standard for our dealings involving customers, business partners, vendors, shareholders, and competitors. By following our Code of Business Conduct, we demonstrate a commitment against all forms of unfair competitive practice, corruption, and misrepresentation. A Global Compliance Office reporting to our general counsel monitors worldwide compliance with our Code of Business Conduct and other policies applying within the Group. It regularly reviews these internal policies, revises them if necessary, and delivers related employee training.
THE WORK OF THE EXECUTIVE AND SUPERVISORY BOARDS
The Executive Board and Supervisory Board cooperate closely for the benefit of the Company. The Executive Board regularly provides the Supervisory Board with full and timely reports on all material matters of strategy, business planning and performance, including any deviations of actual business performance from plan, risks, risk management, and corporate compliance. We provide our shareholders with in-depth information about how the Executive and Supervisory Boards work, how the committees are composed, and how these committees work, in our corporate governance statement. For
Corporate Governance Report 17
more information about the joint work of the Executive and Supervisory Boards and about the work of the Supervisory Board and its committees in 2013, see the Report from the Supervisory Board.
APPLYING INTERNATIONAL CORPORATE GOVERNANCE STANDARDS
As noted above, SAP is an NYSE-listed company and we are therefore subject to certain U.S. financial legislation (including among others the Sarbanes-Oxley Act of 2002) and to the applicable SEC and NYSE regulations. Besides implementing the requirements of the Sarbanes-Oxley Act, section 404, and other Sarbanes-Oxley Act requirements, including conducting an annual audit of our internal control over financial reporting, we comply with those of the corporate governance standards codified in the NYSE Listed Company Manual, section 303A, that bind foreign private issuers. The section 303A standards that apply to SAP include the requirement to have an audit committee composed of members who are independent in the meaning of the Sarbanes-Oxley Act, and related reporting requirements. In accordance with the SEC and NYSE corporate governance rules, we have also published, at Item 16G in our annual report on Form 20-F, a report on the significant differences between the NYSE corporate governance standards and the German corporate governance rules, which we apply. We publish our annual report on Form 20-F on our Web site at www.sap.com/corporate-en/investors/newsandreports/reports in English only.
TRANSPARENCY, COMMUNICATION, AND SERVICE FOR SHAREHOLDERS
Our shareholders can obtain full and timely information about SAP on our Web site and can access current and historical Company data. Among other information, we post all of our financial reports, all relevant news about the Company’s governing bodies and their corporate governance documentation, information requiring ad-hoc (current) disclosure, press releases, and news of directors’ dealings notifiable pursuant to the German Securities Trading Act, section 15 a. Shareholders and the public are able to watch a live broadcast of the entire Annual General Meeting of Shareholders on the Internet. They can vote their shares at the meeting or instruct a proxy of their choice or one of the proxies provided for that purpose by SAP. Our shareholders are also able to participate in the Annual General Meeting of Shareholders on the Internet and to vote their shares by postal ballot. The details are in the invitation to the Annual General Meeting of Shareholders. All of the documentation related to the Annual General Meeting of Shareholders is posted in good time on SAP’s Web site at www.sap.com/corporate-en/investors/governance/meetings.
FINANCIAL ACCOUNTING, RISK MANAGEMENT, AND INTERNAL CONTROL
The June 2013 Annual General Meeting of Shareholders appointed KPMG to audit the SAP AG and the consolidated financial statements. We prepare the SAP AG financial statements in accordance with the German Commercial Code and our consolidated financial statements in accordance with IFRS. We prepare a management report, as required by the German Commercial Code, and the Form 20-F annual report in accordance with SEC requirements. The Executive Board is responsible for financial accounting. The Supervisory Board approves the SAP AG financial statements, the consolidated financial statements, and the combined management report.
In addition to our annual financial statements, we also prepare quarterly reports for the first, second, and third quarters. Our quarterly reports comply with the German Securities Trading Act and are submitted to the Audit Committee of the Supervisory Board before they are published.
18 To Our Stakeholders
In German stock corporation and commercial law, there are special requirements for internal risk management that apply to SAP. To meet them, our global risk management system supports risk planning, identification, analysis, handling, and elimination. We maintain standard documentation of all our internal control structures and continually evaluate their effectiveness. As a company listed on the NYSE, we instruct our auditor, KPMG, to conduct an annual audit of our internal control over financial reporting in accordance with the requirements of the U.S. Sarbanes-Oxley Act of 2002, section 404. The audit as at December 31, 2013, confirmed that our internal control is effective. In compliance with the reporting requirements in the German Commercial Code, sections 289 (5) and 315 (2)(5), the combined SAP AG and SAP Group management report contains full information about the principal features of the internal controls and risk management structure applying to SAP’s consolidated financial reporting.
In 2012, SAP engaged its external independent auditor KPMG to conduct an audit on SAP’s worldwide compliance management system (CMS) according to the German auditing standard IDW PS 980 “Principles for the Proper Performance of Reasonable Assurance Engagements Relating to Compliance Management Systems”. The audit covered the appropriateness, implementation and operating effectiveness of SAP’s CMS in the areas of corruption and antitrust law in the period from July 1 to December 31, 2012. The audit was completed on July 5, 2013.
EXECUTIVE BOARD AND SUPERVISORY BOARD SHAREHOLDINGS
Section 6.3 sentence 2 in the Code recommends that the entire holdings of SAP shares shall be reported separately for the Management Board and Supervisory Board in the Corporate Governance Report. In fulfillment of this recommendation we refer to the Compensation Report of our Combined Management Report for 2013 which contains the respective data.
Corporate Governance Report 19
Report from the Supervisory Board
Professor Hasso Plattner
Chairperson of the
Supervisory Board of SAP AG
Dear Shareholders,
SAP had a very successful 2013. The Company had the fourth consecutive year of double-digit growth in non-IFRS software and software-related service revenue, accelerated its transition to a cloud company, continued to grow its core business, and increased its profitability. This combination of achievements is unique in the software industry and shows that the Company’s long-term strategy for innovation and growth is successful. In 2013, non-IFRS total revenue was €16.9 billion. Non-IFRS software and software-related service revenue increased 11% at constant currencies (by 6% to €14.0 billion at current exchange rates). Non-IFRS operating income increased by 14% to €5.9 billion at constant currencies. The operating margin widened by 150 basis points to 33.5% at constant currencies.
As the Supervisory Board, our role is to look beyond the financial results to also evaluate the Company’s overall vision and direction. SAP anticipated the fundamental shift in IT to cloud computing and to the real-time business process management that in-memory technology makes possible, and, as a market leader, is driving this change.
SAP HANA has revolutionized database technology and created the next generation of real-time business platforms. With total license revenue of €1.2 billion in less than three years and more than 3,000 customers worldwide, SAP HANA is the most successful product in SAP’s history. This technology is the basis of all SAP applications in the future.
The Company’s rapidly-growing cloud business also demonstrates its leadership in that segment. Cloud solutions from SAP have more than 35 million users, making SAP the largest cloud company worldwide. In 2013, it recorded
20 To Our Stakeholders
cloud subscription and support revenue of €757 million. The Company’s new technologies and the dynamism of its cloud business are the foundation for long-term and profitable growth and for extending its market leadership.
We follow these developments closely in the course of our Supervisory Board work. As always, the Supervisory Board relies on an open and sincere dialog with the Executive Board to efficiently organize and perform our duties. In our report, we describe the ongoing close cooperation between the two boards, the topics discussed at meetings of the Supervisory Board, the work of our committees, corporate governance at SAP, and the audit of SAP AG and the consolidated financial statements.
COOPERATION BETWEEN THE EXECUTIVE AND SUPERVISORY BOARDS
In 2013, we discharged the duties imposed on us by the law and by the Company’s Articles of Incorporation. We were continuously consulted by the Executive Board on the running of the Company; we scrutinized and monitored the work of management for legal compliance, adherence to proper accounting principles, appropriateness, and cost-effectiveness. The Executive and Supervisory Boards consulted on the Company’s strategy and regularly discussed progress on its implementation. We were involved whenever the Executive Board made decisions of fundamental importance to SAP.
The Supervisory Board received regular, full, and timely reports from the Executive Board, both from members in person and in written documents. Those reports chiefly concerned the Company’s strategy, plans, business performance, risks, risk management, compliance, and transactions of special significance for SAP. The Executive Board also indicated when the Company’s business deviated from the plans and targets and explained these deviations.
The content and scope of the Executive Board’s reports fully met the requirements that the Supervisory Board had placed on them. In addition to these reports, the Supervisory Board received supplementary information from the Executive Board. In particular, the Executive Board was available at Supervisory Board meetings for discussions and to answer our questions. We questioned and probed the Executive Board to satisfy ourselves that the information it provided us was plausible. The Supervisory Board maintains a list of the categories of transactions for which the Executive Board must obtain the Supervisory Board’s consent. The Supervisory Board continually reviews the list to see if it requires amendment. It was most recently amended in 2013. The Supervisory Board carefully considered all transactions in the listed categories and discussed them with the Executive Board, focusing on the benefits, risks, and other effects of each transaction. The Supervisory Board agreed to all transactions for which its consent was sought by the Executive Board.
The Executive Board also kept the chairperson of the Supervisory Board fully informed between meetings of the Supervisory Board and its committees. In particular, the co-CEOs met regularly with the chairperson of the Supervisory Board to discuss SAP’s strategy, planning, the Company’s business performance, risks, risk management, compliance, and other key topics and decisions. The Supervisory Board chairperson was informed without delay of important events that were significant for assessing SAP’s position and progress or for the management and governance of the Company.
SUPERVISORY BOARD MEETINGS AND RESOLUTIONS
There were four ordinary meetings and two extraordinary meetings of the Supervisory Board in 2013. Resolutions of the Supervisory Board were adopted at these meetings or by correspondence vote. It is customary practice at our meetings that the Executive Board withdraws while we deliberate on items that pertain to the Executive Board or require discussion among Supervisory Board members alone. This happened at all Supervisory Board meetings in 2013. The Supervisory Board discussed the following matters and, where necessary, made resolutions.
Report from the Supervisory Board 21
Resolution Adopted by Correspondence in January
In January 2013, the Supervisory Board approved by correspondence vote the appointment of Rodolpho Cardenuto as president of the America region.
Meeting in February
At our meeting on February 14, 2013, the Supervisory Board discussed the 2013 budget. Based on the operational plan for 2013, which the Executive Board presented in detail, we agreed to the 2013 budget presented by the Executive Board, including the 2013 capital expenditure budget and liquidity plan.
We also received and discussed the recommendation of the General and Compensation Committee concerning Executive Board variable compensation for 2012. We first determined performance against the defined targets, and then decided the payouts for Executive Board members entitled under the 2012 short-term incentive (STI) plan by considering this performance and the discretionary element. We discussed performance against the annual financial targets for the 2010 and 2011 medium-term incentive (MTI) plans and determined the payout of the 2010 MTI plan. We determined the performance against the 2012 tranche of the RSU Milestone Plan 2015. We then turned our attention to Executive Board compensation for 2013. We identified the key performance indicators (KPIs) and set the target numbers for each KPI in the 2013 STI plan and their relative weightings. We adopted a resolution on Executive Board members’ individual allocation of rights under the RSU Milestone Plan 2015 (2013 tranche). Finally, we evaluated the appropriateness of the Executive Board members’ compensation for 2013, and in each case found it to be appropriate in terms of amount, structure, objective criteria, and for each member’s responsibilities and tasks.
On the recommendation of the General and Compensation Committee, we extended the Executive Board appointment of Werner Brandt from January 1, 2014, through June 30, 2014, amended his contract, and set his 2014 compensation.
We approved the engagement of a law firm in which a member of the Supervisory Board is a partner. The member concerned was excluded from the deliberations and voting on this matter.
The Executive Board reviewed business in 2012 and presented other management information, such as SAP’s market position and the Company’s plans through 2015.
The General and Compensation Committee, the Technology and Strategy Committee, the Audit Committee, the Finance and Investment Committee, and the Nomination Committee reported to us on their meetings. The General and Compensation Committee referred to the agenda items discussed at that same Supervisory Board meeting. The Audit Committee described progress on the 2012 financial statements and reported that at its last meeting it had been briefed about the findings from the audit’s focus areas. The Committee also reported on its deliberations on the Company’s internal control systems. The Finance and Investment Committee informed us about the annual report it receives on SAP Ventures and SAP HANA Real-Time Fund activities and about its discussions on the Company’s plans to establish a third venture capital fund. The Technology and Strategy Committee gave us an account of SAP HANA Enterprise Cloud, SAP Managed Services, and the user experience strategy it was discussing.
Meeting in March (Meeting to Discuss the Financial Statements)
At our meeting on March 21, 2013, the Supervisory Board first turned its attention to SAP AG’s 2012 financial statements and the consolidated financial statements, the audits conducted by KPMG AG Wirtschaftsprüfungsgesellschaft (KPMG), and the Executive Board’s proposed resolution on the appropriation of retained earnings for 2012. The Audit Committee reported on all matters for which it is responsible in connection with the 2012 financial statements, particularly on the form and scope of its examination of the documents relating to the financial statements, and recommended that the Supervisory Board approve them. The auditor attended the meeting. Referring in particular to the six audit focus topics that had been agreed between the auditor and the Audit Committee, the auditor reported in detail on the audit and on the results. The auditor also related the discussions on those matters at the two preceding meetings of the Audit Committee. The auditor then discussed the results with the Supervisory Board and
22 To Our Stakeholders
answered our questions. The Supervisory Board approved the audit. There were no findings from our own examination, so we gave our consent to the SAP AG and consolidated financial statements for 2012. We checked and endorsed the Executive Board’s proposal concerning the appropriation of retained earnings. In addition, we agreed our proposed resolutions for the agenda of the Annual General Meeting of Shareholders in June 2013. We adopted a proposal to the Annual General Meeting of Shareholders concerning the election of an auditor for 2013 that followed the recommendation of the Audit Committee.
At this meeting, we also deliberated on the Executive Board’s proposal to convert SAP AG to a European company (Societas Europaea, or SE), which would require Supervisory Board approval. After an in-depth discussion, the Supervisory Board gave its approval for the Executive Board to prepare the conversion of the Company’s legal form to an SE. A resolution on the conversion is to be put to the shareholders at the 2014 Annual General Meeting of Shareholders.
The Executive Board presented the forecast for the second quarter and reported on SAP HANA developments and plans.
Because a Supervisory Board member had left his previous law firm and had become a partner in another law firm, we approved the transfer of the Company’s engagements with the member’s previous law firm to the new firm, and consented to two additional engagements with that new firm. The Supervisory Board member concerned did not take part in the deliberations on these matters or the vote on the related resolution.
Under the appropriate agenda items, the Audit Committee and the Technology and Strategy Committee reported on their recent meetings.
Resolution Adopted by Correspondence in April
The Executive Board had chosen a law firm to advise on the employee co-determination procedure and preparation of the relevant documents ahead of the Company’s conversion to an SE. A member of the Supervisory Board is a partner in this law firm. In April 2013, the Supervisory Board approved by correspondence the instruction of this law firm to the extent the Executive Board envisioned and at the fees and hourly rates negotiated for the services. The Supervisory Board member concerned abstained from voting on the resolution.
Resolutions Adopted by Correspondence in May
On the recommendation of the Finance and Investment Committee, in May 2013, we approved by correspondence additional capital for the SAP HANA Real-Time Fund and the creation of, and capital for, the new SAP Ventures II Fund.
In a second correspondence vote, we appointed Werner Brandt as labor relations director because Luisa Deplazes Delgado was about to leave the Executive Board and we approved the appointment of Bernd Leukert and Luka Mucic to the Global Managing Board with effect from July 1, 2013.
Extraordinary Meeting in June
At our extraordinary meeting on June 4, 2013, we addressed the departure of Lars Dalgaard and Luisa Deplazes Delgado from the Executive Board. On the recommendation of the General and Compensation Committee, we adopted resolutions on the termination agreements with Luisa Deplazes Delgado and Lars Dalgaard, and on the consulting contract with Lars Dalgaard. The Executive Board also informed us about changes to its schedule of portfolios prompted by the departure of Lars Dalgaard and Luisa Deplazes Delgado. In a significant change designed to simplify the organizational structure and create one development organization, responsibility for all innovations was passed to Executive Board member Vishal Sikka. Gerhard Oswald’s portfolio was redefined as Scale, Quality & Support, to include responsibility for SAP HANA Enterprise Cloud. As part of these changes to the schedule of portfolios, Werner Brandt took over responsibility for Global HR.
Report from the Supervisory Board 23
We also discussed the acquisition of hybris. The Executive Board presented the grounds for acquiring the company, the agreed purchase price, and the terms of the purchase agreement. We discussed the key considerations of the acquisition and, on the recommendation of the Finance and Investment Committee, we approved the acquisition of hybris and the financing of the acquisition. In accordance with the applicable plan terms and conditions, we agreed that the targets of the long-term RSU Milestone Plan 2015, the 2013 STI, and the 2011 MTI should be adjusted to eliminate any nonrecurring effects of the hybris acquisition on Executive Board compensation.
Meeting in July
The meeting on July 11, 2013, was held in San Martin, California. The Supervisory Board had the opportunity to join the opening ceremony of the SAP Center in San Jose, visit SAP Labs in Palo Alto, and meet the representatives of major U.S. customers and SAP Ventures’ portfolio companies.
At our July meeting, the Executive Board gave us an account of business in the second quarter of 2013, performance in the first half-year, and the forecast for the second half-year. Notably, it informed us about the revenue of each division and region in the second quarter of 2013, the performance of the cloud division, and SAP’s competitive position in general. We discussed in detail the directors’ and officers’ group liability insurance policies that we take out from year to year, and approved them.
As proposed by the General and Compensation Committee, the Supervisory Board resolved to adjust the compensation of Executive Board member Vishal Sikka to reflect his increased responsibilities. Referring to a report that the independent compensation consulting firm Hostettler, Kramarsch & Partner had prepared, we checked that the compensation the Committee had proposed was appropriate and then approved it. We also resolved to extend Gerhard Oswald’s term of office as an Executive Board member to include the period from July 1, 2014, to December 31, 2016, and approved the extension of his appointment contract accordingly.
The Executive Board updated us about the preparations for the conversion of SAP AG to an SE.
The committees reported from their meetings on topics we had not covered elsewhere on the agenda. The Finance and Investment Committee presented in detail its deliberations from May and June about the planned acquisition of hybris. The Audit Committee reported on the quarter’s results, the audit focus areas for 2013, and the regular review of the Company’s system of internal controls. The Special Committee updated us on TomorrowNow litigation.
After the Executive Board had left the meeting, we discussed succession planning for the Executive and Global Managing Boards.
Extraordinary Meeting in July
We held an extraordinary meeting by telephone conference on July 21, 2013. Jim Hagemann Snabe had informed us that he wished to step down from the Executive Board. After careful deliberation, the Supervisory Board decided to recommend him to the Annual General Meeting of Shareholders in May 2014 as a candidate for Supervisory Board membership, provided the statutory conditions were met for waiving the “cooling-off” period. We then deliberated on Jim Hagemann Snabe’s contract termination agreement. We resolved to terminate his appointment contract by mutual agreement with effect from the end of the Annual General Meeting of Shareholders on May 21, 2014.
24 To Our Stakeholders
Resolutions Adopted by Correspondence in August
On August 16, 2013, the Supervisory Board agreed by correspondence on the terms and conditions and the details of Jim Hagemann Snabe’s contract termination agreement that we had discussed at July’s extraordinary meeting. Under the termination agreement with Jim Hagemann Snabe, he receives fixed compensation for his Executive Board tenure in 2013 and 2014. A report from Ernst & Young confirmed the opinion we had reached in our own review that this compensation was appropriate. Apart from that, we have not agreed to make any payments in connection with Jim Hagemann Snabe’s leaving.
Resolutions Adopted by Correspondence in September
On September 6, 2013, again by correspondence and with the Executive Board’s agreement, we resolved to update the Company’s declaration of implementation of the German Corporate Governance Code (the “Code” in this report) pursuant to the German Stock Corporation Act, section 161. The declaration had to be updated because, under the termination agreement with Jim Hagemann Snabe, he receives only fixed cash compensation elements for his Executive Board tenure in 2013 and 2014. The agreement contains these arrangements because Jim Hagemann Snabe would transfer to the Supervisory Board if the conditions of the German Stock Corporation Act, section 100 (2)(4) are fulfilled and the Annual General Meeting of Shareholders elects him. An advantage of the agreed fixed cash compensation elements is that they avoid a conflict of interest for Jim Hagemann Snabe. If he were to receive the variable compensation elements SAP ordinarily pays its Executive Board members, such a conflict of interest would arise on his transfer to the Supervisory Board because (some) elements of his Supervisory Board compensation package would converge with those of the remaining Executive Board members.
Meeting in October
In our meeting on October 10, 2013, the Executive Board reported on third-quarter business and preliminary results. We then discussed strategy with the Executive Board in light of the Company’s performance.
After the Executive Board had left the meeting, we deliberated on a successor to Werner Brandt as chief financial officer. We agreed to appoint Luka Mucic to this position for a term of three years with effect from July 1, 2014. We discussed Ernst & Young’s report on the appropriateness of the compensation that was to be offered to Luka Mucic. Our own review of the compensation had found it appropriate. We then agreed that and the other terms and conditions of Luka Mucic’s Executive Board appointment contract.
On the recommendation of the General and Compensation Committee, we resolved to again adjust the targets of the 2013 STI plan, 2011 MTI plan, and RSU Milestone Plan 2015. The targets had been adjusted for the hybris acquisition. Since the acquisition was completed later than expected, the targets had to be readjusted to the actual acquisition date.
The Executive Board gave a detailed account of developments in the cloud business, SAP Business Suite powered by SAP HANA, research, and support.
The next item on the agenda was the topic of women on the Executive Board and in leadership at SAP. The Executive Board reported on how the Company’s measures to promote diversity and increase the number of women in leadership positions were progressing.
We received a progress report on the preparations for converting SAP AG to an SE and were informed of who were the members of the Special Negotiating Body.
In agreement with the Executive Board, the Supervisory Board then adopted, for regular publication in October 2013, the annual declaration of implementation of the German Corporate Governance Code pursuant to the German Stock Corporation Act, section 161. The General and Compensation Committee reported that it had met immediately prior to our meeting to verify compliance with the declaration of implementation of the Code. The Supervisory Board determined that we have a sufficient number of independent members. Some Supervisory Board members currently have business dealings with SAP or hold senior positions in companies that currently have business dealings with SAP, or have done so in the course of the year. SAP’s business dealings with these persons or companies are or were at arm’s length. In our view, especially given the limited scope and materiality of those dealings, they did not affect the independence of the Supervisory Board members concerned and do not give rise to any substantial and not merely temporary conflict of interest in the meaning of the
Report from the Supervisory Board 25
Code. Specially designed questionnaires were sent to Supervisory Board and Executive Board members in August 2013 in connection with the regular review of the efficiency of the Supervisory Board’s activities pursuant to section 5.6 of the Code. Ahead of the meeting, we had received a written copy of the Supervisory Board chairperson’s analysis of the results of the survey concerning the efficiency of the work of the Supervisory Board and its committees. We discussed his analysis at the meeting.
On the recommendation of the General and Compensation Committee we resolved to set up a new committee for employee and organizational matters, the People and Organization Committee. We appointed the following members to the People and Organization Committee: Hasso Plattner (chairperson), Anja Feldmann, Wilhelm Haarmann, Christiane Kuntz-Mayr, Lars Lamadé, Hartmut Mehdorn, Mario Rosa-Bian, and Stefan Schulz. The committee is tasked with advising the Executive Board and Supervisory Board on recruitment, people development, major organizational changes, succession planning for the Global Managing Board and other executive positions, employee salary structures and budget, equal opportunities for women at SAP, and employee surveys. We approved a related change to the membership of the Technology and Strategy Committee. Margret Klein-Magar replaces Mario Rosa-Bian, who will step down from this committee. We were then informed about progress on the Company’s activities to attract talented university graduates worldwide and discussed this matter with the Executive Board.
The General and Compensation Committee, the Technology and Strategy Committee, and the Finance and Investment Committee reported on their recent meetings.
Resolution Adopted by Correspondence in November
In November, the Supervisory Board approved by correspondence the Executive Board’s plans to lease a new building in Paris to bring four SAP facilities together in one location.
THE WORK OF THE SUPERVISORY BOARD COMMITTEES
The committees made a key contribution to the work of the Supervisory Board and reported on their work to us. The following committees were in place in 2013 (as of December 31, 2013):
| ¡ | | General and Compensation Committee: Hasso Plattner (chairperson), Panagiotis Bissiritsas, Wilhelm Haarmann, Lars Lamadé, Bernard Liautaud, Margret Klein-Magar |
| ¡ | | Audit Committee: Erhard Schipporeit (chairperson), Stefan Schulz, Inga Wiele, Klaus Wucherer |
| ¡ | | Finance and Investment Committee: Wilhelm Haarmann (chairperson), Panagiotis Bissiritsas, Hartmut Mehdorn, Kurt Reiner |
| ¡ | | Technology and Strategy Committee: Hasso Plattner (chairperson), Stefan Schulz (deputy chairperson), Pekka Ala-Pietilä, Anja Feldmann, Christiane Kuntz-Mayr, Bernard Liautaud, Margret Klein-Magar (joined in November 2013), Kurt Reiner, Mario Rosa-Bian (left in October 2013), Inga Wiele, Klaus Wucherer |
| ¡ | | People and Organization Committee: Hasso Plattner (chairperson), Anja Feldmann, Wilhelm Haarmann, Christiane Kuntz-Mayr, Lars Lamadé, Hartmut Mehdorn, Mario Rosa- Bian, Stefan Schulz |
| ¡ | | Mediation Committee: Hasso Plattner (chairperson), Christiane Kuntz-Mayr, Hartmut Mehdorn, Mario Rosa-Bian |
| ¡ | | Nomination Committee: Hasso Plattner (chairperson), Pekka Ala-Pietilä, Bernard Liautaud |
| ¡ | | Special Committee: Hasso Plattner (chairperson), Pekka Ala-Pietilä, Wilhelm Haarmann, Margret Klein-Magar, Lars Lamadé, Erhard Schipporeit |
Each of the committees was active in 2013 except the Mediation Committee, which has never had to meet in the history of SAP.
For more information about the Supervisory Board committees and their duties, see SAP’s corporate governance statement pursuant to the German Commercial Code, section 289a, published on SAP’s Web site at: www.sap.com/corporate-en/ investors/governance/index.epx.
During 2013, the committees focused on the following topics:
| ¡ | | TheGeneral and Compensation Committee held eight regular meetings, and outside these meetings it passed three resolutions by correspondence. A regular topic on its agenda was succession planning at Executive Board and Global Managing Board levels. The committee prepared the Supervisory Board’s resolutions on Executive Board compensation and on the compensation of the members of the Global Managing |
26 To Our Stakeholders
| | Board. It deliberated on the annual Capital Market Compliance Officer’s Report, the preparations for appointing a successor to Werner Brandt as chief financial officer, and the conversion of SAP AG to an SE. At its May 2013 meeting, the Committee discussed the termination agreements for Lars Dalgaard and Luisa Deplazes Delgado, who had resigned from the Executive Board. It also deliberated on compensation for Global Managing Board members. At its September meeting, the Committee agreed the resolutions it would propose to the Supervisory Board regarding adjustments to the STI, MTI, and long-term incentive (LTI) variable elements of compensation for Executive Board members. As explained above, the adjustments were required to eliminate the nonrecurring effects of the hybris acquisition. It also prepared the Supervisory Board’s resolution on Luka Mucic’s appointment as chief financial officer and deliberated on the plans to set up the People and Organization Committee and this new committee’s composition and tasks. At its October 2013 meeting, the Committee discussed the Company’s implementation of the German Corporate Governance Code recommendations and prepared the Supervisory Board’s decisions with respect to the submission of the declaration of implementation of the Code and on the independence of Supervisory Board members. It also prepared the Supervisory Board’s decision about who should sit on the People and Organization Committee and the tasks of that committee. |
| ¡ | | TheFinance and Investment Committee held four meetings, one of which was a joint meeting with the Technology and Strategy Committee. It also adopted one resolution by correspondence vote. At its meeting on February 11, 2013, the Committee received an update on the SAP Ventures and the SAP HANA Real-Time Fund. It discussed proposals for a new SAP Ventures Fund and for increasing the capital of the SAP HANA Real-Time Fund. It received a summary of equity investments in 2013 and of the work of our Mergers & Acquisitions team. At its May and June 2013 meetings, the Committee deliberated on the hybris acquisition. The Executive Board provided detailed information about its plans to acquire the company, and the Committee resolved to recommend the acquisition to the Supervisory Board. At their joint meeting in October 2013, the Finance and Investment Committee and the Technology and Strategy Committee were informed about SAP’s competitive position and acquisition planning and analysis, and were updated on SAP HANA Enterprise Cloud, and discussed these matters. In November 2013, the Finance and Investment Committee approved by correspondence vote the sale of certain assets of a U.S. subsidiary of Sybase, Inc. |
| ¡ | | TheAudit Committee held four meetings at which members attended in person and four telephone conference meetings. One focus of its work was SAP’s financial reporting, especially the SAP AG and consolidated financial statements, the combined SAP Group and SAP AG management report, and the Form 20-F annual report for 2012. Reviewing the system of risk management in the Group, oversight of the financial reporting process, the systems of internal control and risk management, and the internal audit were also key topics at its meetings. In several of its meetings in 2013, the Audit Committee received updates on the progress and results of the external audit on SAP’s worldwide compliance management system (CMS) for the areas of anticorruption and competition law. The Audit Committee’s view that the compliance processes at SAP are well designed, carefully implemented, and effective was strengthened by the results of the independent external audit of the CMS. In addition, the Committee did preparatory work on the Supervisory Board’s proposals to the Annual General Meeting of Shareholders for the distribution of retained earnings and the auditor to be elected for 2013, and verified the recommended auditor’s independence. Following the election of the auditor, the Audit Committee decided with the auditor on the focus areas of the audit and agreed the auditor’s fee. |
The Audit Committee deliberated regularly on SAP’s business performance and its impact on the Company’s financial accounting. It discussed with the Executive Board the 2012 results, the findings of the 2012 audit, the 2013 quarterly results and quarterly reports, and the auditor’s quarterly reviews of selected software agreements. The auditor attended all physical meetings of the Audit Committee meetings, and most of its teleconference meetings and reported in depth on its audit work and on its quarterly reviews of
Report from the Supervisory Board 27
selected software agreements. In addition to these discussions in the physical meetings, the Executive Board held telephone conferences with the Audit Committee before the announcement of the preliminary quarterly results to inform Committee members about progress on the quarterly financial statements and the quarterly reviews of selected software agreements, and about the preliminary quarterly results. The Audit Committee also discussed each quarterly report with the Executive Board in these telephone conferences. At its July 10 meeting, the Audit Committee was informed by KPMG about the planned audit focus areas. At its meeting on October 9, 2013, the Committee was informed about the governance model for the human resources function with particular regard to risk management and people management. It discussed the effectiveness of the Company’s internal control structure, internal audit service, and compliance system, as described above. The Committee also reviewed the internal audit service’s audit plan.
| ¡ | | TheTechnology and Strategy Committee met four times in 2013. It discussed the key technology trends in the software industry in the years to come and SAP’s corporate and product strategies. The meetings primarily addressed SAP HANA technology and plans to use SAP HANA as the platform for SAP applications. The Committee’s work also focused on the Company’s cloud computing strategy and its implementation. As reported above, in October the Committee held a joint meeting with the Finance and Investment Committee to discuss SAP’s acquisition strategy and review past acquisitions. The Committee discussed the user experience strategy and the strategy for customer relationship management applications. |
| ¡ | | TheNomination Committee, whose members are all shareholder representatives, held one meeting in 2013. At this meeting, in February, it deliberated on the future composition of the Supervisory Board and the plans to convert SAP AG to an SE. |
| ¡ | | TheSpecial Committee is tasked with coordinating and managing the Supervisory Board’s external legal counsel concerned with the investigation and analysis of the facts in connection with the TomorrowNow litigation. The Special Committee invited the Company’s attorneys to its July meeting, held in St. Martin, California, so that they could inform the Committee in person about the latest developments and the court of appeals’ potential verdicts. |
| ¡ | | The newPeople and Organization Committee held its inaugural meeting and adopted its rules of procedure in December 2013. It deliberated on the results of the 2013 employee survey and analyzed them closely. It was informed about personnel planning and development at SAP, and discussed proposals for improvements to the recruitment process. |
Regular reports from the committees ensured that the Supervisory Board was kept fully informed of all matters covered by the committees and were able to discuss them thoroughly.
CORPORATE GOVERNANCE
SAP’s corporate governance officer monitored our compliance with those recommendations in the Code with which, in our declaration, we claim to comply, and reported in full to the General and Compensation Committee. Members of the Executive Board and of the Supervisory Board had no conflicts of interest that sections 4.3.4 and 5.5.2 of the Code require to be disclosed to the Supervisory Board. As we reported above, the Supervisory Board consented to the conclusion of contracts with a member of the Supervisory Board. There was also a transaction between the Company and a member of the Executive Board. It was consistent with industry standards and was immaterial. The General and Compensation Committee consented to this transaction. The Company made no other contracts with members of the Executive Board or Supervisory Board that would have required a prior resolution of the Supervisory Board.
For more information about Code compliance, see the Executive and Supervisory Boards’ Corporate Governance Report. The Supervisory Board closely examined the Executive Board’s corporate governance statement pursuant to the German Commercial Code, section 289a. We approved the statement with the combined SAP Group and SAP AG management report.
28 To Our Stakeholders
SAP AG AND CONSOLIDATED FINANCIAL REPORTS FOR 2013
KPMG audited the SAP AG and consolidated financial reports for 2013. The Annual General Meeting of Shareholders elected KPMG as the SAP AG and SAP Group auditor on June 4, 2013. The Supervisory Board proposed the appointment of KPMG on the recommendation of the Audit Committee. Before proposing KPMG to the Annual General Meeting of Shareholders as auditor for the year, the chairperson of the Supervisory Board and the Audit Committee obtained confirmation from KPMG that circumstances did not exist that might prejudice or raise any doubt concerning its independence as the Company’s auditor. In that connection, KPMG informed us of the volume of other services it provided to the Group in the past year and had been engaged to provide in the year to come. The Supervisory Board has agreed with KPMG that the auditor should report to the Supervisory Board and record in the auditor’s report any fact found during the audit that is inconsistent with the declaration given by the Executive Board and the Supervisory Board concerning implementation of the German Corporate Governance Code. KPMG examined the SAP AG financial statements prepared in accordance with the German Commercial Code, the consolidated financial statements prepared in accordance with International Financial Reporting Standards (IFRSs) as required by the German Commercial Code, section 315a, and the combined SAP Group and SAP AG management report, and certified them without qualification. The auditor thus confirmed that, in its opinion and based on its audit in accordance with the applicable accounting principles, the SAP AG and consolidated financial statements give a true and fair view of the net assets, financial position, and results of operations of SAP AG and the SAP Group. The auditor also confirmed that the combined SAP AG and SAP Group management report is consistent with the corresponding financial statements and as a whole gives a suitable view of the position of SAP AG and the SAP Group and of foreseeable opportunities and risks. KPMG had completed its audit of SAP’s internal control systems over financial reporting and certified without qualification that it complies with the applicable U.S. standards. The auditor states in its opinion that it considers SAP’s internal controls over financial reporting to be effective in all material respects. All Audit Committee and Supervisory Board members received the documents concerning the financial statements mentioned above, the audit reports prepared by KPMG, and the Executive Board’s proposal concerning the appropriation of retained earnings in good time.
On February 20, 2014, the Executive Board prepared the financial reports of SAP AG and the Group for 2014, comprising the SAP AG financial statements, the consolidated financial statements, and the combined management report, and submitted them to the Supervisory Board without delay.
At the meeting of the Audit Committee on Wednesday, March 19, 2014, and at the meeting of the Supervisory Board on Thursday, March 20, 2014, the Executive Board explained the financial statements of SAP AG and the SAP Group and its proposal concerning the appropriation of retained earnings. At the meetings, members of the Executive Board also answered questions from the Audit Committee and the Supervisory Board. It also explained the annual report on Form 20-F to the Audit Committee meeting.
After the explanations from the Executive Board, the Audit Committee and the Supervisory Board reviewed the financial statement documents in the light of KPMG’s audit reports. The representatives of the auditor who attended presented full reports on the audit and the results of the audit to the Audit Committee and Supervisory Board meetings and explained the audit report. The auditor also reported that it had not identified any material weaknesses in our internal control and risk-management systems for financial reporting. Both the Audit Committee and the Supervisory Board asked detailed questions
Report from the Supervisory Board 29
about the form, scope, and results of the audit. The Audit Committee reported to the Supervisory Board on its own review of the financial accounts, its discussions with the Executive Board and with the auditor, and its supervision of the financial reporting process. It confirmed that as part of its supervisory work, it had addressed the effectiveness of internal control, risk management, and internal auditing systems of the SAP Group and found them to be effective.
The Committee also reported that KPMG had told it no circumstances had arisen that might give cause for concern about KPMG’s impartiality and had listed the services it had provided that were not part of the audit. The Committee reported that it had examined the auditor’s independence, taking the non-audit services it had rendered into consideration, and stated that in the Committee’s opinion the auditor possessed the required degree of independence.
The Audit Committee and the Supervisory Board were able to satisfy themselves that KPMG had conducted the audit properly. In particular, they concluded that both the audit reports and the audit itself fulfilled the legal requirements. On the basis of the report and the Audit Committee’s recommendation, the Supervisory Board approved the audit and, because there were no findings from our own examination, we gave our consent to the SAP AG financial statements, the consolidated financial statements, and the combined management report (including the Executive Board’s corporate governance statement pursuant to the German Commercial Code, section 289a). The financial statements and combined management report were thus formally adopted. The Supervisory Board’s opinion of the Company and the Group coincided with that of the Executive Board as set out in the combined management report. The Supervisory Board considered the proposal presented by the Executive Board concerning the appropriation of retained earnings. In doing so, we considered to the requirements of dividends policy, the effects on the liquidity of the Group, and the interests of the shareholders. We also discussed these matters with the auditor. On recommendation of the Audit Committee, we then endorsed the Executive Board’s proposal concerning the appropriation of retained earnings. We approved this present report.
MEMBERSHIP CHANGES ON THE SUPERVISORY BOARD AND EXECUTIVE BOARD
The following members left the Executive Board: Lars Dalgaard on May 31, 2013; and Luisa Deplazes Delgado on June 30, 2013. The Supervisory Board appointed Executive Board member Werner Brandt as labor relations director.
The Supervisory Board thanks the Executive Board, the managing directors of the Group companies, and all of our employees for their hard work and dedication in 2013. We would also like to thank our customers and partners. Without them, our Company’s success would not be possible.
For the Supervisory Board
|
|
| Professor Hasso Plattner |
| (Chairperson) |
30 To Our Stakeholders
Compensation Report1)
COMPENSATION FOR EXECUTIVE AND SUPERVISORY BOARD MEMBERS
This compensation report outlines the criteria that we applied for the year 2013 to determine compensation for Executive Board and Supervisory Board members, discloses the amount of compensation paid, and describes the compensation systems. It also contains information about Executive Board members’ share-based payment plans, shares held by Executive Board and Supervisory Board members, and the directors’ dealings required to be disclosed in accordance with the German Securities Trading Act.
COMPENSATION FOR EXECUTIVE BOARD MEMBERS
Compensation System for 2013
Executive Board members’ compensation for 2013 is intended to reflect SAP’s size and global presence as well as our economic and financial standing. The compensation level is internationally competitive to reward committed, successful work in a dynamic business environment.
The Executive Board compensation package is performance-based. In 2013, it had three elements:
| ¡ | | A variable short-term incentive (STI) plan to reward performance in the plan year |
| ¡ | | A Restricted Share Unit-based long-term incentive (LTI) plan tied to the price of SAP shares (RSU Milestone Plan 2015) |
The Supervisory Board set a compensation target for the sum of the fixed and the variable elements. It reviews, and if appropriate revises, this compensation target every year. The review takes into account SAP’s business performance and the compensation paid to board members at comparable companies on the international stage. The amount of variable compensation depends on SAP’s performance against performance targets that the Supervisory Board sets for each plan year. The performance targets are key performance indicator (KPI) values aligned to the SAP budget for the plan year.
The following criteria apply to the elements of Executive Board compensation for 2013:
| ¡ | | The fixed element is paid as a monthly salary. |
| ¡ | | The variable compensation under the STI 2013 plan depends on the SAP Group’s performance against the KPI target values for non-IFRS constant currency software revenue growth and non-IFRS constant currency operating margin increase as well as non-IFRS constant currency new and upsell billings. In addition, the STI element has a discretionary component that allows the Supervisory Board, after the end of the period in question, to address not only an Executive Board member’s individual performance, but also SAP’s performance in terms of market position, innovative power, customer satisfaction, employee satisfaction, and attractiveness as an employer. Moreover, if there has been any extraordinary and unforeseeable event the Supervisory Board can, at its reasonable discretion, retroactively adjust payouts up or down in the interest of SAP. On February 13, 2014, the Supervisory Board assessed SAP’s performance against the agreed targets and determined the amount of STI payable. The STI pays out after the Annual General Meeting of Shareholders in May 2014. |
| ¡ | | The long-term incentive element is called the RSU Milestone Plan 2015. “RSU” stands for “restricted share unit.” This four-year plan focuses on the SAP share price and on certain objectives derived from our Company strategy for the years through 2015. For each of the four years, the members of the Executive Board are allocated a certain number of SAP RSUs for the respective year based on a budget amount that was granted to each Executive Board member in 2012 already for the years 2012 through 2015. The number of RSUs allocated to each member for a given year is his or her target amount (an amount in euros) for that year divided by the SAP share price over a reference period (defined in the RSU Milestone Plan 2015 terms) at the beginning of the year in question. |
The number of RSUs an Executive Board member actually earns in respect of a given year depends on Company performance against the objectives for that year (a year is a “performance period” in the plan). The objectives derive from SAP’s strategy for the period to 2015. The plan objectives
| 1) | This Compensation report is part of the audited management report. |
Compensation Report 31
relate to two key performance indicators (KPIs): our non-IFRS total revenue and our non-IFRS operating profit. The KPI targets have already been set for the entire life of the RSU Milestone Plan 2015 for the years 2012 to 2015 and will merely be adjusted for the effects of key acquisitions. After the end of each fiscal year, the Supervisory Board assesses the Company’s performance against the objectives set for that year and determines the number of RSUs to be finally allocated to (and which then vest in) each Executive Board member. There are objective-based performance hurdles to clear each year before any RSUs can vest. There is also a cap: Normally, the quantity of vested RSUs a member can attain in respect of a plan year is capped at 150% of his or her initial RSU allocation for that year.
The Company strategy underlying the RSU Milestone Plan 2015 focuses on where SAP aims to be by 2015, so the plan gives greater weight to performance against the KPI targets for 2015 (the final year of the plan) than against the targets for 2012 through 2014. After the end of 2015, the number of vested RSUs a member of the Executive Board actually receives for that year is revised. In circumstances where the targets for the individual years are not achieved but the 2015 targets are achieved, the outcome of this revision would be that a member would receive as many vested RSUs for 2015 as would make up for any that he or she did not receive in the earlier years by reason of failure to achieve targets. On the other hand, if the Company underachieves against the 2015 objectives, Executive Board members may in a worst case scenario lose all of the vested RSUs allocated to them for 2015.
All vested RSUs are subject to a three-year holding period. The holding period commences at the end of the year for which the RSUs were allocated. The amount an RSU eventually pays out depends on the SAP share price at the end of the holding period. A member who leaves the Executive Board before the end of the plan retains his or her vested RSUs for completed plan years but does not retain any allocated but unvested RSUs for the year during which he or she leaves. If a member leaves the Executive Board before the beginning of the subsequent year, no RSUs are finally allocated.
Each vested RSU entitles its holder to a (gross) payout corresponding to the price of one SAP share after the end of the three-year holding period. The applicable share price is measured over a reference period defined in the RSU Milestone Plan 2015 terms.
Subject to the requirements in the German Stock Corporation Act, section 87 (1), the Supervisory Board is entitled to revise the STI and the LTI in extraordinary and unforeseeable circumstances.
For the terms and details of the RSU Milestone Plan 2015, see the Notes to Consolidated Financial Statements section, Note (27). The number of RSUs to be issued to each member of the Executive Board in 2013 by way of long-term incentive was decided by the Supervisory Board on February 14, 2013. An additional long-term incentive plan (LTI HANA) has been dedicated to Vishal Sikka to align his remuneration to his new expanded role with regard to SAP HANA. The LTI HANA for the years 2013 to 2015 consists of three annual compensation components with an assessment period of three years that will be cash-settled after this period. The LTI HANA is linked to KPIs specific to SAP HANA.
The contracts of Executive Board members Bill McDermott, Lars Dalgaard, and Vishal Sikka include clauses that determine the exchange rates for the translation of euro-denominated compensation into U.S. dollars.
In 2010 and 2011, the Executive Board members were granted a variable medium-term incentive (MTI) plan to reward performance in the plan year and the two subsequent years. The variable compensation under the MTI 2011 granted for the fiscal year 2011 depends on the Group’s performance over the three years 2011 to 2013 against the KPI target values for software and software-related service revenue growth and earnings per share (both of which are non-IFRS, constant currency values). In addition, the MTI element has a discretionary component that is assessed by the Supervisory Board at the end of the plan period. The close of the fiscal year 2013 represents the end of the plan period for the MTI 2011, and therefore the corresponding entitlement under the MTI 2011 is included in the compensation for the fiscal year 2013. The payment will be due after the Annual General Meeting of Shareholders in May 2014.
32 To Our Stakeholders
Executive Board Members’ Compensation for 2013
€ thousands
| | | | | | | | | | | | | | | | | | | | | | | | |
| | | Fixed Elements | | | Performance-Related Element | | | Compensation
for 20131) | |
| | | | | | | | | Short-Term
and Medium-Term
Incentive Elements | | | Long-Term
Incentive
Element | | | | |
| | | Salary | | | Other1) | | | STI | | | MTI
2011 | | | Share-Based
Payment
(RSU Milestone
Plan 2015)2) | | | | |
| Bill McDermott (co-CEO) | | | 1,150.0 | | | | 1,570.5 | | | | 1,737.2 | | | | 1,011.1 | | | | 4,143.5 | | | | 9,612.3 | |
| Jim Hagemann Snabe (co-CEO) | | | 1,150.0 | | | | 6,082.9 | | | | 1,737.2 | | | | 1,011.1 | | | | – | | | | 9,981.2 | |
| Dr. Werner Brandt | | | 700.0 | | | | 29.0 | | | | 1,051.5 | | | | 611.0 | | | | 1,486.4 | | | | 3,877.9 | |
| Lars Dalgaard (until May 31, 2013)3) | | | 291.7 | | | | 203.3 | | | | 469.1 | | | | – | | | | – | | | | 964.1 | |
| Luisa Deplazes Delgado (until June 30, 2013)3) | | | 350.0 | | | | 26.1 | | | | 421.0 | | | | – | | | | – | | | | 797.1 | |
| Gerhard Oswald | | | 700.0 | | | | 17.0 | | | | 1,051.5 | | | | 611.0 | | | | 1,486.4 | | | | 3,865.9 | |
| Dr. Vishal Sikka | | | 700.0 | | | | 383.6 | | | | 1,051.5 | | | | 611.0 | | | | 1,486.4 | | | | 4,232.5 | |
| | | | | | | | | | | | | | | | | | | | | | | | |
| Total | | | 5,041.7 | | | | 8,312.4 | | | | 7,519.0 | | | | 3,855.2 | | | | 8,602.7 | | | | 33,331.0 | |
| 1) | Insurance contributions, benefits in kind, expenses for maintenance of two households, relocation costs, non-recurring payments, use of aircraft, tax, cash disbursement of long-term incentive element, discrete payments arising through application of the fixed exchange rate clause. The effects from the application of the fixed exchange rate clause are disclosed under “Other” (in the prior year under the different compensation components). Further, these amounts are shown in the year of payment rather than in the year of entitlement of the underlying compensation. The amount for Jim Hagemann Snabe under “Other” includes the fixed payments for the 2012 and 2013 RSUs according to the description below. |
| 2) | Compensation attributable to Executive Board members for 2013 including the 2013 plan tranche of LTI 2015 based on the grant value at time of grant. |
| 3) | Salary and STI for 2013 arepro rata temporisamounts until the end of the respective term. The RSUs allocated for 2013 are forfeited upon the end of their contract. |
In 2012, the Executive Board members already received the LTI grants for the years 2012 to 2015, which are dependent on their uninterrupted tenure as Executive Board members in the years in question. Although these allocations are tied to the respective years and thus – from an economic perspective – represent compensation for the Executive Board members in the respective years, for the purpose of disclosure in the Compensation Report the grants had to be included in the total compensation for Executive Board members for the year in which the grants were allocated (in 2012) pursuant to section 314 of the German Commercial Code (HGB). The share-based payment amounts in the table above disclose the LTI grants for the year 2013 that were already granted in 2012 and included in the total compensation for 2012. Consequently they are excluded from the total Executive Board compensation for 2013 (see second next paragraph) calculated as required under section 314 of the German Commercial Code.
Compensation Report 33
Jim Hagemann Snabe resigned his seat on the Executive Board with effect from May 21, 2014 (Annual General Meeting of Shareholders). The SAP Supervisory Board will propose that he be elected to the SAP Supervisory Board by the SAP shareholders on the same day. Mr. Snabe’s termination agreement provides as follows: To replace the payout for 2012 RSUs under the RSU Milestone Plan that on allocation in 2012 were valued €4,318,400 based on a stock price of €45.26, he will be paid €6,485,800 gross based on a stock price of €52.96 (that is, the mean of the 2012 and 2013 reference prices) discounted at 2% because of early payment. Of that amount, €4,318,400, which was already allocated in 2012 and which was the grant value at time of grant, was already included in 2012 compensation. The difference of €2,167,400 is included in the total compensation for 2013 (see below). The RSUs allocated for 2013 were converted into a fixed payment of €3,768,300 (gross amount) based on a share price of €58.69, a target achievement of 92.97%, and it is discounted at an interest rate of 2% over the period to the original contractual disbursement date. This amount will be paid out after the close of the Annual General Meeting of Shareholders in May 2014.
To compensate for his 2014 RSUs, Mr. Snabe will receive a prorated payment of €1,700,000 in respect of the period he serves in 2014. This amount will also be paid out after the close of the Annual General Meeting of Shareholders in May 2014.
Including allocations for 2014 and 2015 to Gerhard Oswald (€1,574,800 each) that were allocated in 2013 in line with the extension of his Executive Board contract, the total Executive Board compensation calculated as required under section 314 of the German Commercial Code amounts to €24,109,600, thereof: Bill McDermott €5,468,800, Jim Hagemann Snabe €6,212,900, Werner Brandt €2,391,500, Lars Dalgaard €964,100, Luisa Deplazes Delgado €797,100, Gerhard Oswald €5,529,100, and Vishal Sikka €2,746,100.
The share-based payment amounts in 2013 result from the following RSUs under the RSU Milestone Plan 2015.
Share-Based Payment Under RSU Milestone Plan 2015
| | | | | | | | |
| | | Grants for 2013 | |
| | | Quantity | | | Total Grant Value
at Time of Grant1) | |
| | | | | | € thousands | |
| Bill McDermott (co-CEO) | | | 73,289 | | | | 4,143.5 | |
| Jim Hagemann Snabe (co-CEO)2) | | | – | | | | – | |
| Dr. Werner Brandt | | | 26,290 | | | | 1,486.4 | |
| Lars Dalgaard (until May 31, 2013)2) | | | – | | | | – | |
| Luisa Deplazes Delgado (until June 30, 2013)2) | | | – | | | | – | |
| Gerhard Oswald | | | 26,290 | | | | 1,486.4 | |
| Dr. Vishal Sikka | | | 26,290 | | | | 1,486.4 | |
| | | | | | | | |
| Total | | | 152,159 | | | | 8,602.7 | |
| 1) | The grant value of each RSU allocated in 2013 was €56.54. |
| 2) | The allocations for Jim Hagemann Snabe (73,289 RSUs) were converted into a fixed payment. The allocations for Lars Dalgaard (26,290 RSUs) and Luisa Deplazes Delgado (21,562 RSUs) forfeited upon the end of their contract. Consequently they are not disclosed in the table above. |
34 To Our Stakeholders
Total Executive Board Payment in 2012
€ thousands
| | | | | | | | | | | | | | | | | | | | | | | | |
| | | Fixed Elements | | | Performance-Related Element | | | Compensation
for 20121) | |
| | | | | | | | | Short-Term
and Medium-Term
Incentive Elements | | | Long-Term
Incentive
Element | | | | |
| | | Salary | | | Other2) | | | STI | | | MTI
2010 | | | Share-Based
Payment
(RSU Milestone
Plan 2015)1),3) | | | | |
| Bill McDermott (co-CEO) | | | 1,150.0 | | | | 699.6 | | | | 1,545.7 | | | | 1,067.6 | | | | 4,318.4 | | | | 8,781.3 | |
| Jim Hagemann Snabe (co-CEO) | | | 1,150.0 | | | | 163.8 | | | | 1,545.7 | | | | 1,067.6 | | | | 4,318.4 | | | | 8,245.5 | |
| Dr. Werner Brandt | | | 700.0 | | | | 26.7 | | | | 935.5 | | | | 645.1 | | | | 1,549.1 | | | | 3,856.4 | |
| Lars Dalgaard (from April 12, 2012) | | | 503.6 | | | | 0 | | | | 674.8 | | | | 0 | | | | 1,156.2 | | | | 2,334.6 | |
| Luisa Deplazes Delgado (from September 1, 2012) | | | 233.3 | | | | 96.4 | | | | 193.9 | | | | 0 | | | | 414.4 | | | | 938.0 | |
| Gerhard Oswald | | | 700.0 | | | | 16.5 | | | | 935.5 | | | | 645.1 | | | | 1,549.1 | | | | 3,846.2 | |
| Dr. Vishal Sikka | | | 700.0 | | | | 143.9 | | | | 935.5 | | | | 577.9 | | | | 1,549.1 | | | | 3,906.4 | |
| | | | | | | | | | | | | | | | | | | | | | | | |
| Total | | | 5,136.9 | | | | 1,146.9 | | | | 6,766.6 | | | | 4,003.3 | | | | 14,854.7 | | | | 31,908.4 | |
| 1) | Compensation attributable to Executive Board members for financial year 2012 including the 2012 tranche of LTI 2015 based on the grant value at time of grant. |
| 2) | Insurance contributions, benefits in kind, expenses for maintenance of two households, relocation costs, non-recurring payments, use of aircraft, tax, discrete payments arising through application of the fixed exchange rate clause. The disclosure of payments arising through application of the fixed exchange rate clause was adapted to the disclosure for 2013. |
| 3) | Fair value at the time of grant. |
In 2012, in addition to the LTI grant for 2012, Executive Board members already received the LTI grants for the years 2013 to 2015, which are dependent on their uninterrupted tenure as Executive Board members in the years in question. Although these allocations are tied to the respective years and thus – from an economic perspective – represent compensation for the Executive Board members in the respective years, for the purpose of disclosure in the Compensation Report the grants must be included in the total compensation for Executive Board members for the year in which the grants were allocated pursuant to section 314 of the German Commercial Code. Vesting of a plan tranche is dependent on the respective Executive Board member’s continuous service for the Company in the respective fiscal year. In 2012, the contracts of WernerBrandt and Gerhard Oswald were set to expire in mid-2014, while the contracts of Lars Dalgaard and Luisa Deplazes Delgado were set to expire in mid-2015. As a result, the LTI allocations for the years 2014 to 2015 (for Werner Brandt and Gerhard Oswald) and the LTI allocations for the year 2015 (for Lars Dalgaard and Luisa Deplazes Delgado) had not yet been allocated with legally binding force in 2012.
In 2012, additional grants for Executive Board members for future years were €4,390,000 for each co-CEO and €1,574,800 for each regular Executive Board member, in each of 2013, 2014, and 2015 (except Luisa Deplazes Delgado, who was supposed to receive €1,291,600 for the year 2013). The total compensation for 2012 pursuant to section 314 of the German Commercial Code, in other words, including this additional compensation as well as the long-term compensation tranches granted but not yet earned, amounted to €72,138,400, thereof: Bill McDermott €21,951,300, Jim Hagemann Snabe €21,415,500, Werner Brandt €5,431,200, Lars Dalgaard €5,484,200, Luisa Deplazes Delgado €3,804,400, Gerhard Oswald €5,421,000, and Vishal Sikka €8,630,800.
Compensation Report 35
Share-Based Payment Under RSU Milestone Plan 2015
| | | | | | | | | | | | |
| | | Grants for 2012 | |
| | | Quantity | | | Grant Value per Unit
at Time of Grant | | | Total Grant Value
at Time of Grant | |
| | | | | | € | | | € thousands | |
| Bill McDermott (co-CEO) | | | 95,414 | | | | 45.26 | | | | 4,318.4 | |
| Jim Hagemann Snabe (co-CEO) | | | 95,414 | | | | 45.26 | | | | 4,318.4 | |
| Dr. Werner Brandt | | | 34,226 | | | | 45.26 | | | | 1,549.1 | |
| Lars Dalgaard (from April 12, 2012) | | | 24,594 | | | | 47.01 | | | | 1,156.2 | |
| Luisa Deplazes Delgado (from September 1, 2012) | | | 8,332 | | | | 49.73 | | | | 414.4 | |
| Gerhard Oswald | | | 34,226 | | | | 45.26 | | | | 1,549.1 | |
| Dr. Vishal Sikka | | | 34,226 | | | | 45.26 | | | | 1,549.1 | |
| | | | | | | | | | | | |
| Total | | | 326,432 | | | | | | | | 14,854.7 | |
END-OF-SERVICE BENEFITS
Regular End-of-Service Undertakings
Retirement Pension Plan
The following retirement pension agreements apply to the individual members of the Executive Board:
| ¡ | | Werner Brandt, Luisa Deplazes Delgado (who stepped down on June 30, 2013), and Gerhard Oswald receive a retirement pension when they reach the retirement age of 60 and vacate their Executive Board seat, or a disability pension if, before reaching the regular retirement age, they become subject to occupational disability or permanent incapacity. A surviving dependent’s pension is paid on the death of a former member of the Executive Board. The disability pension is 100% of the vested retirement pension entitlement and is payable until the beneficiary’s 60th birthday, after which it is replaced by a retirement pension. The surviving dependent’s pension is 60% of the retirement pension or vested disability pension entitlement at death. Entitlements are enforceable against SAP AG. Current pension payments are reviewed annually for adjustments and, if applicable, increased according to the surplus in the pension liability insurance. If service is ended before the retirement age of 60 is reached, pension entitlement is reduced in proportion as the actual length of service stands in relation to the maximum possible length of service. |
The applied retirement pension plan is contributory. The contribution is 4% of applicable compensation up to the applicable income threshold plus 14% of applicable compensation above the applicable income threshold. For this purpose, applicable compensation is 180% of annual base salary. The applicable income threshold is the statutory annual income threshold for the state pension plan in Germany (West), as amended from time to time.
Originally, Gerhard Oswald was under a performance-based retirement plan. This plan was discontinued when SAP introduced a contributory retirement pension plan in 2000. His pension benefits are derived from any accrued entitlements on December 31, 1999, under performance-based pension agreements and a salary-linked contribution for the period commencing January 1, 2000. Gerhard Oswald’s rights to retirement pension benefits will increase by further annual contributions because he will remain a member of the Executive Board after his 60th birthday until his retirement on December 31, 2016.
36 To Our Stakeholders
Werner Brandt’s rights to retirement pension benefits will increase by further contributions as he will remain a member of the Executive Board after his 60th birthday until his retirement on June 30, 2014.
| ¡ | | Bill McDermott has rights to future benefits under the portion of the SAP America pension plan classified as “Non-Qualified Retirement Plan” according to the U.S. Employee Retirement Income Security Act (ERISA). The “Non-Qualified” pension plan of SAP America is a cash balance plan that on retirement provides either monthly pension payments or a lump sum. The pension becomes available from the beneficiary’s 65th birthday. Subject to certain conditions, the plan also provides earlier payment or invalidity benefits. The “Non-Qualified” pension plan closed with effect from January 1, 2009. Interest continues to be paid on the earned rights to benefits within this plan. |
| ¡ | | SAP made contributions to a third-party pension plan for Bill McDermott and Vishal Sikka. SAP’s contributions are based on Bill McDermott’s and Vishal Sikka’s payments into this pension plan. In 2013, SAP paid contributions for Bill McDermott totaling €698,400 (2012: €1,053,600) and for Vishal Sikka totaling €153,900 (2012: €215,300). |
| ¡ | | Instead of paying for entitlements under the pension plan for Executive Board members, SAP pays equivalent amounts to a non-SAP pension plan for Jim Hagemann Snabe. In 2013, SAP paid contributions totaling €282,900 (2012: €283,400). |
| ¡ | | Lars Dalgaard has no entitlements under the pension plan for Executive Board members. SAP made no retirement pension plan contributions to a third-party pension plan with respect to Lars Dalgaard in 2013. |
Total Projected Benefit Obligation (PBO) and the Total Accruals for Pension Obligations to Executive Board Members
€ thousands
| | | | | | | | | | | | | | | | | | | | | | | | |
| | | Bill McDermott
(co-CEO)1) | | | Dr. Werner
Brandt | | | Luisa Deplazes
Delgado
(until
June 30, 2013) | | | Gerhard
Oswald | | | Dr. Vishal
Sikka1) | | | Total | |
PBO January 1, 2012 | | | 1,139.5 | | | | 1,499.7 | | | | NA | | | | 4,485.5 | | | | 53.1 | | | | 7,177.8 | |
Less plan assets market value January 1, 2012 | | | 56.6 | | | | 1,131.0 | | | | NA | | | | 3,811.2 | | | | 48.5 | | | | 5,047.3 | |
| | | | | | | | | | | | | | | | | | | | | | | | |
| Accrued January 1, 2012 | | | 1,082.9 | | | | 368.7 | | | | NA | | | | 674.3 | | | | 4.6 | | | | 2,130.5 | |
PBO change in 2012 | | | -64.4 | | | | 541.8 | | | | 55.1 | | | | 1,231.3 | | | | -53.1 | | | | 1,710.7 | |
Plan assets change in 2012 | | | -56.6 | | | | 217.0 | | | | 48.3 | | | | 383.3 | | | | -48.5 | | | | 543.5 | |
PBO December 31, 2012 | | | 1,075.1 | | | | 2,041.5 | | | | 55.1 | | | | 5,716.8 | | | | 0 | | | | 8,888.5 | |
Less plan assets market value December 31, 2012 | | | 0 | | | | 1,348.0 | | | | 48.3 | | | | 4,194.5 | | | | 0 | | | | 5,590.8 | |
| | | | | | | | | | | | | | | | | | | | | | | | |
| Accrued December 31, 2012 | | | 1,075.1 | | | | 693.5 | | | | 6.8 | | | | 1,522.3 | | | | 0 | | | | 3,297.7 | |
PBO change in 2013 | | | -32.4 | | | | 96.0 | | | | 25.2 | | | | 99.7 | | | | 0 | | | | 188.5 | |
Plan assets change in 2013 | | | 0 | | | | 226.2 | | | | 76.5 | | | | 456.8 | | | | 0 | | | | 759.5 | |
PBO December 31, 2013 | | | 1,042.7 | | | | 2,137.5 | | | | 80.3 | | | | 5,816.5 | | | | 0 | | | | 9,077.0 | |
Less plan assets market value December 31, 2013 | | | 0 | | | | 1,574.2 | | | | 124.8 | | | | 4,651.3 | | | | 0 | | | | 6,350.3 | |
| | | | | | | | | | | | | | | | | | | | | | | | |
| Accrued December 31, 2013 | | | 1,042.7 | | | | 563.3 | | | | -44.5 | | | | 1,165.2 | | | | 0 | | | | 2,726.7 | |
| 1) | Prior to May 18, 2012, the qualified portion of the SAP America pension plan was terminated and account balances transferred to third-party pension accounts. |
Compensation Report 37
The table below shows the annual pension entitlement of each member of the Executive Board on reaching age 60 based on entitlements from SAP under performance-based and salary-linked plans vested on December 31, 2013.
Annual Pension Entitlement
€ thousands
| | | | | | | | |
| | | Vested on
December 31,
2013 | | | Vested on
December 31,
2012 | |
| Bill McDermott (co-CEO)1) | | | 88.4 | | | | 78.1 | |
| Dr. Werner Brandt | | | 89.8 | 2) | | | 88.2 | |
| Luisa Deplazes Delgado (until June 30, 2013)3) | | | 5.8 | | | | 2.3 | |
| Gerhard Oswald | | | 267.9 | 4) | | | 259.9 | 5) |
| 1) | The rights shown here for Bill McDermott refer solely to rights under the SAP America pension plan. |
| 2) | Due to the last extension of Werner Brandt’s contract beyond his 60th birthday, this value represents the retirement pension entitlement that he would receive after his current Executive Board contract expires on June 30, 2014, based on the entitlements vested on December 31, 2013. |
| 3) | Due to changes in tax regulations in Germany, for commitments after January 1, 2012, the minimum age to receive pension payments increased to age 62. The value shown for Luisa Deplazes Delgado for 2013 represents the retirement pension entitlement that she would receive at the age of 62 based on the entitlements vested by the end of her contract. |
| 4) | Due to the most recent extension of Gerhard Oswald’s contract beyond June 30, 2014, this value represents the retirement pension entitlement that he would receive after his current Executive Board contract expires on December 31, 2016, based on the entitlements vested on December 31, 2013. |
| 5) | Due to the last extension of Gerhard Oswald’s contract beyond his 60th birthday, this value represents the retirement pension entitlement that he would receive after his current Executive Board contract expires on June 30, 2014, based on the entitlements vested on December 31, 2012. |
These are vested entitlements. To the extent that members continue to serve on the Executive Board and that therefore more contributions are made for them in the future, pensions actually payable at the age of 60 will be higher than the amounts shown in the table.
Postcontractual Non-Compete Provisions
During the agreed 12-month postcontractual non-compete period, each Executive Board member receives abstention payments corresponding to 50% of his or her final average contractual compensation as agreed in the respective contract on an individual basis. Any other occupational income generated by the Executive Board member will be deducted from his compensation in accordance with section 74c of the German Commercial Code.
The following table presents the net present values of the postcontractual non-compete abstention payments. The net present values in the table reflect the discounted present value of the amounts that would be paid in the fictitious scenario in which the Executive Board members leave SAP at the end of their respective current contract terms and their final average contractual compensation prior to their departure equals the compensation in 2013. Actual postcontractual non-compete payments will likely differ from these amounts depending on the time of departure and the compensation levels and target achievements at the time of departure.
Net Present Values of the Postcontractual Non-Compete Abstention Payments
€ thousands
| | | | | | | | |
| | | Contract Term
Expires | | | Net Present
Value of
Postcontractual
Non-Compete
Abstention
Payment | |
| Bill McDermott (co-CEO) | | | June 30, 2017 | | | | 4,534.1 | |
| Dr. Werner Brandt | | | June 30, 2014 | | | | 1,933.3 | |
| Gerhard Oswald | | | December 31, 2016 | | | | 1,846.3 | |
| Dr. Vishal Sikka | | | December 31, 2017 | | | | 1,958.9 | |
| | | | | | | | |
| Total | | | | | | | 10,272.6 | |
After his resignation as a member of the Executive Board, Jim Hagemann Snabe will receive monthly abstention compensation over a period of twelve months for the postcontractual non-compete period totaling €3,015,500 (gross).
Early End-of-Service Undertakings
Severance Payments
The standard contract for all Executive Board members provides that on termination before full term (for example, where the member’s appointment is revoked, where the member becomes occupationally disabled, or in connection
38 To Our Stakeholders
with a change of control), SAP AG will pay to the member the outstanding part of the compensation target for the entire remainder of the term, appropriately discounted for early payment. A member has no claim to that payment if he or she has not served SAP as a member of its Executive Board for at least one year or if he or she leaves SAP AG for reasons for which he or she is responsible.
If an Executive Board member’s appointment to the Executive Board expires or ceases to exist because of, or as a consequence of, change or restructuring, or due to a change of control, SAP AG and each Executive Board member has the right to terminate the employment contract within eight weeks of the occurrence by giving six months’ notice. A change of control is deemed to occur when a third party is required to make a mandatory takeover offer to the shareholders of SAP AG under the German Securities Acquisition and Takeover Act, when SAP AG merges with another company and becomes the subsumed entity, or when a control or profit transfer agreement is concluded with SAP AG as the dependent company. An Executive Board member’s contract can also be terminated before full term if his or her appointment as an SAP AG Executive Board member is revoked in connection with a change of control.
Postcontractual Non-Compete Provisions
Abstention compensation for the postcontractual non-compete period as described above is also payable on early contract termination.
Permanent Disability
In case of permanent disability, the contract will end at the end of the quarter in which the permanent inability to work was determined. The Executive Board member receives the monthly basic salary for a further 12 months starting from the date the permanent disability is determined.
Payments to Executive Board Members Retiring in 2013
Luisa Deplazes Delgado resigned from her position as Executive Board member with effect from June 30, 2013, with the approval of the Supervisory Board. Lars Dalgaard resigned from his position as Executive Board member with effect from May 31, 2013, with the approval of the Supervisory Board. The postcontractual non-compete provision in both contracts has been canceled without compensation.
Payments to Former Executive Board Members
In 2013, we paid pension benefits of €1,387,000 to Executive Board members who had retired before January 1, 2013 (2012: €1,360,000). At the end of the year, the PBO for former Executive Board members was €29,181,000 (2012: €30,551,000). Plan assets of €26,015,000 are available to service these obligations (2012: €26,054,000).
EXECUTIVE BOARD MEMBERS’ LONG-TERM INCENTIVES
Members of the Executive Board hold or held throughout the year share-based payment rights under the RSU Milestone Plan 2015 and the SAP SOP 2010 (which were granted in previous years). For information about the terms and details of these programs, see the Notes to the Consolidated Financial Statements section, Note (27).
RSU Milestone Plan 2015
The table below shows Executive Board members’ holdings, on December 31, 2013, of restricted share units issued to them under the RSU Milestone Plan 2015. The plan is a cash-settled long-term incentive scheme with a payout subsequent to a performance period of one year and an additional holding period of three years. The RSU Milestone Plan 2015 consists of four plan tranches to be issued with respect to the calendar years 2012 through 2015.
Compensation Report 39
RSU Milestone Plan 2015
Quantity of RSUs
| | | | | | | | | | | | | | | | | | | | | | | | |
| | | Holding on
January 1,
2013 | | | Grants in 2013 | | | Performance-
Related
Adjustment | | | Exercised
Units | | | Forfeited
Units | | | Holding on
December 31,
2013 | |
| Bill McDermott (co-CEO) | | | 127,425 | | | | 73,289 | | | | -5,152 | | | | – | | | | – | | | | 195,562 | |
| Jim Hagemann Snabe (co-CEO)1) | | | 127,425 | | | | 73,289 | | | | -5,152 | | | | 195,562 | | | | – | | | | – | |
| Dr. Werner Brandt | | | 45,709 | | | | 26,290 | | | | -1,848 | | | | – | | | | – | | | | 70,151 | |
| Lars Dalgaard (until May 31, 2013) | | | 32,845 | | | | 26,290 | | | | – | | | | – | | | | 26,290 | | | | 32,845 | |
| Luisa Deplazes Delgado (until June 30, 2013) | | | 11,127 | | | | 21,562 | | | | – | | | | – | | | | 21,562 | | | | 11,127 | |
| Gerhard Oswald | | | 45,709 | | | | 26,290 | | | | -1,848 | | | | – | | | | – | | | | 70,151 | |
| Dr. Vishal Sikka | | | 45,709 | | | | 26,290 | | | | -1,848 | | | | – | | | | – | | | | 70,151 | |
| | | | | | | | | | | | | | | | | | | | | | | | |
| Total | | | 435,950 | | | | 273,300 | | | | -15,849 | | | | 195,562 | | | | 47,852 | | | | 449,987 | |
| 1) | According to the termination agreement with Jim Hagemann Snabe, the 2012 and 2013 grants will be paid out after the close of the Annual General Meeting of Shareholders on May 21, 2014 based on a fixed share price of €52.96 for the 2012 grants and €58.69 for the 2013 grants. |
The holding of RSUs on December 31, 2013, that were issued and not forfeited in 2013, reflects the number of RSUs multiplied by the 92.97% target achievement. The RSUs allocated in 2012 have a remaining term of 2.08 years, the RSUs allocated in 2013 have a remaining term of 3.08 years.
RSU Milestone Plan 2015 (2012 Tranche)
Quantity of RSUs
| | | | | | | | | | | | | | | | | | | | | | | | |
| | | Holding on
January 1,
2012 | | | Grants in 2012 | | | Performance-
Related
Adjustment | | | Exercised
Units | | | Forfeited
Units | | | Holding on
December 31,
2012 | |
| Bill McDermott (co-CEO) | | | – | | | | 95,414 | | | | 32,011 | | | | – | | | | – | | | | 127,425 | |
| Jim Hagemann Snabe (co-CEO) | | | – | | | | 95,414 | | | | 32,011 | | | | – | | | | – | | | | 127,425 | |
| Dr. Werner Brandt | | | – | | | | 34,226 | | | | 11,483 | | | | – | | | | – | | | | 45,709 | |
| Lars Dalgaard (from April 12, 2012) | | | – | | | | 24,594 | | | | 8,251 | | | | – | | | | – | | | | 32,845 | |
| Luisa Deplazes Delgado (from September 1,2012) | | | – | | | | 8,332 | | | | 2,795 | | | | – | | | | – | | | | 11,127 | |
| Gerhard Oswald | | | – | | | | 34,226 | | | | 11,483 | | | | – | | | | – | | | | 45,709 | |
| Dr. Vishal Sikka | | | – | | | | 34,226 | | | | 11,483 | | | | – | | | | – | | | | 45,709 | |
| | | | | | | | | | | | | | | | | | | | | | | | |
| Total | | | – | | | | 326,432 | | | | 109,518 | | | | – | | | | – | | | | 435,950 | |
The holding on December 31, 2012, reflects the number of RSUs issued in 2012 multiplied by the 133.55% target achievement.
40 To Our Stakeholders
SAP SOP 2010
The table below shows Executive Board members’ holdings, on December 31, 2013, of virtual share options issued to them under the SAP SOP 2010 since its inception. The strike price for an option is 115% of the base price. The issued options have a term of seven years and can only be exercised on specified dates after the vesting period. The options issued in 2010 are exercisable beginning in September 2014 and the options issued in 2011 are exercisable beginning in June 2015.
SAP SOP 2010 Virtual Share Options
| | | | | | | | | | | | | | | | | | | | | | | | | | | | | | | | | | | | | | | | |
| | | Year
Granted | | | Holding on
January 1, 2013 | | | Strike
Price per
Option | | | Rights
Exercised
in 2013 | | | Price on
Exercise
Date | | | Exercisable
Rights of
Retired
Members
of the
Executive
Board | | | Forfeited
Rights | | | Holding on
December 31, 2013 | |
| | | | | | Quantity of
Options | | | Remaining
Term in
Years | | | € | | | Quantity of
Options | | | € | | | Quantity of
Options | | | Quantity of
Options | | | Quantity of
Options | | | Remaining
Term in
Years | |
| Bill McDermott | | | 2010 | | | | 135,714 | | | | 4.69 | | | | 40.80 | | | | – | | | | – | | | | – | | | | – | | | | 135,714 | | | | 3.69 | |
| (co-CEO) | | | 2011 | | | | 112,426 | | | | 5.44 | | | | 48.33 | | | | – | | | | – | | | | – | | | | – | | | | 112,426 | | | | 4.44 | |
| Jim Hagemann Snabe | | | 2010 | | | | 135,714 | | | | 4.69 | | | | 40.80 | | | | – | | | | – | | | | – | | | | – | | | | 135,714 | | | | 3.69 | |
| (co-CEO) | | | 2011 | | | | 112,426 | | | | 5.44 | | | | 48.33 | | | | – | | | | – | | | | – | | | | – | | | | 112,426 | | | | 4.44 | |
| Dr. Werner Brandt | | | 2010 | | | | 82,428 | | | | 4.69 | | | | 40.80 | | | | – | | | | – | | | | – | | | | – | | | | 82,428 | | | | 3.69 | |
| | | 2011 | | | | 68,284 | | | | 5.44 | | | | 48.33 | | | | – | | | | – | | | | – | | | | – | | | | 68,284 | | | | 4.44 | |
| Gerhard Oswald | | | 2010 | | | | 82,428 | | | | 4.69 | | | | 40.80 | | | | – | | | | – | | | | – | | | | – | | | | 82,428 | | | | 3.69 | |
| | | 2011 | | | | 68,284 | | | | 5.44 | | | | 48.33 | | | | – | | | | – | | | | – | | | | – | | | | 68,284 | | | | 4.44 | |
| Dr. Vishal Sikka | | | 2010 | | | | 82,428 | | | | 4.69 | | | | 40.80 | | | | – | | | | – | | | | – | | | | – | | | | 82,428 | | | | 3.69 | |
| | | 2011 | | | | 68,284 | | | | 5.44 | | | | 48.33 | | | | – | | | | – | | | | – | | | | – | | | | 68,284 | | | | 4.44 | |
| | | | | | | | | | | | | | | | | | | | | | | | | | | | | | | | | | | | | | | | |
| Total | | | | | | | 948,416 | | | | | | | | | | | | – | | | | – | | | | – | | | | – | | | | 948,416 | | | | | |
Total Expense for Share-Based Payment
In the report year and the prior year, total expense for the share-based payment plans of Executive Board members was recorded as follows.
Total Expense for Share-Based Payment
€ thousands
| | | | | | | | |
| | | 2013 | | | 2012 | |
| Bill McDermott (co-CEO) | | | -1,529.7 | | | | 16,239.0 | |
| Jim Hagemann Snabe (co-CEO) | | | -2,967.0 | | | | 16,239.0 | |
| Dr. Werner Brandt | | | 1,042.9 | | | | 4,998.1 | |
| Lars Dalgaard (until May 31, 2013) | | | -2,264.2 | | | | 4,239.6 | |
| Luisa Deplazes Delgado (until June 30, 2013) | | | -2,126.4 | | | | 2,795.6 | |
| Gerhard Oswald | | | -376.0 | | | | 6,417.0 | |
| Dr. Vishal Sikka | | | -376.0 | | | | 6,500.3 | |
| | | | | | | | |
| Total | | | -8,596.4 | | | | 57,428.6 | |
Compensation Report 41
The expense is recognized in accordance with IFRS 2 “Share-Based Payments.” Because the RSU Milestone Plan 2015 tranches for 2014 to 2015 were allocated at the beginning of 2012, we are required to recognize them in part in 2013 even though these future tranches depend on the achievement of specific financial targets in future periods.
Shareholdings and Transactions of Executive Board Members
No member of the Executive Board holds more than 1% of the ordinary shares of SAP AG. Members of the Executive Board held a total of 30,201 SAP shares on December 31, 2013 (2012: 35,271 shares).
The table below shows transactions by Executive Board members and persons closely associated with them notified to SAP pursuant to the German Securities Trading Act, section 15a, in 2013.
Transactions in SAP Shares
| | | | | | | | | | | | |
| | | Transaction Date | | Transaction | | Quantity | | | Unit Price | |
| Dr. Werner Brandt | | June 10, 2013 | | Share purchase | | | 800 | | | | €58.5900 | |
| | November 26, 2013 | | Share sale | | | 11,000 | | | | €60.9000 | |
| Gerhard Oswald | | June 11, 2013 | | Share purchase | | | 815 | | | | €57.5260 | |
| Jim Hagemann Snabe (co-CEO) | | July 22, 2013 | | Share purchase | | | 1,815 | | | | €55.2038 | |
| Bill McDermott (co-CEO) | | July 23, 2013 | | Purchase of ADRs | | | 1,500 | | | | US$72.8400 | |
| Dr. Vishal Sikka | | September 11, 2013 | | Purchase of ADRs | | | 1,000 | | | | US$72.5800 | |
EXECUTIVE BOARD: OTHER INFORMATION
We did not grant any compensation advance or credit to, or enter into any commitment for the benefit of, any member of our Executive Board in 2013 or the previous year.
As far as the law permits, SAP AG and its affiliated companies in Germany and elsewhere indemnify and hold harmless their respective directors and officers against and from the claims of third parties. To this end, we maintain directors’ and officers’ (D&O) group liability insurance. The policy is annual and is renewed from year to year. The insurance covers the personal liability of the insured group for financial loss caused by its managerial acts and omissions. The current D&O policy includes an individual deductible for Executive Board members of SAP AG as required by section 93 (2) of the German Stock Corporation Act.
COMPENSATION FOR SUPERVISORY BOARD MEMBERS
Compensation System
Supervisory Board members’ compensation is governed by our Articles of Incorporation, section 16. Each member of the Supervisory Board receives, in addition to the reimbursement of his or her expenses, compensation composed of fixed elements and a variable element. The variable element depends on the dividend paid by SAP on its shares.
The fixed element is €100,000 for the chairperson, €70,000 for the deputy chairperson, and €50,000 for other members. For membership of the Audit Committee, Supervisory Board members receive additional fixed annual remuneration of €15,000, and for membership of any other Supervisory Board committee €10,000, provided that the committee concerned has met in the year. The chairperson of the Audit Committee receives €25,000, and the chairpersons of the other committees receive €20,000. The fixed remuneration is payable after the end of the year.
42 To Our Stakeholders
The variable compensation element is €10,000 for the chairperson, €8,000 for the deputy chairperson, and €6,000 for the other members of the Supervisory Board for each €0.01 by which the dividend distributed per share exceeds €0.40. The variable remuneration is payable after the end of the Annual General Meeting of Shareholders that resolves on the dividend for the relevant year.
However, the aggregate compensation excluding compensation for committee memberships must not exceed €250,000 for the chairperson, €200,000 for the deputy chairperson, and €150,000 for other members of the Supervisory Board.
Any members of the Supervisory Board having served for less than the entire year receive one-twelfth of the annual remuneration for each month of service commenced. This also applies to the increased compensation of the chairperson and the deputy chairperson and to the remuneration for the chairperson and the members of a committee.
Amount of Compensation
Subject to the resolution on the appropriation of retained earnings by the Annual General Meeting of Shareholders on May 21, 2014, the compensation paid to Supervisory Board members in respect of 2013 will be as set out in the table below.
Supervisory Board Members’ Compensation in 2013
€ thousands
| | | | | | | | | | | | | | | | | | | | | | | | | | | | | | | | |
| | | 2013 | | | 2012 | |
| | | Fixed
Compensation | | | Compensation
for
Committee
Work | | | Variable
Compensation | | | Total | | | Fixed
Compensation | | | Compensation
for
Committee
Work | | | Variable
Compensation | | | Total | |
| Prof. Dr. h.c. mult. Hasso Plattner (chairperson) | | | 100.0 | | | | 81.7 | | | | 150.0 | | | | 331.7 | | | | 100.0 | | | | 60.0 | | | | 150.0 | | | | 310.0 | |
| Christiane Kuntz-Mayr (deputy chairperson) | | | 70.0 | | | | 10.8 | | | | 130.0 | | | | 210.8 | | | | 67.5 | | | | 10.0 | | | | 128.3 | | | | 205.8 | |
| Pekka Ala-Pietilä | | | 50.0 | | | | 30.0 | | | | 100.0 | | | | 180.0 | | | | 50.0 | | | | 20.0 | | | | 100.0 | | | | 170.0 | |
| Panagiotis Bissiritsas | | | 50.0 | | | | 20.0 | | | | 100.0 | | | | 170.0 | | | | 50.0 | | | | 24.2 | | | | 100.0 | | | | 174.2 | |
| Prof. Anja Feldmann | | | 50.0 | | | | 10.8 | | | | 100.0 | | | | 160.8 | | | | 33.3 | | | | 6.7 | | | | 66.7 | | | | 106.7 | |
| Prof. Dr. Wilhelm Haarmann | | | 50.0 | | | | 40.8 | | | | 100.0 | | | | 190.8 | | | | 50.0 | | | | 30.0 | | | | 100.0 | | | | 180.0 | |
| Margret Klein-Magar | | | 50.0 | | | | 20.0 | | | | 100.0 | | | | 170.0 | | | | 33.3 | | | | 6.7 | | | | 66.7 | | | | 106.7 | |
| Lars Lamadé | | | 50.0 | | | | 20.8 | | | | 100.0 | | | | 170.8 | | | | 62.5 | | | | 10.0 | | | | 120.8 | | | | 193.3 | |
| Bernard Liautaud | | | 50.0 | | | | 30.0 | | | | 100.0 | | | | 180.0 | | | | 50.0 | | | | 16.7 | | | | 100.0 | | | | 166.7 | |
| Dr. h. c. Hartmut Mehdorn | | | 50.0 | | | | 10.8 | | | | 100.0 | | | | 160.8 | | | | 50.0 | | | | 10.0 | | | | 100.0 | | | | 160.0 | |
| Dr. Kurt Reiner | | | 50.0 | | | | 20.0 | | | | 100.0 | | | | 170.0 | | | | 33.3 | | | | 13.3 | | | | 66.7 | | | | 113.3 | |
| Mario Rosa-Bian | | | 50.0 | | | | 9.2 | | | | 100.0 | | | | 159.2 | | | | 33.3 | | | | 6.7 | | | | 66.7 | | | | 106.7 | |
| Dr. Erhard Schipporeit | | | 50.0 | | | | 35.0 | | | | 100.0 | | | | 185.0 | | | | 50.0 | | | | 25.0 | | | | 100.0 | | | | 175.0 | |
| Stefan Schulz | | | 50.0 | | | | 25.8 | | | | 100.0 | | | | 175.8 | | | | 50.0 | | | | 24.2 | | | | 100.0 | | | | 174.2 | |
| Inga Wiele | | | 50.0 | | | | 25.0 | | | | 100.0 | | | | 175.0 | | | | 33.3 | | | | 16.7 | | | | 66.7 | | | | 116.7 | |
| Prof. Dr.-Ing. Dr.-Ing. E.h. Klaus Wucherer | | | 50.0 | | | | 25.0 | | | | 100.0 | | | | 175.0 | | | | 50.0 | | | | 20.0 | | | | 100.0 | | | | 170.0 | |
| Compensation for former Supervisory Board Members | | | NA | | | | NA | | | | NA | | | | NA | | | | 104.0 | | | | 39.7 | | | | 208.5 | | | | 352.2 | |
| | | | | | | | | | | | | | | | | | | | | | | | | | | | | | | | |
| Total | | | 870.0 | | | | 415.8 | | | | 1,680.0 | | | | 2,965.8 | | | | 900.8 | | | | 339.6 | | | | 1,740.8 | | | | 2,981.3 | |
Compensation Report 43
In addition, we reimburse members of the Supervisory Board for their expenses and the value-added tax payable on their compensation.
The total compensation of all Supervisory Board members in 2013 for work for SAP excluding compensation relating to the office of Supervisory Board member was €1,176,200 (2012: €1,083,500). Those amounts are composed entirely of remuneration received by employee representatives on the Supervisory Board relating to their position as SAP employees in 2013 and 2012, respectively.
Supervisory Board member Wilhelm Haarmann practiced as a partner in the law firm HAARMANN Partnerschaftsgesellschaft in Frankfurt am Main, Germany, until February 2013. In February 2013, he was elected a partner in Linklaters LLP in Frankfurt am Main, Germany. Wilhelm Haarmann occasionally advises SAP on particular projects, tax matters, and questions of law. Before Mr. Haarmann joined Linklaters LLP, SAP had already received consulting services from Linklaters and will continue to do so. In 2013, the fees for such services totaled €327,500 (2012: €9,400).
LONG-TERM INCENTIVES FOR THE SUPERVISORY BOARD
We do not offer members share options or other share-based payment for their Supervisory Board work. Any share options or other share-based payment received by employee-elected members relate to their position as SAP employees and not to their work on the Supervisory Board.
Shareholdings and Transactions of Supervisory Board Members
Supervisory Board chairperson Hasso Plattner and the companies he controlled held 119,300,882 SAP shares on December 31, 2013 (December 31, 2012: 121,348,807 SAP shares), representing 9.711% (2012: 9.878%) of SAP’s share capital. No other member of the Supervisory Board held more than 1% of the SAP AG share capital at the end of 2013 or of the previous year. Members of the Supervisory Board held a total of 119,316,444 SAP shares on December 31, 2013 (December 31, 2012: 121,363,858 SAP shares).
The table below shows transactions by Supervisory Board members and persons closely associated with them notified to SAP pursuant to the German Securities Trading Act, section 15a, in 2013:
Transactions in SAP Shares
| | | | | | | | | | | | |
| | | Transaction Date | | Transaction | | Quantity | | | Unit Price in € | |
| Christian Wiele | | August 23, 2013 | | Share sale | | | 116 | | | | 57.2600 | |
| Inga Wiele | | August 26, 2013 | | Share sale | | | 92 | | | | 57.3500 | |
| Margret Klein-Magar | | August 26, 2013 | | Share sale | | | 132 | | | | 57.0400 | |
| Mario Rosa-Bian | | August 27, 2013 | | Share sale | | | 130 | | | | 57.3500 | |
| Hasso Plattner | | October 24, 2013 | | Share sale | | | 1 | ) | | | 1 | ) |
| 1) | The notifying party (Hasso Plattner GmbH & Co. Beteiligungs-KG) concluded a contract with a bank acting as commission agent for the monthly sale of SAP shares with a fair value of €10,000,000 per month. The sale will be carried out at the bank’s own discretion in the stock market or over the counter, during December 2013 through November 2014. With this transaction a program running since November 2012 will be continued (see notification on November 30, 2012). Price: Targeted is the volume-weighted average (stock market) price of the SAP share on the relevant day of sale. Number of items: Total amount traded divided by the relevant sale price of the sold shares. |
SUPERVISORY BOARD: OTHER INFORMATION
We did not grant any compensation advance or credit to, or enter into any commitment for the benefit of, any member of our Supervisory Board in 2013 or the previous year.
Hasso Plattner, the chairperson of the Supervisory Board, entered into a consulting contract with SAP after he joined the Supervisory Board in May 2003. The contract does not provide for any compensation. The only cost we incurred under the contract was the reimbursement of expenses.
As far as the law permits, we indemnify Supervisory Board members against, and hold them harmless from, claims brought by third parties. To this end, we maintain directors’ and officers’ (D&O) group liability insurance. The current D&O policy does not include an individual deductible for Supervisory Board members as envisaged in the German Corporate Governance Code.
44 To Our Stakeholders
Responsibility Statement
To the best of our knowledge, and in accordance with the applicable reporting principles, the consolidated financial statements give a true and fair view of the assets, finances, and operating results of the Group, and the management report of the Group and SAP AG includes a fair review of the development and performance of the business and the position of the Group and SAP AG, together with a description of the material opportunities and risks associated with the expected development of the Group and SAP AG.
Walldorf, February 20, 2014
SAP AG
Walldorf, Baden
The Executive Board
| | | | |
| | | | |
Bill Mcdermott | | | | Jim Hagemann Snabe |
| | | | |
| | | | |
Werner Brandt | | | | Gerhard Oswald |
Responsibility Statement 45
Independent Auditor’s Report
TO SAP AG
Report on the Consolidated Financial Statements
We have audited the accompanying consolidated financial statements of SAP AG, Walldorf (“SAP” or “the Company”), and its subsidiaries, which comprise the consolidated statement of financial position as of December 31, 2013, and the consolidated income statement, the consolidated statement of comprehensive income, the consolidated statement of changes in equity, the consolidated statement of cash flows, and the notes to the consolidated financial statements for the year then ended.
Management’s Responsibility for the Consolidated Financial Statements
Management is responsible for the preparation of consolidated financial statements. This includes the responsibility that the consolidated financial statements give a true and fair view of the Company’s net assets, financial position, and results of operations in accordance with International Financial Reporting Standards (IFRSs) as adopted by the European Union (“EU”), the supplementary provisions of German law to be applied in accordance with the German Commercial Code (Handelsgesetzbuch, “HGB”), section 315a (1), and IFRSs as issued by the International Accounting Standards Board. Management’s responsibility includes maintaining such internal control as management determines necessary to enable the preparation of consolidated financial statements that are free from material misstatement, whether due to fraud or error.
Auditor’s Responsibility
Our responsibility is to express an opinion on these consolidated financial statements based on our audit. We conducted our audit in accordance with HGB, section 317, and German generally accepted standards for the audit of consolidated financial statements, promulgated by the Institut der Wirtschaftsprüfer (“IDW”), and in supplementary compliance with International Standards on Auditing and standards of the Public Company Accounting Oversight Board (United States). Those standards require that we comply with ethical requirements and plan and perform the audit to obtain reasonable assurance about whether the consolidated financial statements are free from material misstatement.
An audit involves performing procedures to obtain audit evidence about the amounts and disclosures in the consolidated financial statements. The procedures selected depend on the auditor’s judgment, including the assessment of the risks of material misstatement in the consolidated financial statements, whether due to fraud or error. In making those risk assessments, the auditor considers internal control relevant to the entity’s preparation of the consolidated financial statements that give a true and fair view in order to design audit procedures that are appropriate in the circumstances. An audit also includes evaluating the appropriateness of accounting policies used and the reasonableness of accounting estimates made by management, as well as evaluating the overall presentation of the consolidated financial statements.
We believe that the audit evidence we have obtained is sufficient and appropriate to provide a basis for our audit opinion.
Opinion
In accordance with HGB, section 322 (3) sentence 1, we declare that our audit of the consolidated financial statements has not led to any reservations.
In our opinion, based on our audit, the consolidated financial statements give a true and fair view of the Company’s net assets and financial position as of December 31, 2013; and of its results of operations for the year then ended, in accordance with IFRSs as adopted by the EU, the supplementary provisions of German law to be applied in accordance with HGB, section 315a (1), and IFRSs as issued by the International Accounting Standards Board.
46 To Our Stakeholders
Report on the Management Report
We have audited the accompanying combined management report for SAP Group and SAP AG (“management report”) for the business year ended December 31, 2013.
Management’s Responsibility for the Management Report
Management is responsible for the preparation of the management report in accordance with the provisions of German law to be applied in accordance with HGB, section 315a (1), the German Accounting Standards Nos. 17 and 20 (GAS 17, GAS 20) and the provisions of the IFRS Practice Statement Management Commentary.
Auditor’s Responsibility
Our responsibility is to express an opinion on this management report based on our audit. We conducted our audit of the management report in accordance with HGB, section 317 (2), and German generally accepted standards for the audit of management reports promulgated by the IDW. Those standards require that we plan and perform the audit of the management report in such a way that we obtain reasonable assurance about whether the management report is consistent with the consolidated financial statements and the findings from our audit of the consolidated financial statements and as a whole provides a suitable understanding of the Company’s position and suitably presents the opportunities and risks of future development.
We believe that the audit evidence we have obtained is sufficient and appropriate to provide a basis for our audit opinion.
Opinion
In accordance with HGB, section 322 (3) sentence 1, we declare that our audit has not led to any reservations.
In our opinion, based on our audit of the consolidated financial statements and the management report, the management report is consistent with the consolidated financial statements and as a whole, provides a suitable view of the Company’s position and suitably presents the opportunities and risks of future development.
Report on the Effectiveness of Internal Control over Financial Reporting in the Consolidated Financial Statements in accordance with the standards of the public Company Accounting Oversight Board (United States)
We have audited SAP’s internal control over financial reporting in the consolidated financial statements as of December 31, 2013, based on criteria established in Internal Control – Integrated Framework issued by the Committee of Sponsoring Organizations of the Treadway Commission (COSO).
Management’s Responsibility for Internal Control
Management is responsible for maintaining effective internal control over financial reporting in the consolidated financial statements, and for the assessment of its effectiveness, as included in the accompanying Management’s Annual Report on Internal Control over Financial Reporting in the Consolidated Financial Statements.
A company’s internal control over financial reporting in the consolidated financial statements is a process designed to provide reasonable assurance regarding the reliability of financial reporting and the preparation of financial statements
Independent Auditor’s Report 47
for external purposes in accordance with generally accepted accounting principles. A company’s internal control over financial reporting in the consolidated financial statements includes those policies and procedures that (1) pertain to the maintenance of records that, in reasonable detail, accurately and fairly reflect the transactions and dispositions of the assets of the company; (2) provide reasonable assurance that transactions are recorded as necessary to permit preparation of financial statements in accordance with generally accepted accounting principles; and (3) provide reasonable assurance regarding prevention or timely detection of unauthorized acquisition, use, or disposition of the company’s assets that could have a material effect on the financial statements.
Because of its inherent limitations, internal control over financial reporting in the consolidated financial statements may not prevent or detect misstatements. Also, projections of any evaluation of effectiveness to future periods are subject to the risk that controls may become inadequate because of changes in conditions, or that the degree of compliance with the policies or procedures may deteriorate.
Auditor’s Responsibility
Our responsibility is to express an opinion on SAP’s internal control over financial reporting in the consolidated financial statements based on our audit. We conducted our audit in accordance with the standards of the Public Company Accounting Oversight Board (United States). Those standards require that we plan and perform the audit to obtain reasonable assurance about whether effective internal control over financial reporting in the consolidated financial statements was maintained in all material respects. Our audit included obtaining an understanding of internal control over financial reporting in the consolidated financial statements, assessing the risk that a material weakness exists, and testing and evaluating the design and operating effectiveness of internal control based on the assessed risk. Our audit also included performing such other procedures as we considered necessary in the circumstances.
We believe that the audit evidence we have obtained is sufficient and appropriate to provide a basis for our audit opinion.
Opinion
In our opinion, SAP maintained, in all material respects, effective internal control over financial reporting in the consolidated financial statements as of December 31, 2013, based on criteria established in Internal Control – Integrated Framework issued by COSO.
Mannheim, February 20, 2014
KPMG AG
Wirtschaftsprüfungsgesellschaft
| | | | |
| Dr. Gutsche | | Dr. Böttcher | | |
| Wirtschaftsprüfer | | Wirtschaftsprüfer | | |
48 To Our Stakeholders
Vision, Mission,
and Strategy
Our vision is to help the
world run better and
improve people’s lives;
our mission is to help
every customer become
a best-run business.
To learn more about SAP’s vision, mission, and strategy visit www.sapintegratedreport.com
50
General Information About This Management Report
FORWARD-LOOKING STATEMENTS
This management report contains forward-looking statements and information based on the beliefs of, and assumptions made by, our management using information currently available to them. Any statements contained in this report that are not historical facts are forward-looking statements as defined in the U.S. Private Securities Litigation Reform Act of 1995. We have based these forward-looking statements on our current expectations, assumptions, and projections about future conditions and events. As a result, our forward-looking statements and information are subject to uncertainties and risks, many of which are beyond our control. If one or more of these uncertainties or risks materializes, or if management’s underlying assumptions prove incorrect, our actual results could differ materially from those described in or inferred from our forward-looking statements and information. We describe these risks and uncertainties in the Risk Report section.
The words “aim,” “anticipate,” “assume,” “believe,” “continue,” “could,” “counting on,” “is confident,” “estimate,” “expect,” “forecast,” “guidance,” “intend,” “may,” “might,” “outlook,” “plan,” “project,” “predict,” “seek,” “should,” “strategy,” “want,” “will,” “would,” and similar expressions as they relate to us are intended to identify such forward-looking statements. Such statements include, for example, those made in the Operating Results section, our quantitative and qualitative disclosures about market risk pursuant to the International Financial Reporting Standards (IFRS), namely IFRS 7 and related statements in our Notes to the Consolidated Financial Statements, the Opportunity Report, the Risk Report, our outlook guidance, and other forward-looking information appearing in other parts of this report. To fully consider the factors that could affect our future financial results, both this report and our Annual Report on Form 20-F should be considered, as well as all of our other filings with the Securities and Exchange Commission (SEC). Readers are cautioned not to place undue reliance on these forward-looking statements, which speak only as of the date specified or the date of this report. Except where legally required, we undertake no obligation to publicly update or revise any forward-looking statements as a result of new information that we receive about conditions that existed upon issuance of this report, future events, or otherwise unless we are required to do so by law.
This report includes statistical data about the IT industry and global economic trends that comes from information published by sources including International Data Corporation (IDC), a provider of market information and advisory services for the information technology, telecommunications, and consumer technology markets; the European Central Bank (ECB); and the International Monetary Fund (IMF). This type of data represents only the estimates of IDC, ECB, IMF, and other sources of industry data. SAP does not adopt or endorse any of the statistical information provided by sources such as IDC, ECB, IMF, or other similar sources that is contained in this report. In addition, although we believe that data from these sources is generally reliable, this type of data is imprecise. We caution readers not to place undue reliance on this data.
BASIS OF PRESENTATION
This management report by SAP AG and its subsidiaries (collectively, “we,” “us,” “our,” “SAP,” “Group, “or “Company”) has been prepared in accordance with sections 315 and 315a of the German Commercial Code and German Accounting Standards No. 17 and 20. The management report is also a management commentary complying with the International Financial Reporting Standards (IFRS) Practice Statement Management Commentary.
All of the information in this report relates to the situation on December 31, 2013, or the fiscal year ended on that date, unless otherwise stated.
The report contains references to additional information in other parts of the SAP Integrated Report that is available online. This additional information is not part of the management report.
General Information About This Management Report 51
Overview of the SAP Group
Founded in 1972, SAP today is the world leader in enterprise applications in terms of software and software-related service revenue, and the world’s third-largest independent software manufacturer based on market capitalization. Our continued growth over four decades is attributable to relentless innovation, a diverse portfolio, and our ability to anticipate ever-changing customer requirements. With more than 253,500 customers in over 180 countries, the SAP Group includes subsidiaries in major countries and employs more than 66,500 people.
Our company’s culture puts our customers’ success at the center of everything we do, and is driven by our passions – which are:
| ¡ | | Success – We measure our success by our customers’ success. |
| ¡ | | Accountability – We embrace accountability and strive to always make good on our promises. |
| ¡ | | Professionalism – We exhibit professionalism by consistently delivering quality work. |
| ¡ | | Integrity – We are honest and fair and take responsibility for all our actions. |
| ¡ | | Teamwork – We value teamwork because it enables us to exceed our individual limits and share greater success. |
| ¡ | | Trust – We work for each other’s success and take personal responsibility for all of our relationships. |
For more information about our business conduct, see the Business Conduct section in the SAP Integrated Report 2013 online.
SAP is headquartered in Walldorf, Germany; our legal corporate name is SAP AG. The corporation is listed on the Frankfurt Stock Exchange as well as stock exchanges in Berlin and Stuttgart in Germany and the New York Stock Exchange in the United States. At the end of 2013, our market capitalization was €76.5 billion. SAP is a member of the German DAX and of the Dow Jones EURO STOXX 50 index.
We derive our revenue from fees charged to our customers for licensing of on-premise software products and solutions, and the use of our cloud solutions by subscription. We also derive revenue from support, consulting, development, training, and other services.
SAP markets and distributes our products, solutions, and services primarily through a worldwide network of local subsidiaries, which are licensed to distribute SAP offerings to customers in defined territories. Distributorship agreements are in place with independent resellers in some countries. For more information, see the Business Model section.
As of December 31, 2013, SAP AG controlled directly or indirectly 272 subsidiaries. Our subsidiaries perform various tasks such as sales and marketing, consulting, research and development, customer support, training, or administration. For a complete list of subsidiaries, associates, and other equity investments, see the Notes to the Consolidated Financial Statements section, Note (34).
For management reporting, our activities are broken down into two divisions, On-Premise and Cloud, which are further divided into operating segments. Our On-Premise division is composed of two operating segments, On-Premise Products and On-Premise Services. Our Cloud division is also composed of two operating segments, Cloud Applications and Ariba. For more information about our segments, see the Notes to the Consolidated Financial Statements section, Note (28).
52 Combined Management Report
Vision, Mission, and Strategy
SAP’s continued growth over four decades is attributable to our focus on innovation, a broad portfolio, and our ability to stay close to our customers and understand their ever-changing needs.
OUR VISION AND MISSION
SAP’s vision is to help the world run better and improve people’s lives. Our mission is to help every customer become a best-run business. We do this by delivering technology innovations that address the challenges of today and tomorrow without disrupting our customers’ business operations. For example, enterprise mobility is transforming usage of IT; in-memory technology is simplifying the IT architecture in the enterprise and driving high-value applications; and cloud delivery of IT solutions is simplifying the consumption of technology. We offer solutions that drive business outcomes and enable our customers to run better. We help our customers derive value from their SAP solutions in a cost-effective and predictable way, with our professional services, support, and cloud delivery.
OUR GOALS FOR SUSTAINED BUSINESS SUCCESS
SAP has strong ambitions for sustainable business success, both for our company and for our customers. We believe the most important indicators to measure this success comprise both financial and non-financial indicators: revenue, margin, customer loyalty, and employee engagement.
Revenue
We aim to achieve at least €22 billion total revenue by 2017. SAP still aims to achieve at least €20 billion total revenue by 2015 (2013: €16.9 billion non-IFRS total revenue). An important part to achieving this is our continued focus on innovations, as we expect to become the cloud company with €3.0 to €3.5 billion total revenue from our cloud business by 2017. In 2014, we expect to increase non-IFRS software and software-related services (SSRS) growth by 6% to 8% at constant currencies.
Margin
We aim for 35% non-IFRS operating margin (2013: 32.6%). In order to capture growth opportunities in the cloud, we expect to reach this goal in 2017 instead of 2015, as previously stated. In 2014, we expect between €5.8 billion to €6.0 billion non-IFRS operating profit at constant currencies.
Customer Loyalty
We use the Net Promoter Score (NPS) to measure customer loyalty. In 2014, we are aiming for an increase in NPS by four percentage points (2013: 12.1%).
Employee Engagement
We use the employee engagement index to measure motivation and loyalty of our employees, how proud they are of our company, and how strongly they identify with SAP. We are committed to achieving a score of 82% in 2015 (2013: 77%). Despite the slight drop in employee engagement in 2013 compared to 2012, we expect to see an incremental increase in our industry-leading score in 2014.
These four goals affirm our commitment to innovation and sustainability, and will help us deliver on our vision and mission.
In addition to the primary KPIs, which directly measure our performance with regard to our four company objectives, SAP manages a large set of secondary performance indicators, which influence the primary KPIs in a variety of ways. Our integrated report seeks to clarify some of those relationships, for example the link between our energy consumption and our margin.
Our main indicators are presented with more detail throughout the report. For more information on strategic goals, see the Internal Management System; Report on Expected Developments; Customers; and Employees and Social Investment sections.
Vision, Mission, and Strategy 53
OUR STRATEGY: SIMPLIFY EVERYTHING WITH SAP CLOUD POWERED BY SAP HANA
Organizations around the world are now entering a new era of business model innovation, made possible by the convergence of cloud, mobile, social, and in-memory technologies.
However, businesses often contend with layers of IT complexity that have been built up over the decades. This complexity is the result of several factors, including the proliferation of hardware and custom applications. In addition, investments in innovations often take a long time to implement or to realize business value. Due to the complexity of the current consumption model, customers are not able to respond fast enough to changing market conditions. We believe that simplicity is the key: By solving the challenge of business complexity, we can help unlock our customers’ innovation potential. We are committed to leading this simplification.
In today’s technology industry, the biggest winners have grown by offering simplicity and ease of consumption over a cloud model, which has translated to massive user adoption and market success.
In 2014, SAP will focus on helping its customers “simplify everything, so they can do anything.”
With the SAP HANA platform, we have an opportunity to simplify our product portfolio and IT landscape for our customers. SAP HANA can radically simplify enterprise applications as it collapses the entire IT stack. With SAP HANA Cloud Platform, we have the ability to take our core on-premise applications to the cloud and offer a choice of cloud deployments to our customers.
With SAP Cloud powered by SAP HANA, we will focus our simplification on three areas – simplifying our consumption model, simplifying our portfolio, and simplifying user experience.
| ¡ | | Simplify software consumption by moving our entire portfolio to the cloud: We are transitioning our consumption model to SAP Cloud powered by SAP HANA where we can deliver end-to-end solutions and drive business outcomes for the customers. We will offer our entire portfolio of solutions – applications, analytics, and platform through SAP Cloud powered by SAP HANA. We will move our core SAP Business Suite software to the cloud as a managed service, delivered by both SAP and our partners. We will also accelerate our investments in line-of-business public cloud solutions across SuccessFactors, Ariba, and our cloud portfolio, all running on SAP HANA. We will deliver a true, integrated cloud to our customers. As we are committed to offering flexibility and choice, we will continue to offer an on-premise deployment model to our customers. |
| ¡ | | Simplify our products with SAP HANA as the common platform: We will standardize every SAP product (including SuccessFactors and Ariba) on the common SAP HANA platform, and deliver integration across our portfolio. This will drive a simplified suite experience for our customers and partners. Our partners and ecosystem can either extend our solutions or build end-to-end applications based on the SAP HANA platform. |
| ¡ | | Simplify the user experience: We will simplify the user experience (UX) by offering a “mobile first” approach based on SAP Fiori applications, which offer a simple and easy-to-use experience for broadly used SAP software functions that work seamlessly across devices. We will build applications that show empathy with the user and dramatically improve the experience of our customer’s customers and our customers’ employees. |
54 Combined Management Report
In addition to simplifying our business model, we will focus on end-to-end delivery of industry-specific solutions that can drive business value and outcomes. We will continue to build an open ecosystem and our partner network to deliver SAP Cloud powered by SAP HANA on their cloud infrastructure. Our ecosystem will play a vital role in building new solutions on the SAP HANA platform and delivering value to our customers.
With our focus on simplification, we aim to better innovate and grow.
Today SAP only receives a small percentage of each customer’s overall IT spend. By investing in innovations and shifting our customers to a cloud business model, we will be able to help reduce their total cost of ownership (TCO) on IT. This enables customers to reinvest the TCO savings in new innovations and SAP could capture a higher share of customer IT spend.
Additionally, SAP will drive innovation and top-line growth across the following dimensions:
| ¡ | | Drive the Big Data agenda for our customers with our real-time in-memory SAP HANA platform and predictive analytics solutions |
| ¡ | | Establish SAP HANA as a standard enterprise business platform and monetize through partners and ecosystem |
| ¡ | | Focus on the customer’s customer by extending to business-to-business-to-consumer (B2B2C) through our portfolio of omnichannel and CRM solutions |
| ¡ | | Drive accelerated growth in selected industries such as banking, insurance, retail, public sector, and healthcare |
| ¡ | | Emerging markets will continue to be a growth driver, with high double-digit growth in software and cloud revenues expected through 2017. In addition to our investments in China, Russia, and the Middle East, we are expanding our investments in Africa. |
We will stay committed to our customers’ success and evolve our execution to drive further value creation for our customers. We strive to provide our customers a significant competitive advantage and to help make their growth more sustainable – financially, ecologically, and socially.
For more information about SAP’s goals, see the Report on Expected Developments section.
Vision, Mission, and Strategy 55
Business Model
Creating economic, social, and environmental value over the long-term is central to our vision of helping the world run better and improving people’s lives. To realize our vision, SAP provides software and services to customers throughout the world, all based on our deep expertise in business processes spanning 25 industries.
To provide software and related services to our customers, we rely on financial capital provided by investors. We leverage our intellectual capital to continually increase our knowledge base and expertise. Engaged, highly skilled, and agile employees are central to innovating with and building relationships with our customers and partners, and ultimately to our business success.
Our direct sales organizations drive most business development. Sales go-to-market strategies are established at the global level, and adapted and executed by the regional subsidiaries. Our customer-facing employees, in close collaboration with sales support and marketing, drive demand, build pipeline, and enhance relationships with customers within our target industries. Our marketing efforts cover large enterprises as well as small and midsize enterprises. We believe our broad portfolio of solutions and services enables us to meet the needs of customers of all sizes and across industries.
In addition, our extensive ecosystem provides scalability to meet the demand for SAP innovation and provide customers with a wide selection of third-party competencies. We have developed an independent sales and support force through independent value-added resellers. We have also established partnerships with hardware and software suppliers, system integrators, and third-party consultants. For more information, see the Partner Ecosystem section.
Our sales model has been focused on charging a one-time, upfront fee for a perpetual license to our software that is typically installed at the customer site. In addition, the customer usually concludes a maintenance contract that covers support and software updates. As we see customers’ preferences evolve, we are expanding the delivery of our solutions in the cloud, which we believe is a simple and efficient software consumption model. Our cloud solutions are offered under a subscription-based licensing model. With this model, the customer periodically pays a fee to use software for a limited amount of time. This software is installed at an SAP or an SAP partner location, and the customer accesses the software through the Internet.
To help companies invest in SAP solutions and the associated services and hardware, the SAP Financing service offers customers payment plans optimized for maximum economic benefit. It can help preserve liquidity, provide an alternative to credit from their existing banking relationships, and balance their budgetary priorities – while giving customers the flexibility to choose the best possible solution.
We measure the outcome of our activities through four performance indicators: revenue, margin, customer loyalty, and employee engagement. Each of these directly correlates with our ability to deliver financial returns to our providers of capital. Ultimately, it is our highly engaged employees who build our customers’ success and loyalty to SAP.
56 Combined Management Report
SAP contributes to the creation of long-term value for society in a number of ways. At SAP and within our ecosystem, we support job creation and economic prosperity through demand for highly qualified workers to sell, implement, and enhance our software for customers. Our solutions support the learning and talent development of our customers’ employees. Other SAP solutions enhance health and safety, both on the manufacturing side and in the final consumer products, which impact millions of people worldwide.
Our greatest positive environmental impact stems from enabling improvements through the solutions we provide to customers. For example, our software plays a primary role in driving supply chain optimization, efficiency gains in production processes, and transparency regarding energy consumption and emissions.
We also leverage our expertise in business processes across industries to direct our innovations to the world’s greatest challenges, such as the social and environmental strains posed by a rapidly expanding global middle class. Our goal is to create long-term value by providing solutions not just for the current challenges faced by our customers, but also those of the future. In this way, we see our role moving beyond the creation of new efficient solutions: We want to help fundamentally change how people live, conduct business, and use software. This framework underscores how SAP can create its greatest impact through the use of our solutions by more than 253,500 customers worldwide.
Business Model 57
Portfolio of Products, Solutions, and Services
OUR FOCUS ON CUSTOMERS AND INNOVATION
SAP’s portfolio of products, solutions, services, and support is designed with customer centricity in mind. Our solutions help customers address the major trends and issues of our time – such as the unprecedented power of people to connect, the ubiquity of mobile technology, the pressures of population growth and rapid urbanization, and the increasing demand on natural resources. Our software enables companies of all sizes to better connect to their customers and suppliers, and to measure, track, and manage their sustainable operations. Our solutions also address our customers’ expectations for shorter innovation cycles, an attractive total cost of ownership (TCO), a superior user experience, and choice of consumption options – whether on premise or in the cloud.
SAP’s portfolio offers solutions to customers of all sizes and across 25 industries, all around the globe. The platform for all our solutions is called SAP HANA. SAP was the first company to introduce an in-memory database not only for analytics, but also for running complete enterprise applications in main memory. SAP HANA is an in-memory data platform that is deployable as an on-premise appliance or in the cloud. It is a revolutionary platform best suited for performing real-time analytics, and developing and deploying real-time applications. Due to its hybrid structure for processing transactional work-loads and analytical workloads fully in-memory, SAP HANA combines the best of both worlds. It also offers a unique opportunity for business innovation, simplifying IT landscapes, reducing TCO, and boosting performance by a wide margin. All of our products will be enabled to run on the SAP HANA platform, and we continue to make SAP HANA a key differentiator in both technology and business applications across our entire portfolio.
SOLUTIONS
SAP has built a deep expertise in more than 40 years of delivering market-leading software to distinct industries and lines of business. Our end-to-end solutions for industries and lines of business combine assets across our product, service, technology, and market categories to solve specific customer challenges.
Solutions for Lines of Business
Our line-of-business solutions are relevant across all industries, providing best-practice capabilities to key functional areas within an organization. As a result, they enable professionals to excel within their respective disciplines. Our portfolio of solutions currently covers 12 lines of business:
| ¡ | | Corporate strategy and sustainability |
| ¡ | | Supply chain management |
58 Combined Management Report
We deliver these solutions on premise or through the cloud as software-as-a-service (SaaS) offerings:
| ¡ | | SAP Cloud for Human Resources: Together with existing HR cloud solutions from SAP, SuccessFactors, an SAP company, offers a full suite of cloud solutions that help companies improve workforce productivity and engage, train, motivate, and retain their people. |
| ¡ | | SAP Cloud for Finance: Cloud solutions that support key financial processes including travel and expense reporting. |
| ¡ | | SAP Cloud for Sales, SAP Cloud for Service, SAP Cloud for Marketing: These individual cloud portfolios offer applications that manage all aspects of customer interaction – marketing, sales, service – while employing next-generation social capabilities. |
| ¡ | | SAP Cloud for Procurement: The portfolio from Ariba, an SAP company, combines the world’s largest cloud-based business network with cloud-based applications for buying, selling, and managing cash used by companies around the globe to connect to their trading partners. |
| ¡ | | Cloud Suites: SAP offers SAP Business Suite powered by SAP HANA in the cloud. In addition, SAP Business ByDesign and SAP Business One Cloud provide two cloud suites for subsidiaries and small businesses. |
Solutions for Industries
For decades, SAP has developed deep expertise within specific industry groups. Our product development teams include professionals from within those industries, and we continually engage with customers to develop solutions that represent industry best practices. With the 2013 addition of the SAP for Sports & Entertainment industry portfolio, SAP now supports enterprises in 25 industries.
| | |
Industry Sector | | Industry Portfolio |
| Consumer | | SAP for Consumer Products |
| | SAP for Life Sciences |
| | SAP for Retail |
| | SAP for Wholesale Distribution |
| |
| Discrete manufacturing | | SAP for Aerospace & Defense |
| | SAP for Automotive |
| | SAP for High Tech |
| | SAP for Industrial Machinery & Components |
| |
| Energy and natural | | SAP for Chemicals |
| resources | | SAP for Mill Products |
| | SAP for Mining |
| | SAP for Oil & Gas |
| | SAP for Utilities |
| |
| Financial services | | SAP for Banking |
| | SAP for Insurance |
| |
| Public services | | SAP for Defense & Security |
| | SAP for Healthcare |
| | SAP for Higher Education & Research |
| | SAP for Public Sector |
| |
| Services | | SAP for Engineering, Construction & Operations |
| | SAP for Media |
| | SAP for Professional Services |
| | SAP for Sports & Entertainment |
| | SAP for Telecommunications |
| | SAP for Transportation & Logistics |
Solutions for Small Businesses and Midsize Companies
SAP offers a number of targeted solutions for small businesses and midsize companies, including the SAP Business All-in-One solution, the SAP Business One application, and Edge solutions, which combine business management and business intelligence software. These solutions are targeted and optimized for small businesses and midsize companies, and provide growing enterprises with the capabilities they need to compete in a global market.
SAP also offers affordable, scalable solutions in the cloud, such as SAP Business ByDesign and SuccessFactors HCM Suite. These solutions are relevant for companies of all sizes, including small and midsize enterprises. Additionally, we offer SAP
Portfolio of Products, Solutions, and Services 59
Business One Cloud to small businesses and midsize companies. SAP Business One Cloud is a comprehensive and easy-to-consume cloud offering with predictable costs.
PRODUCTS
In 2013, SAP offered innovative products in five market categories: Applications, Analytics, Mobile, Database and Technology, and Cloud, all powered by the SAP HANA platform.
We will continue to offer products in these market categories, along with innovations designed to meet customer needs now and in the future. As described in the Vision, Mission, and Strategy section of this management report, our strategy will focus even more on how our products deliver simplicity, better business outcomes, and sustainable business value.
In 2013, our product portfolio comprised the following:
Applications
SAP is the recognized leader in enterprise applications. Based on our leading technology and our unmatched business process know-how, we deliver innovations without disruptions.
SAP Business Suite software helps create a comprehensive business process platform for companies to run better and perform better every day.
The main applications in SAP Business Suite are:
| ¡ | | SAP Customer Relationship Management (SAP CRM): Provides a comprehensive set of functionality for marketing, sales, and service to engage with customers. |
| ¡ | | SAP ERP: Supports critical business processes such as finance, HR, and other essential corporate functions. |
| ¡ | | SAP Product Lifecycle Management (SAP PLM): Manages the product and asset lifecycle across the extended supply chain. |
| ¡ | | SAP Supplier Relationship Management (SAP SRM): Supports key procurement activities. |
| ¡ | | SAP Supply Chain Management (SAP SCM): Helps adapt supply chain processes to a rapidly changing competitive landscape. |
SAP Business Suite is also available“powered by SAP HANA” as our next-generation business suite that captures and analyzes data in real time on a single in-memory platform. In the past, companies would run separate disk-based systems; one to capture transactional data, and one to analyze data in a data warehouse. SAP Business Suite powered by SAP HANA allows customers to work with a single in-memory data management system, empowering customers to run their business in real time to transact, analyze, and predict instantly and proactively. This gives companies the ability to translate real-time insights into action immediately, while removing the complexity of redundant system data and systems. Customers can now manage mission-critical business processes, such as planning, execution, reporting, and analysis, in real time using the same relevant live data. This simplification lowers TCO.
Analytics
Our analytics offerings enable users to unleash the power of collective insight by helping them collect massive amounts of Big Data and use it to drive better business outcomes. The solutions enable users to unlock the data they need empowering them with the right information at the right time to make insightful business decisions, anticipate change, and uncover new opportunities. When using software powered by SAP HANA, companies can gain insight by overcoming the classic trade-off between the speed and flexibility of data analysis. As a result, data analysis becomes much faster and more cost-effective.
60 Combined Management Report
Analytic solutions from SAP include:
| ¡ | | Business intelligence (BI): Helps users to make fact-based decisions with enterprise business intelligence solutions that enable users to engage with all their data, on any device, across any platform. Our BI solutions include the SAP BusinessObjects BI platform, SAP Crystal Reports, SAP BusinessObjects Dashboards, and SAP Lumira. |
| ¡ | | Enterprise performance management (EPM): Helps companies improve performance, organizational agility, and decision making. SAP solutions for EPM include SAP Business Planning and Consolidation, SAP Profitability and Cost Management, SAP Financial Consolidation, and SAP Disclosure Management applications. |
| ¡ | | Governance, risk, and compliance (GRC): Provides organizations with a real-time approach to manage GRC across heterogeneous business environments. SAP solutions for GRC include the SAP Risk Management, SAP Access Control, and SAP Global Trade Services applications as well as the SAP Sustainability Performance Management analytic application. |
| ¡ | | Predictive analytics: Brings advanced analytics capabilities to a broad spectrum of users – beyond data scientists to line-of-business users and analysts in the workplace – to help uncover new business opportunities, predict trends, and proactively respond to change. This is made possible by automating key modeling and analytical tasks and enabling faster deployment and adoption of predictive analytics tools. |
Mobile
Today’s businesses demand mobile access to critical business information. Mobile solutions from SAP offer the foundation for enterprise mobility and seamless integration with the core enterprise applications of our customers. SAP is recognized as a market leader in enterprise mobility.
Our portfolio of mobile solutions includes:
| ¡ | | Enterprise mobility management: In many organizations, employees use different types of mobile devices to access critical enterprise data, content, and applications. To address this demand, SAP offers the SAP Afaria mobile device management solution and the SAP Mobile Documents solution. |
| ¡ | | Mobile apps: SAP has a variety of mobile apps that interface with our on-premise solutions and address line-of-business, industry, and consumer needs. In addition, SAP has opened our mobile development platform to our partner ecosystem to support the growing demand for mobile apps. |
| ¡ | | SAP Mobile Platform: SAP Mobile Platform combines Sybase Unwired Platform, the former Sybase 365 Mobilizer Platform (for business-to-consumer applications), and Agentry from the acquired company Syclo into a single platform, thus supporting mobile development and deployment across the entire enterprise. |
Database and Technology
Our database and technology portfolio provides a solid and comprehensive foundation for business applications. SAP HANA, our ground-breaking in-memory platform, has redefined innovation in the database and technology market and has become the fastest-growing product in our history. We depend on our ecosystem to expand our reach, and accelerate growth and adoption of SAP database and technology products beyond our installed base customers.
In addition to SAP HANA, we offer a comprehensive family of database and technology solutions that includes:
| ¡ | | Application development and integration: SAP NetWeaver provides a comprehensive technology platform, designed to efficiently develop, run, and extend business applications. SAP NetWeaver provides technology and enterprise software, such as the SAP NetWeaver Business Warehouse (SAP NetWeaver BW) application, and the SAP NetWeaver Application Server, SAP NetWeaver Portal, and SAP NetWeaver Process Orchestration components. |
| ¡ | | Database: We offer the technology to make up a real-time data platform, including SAP HANA, SAP IQ database software, SAP Adaptive Server Enterprise (SAP ASE), and the SAP SQL Anywhere suite. |
Portfolio of Products, Solutions, and Services 61
Cloud
In a world where customers need to respond quickly to changing market conditions, the cloud model offers an ideal combination of flexibility, affordability, and rapid time to value. With SAP Cloud powered by SAP HANA, we are helping customers enjoy the innovation potential of a cloud-based setup. At the same time, we are simplifying our consumption model, our product portfolio, and our customers’ user experience.
Today, SAP offers one of the most comprehensive cloud portfolios on the market. With the decision to offer all our products in the cloud, the cloud category will evolve from a product category to a deployment option for our customers to simplify the consumption of our solutions. Our offerings span cloud applications, business networks, and cloud platforms. In addition, we offer our customers a choice of different cloud deployments to fit their business needs, such as public or private cloud models.
In 2013, SAP began offeringSAP Cloud powered by SAP HANA, which includes infrastructure, platform, and software as services in the cloud, incorporating the former SAP HANA Enterprise Cloud managed cloud services offering. It allows entire enterprise systems to be run in the cloud and provides customers with a new deployment option to gain immediate value from the innovations of SAP HANA. This enables the operation of mission-critical business applications as well as new applications powered by SAP HANA. In providing such services, we aim to enable organizations to realize faster time to value coupled with lower total cost of ownership, and benefit from increased flexibility and reliability.
In addition, SAP HANA Cloud Platform is a development platform-as-a-service (PaaS) designed to help customers, independent software vendors, and partners rapidly create innovative enterprise software applications in the cloud leveraging our leading in-memory technology.
SAP supports a hybrid model, allowing customers to integrate new cloud services with their on-premise applications. This gives customers the opportunity to consume new innovations using the cloud while safeguarding their investments in their existing application landscape.
SERVICES AND SUPPORT
SAP offers comprehensive services and support to help our customers maximize the value of their SAP investments by offering higher value realization, faster adoption of innovation, and higher efficiency in the implementation of our solutions. Our services and support portfolio covers the entire end-to-end application lifecycle, from a tight integration with our development organization, to accelerating innovation and continuous improvement of our software solutions, to complete risk and quality management.
Software-Related Services
Custom Development
The SAP Custom Development organization specializes in building individual software solutions that address the unique needs of our customers, and that fit seamlessly with existing SAP software. SAP Custom Development draws on our innovations, especially SAP HANA, to deliver unmatched impact and value for specific customer use cases.
Maintenance and Support
SAP offers a comprehensive and tiered maintenance and support model to customers of our on-premise solutions on a global basis. This support offering primarily includes SAP Enterprise Support and SAP Standard Support offerings.
| ¡ | | SAP Enterprise Support: Our premier maintenance and support offering is designed as a strategic, long-term partnership with our customers. |
| ¡ | | SAP Standard Support: Our basic support offering delivers functions, knowledge, and tools that help customers implement, maintain, and enhance their SAP solutions. |
62 Combined Management Report
Our support portfolio also contains two additional premium maintenance offerings:
| ¡ | | SAP MaxAttention: These services provide the highest possible level of support for our customers. The combination of SAP MaxAttention and SAP Enterprise Support offers customers comprehensive all-round support. This strategic offering is designed for continuous business and co-innovation with customers. Through the SAP Active Global Support (SAP AGS) organization, SAP MaxAttention offers support services tailored to the requirements of the customer, expertise acquisition by the customer, and continuous cooperation at senior management level based on an agreed-to balanced scorecard. |
| ¡ | | SAP ActiveEmbedded: These enhanced engagement services help optimize solutions and accelerate adoption of technologies without disrupting customer businesses. |
For our cloud portfolio, support is included as part of our cloud subscriptions. Customers have the option of choosing standard, premium, and platinum support. In the premium and platinum offerings, customers have access to support offerings, such as access to a dedicated support account manager.
Professional Services
Consulting Services
We offer consulting services for the planning, implementation, and optimization phase of our business solutions. Our consultants engage in a wide range of services, including business transformation, IT transformation, performance and insight optimization, and business applications services. These services help customers optimize business performance and leverage the full power of SAP solutions.
SAP consultants also implementSAP Rapid Deployment solutions, which combine preconfigured software and predefined services, such as SAP Best Practices, templates, tools, and user guides. By doing so, they help companies adopt innovations more quickly and at transparent cost.
Education Services
The SAP Education organization offers a complete portfolio of multimodal learning that covers the learning needs of single individuals, as well as organizations. We provide a consistent curriculum for learners around the world, including online e-learning, virtual live classroom sessions, learning on demand, and classroom training. Our educational programs help people become more proficient, efficient, and productive in their use of SAP solutions. Every year, more than 500,000 individuals are trained by SAP Education, making it one of the largest IT training organizations in the world.
For more information about services and support from SAP, see www.sap.com/services-support/svc.html. For more information about how SAP handles security and privacy in our products and services, see the Security and Privacy section of the SAP Integrated Report 2013 online. For more information about SAP products and solutions, see www.sap.com/pc/index.html.
Portfolio of Products, Solutions, and Services 63
Customers
When SAP customers become best-run businesses, they can create more sustainable business models – which in turn helps us ensure our own long-term viability. That is why we strive to provide more than just software; we continually engage with our customers at every stage – not only during the sales and implementation phases, but also through the sharing of best practices and innovations.
One example of this strategy is our Customer Engagement Initiative. This program offers customers early insight into certain aspects of our product road map, so they can influence the development cycle. In addition, it offers customers the opportunity to network on topics of mutual interest. These networking opportunities take place at a variety of global events, including the SAPPHIRE NOW and SAP d-code (previously SAP TechEd) conferences, as well as virtual events.
CUSTOMER LOYALTY
We gauge customer loyalty through an annual survey that measures our Net Promoter Score (NPS). Customer loyalty is one of our four companywide strategic goals, along with revenue, margin, and employee engagement. In 2013, our NPS increased by 3.2 percentage points to 12.1%, compared with 8.9% in 2012. The increase achieved in 2013 showed us that we are on the right track even though we had predicted an increase of eight percentage points at the beginning of the year. In addition, the results provided insights into different geographic regions and issues, and will help inform our future approach.
Our increased NPS reflects our commitment to listening to our customers and responding to their needs. Our goal is to best support their success and the success of SAP. For example, we are expanding on the insights provided by our surveys through in-person focus groups that explore customer feedback in more depth. These sessions have enabled us to identify the underlying reasons behind issues and focus more precisely on where we need to make improvements. We are also showing customers how we are addressing feedback. A prime example is the use of SAP Service Marketplace to describe improvement projects in a host of areas, from our licensing process to our digital experience. Customers can also provide input into these projects through idea place, an online platform from SAP, to capture, discuss, and rate ideas.
The NPS shows how likely our customers would be to recommend SAP to friends or colleagues on a scale of 0–10. To determine this metric, we start with the percentage of “promoters” of SAP – those who give us a score of 9 or 10. We then subtract the number of “detractors” – those who give us a score of 0–6. The method ignores “passives,” who give us a score of 7 or 8. The NPS can range from –100% to +100%. For more information on the NPS, see the Internal Management System section, and the Non-Financial Notes section of the SAP Integrated Report 2013 online.
STRONG CUSTOMER DEMAND
Our strategy focuses on offering solutions and services to help customers run better today and tomorrow. To do so we offer a spectrum of solutions from complete suites to applications that are simple, lean, focused, quick to implement, and highly mobile. In 2013, we saw customers embrace this strategy by licensing or subscribing to the full range of SAP applications – from comprehensive solutions for large enterprises to the latest mobile apps.
64 Combined Management Report
Some examples by region include the following customers:
EUROPE, MIDDLE EAST, AND AFRICA (EMEA) REGION
| ¡ | | The Deutscher Fussball-Bund (DFB) is made up of the German Association Football League at the professional level and five regional and 21 state associations at the semi-pro and amateur levels. The customer plans to tailor campaigns and promotions to fans through the SAP CRM powered by SAP HANA rapid-deployment solution and SAP Event Ticketing software. |
| ¡ | | Eldorado, a large consumer electronics and domestic appliances retailer in Russia, selected the SAP CRM powered by SAP HANA application, as well as the SAP 360 Customer, SAP Planning for Retail, and hybris OmniCommerce for retail to help improve customer service and achieve faster results. With SAP and hybris software, Eldorado expects to track and combine consumer information across channels in real time, so they can run their business and achieve full intimacy with their consumers. |
| ¡ | | Nestlé Nespresso is a world leader in coffee machines and coffee maker technology. With the SAP Cloud for Sales solution, Nespresso aims to extend its premium experience by understanding and engaging customers at every step of the buying journey. |
| ¡ | | The Royal Swaziland Sugar Corporation, a leading sugar producer in Africa, has chosen to adopt SAP Business Suite powered by SAP HANA. SAP Business Suite software will allow the company to consolidate multiple systems. |
| ¡ | | Unilever, one of the largest multinational consumer goods companies in the world, partnered with SAP to develop the SAP Retail Execution mobile app on SAP Mobile Platform. With this SAP software, Unilever expects to empower its large sales force, merchandisers, and shopping assistants across multiple countries in Asia and Europe to accelerate opportunities at the point of sale and increase customer satisfaction. |
AMERICAS REGION
| ¡ | | ExxonMobil, an American multinational oil and gas corporation, selected the SAP Cloud for Sales solution and the SAP Sales and Operations Planning solution (powered by SAP HANA) to support demand and supply balancing. Building on its on-premise SAP software deployment with cloud solutions from SAP, ExxonMobil expects to optimize logistics planning processes, increase planning accuracy, and shorten planning cycle time through the improved management of Big Data. |
| ¡ | | Levi Strauss & Co, a well-known clothing brand, chose to run its analytics platform through SAP NetWeaver Business Warehouse powered by SAP HANA. With this, Levi Strauss expects to consolidate financial reporting globally, get real time insight into product performance, and help stock the right products in the right stores at the right time. |
| ¡ | | Petrobras, Brazil’s largest energy company, is already live with the SAP Business Planning and Consolidation application. Petrobras expects this implementation to improve forecast accuracy and drive real-time financial planning based on latest oil prices and currency fluctuations. |
| ¡ | | ProHealth Care, a community-based healthcare system located in the United States, selected the SuccessFactors Enterprise bundle. With SAP, ProHealth Care expects to align with its top HR initiatives, focusing on patient safety and satisfaction. |
Customers 65
ASIA PACIFIC JAPAN (APJ) REGION
| ¡ | | Agricultural Bank of China (ABC), one of the four Tier 1 banks in China, selected SAP ASE and SAP IQ software to support synergistic development in rural and urban areas. With SAP, ABC expects to capitalize on its comprehensive business portfolio and extensive distribution network through the use of an advanced IT platform. |
| ¡ | | China Resources Enterprise (CRE), a large producer of consumer goods in China, selected the SAP 360 Customer solution and the SAP Trade Promotion Management application. With SAP software, CRE expects to gain the speed and flexibility it needs to execute its winning strategy from any device, anytime, anywhere. |
| ¡ | | Net One Systems, a leading network integrator in Japan, selected the SAP ERP application to promote innovation in its operating processes, construct an efficient IT platform, and strengthen internal controls by linking information among its operations. |
| ¡ | | Shanghai Huayi Group, one of China’s largest chemical manufacturers, operates more than 20 wholly owned and shareholding subsidiaries. With SAP software, Shanghai Huayi Group expects to improve capital operations, resources sharing, and technological management to advance the company into the world’s top 50 chemical makers. |
| ¡ | | Varun Beverages Limited, a food and beverages company based in India, selected SAP Business Suite powered by SAP HANA to support faster, smarter, and real-time decision making. With SAP software, Varun Beverages expects to provide real-time analytical reporting to key stakeholders, while achieving a 20% reduction in the MRP process and a 15% reduction in overall order processing time. |
66 Combined Management Report
Research and Development
Research and development is the source of the discoveries that will shape the future for SAP and its customers. At SAP, research and development is a global effort that is highly collaborative, focused on customer value, and involves co-innovation with customers, partners, and academia.
GLOBAL DEVELOPMENT, LOCAL FOCUS
Our Products & Innovation organization is truly global, with the majority of development colleagues located in 14 SAP Labs locations in 12 countries (see graphic). SAP Labs are globally distributed, situated within major technology hubs where access to talent and the latest technology trends create an optimal setup for innovation.
SAP Labs locations in fast-growing markets strive to produce market-relevant solutions that complement SAP’s global product portfolio. In addition, they are structured in a manner that allows for close interaction with local stakeholders, including customers, partners, and universities. This strategy of distributed development, focusing on locations with talent availability, fostering diversity and access to new ideas, while also ensuring local market relevance, has proven highly successful for SAP.
To every technology and engineering challenge, SAP brings the strength and experience of a global development team. This helps ensure the rapid impact of research and development activities on our solution portfolio, and contributes to an ever-increasing pace of innovation.
CONTINUOUS INNOVATION
Research and development is only successful if it provides continuous improvement for existing products, while at the same time executing against promising new concepts that can help SAP enter new markets. And it must do so better and faster than our competition.
The following were among our 2013 R&D accomplishments:
SAP HANA
In 2013, SAP made further investments in our next-generation in-memory platform, SAP HANA, as the foundation for all of our products, solutions, and services – so that our customers can run their businesses in real time. A rich and growing ecosystem of partners further drives the adoption of SAP HANA as an open platform, and a number of startup companies now deliver new and innovative applications built on the SAP HANA platform.
Cloud
To further advance our leadership in the cloud, we continued to expand our portfolio of cloud-based applications. For example, customers that want to accelerate their transition to the real-time enterprise can now take advantage of our latest innovation in the cloud, SAP Cloud powered by SAP HANA, which includes infrastructure, platform, and software as services in the cloud, incorporating the former SAP HANA Enterprise Cloud managed cloud services offering. Core elements include an elastic infrastructure, the in-memory platform, and services for deploying SAP or custom applications in real time.
SAP Business Suite powered by SAP HANA
Our highly engaged and diverse research and development teams are also working to improve SAP Business Suite by simplifying the end-to-end experience of using the applications while also optimizing performance. Combining SAP Business Suite with SAP HANA was a major milestone in 2013, enabling customers to make decisions in real time and gain unmatched visibility into business processes In addition, the software helps customers unleash their full potential when it comes to meeting consumer and competitive demands through real-time access to data, real-time analytics, and unprecedented improvements in performance.
Adhering to our imperative of “SAP runs SAP,” SAP has led the way in the adoption of SAP Business Suite powered by SAP HANA by going live internally with SAP CRM and SAP ERP applications now running on SAP HANA in 2013.
Research and Development 67
Major Development Locations (SAP Labs) in 12 Countries
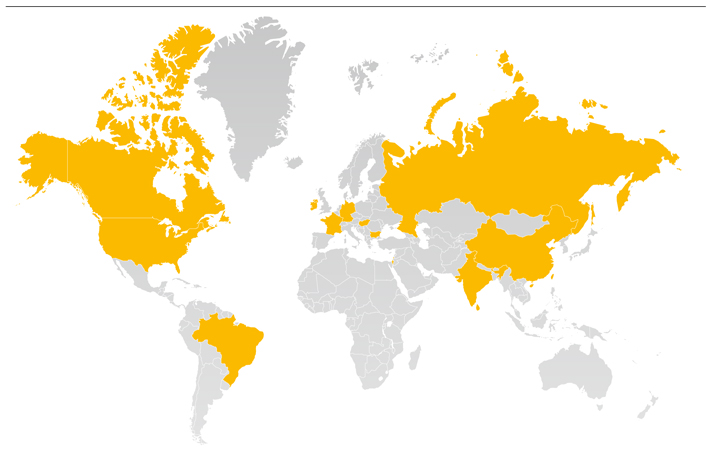
SAP Fiori
With SAP Fiori applications, SAP continues to further renew and simplify the user experience for all our products. For example, SAP Fiori offers an intuitive end-to-end user experience for broadly and frequently used SAP software functions that work seamlessly across devices – desktop, tablet or smartphone.
New Industry Solutions
Across industries, we continue to look for opportunities to help our customers and partners expand their businesses by analyzing, evaluating, and co-innovating business processes. In 2013, for example, SAP brought its knowledge and experience to the sports and entertainment industry. Our solutions help sports teams, leagues, and venues run faster, smarter, and simpler. In addition, they are designed to deepen fan engagement, drive on-field performance, and optimize business efficiency.
68 Combined Management Report
A CULTURE OF CUSTOMER CENTRICITY, EMPOWERMENT, AND ACCOUNTABILITY
Today, SAP’s development is closely attuned to customers’ business environments, product landscapes, and users. In addition, we foster a development culture of customer centricity, empowerment, and accountability. We believe that our work impacts such factors as customer loyalty and employee engagement, and that those factors have significant relevance to our company’s financial performance.
Our design-led research and development methodology puts the customer and user at the center during the entire development process. This results in robust solutions to complex business challenges – solutions that are technically feasible, desirable to users, and viable to the business for both SAP and its customers.
RESEARCH AND DEVELOPMENT EXPENDITURE
SAP’s strong commitment to research and development (R&D) is also reflected in our expenditures: In 2013, we increased our R&D expense (IFRS) slightly by €21 million, to €2,282 million (2012: €2,261 million). We spent 13.6% of total revenue on R&D in 2013 (2012: 13.9%). Our non-IFRS R&D expense as a portion of total operating expenses declined slightly from 19.2% to 19.0% year over year. While we continue to increase our innovative capacity, we increased our efficiency.
Research and Development (IFRS)
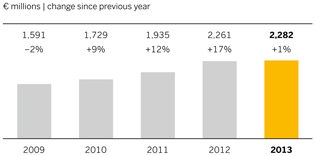
At the end of 2013, our total full-time equivalent (FTE) count in development work was 17,804 (2012: 18,012). Measured in FTEs, our R&D headcount was 27% of total headcount (2012: 28%). Total R&D expense includes not only our own personnel costs but also the external cost of works and services from the providers and cooperation partners we work with to deliver and enhance our products. We also incur external costs for translating, localizing, and testing products, for obtaining certification for them in different markets, patent attorney services and fees, strategy consulting, and the professional development of our R&D workforce.
PATENTS
As a leader in enterprise applications, SAP actively seeks intellectual property protection for innovations and proprietary information. Our software innovations continue to strengthen our market position in enterprise solutions and services. Our investment in R&D has resulted in numerous patents. SAP holds a total of more than 5,500 validated patents worldwide. Of these, more than 700 were granted and validated in 2013.
While our intellectual property is important to our success, we believe our business as a whole is not dependent on any particular patent.
Research and Development 69
Partner Ecosystem
SAP engages with an extensive partner ecosystem to address the needs of customers around the world. With nearly 11,500 partners at the end of 2013, we continue to foster our partner ecosystem. Partners operate independently of SAP, and complement our business in one or more of the following ways:
| ¡ | | Selling SAP software: SAP partners help companies of all sizes identify, purchase, and deploy the ideal solutions to address their business needs. SAP value-added resellers (VARs) and multitier distribution channels offer local market and industry expertise that addresses specific market needs. SAP closely aligns its sales efforts with those of our partners through well-defined rules of engagement that outline each organization’s roles and responsibilities. In most markets, partners are the primary sales channel to address the needs of small and midsize enterprises (SMEs). Our company also sells select products through our own online channel, SAP Store, which includes complementary solutions developed by SAP partners. In addition, SAP resells applicable partner solutions as part of our solution extensions portfolio. These partner-developed solutions are tested, validated, and approved by SAP development organizations, and supported by SAP. |
| ¡ | | Developing solutions that complement SAP software: SAP has a vibrant community of partners that develop on SAP platforms and create complementary products integrating with SAP applications. This community is vital to providing our customers with a broad portfolio of solutions that leverage the capabilities of SAP HANA, SAP Mobile Platform, our cloud offerings, and more. At the same time, we maintain strategic relationships with industry-leading technology, software, and services firms. SAP engages with the partner community in the development of new solutions, and works closely with partners on new product initiatives. Partners can embed SAP technology within their offerings under an original equipment manufacturer (OEM) licensing agreement. We also work actively with partners to enable new and innovative delivery and go-to-market approaches to support customer needs and preferences. Beyond these formal partnerships, companies can also certify their integration with SAP technology through the SAP Integration and Certification Center (SAP ICC). |
| ¡ | | Providing implementation and other services: SAP has strong partnerships with a broad network of IT professional services firms that provide consulting, system integration, hosting, education, and more. At the end of 2013, our partners collectively had more than 380,000 skilled resources in SAP solutions and technology. These companies are critical to the successful implementation and deployment of SAP solutions at customers we serve together. In response to growing customer demand for flexible deployment and purchase options, SAP is working closely with the partner ecosystem to offer innovative cloud-based offerings and business models, including OEM and managed cloud services, and by making SAP platforms and applications available through public cloud offerings. |
To help the SAP partner ecosystem achieve its business goals, SAP provides an extensive array of business support offerings. SAP’s flagship partner program, SAP PartnerEdge, offers a tiered engagement model that provides marketing, sales, and technical enablement, as well as education, deal support, and a variety of other benefits and resources. We provide SAP global partners – a select group of leading global technology, software, and services companies – with dedicated teams that work closely with them to proactively engage in business development and technical initiatives addressing specific market needs. Many of our partners participate in SAP Community Network, an online community that facilitates networking and information sharing for technical professionals. In addition, many participate in the SAP Listens program, which surveys partners for feedback and provides insight into projects we have initiated to address partner issues.
A vibrant partner ecosystem is essential to SAP’s success, and is a key component in our ability to achieve our mission of helping businesses run better and improving the lives of people everywhere.
70 Combined Management Report
Acquisitions
SAP views acquisitions as investments in people, technologies, and growth. In 2013, SAP made the following acquisitions:
ACQUISITIONS
| ¡ | | In March, SAP acquired Ticket-Web GmbH & Co. KG, a provider of ticketing solutions and niche customer relationship management (CRM) software for sports and entertainment promoters. The acquisition helped SAP enter the sports and entertainment industry, as we can now offer enhanced solutions that help promoters, venues, and teams market events over the Internet and better manage arenas. |
| ¡ | | In April, SAP acquired certain assets from KMS Software Company LLC, a provider of Web-based human capital management software and solutions in the areas of electronic onboarding, off-boarding, forms management, and new-hire engagement. |
| ¡ | | In April, SAP acquired Camilion, a provider of product development, product lifecycle, and underwriting solutions for the insurance market. These solutions allow SAP customers to streamline the management and creation of new insurance products, providing insurance brokers and underwriters with simple tools to help speed up transactions and reduce costs. |
| ¡ | | In April, SAP acquired SmartOps, a provider of inventory and service-level optimization software solutions. This acquisition helps SAP develop real-time supply chain software solutions on the SAP HANA platform. The solutions help customers optimize inventory and service levels, freeing up working capital for innovation and growth. |
| ¡ | | In August, SAP acquired hybris, one of the leading commerce technology companies. This is an investment in the future of commerce and customer engagement. We continue to combine the omnichannel commerce solutions of hybris with enterprise technology and industry leading in-memory, cloud, and mobile innovations from SAP. Together, these capabilities can help facilitate new levels of customer insight and engagement. |
| ¡ | | In October, SAP acquired KXEN, a provider of predictive analytics technology for line-of-business users and analysts. The addition of KXEN solutions will provide easy-to-use predictive capabilities for the extensive SAP customer base. |
For more information about our acquisitions, see the Notes to the Consolidated Financial Statements section, Note (4).
VENTURE ACTIVITIES
Through SAP Ventures, which comprises our consolidated investment funds, SAP has partnered with renowned entrepreneurs worldwide to build industry-leading businesses. SAP Ventures has supported more than 100 companies on five continents for more than 15 years. Many of these companies have been acquired or have become publicly listed companies.
In October, SAP announced its commitment to invest US$650 million through a new consolidated investment fund, named SAP Ventures Fund II.
In 2013, SAP made a total commitment of US$1 billion bringing SAP Ventures’ total available investment pool to more than US$1.4 billion for use over the lifetime of its respective funds. Investments through the funds are currently ongoing and depend on capital calls from the funds. SAP Ventures seeks companies with an established market presence that are growing very fast, and which they can help fuel their growth by adding expertise, relationships, geographic reach, and capital. It invests globally with a particular focus on emerging companies in Europe, India, and the United States, as well as in Brazil and China.
For more information about our consolidated investment funds, see the Notes to the Consolidated Financial Statements section, Note (34).
Acquisitions 71
Employees and Social Investment
Nothing has a greater impact on SAP’s long-term success than the creativity, talent, and commitment of our people. Their ability to understand the needs of our customers and to innovate delivers sustainable value to our company and society. Successful strategies to attract, retain, develop, and engage our employees, therefore, are critical to driving a culture of innovation, sustained growth, and profitability.
We continually review and evolve these strategies in response to the markets we serve, demographic trends, and changes in our business model. As we move more of our business to the cloud, we are navigating profound shifts in how people consume and create software. This rapid change means that we innovate in much faster cycles than in the past. As a result, we must have the right mix of talent and capabilities to support our customers and deliver on our business strategy. Our people must be agile and able to connect quickly and seamlessly with the consumers of our solutions.
We are seeking to complement our established employee base by hiring newer generations of talent that bring a different perspective and skill set. We are also working to address shifting expectations. Many professionals today are seeking a stronger sense of purpose in their work, along with a creative, collaborative, and flexible job environment. Fostering this type of culture is also critical to our ability to innovate.
To adapt to this evolving landscape, we are reviewing a wide range of areas, from how we attract diverse talent and develop our employer brand to how we define what it means for our leaders to develop and excel. In 2013, we took a number of steps to make our talent management strategies even more effective in supporting our future innovation and growth. Mobilizing the skills and passions of the people of SAP fuels not only our own success, but also the success of our customers, as well as our ability to fulfill our vision to help the world run better and improve people’s lives.
RECRUITING TALENT TO FULFILL OUR VISION
Throughout 2013, we continued to recruit employees throughout the world, with particular emphasis on emerging markets, including Brazil, China, India, Russia, and Turkey. We are also focused on countries in Africa – namely, Kenya, Nigeria, and South Africa. In addition to our regional emphasis, we laid the foundation to attract talent with different skills to support our cloud strategy. For example, we seek candidates with design expertise to help us create software for the next generation of customers. In addition, we must meet increasing demand for products that take a human-centered approach to design and are extremely easy to use.
To support these priorities, we undertook an end-to-end review of our talent management process in 2013, with particular focus on how to attract and acquire newer generations of talent (“early talent”). We recognize that to meet our business goals, we need a workforce that is agile and multigenerational, with strong cross-cultural awareness. We are highlighting opportunities for emerging talent to connect with a sense of purpose in their work at SAP. In addition, we are creating new ways to interact with prospective hires, such as inviting our employees to speak with college students, running design-thinking workshops on campus, and expanding our presence on social media.
72 Combined Management Report
NURTURING TALENT AND LEADERSHIP
In 2013, we worked toward accelerating employee career development in several ways. Specific projects included enhanced assessments of individual potential and development needs, career development sessions, greater transparency of internal opportunities, and expanded fellowships that allow people to work outside their regular roles. We encouraged employees to work closely with their managers on an ongoing development plan and introduced Success Map, a cloud-based solution developed by SuccessFactors, to enhance talent management and employee development. In addition, we offer a wide range of opportunities for our employees to develop their professional abilities, from e-learning courses to coaching. To ensure that our learning portfolio focuses on the capabilities we need most as an organization, we have been reviewing and refining these offerings. On average, our employees engaged in approximately nine days of training in 2013, compared to 11 days in 2012.
We also undertook a review of our leadership culture to identify and enhance the qualities that are critical as we shift our business model. As a result, we will increase our focus on hiring and developing leaders who drive simplification and develop outstanding talent to ensure our customers’ success. Two pilot programs have already provided our leaders with the opportunity to explore such critical topics in depth, exploring how to lead through change, inspire innovation, and take a holistic approach to leadership at SAP. In addition, we continue to offer a comprehensive suite of leadership programs to all levels of management, from coaching to specialized classroom learning. We are especially focused on deepening our general management capabilities.
We believe that to address the complex problems faced by business and society, our employees must understand and collaborate with people from a wide range of backgrounds and perspectives. Our Social Sabbatical program supports this goal, taking an innovative approach to developing talent while creating a positive impact in communities around the world. A group of 72 high-performing SAP employees from 30 countries are working in close collaboration with entrepreneurs, small and midsize enterprises, and nongovernmental organizations (NGOs) in emerging markets. Projects run for one month and focus on helping organizations grow, tackling business challenges, and expanding their impact. Programs are currently running in Brazil, China, India, and South Africa. Social Sabbaticals demonstrate how we can create value for SAP as well as others. Our employees return with an enhanced ability to lead, design innovative solutions, and work across functions, sectors, and cultures. Organizations benefit from fresh input and expertise that advances their mission to serve society.
ENGAGING EMPLOYEES
In our 2013 People Survey, a general survey of all employees conducted every two years, we achieved an overall employee engagement score of 77%. This is down from the engagement index of 79% reached the previous year during a pulse check of half of our employees, but equal to the score achieved during the last full People Survey in 2011. Our target for 2013 was a score of 82%. We are now committed to achieving this score in 2015. Despite the slight drop in employee engagement in 2013, we expect to see an incremental increase in our industry-leading score in 2014.
We attribute this to the fundamental transformation impacting the industry and to changes in top management that took place this year. In response to the market and customers, we are actively driving a growth and innovation strategy, with concerted efforts to be a leader in the cloud with SAP HANA as the platform for the industry. At the same time, the Executive
Employees and Social Investment 73
Board has undergone significant changes in the past year, with a sole CEO model heralded for 2014. We continually focus on driving engagement through a range of activities, from career development to enhanced leadership. Finally, each board member has committed to following up on a key topic from the People Survey. Employee engagement remains one of SAP’s four company-wide strategic goals, along with revenue, margin, and customer loyalty.
RETAINING TALENT
In 2013, the employee retention rate at SAP worldwide was 93.5% (2012: 94.0%). We define retention as the ratio of the average headcount (expressed in full-time equivalents) minus employee-initiated terminations (turnover) divided by the average headcount. In 2013, the average length of service at SAP worldwide was approximately 6.5 years (2012: 6.8 years).
In addition to measuring our retention rate, we also calculate its financial impact. We conducted an analysis showing that for each percentage point that our retention rate goes up or down, the impact on our operating profit is approximately €60 million.
We do not seek a general retention rate of 100%, as some turnover of talent supports our ability to innovate. However, we view a high retention rate as a priority and work to retain talent through our focus on employee engagement and career development. We are especially focused on retention in highly competitive job markets such as in Brazil and China.
EXPANDING EMPLOYEE OWNERSHIP
In 2013, we continued our share-based compensation programs to give employees worldwide the opportunity to participate in the long-term success of SAP. Our Employee Participation Plan (EPP) is a global plan open to employees worldwide. The plan creates a common financial incentive and reward for achieving the yearly milestones of our 2015 goals. Its formula is based on virtual shares in the Company’s performance, allocated at the beginning of the year, and on the performance of SAP stock. The 2013 tranche pays out in 2014.
The EPP is offered to employees in addition to our existing Share Matching Plan (SMP) and Stock Option Plan (SOP). Under the SMP, eligible employees are invited to purchase SAP shares at a discount of 40%. After a holding period of three years, employees receive one SAP share free of charge for every three shares held. Participants in the 2010 tranche received their free shares in 2013 after the holding period ended.
The SOP targets top executives and top performers with an allocation of stock options that vest after three years. Beneficiaries who were granted options in 2010 were entitled to exercise them in 2013 and benefited from the rise in the stock price.
For more information about share-based payments, see the Notes to the Consolidated Financial Statements section, Note (27).
74 Combined Management Report
DRIVING INNOVATION THROUGH DIVERSITY AND INCLUSION
We reframed our approach to diversity and inclusion in 2013 to focus on four key areas that are critical to innovation and sustainable long-term success: Gender Intelligence, Generational Intelligence, Culture and Identity, and Differently Abled People. Across all four areas, we seek to support the unique contributions of every individual. For example, to increase understanding and effectiveness among people of both genders, we conduct a workshop called Women and Men Leading Together. Exploring the subtleties of gender dynamics, this workshop is now mandatory for all senior executives.
We aim to help lead the tech industry in developing a better gender balance, and we continue to work toward our goal of increasing the number of women in management from 18% in 2010 to 25% in 2017. Our overall percentage of women in the workforce slightly increased in 2013 to 31% (2012: 30%), and the percentage of women in management increased to 21.2% in 2013 from 20.8% in 2012. To further support progress, we offer executive sponsorships for women and require that at least one diversity candidate is included on the short list for leadership and other positions. In addition, all members of our Executive Board have committed to dedicated action plans to support the recruitment, retention, and career advancement of candidates with diverse backgrounds.
One of our most significant developments in 2013 was the introduction of our Autism at Work initiative, which has drawn enormous support from the media, the public, and our employees. We ran pilots in Canada, Germany, India, Ireland, and the United States, hiring an initial group of people on the spectrum of autism disorders to work on specialized IT tasks such as software testing. Autism at Work enables us to tap a broader pool of talent and spark innovation by embracing differences in how people think, work, and tackle problems. We also see potential to make a positive impact on people’s lives and facilitate a broader conversation about autism that challenges assumptions and inspires change.
CREATING HEALTHY CULTURE
At SAP, we focus on the health of our employees as well as the health of our organizational culture. The two are interrelated, and we want to ensure that people have the ability to manage stress, balance their personal and professional lives, perform at their best, and thereby help drive our innovation. Our Business Health Culture Index (BHCI), based on our People Survey, assesses the degree to which our workplace culture supports people’s well-being and work/life balance. In 2013, we achieved a BHCI score of 67%, compared to 66% in 2012. Given the fast pace of change in the IT industry, we have set a goal of maintaining a score of 66% or higher.
We work toward our health goals through such global initiatives as our Health and Innovation Weeks, and workshops for managers on how to help their teams improve their resilience to stress. In 2013, we piloted a program that offered employees in Austria and Ireland the chance to create an in-depth personal health profile and identify opportunities to enhance their well-being. Utilizing tools such as biofeedback, the program assessed everything from diet to sleep habits to how the heart responds to stress. Highly popular with employees, the program provided us with aggregated, anonymous data that will help guide our health efforts in the future as we work to support creativity, resilience, and performance.
Employees and Social Investment 75
SOCIAL INVESTMENTS
Our social investment strategy leverages our talent, technology, and capital to create long-term, sustainable change. In 2013, we continued to focus on two areas that are critical to both SAP and society: Education and entrepreneurship. Fundamental to creating opportunity and enabling people to join the market economy, education also helps to create a pipeline of talent for SAP. Entrepreneurship plays an equally vital role in driving economic growth, creating jobs and spurring innovation. As we provide emerging entrepreneurs with technology and other support, we gain a deeper understanding of the market for small businesses and medium-size companies, positioning us to better serve customers in the future.
In 2013, SAP contributed about €20 million in cash donations to non-governmental and non-profit organizations. We donated software to more than 1,300 non-profit organizations and began a new program to provide the non-profit sector with analytics and cloud solutions. Our employees volunteered about 125,000 hours in communities in 45 countries. In addition, the SAP Solidarity Fund, a non-profit organization focused on helping those affected by catastrophic events, responded to such disasters as the typhoon Haiyan in the Philippines and the flood in Germany. SAP employees donated more than €240,000 to the fund in 2013, of which SAP matched €185,000.
To advance our global entrepreneurship program, we identified 25 entrepreneurs in Brazil who will receive a range of support from SAP, including technology and mentoring. We also introduced a new program, Skills for Africa, which provides free educational opportunities in information and communication technology (ICT) and helps people find employment. Our sister program in Brazil,Instituto Esperansap, is now in its fourth year. These programs herald a new way of thinking, where we play a direct role in preparing the next generation of talent and developing a skilled workforce that will help drive our future growth.
HEADCOUNT
On December 31, 2013, we had 66,572 full-time equivalent (FTE) employees worldwide (December 31, 2012: 64,422). This represents an increase in headcount of 2,150 FTEs in comparison to 2012. Of the overall headcount increase in 2013, 1,111 resulted from acquisitions. The average number of employees in 2013 was 65,409 (2012: 61,134).
We define the FTE headcount as the number of people we would employ if we only employed people on full-time employment contracts. Students employed part-time and certain individuals who are employed by SAP but who, for various reasons, are not currently working are excluded from our figures. Also, temporary employees are not included in the above figures. The number of such temporary employees is not material.
On December 31, 2013, the largest number of SAP employees (47%) were employed in the EMEA region (including 26% in Germany and 21% in other countries in the region), while 29% were employed in the Americas region (including 20% in the United States and 9% in other countries in the region) and 24% in the APJ region.
Our worldwide headcount in the field of software and software-related services grew 7% to 11,261 FTEs (2012: 10,551). Cloud operations and support accounted for most of the increase. Professional services and other services counted 14,629 FTEs at the end of 2013 – an increase of 3% (2012: 14,259). Most
76 Combined Management Report
of this increase was in consulting. A shift in the focus of our industry solutions led to some movement of employees from research and development to sales and marketing, resulting in a 1% headcount decrease to 17,804 FTEs (2012: 18,012) in research and development and a 6% headcount increase to 15,824 FTEs (2012: 14,899) in sales and marketing. Mainly as a result of our acquisition of hybris, general and administration headcount rose 7% to 4,566 FTEs at the end of the year (2012: 4,286). Our infrastructure employees, who provide IT and facility management services, numbered 2,488 FTEs – an increase of 3% (2012: 2,415) that mainly resulted from our acquisitions and investments in our company IT.
In the Americas region, headcount (FTEs) increased by 445, or 2%; in the EMEA region, the increase was 1,236, or 4%; and in the APJ region, it was 469, or 3%.
Our personnel expense per employee decreased to approximately €114,000 in 2013 (2012: approximately €119,000). The decrease is primarily related to foreign exchange effects as the majority of our employees is located outside of the eurozone and paid in local currency. The personnel expense per employee is defined as the personnel expense divided by the average number of employees. For more information about employee compensation and a detailed overview of the number of people SAP employed, see the Notes to the Consolidated Financial Statements section, Note (7).
Number of Employees
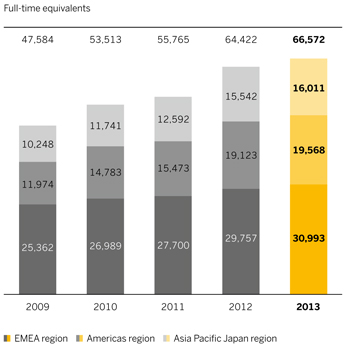
Employees by Functional Area
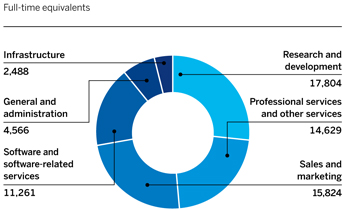
Employees and Social Investment 77
Energy Consumption and Greenhouse Gas Emissions
Over the past several years, we have worked to better understand the connections between our energy consumption, its related cost, and the resulting environmental impact. Today we measure and address our energy usage throughout SAP, as well as our greenhouse gas emissions across our entire value chain. Since the beginning of 2008, we calculate that energy efficiency initiatives have contributed to a cumulative cost avoidance of €260 million, compared to a business-as-usual extrapolation.
Moreover, to credibly offer solutions that help our customers better manage their use of resources, we must do so ourselves. By addressing the financial and environmental impact of our energy consumption, we have gained valuable insights to create solutions for our customers.
TOTAL ENERGY CONSUMED
Because our energy usage drives our emissions, one of the most important measures we look at is our total energy consumed. This includes all energy that SAP produces or purchases – in other words, the energy whose production causes emissions falling into Scopes 1 and 2 of the Greenhouse Gas Protocol. Our total energy consumption increased to 910 gigawatt hours (GWh) in 2013, compared to 860 GWh in 2012. This increase is due to significant growth in our business. In addition, as software usage shifts to the cloud, we are hosting more of our customers’ systems in our data centers, requiring additional servers and facilities that consume more energy. As we describe in more detail below, we believe that this shift has the opposite effect for our customers, who can save energy through our shared infrastructure.
As our business grows, we maintain the efficiency gains we have made over the past several years. For example, our total corporate car fleet is not consuming more fuel despite the fact that a significant number of company cars has been added, since the average company car has become more fuel-efficient. So, while our car fleet grew by 6%, we had efficiency gains of 6% across the entire fleet. As a result, our total energy consumption remained steady at 13,900 kilowatt hours (kWh) per employee in 2013.
GREENHOUSE GAS EMISSIONS
Our goal is to reduce the greenhouse gas emissions from our operations to levels of the year 2000 by 2020. This target includes direct and indirect emissions from running our business (Scopes 1 and 2), as well as a limited subset of other indirect (Scope 3) emissions, such as those stemming from business travel. We do not include all of our Scope 3 emissions in our target because we chose to focus first on those emissions over which we have the most control. However, as detailed in the Energy and Emissions II section in the SAP Integrated Report 2013 online, we are increasingly addressing both our upstream and downstream emissions to drive a comprehensive carbon strategy for SAP.
In addition to our long-term goal for 2020, we have set annual targets. In 2013, our total emissions increased to 545 kilotons CO2 (2012: 485 kilotons). As a result, we missed our annual target to reduce our emissions to 460 kilotons. Just as with our increase in energy consumption, our increased emissions reflect the growth of our business. Due to our environmental efforts of the past, however, the overall absolute reduction achieved between the beginning of 2008 and today is 9%. At the same time, the average number of employees increased by almost 26%.
At the same time, we experienced some decrease in efficiency in 2013 as it relates to our emissions. While our overall energy efficiency remained steady, our greenhouse gas emissions increased from 30.0 grams CO2 per euro of total revenue in 2012 to 32.4 grams CO2 per euro in 2013. Our carbon emissions per employee also increased by about 5% in 2013, respectively.
78 Combined Management Report
One root cause for this development is our change in business model. As our customers increasingly leverage SAP software in the cloud, our leadership in this market means that systems that previously ran at our customers’ sites are increasingly running in SAP data centers. In other words, the emissions that used to be caused by our customers running our software have become SAP’s emissions. As a result, our emissions per employee and per euro in revenue increased in 2013.
In 2014, we plan to address these emissions, as well as our overall footprint, by powering all of our data centers and facilities with 100% renewable electricity. This shift will effectively eliminate the emissions caused by our customers’ systems that have moved into our green cloud. Given the large size of our customers’ footprints and our growth strategy in the cloud, we see significant potential to reduce both our own and our customers’ environmental impact. In 2013 alone, the emissions caused by SAP products in use at our more than 253,500 customers’ sites were at least 10 times larger than SAP’s own footprint, meaning they caused more than 5,800 ktons of CO2. By using 100% renewable energy, we will dramatically broaden the reach of our sustainability efforts and align them with our cloud strategy. We believe this move will not only help the world run better, but contribute to achieving our 2020 carbon target.
EFFICIENCY VERSUS TRANSFORMATION
Our results in 2013 point to an increasing challenge faced not only by SAP but also by our customers. Companies typically increase their resource consumption when they grow. Under traditional business models, they continuously create and sell more goods or services. For this reason, many companies have focused on increasing their efficiency – a prime example is the far better fuel efficiency of passenger cars today compared to decades ago.
Efficiency, however, has its limits. The demands of growth, as we are discovering, often overtake efficiency gains. Extending the example of cars – we have many more cars on the road today, which more than cancels out the reduction in consumption per car. For this reason, and in addition to our green cloud strategy, we are increasingly focused on another path to sustainable growth – applying technology innovation to transformations in how business is conducted.
In the case of SAP, we are seeking to bring about transformations in a range of areas, from incentivizing behavioral change to supporting innovative approaches to conserving resources. TwoGo by SAP, for instance, is a ride-sharing application that turns the daily commute into an economic, social, and environmental opportunity. We began offering TwoGo by SAP to other companies in 2013, supporting their own efforts to reduce the cost of fuel, parking and business trips, enhance employee networks, change behavior, and reduce emissions. For more information on this innovation, see www.twogo.com.
NET POSITIVE IMPACT
As the example of TwoGo by SAP shows, we ultimately aim to help other organizations with their journey toward change. While we are committed to improving our own environmental performance, we believe that we can make a far greater impact by helping our customers reduce their energy use and emissions. We are increasingly focused on facilitating and measuring this “enabler effect,” which our software supports in both direct and indirect ways. A prime example of the former is a transportation application that enables companies to better manage their freight and routes to reduce fuel consumption. Indirectly, our customers can use our analytics to assess their operations and make adjustments that will save energy, reduce emissions, and lower costs. For example, our software can help determine when equipment needs refurbishment or support manufacturers in negotiating better energy rates during peak times. Through the advanced computing power of SAP HANA, we can now help companies make these adjustments in real time, increasing their efficiency even further.
Energy Consumption and Greenhouse Gas Emissions 79
Based on a study from Global e-Sustainability Initiative (GeSI SMARTer2020) assessing the potential effect for the information and communications technology (ICT) industry overall as well as our own estimates, we believe that our solutions contribute to an avoidance of emissions that eclipses the footprint of our entire value chain, including our downstream emissions (use of our software at customers’ sites). Putting such estimates in tangible terms, the total emissions generated by ICT are expected to reach 1.3 gigatons (Gt) of carbon by 2020. By contrast, ICT has the potential to abate 9.1 Gt CO2 in that same time period. Similarly, we estimate that SAP’s downstream emissions will reach 0.0091 Gt CO2 by 2020. Global emissions, on the other hand, are expected to reach 55 Gt CO2 by that time – offering enormous potential for ICT as a whole and for SAP to enable reductions.
We will continue developing methodology to estimate this impact so that we can direct our strategy and resources to those areas where we can create the greatest long-term impact.
80 Combined Management Report
Internal Management System
We use various performance measures to help manage our performance with regard to our primary financial goals, which are revenue and margin, and our primary non-financial goals, which are customer loyalty and employee engagement. We view revenue and margin as indicators for our current performance, while customer loyalty and employee engagement are indicators for our future performance.
MEASURES WE USE TO MANAGE OUR FINANCIAL PERFORMANCE
Measures We Use to Manage Our Operating Financial Performance
In 2013, we used the following key measures to manage our operating financial performance:
Non-IFRS software and cloud subscriptions: Our key revenue drivers, software and cloud subscriptions, include software plus cloud subscription and support revenue. The principal source of our software revenue is the fees customers pay for on-premise software licenses resulting in software being installed on the customer’s hardware. We generate cloud subscription and support revenue when we provide software and the respective support for delivery in the cloud. We evaluate software and cloud subscriptions both at actual currency and at constant currency.
Non-IFRS software and software-related service (SSRS) revenue: We use non-IFRS SSRS revenue and constant currency non-IFRS SSRS revenue to measure our revenue growth. Our SSRS revenue includes software and related support revenue plus cloud subscription and support revenue. Software revenue and cloud subscription and support revenue are our key revenue drivers because they tend to affect our other revenue streams. Generally, customers who buy software licenses also enter into maintenance contracts, and these generate recurring software-related service revenue in the form of support revenue after the software sale. Maintenance contracts cover support services and software updates and enhancements. Software revenue as well as cloud subscription and support revenue also tend to stimulate service revenue from consulting and training sales.
Bookings/billings revenue: For our cloud activities we look at the recognized revenue as well as the contract value generated in a given period (bookings/billings). We measure bookings/ billings as the amounts that we are contractually entitled to invoice the customers over the shorter of the contract term and the first 12 months following the contract execution date, anniversary of contract execution date, or contract renewal date (12 months’ bookings/billings). We evaluate bookings/ billings both at actual currency and at constant currency. In contrast to the cloud subscription and support revenue recognized over the period of providing the cloud service rather than in the period of contract closure, the bookings/billings numbers give insight into the future revenue potential. When evaluating 12 months’ bookings/billings numbers, we consider both the total bookings/billings and the subset of bookings/ billings that results from new customers or additional sales to existing customers in the reporting period rather than from subsequent years or renewals of existing contracts. There is no comparable IFRS measure for this figure.
Non-IFRS operating profit/non-IFRS operating margin: In 2013, we used non-IFRS operating profit/non-IFRS operating margin and constant currency non-IFRS operating profit/ non-IFRS operating margin to measure our overall operational process efficiency and overall business performance. Non-IFRS operating margin is the ratio of our non-IFRS operating profit to total non-IFRS revenue, expressed as a percentage. See below for more information on the IFRS and non-IFRS measures we use.
Internal Management System 81
Measures We Use to Manage Our Non-Operating Financial Performance
We use the following measures to manage our non-operating financial performance:
Financial income, net: This measure provides insight especially into the return on liquid assets and capital investments and the cost of borrowed funds. To manage our financial income, net, we focus on cash flow, the composition of our liquid asset and capital investment portfolio, and the average rate of interest at which assets are invested. We also monitor average outstanding borrowings and the associated finance costs.
Days’ Sales Outstanding (DSO) and Days’ Payables Outstanding (DPO): We manage working capital by controlling the days’ sales outstanding for operating receivables, or DSO (defined as average number of days from the raised invoice to cash receipt from the customer), and the days’ payables outstanding for operating liabilities, or DPO (defined as average number of days from the received invoice to cash payment to the vendor).
Measures We Use to Manage Overall Financial Performance
We use the following measures to manage our overall financial performance:
Earnings per share (EPS): EPS measures our overall performance because it captures all operating and non-operating elements of profit as well as income tax expense. It represents the portion of profit after tax allocable to each SAP share outstanding (using the weighted average number of shares outstanding over the reporting period). EPS is influenced not only by our operating and non-operating business, and income taxes but also by the number of shares outstanding. We are authorized by our shareholders to repurchase shares and believe that such repurchases, additional to dividend distributions, are a good means to return value to our shareholders.
Effective tax rate: We define our effective tax rate as the ratio of income tax expense to profit before tax, expressed as a percentage.
Operating, investing, and financing cash flows: Our consolidated statement of cash flows provides insight as to how we generated and used cash and cash equivalents. When used in conjunction with the other primary financial statements, it provides information that helps us evaluate the changes of our net assets, our financial structure (including our liquidity and solvency), and our ability to affect the amounts and timing of cash flows in order to adapt to changing circumstances and opportunities.
MEASURES WE USE TO MANAGE OUR NON-FINANCIAL PERFORMANCE
In 2013, we used the following key measures to manage our non-financial performance in the areas of employee engagement and customer loyalty:
Employee Engagement Index: We use the employee engagement index to measure motivation and loyalty of our employees, how proud they are of our company, and how strongly they identify with SAP. The index is derived from surveys conducted among our employees. With this measure, we recognize that we can achieve our growth strategy with engaged employees only.
82 Combined Management Report
Net Promoter Score (NPS): This score measures the willingness of our customers to recommend or promote SAP to others. It is derived from our customer survey. Conducted each year, this survey identifies whether a customer is loyal and likely to recommend SAP to friends or colleagues, is neutral, or is unhappy. We introduced this measure in 2012, as we are convinced that we can achieve our financial goals only when our customers are loyal to, and satisfied with, SAP and our solutions. To derive the NPS, we start with the percentage of “promoters” of SAP – those who give us a score of 9 or 10 on a scale of 0 to 10. We then subtract the percentage of “detractors” – those who give us a score of 0 to 6. The methodology calls for ignoring “passives,” who give us a score of 7 or 8.
VALUE-BASED MANAGEMENT
Our holistic view of the performance measures described above, together with our associated analyses, comprises the information we use for value-based management. We use planning and control processes to manage the compilation of these key measures and their availability to our decision makers across various management levels.
SAP’s long-term strategic plans are the point of reference for our other planning and controlling processes, including a multiyear plan through 2017. We identify future growth and profitability drivers at a highly aggregated level. This process is intended to identify the best areas in which to target sustained investment. Next, we evaluate our multiyear plans for our support and development functions and break down the customer-facing plans by sales region. Based on our detailed annual plans, we determine the budget for the respective year. We also have processes in place to forecast revenue and profit on a quarterly basis, to quantify whether we expect to realize our strategic goals, and to identify any deviations from plan. We continuously monitor the concerned units in the Group to analyze these developments and define any appropriate actions.
Our entire network of planning, control, and reporting processes is implemented in integrated planning and information systems, based on SAP software, across all organizational units so that we can conduct the evaluations and analyses needed to make informed decisions.
NON-IFRS FINANCIAL MEASURES CITED IN THIS REPORT
As in previous years, we provided our 2013 financial outlook on the basis of certain non-IFRS measures. Therefore, this report contains a non-IFRS based comparison of our actual performance in 2013 against our outlook in the Report on Economic Position section.
Reconciliations of IFRS to Non-IFRS Financial Measures for 2013 and 2012
The following table reconciles our IFRS financial measures to the respective and most comparable non-IFRS financial measures of this report for each of 2013 and 2012. Due to rounding, the sum of the numbers presented in this table might not precisely equal the totals we provide.
Internal Management System 83
Reconciliations of IFRS to Non-IFRS Financial Measures for the Years Ended December 31
€ millions, unless otherwise stated
| | | | | | | | | | | | | | | | | | | | | | | | | | | | | | | | |
| | | 2013 | | | 2012 | |
| | | IFRS | | | Adj. | | | Non-IFRS | | | Currency
Impact | | | Non-IFRS
Constant
Currency | | | IFRS | | | Adj. | | | Non-
IFRS | |
| Revenue measures | | | | | | | | | | | | | | | | | | | | | | | | | | | | | | | | |
Software | | | 4,516 | | | | 2 | | | | 4,518 | | | | 224 | | | | 4,743 | | | | 4,658 | | | | 0 | | | | 4,658 | |
Cloud subscriptions and support | | | 696 | | | | 61 | | | | 757 | | | | 29 | | | | 786 | | | | 270 | | | | 73 | | | | 343 | |
Software and cloud subscriptions | | | 5,212 | | | | 63 | | | | 5,275 | | | | 253 | | | | 5,529 | | | | 4,928 | | | | 73 | | | | 5,001 | |
Support | | | 8,738 | | | | 19 | | | | 8,756 | | | | 371 | | | | 9,128 | | | | 8,237 | | | | 9 | | | | 8,246 | |
Software and software-related service revenue | | | 13,950 | | | | 82 | | | | 14,032 | | | | 625 | | | | 14,657 | | | | 13,165 | | | | 81 | | | | 13,246 | |
Consulting | | | 2,242 | | | | 0 | | | | 2,242 | | | | 87 | | | | 2,329 | | | | 2,442 | | | | 0 | | | | 2,442 | |
Other services | | | 623 | | | | 0 | | | | 623 | | | | 24 | | | | 647 | | | | 616 | | | | 0 | | | | 616 | |
Professional services and other service revenue | | | 2,865 | | | | 0 | | | | 2,865 | | | | 111 | | | | 2,976 | | | | 3,058 | | | | 0 | | | | 3,058 | |
| | | | | | | | | | | | | | | | | | | | | | | | | | | | | | | | |
| Total revenue | | | 16,815 | | | | 82 | | | | 16,897 | | | | 736 | | | | 17,633 | | | | 16,223 | | | | 81 | | | | 16,304 | |
| | | | | | | | | | | | | | | | | | | | | | | | | | | | | | | | |
| | | | | | | | |
| Operating expense measures | | | | | | | | | | | | | | | | | | | | | | | | | | | | | | | | |
Cost of software and software-related services | | | -2,597 | | | | 364 | | | | -2,233 | | | | | | | | | | | | -2,555 | | | | 414 | | | | -2,141 | |
Cost of professional services and other services | | | -2,402 | | | | 123 | | | | -2,278 | | | | | | | | | | | | -2,520 | | | | 128 | | | | -2,392 | |
Total cost of revenue | | | -4,999 | | | | 487 | | | | -4,512 | | | | | | | | | | | | -5,075 | | | | 542 | | | | -4,533 | |
Gross profit | | | 11,816 | | | | 570 | | | | 12,385 | | | | | | | | | | | | 11,147 | | | | 624 | | | | 11,771 | |
Research and development | | | -2,282 | | | | 120 | | | | -2,162 | | | | | | | | | | | | -2,261 | | | | 129 | | | | -2,132 | |
Sales and marketing | | | -4,131 | | | | 205 | | | | -3,926 | | | | | | | | | | | | -3,912 | | | | 223 | | | | -3,689 | |
General and administration | | | -866 | | | | 70 | | | | -796 | | | | | | | | | | | | -949 | | | | 164 | | | | -784 | |
Restructuring | | | -70 | | | | 70 | | | | 0 | | | | | | | | | | | | -8 | | | | 8 | | | | 0 | |
TomorrowNow litigation | | | 0 | | | | 0 | | | | 0 | | | | | | | | | | | | 0 | | | | 0 | | | | 0 | |
Other operating income/expense, net | | | 12 | | | | 0 | | | | 12 | | | | | | | | | | | | 23 | | | | 0 | | | | 23 | |
| | | | | | | | | | | | | | | | | | | | | | | | | | | | | | | | |
| Total operating expenses | | | -12,336 | | | | 953 | | | | -11,383 | | | | -348 | | | | -11,731 | | | | -12,181 | | | | 1,067 | | | | -11,114 | |
| | | | | | | | | | | | | | | | | | | | | | | | | | | | | | | | |
| Operating profit measures | | | | | | | | | | | | | | | | | | | | | | | | | | | | | | | | |
| Operating profit | | | 4,479 | | | | 1,035 | | | | 5,514 | | | | 388 | | | | 5,902 | | | | 4,041 | | | | 1,148 | | | | 5,190 | |
| Operating margin (in %) | | | 26.6 | | | | | | | | 32.6 | | | | | | | | 33.5 | | | | 24.9 | | | | | | | | 31.8 | |
84 Combined Management Report
Explanation of Non-IFRS Measures
We disclose certain financial measures, such as non-IFRS revenue, non-IFRS operating expenses, non-IFRS operating profit, non-IFRS operating margin, non-IFRS earnings per share, constant currency revenue, and operating profit measures that are not prepared in accordance with IFRS and are therefore considered non-IFRS financial measures. Our non-IFRS financial measures may not correspond to non-IFRS financial measures that other companies report. The non-IFRS financial measures that we report should only be considered in addition to, and not as substitutes for or superior to, revenue, operating expenses, operating profit, operating margin, earnings per share, or other measures of financial performance prepared in accordance with IFRS.
We believe that the disclosed supplemental historical and prospective non-IFRS financial information provides useful information to investors because management uses this information, in addition to financial data prepared in accordance with IFRS, to attain a more transparent understanding of our past performance and our anticipated future results. In 2013, we used these non-IFRS measures consistently in our internal planning and forecasting, reporting and compensation, as well as in our external communications as follows:
| ¡ | | Our management primarily uses these non-IFRS measures rather than IFRS measures as the basis for making financial, strategic and operating decisions. |
| ¡ | | The variable remuneration components of our Executive Board members and employees are based on non-IFRS revenue and non-IFRS operating profit measures rather than the respective IFRS measures. |
| ¡ | | The annual budgeting process for all management units is based on non-IFRS revenue and non-IFRS operating profit numbers rather than the respective IFRS financial measures. |
| ¡ | | All forecast and performance reviews with all senior managers globally are based on these non-IFRS measures, rather than the respective IFRS financial measures. |
| ¡ | | Both our internal performance targets and the guidance we provided to the capital markets are based on non-IFRS revenues and non-IFRS profit measures rather than the respective IFRS financial measures. |
Our non-IFRS financial measures reflect adjustments based on the items below, as well as adjustments for the related income tax effects.
Non-IFRS Revenue
Revenue items identified as non-IFRS revenue have been adjusted from the respective IFRS financial measures by including the full amount of support revenue, cloud subscriptions revenue, and other similarly recurring revenues that we are not permitted to record as revenue under IFRS due to fair value accounting for the contracts in effect at the time of the respective acquisitions.
Under IFRS, we record at fair value the contracts in effect at the time entities were acquired. Consequently, our IFRS support revenue, our IFRS cloud subscriptions and support revenue, our IFRS software and cloud subscription revenue, our IFRS software and software-related service revenue, and our IFRS total revenue for periods subsequent to acquisitions do not reflect the full amount of revenue that would have been recorded by entities acquired by SAP had they remained stand-alone entities. Adjusting revenue numbers for this revenue impact provides additional insight into the comparability across periods of our ongoing performance.
We also report our non-IFRS deferred cloud subscription and support revenue to provide additional insight into amounts that are contracted for and invoiced and that are expected to be recognized in cloud subscription and support revenue in the future. To align the reporting of this non-IFRS deferred revenue number, we adjust this number, like our non-IFRS revenue numbers, for the effect of fair value accounting for the contracts in effect at the time of the respective acquisitions.
Non-IFRS Operating Expense
Operating expense figures that are identified as non-IFRS operating expenses have been adjusted by excluding the following expenses:
| ¡ | | Acquisition related charges |
| | – | | Amortization expense/impairment charges of intangibles acquired in business combinations and certain stand-alone acquisitions of intellectual property (including purchased in-process research and development) |
| | – | | Settlements of pre-existing business relationships in connection with a business combination |
| | – | | Acquisition-related third-party expenses |
Internal Management System 85
| ¡ | | Discontinued activities: Results of discontinued operations that qualify as such under IFRS in all respects except that they do not represent a major line of business |
| ¡ | | Expenses from our share-based payments |
Non-IFRS Operating Profit, Non-IFRS Operating Margin, and Non-IFRS Earnings per Share
Operating profit, operating margin, and earnings per share identified as non-IFRS operating profit, non-IFRS operating margin, and non-IFRS earnings per share have been adjusted from the respective IFRS measures by adjusting for the above-mentioned non-IFRS revenue and non-IFRS operating expenses.
We exclude certain acquisition-related expenses for the purpose of calculating non-IFRS operating profit, non-IFRS operating margin, and non-IFRS earnings per share when evaluating SAP’s continuing operational performance because these expenses generally cannot be changed or influenced by management after the relevant acquisition other than by disposing of the acquired assets. Since management at levels below the Executive Board does not influence these expenses, we generally do not consider these expenses for the purpose of evaluating the performance of management units. Additionally, these non-IFRS measures have been adjusted from the respective IFRS measures for the results of the discontinued activities, share-based payment expenses, and restructuring expenses.
Usefulness of Non-IFRS Measures
We believe that our non-IFRS measures are useful to investors for the following reasons:
| ¡ | | The non-IFRS measures provide investors with insight into management’s decision making because management uses these non-IFRS measures to run our business and make financial, strategic, and operating decisions. |
| ¡ | | The non-IFRS measures provide investors with additional information that enables a comparison of year-over-year operating performance by eliminating certain direct effects of acquisitions and discontinued activities. |
| ¡ | | Non-IFRS and non-GAAP measures are widely used in the software industry. In many cases, inclusion of our non-IFRS measures may facilitate comparison with our competitors’ corresponding non-IFRS and non-GAAP measures. |
Additionally, we believe that our adjustments to our IFRS financial measures for the results of our discontinued TomorrowNow activities are useful to investors for the following reason:
| ¡ | | TomorrowNow activities were discontinued and we will thus continue to exclude potential future TomorrowNow results, which are expected to mainly comprise expenses in connection with the TomorrowNow litigation, from our internal management reporting, planning, forecasting, and compensation plans. Therefore, adjusting our non-IFRS measures for the results of the discontinued TomorrowNow activities provides insight into the financial measures that SAP uses internally. |
We include the revenue adjustments outlined above and exclude the expense adjustments outlined above when making decisions to allocate resources, both on a company level and at lower levels of the organization. In addition, we use these non-IFRS measures to gain a better understanding of SAP’s operating performance from period to period.
We believe that our non-IFRS financial measures described above have limitations, including but not limited to, the following:
| ¡ | | The eliminated amounts could be material to us. |
| ¡ | | Without being analyzed in conjunction with the corresponding IFRS measures, the non-IFRS measures are not indicative of our present and future performance, foremost for the following reasons: |
| | – | | While our non-IFRS profit numbers reflect the elimination of certain acquisition-related expenses, no eliminations are made for the additional revenue and other revenue that result from the acquisitions. |
| | – | | While we adjust for the fair value accounting of the acquired entities’ recurring revenue contracts, we do not adjust for the fair value accounting of deferred compensation items that result from commissions paid to the acquired company’s salesforce and third parties for closing the respective customer contracts. |
| | – | | The acquisition-related charges that we eliminate in deriving our non-IFRS profit numbers are likely to recur should SAP enter into material business combinations in the future. |
86 Combined Management Report
| | – | | The acquisition-related amortization expense that we eliminate in deriving our non-IFRS profit numbers is a recurring expense that will impact our financial performance in future years. |
| | – | | The revenue adjustment for the fair value accounting of the acquired entities’ contracts and the expense adjustment for acquisition-related charges do not arise from a common conceptual basis. This is because the revenue adjustment aims to improve the comparability of the initial post-acquisition period with future post-acquisition periods, while the expense adjustment aims to improve the comparability between post-acquisition periods and pre-acquisition periods. This should particularly be considered when evaluating our non-IFRS operating profit and non-IFRS operating margin numbers as these combine our non-IFRS revenue and non-IFRS expenses despite the absence of a common conceptual basis. |
| | – | | Our discontinued activities and restructuring charges could result in significant cash outflows. The same applies to our share-based payment expense because most of our share-based payments are to be settled in cash rather than shares. |
| | – | | The valuation of our cash-settled, share-based payments could vary significantly from period to period due to the fluctuation of our share price and other parameters used in the valuation of these plans. |
| | – | | In the past we have issued share-based payment awards to our employees every year and we intend to continue doing so in the future. Thus, our share-based payment expenses are recurring although the amounts usually change from period to period. |
Despite these limitations, we believe that the presentation of the non-IFRS measures and the corresponding IFRS measures, together with the relevant reconciliations, provides useful information to management and investors regarding present and future business trends relating to our financial condition and results of operations. We do not evaluate our growth and performance without considering both non-IFRS measures and the comparable IFRS measures. We caution the readers of our financial reports to follow a similar approach by considering our non-IFRS measures only in addition to, and not as a substitute for or superior to, revenue or other measures of our financial performance prepared in accordance with IFRS.
Constant Currency Information
We believe it is important for investors to have information that provides insight into our sales. Revenue measures determined under IFRS provide information that is useful in this regard. However, both sales volume and currency effects impact period-over-period changes in sales revenue. We do not sell standardized units of products and services, so we cannot provide relevant information on sales volume by providing data on the changes in product and service units sold. To provide additional information that may be useful to investors in breaking down and evaluating changes in sales volume, we present information about our revenue and various values and components relating to operating profit that are adjusted for foreign currency effects. We calculate constant currency revenue and operating profit measures by translating foreign currencies using the average exchange rates from the previous year instead of the current year.
Internal Management System 87
We believe that constant currency measures have limitations, particularly as the currency effects that are eliminated constitute a significant element of our revenue and expenses and could materially impact our performance. We therefore limit our use of constant currency measures to the analysis of changes in volume as one element of the full change in a financial measure. We do not evaluate our results and performance without considering both constant currency measures in non-IFRS revenue and non-IFRS operating profit measures on the one hand, and changes in revenue, operating expenses, operating profit, or other measures of financial performance prepared in accordance with IFRS on the other. We caution the readers of our financial reports to follow a similar approach by considering constant currency measures only in addition to, and not as a substitute for or superior to, changes in revenue, operating expenses, operating profit, or other measures of financial performance prepared in accordance with IFRS.
Free Cash Flow
We use our free cash flow measure to estimate the cash flow remaining after all expenditures required to maintain or expand our organic business have been paid off. This measure provides management with supplemental information to assess our liquidity needs. We calculate free cash flow as net cash from operating activities minus purchases (other than purchases made in connection with business combinations) of intangible assets and property, plant, and equipment.
Free Cash Flow
€ millions
| | | | | | | | | | | | |
| | | 2013 | | | 2012 | | | Change (in %) | |
| Net cash flows from operating activities | | | 3,832 | | | | 3,822 | | | | 0 | |
| Purchase of intangible assets and property, plant, and equipment (without acquisitions) | | | -566 | | | | -541 | | | | 5 | |
| | | | | | | | | | | | |
| Free cash flow | | | 3,266 | | | | 3,281 | | | | -0 | |
88 Combined Management Report
Economy and the Market
GLOBAL ECONOMIC TRENDS
In its most recent monthly report, the European Central Bank (ECB1)) concludes that the global economy has remained fairly weak in 2013, especially in the first half of the year. That is consistent with the view of the International Monetary Fund (IMF), stating that in 2013 gross domestic product (GDP) across the world grew 3% year over year.
The experts also note regional divergence: According to the ECB, growth shifted to the industrialized economies and became established there. In contrast, growth in most of the major emerging economies slowed. Weaker domestic demand, limited scope for government stimulus programs, and tougher financing conditions are the reasons cited by the ECB. Additionally, commodity-exporting countries suffered from the sluggish demand on the international commodity markets.
The economy of the Europe, Middle East, and Africa (EMEA) region was weak in 2013. Annual GDP in the euro area declined 0.4% year over year, according to the numbers published by the ECB. The ECB reports that weak domestic and export demand slowed down economic activity in the larger Central and Eastern European countries and Russia, although it perceived a more encouraging trend toward the end of the year. In comparison, the Middle East and Africa merely experienced a slight deceleration of growth. However, political instability severely hindered economic growth in some countries in the region, notably Iraq and Libya.
In the global context, the economy of the Americas region proved relatively robust, the ECB notes. Despite tax increases and government spending cuts that came into force in March, year-over-year annual growth in the United States was just short of 2% compared to 2012. Growth was faster in the second half of the year than in the first as conditions on the residential real estate and labor markets improved, consumer spending rose, and exports increased. The ECB reports continuing recovery in Latin America, at only a slightly reduced pace.
The contrary development of the industrialized and emerging economies was particularly noticeable in the Asia Pacific Japan (APJ) region, according to the ECB. Japan, with its expansive financial and monetary policy, turned to positive GDP growth rates and achieved growth of 2%. Only in the third quarter was there a slight dip, caused by weaker exports. Most emerging economies in Asia performed clearly more subdued than in recent years, the ECB reports. In China, for instance, only the third quarter saw a slight acceleration in growth (to 7.8% year over year) after a modest stimulus package.
THE IT MARKET
Worldwide IT investment growth was higher than overall global economic growth throughout 2013, U.S. market research firm International Data Corporation (IDC) reports. However, that growth slowed during the course of the year. For this reason IDC corrected its projections downward more than once. The main reason for this was slower growth in the emerging economies such as in China and Russia. For that reason the emerging economies did not grow as quickly as IDC had expected at the beginning of the year.
In 2013, the global IT market expanded by a percentage in the middle of the single-digit range, which was slightly less than in the prior year. Leading the way was the mobile devices segment, with growth well into the double-digit range. In fact, IDC revised its forecast for the mobile device segment upward several times in the course of the year. The software segment also outperformed the overall IT market, IDC reports. The PC segment was sluggish the entire year, especially in the emerging economies, where economic growth flagged. Global spending on servers and data storage devices contracted. In contrast, IDC reports that the global market for IT services expanded by a percentage in the low single digits.
| 1) | Unless otherwise indicated, all economic information in this section is based on information from the European Central Bank (ECB). |
Economy and the Market 89
In the EMEA region, the Western European market for IT recorded low but stable growth and has now, in IDC’s view, survived the crisis. In Russia the economic development was completely different, according to the IDC. Over the year, it revised its forecast for growth in the Russian IT market downward by several percentage points in light of the weak Russian economy.
In the Americas region, the IT market followed the relatively robust expansion of the global economy. Although the economic policy situation was at times volatile in the United States, the U.S. IT market largely met expectations. IT investment grew by a percentage in the middle single-digit range year over year. The IT market also proved resilient in Latin America, including Brazil, and even recorded double-digit growth.
In the APJ region, the IT market reflected trends in the overall economy. Notably, the IT market in Japan performed better than IDC had originally expected. At the beginning of the year, IDC forecasted a contraction, but in fact over the full year IT investment increased slightly. On the other hand, IT spending in China grew more slowly than IDC had originally expected. Full-year growth was well below the double-digit percentages of recent years.
IMPACT ON SAP
SAP business was only slightly affected by the relatively weak growth in 2013 – especially in the first half of the year – in the overall global economy and in the IT industry: Despite a slower than expected start to the year, in 2013 our growth surpassed that of the global economy and of the IT industry.
We owe this success first and foremost to our greater focus on innovation strategy and with it our investment in three new fields of business: mobile solutions, in-memory computing with SAP HANA, and cloud solutions. The heightened pace of innovation at SAP and the rapid and successful integration of the companies we acquired, have been the decisive factors in our achieving double-digit constant currency growth in non-IFRS software and software-related services revenue.
SAP was highly successful in the EMEA region. With double-digit growth in revenue from software and cloud subscriptions, we again increased our market share. Alongside double-digit percentage growth in our home market, Germany, we performed remarkably well in France, Russia, the Middle East, and Africa, achieving high double-digit software revenue growth.
Likewise, our Americas region outperformed the overall economy and the IT market. The double-digit increase in revenue from software and cloud subscriptions in 2013 were mainly driven by a substantial – triple-digit – rise in cloud subscription revenue in North America and very strong core business in Latin America.
In the APJ region, the economic environment was very weak at the beginning of the year, and SAP’s revenue suffered during this time as a result. However, the regional economy turned around toward the end of the year, reflected in double-digit growth for our software and cloud subscription revenue in the fourth quarter – a commendable result in the competitive context. This helped return SAP to modest single-digit revenue growth for the full year in the APJ region.
The emerging economies, with high double-digit growth, are important growth markets for SAP. Key among them are China as well as the Middle East, Russia, and Brazil, where we achieved strong double-digit software and cloud subscription revenue growth rates.
Overall, in 2013 we demonstrated an aptitude for global growth that few other companies in the IT industry can match.
90 Combined Management Report
Report on Economic Position
PERFORMANCE AGAINST OUTLOOK FOR 2013 (NON-IFRS)
Our 2013 operating profit-related internal management goals and published outlook were based on our non-IFRS financial measures. For this reason, in this section we discuss performance against our outlook referring solely to these non-IFRS financial measures. All discussion in the Operating Results (IFRS) section, however, is in terms of measures in accordance with International Financial Reporting Standards as issued by the International Accounting Standards Board (IASB), and the numbers in that section are not explicitly identified as IFRS measures.
Guidance for 2013 (Non-IFRS)
At the beginning of 2013, we have given the guidance that our software and software-related service revenue (non-IFRS) for 2013 would increase by between 11% and 13% at constant currencies (2012: €13,246 million). For cloud subscription and support revenue (non-IFRS) we forecasted an increase to €750 million (2012: €342 million) at constant currencies. For SAP HANA, we estimated a software revenue of €650 million to €700 million. We expected our full-year operating profit (non-IFRS) for 2013 to be between €5.85 billion and €5.95 billion (2012: €5.21 billion) at constant currencies. We anticipated an effective tax rate (IFRS) of between 25.5% and 26.5% (2012: 26.2%) and an effective tax rate (non-IFRS) of between 27.0% and 28.0% (2012: 27.5%).
In April, we confirmed the guidance for 2013 that we had published in January 2013. In July 2013, we amended our forecast for revenue growth:
Although the difficult macroeconomic environment, in particular in the Asia Pacific Japan region, and the rapid transition to the cloud have resulted in lower software revenue expectations, we remained committed to double-digit growth with at least 10% growth in non-IFRS software and software-related service revenue at constant currencies in full year 2013 (2012: €13,246 million). We confirmed our predictions for cloud subscription and support revenue and for operating profit, while we adjusted the anticipated effective tax rate to between 24.0% and 25.0% (IFRS) and to between 25.5% and 26.5% (non-IFRS).
Actual Performance in 2013 Compared to Guidance (Non-IFRS)
We achieved or exceeded the amended outlook guidance for revenue and operating profit we published in July.
Comparison of Forecast and Results for 2013
| | | | | | | | |
| | | Forecast for 2013 | | | Results for 2013 | |
| Software and software-related service revenue (non-IFRS, at constant currencies)1) | | | at least +10 | % | | | +11 | % |
| Cloud subscription and support revenue (non-IFRS, at constant currencies) | |
| around
€750 million |
| | | €786 million | |
| Operating profit (non-IFRS, at constant currencies) | |
| €5.85 billion to
€5.95 billion |
| | | €5.90 billion | |
| Effective tax rate (IFRS)1) | | | 24.0% to 25.0 | % | | | 24.4 | % |
| Effective tax rate (non-IFRS)1) | | | 25.5% to 26.5 | % | | | 25.9 | % |
| SAP HANA software revenue (non-IFRS) | |
| €650 million to
€700 million |
| |
| €633 million
(at actual
currencies)
€664 million
(at constant
currencies) |
|
| 1) | Revised forecast (July 2013). |
Report on Economic Position 91
Despite ongoing economic uncertainty throughout 2013, our new and existing customers continued to show a strong willingness to invest in our solutions.
At constant currencies, cloud subscription and support revenue (non-IFRS) grew from €343 million in 2012 to €786 million in 2013, an increase of 129% before elimination of effects relating to the fact that Ariba and SuccessFactors numbers are included only for part of 2012 because they were acquired in the course of that year. Of the 129% growth, those effects account for 97 percentage points. Our software and software-related services revenue grew 11% at constant currencies to €14,657 million (2012: €13,246 million).
The Europe, Middle East, and Africa (EMEA) region recorded strong single-digit growth in software and cloud subscription revenue at constant currencies. The Americas region, while rapidly shifting to the cloud, achieved very strong growth of 15% in software and cloud subscriptions at constant currencies. After ending the year with a strong fourth quarter, in 2013 the Asia Pacific Japan (APJ) region achieved a 3% constant-currency increase in full-year revenue from software and cloud subscriptions. As a result, in 2013 SAP’s full-year software and cloud subscription revenue increased 6% (11% at constant currencies) to €5,275 million. The acquisitions of Success-Factors, Ariba, and hybris contributed 2.8 percentage points to the growth in software and software-related service revenue at constant currencies.
At the beginning of 2013, we forecasted low single-digit percentage growth in professional services and other service revenue and significant increase in total revenue for the year. Although in the event our professional services and other service revenue (non-IFRS) actually decreased by 3% at constant currencies, the strong growth we achieved in software and software-related service revenue (non-IFRS) helped us attain the overall guidance: Total revenue (non-IFRS) increased 8% at constant currencies to €17,633 million (2012: €16,304 million). Our 2013 outlook guidance for SAP HANA software revenue was €650 million to €700 million (2012: €392 million). Because of adverse currency effects, the revenue we achieved was €633 million (€664 million at constant currencies).
In 2013, we achieved operating profit (non-IFRS) of €5,902 million at constant currencies. Thus, operating profit (non-IFRS) at constant currencies was in the middle of the range that SAP had projected (€5.85 billion to €5.95 billion). Despite again investing significantly in innovation, we were able to increase our operating profit by successfully scaling our cloud business and maintaining operational discipline.
We achieved an effective tax rate (IFRS) of 24.4% and an effective tax rate (non-IFRS) of 25.9%, which is within the updated range of 24.0% to 25.0% (IFRS) and 25.5% to 26.5% (non-IFRS) we announced in July 2013.
OPERATING RESULTS (IFRS)
This section on operating results (IFRS) discusses results only in terms of IFRS measures, so the IFRS numbers are not expressly identified as such.
We acquired hybris in August 2013, so hybris results are incorporated in our results only for the months August to December. We acquired SuccessFactors in February 2012, so SuccessFactors results are incorporated in our 2012 results only for the months February to December. Similarly, because we acquired Ariba in October 2012, Ariba results are incorporated in our 2012 results only for the months October to December.
92 Combined Management Report
Revenue
Total Revenue
Total revenue increased from €16,223 million in 2012 to €16,815 million in 2013, representing an increase of €592 million, or 4%. This growth reflects an 8% increase from changes in volumes and prices and a 5% decrease from currency effects. The growing revenue result primarily from a €426 million increase in cloud subscription and support revenue and a €501 million rise in support revenue. Consulting revenue declined by €200 million and software revenue by €142 million. Software and software-related service revenue climbed to €13,950 million in 2013, an increase of 6%. Software and software-related service revenue represented 83% of total revenue in 2013 (2012: 81%). In 2013, consulting and other service revenue contributed €2,865 million to our total revenue, representing a drop of 6% compared to 2012.
Total Revenue by Region (based on customer location)
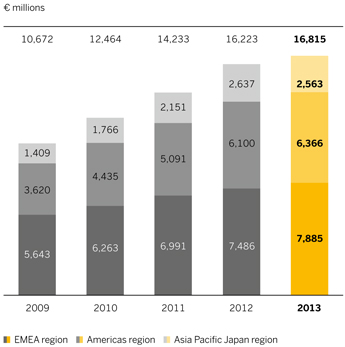
For more information about the breakdown of total revenue by region and industry, see the Revenue by Region and Industry section below.
Software and Software-Related Service Revenue
Software revenue results from the fees earned from the sale or license of software to customers. Revenue from cloud subscriptions and support refers to the income earned from contracts that permit the customer to access specific software solutions hosted by SAP during the term of its contract with SAP. Support revenue represents fees earned from providing customers with technical support services and unspecified software upgrades, updates, and enhancements.
Software Revenue by Region (based on customer location)
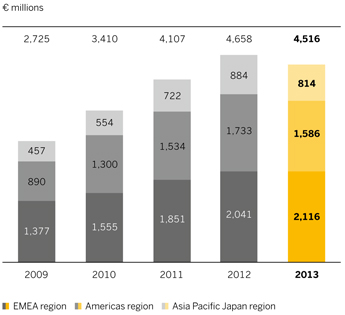
In 2013, software and software-related service revenue grew from €13,165 million in 2012 to €13,950 million, representing an increase of 6%. This software and software-related service revenue growth reflects an 11% increase from changes in volumes and prices and a 5% decrease from currency effects.
Report on Economic Position 93
Software and Software-Related Service Revenue by Region (based on customer location)
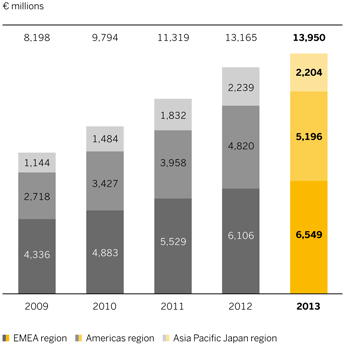
Revenue from software and cloud subscriptions rose from €4,928 million in 2012 to €5,212 million in 2013, representing an increase of €284 million, or 6%. This growth consists of an 11% increase from changes in volumes and prices and a 5% decrease from currency effects.
A combination of a challenging macroeconomic environment in key markets and the accelerating industry shift to the cloud resulted in a 2% increase from changes in volumes and prices. There was also a 5% decrease from currency effects. Overall, software revenue declined €142 million or 3% from €4,658 million in 2012 to €4,516 million in 2013. In 2013, SAP HANA contributed €633 million to total software revenue.
Software and Cloud Subscription Revenue by Region (based on customer location)
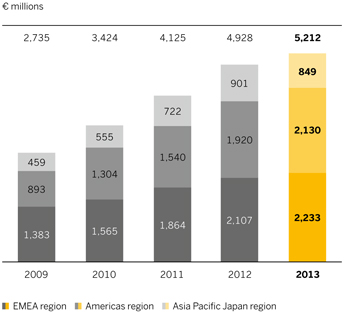
Cloud subscription and support revenue increased from €270 million in 2012 to €696 million in 2013. This increase is largely due to the acquisition of Ariba on October 1, 2012, and to continuing strong growth at SuccessFactors and Ariba in 2013.
Our customer base continued to expand in 2013. Based on the number of contracts concluded, 16% of the orders we received for software in 2013 were from new customers (2012: 19%). The total value of software orders received fell 7% year over year. The total number of contracts signed for new software decreased 6% to 55,909 (2012: 59,289 contracts), while the average order value decreased by 1%.
Our stable customer base, continued investment in software by new and existing customers throughout 2013 and the previous year, and the continued success of our premium support offerings resulted in an increase in support revenue from €8,237 million in 2012 to €8,738 million in 2013. The SAP Enterprise Support services offering was the largest contributor to our
94 Combined Management Report
support revenue. The €501 million, or 6%, growth in support revenue reflects an 11% increase from changes in volumes and prices and a 5% decrease from currency effects. This growth is primarily attributable to SAP Product Support for Large Enterprises, SAP Enterprise Support, and our premium offerings. Accordingly, the acceptance rate for SAP Enterprise Support among new customers rose from 96% in 2012 to 98% in 2013.
Professional Services and Other Service Revenue
Professional services and other service revenue consists primarily of consulting and other service revenue. We generate most of our consulting revenue from the implementation of our software products. Other service revenue consists mainly of revenue from the messaging services acquired from Sybase and of training revenue from educational services supplied to customers and partners on the use of our software products and related topics.
Professional services and other service revenue decreased from €3,058 million in 2012 to €2,865 million in 2013, representing a decline of €193 million, or 6%. This decline reflects a 3% decrease from changes in volumes and prices and a 4% decrease from currency effects.
Customers’ cautious buying behavior toward large services projects led to a decline in consulting revenue from €2,442 million in 2012 to €2,242 million in 2013, representing a decrease of €200 million, or 8%. This decline reflects a 5% decrease from changes in volumes and prices and a 4% decrease from currency effects. Consulting revenue contributed 78% of the total consulting and other service revenue (2012: 80%). Consulting revenue contributed 13% of total revenue (2012: 15%).
Revenue from other services increased €7 million, or 1%, to €623 million in 2013 (2012: €616 million). This reflects a 5% increase from changes in volumes and prices and a 4% decrease from currency changes.
Revenue by Region and Industry
Revenue by Region
We break our operations down into three regions: the Europe, Middle East, and Africa (EMEA) region, the Americas region, and the Asia Pacific Japan (APJ) region. We allocate revenue amounts to each region based on where the customer is located. For more information about revenue by geographic region, see the Notes to the Consolidated Financial Statements section, Note (28).
EMEA Region
In 2013, the EMEA region generated €7,885 million in revenue, which was 47% of total revenue (2012: €7,486; 46%). This represents a year-over-year increase of 5%. Total revenue in Germany increased 5% to €2,505 million in 2013 (2012: €2,380 million). Germany contributed 32% (2012: 32%) of all EMEA region revenue. The remaining revenue in the EMEA region was primarily generated in the United Kingdom, France, Switzerland, the Netherlands, Russia, and Italy. Software and software-related service revenue generated in the EMEA region in 2013 totaled €6,549 million (2012: €6,106 million). Software and software-related service revenue represented 83% of total revenue in 2013 (2012: 82%). Software and cloud subscription revenue rose by 6% to €2,233 million in 2013 (2012: €2,107 million). This growth reflects an 8% increase from changes in volumes and prices and a 2% decrease from currency effects.
Americas Region
In 2013, 38% of our total revenue was generated in the Americas region (2012: 38%). Total revenue in the Americas region increased 4% to €6,366 million; revenue generated in the United States increased 4% to €4,661 million. This growth reflects an 8% increase from changes in volumes and prices and a 4% decrease from currency effects. The United States contributed 73% (2012: 73%) of all revenue generated in the Americas region. In the remaining countries of the Americas region, revenue climbed 4% to reach €1,705 million. This growth
Report on Economic Position 95
reflects a 13% increase from changes in volumes and prices and a 9% decrease from currency effects. This revenue was principally generated in Brazil, Canada, and Mexico. Software and software-related service revenue generated in the Americas region in 2013 totaled €5,196 million (2012: €4,820 million). Total software and software-related service revenue represented 82% of all revenue in the Americas region in 2013 (2012: 79%). Software and cloud subscription revenue rose by 11% to €2,130 million in 2013 (2012: €1,920 million). This growth reflects a 17% increase from changes in volumes and prices and a 6% decrease from currency effects.
APJ Region
In 2013, 15% (2012: 16%) of our total revenue was generated in the APJ region, with the strongest revenue growth being achieved in China. Total revenue in the APJ region decreased by 3% to €2,563 million. In Japan, revenue fell by 21% to €624 million, which represents 24% (2012: 30%) of the total revenue generated in the APJ region. This drop in revenue is attributable, in full, to currency effects. In the remaining countries of the APJ region, revenue increased by 5%. Revenue in the remaining countries of the APJ region was generated primarily in Australia, China, and India. Software and software-related service revenue generated in the APJ region in 2013 totaled €2,204 million (2012: €2,239 million). That was 86% of total revenue (2012: 85%). Software and cloud subscription revenue fell by 6% to €849 million in 2013 (2012: €901 million). This decrease reflects a 4% increase from changes in volumes and prices and a 10% decrease from currency effects.
Revenue by Industry
With effect from January 2013, we rearranged our industry sectors from nine groups into six so that we could focus better on the requirements of existing and potential customers.
We merged one of our existing industry sectors, process manufacturing – which covers the chemicals and mill products industries – with the energy and natural resources industry sector. We combined our former consumer products and the retail and wholesale distribution industry sector into the consumer sector. The healthcare and life sciences, (medical and pharmaceutical) industries, which were previously grouped together under the healthcare sector, now belong to the public services or consumer industry sectors, respectively. To address the changing needs of our customers, a new industry subgroup was established, sports and entertainment, which is part of the professional services sector.
We allocate our customers to one of our industries at the outset of an initial arrangement. All subsequent revenue from a particular customer is recorded under that industry sector.
In 2013, we achieved above-average growth in the following sectors, measured by changes in total revenue: Financial Services (€1,633 million, at a growth rate of 13%), Services (€2,649 million, at a growth rate of 7%), Public Services (€1,691 million, at a growth rate of 5%), and Energy and Natural Resources (€4,077 million, at a growth rate of 4%). The revenue from the other industry sectors: Consumer €3,779 million, which was a 4% improvement on the prior year; Discrete Manufacturing €2,988 million, which was a 4% decline mainly related to APJ and the Americas.
Revenue by Industry
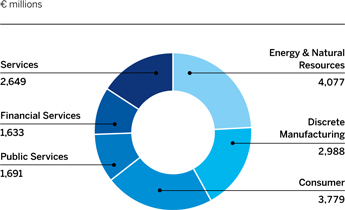
96 Combined Management Report
Operating Profit and Operating Margin
In 2013, our operating profit totaled €4,479 million (2012: €4,041 million), a significant year-over-year increase despite adverse currency effects. We invested in innovations and made substantial advances in our cloud business in 2013.
In 2013, operating expenses increased €155 million or 1% to €12,336 million (2012: €12,181 million). The main contributors to that increase were our greater acquisition-related and restructuring expenses, continued investment in sales activities and the cloud, and higher personnel and infrastructure expenses related to acquisitions.
The effect of acquisition-related expenses, which were €555 million (2012: €537 million), and restructuring expenses, which were €70 million (2012: €8 million), on operating profit was greater than in the prior year. The operating profit for 2013 was also affected by continued investments in global sales activities and cloud computing. The number of SAP employees (expressed in full-time equivalents – FTEs) rose year over year by 2,150 persons, including more than 1,100 employees from acquired businesses.
Those negative effects on operating profit were in part offset by a reduced expense for share-based payment, which totaled €327 million in 2013 (2012: €522 million) owing to a less steep increase in the SAP stock price, and by a reduction in our general and administration expense.
As an overall result of these effects on operating profit, our operating margin widened 1.7 percentage points to 26.6% in 2013 (2012: 24.9%).
The sections that follow discuss our costs by line item.
Operating Profit
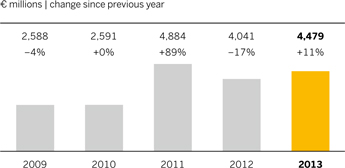
Operating Margin
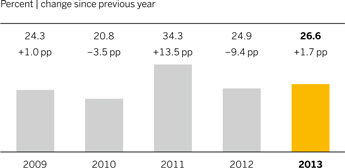
Cost of Software and Software-Related Services
Cost of software and software-related services consists primarily of customer support costs, cost of developing custom solutions that address customers’ specific business requirements, costs for deploying and operating cloud solutions, amortization expenses relating to intangibles, and license fees and commissions paid to third parties for databases and the other complementary third-party products sublicensed by us to our customers.
In 2013, the cost of software and software-related services increased a modest 2% to €2,597 million (2012: €2,555 million). The main factors were a €95 million acquisition-related increase in the cost of providing and operating our cloud solutions and a €13 million increase in customer support costs.
Report on Economic Position 97
They both represent investments that contributed to revenue growth. At the same time, the license fees we pay to third parties decreased by €63 million. The gross margin on our software and software-related services, defined as software and software-related services profit as a percentage of software and software-related services revenue, remained constant year over year in 2013 at 81% (2012: 81%).
Cost of Professional Services and Other Services
Cost of professional services and other services consists primarily of the cost of consulting and training personnel and the cost of bought-in third-party consulting and training resources. This item also includes sales and marketing expenses for our professional services and other services resulting from sales and marketing efforts where those efforts cannot be clearly distinguished from providing the professional services and other services.
The growth of our cloud business and increased demand for pre-bundled offerings led to a reduction in our professional and other services revenue as well as in our professional and other services expense. We reduced costs for professional and other services 5% from €2,520 million in 2012 to €2,402 million in 2013. Our gross margin on professional and other services, defined as professional and other services profit as a percentage of professional and other services revenue, narrowed to 16% (2012: 18%).
Research and Development Expense
Our research and development (R&D) expense consists primarily of the personnel cost of our R&D employees, costs incurred for independent contractors we retain to assist in our R&D activities, and depreciation of the computer hardware and software we use for our R&D activities.
We acquired Ariba and SuccessFactors in the course of 2012, so in 2012 our R&D expense did not include a full year’s Ariba and SuccessFactors R&D. Moreover, the depreciation expense for R&D servers and computer systems was greater in 2013 than in 2012. Nonetheless, our total R&D expense increased only slightly, by 1% to €2,282 million (2012: €2,261 million). Therefore, while we continue to increase our innovative capacity our R&D expense as a percentage of total revenue was slightly less year over year at 13.6% (2012: 13.9%). For more information, see the Research and Development section.
Sales and Marketing Expense
Sales and marketing expense consists mainly of personnel costs and direct sales expense to support our sales and marketing teams in selling and marketing our products and services.
Our sales and marketing expense rose 6% from €3,912 million in 2012 to €4,131 million in 2013. The increase was mainly the result of greater personnel costs as we expanded our global sales force, notably for cloud business, and of the reallocation and re-tasking of employees to sales-related work. By increasing our sales force we accelerated our revenue growth. The ratio of sales and marketing expense to total revenue, expressed as a percentage, increased slightly to 24.6% (2012: 24.1%) because costs grew more rapidly than revenue.
General and Administration Expense
Our general and administration expense consists mainly of personnel costs to support our finance and administration functions.
General and administration expense decreased 9% from €949 million in 2012 to €866 million in 2013. This resulted mainly from a reduced expense for share-based payment and efficient cost management. Consequently, the ratio of general and administration expense to total revenue decreased in 2013 to 5% (2012: 6%).
Results by Segment
We had two divisions in 2013, On-Premise and Cloud, each further divided into operating segments. Our On-Premise division comprises two operating segments: On-Premise Products and On-Premise Services. Our Cloud division also comprises two operating segments: Cloud Applications and Ariba.
98 Combined Management Report
The revenue and profit numbers for each of our operating segments relate to our internal management reporting and differ from the revenue and profit numbers presented in our IFRS Consolidated Statements of Income. For more information about our segment reporting and reconciliation from our internal management reporting to our external IFRS reporting, see the Notes to the Consolidated Financial Statements section, Note (28).
On-Premise Division
The On-Premise division derives its revenue primarily from the sale of on-premise software (that is, software designed for installation on the customer’s hardware) and mobile software (that is, software designed for use on mobile devices) as well as services relating to such software.
On-Premise Products Segment
The On-Premise Products segment is primarily engaged in marketing and licensing our on-premise and mobile software products and providing support services for them.
On-Premise Products segment revenue grew 3% from €12,881 million in 2012 to €13,227 million in 2013. This increase reflects a 7% increase from changes in volumes and prices and a 4% decrease from currency effects. The increase resulted principally from growth in support revenue, which more than offset a slight decline in software solution licensing. Software revenue attributable to our On-Premise Product segment declined 3% to €4,517 million (2012: €4,656 million). The decline reflects a 2% increase from changes in volumes and prices and a 5% decrease from currency effects. Support revenue grew 6% to €8,710 million (2012: €8,226 million). This increase reflects a 10% increase from changes in volumes and prices and a 4% decrease from currency effects.
In 2013, cost of revenue increased 1% to €2,020 million (2012: €1,994 million) and sales and marketing costs grew 1% to €3,447 million (2012: €3,414 million). The moderate increase in expenses in the On-Premise Products segment was the result of greater investment in providing and operating our Cloud solutions in response to growing demand in 2013.
On-Premise Products segment profit rose 4% to €7,760 million (2012: €7,473 million) and the associated segment profitability was 59% (2012: 58%).
On-Premise Services Segment
The On-Premise Services segment performs various professional services, primarily supporting the implementation of our software products and providing education services concerning the use of those software products.
On-Premise Services segment revenue decreased 9% from €2,967 million in 2012 to €2,695 million in 2013. This reduction in revenue reflects a 6% decrease from changes in volumes and prices and a 3% decrease from currency effects. Our cloud business grew more quickly than our business as a whole, and demand for preconfigured solutions increased. As expected, this led to a decrease in both, revenue from consulting and education services and in the expense of providing them.
Accordingly, cost of revenue in the On-Premise Services segment decreased 7% to €2,134 million in 2013 (2012: €2,306 million).
On-Premise Services segment profit declined 15% to €562 million (2012: €661 million). Segment profitability was 21% (2012: 22%).
Cloud Division
Our Cloud division earns revenue by providing software for customers to use in the cloud and by providing services relating to that software.
Driven by the acquisition of SuccessFactors in the first quarter of 2012 and Ariba in the final quarter of 2012, SAP developed a strong cloud momentum that continued in 2013. Our Cloud division revenue run rate reached €1,063 million (end of 2012: €848 million), based on annualized fourth-quarter revenue. The annualized revenue is the overall 2013 fourth-quarter revenue from the Cloud division of €266 million (2012: €212 million), multiplied by four.
Report on Economic Position 99
The cloud revenue reflects only the portion of customer orders already recognizable in revenue. In contrast, the portion of customer orders already invoiced for that refers to services that have not yet been delivered and is as such not recognizable in revenue is reflected in deferred cloud revenue. Orders placed by the customers, which have not yet been delivered and not yet been invoiced are included in the backlog performance indicator.
Non-IFRS deferred cloud subscription and support revenue was €447 million on December 31, 2013 (December 31, 2012: €358 million), a year-over-year increase of 25%. Our cloud subscription and support backlog increased 50% to €1,202 million on December 31, 2013 (December 31, 2012: approximately €800 million).
Cloud Applications Segment
The Cloud Applications segment is primarily engaged in marketing and selling subscriptions to cloud software developed by SAP and SuccessFactors.
In 2013, revenue from the Cloud Applications segment grew 53% to €514 million (2012: €336 million). This increase reflects a 57% increase from changes in volumes and prices and a 4% decrease from currency effects. Greater customer demand for cloud applications led to the steep rise in revenue in 2013.
In 2013, cost of revenue increased 9% to €178 million (2012: €163 million) and sales and marketing costs grew 42% to €328 million (2012: €231 million). These costs rose in the Cloud Applications segment principally as a result of increased business activity in response to greater customer demand for cloud applications in 2013.
Cloud Applications segment profit grew to €8 million (2012: -€59 million loss). Segment profitability was 2% (2012: -17%).
Ariba Segment
The Ariba segment is primarily engaged in marketing and selling subscriptions to cloud software developed by Ariba for its business commerce network. While this segment is named Ariba, it is not identical to the acquired Ariba business because certain SAP activities have been transferred to our Ariba segment.
The numbers for the Ariba segment include the acquired Ariba company numbers as of October 1, 2012, as well as the numbers for those SAP activities that were allocated to the Ariba segment upon its establishment.
In 2013, revenue from the Ariba segment grew 283% to €461 million (2012: €120 million). This increase reflects a 299% increase from changes in volumes and prices and a 16% decrease from currency effects. It results mainly from the fact that only fourth-quarter Ariba revenue is included in the 2012 numbers.
In 2013, cost of revenue increased 151% to €180 million (2012: €72 million) and sales and marketing costs grew 250% to €151 million (2012: €43 million). The expense rise in the Ariba segment is mainly due to the fact that Ariba was acquired in the final quarter of 2012.
Ariba segment profit was €130 million (2012: €5 million). Segment profitability was 28% (2012: 5%).
Financial Income, net
Financial income, net, changed to -€66 million (2012: -€72 million). Our finance income was €115 million (2012: €103 million) and our finance costs were €181 million (2012: €175 million).
Finance income mainly consists of interest income from loans and financial assets (cash, cash equivalents, and current investments), which was €37 million in 2013 (2012: €45 million). This decrease is attributable to a lower average liquidity and lower interest rates than in 2012.
100 Combined Management Report
Finance costs mainly consist of interest expense on financial liabilities (€131 million in 2013 compared to €130 million in 2012) and remained virtually stable year over year. For more information about these financing instruments, see the Notes to the Consolidated Financial Statements section, Note (17b).
Another factor in financial income, net, in 2013 was the derivatives we utilize to execute our financial risk management strategy. The associated time value effects from derivatives were reflected in interest income of €32 million (2012: €27 million) and interest expenses of €23 million (2012: €28 million).
Income tax
Our effective tax rate decreased to 24.4% in 2013 (2012: 26.2%). The reason for the year-over-year decrease mainly resulted from prior year taxes. For more information, see the Notes to the Consolidated Financial Statements section, Note (10).
Profit After Tax and Earnings per Share
Profit after tax increased 19% to €3,325 million in 2013 (2012: €2,803 million). The higher profit after tax in 2013 derived mainly from the increase of our operating profit and the lower effective tax rate.
Profit After Tax
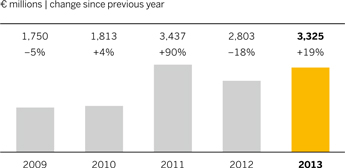
Basic earnings per share increased to €2.79 (2012: €2.35). The increase reflects the higher profit after tax compared to 2012. The number of shares outstanding remained almost constant year over year at 1,193 million (2012: 1,192 million).
Earnings per Share
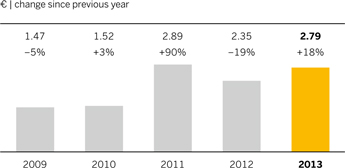
Dividend
We believe our shareholders should benefit appropriately from the profit the Company made in 2013. We wish to continue our dividend policy, which is that the payout ratio should be more than 30% of the profit after tax of the Group.
The Executive Board and the Supervisory Board will therefore recommend to the Annual General Meeting of Shareholders that the total dividend be increased by 18% to €1.00 per share (2012: €0.85). Based on this recommendation, the overall dividend payout ratio (which here means total distributed dividend as a percentage of profit) would be 36% (2012: 36%).
If the shareholders approve this recommendation and if treasury shares remain at the 2013 closing level, the total amount distributed in dividends would be €1,194 million. The actual amount distributed may be different from that total because the number of shares held in treasury may change before the Annual General Meeting of Shareholders. Transactions related to share-based payments could also change the amount of common stock. In 2013 we distributed €1,013 million in dividends from our 2012 profit. In 2012 we also returned €53 million to the shareholders by repurchasing SAP treasury shares. In 2013 we did not repurchase further SAP treasury shares.
Report on Economic Position 101
Dividend per Share
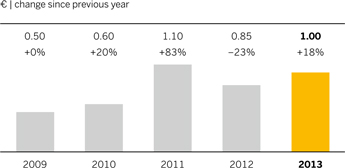
In 2011, in addition to the regular dividend of €0.75 per share, we rewarded our shareholders with a special dividend of €0.35 per share to celebrate our 40th anniversary.
FINANCES (IFRS)
Overview
Global Financial Management
We use global centralized financial management to control liquid assets and monitor exposure to interest rates and currencies. The primary aim of our financial management is to maintain liquidity in the Group at a level that is adequate to meet our obligations. Most SAP companies have their liquidity managed centrally by the Group, so that liquid assets across the Group can be consolidated, monitored, and invested in accordance with Group policy. High levels of liquid assets help keep SAP flexible, sound, and independent. In addition, various credit facilities are currently available for additional liquidity, if required. For more information about these facilities, see the Credit Facilities section.
We manage credit, liquidity, interest rate, equity price, and foreign exchange rate risks on a Group-wide basis. We use selected derivatives exclusively for this purpose and not for speculation, which is defined as entering into a derivative instrument for which we do not have a corresponding underlying transaction. The rules for the use of derivatives and other rules and processes concerning the management of financial risks are collected in our treasury guideline document, which applies globally to all companies in the Group. For more information about the management of each financial risk and about our risk exposure, see the Notes to the Consolidated Financial Statements section, Notes (24) to (26).
Liquidity Management
Our primary source of cash, cash equivalents, and current investments is funds generated from our business operations. Over the past several years, our principal use of cash has been to support operations and our capital expenditure requirements resulting from our growth, to acquire businesses, to pay dividends on our shares, and to buy back SAP shares on the open market. On December 31, 2013, our cash, cash equivalents, and current investments were primarily held in euros and U.S. dollars. We generally invest only in the financial assets of issuers or funds with a minimum credit rating of BBB, and pursue a policy of cautious investment characterized by wide portfolio diversification with a variety of counterparties, predominantly short-term investments, and standard investment instruments. We rarely invest in the financial assets of issuers with a credit rating lower than BBB, and such investments were not material in 2013.
In 2013, SAP signed a new revolving credit facility contract. The size of the facility was increased from €1.5 billion to €2.0 billion to support the company’s growth – for more information see the Credit Facilities section. We believe that our liquid assets combined with our undrawn credit facilities are sufficient to meet our present operating needs and, together with expected cash flows from operations, will support our currently planned capital expenditure requirements over the near term and medium term. It may also be necessary to enter into financing transactions when additional funds are required that cannot be wholly sourced from free cash flow (for example, to finance large acquisitions).
102 Combined Management Report
The persistently strong free cash flow of recent years enabled us to pay back additional debts within a short period of time. Furthermore, a balanced maturity profile prevents repayment peaks from occurring in any particular year.
To expand our business, we have made acquisitions of businesses, products, and technologies. Depending on our future cash position and future market conditions, we might issue additional debt instruments to fund acquisitions, maintain financial flexibility, and limit repayment risk. Therefore, we continuously monitor funding options available in the capital markets and trends in the availability of funds, as well as the cost of such funding. For more information about the financial debt, see the Cash Flows and Liquidity section.
Capital Structure Management
The primary objective of our capital structure management is to maintain a strong financial profile for investor, creditor, and customer confidence, and to support the growth of our business. We seek to maintain a capital structure that will allow us to cover our funding requirements through the capital markets at reasonable conditions, and in so doing, ensure a high level of independence, confidence, and financial flexibility.
Based on our strong corporate financial profile and our excellent capital market reputation, we have so far successfully executed external financing transactions without an external rating. However, we will continue to closely monitor our financing situation to determine whether not having an external rating continues to be appropriate.
Our general intention is to remain in a position to return excess liquidity to our shareholders by distributing annual dividends and repurchasing shares. The amount of future dividends and the extent of future repurchases of shares will be balanced with our effort to continue to maintain an adequate liquidity position.
Capital Structure
| | | | | | | | | | | | | | | | | | | | |
| | | 2013 | | | 2012 | | | % Change | |
| | | € millions | | | % of Total equity and
liabilities | | | € millions | | | % of Total equity and
liabilities | | | | |
| Equity | | | 16,048 | | | | 59 | | | | 14,133 | | | | 54 | | | | 14 | |
Current liabilities | | | 6,347 | | | | 23 | | | | 6,546 | | | | 25 | | | | -3 | |
Non-current liabilities | | | 4,699 | | | | 17 | | | | 5,627 | | | | 21 | | | | -16 | |
| Liabilities | | | 11,046 | | | | 41 | | | | 12,173 | | | | 46 | | | | -9 | |
| | | | | | | | | | | | | | | | | | | | |
| Total equity and liabilities | | | 27,094 | | | | 100 | | | | 26,306 | | | | 100 | | | | 3 | |
Report on Economic Position 103
Our financing activities improved our debt ratio (defined as the ratio of total liabilities to total equity and liabilities, expressed as a percentage) to 41% at the end of 2013 (as compared to 46% at the end of 2012). The ratio of total financial debt to total equity and liabilities decreased by 3% to 16% at the end of 2013 (19% as at December 31, 2012). Total financial debt consists of current and non-current bonds and private placements. For more information about our financial debt, see the Notes to the Consolidated Financial Statements section, Note (17).
As part of our financing activities in 2014, the Company intends to repay a €500 million Eurobond and an €86 million German promissory note when they both mature in April 2014.
Total liabilities on December 31, 2013, mainly comprised financial liabilities of €4,506 million (of which €3,758 million are non-current). Financial liabilities on December 31, 2013, consisted largely of financial debt, which included amounts in euros (€2,386 million) and U.S. dollars (€1,922 million). On December 31, 2013, 100% of financial debt was held at fixed interest rates, of which 56% were swapped into variable interest rates using interest rate swaps. For more information about financial liabilities, see the Notes to the Consolidated Financial Statements section, Note (17).
Cash Flows and Liquidity
Group liquidity on December 31, 2013, primarily comprised amounts in euros (€1,056 million) and U.S. dollars (€884 million). Current investments are included in other financial assets in the statement of financial position. Financial debts are included within financial liabilities in the statement of financial position.
Group Liquidity of SAP Group
€ millions
| | | | | | | | | | | | |
| | | 2013 | | | 2012 | | | Change | |
| Cash and cash equivalents | | | 2,748 | | | | 2,477 | | | | 271 | |
| Current investments | | | 93 | | | | 15 | | | | 78 | |
| | | | | | | | | | | | |
| Group liquidity | | | 2,841 | | | | 2,492 | | | | 349 | |
| Current financial debt | | | 586 | | | | 600 | | | | -14 | |
| | | | | | | | | | | | |
| Net liquidity 1 | | | 2,255 | | | | 1,892 | | | | 363 | |
| Non-current financial debt | | | 3,722 | | | | 4,394 | | | | -672 | |
| | | | | | | | | | | | |
| Net liquidity 2 | | | -1,467 | | | | -2,502 | | | | 1,035 | |
Group liquidity consists of cash and cash equivalents (for example, cash at banks, money market funds, and time deposits with original maturity of three months or less) and current investments (for example, investments with original maturities of greater than three months and remaining maturities of less than one year) as reported in our IFRS Consolidated Financial Statements.
104 Combined Management Report
Group Liquidity Development
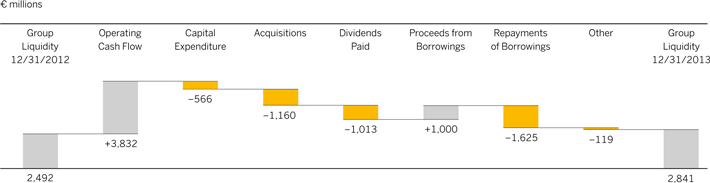
Net liquidity is Group liquidity less total financial debt as defined above.
The increase in Group liquidity from 2012 was mainly due to positive cash inflows from our operations, which were partly offset by cash outflows for acquisitions (such as hybris), dividend payments and repayment of an issued Eurobond.
For information about the impact of cash, cash equivalents, current investments, and our financial liabilities on our income statements, see the analysis of our financial income, net, in the Operating Results (IFRS) section.
Analysis of Consolidated Statements of Cash Flow
Analysis of Consolidated Statements of Cash Flow
€ millions
| | | | | | | | | | | | | | | | | | |
| | | | | 2013 | | | | | 2012 | | | | | Change (in %) | |
| Net cash flows from operating activities | | | | | 3,832 | | | | | | 3,822 | | | | | | 0 | |
| Net cash flows from investing activities | | | | | -1,781 | | | | | | -5,964 | | | | | | -70 | |
| Net cash flows from financing activities | | | | | -1,589 | | | | | | -194 | | | | | | >100 | |
Net cash provided by operating activities remained stable in 2013 (€3,832 million) compared to the prior year (2012: €3,822 million). Increased income tax payments of €193 million to €1,295 million in 2013 burdened net cash flows from operating activities. In addition, days’ sales outstanding (DSO) for receivables, defined as average number of days from the raised invoice to cash receipt from the customer, was 62 days, a three-day increase compared to 2012 (59 days).
Cash outflows from investment activities totaled €1,781 million in 2013, much decreased from the 2012 figure of €5,964 million that were attributed mainly to business combinations of SuccessFactors and Ariba. In 2013, cash outflows were mainly driven by the acquisitions of consolidated companies (especially hybris) as well, for which we paid €1,160 million in total. For more information about current and planned capital expenditures, see the Assets and Investment Goals sections.
Cash outflows from financing activities totaled €1,589 million in 2013, compared to €194 million in 2012. In 2013, cash outflows were mainly driven by dividends paid and a repayment of an issued €600 million Eurobond. In addition, we took out a short-term bank loan in the amount of €1,000 million to finance the acquisition of hybris that were fully offset by repayments
Report on Economic Position 105
in the same amount and year. In the previous year, cash outflows from financing activities were mainly driven by repayments of a Eurobond tranche (€600 million) and several tranches (€611 million) of the promissory notes we issued in 2009 and dividends paid. This was almost fully compensated by a successfully placed Eurobond transaction totaling €1.3 billion and a U.S. private placement transaction of US$1.4 billion.
The decrease of total dividends paid in 2013 to €1,013 million (2012: €1,310 million) was due to a decrease in dividend paid to €0.85 per share compared to €1.10 per share in the previous year, of which €0.35 per share was an extraordinary payout to celebrate our 40th anniversary in 2012.
Credit Facilities
Other sources of capital are available to us through various credit facilities, if required.
By signing a new credit facility contract of €2.0 billion, SAP refinanced its existing credit facility of €1.5 billion that would have expired in December 2015. The revolving credit facility was early refinanced due to favorable market conditions with a tenor of five years plus two one year extension options. The credit line may be used for general corporate purposes. A possible future withdrawal is not bound to any financial covenants. Borrowings under the facility bear interest at the euro interbank offered rate (EURIBOR) or London interbank offered rate (LIBOR) for the respective optional currency plus a margin ranging from 0.3% to 0.525% (2012: 0.45% to 0.75%). We pay a commitment fee of 0.079% (2012: 0.1575%) per annum on unused amounts of the available credit facility. So far, we have not used and do not currently foresee any need to use this credit facility.
As at December 31, 2013, SAP AG had additional available credit facilities totaling €487 million. As at December 31, 2013, there were no borrowings outstanding under these credit facilities. Several of our foreign subsidiaries have credit facilities available that allow them to borrow funds in their local currencies at prevailing interest rates, generally to the extent SAP AG has guaranteed such amounts. As at December 31, 2013, approximately €36 million was available through such arrangements. There were no borrowings outstanding under these credit facilities from any of our foreign subsidiaries as at December 31, 2013.
ASSETS (IFRS)
Analysis of Consolidated Statements of Financial Position
Total assets increased by 3% year over year to €27,094 million.
Breakdown of Consolidated Statements of Financial Position
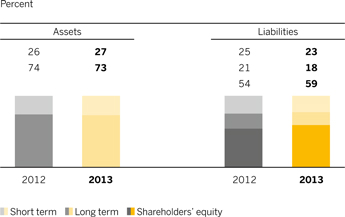
Total current assets increased by 6% in 2013 from €6,928 million to €7,352 million. This was mainly due to an increase in cash and cash equivalents to €2,748 million (2012: €2,477 million) stemming from cash inflows from our operating activities.
Total non-current assets increased slightly in 2013 to €19,741 million compared to the previous year’s figure of €19,378 million. This 2% increase was mainly due to additions to goodwill, resulting from the acquisition of hybris.
106 Combined Management Report
Investment in Goodwill, Intangible Assets or Property, Plant, and Equipment (incl. Capitalizations due to Acquisitions)
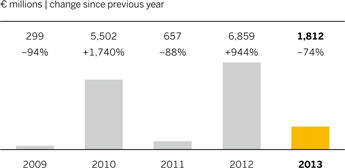
Current liabilities decreased slightly to €6,347 million in 2013 as compared to the prior year (€6,546 million) which is mainly due to a drop in our provisions for share-based payments. In 2013 we paid back a €600 million Eurobond, which was almost fully compensated by reclassifications of €586 million from non-current liabilities to current liabilities due to changes in the respective maturity profile.
The decrease in total non-current liabilities from €5,627 million in 2012 to €4,699 million in 2013 was due mainly to financing activities. The decrease of non-current financial debt relates to reclassifications from non-current liabilities to current liabilities due to changes in the respective maturity profile. For more information about financing activities in 2013, see the Finances (IFRS) section.
Such financing activities improved the equity ratio (that is, the ratio of shareholders’ equity to total assets) to 59%, compared to 54% of the prior year.
Equity Ratio
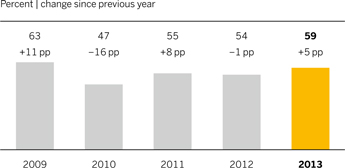
Principal Capital Expenditures and Divestitures Currently in Progress
In 2013, we started construction activities in several locations. We aim to extend our office space and data center capacities to be able to cover future growth. We plan to cover all of these projects in full from operating cash flow. The most important projects are:
| ¡ | | In Bangalore, India, we want to add additional capacity of roughly 2,500 employees. We estimate the total cost to be approximately €51 million, of which we had paid approximately €2 million as of December 31, 2013. We expect to complete the construction of this office building in 2016. |
| ¡ | | In Ra’anana, Israel, we commenced construction of a new building. We estimate the total cost of this project to be approximately €50 million, of which we had paid approximately €10 million as of December 31, 2013. We expect to complete the construction of this office building in 2016. |
| ¡ | | In our research center in Potsdam, Germany, we started with a second construction phase in order to realize additional capacity for at least 100 employees. With the extension of our research center we aim to create the general conditions for further teams contributing innovations to SAP products in miscellaneous fields. We estimate the total cost to be approximately €12 million, of which we had paid approximately €2 million as of December 31, 2013. We expect to complete the construction of this office building in 2015. |
Report on Economic Position 107
| ¡ | | In New York City, New York, United States, we started planning the leasehold improvements for our new office space. The project includes the consolidation of our New York City offices for approximately 600 employees. We estimate the total capital expenditures for this project to be approximately €37 million. We expect to complete the leasehold improvements in 2016. |
| ¡ | | In Paris, France, we started an office consolidation project. The project aims to consolidate three office spaces in Paris into one office space. We estimate the total cost of the leasehold improvements to be approximately €24 million. We expect to complete the leasehold improvements in 2014. |
| ¡ | | In St. Leon-Rot, Germany, we started increasing the capacity of our data center. We estimate the total cost of this project to be approximately €30 million, of which we had paid approximately €14 million as of December 31, 2013. We expect to complete the construction for this project in 2014. |
| ¡ | | In Newtown Square, Pennsylvania, United States, we also started to increase the capacity of our data center. We estimate the total cost of this project to be approximately €20 million, of which we had paid approximately €2 million as of December 31, 2013. We expect to complete the construction for this project in 2014. |
For more information about planned capital expenditures, see the Investment Goals section. There were no material divestitures within the reporting period.
Competitive Intangibles
The assets that are the basis for our current as well as future success do not appear on the Consolidated Statements of Financial Position. This is apparent from a comparison of the market capitalization of SAP AG (based on all outstanding shares), which was €76.5 billion at the end of 2013 (2012: €74.7 billion), with the equity on the Consolidated Statements of Financial Position, which was €16.0 billion (2012: €14.1 billion). This means that the market capitalization of our equity is more than four times higher than the book value. The difference is mainly due to certain intangible assets that the applicable accounting standards do not allow to be recorded (at all or at fair value) on the Consolidated Statements of Financial Position. They include customer capital (our customer base and customer relations), employees and their knowledge and skills, our ecosystem of partners, software we developed ourselves, our ability to innovate, the brands we have built up – in particular, the SAP brand itself – and our organization. On December 31, 2013, SAP ranked third of the most valuable companies in Germany in terms of market capitalization based on all outstanding shares. According to the Interbrand “Best Global Brands” annual survey, SAP ranked again the 25th most valued brand in the world (2012: 25th). Against other German brands, the SAP brand ranks third behind Mercedes-Benz and BMW, and 10th globally against other IT brands. Interbrand determined our value as US$16.7 billion, an increase of 7% compared to the previous year (2012: US$15.6 billion).
The results of our investment in research and development, including R&D investment made in the past, are also a significant element in our competitive intangibles.
Our customer capital continued to grow in 2013. We gained more than 21,500 new customers in various market segments and strengthened our existing customer relationships. To help us improve insight into our customers’ view of SAP, in 2012 we began measuring our Net Promoter Score (NPS), a metric that gives a more complete picture of customer loyalty as it answers the question of how likely our customers would be to recommend SAP. For more information about our new customers and NPS, see the Customers section.
Employee-related and R&D activities increased the value of our employee base and our own software. For more information, see the Employees and Social Investment section and the Research and Development section. We also increased the value of our partner ecosystem by continuing to develop sales and development partnerships.
108 Combined Management Report
Report on the Economic Position of SAP AG
SAP AG is headquartered in Walldorf, Germany, and is the parent company of the SAP Group, which comprises 272 companies. SAP AG is the Group holding company and employs most of the Group’s Germany-based development and service and support personnel.
As the owner of the intellectual property in most SAP software, SAP AG derives its revenue mainly from software license fees paid by its subsidiaries for the right to market SAP solutions.
The SAP AG annual financial statements are prepared in accordance with the reporting standards in the German Commercial Code (as amended by the German Accounting Law Modernization Act) and the German Stock Corporation Act. The full SAP AG annual financial report and unqualified audit report are submitted to the operator of the Elektronischer Bundesanzeiger (Online German Federal Gazette) for publication and inclusion in the Unternehmensregister (German Business Register). It is available from SAP AG on request.
INCOME
The income statement uses the nature of expense method and presents amounts in millions of euros.
SAP AG Income Statement – German Commercial Code Short Version
€ millions
| | | | | | | | |
| | | 2013 | | | 2012 | |
| Total revenue | | | 8,413 | | | | 7,812 | |
| Other operating income | | | 893 | | | | 796 | |
| Cost of services and materials | | | -2,896 | | | | -2,610 | |
| Personnel expenses | | | -1,390 | | | | -1,417 | |
| Depreciation and amortization | | | -309 | | | | -278 | |
| Other operating expenses | | | -2,197 | | | | -2,215 | |
| Operating profit | | | 2,514 | | | | 2,088 | |
| Finance income | | | 825 | | | | 1,144 | |
| Income from ordinary activities | | | 3,339 | | | | 3,232 | |
| Income taxes | | | -834 | | | | -721 | |
| | | | | | | | |
| Net income | | | 2,505 | | | | 2,511 | |
The total revenue of SAP AG in 2013 was €8,413 million (2012: €7,812 million), an increase of 8%. Product revenue increased 4% to €6,543 million (2012: €6,295 million). As in previous years, product revenue was primarily generated from license fees paid by subsidiaries of SAP AG. The increase in SAP AG revenue in 2013 was therefore principally the result of the increase in software and software-related service revenue achieved by the SAP Group.
Other operating income increased €97 million to €893 million (2012: €796 million). The year-over-year increase is due primarily to a rise in gains from currency effects.
SAP AG operating profit increased 20% to €2,514 million (2012: €2,088 million). SAP AG cost of services and materials increased 11% to €2,896 million (2012: €2,610 million). SAP AG cost of services and materials comprises third-party services, including those provided by SAP subsidiaries. SAP AG personnel expenses, mainly the labor cost of the developers, service and support employees, and administration staff employed by SAP AG, decreased slightly by 2% to €1,390 million (2012: €1,417 million) in spite of headcount increase, primarily because of a significant decrease in share-based payment related expenses. Other operating expenses decreased 1% to €2,197 million, mainly due to lower currency losses that declined €39 million compared to the previous year.
Report on the Economic Position of SAP AG 109
Finance income was €825 million (2012: €1,144 million), a decrease of €319 million compared with the previous year, mainly caused by a €322 million decrease in income from securities classified as financial assets and €108 million decrease in investment income. This decrease in finance income was offset by increases of €10 million in income from profit transfer agreements and €26 million in net interest income, as well as a decrease of €76 million in write-downs of financial assets.
SAP AG income from ordinary activities, which is the sum of operating profit and finance income, increased 3% to €3,339 million (2012: €3,232 million). Income tax increased 19% to €831 million (2012: €701 million). The primary cause was a large reduction in income from securities classified as financial assets, much of which is non-taxable. After deducting taxes, the resultant net income decreased €6 million year over year to €2,505 million (2012: €2,511 million).
ASSETS AND FINANCIAL POSITION
In 2013, SAP AG total assets closed at €22,055 million (2012: €21,037 million).
SAP AG Balance Sheet – German Commercial Code Short Version
€ millions
| | | | | | | | |
| | | 12/31/2013 | | | 12/31/2012 | |
| Assets | | | | | | | | |
| Intangible assets | | | 289 | | | | 406 | |
| Property, plant, and equipment | | | 965 | | | | 917 | |
| Financial assets | | | 16,857 | | | | 16,664 | |
| Fixed assets | | | 18,111 | | | | 17,987 | |
| Inventories | | | 2 | | | | 4 | |
| Accounts receivable | | | 2,857 | | | | 2,541 | |
| Liquid assets | | | 884 | | | | 307 | |
| Short-term assets | | | 3,743 | | | | 2,852 | |
| Prepaid expenses and deferred charges | | | 113 | | | | 115 | |
| Deferred taxes | | | 63 | | | | 74 | |
| Surplus arising from offsetting | | | 25 | | | | 9 | |
| | | | | | | | |
| Total assets | | | 22,055 | | | | 21,037 | |
| | |
| Equity and liabilities | | | | | | | | |
| Shareholders’ equity | | | 11,295 | | | | 9,717 | |
| Provisions | | | 1,203 | | | | 1,251 | |
| Other liabilities | | | 9,549 | | | | 10,063 | |
| Deferred income | | | 8 | | | | 6 | |
| | | | | | | | |
| Total shareholders’ equity and liabilities | | | 22,055 | | | | 21,037 | |
Financial assets increased 1% compared with the previous year to €16,857 million, primarily caused by the increase in contributions to subsidiaries. Short-term assets stood at €3,743 million (2012: €2,852 million), a year-over-year increase of €891 million. €316 million of the increase is attributable to accounts receivable and €577 million to liquid assets.
SAP AG shareholders’ equity rose 16% to €11,295 million (2012: €9,717 million). Against outflows of €1,013 million associated with the payment of the 2012 dividend, there was a €2,505 million increase in net income and an inflow of €86 million from the issuance of shares to service the share-based payments of employees and Executive Board members. The equity ratio (that is, the ratio of shareholders’ equity to total assets) increased from 46% in 2012 to 51% in 2013.
110 Combined Management Report
Provisions decreased €48 million to €1,203 million. While the other provisions decreased €107 million to €662 million, mainly due to lower share-based payment related provisions, the reserves for tax increased €58 million to €539 million.
Other liabilities decreased €514 million to €9,549 million (2012: €10,063 million). This decrease is mainly attributable to contrasting effects: On the one hand, SAP AG made a scheduled repayment of a bond in the amount of €600 million; on the other, SAP AG liabilities to affiliated companies decreased €95 million, mainly due to increased cash contribution by subsidiaries through SAP AG’s centralized management of finance and liquidity.
SAP AG Cash Flow Statement – German Commercial Code Short Version
€ millions
| | | | | | | | |
| | | 2013 | | | 2012 | |
| Net cash flows from operating activities | | | 2,987 | | | | 2,334 | |
| Net cash flows from investing activities | | | -485 | | | | -4,598 | |
| Net cash flows from financing activities | | | -1,975 | | | | -271 | |
| Net decrease/increase in cash and cash equivalents | | | 527 | | | | -2,535 | |
| | | | | | | | |
| Cash and cash equivalents at the beginning of the year | | | 307 | | | | 2,842 | |
| | | | | | | | |
| Cash and cash equivalents at the end of the year | | | 834 | | | | 307 | |
Mainly due to the mentioned cash contributions by subsidiaries through SAP AG’s centralized management of finance and liquidity as well as to positive business performance, the cash flow from operating activities increased €653 million to €2,987 million in 2013 (2012: €2,334 million).
SAP AG used net cash flows from investing activities of €485 million in 2013 (2012: €4,598 million), a year-over-year decrease of €4,113 million. The outflows were €500 million for property, plant and equipment and financial assets and €50 million for long-term investments. They were in part offset by inflows of €66 million from sales of property, plant and equipment and financial assets. In the prior year, contributions to subsidiaries’ capital related to the acquisition of SuccessFactors and Ariba occasioned outflows of €4,830 million.
Net cash flows from financing activities were €1,975 million in 2013 compared to €271 million in 2012. In 2013, SAP AG outflows included the dividend of €1,013 million (2012: €1,310 million and repayments of financial liabilities of €1,015 million. On the other hand, SAP AG generated inflows of €53 million from the reissuance of treasury shares and the issuance of new shares for share-based payments.
At the close of the year, SAP AG held €834 million in short-term liquid assets (2012: €307 million), a year-over-year decrease of €527 million.
OPPORTUNITIES AND RISKS
SAP AG is subject to materially the same opportunities and risks as the SAP Group. For more information, see the Opportunity Report and the Risk Report sections.
Report on the Economic Position of SAP AG 111
Overall Financial Position
EXECUTIVE BOARD’S ASSESSMENT
SAP delivered strong revenue and profit growth in 2013. SAP HANA, our platform for real-time business applications, was a major growth engine in 2013. SAP Business Suite powered by SAP HANA is becoming a leading platform for high-performance applications.
Our stable, highly profitable core business and our fast-growing cloud business can together deliver continued growth and an expanding margin. We still aim to increase total revenue growth, both for the near term and for the medium term. At the same time, we want to build still greater profitability for our business. All in all, SAP remains in good financial shape.
INFLUENCE OF ACCOUNTING POLICIES ON OUR FINANCIAL POSITION
For more information about our accounting policies, see the Notes to the Consolidated Financial Statements section, Note (3).
There are no off-balance sheet financial instruments, such as sale-and-lease-back transactions, asset-backed securities, and liabilities related to structured entities, that are not disclosed in our Consolidated Financial Statements.
112 Combined Management Report
Corporate Governance
CORPORATE GOVERNANCE STATEMENT
The German Commercial Code, section 289a, requires that listed stock corporations publish a corporate governance statement either as part of their management report or on their Web site. The Executive Board filed SAP’s corporate governance statement on February 19, 2014, and published it on our public Web site at www.sap.com/corporate-en/investors/governance.
For more information about the corporate governance of SAP, see the Corporate Governance Report section.
PLANNED CONVERSION TO A EUROPEAN COMPANY
In March 2013, the Executive Board and Supervisory Board of SAP AG agreed to convert SAP AG to a European Company (SE). SAP has begun working on the conversion process. The Executive Board and the Supervisory Board believe that the planned change of legal form reflects SAP’s position as a global company with European roots. The European Company legal form also reflects SAP’s European and international business activities. The European Company legal form will allow SAP to optimize its corporate governance structure and the work of its Supervisory Board and Executive Board.
As invited by management, SAP employees and their representatives in the European Union (EU) and European Economic Area (EEA) countries elected their delegates to a Special Negotiating Body (SNB). Negotiations between SAP management and the SNB regarding the European employees’ involvement in the SE began in September 2013, are ongoing, and are expected to last six months. SAP intends to seek the required approval of the shareholders for the conversion of legal form at the 2014 Annual General Meeting of Shareholders. If approved, the change of legal form would take effect upon entry in the commercial register. With the conversion to an SE, its shareholders automatically become shareholders of SAP SE. Shareholders’ rights remain unchanged.
CHANGES IN MANAGEMENT
Lars Dalgaard stepped down from the Executive Board and left the Company on June 1, 2013, to join a private equity firm. He continues to play an active role as an advisor to the SAP Cloud business in the Cloud Governance Board.
We have consolidated all responsibility for innovation and product development under Vishal Sikka, a member of the Executive Board. With effect from June 1, 2013, all on-premise delivery, network (Ariba), and Cloud unit development leaders report directly to Vishal Sikka. Additionally, the Executive Board nominated Bernd Leukert, executive vice president for application innovation, to the Global Managing Board with effect from July 1, 2013. In this capacity, Leukert reports directly to Vishal Sikka.
Luisa Deplazes Delgado, member of the Executive Board of SAP AG, Human Resources, and Labor Relations Director decided to leave SAP with effect from June 30, 2013, to become the CEO of another company.
Corporate Governance 113
In addition to his role as our chief financial officer, Werner Brandt took on Executive Board responsibility for human resources and became the labor relations director in Germany. In this context, Luka Mucic became the head of global finance to support Brandt in his expanded responsibilities. The Executive Board nominated Mucic to the Global Managing Board with effect from July 1, 2013. In October 2013, the Supervisory Board of SAP AG appointed Luka Mucic chief financial officer, effective July 1, 2014. Luka Mucic is the successor of Werner Brandt, who will, as planned, withdraw from the Executive Board by that time.
On July 21, 2013, the SAP Supervisory Board agreed to propose that co-CEO Jim Hagemann Snabe be elected to the SAP Supervisory Board at the SAP Annual General Meeting of Shareholders in May 2014. This proposal is subject to support by at least 25% of the shareholders. Jim Hagemann Snabe will conclude his current role as co-CEO and member of the SAP Executive Board upon the conclusion of the Annual General Meeting of Shareholders in May 2014.
Bob Calderoni, president of Ariba, an SAP company, and a member of our Global Managing Board, decided to leave SAP with effect from January 15, 2014.
114 Combined Management Report
Information Concerning Takeovers
Information required under the German Commercial Code, sections 289 (4) and 315 (4), with explanatory report:
| ¡ | | Composition of share capital: For information about the composition of SAP AG share capital as of December 31, 2013, see the Notes to the Consolidated Financial Statements section, Note (20). Each share entitles the bearer to one vote. American depositary receipts (ADRs) representing our shares are listed on the New York Stock Exchange in the United States. ADRs are certificates representing non-U.S. shares and are traded on U.S. stock exchanges instead of the underlying shares. One SAP ADR corresponds to one SAP share. |
| ¡ | | Restrictions applying to share voting rights or transfers: SAP shares are not subject to transfer restrictions except the lock-in period under the SAP Share Matching Plan (SMP), described below. SAP held 34,795,554 treasury shares on December 31, 2013. Treasury shares did not entitle us to any rights, and hence to any voting rights or dividend. Shares issued in 2013 under the employee SMP are subject to contractual transfer restrictions for a three-year lock-in period unless the plan member’s employment with SAP is ended during that period. Until that lock-in period has expired, the participating employees are not ordinarily allowed to dispose of the shares they have acquired under the plan. We are not aware of any other restrictions applying to share voting rights or to share transfers. |
| ¡ | | Shareholdings that exceed 10% of the voting rights: We are not aware of any direct or indirect SAP AG shareholdings that exceed 10% of the voting rights. |
| ¡ | | Shares with special rights conferring powers of control: No SAP shareholder has special rights conferring powers of control. |
| ¡ | | Type of control over voting rights applying to employee shareholders who do not directly exercise their control rights: As with other shareholders, employee holders of SAP shares exercise their control rights in accordance with the law and the Articles of Incorporation. In votes on the formal approval of their acts at the Annual General Meeting of Shareholders, employee representatives on the Supervisory Board – as all other members of the Supervisory Board – are prohibited from exercising the voting rights associated with their shares. |
| ¡ | | Legal requirements and provisions in the Articles of Incorporation concerning the appointment and dismissal of members of the Executive Board and amendment of the Articles of Incorporation: Conditions for the appointment and dismissal of members of the Executive Board and amendment of the Articles of Incorporation reflect the relevant provisions in the German Stock Corporation Act. Under the Articles of Incorporation, the Executive Board consists of at least two members who are appointed for a period of not more than five years by the Supervisory Board in accordance with the German Stock Corporation Act, section 84. The number of members of the Executive Board is decided by the Supervisory Board. Executive Board members may be reappointed for, or their term of office extended by, a maximum of five years. The German Codetermination Act, section 31, provides that a two-thirds majority of the Supervisory Board membership is required for Executive Board appointments. If the Supervisory Board fails to make an appointment with a majority that meets this requirement, the Mediation Committee must propose an appointee within one month. Appointments to the Executive Board can then be made by a simple majority of the Supervisory Board membership. If the Supervisory Board also fails to make an appointment with a majority that meets this requirement, the chairperson of the Supervisory Board has two votes in the subsequent ballot. The Supervisory Board can appoint a chairperson of the Executive Board and one or more deputy chairpersons from among the members of the Executive Board. The Supervisory Board can revoke appointments to the Executive Board in accordance with the German Stock Corporation Act, section 84, if compelling reasons exist, such as gross negligence on the part of the Executive Board member. If the Executive Board is short of a required member, one may be appointed in urgent cases by a court in accordance with the German Stock Corporation Act, section 85. In accordance with the German Stock Corporation Act, sections 179 and 133, an amendment of the Articles of Incorporation requires a resolution of the General Meeting of Shareholders with a majority of at least three-quarters of the share capital represented in the vote and the simple majority of the votes cast. Section 11 (2) of the Articles of Incorporation authorizes the Supervisory Board to amend the Articles of Incorporation where such amendments only concern the wording. |
Information Concerning Takeovers 115
| ¡ | | Powers of the Executive Board to issue and repurchase shares: The Annual General Meeting of Shareholders on May 25, 2011, granted powers to the Executive Board, subject to the consent of the Supervisory Board, to issue convertible and warrant-linked bonds and to grant conversion and option rights in respect of SAP AG shares representing a total attributable portion of the share capital of not more than €100 million secured by a corresponding amount of contingent capital. These powers will expire on May 24, 2016. The Executive Board is also authorized until June 7, 2015, to increase the share capital by not more than €250 million by issuing new shares against contributions in cash and to increase the share capital by not more than €250 million by issuing new shares against contributions in cash or in kind. For more details about the different tranches of authorized capital and the aforementioned contingent capital, see the Articles of Incorporation, section 4. The Annual General Meeting of Shareholders on June 4, 2013, granted a power to the Executive Board in accordance with the German Stock Corporation Act, section 71 (1)(8), to buy back for treasury on or before June 3, 2018, SAP AG shares attributable in total to not more than €120 million of the share capital. The power is subject to the proviso that the shares repurchased, together with any shares that were previously acquired and are still held by SAP in treasury and any other shares controlled by SAP, must not in total exceed 10% of SAP’s share capital. Executive Board powers, such as those described to issue and repurchase stock and to grant rights of conversion and subscription to shares of SAP, are widely followed common practice among German companies like SAP. They give the Executive Board the flexibility it needs, in particular the options to use SAP shares as consideration in equity investments, raise funds on the financial markets at short notice on favorable terms, or return value to shareholders during the course of the year. To service the SMP, which is an employee stock plan we established in 2010, the Executive Board is authorized, subject to Supervisory Board consent, to issue to participants of the plan new shares until June 7, 2015. This authorized capital has been used for plan tranches in 2010, 2011, and 2012 (but not in 2013), and on December 31, 2013, it empowered the Company to issue new shares representing a total attributable portion of the share capital of not more than €29,609,256. |
| ¡ | | Material agreements with provisions that take effect in the event of a change of control following a takeover bid: SAP AG has concluded the following material agreements with provisions that take effect in the event of a change of control, whether following a takeover bid or otherwise: |
| | – | | The terms of SAP’s syndicated €2 billion revolving credit facility include a change-of-control clause. For more information about this syndicated credit facility, see the Notes to the Consolidated Financial Statements section, Note (25). This clause obliges SAP AG to notify the banks in case of a change of control. If, on receiving the notification, banks that represent at least two-thirds of the credit volume so require, the banks have the right to cancel the credit facility and demand complete repayment of the outstanding debt. If no continuation agreement is reached, the credit facility would end and the obligation to repay would become effective at an ascertainable time. |
| | – | | The terms of the German promissory notes totaling €86 million include a change-of-control clause. For more information about these German promissory notes, see the Notes to the Consolidated Financial Statements section, Note (17b). The clause gives the lenders special termination rights in case of a change of control. If no continuation agreement is reached within 30 days after a change of control, the lenders would be entitled to declare the loan due and demand repayment of the outstanding debt without delay. |
| | – | | In agreements between SAP AG and various banks for bilateral credit facilities that totaled €487 million on December 31, 2013, we have agreed customary material adverse change clauses permitting the banks to terminate if events occur that are materially adverse to the economic standing of SAP AG, which may possibly also include a change of control. In the past, we have drawn on these bilateral credit facilities only infrequently and only for a few days. We believe that in view of our current liquidity situation, termination of these credit facilities would not have a material adverse effect, at least in the near term. |
116 Combined Management Report
| | – | | SAP issued two bonds in 2010, each in two tranches of different tenures, totaling €2.2 billion. In 2012, SAP set up a Debt Issuance Program under which a first tranche of Eurobonds in the amount of €1.3 billion was issued. In 2013, a new €4 billion Debt Issuance Program was set up under which no bonds were issued until December 31, 2013. For more information about these bonds, see the Notes to the Consolidated Financial Statements section, Note (17b). Under the terms agreed with the buyers, we are required to notify the buyers of any change of control without delay. If there is a change of control and SAP is consequently assigned a lower credit rating within a defined period, buyers are entitled to demand repayment. We currently do not have a credit rating with any agency. In case that condition persists in a change of control event, an early redemption would only be triggered if no rating agency assigns a credit rating during the change of control period. |
| | – | | Under the terms of our U.S. private placements totaling US$2.65 billion, we are required to offer lenders repayment of outstanding debt if there is a change of control and SAP is consequently assigned a lower credit rating within a defined period. For more information about these private placements, see the Notes to the Consolidated Financial Statements section, Note (17b). Lenders would have at least 30 days to accept the offer. We currently do not have a credit rating with any agency. In case that condition persists in a change of control event, an early redemption would only be triggered if no rating agency assigns a credit rating during the change of control period. |
| | – | | We have entered into relationships with other companies to jointly develop and market new software products. These relationships are governed by development and marketing agreements with the respective companies. Some of the agreements include provisions that, in the event of a change of control over one of the parties, give the other party a right to consent to the assignment of the agreement or to terminate it. |
| ¡ | | Agreements to compensate members of the Executive Board or the employees in the event of a takeover bid: Agreements have been concluded with the members of the Executive Board concerning compensation in the event of a change of control. These agreements, which are customary in Germany and elsewhere, are described in the Compensation Report that is an integral part of this management report. We have no analogous compensation agreements with other employees. |
Information Concerning Takeovers 117
Opportunity Report
Market dynamics are shifting rapidly as in-memory and cloud computing are being adopted in enterprise IT. Our customers rely on SAP as the trusted advisor to successfully lead this transition not only towards in-memory computing and the cloud, but also towards driving new business outcomes and enabling business model innovations. To meet these expectations we must grow consistently and accelerate the pace of our business transformation by leveraging the right innovation and exploiting new opportunities.
We have established a framework for opportunity management by evaluating and analyzing four key areas: current markets, competitive landscapes, external scenarios, and technological trends. Furthermore, we have delved into customer product segmentation, growth drivers and industry-specific success factors. These combined insights help the Executive Board define market strategies for future consideration.
Our shareholder value relies heavily upon a fine balance of awareness between risk mitigation and value-driven opportunities. Therefore, our strong governance model ensures that decisions are based on return, investment required, and risk mitigation. More importantly, these decisions rely on the talent and resources within SAP’s entire ecosystem, extending even to our partner relationships. Without these core assets, it would not be possible to successfully deliver innovation to our customers in a consumable, inspiring, and sustainable way.
As far as opportunities are likely to occur, we have incorporated them into our business plans, our outlook for 2014, and our medium-term prospects outlined later in this report. The following section therefore focuses on future trends or events that might result in a departure from our outlook and medium-term prospects that are positive for SAP.
SAP AG is the parent company of the Group and earns most of its revenue from software license fees and dividends paid by affiliates. Consequently, the opportunities described below also apply – directly or indirectly – to SAP AG. Insights and conclusions apply to segments and portfolio.
OPPORTUNITIES
Opportunities from Positive Development of Economic Conditions
Economic conditions have a clear influence on our business, financial position, profit, and cash flows. Our outlook for 2014 and medium-term prospects are based on future economic conditions and trends, aligned to our corporate growth strategies. Consequently, should the global economy experience a more sustained recovery than is reflected in our outlook, our revenue and profit may exceed our current outlook and medium-term prospects.
We expect strong growth in emerging markets (Brazil, China, the Middle East, and Africa). These markets are prime opportunities for both our established enterprise applications and new offerings. Africa, for example, is on its way to becoming one of the new global economic powerhouses. Stable GDP growth rates are fueled by the continent’s vast natural resources and increasing foreign and African investment in public infrastructure. Software demand is increasing and we expect double-digit growth rates. SAP Africa’s current business performance gives evidence of solid market opportunity and execution capabilities. In addition, customers and partners are actively targeting Africa and demand a stronger SAP presence in the region. As a result, the Board decided to build a targeted strategic growth plan for the continent to provide strategic answers to key opportunities and challenges. The expected impact of this strategy is reflected in our outlook. Additional revenue and profit opportunities may arise over the course of 2014.
118 Combined Management Report
In addition, we continue to acknowledge the growing demand for prudent management of resources and sustainable business models, both for our customers and for ourselves. In this context, SAP will progress to leverage the technological capabilities to solve more complex problems of humanity.
For more information about future trends in the global economy, the IT market outlook, and the potential influence on SAP, see the Report on Expected Developments section of this management report.
Opportunities from Research and Development Traction
Our continued growth through innovation is based on our ability to leverage R&D resources effectively. We continue to improve our development processes through design thinking and lean methodologies. We are accelerating innovation cycles and engaging more closely with our customers to ensure accuracy and success.
While speed is a key strength, we also focus on ease of adoption and providing compelling returns. This allows our customers to easily consume technologies and software applications with immediate benefits for their businesses. If we make innovations available faster than currently anticipated, or if customers adopt the innovations faster than currently expected, this could positively impact our revenue, profit, and cash flows and result in exceeding our stated outlook and medium-term prospects.
For more information about future opportunities in research and development for SAP, see the Research and Development and Report on Expected Developments sections of this management report.
Opportunities from Our Strategy for Profitable Growth
Our strategy influences our business, financial position, profit, and cash flows. Our mission is to deliver profitable growth across our portfolio of products, solutions, and services. We will continue to expand our addressable market to US$350 billion in 2020, compared to US$110 billion in 2010.
We see opportunities in new product and market areas, such as in-memory, cloud, mobile, digital marketing, social media, machine-to-machine, and predictive analytics. We are entering into these areas through organic development as well as acquisitions. We also seek to establish new business models and leverage our expanding ecosystem of partners to maximize these opportunities.
In addition, our core business applications continue to offer solid multi-year growth opportunities as we bring innovative technologies with simplified consumption to our installed base and continue to add net new customers.
Successful performance relies on our pace of innovation. SAP is now taking market share in our targeted market categories and creating new opportunities to increase the business value for our customers. This should allow SAP to add further business value and thus increase the share of our customers’ IT spending.
Unexpected portfolio growth may positively impact our revenue, profit, and cash flows and result in exceeding our stated outlook and medium-term prospects. Specifically, SAP HANA and our cloud offerings could create even more demand than is reflected in our stated outlook and medium-term prospects.
For more information about future opportunities for SAP, see the Vision, Mission, and Strategy and Report on Expected Developments sections of this management report.
Opportunity Report 119
Opportunities from Our Partner Ecosystem
SAP continues to grow and develop a global partner ecosystem. In order to increase market coverage, we want to enhance our portfolio and spur innovation with the specified objective of increasing the partner revenue contribution to SAP’s overall revenue target. In addition to strengthening our core, we will leverage our entire ecosystem to drive adoption of SAP HANA and cloud solutions as well. As a result, we are creating an ever-stronger setup, where we, along with our customers and partners, co-innovate and develop new innovative solutions on top of SAP HANA. Our unrivaled partner ecosystem is essential for making SAP HANA the industry’s real-time in-memory platform of the future.
Should the business of our partners develop better than currently expected, our indirect sales (partner revenue) could grow stronger than reflected in our outlook and medium-term prospects. This may positively impact our revenue, profit, and cash flows and result in exceeding our stated medium-term prospects.
For more information about opportunities arising from our partner ecosystem, see the Partner Ecosystem and Report on Expected Developments sections of this management report.
Opportunities from Our Employees
Our employees drive our innovation, are the value to our customers, and consistently promote our growth and profitability. In 2013, we increased the number of full-time employees, especially in sales roles to capture growth opportunities. We anticipate improvements in employee productivity as a result of our continued endeavors in design-thinking principles. As described in the Employees section, we also run programs that aim to increase engagement, collaboration, and social innovation.
To ensure continuous innovation and sustained business success, we need to continuously bring the best and brightest talent to SAP. To do so, we will further strengthen our brand perception in the market and optimize our recruiting experience to emphasize our focus on improving people’s lives. Furthermore, we will maximize mobile channels and innovative talent strategies to tap into new talent pools.
Our outlook and medium-term prospects are based on certain assumptions regarding employee productivity and engagement. If the actual employee productivity exceeds these assumptions, it would positively impact our revenue, profit, and cash flows and result in exceeding our stated medium-term prospects.
For more information about future opportunities from our employees, see the Employees section of this management report.
Opportunities from Our Customer Engagement
SAP goes to market by region, customer segments, line of business, and industry. We evolve and invest in our go-to-market coverage model to effectively sell industry-specific solutions while increasing our engagement with customers. We focus on the dynamic and fast-changing landscape each industry faces as technology evolves.
We offer unique services that significantly drive a return on investment, and continue to actively look at new opportunities to increase the value we deliver to our customers. Our outlook and medium-term prospects are based on certain assumptions regarding the success of our go-to-market approaches. If the actual go-to-market success exceeds these assumptions, this would positively impact our revenue, profit, and cash flows, and result in exceeding our stated medium-term prospects.
120 Combined Management Report
Risk Report
INTERNAL CONTROL AND RISK MANAGEMENT SYSTEM
As a global company, SAP is exposed to a wide variety of risks across our range of business operations. As a consequence, the Executive Board has put comprehensive risk management and internal control structures into place that enable SAP to identify and analyze risks early on and take appropriate action. Our risk management and internal control system is designed to identify potential events that could negatively impact the Company and to provide reasonable assurance regarding the achievement of the Company objectives, specifically our ability to achieve our financial, operational, or strategic goals as planned.
This system comprises multiple control mechanisms and is an important element of the corporate decision-making process; it is therefore implemented as an integral part of SAP’s business processes across the entire Group. Ensuring that our global risk management efforts are effective and enable us to aggregate risks and report on them transparently, we have adopted an integrated risk management and internal control approach.
SAP AG is a stock corporation domiciled in Germany and issues securities that are listed on the stock exchanges in Frankfurt, Berlin, and Stuttgart, in Germany, as well as on the New York Stock Exchange, in the United States. We are therefore subject to both German and U.S. regulatory requirements that relate to risk management and internal controls over financial reporting, such as provisions in the German Stock Corporation Act, section 91 (2), and the U.S. Sarbanes-Oxley Act (SOX) of 2002, section 404. The Executive Board has established an early warning system (risk management system) to ensure compliance with applicable regulations and for the effective management of risks.
Our risk management system is based on five pillars, comprising a dedicated risk management policy and a standardized risk management methodology followed by a global risk management organization. The internal control system comprises the internal control and risk management system for financial reporting (ICRMFR) that also covers the broader business environment. In 2013, we implemented continuous control monitoring and continuous auditing in selected areas. Using the Committee of Sponsoring Organizations of the Treadway Commission (COSO) framework, we define and cover internal controls all along the value chain on a process and subprocess level to assure that sound business objectives are set in line with the organization’s strategic, operational, financial, and compliance goals. In addition, we have a governance model in place across risk management and the internal control system to ensure both systems are effective, as well as a central software solution to store, maintain, and report all risk-relevant information.
RISK MANAGEMENT POLICY AND FRAMEWORK
The risk management policy issued by the Executive Board governs how we handle risk in line with the Company’s risk appetite and defines a methodology that is applied uniformly across all parts of the Group. The policy stipulates who is responsible for conducting risk management activities and defines reporting and monitoring structures. We routinely review and update the policy as necessary. Our global corporate audit function conducts regular audits to assess the effectiveness of our risk management system. Every year, SAP’s external auditor assesses if the early risk identification system is adequate to identify risks that may endanger the Group’s ability to continue as a going concern. SAP’s enterprise risk management follows COSO II (integrated framework for enterprise risk management) and covers risks in the areas of strategy, operational business, financial reporting, and compliance. As of today, the risk management system analyzes risks and only assesses or analyzes opportunities where deemed appropriate.
Risk Report 121
RISK MANAGEMENT METHODOLOGY AND REPORTING
The following sections describe the key content elements of the risk management process as part of SAP policy: risk planning, identification, analysis, response, and monitoring. Risk planning and risk identification for both internal and external risks are conducted in cooperation between risk managers and the business units or subsidiaries across the Group. We use various techniques to identify risks. For example, we have identified risk indicators and developed a comprehensive risk catalog that includes risk mitigation strategies for known product and project risks. Risk identification takes place at various levels of the Company to ensure that common risk trends are identified and end-to-end risk management across organizational borders is enabled. We apply both qualitative and quantitative risk analysis as well as other risk analysis methods such as sensitivity analyses and simulation techniques.
To determine which risks pose the highest threat to the viability of the Group, we classify them as “high,” “medium,” or “low” based on the likelihood that a risk will occur within the assessment horizon as well as the impact the risk would have on SAP’s business objectives if it were realized. The scales for measuring these two indicators are given in the following tables.
| | |
Probability/Likelihood of Occurrence | | Description |
| 1 to 19% | | Remote |
| 20 to 39% | | Unlikely |
| 40 to 59% | | Likely |
| 60 to 79% | | Highly Likely |
| 80 to 99% | | Near Certainty |
In this framework, we define a remote risk as one that will occur only under exceptional circumstances and a near certain risk as one that can be expected to occur within the specified time horizon. The period for analyzing our risks is at least the used forecast period. The period for analyzing our risks that could be possible threats to the Group’s ability to continue as a going concern, is eight rolling quarters.
| | |
Impact Level | | Impact Definition |
| Insignificant | | Negligible negative impact on business, financial position, profit, and cash flows |
| Minor | | Limited negative impact on business, financial position, profit, and cash flows |
| Moderate | | Some potential negative impact on business, financial position, profit, and cash flows |
| Major | | Considerable negative impact on business, financial position, profit, and cash flows |
| Business-critical | | Detrimental negative impact on business, financial position, profit, and cash flows |
Based on the likelihood that a risk will occur as well as the impact the risk would have on SAP’s reputation, business, financial position, profit, and cash flow leads us to classify the risks as “high,” “medium,” or “low.”
122 Combined Management Report

Risk analysis is followed by risk response and risk monitoring. Our risk managers work in close cooperation with the business owners, ensuring that effective strategies are implemented to address risks. Risks may be reduced by taking active steps based on risk approval. Business owners are responsible for continuously monitoring the risks and the effectiveness of mitigation strategies, with support from the respective risk managers. To provide greater risk transparency and enable appropriate decision making for business owners, we have established a risk delegation of authority (RDOA) for relevant parts of the organization as deemed appropriate. RDOA is a risk management decision-making hierarchy that helps business owners gain timely insight into SAP’s riskiest projects and processes, so they are better able to review the relevant information, understand the risk profile and associated mitigation strategies, and determine if their approval is warranted. Depending on the exposure, approval is required at different levels of the Company, up to and including the Executive Board.
All identified and relevant risks are reported at the local, regional, and global levels in accordance with our risk management policy. At local, regional, and global levels, we have established executive risk councils that regularly discuss risks and countermeasures and that monitor the success of risk mitigation. In addition, the Executive Board and Global Managing Board are informed quarterly about individual risks based on clearly defined reporting criteria. Newly identified or existing significant risks that are above a defined threshold or with a potential significant impact are also reported to the chairperson of the Supervisory Board and to the chairperson of the Audit Committee of the Supervisory Board. This includes any potential going concern risks.
We also have a process in place that analyzes those risks with respect to potential effects on liquidity, excessive indebtedness, and insolvency, which could be possible threats to the Group’s ability to continue as a going concern.
Risk Report 123
RISK MANAGEMENT ORGANIZATION
Our risk management organization ensures the coverage of the functions of risk management governance, strategic, operational, financial, and compliance risk management, with regard to SAP targets. The Global Governance, Risk & Compliance (GRC) organization comprises a group-wide governance function, which includes regular maintenance and implementation of our risk management policy. The uniform process model comprises all essential elements of risk management: risk planning, risk identification, risk analysis, risk response, and risk monitoring. This function is also responsible for standardized risk reporting to risk committees at different levels of the Company, including the Executive Board and Global Managing Board as well as the chairpersons of the Supervisory Board and the Audit Committee.
Our strategic risk management function is responsible for enabling early identification and mitigation of risks that could threaten the successful execution of SAP’s strategic objectives. It also supports the successful execution of our corporate strategy by creating transparency regarding risks that could threaten commercial interests or intangible assets such as corporate or product reputation and brand image.
Operational and financial risk management is uniformly implemented at SAP. GRC risk managers independent of the business are assigned to each of SAP’s important business units and business activities and to selected strategic initiatives. All GRC risk managers, together with assigned risk contacts in the business units, continuously identify and assess risks associated with material business operations using a uniform approach and monitor the implementation and effectiveness of the measures chosen to mitigate risks.
Further financial risk management activities are performed by our Global Treasury function.
For hybris, risk management activities are performed by the chief financial officer and the head of internal controls, internal audit, and risk management based on their particular area. GRC risk managers are responsible for supporting and monitoring the implementation of risk management across the Group that is both effective and compliant with regulatory requirements and SAP’s global risk management policy. Based on SAP’s risk management policy, all risks and risk-related matters have to be reported to the Global GRC organization, and from an organizational perspective, all risk managers (except for hybris) report to the Global GRC organization.
The head of Global GRC, together with the corresponding function within SAP’s acquired companies (such as hybris), is responsible for SAP’s internal control and risk management program, and provides regular updates to the Audit Committee of the Supervisory Board. The overall risk profile of the Group is consolidated by the head of Global GRC, who reports to the head of Global Finance, who is a member of the Global Managing Board and reports to the CFO.
INTERNAL CONTROL AND RISK MANAGEMENT SYSTEM FOR FINANCIAL REPORTING BY THE GROUP
The purpose of a company’s system of internal control over financial reporting is to ensure with sufficient certainty that its financial reporting is reliable and in compliance with applicable generally accepted accounting principles. Because of the inherent limitations of internal control over financial reporting, it may not prevent or bring to light all potential misstatements in our financial statements.
124 Combined Management Report
SAP’s internal control and risk management system for financial reporting (ICRMSFR) is based on our Group-wide risk management methodology. The ICRMSFR includes organizational, control, and monitoring structures designed to ensure that data and information concerning our business is collected, compiled, and analyzed in accordance with applicable laws and properly reflected in the IFRS Consolidated Financial Statements as well as in the stand-alone financial statements of SAP subsidiaries according to local GAAP.
Our ICRMSFR also includes policies, procedures, and measures designed to ensure compliance of SAP’s financial reports with applicable law and standards. We analyze new statutes, standards, and other pronouncements, as failure to implement them would present a substantial risk to the compliance of our financial reporting. Finally, the ICRMSFR has both preventive and detective controls, including, for example, automated and non-automated reconciliations, segregated duties with two-person responsibility, authorization concepts in our software systems, and monitoring.
Our Corporate Financial Reporting department codifies all accounting policies in the Group Accounting and Global Revenue Recognition Guidelines. These policies and the corporate closing schedule together define the closing process. Under this closing process all affiliates prepare, partly supported by centralized and outsourced services, their financial statements for consolidation by our Corporate Financial Reporting office. The corporate financial reporting department and other corporate departments assist the local subsidiaries’ efforts to comply with Group accounting policies and monitor their work. Our corporate audit function and Corporate Financial Reporting department conduct financial statement audits of SAP subsidiaries.
The Corporate Financial Reporting department conducts all of SAP’s financial consolidation. We outsource some work, such as valuing projected benefit obligations and share-based payment obligations, as well as purchase price allocations in the context of asset acquisitions and business combinations. The employees who work on SAP’s financial reporting receive training in the policies and processes.
A committee chaired by the head of Global Finance and member of the Global Managing Board, proposes the assessment results on the effectiveness of the ICRMSFR each year as of December 31 to the Group CFO based on an analysis of the design and operating effectiveness of our internal controls over financial reporting. The committee meets regularly to set the annual scope for the test of effectiveness, to evaluate any possible weaknesses in the controls, and to determine measures to address them adequately. During its own meetings, the Audit Committee of the Supervisory Board regularly scrutinizes the resulting assessments of the effectiveness of the internal controls with respect to the IFRS Consolidated Financial Statements.
Its assessment of the effectiveness of SAP’s internal controls over financial reporting was that on December 31, 2013, the Group has an effective internal control system over financial reporting.
RISK MANAGEMENT AND INTERNAL CONTROL GOVERNANCE
The Executive Board is responsible for ensuring the effectiveness of the risk management and internal control system. The effectiveness of both systems and their implementation in the different Executive Board areas is monitored by each board member. Our Group CFO regularly provides a status on the risk management and the internal control system to the Audit Committee. Key risks are reported quarterly to the chairpersons of the Supervisory Board and the Audit Committee. The Audit Committee of the Supervisory Board regularly monitors the effectiveness of SAP’s risk management and internal control system. In this regard, they requested the Corporate Audit
Risk Report 125
department to regularly audit various aspects of the risk management system and its effectiveness. Additional reassurance will be obtained through the external audit of the effectiveness of our internal control system over financial reporting and the internal warning system.
SOFTWARE SOLUTION
We use our own risk management software (SAP solutions for GRC) to effectively support the governance process. Risk managers record and address identified risks using our risk management software to create transparency across all known risks that exist in the Group, as well as to facilitate risk management and the associated risk reporting. This information is available to managers through a mobile app as well as regularly issued reports, and is consolidated and aggregated for the quarterly report to the Executive Board and the Global Managing Board. The solution also supports the risk-based approach of SAP’s internal control and risk management system for financial reporting (ICRMSFR).
RISK FACTORS
The following sections outline risk factors that we identify and track using our risk management software (SAP solutions for GRC). They are presented below at a more aggregated level as compared to their use in internal controlling, but are broken down by the same risk categories we also use in our internal risk management system reporting structure. All described risks are applicable to different extent to all of our segments (On-Premise Products, On-Premise Services, Cloud Applications, and Ariba) unless otherwise noted.
SAP AG is the parent company of the SAP Group. Consequently, the risks described below also apply – directly or indirectly – to SAP AG.
Economic, Political, Social, and Regulatory Risk
Uncertainty in the global economy, financial markets, or political conditions could have a negative impact on our business, financial position, profit, and cash flows, and put pressure on our operating profit.
Our business is influenced by multiple risk factors that are both difficult to predict and beyond our influence and control. These factors include global economic and business conditions and fluctuations in national currencies. Other examples are political developments and general regulations, as well as budgetary constraints or shifts in spending priorities of national governments.
Macroeconomic developments, such as a global economic crisis, chronic fiscal imbalances and slowing economic conditions in emerging markets, might decrease the ability of our customers to invest in our solutions. In addition, changes in the euro rates for particular currencies might have an adverse effect on business activities with local customers and partners. All of this could have an adverse effect on our business results, financial condition, profitability or expected growth, and could have an adverse effect on our stock price. Furthermore, political instabilities in regions such as the Middle East and Africa, and natural disasters, contribute to economic and political uncertainty that could also have an adverse effect on our business results, financial condition, profitability, and expected growth.
This could have an adverse effect on our customers’ ability and willingness to make investments in our products and services. These events could reduce the demand for SAP software and services, and lead to:
| ¡ | | Delays in purchases, decreased deal size, or cancelations of proposed investments |
126 Combined Management Report
| ¡ | | Higher credit barriers for customers, reducing their ability to finance software purchases |
| ¡ | | Increased number of bankruptcies among customers, business partners, and key suppliers |
| ¡ | | Increased default risk, which may lead to significant impairment charges in the future |
| ¡ | | Market disruption from aggressive competitive behavior, acquisitions, or business practices |
| ¡ | | Increased price competition and demand for cheaper product and services |
This could have an adverse effect on our business, financial position, profit, and cash flows.
SAP has established measures and dedicated task forces to address and mitigate the described risks and adverse effects to the extent possible. We offer our customers standard software and product packages that are fast and easy to install, as well as attractive financing models. Furthermore, we continue to apply cost discipline internally and have a conservative financial planning policy. Additionally, SAP is continuously reshaping our organizational structure and processes to increase efficiency.
We estimate the probability of occurrence of this risk to be likely. Therefore, we cannot completely exclude the possibility of it having a business-critical impact on our business, financial position, profit, and cash flows. This could exacerbate the other risks we describe in this report or cause a negative deviation from our revenue and operating profit target. We classify this risk as a high risk.
Our international business activities expose us to numerous and sometimes even conflicting regulatory requirements, and to risks that could harm our business, financial position, profit, and cash flows.
We are a global company and currently market our products and services in more than 180 countries and territories in the Americas (including Latin America and North America), APJ, and EMEA regions. Our business in these countries is subject to numerous risks inherent in international business operations. Among others, these risks include:
| ¡ | | Conflict and overlap among tax regimes |
| ¡ | | Possible tax constraints impeding business operations in certain countries |
| ¡ | | Expenses associated with the localization of our products and compliance with local regulatory requirements |
| ¡ | | Discriminatory or conflicting fiscal policies |
| ¡ | | Operational difficulties in countries with a high corruption perception index |
| ¡ | | Protectionist trade policies and regulations for import and export |
| ¡ | | Works councils, labor unions, and immigration laws in different countries |
| ¡ | | Data protection and privacy in regard to access by government authorities to customer, partner, or employee data |
| ¡ | | Difficulties enforcing intellectual property and contractual rights in certain jurisdictions |
| ¡ | | Country-specific software certification requirements |
As we expand further into new countries and markets, these risks could intensify. The compliance with applicable laws and regulations to our business is sometimes unclear, subject to change over time, and sometimes may conflict between different jurisdictions. Additionally these laws and governments’ approach to enforcement, as well as our products and services, are continuing to change and evolve. Compliance with these types of regulation may involve significant costs or require changes in products or business practices. Non-compliance could result in penalties being imposed on us or orders that we stop the alleged noncompliant activity. One or more of these factors could have an adverse effect on our operations globally or in one or more countries or regions, which could have an adverse effect on our business, financial position, profit, and cash flows.
Risk Report 127
We address these risks with various measures depending on the circumstances, including, for example, a strong legal and compliance office presence in the main countries, maintaining an effective Data Protection and Privacy Office and associated policy, receiving guidance from external economics consultants, law firms, tax advisors, and authorities in the concerned countries, and taking legal actions.
Although we estimate the probability of occurrence of this risk to be unlikely, we cannot completely exclude the possibility that this risk could have a major impact on our business, financial position, profit, and cash flows, or cause a negative deviation from our revenue and operating profit target. We classify this risk as a medium risk.
Social and political instability caused by state-based conflicts, terrorist attacks, civil unrest, war, or international hostilities, as well as pandemic disease outbreaks or natural disasters, may disrupt SAP’s business operations.
Terrorist attacks and other acts of violence or war, civil and political unrest (such as in the Middle East and parts of Africa), or natural disasters (such as hurricanes, flooding, or similar events) could have a significant adverse effect on the related economy or beyond. Such an event could lead, for example, to the loss of a significant number of our employees, or to the disruption or disablement of operations at our locations, and could affect our ability to provide business services and maintain effective business operations. Furthermore, this could have a significant adverse effect on our partners as well as our customers and their investment decisions, which could have an adverse effect on our reputation, business, financial position, profit, and cash flows.
Our mitigation measures have been designed and implemented to minimize such adverse effects. To ensure continuous operations of all critical business processes, we have been implementing and operating a worldwide business continuity management and crisis management system. To enable effective response and minimize possible losses in case of crisis situations, we have installed local crisis management teams at our main locations, supplemented by regional crisis management teams for the Americas (including Latin America and North America), APJ, and EMEA regions, and a global crisis management team.
To protect our key IT infrastructure, critical business systems, and processes from material adverse effects in crisis situations, disaster recovery and business continuity plans have been developed that include implementation of data redundancies and daily data backup strategies. To verify and improve our approach, our Global IT organization has been certified to the internationally recognized ISO 22301:2013 (Business Continuity Management) standard. In addition, our corporate headquarters, which includes certain critical business functions, is located in the German state of Baden-Wuerttemberg. This area has historically been free of natural disasters.
We believe that the likelihood of this risk materializing is remote; however, we cannot exclude the possibility of such a risk occurring and having a business-critical impact on our reputation, business, financial position, profit, and cash flows, or causing a negative deviation from our revenue and operating profit target. We classify this risk as a medium risk.
Market Risks
Our established customers might not buy additional software solutions, renew maintenance agreements, purchase additional professional services, or they might switch to other products or service offerings (including competitive products).
In 2013, we offered a wide range of support services including SAP MaxAttention, SAP Enterprise Support, and SAP Product Support for Large Enterprises. We continue to depend materially on the success of our support portfolio and on our ability to deliverhigh-quality services. Traditionally, our large installed customer base generates additional new software, maintenance, consulting, and training revenue. Existing customers might cancel or not renew their maintenance contracts, decide not to
128 Combined Management Report
buy additional products and services, switch to subscription models, or accept alternative offerings from other vendors, which could have an adverse effect on our maintenance business, financial position, profit, and cash flows.
Working closely with SAP user groups, we continuously monitor the performance and the perceived value of our support and the satisfaction of our customers. We implement mitigating steps where required.
We estimate the probability of this risk materializing to be remote, but we cannot completely exclude the possibility that it could have a business-critical impact on our business, financial position, profit, and cash flows, or cause a negative deviation from our revenue and operating profit target. Overall, we classify this risk as medium risk. This risk factor relates only to our On-Premise Product and On-Premise Services segments.
The success of our cloud computing strategy depends on an increasing market adoption of the cloud solutions and managed cloud services. Insufficient adoption of our solutions and services could lead to a loss of SAP’s position as a leading cloud company.
The market for cloud computing is increasing and shows strong growth relative to the market for our on-premise solutions. To offer a broad cloud service portfolio and generate the associated business value for our customers, we have acquired cloud computing companies such as SuccessFactors and Ariba. Due to ongoing contracts and previous substantial investments to integrate traditional on-premise enterprise software into their businesses, customers and partners might be reluctant or unwilling to migrate to the cloud.
Other factors that could affect the market acceptance of cloud solutions include:
| ¡ | | Concerns with entrusting a third party to store and manage critical employee or company confidential data |
| ¡ | | Customer concerns about security capabilities and reliability |
| ¡ | | Customer concerns about the ability to scale operations for large enterprise customers |
| ¡ | | The level of configurability or customizability of the software |
| ¡ | | Missing integration scenarios between on-premise products and cloud-to-cloud solutions |
If organizations do not perceive the benefits of cloud computing, the market for cloud business might not develop further, or it may develop more slowly than we expect, either of which could have an adverse effect on our business, financial position, profit, reputation and cash flows.
Among measures to communicate and demonstrate the value and the benefits of our cloud solutions to the market, we significantly invest in infrastructure and processes that ensure secure operations of our cloud solutions including compliance with all local legal regulations regarding data protection and privacy as well as data security.
Although we estimate the probability of occurrence of this risk to be unlikely, we cannot completely exclude the possibility that this risk could have a business-critical impact on our reputation, business, financial position, profit, and cash flows, or cause a negative deviation from our revenue and operating profit target. We classify the risk as a medium risk. This risk factor relates only to the Cloud Applications and Ariba segments.
Risk Report 129
Our market share and profit could decline due to increased competition, market consolidation and technological innovation, and new business models in the software industry.
The software industry continues to evolve rapidly and is currently undergoing a significant shift due to innovations in the areas of mobile, Big Data, cloud computing, and social media. While smaller innovative companies tend to create new markets continuously, large traditional IT vendors tend to enter such markets mostly through acquisitions.
SAP faces increased competition in its business environment from traditional as well as new competitors. This could result in increased price pressure, cost increases, and loss of market share, which could have an adverse effect on our business, financial position, profit, and cash flows. Additionally customers could change their buying behavior by accelerating their acceptance of cloud solutions to reduce their investments. Furthermore, the trend in the market to invest more in cloud solutions might lead to a risk related to the potential loss of existing on-premise customers. It may also have a temporary adverse effect on our revenue due to conversions from on-premise licenses to cloud subscriptions from existing SAP customers in our installed base.
We believe we will be able to protect our leadership in the market if we continue to execute successfully on our customer-centric innovation strategy, which is driven by a mix of organic growth, targeted acquisitions, and attractive cloud solution offerings. To compete successfully in the market, we continuously enhance our global processes and adjust our organizational structures.
Although we estimate the probability of occurrence of this risk to be unlikely, we cannot completely exclude the possibility that this risk could have a moderate impact on our business, financial position, profit, and cash flows, or cause a negative deviation from our revenue and operating profit target. We classify this risk as a low risk.
Business Strategy Risks
Demand for our new solutions may not develop as planned and our strategy on new business models and flexible consumption models may not be successful.
Our software business consists of new software licenses, software license updates, and support and maintenance fees, as well as of cloud software subscriptions. Our customers are looking to take advantage of technological breakthroughs from SAP without compromising their previous IT investments. However, the introduction of new SAP solutions, technologies, and business models are subject to uncertainties as to whether customers will be able to realize the expected benefits. Uncertainty may lead customers to wait for reference customers first, which might result in a lower level of adoption of our new solutions, technologies, business models and flexible consumption models, or no adoption at all. This could have an adverse effect on our business, financial position, profit, and cash flows.
To mitigate this risk, SAP is balancing the distribution of its strategic investments by evolving and protecting its core businesses and simultaneously developing new solutions, technologies, and business models for markets, such as mobile, cloud, database and technology, and social media. Furthermore, we focus on the design and provision of attractive solution offers to our customers as well as the provision of support excellence to ensure customer satisfaction with and after the implementation of our solution.
130 Combined Management Report
We estimate the probability of occurrence of this risk to be remote, but cannot completely exclude the possibility that this risk could have a major impact on our business, financial position, profit, and cash flows, or cause a negative deviation from our revenue and operating profit target. We classify this risk as a low risk.
Our Cloud organization recognizes subscription and support revenue from our customers over the term of their agreements, and our business depends substantially on customers renewing their agreements and purchasing additional modules or user licenses from SAP as a cloud provider. Also, any downturns or upturns in cloud sales may not be immediately reflected in our operating results, and any decline in our customer renewals would harm the future operating results of the cloud business.
We recognize cloud subscription and support revenue over the duration of our cloud business customer agreements, which typically range from one to three years with some up to five years. As a result, most of the respective revenue recognized in a given period originates from agreements entered into in earlier periods. Consequently, a shortfall in demand for our cloud portfolio in any period may not significantly impact our cloud subscription and support revenue for that quarter, but could have an adverse effect on targeted cloud subscription and support revenue in future periods.
To maintain or improve our operating results in the cloud business, it is important that our customers renew their agreements with us when the initial contract term expires and purchase additional modules or additional users. Our customers have no obligation to renew their subscriptions after the initial subscription period, and we cannot assure that customers will renew subscriptions at the same or at a higher level of service, or at all.
Our customers’ renewal rates may decline or fluctuate as a result of a number of factors, including their satisfaction or dissatisfaction with our cloud product portfolio, our customer support, concerns on efficient and secure cloud operations and in compliance with legal and regulatory requirements, our pricing, the prices of competing products or services, mergers and acquisitions affecting our customer base, the effects of global economic conditions, or reductions in our customers’ spending levels. If our customers do not renew their subscriptions, renew on less favorable terms, or fail to purchase additional modules or users, our revenue and billings may decline, and we may not realize significantly improved operating results from our customer base. This could have an adverse effect on our business, financial position, profit, and cash flows.
In order to continuously improve our services we closely monitor any issue and work together with customers to perform a root cause analysis and provide a solution. Furthermore, we are adapting cloud service delivery to local and/or specific market requirements such as local or regional data centers.
Although we estimate the probability of occurrence of this risk to be remote, we cannot completely exclude the possibility that this risk could have a major impact on our business, financial position, profit, and cash flows, or cause a negative deviation from our revenue and operating profit target. We classify this risk as a low risk. This risk factor relates only to our Cloud Applications and Ariba segments.
If we are unable to scale and enhance an effective partner ecosystem, increased revenue already included in our forecast might be endangered.
An open and vibrant partner ecosystem is a fundamental pillar of our success and growth strategy. We have entered into partnership agreements that drive co-innovation on our platforms, profitably expand all our routes-to-market to optimize market coverage, and provide high-quality services capacity in all market segments. Partners play a key role in driving market adoption of our entire solutions portfolio, by co-innovating on our platforms, embedding our technology, and reselling and/or implementing our software.
Risk Report 131
If partners consider our products less strategic and/or financially less attractive or if SAP fails to establish a network of qualified partners that meet our quality requirements and the requirements of our customers, then, among other things, partners might not:
| ¡ | | Develop a sufficient number of new solutions and content on our platforms |
| ¡ | | Provide high-quality products and services to our customers |
| ¡ | | Drive growth of references by creating customer use cases and demo systems |
| ¡ | | Sufficiently embed our solutions to profitably drive product adoption, especially with new innovations like SAP HANA |
| ¡ | | Enable and train sufficient resources to promote sell and support to scale into targeted markets |
| ¡ | | Comply with applicable laws and regulations, resulting in delayed, disrupted, or terminated sales and services |
| ¡ | | Renew their existing agreements with us or enter into new agreements on terms acceptable to us or at all. |
If one or more of these risks materialize, this may have an adverse effect on the demand for our products and services. As a result we may not be able to scale our business to compete successfully with other software vendors, which could have an adverse effect on our reputation, business, financial position, profit, and cash flows.
SAP continues to invest in long-term, mutually beneficial relationships and agreements with partners. We continue to develop and enhance a wide range of partner programs to retain existing and attract new partners of all types. We offer training opportunities to a wide range of resources for our partners. A thorough certification process for third-party solutions has been designed and established to ensure consistent high-quality and seamless integration.
Although we consider this risk to be unlikely in view of our partner strategy, we cannot exclude the possibility that this risk could have a major impact on our reputation, business, financial position, profit, and cash flows, or cause a negative deviation from our revenue and operating profit target if it were to materialize. We classify this risk as a medium risk.
Human Capital Risks
If we do not effectively manage our geographically dispersed workforce, we may not be able to run our business efficiently and successfully.
Our success is dependent on appropriate alignment of our internal and external workforce planning processes and our location strategy with our general strategy. It is critical that we manage our internationally dispersed workforce effectively, taking short and long-term workforce and skill requirements into consideration. This applies to the management of our internal as well as our external workforce. Changes in headcount and infrastructure needs could result in a mismatch between our expenses and revenue. Failure to manage our geographically dispersed workforce effectively could hinder our ability to run our business efficiently and successfully and could have an adverse effect on our business, financial position, profit, and cash flows.
132 Combined Management Report
We are focusing on mitigating this risk through a range of activities including succession management; workforce planning (which aims to achieve diversity and the right mix of talent and to take account of demographic changes); outsourcing; external short-term staffing; employer branding; career management (such as offering opportunities for short-term assignments and opportunities to improve skills, competencies, and qualifications); and extended benefit programs – for example, a performance-oriented remuneration system, an employer-financed pension plan in certain countries, and long-term incentive plans.
We estimate this risk to be a remote possibility, but we cannot underestimate its potential to have a major impact on our business, financial position, profit, and cash flows, or cause a negative deviation from our revenue and operating profit target. We classify this risk as a low risk.
If we are unable to attract, develop, and retain leaders and employees with specialized knowledge and technology skills, or are unable to achieve internal diversity and inclusion objectives, we might not be able to manage our operations effectively and successfully, or develop successful new solutions and services.
Our highly qualified workforce is the foundation for our continued success. Competition in our industry for highly skilled and specialized personnel and leaders, both male and female, is intense. In certain regions and specific technology and solution areas, we have set ambitious growth targets, specifically in countries such as Brazil, China, and Russia. If we are unable to identify, attract, develop, motivate, adequately compensate, and retain well-qualified personnel, both male and female, or if existing highly skilled and specialized personnel leave SAP and ready successors or adequate replacements are not available, we may not be able to manage our operations effectively, which could have an adverse effect on our reputation and our business, financial position, profit, and cash flows. Furthermore, we may not be able to develop, sell, or implement successful new solutions and services as planned. This is particularly true as we continue to introduce new and innovative technology offerings and expand our business in emerging markets. Missing or inadequately executed benefit and compensation programs could limit SAP’s ability to attract or retain qualified employees and lead to financial losses. In addition, we might not be able to achieve our internal gender diversity objectives to increase the number of women in management from 18% in 2010 to 25% by 2017. Finally, hiring such personnel could expose us to claims by other companies seeking to prevent their employees from working for a competitor.
These risks notwithstanding, we continue to believe our leading market position, employer brand, and extended benefit programs will enable us to hire top talent internationally with the potential to contribute to SAP’s growing business success in the future. We address the risk of an adverse effect on our business operations from a failure to recruit the employees we need or from the loss of leaders and employees by seeking to build employee and leadership strengths through a range of targeted professional development, mentoring, and coaching programs, a gender diversity program, and a special focus on accelerated high-potential employee development that aims to develop talent as well as leadership talent, in particular. A strong focus on succession planning for leadership and key positions seeks for sustainable leadership and to safeguard the business from disruption caused by staff turnover.
Although the risks related to failure to attract, develop, and retain talent could materialize, we believe that this is unlikely and that the impact on our reputation, business, financial position, profit, and cash flows, or potential negative deviation from our revenue and operating profit target would be moderate. We classify this risk as a low risk.
Risk Report 133
Organizational and Governance-Related Risks
Laws and regulatory requirements in Germany, the United States, and elsewhere have become much more stringent.
As a stock corporation domiciled in Germany with securities listed in Germany and the United States, we are subject to German, U.S., and other governance-related regulatory requirements. Changes in laws and regulations and related interpretations, including changes in accounting standards and taxation requirements and increased enforcement actions and penalties may alter the business environment in which we operate. Regulatory requirements have become significantly more stringent in recent years, and some legislation, such as the anticorruption legislation in Germany, the U.S. Foreign Corrupt Practices Act, the UK Bribery Act, and other local laws prohibiting corrupt payments by employees, vendors, distributors, or agents, is being applied more rigorously. Emerging markets are a significant focus of our international growth strategy. The nature of these markets presents a number of inherent risks. A failure by us to comply with applicable laws and regulations, or any related allegations of wrongdoing against us, whether merited or not, could have an adverse effect on our business, financial position, profit, cash flows and reputation.
It is difficult to assess the precise potential risk, because there is a wide variety of complex legal and regulatory requirements that apply, and therefore an equally wide variety of potential non-compliance scenarios exist.
However, we continuously monitor new regulatory requirements, updated or new enforcement trends, and publicly available information on compliance issues in the computer software industry, the emerging markets where we invest our resources, and in the business environment in general. Based on this information and any other available sources, we continuously update and refresh our compliance programs to achieve the most effective approach possible and to ensure that our employees understand and comply with the SAP Code of Business Conduct. This process is coordinated by our Global Compliance Office, a team of dedicated resources that are tasked with managing our policy-related compliance measures. Our chief compliance officer coordinates policy implementation, training, and enforcement efforts throughout SAP. Those efforts are monitored and tracked to allow trending and risk analysis and to ensure consistent policy application throughout the Group. Despite our comprehensive compliance programs and established internal controls, intentional efforts of individuals to circumvent controls or engage in fraud for personal gains cannot always be prevented.
Although we estimate the likelihood of this risk to be remote, we cannot completely exclude the possibility that this risk could have a major impact on our reputation, business, financial position, profit, and cash flows, or cause a negative deviation from our revenue and operating profit target. We classify this risk as a low risk.
Non-compliance with applicable data protection and privacy laws or failure to adequately meet the requirements of SAP’s customers with respect to our products and services could lead to civil liabilities and fines, as well as loss of customers and damage to SAP’s reputation.
As a global software and service provider, SAP is required to comply with the laws in the locations where SAP does business. SAP and its subsidiaries are facing a surge of data protection and privacy laws and regulations around the world, with further changes to be expected in the future, for example, by the European Data Protection Regulation proposed by the European Commission. These laws and regulations amend and supplement existing requirements regarding the processing of personal data that SAP and SAP customers must fulfill and which we must consequently address with our products and services.
134 Combined Management Report
Failure to comply with applicable laws or to adequately address privacy concerns of customers, even if unfounded, could lead to investigations by supervisory authorities, civil liability, fines, (in the future, potentially calculated based on the Company’s annual turnover), loss of customers, damage to our reputation, and could have an adverse effect on our business, financial position, profit, and cash flows.
To mitigate these risks, SAP actively monitors changes to laws and regulations so we can take adequate measures and certify our existing standards and policies on an ongoing basis. We have implemented a wide range of measures to protect data controlled by SAP and our customers from unauthorized access and processing, as well as from accidental loss or destruction. We have implemented a certified Data Protection Management System in data protection critical areas including support, HR, global services, marketing, application innovation, and custom development, whereby implementation is audited internally and externally by the British Standard Institutions on an annual basis. Furthermore, customers are provided with security certifications (such as ISO 27001), security white papers, and reports from our independent auditors and certification bodies.
We estimate this risk to be unlikely, but cannot rule out the possibility of it having a business-critical impact on our business, financial position, profit, and cash flows, causing damage to our reputation, or causing a negative deviation from our revenue and operating profit target. We classify this risk as a medium risk.
Failure to respond to meet customer, partner, or other stakeholder expectations or generally accepted standards on climate change, energy constraints, and our social investment strategy could negatively impact SAP’s business, results of operations, and reputation.
Energy and emissions management are an integral component of our holistic management of social, environmental, and economic risks and opportunities. We have identified risks in these major areas:
| ¡ | | Our solutions and green IT |
| ¡ | | Our own operations – energy management and other environmental issues such as carbon management, water use, and waste |
Because our customers, employees, and investors expect a reliable energy and carbon strategy, we have reemphasized our previously communicated targets, especially our 2020 target for greenhouse gas emissions. In addition, our customers might no longer recognize SAP for its environmental leadership and might buy other vendors’ products and services. Consequently, we could fail to achieve our revenue target. If we do not meet stakeholder expectations in the areas identified, our rating in sustainable investment indices might decrease, which could have an adverse effect on our reputation, business, financial position, profit, and cash flows.
In recent years, SAP has shown that it is possible to take a proactive position on social and environmental issues while delivering robust financial growth. As a result, we received great recognition for our sustainability efforts. As a proof point for SAP’s sustainability performance, we continue to be listed in the most prominent and recognized sustainability indices, such as the Dow Jones Sustainability Indexes and the Sustainability Leadership Report by Brandlogic. As we did not meet our greenhouse gas emissions target of 460 kilotons for 2013, we might fail to meet expectations regarding our energy and emission performance.
Risk Report 135
However, we believe that the risk of failing to meet expectations regarding our energy and emission strategy is unlikely to occur and that if the risk were to occur, it would only have a moderate impact on our reputation, business, financial position, profit, and cash flows, as well as on the achievement of our revenue and operating profit target. We classify this risk as a low risk.
Unethical behavior and non-compliance with our integrity standards due to intentional and fraudulent behavior of employees could harm our business, financial position, profit, and reputation.
SAP’s leadership position in the global market is founded on the long-term and sustainable trust of our stakeholders worldwide. Our heritage is one of corporate transparency, open communication with financial markets, and adherence to recognized standards of business integrity. The SAP Code of Business Conduct, adopted by the Executive Board on January 29, 2003, put into words the already existing guidelines and expectations for the business behavior practiced at SAP. However, we may encounter unethical behavior and non-compliance with our integrity standards due to intentional and fraudulent behavior of individual employees, possibly in collusion with external third parties. In addition to intentional behavior, problems could also arise due to negligence in the adherence to rules and regulations. Unethical behavior and misconduct attributable to SAP could not only lead to criminal charges, fines and claims by injured parties, but also to financial loss, and severe reputational damage. This could have an adverse effect on our business, financial position, profit, and cash flows.
To help prevent this, we instituted a comprehensive compliance management system (CMS), which is based on the three pillars of prevention, detection, and reaction. Our CMS program comprises several educational, counseling, control, and investigative instruments. The objective is to minimize and mitigate the risk of unethical behavior, whether intentional or negligent. The SAP Code of Business Conduct is mandatory and applies to every employee. It provides legal compliance guidance on how to avoid unethical behavior and solve dilemma situations. On a yearly basis, the SAP Code of Business Conduct is re-confirmed by SAP’s workforce (except where disallowed by local legal regulations). We also rolled out and enforce various additional compliance policies aimed at managing third parties and preventing misuse of third-party payments for illegal purposes; ensuring controls around travel, entertainment, gift, and expense policies; and pushing out a commitment to business with integrity through our partner and vendor ecosystems. These efforts are flanked by continuous education including e-learning and classroom training to target audiences as identified by compliance risk assessment. The overall CMS approach by SAP is continuously monitored internally and externally, and adapted accordingly, if needed.
Although we estimate the probability of occurrence of intentional or negligent major unethical conduct to be remote, we cannot exclude the possibility that this risk could materialize. In that event, this risk could have a major impact on our reputation, business, financial position, profit, and cash flows and could cause a negative deviation from our operating profit target. We classify this risk as a low risk.
Communication and Information Risks
Our controls and efforts to prevent the unauthorized disclosure of confidential information might not always be effective.
Confidential or strictly confidential information that is related to topics such as our strategy, new technologies, mergers and acquisitions, unpublished financial results, or personal data, could be prematurely or inadvertently disclosed. This could require us to notify multiple regulatory agencies and, where
136 Combined Management Report
appropriate, the data owner, which could result in a loss of reputation for SAP. For example, leaked information during a merger or acquisition deal could cause the loss of our deal target, or our share price could decline in case of prematurely published financial results. This could have an adverse effect on our market position and lead to fines and penalties. In addition, this could have an adverse effect on our business, financial position, profit, and cash flows.
We take a wide range of actions to prevent classified confidential information from unauthorized disclosure, including procedural and organizational measures. These measures include mandatory security awareness training for all employees, standards for safe internal and external communication, and technical security features in our IT hardware and communication channels, such as mandatory encryption of sensitive data.
Although we estimate the likelihood of occurrence of this risk to be remote, we cannot completely exclude the possibility that this risk could have a business-critical impact on our reputation, business, financial position, profit, and cash flows, or cause a negative deviation from our operating profit target. We classify this risk as a medium risk.
Financial Risks
Our sales are subject to quarterly fluctuations and our sales forecasts may not be accurate.
Our revenue and operating results can vary and have varied in the past, sometimes substantially, from quarter to quarter. Our revenue in general, and in particular our software revenue, is difficult to forecast for a number of reasons, including:
| ¡ | | The relatively long sales cycles for our products |
| ¡ | | The large size, complexity, and extended timing of individual license transactions |
| ¡ | | The introduction of new licensing and deployment models such as cloud subscription models |
| ¡ | | The timing of the introduction of new products or product enhancements by SAP or our competitors |
| ¡ | | Changes in customer budgets |
| ¡ | | Decreased software sales that could have an adverse effect on related maintenance and services revenue |
| ¡ | | The timing, size, and length of a customer’s services projects |
| ¡ | | Deployment models that require the recognition of revenue over an extended period of time |
| ¡ | | Seasonality of a customer’s technology purchases |
| ¡ | | Limited visibility into the ability of acquired companies to accurately predict their sales pipelines and the likelihood that the projected pipeline will convert favorably into sales |
| ¡ | | Other general economic, social, environmental, and market conditions, such as the global economic crisis and the current difficulties for countries with large debt |
Since many of our customers make their IT purchasing decisions near the end of calendar quarters, and with a significant percentage of those decisions being made during our fourth quarter, even a small delay in purchasing decisions for our on-premise software could have an adverse effect on our revenue results for a given year. Our dependence on large transactions has decreased in recent years with a trend towards an increased number of transactions coupled with a decrease in deal size. However, the loss or delay of one or a few large opportunities, which are still characteristic of the large enterprise segment, could have an adverse effect on our business, financial position, profit, and cash flows.
We use a “pipeline” system to forecast sales and trends in our business. Pipeline analysis informs and guides our business planning, budgeting, and forecasting, but pipeline estimates do not necessarily consistently correlate to revenue in a particular quarter, potentially due to one or more of the reasons outlined above. The reliability of our plans, budgets, and forecasts may therefore be compromised. Because our operating expenses are based upon anticipated revenue levels and a high percentage of our expenses are relatively fixed in the near term, any
Risk Report 137
shortfall in anticipated revenue or delay in revenue recognition could result in significant variations in our operating results from quarter to quarter or year to year. Continued deterioration in global economic conditions would make it increasingly difficult for us to accurately forecast demand for our products and services, and could cause our revenue, operating results, and cash flows to fall short of our expectations and public forecasts. This could have an adverse effect on our stock price. To the extent any future expenditure fails to generate the anticipated increase in revenue, our quarterly or annual operating results may be subject to an adverse effect and may vary significantly compared to preceding or subsequent periods.
Although we estimate the probability of occurrence of this risk to be unlikely, we cannot completely exclude the possibility that this risk could have a moderate impact on our business, financial position, profit, and cash flows, or cause a negative deviation from our revenue and operating profit target. We classify this risk as a low risk.
External factors could impact our liquidity and increase the default risk associated with, and the valuation of, our financial assets.
Macroeconomic factors such as an economic downturn could have an adverse effect on our future liquidity. We use a globally centralized financial management to control financial risk, such as liquidity, exchange rate, interest rate, counterparty, and equity price risks. The primary aim is to maintain liquidity in the Group at a level that is adequate to meet our obligations at any time. Our total group liquidity was €2,841 million on December 31, 2013. This position is supported by our strong operating cash flows, of which a large part is recurring, and by credit facilities on which we can draw if necessary. However, adverse macroeconomic factors could increase the default risk associated with our total group liquidity. This could have an impact on the valuation of our financial assets, which could have an adverse effect on our business, financial position, profit, and cash flows.
SAP’s investment policy with regard to total group liquidity is set out in our internal treasury guideline document, which is a collection of uniform rules that apply globally to all companies in the Group. Among its stipulations, it requires that with limited exceptions we invest only in assets and funds rated BBB flat or better. The weighted average rating of the investments of our total group liquidity is in the range A to A-. We continue to pursue a policy of cautious investment characterized by wide portfolio diversification with a variety of counterparties, predominantly short-term investments, and standard investment instruments.
Although we estimate the probability of occurrence of this risk to be remote, there can be no assurance that the prescribed measures will be successful or that uncertainty in global economic conditions could not have a business-critical impact on our business, financial position, profit, cash flows or operating profit target. We classify this risk as a medium risk.
Management’s use of estimates could negatively affect our business, financial position, profit, and cash flows.
To comply with IFRS, management is required to make many judgments, estimates, and assumptions that affect the reported financial figures. The facts and circumstances as well as assumptions on which management bases these estimates and judgments, and management’s judgment regarding the facts and circumstances may change from time to time and this could result in significant changes in the estimates and judgments and consequently in the reported financials. Such changes could have an adverse effect on our business, financial position, profit and cash flows.
We have a number of control procedures in place to make sure that our estimates and judgments are appropriate. For example, we apply two-person verification to significant estimating.
138 Combined Management Report
Although we estimate the probability of occurrence of the risk to be unlikely, we cannot completely exclude the possibility of a major impact on our business, financial position, profit, and cash flows, or a negative deviation from our revenue and operating profit target. We classify this risk as a medium risk.
Current and future accounting pronouncements and other financial reporting standards, especially but not only concerning revenue recognition, may negatively impact the financial results we present.
We regularly monitor our compliance with applicable financial reporting standards and review new pronouncements and drafts thereof that are relevant to us. As a result of new standards, changes to existing standards, and changes in their interpretation, we might be required to change our accounting policies, particularly concerning revenue recognition, to alter our operational policies so that they reflect new or amended financial reporting standards, or to restate our published financial statements. Such changes may have an adverse effect on our reputation, business, financial position, and profit, or cause an adverse deviation from our revenue and operating profit target.
Although we estimate the probability of occurrence of the risk to be unlikely, we cannot completely exclude the possibility of a major impact. We classify this risk as a medium risk.
Because we conduct operations throughout the world, our business, financial position, profit, and cash flows may be affected by currency and interest rate fluctuations.
Our Group-wide management reporting and our external financial reporting are both in euros. Nevertheless, a significant portion of our business is conducted in currencies other than the euro. Approximately 71% of our revenue in 2013 was attributable to operations outside the euro area and was translated into euros. Consequently, period-over-period changes in the euro rates for particular currencies can significantly affect our reported revenue and income. In general, appreciation of the euro relative to another currency has an adverse effect while depreciation of the euro relative to another currency has a positive effect. Variable interest balance-sheet items are also subject to changes in interest rates. Such changes may have an adverse effect on our business, financial position, profit and cash flows or cause an adverse deviation from our revenue and operating profit target.
For more information about our currency and interest rate risks and our related hedging activity, see the Notes to the Consolidated Financial Statements section, Notes (24) and (25).
We continuously monitor our exposure to currency fluctuation risks based on balance-sheet items and expected cash flows, and pursue a Group-wide foreign exchange risk management strategy using, for example, derivative financial instruments as appropriate. With regard to our financial debt, we have a very balanced maturity profile and mixture of fixed and floating interest rate arrangements in place.
We believe that the likelihood of this risk of significant currency and interest rate fluctuations materializing is remote and that if the risk were to occur, its impact on our business, financial position, profit, and cash flows could be major, or cause a negative deviation from our revenue and operating profit target. We classify this risk as a low risk.
For more information about risks arising from financial instruments, including our currency and interest-rate risks and our related hedging activity, see the Notes to the Consolidated Financial Statements section, Notes (24) to (25).
The cost of using derivative instruments to hedge share-based payments may exceed the benefits of hedging them.
We use derivative instruments to reduce the impact of our share-based payments on our income statement and to limit future expense associated with those plans. We decide case-by-case whether and to what extent we should hedge this risk. The expense of hedging the share-based payments could exceed the benefit achieved by hedging them. On the other hand, a decision to leave the plans materially unhedged could
Risk Report 139
prove disadvantageous. This could have an adverse effect on our business, financial position, profit and cash flows or cause an adverse deviation from our revenue and operating profit target.
We believe that the likelihood of this risk materializing is remote and that if the risk were to occur, its potential impact on our business, financial position, profit, cash flows, and operating profit target would be minor. We classify this risk as a low risk.
Project Risks
Implementation of SAP software often involves a significant commitment of resources by our customers and is subject to a number of significant risks over which we often have no control.
A core element of our business is the successful implementation of software solutions to enable our customers to make their business a best-run business. The implementation of SAP software is led by SAP, by partners, by customers, or by a combination thereof. Depending on various factors, such as the complexity of solutions, the customer’s implementation and integration needs or the resources required, SAP faces a number of different risks. For example, functional requirement changes, delays in timeline, or deviation from recommended best practices may occur during the course of a project. These scenarios have a direct impact on the project resource model and on securing adequate internal personnel or consultants in a timely manner and could therefore prove challenging.
As a result of these and other risks, SAP and/or some of our customers have incurred significant implementation costs in connection with the purchase and installation of SAP software products. Some customers’ implementations have taken longer than planned. We cannot guarantee that we can reduce or eliminate protracted installation or significant third-party consulting costs, that trained consultants will be readily available, that our costs will not exceed the fees agreed in fixed-price contracts, or that customers will be satisfied with the implementation of our software and solutions. Unsuccessful, lengthy, or costly customer implementation and integration projects could result in claims from customers, harm SAP’s reputation, and could have an adverse effect on our business, financial position, profit, and cash flows.
Our customers continue to follow project approaches to optimize their IT solutions in a non-disruptive manner. Our projects also include risk management processes that are integrated into SAP project management methods intended to safeguard implementations with coordinated risk and quality management programs. In our opinion, we make adequate financial planning provisions for the remaining individual risks.
We estimate the probability of occurrence of this risk to be unlikely, but we cannot completely exclude the possibility that this risk could have a major negative impact on our reputation, business, financial position, profit, and cash flows, or cause a negative deviation from our revenue and operating profit target. We classify this risk as a medium risk. This risk factor relates only to our On-Premise Services, Ariba, and Cloud Applications segments.
Product and Technology Risks
There is a risk that undetected security vulnerabilities shipped and deployed within our software products might cause damage to SAP and our customers.
Customer systems or systems operated by SAP itself to provide services could potentially be compromised by vulnerabilities if they are exploited by hackers. This could lead to theft, destruction, or abuse of data, or systems could be rendered unusable (such as denial of service attack). The detection of security vulnerabilities in our software, our customers’ systems, or SAP systems used in the provision of services, especially in case of exploitation, could prevent us from meeting our contractual obligations and subsequently might lead to customer claims and reputational damage, which might have an adverse effect on our business, financial position, profit, and cash flows.
140 Combined Management Report
SAP has implemented a software security development lifecycle as a mandatory integral part of our software development process. We systematically use methods to develop secure software in all development phases starting early in the design phase. This includes industry best practices such as automated security source code scans, mandatory security training for all developers, and solid testing and validation of our products, patches, and services before shipment.
SAP has a software security response process in place to rapidly react to detected vulnerabilities and provide fixes. We have also improved the roll-out procedures for security-relevant notes, patches, and service packs to ensure easy and fast consumption on the customer side.
We cannot completely exclude the possibility of a negative impact on our customers’ or our own operations globally or in one or more countries or regions. We estimate the probability of occurrence of the risk of severe customer and SAP damages to be unlikely. If such an occurrence happens, it could have a business-critical impact on our reputation, business, financial position, profit, and cash flows as well as on the achievement of our revenue and operating profit target. We classify this risk as a medium risk.
Undetected defects in the introduction of new products and product enhancements could increase our costs, and reduce customer demand.
To achieve market acceptance and high customer satisfaction, our new products and product enhancements often require long development and testing periods. Development work and market introduction are subject to risks. For example, products might not completely meet our stringent high-quality standards, including security standards, might not fulfill market needs or customer expectations, or might not comply with local standards and requirements. Furthermore, this risk also exists with respect to acquired companies’ technologies and products where we might not be able to manage these as quickly and successfully as expected. Therefore, market launches, entering new markets, or the introduction of new innovations could be delayed or not be successful.
Also, new products could contain undetected defects or they might not be mature enough from the customer’s point of view for business-critical solutions. The detection and correction of any defects after shipment could be expensive and time consuming and we might not be able to meet the expectations of customers regarding time and quality in the defect resolution process. In some circumstances, we might not be in a position to rectify such defects or entirely meet the expectations of customers, specifically as we are expanding our product portfolio into additional markets. As a result, we might be faced with customer claims for cash refunds, damages, replacement software, or other concessions. The risk of defects and their adverse consequences could increase as we seek to introduce a variety of new software products simultaneously at a higher innovation rate. Significant undetected defects or delays in introducing new products or product enhancements could affect market acceptance of SAP software products and could have an adverse effect on our reputation, business, financial position, profit, and cash flows.
Risk Report 141
The use of existing SAP software products by customers in business-critical solutions and processes and the relative complexity and technical interdependency of our software products create a risk that customers or third parties may pursue warranty, performance, or other claims against us for actual or alleged defects in SAP software products, in our provision of services, or in our application hosting services. We have in the past been, and may in the future be, subject to warranty, performance, or other similar claims.
Although our contracts generally contain provisions designed to limit our exposure due to actual or alleged defects in SAP software products or in our provision of services, these provisions may not cover every eventuality or be effective under the applicable law. Regardless of its merits, any claim could entail substantial expense and require the devotion of significant time and attention by key management personnel. Publicity surrounding such claims could affect our reputation and the demand for our software.
We counter these risks using a broad range of techniques, including project management, project monitoring, product standards and governance, rigid and regular quality assurance measures certified to ISO 9001:2008, and program risk assessments during product development as well as market introduction phases. In addition, direct customer feedback is considered in the market release decision process. Delivering high-quality software products is a priority and part of our core business. Our strong investment and permanent efforts lead to a generally high level of quality of our products, which is made transparent in the defined quality perception and support index and confirmed by our constantly high customer satisfaction ratings as measured by customer quality perception reporting.
We believe that the likelihood that this risk will materialize is remote but we cannot completely exclude the possibility that this risk, if it were to occur, could have a business-critical impact on our reputation, business, financial position, profit, and cash flows, or cause a negative deviation from our revenue and operating profit target. We classify this risk as a medium risk.
Changes in our rights to use software and technologies we license from third parties, which are an integral part of SAP’s products, could slow down time to market and influence our license pricing and therefore the competitiveness with other software vendors. Furthermore, it could diminish our software’s functional capabilities and therefore could jeopardize the stability of our solution portfolio offering.
The numerous third-party technologies we have licensed and certain open source software components we use have become an integral part of our product portfolio. We depend on those technologies for the functionality of our software or cloud services. Changes to, or the loss of, third-party licenses as well as open source licenses being construed could significantly increase the cost of these licenses and significantly reduce software functionality and/or usability of SAP’s software products. As a result, we might incur additional development or license costs to ensure the continued functionality of our products, which could have an adverse effect on our business, financial position, profit, and cash flows. This risk increases with each acquisition of a company or a company’s intellectual property assets that had been subject to third-party technology licensing, open source software, and product standards less rigorous than our own.
We strive to execute appropriate due diligence and contract management processes and to continuously monitor development projects through our product implementation lifecycle process.
142 Combined Management Report
We believe that the probability of occurrence of this risk is likely and we cannot exclude the possibility of a major impact on our business, financial position, profit, and cash flows, or the possibility of a negative deviation from our revenue and operating profit target. We classify this risk as a medium risk.
If we are unable to keep up with rapid technological innovations, new business models, and changing market expectations, we might not be able to compete effectively.
Our future success depends upon our ability to keep pace with technological and process innovations and new business models, as well as our ability to develop new products and services, enhance and expand our existing products and services portfolio, and integrate products and services we obtain through acquisitions. To be successful, we are required to shift our products and our go-to-market approach to a cloud-based delivery model to satisfy changing customer demand.
We might not be successful in bringing new solutions, solution enhancements, and/or services to market before our competitors. We may also face increasing competition from open source software initiatives in which competitors may provide software and intellectual property free and/or under terms and conditions unfavorable for SAP. In addition, we might not be able to generate enough revenue to offset the significant research and development costs we incur to deliver technological innovations. Moreover, we might not anticipate and develop technological improvements or succeed in adapting our products and processes to technological change, changing regulatory requirements, emerging industry standards, and changing requirements of our customers and partners. Finally, we might not succeed in producing high-quality products, enhancements, and releases in a timely and cost-effective manner to compete with products, solutions, and other technologies offered by our competitors, which could have an adverse effect on our reputation, business, financial position, profit, and cash flows.
We will continue to align our organization, processes, products, delivery model, and services to changing markets and customer and partner demands. We invent new technology or adopt the latest technology if there is a clear business opportunity for SAP and if it provides value to our customers. To ensure that we remain competitive in the future, we still conduct wide-ranging market and technology analyses and research projects, often in close cooperation with our customers and partners. We strive for strategic acquisitions with the potential to drive innovation and contribute to achieving our growth target.
We believe that the likelihood of this risk materializing is remote; however, we cannot exclude the business-critical impact this risk would have on our reputation, business, financial position, profit, and cash flows, or the potential negative deviation from our revenue and operating profit target if it were to materialize. We classify this risk as a medium risk.
Our technology and/or product strategy may not be successful or our customers and partners might not adopt our technology platforms and other innovations accordingly.
We offer customers a broad portfolio of products, solutions, and services. Our technology strategy centers on SAP HANA as the real-time in-memory computing platform for analytics and applications. The success of our technology strategy depends on the convergence of SAP HANA with our mobile, cloud, and SAP NetWeaver technology platform. It also depends on the delivery of SAP solutions based on the SAP HANA platform as well as the success of our new framework to meet changing customer expectations regarding end-to-end user experience. Our technology strategy also relies on our ability to maintain a dynamic network of partner organizations developing their own business applications using our technology platforms.
Risk Report 143
We might not be successful in integrating our platforms, enabling the complete product portfolio, harmonizing our user interface design and technology, or bringing new solutions based on the SAP HANA platform to the market as fast as expected. In addition, we may not be able to compete effectively in the area of managed cloud services. As a result, our partner organizations and customers might not adopt the SAP HANA platform and our managed cloud services quickly enough or they might consider competitive solutions. As a result, this could have an adverse effect on our reputation, business, financial position, profit, and cash flows.
We believe that we will be able to deliver additional business value with minimum disruption to our customers if we can successfully drive the integration and convergence of our technology platform offerings, enable our current product portfolio for SAP HANA, develop new solutions based on SAP HANA, and offer comprehensive cloud-based services. We enable and encourage partners to leverage SAP technology by providing guidance about business opportunities, architecture, and technology, as well as a comprehensive certification program designed to ensure that third-party solutions are of consistently high quality.
We believe that the likelihood of this risk materializing is remote and that if this risk were to occur, its impact on our reputation, business, financial position, profit, cash flows, and revenue and operating profit target would be business-critical. We classify this risk as a medium risk.
Our cloud offerings might be subject to a security attack, become unavailable, or fail to perform properly.
The software used in our cloud portfolio is inherently complex and any defects in product functionality, system stability, or data center operations that cause interruptions in the availability of our application suite could result in the following:
| ¡ | | Lost or delayed market acceptance and sales |
| ¡ | | Breach of warranty or other contract breach or misrepresentation claims |
| ¡ | | Sales credits or refunds to our customers or partners |
| ¡ | | Loss of customers and/or partners |
| ¡ | | Diversion of development and customer service resources |
| ¡ | | Breach of data protection and privacy laws and regulations |
| ¡ | | Customers considering competitive cloud offerings |
The costs incurred in correcting any defects or errors might be substantial and could have an adverse effect on our reputation, business, financial position, profit, and cash flows. Because of the large amount of data that we collect and manage, it is possible that hardware failures, defects in our software, or errors in our systems could result in data loss or corruption, or cause the information that we collect to be incomplete or contain inaccuracies that our customers regard as significant. Furthermore, the availability of our application suite could be interrupted by a number of factors, including customers’ inability to access the Internet, the failure of our network or software systems due to human or other error, and security breaches, or variability in user traffic for our application suite. Additionally, any loss of the right to use hardware purchased or leased from third parties could result in delays in our ability to provide our application suite until equivalent technology is either developed by us or, if available, identified.
We have administrative, technical, and physical security measures in place as well as contracts that require third-party data centers to have appropriate security and data protection and privacy measures in place. In this context, customers might demand to only use specific and/or local data centers. However, if these security measures are breached as a result of third-party action, employee error and malfeasance, or otherwise, and if as a result someone obtains unauthorized
144 Combined Management Report
access to our customers’ data, which may include personally identifiable information regarding users, our reputation could be damaged, our business may suffer, local data protection and privacy laws or regulations might be breached, and we could incur significant liability.
In addition, our insurance coverage might not cover claims against us for loss or security breach of data or other indirect or consequential damages. Moreover, defending a suit, regardless of its merit, could be costly and time-consuming. In addition to potential liability, if we experience interruptions in the availability of our application suite, our reputation could be harmed and we could lose customers.
Our mitigation measures have been designed and implemented to minimize such adverse effects. We continuously invest in protecting the integrity and security of our products and services as well as internal and external data that is managed within our data centers. We are consolidating and harmonizing our data centers including data protection measures to run a homogeneous landscape that supports the complex infrastructure, application, and security requirements to deliver the required service level for cloud solutions.
Although we estimate the probability of occurrence of this risk to be unlikely, we cannot completely exclude the possibility that any disruption of our cloud operations could result in a business-critical impact on our reputation, business, financial position, profit, cash flows, and revenue and operating profit target. We classify this risk as a medium risk. This risk factor relates only to our Cloud Applications and Ariba segments.
Operational Risks
Third parties have claimed, and might claim in the future, that we infringe their intellectual property rights, which could lead to damages being awarded against us and limit our ability to use certain technologies in the future.
We believe that we will increasingly be subject to intellectual property infringement claims as the number of products in our industry segment grows, as we acquire companies with increased use of third-party code including open source code, as we expand into new industry segments with our products, resulting in greater overlap in the functional scope of products, and as non-practicing entities that do not design, manufacture, or distribute products increasingly assert intellectual property infringement claims.
Any claims, with or without merit, and negotiations or litigation relating to such claims, could preclude us from utilizing certain technologies in our products, be time-consuming, result in costly litigation, and require us to pay damages to third parties, stop selling or reconfigure our products and, under certain circumstances, pay fines and indemnify our customers, which could have an adverse effect on our business, financial profile, profit, cash flows, and reputation. They could also require us to enter into royalty and licensing arrangements on terms that are not favorable to us, cause product shipment delays, subject our products to injunctions, require a complete or partial redesign of products, result in delays to our customers’ investment decisions, and damage our reputation.
Software includes many components or modules that provide different features and perform different functions. Some of these features or functions may be subject to third-party intellectual property rights. The rights of another party could encompass technical aspects that are similar to one or more technologies in one or more of our products. Intellectual property rights of third parties could preclude us from using certain technologies in our products or require us to enter into royalty and licensing arrangements on unfavorable or expensive terms.
Risk Report 145
The software industry is making increasing use of open source software in its development work on solutions. We also integrate certain open source software components from third parties into our software. Open source licenses may require that the software code in those components or the software into which they are integrated be freely accessible under open source terms. Third-party claims may require us to make freely accessible under open source terms one of our products or non-SAP software upon which we depend.
SAP continues to expand its participation in standards organizations and increase the use of such standards in its products. Participation in standards organizations might require the licensing of SAP’s intellectual property to contributors to the standard and to all standards implementers, including competitors, on a non-discriminatory basis in accordance with licensing terms defined by standards organizations. Within the software-related standards field, there is a trend toward expanding the scope of licensing obligations and narrowing an intellectual property owner’s right to revoke a license if sued by a licensee. In certain situations, limitations on SAP’s rights to revoke a license could reduce SAP’s ability to assert a patent infringement claim against a third party. Assertion of patents inadvertently licensed through standards could expose SAP to third-party claims.
Our Global Compliance Office is responsible for constantly assessing and managing risks associated with third-party intellectual property. It works closely with our Global GRC organization. The Global Compliance Office investigates the way we handle intellectual property, sets internal policies, and monitors compliance with these policies.
We consider the probability of this risk materializing to be likely, and that any claims concerning intellectual property rights of third parties, open source requirements, or certain standards could have a business-critical impact on our business, financial position, profit, cash flows and reputation, as well as on the achievement of our revenue and operating profit target, and could also exacerbate the other risks we describe in this report. We classify this risk as a high risk.
We are named as a defendant in various legal proceedings for alleged intellectual property infringements. For more information and a more detailed discussion relating to certain of these legal proceedings, see the Notes to the Consolidated Financial Statements, Note (23).
Claims and lawsuits against us could have an adverse effect on our business, financial position, profit, cash flows, and reputation.
Claims and lawsuits are brought against us, including claims and lawsuits involving businesses we have acquired. Adverse outcomes to some or all of the claims and lawsuits pending against us might result in the award of significant damages or injunctive relief against us that could hinder our ability to conduct our business and could have an adverse effect on our reputation, business, financial position, profit, and cash flows.
The outcome of litigation and other claims or lawsuits is intrinsically uncertain. Management’s view of the litigation may also change in the future. Actual outcomes of litigation and other claims or lawsuits could differ from the assessments made by management in prior periods.
We consider the probability of occurrence of this risk to be likely, and cannot exclude its business-critical impact on our reputation, business, financial position, profit, cash flows, and revenue and operating profit target if it were to materialize. We classify this risk as a high risk.
For more information and more detailed discussion relating to certain of these legal proceedings, see the Notes to the Consolidated Financial Statements, Note (23).
146 Combined Management Report
We might not acquire and integrate companies effectively or successfully and our strategic alliances might not be successful.
To expand our business, we have in the past made acquisitions of businesses, products, and technologies. We expect to continue to make such acquisitions in the future. Management’s negotiation of potential acquisitions and alliances and integration of acquired businesses, products, or technologies demands time, focus, and resources of management and of the workforce. Acquisitions of companies, businesses, and technology expose us to unpredictable operational difficulties, expenditures, and risks. These risks include, among others:
| ¡ | | The selection of the wrong integration model for the acquired company |
| ¡ | | The failure to integrate the acquired business and its different business and licensing models |
| ¡ | | The failure to integrate the acquired technologies or products with our current products and technologies |
| ¡ | | The failure to integrate the acquired company’s operations across SAP’s different cultures, languages, and local protocols, all within the constraints of applicable local laws |
| ¡ | | The failure to meet the needs of the acquired company’s customers and partners in the combined company |
| ¡ | | The diversion of management’s time and attention from daily operations |
| ¡ | | The loss of key personnel of the acquired business |
| ¡ | | Material unknown liabilities and contingent liabilities of acquired companies, including legal, tax, accounting intellectual property, or other significant liabilities that may not be detected through the due diligence process |
| ¡ | | Legal and regulatory constraints (such as contract obligations, privacy frameworks and agreements, and so on) |
| ¡ | | Difficulties in implementing, restoring, or maintaining internal controls, procedures, and policies |
| ¡ | | Practices or policies of the acquired company that may be incompatible with our compliance requirements |
| ¡ | | An adverse effect on relationships with existing customers, partners, or third-party providers of technology or products |
| ¡ | | Difficulties in integrating the acquired company’s accounting, HR, and other administrative systems and coordination of the acquired company’s research and development (R&D), sales, and marketing functions |
| ¡ | | Debt incurrence or significant cash expenditures |
In addition, acquired businesses might not perform as anticipated, resulting in charges for the impairment of goodwill and other intangible assets on our statements of financial position. Such charges may have an adverse effect on our business, financial position, profit, and cash flows. We have entered into, and expect to continue to enter into, alliance arrangements for a variety of purposes, including the development of new products and services. There can be no assurance that any such products or services will be successfully developed or that we will not incur significant unanticipated liabilities in connection with such arrangements. We may not be successful in overcoming these risks and we may therefore not benefit as anticipated from acquisitions or alliances.
We counter these acquisition-related risks with many different methodological and organizational measures. These include technical, operational, financial, and legal due diligence on the company or assets to be acquired and a holistic evaluation of material transaction and integration risks. The methods we use depend on the integration scenario. Our integration planning is detailed and standardized, and carried out by a dedicated integration team. We therefore believe we have minimized this risk.
Although we estimate this risk to be unlikely, we cannot completely exclude the possibility that this risk could have a major impact on our business, financial position, profit, cash flows, and revenue and operating profit target. We classify this risk as a medium risk.
Risk Report 147
We may not be able to obtain adequate title to, or licenses in, or to enforce, intellectual property.
Protecting and defending our intellectual property is crucial to our success. We use a variety of means to identify and monitor potential risks and to protect our intellectual property. These include applying for patents, registering trademarks and other marks and copyrights, implementing measures to stop copyright and trademark infringement, entering into licensing, confidentiality, and non-disclosure agreements, and deploying protection technology. Despite our efforts, we might not be able to prevent third parties from obtaining, using, or selling without authorization what we regard as our proprietary technology and information. All of these measures afford only limited protection, and our proprietary rights could be challenged, invalidated, held unenforceable, or otherwise affected. Some intellectual property might be vulnerable to disclosure or misappropriation by employees, partners, or other third parties. Third parties might independently develop technologies that are substantially equivalent or superior to our technology. Finally, third parties might reverse-engineer or otherwise obtain and use technology and information that we regard as proprietary. Accordingly, we might not be able to protect our proprietary rights against unauthorized third-party copying or utilization, which could have an adverse effect on our competitive position and our financial position, and result in reduced sales. Any legal action we bring to enforce our proprietary rights could also involve enforcement against a partner or other third party, which may have an adverse effect on our ability, and our customers’ ability, to use that partner’s or other third parties’ products. In addition, the laws and courts of certain countries may not offer effective means to enforce our intellectual property rights. This could have an adverse effect on our reputation, business, financial position, profit, and cash flows.
We rely on a combination of the protections provided by applicable statutory and common law rights, including trade secret, copyright, patent, and trademark laws, license and non-disclosure agreements, and technical measures to establish and protect our proprietary rights in our products. We have established various internal programs, such as internal policies, processes, and monitoring, to assess and manage the risks associated with standards organizations, open source, and third-party intellectual property.
We may be dependent in the aggregate on technology that we license from third parties that is embedded in our products or that we resell to our customers. We have licensed and will continue to license numerous third-party software products that we incorporate into and/or distribute with our existing products. We endeavor to protect ourselves in the respective agreements by obtaining certain rights in case such agreements are terminated.
We are party to certain patent cross-license agreements with third parties.
We estimate the probability of this risk occurring as likely, and that it could have a business-critical impact on our reputation, business, financial position, profit, cash flows, and revenue and operating profit target. We classify this risk as a high risk.
SAP’s business strategy focuses on certain business models that are highly dependent on a working cyberspace. A cybersecurity breach could have an adverse effect on our customers, our reputation, and our business.
The key cybersecurity risks currently applicable to SAP include state-driven economic espionage as well as competitor-driven industrial espionage, and criminal activities including, but not limited to cyber-attacks against on-premise software, hosted, and cloud services. This might result in, for example, leakage of
148 Combined Management Report
confidential information and intellectual property, defective products, production downtimes, supply shortages, and compromised data (including personal data). A failure of our cybersecurity measures could expose our business operations and service delivery to the described risks, for example, virtual attack, disruption, damage, and/or unauthorized access. Additionally, we could be subject to recovery costs, for example, as well as significant contractual and legal claims by customers, partners, authorities, and third-party service providers for damages against us, which could have an adverse effect on our reputation, business, financial position, profit, and cash flows.
To address the increasing cybersecurity threats, SAP is continuously adapting and modifying its security procedures. We have multiple security measures in place, such as technical IT security measures, identity and access management, and mandatory security and compliance trainings. In addition, our security governance model clearly defines security management accountabilities for all security areas regarding product security and corporate security that enables us to respond quickly to identified cybersecurity risks.
Although we still consider the occurrence of this risk to be unlikely, we cannot completely exclude the possibility that this risk could have a business-critical impact on our business, financial position, profit, cash flows, and reputation as well as revenue and operating profit target. We classify this risk as a medium risk.
We may not be able to protect our critical information and assets or to safeguard our business operations against disruption.
SAP is dependent on the exchange of a wide range of information across our global operations and on the availability of our infrastructure. With regard to our physical environment, we face several key security risks such as industrial and/or economic espionage, serious and organized crime, and other illegal activities, as well as violent extremism and terrorism. We might be endangered by threats including, but not limited, to social engineering, misuse, or theft of information or assets, or damage to assets by trespassers in our facilities or by people who have gained unauthorized physical access to our facilities, systems, or information, which could have an adverse effect on our business, financial profile, profit, and cash flows.
To minimize these risks, we have implemented several technical and organizational measures designed to safeguard our information, IT and facility infrastructure, and other assets. These measures include, for example, physical access control systems at facilities, multilevel access controls, closed-circuit television surveillance, and security personnel in all critical areas. Access to information and information systems is controlled using authorization concepts. Managers and employees are regularly sensitized to the issues and given mandatory security and compliance trainings. We keep these measures under continuous review to meet current threats.
Although we estimate the probability of occurrence of this risk to be unlikely, we cannot completely exclude the possibility that any misuse, theft, or breach of security could have a moderate impact on our business, financial position, profit, and cash flows as well as on our revenue and operating profit target. We classify this risk as a low risk.
Our insurance coverage might not be sufficient and uninsured losses may occur.
We maintain insurance coverage to protect us against a broad range of risks, at levels we believe are appropriate and consistent with current industry practice. Our objective is to exclude or minimize risk of financial loss at reasonable cost. However, we may incur losses that are beyond the limits, or outside the scope, of coverage of our insurance and that may limit or prevent indemnification under our insurance policies. In addition, we might not be able to maintain adequate insurance coverage on commercially reasonable terms in the future. Further, certain categories of risks are currently not insurable at reasonable cost, which could have an adverse effect on our
Risk Report 149
business, financial position, profit, and cash flows. Finally, there can be no assurance of the financial ability of the insurance companies to meet their claim payment obligations.
In view of the scope of our insurance coverage and our selection of insurers, and because we keep our insurance programs under constant review, we believe that the likelihood of this risk materializing is remote.
We cannot exclude the possibility of a business-critical impact on our business, financial position, profit, cash flows, and operating profit target if the risk were to occur. We classify this risk as a medium risk.
We could incur losses in connection with venture capital investments.
Through our partnership with SAP Ventures, we plan to continue investing in new and promising technology businesses. Many such investments generate net losses and require additional expenditures from their investors. Changes to planned business operations have in the past, and may in the future, affect the performance of companies in which SAP Ventures holds investments, and that could have an adverse effect on the value of our investments in SAP Ventures, which could have an adverse effect on our business, financial position, profit, and cash flows. Furthermore, tax deductibility of capital losses and impairment in connection with equity securities are often restricted and could therefore have an adverse effect on our effective tax rate.
To address this risk, SAP Ventures diversifies its portfolio and manages our investments actively. In addition, our venture capital activities have a limited scope.
We believe that the likelihood of this risk materializing is remote and that if the risk were to occur, its potential impact on our business, financial position, profit, cash flows, and operating profit target would be minor. We classify this risk as a low risk.
Consolidated Risk Profile
Management Assessment of Overall Risks and Opportunities
SAP consolidates and aggregates all risks reported by the different business units and functions following our risk management policy, monitored by a Group-wide risk management governance function.
Compared to previous years, in 2013 we recognized only minor changes in the percentages of all risks categorized as “high” or “medium” in our risk level matrix. At the end of the year, the number of risks categorized as “high” accounted for 12% (2012: 9%) of all identified risks, while the risks categorized as “medium” accounted for 39% (2012: 34%) of all identified risks.
In our view, considering their likelihood of occurrence and impact level, the risks described in our aggregated risk report do not individually or cumulatively threaten our ability to continue as a going concern. Management remains confident that the Group’s earnings strength forms a solid basis for our future business development and provides the necessary resource to pursue the opportunities available to the Group. Because of our strong position in the market, our technological leadership, our highly motivated employees, and our structured processes for early risk identification, we are confident that we can continue to successfully counter the challenges arising from the risks in our risk profile in 2014.
150 Combined Management Report
Supplementary Report
Bob Calderoni, president of Ariba, an SAP company, and a member of our Global Managing Board, decided to leave SAP with effect from January 15, 2014.
Supplementary Report 151
Report on Expected Developments
FUTURE TRENDS IN THE GLOBAL ECONOMY
The experts at the European Central Bank (ECB1)) expect the global economy to expand gradually in response to factors such as more stable credit conditions around the world. The ECB bases this expectation on the assumption that, as in 2013, prospects will improve in the industrialized economies but will remain subdued in some of the emerging economies compared to past years.
According to these expectations, the outlook in the Europe, Middle East, and Africa (EMEA) region has improved: The ECB expects a slow recovery in the euro area in 2014 and 2015, supported by a slight recovery of domestic and export demand. Companies in particular will increase their investments in 2014, encouraged by the very low interest rates and by a high demand for modernization after several years of restrained investments. The ECB currently expects GDP in the euro area to grow about 1% in 2014 and 1.5% in 2015. That would bring GDP back to first-quarter 2008 “pre-crisis” levels by the end of 2015. The ECB also expects the economies of Central and Eastern Europe to gain traction beginning in 2014.
The ECB is also optimistic about the Americas region. It believes the economic upturn in the United States will gradually gain momentum as the residential real-estate and labor markets continue to brighten up. However, it believes uncertainty regarding financial policy will continue, with new legislation on debt capping and public finance under continued discussion.
Future trends in the Asia Pacific Japan (APJ) region are difficult to estimate, according to the ECB. In Japan, a consumption tax rise is due in April 2014. That could cause the economy to pick up in the first quarter, as consumers bring forward spending. As a result, subsequent quarters may see an economic slowdown. It remains to be seen what effect the wide-ranging agenda for reform announced by the Communist Party of China in November 2013 will have. The goal is to set China on a more sustainable path to economic growth. The ECB believes the reforms will strengthen the market and the economy outside the public sector.
Economic Trends – Year-Over-Year GDP Growth
Percent
| | | | | | | | | | | | |
| | | 2012e | | | 2013p | | | 2014p | |
| World | | | 3.1 | | | | 3.0 | | | | 3.7 | |
| Advanced economies | | | 1.4 | | | | 1.3 | | | | 2.2 | |
| Developing and emerging economies | | | 4.9 | | | | 4.7 | | | | 5.1 | |
| Europe, the Middle East, and Africa (EMEA) | | | | | | | | | | | | |
| Euro area | | | -0.7 | | | | -0.4 | | | | 1.0 | |
| Germany | | | 0.9 | | | | 0.5 | | | | 1.6 | |
| Central and Eastern Europe | | | 1.4 | | | | 2.5 | | | | 2.8 | |
| Middle East and North Africa | | | 4.1 | | | | 2.4 | | | | 3.3 | |
| Sub Saharan Africa | | | 4.8 | | | | 5.1 | | | | 6.1 | |
| Americas | | | | | | | | | | | | |
| United States | | | 2.8 | | | | 1.9 | | | | 2.8 | |
| Canada | | | 1.7 | | | | 1.7 | | | | 2.2 | |
| Central and South America, Caribbean | | | 3.0 | | | | 2.6 | | | | 3.0 | |
| Asia Pacific Japan (APJ) | | | | | | | | | | | | |
| Japan | | | 1.4 | | | | 1.7 | | | | 1.7 | |
| Asian developing economies | | | 6.4 | | | | 6.5 | | | | 6.7 | |
| China | | | 7.7 | | | | 7.7 | | | | 7.5 | |
e = estimate; p = projection
Source: International Monetary Fund (IMF), World Economic Outlook Update January 2014, “Is the Tide Rising?”
As of January 21, 2014, p. 2.
IT MARKET: THE OUTLOOK FOR 2014
According to International Data Corporation (IDC), a market research firm based in the United States, economic recovery in 2014 will lead to a greater increase in spending on IT than occurred in 2013. That increase is expected to continue to be higher than the growth in the overall economy. IDC expects businesses will revert to normal IT upgrade cycles in 2014 as liquidity bottlenecks are resolved by the return of economic stability, so companies in particular will increase investment in IT. In the emerging economies, IDC expects IT markets to recover from the setbacks of the previous year, because basically demand for IT products is high and conditions are stable.
| 1) | Unless otherwise indicated, all economic information in this section is based on information from the European Central Bank (ECB). |
152 Combined Management Report
According to IDC, software sales should again outpace the IT market as a whole in 2014. Spending on PCs and tablets should grow by a percentage in the low single digits: the PC market has bottomed out and the tablet market should see growth well into the double digits. Investments in servers and data storage devices could grow by a percentage in the low single digits again, and IDC forecasts slightly more growth in the IT services market in 2014 than in 2013.
The outlook IDC describes for 2014 in the Europe, Middle East, and Africa (EMEA) region is positive: It believes Western Europe will almost sustain the slightly improved growth it achieved at the end of 2013, showing significant positive growth rates for the full year. The IT markets of Central and Eastern Europe, the Middle East, and Africa could see growth in the high single digits, and the IT market in Russia may even approach double-digit growth, IDC says.
IDC is more cautious about the Americas region: It believes 2014 IT market growth in the United States may fall short of the 2013 level as demand for smartphones declines. Despite the uncertainty concerning government policy, IDC predicts IT investment in the United States will be largely stable. IDC believes growth in the Latin America IT markets will slow to single digits.
IDC forecasts that the IT market in the Asia Pacific Japan (APJ) region will grow by a percentage in the middle of the single-digit range. However, it believes the market in Japan will decline slightly. In contrast, IDC predicts the IT market in China, which was weak in the previous year, should recover well into double-digit growth in 2014.
Trends in the It Market – Increased It spending Year over Year
Percent
| | | | | | | | | | | | |
| | | 2012e | | | 2013p | | | 2014p | |
| World | | | | | | | | | | | | |
| Total IT | | | 5.3 | | | | 4.4 | | | | 5.1 | |
Hardware | | | 6.3 | | | | 4.8 | | | | 5.4 | |
Packaged software | | | 6.2 | | | | 5.6 | | | | 6.2 | |
Applications | | | 6.0 | | | | 5.6 | | | | 6.0 | |
IT services | | | 3.2 | | | | 3.2 | | | | 3.9 | |
| Europe, Middle East, and Africa (EMEA) | | | | | | | | | | | | |
| Total IT | | | 5.2 | | | | 2.3 | | | | 4.4 | |
Packaged software | | | 4.7 | | | | 4.6 | | | | 5.2 | |
Applications | | | 4.4 | | | | 4.5 | | | | 5.0 | |
IT services | | | 1.4 | | | | 2.0 | | | | 3.6 | |
| Americas | | | | | | | | | | | | |
| Total IT | | | 4.2 | | | | 5.9 | | | | 4.5 | |
Packaged software | | | 6.8 | | | | 6.0 | | | | 6.7 | |
Applications | | | 6.9 | | | | 6.2 | | | | 6.5 | |
IT services | | | 4.2 | | | | 3.7 | | | | 3.6 | |
| Asia Pacific Japan (APJ) | | | | | | | | | | | | |
| Total IT | | | 6.9 | | | | 4.6 | | | | 6.7 | |
Packaged software | | | 6.9 | | | | 5.9 | | | | 6.4 | |
Applications | | | 6.0 | | | | 5.7 | | | | 6.4 | |
IT services | | | 4.5 | | | | 4.3 | | | | 5.1 | |
e = estimate, p = projection
Source: IDC Worldwide Black Book Q3 2013
IMPACT ON SAP
SAP expects to outperform the global economy and the IT industry again in 2014. Four years of growth momentum underscore our leadership in the transformation of the industry. We are gaining market share in all regions. We have reinvented the database and developed the next-generation real time in-memory platform SAP HANA. We are managing the transition to the cloud successfully, while growing our core business and expanding our operating margin.
Report on Expected Developments 153
Thanks to our great progress in strategy and technology since 2010, we have increased the importance of SAP to our customers. We are well-positioned to expand our core business and to accelerate our cloud businesses. We are therefore confident we can achieve our medium-term targets for 2015 and 2017, assuming that the economic environment and IT industry develop as currently forecast. Balanced in terms of regions as well as industries, we are well-positioned to offset smaller individual fluctuations in the global economy and IT market.
A comparison of our business outlook with forecasts for the global economy and IT industry shows that, with our customer-centered innovation strategy, we can be successful even in a tough economic environment. Our market and the demands of our customers are changing rapidly. We anticipated these changes early.
We plan to continue to invest in countries in which we expect significant growth, and we aim to expand our market share in those countries. Such countries include Brazil, China, India, Russia, as well as countries in the Middle East and Africa. We therefore expect to see further future growth potential helping us reach our ambitious 2014 outlook targets and medium-term aspirations for 2015 and 2017. For more information, see the Operational Targets for 2014 (Non-IFRS) section.
FORECAST FOR SAP
Strategy for Profitable Growth
SAP seeks to maintain profitable growth across its portfolio of products and services. Our goal is to expand our addressable market to US$350 billion in 2020, compared to US$110 billion in 2010. Our ability to deliver software-based innovation and value in target growth areas positions us favorably in the enterprise software market.
SAP’s continued growth depends on our ability to deliver innovative solutions and provide significant value to our customers. We continue to improve our research and development effectiveness, creating efficiencies and accelerating innovation cycles to engage more closely with our customers. We are also investing in our go-to-market channels to expand capacity and drive greater volume sales. At the same time, we are expanding our technology partner ecosystem to foster co-innovation as a force multiplier for creating additional business value for our customers.
The success of SAP and our customers depends on our people – whom we consider our most important asset. Our employees spark our innovation, deliver value to our customers, and drive our sustainable growth and profitability. The correlation between our continued business success and our ability to attract, retain, and engage top talent is stronger than ever. We will continue to execute our people strategy to set us apart in vital areas such as workforce diversity and talent management. Our ambitious growth strategy and our ability to innovate depends on creating an environment for our employees that drives them to unleash their full potential.
Go-to-Market Investment Delivers Customer Value
SAP goes to market by region, customer segment, line of business and industry. In each region, we seek to concentrate our sales efforts on the fastest-growing markets with the greatest business and revenue potential. We evolve and invest in our go-to-market coverage model to effectively sell industry-specific solutions while increasing our engagement with customers in line-of-business functions. We continue to provide companies of any size – small, midsize, and large – with tailored offerings that align to their specific budgetary, resource, and deployment requirements.
154 Combined Management Report
Greater Volume and Co-Innovation Through an Open Ecosystem
SAP continues to engage an expanding partner ecosystem to increase market coverage, enhance our solutions portfolio, and spur innovation. SAP and its vibrant partner ecosystem offer greater choice and business value through the power of co-innovation, appealing to customers that want to avoid being “locked in” to a single vendor. SAP partners offer customers knowledgeable local delivery of solutions across industries and lines of business. SAP technology partners continue to drive our research agenda, enhance the SAP portfolio, and monetize new technology breakthroughs.
Organic Growth and Targeted Acquisitions
Organic growth remains the primary driver of SAP’s strategy. We will continue to invest in our own product development and technology innovation, improving the speed, number of projects, and innovations brought to market. Our ecosystem strategy enables us to better leverage our innovation by extending it to our partners to drive additional customer value, based on their own domain expertise. We will also continue to acquire targeted, strategic, and “fill-in” technology to add to our broad solution offerings and improve our coverage in key strategic markets to best support our customers’ needs.
OPERATIONAL TARGETS FOR 2014 (NON-IFRS)
Revenue and Operating Profit Outlook
The Executive Board is providing the following outlook for the full year 2014:
| ¡ | | SAP expects full-year 2014 non-IFRS cloud subscription and support revenue to be in a range of €950 to €1,000 million at constant currencies (2013: €757 million). The upper end of this range represents a growth rate of 32% that is similar to the respective 2013 growth rate after adjusting for acquisitions. |
| ¡ | | SAP expects full-year 2014 non-IFRS software and software-related service revenue to increase by 6% to 8% at constant currencies (2013: €14,032 million). |
| ¡ | | SAP expects full-year 2014 non-IFRS operating profit to be in a range of €5.8 billion to €6.0 billion at constant currencies (2013: €5,514 million). |
We expect that total revenue growth (non-IFRS) will continue to depend largely on the revenue from the On-Premise Products segment. However, the revenue growth we expect from this segment is below the outlook provided for cloud subscription revenue (non-IFRS). In light of the rate at which professional services and other service revenue is growing, we do not expect strong growth in the On-Premise Services segment.
We expect an increase in segment profit in our On-Premise division, with On-Premise Products segment profit growing faster than On-Premise Services segment profit. We expect only a slight improvement in On-Premise Services segment profit. The Cloud division is expected to continue with increasingly positive segment profit in 2014.
In light of the rate at which cloud subscriptions are growing in our cloud segments, we expect strong revenue growth in those segments.
We present the following reconciliation from our 2013 IFRS software and cloud subscription revenue, IFRS software and software-related service revenue, IFRS total revenue, and IFRS operating profit to the non-IFRS equivalents to facilitate comparison between IFRS financial measures and the non-IFRS financial measures in our 2014 outlook:
Report on Expected Developments 155
Reconciliations of IFRS to Non-IFRS Financial Measures for 2013
€ millions, unless otherwise stated
| | | | | | | | | | | | | | | | | | | | |
| | | IFRS Financial
Measure | | | Recurring Revenue
Not Recorded
Under IFRS | | | Adjustments
Operating1) | | | Discontinued
Activities3) | | | Non-IFRS
Financial
Measure | |
| Cloud subscriptions and support | | | 696 | | | | 61 | | | | n.a. | | | | n.a. | | | | 757 | |
| Software and cloud subscription revenue | | | 5,212 | | | | 63 | | | | n.a. | | | | n.a. | | | | 5,275 | |
| Software and software-related service revenue | | | 13,950 | | | | 82 | | | | n.a. | | | | n.a. | | | | 14,032 | |
| Total revenue2) | | | 16,815 | | | | 82 | | | | n.a. | | | | n.a. | | | | 16,897 | |
| Total operating expenses | | | -12,336 | | | | 0 | | | | 953 | | | | 0 | | | | -11,383 | |
| Operating profit2) | | | 4,479 | | | | 82 | | | | 953 | | | | 0 | | | | 5,514 | |
| 1) | Included in operating expenses are acquisition-related charges, share-based payment expenses, and restructuring charges. |
| 2) | These financial measures are the numerator or the denominator in the calculation of our IFRS and non-IFRS operating margin, and are included in this table for transparency. |
| 3) | The discontinued activities include the results of our discontinued TomorrowNow business. |
The following table shows the estimates of the items that represent the differences between our non-IFRS financial measures and our IFRS financial measures.
Non-IFRS Measures
€ millions
| | | | | | | | |
| | | Estimated
Amounts for 2014 | | | Actual
Amounts for 2013 | |
| Deferred revenue write-down | | | < 20 | | | | 82 | |
| Discontinued activities | | | < 10 | | | | 1 | |
| Share-based payment expenses | | | 470 to 510 | | | | 327 | |
| Acquisition-related charges | | | 520 to 560 | | | | 555 | |
| Restructuring charges | | | 50 to 150 | | | | 70 | |
The company expects a full-year 2014 effective tax rate (IFRS) of 26.0% to 27.0% (2013: 24.4%) and an effective tax rate (non-IFRS) of 27.5% to 28.5% (2013: 25.9%).
Goals for Liquidity and Finance
On December 31, 2013, our net liquidity was negative, but we have additional liquidity reserves. We believe that our liquid assets combined with our undrawn credit facilities are sufficient to meet our present operating financing needs also in 2014 and, together with expected cash flows from operations, will support our currently planned capital expenditure requirements over the near term and medium term.
We intend to effect a substantial planned reduction of our financial debt in 2014 and, at the time of this report, we expect to make repayments of €586 million over the year. We will consider issuing new debt, such as bonds or U.S. private placements, on an as-needed basis only and if market conditions are advantageous. By the time of this report, we have no concrete plans for future share buybacks.
Investment Goals
Excepting acquisitions, our planned capital expenditures for 2014 and 2015 mainly comprise the construction activities described earlier in this report. We expect investments of approximately €194 million during the next three years. These investments can be covered in full by operating cash flow.
Proposed Dividend
We plan to continue our dividend policy, which is that the payout ratio should be more than 30%.
156 Combined Management Report
Premises on Which Our Outlook Is Based
In preparing our outlook, we have taken into account all events known to us at the time we prepared this report that could influence SAP’s business going forward.
Among the premises on which this outlook is based are those presented concerning the economy and on the assumption that there will be no effects from a major acquisition.
OUTLOOK FOR SAP AG
The primary source of revenue for SAP AG is the license fees it charges subsidiaries for the right to market and maintain SAP software solutions. Consequently, the performance of SAP AG in operating terms is closely tied to the software and software-related service revenue of the SAP Group.
We expect SAP AG product revenue to increase generally in line with the rise in software and software-related service revenue anticipated for the SAP Group in 2014. Assuming there are no special effects relating to acquisitions or internal corporate restructuring measures in 2014, we also expect SAP AG operating profit to grow. Provided the SAP Group continues to hit its revenue and profit targets, we expect SAP AG to sustain revenue and operating profit growth into the medium term.
We believe SAP AG, the parent company of the SAP Group, will receive investment income in the form of profit transfers and dividends again in the future. The growth we expect from the SAP Group should have a positive effect on SAP AG investment income.
The outlook projections for the SAP Group in respect of liquidity, finance, investment, and dividend are equally applicable to SAP AG.
Among the assumptions underlying this outlook are those presented above concerning the economy and our expectations for the performance of the SAP Group.
MEDIUM-TERM PROSPECTS
With SAP HANA as the single platform for our entire solution portfolio, delivered on-premise or in the cloud, SAP will drive simplicity and business outcomes for our customers.
We expect our business, our revenue, and our profit to grow, assuming there is a sustained recovery in the global economy. Our strategic objectives are focused on the following financial and non-financial indicators: revenue, margin, customer loyalty, and employee engagement.
We expect the combination of a stable, highly-profitable core and fast-growing cloud business to deliver continued growth and margin expansion. We continue to strive to increase our total revenue to more than €20 billion by 2015 and revenue from our cloud business, including cloud-related professional services, to approximately €2 billion by 2015.
Looking beyond 2015, we introduced new 2017 targets. We now aim to increase total revenue to at least €22 billion and revenue from our cloud business to €3.0 to €3.5 billion by 2017. We have retained our non-IFRS operating margin goal of 35%. To capture the growth opportunities in the cloud, we now expect this target to be reached by 2017 rather than in 2015 as previously stated. We anticipate the fast-growing cloud business along with growth in support revenue will drive a higher proportion of more predictable, recurring revenue in the future.
Report on Expected Developments 157
In addition to our financial goals, we also focus on two non-financial targets: Customer loyalty and employee engagement. We believe it is essential that our employees are engaged, drive our success, and support our strategy. Therefore, we plan to increase our employee engagement index score to 82% by 2015 (2013: 77%). Further, our customers’ satisfaction with the solutions we offer is very important to us. We want our customers to not only be satisfied, but also see us as a trusted partner for innovation. We measure this customer loyalty metric using the Net Promoter Score (NPS). For 2014, we have set a target for increasing the NPS by four percentage points (2013: 12.1%).
SAP’s vision to help the world run better and improve people’s lives comes to life in product innovation that drives business value for our customers. By delivering on our product roadmap, SAP is powering a market-wide transformation in how people and organizations work together and run better. Building on a track record of innovation, SAP is again at the forefront of a major shift in the IT sector, away from commoditized hardware and lower value services, toward renewed investment in differentiating IT through business software and services that drive simplicity, efficiency, and a more sustainable business transformation.
158 Combined Management Report
Internal
Management System
We measure our performance
through four companywide
indicators: revenue, margin,
employee engagement,
and customer loyalty.
To learn more about SAP’s internal management system please visit www.sapintegratedreport.com
160
Consolidated Financial Statements IFRS
Consolidated Income Statements of SAP Group for the Years Ended December 31,
€ millions, unless otherwise stated
| | | | | | | | | | | | | | | | |
| | | Notes | | | 2013 | | | 2012 | | | 2011 | |
Software | | | | | | | 4,516 | | | | 4,658 | | | | 4,107 | |
Cloud subscriptions and support | | | | | | | 696 | | | | 270 | | | | 18 | |
Software and cloud subscriptions | | | | | | | 5,212 | | | | 4,928 | | | | 4,125 | |
Support | | | | | | | 8,738 | | | | 8,237 | | | | 7,194 | |
| | | | | | | | | | | | | | | | |
Software and software-related service revenue | | | | | | | 13,950 | | | | 13,165 | | | | 11,319 | |
Consulting | | | | | | | 2,242 | | | | 2,442 | | | | 2,341 | |
Other services | | | | | | | 623 | | | | 616 | | | | 573 | |
Professional services and other service revenue | | | | | | | 2,865 | | | | 3,058 | | | | 2,914 | |
| | | | | | | | | | | | | | | | |
| Total revenue | | | (5 | ) | | | 16,815 | | | | 16,223 | | | | 14,233 | |
| | | | |
Cost of software and software-related services | | | | | | | -2,597 | | | | -2,555 | | | | -2,107 | |
Cost of professional services and other services | | | | | | | -2,402 | | | | -2,520 | | | | -2,247 | |
Total cost of revenue | | | | | | | -4,999 | | | | -5,075 | | | | -4,354 | |
Gross profit | | | | | | | 11,816 | | | | 11,147 | | | | 9,879 | |
Research and development | | | | | | | -2,282 | | | | -2,261 | | | | -1,935 | |
Sales and marketing | | | | | | | -4,131 | | | | -3,912 | | | | -3,083 | |
General and administration | | | | | | | -866 | | | | -949 | | | | -715 | |
Restructuring | | | (18 | ) | | | -70 | | | | -8 | | | | -4 | |
TomorrowNow litigation | | | (23 | ) | | | 0 | | | | 0 | | | | 717 | |
Other operating income/expense, net | | | (6 | ) | | | 12 | | | | 23 | | | | 25 | |
| Total operating expenses | | | | | | | -12,336 | | | | -12,181 | | | | -9,348 | |
| | | | | | | | | | | | | | | | |
| Operating profit | | | | | | | 4,479 | | | | 4,041 | | | | 4,884 | |
| | | | |
| Other non-operating income/expense, net | | | (8 | ) | | | -17 | | | | -173 | | | | -75 | |
Finance income | | | | | | | 115 | | | | 103 | | | | 119 | |
Finance costs | | | | | | | -181 | | | | -175 | | | | -161 | |
| Financial income, net | | | (9 | ) | | | -66 | | | | -72 | | | | -42 | |
| | | | | | | | | | | | | | | | |
| Profit before tax | | | | | | | 4,396 | | | | 3,796 | | | | 4,767 | |
| | | | |
Income tax TomorrowNow litigation | | | | | | | 0 | | | | 0 | | | | -281 | |
Other income tax expense | | | | | | | -1,071 | | | | -993 | | | | -1,049 | |
Income tax expense | | | (10 | ) | | | -1,071 | | | | -993 | | | | -1,331 | |
| | | | | | | | | | | | | | | | |
| Profit after tax | | | | | | | 3,325 | | | | 2,803 | | | | 3,437 | |
Profit attributable to non-controlling interests | | | | | | | -1 | | | | 0 | | | | 1 | |
Profit attributable to owners of parent | | | | | | | 3,326 | | | | 2,803 | | | | 3,435 | |
| | | | |
| Earnings per share, basic (in €) | | | (11 | ) | | | 2.79 | | | | 2.35 | | | | 2.89 | |
| Earnings per share, diluted (in €) | | | (11 | ) | | | 2.78 | | | | 2.35 | | | | 2.89 | |
The accompanying Notes are an integral part of these Consolidated Financial Statements.
| | |
| | Consolidated Financial Statements IFRS 161 |
Consolidated Statements of Comprehensive Income of SAP Group for the Years Ended December 31,
€ millions
| | | | | | | | | | | | | | | | |
| | | Notes | | | 2013 | | | 2012 | | | 2011 | |
| Profit after tax | | | | | | | 3,325 | | | | 2,803 | | | | 3,437 | |
| Items that will not be reclassified to profit or loss | | | | | | | | | | | | | | | | |
Remeasurements on defined benefit pension plans | | | (18 | ) | | | 16 | | | | -12 | | | | -17 | |
Income tax relating to items that will not be reclassified | | | (10 | ) | | | -3 | | | | 4 | | | | 5 | |
| | | | | | | | | | | | | | | | |
| Other comprehensive income after tax for items that will not be reclassified to profit or loss | | | | | | | 13 | | | | -8 | | | | -12 | |
| Items that will be reclassified subsequently to profit or loss | | | (20 | ) | | | | | | | | | | | | |
Exchange differences | | | | | | | -576 | | | | -214 | | | | 106 | |
Available-for-sale financial assets | | | (26 | ) | | | 60 | | | | 13 | | | | -7 | |
Cash flow hedges | | | (25 | ) | | | 0 | | | | 63 | | | | -1 | |
Income tax relating to items that will be reclassified | | | (10 | ) | | | -8 | | | | -20 | | | | 7 | |
| | | | | | | | | | | | | | | | |
| Other comprehensive income after tax for items that will be reclassified to profit or loss | | | | | | | -524 | | | | -157 | | | | 105 | |
| Other comprehensive income net of tax | | | | | | | -511 | | | | -165 | | | | 93 | |
| | | | | | | | | | | | | | | | |
| Total comprehensive income | | | | | | | 2,814 | | | | 2,638 | | | | 3,530 | |
attributable to owners of parent | | | | | | | 2,815 | | | | 2,638 | | | | 3,528 | |
attributable to non-controlling interests | | | | | | | -1 | | | | 0 | | | | 1 | |
The accompanying Notes are an integral part of these Consolidated Financial Statements.
| | |
| 162 Consolidated Statements of Comprehensive Income | | |
Consolidated Statements of Financial Position of SAP Group as at December 31,
€ millions
| | | | | | | | | | | | |
| | | Notes | | | 2013 | | | 2012 | |
Cash and cash equivalents | | | | | | | 2,748 | | | | 2,477 | |
Other financial assets | | | (12 | ) | | | 251 | | | | 154 | |
Trade and other receivables | | | (13 | ) | | | 3,865 | | | | 3,917 | |
Other non-financial assets | | | (14 | ) | | | 346 | | | | 294 | |
Tax assets | | | | | | | 142 | | | | 85 | |
| | | | | | | | | | | | |
Total current assets | | | | | | | 7,352 | | | | 6,928 | |
Goodwill | | | (15 | ) | | | 13,688 | | | | 13,192 | |
Intangible assets | | | (15 | ) | | | 2,956 | | | | 3,234 | |
Property, plant, and equipment | | | (16 | ) | | | 1,820 | | | | 1,708 | |
Other financial assets | | | (12 | ) | | | 607 | | | | 509 | |
Trade and other receivables | | | (13 | ) | | | 98 | | | | 88 | |
Other non-financial assets | | | (14 | ) | | | 107 | | | | 68 | |
Tax assets | | | | | | | 172 | | | | 170 | |
Deferred tax assets | | | (10 | ) | | | 294 | | | | 408 | |
| | | | | | | | | | | | |
Total non-current assets | | | | | | | 19,741 | | | | 19,378 | |
| | | | | | | | | | | | |
| Total assets | | | | | | | 27,094 | | | | 26,306 | |
| | |
| | Consolidated Financial Statements IFRS 163 |
| | | | | | | | | | | | |
| | | Notes | | | 2013 | | | 2012 | |
Trade and other payables | | | (17 | ) | | | 850 | | | | 870 | |
Tax liabilities | | | | | | | 433 | | | | 440 | |
Financial liabilities | | | (17 | ) | | | 748 | | | | 802 | |
Other non-financial liabilities | | | (17 | ) | | | 2,263 | | | | 2,204 | |
Provision TomorrowNow litigation | | | (23 | ) | | | 223 | | | | 234 | |
Other provisions | | | | | | | 422 | | | | 609 | |
Provisions | | | (18 | ) | | | 645 | | | | 843 | |
Deferred income | | | (19 | ) | | | 1,408 | | | | 1,386 | |
Total current liabilities | | | | | | | 6,347 | | | | 6,546 | |
Trade and other payables | | | (17 | ) | | | 45 | | | | 63 | |
Tax liabilities | | | | | | | 318 | | | | 388 | |
Financial liabilities | | | (17 | ) | | | 3,758 | | | | 4,446 | |
Other non-financial liabilities | | | (17 | ) | | | 112 | | | | 98 | |
Provisions | | | (18 | ) | | | 277 | | | | 347 | |
Deferred tax liabilities | | | (10 | ) | | | 115 | | | | 223 | |
Deferred income | | | (19 | ) | | | 74 | | | | 62 | |
Total non-current liabilities | | | | | | | 4,699 | | | | 5,627 | |
| | | | | | | | | | | | |
Total liabilities | | | | | | | 11,046 | | | | 12,173 | |
Issued capital | | | | | | | 1,229 | | | | 1,229 | |
Share premium | | | | | | | 551 | | | | 492 | |
Retained earnings | | | | | | | 16,258 | | | | 13,934 | |
Other components of equity | | | | | | | -718 | | | | -194 | |
Treasury shares | | | | | | | -1,280 | | | | -1,337 | |
Equity attributable to owners of parent | | | | | | | 16,040 | | | | 14,125 | |
| | | |
Non-controlling interests | | | | | | | 8 | | | | 8 | |
| | | | | | | | | | | | |
Total equity | | | (20 | ) | | | 16,048 | | | | 14,133 | |
| | | | | | | | | | | | |
| Total equity and liabilities | | | | | | | 27,094 | | | | 26,306 | |
The accompanying Notes are an integral part of these Consolidated Financial Statements.
| | |
| 164 Consolidated Statements of Financial Position | | |
Consolidated Statements of Changes in Equity of SAP Group as at December 31,
€ millions
| | | | | | | | | | | | | | | | | | | | | | | | | | | | | | | | | | | | | | | | |
| | | Equity Attributable to Owners of Parent | | | Non-
Controlling
Interests | | | Total
Equity | |
| | | Issued
Capital | | | Share
Premium | | | Retained
Earnings | | | Other Components of Equity | | | Treasury
Shares | | | Total | | | | | | | |
| | | | | | | | | | | | Exchange
Differences | | | Available-
for-Sale
Financial
Assets | | | Cash
Flow
Hedges | | | | | | | | | | | | | |
Note reference | | (20) | | | (20) | | | (20) | | | Statement of Comprehensive Income | | | (20) | | | | | | | | | | |
| January 1, 2011 prior to IAS 19 (revised) adoption | | | 1,227 | | | | 337 | | | | 9,767 | | | | -131 | | | | 16 | | | | -27 | | | | -1,382 | | | | 9,807 | | | | 17 | | | | 9,824 | |
| Cumulated difference from the retrospective adoption of IAS 19 (revised) | | | | | | | | | | | -11 | | | | | | | | | | | | | | | | | | | | -11 | | | | | | | | -11 | |
| January 1, 2011 after IAS 19 (revised) adoption | | | 1,227 | | | | 337 | | | | 9,756 | | | | -131 | | | | 16 | | | | -27 | | | | -1,382 | | | | 9,796 | | | | 17 | | | | 9,813 | |
Profit after tax | | | | | | | | | | | 3,435 | | | | | | | | | | | | | | | | | | | | 3,435 | | | | 1 | | | | 3,437 | |
Other comprehensive income | | | | | | | | | | | -12 | | | | 112 | | | | -7 | | | | 0 | | | | | | | | 93 | | | | | | | | 93 | |
Comprehensive income | | | | | | | | | | | 3,423 | | | | 112 | | | | -7 | | | | 0 | | | | | | | | 3,528 | | | | 1 | | | | 3,530 | |
| Share-based payments | | | | | | | 9 | | | | | | | | | | | | | | | | | | | | | | | | 9 | | | | | | | | 9 | |
| Dividends | | | | | | | | | | | -713 | | | | | | | | | | | | | | | | | | | | -713 | | | | | | | | -713 | |
| Issuance of shares under share-based payments | | | 1 | | | | 46 | | | | | | | | | | | | | | | | | | | | | | | | 47 | | | | | | | | 47 | |
Purchase of treasury shares | | | | | | | | | | | | | | | | | | | | | | | | | | | -246 | | | | -246 | | | | | | | | -246 | |
| Reissuance of treasury shares under share-based payments | | | | | | | 27 | | | | | | | | | | | | | | | | | | | | 251 | | | | 278 | | | | | | | | 278 | |
Change in non-controlling interests | | | | | | | | | | | -19 | | | | | | | | | | | | | | | | | | | | -19 | | | | -10 | | | | -29 | |
| | | | | | | | | | | | | | | | | | | | | | | | | | | | | | | | | | | | | | | | |
December 31, 2011 | | | 1,228 | | | | 419 | | | | 12,448 | | | | -19 | | | | 9 | | | | -27 | | | | -1,377 | | | | 12,681 | | | | 8 | | | | 12,689 | |
Profit after tax | | | | | | | | | | | 2,803 | | | | | | | | | | | | | | | | | | | | 2,803 | | | | | | | | 2,803 | |
Other comprehensive income | | | | | | | | | | | -8 | | | | -217 | | | | 13 | | | | 47 | | | | | | | | -165 | | | | | | | | -165 | |
Comprehensive income | | | | | | | | | | | 2,795 | | | | -217 | | | | 13 | | | | 47 | | | | | | | | 2,638 | | | | | | | | 2,638 | |
| Share-based payments | | | | | | | 41 | | | | | | | | | | | | | | | | | | | | | | | | 41 | | | | | | | | 41 | |
| Dividends | | | | | | | | | | | -1,310 | | | | | | | | | | | | | | | | | | | | -1,310 | | | | | | | | -1,310 | |
| Issuance of shares under share-based payments | | | 1 | | | | 14 | | | | | | | | | | | | | | | | | | | | | | | | 15 | | | | | | | | 15 | |
Purchase of treasury shares | | | | | | | | | | | | | | | | | | | | | | | | | | | -53 | | | | -53 | | | | | | | | -53 | |
| Reissuance of treasury shares under share-based payments | | | | | | | 18 | | | | | | | | | | | | | | | | | | | | 93 | | | | 111 | | | | | | | | 111 | |
| Other | | | | | | | | | | | 2 | | | | | | | | | | | | | | | | | | | | 2 | | | | | | | | 2 | |
| | | | | | | | | | | | | | | | | | | | | | | | | | | | | | | | | | | | | | | | |
December 31, 2012 | | | 1,229 | | | | 492 | | | | 13,934 | | | | -236 | | | | 22 | | | | 20 | | | | -1,337 | | | | 14,125 | | | | 8 | | | | 14,133 | |
Profit after tax | | | | | | | | | | | 3,326 | | | | | | | | | | | | | | | | | | | | 3,326 | | | | -1 | | | | 3,325 | |
Other comprehensive income | | | | | | | | | | | 13 | | | | -584 | | | | 60 | | | | 0 | | | | | | | | -511 | | | | | | | | -511 | |
Comprehensive income | | | | | | | | | | | 3,339 | | | | -584 | | | | 60 | | | | 0 | | | | | | | | 2,815 | | | | -1 | | | | 2,814 | |
| Share-based payments | | | | | | | 30 | | | | | | | | | | | | | | | | | | | | | | | | 30 | | | | | | | | 30 | |
| Dividends | | | | | | | | | | | -1,013 | | | | | | | | | | | | | | | | | | | | -1,013 | | | | | | | | -1,013 | |
| Reissuance of treasury shares under share-based payments | | | | | | | 29 | | | | | | | | | | | | | | | | | | | | 57 | | | | 86 | | | | | | | | 86 | |
| | | | | | | | | | | | | | | | | | | | | | | | | | | | | | | | | | | | | | | | |
December 31, 2013 | | | 1,229 | | | | 551 | | | | 16,258 | | | | -820 | | | | 82 | | | | 20 | | | | -1,280 | | | | 16,040 | | | | 8 | | | | 16,048 | |
The accompanying Notes are an integral part of these Consolidated Financial Statements.
| | |
| | Consolidated Financial Statements IFRS 165 |
Consolidated Statements of Cash Flows of SAP Group for the Years Ended December 31,
€ millions
| | | | | | | | | | | | | | | | |
| | | Notes | | | 2013 | | | 2012 | | | 2011 | |
| Profit after tax | | | | | | | 3,325 | | | | 2,803 | | | | 3,437 | |
| Adjustments to reconcile profit after taxes to net cash flows provided by operating activities: | | | | | | | | | | | | | | | | |
Depreciation and amortization | | | (15), (16 | ) | | | 951 | | | | 863 | | | | 724 | |
Income tax expense | | | (10 | ) | | | 1,071 | | | | 993 | | | | 1,331 | |
Financial income, net | | | (9 | ) | | | 66 | | | | 72 | | | | 42 | |
Decrease/increase in sales and bad debt allowances on trade receivables | | | | | | | 42 | | | | -25 | | | | -18 | |
Other adjustments for non-cash items | | | | | | | 57 | | | | 31 | | | | 14 | |
Decrease/increase in trade and other receivables | | | | | | | -110 | | | | -298 | | | | -426 | |
Decrease/increase in other assets | | | | | | | -131 | | | | -23 | | | | -39 | |
Decrease/increase in trade payables, provisions, and other liabilities | | | | | | | -176 | | | | 420 | | | | -404 | |
Decrease/increase in deferred income | | | | | | | 125 | | | | 154 | | | | 121 | |
| Cash outflows due to TomorrowNow litigation | | | (23 | ) | | | -1 | | | | 7 | | | | -52 | |
| Interest paid | | | | | | | -159 | | | | -165 | | | | -139 | |
| Interest received | | | | | | | 67 | | | | 92 | | | | 92 | |
| Income taxes paid, net of refunds | | | | | | | -1,295 | | | | -1,102 | | | | -908 | |
| | | | | | | | | | | | | | | | |
| Net cash flows from operating activities | | | | | | | 3,832 | | | | 3,822 | | | | 3,775 | |
| Business combinations, net of cash and cash equivalents acquired | | | (4 | ) | | | -1,160 | | | | -6,094 | | | | -188 | |
| Purchase of intangible assets and property, plant, and equipment | | | | | | | -566 | | | | -541 | | | | -445 | |
| Proceeds from sales of intangible assets or property, plant, and equipment | | | | | | | 55 | | | | 39 | | | | 55 | |
| Purchase of equity or debt instruments of other entities | | | | | | | -1,531 | | | | -1,022 | | | | -2,046 | |
| Proceeds from sales of equity or debt instruments of other entities | | | | | | | 1,421 | | | | 1,654 | | | | 1,398 | |
| | | | | | | | | | | | | | | | |
| Net cash flows from investing activities | | | | | | | -1,781 | | | | -5,964 | | | | -1,226 | |
| Purchase of non-controlling interests | | | | | | | 0 | | | | 0 | | | | -28 | |
| Dividends paid | | | (21 | ) | | | -1,013 | | | | -1,310 | | | | -713 | |
| Purchase of treasury shares | | | (21 | ) | | | 0 | | | | -53 | | | | -246 | |
| Proceeds from reissuance of treasury shares | | | | | | | 49 | | | | 90 | | | | 251 | |
| Proceeds from issuing shares (share-based payments) | | | | | | | 0 | | | | 15 | | | | 46 | |
| Proceeds from borrowings | | | | | | | 1,000 | | | | 5,778 | | | | 519 | |
| Repayments of borrowings | | | | | | | -1,625 | | | | -4,714 | | | | -1,005 | |
| | | | | | | | | | | | | | | | |
| Net cash flows from financing activities | | | | | | | -1,589 | | | | -194 | | | | -1,176 | |
| Effect of foreign currency exchange rates on cash and cash equivalents | | | | | | | -191 | | | | -152 | | | | 74 | |
| Net decrease/increase in cash and cash equivalents | | | | | | | 271 | | | | -2,488 | | | | 1,447 | |
| | | | | | | | | | | | | | | | |
| Cash and cash equivalents at the beginning of the period | | | (21 | ) | | | 2,477 | | | | 4,965 | | | | 3,518 | |
| | | | | | | | | | | | | | | | |
| Cash and cash equivalents at the end of the period | | | (21 | ) | | | 2,748 | | | | 2,477 | | | | 4,965 | |
The accompanying Notes are an integral part of these Consolidated Financial Statements.
| | |
| 166 Consolidated Statements of Cash Flows | | |
Notes to the Consolidated Financial Statements
(1) GENERAL INFORMATION ABOUT CONSOLIDATED FINANCIAL STATEMENTS
The accompanying Consolidated Financial Statements of SAP AG and its subsidiaries (collectively, “we,” “us,” “our,” “SAP,” “Group,” and “Company”) have been prepared in accordance with International Financial Reporting Standards (IFRS). The designation “IFRS” includes all standards issued by the International Accounting Standards Board (IASB) and related interpretations issued by the IFRS Interpretations Committee (IFRIC).
We have applied all standards and interpretations that were effective on and endorsed by the European Union (EU) as at December 31, 2013. There were no standards or interpretations impacting our Consolidated Financial Statements for the years ended December 31, 2013, 2012, and 2011, that were effective but not yet endorsed. Therefore our Consolidated Financial Statements comply with both IFRS as issued by the IASB and with IFRS as endorsed by the EU.
Our Executive Board approved the Consolidated Financial Statements on February 20, 2014, for submission to our Supervisory Board.
All amounts included in the Consolidated Financial Statements are reported in millions of euros (€ millions) except where otherwise stated. Due to rounding, numbers presented throughout this document may not add up precisely to the totals we provide and percentages may not precisely reflect the absolute figures.
(2) SCOPE OF CONSOLIDATION
The Consolidated Financial Statements include SAP AG and all subsidiaries of SAP AG.
The following table summarizes the changes in the number of entities included in the Consolidated Financial Statements.
Entities Consolidated in the Financial Statements
| | | | | | | | | | | | |
| | | German | | | Foreign | | | Total | |
| December 31, 2011 | | | 23 | | | | 176 | | | | 199 | |
| Additions | | | 4 | | | | 92 | | | | 96 | |
| Disposals | | | -5 | | | | -23 | | | | -28 | |
| | | | | | | | | | | | |
| December 31, 2012 | | | 22 | | | | 245 | | | | 267 | |
| Additions | | | 1 | | | | 24 | | | | 25 | |
| Disposals | | | -1 | | | | -19 | | | | -20 | |
| | | | | | | | | | | | |
| December 31, 2013 | | | 22 | | | | 250 | | | | 272 | |
The additions relate to legal entities added in connection with acquisitions and foundations. The disposals are due to sales, mergers and liquidations of legal entities.
In August 2013, we acquired hybris AG, which may affect comparability of our 2013 Consolidated Financial Statements with our 2012 and 2011 Consolidated Financial Statements. For more information about our business combinations and the effect on our Consolidated Financial Statements, see Note (4).
| | |
| | Notes to the Consolidated Financial Statements 167 |
(3) SUMMARY OF SIGNIFICANT ACCOUNTING POLICIES
(3a) Bases of Measurement
The Consolidated Financial Statements have been prepared on the historical cost basis except for the following:
| ¡ | | Derivative financial instruments, available-for-sale financial assets, and liabilities for cash-settled share-based payments are measured at fair value. |
| ¡ | | Monetary assets and liabilities denominated in foreign currencies are translated at period-end exchange rates. |
| ¡ | | Post-employment benefits are measured according to IAS 19 (Employee Benefits) as described in Note (18a). |
Where applicable, information about the methods and assumptions used in determining the respective measurement bases is disclosed in the Notes specific to that asset or liability.
(3b) Relevant Accounting policies
Business Combinations and Goodwill
Business combinations are accounted for using the acquisition method as at the closing date, which is the date on which we obtain control of the acquiree. The consideration transferred in an acquisition is measured at the fair value of the assets transferred and liabilities incurred at the date of transfer of control. Settlements of pre-existing relationships are not included in the consideration transferred. Such amounts are recognized in profit and loss. Identifiable assets acquired and liabilities assumed in a business combination (including contingent consideration) are measured at their acquisition date fair values. Changes in contingent consideration classified as a liability at the acquisition date are recognized in profit and loss unless they related to facts that existed at the measurement date that we become aware of during the measurement period. We decide on a transaction-by-transaction basis whether to measure the non-controlling interest in the acquiree either at fair value or at the proportionate share of the acquiree’s identifiable net assets. Acquisition-related costs are accounted as expense in the periods in which the costs are incurred and the services are received, with the expense being classified as general and administration expense.
The excess of the consideration transferred in a business combination over the fair value of the identifiable net assets acquired is recorded as goodwill.
With respect to at-equity investments, the carrying amount of goodwill is included in the carrying amount of the investment.
Foreign Currencies
Assets and liabilities of our foreign subsidiaries that use a functional currency other than the euro are translated at the closing rate at the date of the Statement of Financial Position. Income and expenses are translated at average rates of exchange computed on a monthly basis. All resulting exchange differences are recognized in other comprehensive income. Exchange differences from monetary items denominated in foreign currency transactions that are part of a long-term investment (that is, settlement is neither planned nor likely to occur in the foreseeable future) are also included in other comprehensive income. When a foreign operation is disposed of, liquidated, or abandoned, the foreign currency translation adjustments applicable to that entity are reclassified from other comprehensive income to profit or loss.
| | |
| 168 Consolidated Financial Statements IFRS | | |
On initial recognition, foreign currency transactions are recorded in the respective functional currencies of Group entities by applying to the foreign currency amount the exchange rate at the date of the transaction. Monetary assets and liabilities that are denominated in foreign currencies are remeasured at the period-end closing rate. Resulting exchange differences are recognized, in the period in which they arise, in other non-operating expense.
Operating cash flows of foreign subsidiaries are translated into euros using average rates of exchange computed on a monthly basis. Investing and financing cash flows of foreign subsidiaries are translated into euros using the exchange rates in effect at the time of the respective transaction. The effect of exchange rate changes on cash is reported in a separate line item in the Consolidated Statements of Cash Flows.
Any goodwill arising from the acquisition of a foreign operation and any fair value adjustments to the carrying amounts of assets and liabilities arising from the acquisition are treated as assets and liabilities of the foreign operation and translated at the respective closing rates.
The exchange rates of key currencies affecting the Company were as follows:
Exchange Rates
Equivalent to €1
| | | | | | | | | | | | | | | | | | | | | | | | |
| | | | | | Closing Rate as at December 31, | | | Annual Average Exchange Rate | |
| | | | | | 2013 | | | 2012 | | | 2013 | | | 2012 | | | 2011 | |
| U.S. dollar | | | USD | | | | 1.3791 | | | | 1.3194 | | | | 1.3301 | | | | 1.2862 | | | | 1.3863 | |
| Pound sterling | | | GBP | | | | 0.8337 | | | | 0.8161 | | | | 0.8482 | | | | 0.8104 | | | | 0.8656 | |
| Japanese yen | | | JPY | | | | 144.72 | | | | 113.61 | | | | 130.21 | | | | 103.05 | | | | 110.17 | |
| Swiss franc | | | CHF | | | | 1.2276 | | | | 1.2072 | | | | 1.2302 | | | | 1.2055 | | | | 1.2299 | |
| Canadian dollar | | | CAD | | | | 1.4671 | | | | 1.3137 | | | | 1.3710 | | | | 1.2843 | | | | 1.3739 | |
| Australian dollar | | | AUD | | | | 1.5423 | | | | 1.2712 | | | | 1.3944 | | | | 1.2419 | | | | 1.3436 | |
Revenue Recognition
We derive our revenue from fees charged to our customers for (a) licenses to our on-premise software products, (b) the use of our hosted cloud subscription software offerings and (c) support, consulting, development, training, and other services. The majority of our software arrangements include support services, and many also include professional services and other elements.
Software and software-related service revenue, as shown in our Consolidated Income Statements, is the sum of our software revenue, our support revenue and our cloud subscriptions and support revenue. Professional services and other service revenue as shown in our Consolidated Income Statements is the sum of our consulting revenue and other service revenue. Other service revenue as shown in our Consolidated Income Statements mainly consists of revenue from training services, messaging services, and SAP marketing events. Revenue information by segment and geographic region is disclosed in Note (28).
| | |
| | Notes to the Consolidated Financial Statements 169 |
If, for any of our product or service offerings, we determine at the outset of an arrangement that the amount of revenue cannot be measured reliably, we conclude that the inflow of economic benefits associated with the transaction is not probable, and we defer revenue recognition until the arrangement fee becomes due and payable by the customer. If, at the outset of an arrangement, we determine that collectability is not probable, we conclude that the inflow of economic benefits associated with the transaction is not probable, and we defer revenue recognition until the earlier of when collectability becomes probable or payment is received. If collectability becomes not probable before all revenue from an arrangement is recognized, we recognize revenue only to the extent of the fees that are successfully collected unless collectability becomes probable again. If a customer is specifically identified as a bad debtor, we stop recognizing revenue from the customer except to the extent of the fees that have already been collected.
We account for out-of-pocket expenses invoiced by SAP and reimbursed by customers as support, cloud subscription and support, consulting, or other service revenue, depending on the nature of the service for which the out-of-pocket expenses were incurred.
Software revenue represents fees earned from the sale or license of software to customers for use on the customer’s premises, in other words, where the customer has the right to take possession of the software for installation on the customer’s premises (on-premise software). Revenue from the sale of perpetual licenses of our standard software products is recognized in line with the requirements for selling goods stated in IAS 18 (Revenue) when evidence of an arrangement exists, delivery has occurred, the risks and rewards of ownership have been transferred to the customer, the amount of revenue and associated costs can be measured reliably, and collection of the related receivable is probable. The fee of the sale is recognized net of returns and allowances, trade discounts, and volume rebates.
We usually sell or license on-premise software on a perpetual basis. Occasionally, we license on-premise software for a specified period of time. Revenue from short-term time-based licenses, which usually include support services during the license period, is recognized ratably over the license term. Revenue from multi-year time-based licenses that include support services, whether separately priced or not, is recognized ratably over the license term unless a substantive support service renewal rate exists; if this is the case, the amount allocated to the delivered software is recognized as software revenue based on the residual method once the basic criteria described above have been met.
In general, our software license agreements do not include acceptance-testing provisions. If an arrangement allows for customer acceptance-testing of the software, we defer revenue until the earlier of customer acceptance or when the acceptance right lapses.
We usually recognize revenue from on-premise software arrangements involving resellers on evidence of sell-through by the reseller to the end-customer, because the inflow of the economic benefits associated with the arrangements to us is not probable before sell-through has occurred.
Sometimes we enter into customer-specific on-premise software development agreements. We recognize software revenue in connection with these arrangements using the percentage-of-completion method based on contract costs incurred to date as a percentage of total estimated contract costs required to complete the development work. If we do not have a sufficient basis to reasonably measure the progress of completion or to estimate the total contract revenue and costs, revenue is recognized only to the extent of the contract costs incurred for which we believe recoverability to be probable. When it becomes probable that total contract costs exceed total contract revenue in an arrangement, the expected losses are recognized immediately as an expense based on the costs attributable to the contract.
170 Consolidated Financial Statements IFRS
On-premise software subscription contracts combine software and support service elements, as under these contracts the customer is provided with current software products, rights to receive unspecified future software products, and rights to product support during the on-premise software subscription term. Customers pay a periodic fee for a defined subscription term, and we recognize such fees ratably over the term of the arrangement beginning with the delivery of the first product. Revenue from on-premise software subscription contracts is allocated to the software revenue and support revenue line items in our Consolidated Income Statements.
On-premise software rental contracts also combine software and support service elements. Under such contracts the customer is provided with current software products and product support, but not with the right to receive unspecified future software products. Customers pay a periodic fee over the rental term. We recognize fees from software rental contracts ratably over the term of the arrangement. Revenue from rental contracts is allocated to the software revenue and support revenue line items in our Consolidated Income Statements.
Support revenue represents fees earned from providing customers with unspecified future software updates, upgrades, and enhancements, and technical product support services for on-premise software products. We recognize support revenue based on our performance under the support arrangements. Under our major support services our performance obligation is to stand ready to provide technical product support and to provide unspecified updates and enhancements on a when-and-if-available basis. For these support services we recognize revenue ratably over the term of the support arrangement. We do not sell separately technical product support or unspecified software upgrades, updates, and enhancements. Accordingly, we do not distinguish within software and software-related service revenue or within cost of software and software-related services the amounts attributable to technical support services and unspecified software upgrades, updates, and enhancements.
Revenue from cloud subscriptions and support represents fees earned from providing customers with:
| ¡ | | The right to use software in a cloud-based-infrastructure (hosting) provided by SAP, where the customer does not have the right to terminate the hosting contract and take possession of the software to run it on the customer’s own IT infrastructure or by a third party hosting provider without significant penalty, or |
| ¡ | | Additional premium support beyond the standard support which is included in SAP’s basic cloud subscription fees, or |
| ¡ | | Hosting services and related application management services for software hosted by SAP, where the customer has the right to terminate the hosting contract and take possession of the software without significant penalty. |
Cloud subscription and support revenue is recognized as the services are performed. Where a fixed fee is agreed for the right to continuously access and use a cloud offering for a certain term, the fee is recognized ratably over the term covered by the fixed fee. Fees that are based on actual transaction volumes are recognized as the transactions occur.
Revenue from consulting primarily represents fees earned from providing customers with consulting services which primarily relate to the installation and configuration of our software products and cloud offerings. Usually, our consulting contracts do not involve significant production, modification, or customization of software and the related revenue is recognized as the services are provided using the percentage-of-completion method of accounting as outlined above.
Notes to the Consolidated Financial Statements 171
Revenue from other services represents fees earned from providing customers with training services, application management services for software not hosted by SAP, messaging services, SAP marketing events, and referral services.
| ¡ | | Training services provide educational services to customers and partners regarding the use of our software products. We recognize training revenue and application management services as the services are rendered. |
| ¡ | | Messaging services primarily comprise the transmission of electronic text messages from one mobile phone provider to another. We recognize revenue from message services based upon the number of messages successfully processed and delivered. Revenue from fixed-price messaging arrangements is recognized ratably over the contractual term of the arrangement. |
| ¡ | | Revenue from marketing events hosted by SAP, for which SAP sells tickets to its customers, is recognized when the marketing event is completed. |
| ¡ | | Referral services comprise referring customers to partners. We recognize revenue from referral services upon providing the referral. |
The majority of our arrangements contain multiple elements. We account for software, support, cloud subscription, consulting and other service deliverables as separate units of account and allocate revenue based on fair value. Fair value is determined by establishing either company-specific objective evidence, or an estimated stand-alone selling price.
The revenue amounts allocated to the individual elements are recognized when the revenue recognition criteria described above have been met for the respective element.
We generally determine the fair value of each element based on its company-specific objective evidence of fair value, which is the price charged when that element is sold separately or, for elements not yet sold separately, the price established by our management if it is probable that the price will not change before the element is sold separately.
We derive the company-specific objective evidence of fair value for our support services from the rates charged to renew the support services annually after an initial period. Such renewal rates generally represent a fixed percentage of the discounted software license fee charged to the customer. The majority of our customers renew their annual support service contracts at these rates.
Where company-specific objective evidence of fair value or third-party evidence of selling price cannot be established for deliverables, we determine the fair value of the respective element by estimating its stand-alone selling price. This is generally the case for our cloud subscription offerings.
Estimated stand-alone selling price (ESP) for our cloud subscription offerings is determined based on the rates agreed with the individual customers to apply if and when the subscription arrangement renews. We determine ESP by considering multiple factors which include, but are not limited to, the following: i) substantive renewal rates contained within an arrangement for cloud subscription deliverables; ii) gross margin objectives and internal costs for services; and iii) pricing practices, market conditions, and competitive landscape.
We apply the residual method of revenue recognition when company-specific objective evidence of fair value or estimated stand-alone selling price exists for all of the undelivered elements in the arrangement, but does not exist for one or more delivered elements. This is generally the case in multiple element arrangements involving on-premise software and services related to on-premise software where company-specific objective evidence of fair value or estimated stand-alone selling price exists for all the services in the arrangement (for example, support services, consulting services, cloud subscription services), but does not exist for the on-premise software. Under the residual method, revenue is allocated to all undelivered elements in the amount of their respective fair values and the remaining amount of the arrangement fee is allocated to the delivered element. With this policy we have considered the guidance provided by FASB ASC Subtopic 985-605, Software Revenue Recognition (FASB ASC 985-605), where applicable, as authorized by IAS 8 Accounting Policies, Changes in Accounting Estimates and Errors (IAS 8).
172 Consolidated Financial Statements IFRS
In multiple element arrangements where company-specific objective evidence of fair value or an estimated stand-alone selling price exists for all elements, revenue is allocated to the elements based on their relative fair values (relative fair value method).
Our consideration of whether on-premise software, cloud subscriptions, consulting or other services are to be accounted for separately or as one combined element of the arrangement depends on:
| ¡ | | Whether the arrangement involves significant production, modification, or customization of the software or cloud subscription, and |
| ¡ | | Whether the services are not available from third-party vendors and are therefore deemed essential to the software. |
If neither of the above is the case, revenue for the on-premise software or cloud subscription element, and the other elements, are recognized separately. In contrast, if one or both of the above applies, the respective elements of the arrangement are combined and accounted for as a single unit of account, and the portion of the arrangement fee allocated to this single unit of account is recognized using the percentage-of-completion method, as outlined above, or over the cloud subscription term, if applicable, depending on which service term is longer.
We consider FASB ASC 985-605 in our accounting for options that entitle the customer to purchase, in the future, additional on-premise software. We allocate revenue to future incremental discounts whenever customers are granted the right to license additional on-premise software at a higher discount than the one given within the initial software license arrangement, or to purchase or renew services at rates below the fair values established for these services.
Our contributions to resellers that allow our resellers to execute qualified and approved marketing activities are recognized as an offset to revenue, unless we obtain a separate identifiable benefit for the contribution, and the fair value of the benefit is reasonably estimable.
Cost of Software and Software-Related Services
Cost of software and software-related services includes the cost incurred in producing the goods and providing the services that generate software and software-related service revenue. Consequently, this line item includes primarily employee expenses relating to these services, amortization of acquired intangibles, fees for third-party licenses, shipping and ramp-up cost.
Cost of Professional Services and Other Services
Cost of professional services and other services includes the cost incurred in providing the services that generate professional service and other service revenue including messaging revenues. The item also includes sales and marketing expenses related to our professional services and other services that result from sales and marketing efforts that cannot be clearly separated from providing the services.
Notes to the Consolidated Financial Statements 173
Research and Development
Research and development includes the costs incurred by activities related to the development of software solutions (new products, updates, and enhancements) including resource and hardware costs for the development systems.
Development activities involve the application of research findings or other knowledge to a plan or design of new or substantially improved software products before the start of commercial use. Development expenditures are capitalized only if all of the following criteria are met:
| ¡ | | The development cost can be measured reliably. |
| ¡ | | The product is technically and commercially feasible. |
| ¡ | | Future economic benefits are probable. |
| ¡ | | We intend to complete development and market the product. |
We have determined that the conditions for recognizing internally generated intangible assets from our software development activities are not met until shortly before the products are available for sale. Development costs incurred after the recognition criteria are met have not been material. Consequently, all research and development costs are expensed as incurred.
Sales and Marketing
Sales and marketing includes costs incurred for the selling and marketing activities related to our software solutions, software-related service portfolio, and cloud business.
General and Administration
General and administration includes costs related to finance and administrative functions, human resources, and general management as long as they are not directly attributable to one of the other operating expense line items.
Leases
We are a lessee of property, plant, and equipment, mainly buildings, hardware, and vehicles, under operating leases that do not transfer to us the substantive risks and rewards of ownership. Rent expense on operating leases is recognized on a straight-line basis over the life of the lease including renewal terms if, at inception of the lease, renewal is reasonably assured.
Some of our operating leases contain lessee incentives, such as up-front payments of costs or free or reduced periods of rent. The incentives are amortized over the life of the lease and the rent expense is recognized on a straight-line basis over the life of the lease. The same applies to contractually-agreed future increases of rents.
Income Tax
Deferred taxes are accounted for under the liability method. We recognize deferred tax assets and liabilities for the future tax consequences attributable to differences between the carrying amounts of existing assets and liabilities in the Consolidated Statements of Financial Position and their respective tax bases and on the carryforwards of unused tax losses and unused tax credits. Deferred tax assets are recognized to the extent that it is probable that taxable profit will be available against which the deductible temporary differences, unused tax losses, and unused tax credits can be utilized.
Deferred tax assets and liabilities are measured at the tax rates that are expected to apply to the period when the asset is realized or the liability is settled, based on tax rates and tax laws that have been enacted or substantively enacted by the end of the reporting period. The effect on deferred tax assets and liabilities of a change in tax rates is recognized in profit or loss, unless related to items recognized in other comprehensive income or directly in equity, in the period of (substantive) enactment.
174 Consolidated Financial Statements IFRS
The carrying amount of a deferred tax asset is reviewed at the end of each reporting period and is reduced to the extent that it is no longer probable that sufficient taxable profit will be available to allow the benefit of part or all of the deferred tax assets to be utilized.
We have aligned the presentation of prior period comparative amounts for tax assets and tax liabilities with the current period presentation by offsetting certain current tax assets against certain current tax liabilities and certain deferred tax assets against certain deferred tax liabilities which were not offset previously. The impact of this offsetting on the comparative amounts was to decrease both, current tax assets and current tax liabilities as of December 31, 2012, by €70 million and to decrease both, deferred tax assets and deferred tax liabilities as of December 31, 2012, by €353 million. Management concluded that these adjustments were immaterial to the consolidated financial statements.
Share-Based Payments
Share-based payments cover cash-settled and equity-settled awards issued to our employees. The fair values of both equity-settled and cash-settled awards are initially measured at grant date using an option-pricing model.
The fair value of equity-settled awards is not subsequently remeasured. The grant date fair value of equity-settled awards is recognized as personnel expense in profit or loss over the period in which the employees become unconditionally entitled to the rights, with a corresponding increase in share premium. The amount recognized as an expense is adjusted to reflect the actual number of equity-settled awards that ultimately vest. We grant our employees discounts on certain share-based payments. Since those discounts are not dependent on future services to be provided by our employees, the discount is recognized as an expense when the rights are granted.
For the share-based payments that are settled by paying cash rather than by issuing equity instruments, a provision is recorded for the rights granted reflecting the vested portion of the fair value of the rights at the end of each reporting period. Personnel expense is recognized over the period the beneficiaries are expected to perform the related service (vesting period), with a corresponding increase in provisions. Cash-settled awards are remeasured to fair value at the end of each reporting date until the award is settled. Any changes in the fair value of the provision are recognized as personnel expense in profit or loss. The amount of unrecognized compensation expense is dependent on the future price of our ordinary shares which we cannot reasonably predict.
Where we hedge our exposure to cash-settled awards, changes in the fair value of the respective hedging instruments are also recognized as personnel expense in profit or loss. The fair values for hedged programs are based on market data reflecting current market expectations.
For more information about our share-based payments, see Note (27).
Other Components of Equity
Other components of equity include:
| ¡ | | Exchange differences arising from the translation of the financial statements of our foreign operations as well as the exchange differences from intercompany long-term monetary items for which settlement is neither planned nor likely to occur in the foreseeable future |
| ¡ | | Unrealized gains and losses on available-for-sale financial assets |
| ¡ | | Gains and losses on cash flow hedges comprising the net change in fair value of the effective portion of the respective cash flow hedges that have not yet impacted profit or loss |
Notes to the Consolidated Financial Statements 175
Treasury Shares
Treasury shares are recorded at acquisition cost and are presented as a deduction from total equity. Gains and losses on the subsequent reissuance of treasury shares are credited or charged to share premium on an after-tax basis. On cancellation of treasury shares, any excess of their carrying amount over the calculated par value is charged to retained earnings.
Earnings per Share
We present basic and diluted earnings per share (EPS). Basic earnings per share is determined by dividing profit after tax attributable to equity holders of SAP AG by the weighted average number of ordinary shares outstanding during the respective year. Diluted earnings per share reflect the potential dilution assuming the conversion of all dilutive potential ordinary shares.
Financial Assets
Our financial assets comprise cash and cash equivalents (highly liquid investments with original maturities of three months or less), loans and receivables, acquired equity and debt investments, and derivative financial instruments (derivatives) with positive fair values.
These assets are recognized and measured in accordance with IAS 39 (Financial Instruments: Recognition and Measurement). Accordingly, financial assets are recognized in the Consolidated Statements of Financial Position if we have a contractual right to receive cash or other financial assets from another entity. Regular way purchases or sales of financial assets are recorded at the trade date. Financial assets are initially recognized at fair value plus, in the case of financial assets not at fair value through profit or loss, directly attributable transaction costs. Interest-free or below-market-rate loans and receivables are initially measured at the present value of the expected future cash flows. The subsequent measurement depends on the classification of our financial assets to the following categories according to IAS 39:
| ¡ | | Loans and receivables: Loans and receivables are non-derivative financial assets with fixed or determinable payments that are neither quoted in an active market nor intended to be sold in the near term. This category comprises trade receivables, receivables and loans included in other financial assets, and cash and cash equivalents. We carry loans and receivables at amortized cost less impairment losses. For further information on trade receivables, see the Trade and Other Receivables section. |
| ¡ | | Available-for-sale financial assets: Available-for-sale financial assets are non-derivative financial assets that are not assigned to either of the two other categories and mainly include equity investments and debt investments. Available-for-sale financial assets are measured at fair value, with changes in fair value being reported net of tax in other comprehensive income. Fair value changes are not recognized in profit or loss until the assets are sold or impaired. |
| ¡ | | Financial assets at fair value through profit or loss: Financial assets at fair value through profit or loss comprise only those financial assets that are held for trading, as we do not designate financial assets at fair value through profit or loss on initial recognition. This category solely contains embedded and freestanding derivatives with positive fair values. Except where hedge accounting is applied, all changes in the fair value of financial assets in this category are immediately recognized in profit or loss. For more information about derivatives, see the Derivatives section. |
All financial assets not accounted for at fair value through profit or loss are assessed for impairment at each reporting date or if we become aware of objective evidence of impairment as a result of one or more events that indicate that the carrying amount of the asset may not be recoverable. Objective evidence includes but is not limited to a significant or prolonged decline of the fair value below its carrying amount, a high probability of insolvency, or a material breach of contract by the issuer such as a significant delay or a shortfall
176 Consolidated Financial Statements IFRS
in payments due. Impairment losses in the amount of the difference between an asset’s carrying amount and the present value of the expected future cash flows or current fair value, respectively, are recognized in financial income, net. For available-for-sale financial assets such impairment losses directly reduce an asset’s carrying amount, while impairments on loans and receivables are recorded using allowance accounts. Account balances are charged off against the respective allowance after all collection efforts have been exhausted and the likelihood of recovery is considered remote. Impairment losses are reversed if the reason for the original impairment loss no longer exists. No such reversals are made for available-for-sale equity investments.
Income/expenses and gains/losses on financial assets consist of impairment losses and reversals, interest income and expenses, dividends, and gains and losses from the disposal of such assets. Dividend income is recognized when earned. Interest income is recognized based on the effective interest method. Neither dividend nor interest income is included in net gains/losses at the time of disposal of an asset. Financial assets are derecognized when contractual rights to receive cash flows from the financial assets expire or the financial assets are transferred together with all material risks and benefits.
Derivatives
We account for derivatives and hedging activities in accordance with IAS 39 at fair value.
Derivatives Without Designated Hedge Relationship
Many transactions constitute economic hedges, and therefore contribute effectively to the securing of financial risks but do not qualify for hedge accounting under IAS 39. For the hedging of currency risks inherent in foreign currency denominated and recognized monetary assets and liabilities, we do not designate our held-for-trading derivative financial instruments as accounting hedges, as the profits and losses from the underlying transactions are recognized in profit or loss in the same periods as the profits or losses from the derivatives.
Embedded Derivatives
We occasionally have contracts that require payment streams in currencies other than the functional currency of either party to the contract. Such embedded foreign currency derivatives are separated from the host contract and accounted for separately if the following are met:
| ¡ | | The economic characteristics and risks of the host contract and the embedded derivative are not closely related. |
| ¡ | | A separate instrument with the same terms as the embedded derivative would meet the definition of a derivative. |
| ¡ | | The combined instrument is not measured at fair value through profit or loss. |
Derivatives with Designated Hedge Relationship
We designate derivatives in respect of foreign currency risk or interest rate risk as cash flow or fair value hedges in a hedging relationship that qualifies for hedge accounting under IAS 39 and carry them at their fair value. At inception, we designate and document the hedge relationship, including the nature of the risk, the identification of the hedged item, the hedging instrument, and how we will assess the hedge effectiveness. Furthermore, at inception and on an ongoing basis we measure and document whether the derivatives are highly effective in
Notes to the Consolidated Financial Statements 177
offsetting the changes in the fair values or cash flows of the hedged item attributable to the hedged risk. The accounting for changes in fair value of the hedging instrument depends on the type of the hedge and the effectiveness of the hedging relationship. For more information about our hedges, see Note (25).
a) Cash Flow Hedge
In general, we apply cash flow hedge accounting to the foreign currency risk of highly probable forecasted transactions and interest rate risk on variable rate financial liabilities.
The effective portion of changes in the fair value of the derivative instrument determined to be an effective hedge is recognized in other comprehensive income and presented within other components of equity from cash flow hedges. With regard to foreign currency risk, this relates to the spot price and the intrinsic values of the derivatives designated and qualifying as cash flow hedges, while gains and losses on the interest element and on those time values excluded from the hedging relationship as well as the ineffective portion of gains or losses are recognized in profit or loss. We subsequently reclassify the effective portion of gains or losses from other comprehensive income to profit or loss when the hedged transaction affects profit or loss.
If the hedge no longer meets the criteria for hedge accounting, any cumulative gain or loss recognized in other comprehensive income at that time remains in other comprehensive income until the forecasted transaction is ultimately recognized in profit or loss. When a forecasted transaction is no longer expected to occur, the cumulative gain or loss existing in other comprehensive income at that time is immediately transferred to profit or loss.
b) Fair Value Hedge
We apply fair value hedge accounting for hedging certain of our fixed rate financial liabilities.
Changes in the fair value of derivatives that are designated and qualify as fair value hedges are recorded in profit or loss, together with any changes in the fair value of the hedged asset or liability that are attributable to the hedged risk (basis adjustment). The change in the fair value of the derivatives and the change in the hedged item attributable to the hedged risk are recognized in profit or loss in the line item relating to the hedged item.
If the hedge no longer meets the criteria for hedge accounting, the basis adjustment to the carrying amount of a hedged item for which the effective interest method is used is amortized over the period to maturity.
Valuation and Testing of Effectiveness
The effectiveness of the hedging relationship is tested prospectively and retrospectively. Prospectively, we apply the critical terms match for our foreign currency hedges as currencies, maturities, and the amounts are identical for the forecasted transactions and the spot element of the forward exchange rate contract or intrinsic value of the currency options, respectively. For interest rate swaps, we also apply the critical terms match as the notional amounts, currencies, maturities, basis of the variable legs or fixed legs, respectively, reset dates, and the dates of the interest and principal payments are identical for the debt instrument and the corresponding interest rate swaps. Therefore, over the life of the hedging instrument, the changes in the designated components of the hedging instrument will offset the impact of fluctuations of the underlying hedged items.
178 Consolidated Financial Statements IFRS
The method of retrospectively testing effectiveness depends on the type of the hedge as described further below:
a) Cash Flow Hedge
Retrospectively, effectiveness is tested on a cumulative basis applying the dollar offset method by using the hypothetical derivative method. Under this approach, the change in fair value of a constructed hypothetical derivative with terms reflecting the relevant terms of the hedged item is compared to the change in the fair value of the hedging instrument employing its relevant terms. The hedge is deemed highly effective if the results are within the range 80% to 125%.
b) Fair Value Hedge
Retrospectively, effectiveness is tested using statistical methods in the form of a regression analysis by which the validity and extent of the relationship between the change in value of the hedged items as the independent and the fair value change of the derivatives as the dependent variable is determined. The hedge is deemed highly effective if the determination coefficient between the hedged items and the hedging instruments exceeds 0.8 and the slope coefficient lies within a range of -0.8 to -1.25.
Trade and Other Receivables
Trade receivables are recorded at invoiced amounts less sales allowances and allowances for doubtful accounts. We record these allowances based on a specific review of all significant outstanding invoices. When analyzing the recoverability of our trade receivables, we consider the following factors:
| ¡ | | First, we consider the financial solvency of specific customers and record an allowance for specific customer balances when we believe it is probable that we will not collect the amount due according to the contractual terms of the arrangement. |
| ¡ | | Second, we evaluate homogenous portfolios of trade receivables according to their default risk primarily based on the age of the receivable and historical loss experience, but also taking into consideration general market factors that might impact our trade receivable portfolio. We record a general bad debt allowance to record impairment losses for a portfolio of trade receivables when we believe that the age of the receivables indicates that it is probable that a loss has occurred and we will not collect some or all of the amounts due. |
Account balances are written off, that is, charged off against the allowance after all collection efforts have been exhausted and the likelihood of recovery is considered remote.
In our Consolidated Income Statements, expenses from recording bad debt allowances for a portfolio of trade receivables are classified as other operating income, net, whereas expenses from recording bad debt allowances for specific customer balances are classified as cost of software and software-related services or cost of professional services and other services, depending on the transaction from which the respective trade receivable results. Sales allowances are recorded as an offset to the respective revenue item.
Included in trade receivables are unbilled receivables related to fixed-fee and time-and-material consulting arrangements for contract work performed to date.
Other Non-Financial Assets
Other non-financial assets are recorded at amortized cost, which approximates fair value due to their short-term nature.
Intangible Assets
We classify intangible assets according to their nature and use in our operation. Software and database licenses consist primarily of technology for internal use, whereas acquired technology consists primarily of purchased software to be incorporated into our product offerings and in-process research and development. Customer relationship and other intangibles consist primarily of customer contracts and acquired trademark licenses.
Notes to the Consolidated Financial Statements 179
All our purchased intangible assets other than goodwill have finite useful lives. They are initially measured at acquisition cost and subsequently amortized either based on expected usage or on a straight-line basis over their estimated useful lives ranging from two to 16 years.
We recognize acquired in-process research and development projects as an intangible asset separate from goodwill if a project meets the definition of an asset. Amortization for these intangible assets starts when the projects are complete and the developed software is taken to the market. We typically amortize these intangibles over five to seven years.
Amortization expenses of intangible assets are classified as cost of software and software-related services, cost of professional services and other services, research and development, sales and marketing, and general and administration depending on their use.
Property, Plant, and Equipment
Property, plant, and equipment are carried at acquisition cost plus the fair value of related asset retirement costs, if any and if reasonably estimable, and less accumulated depreciation. Interest incurred during the construction of qualifying assets is capitalized and amortized over the related assets’ estimated useful lives.
Property, plant, and equipment are depreciated over their expected useful lives, generally using the straight-line method.
Useful Lives of Property, Plant, and Equipment
| | | | |
| Buildings | | | 25 to 50 years | |
| Leasehold improvements | | | Based on the lease contract | |
| Information technology equipment | | | 3 to 5 years | |
| Office furniture | | | 4 to 20 years | |
| Automobiles | | | 4 to 5 years | |
Leasehold improvements are depreciated using the straight-line method over the shorter of the term of the lease or the useful life of the asset. If a renewal option exists, the term used reflects the additional time covered by the option if exercise is reasonably assured when the leasehold improvement is first put into operation.
Impairment of Goodwill and Non-Current Assets
We test goodwill for impairment at least annually and when events occur or changes in circumstances indicate that the recoverable amount of a cash-generating unit to which goodwill has been allocated is less than its carrying value.
The recoverable amount of goodwill is estimated each year at the same time. The goodwill impairment test is performed at the level of our operating segments since there are no lower levels in SAP at which goodwill is monitored for internal management purposes.
For the purpose of impairment testing, goodwill acquired in a business combination is allocated to the operating segments that are expected to benefit from the synergies of the combination. If the carrying amount of the operating segment to which the goodwill is allocated exceeds the recoverable amount, an impairment loss on goodwill allocated to this operating segment is recognized. The recoverable amount is the higher of the operating segment’s fair value less costs of disposal and its value in use. Fair value less costs of disposal is the price that would be received to sell an asset or cash generating unit or paid to transfer a liability in an orderly transaction between market participants at the measurement date, less the cost of
180 Consolidated Financial Statements IFRS
disposal. Value in use is the present value of the future cash flows expected to be derived from an asset or cash-generating unit. Impairment losses on goodwill are not reversed in future periods.
We review non-current assets, such as property, plant, equipment, and intangible assets for impairment whenever events or changes in circumstances indicate that the carrying amount of an asset or group of assets may not be recoverable. Intangible assets not yet available for use are tested for impairment annually.
For the purpose of impairment testing, assets that cannot be tested individually are grouped together into the smallest group of assets that generates cash inflows from continuing use that are largely independent of the cash inflows of other assets or groups of assets. If assets do not generate cash inflows that are largely independent of those from other assets or groups of assets, the impairment test is not performed at an individual asset level; instead, it is performed at the level of the cash-generating unit (CGU) to which the asset belongs.
An impairment loss is recognized if the carrying amount of an asset or its CGU exceeds its estimated recoverable amount. The recoverable amount of an asset or its CGU is the greater of its value in use and its fair value less costs of disposal. In assessing value in use, the estimated future cash flows are discounted to their present value using a pre-tax discount rate that reflects current market assessments of the time value of money and the risks specific to the asset.
Impairment losses are presented in other operating income, net in profit or loss.
Contingent Assets
We carry insurance policies to, among other things, offset the expenses associated with defending against litigation matters as well as other risks. We recognize the respective reimbursements in profit or loss when it is virtually certain that the reimbursement will be received and retained by us.
Liabilities
Financial Liabilities
Financial liabilities include trade and other payables, bank loans, issued bonds, private placements and other financial liabilities which comprise derivative and non-derivative financial liabilities.
Financial liabilities are recognized and measured in accordance with IAS 39. Accordingly, they are recognized in the Consolidated Financial Statements if we have a contractual obligation to transfer cash or another financial asset to another party. Financial liabilities are initially recognized at fair value. In the case of financial liabilities not measured at fair value through profit or loss, the initial measurement includes directly attributable transaction costs. If material, financial liabilities are discounted to present value based on prevailing market rates adjusted for credit risk, with the discount being recognized over time as interest expense. The subsequent measurement depends on the allocation of financial liabilities to the following categories according to IAS 39:
| ¡ | | Financial liabilities at fair value through profit or loss only comprise those financial liabilities that are held for trading, as we do not designate financial liabilities at fair value through profit or loss on initial recognition. This category solely contains embedded and other derivatives with negative fair values, except where hedge accounting is applied. All changes in the fair value of financial liabilities in this category are immediately recognized in profit or loss. For more information about derivatives, see the Derivatives section. |
| ¡ | | Financial liabilities at amortized cost include all nonderivative financial liabilities which are measured at amortized cost using the effective interest method. |
Notes to the Consolidated Financial Statements 181
Expenses and gains/losses on financial liabilities consist of interest expense, and gains and losses from the disposal of such liabilities. Interest expense is recognized based on the effective interest method.
Financial liabilities are derecognized when the contractual obligation is discharged, canceled, or has expired.
Non-Financial Liabilities
Other non-financial liabilities with fixed or determinable payments that are not quoted in an active market are mainly the result of obligations to employees and fiscal authorities and are generally measured at amortized cost.
Provisions
Provisions are recorded when all of the following conditions are met:
| ¡ | | It is more likely than not that we have a legal or constructive obligation to third parties as a result of a past event. |
| ¡ | | The amount can be reasonably estimated. |
| ¡ | | It is probable that there will be an outflow of future economic benefits to settle the obligation, while there may be uncertainty about the timing or amount of the future expenditure required in the settlement. |
We regularly adjust provisions as further information becomes available or circumstances change. Non-current provisions are reported at the present value of their expected settlement amounts as at the reporting date. Discount rates are regularly adjusted to current market interest rates.
A provision for restructuring is recognized when we have approved a detailed and formal restructuring plan and the restructuring has commenced or has been announced.
Post-Employment Benefits
We measure our pension-benefit liabilities and other post-employment benefits based on actuarial computations using the projected-unit-credit method in accordance with IAS 19. The assumptions used to calculate pension liabilities and costs are disclosed in Note (18a). As a result of the actuarial calculation for each plan, we recognize an asset or liability for the overfunded or underfunded status of the respective defined benefit plan. We classify a portion of the liability as current (determined on a plan-by-plan basis) if the amount by which the actuarial present value of benefits included in the benefit obligation payable within the next 12 months exceeds the fair value of plan assets. Remeasurements of the defined benefit obligation (DBO) or plan assets resulting from demographic and financial data different than originally assumed and from changes in assumptions can result in actuarial gains and losses. We recognize all such remeasurements immediately in retained earnings through other comprehensive income. They will not be reclassified to profit or loss in subsequent periods. Net interest expense and other expenses related to defined benefit plans are recognized in employee expenses.
SAP’s pension benefits are classified as defined contribution plans if the payment to a separate fund relieves SAP of all obligations from the pension plan. Obligations for contributions to defined contribution pension plans are recognized as an expense in profit or loss when paid or due.
Certain of our foreign subsidiaries are required to provide termination indemnity benefits to their employees regardless of the reason for termination (retirement, voluntary, or involuntary). We treat these plans as defined benefit pension plans if the substance of the post-employment plan is a pension-type arrangement. Most of these arrangements provide the employee with a one-time payout based on compensation levels, age, and years of service on termination independent of the reason (retirement, voluntary, or involuntary).
182 Consolidated Financial Statements IFRS
Deferred Income
Deferred income is recognized as software revenue, support revenue, cloud subscription and support revenue, consulting revenue, or other service revenue, depending on the reasons for the deferral, once the basic applicable revenue recognition criteria have been met, for example, when the related services are performed or when the discounts are used.
(3c) Management Judgments and Sources of Estimation Uncertainty
The preparation of the Consolidated Financial Statements in conformity with IFRS requires management to make judgments, estimates, and assumptions that affect the application of accounting policies and the reported amounts of assets, liabilities, revenues, and expenses, as well as disclosure of contingent assets and liabilities.
We base our judgments, estimates, and assumptions on historical and forecast information, as well as regional and industry economic conditions in which we or our customers operate, changes to which could adversely affect our estimates. Although we believe we have made reasonable estimates about the ultimate resolution of the underlying uncertainties, no assurance can be given that the final outcome of these matters will be consistent with what is reflected in our assets, liabilities, revenues, and expenses. Actual results could differ from original estimates.
The accounting policies that most frequently require us to make judgments, estimates, and assumptions, and therefore are critical to understanding our results of operations, include the following:
| ¡ | | Valuation of trade receivables |
| ¡ | | Accounting for share-based payments |
| ¡ | | Accounting for income tax |
| ¡ | | Accounting for business combinations |
| ¡ | | Subsequent accounting for goodwill and other intangibles |
| ¡ | | Accounting for legal contingencies |
| ¡ | | Recognition of internally generated intangible assets from development |
Our management periodically discusses these critical accounting policies with the Audit Committee of the Supervisory Board.
Revenue Recognition
As described in the Revenue Recognition section of Note (3b), we do not recognize revenue before persuasive evidence of an arrangement exists, delivery has occurred, the risks and rewards of ownership have been transferred to the customer, the amount of revenue can be measured reliably, and collection of the related receivable is probable. The determination of whether the amount of revenue can be measured reliably or whether the fees are collectible is inherently judgmental as it requires estimates as to whether and to what extent subsequent concessions may be granted to customers and whether the customer is expected to pay the contractual fees. The timing and amount of revenue recognition can vary depending on what assessments have been made.
In most of our revenue-generating arrangements we sell to the customer more than one product solution or service. Additionally, we have ongoing relationships with many of our customers and often enter into several transactions with the same customer within close proximity in time. We therefore have to determine the following:
| ¡ | | Which arrangements with the same customer are to be accounted for as one arrangement |
| ¡ | | Which deliverables under one arrangement are to be accounted for separately |
| ¡ | | How to allocate the total arrangement fee to the individual elements of one arrangement |
Notes to the Consolidated Financial Statements 183
The determination of whether different arrangements with the same customer are to be accounted for as one arrangement is highly judgmental, as it requires us to evaluate whether the arrangements are negotiated together or linked in any other way. The timing and amount of revenue recognition can vary depending on whether two arrangements are accounted for separately or as one arrangement.
Under an arrangement including on-premise software, or a cloud subscription, and other deliverables, we do not account for theon-premise software, or cloud subscription, and the other deliverables separately if one of the other deliverables (such as consulting services) is deemed to be essential to the functionality of the on-premise software, or cloud subscription. The determination whether an undelivered element is essential to the functionality of the delivered element requires the use of judgment. The timing and amount of revenue recognition can vary depending on how that judgment is exercised, because revenue may be recognized over a longer service term.
We also do not account separately for different deliverables under an arrangement if we have no basis for allocating the overall arrangement fee to the different elements of the arrangement. However, we believe that such allocation basis exists if we can either demonstrate for each undelivered element of the arrangement a company-specific fair value, or, where such company-specific fair value cannot be established, if we can reasonably estimate stand-alone selling prices, as further defined in the Revenue Recognition section of Note (3b). Judgment is required in the determination of an appropriate fair value measurement which may impact the timing and amount of revenue recognized depending on the following:
| ¡ | | Whether an appropriate measurement of fair value can be demonstrated for undelivered elements. |
| ¡ | | The approaches used to establish fair value. |
Additionally, our revenue for on-premise software contracts would be significantly different if we applied a revenue allocation policy other than the residual method.
Revenue from consulting, other services, and customer-specific on-premise software development projects is determined by applying the percentage-of-completion method. The percentage-of-completion method requires us to make estimates about total revenue, total cost to complete the project, and the stage of completion. The assumptions, estimates, and uncertainties inherent in determining the stage of completion affect the timing and amounts of revenue recognized and expenses reported. If we do not have a sufficient basis to measure the progress of completion or to estimate the total contract revenue and costs, revenue recognition is limited to the amount of contract costs incurred. The determination of whether a sufficient basis to measure the progress of completion exists is judgmental. Changes in estimates of progress towards completion and of contract revenue and contract costs are accounted for as cumulative catch-up adjustments to the reported revenue for the applicable contract.
Valuation of Trade Receivables
As described in the Trade and Other Receivables section in Note (3b), we account for impairments of trade receivables by recording sales allowances and allowances for doubtful accounts on an individual receivable basis and on a portfolio basis. The assessment of whether a receivable is collectible is inherently judgmental and requires the use of assumptions about customer defaults that could change significantly. Judgment is required when we evaluate available information about a particular customer’s financial situation to determine whether it is probable that a credit loss will occur and the amount of such loss is reasonably estimable and thus an allowance for that specific account is necessary. Basing the general allowance for the remaining receivables on our historical loss experience, too, is highly judgmental, as history may not be indicative of future development, particularly
184 Consolidated Financial Statements IFRS
in the global economic circumstances resulting from the recent global financial crisis. Changes in our estimates about the allowance for doubtful accounts could materially impact the reported assets and expenses in our financial statements, and our profit could be adversely affected if actual credit losses exceed our estimates.
Accounting for Share-Based Payments
We use certain assumptions in estimating the fair values for our share-based payments, including expected future share price volatility and expected option life (which represents our estimate of the average amount of time remaining until the options are exercised or expire unexercised). In addition, the final payout for these plans also depends on our share price at the respective exercise dates. All these assumptions may significantly impact the fair value determination and thus the amount and timing of our share-based payment expense. Furthermore, the fair values of the options granted under our 2009 Plan (SOP PP) are dependent on our performance against the Technology Peer Group Index (TechPGI) since the respective grant date, the volatility and the expected correlation between the market price of this index, and our share price.
For the purpose of determining the estimated fair value of our stock options, we believe expected volatility is the most sensitive assumption. Regarding future payout under the plans, the price of SAP’s shares will be the most relevant factor. The fair values of the Restricted Share Units (RSUs) granted under our Employee Participation Plan (EPP) and Long-Term Incentive Plan (LTI) 2015 depend on SAP’s share price directly after the announcement of the preliminary fourth quarter and full- year results for the last financial year of the respective performance period under the EPP (three-year holding period under the LTI 2015), and thus may be significantly above or below the budgeted amounts. With respect to our plan granted in 2009 (SOP PP), we believe that future payout will be significantly impacted not only by our share price but also by the requirement to outperform the TechPGI. Changes in these factors could significantly affect the estimated fair values as calculated by the option-pricing model, and the future payout. For more information about these plans, see Note (27).
Accounting for Income Tax
We conduct operations and earn income in numerous foreign countries and are subject to changing tax laws in multiple jurisdictions within the countries in which we operate. Our ordinary business activities also include transactions where the ultimate tax outcome is uncertain, such as those involving revenue sharing and cost reimbursement arrangements between SAP Group entities. In addition, the amount of income tax we pay is generally subject to ongoing audits by domestic and foreign tax authorities. As a result, judgment is necessary in determining our worldwide income tax provisions. We have made reasonable estimates about the ultimate resolution of our tax uncertainties based on current tax laws and our interpretation thereof. Such judgment can have a material effect on our income tax expense, income tax provision, and profit after tax.
The carrying amount of a deferred tax asset is reviewed at the end of each reporting period and is reduced to the extent that it is no longer probable that sufficient taxable profit will be available to allow the benefit of part or all of the deferred tax assets to be utilized. This assessment requires management judgment, estimates, and assumptions. In evaluating our ability to utilize our deferred tax assets, we consider all available positive and negative evidence, including the level of historical taxable income and projections for future taxable income over the periods in which the deferred tax assets are recoverable. Our judgment regarding future taxable income is based on expectations of market conditions and other facts and circumstances. Any adverse change to the underlying facts or our estimates and assumptions could require that we reduce the carrying amount of our net deferred tax assets.
For more information about our income tax, see Note (10).
Notes to the Consolidated Financial Statements 185
Accounting for Business Combinations
In our accounting for business combinations, judgment is required in determining whether an intangible asset is identifiable, and should be recorded separately from goodwill. Additionally, estimating the acquisition date fair values of the identifiable assets acquired and liabilities assumed involves considerable management judgment. The necessary measurements are based on information available at the acquisition date and are based on expectations and assumptions that have been deemed reasonable by management. These judgments, estimates, and assumptions can materially affect our financial position and profit for several reasons, among which are the following:
| ¡ | | Fair values assigned to assets subject to depreciation and amortization affect the amounts of depreciation and amortization to be recorded in operating profit in the periods following the acquisition. |
| ¡ | | Subsequent negative changes in the estimated fair values of assets may result in additional expense from impairment charges. |
| ¡ | | Subsequent changes in the estimated fair values of liabilities and provisions may result in additional expense (if increasing the estimated fair value) or additional income (if decreasing the estimated fair value). |
Subsequent Accounting for Goodwill and Other Intangibles
As described in the Intangible Assets section in Note (3b), all our intangible assets other than goodwill have finite useful lives. Consequently, the depreciable amount of the intangible assets is allocated on a systematic basis over their useful lives. Judgment is required in determining the following:
| ¡ | | The useful life of an intangible asset, as this determination is based on our estimates regarding the period over which the intangible asset is expected to produce economic benefits to us. |
| ¡ | | The amortization method, as IFRS requires the straight-line method to be used unless we can reliably determine the pattern in which the asset’s future economic benefits are expected to be consumed by us. |
Both the amortization period and the amortization method have an impact on the amortization expense that is recorded in each period.
In making impairment assessments for our intangible assets and goodwill, the outcome of these tests is highly dependent on management’s latest estimates and assumptions regarding future cash flow projections and economic risks, which are complex and require significant judgment and assumptions about future developments. They can be affected by a variety of factors, including changes in our business strategy, our internal forecasts, and an estimate of our weighted-average cost of capital. Due to these factors, actual cash flows and values could vary significantly from the forecasted future cash flows and related values derived using the discounted cash flow method. Although we believe the assumptions and estimates we have made in the past have been reasonable and appropriate, different assumptions and estimates could materially affect our financial position and profit.
The results of goodwill impairment tests may depend on the allocation of goodwill to our operating segments. This allocation is judgmental as it is based on our estimates regarding which operating segments are expected to benefit from the synergies of the business combination.
We recognized no impairment losses on our goodwill and no significant impairment losses on our intangible assets during 2013. Although we do not currently have an indication of any significant impairment, there can be no assurance that impairment losses will not occur in the future. For more information, see Note (15).
186 Consolidated Financial Statements IFRS
Accounting for Legal Contingencies
As described in Note (23), we are currently involved in various claims and legal proceedings. We review the status of each significant matter not less frequently than each quarter and assess our potential financial and business exposures related to such matters. Significant judgment is required in the determination of whether a provision is to be recorded and what the appropriate amount for such provision should be. Notably, judgment is required in the following:
| ¡ | | Determining whether an obligation exists |
| ¡ | | Determining the probability of outflow of economic benefits |
| ¡ | | Determining whether the amount of an obligation is reliably estimable |
| ¡ | | Estimating the amount of the expenditure required to settle the present obligation |
Due to uncertainties relating to these matters, provisions are based on the best information available at the time.
At the end of each reporting period, we reassess the potential obligations related to our pending claims and litigation and adjust our respective provisions to reflect the current best estimate. In addition, we monitor and evaluate new information that we receive after the end of the respective reporting period but before the Consolidated Financial Statements are authorized for issue to determine whether this provides additional information regarding conditions that existed at the end of the reporting period. Such revisions to our estimates of the potential obligations could have a material impact on our financial position and profit. For further information about this case, see Notes (18b) and (23).
Recognition of Internally Generated Intangible Assets from Development
Under IAS 38, internally generated intangible assets from the development phase are recognized if certain conditions are met. These conditions include the technical feasibility, intention to complete, the ability to use or sell the asset under development, and the demonstration of how the asset will generate probable future economic benefits. The cost of a recognized internally generated intangible asset comprises all directly attributable cost necessary to make the asset capable of being used as intended by management. In contrast, all expenditures arising from the research phase are expensed as incurred.
We believe that determining whether internally generated intangible assets from development are to be recognized as intangible assets requires significant judgment, particularly in the following areas:
| ¡ | | Determining whether activities should be considered research activities or development activities. |
| ¡ | | Determining whether the conditions for recognizing an intangible asset are met requires assumptions about future market conditions, customer demand and other developments. |
| ¡ | | The term “technical feasibility” is not defined in IFRS, and therefore determining whether the completion of an asset is technically feasible requires judgment and a company-specific approach. |
| ¡ | | Determining the future ability to use or sell the intangible asset arising from the development and the determination of the probability of future benefits from sale or use. |
| ¡ | | Determining whether a cost is directly or indirectly attributable to an intangible asset and whether a cost is necessary for completing a development. |
We have determined that the conditions for recognizing internally generated intangible assets from our software development activities are not met until shortly before the developed products are available for sale. This assessment is monitored by us on a regular basis.
Notes to the Consolidated Financial Statements 187
(3d) New Accounting Standards Adopted in the Current Period
The following new accounting standards and amendments to standards have been adopted in fiscal year 2013:
| ¡ | | Amendments to IFRS 7 (Financial Instruments: Disclosures) – Offsetting financial assets and financial liabilities, which require entities to disclose gross amounts subject to rights of set-off, amounts set off in accordance with the accounting standards followed, and the related net credit exposure. The amendments did not result in an impact on the Company’s Consolidated Financial Statements. |
| ¡ | | IFRS 10 (Consolidated Financial Statements), IFRS 11 (Joint Arrangements), and IFRS 12 (Disclosure of Interests in Other Entities) including amendments to the transition guidance for IFRS 10-12 issued in June 2012, which provide a single consolidation model that identifies control as the basis for consolidation for all types of entities, establish principles for the financial reporting by parties to a joint arrangement, and combine, enhance and replace the disclosure requirements for subsidiaries, joint arrangements, associates and structured entities. The adoption of this new set of standards (we adopted the new standards earlier than required by the European Union) did not result in a change in the financial position of the Group. However, additional qualitative and quantitative disclosure has been added, for example, with respect to consolidated structured entities. |
| ¡ | | IFRS 13 (Fair Value Measurement), which defines fair value, sets out in a single IFRS a framework for measuring fair value, and requires disclosures about fair value measurements. The adoption of the standard has resulted in additional disclosures, for example, relating to risks associated with financial instruments and to the valuation techniques used for the valuation of the financial instruments. |
| ¡ | | Amendments to IAS 1 (Presentation of Financial Statements), which aim to improve and align the presentation of items of other comprehensive income in financial statements prepared in accordance with IFRS and U.S. GAAP. Since SAP had already made appropriate changes in the Consolidated Statements of Comprehensive Income in prior years, the adoption of the standard did not result in any changes to the Consolidated Financial Statements. |
| ¡ | | Amendments to IAS 19, which aim to improve the understanding of how defined benefit plans affect an entity’s financial position, financial performance, and cash flows. The retrospective application of the revised IAS 19 in accordance with the transitional provisions set out in IAS 19.173 (as revised in 2011) resulted in the netting of items in the Consolidated Statements of Financial Position (mandatory netting of plan assets with time credits and semiretirement obligations now classified as other long-term employee benefits), reclassifications of certain employee benefit liabilities from short-term benefits to long-term benefits and consequential remeasurement of these liabilities. These changes, which are immaterial both individually and in the aggregate, resulted in amounts of adjustments for the following balance sheet line items as of December 31, 2012: decrease of non-current other financial assets by €124 million, increase of deferred tax assets by €18 million (thus reducing total assets by €106 million), increase of current other non-financial liabilities by €68 million, decrease of current and non-current other provisions by €93 million and €45 million respectively, increase of deferred tax liabilities by €3 million (thus reducing total liabilities by €67 million) and a reduction of retained earnings by €39 million. The impacts on our income statements were inconsequential in all periods presented. The standard also resulted in additional |
188 Consolidated Financial Statements IFRS
| | disclosures (for example, a sensitivity analysis for changes in defined benefit obligations, additional components considered in actuarial assumptions, etc.), for more information see Note (18a). |
| ¡ | | Amendments to IAS 36 (Impairment of Assets), which aim to remove the unintended consequences of IFRS 13 on the disclosures required under IAS 36 and expand the disclosures on recoverable amounts of assets or cash-generating units when they are based on fair value less costs of disposals. SAP has early-adopted these new amendments to IAS 36. |
(3e) New Accounting Standards Not Yet Adopted
The standards and interpretations (relevant to the Group) that are issued, but not yet effective, up to the date of issuance of the Group’s financial statements are disclosed below. The Group intends to adopt these standards, if applicable, when they become effective:
| ¡ | | IFRS 9 (Financial Instruments) and subsequent amendments to IFRS 7 and IFRS 9, which will be applicable in fiscal year 2017 at the earliest (the final mandatory effective date is expected to be determined after the final guidance has been issued). The new guidance is expected to impact the classification and measurement of financial assets. We have not yet completed the determination of the impact on our Consolidated Financial Statements. |
| ¡ | | Amendments to IAS 32 (Financial Instruments: Presentation) – Offsetting financial assets and financial liabilities, which become mandatory for the Group’s 2014 Consolidated Financial Statements, aim to eliminate inconsistencies when applying the offsetting criteria and include some clarifications. The amendments will not have a material impact on our Consolidated Financial Statements. |
(4) BUSINESS COMBINATIONS
In 2013, we concluded the following business combinations:
Acquired Businesses
| | | | | | | | | | |
| | | Sector | | Acquisition Type | | Acquired Voting Interest | | Acquisition Date | |
| Ticket-Web GmbH & Co. KG, Wildau, Germany | | Solution provider of ticketing & customer relationship management | | Asset Deal | | NA | | | March 4, 2013 | |
| | | | |
| KMS Software Company LLC., Los Angeles, California, USA | | Provider of employee onboarding solutions | | Asset Deal | | NA | | | April 1, 2013 | |
| | | | |
| Camilion Solutions, Inc., Toronto, Canada | | Solutions for the insurance industry | | Share Deal | | 100% | | | April 2, 2013 | |
| | | | |
| SmartOps Corporation, Pittsburgh, Pennsylvania, USA | | Provider of inventory and service-level optimization software solutions | | Share Deal | | 100% | | | April 12, 2013 | |
| | | | |
| hybris AG, Rotkreuz, Switzerland | | Provider of independent commerce technology (B2B and B2C) | | Share Deal | | 100% | | | August 1, 2013 | |
| | | | |
| KXEN Inc., San Francisco, California, USA | | Provider of predictive analytics technology for line of business users and analysts | | Share Deal | | 100% | | | October 1, 2013 | |
We acquire businesses in specific areas of strategic interest to us.
Notes to the Consolidated Financial Statements 189
Acquisition of hybris
On August 1, 2013, following satisfaction of applicable regulatory and other approvals, we acquired 100% of the shares of hybris AG.
hybris is a recognized leader in independent commerce technology (B2B and B2C). We expect this acquisition to combine hybris’s omnichannel commerce solution with SAP’s enterprise technology and in-memory, cloud, and mobile innovations and help facilitate new levels of customer insight and engagement.
Financial Impact of Our Acquisitions as of the Acquisition Date
The following table summarizes the values of identifiable assets acquired and liabilities assumed, as of the acquisition date.
Recognized Amounts of Identifiable Assets Acquired and Liabilities Assumed
€ millions
| | | | | | | | |
| | | Total | | | Thereof
hybris | |
| Cash and cash equivalents | | | 16 | | | | 10 | |
| Other financial assets | | | 1 | | | | 1 | |
| Trade and other receivables | | | 40 | | | | 30 | |
| Other non-financial assets | | | 5 | | | | 4 | |
| Property, plant, and equipment | | | 8 | | | | 7 | |
| Intangible assets | | | 376 | | | | 332 | |
Thereof acquired technology | | | 192 | | | | 167 | |
Thereof customer relationship and other intangibles | | | 182 | | | | 164 | |
Customer relationship | | | 156 | | | | 144 | |
Trade name | | | 11 | | | | 10 | |
Other intangible assets | | | 15 | | | | 10 | |
Thereof software and database licenses | | | 2 | | | | 1 | |
| Current and deferred tax assets | | | 21 | | | | 13 | |
| | | | | | | | |
| Total identifiable assets | | | 467 | | | | 397 | |
| Trade accounts payable | | | 13 | | | | 10 | |
| Loans and borrowings | | | 25 | | | | 24 | |
| Current and deferred tax liabilities | | | 83 | | | | 67 | |
| Provisions and other non-financial liabilities | | | 34 | | | | 30 | |
Thereof legal and litigation related liabilities | | | 1 | | | | 1 | |
| Deferred revenue | | | 16 | | | | 14 | |
| | | | | | | | |
| Total identifiable liabilities | | | 171 | | | | 145 | |
| | | | | | | | |
| Total identifiable net assets | | | 296 | | | | 252 | |
| | | | | | | | |
| Goodwill | | | 840 | | | | 780 | |
| | | | | | | | |
| Total consideration transferred in cash | | | 1,136 | | | | 1,032 | |
The goodwill arising from the acquisitions consists largely of the synergies and the know-how and technical skills of the acquired businesses’ workforces.
190 Consolidated Financial Statements IFRS
hybris goodwill is attributed to expected synergies from the acquisition particularly sourcing from the customers’ transformations from channel-centric to omnichannel business. By combining hybris commerce solutions with SAP products, we expect to enable our customers – across all devices, delivery channels and touchpoints – to provide new levels of real-time customer interaction and customer engagement.
The initial accounting for the business combinations entered into in 2013 is incomplete because we are still obtaining the information necessary to identify and measure contingent liabilities and tax related assets and liabilities of the acquired businesses. Accordingly, the respective amounts recognized in our financial statements for these items are regarded provisional as of December 31, 2013.
The acquisition-related costs incurred totaled €10 million for our 2013 business combinations, all of which were recognized in general and administration expense.
Impact of Business Combinations on Our Financial Statements
The amounts of revenue and profit or loss of the hybris business acquired in 2013 since the acquisition date included in the consolidated income statements for the reporting period are as follows:
Impact of hybris on SAP’s Financials
€ millions
| | | | |
| | | Contribution
of hybris | |
| Revenue | | | 70 | |
| Profit after tax | | | -11 | |
Had hybris been consolidated as of January 1, 2013, our estimated pro forma revenue for the reporting period would have been €16,865 million, and pro forma profit after tax would have been €3,282 million.
These amounts were calculated after applying the Company’s accounting policies and after adjusting the results for hybris to reflect, for example:
| ¡ | | Additional depreciation and amortization that would have been charged assuming the fair value adjustment to property, plant, and equipment and intangible assets had been applied from January 1, 2013 |
| ¡ | | The impact of fair value adjustments on deferred revenue on a full-year basis |
| ¡ | | The borrowing costs on the funding levels and debt/equity position of the Company after the business combination |
These pro forma numbers have been prepared for comparative purposes only. The pro forma revenue and profit numbers are not necessarily indicative of either the results of operations that would have actually occurred had the acquisition been in effect at the beginning of the respective periods or of future results.
Prior year acquisitions are described in the Consolidated Financial Statements in the 2012 Annual Report.
(5) REVENUE
For detailed information about our revenue recognition policies, see Note (3).
For revenue information by segment and geographic region, see Note (28).
Notes to the Consolidated Financial Statements 191
Revenue from construction-type contracts (contract revenue) is included in software revenue and consulting revenue depending on the type of project. The status of our construction projects in progress at the end of the reporting period accounted for under IAS 11 was as follows:
Construction Projects in Progress
€ millions
| | | | | | | | | | | | |
| | | 2013 | | | 2012 | | | 2011 | |
| Revenue recognized in the respective year | | | 194 | | | | 196 | | | | 172 | |
| Aggregate cost recognized (multi-year) | | | 221 | | | | 255 | | | | 229 | |
| Recognized result (+ profit/- loss; multi-year) | | | 87 | | | | 2 | | | | 14 | |
| Advance payments received | | | 1 | | | | 3 | | | | 5 | |
| Gross amounts due from customers | | | 3 | | | | 7 | | | | 20 | |
| Gross amounts due to customers | | | 69 | | | | 15 | | | | 44 | |
| Loss provisions | | | 3 | | | | 34 | | | | 27 | |
(6) OTHER OPERATING INCOME/EXPENSE, NET
Other operating income/expense, net, was as follows:
Other Operating Income/Expense, Net
€ millions
| | | | | | | | | | | | |
| | | 2013 | | | 2012 | | | 2011 | |
| Miscellaneous other operating expenses | | | -6 | | | | -3 | | | | -3 | |
| Gain/loss on disposals of non-current assets | | | 0 | | | | -5 | | | | 18 | |
| Miscellaneous other operating income | | | 19 | | | | 31 | | | | 10 | |
| | | | | | | | | | | | |
| Other operating income/expense, net | | | 12 | | | | 23 | | | | 25 | |
(7) EMPLOYEE BENEFITS EXPENSE AND HEADCOUNT
Employee Benefits Expense
Employee benefits expense comprises the following:
Employee Benefits Expense
€ millions
| | | | | | | | | | | | |
| | | 2013 | | | 2012 | | | 2011 | |
| Salaries | | | 5,997 | | | | 5,726 | | | | 4,938 | |
| Social security expense | | | 857 | | | | 777 | | | | 642 | |
| Pension expense | | | 212 | | | | 190 | | | | 168 | |
| Share-based payment expense | | | 327 | | | | 522 | | | | 68 | |
| Termination benefits | | | 39 | | | | 65 | | | | 65 | |
| Employee-related restructuring expense | | | 57 | | | | 6 | | | | 0 | |
| | | | | | | | | | | | |
| Employee benefits expense | | | 7,489 | | | | 7,286 | | | | 5,880 | |
Pension expense includes the amounts recorded for our defined benefit and defined contribution plans as described in Note (18a). Expenses for local state pension plans are included in social security expense.
192 Consolidated Financial Statements IFRS
Number of Employees
On December 31, 2013, the breakdown of our full-time equivalent employee numbers by function in SAP and by region was as follows:
Number of Employees
Full-time equivalents
| | | | | | | | | | | | | | | | | | | | | | | | | | | | | | | | | | | | | | | | | | | | | | | | |
| | | December 31, 2013 | | | December 31, 2012 | | | December 31, 2011 | |
| | | EMEA1) | | | Americas | | | Asia
Pacific
Japan | | | Total | | | EMEA1) | | | Americas | | | Asia
Pacific
Japan | | | Total | | | EMEA1) | | | Americas | | | Asia
Pacific
Japan | | | Total | |
| Software and software-related services | | | 4,859 | | | | 2,861 | | | | 3,541 | | | | 11,261 | | | | 4,559 | | | | 2,628 | | | | 3,364 | | | | 10,551 | | | | 4,068 | | | | 2,079 | | | | 2,816 | | | | 8,963 | |
| Professional services and other services | | | 7,177 | | | | 4,406 | | | | 3,047 | | | | 14,629 | | | | 7,020 | | | | 4,399 | | | | 2,840 | | | | 14,259 | | | | 6,808 | | | | 3,963 | | | | 2,497 | | | | 13,268 | |
| Research and development | | | 8,806 | | | | 3,630 | | | | 5,367 | | | | 17,804 | | | | 8,952 | | | | 3,672 | | | | 5,388 | | | | 18,012 | | | | 8,713 | | | | 3,028 | | | | 4,120 | | | | 15,861 | |
| Sales and marketing | | | 6,346 | | | | 6,437 | | | | 3,041 | | | | 15,824 | | | | 5,697 | | | | 6,220 | | | | 2,982 | | | | 14,899 | | | | 4,856 | | | | 4,581 | | | | 2,343 | | | | 11,780 | |
| General and administration | | | 2,424 | | | | 1,445 | | | | 697 | | | | 4,566 | | | | 2,243 | | | | 1,383 | | | | 660 | | | | 4,286 | | | | 2,073 | | | | 1,120 | | | | 542 | | | | 3,735 | |
| Infrastructure | | | 1,380 | | | | 790 | | | | 318 | | | | 2,488 | | | | 1,286 | | | | 821 | | | | 308 | | | | 2,415 | | | | 1,182 | | | | 702 | | | | 274 | | | | 2,158 | |
| | | | | | | | | | | | | | | | | | | | | | | | | | | | | | | | | | | | | | | | | | | | | | | | |
| SAP Group (December 31) | | | 30,993 | | | | 19,568 | | | | 16,011 | | | | 66,572 | | | | 29,757 | | | | 19,123 | | | | 15,542 | | | | 64,422 | | | | 27,700 | | | | 15,473 | | | | 12,592 | | | | 55,765 | |
Thereof acquisitions | | | 511 | | | | 571 | | | | 29 | | | | 1,111 | | | | 791 | | | | 2,987 | | | | 1,038 | | | | 4,816 | | | | 264 | | | | 49 | | | | 90 | | | | 403 | |
| | | | | | | | | | | | | | | | | | | | | | | | | | | | | | | | | | | | | | | | | | | | | | | | |
| SAP Group (months’ end average) | | | 30,238 | | | | 19,418 | | | | 15,752 | | | | 65,409 | | | | 29,009 | | | | 17,619 | | | | 14,506 | | | | 61,134 | | | | 27,296 | | | | 15,010 | | | | 12,040 | | | | 54,346 | |
| 1) | Europe, Middle East, Africa |
Allocation of Share-Based Payment Expense
The allocation of expense for share-based payments, net of the effects from hedging these instruments, to the various operating expense items is as follows:
Share-Based Payments
€ millions
| | | | | | | | | | | | |
| | | 2013 | | | 2012 | | | 2011 | |
| Cost of software and software-related services | | | 40 | | | | 42 | | | | 5 | |
| Cost of professional services and other services | | | 61 | | | | 104 | | | | 11 | |
| Research and development | | | 90 | | | | 125 | | | | 16 | |
| Sales and marketing | | | 96 | | | | 123 | | | | 15 | |
| General and administration | | | 40 | | | | 127 | | | | 21 | |
| | | | | | | | | | | | |
| Share-based payments | | | 327 | | | | 522 | | | | 68 | |
Thereof cash-settled share-based payments | | | 240 | | | | 450 | | | | 33 | |
Thereof equity-settled share-based payments | | | 87 | | | | 72 | | | | 35 | |
For more information about our share-based payments, see Note (27).
Notes to the Consolidated Financial Statements 193
(8) OTHER NON-OPERATING INCOME/EXPENSE, NET
Other non-operating income/expense, net was as follows:
Other Non-Operating Income/Expense, Net
€ millions
| | | | | | | | | | | | |
| | | 2013 | | | 2012 | | | 2011 | |
| Foreign currency exchange gain/loss, net | | | 4 | | | | -154 | | | | -58 | |
Thereof from financial assets/liabilities at fair value through profit or loss | | | -75 | | | | -102 | | | | 44 | |
Thereof from available for sale financial assets | | | 0 | | | | -2 | | | | 0 | |
Thereof from loans and receivables | | | 184 | | | | -32 | | | | -177 | |
Thereof from financial liabilities at amortized cost | | | -105 | | | | -20 | | | | 79 | |
Thereof from non-financial assets/liabilities | | | 0 | | | | 2 | | | | -4 | |
| Miscellaneous other non-operating income | | | 1 | | | | 4 | | | | 2 | |
| Miscellaneous other non-operating expense | | | -22 | | | | -23 | | | | -19 | |
| | | | | | | | | | | | |
| Other non-operating income/expense, net | | | -17 | | | | -173 | | | | -75 | |
194 Consolidated Financial Statements IFRS
(9) FINANCIAL INCOME, NET
Financial Income, net was as follows:
Financial Income, Net
€ millions
| | | | | | | | | | | | |
| | | 2013 | | | 2012 | | | 2011 | |
Finance income | | | | |
Interest income from | | | | | | | | | | | | |
available-for-sale financial assets (debt) | | | 0 | | | | 1 | | | | 2 | |
loans and receivables | | | 37 | | | | 45 | | | | 58 | |
derivatives | | | 32 | | | | 27 | | | | 37 | |
Gains on | | | | | | | | | | | | |
available-for-sale financial assets (debt) | | | 0 | | | | 0 | | | | 1 | |
available-for-sale financial assets (equity) | | | 46 | | | | 30 | | | | 12 | |
Share of result of associates | | | 0 | | | | 0 | | | | 9 | |
| | | | | | | | | | | | |
Finance income | | | 115 | | | | 103 | | | | 119 | |
Finance cost | | | | | | | | | | | | |
Interest expense from | | | | | | | | | | | | |
financial liabilities at amortized cost | | | -131 | | | | -130 | | | | -123 | |
derivatives | | | -23 | | | | -28 | | | | -37 | |
TomorrowNow litigation | | | 0 | | | | -1 | | | | 8 | |
Losses on | | | | | | | | | | | | |
available-for-sale financial assets (equity) | | | -2 | | | | -1 | | | | 0 | |
Impairment losses from | | | | | | | | | | | | |
available-for-sale financial assets (equity) | | | -11 | | | | -7 | | | | -2 | |
Fee expenses | | | -14 | | | | -8 | | | | -7 | |
| | | | | | | | | | | | |
Finance cost | | | -181 | | | | -175 | | | | -161 | |
| | | | | | | | | | | | |
| Financial income, net | | | -66 | | | | -72 | | | | -42 | |
Notes to the Consolidated Financial Statements 195
(10) INCOME TAX
Income tax expense for the years ended December 31 is attributable to the following regions:
Tax Expense According to Region
€ millions
| | | | | | | | | | | | |
| | | 2013 | | | 2012 | | | 2011 | |
| Current tax expense | | | | | | | | | | | | |
| Germany | | | 836 | | | | 700 | | | | 635 | |
| Foreign | | | 326 | | | | 506 | | | | 521 | |
| | | | | | | | | | | | |
| Total current tax expense | | | 1,162 | | | | 1,206 | | | | 1,156 | |
| Deferred tax expense/income | | | | | | | | | | | | |
| Germany | | | 51 | | | | -11 | | | | -14 | |
| Foreign | | | -142 | | | | -202 | | | | 189 | |
| | | | | | | | | | | | |
| Total deferred tax expense/income | | | -91 | | | | -213 | | | | 175 | |
| | | | | | | | | | | | |
| Total income tax expense | | | 1,071 | | | | 993 | | | | 1,331 | |
Income tax expense for the years ended December 31 comprised the following components:
Major Components of Tax Expense
€ millions
| | | | | | | | | | | | |
| | | 2013 | | | 2012 | | | 2011 | |
| Current tax expense/income | | | | | | | | | | | | |
| Tax expense for current year | | | 1,249 | | | | 1,173 | | | | 1,152 | |
| Taxes for prior years | | | -87 | | | | 33 | | | | 4 | |
| | | | | | | | | | | | |
| Total current tax expense | | | 1,162 | | | | 1,206 | | | | 1,156 | |
| Deferred tax expense/income | | | | | | | | | | | | |
| Origination and reversal of temporary differences | | | -168 | | | | -266 | | | | 164 | |
| Unused tax losses, research and development tax credits and foreign tax credits | | | 77 | | | | 53 | | | | 11 | |
| | | | | | | | | | | | |
| Total deferred tax expense/income | | | -91 | | | | -213 | | | | 175 | |
| | | | | | | | | | | | |
| Total income tax expense | | | 1,071 | | | | 993 | | | | 1,331 | |
Profit before tax for the years ended December 31 consisted of the following:
Profit Before Tax
€ millions
| | | | | | | | | | | | |
| | | 2013 | | | 2012 | | | 2011 | |
| Germany | | | 3,126 | | | | 2,460 | | | | 2,316 | |
| Foreign | | | 1,270 | | | | 1,336 | | | | 2,451 | |
| | | | | | | | | | | | |
| Total | | | 4,396 | | | | 3,796 | | | | 4,767 | |
196 Consolidated Financial Statements IFRS
The following table reconciles the expected income tax expense computed by applying our combined German tax rate of 26.41% (2012: 26.47%; 2011: 26.34%) to the actual income tax expense. Our 2013 combined German tax rate includes a corporate income tax rate of 15.00% (2012: 15.00%; 2011: 15.00%), plus a solidarity surcharge of 5.5% (2012: 5.5%; 2011: 5.5%) thereon, and trade taxes of 10.58% (2012: 10.64%; 2011: 10.51%).
Relationship Between Tax Expense and Profit Before Tax
€ millions, unless otherwise stated
| | | | | | | | | | | | |
| | | 2013 | | | 2012 | | | 2011 | |
| Profit before tax | | | 4,396 | | | | 3,796 | | | | 4,767 | |
| Tax expense at applicable tax rate of 26.41% (2012: 26.47%; 2011: 26.34%) | | | 1,161 | | | | 1,005 | | | | 1,256 | |
| Tax effect of: | | | | | | | | | | | | |
Foreign tax rates | | | -116 | | | | -114 | | | | 79 | |
Non-deductible expenses | | | 158 | | | | 111 | | | | 89 | |
Tax exempt income | | | -146 | | | | -169 | | | | -149 | |
Withholding taxes | | | 87 | | | | 71 | | | | 93 | |
Research and development and foreign tax credits | | | -41 | | | | -29 | | | | -33 | |
Prior-year taxes | | | -113 | | | | 15 | | | | -25 | |
Reassessment of deferred tax assets, research and development tax credits, and foreign tax credits | | | 60 | | | | 31 | | | | 0 | |
Other | | | 21 | | | | 72 | | | | 21 | |
| | | | | | | | | | | | |
| Total income tax expense | | | 1,071 | | | | 993 | | | | 1,331 | |
| | | | | | | | | | | | |
| Effective tax rate (in %) | | | 24.4 | | | | 26.2 | | | | 27.9 | |
€105 million of the prior-year tax income recognized in the current reporting period relate to assets acquired or liabilities assumed in business combinations of previous reporting periods.
Deferred tax assets and liabilities on a gross basis as at December 31 are attributable to the following items:
Recognized Deferred Tax Assets and Liabilities
€ millions
| | | | | | | | |
| | | 2013 | | | 2012 | |
| Deferred tax assets | | | | | | | | |
| Intangible assets | | | 87 | | | | 117 | |
| Property, plant, and equipment | | | 18 | | | | 35 | |
| Other financial assets | | | 7 | | | | 2 | |
| Trade and other receivables | | | 38 | | | | 67 | |
| Carryforwards of unused tax losses | | | 521 | | | | 641 | |
| Pension provisions | | | 78 | | | | 76 | |
| Share-based payments | | | 105 | | | | 122 | |
| Other provisions and obligations | | | 305 | | | | 305 | |
| Deferred income | | | 48 | | | | 46 | |
| Research and development and foreign tax credits | | | 65 | | | | 37 | |
| Other | | | 121 | | | | 120 | |
| | | | | | | | |
| Deferred tax assets | | | 1,393 | | | | 1,568 | |
| Deferred tax liabilities | | | | | | | | |
| Intangible assets | | | 696 | | | | 844 | |
| Property, plant, and equipment | | | 52 | | | | 55 | |
| Other financial assets | | | 367 | | | | 382 | |
| Trade and other receivables | | | 26 | | | | 23 | |
| Pension provisions | | | 6 | | | | 4 | |
| Share-based payments | | | 1 | | | | 2 | |
| Other provisions and obligations | | | 21 | | | | 17 | |
| Deferred income | | | 6 | | | | 20 | |
| Other | | | 39 | | | | 36 | |
| | | | | | | | |
| Deferred tax liabilities | | | 1,214 | | | | 1,383 | |
| | | | | | | | |
| Deferred tax assets/liabilities, net | | | 179 | | | | 185 | |
We retrospectively adjusted the provisional amounts recognized for deferred tax assets and liabilities related to the 2012 Ariba business combination by a corresponding decrease in goodwill in the amount of €82 million. The adjustment reflects new
Notes to the Consolidated Financial Statements 197
information obtained about facts and circumstances as of the acquisition date, mainly about the utilization of carryforwards of unused tax losses.
Deferred tax assets have not been recognized in respect of the following items for the years ended December 31:
Items Not Resulting in a Deferred Tax Asset
€ millions
| | | | | | | | | | | | |
| | | 2013 | | | 2012 | | | 2011 | |
| Unused tax losses | | | | | | | | | | | | |
| Not expiring | | | 68 | | | | 49 | | | | 38 | |
| Expiring in the following year | | | 43 | | | | 6 | | | | 10 | |
| Expiring after the following year | | | 525 | | | | 517 | | | | 93 | |
| | | | | | | | | | | | |
| Total unused tax losses | | | 636 | | | | 572 | | | | 141 | |
| Deductible temporary differences | | | 178 | | | | 202 | | | | 30 | |
| Unused research and development and foreign tax credits | | | | | | | | | | | | |
| Not expiring | | | 25 | | | | 32 | | | | 17 | |
| Expiring in the following year | | | 1 | | | | 0 | | | | 0 | |
| Expiring after the following year | | | 1 | | | | 36 | | | | 3 | |
| | | | | | | | | | | | |
| Total unused tax credits | | | 27 | | | | 68 | | | | 20 | |
€421 million (2012: €367 million; 2011: €34 million) of the unused tax losses relate to U.S. state tax loss carryforwards. As described above, prior-year numbers for unused tax losses related to the 2012 Ariba business combination were adjusted, resulting in a decrease in the amount of €743 million.
We have not recognized a deferred tax liability on approximately €7.07 billion (2012: €5.84 billion) for undistributed profits of our subsidiaries, because we are in a position to control the timing of the reversal of the temporary difference and it is probable that such differences will not reverse in the foreseeable future.
The proposed dividend payment of €1.00 per share for the year ended December 31, 2013, will not have any effects on the income tax of SAP AG.
Total income tax including the items charged or credited directly to share premium and other comprehensive income for the years ended December 31 consists of the following:
Total Income Tax
€ millions
| | | | | | | | | | | | |
| | | 2013 | | | 2012 | | | 2011 | |
| Income tax recorded in profit | | | 1,071 | | | | 993 | | | | 1,331 | |
| Income tax recorded in share premium | | | -5 | | | | -4 | | | | -10 | |
| Income tax recorded in other comprehensive income that will not be reclassified to profit and loss | | | | | | | | | | | | |
Actuarial gains/losses on defined benefit pension plans | | | 3 | | | | -4 | | | | -5 | |
| Income tax recorded in other comprehensive income that will be reclassified to profit and loss | | | | | | | | | | | | |
Gains/losses on cash flow hedges | | | 0 | | | | 17 | | | | -1 | |
Currency effects | | | 8 | | | | 3 | | | | -6 | |
| | | | | | | | | | | | |
| Total | | | 1,077 | | | | 1,005 | | | | 1,309 | |
198 Consolidated Financial Statements IFRS
The income tax recorded in share premium relates to our equity-settled share-based payment.
We are subject to ongoing tax audits by domestic and foreign tax authorities. As a result of the tax audit of SAP AG and its German subsidiaries for the years 2003 through 2006, we are in dispute with the German tax authorities in respect of intercompany financing matters. We strongly disagree with the tax authorities’ position and intend to vigorously contest it. Currently, we expect that we will need to initiate litigation to prevail. We have not recorded a provision for this matter as we believe that the tax authorities’ claim has no merit and that no adjustment is warranted. If, contrary to our view, the German tax authorities were to prevail in their arguments before the court, we would expect to have an additional tax expense (including related interest expense) for the tax audit period 2003 through 2006 and for the following years 2007 through 2013 of approximately €168 million in total.
(11) EARNINGS PER SHARE
Restricted shares (the bonus shares in the Share Matching Plan discussed in Note (27) below) granted to employees under our share-based payments are included in the diluted earnings per share calculations to the extent they have a dilutive effect.
Earnings per share for the years ended December 31 was calculated as follows:
Earnings per Share
€ millions, unless otherwise stated
| | | | | | | | | | | | |
| | | 2013 | | | 2012 | | | 2011 | |
| Profit attributable to equity holders of SAP AG | | | 3,326 | | | | 2,803 | | | | 3,435 | |
Issued ordinary shares | | | 1,229 | | | | 1,229 | | | | 1,227 | |
Effect of treasury shares | | | -35 | | | | -37 | | | | -38 | |
| Weighted average shares outstanding, basic1) | | | 1,193 | | | | 1,192 | | | | 1,189 | |
| Dilutive effect of share-based payments1) | | | 2 | | | | 1 | | | | 1 | |
| Weighted average shares outstanding, diluted1) | | | 1,195 | | | | 1,193 | | | | 1,190 | |
| | | | | | | | | | | | |
| Earnings per share, basic, attributable to equity holders of SAP AG (in €) | | | 2.79 | | | | 2.35 | | | | 2.89 | |
| | | | | | | | | | | | |
| Earnings per share, diluted, attributable to equity holders of SAP AG (in €) | | | 2.78 | | | | 2.35 | | | | 2.89 | |
| 1) | Number of shares in millions |
Notes to the Consolidated Financial Statements 199
(12) OTHER FINANCIAL ASSETS
Other financial assets as at December 31 were as follows:
Other Financial Assets
€ millions
| | | | | | | | | | | | | | | | | | | | | | | | |
| | | 2013 | | | 2012 | |
| | Current | | | Non-Current | | | Total | | | Current | | | Non-Current | | | Total | |
| Loans and other financial receivables | | | 90 | | | | 243 | | | | 333 | | | | 35 | | | | 208 | | | | 243 | |
Debt investments | | | 38 | | | | 0 | | | | 38 | | | | 15 | | | | 14 | | | | 29 | |
Equity investments | | | 0 | | | | 322 | | | | 322 | | | | 0 | | | | 201 | | | | 201 | |
| Available-for-sale financial assets | | | 38 | | | | 322 | | | | 360 | | | | 15 | | | | 215 | | | | 230 | |
| Derivatives | | | 123 | | | | 6 | | | | 129 | | | | 104 | | | | 40 | | | | 144 | |
| Investments in associates | | | 0 | | | | 36 | | | | 36 | | | | 0 | | | | 46 | | | | 46 | |
| | | | | | | | | | | | | | | | | | | | | | | | |
| Total | | | 251 | | | | 607 | | | | 858 | | | | 154 | | | | 509 | | | | 663 | |
Loans and Other Financial Receivables
Loans and other financial receivables mainly consist of time deposits, investments in pension assets for which the corresponding liability is included in employee-related obligations (see Note (18b)), other receivables, and loans to employees and third parties. The majority of our loans and other financial receivables are concentrated in the United States.
As at December 31, 2013, there were no loans and other financial receivables past due but not impaired. We have no indications of impairments of loans and other financial receivables that are not past due and not impaired as at the reporting date. For general information on financial risk and the nature of risk, see Note (24).
Available-for-Sale Financial Assets
Our available-for-sale financial assets consist of debt investments in bonds of financial and non-financial corporations and municipalities and equity investments in listed and unlisted securities.
These available-for-sale financial assets are denominated in the following currencies:
Currencies of Available-for-Sale Financial Assets
€ millions
| | | | | | | | |
| | | 2013 | | | 2012 | |
| Euros | | | 51 | | | | 36 | |
| U.S. dollars | | | 305 | | | | 185 | |
| Other | | | 4 | | | | 9 | |
| | | | | | | | |
| Total | | | 360 | | | | 230 | |
For more information on fair value measurement with regard to our equity investments, see Note (26).
Derivatives
Detailed information about our derivative financial instruments is presented in Note (25).
200 Consolidated Financial Statements IFRS
(13) TRADE AND OTHER RECEIVABLES
Trade and other receivables were as follows:
Trade and Other Receivables
€ millions
| | | | | | | | | | | | | | | | | | | | | | | | |
| | | 2013 | | | 2012 | |
| | Current | | | Non-Current | | | Total | | | Current | | | Non-Current | | | Total | |
| Trade receivables, net | | | 3,802 | | | | 14 | | | | 3,816 | | | | 3,837 | | | | 0 | | | | 3,837 | |
| Other receivables | | | 63 | | | | 84 | | | | 147 | | | | 80 | | | | 88 | | | | 168 | |
| | | | | | | | | | | | | | | | | | | | | | | | |
| Total | | | 3,865 | | | | 98 | | | | 3,963 | | | | 3,917 | | | | 88 | | | | 4,005 | |
The carrying amounts of our trade receivables as at December 31 are as follows:
Carrying Amounts of Trade Receivables
€ millions
| | | | | | | | |
| | | 2013 | | | 2012 | |
| Gross carrying amount | | | 3,954 | | | | 3,943 | |
| Sales allowances charged to revenue | | | -96 | | | | -73 | |
| Allowance for doubtful accounts charged to expense | | | -42 | | | | -33 | |
| | | | | | | | |
| Carrying amount trade receivables, net | | | 3,816 | | | | 3,837 | |
The changes in the allowance for doubtful accounts charged to expense were immaterial in all periods presented.
Concentrations of credit risks are limited due to our large customer base and its distribution across many different industries and countries worldwide.
Notes to the Consolidated Financial Statements 201
The aging of trade receivables as at December 31 was:
Aging of Trade Receivables
€ millions
| | | | | | | | |
| | | 2013 | | | 2012 | |
| Not past due and not individually impaired | | | 3,055 | | | | 3,068 | |
| Past due but not individually impaired | | | | | | | | |
Past due 1 – 30 days | | | 330 | | | | 368 | |
Past due 31 – 120 days | | | 258 | | | | 246 | |
Past due 121 – 365 days | | | 120 | | | | 90 | |
Past due over 365 days | | | 13 | | | | 14 | |
| Total past due but not individually impaired | | | 721 | | | | 718 | |
| Individually impaired, net of allowances | | | 40 | | | | 51 | |
| | | | | | | | |
| Carrying amount of trade receivables, net | | | 3,816 | | | | 3,837 | |
We believe that the recorded sales and bad debt allowances adequately provide for the credit risk inherent in trade receivables.
For more information about financial risk and how we manage it, see Notes (24) and (25).
(14) OTHER NON-FINANCIAL ASSETS
Other Non-Financial Assets
€ millions
| | | | | | | | | | | | | | | | | | | | | | | | |
| | | 2013 | | | 2012 | |
| | Current | | | Non-Current | | | Total | | | Current | | | Non-Current | | | Total | |
| Prepaid expenses | | | 179 | | | | 57 | | | | 236 | | | | 149 | | | | 68 | | | | 217 | |
| Other tax assets | | | 92 | | | | 0 | | | | 92 | | | | 74 | | | | 0 | | | | 74 | |
| Capitalized contract cost | | | 55 | | | | 50 | | | | 105 | | | | 56 | | | | 0 | | | | 56 | |
| Advance payments | | | 17 | | | | 0 | | | | 17 | | | | 11 | | | | 0 | | | | 11 | |
| Miscellaneous other assets | | | 3 | | | | 0 | | | | 3 | | | | 4 | | | | 0 | | | | 4 | |
| | | | | | | | | | | | | | | | | | | | | | | | |
| Total | | | 346 | | | | 107 | | | | 453 | | | | 294 | | | | 68 | | | | 362 | |
Prepaid expenses primarily consist of prepayments for operating leases, support services, and software royalties that will be recognized as an expense in future periods.
202 Consolidated Financial Statements IFRS
(15) GOODWILL AND INTANGIBLE ASSETS
Goodwill and Intangible Assets
€ millions
| | | | | | | | | | | | | | | | | | | | |
| | | Goodwill | | | Software and
Database Licenses | | | Acquired
Technology/IPRD | | | Customer
Relationship and
Other Intangibles | | | Total | |
| Historical cost | | | | | | | | | | | | | | | | | | | | |
| January 1, 2012 | | | 8,808 | | | | 489 | | | | 1,267 | | | | 1,930 | | | | 12,494 | |
| Foreign currency exchange differences | | | -77 | | | | -2 | | | | -3 | | | | -27 | | | | -109 | |
| Additions from business combinations | | | 4,557 | | | | 4 | | | | 578 | | | | 1,152 | | | | 6,291 | |
| Other additions | | | 0 | | | | 60 | | | | 0 | | | | 0 | | | | 60 | |
| Retirements/disposals | | | 0 | | | | -18 | | | | -64 | | | | -1 | | | | -83 | |
| December 31, 2012 | | | 13,288 | | | | 533 | | | | 1,778 | | | | 3,054 | | | | 18,653 | |
| Foreign currency exchange differences | | | -345 | | | | -2 | | | | -40 | | | | -95 | | | | -482 | |
| Additions from business combinations | | | 840 | | | | 2 | | | | 192 | | | | 182 | | | | 1,216 | |
| Other additions | | | 0 | | | | 43 | | | | 0 | | | | 0 | | | | 43 | |
| Retirements/disposals | | | 0 | | | | -18 | | | | -1 | | | | -105 | | | | -124 | |
| | | | | | | | | | | | | | | | | | | | |
| December 31, 2013 | | | 13,783 | | | | 558 | | | | 1,929 | | | | 3,036 | | | | 19,306 | |
| | | | | |
| Accumulated amortization | | | | | | | | | | | | | | | | | | | | |
| January 1, 2012 | | | 97 | | | | 295 | | | | 692 | | | | 675 | | | | 1,759 | |
| Foreign currency exchange differences | | | -1 | | | | -3 | | | | -6 | | | | -8 | | | | -18 | |
| Additions amortization | | | 0 | | | | 57 | | | | 192 | | | | 316 | | | | 565 | |
| Retirements/disposals | | | 0 | | | | -14 | | | | -64 | | | | -1 | | | | -79 | |
| Transfers | | | 0 | | | | 0 | | | | 29 | | | | -29 | | | | 0 | |
| December 31, 2012 | | | 96 | | | | 335 | | | | 843 | | | | 953 | | | | 2,227 | |
| Foreign currency exchange differences | | | -1 | | | | -2 | | | | -20 | | | | -22 | | | | -45 | |
| Additions amortization | | | 0 | | | | 51 | | | | 249 | | | | 303 | | | | 603 | |
| Retirements/disposals | | | 0 | | | | -17 | | | | -1 | | | | -105 | | | | -123 | |
| | | | | | | | | | | | | | | | | | | | |
| December 31, 2013 | | | 95 | | | | 367 | | | | 1,071 | | | | 1,129 | | | | 2,662 | |
| | | | | |
| Carrying value December 31, 2012 | | | 13,192 | | | | 198 | | | | 935 | | | | 2,101 | | | | 16,426 | |
| | | | | | | | | | | | | | | | | | | | |
| Carrying value December 31, 2013 | | | 13,688 | | | | 191 | | | | 858 | | | | 1,907 | | | | 16,644 | |
Notes to the Consolidated Financial Statements 203
The additions other than from business combinations to software and database licenses in 2013 and 2012 were individually acquired from third parties and include cross-license agreements and patents.
We carry the following significant intangible assets:
Significant Intangible Assets
| | | | | | | | | | | | |
| | | Carrying Amount
in € Millions | | | Remaining
Useful Life
in Years | |
| | | 2013 | | | 2012 | | | | |
| Business Objects – Customer relationships: Maintenance | | | 150 | | | | 181 | | | | 8–11 | |
| Sybase – Acquired technologies | | | 225 | | | | 330 | | | | 1–3 | |
| Sybase – Customer relationships: Maintenance | | | 466 | | | | 581 | | | | 9 | |
| Sybase – Customer relationships: Messaging and license | | | 66 | | | | 109 | | | | 1–7 | |
| SuccessFactors – Acquired technologies | | | 206 | | | | 260 | | | | 6 | |
| SuccessFactors – Customer relationships: Subscription | | | 383 | | | | 404 | | | | 13 | |
| Ariba – Acquired technologies | | | 186 | | | | 238 | | | | 7 | |
| Ariba – Customer relationships | | | 480 | | | | 508 | | | | 12–14 | |
| hybris – Acquired technologies | | | 159 | | | | 0 | | | | 7 | |
| hybris – Customer relationships | | | 137 | | | | 0 | | | | 4–14 | |
| | | | | | | | | | | | |
| Total significant intangible assets | | | 2,458 | | | | 2,611 | | | | | |
The carrying amount of goodwill has been allocated for impairment testing purposes to the SAP’s operating segments at December 31, 2013, and 2012, as follows:
Goodwill by Operating Segment
€ millions
| | | | | | | | | | | | | | | | | | | | |
| | | On-Premise
Products | | | On-Premise
Services | | | Cloud
Applications | | | Ariba | | | Total | |
| | | 7,462 | | | | 1,122 | | | | 2,167 | | | | 2,523 | | | | 13,274 | |
| Adjustments | | | 0 | | | | 0 | | | | 0 | | | | -82 | | | | -82 | |
| | | | | | | | | | | | | | | | | | | | |
| January 1, 2013 | | | 7,462 | | | | 1,122 | | | | 2,167 | | | | 2,441 | | | | 13,192 | |
| Additions from business combinations | | | 726 | | | | 85 | | | | 27 | | | | 2 | | | | 840 | |
| Foreign currency exchange differences | | | -105 | | | | -12 | | | | -126 | | | | -100 | | | | -344 | |
| | | | | | | | | | | | | | | | | | | | |
| December 31, 2013 | | | 8,083 | | | | 1,195 | | | | 2,067 | | | | 2,343 | | | | 13,688 | |
Prior year goodwill amounts have been adjusted by €82 million relating to tax adjustments. For more information, see Note (10).
204 Consolidated Financial Statements IFRS
Goodwill Impairment Testing
The key assumptions on which management based its cash flow projections for the period covered by the underlying business plans are as follows:
Key Assumptions in Cash Flow Projections
| | |
Key assumption | | Basis for determining values assigned to key assumption |
| |
| Budgeted revenue growth | | Revenue growth rate achieved in the current fiscal year, increased for an expected increase in SAP’s addressable cloud, mobility, and database markets; expected growth in the established categories of applications and analytics. Values assigned reflect our past experience and our expectations regarding an increase in the addressable market. |
| |
| Budgeted operating margin | | Operating margin budgeted for a given budget period equals the operating margin achieved in the current fiscal year, increased for expected efficiency improvements. Values assigned reflect past experience, except for efficiency improvements. |
| |
| Pre-tax discount rates | | Our estimated cash flow projections are discounted to present value by means of the pre-tax discount rates. Pre-tax discount rates are based on the weighted average cost of capital (WACC) approach. The WACC takes into account both debt and equity and reflects specific risks relating to the relevant segment by applying individual beta factors. |
| |
| Terminal growth rate | | Our estimated cash flow projections for periods beyond the business plan were extrapolated using the segment-specific terminal growth rates. These growth rates do not exceed the long-term average growth rates for the markets in which our segments operate. |
On-Premise Products and On-Premise Services
The recoverable amounts of the On-Premise Products and On-Premise Services segments have been determined based on value-in-use calculations. The calculations use cash flow projections based on actual operating results and a Company-wide three-year business plan approved by management.
The key assumptions are set out below:
Key Assumptions
Percent
| | | | | | | | | | | | | | | | |
| | | On-Premise Products | | | On-Premise Services | |
| | | 2013 | | | 2012 | | | 2013 | | | 2012 | |
| Pre-tax discount rates | | | 11.6 | | | | 11.5 | | | | 11.7 | | | | 10.7 | |
| Terminal growth rate | | | 3.0 | | | | 2.9 | | | | 0.9 | | | | 2.1 | |
We believe that any reasonably possible change in any of the above key assumptions would not cause the carrying amount of our On-Premise Product segment or our On-Premise Services segment to exceed their respective recoverable amounts. Even an increase in discount rate of up to five percentage points (pp) or a reduction of estimated cash flows of up to 30% would not result in any additional impairment requirement for our On-Premise Product segment or On-Premise Services segments.
Cloud Applications and Ariba
The recoverable amounts of the Cloud Application and Ariba segments have been determined based upon fair values less costs of disposal. The fair value measurement was categorized as a level 3 fair value based on the inputs used in the valuation technique. The cash flow projections are based on actual operating results and specific estimates covering a 12-year period. The projected results were determined based on management’s estimates and are consistent with the assumptions that a market participant would make. Both segments operate in a relatively immature area with significant growth rates projected for the near future. They therefore require a longer detailed planning period relative to mature segments.
Notes to the Consolidated Financial Statements 205
The key assumptions (that a market participant would make) are set out below:
Key Assumptions
Percent
| | | | | | | | |
| | | Cloud
Applications | | | Ariba | |
| | | 2013 | | | 2013 | |
| Budgeted revenue growth (average of the budgeted period) | | | 14.5 | | | | 14.5 | |
| Pre-tax discount rates | | | 13.6 | | | | 14.2 | |
| Terminal growth rate | | | 3.5 | | | | 3.5 | |
We are using a target operating margin of 36% and 34%, respectively, for the Cloud Applications segment and the Ariba segment at the end of budgeted period as a key assumption, which is within the range of expectations of market participants (for example, industry analysts).
The recoverable amounts for the Cloud Applications segment and the Ariba segment exceed the carrying amounts by €608 million (2012: €281 million) and €153 million (2012: €0 million) respectively.
In the prior year, for the Cloud Applications segment, a value-in-use calculation was used based on an eight-year business plan with budgeted revenue growth rates in a range of 14% to 51% (with higher growth rates expected in the earlier years). The pre-tax discount rate applied was 13.1% and the terminal growth rate was 3.4%. The recoverable amount for the Ariba segment was estimated using the market approach in the prior year, which represented the best estimate of fair value because of the close proximity of the transaction date to year-end. Given available market data supporting revenue and operating margin growth rates exceeding terminal value growth rates for a period longer than five years, we believe that the most appropriate valuation technique for both segments should be based upon fair value less cost of disposals in the current year.
The following table shows amounts by which the key assumptions would need to change individually for the recoverable amount to be equal to the carrying amount:
Sensitivity to Change in Assumptions
| | | | | | | | |
| | | Cloud
Applications | | | Ariba | |
| | | 2013 | | | 2013 | |
| Budgeted revenue growth (average of the budgeted period) | | | -1.7 pp | | | | -0.5 pp | |
| Pre-tax discount rates | | | +1.4 pp | | | | +0.4 pp | |
| Terminal growth rate | | | -2.7 pp | | | | -0.6 pp | |
The recoverable amount for the Cloud Applications segment would equal the carrying amount if an operating margin of only 27% were achieved from 2022, and the recoverable amount for the Ariba segment would equal the carrying amount if an operating margin of only 31% were achieved from 2024.
206 Consolidated Financial Statements IFRS
(16) PROPERTY, PLANT, AND EQUIPMENT
Property, Plant, and Equipment
€ millions
| | | | | | | | | | | | | | | | |
| | | Land and
Buildings | | | Other Property,
Plant, and
Equipment | | | Advance
Payments and
Construction
in Progress | | | Total | |
| Historical cost | | | | | | | | | | | | | | | | |
| January 1, 2012 | | | 1,360 | | | | 1,551 | | | | 7 | | | | 2,918 | |
| Foreign currency exchange differences | | | -12 | | | | -16 | | | | -1 | | | | -29 | |
| Additions from business combinations | | | 13 | | | | 22 | | | | 1 | | | | 36 | |
| Other additions | | | 55 | | | | 397 | | | | 20 | | | | 472 | |
| Retirements/disposals | | | -44 | | | | -236 | | | | -5 | | | | -285 | |
| Transfers | | | 1 | | | | 3 | | | | -4 | | | | 0 | |
| December 31, 2012 | | | 1,373 | | | | 1,721 | | | | 18 | | | | 3,112 | |
| Foreign currency exchange differences | | | -34 | | | | -48 | | | | -3 | | | | -85 | |
| Additions from business combinations | | | 1 | | | | 7 | | | | 0 | | | | 8 | |
| Other additions | | | 65 | | | | 430 | | | | 50 | | | | 545 | |
| Retirements/disposals | | | -15 | | | | -201 | | | | -6 | | | | -222 | |
| Transfers | | | 12 | | | | 3 | | | | -15 | | | | 0 | |
| | | | | | | | | | | | | | | | |
| December 31, 2013 | | | 1,402 | | | | 1,912 | | | | 44 | | | | 3,358 | |
| | | | |
| Accumulated depreciation | | | | | | | | | | | | | | | | |
| January 1, 2012 | | | 460 | | | | 907 | | | | 0 | | | | 1,367 | |
| Foreign currency exchange differences | | | -5 | | | | -12 | | | | 0 | | | | -17 | |
| Additions depreciation | | | 56 | | | | 243 | | | | 0 | | | | 299 | |
| Retirements/disposals | | | -42 | | | | -203 | | | | 0 | | | | -245 | |
| December 31, 2012 | | | 469 | | | | 935 | | | | 0 | | | | 1,404 | |
| Foreign currency exchange differences | | | -15 | | | | -31 | | | | 0 | | | | -46 | |
| Additions depreciation | | | 59 | | | | 289 | | | | 0 | | | | 348 | |
| Retirements/disposals | | | -14 | | | | -154 | | | | 0 | | | | -168 | |
| | | | | | | | | | | | | | | | |
| December 31, 2013 | | | 499 | | | | 1,039 | | | | 0 | | | | 1,538 | |
| | | | |
| Carrying value | | | | | | | | | | | | | | | | |
| December 31, 2012 | | | 904 | | | | 786 | | | | 18 | | | | 1,708 | |
| | | | | | | | | | | | | | | | |
| December 31, 2013 | | | 903 | | | | 873 | | | | 44 | | | | 1,820 | |
The additions and disposals in other property, plant, and equipment relate primarily to the replacement and purchase of computer hardware and vehicles acquired in the normal course of business.
Notes to the Consolidated Financial Statements 207
(17) TRADE AND OTHER PAYABLES, FINANCIAL LIABILITIES, AND OTHER NON-FINANCIAL LIABILITIES
(17a) Trade and Other Payables
Trade and other payables as at December 31 were as follows:
Trade and Other Payables
€ millions
| | | | | | | | | | | | | | | | | | | | | | | | |
| | | 2013 | | | 2012 | |
| | | Current | | | Non-Current | | | Total | | | Current | | | Non-Current | | | Total | |
| Trade payables | | | 640 | | | | 0 | | | | 640 | | | | 684 | | | | 0 | | | | 684 | |
| Advance payments received | | | 80 | | | | 0 | | | | 80 | | | | 81 | | | | 0 | | | | 81 | |
| Miscellaneous other liabilities | | | 130 | | | | 45 | | | | 175 | | | | 105 | | | | 63 | | | | 168 | |
| | | | | | | | | | | | | | | | | | | | | | | | |
| Trade and other payables | | | 850 | | | | 45 | | | | 895 | | | | 870 | | | | 63 | | | | 933 | |
Miscellaneous other liabilities include mainly deferral amounts for free rent periods and liabilities related to government grants.
(17b) Financial Liabilities
Financial liabilities as at December 31 were as follows:
Financial Liabilities
€ millions
| | | | | | | | | | | | | | | | | | | | | | | | | | | | | | | | | | | | | | | | |
| | | 2013 | | | 2012 | |
| | | Nominal volume | | | Carrying amount | | | Nominal volume | | | Carrying amount | |
| | | Current | | | Non-Current | | | Current | | | Non-Current | | | Total | | | Current | | | Non-Current | | | Current | | | Non-Current | | | Total | |
Bonds | | | 500 | | | | 1,800 | | | | 500 | | | | 1,791 | | | | 2,291 | | | | 600 | | | | 2,300 | | | | 600 | | | | 2,287 | | | | 2,887 | |
Private placement transactions | | | 86 | | | | 1,922 | | | | 86 | | | | 1,891 | | | | 1,977 | | | | 0 | | | | 2,094 | | | | 0 | | | | 2,088 | | | | 2,088 | |
| | | | | | | | | | | | | | | | | | | | | | | | | | | | | | | | | | | | | | | | |
| Financial Debt | | | 586 | | | | 3,722 | | | | 586 | | | | 3,682 | | | | 4,268 | | | | 600 | | | | 4,394 | | | | 600 | | | | 4,375 | | | | 4,975 | |
| Other financial liabilities | | | NA | | | | NA | | | | 162 | | | | 76 | | | | 238 | | | | NA | | | | NA | | | | 202 | | | | 71 | | | | 273 | |
| | | | | | | | | | | | | | | | | | | | | | | | | | | | | | | | | | | | | | | | |
| Financial liabilities | | | | | | | | | | | 748 | | | | 3,758 | | | | 4,506 | | | | | | | | | | | | 802 | | | | 4,446 | | | | 5,248 | |
Financial liabilities are unsecured, except for the retention of title and similar rights customary in our industry. Effective interest rates on our financial debt (including the effects from interest rate swaps) were 2.48% in 2013, 2.87% in 2012, and 2.98% in 2011.
208 Consolidated Financial Statements IFRS
For an analysis of the contractual cash flows of our financial liabilities based on maturity, see Note (24). For information on the risk associated with our financial liabilities, see Note (25). For information on fair values, see Note (26).
Bonds
As at December 31, we had outstanding bonds with the following terms:
Bonds
| | | | | | | | | | | | | | | | | | | | | | | | | | | | |
| | | Maturity | | | Issue Price | | | Coupon Rate | | | Effective
Interest Rate | | | Nominal Volume
(in € millions) | | | Balance on
12/31/2013
(in € millions) | | | Balance on
12/31/2012
(in € millions) | |
| Eurobond 1 – 2010 | | | 2014 | | | | 99.755 | % | | | 2.50% (fix) | | | | 2.64 | % | | | 500 | | | | 500 | | | | 499 | |
| Eurobond 2 – 2010 | | | 2017 | | | | 99.780 | % | | | 3.50% (fix) | | | | 3.58 | % | | | 500 | | | | 499 | | | | 498 | |
| Eurobond 4 – 2010 | | | 2013 | | | | 99.857 | % | | | 2.25% (fix) | | | | 2.38 | % | | | 600 | | | | 0 | | | | 600 | |
| Eurobond 5 – 2012 | | | 2015 | | | | 99.791 | % | | | 1.00% (fix) | | | | 1.17 | % | | | 550 | | | | 547 | | | | 547 | |
| Eurobond 6 – 2012 | | | 2019 | | | | 99.307 | % | | | 2.125% (fix) | | | | 2.27 | % | | | 750 | | | | 745 | | | | 743 | |
| | | | | | | | | | | | | | | | | | | | | | | | | | | | |
| Bonds | | | | | | | | | | | | | | | | | | | | | | | 2,291 | | | | 2,887 | |
In September 2012, we arranged a debt issuance program with an initial renewable term of 12 months. The program enables us to issue bonds in a number of tranches in different currencies up to a volume of €2.4 billion. In November 2012, we issued bonds under the program as shown in the table above. In September 2013, our debt issuance program was extended by 12 months and the volume was increased to €4 billion, all of which is available for new bond issuances.
All our Eurobonds are listed for trading on the Luxembourg Stock Exchange.
Notes to the Consolidated Financial Statements 209
Private Placement Transactions
Our private placement transactions have the following terms:
Private Placements
| | | | | | | | | | | | | | | | | | | | | | | | |
| | | Maturity | | | Coupon Rate | | | Effective
Interest Rate | | | Nominal Volume
(in respective
currency in millions) | | | Balance on
12/31/2013
(in € millions) | | | Balance on
12/31/2012
(in € millions) | |
| German promissory note | | | | | | | | | | | | | | | | | | | | | | | | |
Tranche 3 – 2009 | | | 2014 | | | | 4.92% (fix) | | | | 4.98 | % | | | €86 | | | | 86 | | | | 86 | |
| | | | | | |
| U.S. private placements | | | | | | | | | | | | | | | | | | | | | | | | |
Tranche 1 – 2010 | | | 2015 | | | | 2.34% (fix) | | | | 2.40 | % | | | US$300 | | | | 216 | | | | 227 | |
Tranche 2 – 2010 | | | 2017 | | | | 2.95% (fix) | | | | 3.03 | % | | | US$200 | | | | 145 | | | | 151 | |
Tranche 3 – 2011 | | | 2016 | | | | 2.77% (fix) | | | | 2.82 | % | | | US$600 | | | | 434 | | | | 454 | |
Tranche 4 – 2011 | | | 2018 | | | | 3.43% (fix) | | | | 3.50 | % | | | US$150 | | | | 108 | | | | 113 | |
Tranche 5 – 2012 | | | 2017 | | | | 2.13% (fix) | | | | 2.16 | % | | | US$242.5 | | | | 175 | | | | 183 | |
Tranche 6 – 2012 | | | 2020 | | | | 2.82% (fix) | | | | 2.86 | % | | | US$290 | | | | 206 | | | | 219 | |
Tranche 7 – 2012 | | | 2022 | | | | 3.18% (fix) | | | | 3.22 | % | | | US$444.5 | | | | 313 | | | | 336 | |
Tranche 8 – 2012 | | | 2024 | | | | 3.33% (fix) | | | | 3.37 | % | | | US$323 | | | | 225 | | | | 244 | |
Tranche 9 – 2012 | | | 2027 | | | | 3.53% (fix) | | | | 3.57 | % | | | US$100 | | | | 69 | | | | 75 | |
| | | | | | | | | | | | | | | | | | | | | | | | |
| Private placements | | | | | | | | | | | | | | | | | | | 1,977 | | | | 2,088 | |
The U.S. private placement notes were issued by one of our subsidiaries that has the U.S. dollar as its functional currency.
Other Financial Liabilities
Our other financial liabilities mainly comprise derivative liabilities and liabilities for accrued interest.
(17c) Other Non-Financial Liabilities
Other non-financial liabilities as at December 31 were as follows:
Other Non-Financial Liabilities
€ millions
| | | | | | | | | | | | | | | | | | | | | | | | |
| | | 2013 | | | 2012 | |
| | | Current | | | Non-Current | | | Total | | | Current | | | Non-Current | | | Total | |
| Other employee-related liabilities | | | 1,775 | | | | 112 | | | | 1,887 | | | | 1,768 | | | | 98 | | | | 1,866 | |
| Other taxes | | | 488 | | | | 0 | | | | 488 | | | | 436 | | | | 0 | | | | 436 | |
| | | | | | | | | | | | | | | | | | | | | | | | |
| Other non-financial liabilities | | | 2,263 | | | | 112 | | | | 2,375 | | | | 2,204 | | | | 98 | | | | 2,302 | |
210 Consolidated Financial Statements IFRS
Other employee-related liabilities mainly relate to vacation accruals, bonus and sales commission accruals, as well as employee-related social security obligations.
Other taxes comprise mainly payroll tax liabilities and value-added tax liabilities.
(18) PROVISIONS
Provisions as at December 31 were as follows:
Provisions
€ millions
| | | | | | | | | | | | | | | | | | | | | | | | |
| | | 2013 | | | 2012 | |
| | | Current | | | Non-Current | | | Total | | | Current | | | Non-Current | | | Total | |
| Pension plans and similar obligations (see Note (18a)) | | | 2 | | | | 62 | | | | 64 | | | | 3 | | | | 69 | | | | 72 | |
| Other provisions (see Note (18b)) | | | 643 | | | | 215 | | | | 858 | | | | 840 | | | | 278 | | | | 1,118 | |
| | | | | | | | | | | | | | | | | | | | | | | | |
| Total | | | 645 | | | | 277 | | | | 922 | | | | 843 | | | | 347 | | | | 1,190 | |
(18a) Pension Plans and Similar Obligations
We maintain several defined benefit and defined contribution pension plans for our employees in Germany and at foreign subsidiaries, which provide for old age, disability, and survivors’ benefits. The measurement dates for the domestic and foreign benefit plans are December 31. Individual benefit plans have also been established for members of our Executive Board. Furthermore, in certain countries we provide termination indemnity benefits to employees regardless of the cause for termination. These types of benefits are typically defined by law in these foreign countries.
Our domestic defined benefit pension plans provide participants with pension benefits that are based on the length of service and compensation of employees.
There is also a domestic employee-financed pension plan which SAP funds through the purchase of qualifying insurance policies and where SAP guarantees a minimum return on investment which is equivalent to the return guaranteed by the insurer. Even though the risk that SAP would be liable for a return that cannot be met by the insurance company is very remote, these employee-financed plans do not qualify as defined contribution plans under IFRS and consequently, the pension liabilities and the respective insurance policies are included in domestic plan assets and plan liabilities respectively.
Foreign defined benefit pension plans provide participants with pension benefits that are based on compensation levels, age, and length of service.
The pension plan in Switzerland accounted for €189 million of defined benefit obligation and €194 million of the plan assets. This plan consists of three benefits namely retirement benefits, disability benefits and spouse pension. These obligations are based on salary and age of the employees. Both employer and employee make contributions to the plan. Statutory minimum funding obligations exist.
Notes to the Consolidated Financial Statements 211
The following table shows the present value of the nature of the benefits provided by the defined benefit obligations:
Nature of the Benefits
€ millions
| | | | | | | | | | | | | | | | |
| | | Domestic Plans | | | Foreign Plans | | | Other Post-
Employment Plans | | | Total | |
| | | 2013 | | | 2013 | | | 2013 | | | 2013 | |
| Present value of defined benefit obligation | | | | | | | | | | | | | | | | |
| Benefits based on final salary | | | | | | | | | | | | | | | | |
Annuity | | | 14 | | | | 2 | | | | 0 | | | | 16 | |
Lump sum | | | 0 | | | | 5 | | | | 25 | | | | 30 | |
| Benefits not based on final salary | | | | | | | | | | | | | | | | |
Annuity | | | 40 | | | | 189 | | | | 1 | | | | 230 | |
Lump sum | | | 574 | | | | 35 | | | | 8 | | | | 617 | |
| | | | | | | | | | | | | | | | |
| Total | | | 628 | | | | 231 | | | | 34 | | | | 893 | |
212 Consolidated Financial Statements IFRS
The following table shows the change in present values of the defined benefit obligations (DBOs) and the fair value of the plan assets with a reconciliation of the funded status to net amounts:
Change in the Present Value of the DBO and the Fair Value of the Plan Assets
€ millions
| | | | | | | | | | | | | | | | | | | | | | | | | | | | | | | | |
| | | Domestic Plans | | | Foreign Plans | | | Other Post-
Employment Plans | | | Total | |
| | | 2013 | | | 2012 | | | 2013 | | | 2012 | | | 2013 | | | 2012 | | | 2013 | | | 2012 | |
| Change in benefit obligation | | | | | | | | | | | | | | | | | | | | | | | | | | | | | | | | |
| Benefit obligation at beginning of year | | | 597 | | | | 462 | | | | 220 | | | | 453 | | | | 32 | | | | 23 | | | | 850 | | | | 938 | |
| Current service cost | | | 7 | | | | -2 | | | | 15 | | | | 15 | | | | 3 | | | | 3 | | | | 25 | | | | 16 | |
| Interest expense | | | 19 | | | | 21 | | | | 4 | | | | 8 | | | | 1 | | | | 1 | | | | 24 | | | | 30 | |
| Employee contributions | | | 28 | | | | 26 | | | | 5 | | | | 5 | | | | 0 | | | | 0 | | | | 33 | | | | 31 | |
| Remeasurements loss (+)/gain (-) | | | -17 | | | | 94 | | | | 1 | | | | 0 | | | | -1 | | | | 6 | | | | -17 | | | | 100 | |
| Benefits paid | | | -5 | | | | -5 | | | | -4 | | | | -3 | | | | -1 | | | | -2 | | | | -10 | | | | -10 | |
| Acquisitions/divestitures | | | 0 | | | | 0 | | | | 1 | | | | 0 | | | | 2 | | | | 1 | | | | 3 | | | | 1 | |
| Curtailments/settlements | | | 0 | | | | 0 | | | | 0 | | | | -257 | | | | 0 | | | | 0 | | | | 0 | | | | -257 | |
| Past service cost | | | 0 | | | | 0 | | | | 1 | | | | 0 | | | | 0 | | | | 0 | | | | 1 | | | | 0 | |
| Foreign currency exchange rate changes | | | 0 | | | | 0 | | | | -12 | | | | -1 | | | | -2 | | | | 0 | | | | -14 | | | | -1 | |
| | | | | | | | | | | | | | | | | | | | | | | | | | | | | | | | |
| Benefit obligation at year-end | | | 628 | | | | 597 | | | | 231 | | | | 220 | | | | 34 | | | | 32 | | | | 893 | | | | 850 | |
Thereof fully or partially funded plans | | | 628 | | | | 597 | | | | 196 | | | | 180 | | | | 20 | | | | 19 | | | | 844 | | | | 796 | |
Thereof unfunded plans | | | 0 | | | | 0 | | | | 35 | | | | 40 | | | | 14 | | | | 13 | | | | 49 | | | | 54 | |
| | | | | | | | |
| Change in plan assets | | | | | | | | | | | | | | | | | | | | | | | | | | | | | | | | |
| Fair value of plan assets at beginning of year | | | 589 | | | | 461 | | | | 181 | | | | 387 | | | | 9 | | | | 6 | | | | 779 | | | | 854 | |
| Interest income | | | 20 | | | | 22 | | | | 4 | | | | 7 | | | | 1 | | | | 1 | | | | 25 | | | | 30 | |
| Employer contributions | | | 1 | | | | 1 | | | | 14 | | | | 31 | | | | 4 | | | | 4 | | | | 19 | | | | 36 | |
| Employee contributions | | | 28 | | | | 26 | | | | 5 | | | | 5 | | | | 0 | | | | 0 | | | | 33 | | | | 31 | |
| Benefits paid | | | -5 | | | | -5 | | | | -4 | | | | -3 | | | | -1 | | | | -1 | | | | -10 | | | | -9 | |
| Acquisitions/divestitures | | | 0 | | | | 0 | | | | 1 | | | | 0 | | | | 0 | | | | 0 | | | | 1 | | | | 0 | |
| Curtailments/settlements | | | 0 | | | | 0 | | | | 0 | | | | -257 | | | | 0 | | | | 0 | | | | 0 | | | | -257 | |
| Remeasurements loss (-)/gain (+) | | | -10 | | | | 84 | | | | 5 | | | | 8 | | | | 0 | | | | 0 | | | | -5 | | | | 92 | |
| Foreign currency exchange rate changes | | | 0 | | | | 0 | | | | -3 | | | | 3 | | | | -2 | | | | 0 | | | | -5 | | | | 3 | |
| | | | | | | | | | | | | | | | | | | | | | | | | | | | | | | | |
| Fair value of plan assets at year-end | | | 623 | | | | 589 | | | | 201 | | | | 181 | | | | 11 | | | | 9 | | | | 835 | | | | 779 | |
(continued)
Notes to the Consolidated Financial Statements 213
Change in the Present Value of the DBO and the Fair Value of the Plan Assets (continued)
€ millions
| | | | | | | | | | | | | | | | | | | | | | | | | | | | | | | | |
| | | Domestic Plans | | | Foreign Plans | | | Other Post-
Employment Plans | | | Total | |
| | | 2013 | | | 2012 | | | 2013 | | | 2012 | | | 2013 | | | 2012 | | | 2013 | | | 2012 | |
| Reconciliation of net defined benefit liability (asset) | | | | | | | | | | | | | | | | | | | | | | | | | | | | | | | | |
| Net defined benefit liability (asset) at beginning of year | | | 8 | | | | 1 | | | | 39 | | | | 66 | | | | 23 | | | | 17 | | | | 70 | | | | 84 | |
| Current service cost | | | 7 | | | | -2 | | | | 15 | | | | 15 | | | | 3 | | | | 3 | | | | 25 | | | | 16 | |
| Interest expense (income) | | | -1 | | | | -1 | | | | 0 | | | | 1 | | | | 0 | | | | 0 | | | | -1 | | | | 0 | |
| Employer contributions | | | -1 | | | | -1 | | | | -14 | | | | -31 | | | | -4 | | | | -4 | | | | -19 | | | | -36 | |
| Employee contributions | | | 0 | | | | 0 | | | | 0 | | | | 0 | | | | 0 | | | | 0 | | | | 0 | | | | 0 | |
| Remeasurements loss (+)/gain (-) | | | -7 | | | | 10 | | | | -4 | | | | -8 | | | | -1 | | | | 6 | | | | -12 | | | | 8 | |
| Benefits paid | | | 0 | | | | 0 | | | | 0 | | | | 0 | | | | 0 | | | | -1 | | | | 0 | | | | -1 | |
| Acquisitions/divestitures | | | 0 | | | | 0 | | | | 0 | | | | 0 | | | | 2 | | | | 1 | | | | 2 | | | | 1 | |
| Past service cost | | | 0 | | | | 0 | | | | 1 | | | | 0 | | | | 0 | | | | 0 | | | | 1 | | | | 0 | |
| Foreign currency exchange rate changes | | | 0 | | | | 0 | | | | -9 | | | | -4 | | | | 0 | | | | 0 | | | | -9 | | | | -4 | |
| | | | | | | | | | | | | | | | | | | | | | | | | | | | | | | | |
| Net defined benefit liability (asset) at year-end | | | 5 | | | | 8 | | | | 30 | | | | 39 | | | | 23 | | | | 23 | | | | 58 | | | | 71 | |
| | | | | | | | |
| Amounts recognized in the Consolidated Statement of Financial Position: | | | | | | | | | | | | | | | | | | | | | | | | | | | | | | | | |
| Non-current pension assets | | | 0 | | | | 0 | | | | 6 | | | | 1 | | | | 0 | | | | 0 | | | | 6 | | | | 1 | |
| Accrued benefit liability (current) | | | 0 | | | | 0 | | | | -2 | | | | -3 | | | | 0 | | | | 0 | | | | -2 | | | | -3 | |
| Accrued benefit liability (non-current) | | | -5 | | | | -8 | | | | -34 | | | | -37 | | | | -23 | | | | -23 | | | | -62 | | | | -69 | |
| | | | | | | | | | | | | | | | | | | | | | | | | | | | | | | | |
| Total | | | -5 | | | | -8 | | | | -30 | | | | -39 | | | | -23 | | | | -23 | | | | -58 | | | | -71 | |
214 Consolidated Financial Statements IFRS
The following weighted average assumptions were used for the actuarial valuation of our domestic and foreign pension liabilities as well as other post-employment benefit obligations as at the respective measurement date:
Actuarial Assumptions for Defined Benefit Liabilities
Percent
| | | | | | | | | | | | | | | | | | | | | | | | | | | | | | | | | | | | |
| | | Domestic Plans | | | Foreign Plans | | | Other Post-
Employment Plans | |
| | | 2013 | | | 2012 | | | 2011 | | | 2013 | | | 2012 | | | 2011 | | | 2013 | | | 2012 | | | 2011 | |
| Discount rate | | | 3.6 | | | | 3.3 | | | | 4.6 | | | | 2.1 | | | | 1.9 | | | | 3.2 | | | | 5.2 | | | | 4.8 | | | | 5.5 | |
| Future salary increases | | | 2.5 | | | | 2.5 | | | | 2.5 | | | | 1.7 | | | | 1.8 | | | | 0.8 | | | | 4.7 | | | | 4.2 | | | | 3.9 | |
| Future pension increases | | | 2.0 | | | | 2.0 | | | | 2.0 | | | | 0.0 | | | | 0.0 | | | | 0.0 | | | | 0.0 | | | | 0.0 | | | | 0.0 | |
| Employee turnover | | | 2.0 | | | | 2.0 | | | | 2.0 | | | | 9.9 | | | | 9.5 | | | | 4.2 | | | | 2.5 | | | | 2.3 | | | | 2.3 | |
| Inflation | | | 0.0 | | | | 0.0 | | | | 0.0 | | | | 1.3 | | | | 1.3 | | | | 0.5 | | | | 1.1 | | | | 1.1 | | | | 1.2 | |
The assumed discount rates are derived from rates available on high-quality corporate bonds and government bonds for which the timing and amounts of payments match the timing and the amounts of our projected pension payments.
The sensitivity analysis table shows how the present value of all defined benefit obligations would have been influenced by reasonable possible changes to above actuarial assumptions. The sensitivity analysis table presented below considers change in one actuarial assumption at a time, holding all other actuarial assumptions constant.
Sensitivity Analysis
€ millions
| | | | | | | | | | | | | | | | |
| | | Domestic Plans | | | Foreign Plans | | | Other Post-
Employment Plans | | | Total | |
| | | 2013 | | | 2013 | | | 2013 | | | 2013 | |
| Present value of all defined benefit obligations if: | | | | | | | | | | | | | | | | |
| Discount rate was 50 basis points higher | | | 585 | | | | 217 | | | | 32 | | | | 834 | |
| Discount rate was 50 basis points lower | | | 675 | | | | 246 | | | | 36 | | | | 957 | |
| Expected rate of future salary increases was 50 basis points higher | | | 628 | | | | 233 | | | | 36 | | | | 897 | |
| Expected rate of future salary increases was 50 basis points lower | | | 628 | | | | 228 | | | | 32 | | | | 888 | |
| Expected rate of future pension increases was 50 basis points higher | | | 632 | | | | 236 | | | | 34 | | | | 902 | |
| Expected rate of future pension increases was 50 basis points lower | | | 625 | | | | 226 | | | | 34 | | | | 885 | |
| Expected inflation was 50 basis points higher | | | 628 | | | | 233 | | | | 36 | | | | 897 | |
| Expected inflation was 50 basis points lower | | | 628 | | | | 229 | | | | 32 | | | | 889 | |
Notes to the Consolidated Financial Statements 215
The components of total expense of defined benefit pension plans for the years 2013, 2012, and 2011 recognized in operating expense were as follows:
Total Expense of Defined Benefit Pension Plans
€ millions
| | | | | | | | | | | | | | | | | | | | | | | | | | | | | | | | | | | | | | | | | | | | | | | | |
| | | Domestic Plans | | | Foreign Plans | | | Other Post-
Employment Plans | | | Total | |
| | | 2013 | | | 2012 | | | 2011 | | | 2013 | | | 2012 | | | 2011 | | | 2013 | | | 2012 | | | 2011 | | | 2013 | | | 2012 | | | 2011 | |
| Current service cost | | | 7 | | | | -2 | | | | -1 | | | | 15 | | | | 15 | | | | 18 | | | | 3 | | | | 3 | | | | 3 | | | | 25 | | | | 16 | | | | 20 | |
| Interest expense | | | 19 | | | | 21 | | | | 20 | | | | 4 | | | | 8 | | | | 13 | | | | 1 | | | | 1 | | | | 1 | | | | 24 | | | | 30 | | | | 34 | |
| Interest income | | | -20 | | | | -22 | | | | -21 | | | | -4 | | | | -7 | | | | -12 | | | | -1 | | | | -1 | | | | 0 | | | | -25 | | | | -30 | | | | -33 | |
| Past service cost | | | 0 | | | | 0 | | | | 0 | | | | 1 | | | | 0 | | | | -2 | | | | 0 | | | | 0 | | | | 0 | | | | 1 | | | | 0 | | | | -2 | |
| | | | | | | | | | | | | | | | | | | | | | | | | | | | | | | | | | | | | | | | | | | | | | | | |
| Total expense | | | 6 | | | | -3 | | | | -2 | | | | 16 | | | | 16 | | | | 17 | | | | 4 | | | | 3 | | | | 4 | | | | 26 | | | | 16 | | | | 19 | |
| Actual return on plan assets | | | 10 | | | | 106 | | | | 28 | | | | 9 | | | | 15 | | | | 5 | | | | 1 | | | | 1 | | | | 0 | | | | 20 | | | | 122 | | | | 33 | |
Due to the fact that our domestic defined benefit pension plans primarily consist of an employee-financed post-retirement plan that is fully financed with qualifying insurance policies, current service cost may turn into a credit as a result of adjusting the defined benefit liability’s carrying amount to the fair value of the qualifying plan assets. Such adjustments are recorded in service cost.
216 Consolidated Financial Statements IFRS
We have recognized the following amounts as remeasurements for our defined benefit pension plans:
Remeasurements on Defined Benefit Pension Plans
€ millions
| | | | | | | | | | | | | | | | | | | | | | | | | | | | | | | | | | | | | | | | | | | | | | | | |
| | | Domestic Plans | | | Foreign Plans | | | Other Post-
Employment Plans | | | Total | |
| | | 2013 | | | 2012 | | | 2011 | | | 2013 | | | 2012 | | | 2011 | | | 2013 | | | 2012 | | | 2011 | | | 2013 | | | 2012 | | | 2011 | |
| Beginning balance of remeasurements on defined benefit plans (gains (-) and losses (+)) | | | 10 | | | | 0 | | | | -4 | | | | -12 | | | | 101 | | | | 87 | | | | 5 | | | | 0 | | | | 0 | | | | 3 | | | | 101 | | | | 83 | |
| Remeasurements on defined benefit obligations: | | | | | | | | | | | | | | | | | | | | | | | | | | | | | | | | | | | | | | | | | | | | | | | | |
| Actuarial gains (-) and losses (+) arising from change in demographic assumptions | | | 0 | | | | 0 | | | | 0 | | | | 3 | | | | 0 | | | | 5 | | | | 0 | | | | 0 | | | | 0 | | | | 3 | | | | 0 | | | | 5 | |
| Actuarial gains (-) and losses (+) arising from change in financial assumptions | | | -28 | | | | 106 | | | | 14 | | | | -6 | | | | 5 | | | | 5 | | | | 0 | | | | 0 | | | | 0 | | | | -34 | | | | 111 | | | | 19 | |
| Actuarial gains (-) and losses (+) arising from experience adjustments | | | 11 | | | | -12 | | | | -3 | | | | 6 | | | | -5 | | | | -9 | | | | 0 | | | | 5 | | | | 0 | | | | 17 | | | | -12 | | | | -12 | |
| Remeasurements on plan assets: | | | | | | | | | | | | | | | | | | | | | | | | | | | | | | | | | | | | | | | | | | | | | | | | |
| Actuarial gains (-) and losses (+) arising from experience adjustments | | | 10 | | | | -84 | | | | -7 | | | | -5 | | | | -3 | | | | 12 | | | | 0 | | | | 0 | | | | 0 | | | | 5 | | | | -87 | | | | 5 | |
| Settlement | | | 0 | | | | 0 | | | | 0 | | | | 0 | | | | -110 | | | | 0 | | | | 0 | | | | 0 | | | | 0 | | | | 0 | | | | -110 | | | | 0 | |
| Foreign currency exchange rate changes | | | 0 | | | | 0 | | | | 0 | | | | -2 | | | | 0 | | | | 0 | | | | -1 | | | | 0 | | | | 0 | | | | -3 | | | | 0 | | | | 0 | |
| | | | | | | | | | | | | | | | | | | | | | | | | | | | | | | | | | | | | | | | | | | | | | | | |
| Ending balance of remeasurements on defined benefit plans (gains (-) and losses (+)) | | | 2 | | | | 10 | | | | 0 | | | | -17 | | | | -12 | | | | 101 | | | | 3 | | | | 5 | | | | 0 | | | | -12 | | | | 3 | | | | 101 | |
Notes to the Consolidated Financial Statements 217
For the determination of the total expense for the years 2013, 2012, and 2011, the projection of the defined benefit obligation and the fair value of the plan assets as at December 31, 2013, 2012, and 2011, the following principal actuarial assumptions (expressed as weighted averages for our foreign and post-employment benefit plans) were used:
Actuarial Assumptions for Total Expense
Percent
| | | | | | | | | | | | | | | | | | | | | | | | | | | | | | | | | | | | |
| | | Domestic Plans | | | Foreign Plans | | | Other Post-
Employment Plans | |
| | | 2013 | | | 2012 | | | 2011 | | | 2013 | | | 2012 | | | 2011 | | | 2013 | | | 2012 | | | 2011 | |
| Discount rate | | | 3.3 | | | | 4.6 | | | | 4.9 | | | | 2.0 | | | | 2.2 | | | | 3.3 | | | | 4.8 | | | | 5.6 | | | | 5.8 | |
| Future salary increases | | | 2.5 | | | | 2.5 | | | | 2.5 | | | | 1.7 | | | | 1.8 | | | | 1.3 | | | | 4.2 | | | | 3.9 | | | | 3.4 | |
| Future pension increases | | | 2.0 | | | | 2.0 | | | | 2.0 | | | | 0.0 | | | | 0.0 | | | | 0.0 | | | | 0.0 | | | | 0.0 | | | | 0.0 | |
| Employee turnover | | | 2.0 | | | | 2.0 | | | | 2.0 | | | | 9.8 | | | | 10.2 | | | | 4.2 | | | | 2.0 | | | | 1.9 | | | | 2.0 | |
| Inflation | | | 0.0 | | | | 0.0 | | | | 0.0 | | | | 1.3 | | | | 1.3 | | | | 0.5 | | | | 1.1 | | | | 1.1 | | | | 1.2 | |
Our investment strategy on domestic benefit plans is to invest all contributions in stable insurance policies.
Our investment strategies for foreign benefit plans vary according to the conditions in the country in which the respective benefit plans are situated. Generally, a long-term investment horizon has been adopted for all major foreign benefit plans. Although our policy is to invest in a risk-diversified portfolio consisting of a mix of assets, both the defined benefit obligation and plan assets can fluctuate overtime which exposes the Group to actuarial and market (investment) risks. Depending on the statutory requirements in each country, it might be necessary to reduce the underfunding by addition of liquid assets. To minimize these actuarial and market fluctuations, SAP reviews relevant financial factors for appropriateness and reasonableness and makes modifications to eliminate certain effects when considered necessary.
218 Consolidated Financial Statements IFRS
Our plan asset allocation as at December 31, 2013, and December 31, 2012, was as follows:
Plan Asset Allocation
€ millions
| | | | | | | | | | | | | | | | |
| | | 2013 | | | 2012 | |
| | | Quoted in an
Active Market | | | Not Quoted in an
Active Market | | | Quoted in an
Active Market | | | Not Quoted in an
Active Market | |
| Asset category | | | | | | | | | | | | | | | | |
| Equity investments | | | 48 | | | | 0 | | | | 42 | | | | 0 | |
| Corporate bonds | | | 65 | | | | 0 | | | | 63 | | | | 0 | |
| Real estate | | | 33 | | | | 0 | | | | 29 | | | | 0 | |
| Insurance policies | | | 9 | | | | 623 | | | | 8 | | | | 589 | |
| Cash and cash equivalents | | | 34 | | | | 0 | | | | 31 | | | | 0 | |
| Others | | | 23 | | | | 0 | | | | 17 | | | | 0 | |
| | | | | | | | | | | | | | | | |
| Total | | | 212 | | | | 623 | | | | 190 | | | | 589 | |
Our expected contribution in 2014 is €1 million for domestic defined benefit pension plans and €15 million for foreign defined benefit pension plans, all of which is expected to be paid in cash. The weighted duration of our defined benefit plans amounted to 15 years as at December 31, 2013, and 14 years as at December 31, 2012.
The table below presents the maturity analysis of the benefit payments:
Maturity Analysis
€ millions
| | | | | | | | | | | | |
| | | Domestic Plans | | | Foreign Plans | | | Other Post-
Employment Plans | |
| | | 2013 | | | 2013 | | | 2013 | |
| Less than a year | | | 8 | | | | 20 | | | | 1 | |
| Between 1-2 years | | | 9 | | | | 36 | | | | 2 | |
| Between 2-5 years | | | 58 | | | | 53 | | | | 5 | |
| Over 5 years | | | 989 | | | | 205 | | | | 64 | |
| | | | | | | | | | | | |
| Total | | | 1,064 | | | | 314 | | | | 72 | |
Notes to the Consolidated Financial Statements 219
Defined Contribution Plan/State Plans
We also maintain domestic and foreign defined contribution plans. Amounts contributed by us under such plans are based on a percentage of the employees’ salaries or the amount of contributions made by employees. Furthermore, in Germany and some other countries we make contributions to public pension plans that are operated by national or local government or a similar institution. The expenses of defined contribution plans and state plans for the years 2013, 2012, and 2011, were as follows:
Total Expense of Defined Contribution Plans and State Plans
€ millions
| | | | | | | | | | | | |
| | | 2013 | | | 2012 | | | 2011 | |
| Defined contribution plans | | | 182 | | | | 173 | | | | 151 | |
| State plans | | | 316 | | | | 296 | | | | 244 | |
| | | | | | | | | | | | |
| Total expense | | | 498 | | | | 469 | | | | 395 | |
(18b) Other Provisions
Changes in other provisions over the reporting year were as follows:
Other Provisions
€ millions
| | | | | | | | | | | | | | | | | | | | | | | | | | | | |
| | | Balance
1/1/2013 | | | Addition | | | Additions
from
business
combinations | | | Utilization | | | Release | | | Currency
Impact | | | Balance
12/31/2013 | |
| Employee-related provisions | | | | | | | | | | | | | | | | | | | | | | | | | | | | |
Provisions for share-based payments | | | 579 | | | | 293 | | | | 0 | | | | -360 | | | | -54 | | | | -13 | | | | 445 | |
Other employee-related provisions | | | 87 | | | | 58 | | | | 0 | | | | -80 | | | | -11 | | | | -2 | | | | 52 | |
| Customer-related provisions | | | 74 | | | | 83 | | | | 0 | | | | -83 | | | | -36 | | | | -2 | | | | 36 | |
| Litigation-related provisions | | | | | | | | | | | | | | | | | | | | | | | | | | | | |
TomorrowNow litigation | | | 234 | | | | 0 | | | | 0 | | | | -1 | | | | 0 | | | | -10 | | | | 223 | |
Other litigation-related provisions | | | 55 | | | | 6 | | | | 1 | | | | -11 | | | | -36 | | | | -3 | | | | 12 | |
| Restructuring provisions | | | 12 | | | | 74 | | | | 0 | | | | -49 | | | | -4 | | | | 0 | | | | 33 | |
| Onerous contract provisions (other than from customer contracts) | | | 53 | | | | 3 | | | | 0 | | | | -22 | | | | 0 | | | | -1 | | | | 33 | |
| Other provisions | | | 24 | | | | 6 | | | | 0 | | | | -3 | | | | -1 | | | | -2 | | | | 24 | |
| | | | | | | | | | | | | | | | | | | | | | | | | | | | |
| Total other provisions | | | 1,118 | | | | 523 | | | | 1 | | | | -609 | | | | -142 | | | | -33 | | | | 858 | |
Thereof current | | | 840 | | | | | | | | | | | | | | | | | | | | | | | | 643 | |
Thereof non-current | | | 278 | | | | | | | | | | | | | | | | | | | | | | | | 215 | |
For more information about our share-based payments, see Note (27).
Other employee-related provisions primarily comprise obligations for time credits, severance payments, jubilee expenses, and semiretirement. While most of these employee-related provisions can be claimed within the next 12 months, we do not expect the related cash flows within this time period.
220 Consolidated Financial Statements IFRS
Customer-related provisions include performance obligations, as well as expected contract losses from contracts with customers. The associated cash outflows are substantially short-term in nature.
Litigation-related provisions relate primarily to the litigation matters described in Note (23). They include the expenses related to the provision established for the related litigation as well as any related legal fees incurred to date and expected to be incurred in the future. We have established provisions taking into account the facts of each case. The timing of the cash outflows associated with legal claims cannot be reasonably determined in all cases. For more information, see Note (3c).
Restructuring provisions comprise various restructuring activities that occurred in 2013 and 2012.
During 2012 and 2013, we implemented organizational changes in sales and go-to-market in EMEA and North America. We made other changes to integrate Sybase employees into our global finance and administration organization and to integrate the business activities of Crossgate. In line with our new cloud integration strategy, we set up a plan to cover all cloud-business related organizational changes. The cash outflows for these restructuring programs are typically short-term in nature.
Non-customer contract-related onerous contract provisions have been recorded in connection with unused lease space and unfavorable acquired facility lease terms. The utilization of onerous leases depends on the terms of the underlying lease contract.
Other provisions comprise warranty obligations and decommissioning, restoration, and similar liabilities associated with leased facilities. The related outflow for warranty obligations is short-term in nature. The associated cash outflows for decommissioning, restoration, and similar liabilities, which are typically long-term in nature, are generally expected to occur at the dates we exit the facilities to which they relate.
(19) DEFERRED INCOME
Deferred income consists mainly of prepayments made by our customers for support services, cloud subscriptions, and professional services; fees from multiple element arrangements allocated to undelivered elements; and amounts recorded in purchase accounting at fair value for obligations to perform under acquired support contracts in connection with acquisitions.
On December 31, 2013, current deferred income included a total of €443 million in deferred revenue (December 31, 2012: €317 million), which in future will be recognized as revenue from cloud subscriptions and support.
(20) TOTAL EQUITY
Issued Capital
As at December 31, 2013, SAP AG had issued 1,228,504,232 no-par value bearer shares (December 31, 2012: 1,228,504,232) with a calculated nominal value of €1 per share. All the shares issued are fully paid.
Notes to the Consolidated Financial Statements 221
The following table shows the changes in the number and the value of issued shares and treasury shares in millions.
Change in Issued Capital and Treasury Shares
| | | | | | | | | | | | | | | | |
| | | Number of Shares in Millions | | | Value in € Millions | |
| | | Issued Capital | | | Treasury Shares | | | Issued Capital | | | Treasury Shares | |
| January 1, 2011 | | | 1,227 | | | | -39 | | | | 1,227 | | | | -1,382 | |
| Issuing shares under share-based payments | | | 1 | | | | 0 | | | | 1 | | | | 0 | |
| Purchase of treasury shares | | | 0 | | | | -6 | | | | 0 | | | | -246 | |
| Reissuance of treasury shares under share-based payments | | | 0 | | | | 7 | | | | 0 | | | | 251 | |
| December 31, 2011 | | | 1,228 | | | | -38 | | | | 1,228 | | | | -1,377 | |
| Issuing shares under share-based payments | | | 1 | | | | 0 | | | | 1 | | | | 0 | |
| Purchase of treasury shares | | | 0 | | | | -1 | | | | 0 | | | | -53 | |
| Reissuance of treasury shares under share-based payments | | | 0 | | | | 2 | | | | 0 | | | | 93 | |
| December 31, 2012 | | | 1,229 | | | | -37 | | | | 1,229 | | | | -1,337 | |
| Reissuance of treasury shares under share-based payments | | | 0 | | | | 2 | | | | 0 | | | | 57 | |
| | | | | | | | | | | | | | | | |
| December 31, 2013 | | | 1,229 | | | | -35 | | | | 1,229 | | | | -1,280 | |
Authorized Shares
The Articles of Incorporation authorize the Executive Board to increase the issued capital:
| ¡ | | Up to a total amount of €250 million by issuing new no-par value bearer shares against contributions in cash until June 7, 2015 (Authorized Capital I). The issuance is subject to the statutory subscription rights of existing shareholders. |
| ¡ | | Up to a total amount of €250 million by issuing new no-par value bearer shares against contributions in cash or in kind until June 7, 2015 (Authorized Capital II). Subject to the consent of the Supervisory Board, the Executive Board is authorized to exclude the shareholders’ statutory subscription rights in certain cases. |
| ¡ | | Up to a total amount of approximately €30 million by issuing new no-par value bearer shares against contributions in cash or in kind until June 7, 2015 (Authorized Capital III). The new shares may only be used to grant shares to employees of SAP AG and its subsidiaries (employee shares). The shareholders’ subscription rights are excluded. |
Contingent Shares
SAP AG’s share capital is subject to a contingent capital increase which may be effected only to the extent that the holders or creditors of convertible bonds or stock options issued or guaranteed by SAP AG or any of its directly or indirectly controlled subsidiaries under certain share-based payments exercise their conversion or subscription rights, and no other methods for servicing these rights are used. As at December 31, 2013, €100 million, representing 100 million shares, was still available for issuance (2012: €100 million).
Share Premium
Share premium represents all capital contributed to SAP with the proceeds resulting from the issuance of issued capital in excess of their calculated par value. Share premium arises mainly from issuance of issued capital, treasury shares transactions, and share-based payments.
Retained Earnings
Retained earnings contain prior years’ undistributed profit after tax and unrecognized pension costs. Unrecognized pension costs comprise remeasurements relating to defined benefit pension plans and similar obligations.
222 Consolidated Financial Statements IFRS
Other Comprehensive Income
The component of other comprehensive income before tax that will be reclassified to profit or loss in the future includes the following items:
Items Recognized in Other Comprehensive Income that will be Reclassified to Profit or Loss Before Tax
€ millions
| | | | | | | | | | | | |
| | | 2013 | | | 2012 | | | 2011 | |
| Gains (losses) on exchange differences | | | -576 | | | | -214 | | | | 106 | |
| Gains (losses) on remeasuring available-for-sale financial assets | | | 79 | | | | 33 | | | | -6 | |
| Reclassification adjustments on available-for-sale financial assets | | | -19 | | | | -20 | | | | -1 | |
| | | | | | | | | | | | |
| Available-for-sale financial assets | | | 60 | | | | 13 | | | | -7 | |
| Gains (losses) on cash flow hedges | | | 78 | | | | 21 | | | | -23 | |
| Reclassification adjustments on cash flow hedges | | | -78 | | | | 42 | | | | 22 | |
| | | | | | | | | | | | |
| Cash flow hedges | | | 0 | | | | 63 | | | | -1 | |
Treasury Shares
By resolution of SAP AG’s General Meeting of Shareholders held on June 4, 2013, the authorization granted by the General Meeting of Shareholders of June 8, 2010, regarding the acquisition of treasury shares was revoked to the extent it had not been exercised at that time, and replaced by a new authorization of the Executive Board of SAP AG to acquire, on or before June 3, 2018, shares of SAP AG representing a pro rata amount of capital stock of up to €120 million in aggregate, provided that the shares purchased under the authorization, together with any other shares in the Company previously acquired and held by, or attributable to, SAP AG do not account for more than 10% of SAP AG’s issued share capital. Although treasury shares are legally considered outstanding, there are no dividend or voting rights associated with shares held in treasury. We may redeem or resell shares held in treasury, or we may use treasury shares for the purpose of servicing option or conversion rights under the Company’s share-based payment plans. Also, we may use shares held in treasury as consideration in connection with mergers with, or acquisitions of, other companies.
Miscellaneous
Under the German Stock Corporation Act (Aktiengesetz), the total amount of dividends available for distribution to SAP AG’s shareholders is based on the profits of SAP AG as reported in its statutory financial statements, which are prepared under the accounting rules in the German Commercial Code (Handelsgesetzbuch). For the year ended December 31, 2013, the Executive Board of SAP AG intends to propose a dividend of €1.00 per share (that is, an estimated total dividend of €1,194 million), to be paid from the profits of SAP AG.
Dividends per share for 2012 and 2011 were €0.85 and €1.10 respectively and were paid in the succeeding year.
(21) ADDITIONAL CAPITAL DISCLOSURES
Capital Structure Management
The primary objective of our capital structure management is to maintain a strong financial profile for investor, creditor, and customer confidence, and to support the growth of our business. We seek to maintain a capital structure that will allow us to cover our funding requirements through the capital markets at reasonable conditions, and in so doing, ensure a high level of independence, confidence, and financial flexibility.
Notes to the Consolidated Financial Statements 223
Based on our strong corporate financial profile and our excellent capital market reputation, we have so far successfully executed external financing transactions without an external rating. However, we will continue to closely monitor our financing situation to determine whether not having an external rating continues to be appropriate.
Capital Structure
| | | | | | | | | | | | | | | | | | | | |
| | | 2013 | | | 2012 | | | | |
| | | € millions | | | % of Total equity
and liabilities | | | € millions | | | % of Total equity
and liabilities | | | Change (in %) | |
| Equity | | | 16,048 | | | | 59 | | | | 14,133 | | | | 54 | | | | 14 | |
Current liabilities | | | 6,347 | | | | 23 | | | | 6,546 | | | | 25 | | | | -3 | |
Non-current liabilities | | | 4,699 | | | | 17 | | | | 5,627 | | | | 21 | | | | -16 | |
| Liabilities | | | 11,046 | | | | 41 | | | | 12,173 | | | | 46 | | | | -9 | |
| | | | | | | | | | | | | | | | | | | | |
| Total equity and liabilities | | | 27,094 | | | | 100 | | | | 26,306 | | | | 100 | | | | 3 | |
Our financing activities improved our debt ratio (defined as the ratio of total liabilities to total equity and liabilities, expressed as a percentage) to 41% at the end of 2013 (as compared to 46% at the end of 2012). The ratio of total financial debt to total equity and liabilities decreased by 3% to 16% at the end of 2013 (19% as at December 31, 2012). Total financial debt consists of current and non-current bonds or private placements. For more information about our financial debt, see Note (17).
Looking ahead to financing activities in 2014, the Company intends to repay a €500 million Eurobond and an €86 million German promissory note when they both mature in April.
While we monitor these ratios continuously, our main focus is on the management of our net liquidity position as outlined in the following table:
Group Liquidity of SAP Group
€ millions
| | | | | | | | | | | | |
| | | 2013 | | | 2012 | | | Change | |
Cash and cash equivalents | | | 2,748 | | | | 2,477 | | | | 271 | |
Current investments | | | 93 | | | | 15 | | | | 78 | |
| | | | | | | | | | | | |
| Group liquidity | | | 2,841 | | | | 2,492 | | | | 349 | |
Current financial debt | | | 586 | | | | 600 | | | | -14 | |
| | | | | | | | | | | | |
| Net liquidity 1 | | | 2,255 | | | | 1,892 | | | | 363 | |
Non-current financial debt | | | 3,722 | | | | 4,394 | | | | -672 | |
| | | | | | | | | | | | |
| Net liquidity 2 | | | -1,467 | | | | -2,502 | | | | 1,035 | |
224 Consolidated Financial Statements IFRS
Net liquidity 1 is group liquidity minus current financial debt. In 2013 we paid back a €600 million Eurobond, which was almost fully compensated by reclassifications of €586 million from non-current financial debt to current financial debt due to changes in the respective maturity profile.
Net liquidity 2 is net liquidity 1 minus non-current financial debt.
Improvements of our net liquidity ratios since December 31, 2012 are mainly due to positive cash inflows from our operations, which were partly offset by cash outflows for acquisitions (such as hybris) and dividend payments.
We intend to reduce our financial debt as and when the debt falls due. We will consider issuing new debt, such as bonds or U.S. private placements, on an as-needed basis only and if market conditions are advantageous.
Distribution Policy
Our general intention is to remain in a position to return excess liquidity to our shareholders by distributing annual dividends and repurchasing shares. The amount of future dividends and the extent of future repurchases of shares will be balanced with our effort to continue to maintain an adequate liquidity position.
In 2013, we were able to distribute €1,013 million in dividends from our 2012 profit (as compared to €1,310 million in 2012 and €713 million in 2011 related to 2011 and 2010 profit, respectively), representing €0.85 per share. Aside from the distributed dividend, in 2013, 2012, and 2011 we also returned €0 million, €53 million, and €246 million respectively to our shareholders by repurchasing our own shares.
As a result of our equity-settled share-based payments transactions (as described in Note (27)) we have commitments to grant SAP shares to employees. We intend to meet these commitments by reissuing treasury shares or issuing ordinary shares. For more information about contingent capital, see Note (20).
(22) OTHER FINANCIAL COMMITMENTS AND CONTINGENT LIABILITIES
Other Financial Commitments
Our other financial commitments as at December 31, 2013, and 2012, were as follows:
Other Financial Commitments
€ millions
| | | | | | | | |
| | | 2013 | | | 2012 | |
| Operating leases | | | 1,204 | | | | 923 | |
| Contractual obligations for acquisition of property, plant, and equipment and intangible assets | | | 80 | | | | 66 | |
| Other purchase obligations | | | 424 | | | | 522 | |
| Purchase obligations | | | 504 | | | | 588 | |
| | | | | | | | |
| Total | | | 1,708 | | | | 1,511 | |
Our operating leases relate primarily to the lease of office space, hardware, and cars, with remaining non-cancelable lease terms between less than one and 35 years. On a limited scale, the operating lease contracts include escalation clauses (based, for example, on the consumer price index) and renewal options. The contractual obligations for acquisition of property, plant, and equipment and intangible assets relate primarily to the construction of new and existing facilities, hardware, software, patents, office equipment, and vehicle purchase obligations. The remaining obligations relate mainly to marketing, consulting, maintenance, license agreements, and other third-party agreements. Historically, the majority of such purchase obligations have been realized.
Notes to the Consolidated Financial Statements 225
Commitments under operating leasing contracts and purchase obligations as at December 31, 2013, were as follows:
Other Financial Commitments
€ millions
| | | | | | | | |
| | | Operating Leases | | | Purchase Obligations | |
| Due 2014 | | | 235 | | | | 282 | |
| Due 2015-2018 | | | 561 | | | | 186 | |
| Due thereafter | | | 408 | | | | 36 | |
| | | | | | | | |
| Total | | | 1,204 | | | | 504 | |
Our rental and operating lease expenses were €273 million, €277 million, and €241 million for the years 2013, 2012, and 2011, respectively.
Contingent Liabilities
In the normal course of business, we usually indemnify our customers against liabilities arising from a claim that our software products infringe a third party’s patent, copyright, trade secret, or other proprietary rights. In addition, we occasionally grant function or performance guarantees in routine consulting contracts or development arrangements. Also, our software license agreements generally include a clause guaranteeing that the software substantially conforms to the specifications as described in applicable documentation for a period of six to 12 months from delivery. Our product and service warranty liability, which is measured based on historical experience and evaluation, is included in other provisions (see Note (18b)).
For contingent liabilities related to litigation matters, see Note (23).
(23) LITIGATION AND CLAIMS
We are subject to a variety of claims and lawsuits that arise from time to time in the ordinary course of our business, including proceedings and claims that relate to companies we have acquired, claims that relate to customers demanding indemnification for proceedings initiated against them based on their use of SAP software, and claims that relate to customers’ being dissatisfied with the products and services that we have delivered to them. We will continue to vigorously defend against all claims and lawsuits against us. We record a provision for such matters when it is probable that we have a present obligation that results from a past event, is reliably estimable, and the settlement of which is probable to require an outflow of resources embodying economic benefits. For the TomorrowNow litigation, we have recorded a provision of US$306 million (US$306 million on December 31, 2012, US$272 million on December 31, 2011, US$1.3 billion on December 31, 2010). We currently believe that resolving all other claims and lawsuits against us, individually or in the aggregate, did not and will not have a material adverse effect on our business, financial position, profit, or cash flows. Consequently, the provisions currently recorded for these other claims and lawsuits are neither individually nor in aggregate material to SAP.
However, the outcome of litigation and other claims or lawsuits is intrinsically subject to considerable uncertainty. Management’s view of the litigation may also change in the future. Actual outcomes of litigation and other claims or lawsuits may differ from the assessments made by management in prior periods, which could result in a material impact on our business, financial position, profit, cash flows, or reputation. Most of the litigations and claims are of a very individual nature and claims are either not quantified by the claimants or claim amounts quantified are, based on historical evidence, not expected to be a good proxy for the expenditure that would be required to settle the case concerned. The specifics of the jurisdictions where most of the claims are located further impair the
226 Consolidated Financial Statements IFRS
predictability of the outcome of the cases. Therefore, it is not practicable to reliably estimate the financial effect that these litigations and claims would have if SAP were to incur expenditure for these cases.
For more information about the provisions recorded for litigation, see Note (18b).
Among the claims and lawsuits are the following:
Intellectual Property Litigation
In March 2007, United States-based Oracle Corporation and certain of its subsidiaries (Oracle) instituted legal proceedings in the United States against TomorrowNow, Inc., its parent company SAP America, Inc. and SAP America’s parent company SAP AG (SAP). Oracle filed several amended complaints between 2007 and 2009. As amended, the lawsuit alleges copyright infringement, violations of the Federal Computer Fraud and Abuse Act and the California Computer Data Access and Fraud Act, unfair competition, intentional and negligent interference with prospective economic advantage, and civil conspiracy. The lawsuit alleges that SAP unlawfully copied and misappropriated proprietary, copyrighted software products and other confidential materials developed by Oracle to service its own customers. The lawsuit sought injunctive relief and monetary damages, including punitive damages, alleged by Oracle to be in the billions of U.S. dollars. The trial was held in November 2010. Prior to trial, SAP AG, SAP America and TomorrowNow stipulated to liability for certain claims and SAP agreed to pay Oracle US$120 million for attorneys’ fees. After the trial, the jury returned a damages verdict of US$1.3 billion. The judgment, which was issued on February 3, 2011, additionally provided for prejudgment interest of US$15 million. The judgment amount is also subject to post-judgment interest, which accrues from the time judgment is entered.
The jury based its verdict on the theory of a hypothetical license, that is, the value of what TomorrowNow would have paid if it had negotiated with Oracle a license for the copyrights infringed by TomorrowNow. Before and during the course of the trial, various damages amounts had been presented by the parties to the litigation. They included the following:
| a) | Before the trial, Oracle had requested damages in excess of US$3.5 billion based on alleged “saved acquisition costs,” the court dismissed that damage claim based on a pretrial motion, but Oracle has the right to appeal that dismissal. |
| b) | During the trial, Oracle’s damages experts presented an amount of US$408 million based on lost profits and disgorgement of infringer’s profit. |
| c) | During the trial, members of Oracle management presented, as part of their testimonies, amounts of up to US$5 billion. Oracle’s damages expert presented a damages estimate of “at least” US$1.655 billion under a hypothetical license theory. Oracle’s counsel asked the jury to award “somewhere between US$1.65 and US$3 billion.” |
| d) | During the trial, the damages expert for TomorrowNow and SAP presented an amount of US$28 million based on lost profits and infringer’s profits or, alternatively, US$40.6 million based on a hypothetical license theory. Counsel for SAP and TomorrowNow asked the jury to award US$28 million. |
We believed both before and during the trial and continue to believe that the hypothetical license theory is not an appropriate basis for calculating the damages. Instead, we believe that damages should be based on lost profits and infringer’s profits. As such, SAP filed post-trial motions asking the judge to overturn the judgment. A hearing on the post-trial motions was held in July 2011. On September 1, 2011, the trial judge issued an order which set aside the jury verdict and vacated that part of the judgment awarding US$1.3 billion in damages. The trial judge also gave Oracle the choice of accepting reduced damages of US$272 million or having a new trial based on lost profits and infringer’s profits. Oracle filed a motion seeking an early appeal from the ruling vacating the jury’s damages award,
Notes to the Consolidated Financial Statements 227
which was denied by the judge. Consequently, Oracle elected to proceed with a new trial. In lieu of a new trial, the parties stipulated to a judgment of US$306 million while each preserving all rights for appeal. Both parties have filed their respective notice of appeal. On appeal, Oracle is seeking three forms of relief: (1) reinstatement of the November 2010 US$1.3 billion verdict; (2) as a first alternative, a new trial at which Oracle may again seek hypothetical license damages (based in part on evidence of alleged saved development costs) plus SAP’s alleged infringer’s profits without any deduction of expenses (Oracle does not put a number on its claim for the requested new trial); and (3) as a second alternative, increase of the remittitur (alternative to new trial) to US$408.7 million (versus the US$272 million Oracle had previously rejected). SAP has dismissed its cross-appeal. The hearing is tentatively scheduled for May 13, 2014, though this is subject to change.
Additionally, in June 2007, SAP became aware that the United States Department of Justice (U.S. DOJ) had opened an investigation concerning related issues and had issued subpoenas to SAP and TomorrowNow. The DOJ investigation has been resolved by way of a plea agreement which includes TomorrowNow pleading guilty to 11 counts of violations of the Computer Fraud and Abuse Act, one count of criminal copyright infringement, the payment of a US$20 million fine and three years’ probation. No charges were brought against SAP AG or subsidiaries thereof other than TomorrowNow.
In April 2007, United States-based Versata Software, Inc. (formerly Trilogy Software, Inc.) (Versata) instituted legal proceedings in the United States District Court for the Eastern District of Texas against SAP. Versata alleged that SAP’s products infringe one or more of the claims in each of five patents held by Versata. In its complaint, Versata sought unspecified monetary damages and permanent injunctive relief. The first trial was held in August 2009. The jury returned a verdict in favor of Versata and awarded Versata US$138.6 million for past damages. In January 2011, the court vacated the jury’s damages award and ordered a new trial on damages.
The retrial was held in May 2011. The jury returned a verdict in favor of Versata and awarded Versata US$345 million for past damages. In September 2011, the judge denied SAP’s post-trial motions with the exception of reducing the damages verdict by US$16 million to approximately US$329 million. The judge also ordered approximately US$60 million in pre-judgment interest. Additionally, the judge granted Versata’s request for a broad injunction which prohibits SAP from 1) selling products in the United States with the infringing functionality, 2) providing maintenance to or accepting maintenance revenue from existing customers in the United States until such customers disable the infringing functionality and verify such disablement, and 3) licensing additional users to existing customers in the United States until such customers disable the infringing functionality and verify such disablement. Finally, the judge stayed the injunction pending the outcome of an appeal.
Both parties appealed to the U.S. Court of Appeals for the Federal Circuit. The appeal hearing occurred in February 2013 and a decision was issued on May 1, 2013. The three-judge panel ruled in Versata’s favor on infringement and damages, leaving both fully intact. The past damages verdict currently stands at approximately US$390 million. Regarding the injunction, the court ruled that the injunction was too broad, stating that SAP should be able to provide maintenance or additional seats for prior customers of the infringing products, so long as the maintenance or the additional seat does not involve, or allow access to, the “enjoined capability” where enjoined capability is defined as the capability to execute a pricing procedure using hierarchical access of customer and product data. SAP filed a petition seeking rehearing by the three-judge panel that issued this decision and/or by the entire appeals court. The appeals court requested that Versata respond to SAP’s petition no later than July 29, 2013. In August 2013, the appeals court denied SAP’s request for rehearing and issued its mandate passing jurisdiction to the district court.
228 Consolidated Financial Statements IFRS
Separately, SAP filed a petition with the United States Patent and Trademark Office (USPTO) challenging the validity of the asserted Versata patent. In January 2013, the USPTO granted SAP’s request to reconsider the validity of Versata’s patent and instituted the relevant procedure (transitional post grant review). A decision was issued in June 2013 rendering all challenged patent claims (including all the patent claims SAP was found to have infringed) unpatentable. Versata filed with the USPTO a request seeking reconsideration of the decision on six different grounds. The USPTO invited SAP to file an opposition responding to two of the six grounds. On September 13, 2013, the USPTO denied Versata’s request for reconsideration.
In June 2013, following the determination of unpatentability, SAP filed a request with the appeals court to stay the litigation pending review of the USPTO decision. That request was denied in early July 2013.
In December 2013, SAP filed with the United States Supreme Court a petition for a writ of certiorari to review the decisions of the appeals court. That petition was denied in January 2014. Immediately thereafter, Versata requested that the District Court dismiss its remaining claims for injunctive and equitable relief. The District Court granted that request and deemed the previously entered judgment final. On that same day, SAP requested that the District Court vacate the judgment or stay the litigation, based on the USPTO decision declaring Versata’s patent claims unpatentable. That request is pending.
In August 2007, United States-based elcommerce.com, Inc. (elcommerce) instituted legal proceedings in the United States against SAP. elcommerce alleged that SAP’s products infringe one or more of the claims in one patent held by elcommerce. In its complaint, elcommerce sought unspecified monetary damages and permanent injunctive relief. The court in East Texas granted SAP’s request to transfer the litigation from East Texas to Pennsylvania. Subsequent to the Markman ruling by the court, the parties agreed to the entry of final judgment regarding non-infringement by SAP. elcommerce has appealed the court’s Markman ruling. The hearing for the appeal was held in May 2012, and we are awaiting the court’s decision. SAP also filed a reexamination request with the USPTO to invalidate elcommerce’s patent. On September 23, 2013, the USPTO issued a decision invalidating the patent. elcommerce has sought rehearing from the USPTO.
In February 2010, United States-based TecSec, Inc. (TecSec) instituted legal proceedings in the United States against SAP, Sybase, IBM, and many other defendants. TecSec alleged that SAP’s products infringe one or more of the claims in five patents held by TecSec. In its complaint, TecSec seeks unspecified monetary damages and permanent injunctive relief. The trial has not yet been scheduled. The legal proceedings have been stayed against all defendants pending the outcome of an appeal by TecSec. The appeal hearing occurred in March 2013. The appellate court issued its decision in October 2013. That decision did not end the litigation and therefore we expect the lawsuit to resume at the district court in the coming months.
In April 2010, SAP instituted legal proceedings (a Declaratory Judgment action) in the United States against Wellogix, Inc. and Wellogix Technology Licensing, LLC (Wellogix). The lawsuit seeks a declaratory judgment that five patents owned by Wellogix are invalid and/or not infringed by SAP. The trial has not yet been scheduled. The legal proceedings have been stayed pending the outcome of six reexaminations filed with the USPTO. In September 2013, the USPTO issued a decision on four of the six reexaminations, invalidating every claim of each of the four patents. SAP is awaiting a decision on the two remaining reexamination requests.
Other Litigation
In April 2008, South African-based Systems Applications Consultants (PTY) Limited (Securinfo) instituted legal proceedings in South Africa against SAP. Securinfo alleges that
Notes to the Consolidated Financial Statements 229
SAP has caused one of its subsidiaries to breach a software distribution agreement with Securinfo. In its complaint, Securinfo seeks damages of approximately €610 million plus interest. In September 2009, SAP filed a motion to dismiss which was rejected. A trial date which was scheduled for June 2011 has been postponed.
In November 2012, SAP filed a motion to dismiss based on a procedural aspect of the case. The court followed SAP’s argument and dismissed the claim by Securinfo. Securinfo appealed against this decision on December 19, 2012.
In March 2013, the court dismissed Securinfo’s appeal. Securinfo appealed against this decision to the Supreme Court of South Africa. The Supreme Court granted leave to appeal to the full bench of the court which had originally dismissed Securinfo’s appeals. Securinfo has applied for an appeal hearing date. The court has not yet provided a date.
We are subject to ongoing audits by domestic and foreign tax authorities. Along with many other companies operating in Brazil, we are involved in various proceedings with Brazilian authorities regarding assessments and litigation matters on non-income taxes on intercompany royalty payments and intercompany services. The total potential amount related to these matters for all applicable years is approximately €76 million. We have not recorded a provision for these matters, as we believe that we will prevail on these matters.
For more information about income tax risk-related litigation, see Note (10).
(24) FINANCIAL RISK FACTORS
We are exposed to various financial risks, such as market risks (including foreign currency exchange rate risk, interest rate risk, and equity price risk), credit risk, and liquidity risk.
Market Risk
a) Foreign Currency Exchange Rate Risk
Foreign currency exchange rate risk is the risk of loss due to adverse changes in foreign currency exchange rates. Under IFRS, foreign currency exchange rate risks arise on account of monetary financial instruments denominated in currencies other than the functional currency where the non-functional currency is the respective risk variable; translation risks are not taken into consideration.
As a globally active enterprise, we are subject to risks associated with fluctuations in foreign currencies with regard to our ordinary operations. Since the Group’s entities mainly conduct their operating business in their own functional currencies, our risk of exchange rate fluctuations from ongoing ordinary operations is not considered significant. However, occasionally we generate foreign currency-denominated receivables, payables, and other monetary items by transacting in a currency other than the functional currency. To mitigate the extent of the associated foreign currency exchange rate risk, the majority of these transactions are hedged as described in Note (25).
In rare circumstances, transacting in a currency other than the functional currency also leads to embedded foreign currency derivatives being separated and measured at fair value through profit or loss.
In addition, the Intellectual Property (IP) holders in the SAP Group are exposed to risks associated with forecasted intercompany cash flows in foreign currencies. These cash flows arise out of royalty payments from subsidiaries to the respective IP holder. The royalties are linked to the subsidiaries’ external revenue. This arrangement leads to a concentration of the foreign currency exchange rate risk with the IP holders, as the royalties are mostly denominated in the subsidiaries’ local currencies, while the functional currency of the IP holders with the highest royalty volume is the euro. The highest foreign currency exchange rate exposure of this kind relates to the currencies of subsidiaries with significant operations, for example the U.S. dollar, the pound sterling, the Japanese yen, the Swiss franc, and the Australian dollar.
230 Consolidated Financial Statements IFRS
Generally, we are not exposed to any significant foreign currency exchange rate risk with regard to our investing and financing activities, as such activities are normally conducted in the functional currency of the investing or borrowing entity. However, we were exposed to a cash flow risk from the consideration to be paid in U.S. dollars for the acquisition of hybris in 2013 and of SuccessFactors and Ariba, Inc. in 2012 as the funds were provided through our free cash and acquisition term loans, both mostly generated in euros. For more information, see Note (25).
b) Interest Rate Risk
Interest rate risks result from changes in market interest rates, which can cause changes in the fair values of fixed rate instruments and in the interest to be paid or received for variable rate instruments. We are exposed to interest rate risk as a result of our investing and financing activities mainly in euros and U.S. dollars.
As at December 31, 2013, our liquidity was mainly invested in time deposits and bonds with fixed yields, and money market instruments with variable yields, held as cash equivalents and current and non-current investments. Since the fixed yield time deposits held at year-end have short maturities, they do not expose us to a substantial fair value interest rate risk. However, a fair value interest rate exposure arises from the bonds classified as available for sale. Also, we are exposed to a cash flow risk from our cash held at banks spread across the world and the variable yield money market funds, mainly held in the United States.
As at December 31, 2013, we were exposed to an interest rate risk from our financing activities (for more information about the individual instruments, see Note (17b)) as all our issued bonds, the U.S. private placement notes, and the remaining tranche of the German promissory notes pay fixed interest leading to a fair value risk.
c) Equity Price Risk
Equity price risk is the risk of loss due to adverse changes in equity markets. We are exposed to such risk with regard to our investments in listed equity securities (2013: €83 million; 2012: €52 million) and our share-based payments (for the exposure from these plans, see Note (27)).
Credit Risk
Credit risk is the risk of economic loss of principal or financial rewards stemming from a counterparty’s failure to repay or service debt according to the contractual obligations.
To reduce the credit risk in investments, we arranged to receive rights to collateral for certain investing activities in the full amount of the investment volume, which we would be allowed to make use of only in the case of default of the counterparty to the investment.
With the exception of these transactions, we have not executed significant agreements to reduce our overall credit risk exposure, such as master netting arrangements. Therefore, the total amounts recognized as cash and cash equivalents, current investments, loans and other financial receivables, and derivative financial assets represent our maximum exposure to credit risks, except for the agreements mentioned above.
Liquidity Risk
Liquidity risk results from the potential inability to meet financial obligations, such as payments to suppliers or employees. A maturity analysis that provides the remaining contractual maturities of all our financial liabilities held at December 31, 2013, is shown in the table below. Financial liabilities shown in the table below for which repayment can be requested by the contract partner at any time are assigned to the earliest possible period. Variable interest payments were calculated using the last relevant interest rate fixed as at December 31, 2013. As we settle our derivative contracts gross, we show the pay and receive legs separately for all our
Notes to the Consolidated Financial Statements 231
currency and interest rate derivatives, whether or not the fair value of the derivative is negative. The cash outflows for the currency derivatives are translated using the applicable forward rate.
The cash flows for unrecognized but contractually agreed financial commitments are shown in Note (22).
Contractual Maturities of Financial Liabilities and Financial Assets
€ millions
| | | | | | | | | | | | | | | | | | | | | | | | | | | | |
| | | Carrying
Amount | | | Contractual Cash Flows | |
| | 12/31/2013 | | | 2014 | | | 2015 | | | 2016 | | | 2017 | | | 2018 | | | Thereafter | |
| Non-derivative financial liabilities | | | | | | | | | | | | | | | | | | | | | | | | | | | | |
| Trade payables | | | -640 | | | | -640 | | | | 0 | | | | 0 | | | | 0 | | | | 0 | | | | 0 | |
| Financial liabilities | | | -4,336 | | | | -731 | | | | -863 | | | | -513 | | | | -891 | | | | -153 | | | | -1,730 | |
| | | | | | | | | | | | | | | | | | | | | | | | | | | | |
| Total of non-derivative financial liabilities | | | -4,976 | | | | -1,371 | | | | -863 | | | | -513 | | | | -891 | | | | -153 | | | | -1,730 | |
| | | | | | | |
| Derivative financial liabilities and assets | | | | | | | | | | | | | | | | | | | | | | | | | | | | |
| Derivative financial liabilities | | | | | | | | | | | | | | | | | | | | | | | | | | | | |
Currency derivatives without designated hedge relationship | | | -144 | | | | | | | | | | | | | | | | | | | | | | | | | |
Cash outflows | | | | | | | -1,975 | | | | -9 | | | | -9 | | | | -8 | | | | -8 | | | | -15 | |
Cash inflows | | | | | | | 1,885 | | | | 0 | | | | 0 | | | | 0 | | | | 0 | | | | 0 | |
Currency derivatives with designated hedge relationship | | | -3 | | | | | | | | | | | | | | | | | | | | | | | | | |
Cash outflows | | | | | | | -178 | | | | 0 | | | | 0 | | | | 0 | | | | 0 | | | | 0 | |
Cash inflows | | | | | | | 174 | | | | 0 | | | | 0 | | | | 0 | | | | 0 | | | | 0 | |
Interest rate derivatives with designated hedge relationship | | | -23 | | | | | | | | | | | | | | | | | | | | | | | | | |
Cash outflows | | | | | | | -12 | | | | -17 | | | | -27 | | | | -39 | | | | -37 | | | | -192 | |
Cash inflows | | | | | | | 30 | | | | 35 | | | | 35 | | | | 35 | | | | 28 | | | | 123 | |
| | | | | | | | | | | | | | | | | | | | | | | | | | | | |
| Total of derivative financial liabilities | | | -170 | | | | -76 | | | | 9 | | | | -1 | | | | -12 | | | | -17 | | | | -84 | |
| Derivative financial assets | | | | | | | | | | | | | | | | | | | | | | | | | | | | |
Currency derivatives without designated hedge relationship | | | 26 | | | | | | | | | | | | | | | | | | | | | | | | | |
Cash outflows | | | | | | | -2,544 | | | | 0 | | | | 0 | | | | 0 | | | | 0 | | | | 0 | |
Cash inflows | | | | | | | 2,569 | | | | 0 | | | | 0 | | | | 0 | | | | 0 | | | | 0 | |
Currency derivatives with designated hedge relationship | | | 30 | | | | | | | | | | | | | | | | | | | | | | | | | |
Cash outflows | | | | | | | -391 | | | | 0 | | | | 0 | | | | 0 | | | | 0 | | | | 0 | |
Cash inflows | | | | | | | 419 | | | | 0 | | | | 0 | | | | 0 | | | | 0 | | | | 0 | |
Interest rate derivatives with designated hedge relationship | | | 5 | | | | | | | | | | | | | | | | | | | | | | | | | |
Cash outflows | | | | | | | -12 | | | | -25 | | | | -29 | | | | -36 | | | | -21 | | | | -24 | |
Cash inflows | | | | | | | 19 | | | | 33 | | | | 33 | | | | 33 | | | | 16 | | | | 16 | |
| | | | | | | | | | | | | | | | | | | | | | | | | | | | |
| Total of derivative financial assets | | | 61 | | | | 60 | | | | 8 | | | | 4 | | | | -3 | | | | -5 | | | | -8 | |
| | | | | | | | | | | | | | | | | | | | | | | | | | | | |
| Total of derivative financial liabilities and assets | | | -109 | | | | -16 | | | | 17 | | | | 3 | | | | -15 | | | | -22 | | | | -92 | |
232 Consolidated Financial Statements IFRS
Contractual Maturities of Financial Liabilities and Financial Assets
€ millions
| | | | | | | | | | | | | | | | | | | | | | | | | | | | |
| | | Carrying
Amount | | | Contractual Cash Flows | |
| | 12/31/2012 | | | 2013 | | | 2014 | | | 2015 | | | 2016 | | | 2017 | | | Thereafter | |
| Non-derivative financial liabilities | | | | | | | | | | | | | | | | | | | | | | | | | | | | |
| Trade payables | | | -684 | | | | -684 | | | | 0 | | | | 0 | | | | 0 | | | | 0 | | | | 0 | |
| Financial liabilities | | | -5,051 | | | | -757 | | | | -705 | | | | -874 | | | | -534 | | | | -904 | | | | -1,922 | |
| | | | | | | | | | | | | | | | | | | | | | | | | | | | |
| Total of non-derivative financial liabilities | | | -5,735 | | | | -1,441 | | | | -705 | | | | -874 | | | | -534 | | | | -904 | | | | -1,922 | |
| | | | | | | |
| Derivative financial liabilities and assets | | | | | | | | | | | | | | | | | | | | | | | | | | | | |
| Derivative financial liabilities | | | | | | | | | | | | | | | | | | | | | | | | | | | | |
Currency derivatives without designated hedge relationship | | | -195 | | | | | | | | | | | | | | | | | | | | | | | | | |
Cash outflows | | | | | | | -2,996 | | | | -10 | | | | -10 | | | | -10 | | | | -9 | | | | -26 | |
Cash inflows | | | | | | | 2,875 | | | | 0 | | | | 0 | | | | 0 | | | | 0 | | | | 0 | |
Currency derivatives with designated hedge relationship | | | -2 | | | | | | | | | | | | | | | | | | | | | | | | | |
Cash outflows | | | | | | | -157 | | | | 0 | | | | 0 | | | | 0 | | | | 0 | | | | 0 | |
Cash inflows | | | | | | | 154 | | | | 0 | | | | 0 | | | | 0 | | | | 0 | | | | 0 | |
Interest rate derivatives with designated hedge relationship | | | 0 | | | | | | | | | | | | | | | | | | | | | | | | | |
Cash outflows | | | | | | | 0 | | | | 0 | | | | 0 | | | | 0 | | | | 0 | | | | 0 | |
Cash inflows | | | | | | | 0 | | | | 0 | | | | 0 | | | | 0 | | | | 0 | | | | 0 | |
| | | | | | | | | | | | | | | | | | | | | | | | | | | | |
| Total of derivative financial liabilities | | | -197 | | | | -124 | | | | -10 | | | | -10 | | | | -10 | | | | -9 | | | | -26 | |
| Derivative financial assets | | | | | | | | | | | | | | | | | | | | | | | | | | | | |
Currency derivatives without designated hedge relationship | | | 46 | | | | | | | | | | | | | | | | | | | | | | | | | |
Cash outflows | | | | | | | -2,690 | | | | 0 | | | | 0 | | | | 0 | | | | 0 | | | | 0 | |
Cash inflows | | | | | | | 2,735 | | | | 0 | | | | 0 | | | | 0 | | | | 0 | | | | 0 | |
Currency derivatives with designated hedge relationship | | | 29 | | | | | | | | | | | | | | | | | | | | | | | | | |
Cash outflows | | | | | | | -460 | | | | 0 | | | | 0 | | | | 0 | | | | 0 | | | | 0 | |
Cash inflows | | | | | | | 485 | | | | 0 | | | | 0 | | | | 0 | | | | 0 | | | | 0 | |
Interest rate derivatives with designated hedge relationship | | | 0 | | | | | | | | | | | | | | | | | | | | | | | | | |
Cash outflows | | | | | | | 0 | | | | 0 | | | | 0 | | | | 0 | | | | 0 | | | | 0 | |
Cash inflows | | | | | | | 0 | | | | 0 | | | | 0 | | | | 0 | | | | 0 | | | | 0 | |
| | | | | | | | | | | | | | | | | | | | | | | | | | | | |
| Total of derivative financial assets | | | 75 | | | | 70 | | | | 0 | | | | 0 | | | | 0 | | | | 0 | | | | 0 | |
| | | | | | | | | | | | | | | | | | | | | | | | | | | | |
| Total of derivative financial liabilities and assets | | | -122 | | | | -54 | | | | -10 | | | | -10 | | | | -10 | | | | -9 | | | | -26 | |
The change in our non-derivative financial liabilities which is due to scheduled repayments will lead to an overall decrease in cash outflows compared to the end of 2012. For more information, see Note (17b).
Notes to the Consolidated Financial Statements 233
(25) FINANCIAL RISK MANAGEMENT
We manage market risks (including foreign currency exchange rate risk, interest rate risk, and equity price risk), credit risk, and liquidity risk on a Group-wide basis through our global treasury department. Our risk management and hedging strategy is set by our treasury guideline and other internal guidelines, and is subject to continuous internal risk analysis. Derivative financial instruments are only purchased to reduce risks and not for speculation, which is defined as entering into derivative instruments without a corresponding underlying transaction.
In the following sections we provide details on the management of each respective financial risk and our related risk exposure. In the sensitivity analyses that show the effects of hypothetical changes of relevant risk variables on profit or other comprehensive income, we determine the periodic effects by relating the hypothetical changes in the risk variables to the balance of financial instruments at the reporting date.
Foreign Currency Exchange Rate Risk Management
We continually monitor our exposure to currency fluctuation risks based on monetary items and forecasted transactions and pursue a Group-wide strategy to manage foreign currency exchange rate risk, using derivative financial instruments, primarily foreign exchange forward contracts, as appropriate, with the primary aim of reducing profit or loss volatility.
Currency Hedges Without Designated Hedge Relationship
The foreign exchange forward contracts we enter into to offset exposure relating to foreign currency denominated monetary assets and liabilities are not designated as being in a hedge accounting relationship, because the realized currency gains and losses from the underlying items are recognized in profit or loss in the same periods as the gains and losses from the derivatives.
Currency hedges without a designated hedge relationship also include foreign currency derivatives embedded in non-derivative host contracts that are separated and accounted for as derivatives according to the requirements of IAS 39.
In addition, during 2012 we held foreign currency options and deal-contingent forward contracts to partially hedge the cash flow risk from the consideration paid in U.S. dollars for the acquisitions of SuccessFactors and Ariba.
Currency Hedges with Designated Hedge Relationship (Cash Flow Hedges)
We enter into derivative financial instruments, primarily foreign exchange forward contracts, to hedge significant forecasted cash flows (royalties) from foreign subsidiaries denominated in foreign currencies with a defined set of hedge ratios and a hedge horizon of up to 12 months. Specifically, we exclude the interest component and only designate the spot rate of the foreign exchange forward contracts as the hedging instrument to offset anticipated cash flows relating to the subsidiaries with significant operations, including the United States, the United Kingdom, Japan, Switzerland, and Australia. We generally use foreign exchange derivatives that have maturities of 12 months or less, which may be rolled over to provide continuous coverage until the applicable royalties are received.
In 2013, net gains totaling €57 million (2012: net gains of €17 million; 2011: net losses of €14 million) resulting from the change in the component of the derivatives designated as hedging instruments were recorded in other comprehensive income.
For the years ended December 31, 2013 and 2012, no previously highly probable transaction designated as a hedged item in a foreign currency cash flow hedge relationship ceased to be probable. Therefore, we did not discontinue any of our cash flow hedge relationships. Also, we identified no ineffectiveness in all years reported. In 2013, we reclassified net gains of €57 million (2012: net losses of €24 million; 2011: net losses of €13 million) from other comprehensive income to profit or loss due to the hedged items affecting income. Generally, the cash flows of the hedged forecasted transactions are expected to occur
234 Consolidated Financial Statements IFRS
and to be recognized in profit or loss monthly within a time frame of 12 months from the date of the statement of financial position. It is estimated that €20 million of the net gains recognized in other comprehensive income in 2013, will be reclassified from other comprehensive income to profit or loss during fiscal year 2014.
Foreign Currency Exchange Rate Exposure
In line with our internal risk reporting process, we use the cash flow-at-risk method to quantify our risk positions with regard to our forecasted intercompany transactions and value-at-risk for our foreign currency denominated financial instruments. In order not to provide two different methodologies, we have opted to disclose our risk exposure based on a sensitivity analysis considering the following:
| ¡ | | Since the SAP Group’s entities generally operate in their functional currencies, the majority of our non-derivative monetary financial instruments, such as cash and cash equivalents, trade receivables, trade payables, loans to employees and third parties, bank liabilities, and other financial liabilities, are denominated in the respective entities’ functional currency. Thus, a foreign currency exchange rate risk in these transactions is nearly non-existent. In exceptional cases and limited economic environments, operating and financing transactions are denominated in currencies other than the functional currency, leading to a foreign currency exchange rate risk for the related monetary instruments. Where we hedge against currency impacts on cash flows, these foreign currency-denominated financial instruments are economically converted into the functional currency by the use of forward exchange contracts or options. Therefore, fluctuations in foreign currency exchange rates neither have a significant impact on profit nor on other comprehensive income with regard to our non-derivative monetary financial instruments. |
| ¡ | | Income or expenses recorded in connection with the non-derivative monetary financial instruments discussed above are mainly recognized in the relevant entity’s functional currency. Therefore, fluctuations in foreign currency exchange rates neither have a significant impact on profit nor on other comprehensive income in this regard. |
| ¡ | | Our free-standing derivatives designed for hedging foreign currency exchange rate risks almost completely balance the changes in the fair values of the hedged item attributable to exchange rate movements in the Consolidated Income Statements in the same period. As a consequence, the hedged items and the hedging instruments are not exposed to foreign currency exchange rate risks, and thereby have no effect on profit. |
Consequently, we are only exposed to significant foreign currency exchange rate fluctuations with regard to:
| ¡ | | Derivatives held within a designated cash flow hedge relationship (excluding the interest element, which is not part of the assigned cash flow hedge relationships) |
| ¡ | | Foreign currency embedded derivatives |
| ¡ | | The foreign currency options held as at December 31, 2011, in connection with the acquisition of SuccessFactors. |
Where we do not have a significant exposure towards a single currency, we disclose our sensitivity to our major foreign currencies (as described in Note (24)) in total.
Notes to the Consolidated Financial Statements 235
Foreign Currency Sensitivity
€ millions
| | | | | | | | | | | | | | | | | | | | | | | | |
| | | Effects on Other Non-Operating Expense, Net | | | Effects on Other Comprehensive Income | |
| | | 2013 | | | 2012 | | | 2011 | | | 2013 | | | 2012 | | | 2011 | |
| Derivatives held within a designated cash flow hedge relationship | | | | | | | | | | | | | | | | | | | | | | | | |
All major currencies -10% | | | | | | | | | | | | | | | 57 | | | | 60 | | | | 70 | |
All major currencies +10% | | | | | | | | | | | | | | | -57 | | | | -60 | | | | -70 | |
| Embedded derivatives | | | | | | | | | �� | | | | | | | | | | | | | | | |
Swiss franc -10% | | | 32 | | | | 38 | | | | 41 | | | | | | | | | | | | | |
Swiss franc +10% | | | -32 | | | | -38 | | | | -41 | | | | | | | | | | | | | |
other currencies -10% | | | 3 | | | | 3 | | | | 0 | | | | | | | | | | | | | |
other currencies +10% | | | -3 | | | | -3 | | | | 0 | | | | | | | | | | | | | |
| Freestanding foreign currency options related to SuccessFactors acquisition | | | | | | | | | | | | | | | | | | | | | | | | |
U.S. dollar -10% | | | 0 | | | | 0 | | | | 6 | | | | | | | | | | | | | |
U.S. dollar +10% | | | 0 | | | | 0 | | | | -50 | | | | | | | | | | | | | |
Our foreign currency exposure as at December 31 (and if year-end exposure is not representative, also our average/ high/low exposure) was as follows:
Foreign Currency Exposure
€ billions
| | | | | | | | |
| | | 2013 | | | 2012 | |
| Year-end exposure towards all our major currencies | | | 0.9 | | | | 1.0 | |
| Average exposure | | | 1.0 | | | | 2.4 | |
| Highest exposure | | | 1.1 | | | | 3.7 | |
| Lowest exposure | | | 0.9 | | | | 1.0 | |
During 2013, our sensitivity to foreign currency exchange rate fluctuations remained fairly stable compared to the year ended December 31, 2012.
Interest Rate Risk Management
The aim of our interest rate risk management is to reduce profit or loss volatility and optimize our interest result by creating a balanced structure of fixed and variable cash flows. We therefore manage interest rate risks by adding interest rate-related derivative instruments to a given portfolio of investments and debt financing.
As at December 31, 2013, a cash flow interest rate risk existed with regard to our cash at banks of €1.2 billion and our investing activities in money market instruments with variable yields in the amount of €487 million. A fair value interest rate risk arises from the fixed yield bonds classified as available-for-sale and accounted for at fair value as well as the fixed rate financing transactions held at amortized cost.
100% (2012: 100%) of our total interest-bearing financial liabilities outstanding as at December 31, 2013, had a fixed interest rate whereas 40% (2012: 29%) of our interest-bearing cash, cash equivalents, time deposits, and available-for-sale financial assets had a fixed interest rate.
236 Consolidated Financial Statements IFRS
Derivatives with Designated Hedge Relationship (Fair Value Hedges)
The majority of our investments are based on variable rates and/or short maturities while all our financing transactions are based on fixed rates and long maturities. To match the interest rate risk from our financing transactions to our investments we use receiver interest rate swaps to convert certain of our fixed rate financial liabilities to floating and by this means secure the fair value of the swapped financing transactions. The desired fix-floating mix of our net debt is set by the Treasury Committee. Interest rate swaps included, 44% (2012: 100%) of our total interest-bearing financial liabilities outstanding as at December 31, 2013, had a fixed interest rate.
None of the fair value adjustment from the receiver swaps, the basis adjustment on the underlying hedged items held in fair value hedge relationships, and the difference between the two recognized in Financial Income, net is material in any of the years presented.
Interest Rate Exposure
A sensitivity analysis is provided to show the impact of our interest rate risk exposure on profit or loss and equity in accordance with IFRS 7, considering the following:
| ¡ | | Changes in interest rates only affect the accounting for non-derivative fixed rate financial instruments if they are recognized at fair value. Therefore, such interest rate changes do not change the carrying amounts of our non-derivative financial liabilities as we account for them at amortized cost. On December 31 of each year-end reported, we had fixed rate bonds classified as available-for-sale as described in Note (24). We therefore consider interest rate changes relating to the fair value measurement of such fixed rate non-derivative financial assets classified as available-for-sale in the equity-related sensitivity calculation. |
| ¡ | | Income or expenses recorded in connection with non-derivative financial instruments with variable interest rates are subject to interest rate risk if they are not hedged items in an effective hedge relationship. Thus, we take into consideration interest rate changes relating to our variable-rate financing and our investments in money market instruments in the profit-related sensitivity calculation. |
| ¡ | | Due to the designation of interest rate payer swaps in a cash flow hedge relationship, the interest rate changes affect the respective amounts recorded in other comprehensive income. The movements related to the interest rate swaps’ variable leg were not reflected in the sensitivity calculation, as they offset the variable interest rate payments for the German private placement (SSD). We therefore only considered interest rate sensitivity in discounting the interest rate swaps’ fixed leg cash flows in the equity-related sensitivity calculation. |
| ¡ | | The designation of interest rate receiver swaps in a fair value hedge relationship leads to interest rate changes affecting Financial Income, net. The fair value movements related to the interest rate swaps are not reflected in the sensitivity calculation, as they offset the fixed interest rate payments for the bonds and private placements as hedged items. However, changes in market interest rates affect the amount of interest payments from the interest rate swap. As a consequence, they are included in the in the profit-related sensitivity calculation. |
Due to the current low interest rate level we base our sensitivity analyses on a yield curve shift of +100/-20 basis points to avoid negative interest rates.
If, on December 31, 2013, 2012, and 2011, interest rates had been 100 basis points higher (20 basis points lower), this would not have had a material effect on the following:
| ¡ | | The gains/losses on available-for-sale financial assets in other comprehensive income |
| ¡ | | Financial income, net for our variable interest rate investments and financial debt |
| ¡ | | The effective portion of the interest rate cash flow hedge in other comprehensive income |
| ¡ | | The variable interest payments from the receiver swaps. |
Notes to the Consolidated Financial Statements 237
Our interest rate exposure as at December 31 (and if year-end exposure is not representative, also our average/high/low exposure) was as follows:
Interest rate risk exposure
€ billions
| | | | | | | | | | | | | | | | | | | | | | | | | | | | | | | | |
| | | 2013 | | | 2012 | |
| | | Year-End | | | Average | | | High | | | Low | | | Year-End | | | Average | | | High | | | Low | |
| Fair value interest rate risk | | | | | | | | | | | | | | | | | | | | | | | | | | | | | | | | |
From investments | | | 0.04 | | | | 0.06 | | | | 0.13 | | | | 0.04 | | | | 0.03 | | | | 0.10 | | | | 0.30 | | | | 0 | |
| Cash flow interest rate risk | | | | | | | | | | | | | | | | | | | | | | | | | | | | | | | | |
From investments (incl. cash) | | | 1.73 | | | | 2.23 | | | | 2.71 | | | | 1.73 | | | | 1.80 | | | | 2.41 | | | | 3.03 | | | | 1.80 | |
From financing | | | 0 | | | | 0.31 | | | | 1.00 | | | | 0 | | | | 0 | | | | 1.10 | | | | 3.20 | | | | 0 | |
From interest rate swaps | | | 2.39 | | | | 0.60 | | | | 2.40 | | | | 0 | | | | 0 | | | | 0 | | | | 0 | | | | 0 | |
Equity Price Risk Management
Our investments in equity instruments with quoted market prices in active markets (2013: €83 million; 2012: €52 million) are monitored based on the current market value that is affected by the fluctuations in the volatile stock markets worldwide. An assumed 20% increase (decrease) in equity prices as at December 31, 2013 (2012), would not have a material impact on the value of our investments in marketable equity securities and the corresponding entries in other comprehensive income.
We are exposed to equity price risk with regard to our share-based payments. In order to reduce resulting profit or loss volatility, we hedge certain cash flow exposures associated with these plans through the purchase of derivative instruments, but do not establish a designated hedge relationship. In our sensitivity analysis we include the underlying share-based payments and the hedging instruments. Thus, we base the calculation on our net exposure to equity prices as we believe taking only the derivative instrument into account would not properly reflect our equity price risk exposure. An assumed 20% increase (decrease) in equity prices as at December 31, 2013, would have increased (decreased) our share-based payment expenses by €126 million (€90 million) (2012: increased by €139 million (decreased by €117 million); 2011: increased by €27 million (decreased by €25 million)).
Credit Risk Management
To mitigate the credit risk from our investing activities and derivative financial assets, we conduct all our activities only with approved major financial institutions and issuers that carry high external ratings, as required by our internal treasury guideline. Among its stipulations, the guideline requires that we invest only in assets from issuers with a minimum rating of at least BBB. We only make investments in issuers with a lower rating in exceptional cases. Such investments were not material in 2013. The weighted average rating of our financial assets is in the range A to A-. We pursue a policy of cautious investments characterized by predominantly current investments, standard investment instruments, as well as a wide portfolio diversification by doing business with a variety of counterparties.
238 Consolidated Financial Statements IFRS
To further reduce our credit risk, we require collateral for certain investments in the full amount of the investment volume which we would be allowed to make use of in the case of default of the counterparty to the investment. As such collateral, we only accept bonds of non-financial corporations with at least investment grade rating level.
In addition, the concentration of credit risk that exists when counterparties are involved in similar activities by instrument, sector, or geographic area is further mitigated by diversification of counterparties throughout the world and adherence to an internal limit system for each counterparty. This internal limit system stipulates that the business volume with individual counterparties is restricted to a defined limit, which depends on the lowest official long-term credit rating available by at least one of the major rating agencies, the Tier 1 capital of the respective financial institution, or participation in the German Depositors’ Guarantee Fund or similar protection schemes. We continuously monitor strict compliance with these counterparty limits. As the premium for credit default swaps mainly depends on market participants’ assessments of the creditworthiness of a debtor, we also closely observe the development of credit default swap spreads in the market to evaluate probable risk developments to timely react to changes if these should manifest.
The default risk of our trade receivables is managed separately, mainly based on assessing the creditworthiness of customers through external ratings and our historical experience with respective customers. Outstanding receivables are continuously monitored locally. Credit risks are accounted for through individual and portfolio allowances. For more information, see Note (3). The impact of default on our trade receivables from individual customers is mitigated by our large customer base and its distribution across many different industries, company sizes, and countries worldwide. For more information about our trade receivables, see Note (13). For information about the maximum exposure to credit risk, see Note (24).
Liquidity Risk Management
Our liquidity is managed by our global treasury department with the primary aim of maintaining liquidity at a level that is adequate to meet our financial obligations.
Our primary source of liquidity is funds generated from our business operations, which have historically been the primary source of the liquid funds needed to maintain our investing and financing strategy. The majority of our subsidiaries pool their cash surplus to our global treasury department, which then arranges to fund other subsidiaries’ requirements or invest any net surplus in the market, seeking to optimize yields, while ensuring liquidity, by investing only with counterparties and issuers of high credit quality, as explained above. Hence, high levels of liquid assets and marketable securities provide a strategic reserve, helping keep SAP flexible, sound, and independent.
Apart from effective working capital and cash management, we have reduced the liquidity risk inherent in managing our day-to-day operations and meeting our financing responsibilities by arranging an adequate volume of available credit facilities with various financial institutions on which we can draw if necessary.
In order to retain high financial flexibility, on November 13, 2013, SAP AG entered into a €2.0 billion syndicated credit facility agreement with an initial term of five years ending in December 2018, effectively replacing the €1.5 billion credit facility from 2010. The use of the facility is not restricted by any financial covenants. Borrowings under the facility bear interest of EURIBOR or LIBOR for the respective currency plus a margin of 22.5 basis points. We are also required to pay a commitment fee of 7.88 basis points per annum on the unused available credit. We have never drawn on the facility.
Additionally, as at December 31, 2013, and 2012, SAP AG had available lines of credit totaling €487 million and €489 million, respectively. As at December 31, 2013, and 2012, there were no borrowings outstanding under these lines of credit. As at December 31, 2013, and 2012, certain subsidiaries had lines of credit available that allowed them to borrow in local currencies at prevailing interest rates up to €36 million and €48 million,
Notes to the Consolidated Financial Statements 239
respectively. There were no borrowings outstanding under these credit facilities from any of our foreign subsidiaries as at December 31, 2013, and 2012.
(26) ADDITIONAL FAIR VALUE DISCLOSURES ON FINANCIAL INSTRUMENTS
Fair Value of Financial Instruments
We use various types of financial instruments in the ordinary course of business which are grouped into the following categories: loans and receivables (L&R), available-for-sale (AFS), held-for-trading (HFT), and amortized cost (AC).
The table below shows the carrying amounts and fair values of financial assets and liabilities by category of financial instrument as well as by category of IAS 39. Where financial assets and liabilities are shown as measured at fair value this is done on a recurring basis. Since the line items trade receivables, trade payables, and other financial assets contain both financial and non-financial assets or liabilities (such as other taxes or advance payments), the non-financial assets or liabilities are shown in the column headed “Not in Scope of IFRS 7” to allow a reconciliation to the corresponding line items in the Consolidated Statements of Financial Position. The carrying amounts and fair values of our financial instruments as at December 31 were as follows:
Fair Values of Financial Instruments
€ millions
| | | | | | | | | | | | | | | | | | | | | | | | | | | | | | | | | | | | | | | | | | | | | | | | | | |
| | | | | 2013 | | | 2012 | |
| | | | | Book Value
12/31/2013 | | | Measurement Categories | | | Fair Value
12/31/2013 | | | Not in
Scope of
IFRS 7 | | | Book Value
12/31/2012 | | | Measurement Categories | | | Fair Value
12/31/2012 | | | Not in
Scope of
IFRS 7 | |
| | | Category | | | | | At
Amortized
Cost | �� | | At Cost | | | At Fair
Value | | | | | | | | | | | | At
Amortized
Cost | | | At Cost | | | At Fair
Value | | | | | | | |
| Assets | | | | | | | | | | | | | | | | | | | | | | | | | | | | | | | | | | | | | | | | | | | | | | | | | | |
| Cash and cash equivalents | | L&R | | | 2,748 | | | | 2,748 | | | | | | | | | | | | 2,748 | | | | | | | | 2,477 | | | | 2,477 | | | | | | | | | | | | 2,477 | | | | | |
| Trade receivables | | L&R | | | 3,963 | | | | 3,816 | | | | | | | | | | | | 3,816 | | | | 147 | | | | 4,005 | | | | 3,837 | | | | | | | | | | | | 3,837 | | | | 168 | |
| Other financial assets | | | | | 858 | | | | | | | | | | | | | | | | | | | | | | | | 663 | | | | | | | | | | | | | | | | | | | | | |
Debt investments | | L&R/AFS | | | | | | | | | | | | | | | 38 | | | | 38 | | | | | | | | | | | | | | | | | | | | 29 | | | | 29 | | | | | |
Equity investments | | AFS/– | | | | | | | | | | | 0 | | | | 322 | | | | 322 | | | | 36 | | | | | | | | | | | | 149 | | | | 52 | | | | 52 | | | | 46 | |
Other non-derivative financial assets | | L&R | | | | | | | 214 | | | | | | | | | | | | 214 | | | | 119 | | | | | | | | 159 | | | | | | | | | | | | 159 | | | | 84 | |
Derivative assets | | | | | | | | | | | | | | | | | | | | | | | | | | | | | | | | | | | | | | | | | | | | | | | | | | |
With hedging relationship | | – | | | | | | | | | | | | | | | 35 | | | | 35 | | | | | | | | | | | | | | | | | | | | 29 | | | | 29 | | | | | |
Without hedging relationship | | HFT | | | | | | | | | | | | | | | 94 | | | | 94 | | | | | | | | | | | | | | | | | | | | 115 | | | | 115 | | | | | |
| Liabilities | | | | | | | | | | | | | | | | | | | | | | | | | | | | | | | | | | | | | | | | | | | | | | | | | | |
| Trade payables | | AC | | | -895 | | | | -640 | | | | | | | | | | | | -640 | | | | -255 | | | | -933 | | | | -684 | | | | | | | | | | | | -684 | | | | -249 | |
| Financial liabilities | | | | | -4,506 | | | | | | | | | | | | | | | | | | | | | | | | -5,248 | | | | | | | | | | | | | | | | | | | | | |
Non-derivative financial liabilities | | AC | | | | | | | -4,336 | | | | | | | | | | | | -4,439 | | | | | | | | | | | | -5,051 | | | | | | | | | | | | -5,228 | | | | | |
Derivatives | | | | | | | | | | | | | | | | | | | | | | | | | | | | | | | | | | | | | | | | | | | | | | | | | | |
With hedging relationship | | – | | | | | | | | | | | | | | | -26 | | | | -26 | | | | | | | | | | | | | | | | | | | | -2 | | | | -2 | | | | | |
Without hedging relationship | | HFT | | | | | | | | | | | | | | | -144 | | | | -144 | | | | | | | | | | | | | | | | | | | | -195 | | | | -195 | | | | | |
| | | | | | | | | | | | | | | | | | | | | | | | | | | | | | | | | | | | | | | | | | | | | | | | | | |
| Total financial instruments, net | | | | | 2,168 | | | | 1,802 | | | | 0 | | | | 319 | | | | 2,018 | | | | 47 | | | | 964 | | | | 738 | | | | 149 | | | | 28 | | | | 589 | | | | 49 | |
| Aggregation according to IAS 39 | | | | | | | | | | | | | | | | | | | | | | | | | | | | | | | | | | | | | | | | | | | | | | | | | | |
| Financial assets | | | | | | | | | | | | | | | | | | | | | | | | | | | | | | | | | | | | | | | | | | | | | | | | | | |
At fair value through profit or loss | | HFT | | | 94 | | | | | | | | | | | | 94 | | | | 94 | | | | | | | | 115 | | | | | | | | | | | | 115 | | | | 115 | | | | | |
Available-for-sale | | AFS | | | 360 | | | | | | | | 0 | | | | 360 | | | | 360 | | | | | | | | 230 | | | | | | | | 149 | | | | 81 | | | | 81 | | | | | |
Loans and receivables | | L&R | | | 6,925 | | | | 6,778 | | | | | | | | | | | | 6,778 | | | | 147 | | | | 6,641 | | | | 6,473 | | | | | | | | | | | | 6,473 | | | | 168 | |
| Financial liabilities | | | | | | | | | | | | | | | | | | | | | | | | | | | | | | | | | | | | | | | | | | | | | | | | | | |
At fair value through profit or loss | | HFT | | | -144 | | | | | | | | | | | | -144 | | | | -144 | | | | | | | | -195 | | | | | | | | | | | | -195 | | | | -195 | | | | | |
At amortized cost | | AC | | | -5,231 | | | | -4,976 | | | | | | | | | | | | -5,079 | | | | -255 | | | | -5,984 | | | | -5,735 | | | | | | | | | | | | -5,912 | | | | -249 | |
| Outside scope of IAS 39 | | | | | | | | | | | | | | | | | | | | | | | | | | | | | | | | | | | | | | | | | | | | | | | | | | |
Financial instruments related to employee benefit plans | | | | | 119 | | | | | | | | | | | | | | | | | | | | 119 | | | | 84 | | | | | | | | | | | | | | | | | | | | 84 | |
Investment in associates | | | | | 36 | | | | | | | | | | | | | | | | | | | | 36 | | | | 46 | | | | | | | | | | | | | | | | | | | | 46 | |
Derivatives with hedging relationship | | | | | 9 | | | | | | | | | | | | 9 | | | | 9 | | | | | | | | 27 | | | | | | | | | | | | 27 | | | | 27 | | | | | |
| | | | | | | | | | | | | | | | | | | | | | | | | | | | | | | | | | | | | | | | | | | | | | | | | | |
| Total financial instruments, net | | | | | 2,168 | | | | 1,802 | | | | 0 | | | | 319 | | | | 2,018 | | | | 47 | | | | 964 | | | | 738 | | | | 149 | | | | 28 | | | | 589 | | | | 49 | |
240 Consolidated Financial Statements IFRS
Determination of Fair Values
IFRS 13 defines fair value as the price that would be received to sell an asset or paid to transfer a liability in an orderly transaction between market participants on the measurement date. Accordingly, best evidence of fair value provides quoted prices in an active market. Where market prices are not readily available, valuation techniques have to be used to establish fair value.
Depending on the inputs used for determining fair value and their significance for the valuation techniques, we have categorized our financial instruments at fair value into a three-level fair value hierarchy as mandated by IFRS 13.
The fair value hierarchy gives the highest priority to quoted prices in active markets for identical assets or liabilities (Level 1) and the lowest priority to unobservable inputs (Level 3). The inputs used to measure fair value for one single instrument may fall into different levels of the fair value hierarchy. In such cases, the level in the fair value hierarchy within which the fair value measurement in its entirety falls has been determined based on the lowest level input that is significant to the fair value measurement in its entirety. Our assessment of the significance of a particular input to the fair value measurement in its entirety requires judgment, and considers factors specific to the asset or liability.
The levels of the fair value hierarchy, its application to our financial assets and liabilities, and the respective determination of fair value are described below – differentiating between those that are measured at fair value and those that are measured at cost or amortized cost where fair value is only disclosed:
| ¡ | | Level 1: Quoted prices in active markets for identical assets or liabilities. |
| ¡ | | Level 2: Inputs other than those that can be observed, either directly or indirectly, such as quoted prices in active markets for similar assets or liabilities, quoted prices for identical or similar assets or liabilities in markets that are not active, or other inputs that are observable or can be corroborated by observable market data for substantially the full term of the assets or liabilities. |
| ¡ | | Level 3: Unobservable inputs that are supported by little or no market activity and that are significant to the fair value of the assets or liabilities. |
It is our policy to recognize transfers at the beginning of the period of the event or change in circumstances that caused the transfer.
Notes to the Consolidated Financial Statements 241
Financial Instruments Measured at Fair Value on a Recurring Basis
| | | | | | | | |
Type | | Fair Value Hierarchy | | Determination of Fair Value/
Valuation Technique | | Significant Unobservable Inputs | | Interrelationship Between
Significant Unobservable Inputs
and Fair Value Measurement |
| Other financial assets | | | | | | | | |
| Debt investments | | Level 1 | | Quoted prices in an active market | | NA | | NA |
| | | | |
| Listed equity investments | | Level 1 | | Quoted prices in an active market | | NA | | NA |
| | | | |
| Listed equity investments with sale restriction | | Level 2 | | Quoted prices in an active market deducting a discount for the disposal restriction derived from the premium for a respective put option. | | NA | | NA |
| | | | |
| Unlisted equity investments | | Level 3 | | Market approach. Comparable company valuation using revenue multiples derived from companies comparable to the investee. | | – Peer companies used (revenue multiples range from 2.3-8.5) – Revenues of investees – Discounts for lack of marketability (20% – 30%) | | The estimated fair value would increase (decrease) if: – the revenue multiples were higher (lower) – the investees’ revenues were higher (lower) – the liquidity discounts were lower (higher). |
| | | | |
| Unlisted equity investments | | Level 3 | | Market approach. Venture capital method evaluating a variety of quantitative and qualitative factors like actual and forecasted results, cash position, recent or planned transactions, and market comparable companies. | | NA | | NA |
| | | | |
| Unlisted equity investments | | Level 3 | | Discounted cash flow. | | – Revenue growth rate (6% – 9%) – Weighted average cost of capital (13.3%) | | The estimated fair value would increase (decrease) if: – the revenue growth was higher (lower) – the weighted average cost of capital was lower (higher) |
| | | | |
| Unlisted equity investments | | Level 3 | | Last financing round valuations | | NA | | NA |
| | | | |
| Unlisted equity investments | | Level 3 | | Liquidation preferences | | NA | | NA |
(continued)
242 Consolidated Financial Statements IFRS
Financial Instruments Measured at Fair Value on a Recurring Basis (continued)
| | | | | | | | |
Type | | Fair Value
Hierarchy | | Determination of Fair Value/ Valuation Technique | | Significant Unobservable Inputs | | Interrelationship Between
Significant Unobservable Inputs
and Fair Value Measurement |
| Other financial assets (continued) | | | | | | | | |
| Private equity funds | | Level 3 | | Net asset value/Fair market value as reported by the respective funds | | NA | | NA |
| | | | |
| Interest rate swaps | | Level 2 | | Discounted cash flow. Expected future cash flows are estimated based on forward interest rates from observable yield curves and contract interest rates, discounted at a rate that reflects the credit risk of the counterparty. | | NA | | NA |
| | | | |
| Call options for share-based payments plans | | Level 2 | | Monte Carlo Model. Calculated considering risk-free interest rates, the remaining term of the derivatives, the dividend yields, the stock price, and the volatility of our share. | | NA | | NA |
| | | | |
| Other financial assets/Financial liabilities | | | | | | | | |
| Foreign exchange (FX) forward contracts | | Level 2 | | Discounted cash flow using Par-Method. Expected future cash flows based on forward exchange rates are discounted over the respective remaining term of the contracts using the respective deposit interest rates and spot rates. | | NA | | NA |
Notes to the Consolidated Financial Statements 243
Financial Instruments not Measured at Fair Value
| | | | |
Type | | Fair Value Hierarchy | | Determination of Fair Value/ Valuation Technique |
| Financial liabilities | | | | |
Fixed rate bonds (financial liabilities) | | Level 1 | | Quoted prices in an active market |
| | |
Fixed rate private placements/loans (financial liabilities) | | Level 2 | | Discounted cash flows. Future cash outflows for fixed interest and principal are discounted over the respective term of the contracts using the respective market interest rates as of the reporting date. |
For cash and cash equivalents, trade receivable, other non-derivative financial assets/liabilities, accounts payable and variable rate financial debt it is assumed that their carrying value reasonably approximates their fair values.
244 Consolidated Financial Statements IFRS
The following table allocates those financial assets and liabilities that are measured at fair value in accordance with IAS 39 either through profit or loss or other comprehensive income or for which fair value must be disclosed in accordance with IFRS 7 as at December 31, 2013, to the three levels of the fair value hierarchy according to IFRS 13.
Classification of Financial Instruments
€ millions
| | | | | | | | | | | | | | | | | | | | | | | | | | | | | | | | |
| | | 2013 | | | 2012 | |
| | | Level 1 | | | Level 2 | | | Level 3 | | | Total | | | Level 1 | | | Level 2 | | | Level 3 | | | Total | |
| Financial assets | | | | | | | | | | | | | | | | | | | | | | | | | | | | | | | | |
Corporate bonds | | | 29 | | | | 0 | | | | 0 | | | | 29 | | | | 27 | | | | 0 | | | | 0 | | | | 27 | |
Government securities | | | 2 | | | | 0 | | | | 0 | | | | 2 | | | | 0 | | | | 0 | | | | 0 | | | | 0 | |
Municipal bonds | | | 7 | | | | 0 | | | | 0 | | | | 7 | | | | 2 | | | | 0 | | | | 0 | | | | 2 | |
Debt investments | | | 38 | | | | 0 | | | | 0 | | | | 38 | | | | 29 | | | | 0 | | | | 0 | | | | 29 | |
Software industry | | | 52 | | | | 31 | | | | 239 | | | | 322 | | | | 52 | | | | 0 | | | | 0 | | | | 52 | |
Equity investments | | | 52 | | | | 31 | | | | 239 | | | | 322 | | | | 52 | | | | 0 | | | | 0 | | | | 52 | |
| Available-for-sale financial assets | | | 90 | | | | 31 | | | | 239 | | | | 360 | | | | 81 | | | | 0 | | | | 0 | | | | 81 | |
FX forward contracts | | | 0 | | | | 56 | | | | 0 | | | | 56 | | | | 0 | | | | 76 | | | | 0 | | | | 76 | |
Interest rate swaps | | | 0 | | | | 5 | | | | 0 | | | | 5 | | | | 0 | | | | 0 | | | | 0 | | | | 0 | |
Call options for share-based payments | | | 0 | | | | 68 | | | | 0 | | | | 68 | | | | 0 | | | | 68 | | | | 0 | | | | 68 | |
| Derivative financial assets | | | 0 | | | | 129 | | | | 0 | | | | 129 | | | | 0 | | | | 144 | | | | 0 | | | | 144 | |
| | | | | | | | | | | | | | | | | | | | | | | | | | | | | | | | |
| Total | | | 90 | | | | 160 | | | | 239 | | | | 489 | | | | 81 | | | | 144 | | | | 0 | | | | 225 | |
| | | | | | | | |
| Financial liabilities | | | | | | | | | | | | | | | | | | | | | | | | | | | | | | | | |
FX forward contracts | | | 0 | | | | 147 | | | | 0 | | | | 147 | | | | 0 | | | | 197 | | | | 0 | | | | 197 | |
Interest rate swaps | | | 0 | | | | 23 | | | | 0 | | | | 23 | | | | 0 | | | | 0 | | | | 0 | | | | 0 | |
| Derivative financial liabilities | | | 0 | | | | 170 | | | | 0 | | | | 170 | | | | 0 | | | | 197 | | | | 0 | | | | 197 | |
| | | | | | | | | | | | | | | | | | | | | | | | | | | | | | | | |
| Total | | | 0 | | | | 170 | | | | 0 | | | | 170 | | | | 0 | | | | 197 | | | | 0 | | | | 197 | |
Notes to the Consolidated Financial Statements 245
Transfers between Level 1 and 2
Transfers of available-for-sale equity investments from Level 2 to Level 1 which occurred because disposal restrictions lapsed and deducting a discount for such restriction was no longer necessary were not material in all years presented, while transfers from Level 1 to Level 2 did not occur at all.
Level 3 disclosures
The following table shows the reconciliation from the opening to the closing balances for our Level 3 fair values:
Reconciliation of Level 3 Fair Values
€ millions
| | | | |
| | | 2013 | |
| | | Unlisted Equity
Investments and Private
Equity Funds | |
| Opening balance | | | 0 | |
| Transfers | | | | |
into Level 3 | | | 162 | |
out of Level 3 | | | -30 | |
| Purchases | | | 79 | |
| Sales | | | -16 | |
| Gains/losses | | | | |
included in financial income, net in profit and loss | | | 7 | |
included in available-for-sale financial assets in other comprehensive income | | | 46 | |
included in exchange differences in other comprehensive income | | | -9 | |
| Closing balance | | | 239 | |
| | | | |
| Change in unrealized gains/losses in profit and loss for investments held at the end of the reporting period | | | 0 | |
The transfers into and out of Level 3 relate to unlisted equity investments.
Changing the unobservable inputs to reflect reasonably possible alternative assumptions would not have a material impact on the fair values of our unlisted equity investments held as available-for-sale as of the reporting date.
(27) SHARE-BASED PAYMENTS
SAP has granted awards under various cash-settled and equity-settled share-based payments to its directors and employees. Most of these awards are described in detail below. SAP has other share-based payments, which are, individually and in aggregate, immaterial to our Consolidated Financial Statements.
a) Cash-Settled Share-based payments
SAP’s cash-settled share-based payments include the following programs: Employee Participation Plan (EPP) and Long-Term Incentive Plan (LTI Plan for the Global Managing Board) 2015, SOP Performance Plan 2009 (SOP PP), Stock Option Plan 2010 (SOP 2010 (2010-2013 tranches)), Restricted Stock Unit Plan 2013 (RSU 2013), acquired SFSF Rights (former SuccessFactors awards assumed in connection with the SuccessFactors acquisition in 2012), acquired Ariba Rights (former Ariba awards assumed in connection with the Ariba acquisition in 2012).
246 Consolidated Financial Statements IFRS
As at December 31, 2013, the valuation of our outstanding cash-settled plans was based on the following parameters and assumptions:
Fair Value and Parameters Used at Year-End 2013 for Cash-Settled Plans
| | | | | | | | | | | | | | | | | | | | | | | | | | | | |
| | | LTI Plan 2015
(2012/2013
Tranche) | | | EPP 2015
(2013 Tranche) | | | RSU 2013 | | | SOP PP | | | SOP 2010
(2010 – 2013
Tranche) | | | SFSF Rights | | | Ariba Rights | |
| Option pricing model used | | | Other | 1) | | | Other | 1) | | | Other | 1) | | | Monte-Carlo | | | | Monte-Carlo | | | | NA | | | | NA | |
| Range of grant dates | | | 2/7/2012 | | | | 3/20/2013 | | | | 1/16/2013 | | | | 5/6/2009 | | | | 9/9/2010 | | | | 2/21/2012 | | | | 10/1/2012 | |
| | | 7/1/2013 | | | | | | | | 12/16/2013 | | | | | | | | 9/13/2013 | | | | | | | | | |
| Quantity of awards issued (in thousands) | | | 661 | | | | 2,087 | | | | 1,559 | | | | 10,321 | | | | 26,341 | | | | 4,534 | | | | 4,091 | |
| Weighted average fair value as at December 31, 2013 | | | €59.80 | | | | €62.31 | | | | €61.55 | | | | €0.74 | | | | €15.71 | | | | €29.00 | | | | €32.63 | |
| Weighted average intrinsic value as at December 31, 2013 | | | €62.31 | | | | €62.31 | | | | €63.19 | | | | €0.00 | | | | €10.98 | | | | €29.00 | | | | €32.63 | |
| Expected remaining life as at December 31, 2013 (in years) | | | 2.4 | | | | 0.1 | | | | 1.2 | | | | 0.2 | | | | 3.3 | | | | 0.8 | | | | 0.7 | |
| Risk-free interest rate (depending on maturity) | |
| 0.26% to
0.46 |
% | | | 0.01 | % | |
| 0.01% to
0.44 |
% | | | 0.02 | % | |
| 0.08% to
0.92 |
% | | | NA | | | | NA | |
| Expected volatility SAP shares | | | NA | | | | NA | | | | NA | | | | 19.7 | % | |
| 21.3% to
27.6 |
% | | | NA | | | | NA | |
| Expected dividend yield SAP shares | | | 1.67 | % | | | NA | | | | 1.65 | % | | | 1.67 | % | | | 1.67 | % | | | NA | | | | NA | |
| Share price of reference index | | | NA | | | | NA | | | | NA | | | | €230.94 | | | | NA | | | | NA | | | | NA | |
| Expected volatility reference index | | | NA | | �� | | NA | | | | NA | | | | 10.6 | % | | | NA | | | | NA | | | | NA | |
| Expected dividend yield reference index | | | NA | | | | NA | | | | NA | | | | 2.15 | % | | | NA | | | | NA | | | | NA | |
| Expected correlation SAP share/reference index | | | NA | | | | NA | | | | NA | | | | 17.4 | % | | | NA | | | | NA | | | | NA | |
| 1) | For these awards the fair value is calculated by subtracting the net present value of expected future dividend payments, if any, until maturity of the respective award from the prevailing share price as of the valuation date. |
Notes to the Consolidated Financial Statements 247
As at December 31, 2012, the valuation of our outstanding cash-settled plans was based on the following parameters and assumptions:
Fair Value and Parameters Used at Year-End 2012 for Cash-Settled Plans
| | | | | | | | | | | | | | | | | | | | | | | | |
| | | LTI Plan 2015
(2012 Tranche) | | | EPP 2015
(2012 Tranche) | | | SOP PP | | | SOP 2010
(2010 – 2012
Tranche) | | | SFSF Rights | | | Ariba Rights | |
| Option pricing model used | | | Other | 1) | | | Other | 1) | | | Monte-Carlo | | | | Monte-Carlo | | | | NA | | | | NA | |
| Range of grant dates | | | 2/7/2012 | | | | 4/5/2012 | | | | 5/6/2009 | | | | 9/9/2010 | | | | 2/21/2012 | | | | 10/1/2012 | |
| | | 9/1/2012 | | | | | | | | | | | | 6/8/2012 | | | | | | | | | |
| Quantity of awards issued (in thousands) | | | 349 | | | | 2,752 | | | | 10,321 | | | | 18,920 | | | | 4,534 | | | | 4,091 | |
| Weighted average fair value as at December 31, 2012 | | | €57.79 | | | | €60.69 | | | | €7.36 | | | | €17.06 | | | | €30.32 | | | | €34.11 | |
| Weighted average intrinsic value as at December 31, 2012 | | | €60.69 | | | | €60.69 | | | | €4.76 | | | | €14.79 | | | | €30.32 | | | | €34.11 | |
| Expected remaining life as at December 31, 2012 (in years) | | | 3.1 | | | | 0.1 | | | | 1.2 | | | | 4.1 | | | | 1.3 | | | | 1.1 | |
| Risk-free interest rate (depending on maturity) | | | 0.06 | % | | | 0.00 | % | | | -0.04 | % | |
| 0.03% to
0.41 |
% | | | NA | | | | NA | |
| Expected volatility SAP shares | | | NA | | | | NA | | | | 19.8 | % | |
| 25.8% to
29.6 |
% | | | NA | | | | NA | |
| Expected dividend yield SAP shares | | | 1.55 | % | | | NA | | | | 1.55 | % | | | 1.55 | % | | | NA | | | | NA | |
| Share price of reference index | | | NA | | | | NA | | | | €192.95 | | | | NA | | | | NA | | | | NA | |
| Expected volatility reference index | | | NA | | | | NA | | | | 5.5 | % | | | NA | | | | NA | | | | NA | |
| Expected dividend yield reference index | | | NA | | | | NA | | | | 1.39 | % | | | NA | | | | NA | | | | NA | |
| Expected correlation SAP share/reference index | | | NA | | | | NA | | | | 42.1 | % | | | NA | | | | NA | | | | NA | |
| 1) | For these awards the fair value is calculated by subtracting the net present value of expected future dividend payments, if any, until maturity of the respective award from the prevailing share price as of the valuation date. |
Expected volatility of the SAP share price is based on a mixture of implied volatility from traded options with corresponding lifetimes and exercise prices as well as historical volatility with the same expected life as the options granted. For the SOP PP valuation, the expected volatility of the Technology Peer Group Index (ISIN DE000A0YKR94) (TechPGI) is based on the historical volatility derived from the index price history.
Expected remaining life of the options reflects both the contractual term and the expected, or historical, exercise behavior. The risk-free interest rate is derived from German government bonds with a similar duration. Dividend yield is based on expectations of future dividends.
The number of awards under our cash-settled plans developed as follows in the years ended December 31, 2013, 2012, and 2011:
248 Consolidated Financial Statements IFRS
Changes in Numbers of Outstanding Awards Under Our Cash-Settled Plans
thousands
| | | | | | | | | | | | | | | | | | | | | | | | | | | | |
| | | LTI Plan 2015
(2012/2013
Tranche) | | | EPP 2015
(2012/2013
Tranche) | | | RSU 2013 | | | SOP PP | | | SOP 2010
(2010-2013
Tranche) | | | SFSF
Rights | | | Ariba
Rights | |
| Outstanding as at 12/31/2010 | | | NA | | | | NA | | | | NA | | | | 9,575 | | | | 5,373 | | | | NA | | | | NA | |
| Granted in 2011 | | | NA | | | | NA | | | | NA | | | | 0 | | | | 5,192 | | | | NA | | | | NA | |
| Exercised in 2011 | | | NA | | | | NA | | | | NA | | | | 0 | | | | 0 | | | | NA | | | | NA | |
| Expired in 2011 | | | NA | | | | NA | | | | NA | | | | 0 | | | | 0 | | | | NA | | | | NA | |
| Forfeited in 2011 | | | NA | | | | NA | | | | NA | | | | -632 | | | | -515 | | | | NA | | | | NA | |
| Outstanding as at 12/31/2011 | | | NA | | | | NA | | | | NA | | | | 8,943 | | | | 10,050 | | | | NA | | | | NA | |
| Granted in 2012 | | | 349 | | | | 2,752 | | | | NA | | | | 0 | | | | 8,331 | | | | 4,534 | | | | 4,091 | |
| Adjustment based upon KPI target achievement in 2012 | | | 117 | | | | 880 | | | | NA | | | | NA | | | | NA | | | | NA | | | | NA | |
| Exercised in 2012 | | | 0 | | | | 0 | | | | NA | | | | -3,294 | | | | 0 | | | | -1,826 | | | | -1,587 | |
| Expired in 2012 | | | 0 | | | | 0 | | | | NA | | | | 0 | | | | 0 | | | | 0 | | | | 0 | |
| Forfeited in 2012 | | | 0 | | | | -130 | | | | NA | | | | -805 | | | | -954 | | | | -305 | | | | -144 | |
| Outstanding as at 12/31/2012 | | | 466 | | | | 3,502 | | | | NA | | | | 4,844 | | | | 17,427 | | | | 2,403 | | | | 2,360 | |
| Granted in 2013 | | | 311 | | | | 2,087 | | | | 1,559 | | | | 0 | | | | 7,421 | | | | NA | | | | NA | |
| Adjustment based upon KPI target achievement in 2013 | | | -18 | | | | -139 | | | | 0 | | | | NA | | | | NA | | | | NA | | | | NA | |
| Exercised in 2013 | | | -196 | | | | -3,495 | | | | 0 | | | | -992 | | | | -2,215 | | | | -797 | | | | -1,362 | |
| Expired in 2013 | | | 0 | | | | -7 | | | | 0 | | | | 0 | | | | 0 | | | | 0 | | | | 0 | |
| Forfeited in 2013 | | | -48 | | | | -103 | | | | -96 | | | | -385 | | | | -967 | | | | -531 | | | | -90 | |
| | | | | | | | | | | | | | | | | | | | | | | | | | | | |
| Outstanding as at 12/31/2013 | | | 515 | | | | 1,845 | | | | 1,463 | | | | 3,467 | | | | 21,666 | | | | 1,075 | | | | 908 | |
| Additional information | | | | | | | | | | | | | | | | | | | | | | | | | | | | |
| Awards exercisable as at 12/31/2011 | | | NA | | | | NA | | | | NA | | | | 8,943 | | | | 0 | | | | NA | | | | NA | |
| Awards exercisable as at 12/31/2012 | | | 0 | | | | 0 | | | | NA | | | | 4,844 | | | | 0 | | | | 0 | | | | 0 | |
| | | | | | | | | | | | | | | | | | | | | | | | | | | | |
| Awards exercisable as at 12/31/2013 | | | 0 | | | | 0 | | | | 0 | | | | 3,467 | | | | 1,609 | | | | 0 | | | | 0 | |
| Aggregate intrinsic value of vested awards (in € millions), as at 12/31/2011 | | | NA | | | | NA | | | | NA | | | | 0 | | | | 0 | | | | NA | | | | NA | |
| Aggregate intrinsic value of vested awards (in € millions), as at 12/31/2012 | | | 28 | | | | 213 | | | | NA | | | | 23 | | | | 0 | | | | 3 | | | | 3 | |
| | | | | | | | | | | | | | | | | | | | | | | | | | | | |
| Aggregate intrinsic value of vested awards (in € millions), as at 12/31/2013 | | | 43 | | | | 115 | | | | 0 | | | | 0 | | | | 37 | | | | 0 | | | | 0 | |
| Weighted average share price (in €) for share options exercised in 2011 | | | NA | | | | NA | | | | NA | | | | NA | | | | NA | | | | NA | | | | NA | |
| Weighted average share price (in €) for share options exercised in 2012 | | | NA | | | | NA | | | | NA | | | | 60.40 | | | | NA | | | | 30.32 | | | | 34.11 | |
| | | | | | | | | | | | | | | | | | | | | | | | | | | | |
| Weighted average share price (in €) for share options exercised in 2013 | | | 54.96 | | | | 59.90 | | | | NA | | | | 61.38 | | | | 55.47 | | | | 29.00 | | | | 32.63 | |
| Provision as at 12/31/2012 (in € millions) | | | 53 | | | | 212 | | | | NA | | | | 36 | | | | 137 | | | | 39 | | | | 51 | |
| | | | | | | | | | | | | | | | | | | | | | | | | | | | |
| Provision as at 12/31/2013 (in € millions) | | | 41 | | | | 115 | | | | 32 | | | | 3 | | | | 183 | | | | 20 | | | | 24 | |
| Expense recognized in 2011 (in € millions) | | | NA | | | | NA | | | | NA | | �� | | -8 | | | | 28 | | | | NA | | | | NA | |
| Expense recognized in 2012 (in € millions) | | | 53 | | | | 216 | | | | NA | | | | 20 | | | | 74 | | | | 38 | | | | 21 | |
| | | | | | | | | | | | | | | | | | | | | | | | | | | | |
| Expense recognized in 2013 (in € millions) | | | -11 | | | | 118 | | | | 34 | | | | -28 | | | | 83 | | | | 10 | | | | 21 | |
Notes to the Consolidated Financial Statements 249
Cash-settled plans granted to SAP employees (except for employees of SFSF and Ariba)
a.1) Employee Participation Plan (EPP) and Long-Term Incentive Plan (LTI Plan) 2015
SAP implemented two new share-based payments in 2012: an Employee Participation Plan (EPP) 2015 for employees and a Long-Term Incentive (LTI) Plan 2015 for members of the Global Managing Board.
The plans are focused on SAP’s share price and the achievement of two financial key performance indicators (KPIs): non-IFRS total revenue and non-IFRS operating profit, which are derived from the Company’s 2015 financial KPIs. Under these plans, virtual shares, called restricted share units (RSUs), are granted to participants. Participants are paid out in cash based on the number of RSUs that vest.
The RSUs were granted and allocated at the beginning of each year through 2015, with EPP 2015 RSUs subject to annual Executive Board approval. Participants in the LTI Plan 2015 have already been granted a budget for the years 2012 to 2015 (2013 to 2015 for new plan participants in 2013). All participants in the LTI Plan 2015 are members of the Global Managing Board.
The RSU allocation process will take place at the beginning of each year based on SAP’s share price after the publication of its preliminary annual results for the last financial year prior to the performance period.
At the end of the given year, the number of RSUs that finally vest with plan participants depends on SAP’s actual performance for the given year, and might be higher or lower than the number of RSUs originally granted. If performance against both KPI targets reaches at least the defined 80% threshold, the RSUs vest. Depending on performance, the vesting can reach a maximum of 150% of the budgeted amount. If performance against either or both of those KPI targets does not reach the defined threshold of 80%, no RSUs vest and RSUs granted for that year will be forfeited. For the year 2013, the RSUs granted at the beginning of the year vested with 92.97% (2012: 133.55%) achievement of the KPI targets.
250 Consolidated Financial Statements IFRS
Under the EPP 2015, the RSUs are paid out in the first quarter of the year after the one-year performance period, whereas the RSUs for members of the Global Managing Board under the LTI Plan 2015 are subject to a three-year-holding period before payout, which occurs starting in 2016.
The plans include a “look-back” provision, due to the fact that these plans are based on reaching certain KPI levels in 2015. If the overall achievement in 2015 is higher or lower than represented by the number of RSUs vested from 2012 to 2014, the number of RSUs granted in 2015 can increase or decrease accordingly. However, RSUs that were already fully vested in prior years cannot be forfeited. For the EPP, the application of the “look-back”-provision is subject to approval by the Executive Board in 2015.
The final financial effect of each tranche of the EPP 2015 and the LTI Plan 2015 will depend on the number of vested RSUs and the SAP share price, which is set directly after the announcement of the preliminary fourth quarter and full-year results for the last financial year under the EPP 2015 (of the respective three-year holding period under the LTI Plan 2015), and thus may be significantly above or below the budgeted amounts.
a.2) SOP Performance Plan 2009 (SOP PP)
Under the SOP Performance Plan 2009, we granted to top executives and top performers cash-based virtual stock options, the value of which depends on the multi-year performance of the SAP share relative to an industry-specific share price index, the TechPGI.
The future payout at the exercise date will be based on the outperformance of the SAP share price over the TechPGI. Exercise is only possible if the SAP share price has outperformed the TechPGI. For that purpose, the SOP PP 2009 agreement defines the initial value of the TechPGI (€97.54) as well as the SAP initial exercise price (€28.00 per share). After a vesting period of two years, the plan provides for 4 predetermined exercise dates every calendar year until the rights lapse five years after the grant date. The latest possible exercise day for eligible employees will be in March 2014.
Monetary benefits are capped at 110% of the grant price (€30.80). The dynamic exercise price at valuation date is €66.29.
a.3) SAP Stock Option Plan 2010 (SOP 2010 (2010–2013 Tranches))
Under the SAP Stock Option Plan 2010, we granted members of the Senior Leadership Team / Global Executives, SAP’s Top Rewards (employees with an exceptional rating / high potentials) between 2010 and 2013 and only in 2010 and 2011 members of the Executive Board cash-based virtual stock options, the value of which depends on the multi-year performance of the SAP share.
The grant-base value is based on the average fair market value of one ordinary share over the five business days prior to the Executive Board resolution date.
The virtual stock options granted under the SOP 2010 give the employees the right to receive a certain amount of money by exercising the options under the terms and conditions of this plan. After a three-year vesting period (four years for members of the Executive Board), the plan provides for 11 predetermined exercise dates every calendar year (one date per month except in April) until the rights lapse six years after the grant date (seven years for members of the Executive Board). Employees can exercise their virtual stock options only if they are employed by SAP; if they leave the Company, they forfeit them. Executive Board members’ options are non-forfeitable once granted – if the service agreement ends in the grant year, the number of options is reducedpro rata temporis. Any options not exercised at the end of their term expire.
The exercise price is 110% of the grant base value (115% for members of the Executive Board) which is €39.03 (€40.80) for the 2010 tranche, €46.23 (€48.33) for the 2011 tranche, €49.28 for the 2012 tranche, and €59.85 for the 2013 tranche.
Monetary benefits will be capped at 100% of the exercise price (150% for members of the Executive Board).
Notes to the Consolidated Financial Statements 251
Cash-settled plans granted to employees of SFSF and Ariba
a.4) Restricted Stock Unit Plan 2013 (RSU 2013)
We maintain share-based payment plans that allow for the issuance of restricted stock units (RSU) to retain and motivate executives and certain employees of the SuccessFactors and Ariba businesses, which we acquired in 2012.
Under the RSU 2013 Plan, we granted a certain number of RSUs throughout 2013 representing a contingent right to receive a cash payment determined by the market value of the same number of SAP AG American Depository Receipts on the New York Stock Exchange and the number of RSUs that ultimately vest. Granted RSUs will vest in different tranches, either:
| – | Over a one-to-three year service period only, or |
| – | Over a one-to-three year service period and upon meeting certain key performance indicators (KPIs). |
The number of RSUs that could vest for SuccessFactors employees under the performance-based grants was contingent upon a weighted achievement of performance milestones for the fiscal year ended December 31, 2013 related to:
| – | Specific indicators of cloud subscriptions and support revenue (80%) and |
| – | Profit contribution of such specific indicators of cloud subscriptions and support revenue (20%). |
Depending on performance, the number of RSUs vesting could have ranged between 80% and 140% of the number initially granted. Performance against the KPI targets was set at 100% in fiscal year 2013.
The number of RSUs that could vest for Ariba employees under the performance-based grants was contingent upon achievement of performance milestones for the fiscal year ended December 31, 2013 related to specific indicators of growth in cloud subscriptions and support revenue. The KPI targets included a minimum threshold for at least 50% vesting. If performance against the KPI targets had not exceeded the minimum threshold, no RSUs would have vested. Additionally, the number of RSUs that can vest is capped at 200% of the number originally granted. Performance against the KPI targets was 100% in fiscal year 2013.
The RSUs are paid out in cash upon vesting.
a.5) SuccessFactors Cash-Settled Awards Replacing Pre-Acquisition SuccessFactors Awards (SFSF Rights)
In conjunction with the acquisition of SuccessFactors in 2012, under the terms of the acquisition agreement, SAP exchanged unvested Restricted Stock Awards (RSAs), Restricted Stock Units (RSUs), and Performance Stock Units (PSUs) held by employees of SuccessFactors for cash-settled share-based payment awards of SAP (SFSF Rights).
RSAs, RSUs, and PSUs unvested at the closing of the acquisition were converted into the right to receive, at the originally agreed vesting dates, an amount in cash equal to the number of RSAs and RSUs held at the vesting date multiplied by US$40.00 per share.
There were 4.5 million unvested RSAs, RSUs, and PSUs at the acquisition date, representing a fair value of €128 million after considering forfeitures dependent on grant dates and remaining vesting periods. Of the total fair value, €59 million was allocated to consideration transferred and €68 million was allocated to future services to be provided and will be recognized as post-acquisition compensation expense as the awards vest over the remainder of the original vesting terms – the remaining vesting period for such SuccessFactors Rights are in a range of up to four years from the acquisition date. From January 1, 2013, to December 31, 2013, 0.8 million SFSF Rights vested. The unrecognized expense related to SFSF Rights was €11 million as at December 31, 2013, and will be recognized over a remaining vesting period of up to 2.0 years.
252 Consolidated Financial Statements IFRS
a.6) Ariba Cash-Settled Awards Replacing Pre-Acquisition Ariba Awards (Ariba Rights)
The terms of the acquisition agreement under which SAP acquired Ariba in 2012 required SAP to exchange unvested Restricted Stock Awards (RSAs) and Restricted Stock Units (RSUs) held by employees of Ariba for cash-settled share-based payment awards of SAP (Ariba Rights).
RSAs and RSUs unvested at the closing of the acquisition were converted into the right to receive an amount in cash equal to the number of RSAs and RSUs held at the vesting date multiplied by US$45.00 per share in accordance with the respective vesting terms.
There were 4.1 million unvested RSAs and RSUs at the acquisition date, representing a fair value of €138 million after considering forfeitures dependent on grant dates and remaining vesting periods. Of the total fair value, €86 million was allocated to consideration transferred and €52 million was allocated to future services to be provided and will be recognized as post-acquisition compensation expense as the awards vest over the remainder of the vesting terms – the remaining vesting period for such Ariba Rights are in a range of up to 3.5 years at acquisition date (in accordance with the originally agreed vesting dates). From January 1, 2013, to December 31, 2013, 1.4 million Ariba Rights vested. The unrecognized expense related to Ariba Rights was €7 million as at December 31, 2013, and will be recognized over a remaining vesting period of up to 1.75 years.
b) Equity-Settled Share-Based Payments
Equity-settled plans include primarily the Share Matching Plan (SMP).
Under the Share Matching Plan (SMP) implemented in 2010, SAP offers its employees the opportunity to purchase SAP AG shares at a discount of 40%. The number of SAP shares an eligible employee may purchase through the SMP is limited to a percentage of the employee’s annual base salary. After a three-year holding period, such plan participants will receive one (in 2012: five) free matching share of SAP for every three SAP shares acquired.
The terms for the members of the Senior Leadership Team / Global Executives are slightly different than those for the other employees. They do not receive a discount when purchasing the shares. However, after a three-year holding period, they receive two (in 2012: five) free matching SAP shares for every three SAP shares acquired. This plan is not open to members of the SAP Executive Board.
Notes to the Consolidated Financial Statements 253
The following table shows the parameters and assumptions used at grant date to determine the fair value of free matching shares, as well as the quantity of shares purchased and free matching shares granted through this program in 2013, 2012, and 2011:
Fair Value and Parameters at Grant Date for SMP
| | | | | | | | | | | | |
| | | 2013 | | | 2012 | | | 2011 | |
| Grant date | | | 9/4/2013 | | | | 6/6/2012 | | | | 6/8/2011 | |
| Share price at grant date | | | €54.20 | | | | €45.43 | | | | €41.73 | |
| Purchase price set by the Executive Board | | | €56.20 | | | | €48.23 | | | | €44.07 | |
| Risk-free interest rate | | | 0.43 | % | | | 0.12 | % | | | 1.95 | % |
| Expected dividend yield of SAP shares | | | 1.92 | % | | | 2.13 | % | | | 1.70 | % |
| Expected life of free matching shares (in years) | | | 3.0 | | | | 3.0 | | | | 3.0 | |
| Free matching share fair value at grant date | | | €51.09 | | | | €42.54 | | | | €39.69 | |
| | | |
| Number of shares purchased (in thousands) | | | 1,559 | | | | 1,926 | | | | 1,334 | |
| Free matching shares granted (in thousands) | | | 573 | | | | 3,210 | | | | 481 | |
The following table shows the breakdown of the expense recognized for this program in 2013, 2012, and 2011 and the unrecognized expense at year-end in € millions:
Recognized and Unrecognized Expense at Year-End for SMP
€ millions, unless otherwise stated
| | | | | | | | | | | | |
| | | 2013 | | | 2012 | | | 2011 | |
| Expense recognized relating to discount | | | 32 | | | | 34 | | | | 22 | |
| Expense recognized relating to vesting of free matching shares | | | 51 | | | | 34 | | | | 9 | |
| | | | | | | | | | | | |
| Total expense relating to SMP | | | 83 | | | | 68 | | | | 31 | |
| Unrecognized expense as at December 31 | | | 80 | | | | 107 | | | | 22 | |
| Average remaining vesting period (in years) as at December 31 | | | 1.6 | | | | 2.2 | | | | 2.2 | |
254 Consolidated Financial Statements IFRS
(28) SEGMENT AND GEOGRAPHIC INFORMATION
General Information
Our internal reporting system produces reports in which business activities are presented in a variety of ways, for example, by line of business, geography, and areas of responsibility of the individual Board members. Based on these reports, the Executive Board, which is responsible for assessing the performance of various company components and making resource allocation decisions as our Chief Operating Decision Maker (CODM), evaluates business activities in a number of different ways.
SAP has two divisions – On-Premise and Cloud, which are further divided into operating segments. Our On-Premise division is comprised of two operating segments: On-Premise Products and On-Premise Services, and our Cloud division is comprised of two operating segments: Cloud Applications and Ariba. All operating segments are reportable segments.
On August 1, 2013, SAP acquired hybris AG. Since the majority of hybris’ activities are currently delivered in an on-premise model, the majority of hybris’ activities are correspondingly reflected in the On-Premise segments.
The most important factors we use to identify operating segments are distinctions among our product and service offerings, notably:
| – | Between divisions, the software delivery model (software to be installed on the customer’s hardware (on-premise software), as distinct from software for delivery in the cloud) |
| – | Within the On-Premise division, the types of services offered |
| – | Within the Cloud division, the fields in which the cloud applications are used |
The On-Premise division derives its revenues primarily from the sale of on-premise software (that is, software designed for use on hardware on the customer’s premises), mobile software (that is, software designed for use on mobile devices), and services relating to such software. Within the On-Premise division, the On-Premise Products segment is primarily engaged in marketing and licensing our on-premise and mobile software products and providing support services for these software products. The On-Premise Services segment primarily performs various professional services, mainly implementation services of our software products and educational services on the use of our software products.
The Cloud division derives its revenues primarily from the sale of cloud software (that is, software designed for delivery through the cloud) and services relating to such software (including support services, professional services, and educational services). Within the Cloud division, the Cloud Applications segment is primarily engaged in marketing and selling subscriptions to the cloud software offerings developed by SAP and SuccessFactors. The Ariba segment primarily markets and sells the cloud software offerings developed by Ariba and derives revenue from its cloud-based collaborative business network.
Notes to the Consolidated Financial Statements 255
Information About Profit or Loss, Assets, and Liabilities
Operating Segments Revenue and Profit or Loss
€ millions
| | | | | | | | | | | | | | | | | | | | | | | | | | | | |
| | | On-Premise Division | | | Cloud Division | | | Total | |
| | | On-Premise
Products | | | On-Premise
Services | | | Division
Total | | | Cloud
Applications | | | Ariba | | | Division
Total | | | | |
| 2013 | | | | | | | | | | | | | | | | | | | | | | | | | | | | |
Software | | | 4,517 | | | | 0 | | | | 4,517 | | | | 1 | | | | 0 | | | | 1 | | | | 4,518 | |
Cloud subscriptions and support | | | 0 | | | | 0 | | | | 0 | | | | 412 | | | | 344 | | | | 757 | | | | 757 | |
Software and cloud subscriptions | | | 4,517 | | | | 0 | | | | 4,517 | | | | 413 | | | | 345 | | | | 758 | | | | 5,275 | |
Support | | | 8,710 | | | | 0 | | | | 8,710 | | | | 16 | | | | 30 | | | | 46 | | | | 8,756 | |
Software and software-related service revenue | | | 13,227 | | | | 0 | | | | 13,227 | | | | 429 | | | | 375 | | | | 804 | | | | 14,032 | |
Professional services and other service revenue | | | 0 | | | | 2,695 | | | | 2,695 | | | | 85 | | | | 85 | | | | 170 | | | | 2,865 | |
Total revenue | | | 13,227 | | | | 2,695 | | | | 15,923 | | | | 514 | | | | 461 | | | | 975 | | | | 16,897 | |
Cost of revenue | | | -2,020 | | | | -2,134 | | | | -4,154 | | | | -178 | | | | -180 | | | | -358 | | | | -4,512 | |
| Gross profit | | | 11,207 | | | | 562 | | | | 11,769 | | | | 336 | | | | 281 | | | | 617 | | | | 12,385 | |
| Cost of sales and marketing | | | -3,447 | | | | 0 | | | | -3,447 | | | | -328 | | | | -151 | | | | -479 | | | | -3,926 | |
| | | | | | | | | | | | | | | | | | | | | | | | | | | | |
| Reportable segment profit/loss | | | 7,760 | | | | 562 | | | | 8,322 | | | | 8 | | | | 130 | | | | 138 | | | | 8,460 | |
| | | | | | | |
| 2012 | | | | | | | | | | | | | | | | | | | | | | | | | | | | |
Software | | | 4,656 | | | | 0 | | | | 4,656 | | | | 2 | | | | 0 | | | | 2 | | | | 4,658 | |
Cloud subscriptions and support | | | 0 | | | | 0 | | | | 0 | | | | 257 | | | | 86 | | | | 343 | | | | 343 | |
Software and cloud subscriptions | | | 4,656 | | | | 0 | | | | 4,656 | | | | 259 | | | | 86 | | | | 345 | | | | 5,001 | |
Support | | | 8,226 | | | | 0 | | | | 8,226 | | | | 10 | | | | 10 | | | | 20 | | | | 8,246 | |
Software and software-related service revenue | | | 12,881 | | | | 0 | | | | 12,881 | | | | 269 | | | | 96 | | | | 365 | | | | 13,246 | |
Professional services and other service revenue | | | 0 | | | | 2,967 | | | | 2,967 | | | | 67 | | | | 25 | | | | 91 | | | | 3,058 | |
Total revenue | | | 12,881 | | | | 2,967 | | | | 15,848 | | | | 336 | | | | 120 | | | | 456 | | | | 16,304 | |
Cost of revenue | | | -1,994 | | | | -2,306 | | | | -4,300 | | | | -163 | | | | -72 | | | | -234 | | | | -4,533 | |
| Gross profit | | | 10,887 | | | | 661 | | | | 11,549 | | | | 173 | | | | 49 | | | | 222 | | | | 11,771 | |
| Cost of sales and marketing | | | -3,414 | | | | 0 | | | | -3,414 | | | | -231 | | | | -43 | | | | -275 | | | | -3,689 | |
| Reportable segment profit/loss | | | 7,473 | | | | 661 | | | | 8,134 | | | | -59 | | | | 5 | | | | -53 | | | | 8,082 | |
| | | | | | | |
| 2011 | | | | | | | | | | | | | | | | | | | | | | | | | | | | |
Software | | | 4,105 | | | | 0 | | | | 4,105 | | | | 0 | | | | 2 | | | | 2 | | | | 4,107 | |
Cloud subscriptions and support | | | 0 | | | | 0 | | | | 0 | | | | 18 | | | | 0 | | | | 18 | | | | 18 | |
Software and cloud subscriptions | | | 4,105 | | | | 0 | | | | 4,105 | | | | 18 | | | | 2 | | | | 20 | | | | 4,125 | |
Support | | | 7,220 | | | | 0 | | | | 7,220 | | | | 0 | | | | 0 | | | | 1 | | | | 7,220 | |
Software and software-related service revenue | | | 11,325 | | | | 0 | | | | 11,325 | | | | 18 | | | | 2 | | | | 20 | | | | 11,346 | |
Professional services and other service revenue | | | 0 | | | | 2,901 | | | | 2,901 | | | | 12 | | | | 1 | | | | 13 | | | | 2,914 | |
Total revenue | | | 11,325 | | | | 2,901 | | | | 14,226 | | | | 29 | | | | 4 | | | | 33 | | | | 14,260 | |
Cost of revenue | | | -1,762 | | | | -2,201 | | | | -3,963 | | | | -66 | | | | -9 | | | | -75 | | | | -4,038 | |
| Gross profit | | | 9,564 | | | | 700 | | | | 10,264 | | | | -37 | | | | -5 | | | | -42 | | | | 10,222 | |
| Cost of sales and marketing | | | -2,919 | | | | 0 | | | | -2,919 | | | | -32 | | | | -2 | | | | -34 | | | | -2,954 | |
| Reportable segment profit/loss | | | 6,644 | | | | 700 | | | | 7,344 | | | | -69 | | | | -7 | | | | -76 | | | | 7,268 | |
256 Consolidated Financial Statements IFRS
Segment asset/liability information is not regularly provided to our CODM. Goodwill by operating segment is disclosed in Note (15).
Measurement and Presentation
Our management reporting system reports our intersegment services as cost reductions and does not track them as internal revenue. Intersegment services mainly represent utilization of human resources of one segment by another segment on a project-by-project basis. Intersegment services are charged based on internal cost rates including certain indirect overhead costs, excluding a profit margin.
Most of our depreciation and amortization expense affecting operating segment profits is allocated to the segments as part of broader infrastructure allocations and is thus not tracked separately on the operating segment level. Depreciation and amortization expense that is directly allocated to the operating segments is immaterial in all operating segments presented.
The accounting policies applied in the measurements of the operating segments’ revenues and profits differ from IFRS accounting principles described in Note (3) as follows:
| ¡ | The measurements of the operating segments revenues and profits generally attribute revenue to the segment based on the nature of the business regardless of revenue classification in our income statement. Thus, for example, the Cloud Applications segment’s revenue may include certain amounts classified as software revenue in our Consolidated Income Statements. |
| ¡ | The measurements of the operating segments’ revenues and profits includes the recurring revenues that would have been reflected by acquired entities had it remained a stand-alone entity but which are not reflected as revenue under IFRS as a result of purchase accounting for customer contracts in effect at the time of an acquisition. |
| ¡ | The measurements of the operating segments’ profits excludes share-based payment expense, and restructuring costs as well as research and development expense and general and administration expense at segment level. These expenses are managed and reviewed at the Group level only. |
| ¡ | The measurements of the operating segments’ profits exclude the following acquisition-related charges: |
| | – | | Amortization expense/impairment charges of intangibles acquired in business combinations and certain stand-alone acquisitions of intellectual property |
| | – | | Expenses from purchased in-process research and development |
| | – | | Restructuring expenses and settlements of pre-existing relationships |
| | – | | Acquisition-related third-party costs that are required to be expensed |
| ¡ | The measurements of the operating segments’ profits excludes results of the discontinued operations that qualify as such under IFRS in all respects except if they do not represent a major line of business. For all periods presented this relates exclusively to the operations of TomorrowNow. |
Cost of revenue for our On-Premise Services segment also includes sales and marketing expenses related to professional services and other services that result from sales and marketing efforts that cannot be clearly separated from providing the services. For this reason, no sales and marketing expenses as such have been allocated to this segment.
Notes to the Consolidated Financial Statements 257
Reconciliation of Revenues and Segment Results
€ millions
| | | | | | | | | | | | |
| | | 2013 | | | 2012 | | | 2011 | |
| Total revenues for reportable segments | | | 16,897 | | | | 16,304 | | | | 14,260 | |
Adjustment recurring software revenues | | | -2 | | | | 0 | | | | 0 | |
Adjustment recurring cloud subscriptions and support revenues | | | -61 | | | | -73 | | | | 0 | |
Adjustment recurring support revenues | | | -19 | | | | -9 | | | | -27 | |
| Adjustment recurring revenues | | | -82 | | | | -81 | | | | -27 | |
| | | | | | | | | | | | |
| Total revenue | | | 16,815 | | | | 16,223 | | | | 14,233 | |
| | | |
| Total profit for reportable segments | | | 8,460 | | | | 8,082 | | | | 7,268 | |
| Adjustment recurring revenues | | | -82 | | | | -81 | | | | -27 | |
| Research and development expense | | | -2,162 | | | | -2,132 | | | | -1,894 | |
| General and administration expense | | | -796 | | | | -784 | | | | -685 | |
| Other operating income/expense, net | | | 12 | | | | 23 | | | | 25 | |
| Restructuring | | | -70 | | | | -8 | | | | -4 | |
| Share-based payments | | | -327 | | | | -522 | | | | -68 | |
| TomorrowNow litigation/Loss from discontinued operations | | | 0 | | | | 0 | | | | 717 | |
| Acquisition-related charges | | | -555 | | | | -537 | | | | -448 | |
| | | | | | | | | | | | |
| Operating profit | | | 4,479 | | | | 4,041 | | | | 4,884 | |
| Other non-operating income/expense, net | | | -17 | | | | -173 | | | | -75 | |
| Financial income, net | | | -66 | | | | -72 | | | | -42 | |
| | | | | | | | | | | | |
| Profit before tax | | | 4,396 | | | | 3,796 | | | | 4,767 | |
The research and development expense and general and administration expense presented in the reconciliation differ from the corresponding expenses in the consolidated income statement because the portions of share-based payments-related expenses, restructuring expenses, and acquisition-related expenses that are included in the research and development line item respectively the general and administration expense line item in the income statement, are presented as separate items in the reconciliation.
Geographic Information
The tables below show the geographical breakdown of revenue according to specific criteria:
| ¡ | The management view is the geographic revenue breakdown that the SAP Executive Board, SAP’s chief operating decision-maker, uses primarily when reviewing revenue by sales destination. Under this view, the software revenue from a software contract is attributed to the country in which the contract was negotiated. Such reporting presumes that the software contract was negotiated in the country in which the customer is domiciled. The only circumstances in which this presumption is not applied is where there is objective evidence that all contract negotiations took place in a country other than the domicile of the legal entity contracting on the customer’s behalf. Software revenue from a given software contract is always attributed to a single geographical region; in other words, the software revenue is not split between geographical regions. Because cloud subscriptions and support revenue is earned largely from contracts that were negotiated in various periods in the past, it is allocated without exception to the country in which the customer is domiciled. |
| ¡ | In the presentation by customer location, all revenue is attributed to the country in which the customer is domiciled. |
Revenue by Region
Revenue by Region – Management View
Software Revenue by Region
€ millions
| | | | | | | | | | | | |
| | | 2013 | | | 2012 | | | 2011 | |
| EMEA | | | 2,095 | | | | 2,005 | | | | 1,852 | |
| Americas | | | 1,620 | | | | 1,774 | | | | 1,534 | |
| APJ | | | 802 | | | | 879 | | | | 722 | |
| | | | | | | | | | | | |
| SAP Group | | | 4,516 | | | | 4,658 | | | | 4,107 | |
258 Consolidated Financial Statements IFRS
Software Revenue by Location of Negotiation and Cloud Subscription Revenue by Region
€ millions
| | | | | | | | | | | | |
| | | |
| | | 2013 | | | 2012 | | | 2011 | |
| EMEA | | | 2,212 | | | | 2,071 | | | | 1,865 | |
| Americas | | | 2,164 | | | | 1,961 | | | | 1,539 | |
| APJ | | | 837 | | | | 896 | | | | 722 | |
| | | | | | | | | | | | |
| SAP Group | | | 5,212 | | | | 4,928 | | | | 4,125 | |
Revenue by Region – Location of Customers
Software Revenue by Region
€ millions
| | | | | | | | | | | | |
| | | |
| | | 2013 | | | 2012 | | | 2011 | |
| EMEA | | | 2,116 | | | | 2,041 | | | | 1,851 | |
| Americas | | | 1,586 | | | | 1,733 | | | | 1,534 | |
| APJ | | | 814 | | | | 884 | | | | 722 | |
| | | | | | | | | | | | |
| SAP Group | | | 4,516 | | | | 4,658 | | | | 4,107 | |
| | | |
Cloud Subscriptions and Support Revenue by Region € millions | | | | | | | | | | | | |
| | | |
| | | 2013 | | | 2012 | | | 2011 | |
| EMEA | | | 117 | | | | 66 | | | | 13 | |
| Americas | | | 544 | | | | 187 | | | | 5 | |
| APJ | | | 35 | | | | 17 | | | | 0 | |
| | | | | | | | | | | | |
| SAP Group | | | 696 | | | | 270 | | | | 18 | |
| | | |
Software and Cloud Subscription Revenue by Region € millions | | | | | | | | | | | | |
| | | |
| | | 2013 | | | 2012 | | | 2011 | |
| EMEA | | | 2,233 | | | | 2,107 | | | | 1,864 | |
| Americas | | | 2,130 | | | | 1,920 | | | | 1,540 | |
| APJ | | | 849 | | | | 901 | | | | 722 | |
| | | | | | | | | | | | |
| SAP Group | | | 5,212 | | | | 4,928 | | | | 4,125 | |
| | | |
Software and Software-Related Service Revenue by Region € millions | | | | | | | | | | | | |
| | | |
| | | 2013 | | | 2012 | | | 2011 | |
| Germany | | | 1,984 | | | | 1,821 | | | | 1,726 | |
| Rest of EMEA | | | 4,566 | | | | 4,285 | | | | 3,803 | |
| Total EMEA | | | 6,549 | | | | 6,106 | | | | 5,529 | |
| United States | | | 3,788 | | | | 3,537 | | | | 2,870 | |
| Rest of Americas | | | 1,408 | | | | 1,283 | | | | 1,088 | |
| Total Americas | | | 5,196 | | | | 4,820 | | | | 3,958 | |
| Japan | | | 556 | | | | 699 | | | | 579 | |
| Rest of APJ | | | 1,647 | | | | 1,540 | | | | 1,253 | |
| APJ | | | 2,204 | | | | 2,239 | | | | 1,832 | |
| | | | | | | | | | | | |
| SAP Group | | | 13,950 | | | | 13,165 | | | | 11,319 | |
| | | |
Total Revenue by Region € millions | | | | | | | | | | | | |
| | | |
| | | 2013 | | | 2012 | | | 2011 | |
| Germany | | | 2,505 | | | | 2,380 | | | | 2,347 | |
| Rest of EMEA | | | 5,381 | | | | 5,106 | | | | 4,644 | |
| Total EMEA | | | 7,885 | | | | 7,486 | | | | 6,991 | |
| United States | | | 4,661 | | | | 4,461 | | | | 3,699 | |
| Rest of Americas | | | 1,705 | | | | 1,639 | | | | 1,392 | |
| Total Americas | | | 6,366 | | | | 6,100 | | | | 5,091 | |
| Japan | | | 624 | | | | 789 | | | | 652 | |
| Rest of APJ | | | 1,939 | | | | 1,848 | | | | 1,499 | |
| APJ | | | 2,563 | | | | 2,637 | | | | 2,151 | |
| | | | | | | | | | | | |
| SAP Group | | | 16,815 | | | | 16,223 | | | | 14,233 | |
Notes to the Consolidated Financial Statements 259
Non-Current Assets
€ millions
| | | | | | | | |
| | |
| | | 2013 | | | 2012 | |
| Germany | | | 2,337 | | | | 2,318 | |
| France | | | 2,112 | | | | 2,120 | |
| Rest of EMEA | | | 4,161 | | | | 3,251 | |
| EMEA | | | 8,610 | | | | 7,689 | |
| United States | | | 9,823 | | | | 10,395 | |
| Rest of Americas | | | 123 | | | | 97 | |
| Americas | | | 9,946 | | | | 10,492 | |
| Japan | | | 19 | | | | 22 | |
| Rest of APJ | | | 204 | | | | 216 | |
| APJ | | | 223 | | | | 238 | |
| | | | | | | | |
| SAP Group | | | 18,779 | | | | 18,418 | |
Non-current assets as presented in the table above follow the requirements of IFRS 8 for a geographical breakdown of non-current assets excluding financial instruments, deferred tax assets, post-employment benefits, and rights arising under insurance contracts.
For information about the breakdown of our full-time equivalent employee numbers by region, see Note (7).
(29) BOARD OF DIRECTORS
Executive Board
Memberships on supervisory boards and other comparable governing bodies of enterprises, other than subsidiaries of SAP on December 31, 2013
Bill McDermott
Co-Chief Executive Officer
Strategy, Governance, Business Development,
Corporate Development,
Sales and Ecosystem Activities
Communications and Marketing
Board of Directors, ANSYS, Inc., Canonsburg, Pennsylvania, United States
Board of Directors, Under Armour, Inc., Baltimore, Maryland, United States
Jim Hagemann Snabe
Co-Chief Executive Officer
Strategy, Governance, Business Development,
Corporate Development,
Communications and Marketing
Board of Directors, Bang & Olufsen a/s, Stuer, Denmark
Board of Directors, The Danske Bank Group, Copenhagen, Denmark (from March 18, 2013)
Supervisory Board, Siemens AG, Munich, Germany (from October 1, 2013)
Dr. Werner Brandt
Chief Financial Officer, Labor Relations Director
Finance and Administration including Investor Relations and Data Protection & Privacy
Human Resources
Supervisory Board, Deutsche Lufthansa AG, Frankfurt am Main, Germany
Supervisory Board, QIAGEN N.V., Venlo, the Netherlands
Supervisory Board, RWE AG, Essen, Germany (from April 18, 2013)
Gerhard Oswald
Board Area Scale Quality & Support
SAP Active Global Support, SAP HANA Enterprise Cloud, Cloud Delivery,
Quality Governance & Production, Solution & Knowledge Packaging,
SAP Labs Network (joint leadership with Vishal Sikka)
260 Consolidated Financial Statements IFRS
Dr. Vishal Sikka
Products & Innovation
Global Product Development including SAP HANA, Custom Development,
Design & User Experience, Global Research,
SAP Labs Network (joint leadership with Gerhard Oswald)
Board Members Who Left During 2013
Lars Dalgaard (until May 31, 2013)
Luisa Deplazes Delgado (until June 30, 2013)
Supervisory Board
Memberships on supervisory boards and other comparable governing bodies of enterprises, other than subsidiaries of SAP on December 31, 2013
Prof. Dr. h. c. mult. Hasso Plattner 2),4),5),7),8),9)
Chairman
Board of Directors, Bramasol, Inc., San Francisco, California, USA (until July 1, 2013)
Supervisory Board, Oligo Lichttechnik GmbH, Hennef, Germany
Christiane Kuntz-Mayr 1),4),5),9)
Deputy Chairperson
Deputy Chairperson of the Works Council at SAP AG
Pekka Ala-Pietilä 5),7),8)
Chairman of the Board of Directors, Solidium Oy, Helsinki, Finland
Board of Directors, Pöyry Plc, Vantaa, Finland
Chairman of the Board of Directors, CVON Group Limited, London, UK
Board of Directors, CVON Limited, London, UK
Chairman of the Board of Directors, CVON Innovation Services Oy, Turku, Finland
Board of Directors, CVON Future Limited, London, UK
Chairman of the Board of Directors, Blyk International Ltd., London, UK
Chairman of the Board of Directors, Huhtamäki Oyj, Espoo, Finland
Panagiotis Bissiritsas 1),2),6)
Support Expert
Prof. Anja Feldmann 5),9)
Professor at the Electrical Engineering and Computer Science Faculty at the Technische Universität Berlin
Prof. Dr. Wilhelm Haarmann 2),6),8),9)
Attorney-at-law, certified public auditor, certified tax advisor
Linklaters LLP, Rechtsanwälte, Notare, Steuerberater, Frankfurt am Main, Germany
Chairman of the Supervisory Board, CinemaxX AG, Hamburg, Germany
Margret Klein-Magar 1),2),5),8)
Vice President, Head of People Principles
Lars Lamadé 1),2),8),9)
Project Manager OPD COO
Deputy Chairman of the Supervisory Board, Rhein-Neckar-Loewen GmbH, Kronau, Germany
Bernard Liautaud 2),5),7)
General Partner Balderton Capital, London, UK
Board of Directors, nlyte Software Ltd., London, UK
Board of Directors, Talend SA, Suresnes, France
Board of Directors, Cap Gemini, Paris, France (until October 8, 2013)
Board of Directors, Quickbridge (UK) Ltd., London, UK
Board of Directors, SCYTL Secure Electronic Voting SA, Barcelona, Spain
Notes to the Consolidated Financial Statements 261
Board of Directors, Abiquo Group Inc., Redwood City, California, United States
Board of Directors, Vestiaire Collective SA, Levallois-Perret, France
Board of Directors, Dashlane, Inc., New York, New York, United States
Board of Directors, Recorded Future, Inc., Cambridge, Massachusetts, United States
Board of Directors, eWise Group, Inc., Redwood City, California, United States
Board of Directors, Qubit Digital Ltd., London, UK
Dr. h. c. Hartmut Mehdorn 4),6),9)
CEO of FBB, Flughafen Berlin-Brandenburg GmbH, Berlin, Germany
Board of Directors, Air Berlin PLC & Co. Luftverkehrs KG, Berlin (until January 7, 2013)
Advisory Board, Fiege-Gruppe, Greven, Germany
Board of Directors, RZD – Russian Railways, Moscow, Russia
Dr. Kurt Reiner1),5),6)
Development Expert
Mario Rosa-Bian 1),4),9)
Project Principal Consultant
Dr. Erhard Schipporeit 3),8)
Independent Management Consultant
Supervisory Board, Talanx AG, Hanover, Germany
Supervisory Board, Deutsche Börse AG, Frankfurt am Main, Germany
Supervisory Board, HDI V.a.G., Hanover, Germany
Supervisory Board, Hannover Rückversicherung SE, Hanover, Germany
Supervisory Board, Fuchs Petrolub SE, Mannheim, Germany
Supervisory Board, BDO AG, Hamburg, Germany
Board of Directors, TUI Travel PLC, London, UK
Board of Directors, Fidelity Funds SICAV, Luxembourg
Stefan Schulz1),3),5),9)
Vice President, IP at HANA Enterprise Cloud
Supervisory Board, ORTEC International Beheer B.V., Zoetermeer, the Netherlands (from June 17, 2013)
Inga Wiele 1),3),5)
Senior Internal Strategic Consultant
Prof. Dr.-Ing. Dr.-Ing. E. h. Klaus Wucherer 3),5)
Managing Director of Dr. Klaus Wucherer Innovations- und Technologieberatung GmbH, Erlangen, Germany
Deputy Chairman of the Supervisory Board, HEITEC AG, Erlangen, Germany
Supervisory Board, Dürr AG, Bietigheim-Bissingen, Germany
Supervisory Board, LEONI AG, Nuremberg, Germany
Chairman of the Supervisory Board, Festo AG & Co. KG, Esslingen, Germany
Information as at December 31, 2013
| 1) | Elected by the employees |
| 2) | Member of the Company’s General and Compensation Committee |
| 3) | Member of the Company’s Audit Committee |
| 4) | Member of the Company’s Mediation Committee |
| 5) | Member of the Company’s Technology and Strategy Committee |
| 6) | Member of the Company’s Finance and Investment Committee |
| 7) | Member of the Company’s Nomination Committee |
| 8) | Member of the Company’s Special Committee |
| 9) | Member of the Company’s People and Organization Committee |
262 Consolidated Financial Statements IFRS
The total compensation of the Executive Board members for the years 2013, 2012, and 2011 was as follows:
Executive Board Compensation
€ thousands
| | | | | | | | | | | | |
| | | 2013 | | | 2012 | | | 2011 | |
| Short-term employee benefits | | | 24,728 | | | | 17,054 | | | | 20,197 | |
| Share-based payment1) | | | 8,603 | | | | 14,855 | | | | 4,016 | |
| Subtotal1) | | | 33,331 | | | | 31,909 | | | | 24,213 | |
| Post-employment benefits | | | 1,324 | | | | 3,263 | | | | 1,547 | |
thereof defined-benefit | | | 189 | | | | 1,711 | | | | 696 | |
thereof defined-contribution | | | 1,135 | | | | 1,552 | | | | 850 | |
| Termination benefits | | | 0 | | | | 0 | | | | 4,125 | |
| Other long-term benefits | | | 0 | | | | 0 | | | | 4,031 | |
| | | | | | | | | | | | |
| Total1) | | | 34,655 | | | | 35,172 | | | | 33,915 | |
| 1) | Portion of total executive compensation allocated to the respective year |
The share-based payment amounts disclosed above are based on the grant date fair value of the restricted share units (RSUs) issued to Executive Board members during the year.
The Executive Board members already received, in 2012, the LTI grants for the years 2012 to 2015 subject to continuous service as member of the Executive Board in the respective years. Although these grants are linked to and thus, economically, compensation for the Executive Board members in the respective years, section 314 of the German Commercial Code (HGB) requires them to be included in the total compensation number for the year of grant. Due to the contract extension for Gerhard Oswald in 2013, an additional grant was triggered during 2013, which relates to the allocations of 2014 and 2015. Vesting of the LTI grants is dependent on the respective Executive Board member’s continuous service for the Company.
The share-based payment as defined in section 314 of the German Commercial Code (HGB) amounts to €3,150 thousands (2012: €55,085 thousands) based on the allocations for 2014 and 2015 for Gerhard Oswald which were granted in 2013 in line with the extension of his Executive Board contract. Including this amount, the subtotal Executive Board compensation amounts to €24,110 thousands (2012: €72,138 thousands) and the total Executive Board compensation amounts to €25,434 thousands (2012: €75,401 thousands). These amounts differ from the amounts shown in the table above, since the amounts in the table above are based on the LTI tranches that were allocated to each of the respective years, rather than are based on the grant date as defined under section 314 of the German Commercial Code (HGB).
Share-Based Payment for Executive Board Members
| | | | | | | | | | | | |
| | | 2013 | | | 2012 | | | 2011 | |
| Number of RSUs granted | | | 152,159 | | | | 326,432 | | | | 0 | |
| Number of stock options granted | | | 0 | | | | 0 | | | | 475,227 | |
| Total expense in € thousands | | | -8,596 | | | | 57,429 | | | | 4,420 | |
In the table above, the share-based payment expense is the amount recorded in profit or loss under IFRS 2 in the respective period.
The projected benefit obligation (PBO) for pensions to Executive Board members and the annual pension entitlement of the members of the Executive Board on reaching age 60 based on entitlements from performance-based and salary-linked plans were as follows:
Retirement Pension Plan for Executive Board Members
€ thousands
| | | | | | | | | | | | |
| | | 2013 | | | 2012 | | | 2011 | |
| PBO December 31 | | | 9,077 | | | | 8,889 | | | | 7,291 | |
| Annual pension entitlement | | | 452 | | | | 429 | | | | 437 | |
Notes to the Consolidated Financial Statements 263
Subject to the adoption of the dividend resolution by the shareholders at the Annual General Meeting of Shareholders on May 21, 2014, the total annual compensation of the Supervisory Board members for 2013 is as follows:
Supervisory Board Compensation
€ thousands
| | | | | | | | | | | | |
| | | 2013 | | | 2012 | | | 2011 | |
| Total compensation | | | 2,966 | | | | 2,981 | | | | 3,028 | |
thereof fixed compensation | | | 870 | | | | 901 | | | | 874 | |
thereof committee remuneration | | | 416 | | | | 340 | | | | 465 | |
thereof variable compensation | | | 1,680 | | | | 1,741 | | | | 1,688 | |
The Supervisory Board members do not receive any share-based payment for their services. As far as members who are employee representatives on the Supervisory Board receive share-based payment such compensation is for their services as employees only and is unrelated to their status as members of the Supervisory Board.
The total compensation of all Supervisory Board members in 2013 for work for SAP excluding compensation relating to the office of Supervisory Board member was €1,176 thousands (2012: €1,084 thousands; 2011: €1,688 thousands).
During the fiscal year 2013, payments to and PBO for former Executive Board members were as follows:
Payments to/PBO for Former Executive Board Members
€ thousands
| | | | | | | | | | | | |
| | | 2013 | | | 2012 | | | 2011 | |
| Pension benefits | | | 1,387 | | | | 1,360 | | | | 1,346 | |
| PBO | | | 29,181 | | | | 30,551 | | | | 25,267 | |
SAP did not grant any compensation advance or credit to, or enter into any commitment for the benefit of, any member of the Executive Board or Supervisory Board in 2013, 2012, or 2011.
On December 31, 2013, the shareholdings of SAP’s board members were as follows:
Shareholdings of Executive and Supervisory Board Members
Number of SAP shares
| | | | | | | | | | | | |
| | | 2013 | | | 2012 | | | 2011 | |
| Executive Board | | | 30,201 | | | | 35,271 | | | | 20,569 | |
| Supervisory Board | | | 119,316,444 | | | | 121,363,858 | | | | 121,524,139 | |
Detailed information about the different elements of the compensation as well as the number of shares owned by members of the Executive Board and the Supervisory Board are disclosed in the Compensation Report which is part of our Management Report and of our Annual Report on Form 20-F, both of which are available on SAP’s Web site.
264 Consolidated Financial Statements IFRS
(30) RELATED PARTY TRANSACTIONS
Certain Executive Board and Supervisory Board members of SAP AG currently hold, or held within the last year, positions of significant responsibility with other entities, as presented in Note (29). We have relationships with certain of these entities in the ordinary course of business, whereby we buy and sell a wide variety of products and services at prices believed to be consistent with those negotiated at arm’s length between unrelated parties.
Companies controlled by Hasso Plattner, chairman of our Supervisory Board and Chief Software Advisor of SAP, engaged in the following transactions with SAP: providing consulting services to SAP, selling a piece of land to SAP, receiving sport sponsoring from SAP, making purchases of SAP products and services. In the prior year, this also included purchasing an entity through an asset deal from a company indirectly held by him.
Christiane Kuntz-Mayr, vice chairperson of the SAP Supervisory Board, acts as a manager of family & kids @ work gemeinnutzige UG (“family & kids @ work”). Family & kids @ work is supported financially by SAP.
Wilhelm Haarmann practiced as a partner in the law firm HAARMANN Partnerschaftsgesellschaft in Frankfurt am Main, Germany, until February 2013. In February 2013, he became a partner in Linklaters LLP. SAP occasionally purchased and purchases legal and similar services from both of these firms.
All amounts related to the above mentioned transactions were immaterial to SAP in all periods presented.
For information about the compensation of our Executive Board and Supervisory Board members, see Note (29).
Notes to the Consolidated Financial Statements 265
(31) PRINCIPAL ACCOUNTANT FEES AND SERVICES
At the Annual General Meeting of Shareholders held on June 4, 2013, our shareholders elected KPMG AG Wirtschaftsprüfungsgesellschaft as SAP’s independent auditor for 2013. KPMG AG Wirtschaftsprüfungsgesellschaft and other firms in the global KPMG network charged the following fees to SAP for audit and other professional services related to 2013 and the previous years:
Fees for Audit and Other Professional Services
€ millions
| | | | | | | | | | | | | | | | | | | | | | | | | | | | | | | | | | | | |
| | | 2013 | | | 2012 | | | 2011 | |
| | | KPMG AG
(Germany) | | | Foreign
KPMG
Firms | | | Total | | | KPMG AG
(Germany) | | | Foreign
KPMG
Firms | | | Total | | | KPMG AG
(Germany) | | | Foreign
KPMG
Firms | | | Total | |
| Audit fees | | | 2 | | | | 7 | | | | 9 | | | | 2 | | | | 8 | | | | 10 | | | | 2 | | | | 7 | | | | 9 | |
| Audit-related fees | | | 1 | | | | 0 | | | | 1 | | | | 2 | | | | 0 | | | | 2 | | | | 0 | | | | 0 | | | | 0 | |
| Tax fees | | | 0 | | | | 0 | | | | 0 | | | | 0 | | | | 0 | | | | 0 | | | | 0 | | | | 0 | | | | 0 | |
| All other fees | | | 0 | | | | 0 | | | | 0 | | | | 0 | | | | 0 | | | | 0 | | | | 0 | | | | 0 | | | | 0 | |
| | | | | | | | | | | | | | | | | | | | | | | | | | | | | | | | | | | | |
| Total | | | 3 | | | | 7 | | | | 10 | | | | 4 | | | | 8 | | | | 12 | | | | 2 | | | | 7 | | | | 9 | |
Audit fees are the aggregate fees charged by KPMG for the audit of our Consolidated Financial Statements as well as audits of statutory financial statements of SAP AG and its subsidiaries. Audit-related fees are fees charged by KPMG for assurance and related services that are reasonably related to the performance of the audit or review of our financial statements and are not reported under audit fees. Tax fees are fees for professional services rendered by KPMG for tax advice on transfer pricing, restructuring, and tax compliance on current, past, or contemplated transactions. The all other fees category includes other support services, such as training and advisory services on issues unrelated to accounting and taxes.
(32) GERMAN CODE OF CORPORATE GOVERNANCE
The German federal government published the German Code of Corporate Governance in February 2002. The Code contains statutory requirements and a number of recommendations and suggestions. Only the legal requirements are binding for German companies. With regard to the recommendations, the German Stock Corporation Act, section 161, requires that every year listed companies publicly state the extent to which they have implemented them. Companies can deviate from the suggestions without having to make any public statements.
In 2013 and 2012, our Executive Board and Supervisory Board issued the required declarations of implementation. These statements are available on our Web site: www.sap.com/corporate-en/investors/governance.
(33) SUBSEQUENT EVENTS
No events that have occurred since December 31, 2013, have a material impact on the Company’s Consolidated Financial Statements.
266 Consolidated Financial Statements IFRS
(34) SUBSIDIARIES, ASSOCIATES, AND OTHER EQUITY INVESTMENTS
| | | | | | | | | | | | | | | | | | | | |
| As at December 31, 2013 | | Ownership3) | | | Total
Revenue
in 20131) | | | Profit/
Loss (–)
after Tax
for 20131) | | | Total Equity
as at
12/31/20131) | | | Number of
Employees
as at
12/31/20132) | |
Name and Location of Company | | % | | | €(000) | | | €(000) | | | €(000) | | | | |
| I. Fully Consolidated Subsidiaries | | | | | | | | | | | | | | | | | | | | |
| GERMANY | | | | | | | | | | | | | | | | | | | | |
| Ariba Deutschland GmbH, Frankfurt am Main | | | 100.0 | | | | 4,280 | | | | 103 | | | | 1,202 | | | | 22 | |
| hybris GmbH, Munich5) | | | 100.0 | | | | 26,330 | | | | 3,007 | | | | 32,234 | | | | 217 | |
| OutlookSoft Deutschland GmbH, Walldorf | | | 100.0 | | | | – | | | | 0 | | | | 3 | | | | – | |
| SAP Beteiligungs GmbH, Walldorf | | | 100.0 | | | | 3 | | | | 3 | | | | 53 | | | | – | |
| SAP Business Compliance Services GmbH, Siegen | | | 100.0 | | | | 4,797 | | | | 363 | | | | 1,089 | | | | 38 | |
| SAP Deutschland AG & Co. KG, Walldorf8),10) | | | 100.0 | | | | 3,050,364 | | | | 516,247 | | | | 1,321,646 | | | | 4,716 | |
| SAP Dritte Beteiligungs- und Vermögensverwaltungs GmbH, Walldorf9),10) | | | 100.0 | | | | – | | | | -20,479 | | | | 541,342 | | | | – | |
| SAP Erste Beteiligungs- und Vermögensverwaltungs GmbH, Walldorf9),10) | | | 100.0 | | | | – | | | | -3 | | | | 804,844 | | | | – | |
| SAP Foreign Holdings GmbH, Walldorf | | | 100.0 | | | | – | | | | -193 | | | | 88 | | | | – | |
| SAP Fünfte Beteiligungs- und Vermögensverwaltungs GmbH, Walldorf10) | | | 100.0 | | | | – | | | | 2,849 | | | | 2,325,861 | | | | – | |
| SAP Hosting Beteiligungs GmbH, St. Leon-Rot | | | 100.0 | | | | – | | | | 0 | | | | 26 | | | | – | |
| SAP Portals Europe GmbH, Walldorf | | | 100.0 | | | | – | | | | -8 | | | | 124,191 | | | | – | |
| SAP Portals Holding Beteiligungs GmbH, Walldorf | | | 100.0 | | | | – | | | | -46 | | | | 930,081 | | | | – | |
| SAP Projektverwaltungs- und Beteiligungs GmbH, Walldorf9),10) | | | 100.0 | | | | – | | | | -949 | | | | 323,875 | | | | – | |
| SAP Puerto Rico GmbH, Walldorf | | | 100.0 | | | | 34,127 | | | | -2,779 | | | | -5,773 | | | | 20 | |
| SAP Retail Solutions Beteiligungsgesellschaft mbH, Walldorf | | | 100.0 | | | | – | | | | -4,339 | | | | 9,516 | | | | – | |
| SAP Sechste Beteiligungs- und Vermögensverwaltungs GmbH, Walldorf10) | | | 100.0 | | | | – | | | | 0 | | | | 25 | | | | – | |
| SAP Ventures Investment GmbH, Walldorf | | | 100.0 | | | | – | | | | 1 | | | | 58,030 | | | | – | |
| SAP Vierte Beteiligungs- und Vermögensverwaltungs GmbH, Walldorf | | | 100.0 | | | | – | | | | 0 | | | | 24 | | | | – | |
| SAP Zweite Beteiligungs- und Vermögensverwaltungs GmbH, Walldorf9),10) | | | 100.0 | | | | – | | | | -101,699 | | | | -126,334 | | | | – | |
| SuccessFactors Germany GmbH, Garching | | | 100.0 | | | | 17,663 | | | | 306 | | | | 812 | | | | 78 | |
| TechniData GmbH, Markdorf | | | 100.0 | | | | 117 | | | | 639 | | | | 29,703 | | | | – | |
| | | | | |
| REST OF EUROPE, MIDDLE EAST, AFRICA | | | | | | | | | | | | | | | | | | | | |
| Ambin Properties (Proprietary) Limited, Johannesburg, South Africa | | | 100.0 | | | | – | | | | 261 | | | | 1,306 | | | | – | |
| Ariba Belgium N.V., Heverlee, Belgium | | | 100.0 | | | | 1,653 | | | | 68 | | | | 1,405 | | | | 8 | |
| Ariba Czech s.r.o., Prague, Czech Republic | | | 100.0 | | | | 8,294 | | | | 210 | | | | 1,666 | | | | 158 | |
| Ariba France, SAS, Paris, France | | | 100.0 | | | | 11,228 | | | | 602 | | | | 3,436 | | | | 53 | |
| Ariba Iberia, S.L., Madrid, Spain | | | 100.0 | | | | 1,778 | | | | 74 | | | | 716 | | | | 12 | |
| Ariba International Sweden AB, Stockholm, Sweden | | | 100.0 | | | | 2,025 | | | | 86 | | | | 340 | | | | 7 | |
| Ariba Italia SRL, Rome, Italy | | | 100.0 | | | | 1,589 | | | | 12 | | | | -726 | | | | 10 | |
| Ariba Middle East & North Africa FZ-LLC, Dubai, United Arab Emirates | | | 100.0 | | | | 550 | | | | 31 | | | | 53 | | | | 2 | |
| Ariba Slovak Republic s.r.o., Kosice, Slovakia | | | 100.0 | | | | 1,601 | | | | 62 | | | | 396 | | | | 36 | |
| Ariba Switzerland GmbH, Zurich, Switzerland | | | 100.0 | | | | 1,039 | | | | 49 | | | | 1,059 | | | | 6 | |
| Ariba Technologies Ireland Ltd., Dublin, Ireland | | | 100.0 | | | | 986 | | | | 41 | | | | -56 | | | | 11 | |
Notes to the Consolidated Financial Statements 267
| | | | | | | | | | | | | | | | | | | | |
| As at December 31, 2013 | | Ownership3) | | | Total
Revenue
in 20131) | | | Profit/
Loss (–)
after Tax
for 20131) | | | Total Equity
as at
12/31/20131) | | | Number of
Employees
as at
12/31/20132) | |
Name and Location of Company | | % | | | €(000) | | | €(000) | | | €(000) | | | | |
| Ariba Technologies Netherlands B.V., Amsterdam, the Netherlands | | | 100.0 | | | | 1,262 | | | | 70 | | | | 6,228 | | | | 5 | |
| Ariba UK Limited, Egham, United Kingdom11) | | | 100.0 | | | | 14,567 | | | | 604 | | | | 6,400 | | | | 63 | |
| b-process, Paris, France | | | 100.0 | | | | 12,538 | | | | -1,204 | | | | -4,556 | | | | 46 | |
| Business Objects (UK) Limited, London, United Kingdom11) | | | 100.0 | | | | – | | | | -29,936 | | | | 319 | | | | – | |
| Business Objects Holding B.V., ’s-Hertogenbosch, the Netherlands | | | 100.0 | | | | – | | | | 59 | | | | 4,284 | | | | – | |
| Business Objects Software Limited, Dublin, Ireland | | | 100.0 | | | | 902,168 | | | | 499,289 | | | | 4,774,388 | | | | 245 | |
| Christie Partners Holding C.V., Rotterdam, the Netherlands | | | 100.0 | | | | – | | | | -2 | | | | -21,828 | | | | – | |
| Crossgate UK Ltd., Slough, United Kingdom11) | | | 100.0 | | | | – | | | | – | | | | – | | | | – | |
| Crystal Decisions (Ireland) Limited, Dublin, Ireland | | | 100.0 | | | | – | | | | 0 | | | | 44,543 | | | | – | |
| Crystal Decisions Holdings Limited, Dublin, Ireland | | | 100.0 | | | | – | | | | -4 | | | | 77,725 | | | | – | |
| Crystal Decisions UK Limited, London, United Kingdom11) | | | 100.0 | | | | – | | | | 0 | | | | 2,206 | | | | – | |
| Epista Software A/S, Copenhagen, Denmark | | | 100.0 | | | | 3,040 | | | | 871 | | | | 5,849 | | | | 12 | |
| EssCubed Procurement Pty. Ltd., Johannesburg, South Africa | | | 100.0 | | | | -13 | | | | 3 | | | | -786 | | | | – | |
| hybris AG, Rotkreuz, Switzerland5) | | | 100.0 | | | | 51,536 | | | | -22,800 | | | | 1,057,690 | | | | 24 | |
| hybris Austria GmbH, Vienna, Austria5) | | | 100.0 | | | | 718 | | | | -116 | | | | -167 | | �� | | 4 | |
| hybris France SAS, Levallois-Perret, France5) | | | 100.0 | | | | 5,418 | | | | -1,048 | | | | 1,506 | | | | 24 | |
| hybris Netherlands BV, Amsterdam, the Netherlands5) | | | 100.0 | | | | 1,575 | | | | -121 | | | | 5,750 | | | | 9 | |
| hybris Software AB, Västerås, Sweden5) | | | 100.0 | | | | 1,239 | | | | -598 | | | | 8,716 | | | | 9 | |
| hybris Sp.z.o.o., Gliwice, Poland5) | | | 100.0 | | | | 2,870 | | | | 576 | | | | 540 | | | | 121 | |
| hybris UK Ltd., London, United Kingdom5) | | | 100.0 | | | | 11,281 | | | | -31 | | | | 20,878 | | | | 60 | |
| Joe D Partners C.V., Utrecht, the Netherlands | | | 100.0 | | | | 160,869 | | | | 3,084 | | | | 454,937 | | | | – | |
| KXEN Ltd., London, United Kingdom5) | | | 100.0 | | | | 34 | | | | -200 | | | | -1,247 | | | | 3 | |
| KXEN SAS, Suresnes, France5) | | | 100.0 | | | | 1,170 | | | | -443 | | | | -530 | | | | 42 | |
| Limited Liability Company “SAP Labs”, Moscow, Russia | | | 100.0 | | | | 9,616 | | | | 38 | | | | 976 | | | | 114 | |
| Limited Liability Company “SAP CIS”, Moscow, Russia | | | 100.0 | | | | 445,093 | | | | 14,227 | | | | 81,046 | | | | 834 | |
| Limited Liability Company SAP Kazakhstan, Almaty, Kazakhstan | | | 100.0 | | | | 20,234 | | | | -1,122 | | | | 3,814 | | | | 23 | |
| Limited Liability Company SAP Ukraine, Kiev, Ukraine | | | 100.0 | | | | 35,415 | | | | -1,012 | | | | -3,669 | | | | 96 | |
| Merlin Systems Oy, Espoo, Finland | | | 100.0 | | | | 9,967 | | | | 230 | | | | 3,300 | | | | 31 | |
| NL Quotaholder 1 B.V., Amsterdam, the Netherlands | | | 100.0 | | | | – | | | | – | | | | – | | | | – | |
| NL Quotaholder 2 B.V., Amsterdam, the Netherlands | | | 100.0 | | | | – | | | | – | | | | – | | | | – | |
| OOO hybris Software, Moscow, Russia5) | | | 100.0 | | | | 290 | | | | 11 | | | | 193 | | | | 4 | |
| Plateau Systems UK Ltd., Guildford, United Kingdom | | | 100.0 | | | | – | | | | -6 | | | | -7,163 | | | | – | |
| Quadrem Africa Pty. Ltd., Johannesburg, South Africa4) | | | 100.0 | | | | 1,026 | | | | -236 | | | | -747 | | | | 99 | |
| Quadrem Netherlands B.V., Amsterdam, the Netherlands | | | 100.0 | | | | 35,580 | | | | -2,479 | | | | 51,819 | | | | 4 | |
| Quadrem Overseas Cooperatief U.A., Amsterdam, the Netherlands | | | 100.0 | | | | – | | | | – | | | | – | | | | – | |
| SAP Nederland B.V., ‘s-Hertogenbosch, the Netherlands | | | 100.0 | | | | 461,938 | | | | 30,690 | | | | 444,768 | | | | 447 | |
| SAP – NOVABASE, A.C.E., Porto Salvo, Portugal | | | 66.7 | | | | – | | | | – | | | | – | | | | – | |
| SAP (Schweiz) AG, Biel, Switzerland | | | 100.0 | | | | 646,567 | | | | 84,175 | | | | 189,327 | | | | 615 | |
| SAP (UK) Limited, Feltham, United Kingdom | | | 100.0 | | | | 817,002 | | | | 71,681 | | | | 53,687 | | | | 1,266 | |
268 Consolidated Financial Statements IFRS
| | | | | | | | | | | | | | | | | | | | |
| As at December 31, 2013 | | Ownership3) | | | Total
Revenue
in 20131) | | | Profit/
Loss (–)
after Tax
for 20131) | | | Total Equity
as at
12/31/20131) | | | Number of
Employees
as at
12/31/20132) | |
Name and Location of Company | | % | | | €(000) | | | €(000) | | | €(000) | | | | |
| SAP Belgium NV/SA, Brussels, Belgium | | | 100.0 | | | | 205,283 | | | | 5,751 | | | | 125,761 | | | | 248 | |
| SAP Bulgaria EOOD, Sofia, Bulgaria | | | 100.0 | | | | 2,991 | | | | 349 | | | | 1,228 | | | | 1 | |
| SAP Business Services Center Europe s.r.o., Prague, Czech Republic | | | 100.0 | | | | 28,629 | | | | 428 | | | | 7,408 | | | | 454 | |
| SAP Business Services Center Nederland B.V., Utrecht, the Netherlands | | | 100.0 | | | | 226,727 | | | | 7,581 | | | | 47,565 | | | | 20 | |
| SAP Commercial Services Ltd., Valletta, Malta | | | 100.0 | | | | – | | | | 0 | | | | -17 | | | | – | |
| SAP ČR, spol. s r.o., Prague, Czech Republic | | | 100.0 | | | | 77,415 | | | | 4,342 | | | | 12,912 | | | | 255 | |
| SAP Cyprus Ltd, Nicosia, Cyprus | | | 100.0 | | | | 3,045 | | | | -191 | | | | -2,274 | | | | 2 | |
| SAP d.o.o., Zagreb, Croatia | | | 100.0 | | | | 7,251 | | | | 194 | | | | -574 | | | | 13 | |
| SAP Danmark A/S, Copenhagen, Denmark | | | 100.0 | | | | 165,362 | | | | 12,769 | | | | 22,120 | | | | 164 | |
| SAP East Africa Limited, Nairobi, Kenya5) | | | 100.0 | | | | – | | | | 6 | | | | 2,502 | | | | – | |
| SAP Egypt LLC, Cairo, Egypt | | | 100.0 | | | | 10,362 | | | | -3,475 | | | | -10,554 | | | | 57 | |
| SAP EMEA Inside Sales S.L., Barcelona, Spain | | | 100.0 | | | | 14,020 | | | | 285 | | | | 3,119 | | | | 97 | |
| SAP España – Sistemas, Aplicaciones y Productos en la Informática, S.A., Madrid, Spain | | | 100.0 | | | | 257,656 | | | | 14,090 | | | | 224,996 | | | | 407 | |
| SAP Estonia OÜ, Tallinn, Estonia | | | 100.0 | | | | 2,216 | | | | -67 | | | | 289 | | | | 1 | |
| SAP Finland Oy, Espoo, Finland | | | 100.0 | | | | 114,921 | | | | 6,413 | | | | 63,879 | | | | 109 | |
| SAP France Holding, Paris, France | | | 100.0 | | | | 873 | | | | 36,109 | | | | 5,169,074 | | | | 3 | |
| SAP France, Paris, France | | | 100.0 | | | | 866,137 | | | | 173,827 | | | | 1,508,230 | | | | 1,413 | |
| SAP Hellas S.A., Athens, Greece | | | 100.0 | | | | 27,699 | | | | 1,191 | | | | 11,208 | | | | 51 | |
| SAP Holdings (UK) Limited, Feltham, United Kingdom5) | | | 100.0 | | | | – | | | | -15,993 | | | | 731,275 | | | | – | |
| SAP Hungary Rendszerek, Alkalmazások és Termékek az Adatfeldolgozásban Informatikai Kft., Budapest, Hungary | | | 100.0 | | | | 45,664 | | | | 1,462 | | | | 15,049 | | | | 411 | |
| SAP Ireland Limited, Dublin, Ireland | | | 100.0 | | | | 702 | | | | 41 | | | | 9,725 | | | | – | |
| SAP Ireland US-Financial Services Ltd., Dublin, Ireland | | | 100.0 | | | | 200 | | | | 353,089 | | | | 4,766,140 | | | | 3 | |
| SAP Israel Ltd., Ra’anana, Israel | | | 100.0 | | | | 36,288 | | | | 1,843 | | | | 3,516 | | | | 56 | |
| SAP Italia Sistemi Applicazioni Prodotti in Data Processing S.p.A., Milan, Italy | | | 100.0 | | | | 372,780 | | | | 16,071 | | | | 297,860 | | | | 537 | |
| SAP Labs Bulgaria EOOD, Sofia, Bulgaria | | | 100.0 | | | | 24,595 | | | | 775 | | | | 4,947 | | | | 475 | |
| SAP Labs Finland Oy, Espoo, Finland | | | 100.0 | | | | 6,515 | | | | 160 | | | | 41,517 | | | | 45 | |
| SAP Labs France SAS, Mougins, France | | | 100.0 | | | | 57,194 | | | | 2,861 | | | | 18,638 | | | | 350 | |
| SAP Labs Israel Ltd., Ra’anana, Israel | | | 100.0 | | | | 52,368 | | | | 2,021 | | | | 17,495 | | | | 338 | |
| SAP Latvia SIA, Riga, Latvia | | | 100.0 | | | | 2,229 | | | | 38 | | | | -185 | | | | 3 | |
| SAP Malta Investments Ltd., Valletta, Malta | | | 100.0 | | | | – | | | | 0 | | | | -17 | | | | – | |
| SAP Middle East and North Africa L.L.C., Dubai, United Arab Emirates6) | | | 49.0 | | | | 167,892 | | | | -36,717 | | | | -55,309 | | | | 337 | |
| SAP Nederland Holding B.V., ‘s-Hertogenbosch, the Netherlands | | | 100.0 | | | | – | | | | 2 | | | | 521,916 | | | | – | |
| SAP Norge AS, Lysaker, Norway | | | 100.0 | | | | 89,951 | | | | 3,523 | | | | 22,322 | | | | 89 | |
| SAP Österreich GmbH, Vienna, Austria | | | 100.0 | | | | 192,649 | | | | 19,746 | | | | 25,229 | | | | 347 | |
| SAP Polska Sp. z o.o., Warsaw, Poland | | | 100.0 | | | | 63,228 | | | | 3,985 | | | | 22,358 | | | | 107 | |
| SAP Portals Israel Ltd., Ra’anana, Israel | | | 100.0 | | | | 61,812 | | | | 21,101 | | | | 75,890 | | | | 214 | |
| SAP Portugal – Sistemas, Aplicações e Produtos Informáticos, Sociedade Unipessoal, Lda., Porto Salvo, Portugal | | | 100.0 | | | | 70,026 | | | | 7,327 | | | | 18,136 | | | | 207 | |
Notes to the Consolidated Financial Statements 269
| | | | | | | | | | | | | | | | | | | | |
| As at December 31, 2013 | | Ownership3) | | | Total
Revenue
in 20131) | | | Profit/
Loss (–)
after Tax
for 20131) | | | Total Equity
as at
12/31/20131) | | | Number of
Employees
as at
12/31/20132) | |
Name and Location of Company | | % | | | €(000) | | | €(000) | | | €(000) | | | | |
| SAP Public Services Hungary Kft., Budapest, Hungary | | | 100.0 | | | | 4,284 | | | | 549 | | | | 1,306 | | | | 7 | |
| SAP Romania SRL, Bucharest, Romania | | | 100.0 | | | | 27,044 | | | | 2,298 | | | | 5,311 | | | | 270 | |
| SAP Saudi Arabia Software Services Ltd, Riyadh, Kingdom of Saudi Arabia | | | 100.0 | | | | 44,426 | | | | 3,561 | | | | 37,416 | | | | 50 | |
| SAP Saudi Arabia Software Trading Ltd, Riyadh, Kingdom of Saudi Arabia | | | 75.0 | | | | 36,862 | | | | -25,350 | | | | -24,698 | | | | 81 | |
| SAP Service and Support Centre (Ireland) Limited, Dublin, Ireland | | | 100.0 | | | | 80,598 | | | | 2,899 | | | | 34,430 | | | | 884 | |
| SAP sistemi, aplikacije in produkti za obdelavo podatkov d.o.o., Ljubljana, Slovenia | | | 100.0 | | | | 13,920 | | | | 844 | | | | 3,561 | | | | 22 | |
| SAP Slovensko s.r.o., Bratislava, Slovakia | | | 100.0 | | | | 37,036 | | | | 2,532 | | | | 15,373 | | | | 180 | |
| SAP Svenska Aktiebolag, Stockholm, Sweden | | | 100.0 | | | | 166,507 | | | | 7,525 | | | | 15,933 | | | | 154 | |
| SAP Training and Development Institute FZCO, Dubai, United Arab Emirates | | | 100.0 | | | | 4,532 | | | | -254 | | | | -437 | | | | 36 | |
| SAP Türkiye Yazilim Üretim ve Ticaret A.S., Istanbul, Turkey | | | 100.0 | | | | 78,245 | | | | -10,007 | | | | 10,138 | | | | 155 | |
| SAP UAB (Lithuania), Vilnius, Lithuania | | | 100.0 | | | | 2,491 | | | | 106 | | | | -58 | | | | 3 | |
| SAPV (Mauritius), Ebene, Mauritius7) | | | 0 | | | | – | | | | 258 | | | | 22,932 | | | | – | |
| SAP West Balkans d.o.o., Belgrade, Serbia | | | 100.0 | | | | 16,177 | | | | 2,389 | | | | 7,595 | | | | 29 | |
| SuccessFactors (UK) Limited, London, United Kingdom | | | 100.0 | | | | 20,662 | | | | 1,610 | | | | 2,255 | | | | 100 | |
| SuccessFactors Denmark ApS, Copenhagen, Denmark | | | 100.0 | | | | 1,687 | | | | 171 | | | | 279 | | | | 4 | |
| SuccessFactors France SAS, Paris, France | | | 100.0 | | | | 9,109 | | | | 290 | | | | 573 | | | | 45 | |
| SuccessFactors Ireland Limited, Dublin, Ireland | | | 100.0 | | | | 773 | | | | 32 | | | | 77 | | | | 6 | |
| SuccessFactors Italy SRL, Milan, Italy | | | 100.0 | | | | 1,507 | | | | 44 | | | | 71 | | | | 5 | |
| SuccessFactors Netherlands B.V., Amsterdam, the Netherlands | | | 100.0 | | | | 5,071 | | | | 359 | | | | 16,926 | | | | 22 | |
| SuccessFactors Schweiz GmbH, Zurich, Switzerland | | | 100.0 | | | | 3,620 | | | | -257 | | | | -388 | | | | 7 | |
| Sybase (UK) Limited, Maidenhead, United Kingdom11) | | | 100.0 | | | | 0 | | | | -4 | | | | 327 | | | | – | |
| Sybase France SARL, Paris, France | | | 100.0 | | | | 46,272 | | | | 4,754 | | | | 12,919 | | | | – | |
| Sybase Iberia S.L., Madrid, Spain | | | 100.0 | | | | – | | | | 2 | | | | 65,920 | | | | – | |
| Sybase South Africa (Proprietary) Limited, Johannesburg, South Africa | | | 89.5 | | | | – | | | | 38 | | | | 75 | | | | – | |
| Syclo International Limited, Leatherhead, United Kingdom11) | | | 100.0 | | | | 510 | | | | 977 | | | | 0 | | | | – | |
| Systems Applications Products Africa Region (Proprietary) Limited, Johannesburg, South Africa | | | 100.0 | | | | 81,563 | | | | 10,920 | | | | 23,403 | | | | 39 | |
| Systems Applications Products Africa (Proprietary) Limited, Johannesburg, South Africa | | | 100.0 | | | | – | | | | 3,146 | | | | 62,455 | | | | – | |
| Systems Applications Products Nigeria Limited, Abuja, Nigeria | | | 100.0 | | | | 16,604 | | | | -907 | | | | 2,953 | | | | 43 | |
| Systems Applications Products South Africa (Proprietary) Limited, Johannesburg, South Africa | | | 89.5 | | | | 227,424 | | | | -12,240 | | | | -5,707 | | | | 455 | |
| The Infohrm Group Ltd., London, United Kingdom | | | 100.0 | | | | 88 | | | | 223 | | | | -245 | | | | – | |
| TomorrowNow (UK) Limited, Feltham, United Kingdom11) | | | 100.0 | | | | – | | | | 0 | | | | 0 | | | | – | |
| TomorrowNow Nederland B.V., Amsterdam, the Netherlands | | | 100.0 | | | | – | | | | -9 | | | | -3,301 | | | | – | |
270 Consolidated Financial Statements IFRS
| | | | | | | | | | | | | | | | | | | | |
| As at December 31, 2013 | | Ownership3) | | | Total
Revenue
in 20131) | | | Profit/
Loss (–)
after Tax
for 20131) | | | Total Equity
as at
12/31/20131) | | | Number of
Employees
as at
12/31/20132) | |
Name and Location of Company | | % | | | €(000) | | | €(000) | | | €(000) | | | | |
| AMERICAS | | | | | | | | | | | | | | | | | | | | |
| 110405, Inc., Newtown Square, Pennsylvania, USA | | | 100.0 | | | | – | | | | 0 | | | | 15,150 | | | | – | |
| Alliente, Inc., Pittsburgh, Pennsylvania, USA | | | 100.0 | | | | – | | | | – | | | | – | | | | – | |
| Ariba Canada, Inc., Mississauga, Canada | | | 100.0 | | | | 3,094 | | | | 129 | | | | 1,214 | | | | 21 | |
| Ariba Holdings, Inc., Grand Cayman, Cayman Islands | | | 100.0 | | | | – | | | | – | | | | – | | | | – | |
| Ariba, Inc., Sunnyvale, California, USA | | | 100.0 | | | | 299,460 | | | | -92,369 | | | | 3,093,731 | | | | 1,245 | |
| Ariba International Holdings, Inc., Wilmington, Delaware, USA | | | 100.0 | | | | – | | | | – | | | | – | | | | – | |
| Ariba International, Inc., Wilmington, Delaware, USA | | | 100.0 | | | | 7,405 | | | | 301 | | | | -1,722 | | | | 43 | |
| Ariba Investment Company, Inc., Wilmington, Delaware, USA | | | 100.0 | | | | – | | | | 2,638 | | | | 210,474 | | | | – | |
| Business Objects Argentina S.R.L., Buenos Aires, Argentina | | | 100.0 | | | | – | | | | 0 | | | | 49 | | | | – | |
| Business Objects Option LLC, Wilmington, Delaware, USA | | | 100.0 | | | | -33 | | | | 2,032 | | | | 63,668 | | | | – | |
| Camilion Solutions, Inc., Markham, Canada5) | | | 100.0 | | | | 9,364 | | | | -3,017 | | | | 31,701 | | | | 114 | |
| Cube Tree LLC, San Mateo, California, USA | | | 100.0 | | | | 505 | | | | 492 | | | | 680 | | | | – | |
| Extended Systems, Inc., Boise, Idaho, USA | | | 99.0 | | | | – | | | | 32 | | | | 16,513 | | | | – | |
| Financial Fusion, Inc., Concord, Massachusetts, USA | | | 100.0 | | | | – | | | | – | | | | – | | | | – | |
| FreeMarkets International Holdings Inc. de Mexico, de S. de R.L. de C.V., Mexico City, Mexico | | | 100.0 | | | | – | | | | – | | | | -60 | | | | – | |
| FreeMarkets Ltda., São Paulo, Brazil | | | 100.0 | | | | 52 | | | | -376 | | | | -464 | | | | – | |
| hybris Canada, Inc., Montreal, Canada5) | | | 100.0 | | | | 13,492 | | | | 723 | | | | 254 | | | | 244 | |
| hybris Software Brasil Ltda., Morumbi, Brazil5) | | | 100.0 | | | | 23 | | | | -389 | | | | -821 | | | | 4 | |
| hybris (US) Corp., Wilmington, Delaware, USA5) | | | 100.0 | | | | 28,138 | | | | 1,400 | | | | 25,043 | | | | 125 | |
| iAnywhere Solutions, Inc., Dublin, California, USA | | | 99.0 | | | | 75,212 | | | | 36,253 | | | | 172,933 | | | | 43 | |
| Inxight Federal Systems Group, Inc., Wilmington, Delaware, USA | | | 100.0 | | | | – | | | | 0 | | | | 66 | | | | – | |
| Jam Acquisition II LLC, San Mateo, California, USA | | | 100.0 | | | | 200 | | | | 200 | | | | 178 | | | | – | |
| Jobs2Web, Inc., Minnetonka, Minnesota, USA | | | 100.0 | | | | 2,897 | | | | 2,637 | | | | 2,482 | | | | – | |
| KXEN, Inc., San Francisco, California USA5) | | | 100.0 | | | | 531 | | | | -651 | | | | 21,199 | | | | 11 | |
| Plateau Systems LLC, Arlington, Virginia, USA | | | 100.0 | | | | 4,564 | | | | 3,972 | | | | 5,603 | | | | – | |
| Quadrem Brazil Ltda., Rio de Janeiro, Brazil | | | 100.0 | | | | 23,672 | | | | 2,001 | | | | 7,370 | | | | 175 | |
| Quadrem Canada Ltd., Mississauga, Canada | | | 100.0 | | | | 923 | | | | 102 | | | | 506 | | | | 8 | |
| Quadrem Chile Ltda., Santiago de Chile, Chile | | | 100.0 | | | | 13,566 | | | | -677 | | | | 1,732 | | | | 187 | |
| Quadrem Colombia SAS, Bogotá, Colombia | | | 100.0 | | | | 240 | | | | -26 | | | | -33 | | | | 3 | |
| Quadrem International Ltd., Hamilton, Bermuda | | | 100.0 | | | | – | | | | 826 | | | | 69,569 | | | | – | |
| Quadrem Mexico S. de R. de C.V., Mexico City, Mexico | | | 100.0 | | | | 360 | | | | 2 | | | | -38 | | | | 3 | |
| Quadrem Peru S.A.C., Lima, Peru | | | 100.0 | | | | 2,803 | | | | -1,346 | | | | -2,105 | | | | 89 | |
| Quadrem U.S., Inc., Plano, Texas, USA | | | 100.0 | | | | – | | | | – | | | | – | | | | – | |
| SAP America, Inc., Newtown Square, Pennsylvania, USA | | | 100.0 | | | | 3,530,473 | | | | 114,589 | | | | 4,992,376 | | | | 5,819 | |
| SAP Andina y del Caribe C.A., Caracas, Venezuela | | | 100.0 | | | | 14,481 | | | | -53,041 | | | | -35,312 | | | | 26 | |
| SAP Argentina S.A., Buenos Aires, Argentina | | | 100.0 | | | | 172,462 | | | | -14,424 | | | | 4,773 | | | | 618 | |
| SAP Brasil Ltda, São Paulo, Brazil | | | 100.0 | | | | 553,602 | | | | -12,986 | | | | 43,000 | | | | 1,441 | |
Notes to the Consolidated Financial Statements 271
| | | | | | | | | | | | | | | | | | | | |
| As at December 31, 2013 | | Ownership3) | | | Total
Revenue
in 20131) | | | Profit/
Loss (–)
after Tax
for 20131) | | | Total Equity
as at
12/31/20131) | | | Number of
Employees
as at
12/31/20132) | |
Name and Location of Company | | % | | | €(000) | | | €(000) | | | €(000) | | | | |
| SAP Canada, Inc., Toronto, Canada | | | 100.0 | | | | 708,115 | | | | 50,265 | | | | 470,548 | | | | 2,201 | |
| SAP Chile Limitada, Santiago, Chile | | | 100.0 | | | | – | | | | 1,015 | | | | 13,618 | | | | – | |
| SAP Colombia SAS, Bogotá, Colombia | | | 100.0 | | | | 129,544 | | | | -5,209 | | | | -15,589 | | | | 216 | |
| SAP Costa Rica, S.A., San José, Costa Rica | | | 100.0 | | | | 14,550 | | | | -4,394 | | | | -4,404 | | | | 13 | |
| SAP Financial, Inc., Toronto, Canada | | | 100.0 | | | | – | | | | 25,202 | | | | 6,738 | | | | – | |
| SAP Global Marketing, Inc., New York, New York, USA | | | 100.0 | | | | 276,915 | | | | 1,148 | | | | 24,311 | | | | 543 | |
| SAP HANA Real Time Fund, Wilmington, Delaware, USA7) | | | 0 | | | | – | | | | -904 | | | | -1,292 | | | | – | |
| SAP Industries, Inc., Newtown Square, Pennsylvania, USA | | | 100.0 | | | | 468,227 | | | | 40,420 | | | | 396,489 | | | | 446 | |
| SAP International, Inc., Miami, Florida, USA | | | 100.0 | | | | 29,221 | | | | -3,806 | | | | 8,615 | | | | 65 | |
| SAP International PANAMA S.A., Panama City, Panama5) | | | 100.0 | | | | 234 | | | | -30 | | | | 334 | | | | 2 | |
| SAP Investments, Inc., Wilmington, Delaware, USA | | | 100.0 | | | | – | | | | 25,169 | | | | 666,458 | | | | – | |
| SAP LABS, LLC, Palo Alto, California, USA | | | 100.0 | | | | 545,498 | | | | 10,662 | | | | 221,018 | | | | 2,184 | |
| SAP México S.A. de C.V., Mexico City, Mexico | | | 100.0 | | | | 306,180 | | | | 8,737 | | | | -18,242 | | | | 569 | |
| SAP National Security Services, Inc., Newtown Square, Pennsylvania, USA | | | 100.0 | | | | 178,593 | | | | 35,723 | | | | 173,364 | | | | 268 | |
| SAP PERU S.A.C., Lima, Peru | | | 100.0 | | | | 29,648 | | | | -3,248 | | | | 4,846 | | | | 55 | |
| SAP Public Services, Inc., Washington, D.C., USA | | | 100.0 | | | | 288,791 | | | | 13,780 | | | | 256,245 | | | | 202 | |
| SAP Technologies Inc., Palo Alto, California, USA | | | 100.0 | | | | – | | | | – | | | | – | | | | – | |
| SAP Ventures Fund I, L.P., Wilmington, Delaware, USA7) | | | 0 | | | | – | | | | 31,690 | | | | 110,261 | | | | – | |
| SAP Ventures Fund II, L.P., Wilmington, Delaware, USA5), 7) | | | 0 | | | | – | | | | -2,630 | | | | -2,584 | | | | – | |
| SuccessFactors, Inc., San Mateo, California, USA | | | 100.0 | | | | 413,455 | | | | -173,389 | | | | 2,406,889 | | | | 1,373 | |
| SuccessFactors Brasil Consultoria e Assistência em Vendas Limitada, São Paulo, Brazil | | | 100.0 | | | | 6,571 | | | | -332 | | | | -272 | | | | 28 | |
| SuccessFactors Canada Inc., Ottawa, Canada | | | 100.0 | | | | 8,564 | | | | 254 | | | | 580 | | | | 33 | |
| SuccessFactors Cayman, Ltd., Grand Cayman, Cayman Islands | | | 100.0 | | | | – | | | | – | | | | 208 | | | | – | |
| SuccessFactors de México, S. de R.L. de C.V., Mexico City, Mexico | | | 100.0 | | | | 4,175 | | | | 138 | | | | 155 | | | | 19 | |
| SuccessFactors International Holdings, LLC, San Mateo, California, USA | | | 100.0 | | | | – | | | | – | | | | 102 | | | | – | |
| SuccessFactors International Services, Inc., San Mateo, California, USA | | | 100.0 | | | | 3,486 | | | | 168 | | | | 286 | | | | 7 | |
| SuccessFactors Middle East Holdings, LLC, San Mateo, California, USA | | | 100.0 | | | | – | | | | – | | | | – | | | | – | |
| Surplus Record, Inc., Chicago, Illinois, USA | | | 100.0 | | | | 3,006 | | | | 755 | | | | 7,757 | | | | – | |
| Sybase 365 LLC, Dublin, California, USA | | | 100.0 | | | | 101,570 | | | | 1,192 | | | | 57,218 | | | | 116 | |
| Sybase 365 Ltd., Tortola, British Virgin Islands | | | 100.0 | | | | – | | | | 0 | | | | -908 | | | | – | |
| Sybase Argentina S.A., Buenos Aires, Argentina | | | 100.0 | | | | – | | | | -112 | | | | 703 | | | | – | |
| Sybase Global LLC, Dublin, California, USA | | | 100.0 | | | | – | | | | – | | | | 7,064 | | | | – | |
| Sybase Intl Holdings LLC, Dublin, California, USA | | | 100.0 | | | | – | | | | 0 | | | | 11,346 | | | | – | |
| Sybase, Inc., Dublin, California, USA | | | 100.0 | | | | 547,633 | | | | 252,904 | | | | 4,375,352 | | | | 1,031 | |
| The Inforhrm Group, Inc., Washington, Columbia, USA | | | 100.0 | | | | 34 | | | | -6 | | | | -24 | | | | – | |
| TomorrowNow, Inc., Bryan, Texas, USA | | | 100.0 | | | | – | | | | -1,454 | | | | -179,441 | | | | 3 | |
| YouCalc, Inc., San Mateo, California, USA | | | 100.0 | | | | – | | | | – | | | | – | | | | – | |
272 Consolidated Financial Statements IFRS
| | | | | | | | | | | | | | | | | | | | |
| As at December 31, 2013 | | Ownership3) | | | Total
Revenue
in 20131) | | | Profit/
Loss (–)
after Tax
for 20131) | | | Total Equity
as at
12/31/20131) | | | Number of
Employees
as at
12/31/20132) | |
Name and Location of Company | | % | | | €(000) | | | €(000) | | | €(000) | | | | |
| ASIA PACIFIC JAPAN | | | | | | | | | | | | | | | | | | | | |
| Ariba (China) Limited, Hong Kong, China | | | 100.0 | | | | – | | | | – | | | | – | | | | – | |
| Ariba Australia Pty Ltd., Sydney, Australia | | | 100.0 | | | | – | | | | -21 | | | | -1 | | | | – | |
| Ariba India Pvt. Ltd., Gurgaon, India | | | 100.0 | | | | 4,707 | | | | 708 | | | | 2,299 | | | | 42 | |
| Ariba International Singapore Pte. Ltd., Singapore, Singapore | | | 100.0 | | | | 4,125 | | | | 63 | | | | -4,894 | | | | 19 | |
| Ariba Software Technology Services (Shanghai) Co. Ltd., Shanghai, China | | | 100.0 | | | | 828 | | | | 10 | | | | 592 | | | | 2 | |
| Ariba Technologies India Pvt. Ltd., Bangalore, India | | | 100.0 | | | | 18,948 | | | | 1,716 | | | | 6,233 | | | | 561 | |
| Beijing Zhang Zhong Hu Dong Information Technology Co. Ltd., Beijing, China6) | | | 0 | | | | 1,032 | | | | -2 | | | | 849 | | | | 7 | |
| Business Objects Malaysia Sdn. Bhd., Kuala Lumpur, Malaysia | | | 100.0 | | | | – | | | | -2 | | | | 238 | | | | – | |
| Business Objects Software (Shanghai) Co. Ltd., Shanghai, China | | | 100.0 | | | | 6,746 | | | | 354 | | | | 7,846 | | | | 84 | |
| hybris Australia Pty Limited, Surry Hills, Australia5) | | | 100.0 | | | | 2,638 | | | | 199 | | | | 232 | | | | 18 | |
| hybris Hong Kong Ltd., Hong Kong, China5) | | | 100.0 | | | | 1,579 | | | | 528 | | | | 510 | | | | 8 | |
| hybris Japan K.K., Tokyo, Japan5) | | | 100.0 | | | | 972 | | | | 195 | | | | -111 | | | | 7 | |
| hybris Korea Ltd., Seoul, South Korea5) | | | 100.0 | | | | 545 | | | | -1,148 | | | | -292 | | | | 3 | |
| Nihon Ariba K.K., Tokyo, Japan | | | 100.0 | | | | 2,332 | | | | 136 | | | | 1,426 | | | | 13 | |
| Plateau Systems Australia Ltd, Brisbane, Australia | | | 100.0 | | | | – | | | | – | | | | -710 | | | | – | |
| Plateau Systems Pte. Ltd., Singapore, Singapore | | | 100.0 | | | | – | | | | – | | | | -469 | | | | – | |
| PT SAP Indonesia, Jakarta, Indonesia | | | 99.0 | | | | 50,527 | | | | 3,289 | | | | 2,690 | | | | 55 | |
| PT Sybase 365 Indonesia, Jakarta, Indonesia | | | 100.0 | | | | 0 | | | | -44 | | | | 278 | | | | – | |
| Quadrem Asia Pte. Ltd., Singapore, Singapore | | | 100.0 | | | | 63 | | | | 7 | | | | 119 | | | | – | |
| Quadrem Australia Pty Ltd., Brisbane, Australia | | | 100.0 | | | | 3,754 | | | | 315 | | | | 971 | | | | 21 | |
| Quadrem China Ltd., Hong Kong, China | | | 100.0 | | | | – | | | | – | | | | 13 | | | | – | |
| Right Hemisphere Ltd., Auckland, New Zealand | | | 100.0 | | | | 1,538 | | | | 1,647 | | | | 5,739 | | | | – | |
| Ruan Lian Technologies (Beijing) Co. Ltd., Beijing, China | | | 100.0 | | | | 81 | | | | 7 | | | | -921 | | | | 1 | |
| SAP (Beijing) Software System Co. Ltd., Beijing, China | | | 100.0 | | | | 544,297 | | | | -10,691 | | | | 24,902 | | | | 3,697 | |
| SAP Asia Pte Ltd, Singapore, Singapore | | | 100.0 | | | | 360,926 | | | | 7,880 | | | | 84,461 | | | | 1,023 | |
| SAP Asia (Vietnam) Co. Ltd., Ho Chi Minh City, Vietnam | | | 100.0 | | | | 1,449 | | | | 24 | | | | 538 | | | | 42 | |
| SAP Australia Pty Ltd, Sydney, Australia | | | 100.0 | | | | 479,267 | | | | 25,552 | | | | 243,608 | | | | 770 | |
| SAP Hong Kong Co. Limited, Hong Kong, China | | | 100.0 | | | | 55,271 | | | | -905 | | | | -1,276 | | | | 87 | |
| SAP India (Holding) Pte Ltd, Singapore, Singapore | | | 100.0 | | | | – | | | | -7 | | | | 275 | | | | – | |
| SAP India Private Limited, Bangalore, India | | | 100.0 | | | | 383,854 | | | | 36,544 | | | | 212,004 | | | | 1,892 | |
| SAP Japan Co. Ltd., Tokyo, Japan | | | 100.0 | | | | 620,435 | | | | 32,575 | | | | 412,555 | | | | 1,050 | |
| SAP Korea Ltd., Seoul, South Korea | | | 100.0 | | | | 202,190 | | | | 7,879 | | | | 25,871 | | | | 313 | |
| SAP Labs India Private Limited, Bangalore, India | | | 100.0 | | | | 184,569 | | | | 3,010 | | | | 711 | | | | 4,632 | |
| SAP Labs Korea, Inc., Seoul, South Korea | | | 100.0 | | | | 13,968 | | | | 439 | | | | 17,388 | | | | 125 | |
| SAP Malaysia Sdn. Bhd., Kuala Lumpur, Malaysia | | | 100.0 | | | | 92,273 | | | | 4,885 | | | | 25,849 | | | | 117 | |
| SAP New Zealand Limited, Auckland, New Zealand | | | 100.0 | | | | 73,758 | | | | 6,272 | | | | 41,068 | | | | 97 | |
| SAP Philippines, Inc., Makati, Philippines | | | 100.0 | | | | 34,754 | | | | -705 | | | | 1,816 | | | | 44 | |
Notes to the Consolidated Financial Statements 273
| | | | | | | | | | | | | | | | | | | | |
| As at December 31, 2013 | | Ownership3) | | | Total
Revenue
in 20131) | | | Profit/
Loss (–)
after Tax
for 20131) | | | Total Equity
as at
12/31/20131) | | | Number of
Employees
as at
12/31/20132) | |
Name and Location of Company | | % | | | €(000) | | | €(000) | | | €(000) | | | | |
| SAP SYSTEMS, APPLICATIONS AND PRODUCTS IN DATA PROCESSING (THAILAND) LTD., Bangkok, Thailand4) | | | 100.0 | | | | 68,015 | | | | -275 | | | | 11,303 | | | | 60 | |
| SAP Taiwan Co. Ltd., Taipei, Taiwan | | | 100.0 | | | | 59,114 | | | | 4,723 | | | | 34,776 | | | | 84 | |
| Shanghai SuccessFactors Software Technology Co., Ltd., Shanghai, China | | | 100.0 | | | | 11,418 | | | | 288 | | | | 1,038 | | | | 166 | |
| SuccessFactors (Philippines), Inc., Pasig City, Philippines | | | 100.0 | | | | 2,100 | | | | -60 | | | | 56 | | | | 82 | |
| SuccessFactors Asia Pacific Limited, Hong Kong, China | | | 100.0 | | | | 5 | | | | 0 | | | | 212 | | | | – | |
| SuccessFactors Australia Holdings Pty Ltd., Brisbane, Australia | | | 100.0 | | | | – | | | | -4,795 | | | | 9,592 | | | | – | |
| SuccessFactors Australia Pty Limited, Brisbane, Australia | | | 100.0 | | | | 20,413 | | | | 2,475 | | | | 36,112 | | | | 94 | |
| SuccessFactors Business Solutions India Private Limited, Bangalore, India | | | 100.0 | | | | 7,798 | | | | 353 | | | | 636 | | | | 167 | |
| SuccessFactors Hong Kong Limited, Hong Kong, China | | | 100.0 | | | | 2,755 | | | | 105 | | | | 184 | | | | 11 | |
| SuccessFactors Japan K.K., Tokyo, Japan | | | 100.0 | | | | 3,001 | | | | -143 | | | | -15 | | | | 14 | |
| SuccessFactors Korea Ltd., Seoul, South Korea | | | 100.0 | | | | 23 | | | | 1 | | | | 35 | | | | – | |
| SuccessFactors Singapore Pte. Ltd., Singapore, Singapore | | | 100.0 | | | | 3,150 | | | | 141 | | | | 217 | | | | 11 | |
| Sybase Australia Pty Ltd, Sydney, Australia | | | 100.0 | | | | – | | | | -17,015 | | | | 107 | | | | – | |
| Sybase Hong Kong Ltd, Hong Kong, China | | | 100.0 | | | | – | | | | 74 | | | | 422 | | | | – | |
| Sybase India Ltd., Mumbai, India | | | 100.0 | | | | – | | | | -9 | | | | 2,112 | | | | – | |
| Sybase Philippines, Inc., Makati City, Philippines | | | 100.0 | | | | – | | | | 15 | | | | -8 | | | | – | |
| Sybase Software (China) Co. Ltd., Beijing, China | | | 100.0 | | | | 33,119 | | | | 1,026 | | | | 17,265 | | | | 331 | |
| Sybase Software (India) Private Ltd, Mumbai, India | | | 100.0 | | | | 17,269 | | | | 1,110 | | | | 8,382 | | | | 219 | |
| TomorrowNow Australia Pty Ltd, Sydney, Australia | | | 100.0 | | | | – | | | | -1 | | | | – | | | | – | |
| TomorrowNow Singapore Pte Ltd, Singapore, Singapore | | | 100.0 | | | | – | | | | -7 | | | | – | | | | – | |
274 Consolidated Financial Statements IFRS
| | | | | | | | | | | | | | | | | | | | |
| As at December 31, 2013 | | Ownership3) | | | Total
Revenue
in 20131) | | | Profit/
Loss (–)
after Tax
for 20131) | | | Total Equity
as at
12/31/20131) | | | Number of
Employees
as at
12/31/20132) | |
Name and Location of Company | | % | | | €(000) | | | €(000) | | | €(000) | | | | |
| II. INVESTMENTS IN ASSOCIATES | | | | | | | | | | | | | | | | | | | | |
| Alteryx, Inc., Irvine, California, USA | | | 15.42 | | | | 21,168 | | | | -4,781 | | | | -728 | | | | 171 | |
| China DataCom Corporation Limited, Guangzhou, China | | | 28.30 | | | | 47,689 | | | | 4,456 | | | | 37,361 | | | | 1,049 | |
| Greater Pacific Capital (Cayman) L.P., Grand Cayman, Cayman Islands12) | | | 5.35 | | | | 497 | | | | -822 | | | | 285,845 | | | | – | |
| Original1 GmbH, Frankfurt am Main, Germany13) | | | 40.00 | | | | – | | | | – | | | | – | | | | – | |
| Procurement Negócios Eletrônicos S/A, Rio de Janeiro, Brazil | | | 17.00 | | | | 23,033 | | | | 1,063 | | | | 12,655 | | | | – | |
| 1) | These figures are based on our local IFRS financial statements prior to eliminations resulting from consolidation and therefore do not reflect the contribution of these companies included in the Consolidated Financial Statements. The translation of the equity into Group currency is based on period-end closing exchange rates, and on average exchange rates for revenue and net income/loss. |
| 2) | As at December 31, 2013, including managing directors, in FTE. |
| 3) | No changes in ownership percentage unless otherwise specified in the footnotes. |
| 4) | During the year 2013, SAP’s ownership of the following subsidiary changed: SAP SYSTEMS, APPLICATIONS AND PRODUCTS IN DATA PROCESSING (THAILAND) LTD., Bangkok, Thailand (2012: 49%); Quadrem Africa Pty. Ltd., Johannesburg, South Africa (2012: 49%). |
| 5) | Consolidated for the first time in 2013. |
| 6) | Agreements with the other shareholders provide that SAP AG fully controls the entity. |
| 7) | SAP AG does not hold any ownership interests in four structured entities, SAPV (Mauritius), SAP HANA Real Time Fund, SAP Ventures Fund I, L.P and SAP Ventures Fund II, L.P However, based on the terms of limited partnership agreements under which these entities were established, SAP AG is exposed to the majority of the returns related to their operations and has the current ability to direct these entities’ activities that affect these returns, in accordance with IFRS 10. Accordingly, the results of operations are included in SAP’s consolidated financial statements. |
| 8) | Entity whose personally liable partner is SAP AG. |
| 9) | Entity with profit and loss transfer agreement. |
| 10) | Pursuant to HGB, section 264 (3) or section 264b, the subsidiary is exempt from applying certain legal requirements to their statutory stand-alone financial statements including the requirement to prepare notes to the financial statements and a review of operations, the requirement of independent audit and the requirement of public disclosure. |
| 11) | Pursuant to sections 479A to 479C of the UK Companies Act 2006 the subsidiaries are exempt from having their financial statements audited on the basis that SAP AG has provided a guarantee of these subsidiaries’ liabilities in respect of their financial year ended 31 December 2013. |
| 12) | Greater Pacific Capital (Cayman) is part of a fund-of-funds concept acting as one of the feeder-funds to the partnership. There are neither financial statements for the year ended December 31, 2013 nor budget or forecast available hence the information provided is based on the audited financial statements for the year ended December 31, 2012. |
| 13) | Original1 GmbH is in liquidation and it has not been deregistered from the commercial register yet. |
Notes to the Consolidated Financial Statements 275
|
| As at December 31, 2013 |
Name and Location of Company |
|
III. OTHER EQUITY INVESTMENTS (ownership of 5% or more) |
| Alchemist Accelerator Fund I LLC, San Francisco, California, USA |
| All Tax Platform – Solucoes Tributarias S.A., São Paulo, Brazil |
| Amplify Partners L.P., Cambridge, Massachusetts, USA |
| ArisGlobal Holdings LLC, Stamford, Connecticut, USA |
| Connectiva Systems, Inc., New York, New York, USA |
| Convercent, Inc., Denver, Colorado, USA |
| Data Collective II L.P., San Francisco, California, USA |
| EIT ICT Labs GmbH, Berlin, Germany |
| Five 9, Inc., San Ramon, California, USA |
| Follow Analytics, Inc., San Francisco, California, USA |
| GK Software AG, Schöneck, Germany |
| InnovationLab GmbH, Heidelberg, Germany |
| iTAC Software AG, Dernbach, Germany |
| iYogi Holdings Pvt. Ltd., Port Louis, Mauritius |
| JasperSoft Corporation, San Francisco, California, USA |
| Lavante, Inc., San José, California, USA |
| MuleSoft, Inc., San Francisco, California, USA |
| MVP Strategic Partnership Fund GmbH & Co. KG, Grünwald, Germany |
| Narrative Science, Inc., Chicago, Illinois, USA |
| On Deck Capital, Inc., New York, New York, USA |
| Onventis GmbH, Stuttgart, Germany |
| Patent Quality, Inc., Bellevue, Washington, USA |
| PayScale, Inc., Seattle, Washington, USA |
| Point Nine Capital Fund II GmbH & Co. KG, Berlin, Germany |
| Post for Systems, Cairo, Egypt |
| Realize Corporation, Tokyo, Japan |
| Retail Solutions, Inc. (legal name: T3C, Inc.), Mountain View, California, USA |
| Return Path, Inc., New York, New York, USA |
| RIB Software AG, Stuttgart, Germany |
| Smart City Planning, Inc., Tokyo, Japan |
| SV Angel IV L.P., San Francisco, California, USA |
| Technologie- und Gründerzentrum Walldorf Stiftung GmbH, Walldorf, Germany |
| The SAVO Group Ltd., Chicago, Illinois, USA |
| Ticketfly, Inc., San Francisco, California, USA |
| Vendavo, Inc., Mountain View, California, USA |
276 Consolidated Financial Statements IFRS
Walldorf, February 20, 2014
SAP AG
Walldorf, Baden
The Executive Board
| | |
| |
| Bill McDermott | | Jim Hagemann Snabe |
| |
| Werner Brandt | | Gerhard Oswald |
| |
| Vishal Sikka | | |
Notes to the Consolidated Financial Statements 277
Management’s Annual Report on Internal Control over Financial Reporting in the Consolidated Financial Statements
U.S. law requires that management submit a report on the effectiveness of internal control over financial reporting in the consolidated financial statements. For 2013, that report is as follows:
The management of SAP is responsible for establishing and maintaining adequate internal control over financial reporting as such term is defined in Rules 13a-15(f) and 15d-15(f) under the U.S. Securities Exchange Act of 1934. SAP’s internal control over financial reporting is a process designed under the supervision of SAP’s co-CEOs and CFO to provide reasonable assurance regarding the reliability of financial reporting and the preparation of financial statements for external reporting purposes in accordance with International Financial Reporting Standards (IFRS) as issued by the International Accounting Standards Board (IASB).
SAP’s management assessed the effectiveness of the Company’s internal control over financial reporting as at December 31, 2013. In making this assessment, it used the criteria set forth by the Committee of Sponsoring Organizations of the Treadway Commission (COSO) in Internal Control — Integrated Framework (1992).
Based on the assessment under these criteria, SAP management has concluded that, as at December 31, 2013, the Company’s internal control over financial reporting was effective.
KPMG AG Wirtschaftsprüfungsgesellschaft, our independent registered public accounting firm, has issued its attestation report on the effectiveness of SAP’s internal control over financial reporting. It is included in the independent auditor’s report on the Consolidated Financial Statements and Management Report as at December 31, 2013.
278 Management’s Annual Report on Internal Control
Five-Year
Summary
Analyze our financial,
social, and environmental
performance over the
past five years.
To learn more about SAP’s performance please visit www.sapintegratedreport.com
280
Five-Year Summary1)
SAP Group
€ millions, unless otherwise stated
| | | | | | | | | | | | | | | | | | | | |
| | | 2013 | | | 2012 | | | 2011 | | | 2010 | | | 2009 | |
| Revenue and income | | | | | | | | | | | | | | | | | | | | |
Software and cloud subscriptions (IFRS) | | | 5,212 | | | | 4,928 | | | | 4,125 | | | | 3,424 | | | | 2,735 | |
Non-IFRS adjustments | | | 63 | | | | 73 | | | | 0 | | | | 0 | | | | 0 | |
Software and cloud subscriptions (non-IFRS) | | | 5,275 | | | | 5,001 | | | | 4,125 | | | | 3,424 | | | | 2,735 | |
Software and software-related service revenue (IFRS) | | | 13,950 | | | | 13,165 | | | | 11,319 | | | | 9,794 | | | | 8,198 | |
Non-IFRS adjustments | | | 82 | | | | 81 | | | | 27 | | | | 74 | | | | 11 | |
Software and software-related service revenue (non-IFRS) | | | 14,032 | | | | 13,246 | | | | 11,346 | | | | 9,868 | | | | 8,209 | |
Total revenue (IFRS) | | | 16,815 | | | | 16,223 | | | | 14,233 | | | | 12,464 | | | | 10,672 | |
Non-IFRS adjustments | | | 82 | | | | 81 | | | | 27 | | | | 74 | | | | 11 | |
Total revenue (non-IFRS) | | | 16,897 | | | | 16,304 | | | | 14,260 | | | | 12,538 | | | | 10,683 | |
Software and software-related service revenue as a percentage of total revenue | | | 83 | | | | 81 | | | | 80 | | | | 79 | | | | 77 | |
Operating profit (IFRS) | | | 4,479 | | | | 4,041 | | | | 4,884 | | | | 2,591 | | | | 2,588 | |
Non-IFRS adjustments | | | 1,035 | | | | 1,148 | | | | -171 | | | | 1,416 | | | | 339 | |
Operating profit (non-IFRS) | | | 5,514 | | | | 5,190 | | | | 4,713 | | | | 4,007 | | | | 2,927 | |
Operating margin as a percentage (IFRS) | | | 26.6 | | | | 24.9 | | | | 34.3 | | | | 20.8 | | | | 24.3 | |
Operating margin as a percentage (non-IFRS) | | | 32.6 | | | | 31.8 | | | | 33.1 | | | | 32.0 | | | | 27.4 | |
Operating margin as a percentage (non-IFRS at constant currency) | | | 33.5 | | | | 33.0 | | | | 32.7 | | | | 33.2 | | | | 27.6 | |
Share-based payments | | | 327 | | | | 522 | | | | 68 | | | | 58 | | | | 54 | |
Restructuring2) | | | 70 | | | | 8 | | | | 4 | | | | -3 | | | | 198 | |
Acquisition-related charges | | | 555 | | | | 537 | | | | 448 | | | | 300 | | | | 271 | |
Financial income, net | | | -66 | | | | -72 | | | | -42 | | | | -67 | | | | -80 | |
Profit before tax | | | 4,396 | | | | 3,796 | | | | 4,767 | | | | 2,338 | | | | 2,435 | |
Income tax expense | | | -1,071 | | | | -993 | | | | -1,331 | | | | -525 | | | | -685 | |
Profit after tax | | | 3,325 | | | | 2,803 | | | | 3,437 | | | | 1,813 | | | | 1,750 | |
Profit before tax (as a percentage) | | | 26 | | | | 23 | | | | 33 | | | | 19 | | | | 23 | |
Return on equity (as a percentage) | | | 22 | | | | 21 | | | | 31 | | | | 20 | | | | 22 | |
| | | | | |
| Liquidity and cash flow | | | | | | | | | | | | | | | | | | | | |
Net cash flows from operating activities | | | 3,832 | | | | 3,822 | | | | 3,775 | | | | 2,922 | | | | 3,019 | |
Net cash flows from investing activities | | | -1,781 | | | | -5,964 | | | | -1,226 | | | | -3,994 | | | | -299 | |
Net cash flows from financing activities | | | -1,589 | | | | -194 | | | | -1,176 | | | | 2,520 | | | | -2,170 | |
Free cash flow | | | 3,266 | | | | 3,281 | | | | 3,330 | | | | 2,588 | | | | 2,794 | |
Free cash flow as percentage of total revenue | | | 19 | | | | 20 | | | | 23 | | | | 21 | | | | 26 | |
Cash conversion rate (net cash flows from operating activities as a percentage of profit after tax) | | | 115 | | | | 136 | | | | 110 | | | | 161 | | | | 173 | |
Cash and cash equivalents | | | 2,748 | | | | 2,477 | | | | 4,965 | | | | 3,518 | | | | 1,884 | |
Short-term investments | | | 93 | | | | 15 | | | | 636 | | | | 10 | | | | 400 | |
Group liquidity (cash and cash equivalents/short-term investments/restricted cash) | | | 2,841 | | | | 2,492 | | | | 5,601 | | | | 3,528 | | | | 2,284 | |
Financial debts (due to banks, private placements, bonds) | | | 4,308 | | | | 4,994 | | | | 3,965 | | | | 4,378 | | | | 703 | |
Net liquidity | | | -1,467 | | | | -2,502 | | | | 1,636 | | | | -850 | | | | 1,581 | |
Days’ sales outstanding (DSO, in days) | | | 62 | | | | 59 | | | | 60 | | | | 65 | | | | 79 | |
Additional Information 281
SAP Group
€ millions, unless otherwise stated
| | | | | | | | | | | | | | | | | | | | |
| | | 2013 | | | 2012 | | | 2011 | | | 2010 | | | 2009 | |
| Assets, equity and liabilities | | | | | | | | | | | | | | | | | | | | |
Trade and other receivables | | | 3,963 | | | | 4,005 | | | | 3,577 | | | | 3,177 | | | | 2,598 | |
Total current assets | | | 7,352 | | | | 6,928 | | | | 9,669 | | | | 7,143 | | | | 5,255 | |
Total non-current assets | | | 19,741 | | | | 19,378 | | | | 13,558 | | | | 13,696 | | | | 8,119 | |
Deferred cloud subscription and support revenue (IFRS) | | | 443 | | | | 317 | | | | 4 | | | | 2 | | | | 0 | |
Non-IFRS adjustments | | | 4 | | | | 40 | | | | 0 | | | | 0 | | | | 0 | |
Deferred cloud subscription and support revenue (non-IFRS) | | | 447 | | | | 358 | | | | 4 | | | | 2 | | | | 0 | |
Total current liabilities (including deferred income) | | | 6,347 | | | | 6,546 | | | | 6,266 | | | | 5,153 | | | | 3,416 | |
Total non-current liabilities (including deferred income) | | | 4,699 | | | | 5,627 | | | | 4,254 | | | | 5,862 | | | | 1,467 | |
Total equity (including non-controlling interests) | | | 16,048 | | | | 14,133 | | | | 12,707 | 9) | | | 9,824 | | | | 8,491 | |
Total assets | | | 27,094 | | | | 26,306 | | | | 23,227 | | | | 20,841 | | | | 13,374 | |
Equity ratio (total equity as a percentage of total assets) | | | 59 | | | | 54 | | | | 55 | | | | 47 | | | | 63 | |
Debt ratio (total liabilities as a percentage of total assets) | | | 41 | | | | 46 | | | | 45 | | | | 53 | | | | 37 | |
Investments in goodwill, intangible assets or property, plant, and equipment (including capitalizations due to acquisitions) | | | 1,812 | | | | 6,859 | | | | 657 | | | | 5,502 | | | | 299 | |
Depreciation and amortization | | | 951 | | | | 863 | | | | 724 | | | | 534 | | | | 499 | |
| | | | | |
| Operating expenses | | | | | | | | | | | | | | | | | | | | |
Cost of software and software-related services | | | 2,597 | | | | 2,555 | | | | 2,107 | | | | 1,823 | | | | 1,658 | |
Cost of professional services and other services | | | 2,402 | | | | 2,520 | | | | 2,247 | | | | 2,071 | | | | 1,851 | |
Total cost of revenue | | | 4,999 | | | | 5,075 | | | | 4,354 | | | | 3,894 | | | | 3,509 | |
Research and development | | | 2,282 | | | | 2,261 | | | | 1,935 | | | | 1,729 | | | | 1,591 | |
Research and development (as a percentage of total revenue) | | | 14 | | | | 14 | | | | 14 | | | | 14 | | | | 15 | |
Research and development (as a percentage of total operating expenses) | | | 18 | | | | 19 | | | | 21 | | | | 18 | | | | 20 | |
Number of employees in research and development at year-end3) | | | 17,804 | | | | 18,012 | | | | 15,861 | | | | 15,884 | | | | 14,813 | |
Sales and marketing | | | 4,131 | | | | 3,912 | | | | 3,083 | | | | 2,646 | | | | 2,199 | |
General and administration | | | 866 | | | | 949 | | | | 715 | | | | 636 | | | | 564 | |
| | | | | |
| Financial performance measures | | | | | | | | | | | | | | | | | | | | |
Issued shares at year-end (in millions) | | | 1,229 | | | | 1,229 | | | | 1,228 | | | | 1,227 | | | | 1,226 | |
Weighted average shares outstanding, basic (in millions) | | | 1,193 | | | | 1,192 | | | | 1,189 | | | | 1,188 | | | | 1,188 | |
Earnings per share, basic (in €) | | | 2.79 | | | | 2.35 | | | | 2.89 | | | | 1.52 | | | | 1.47 | |
Weighted average shares outstanding, diluted (in millions) | | | 1,195 | | | | 1,193 | | | | 1,190 | | | | 1,189 | | | | 1,189 | |
Earnings per share, diluted (in €) | | | 2.78 | | | | 2.35 | | | | 2.89 | | | | 1.52 | | | | 1.47 | |
Dividend per ordinary share (in €) | | | 1.00 | | | | 0.85 | | | | 1.10 | | | | 0.60 | | | | 0.50 | |
Total dividend distributed4) | | | 1,194 | | | | 1,013 | | | | 1,310 | | | | 713 | | | | 594 | |
Total dividend distributed as a percentage of profit after tax | | | 36 | | | | 36 | | | | 38 | | | | 39 | | | | 34 | |
SAP share price at year-end (in €) | | | 62.31 | | | | 60.69 | | | | 40.85 | | | | 38.10 | | | | 33.00 | |
SAP share price – peak (in €) | | | 64.80 | | | | 61.43 | | | | 45.90 | | | | 38.40 | | | | 35.26 | |
SAP share price – low (in €) | | | 52.20 | | | | 41.45 | | | | 34.26 | | | | 31.12 | | | | 25.01 | |
282 Five-Year Summary
SAP Group
€ millions, unless otherwise stated
| | | | | | | | | | | | | | | | | | | | |
| | | 2013 | | | 2012 | | | 2011 | | | 2010 | | | 2009 | |
| Financial performance measures (continued) | | | | | | | | | | | | | | | | | | | | |
Market capitalization (in € billions) | | | 76.5 | | | | 74.7 | | | | 50.2 | | | | 46.7 | | | | 40.5 | |
Return on SAP ordinary shares5) 1-year investment period (as a percentage) | | | 4.20 | | | | 52.10 | | | | 8.70 | | | | 17.00 | | | | 32.90 | |
Return on SAP ordinary shares5) 5-year investment period (as a percentage) | | | 21.80 | | | | 13.10 | | | | 1.70 | | | | 1.20 | | | | 1.30 | |
Return on SAP ordinary shares5) 10-year investment period (as a percentage) | | | 7.90 | | | | 13.80 | | | | 2.20 | | | | 3.20 | | | | -1.20 | |
| | | | | |
| Employees and personnel expenses | | | | | | | | | | | | | | | | | | | | |
Number of employees at year-end3) | | | 66,572 | | | | 64,422 | | | | 55,765 | | | | 53,513 | | | | 47,584 | |
Number of employees, annual average3) | | | 65,409 | | | | 61,134 | | | | 54,346 | | | | 49,970 | | | | 48,471 | |
Personnel expenses | | | 7,489 | | | | 7,286 | | | | 5,880 | | | | 5,261 | | | | 4,963 | |
Personnel expenses – excluding share-based payments | | | 7,162 | | | | 6,764 | | | | 5,812 | | | | 5,203 | | | | 4,909 | |
Personnel expenses per employee – excluding share-based payments (in € thousands) | | | 109 | | | | 111 | | | | 107 | | | | 104 | | | | 101 | |
Women working at SAP (as a percentage) | | | 31 | | | | 30 | | | | 30 | | | | 30 | | | | 29 | |
Women in management7) (total, as a percentage) | | | 21.2 | | | | 20.8 | | | | 19.5 | | | | 18.7 | | | | 17.6 | |
Women managing managers6),7) (as a percentage) | | | 14.3 | | | | 14.5 | | | | 13.5 | | | | 13.7 | | | | 14.7 | |
Women managing teams6),7) (as a percentage) | | | 21.7 | | | | 21.1 | | | | 20.5 | | | | 19.6 | | | | 19.1 | |
Employee Engagement Index (as a percentage) | | | 77 | | | | 79 | | | | 77 | | | | 68 | | | | 69 | |
Business Health Culture Index (as a percentage) | | | 67 | | | | 66 | | | | 65 | | | | 59 | | | | 61 | |
Employee retention (as a percentage) | | | 93.5 | | | | 94.0 | | | | 92.8 | | | | 92.9 | | | | 94.2 | |
Total turnover rate (as a percentage) | | | 8 | | | | 7 | | | | 9 | | | | 9 | | | | 11 | |
| | | | | |
| Environment | | | | | | | | | | | | | | | | | | | | |
Greenhouse gas emissions (in kilotons) | | | 545 | | | | 485 | | | | 490 | | | | 455 | | | | 480 | |
Greenhouse gas emissions per employee3) (in tons) | | | 8.3 | | | | 7.9 | | | | 9.0 | | | | 8.7 | | | | 9.2 | |
Greenhouse gas emissions per € revenue (in grams) | | | 32.4 | | | | 30.0 | | | | 34.4 | | | | 36.4 | | | | 42.0 | |
Total energy consumption (in GWh) | | | 910 | | | | 860 | | | | 860 | | | | 845 | | | | 860 | |
Energy consumed per employee3) (in kWh) | | | 13,900 | | | | 14,000 | | | | 15,700 | | | | 16,100 | | | | 16,500 | |
Data center energy consumed (in GWh) | | | 173 | | | | 160 | | | | 154 | | | | 144 | | | | 157 | |
Data center energy per employee3) (in kWh) | | | 2,633 | | | | 2,598 | | | | 2,824 | | | | 2,746 | | | | 3,001 | |
Renewable energy sourced (as a percentage) | | | 43 | | | | 51 | | | | 32 | | | | 32 | | | | 0 | |
| | | | | |
| Customers | | | | | | | | | | | | | | | | | | | | |
Net Promoter Score8) (as a percentage) | | | 12.1 | | | | 8.9 | | | | NA | | | | NA | | | | NA | |
| 1) | Amounts for 2009 to 2013 according to IFRS, unless otherwise stated |
| 2) | Includes -€5 million (2010) and €4 million (2009) acquisition-related charges |
| 4) | 2013 numbers are based on the proposed dividend for 2013 and on 2013 closing level of treasury stock. |
| 5) | Assuming all dividends are reinvested |
| 6) | Relates to different levels of management position |
| 7) | Numbers based on year-end |
| 8) | In 2012, we adopted a new methodology for measuring customer loyalty: Net Promoter Score (NPS). There are therefore no comparable NPS values for years prior to 2012. |
| 9) | Total equity after IAS 19 (revised) adoption: €12,689 million |
Additional Information 283
Glossary
A
ABAP – SAP software programming language.
add-on – SAP application that is technically dependent on – and can only be installed on top of – another SAP application.
Americas’ SAP Users’ Group (ASUG) – Non-profit organization of SAP customer companies dedicated to providing educational and networking opportunities in support of SAP software and implementation. These user groups are established in regions around the world to share knowledge and influence SAP development efforts. ASUG is the largest user group with more than 50,000 members in the Americas.
analytics – Data analysis typically generated in the form of reports and charts that can be used for business insight and decision making.
analytics solutions from SAP – Analytics solutions from SAP enable people to unleash the power of collective insight in Big Data by empowering them with the right information at the right time to make insightful business decisions, anticipate change, and uncover new opportunities. When powered by SAP HANA, companies can unleash the power of real-time collective insight by overcoming the classic trade-off between the speed and flexibility of data analysis. Our analytics offerings cover the areas of business intelligence, enterprise performance management, and governance, risk, and compliance.
application – Software that enables organizations to perform certain business processes or activities and to address specific business needs.
applied analytics – Category of offerings within the analytics solutions from SAP portfolio comprising individual offerings for analytic applications, analytic content, and accelerators.
Ariba – SAP’s acquisition of Ariba, Inc., a leading cloud-based business commerce network, completed on October 1, 2012. All cloud-related supplier assets of SAP are now consolidating under Ariba, which operates as an independent business under the name “Ariba, an SAP company.” Ariba solutions for procurement, financials, and sourcing, as well as the Ariba Network, continue to maintain the Ariba brand.
Ariba Network – Business commerce network where companies of all sizes can connect to their trading partners anywhere, at any time from any application or device to buy, sell, and manage their cash more efficiently and effectively than ever before. Companies around the world use the Ariba Network to simplify inter-enterprise commerce and enhance the results they deliver. See “business network.”
B
benchmarking – Process of measuring products, services, and practices against those of leading companies, which can also be used as a reference point of measurement for evaluating best practices.
best practice – A management concept that involves devising a method of process that most effectively produces a desired outcome. SAP applications use business best practices to help customers automate common business processes through software and technology. See “SAP Best Practices.”
Big Data – The large volume of data created by billions of connected devices and people generating a tremendous amount of information about their behavior, location, and activity. This availability of massive amounts of data requires companies to rethink technology architecture and database structures.
Business Health Culture Index – A score for the general cultural conditions in an organization that enable employees to stay healthy and balanced. The index is calculated based on the results of regular employee surveys.
284 Glossary
business intelligence (BI) – Software that enables users to analyze an organization’s raw data and make fact-based decisions. BI-related processes include data mining, analytical processing, querying, and reporting. SAP BusinessObjects BI solutions include the SAP BusinessObjects BI platform, SAP Crystal Reports, SAP BusinessObjects Dashboards, and SAP Lumira.
business network – An online service that connects businesses and their systems to those of their trading partners and enables new processes and information and insight sharing only possible in a digital environment. See “Ariba Network.”
business user – Employees who spend significant time finding and sharing information, collaborating with others, coordinating projects, devising strategy or operational tactics, and coming up with new ideas based on information gathered from multiple sources. Also called knowledge or information workers or business consumers.
business warehouse – See “data warehouse.”
C
channel partner – SAP partner category that includes value-added resellers (VARs), independent software vendors (ISVs), and value-added distributors.
cloud computing – Generic term for flexible, IT-related services available through, or hosted on, the Internet for consumers and business, including storage, computing power, software development environments, and applications, combined with service delivery. Accessed as needed “in the cloud,” these services eliminate the need for in-house IT resources. See “software as a service.”
core applications – Standard business applications available in SAP Business Suite, including SAP ERP, SAP Customer Relationship Management (SAP CRM), SAP Product Lifecycle Management (SAP PLM), SAP Supply Chain Management (SAP SCM), and SAP Supplier Relationship Management (SAP SRM).
core solutions – Offerings for standard business applications and technologies that provide customers with a stable, consistent solution suite that allows them to be more efficient and agile, make decisions in real time, and create new value for their own customers. See “core applications.”
CO2 equivalent – A measure to compare the emissions of various greenhouse gases based upon their global warming potential. For example, the global warming potential for methane over 100 years is 21. This means that emissions of one million metric tons of methane are equivalent to emissions of 21 million metric tons of carbon dioxide.
custom development project (CDP) – Realization of a custom-developed solution that meets unique business needs, realized at SAP or in a customer’s development system.
customer connection – A simple process directed at incrementally enhancing and improving the products and solutions SAP customers are using today. It offers SAP customers the opportunity to suggest small enhancements to products and solutions in mainstream maintenance, for fast and non-disruptive delivery using notes and support packages.
D
data center energy – The amount of energy consumed in SAP’s data centers related to the number of employees (expressed in full-time equivalents/FTEs).
data warehouse – An electronic collection of information organized for easy access by computer programs. See “SAP NetWeaver Business Warehouse.”
design thinking – A methodology for routine innovation that brings together the right side of the brain (creative) with the left side of the brain (analytical).
Additional Information 285
disruptive technology – Process by which a product or service takes root initially in simple applications at the bottom of a market and then relentlessly moves “up market,” eventually displacing established competitors. Term coined by Clayton Christensen.
DSAG – Abbreviation for DeutschsprachigeSAP-Anwendergruppe (German-Speaking SAP Users’ Group), which has around 43,062 members from 2,735 companies in German-speaking countries and beyond.
E
ecosystem – Construct encompassing SAP and its customers and partners that extends the value SAP provides to its customers. By bringing together community-based insight, innovative partner solutions, and industry-leading collaboration and co-innovation, it enables customers to extract the greatest possible value from their SAP investments.
embedded analytics – Incorporating business intelligence within operational applications and business processes.
Employee Engagement Index – A score for the level of employee commitment, pride, and loyalty, as well as the feeling of employees of being advocates for their company.
employee retention – The ratio of the average headcount (expressed in full-time equivalents/FTEs) minus employee-initiated terminations (turnover) divided by the average headcount, taking into account the past 12 months.
enabler effect – Reduction of greenhouse gas emissions and increase of energy savings in the entire economy through innovative technology provided by the ICT sector.
end-to-end process – Set of activities supporting defined management, core, or support processes. Customers can use these activities as a reference to map their own processes.
end-to-end solution – Software solution that covers one end-to-end process.
enhancement package – Optional software packages that enable companies to take advantage of innovation while keeping their core software stable. Enhancement packages contain improved general business and industry functionality, enterprise services, and other user interface and functional improvements. Organizations can activate selected business functions contained within the enhancement packages and deploy them on their own timetable with minimal disruption to business operations.
enterprise mobility – Term used in business and industry to refer to the concept and approach to making a business mobile. At SAP, we use “enterprise mobility” as our umbrella term for an overall mobile strategy.
enterprise resource planning – See “SAP ERP.”
enterprise service – A set of highly integrated Web services that can be accessed and used repeatedly by applications to support business processes. Used as building blocks for composing larger units of software, enterprise services can be quickly defined by SAP or its partners and assembled to compose new applications and enable new business processes. See Web service.
environmental impact – A positive or negative change to the natural environment.
G
Global Reporting Initiative (GRI) – A non-profit organization that provides companies and organizations with a comprehensive sustainability reporting framework that is widely used around the world.
greenhouse gas footprint – The sum of all greenhouse gas emissions measured and reported, including renewable energy and third-party reductions, for example, offsets.
286 Glossary
I
inclusivity – For an organization that accepts its accountability to those it impacts and who impact it: The participation of stakeholders in developing and achieving a strategic and accountable response to sustainability.
independent software vendor (ISV) – Company that makes and sells software products that run on one or more computer hardware or operating system platforms.
industry – An economic sector characterized by a value chain, business processes, and a set of products and services that is typical or common for all companies belonging to this sector. At SAP, “industries” is also used as a term to differentiate between lines-of-business functions such as marketing, procurement, and finance, and those functions specific to an industry. SAP has software portfolios that address the business needs of 25 different industries.
industry application – Software unit supporting a specific collection of business processes required to address the business needs of a specific industry.
in-memory computing – A major advance in information technology that creates a dramatic change in computing, analytics, and data storage. Combining advances in multicore processing with more affordable servers, in-memory computing allows information to be stored in the main memory rather than in relational databases to greatly accelerate processing times. It disrupts the traditional IT stack comprised of hardware, middleware, and software, where disk-based relational databases can become bottlenecks.
in-memory database – Database that keeps all active records in main memory rather than on disk. Accessing in-memory records is considerably faster than retrieving them from the disk, significantly increasing performance. SAP HANA is SAP’s groundbreaking database that allows businesses to take advantage of in-memory computing. See “SAP HANA.”
Internet of Things – A fusion of the digital world and the physical world that brings together different concepts and technical components. Everyday objects and machines have sensors that can “communicate” with each other over the Internet, making new models possible for business processes, collaboration, miniaturization of devices, and mobile communications. SAP offers several solutions that address the Internet of Things.
ISO 14001 – A standard for environmental management systems that provides practical tools for companies and organizations to identify and control their environmental impact and constantly improve their environmental performance.
K
key performance indicator (KPI) – Performance figure for which threshold values are defined and against which validation is executed.
L
lean– Set of manufacturing principles originating from Japanese car manufacturer Toyota that first defines customer value, then reorganizes every step required to design, order, build, deliver, and maintain this value across all the organizations and units. As a result, firms can do more with less, respond more quickly to customer needs, create jobs that are more rewarding for employees, and reduce their impact on the environment.
legal change – Correction to SAP software to adapt an SAP software release to changes in legal and regulatory requirements.
line of business (LoB) – Internal organizational area or business unit in a company (division) that combines all responsibilities for a particular product, group, or set of processes. Examples include sales, purchasing, human resources, finance, marketing, and so on.
line-of-business (LoB) applications – In the context of computing, a set of core software applications vital to running an enterprise, such as accounting, HR, procurement, and so on.
Additional Information 287
M
mainstream maintenance – First SAP maintenance phase, which includes the full scope of support. It is followed by an extended maintenance, customer-specific maintenance, or priority-one support phase.
maintenance – Software support comprising support for legal changes and corrections delivered through the SAP Notes tool, support packages, problem support, and access to information and online service channels – depending on the maintenance phase.
maintenance strategy – Set of rules that determine the length and conditions of maintenance for SAP software releases. Detailed rules can differ depending on the type of application.
mobile apps – Applications for mobile devices available for download, demo, and purchase on SAP Store, App Store, and other online stores. Mobile apps are categorized as either business/product in focus or as consumer-focused. AT SAP, our mobile apps are task-oriented (productivity or analytical) or allow full access (process) to existing on-premise software.
mobile solutions – Mobile solutions from SAP provide a foundation for enterprise mobility and seamless integration with the core enterprise applications of our customers. Our portfolio of mobile solutions includes enterprise mobility management, including the SAP Afaria mobile device management solution and the SAP Mobile Documents solution; mobile apps; and SAP Mobile Platform.
N
Net Promoter Score (NPS) – Describes the willingness of customers to recommend or promote an organization or company to others. It is defined as the percentage of customers that are likely to recommend an organization or company to friends or colleagues (promoters) minus the percentage of customers that are unlikely to do so.
“the networked economy” – Condition in today’s marketplace, where businesses and their systems are connected to digital communities of existing and potential partners. The move to this new, interenterprise operating model is accelerated by trends such as cloud computing, enterprise mobility, and the convergence of enterprise applications and social media. See Ariba Network.
non-profit or not-for-profit – A corporation or an association that conducts business for the benefit of the public without shareholders and without a profit motive.
O
(carbon) offset or greenhouse gas (GHG) offset – A unit of carbon dioxide-equivalent (CO2 equivalent) that is reduced, avoided, or sequestered to compensate for emissions occurring elsewhere.
on demand – Model of software deployment whereby providers license an application to customers for use as a service when they need it, that is, “on demand.” It eliminates the need for on-site IT resources to manage infrastructure and thereby reduces operational expenses. Due to their software-as-a-service nature, on-demand solutions are often available in the cloud.
on device – Anytime, anywhere access to SAP applications and data from any type of wired or wireless device (desktop, laptop, mobile, tablets, sensors, and so on).
on premise – Traditional model of software deployment where enterprises purchase software licenses and deploy applications in-house.
288 Glossary
One SAP – An organizational approach at SAP that promotes strong collaboration among all areas of the company across services, software, and ecosystem, supporting “one face to the customer.”
open source – Software based on the concept of software developers coming together to build a virtual community and solving a common problem by developing working software that everyone has a right to change. Successful development projects under the open source model include Linux – a free operating system supported by SAP.
original equipment manufacturer (OEM) – Company that produces a product or component to be purchased for sale or use by other manufacturers or that incorporates a purchased product or component into its own new product for further sale.
P
plug-in – Software that enhances the functionality of an existing application.
point of sale (POS) – Generic term used in distribution to describe all information that is recorded at the time a product is sold. The data typically includes the location of the sale, price point, SKU, end-user contact information, and partner contact information. The SAP Point-of-Sale application can help retail businesses reduce the operating costs of store systems – while delivering an enhanced customer experience.
“powered by SAP HANA” – An SAP offering powered by SAP HANA runs on the SAP HANA platform. More than 100 SAP applications are currently “powered by SAP HANA.” Partner solutions or applications that are powered by SAP HANA are certified by SAP to run on the SAP HANA platform. These applications take advantage of distinctive capabilities of SAP HANA to deliver key benefits, such as simpler administration, reduced overhead, and better business intelligence over conventional traditional technology platforms.
predictive analytics – Brings advanced analytics capabilities to a broad spectrum of users to help uncover new business opportunities, predict trends, and proactively respond to change. The recent acquisition of KXEN enables SAP to extend predictive analytics tools beyond data scientists to line-of-business users and analysts in the workplace by automating key modeling and analytical tasks and enabling faster deployment and adoption. Available in SAP Predictive Analysis software.
priority-one support – An additional optional maintenance phase offered after expiration of mainstream maintenance for specific releases of the SAP BusinessObjects Business Intelligence platform and former SAP BusinessObjects solutions no longer actively sold or marketed.
product – A non-versioned high-level view of software from a software logistics perspective. It is a “bracket” that contains corresponding software product versions.
Product Availability Matrix (PAM) – Database that bundles technical and release planning information on SAP components for quick reference. Information on the availability of SAP component releases and maintenance end dates, as well as release information are available.
product footprint – The environmental impact of products, processes, or services by production, usage, and disposal.
product instance – A group of technically dependent software component versions that are part of a (software) product version and have to be installed and operated on a single logical system/server. The software product instances of a software product version show the maximal distribution possibility of the software product version. Also known as “software product instance.”
product line – Individual products grouped together based on their main brand names, including all versions, technical releases, editions, options, add-ons, delivery types, and related tools. Example: The product line “SAP Customer Relationship Management” would include SAP CRM 7.0, SAP Cloud for Sales, SAP Cloud for Service, SAP CRM rapid-deployment solution, the SAP Customer Insight mobile app, and so on.
Additional Information 289
product version – One or more software component versions made available at the same time for implementing a well-defined scope of functionality. The versions of a product fulfill the principle of functional continuity. From a delivery point of view, the version indicates the release of a product and can either be stand-alone or add-on. Also known as “software product version.”
R
Ramp-Up Knowledge Transfer – SAP training program that delivers early product-related knowledge to presales, sales, consultants, partners, and support teams. This program contributes to the successful implementation of ramp-up projects and is a crucial element of the ramp-up process in the product innovation lifecycle at SAP.
release – SAP software that has a version number, is shipped at a particular time, and has defined maintenance phases.
release-to-customer date – Date that marks the initial availability of a release to customers and the beginning of the restricted shipment phase.
renewable energy – The shares and types of electricity obtained from renewable sources such as hydro, wind, solar, geothermal, and biomass. It is calculated by adding the amount of renewable energy specifically sourced, produced on-site by our own solar cells and covered by Renewable Energy Certificates (RECs).
restricted shipment phase – First phase of a release delivery, which is rolled out within the framework of the SAP Ramp-Up program. The program determines how many customers receive the release and increases distribution in a controlled way. This phase is followed by the unrestricted shipment phase.
road map – Product timeline that has a variety of objectives, including communication to customers, users, or other parties interested in the timing of future product releases; the features planned for those releases; general prioritization of features; and in some cases, the requirements of features in enough detail that current and prospective customers can give feedback on the feature itself and the product’s direction.
S
SAP ActiveEmbedded – Enhanced engagement services for optimizing solutions and accelerating adoption of technologies without disrupting customer businesses.
SAP Active Global Support (SAP AGS) – A global organization with more than 4,000 support engineers and developers that focuses on support offerings, helping companies manage the application lifecycle and optimize solution performance and consequently manage complexity, mitigate risks, and control costs. The services are available through seven strategically located global support centers and more than 30 local support centers.
SAP Adaptive Server Enterprise (SAP ASE) – A high-performance relational database management system for mission-critical, data-intensive environments. It ensures highest operational efficiency and throughput on a broad range of platforms. Key features include data encryption to protect from internal and external breaches, partitioning technology for better performance and easier maintenance; and virtualization and clustering capabilities for continuous availability and efficient use of resources. Formerly called SAP Sybase ASE.
SAP Afaria – A mobile device management solution that provides a single administrative console to centrally manage, secure, and deploy mobile data, applications, and devices. SAP Afaria simplifies the management complexities of a workforce on the go by making the data stored and transmitted by mobile devices secure.
SAP Best Practices – Packages that provide proven methods and tools for organizations to implement best business practices in key areas and a range of industries using SAP software. The packages deliver methodology, documentation, and preconfiguration that enable rapid, reliable deployment with quick return on investment.
290 Glossary
SAP Business All-in-One – Comprehensive and flexible business management solution targeted to midsize companies with up to 2,500 employees that are looking for a comprehensive, integrated industry-specific ERP solution with built-in best practices.
SAP Business ByDesign – Adaptable, cloud-based business suite ideally suited for SMEs and subsidiaries of large corporations, it is a complete, integrated suite that can run a whole enterprise – financials, human resources, sales, procurement, customer service, and supply chain. The latest versions enable partners and customers to extend the system capabilities or build cloud-based applications using SAP Business ByDesign Studio.
SAP Business One – Application designed especially for small businesses with up to 100 employees, providing a single, integrated solution for managing the entire business across financials, sales, customer relationships, purchasing, inventory, analytics, and operations.
SAP Business Suite – Software suite that helps companies build a comprehensive business process platform to run and perform better. The software supports core business operations ranging from supplier relationships to production, warehouse management, sales, and administrative functions, through to customer relationships. The main applications in the suite are SAP CRM, SAP ERP, SAP PLM, SAP SRM, and SAP SCM. SAP Business Suite, SAP CRM, and SAP ERP are now available powered by SAP HANA.
SAP Business Suite powered by SAP HANA – In January 2013, SAP launched SAP Business Suite powered by SAP HANA, a next-generation business suite that captures and analyzes data in real time on a single in-memory platform empowering customers to run their business in real time to transact, analyze, and predict instantly and proactively. The core applications in the suite now take advantage of SAP HANA for smarter innovations, faster business processes, and simpler interactions.
SAP Cloud for Financials – A cloud-based financial management solution with an intuitive, easy-to-consume interface and personalized information. It features embedded, dynamic analytics, enabling companies to achieve superior financial insight across the business. Customers can use the solution to drive streamlined, end-to-end compliant financial processes as well as real-time financial performance information for everyone in the business. It includes the solution formerly called SAP Financials OnDemand and is part of the SAP Cloud for Finance portfolio.
SAP Cloud for Sales, SAP Cloud for Service, and SAP Cloud for Marketing – Individual people-centric, cloud-based portfolios for sales, service, and marketing organizations with designed-in social collaboration to help transform social media conversations into business insight. The SAP Cloud for Sales portfolio complements the on-premise SAP CRM application, offers enterprises running SAP Business Suite, a pre-integrated cloud solution that embraces the way sales representatives collaborate and improves their productivity, and includes the former SAP Sales OnDemand solution. The portfolios include the SAP Cloud for Social Engagement solution and the solution formerly called SAP Customer OnDemand.
SAP Cloud for Social Engagement – A cloud-based solution that helps transform social media conversations into business insight. Marketing and customer service organizations can use it to better engage with customers to increase brand loyalty, manage reputational risks, and capitalize on opportunities. Formerly called SAP Social OnDemand.
SAP Cloud powered by SAP HANA – In 2013, SAP began offering SAP Cloud powered by SAP HANA that includes infrastructure, platform, and software as services in the cloud, incorporating the former SAP HANA Enterprise Cloud managed cloud services offering. It allows entire enterprise systems to be run in the cloud and provides customers with a new deployment option to gain immediate value from the innovations of SAP HANA. This enables the operation of mission-critical business applications as well as new applications powered by SAP HANA.
Additional Information 291
SAP Co-Innovation Lab – SAP location featuring a simulated, heterogeneous data center that incorporates hardware and infrastructure software from various vendors. The lab provides a hands-on environment for SAP, customers, and partners to innovate, accelerate, and showcase new business solutions and technologies collaboratively. Customers and partners can visit the lab to evaluate the latest SAP and partner solutions in a simulated, real-world infrastructure. SAP Co-Innovation Lab locations include São Paulo, Brazil; Palo Alto, California (United States); Tokyo, Japan; Seoul, Korea; Bangalore, India; Walldorf, Germany; Zurich, Switzerland; Moscow, Russia.
SAP Community Network – Online portal with nearly two million members in more than 200 countries, providing individuals with the opportunity to trade experience and insights, pursue business opportunities, and learn from each other. SAP offers distinct communities in the network that offer information, trusted resources, and co-innovation. See “Business Process Expert community,” “SAP Developer Network,” and “SAP University Alliances community.”
SAP CRM powered by SAP HANA – First SAP Business Suite application powered by SAP HANA.
SAP Custom Development – SAP organization that specializes in building individual software solutions that address the unique needs of customers, and that fit seamlessly with existing SAP software. The organization draws on SAP innovations, especially SAP HANA, to deliver unmatched impact and value for specific customer use cases. See “custom development project.”
SAP Customer Relationship Management (SAP CRM) – Application that provides comprehensive software support to help marketing, sales, and service professionals obtain complete customer intelligence that they can leverage to manage customer relationships and customer-related processes effectively. SAP CRM can enable multichannel customer interactions, including mobile smartphones, the Internet, and social media and also offers a communications infrastructure that is designed to help connecting with other users anytime, anywhere. SAP offers CRM applications in both on-premise and on-demand deployment models.
SAP Data Management – Portfolio that replaces and extends the concept and previously named offering of SAP Real-Time Data Platform. It refers to the data management capabilities in the following offerings, which are still available as individual offerings: SAP HANA; SAP ASE; SAP IQ; SAP SQL Anywhere; SAP ESP; SAP Replication Server; SAP PowerDesigner; SAP Control Center, SAP PowerBuilder, and SAP Data Services. Together, these allow users to access, store, and capitalize on Big Data to support business decision making in real time.
SAP d-code – New name for SAP TechEd conferences in 2014, which go beyond technical education to encompass a broader scope of topics and audience.
SAP Developer Network – Part of SAP Community Network, this online community offers deep technical content and expertise for SAP developers, analysts, consultants, and administrators.
SAP EcoHub – Online solution marketplace that centralizes information about SAP and partner solutions – and includes features such as feedback, ratings, and demos to help discover, evaluate, and buy solutions to complement an investment in SAP software.
SAP Education – An organization with more than 1,000 resources on global scale that provides a complete and high-quality enablement offering across the entire customer lifecycle for all target audiences (business users, project teams, customers, partners, and so on). The comprehensive portfolio of educational products and services leverages a multimodal offering (on-site, e-learning, and virtual classrooms) to accelerate enablement and reduce cost and certifications paths to help ensure enablement quality.
292 Glossary
SAP Enterprise Support – Services that provide proactive support in addition to all features of SAP Standard Support services. These proactive support services encompass tools, processes, and services that enable continuous improvement, holistic application lifecycle management for continuous innovation, business and operational process improvements, and levers to address the total cost of operation (TCO).
SAP Environment, Health & Safety Management (SAP EHS Management) – An application that supports sustainability initiatives – enabling companies to manage EHS operational, financial, and reporting risks holistically across their facilities and extended business network. As an integral part of SAP Business Suite, the application systematically embeds EHS requirements and tasks directly into enterprise business processes, reinforcing compliance and risk reduction across global operations.
SAP ERP – Application designed to optimize business and IT processes by reducing IT complexity, increasing adaptability, and delivering more IT value at a lower cost than traditional ERP solutions. It can support mission-critical, end-to-end business processes for finance, human capital management, asset management, sales, procurement, and other essential corporate functions. SAP ERP can also support industry-specific processes by providing industry-specific business functions that can be activated selectively via the switch framework, keeping the application core stable and helping ensure maximum performance.
SAP ERP powered by SAP HANA – The second SAP Business Suite application powered by SAP HANA.
SAP Executive Board – The official governing body of SAP, overseeing and deciding on the activities of the company. Subject to the requirements of stock corporation law, the SAP Executive Board is committed to the interests of SAP and bound by company policy. It provides the SAP Supervisory Board with regular, prompt, and comprehensive reports about all essential issues of business, corporate strategy, and potential risks. Membership in the SAP Executive Board is part of the official titles for these board members.
SAP Financing – Service that helps companies invest in SAP solutions implemented by a strategic partner of SAP: Siemens Financial Services GmbH (SFS). SFS targets the financing service chiefly at midsize companies. Depending on local conditions, the SFS plan leases solutions to customers and provides loan finance.
SAP for Aerospace & Defense (SAP for A&D) – Solution portfolio specifically designed to meet the needs of the aerospace and defense industry. It offers capabilities for maintenance, repair and overhaul, airline operations, defense, manufacturing, contract and program management, and business acquisitions.
SAP for Automotive – Solution portfolio designed to meet the specific needs of the automotive industry. Its capabilities help link complex business processes into a logical flow, maximizing efficiency and profitability and satisfying customers’ expectations.
SAP for Banking – Solution portfolio that enables banks to obtain all customer information at a glance and offers a full complement of high-performance capabilities for strategic planning, financial accounting, costing, and enterprise-wide control. It also features key industry-specific applications for profitability management, risk management, customer relationship management, and integrated customer account systems.
SAP for Chemicals – Solution portfolio that delivers support for specific processes and tools that chemical companies require. Industry-specific capabilities include recipe management, batch management, and version control.
Additional Information 293
SAP for Consumer Products – Solution portfolio that supports the integration of every step of the consumer product value chain – from suppliers to consumers. Key capabilities include mobile and Internet sales, trade promotion management, inventory management, brand and channel management, and demand signal management.
SAP for Defense & Security – Solution portfolio that offers a variety of capabilities that meet the critical needs of the defense and security sector. Key industry-specific capabilities include acquisition and materials management; force planning; maintenance, repair, and overhaul (MRO); personnel and organization; infrastructure management; planning and support for deployed operations; in-service support; and line maintenance.
SAP for Engineering, Construction & Operations (SAP for EC&O) – Solution portfolio designed to meet the specific requirements of project-oriented enterprises that offers capabilities for industrial plant construction, construction of commercial and private buildings, and shipbuilding.
SAP for Healthcare – Solution portfolio for hospitals and clinics to manage a variety of required administrative and clinical processes.
SAP for High Tech – Solution portfolio that meets the demands of high-tech industries, including RosettaNet support.
SAP for Higher Education and Research (SAP for HE&R) – Solution portfolio that supports organizational processes and unique needs of public and private universities, multicampus institutions, research agencies, and medical colleges, including campus management, grants management, student life-cycle management, financials, operations, human capital management, procurement, analytics, research, and asset management.
SAP for Industrial Machinery & Components (SAP for IM&C) – Solution portfolio that coordinates the entire scope of business activities (estimating, order entry, project management, and production planning) for the industrial sector and supports areas ranging from maintenance and services to billing and profitability analysis.
SAP for Insurance – Solution portfolio that integrates steps in the insurance business process, including capabilities for customer contact, policy and product management, collections and disbursement, and claims management.
SAP for Life Sciences – Solution portfolio that meets the requirements of pharmaceutical, biotechnology, and diagnostics companies, as well as manufacturers of medical devices and products.
SAP for Media – Solution portfolio that supports processes specific to the media industry with capabilities that include sales and distribution, advertising management, product development, and intellectual property management.
SAP for Mill Products – Solution portfolio for manufacturers of building materials, the paper and timber industry, metal and primary metal producers, and textile and furniture manufacturers.
SAP for Mining – Solution portfolio that supports processes specific to the mining industry, including mining operations and asset performance; sales and supply chain management; operational risk and compliance; as well as human resources; finance; procurement; and IT management.
SAP for Oil & Gas (SAP for O&G) – Solution portfolio that meets the demands of oil and gas companies of all sizes.
SAP for Professional Services – Solution portfolio that delivers integrated tools, best practices, and support for automated processes designed specifically for the demands of the professional services industry, including management consultancies as well as accounting and legal firms.
294 Glossary
SAP for Public Sector – Solution portfolio for public administration, providing an electronic framework that enables online communication through various applications for the public, government authorities, and related entities.
SAP for Retail – Solution portfolio that offers multichannel applications designed specifically to provide the best retail services to a large customer base.
SAP for Sports & Entertainment – Solution portfolio that comprises solutions for sports teams, leagues, and venues, designed to help them deepen fan engagement, drive on-field performance, and optimize business efficiency.
SAP for Telecommunications – Solution portfolio that provides telecommunications enterprises of all types and sizes a range of industry-specific capabilities, including support for convergent invoicing and contract accounting.
SAP for Transportation & Logistics – Solution portfolio that covers the unique business needs of postal services, railways, airlines, and toll collection companies, as well as logistics service providers, to optimize supply chain and planning.
SAP for Utilities – Solution portfolio for all supply and energy industries, with capabilities ranging from call centers and Internet communications to consumption billing.
SAP for Wholesale Distribution – Solution portfolio that addresses the needs of midsize and large wholesale distribution businesses in a wide range of segments. Industry-specific capabilities support new business models and strategies that meet the needs of an important supply sector.
SAP Ganges – Name of a solution evolving from an SAP project that focused on improving the IT infrastructure of micro-businesses (small, usually family-owned shop selling groceries and other sundries). Solution includes software for POS devices as well as services provided to retailers, distributors, wholesalers, and manufacturers. The services also include providing banks with reporting that supplements credit worthiness for retailers. Solution is currently only available for the Indian market.
SAP Global Managing Board – The SAP Global Managing Board was established in May 2012 in addition to the SAP Executive Board and allows SAP to appoint a broader range of global leaders to help steer the organization. It comprises members of the SAP Executive Board and selected additional executives, and has advisory and decision-supporting functions for the SAP Executive Board. Per definition, all members of the SAP Executive Board are members of the SAP Global Managing Board.
SAP Global Research and Business Incubation – Research and innovation unit integrated into the Products & Innovation organization at SAP in April 2013. The new decentralized structure combines the strengths of research and development to benefit new products (including SAP HANA) and strategic topics (such as mobile and business intelligence). A team manages the project governance of publicly funded projects as well as handling ecosystems, communications, and relationship management with stakeholders from academia and governments.
SAP HANA – Flexible, data-agnostic, in-memory platform that helps organizations analyze their business operations, using huge volumes of detailed transactional and analytic information from virtually any data source. The platform provides the foundation for innovative applications that take advantage of an in-memory database and calculation engine, allowing customers to conduct complex planning, forecasting, and simulation based on real-time data.
SAP HANA Cloud Platform – Development platform-as-a-service (PaaS) designed to help customers, independent software vendors, and partners rapidly create innovative enterprise software applications in the cloud leveraging our leading in-memory technology.
Additional Information 295
SAP HANA Enterprise Cloud – See “SAP Cloud powered by SAP HANA.”
SAP HANA Live – Umbrella term for a group of analytics foundations for SAP HANA, specific to an industry or for a particular software (SAP HANA Live for Event Management, SAP HANA Live for SAP CRM), and so on, as well as a browser (SAP HANA Live Browser).
SAP HANA One – Deployment of SAP HANA certified for productive use on the Amazon Web Services Cloud. SAP HANA One can be deployed for production use with small data sets, in minutes, opening a door to starter projects from customers, ISVs, and startups.
SAP IQ – An analytics server designed specifically for advanced analytics, data warehousing, and business intelligence environments. Able to work with massive volumes of structured and unstructured data, it is ideally suited to take advantage of Big Data opportunities by discovering more accurate insight into business performance and market dynamics. Formerly called SAP Sybase IQ.
SAP Jam – Social software platform that includes the former SuccessFactors Jam, SAP StreamWork, and new software. It enables sales teams and internal experts to socially connect and communicate with customers in the context of each opportunity. Customers can also easily provide feedback and share what is important to them to strengthen relationships.
SAP Learning Solution – Portfolio of learning tools including a learning portal, learning management system, authoring tools, and content management system. Individual training and strategic personnel development are supported in the solution.
SAP Lumira – Data visualization software that helps connect, access, and visualize data without a single line of code. Formerly called SAP Visual Intelligence.
SAP Managed Services – Organization and offerings that enable SAP customers to access SAP applications and that provide the infrastructure required. In this way, solutions are ready to use and can be adapted to customers’ growing requirements.
SAP Manufacturing – Solution for managing manufacturing operations with embedded lean manufacturing and Six Sigma principles. It provides capabilities for planning, execution, quality, maintenance, as well as environment, health, and safety.
SAP MaxAttention – Support option with a full range of services customized for individual customer needs and covering all stages of an SAP solution’s lifecycle, driven by an on-site technical quality manager.
SAP Mobile – Overarching category term used to communicate all SAP mobile offerings together. These include any type of mobile apps, solutions, technology, or platform (including SAP Mobile Platform), as well as solutions extensions and rapid-deployment solutions and any Sybase-related products.
SAP Mobile Platform – A platform of mobile capabilities and technology that bundles three existing offerings under one name (Sybase Unwired Platform, Sybase Mobiliser, and a Syclo offering named Agentry). SAP Mobile Platform is offered in enterprise or consumer editions and each edition is available as either an on-premise or a cloud version.
SAP Month of Service – Held in October, SAP’s signature corporate volunteerism effort offers SAP employees around the world opportunities to come together to support social change in their communities.
SAP NetWeaver – A comprehensive technology stack designed to efficiently develop, run, and extend business applications. SAP NetWeaver provides foundation and enterprise software, including the SAP NetWeaver Business Warehouse application, and the SAP NetWeaver Application Server, SAP NetWeaver Portal, and SAP NetWeaver Process Orchestration components. It facilitates the easy integration of SAP software with heterogeneous system environments, third-party solutions, and external business partners. See “technology platform.”
296 Glossary
SAP NetWeaver Adaptive Computing Controller – Tool based on the J2EE engine of SAP NetWeaver Application Server that enables users to control the entire landscape from a single point. Administrators can monitor the runtime data of logical and physical landscapes; start, stop, or relocate application services; and assign hardware resources to application services.
SAP NetWeaver Application Server (SAP NetWeaver AS) – Component of SAP NetWeaver that provides support for platform-independent Web services, business applications, and standards-based development based upon key technologies such as Java and ABAP technology.
SAP NetWeaver Business Intelligence – See SAP NetWeaver Business Warehouse.
SAP NetWeaver Business Warehouse (SAP NetWeaver BW) – Application of SAP NetWeaver that provides a complete view of a company and the tools needed to make the right decisions, optimize processes, and measure strategic success, such as business-critical factors and benchmarks. Formerly called SAP NetWeaver Business Intelligence.
SAP NetWeaver Developer Studio – Tool based on the open source Eclipse framework that supports the efficient development of Web Dynpro, Web services, and Java/J2EE business applications, as well as Java projects on a large-scale basis for both SAP technologies and standard technologies.
SAP NetWeaver Gateway – A technology framework enabling exposure and simplified access to SAP software from any device or environment using standard, open protocols. It opens data and processes running on SAP applications for software developers to create apps in different environments and devices to engage many more business consumers.
SAP NetWeaver Master Data Management (SAP NetWeaver MDM) – Component of SAP NetWeaver that ensures cross-system data consistency across disparate systems and helps integrate business processes – providing a single version of master data for supplier, product, customer, or user-defined data objects in heterogeneous environments.
SAP NetWeaver Mobile – Component of SAP NetWeaver that helps IT organizations extend applications, data, and process to mobile workers that are not always connected to the company network. It includes over-the-air device management, application design tools, and synchronization middleware that allow occasionally connected mobile devices to inter-operate as part of a company’s business processes.
SAP NetWeaver Portal – Component of SAP NetWeaver that offers a complete portal infrastructure and high-performance functions for knowledge management and collaboration between enterprises. The portal is based on open standards and Web services and is tightly linked with other SAP NetWeaver components, so it also supports heterogeneous IT landscapes and is compatible with Java, J2EE, and Microsoft.NET.
SAP NetWeaver Process Integration (SAP NetWeaver PI) – Component of SAP NetWeaver that enables different versions of SAP and non-SAP systems from different vendors running on different platforms (for example, Java ABAP and so on) to communicate with each other. Includes all capabilities previously covered by SAP NetWeaver Exchange Infrastructure to realize cross-system business processes.
SAP NetWeaver Visual Composer – Design tool that facilitates the creation of SAP NetWeaver Portal content using a visual user interface, rather than written code.
SAP Notes – Tool that provides instructions on how to remove known errors from SAP software, including a description of the symptoms, cause, and location of the errors.
Additional Information 297
SAP PartnerEdge – Global, partner-to-partner business collaboration network where SAP partners can share expertise, development capabilities, solutions, and knowledge to extend their market reach. In late 2012, SAP’s extranet for partners, SAP Channel Partner Portal, merged with SAP PartnerEdge. The combined site, available at www.sappartneredge.com now gives partners access to information, product and business news, tools, training, and business resources to order products. Partners can also manage their relationship with SAP and collaborate with other SAP partners through SAP PartnerEdge.
SAPPHIRE NOW – SAP’s signature business technology event and the largest SAP customer-driven conference is held annually in several locations around the globe. The global event in the United States is co-located with the Americas’ SAP Users’ Group (ASUG) annual conference. Attendees discover new initiatives, solutions, products, and services, as well as unique access to the latest business strategies and industry best practices from SAP customers, partners, executives, and industry experts to help them drive business results across all levels.
SAP Premier Customer Network – Exclusive SAP community of top industry leaders representing some of the world’s largest and best-run businesses. For these premier customers, SAP aims to simplify and tailor the partnership toward the unique needs of each customer by proactively assembling the best talent and synchronization across all SAP lines of business (product development, sales, services, support, and marketing) globally.
SAP Product Lifecycle Management (SAP PLM) – Application that helps companies manage, track, and control all product-related information over the complete product and asset lifecycle as well as throughout the extended supply chain. SAP PLM is designed to facilitate creativity and to free the process of product innovation from organizational constraints.
SAP Real-Time Data Platform – See SAP Data Management.
SAP Ramp-Up – Program SAP uses to introduce new application releases on the market to selected customers during the restricted shipment phase.
SAP Rapid Deployment solutions – Packages of preconfigured software and predefined services with content including best practices, templates, tools, and business user enablement with predetermined scope, time, and costs. Because the solutions are installed quickly, customers can benefit from crucial software functionality within as little as 12 weeks, helping lower the total cost of implementation and giving customers immediate and tangible value.
SAP Replication Server – Software that moves and synchronizes data in real time, allowing companies to gain better use of application data and to create reports without affecting operational systems. Administrators can set up redundant disaster recovery sites and distribute, consolidate, and synchronize data across multiple platforms. Formerly called SAP Sybase Replication Server.
SAP River– An integrated development environment and programming language that allows rapid development of business applications to run on SAP HANA.
SAP road maps – Available for industries, lines of business, and technology, SAP road maps highlight the SAP solutions available today, planned innovation, and the SAP vision for the future.
SAP Safeguarding – Project-based support option that helps customers manage risks and enable the technical robustness of SAP solutions during implementation, upgrade, and operations.
298 Glossary
SAP Service Marketplace – Extranet platform that offers capabilities for collaboration between SAP, customers, and partners. The extranet provides central access and guided navigation to SAP’s complete product listing with support, maintenance, and upgrade information.
SAP Services – A portfolio of services that helps customers derive value from their SAP solutions in a fast, cost-effective, and predictable way. The portfolio comprises three categories of services: High value (people-centric offerings in areas such as business transformation, industry-specific (for example, banking), and architecture-focused projects), innovation services (help lead the market adoption of SAP innovations such as SAP HANA, mobility, and cloud offerings); and engineered services (assembled to order to provide faster time to value and lower TCO with greater predictability, including rapid-deployment solutions).
SAP SMS 365 – Interoperability services that simplify the deployment and delivery of inter-operator messaging over incompatible networks, protocol stacks, and handsets among mobile operators worldwide. Messages are delivered through a secure operator-grade messaging platform, with advanced protocol conversion, routing, queuing, and transcoding capabilities.
SAP Solidarity Fund – The SAP Solidarity Fund e.V. was set up by SAP employees as an immediate response to the September 11, 2001, attacks. The goal of this charitable association was to help people – as a result of a natural disaster, for example – quickly and with minimum bureaucracy. The activities of the SAP Solidarity Fund are made possible mainly through contributions from SAP employees and people associated with SAP. Since its foundation, the SAP Solidarity Fund has managed to make more than €2 million available for various projects.
SAP Solution Explorer – A customer-facing self-service tool that helps users find the business management software solutions they need from SAP to operate profitably, adapt continuously, and grow sustainably. Content includes value maps and executive summaries for all SAP-supported lines of businesses, industries, technology, and selected topics.
SAP Solution Manager – Application management solution that enables customers to manage their SAP and non-SAP applications better. With SAP Solution Manager, customers can centralize, enhance, automate, and improve the management of their entire system landscape, thus reducing total cost of ownership. The solution includes features such as diagnostics, testing, root cause analysis, and solution monitoring.
SAP solutions for enterprise performance management (EPM) – Software that helps companies improve performance, organizational agility, and decision making. SAP solutions for EPM include SAP Business Planning and Consolidation, SAP Profitability and Cost Management, SAP Financial Consolidation, and SAP Disclosure Management applications.
SAP solutions for governance, risk, and compliance (GRC) – Applications that provide organizations with a real-time approach to managing GRC across heterogeneous environments. SAP solutions for GRC include the SAP Risk Management, SAP Access Control, and SAP Global Trade Services applications as well as the SAP Sustainability Performance Management analytic application, among others.
SAP solutions for small businesses and midsize companies – SAP Business All-in-One solution, SAP Business One application, and SAP BusinessObjects Edge solutions that combine business management and business intelligence software for small businesses and midsize companies. As with large enterprises, these firms seek to streamline business processes, cut costs, drive growth, and increase profitability by receiving the right information at the right time – across all operations.
SAP solutions for sustainability – Sustainability software includes the measurement of sustainability key performance indicators; energy and carbon management; and environment, health, and safety. SAP solutions for sustainability help organizations tackle energy consumption and greenhouse gas emissions, as well as support efforts in product safety, healthcare, and sustainability performance management.
Additional Information 299
SAP SQL Anywhere – A mobile, embedded, and cloud-enabled fully relational database that is embedded in more than 10 million installations worldwide, from laptops to tablets to smartphones. Formerly called SAP Sybase SQL Anywhere.
SAP Standard Support – Support option offering a reliable response to technical disruptions and for maintaining system health and integrity. This basic support offering features including updates, problem resolution, knowledge transfer, quality management, and more to keep IT landscapes up-to-date and stable.
SAP Startup Focus – Program that offers a variety of resources for young companies including technology, training, technical advice and valuable go-to-market support. It serves as a development and growth accelerator that provides an integrated approach for startups to innovate on the SAP HANA platform.
SAP StreamWork – See “SAP Jam.”
SAP Supplier Relationship Management (SAP SRM) – Procurement application that helps organizations in all industries improve their centralized sourcing and contract management and interact with suppliers through multiple channels. SAP SRM is designed to accelerate and optimize the entire end-to-end procure-to-pay process by supporting integrated processes and by enforcing contract compliance, which can result in realizable savings.
SAP Supply Chain Management (SAP SCM) – Application that helps companies adapt their supply-chain processes to a rapidly changing competitive environment. SAP SCM helps transform traditional supply chains from linear, sequential processes into open, configurable, responsive supply networks in which customer-centric, demand-driven companies can monitor and respond more smartly and quickly to demand and supply dynamics across a globally distributed environment.
SAP University Alliances – Program that introduces students to the exciting technologies shaping business today, and designed to connect students around the world interested in SAP solutions, careers, and research opportunities. Students participate in classroom sessions, app development, networking opportunities, events, and more.
SAP University Alliances community – Part of SAP Community Network, this online community provides connections between university leaders and students, SAP customers and partners, and SAP internal experts. Professors and lecturers gain access to up-to-date SAP-related business and IT course materials, resources, and peer-to-peer contact with many renowned experts.
SAP User Group Executive Network (SUGEN) – In 2007, SAP initiated a program that encouraged all SAP user groups to share their expertise and recommended practices with the wider user-group community. It kindled some valuable discussion, which, in the end, is good for all SAP stakeholders. An umbrella organization, SUGEN embraces 12 national SAP user groups with the shared aim of defining priorities and agreeing on plans of action to bring greater focus to the dialog between SAP and its user groups on the global plane.
SAP Ventures – An independent venture firm spun off from SAP, providing the agility of a start-up while allowing companies to tap into SAP’s global enterprise ecosystem of customers and partners. The firm partners with outstanding entrepreneurs and venture firms worldwide to build industry-leading businesses.
SAP Web Channel Experience Management – An application that SAP developed to address companies’ needs to deliver an integrated and consistent customer experience over the Internet. The software allows organizations to deploy state-of-the-art Web shops, fully integrated with their back-end order management and inventory systems. This next generation e-commerce solution also brings together e-marketing, sales, online self-service, and social customer conversations on a single platform to provide a one-stop, synchronized Web customer experience. Formerly SAP Sybase PowerBuilder.
300 Glossary
Scope 1 (emissions) – Direct greenhouse gas emissions from sources that are owned or controlled by the reporting company, for example, fuel burned in corporate cars.
Scope 2 (emissions) – Indirect greenhouse gas emissions from consumption of purchased electricity, heat, or steam.
Scope 3 (emissions) – Indirect emissions that are a consequence of the activities of the reporting company, but occur from sources owned or controlled by another company, such as business flights.
software and software-related services (SSRS) – SAP reports revenues in software and software-related services (SSRS), which encompasses software, support, subscription, and other software-related service revenue.
software as a service (SaaS) – Software that is provided literally “as a service.” Software applications are delivered and managed remotely over a secure Internet connection and a standard Web browser. Access is charged on a subscription basis at a fixed price per user, usually on a monthly basis, and users only pay for applications they actually use. See “cloud computing.”
solution – SAP solutions enable a customer to meet a challenge or take advantage of an opportunity and are built or assembled by flexibly combining SAP applications and other SAP software. The solutions may include support for best business practices and be aided by consulting and ongoing support. They may also be enhanced or extended by SAP partner applications and services. Organizations can deploy SAP solutions to perform industry-specific business processes and to address their business issues in the way that best meets their needs.
solution area – A group of solutions that support a specific subprocess of a company’s end-to-end process.
solution extensions – Developed by independent partners, solution extensions integrate easily with SAP software, offering customers cross-solution and cross-industry functions that complement SAP software. These select third-party offerings are branded with “SAP,” and sold and supported by SAP and partners.
solution portfolio – Collection of general-purpose and industry-specific applications, services such as consulting, and support for industry best practices. SAP offers solution portfolios that serve the needs of organizations in more than 25 major industries. Customers choose from among the offerings to assemble or build their SAP solutions to meet their requirements. Each offering in the portfolio is priced and available for individual purchase.
specification – Document that details the business and functional requirements of a particular product or project.
stakeholder – Individual or group the corporation is responsible to because they are affected by or can affect the company’s business. Besides the traditional stockholder, SAP’s stakeholders include, for example, employees, customers, partners, suppliers, analysts, and society.
stand-alone release – SAP application release that can be deployed independently of other application releases.
standard-related custom development project (SCDP) – Customer-specific development with a contractually binding commitment for at least a partial retrofit.
SuccessFactors Compensation – As part of SuccessFactors HCM Suite, this solution helps companies create a more simplified compensation plan management with more accurate budgeting and reduced risk. With performance data is calibrated across the company to ensure fairness and employee retention, insight for total employee compensation analysis and assurance that budgets are used wisely, companies can retain top performers. Risk can be significantly reduced with improved audit compliance.
Additional Information 301
SuccessFactors Employee Central – The foundation of the SuccessFactors HCM Suite of solutions, Employee Central is a next-generation core HR software delivered securely as a service from the SuccessFactors cloud. It offers one global system of record, complete workforce overview combining HR and talent data, powerful analytics, and social collaboration fine-tuned to meet local needs. It is currently available in 10 countries. An additional offering specifically for payroll was launched in 2013 called SAP SuccessFactors Employee Central Payroll.
SuccessFactors HCM Suite – Suite of HR solutions for talent management, core HR, collaboration, and workforce analytics. The cloud-based suite provides solutions to bridge the gap between strategy and execution with tools to hire, reward, and develop the right people with the right skills to grow a business sustainably. Formerly called SuccessFactors Business Execution Suite (SuccessFactors BizX Suite).
SuccessFactors Learning – As an integrated part of SuccessFactors HCM Suite, this solution helps companies transform how a workforce learns by combining formal, social, and extended learning with content management, reporting, and analytics, available from an office or on a mobile device.
SuccessFactors Professional Edition – A cloud-based solution that addresses, and is tailored to, the performance and talent management essentials small businesses and midsize companies require. Applications include employee profile, performance management, goal management, 360-degree review, and the SAP Jam social collaboration platform.
SuccessFactors Workforce Analytics – As part of SuccessFactors HCM Suite, this solution helps companies get the insights they need to make strategic workforce decisions by finding answers to key questions about workforce challenges and how to solve them.
support package – Bundle of software corrections compiled periodically and available for ABAP or Java programming languages.
support release – Release offered after the beginning of the unrestricted shipment phase – if required – that contains a collection of all previously available support packages.
sustainability – For SAP, sustainability is the ability to manage economic, social, and environmental risks and opportunities holistically for increased profitability. It contributes to our vision to help the world run better and improve peoples’ lives. SAP is committed to fully integrating sustainability into our strategy and business model and in this way the company pursues a corporate strategy that is sustainable rather than a stand-alone sustainability strategy. See “SAP solutions for sustainability.”
Sybase – SAP acquired Sybase in late 2010, broadening the SAP portfolio for enterprise mobility, introducing a complete mobile platform and mobile solutions that enable customer access to data stored in SAP software and systems from anywhere and from any device.
Syclo – Acquired by SAP in 2012, Syclo is a leading provider of enterprise mobile applications and technologies. The Syclo family of mobile apps extend SAP ERP and SAP CRM for mission-critical work on the go and out in the field. They offer a quick, flexible, reliable path to mobilizing asset management, field service, inventory/warehouse, and sales, regardless of language, user type, device selection, or connectivity.
302 Glossary
system integrator (SI) – Company focused on integrating IT systems and providing related consulting. This is a classic channel used by large software vendors, large hardware vendors, and original equipment manufacturers.
T
technology platform – The technical foundation for a business-driven software architecture that increases the adaptability, flexibility, openness, and cost-efficiency of IT operations and enables organizations to become more agile in responding to change. See “SAP NetWeaver.”
total energy consumed – The sum of all energy consumed through SAP’s own operations, including energy from renewable sources.
U
United Nations Global Compact (UN Global Compact) – A policy initiative for businesses that are committed to aligning their operations and strategies with ten universally accepted principles in the areas of human rights, labor standards, environment, and anti-corruption.
unrestricted shipment phase – Second phase of release delivery, during which all customers can obtain the release. The phase follows the restricted shipment phase.
upgrade – Replacement of an existing application component with a newer component of that same application.
V
value-added reseller (VAR) – Partner that receives the majority of its revenue from reselling a vendor’s hardware or software solutions directly to end users. Additionally, VARs often provide consulting, implementation, postsales support, and training to their own customers. VARs may develop and sell add-on applications to meet the needs of vertical markets and may expand SAP product functionality.
value map – A structural view of SAP solutions organized according to industry, business responsibility, and technology area.
vertical solution – A specialized application designed to meet the unique needs of a particular business or industry.
“visual enterprise” – Ability to visually communicate parts of the business helps maximize productivity, improve process efficiency and quality, and reduce cost and cycle time. Solutions that support the “visual enterprise” unify and synchronize product information from multiple systems and deliver it in role-specific and workflow-controlled processes to people. The SAP 3-D Visual Enterprise applications, resulting from the RightHemisphere acquisition, enrich SAP Business Suite software with new 3-D visualization features that integrate business data, which will support new standards to increase speed, enhance productivity, and improve quality across the entire value chain.
Additional Information 303
virtualization – The decoupling of physical and logical computer resources. This approach can be implemented on different levels such as network, storage, central processing unit, server, and application.
W
Web service – Describes a set of technical functionality using Web Services Description Language (WSDL), enabling interoperable machine-to-machine interaction over a network. Typically, Web services are simply Web application programming interfaces (APIs) that can be accessed and executed by a consuming application.
“women in management” – Phrase used to refer to the percentage of women in management positions (managing teams, managing managers, executive boards) as compared to the total number of managers, expressed by the number of individuals and not full-time equivalents (FTEs).
works council – As dictated by the German Works Council Constitution Act, a works council is a legal body for representing employees’ interests to the employer and codetermining the works in private companies. On June 21, 2006, the SAP AG employees working in Germany elected its first works council. A European works council was created in the spring of 2012.
304 Glossary
Addresses
GROUP HEADQUARTERS
SAP AG
Dietmar-Hopp-Allee 16
69190 Walldorf
Germany
Tel. +49 6227 74 74 74
Fax +49 6227 75 75 75
E-mail info@sap.com
Internet www.sap.com
The addresses of all our international subsidiaries and sales partners are available on our public Web site at www.sap.com/directory/main.html.
For more information about the matters discussed in this report, contact:
Investor Relations
Tel. +49 6227 76 73 36
Fax +49 6227 74 08 05
E-mail investor@sap.com
Internet www.sap.com/investor
Press
Tel. +49 6227 74 63 15
Fax +49 6227 74 63 31
E-mail press@sap.com
Internet www.sap.com/press
Additional Information 305
Financial and Sustainability Publications
The SAP Integrated Report is available online only at www.sapintegratedreport.com in English, or in German at www.sapintegratedreport.de.
The following publications are available in English at www.sap.com/investor, or in German at www.sap.de/investor, as indicated below:
| ¡ | | SAP Group Annual Report (IFRS, in English and German) |
| ¡ | | Annual Report on Form 20-F (IFRS, in English) |
| ¡ | | SAP AG Statutory Financial Statements and Review of Operations (HGB, in German) |
| ¡ | | Interim Reports (in English and German) |
| ¡ | | SAP INVESTOR, SAP’s quarterly shareholder magazine (online at www.sap-investor.com, in English and German) |
You can also read SAP’s annual and interim reports on an iPad. The free and interactive app Publications is now available in the App Store.
Complete information on the governance of SAP is available at www.sap.com/corpgovernance. Materials include:
| ¡ | | Information about the management of the company, including the directors on the governing bodies |
| ¡ | | Details of the directors’ dealings in SAP shares |
| ¡ | | Shareholder meeting papers and ballot results |
| ¡ | | Articles of Incorporation |
| ¡ | | German Code of Corporate Governance |
| ¡ | | Declaration of Implementation pursuant to the German Stock Corporation Act, Section 161 |
| ¡ | | Code of Business Conduct for Employees |
| ¡ | | Corporate Governance Statement pursuant to the German Commercial Code, Section 289a |
| ¡ | | Corporate Governance Report |
Additional SAP policies are made public at www.sap.com/corporate-en/sustainability:
| ¡ | | SAP Environmental Policy |
| ¡ | | SAP Human Rights Commitment |
| ¡ | | SAP Global Health and Safety Management Policy |
| ¡ | | SAP Supplier Code of Conduct |
| ¡ | | SAP Partner Code of Conduct |
306 Financial and Sustainability Publications
Financial Calendar
2014
March 21
Publication of SAP Integrated Report
April 17
Results for the first quarter of 2014
May 21
Annual General Meeting of Shareholders Mannheim, Germany
May 22
Dividend payment
July 17
Results for the second quarter of 2014
October 20
Results for the third quarter of 2014
2015
January 21
Preliminary results for fiscal year 2014
May 20
Annual General Meeting of Shareholders Mannheim, Germany
May 21
Dividend payment
Additional Information 307
Publication Details
PUBLISHER
SAP AG
Investor Relations
CONCEPT AND REALIZATION
Kuhn, Kammann & Kuhn GmbH, Cologne, Germany
PHOTOGRAPHY GLOBAL MANAGING BOARD AND COVER
Andreas Pohlmann, Munich, Germany
PRINTING
ABC Druck, Heidelberg, Germany
COPYRIGHT
©2014 SAP AG
Dietmar-Hopp-Allee 16
69190 Walldorf
Germany
TRADEMARKS
© 2014 SAP AG or an SAP affiliate company. All rights reserved.
No part of this publication may be reproduced or transmitted in any form or for any purpose without the express permission of SAP AG or an SAP affiliate company.
SAP and other SAP products and services mentioned herein as well as their respective logos are trademarks or registered trademarks of SAP AG (or an SAP affiliate company) in Germany and other countries. Please see www.sap.com/corporate-en/legal/copyright for additional trademark information and notices.
308 Publication Details
GROUP HEADQUARTERS
SAP AG
Dietmar-Hopp-Allee 16
69190 Walldorf
Germany
www.sap.com
www.sap.com/investor
50121673