Exhibit 99.1
INTERIM REPORT JANUARY — JUNE 2014
| | |
 | | THE BEST-RUN BUSINESS RUN SAP™ |
TABLE OF CONTENTS
INTERIM REPORT JANUARY — JUNE 2014
Introductory Notes
This interim group report meets the requirements of German Accounting Standard No. 16 “Zwischenberichterstattung” (DRS 16). We prepared the financial data in the Half-Year Financial Statements (Unaudited) section for SAP SE and its subsidiaries in accordance with International Financial Reporting Standards (IFRS). In doing so, we observed the IFRS (including the interpretations by the IFRS Interpretations Committee (IFRIC)) both as issued by the International Accounting Standards Board (IASB) and as endorsed by the European Union (EU). This does not apply to numbers expressly identified as non-IFRS. For additional IFRS and non-IFRS information, see the Supplementary Financial Information (Unaudited) section.
This interim group report complies with the legal requirements in accordance with the German Securities Trading Act (Wertpapierhandelsgesetz, WpHG) for a half-year financial report, and comprises the interim management report, consolidated interim financial statements, and the responsibility statement in accordance with the German Securities Trading Act, section 37w (2).
This half-year financial report updates our consolidated financial statements 2013, presents significant events and transactions of the second quarter 2014 and the first half of 2014, and updates the forward-looking information contained in our Management Report 2013. Both the 2013 consolidated financial statements and the 2013 Management Report are part of our 2013 Integrated Report which is available at www.sapintegratedreport.de.
All of the information in this interim group report is unaudited. This means the information has been subject neither to any audit nor to any review by an independent auditor.
| | |
| INTERIM REPORT JANUARY – JUNE 2014 | | 3 |
INTERIM MANAGEMENT REPORT
GENERAL INFORMATION
Forward-Looking Statements
This half-year financial report contains forward-looking statements and information based on the beliefs of, and assumptions made by, our management using information currently available to them. Any statements contained in this report that are not historical facts are forward-looking statements as defined in the U.S. Private Securities Litigation Reform Act of 1995. We have based these forward-looking statements on our current expectations, assumptions, and projections about future conditions and events. As a result, our forward-looking statements and information are subject to uncertainties and risks, many of which are beyond our control. If one or more of these uncertainties or risks materializes, or if management’s underlying assumptions prove incorrect, our actual results could differ materially from those described in or inferred from our forward-looking statements and information.
We describe these risks and uncertainties in the Risk and Opportunity Management section, respectively in the there-mentioned sources.
The words “aim,” “anticipate,” “assume,” “believe,” “continue,” “could,” “counting on,” “development,” “is confident,” “estimate,” “expect,” “forecast,” “future trends,” “guidance,” “intend,” “may,” “might,” “outlook,” “plan,” “project,” “predict,” “seek,” “should,” “strategy,” “want,” “will,” “would,” and similar expressions as they relate to us are intended to identify such forward-looking statements. Such statements include, for example, those made in the Operating Results section, the Risk and Opportunity Management section, our Forecast for SAP, and other forward-looking information appearing in other parts of this half-year financial report. To fully consider the factors that could affect our future financial results, both our 2013 Integrated Report and Annual Report on Form 20-F for December 31, 2013, should be considered, as well as all of our other filings with the Securities and Exchange Commission (SEC). Readers are cautioned not to place undue reliance on these forward-looking statements, which speak only as of the date specified or the date of this report. Except where legally required, we undertake no obligation to publicly update or revise any forward-looking statements as a result of new information that we receive about conditions that existed upon issuance of this report, future events, or otherwise unless we are required to do so by law.
Statistical Data
This report includes statistical data about the IT industry and global economic trends that comes from information published by sources including International Data Corporation (IDC), a provider of market information and advisory services for the information technology, telecommunications, and consumer technology markets; the European Central Bank (ECB); and the International Monetary Fund (IMF). This type of data represents only the estimates of IDC, ECB, IMF or the other mentioned sources of industry data. SAP does not adopt or endorse any of the statistical information. In addition, although we believe that data from these sources is generally reliable, this type of data is imprecise. We caution readers not to place undue reliance on this data.
All of the information in this report relates to the situation on June 30, 2014, or the half-year ended on that date unless otherwise stated.
Non-IFRS Financial Information
This half-year financial report contains non-IFRS measures as well as financial data prepared in accordance with IFRS. We present and discuss the reconciliation of these non-IFRS measures to the respective IFRS measures in the Supplementary Financial Information (Unaudited) section. For more information about non-IFRS measures, see our Web site www.sap.com/corporate-en/investors/newsandreports/reporting-framework.epx under “Non-IFRS Measures and Estimates.”
| | |
| 4 | | INTERIM MANAGEMENT REPORT |
ECONOMY AND THE MARKET
Global Economic Trends
The European Central Bank reports that global economic growth remained robust overall in the first half of 2014. Having decelerated at the start of the year, both the industrialized and developing economies stabilized in the second quarter.
In the Europe, Middle-East, and Africa (EMEA) region, the ECB reports that gross domestic product (GDP) in the euro area improved slightly in the first six months, though slightly less than forecast. The economies in Central and Eastern Europe continued to recover despite the geopolitical tension in Ukraine. In the Middle East and Africa, economic trends were mixed.
According to the ECB, extreme weather conditions had a major impact on growth in the Americas region: GDP fell in the United States in the first three months of the year due to the unusually harsh winter but subsequently recovered in the second quarter. Growth in Latin America remained generally restrained in the first half of the year – with a moderate improvement in Mexico and a slight decline in Brazil.
In the Asia Pacific Japan (APJ) region, the ECB says the difference in growth rates between the industrialized economies and the emerging economies narrowed: In Japan, an increase in consumer spending ahead of the consumption tax raise in April boosted GDP even higher than expected in the first quarter. As expected, GDP growth declined subsequently. In China, economic growth saw a slight decline in the first half of 2014.
The IT Market
According to International Data Corporation (IDC), a market research firm based in the United States, the global IT market did not develop uniformly in the first half of the current year but still outpaced the overall economy. Particularly, the mobile device market expanded less quickly than in 2013, primarily due to growing saturation and increasing price pressure. The IT markets in the emerging economies continued to outperform those of industrialized economies. However, the difference in growth rates narrowed.
Within the Europe, Middle-East, and Africa (EMEA) region, the IT markets of most Western European countries stabilized and expanded. In Central and Eastern Europe, however, political uncertainty in Ukraine dampened IT market growth contrary to the general economic trend, particularly in the second quarter.
In the Americas region, IT markets were buoyed by increased consumer confidence in a positive economic environment. The U.S. IT market largely overcame the 2013 federal spending cuts by the middle of 2014, and IT markets in Latin America continued to see strong growth, albeit at a slower pace than previously.
The IT markets in the Asia Pacific Japan (APJ) region were more restrained, says IDC: The Japanese IT market benefited from pent-up consumer demand at the beginning of the year but flattened once this demand contracted and the consumption tax raise came into effect in April. In China, IT market growth remained at a low level in comparison with previous years, but did not decline further.
Impact on SAP
SAP saw a strong performance in EMEA, despite uncertainties due to the Ukraine crisis. Non-IFRS software and software-related service revenue increased 8% year-over-year at constant currencies. This was the result of 51% growth in Non-IFRS cloud subscriptions and support revenue at constant currencies for the region as well as strong software revenue growth in the UK and France.
The Americas region had a solid performance. Non-IFRS software and software-related service revenue increased 6% year-over-year at constant currencies. The region continued the fast transition to the cloud with 34% growth in non-IFRS cloud subscriptions and support revenue at constant currencies. SAP also saw strong software revenue growth in Canada and continues to see strong demand in Latin America with tremendous growth opportunities.
In the APJ region SAP had a strong performance. Non-IFRS software and software-related service revenue grew by 12% at constant currencies. Non-IFRS cloud subscriptions and support revenue grew by 48% at constant currencies. Australia and Malaysia were highlights, with strong triple-digit software revenue growth at constant currencies.
VISION, MISSION, AND STRATEGY
We did not change our vision, mission, or strategy in the first six months of 2014. For a detailed description, see our 2013 Integrated Report and item 4 in our 2013 Annual Report on Form 20-F.
| | |
| INTERIM REPORT JANUARY – JUNE 2014 | | 5 |
PORTFOLIO OF SOFTWARE AND SERVICES
In the first half of 2014, we made enhancements to our portfolio of software and services. For a detailed description of our portfolio of software and services, see our 2013 Integrated Report (www.sapintegratedreport.com) and item 4 in our 2013 Annual Report on Form 20-F.
Software Portfolio
In our 2013 Integrated Report, SAP already stated its commitment to helping customers “simplify everything, so they can do anything.” With SAP Cloud powered by SAP HANA, we will focus our simplification on three areas – simplifying our consumption model, simplifying our portfolio, and simplifying the user experience.
As already stated in our report for the first quarter, part of this work has been to re-categorize our software products to better reflect our business strategy. We have consolidated our five former market categories Applications, Analytics, Mobile, Database and Technology, and Cloud into three categories for the future: Applications, Analytics, and Technology Platform.
The first half of 2014 was marked by SAPPHIRE NOW in Orlando, SAP’s premier business technology event for executives, lines of business, and IT decision makers. SAP unveiled its vision for the future of business, which is to enable a simpler world, simpler SAP, and simpler customer experience. Executive keynotes and major announcements presented today’s global business network economy and showcased the strategy for businesses to simplify everything through SAP Cloud powered by SAP HANA.
Applications
In the first half of 2014, we announced a number of features and functions designed to help simplify business and technology to improve people’s lives – including innovations in specific industries, as well as in mobile, cloud, and business networks.
In June, we made several announcements at SAPPHIRE NOW in Orlando, including:
| • | | SAP Fiori user experience and SAP Screen Personas software will now be included within underlying licenses of SAP software. With additional apps released in the second quarter of 2014, there are currently more than 300 apps available that use the SAP Fiori user experience. |
| • | | We introduced SAP Simple Finance, a set of solutions based on SAP HANA in SAP HANA Enterprise Cloud to help Chief Financial Officers and finance departments tackle the most complex tasks in finance. |
| • | | We announced plans to co-innovate with customers and partners to deliver industry-specific solutions across all 25 industries served by SAP. The solutions will run on SAP Cloud powered by SAP HANA. |
Also in June, the SAP Match Insights solution for football was launched during the World Cup in Brazil as a result of a co-innovation project between SAP and the German Football Association (DFB). This solution running on the SAP HANA platform helps facilitate the analysis of training, preparation, and tournaments to help improve player and team performance.
In May, SAP crossed the 1,000 customer mark for SAP Business Suite powered by SAP HANA since its launch in January 2013. SAP Business Suite powered by SAP HANA has already become one of the fastest-growing software applications in SAP’s history.
At the Financials 2014 event in May, we announced a new wave of innovation for SAP Business Suite powered by SAP HANA to help enterprises accelerate their finance transformation. The innovation modernizes the SAP ERP Financials solution to help finance organizations access information in new ways enabled by the speed and power of SAP HANA.
We also expanded our portfolio of customer relationship management (CRM) offerings in May leveraging the SAP HANA Cloud Platform with new industry versions designed for insurance, utilities, and retail.
Additionally in the first quarter, we introduced enhancements to cloud solutions for customer engagement, including new capabilities for sales, service, and marketing.
Ariba, an SAP company, and Accenture announced plans to expand their global alliance to offer new cloud-based solutions that help improve the delivery of procurement and finance and accounting business services to clients.
Additionally for Ariba, the first half of 2014 brought enhancements designed to fuel the new levels of connectivity, collaboration, and insight. These enhancements will help customers optimize the buying, selling, and managing of cash in today’s fast-moving networked economy.
In March, we introduced a new rapid-deployment solution. It accelerates the preparation of consolidated financial reports both to the
| | |
| 6 | | INTERIM MANAGEMENT REPORT |
International Financial Reporting Standards (IFRSs) and as required by European Banking Authority Financial Reporting (EBA FINREP) regulations, using the same dataset. It helps banks adapt to FINREP requirements.
In late March, SAP and Adobe announced a global reseller agreement targeted at digital marketing and omni-channel commerce for enterprise customers. We plan to resell Adobe Marketing Cloud with the SAP HANA platform and the hybris Commerce Suite.
Also in late March we made the announcement of a new rapid-deployment solution that enables businesses to secure mobile devices, content, and apps within more days.
In early February, we introduced the SAP Commercial Project Management application. Leveraging existing capabilities of SAP Business Suite software, the application offers coverage of the lead-to-cash scenario for projects, beginning with selling a project and continuing through planning to delivery.
We also announced general availability of the 9.0 version of the SAP Business One application for SAP HANA.
In cloud applications, we introduced enhancements to the SAP Cloud for Travel and Expense solution, with new capabilities that make travel and expense management simpler, faster, and richer than ever before.
At the 103rd Annual Convention and EXPO of the National Retail Federation (NRF) in New York City, we launched SAP Shopper Experience, a personalized and engaging retail mobile app that transforms the entire consumer shopping experience with social media sharing, loyalty programs, and a self-payment system for shoppers.
In January, we announced that NEC, a provider of innovative IT, network, and communications products and solutions for enterprises, had entered into an original equipment manufacturer (OEM) agreement to integrate the SAP Business ByDesign solution with its global cloud-based enterprise resource planning (ERP) services.
Industry Recognition
SAP was named the overall leader in worldwide supply chain management and supply chain planning, according to the Gartner, Inc. “Market Snapshot: Supply Chain Management Software, Worldwide, 2013” report.
Cloud-based HR software solutions from SuccessFactors, an SAP company, were positioned for the second year in a row in the Leaders quadrant of Gartner, Inc.’s “Magic Quadrant for Talent Management Suites (TMS).”
In February, the SAP Scouting solution won the prestigious “2014 People’s Choice Award” in design at the Interaction Awards, an initiative of the Interaction Design Association (IxDA).
Also in February, Forrester Research ranked SAP as a leader in its report “The Forrester Wave: SAP Services Providers, Q1 2014.”
Already earlier this year, the Corporate Executive Board (CEB) Tower Group recognized SAP as a best-in-class provider in the report categories operational flexibility and enterprise support in its “Core Banking Systems for the Large Bank Market” report.
Analytics
Among the developments in analytics during the first half of 2014 were new product updates as well as two specialized applications for healthcare and sports.
At the BI 2014 conference in May, we announced updates to SAP Lumira software that include integration to SAP HANA and the ability to create and share infographics.
Also in May, SAP announced the availability of our analytics solutions in SAP HANA Enterprise Cloud to enable our customers to deploy our portfolio of analytics solutions with more flexibility, choice and control.
SAP unveiled SAP Global Trade Services, Processing Trade in China in May. This new application helps centralize processing trade activities so that businesses can work efficiently and transparently with China.
In February, we announced that we are developing innovative solutions aimed at significantly improving health outcomes while cutting costs. This included the first live tour “Medical Insights” for clinical data integration, an important advance in cancer treatment.
Also in February, we announced that we will continue to enhance the Extreme Sailing Series in 2014. As the Official Technical Partner of the series and title sponsor of the SAP Extreme Sailing Team, we will deliver enhanced analysis tools both pre- and post-race, offering sailors, media, and fans greater insight into the on-water action.
| | |
| INTERIM REPORT JANUARY – JUNE 2014 | | 7 |
Industry Recognition
For the fifth year in a row, analyst firm Gartner named SAP market leader in the “Market Share Analysis: Business Intelligence and Analytics Software, 2013” report.
SAP was named a victor in the 2014 “Hurwitz Victory Index Report for Advanced Analytics” for both go-to-market and customer experience strength.
In the first half of 2014, we were named a leader by Forrester Research Inc. in its report “The Forrester Wave: Enterprise Business Intelligence Platforms, Q4 2013.” SAP was cited for its broad business intelligence innovations.
In addition, our market leader status was confirmed in the latest edition of analyst Howard Dresner’s “Wisdom of Crowds Mobile Computing/Mobile Business Intelligence Market Study.”
In March, we were named a leader in both Gartner’s 2014 Magic Quadrant for Business Intelligence and Analytic Platforms, and in Gartner’s 2014 Magic Quadrant for Corporate Performance Management (CPM) Suites. This is the eighth year in a row that Gartner has positioned SAP as a leader in the Magic Quadrant for Corporate Performance Management Suites.
Technology Platform
Our Technology Platform category addresses the database, IT management, cloud infrastructure, and mobile platform segments of the market.
We announced at SAPPHIRE NOW in Orlando developments related to SAP HANA, including:
| • | | Next steps in delivering SAP HANA as the modern platform that empowers customers to transform their businesses and innovate in the cloud. This includes new innovations, key features, and functions for SAP HANA, mobile, analytics, data services, and cloud integration services. |
| • | | The new release of service pack 8 (SP8) for SAP HANA provides next steps for customers to accelerate, innovate, and simplify their business. |
| • | | The winners of the inaugural SAP HANA Innovation Award, celebrating customers that have positively impacted business and society with the platform. |
| • | | Updates on how SAP HANA Cloud Platform (our platform as a service (PaaS)) and SAP HANA Marketplace are helping to create a simple and compelling end-to-end experience for customers, partners, and developers. |
| • | | We are working with an open ecosystem to drive innovation on the SAP HANA platform. Collaborations with partners, including Red Hat, IBM, HP, and VMware, as well as startups offer customers broader choice, ease of deployment, and simplified IT environments. |
OpenText and SAP announced in May that SAP Archiving by OpenText will now run on the SAP HANA platform and include support for SAP HANA Enterprise Cloud service deployments.
SAP and VMware announced in May that the SAP HANA platform on VMware vSphere 5.5 for production use has been released to customers. This enables customers to innovate and simplify their data centers by achieving faster time-to-value, higher service levels, and lower total cost of ownership (TCO).
Also in May, SAP and Microsoft announced an extension to our long-term partnership in three areas: Enterprise cloud computing with SAP applications certification for Microsoft Azure; improved interoperability between data from SAP applications and Microsoft Office; and mobile productivity with expanded development and support for Windows and Windows Phone 8.1.
SAP announced general availability of the SAP Mobile Platform 3.0 in May. The latest version completes the full unification of our mobile app development platform frameworks, making it easier for customers to build and deploy apps.
In April, SAP made significant gains toward building out the SAP Cloud powered by SAP HANA in the first half of 2014 with the announcement of new subscription models for SAP Business Suite through the SAP HANA Enterprise Cloud service, the expansion of new global data centers worldwide, and enhanced migration services to ease the customer journey to the cloud.
Ariba, an SAP company, announced in April that the Ariba Network is moving to the SAP HANA platform. The move will enable companies to gain new insights into their operations and act on them more quickly to drive better business outcomes and competitive advantage.
In cloud technologies, we began the year by announcing plans to collaborate with 12 world-class
| | |
| 8 | | INTERIM MANAGEMENT REPORT |
cloud service providers to offer SAP-validated, cloud-based infrastructure and application services globally. Our partners include CenturyLink Technology Solutions, China Datacom, Fujitsu, Hitachi Data Systems, HP, IBM, Swisscom, Telstra, T-Systems, Verizon, Virtustream, and VMware vCloud & Hybrid Service.
Our cloud roadmap also advanced in the first half of 2014, as we introduced simplified pricing, deployment, and accessibility options for SAP HANA. Customers now have the ability to choose from three offerings: SAP HANA AppServices, SAP HANA DBServices, and SAP HANA Infrastructure Services.
In late March, SAP announced the availability of the 7.4 version of the SAP Business Warehouse application powered by SAP HANA.
SAP unveiled many of its recent innovations at Mobile World Congress in February. Among our announcements at this event were:
| • | | A collaboration with Xamarin and Service2Media to provide developers with mobile app development frameworks that can efficiently and cost-effectively enable development on the SAP Mobile Platform. |
| • | | New LTE (Long-Term Evolution) roaming agreements with MTT Russia, Orange, and Telenor Global Services. |
| • | | An innovative technology infrastructure for in-vehicle mobility services developed by SAP and BMW. This collaboration brings SAP one step closer toward making its vision of the connected car a reality. |
Also in the first half of 2014, we announced an expansion of our relationship with DigitalRoute, a leading provider of new approaches to Big Data management, to produce a solution that will bring together data from both operational and business support systems.
The British Columbia Centre for Excellence in HIV/AIDS at St. Paul’s Hospital in Vancouver announced in the first quarter that it is pioneering a new technology from PHEMI Health Systems and SAP to accelerate the treatment and improve the outcome for patients diagnosed with HIV/AIDS.
Industry Recognition
SAP was presented the inaugural 2014 Industry Innovation Award at the Global Sports Management Summit in May. The award highlights SAP’s commitment to make every team and athlete better, and engage fans better.
In March, SAP generated along with a team of technology partners, including BMMsoft, HP, Intel, NetApp, and Red Hat, a new world record for the world’s largest data warehouse using the SAP HANA platform and SAP IQ software. This independently audited 12.1-petabyte data warehouse has been recognized by Guinness World Records, and is four times larger than the previous record.
RESEARCH AND DEVELOPMENT
Our total research and development expense decreased slightly by 1% to €1,116 million in the first half of 2014, compared to €1,124 million in the corresponding period in 2013. We had 18,074 full-time equivalent (FTE) employees working in research and development teams on June 30, 2014, which increased by 700 FTEs compared to the prior year (June 30, 2013: 17,374).
On our IFRS numbers, the portion of total revenue we spent on research and development in the first half of 2014 was 14.2%, which decreased by 0.5 percentage points compared to the 14.7% recorded for the first half of 2013. On the non-IFRS numbers, the portion of total revenue we spent on R&D in the first half of 2014 was 13.5%, which decreased by 0.6 percentage points compared to the same period in the previous year (14.1%).
ACQUISITIONS
On June 13, 2014, we acquired the United States-based American company SeeWhy, the leading provider of cloud-based behavioral target marketing solutions to help businesses increase customer engagement and drive revenues.
On May 2, 2014, we closed our acquisition of United States-based American company Fieldglass following approval by the relevant antitrust authorities. Fieldglass is the leading provider of cloud solutions for procuring and managing contingent labor and services.
For more information about acquisitions of the prior year, see Note (4) in the Notes to the 2013 Annual Report.
| | |
| INTERIM REPORT JANUARY – JUNE 2014 | | 9 |
EMPLOYEES
Nothing has a greater impact on SAP’s long-term success than the creativity, talent, and commitment of our people. Their ability to understand the needs of our customers and to innovate delivers sustainable value to our company, our customers, and society. Successful strategies to attract, retain, develop, and engage our employees, therefore, are critical to driving a culture of innovation, sustained growth, and profitability.
An important factor for our long-term success is our ability to attract and retain talented employees. In the second quarter of 2014, the employee retention rate was 93.5% (compared to 93.6% in the second quarter of 2013). We define employee retention rate as the ratio between the average number of employees less voluntary employee departures (fluctuation) and the average number of employees (in full-time equivalents).
One of SAP’s overall non-financial goals is fostering a diverse workforce, specifically increasing the number of women in management. At the end of the second quarter of 2014, 21.1% of all management positions at SAP were held by women, compared to 21.4% at the end of June 2013. SAP has set a long-term target to increase the share of women in management to 25% by the year 2017.
On June 30, 2014, we had 67,651 full-time equivalent (FTE) employees worldwide (June 30, 2013: 64,937; December 31, 2013: 66,572).
Our overall employee headcount on June 30, 2014, included 17,171 FTEs based in Germany (June 30, 2013: 16,683), and 13,563 FTEs based in the United States (June 30, 2013: 13,550).
ORGANIZATION AND CHANGES IN MANAGEMENT
At the Annual General Meeting of Shareholders on May 21, 2014, SAP shareholders approved the conversion of the Company’s legal form to a European Company (Societas Europaea, SE). The conversion became effective when it was entered in the commercial register on July 7, 2014. Since this date, the Company’s legal form is SAP SE.
On May 4, 2014, the SAP AG Supervisory Board appointed Robert Enslin and Bernd Leukert to the SAP AG Executive Board, with immediate effect. Robert Enslin continues to be responsible for SAP’s sales organization. Bernd Leukert assumed responsibility for the entire development organization from Vishal Sikka, who on May 4, 2014, resigned from the SAP Executive Board for personal reasons and left the Company.
In addition, the Supervisory Board endorsed the appointment of Helen Arnold and Stefan Ries to our Global Managing Board, with a view to further strengthening the next generation of SAP executives.
Bob Calderoni, president of Ariba, an SAP company, and a member of the Global Managing Board, left SAP on January 15, 2014.
| | |
| 10 | | INTERIM MANAGEMENT REPORT |
REPORT ON ECONOMIC POSITION
We simplified the presentation of our software and software-related service revenue in our income statement starting with the first quarter of 2014 to express our focus on the combined power of our fast growing cloud business and our solid core business. With this modification, only the order and subtotals were changed; the content of line items remained unchanged.
Software and software-related service revenue now starts with the line item cloud subscriptions and support and is followed by line items software and support of our on-premise activities. The software and cloud subscriptions row was deleted and a new sum for software and support was added.
In the discussion of our assets, financial position, and operating results, the financial data presented for the first half of 2014 fully contains the revenue and expenses, assets, liabilities and cash flow from hybris. Fieldglass numbers are included in our consolidated financial statements since the May 2, 2014 acquisition date. hybris numbers are not included in the prior-year amounts – hybris was acquired on August 1, 2013.
Segment Information
In the first quarter of 2014, we took significant steps to drive forward our strategy and our ambition to become THE cloud company powered by SAP HANA. To execute this strategy, we merged certain areas of the company that performed similar tasks (for example, the on-premise sales forces with the cloud sales forces, and the on-premise support units with the cloud support units) to achieve a seamless organization of SAP.
Since this integration, our cloud-related activities are no longer dealt with by separate components in our Company. Our Executive Board assesses the financial performance of our Company on an integrated basis only. Consequently, with effect from the first quarter of 2014, SAP has one single operating segment.
For more information about the changes to our segment reporting, see the Notes to the Consolidated Interim Financial Statements section, Note (19).
Performance Against Our Outlook for 2014 (Non-IFRS)
In this section, all discussion of the first half years’ contribution to target achievement is based exclusively on non-IFRS measures. However, in the following section, the discussion of results refers to IFRS figures only, so those figures are not expressly identified as IFRS figures.
Starting in the second quarter of 2014, we additionally adjust our non-IFRS operating expense by excluding the expenses resulting from the Versata litigation (for more information about this litigation, see the Notes to the Consolidated Interim Financial Statements section, Note (16)). Prior-year amounts have been adjusted to comply with the modified set of non-IFRS adjustments. We exclude the Versata litigation expenses to provide additional insight into the comparability of our ongoing operating performance across periods and to continue the alignment of our non-IFRS measures with our internal performance measures. Our internal performance measures neither include effects from the Versata litigation.
We present, discuss, and explain the reconciliation from IFRS measures to non-IFRS measures in the Supplementary Financial Information (Unaudited) section.
Guidance for 2014 (Non-IFRS)
For our guidance based on non-IFRS numbers, see the Forecast for SAP passage in this interim management report.
| | |
| INTERIM REPORT JANUARY – JUNE 2014 | | 11 |
Key Figures — SAP Group in the Second Quarter of 2014 (Non-IFRS)
| | | | | | | | | | | | | | | | |
| | | | | | | | | | | | Non-IFRS | |
€ millions, unless otherwise stated | | 4/1/ -
6/30/2014 | | | 4/1/ -
6/30/2013 | | | Change
in % | | | Change in %
(Constant
Currency) | |
Cloud subscriptions and support | | | 242 | | | | 183 | | | | 32 | | | | 39 | |
Software | | | 957 | | | | 982 | | | | –2 | | | | 1 | |
Support | | | 2,280 | | | | 2,182 | | | | 4 | | | | 9 | |
Software and software-related service revenue | | | 3,480 | | | | 3,347 | | | | 4 | | | | 8 | |
Total revenue | | | 4,153 | | | | 4,091 | | | | 2 | | | | 5 | |
Operating expense | | | –2,917 | | | | –2,905 | | | | 0 | | | | 5 | |
Operating profit | | | 1,236 | | | | 1,186 | | | | 4 | | | | 7 | |
Operating margin (in %) | | | 29.8 | | | | 29.0 | | | | 0.8pp | | | | 0.6pp | |
Profit after tax | | | 938 | | | | 850 | | | | 10 | | | | NA | |
Effective tax rate (in %) | | | 25.4 | | | | 26.8 | | | | –1.4pp | | | | NA | |
Earnings per share, basic (in €) | | | 0.79 | | | | 0.71 | | | | 10 | | | | NA | |
Deferred cloud subscriptions and support revenue (June 30) | | | 448 | | | | 361 | | | | 24 | | | | 29 | |
Actual Performance in the Second Quarter of 2014 (Non-IFRS)
Our revenue from cloud subscriptions and support (non-IFRS) was €242 million (Q2 2013: €183 million), an increase of 32% (39% at constant currency) compared to the same period in 2013. Our cloud subscriptions and support margin was down 8.8 percentage points to 64%. This decrease was primarily due to the ramp-up of the Cloud Infrastructure Delivery to reflect the increasing customer demand. In the second quarter 2014, Fieldglass contributed €11 million (non-IFRS) to SAP’s cloud subscriptions and support revenue.
Deferred cloud subscriptions and support revenue (non-IFRS) was €448 million on June 30, 2014 (June 30, 2013: €361 million). On a constant currency basis, the increase was 29%. The opening balance for Fieldglass deferred cloud subscription and support revenue (non-IFRS) on May 2, 2014 was €1 million.
Our annual cloud revenue run rate (non-IFRS) is €1,186 million. The annual revenue run rate is the total of second-quarter 2014 cloud subscription and support revenue (non-IFRS) (€242 million) plus non-IFRS cloud-related professional services and other service revenue (€54 million) multiplied by four. This definition has changed from the previous year.
Non-IFRS cloud subscription and support revenue and non-IFRS cloud-related professional services and other service revenue from our former Ariba segment (as reported in our 2013 consolidated financial statements) included certain on-premise revenue. With effect from the first quarter of 2014, we have ceased presenting Ariba on-premise revenue as cloud revenue because we have integrated our cloud-related activities, see Note (19). Since the first quarter of 2014, we have based our annual cloud revenue run rate on cloud revenue, therefore we have adjusted that calculation accordingly.
Calculated cloud billings (non-IFRS) increased 41% year-over-year. On a constant currency basis, the increase was 37%. This is calculated as total of a period’s cloud subscription and support revenue and of the respective period’s change in the deferred cloud subscription and support revenue balance.
SAP continues to scale the world’s largest Web-based business trading community with trailing twelve month Ariba network spend volume exceeding US$540 billion.
In the second quarter of 2014, software and software-related service revenue (non-IFRS) was €3,480 million (Q2 2013: €3,347 million), an increase of 4%. On a constant currency basis, the increase was 8%.
Non-IFRS total revenue in the same period was €4,153 million (Q2 2013: €4,091 million), an increase of 2%. On a constant currency basis, the increase was 5%.
Our prior-year non-IFRS operating expense, operating profit, operating margin, and profit after tax have been adjusted for the Versata litigation expenses to comply with the modified set of non-IFRS adjustments.
| | |
| 12 | | INTERIM MANAGEMENT REPORT |
Non-IFRS operating expense in the second quarter of 2014 stayed constant at €2,917 million compared to the same period in the prior year (Q2 2013: €2,905 million). On a constant currency basis, non-IFRS operating expense increased by 5%.
Non-IFRS operating profit was €1,236 million (Q2 2013: €1,186 million), an increase of 4% (7% at constant currencies).
Non-IFRS operating margin in the second quarter of 2014 was 29.8%, an increase of 0.8 percentage points (Q2 2013: 29.0%). Non-IFRS operating margin on a constant currency basis was 29.5%, an increase of 0.6 percentage points.
In the second quarter of 2014, non-IFRS profit after tax was €938 million (Q2 2013: €850 million), an increase of 10%. Non-IFRS basic earnings per share was €0.79 (Q2 2013: €0.71), an increase of 10%.
The non-IFRS effective tax rate in the second quarter of 2014 was 25.4% (Q2 2013: 26.8%). The year-over-year decrease in the effective tax rate mainly resulted from tax effects relating to intercompany financing, changes in foreign currency exchange rates, and the repeal of the minimum taxation in Mexico, which were partly compensated by changes in taxes for prior years and in the regional allocation of income.
Key Figures — SAP Group in the First Half of 2014 (Non-IFRS)
| | | | | | | | | | | | | | | | |
€ millions, unless
otherwise stated | | 1/1/ -
6/30/2014 | | | 1/1/ -
6/30/2013 | | | Change
in % | | | Non-IFRS
Change in %
(Constant
Currency) | |
Cloud subscriptions and support | | | 463 | | | | 350 | | | | 32 | | | | 38 | |
Software | | | 1,581 | | | | 1,638 | | | | –4 | | | | 1 | |
Support | | | 4,495 | | | | 4,295 | | | | 5 | | | | 9 | |
Software and software-related service revenue | | | 6,538 | | | | 6,284 | | | | 4 | | | | 8 | |
Total revenue | | | 7,854 | | | | 7,727 | | | | 2 | | | | 6 | |
Operating expense | | | –5,699 | | | | –5,639 | | | | 1 | | | | 5 | |
Operating profit | | | 2,155 | | | | 2,088 | | | | 3 | | | | 7 | |
Operating margin (in %) | | | 27.4 | | | | 27.0 | | | | 0.4pp | | | | 0.3pp | |
Profit after tax | | | 1,604 | | | | 1,539 | | | | 4 | | | | NA | |
Effective tax rate (in %) | | | 25.6 | | | | 24.5 | | | | 1.2pp | | | | NA | |
Earnings per share, basic (in €) | | | 1.34 | | | | 1.29 | | | | 4 | | | | NA | |
Deferred cloud subscriptions and support revenue (June 30) | | | 448 | | | | 361 | | | | 24 | | | | 29 | |
Actual Performance in the First Half of 2014 (Non-IFRS)
In the first half of 2014, our revenue from cloud subscriptions and support (non-IFRS) was €463 million (first half of 2013: €350 million), an increase of 32% (38% at constant currencies) compared to the same period in 2013. Our cloud subscriptions and support margin was down 5.5 percentage points to 67%. This decrease was primarily due to the ramp-up of the Cloud Infrastructure Delivery to reflect the increasing customer demand. For more information on the contribution of Fieldglass to the cloud subscription and support revenue, see Report on Economic Position, Actual Performance in the Second Quarter of 2014 (Non-IFRS).
In the first half of 2014, software and software-related service revenue (non-IFRS) was €6,538 million (first half of 2013: €6,284 million), an increase of 4%. On a constant currency basis, the increase was 8%.
Non-IFRS total revenue in the same period was €7,854 million (first half of 2013: €7,727 million), an increase of 2%. On a constant currency basis, the increase was 6%.
Our prior-year non-IFRS operating expense, operating profit, operating margin, and profit after tax have been adjusted for the Versata litigation expenses to comply with the modified set of non-IFRS adjustments.
Non-IFRS operating expense in the first half of 2014 was €5,699 million (first half of 2013: €5,639 million), an increase of 1%. On a constant currency basis, the increase was 5%.
| | |
| INTERIM REPORT JANUARY – JUNE 2014 | | 13 |
Non-IFRS operating profit was €2,155 million (first half of 2013: €2,088 million), an increase of 3% (7% at constant currencies).
Non-IFRS operating margin in the first half of 2014 was 27.4%, an increase of 0.4 percentage points (first half of 2013: 27.0%). Non-IFRS operating margin on a constant currency basis was 27.4%, an increase of 0.3 percentage points.
In the first half of 2014, non-IFRS profit after tax was €1,604 million (first half of 2013: €1,539 million), an increase of 4%. Non-IFRS basic earnings per share was €1.34 (first half of 2013: €1.29), an increase of 4%.
The non-IFRS effective tax rate in the first half of 2014 was 25.6% (first half of 2013: 24.5%). The year-over-year increase in the effective tax rate mainly resulted from changes in taxes for prior years and in the regional allocation of income which were partly compensated by tax effects relating to intercompany financing, changes in foreign currency exchange rates, and the repeal of the minimum taxation in Mexico.
| | |
| 14 | | INTERIM MANAGEMENT REPORT |
Key Figures — SAP Group in the Second Quarter of 2014 (IFRS)
| | | | | | | | | | | | | | | | |
€ millions, unless otherwise stated | | 4/1/ -
6/30/2014 | | | 4/1/ -
6/30/2013 | | | Change | | | Change
in % | |
Cloud subscriptions and support | | | 241 | | | | 159 | | | | 82 | | | | 52 | |
Software | | | 957 | | | | 982 | | | | –24 | | | | –2 | |
Support | | | 2,279 | | | | 2,177 | | | | 102 | | | | 5 | |
Software and software-related service revenue | | | 3,478 | | | | 3,318 | | | | 160 | | | | 5 | |
Total revenue | | | 4,151 | | | | 4,062 | | | | 89 | | | | 2 | |
Operating expense | | | –3,453 | | | | –3,074 | | | | –379 | | | | 12 | |
Operating profit | | | 698 | | | | 988 | | | | –291 | | | | –29 | |
Operating margin (in %) | | | 16.8 | | | | 24.3 | | | | –7.5pp | | | | NA | |
Profit after tax | | | 556 | | | | 724 | | | | –168 | | | | –23 | |
Effective tax rate (in %) | | | 22.6 | | | | 24.8 | | | | –2.2pp | | | | NA | |
Headcount (average first six months) | | | 67,008 | | | | 64,756 | | | | 2,252 | | | | 3 | |
Days sales outstanding in days (June 30) | | | 64 | | | | 62 | | | | 2 | | | | 3 | |
Earnings per share, basic (in €) | | | 0.47 | | | | 0.61 | | | | –0.14 | | | | –23 | |
Deferred cloud subscriptions and support revenue (June 30) | | | 445 | | | | 354 | | | | 91 | | | | 26 | |
OPERATING RESULTS IN THE SECOND QUARTER (IFRS)
Orders
The total number of completed transactions for on-premise software in the second quarter of 2014 decreased 5% year on year to 13,213 (Q2 2013: 13,936). In contrast, the average value of software orders received for on-premise software deals increased 10% compared to the year before. Of all our software orders received in the second quarter of 2014, 21% were attributable to deals worth more than €5 million (Q2 2013: 14%), while 47% were attributable to deals worth less than €1 million (Q2 2013: 51%).
Revenue
Our revenue from cloud subscriptions and support was €241 million (Q2 2013: €159 million), an increase of 52% compared to the same period in 2013. Deferred cloud subscriptions and support revenue was €445 million on June 30, 2014 (June 30, 2013: €354 million). For more information on the contribution of Fieldglass to the cloud subscription and support revenue and deferred revenue, see Report on Economic Position, Actual Performance in the Second Quarter of 2014 (Non-IFRS). The numbers mentioned are identical, both on an IFRS and non-IFRS basis.
Our annual cloud revenue run rate is €1,181 million. Calculated cloud billings increased 39% year-over-year.
In the second quarter of 2014, software revenue was €957 million (Q2 2013: €982 million), a decrease of 2% compared to the same period in 2013.
Total revenue was €4,151 million (Q2 2013: €4,062 million), an increase of 2% compared to the same period in 2013.
Operating Expense
In the second quarter of 2014, our operating expense increased 12% to €3,453 million (Q2 2013: €3,074 million). A main driver of this increase were the expenses resulting from recognizing a provision for the Versata litigation in the amount of €289 million. In contrast, the respective operating expense from the second quarter of 2013 decreased as we reversed the then-existing provision of €33 million in response to the United States Patent and Trademark Office (USPTO) decision to cancel the disputed patent. For more information about this litigation, see the Notes to the Interim Financial Statements section, Note (16).
Operating Profit and Operating Margin
In the second quarter of 2014, operating profit decreased 29% compared with the same period in the previous year to €698 million (Q2 2013: €988 million). The decrease was mainly due to the expenses from recognizing a provision for the Versata litigation.
Our operating margin decreased by 7.5 percentage points to 16.8% (Q2 2013: 24.3%). The expenses from recognizing a provision for the Versata litigation had a 7.0 percentage point negative effect on our operating margin in the second quarter of 2014 (Q2 2013: 0.8 percentage point positive effect).
Profit After Tax and Earnings per Share
In the second quarter of 2014, profit after tax was €556 million (Q2 2013: €724 million), a decrease of
| | |
| INTERIM REPORT JANUARY – JUNE 2014 | | 15 |
23%. Basic earnings per share was €0.47 (Q2 2013: €0.61), a decrease of 23%. The year-over-year decrease was mainly driven by the expenses from recognizing a provision for the Versata litigation.
The effective tax rate in the second quarter of 2014 was 22.6% (Q2 2013: 24.8%). The year-over-year decrease in the effective tax rate mainly resulted from tax effects relating to intercompany financing, changes in foreign currency exchange rates and the repeal of the minimum taxation in Mexico which were partly compensated by changes in taxes for prior years and in the regional allocation of income.
Key Figures — SAP Group in the First Half of 2014 (IFRS)
| | | | | | | | | | | | | | | | |
€ millions, unless otherwise stated | | 1/1/ -
6/30/2014 | | | 1/1/ -
6/30/2013 | | | Change | | | Change
in % | |
Cloud subscriptions and support | | | 460 | | | | 296 | | | | 164 | | | | 55 | |
Software | | | 1,581 | | | | 1,638 | | | | –58 | | | | –4 | |
Support | | | 4,492 | | | | 4,286 | | | | 206 | | | | 5 | |
Software and software-related service revenue | | | 6,533 | | | | 6,220 | | | | 313 | | | | 5 | |
Total revenue | | | 7,849 | | | | 7,663 | | | | 186 | | | | 2 | |
Operating expense | | | –6,428 | | | | –6,029 | | | | –400 | | | | 7 | |
Operating profit | | | 1,421 | | | | 1,634 | | | | –214 | | | | –13 | |
Operating margin (in %) | | | 18.1 | | | | 21.3 | | | | –3.2pp | | | | NA | |
Profit after tax | | | 1,090 | | | | 1,244 | | | | –154 | | | | –12 | |
Effective tax rate (in %) | | | 23.4 | | | | 21.5 | | | | 1.9pp | | | | NA | |
Earnings per share, basic (in €) | | | 0.91 | | | | 1.04 | | | | –0.13 | | | | –12 | |
Deferred cloud subscriptions and support revenue (June 30) | | | 445 | | | | 354 | | | | 91 | | | | 26 | |
OPERATING RESULTS IN THE FIRST HALF (IFRS)
Orders
The total number of On-Premise software deals we closed decreased by 3% from the comparator amount in the first half of 2014 to 25,084 (first half of 2013: 25,923). In contrast, the average value of On-Premise software orders we received remained stable compared with the previous year. In the first half of 2014, 18% (first half of 2013: 17%) of the value of new software orders came from orders whose volume exceeded €5 million, while 50% (first half of 2013: 50%) came from orders worth less than €1 million.
Revenue
Our revenue from cloud subscriptions and support was €460 million (first half of 2013: €296 million), an increase of 55% compared to the same period in 2013. For more information on the contribution of Fieldglass to the cloud subscription and support revenue, see Report on Economic Position, Actual Performance in the Second Quarter of 2014 (Non-IFRS). The numbers mentioned are identical, both on an IFRS and non-IFRS basis.
In the first half of 2014, software revenue was €1,581 million (first half of 2013: €1,638 million), a decrease of 4% compared to the same period in 2013.
Total revenue was €7,849 million (first half of 2013: €7,663 million), an increase of 2% compared to the same period in 2013.
Operating Expense
In the first half of 2014, our operating expense increased by 7% to €6,428 million (first half of 2013: €6,029 million). A main driver of this increase were the expenses resulting from recognizing a provision for the Versata litigation in the amount of €289 million. In contrast, the respective operating expense from the first half of 2013 decreased as we reversed the then-existing provision of €32 million in response to the United States Patent and Trademark Office (USPTO) decision to cancel the disputed patent. For more information about this litigation, see the Notes to the Interim Financial Statements section, Note (16).
Operating Profit and Operating Margin
In the first half of 2014, operating profit decreased by 13% compared with the same period in the previous
| | |
| 16 | | INTERIM MANAGEMENT REPORT |
year to €1,421 million (first half of 2013: €1,634 million). The decrease was mainly due to the expenses from recognizing a provision for the Versata litigation.
Our operating margin decreased by 3.2 percentage points to 18.1% (first half of 2013: 21.3%). The expenses from recognizing a provision for the Versata litigation had a 3.7 percentage point negative effect on our operating margin in the first half of 2014 (first half of 2013: 0.4 percentage point positive effect).
Profit After Tax and Earnings per Share
In the first half of 2014, profit after tax was €1,090 million (first half of 2013: €1,244 million), a decrease of 12%. Basic earnings per share was €0.91 (first half of 2013: €1.04), a decrease of 12%. The year-over-year decrease was mainly driven by the expenses from recognizing a provision for the Versata litigation.
The effective tax rate in the first half of 2014 was 23.4% (first half of 2013: 21.5%). The year-over-year increase in the effective tax rate mainly resulted from changes in taxes for prior years and in the regional allocation of income which were partly compensated by tax effects relating to intercompany financing, changes in foreign currency exchange rates and the repeal of the minimum taxation in Mexico.
| | |
| INTERIM REPORT JANUARY – JUNE 2014 | | 17 |
FINANCES (IFRS)
Cash Flow and Liquidity
Operating cash flow for the first half of 2014 was €2,575 million (first half of 2013: €2,482 million). Thus, our consistently strong operating cash flow increased 4% over the same period in the previous year, marking SAP’s highest ever operating cash flow for the first half of a year.
Group liquidity stood at €3,180 million on June 30, 2014 (December 31, 2013: €2,841 million). Group liquidity comprised cash and cash equivalents totaling €3,123 million (December 31, 2013: €2,748 million) and current investments totaling €57 million (December 31, 2013: €93 million).
Group Liquidity of SAP Group
| | | | | | | | | | | | |
€ millions | | 6/30/
2014 | | | 12/31/
2013 | | | Change | |
Cash and cash equivalents | | | 3,123 | | | | 2,748 | | | | 375 | |
Current investments | | | 57 | | | | 93 | | | | –36 | |
Group liquidity, gross | | | 3,180 | | | | 2,841 | | | | 339 | |
Current financial debt | | | 500 | | | | 586 | | | | –86 | |
Net liquidity 1 | | | 2,680 | | | | 2,255 | | | | 425 | |
Non-current financial debt | | | 3,740 | | | | 3,722 | | | | 18 | |
Net liquidity 2 | | | –1,060 | | | | –1,467 | | | | 407 | |
Net liquidity 1 is total group liquidity minus current financial debt. It increased on a year-to-date basis by €425 million to €2,680 million.
Net liquidity 2, defined as net liquidity 1 minus non-current financial debt, was –€1,060 million (December 31, 2013: –€1,467 million).
Financial debt consists of current and non-current bonds and private placements. For more information about our financial debt, see the Notes to the Consolidated Interim Financial Statements section, Note (12).
Free Cash Flow and Days’ Sales Outstanding (DSO)
Our free cash flow and our DSO on June 30, 2014, were as follows:
Free Cash Flow
| | | | | | | | | | | | |
€ millions | | 1/1 -
6/30/ 2014 | | | 1/1 -
6/30/ 2013 | | | Change
in % | |
Free cash flow | | | 2,271 | | | | 2,217 | | | | 2 | |
We calculate free cash flow as net cash from operating activities minus purchases of intangible assets and property, plant, and equipment.
Days’ Sales Outstanding
| | | | | | | | | | | | |
| | | 6/30/
2014 | | | 6/30/
2013 | | | Change
in Days | |
Days’ sales outstanding (DSO) in days | | | 64 | | | | 62 | | | | 2 | |
Days’ sales outstanding (DSO) for receivables, defined as average number of days from the raised invoice to cash receipt from the customer, was 64 days, a 2-day increase year over year.
ASSETS (IFRS)
Analysis of Consolidated Statements of Financial Position
The total assets of the Group were €28,226 million on June 30, 2014, an increase of €1,137 million since December 31, 2013, resulting mainly from an increase in goodwill out of the Fieldglass acquisition.
The equity ratio on June 30, 2014, was 57% (December 31, 2013: 59%), a slight decrease.
Investments
Investments in intangible assets and property, plant, and equipment were €1,051 million in the first half year of 2014, which increased by €705 million compared to the first half of 2013 (€346 million) due to the Fieldglass acquisition.
Off-Balance-Sheet Financial Instruments
There are no off-balance-sheet financial instruments, such as sale-and-lease-back transactions, asset-backed securities, or liabilities related to structured entities, that are not disclosed in our interim Consolidated Financial Statements.
Competitive Intangibles
The assets that are the basis for our current and future success do not appear on the Consolidated Statements of Financial Position. This is apparent from a comparison of the market capitalization of SAP SE, which was €69.3 billion, with the equity of the SAP Group on the Consolidated Statements of Financial Position, which was €16.2 billion on June 30, 2014 (December 31, 2013: €16.0 billion). This means that the market capitalization of our equity is more than four times higher than the book value.
Customer capital, our employees and their knowledge and skills, our ecosystem of partners, the SAP brand, and our past investments in
| | |
| 18 | | INTERIM MANAGEMENT REPORT |
research and development are some of the most important competitive intangibles that influence our market value.
According to the 2013 Interbrand annual survey of the Top 100 Best Global Brands, SAP is ranked the 25th most valued brand in the world. Interbrand determined a value of US$16.7 billion.
ENERGY CONSUMPTION AND GREENHOUSE GAS EMISSIONS
Over the past several years, we have worked to better understand the connections between our energy consumption, its related cost, and the resulting environmental impact. Today we measure and address our energy usage throughout SAP, as well as our greenhouse gas emissions across our entire value chain. Between the beginning of 2008 and the end of the second quarter 2014, we calculate that energy efficiency initiatives have contributed to a cumulative cost avoidance of €290 million, compared to a business-as-usual extrapolation.
Moreover, to credibly offer solutions that help our customers better manage their use of resources, we must do so ourselves. By addressing the financial and environmental impact of our energy consumption, we have gained valuable insights to create solutions for our customers.
Our goal is to reduce the greenhouse gas (GHG) emissions from our operations to levels of the year 2000 by 2020. SAP’s GHG emissions for the second quarter 2014 totaled 140 kilotons compared to 145 kilotons in the second quarter of 2013. This decrease is primarily due to additional renewable energy certificates procured. This positive effect was partially offset by an increase in business flights compared to the first quarter of 2014.
As we measure our emissions per employee and per euro of revenue, we gain insight into our efficiency as we grow. Since 2007, we have increased our efficiency according to both measures, lowering our emissions per employee by about 29% and per euro of revenue by about 45% at the end of June 2014 (rolling four quarters).
To further reduce emissions, SAP launched the “SAP E-Fleet” initiative to raise the portion of electric vehicles in its company car fleet to 20% by 2020. In line with its existing policy for office buildings and data centers, SAP will provide the power for its electric company cars solely from 100% renewable sources.
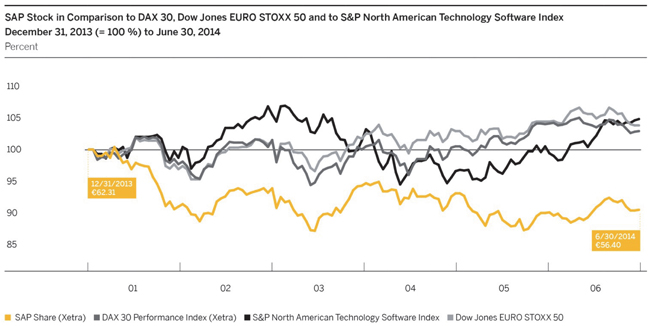
SAP STOCK
SAP SE common stock is listed on the Frankfurt Stock Exchange as well as on a number of other German exchanges. On the New York Stock Exchange (NYSE), SAP American depositary receipts (ADRs), each representing one common share, trade under the symbol SAP. SAP is a component of the DAX (the index of 30 German blue chip companies) and the Dow Jones EURO STOXX 50. We use the S&P North American Technology Software Index for comparison purposes.
Key Facts About SAP Stock / SAP ADRs
| | | | |
Listings | | | | |
Germany | | | Berlin, Frankfurt, Stuttgart | |
United States (ADR) | | | New York Stock Exchange | |
IDs and Symbols | | | | |
WKN/ISIN | | | 716460/DE0007164600 | |
NYSE (ADR) | | | 803054204 (CUSIP | ) |
Reuters | | | SAPG.F or .DE | |
Bloomberg | | | SAP GR | |
Weight (%) in Indices on 6/30/2014 | | | | |
DAX 30 | | | 6.36 | % |
Prime All Share | | | 4.94 | % |
CDAX | | | 5.08 | % |
HDAX | | | 5.21 | % |
Dow Jones STOXX 50 | | | 1.64 | % |
Dow Jones EURO STOXX 50 | | | 2.65 | % |
SAP stock declined 4.0% in the second quarter of 2014, whereas the two major benchmark indexes rose slightly: The DAX 30 gained 2.9%, surpassing the 10,000 point mark for the first time in June, while the EURO STOXX 50 increased 2.1%. In the first half of the year SAP stock declined 10%.
SAP stock started the second quarter at €58.76, the Xetra closing price on March 31, and reached its quarter peak of €59.15 on April 4. The share price remained at a level between €57.50 and €58.00 after publication of the first-quarter results on April 17 before the Ukraine crisis subdued the mood of the stock markets.
The announcement of personnel changes on the SAP Executive Board as well as the ex-dividend markdown after the Annual General Meeting of Shareholders – at which SAP shareholders approved a dividend of €1.00 per share – put additional pressure on SAP stock during this period: It reached €54.41, its low point of the quarter, on May 22. At the same time, the benchmark indexes
| | |
| INTERIM REPORT JANUARY – JUNE 2014 | | 19 |
benefited from new records on the U.S. stock markets and hopes that the European Central Bank (ECB) would further loosen its monetary policy. ECB lived up to these expectations, and in response the DAX soared past the 10,000 point mark for the first time on June 9. SAP stock, meanwhile, climbed to €57.60 on June 19, bolstered by the general stock market mood and positive resonance to SAP’s user conference SAPPHIRE NOW. At the end of the month, however, escalating tensions in Ukraine and in Iraq and news of disappointing economic data from the United States weighed on market sentiment, causing SAP stock to close the second quarter at €56.40.
Capital Stock
SAP’s capital stock on June 30, 2014, was €1,228,504,232 (December 31, 2013: €1,228,504,232). It is issued as 1,228,504,232 no-par shares, each with an attributable value of €1 in relation to the capital stock.
Free Float
On June 30, 2014, the proportion of our stock in free float, applying the definition accepted on the Frankfurt Stock Exchange – which excludes treasury stock from the free float – stood at 74.5% (December 31, 2013: 74.7%).
Market Capitalization
With the Xetra closing price at €56.40 on the last trading day in the first half of the year, SAP’s market capitalization was €69.3 billion based on 1,228,504,232 million outstanding shares. SAP was therefore the fifth largest DAX company based on market capitalization.
Deutsche Börse uses the free-float factor to weight companies in the DAX. Based on a free-float factor of 74.5%, this results in a free-float market capitalization of approximately €51.6 billion. When measured by its free-float market capitalization, SAP was the sixth-largest company listed on the DAX at the end of the second quarter.
For more information about SAP common stock, see the SAP Web site at www.sap.com/investor.
| | |
| 20 | | INTERIM MANAGEMENT REPORT |
RISK AND OPPORTUNITY MANAGEMENT
We have comprehensive risk-management structures in place, which are intended to enable us to recognize and analyze risks early and to take the appropriate action. For changes in our legal liability risks since our last annual report, see Note 16 in the Notes to the Interim Financial Statements. The other risk factors remain largely unchanged since 2013, and are discussed more fully in our 2013 Integrated Report and our Annual Report on Form 20-F for 2013. We do not believe the risks we have identified jeopardize our ability to continue as a going concern. Opportunities also remain largely unchanged since 2013.
SUPPLEMENTARY REPORT
On July 7, 2014, the conversion of the legal form of the company from an AG to a European Company (Societas Europaea, SE) took effect with the registration in the commercial register.
REPORT ON EXPECTED DEVELOPMENTS
Future Trends in the Global Economy
The economists at the European Central Bank (ECB) expect the global economy to continue to grow gradually for the remainder of 2014. They believe that domestic demand will increase in industrialized economies and that economic recovery in the rest of the world will benefit from this. However, the ECB also predicts that structural factors such as capacity bottlenecks will hold back some of the emerging economies. Overall, it anticipates the global growth momentum will shift in favor of industrialized economies.
In the Europe, Middle-East, and Africa (EMEA) region, the ECB predicts an increase in euro area GDP of 1% in 2014, which is slightly lower than its earlier projection. For 2015, the analysts see higher-than-projected growth. In Central and Eastern Europe, the ECB believes the economy will strengthen as the year progresses, despite the Ukraine crisis.
The ECB also sees positive economic trends in the Americas region: It expects the U.S. economy to grow considerably in the remainder of 2014 thanks to a faster recovery. It also believes growth in Latin America will pick up gradually by the end of the year, yet remain below the high levels of previous years.
In the Asia Pacific Japan (APJ) region, the ECB expects the Japanese economy to return to a moderate growth level in the second half of 2014. In China, the experts believe growth will stabilize in the coming months.
Economic Trends – Year Over Year GDP Growth
| | | | | | | | | | | | |
% | | | | | | | | | | | | |
World | | | 2013e | | | | 2014p | | | | 2015p | |
World | | | 3.0 | | | | 3.6 | | | | 3.9 | |
Advanced economies | | | 1.3 | | | | 2.2 | | | | 2.3 | |
Developing and emerging economies | | | 4.7 | | | | 4,9 | | | | 5.3 | |
Europe, the Middle East, and Africa (EMEA) | | | | | | | | | | | | |
Euro area | | | –0.5 | | | | 1.2 | | | | 1.5 | |
Germany | | | 0.5 | | | | 1.7 | | | | 1.6 | |
Central and Eastern Europe | | | 2.8 | | | | 2.4 | | | | 2,9 | |
Middle East and North Africa | | | 2.4 | | | | 3.2 | | | | 4.4 | |
Sub-Saharan Africa | | | 4.9 | | | | 5.4 | | | | 5.5 | |
Americas | | | | | | | | | | | | |
United States | | | 1.9 | | | | 2.8 | | | | 3.0 | |
Canada | | | 2.0 | | | | 2.3 | | | | 2.4 | |
Central and South America, Caribbean | | | 2.7 | | | | 2.5 | | | | 3.0 | |
Asia Pacific Japan (APJ) | | | | | | | | | | | | |
Asian developing economies | | | 6.5 | | | | 6.7 | | | | 6.8 | |
Japan | | | 1.5 | | | | 1.4 | | | | 1.0 | |
China | | | 7.7 | | | | 7.5 | | | | 7.3 | |
e = Estimate; p = Projection
Source: International Monetary Fund (IMF), World Economic Outlook April 2014, Recovery Strengthens, Remains Uneven, as of April 3, 2014, p. 18.
IT Market: The Outlook for 2014
According to International Data Corporation (IDC), a market research firm based in the United States, the global IT market will develop positively in 2014: As more and more companies in industrialized economies replace outdated technology and make greater use of IT services, IT markets in emerging countries could stabilize as well. However, IDC predictions of low mobile market growth remain unchanged. IDC therefore estimates the IT market will expand 4.1% in 2014 and thus more rapidly than the overall economy. The software segment is expected to grow even by 6.1%.
In the Europe, Middle East, and Africa (EMEA) region, the Western European market for IT could grow 2%, in IDC’s view. However, the analysts also anticipate that the Ukraine crisis will impact the Russian IT market, with an expected decline of almost 1% in 2014, impacting other Central and Eastern European economies in the process.
In the Americas region, IDC estimates the U.S. IT market will expand by 8% in the software segment
| | |
| INTERIM REPORT JANUARY – JUNE 2014 | | 21 |
and by more than 2% in the IT services segment. The IT market in Latin America, meanwhile, is forecast to expand 8.8% in 2014.
IDC expects market activity in the Asia Pacific Japan (APJ) region to be more subdued: It believes the Japanese IT market could decline by approximately 1% in 2014, and that barring further economic difficulties, growth not exceeding 10% is possible on the Chinese IT market.
Trends in the IT Market – Increased IT Spending Year-Over-Year
| | | | | | | | | | | | |
% | | | | | | | | | | | | |
World | | | 2013e | | | | 2014p | | | | 2015p | |
Total IT | | | 4.5 | | | | 4.1 | | | | 4.5 | |
Hardware | | | 4.8 | | | | 3.8 | | | | 4.2 | |
Packaged software | | | 7.1 | | | | 6.1 | | | | 6.5 | |
Applications | | | 6.8 | | | | 5.8 | | | | 6.1 | |
IT services | | | 2.4 | | | | 3.4 | | | | 3.7 | |
Europe, Middle East, Africa (EMEA) | | | | | | | | | | | | |
IT total | | | 2.3 | | | | 2.4 | | | | 3.2 | |
Packaged software | | | 4.7 | | | | 4.9 | | | | 5.4 | |
Applications | | | 4.5 | | | | 4.6 | | | | 5.1 | |
IT services | | | 1.2 | | | | 2.9 | | | | 3.5 | |
Americas | | | | | | | | | | | | |
IT total | | | 5.5 | | | | 4.7 | | | | 4.9 | |
Packaged software | | | 8.5 | | | | 6.8 | | | | 7.1 | |
Applications | | | 8.2 | | | | 6.4 | | | | 6.6 | |
IT services | | | 2.7 | | | | 3.1 | | | | 3.1 | |
Asia Pacific Japan | | | | | | | | | | | | |
IT total | | | 5.5 | | | | 5.2 | | | | 5.4 | |
Packaged software | | | 7.1 | | | | 6.2 | | | | 6.6 | |
Applications | | | 6.5 | | | | 6.0 | | | | 6.3 | |
IT services | | | 4.0 | | | | 5.0 | | | | 5.6 | |
e = Estimate, p = Projection
Source: IDC Worldwide Black Book Q1 2014
Impact on SAP
Organizations around the world are now entering a new era of business model innovation, made possible by the convergence of cloud, mobile, social, and in-memory technologies.
However, businesses often contend with layers of IT complexity that have been built up over the decades. This complexity is the result of several factors, including the proliferation of hardware and custom applications. In addition, customers are not able to respond fast enough to changing market conditions due to the complexity of the current consumption model.
In today’s technology industry, the biggest winners have grown by offering simplicity across their entire business model. For technology companies in particular, this has yielded massive user adoption in very short time frames resulting in market success.
We believe that simplicity is the key: By solving the challenge of business complexity, we can help unlock our customers’ innovation potential.
With our focus on simplification, we aim to better innovate and grow.
By offering our entire portfolio in the SAP Cloud powered by SAP HANA, we will focus our simplification on three areas – simplifying our consumption model, our portfolio, and user experience.
With the SAP HANA platform, we have an opportunity to simplify our product portfolio and IT landscape for our customers. SAP HANA can radically simplify enterprise applications as it collapses the entire IT stack. With SAP HANA Cloud Platform, we have the ability to take our core on-premise applications to the cloud and offer a choice of cloud deployments to our customers.
In addition, we will also simplify our business model through end-to-end delivery of industry-specific solutions that can drive business value and outcomes. We will continue to build an open ecosystem and our partner network to deliver SAP Cloud powered by SAP HANA on their cloud infrastructure. Our ecosystem will play a vital role in building new solutions on the SAP HANA platform and delivering value to our customers.
By investing in innovations and shifting our customers to a cloud business model, we will be able to help reduce their total cost of ownership (TCO) on IT. This enables customers to reinvest the TCO savings in innovations and SAP could capture a higher share of customer IT spend.
Emerging markets will continue to be a growth driver, with high double-digit growth in software and cloud revenues expected through 2017. In addition to our investments in China, Russia (subject to close observation of the further political and economic developments in Russia), and the Middle East, we are expanding our investments in Africa.
Overall, we expect to have sufficient future growth potential helping us to reach our 2014 outlook targets and medium-term aspirations, which extend beyond 2015 and into 2017. Thus, SAP expects to outperform, with regard to non-IFRS software and software-related service revenue at constant currencies, the global economy and the IT industry
| | |
| 22 | | INTERIM MANAGEMENT REPORT |
in 2014, as long as they develop as currently forecasted. For more information, see the Operational Targets for 2014 (Non-IFRS) section.
Forecast for SAP
Operational Targets for 2014 (Non-IFRS)
Revenue and Operating Profit Outlook
As we continue to expand our cloud business, the Executive Board adjusted the full year outlook for cloud subscriptions and support revenue as follows:
The Company now expects full year 2014 non-IFRS cloud subscriptions and support revenue to be in a range of €1,000 – €1,050 million (previously: €950 – €1,000 million) at constant currencies (2013: €757 million). The upper end of this range represents a growth rate of 39%.
The Company continues to expect full year 2014 non-IFRS software and software-related service revenue to increase by 6% – 8% at constant currencies (2013: €14.03 billion).
The Company continues to expect full-year 2014 non-IFRS operating profit to be in a range of €5.8 billion – €6.0 billion at constant currencies (2013: €5.48 billion).
While the Company’s full-year 2014 business outlook is at constant currency, actual currency reported figures are expected to continue to be negatively impacted by currency exchange rate fluctuations. If exchange rates remain at the June 2014 level for the rest of the year, the Company expects non-IFRS software and software-related service revenue and non-IFRS operating profit growth rates at actual currency to experience a negative currency impact of approximately 2 percentage points and 2 percentage points respectively for the third quarter of 2014 and of approximately 2 percentage points and 2 percentage points respectively in the full year 2014.
The above mentioned indication for the expected currency exchange rate impact on actual currency reported figures replaces the earlier indication disclosed on April 17, 2014 in our Interim Report January – March 2014.
We expect that total revenue growth (non-IFRS) will continue to depend largely on the revenue from software and software-related services. However, the revenue growth we expect from this is below the outlook provided for cloud subscriptions and support revenue (non-IFRS).
We expect our cloud subscriptions and support margin (non-IFRS) to improve in the second half of 2014 compared to the first half of 2014 (first half of 2014: 67%).
Differences Between IFRS and Non-IFRS Measures
As noted above, our guidance is based on non-IFRS measures at constant currencies. The following provides additional insight into the impact of the constant currency notion and the items by which our IFRS measures and non-IFRS measures differ.
The following table shows the estimates of the items that represent the differences between our non-IFRS financial measures and our IFRS financial measures.
Non-IFRS Measures
| | | | | | | | | | | | |
€ millions | | Estimated
amounts
for 1/1 –
12/31/20141) | | | Actual
Amounts
from 1/1 –
6/30/2014 | | | Actual
Amounts
from 1/1 –
6/30/2013 | |
Deferred revenue write-down | | | <20 | | | | 5 | | | | 64 | |
Discontinued activities2) | | | < 10 | | | | 1 | | | | 0 | |
Versata Litigation2) | | | 289 | | | | 289 | | | | –32 | |
Share-based payment expenses3),4) | | | 320 to 360 | | | | 124 | | | | 109 | |
Acquisition-related charges5) | | | 520 to 560 | | | | 261 | | | | 283 | |
Restructuring | | | 100 to 150 | | | | 54 | | | | 31 | |
| 1) | All adjusting items are partly incurred in currencies other than the euro. Consequently, the amounts are subject to currency volatility. All estimates for 2014 provided in the table are at actual currency and are calculated based on certain assumptions regarding the developments of the different currency exchange rates. Depending on the future development of these exchange rates, the total amounts for 2014 may differ significantly from the estimates provided in the table above. The reader should remember that SAP’s outlook is based on constant currency. |
| 2) | We will consider all new information that emerges from further developments of the TomorrowNow and Versata litigation to determine if the provision should be adjusted in the future, which could result in a change to the respective estimate provided in the table above. |
| 3) | Our share-based payment expenses are subject, among other factors, to share price volatility, anticipated achievement of financial KPI objectives, and fluctuations in SAP’s workforce. The estimates in the table above are based on certain assumptions regarding these factors. Depending on how these factors change in the future, the total expense for 2014 may differ significantly from these estimates. |
| | |
| INTERIM REPORT JANUARY – JUNE 2014 | | 23 |
| 4) | The estimates provided above for share-based compensation expenses include grants under existing programs. New share-based compensation plans or changes to the existing plans may make the total amounts for 2014 differ significantly from these estimates. |
| 5) | The estimates provided above for acquisition-related charges are based on the acquisitions performed by SAP until the day of this document. Further acquisitions may make the total amounts for 2014 differ significantly from these estimates. |
The company expects a full-year 2014 effective tax rate (IFRS) of 26.0% to 27.0% (2013: 24.4%) and an effective tax rate (non-IFRS) of 27.5% to 28.5% (2013: 25.9%).
Goals for Liquidity, Finance, Investments, and Dividends
Our goals for liquidity, finance, investments, and dividends as discussed in our 2013 Integrated Report have changed as follows:
On June 30, 2014, we had a negative net liquidity. We believe that our liquid assets combined with our undrawn credit facilities are sufficient to meet our present operating financing needs also in the second half of 2014 and, together with expected cash flows from operations, will support our currently planned capital expenditure requirements over the near term and medium term. We reduced our financial debt by €586 million in the second quarter as intended, and currently expect to have repaid the €500 million acquisition term loan in respect of the Fieldglass acquisition by the end of the first quarter of 2015 at the latest. We will consider issuing new debt, such as bonds or U.S. private placements, on an as-needed basis only and if market conditions are advantageous. By the time of this report, we have no concrete plans for future share buybacks.
Excepting acquisitions, our planned capital expenditures for 2014 and 2015 can be covered in full by operating cash flow. They will mainly be spent on property improvements planned in Bangalore (India), Beijing (China), New York City (United States), Paris (France), Potsdam (Germany), and Ra’anana (Israel) and on increasing our data center capacity in Newtown Square (United States) and St. Leon-Rot (Germany).
We plan to continue our dividend policy, which is that the payout ratio should be more than 30%.
Premises on Which Our Outlook Is Based
In preparing our outlook guidance, we have taken into account all events known to us at the time we prepared this report that could influence SAP’s business going forward. Among the premises on which this outlook is based are those presented concerning economic development. This outlook does not take into consideration any effects in 2014 from major acquisitions.
Medium-Term Prospects
Our medium-term prospects as discussed in our 2013 Integrated Report and our 2013 Annual Report on Form 20-F did not change in the first six months of 2014. We continue to strive to increase our total revenue to more than €20 billion by 2015 and revenue from our cloud business, including cloud-related professional services, to approximately €2 billion by 2015.
Looking beyond 2015, we introduced new 2017 targets. We now aim to increase total revenue to at least €22 billion and revenue from our cloud business to €3.0 to €3.5 billion by 2017. We have retained our non-IFRS operating margin goal of 35%. To capture the growth opportunities in the cloud, we now expect this target to be reached by 2017 rather than in 2015 as previously stated. We anticipate the fast-growing cloud business along with growth in support revenue will drive a higher proportion of more predictable, recurring revenue in the future.
In addition to our financial goals, we also focus on two non-financial targets: Customer loyalty and employee engagement. We believe it is essential that our employees are engaged, drive our success, and support our strategy. Therefore, we plan to increase our employee engagement index score to 82% by 2015 (2013: 77%). Further, our customers’ satisfaction with the solutions we offer is very important to us. We want our customers to not only be satisfied, but also see us as a trusted partner for innovation. We measure this customer loyalty metric using the Net Promoter Score (NPS). For 2014, we have set a target for increasing the NPS by four percentage points (2013: 12.1%).
| | |
| 24 | | INTERIM MANAGEMENT REPORT |
CONSOLIDATED INTERIM FINANCIAL STATEMENTS – IFRS (Unaudited)
NOTES TO THE CONSOLIDATED INTERIM FINANCIAL STATEMENTS
| | |
| INTERIM REPORT JANUARY – JUNE 2014 | | 25 |
CONSOLIDATED INCOME STATEMENTS OF SAP GROUP – QUARTER
For the three months ended June 30
| | | | | | | | | | | | | | | | |
€ millions, unless otherwise stated | | Note | | | 2014 | | | 2013 | | | Change
in % | |
Cloud subscriptions and support | | | | | | | 241 | | | | 159 | | | | 52 | |
Software | | | | | | | 957 | | | | 982 | | | | –2 | |
Support | | | | | | | 2,279 | | | | 2,177 | | | | 5 | |
Software and support | | | | | | | 3,237 | | | | 3,159 | | | | 2 | |
Software and software-related service revenue | | | | | | | 3,478 | | | | 3,318 | | | | 5 | |
Professional services and other service revenue | | | (5 | ) | | | 673 | | | | 744 | | | | –10 | |
Total revenue | | | | | | | 4,151 | | | | 4,062 | | | | 2 | |
| | | | |
Cost of software and software-related services | | | (6 | ) | | | –698 | | | | –630 | | | | 11 | |
Cost of professional services and other services | | | | | | | –591 | | | | –609 | | | | –3 | |
Total cost of revenue | | | | | | | –1,289 | | | | –1,240 | | | | 4 | |
Gross profit | | | | | | | 2,862 | | | | 2,822 | | | | 1 | |
Research and development | | | | | | | –566 | | | | –567 | | | | 0 | |
Sales and marketing | | | | | | | –1,049 | | | | –1,059 | | | | –1 | |
General and administration | | | | | | | –218 | | | | –232 | | | | –6 | |
Restructuring | | | | | | | –39 | | | | –17 | | | | >100 | |
TomorrowNow and Versata litigation | | | | | | | –289 | | | | 33 | | | | <-100 | |
Other operating income/expense, net | | | | | | | –3 | | | | 9 | | | | <-100 | |
Total operating expenses | | | | | | | –3,453 | | | | –3,074 | | | | 12 | |
Operating profit | | | | | | | 698 | | | | 988 | | | | –29 | |
| | | | |
Other non-operating income/expense, net | | | | | | | 4 | | | | –2 | | | | <-100 | |
Finance income | | | | | | | 47 | | | | 26 | | | | 79 | |
Finance costs | | | | | | | –30 | | | | –49 | | | | –39 | |
Financial income, net | | | | | | | 17 | | | | –23 | | | | <-100 | |
Profit before tax | | | | | | | 719 | | | | 963 | | | | –25 | |
Income tax TomorrowNow and Versata litigation | | | | | | | 76 | | | | –9 | | | | <-100 | |
Other income tax expense | | | | | | | –239 | | | | –230 | | | | 4 | |
Income tax expense | | | (8 | ) | | | –163 | | | | –239 | | | | –32 | |
Profit after tax | | | | | | | 556 | | | | 724 | | | | –23 | |
Profit attributable to non-controlling interests | | | | | | | –1 | | | | 0 | | | | 38 | |
Profit attributable to owners of parent | | | | | | | 557 | | | | 725 | | | | –23 | |
| | | | | | | | | | | | | | | | |
| | | | | | | | | | | | | | | | | |
Earnings per share, basic (in €)* | | | (9 | ) | | | 0.47 | | | | 0.61 | | | | –23 | |
Earnings per share, diluted (in €)* | | | (9 | ) | | | 0.47 | | | | 0.61 | | | | –23 | |
| * | For the three months ended June 30, 2014 and 2013, the weighted average number of shares was 1,194 million (diluted 1,197 million) and 1,193 million (diluted: 1,195million), respectively (treasury stock excluded). |
Due to rounding, numbers may not add up precisely.
| | |
| 26 | | CONSOLIDATED INTERIM FINANCIAL STATEMENTS – IFRS |
CONSOLIDATED STATEMENTS OF COMPREHENSIVE INCOME OF SAP GROUP – QUARTER
Three months ended June 30
| | | | | | | | |
€ millions | | 2014 | | | 2013 | |
Profit after tax | | | 556 | | | | 724 | |
Items that will not be reclassified to profit and loss | | | | | | | | |
Remeasurements on defined benefit pension plans | | | –2 | | | | 5 | |
Income tax relating to items that will not be reclassified | | | 3 | | | | –3 | |
Other comprehensive income after tax for items that will not be reclassified to profit and loss | | | 1 | | | | 2 | |
Items that will be reclassified subsequently to profit and loss | | | | | | | | |
Exchange differences on translation | | | 126 | | | | –319 | |
Available-for-sale financial assets | | | 8 | | | | 5 | |
Cash flow hedges | | | –26 | | | | 18 | |
Income tax relating to items that will be reclassified | | | 14 | | | | –8 | |
Other comprehensive income after tax for items that will be reclassified to profit and loss | | | 122 | | | | –304 | |
Other comprehensive income net of tax | | | 123 | | | | –302 | |
Total comprehensive income | | | 679 | | | | 422 | |
– Attributable to owners of parent | | | 680 | | | | 422 | |
– Attributable to non-controlling interests | | | –1 | | | | 0 | |
Due to rounding, numbers may not add up precisely.
| | |
| INTERIM REPORT JANUARY – JUNE 2014 | | 27 |
CONSOLIDATED INCOME STATEMENTS OF SAP GROUP – HALF-YEAR
For the six months ended June 30
| | | | | | | | | | | | | | | | |
€ millions, unless otherwise stated | | Note | | | 2014 | | | 2013 | | | Change
in % | |
Cloud subscriptions and support | | | | | | | 460 | | | | 296 | | | | 55 | |
Software | | | | | | | 1,581 | | | | 1,638 | | | | –4 | |
Support | | | | | | | 4,492 | | | | 4,286 | | | | 5 | |
Software and support | | | | | | | 6,072 | | | | 5,924 | | | | 3 | |
Software and software-related service revenue | | | | | | | 6,533 | | | | 6,220 | | | | 5 | |
Professional services and other service revenue | | | (5 | ) | | | 1,316 | | | | 1,443 | | | | –9 | |
Total revenue | | | | | | | 7,849 | | | | 7,663 | | | | 2 | |
| | | | |
Cost of software and software-related services | | | (6 | ) | | | –1,343 | | | | –1,234 | | | | 9 | |
Cost of professional services and other services | | | | | | | –1,182 | | | | –1,215 | | | | –3 | |
Total cost of revenue | | | | | | | –2,525 | | | | –2,448 | | | | 3 | |
Gross profit | | | | | | | 5,324 | | | | 5,215 | | | | 2 | |
Research and development | | | | | | | –1,116 | | | | –1,124 | | | | –1 | |
Sales and marketing | | | | | | | –2,016 | | | | –2,034 | | | | –1 | |
General and administration | | | | | | | –423 | | | | –429 | | | | –1 | |
Restructuring | | | | | | | –54 | | | | –31 | | | | 78 | |
TomorrowNow and Versata litigation | | | | | | | –290 | | | | 32 | | | | <-100 | |
Other operating income/expense, net | | | | | | | –4 | | | | 5 | | | | <-100 | |
Total operating expenses | | | | | | | –6,428 | | | | –6,029 | | | | 7 | |
Operating profit | | | | | | | 1,421 | | | | 1,634 | | | | –13 | |
| | | | |
Other non-operating income/expense, net | | | | | | | –7 | | | | –13 | | | | –48 | |
Finance income | | | | | | | 69 | | | | 56 | | | | 24 | |
Finance costs | | | | | | | –61 | | | | –93 | | | | –35 | |
Financial income, net | | | | | | | 9 | | | | –37 | | | | <-100 | |
Profit before tax | | | | | | | 1,423 | | | | 1,584 | | | | –10 | |
Income tax TomorrowNow and Versata litigation | | | | | | | 77 | | | | –9 | | | | <-100 | |
Other income tax expense | | | | | | | –409 | | | | –331 | | | | 23 | |
Income tax expense | | | (8 | ) | | | –332 | | | | –340 | | | | –2 | |
Profit after tax | | | | | | | 1,090 | | | | 1,244 | | | | –12 | |
Profit attributable to non-controlling interests | | | | | | | –1 | | | | 0 | | | | >100 | |
Profit attributable to owners of parent | | | | | | | 1,091 | | | | 1,245 | | | | –12 | |
| | | | | | | | | | | | | | | | |
| | | | | | | | | | | | | | | | | |
Earnings per share, basic (in €)* | | | (9 | ) | | | 0.91 | | | | 1.04 | | | | –12 | |
Earnings per share, diluted (in €)* | | | (9 | ) | | | 0.91 | | | | 1.04 | | | | –12 | |
| * | For the six months ended June 30, 2014 and 2013, the weighted average number of shares was 1,194 million (diluted 1,197million) and 1,193 million (diluted: 1,195million), respectively (treasury stock excluded). |
Due to rounding, numbers may not add up precisely.
| | |
| 28 | | CONSOLIDATED INTERIM FINANCIAL STATEMENTS – IFRS |
CONSOLIDATED STATEMENTS OF COMPREHENSIVE INCOME OF SAP GROUP – HALF-YEAR
For the six months ended June 30
| | | | | | | | |
€ millions | | 2014 | | | 2013 | |
Profit after tax | | | 1,090 | | | | 1,244 | |
Items that will not be reclassified to profit and loss | | | | | | | | |
Remeasurements on defined benefit pension plans | | | 1 | | | | 3 | |
Income tax relating to items that will not be reclassified | | | 1 | | | | –3 | |
Other comprehensive income after tax for items that will not be reclassified to profit and loss | | | 2 | | | | 0 | |
Items that will be reclassified subsequently to profit and loss | | | | | | | | |
Exchange differences on translation | | | 142 | | | | –90 | |
Available-for-sale financial assets | | | 17 | | | | 5 | |
Cash flow hedges | | | –34 | | | | 18 | |
Income tax relating to items that will be reclassified | | | 11 | | | | –2 | |
Other comprehensive income after tax for items that will be reclassified to profit and loss | | | 136 | | | | –69 | |
Other comprehensive income net of tax | | | 138 | | | | –69 | |
Total comprehensive income | | | 1,228 | | | | 1,175 | |
– Attributable to owners of parent | | | 1,229 | | | | 1,175 | |
– Attributable to non-controlling interests | | | –1 | | | | 0 | |
Due to rounding, numbers may not add up precisely.
| | |
| INTERIM REPORT JANUARY – JUNE 2014 | | 29 |
CONSOLIDATED STATEMENTS OF FINANCIAL POSITION OF SAP GROUP
as at June 30, 2014 and December 31, 2013
| | | | | | | | | | | | |
€ millions | | Notes | | | 2014 | | | 2013 | |
Cash and cash equivalents | | | | | | | 3,123 | | | | 2,748 | |
Other financial assets | | | (10 | ) | | | 230 | | | | 251 | |
Trade and other receivables | | | (11 | ) | | | 3,614 | | | | 3,865 | |
Other non-financial assets | | | | | | | 470 | | | | 346 | |
Tax assets | | | | | | | 172 | | | | 142 | |
Total current assets | | | | | | | 7,610 | | | | 7,352 | |
| | | |
Goodwill | | | | | | | 14,380 | | | | 13,684 | |
Intangible assets | | | | | | | 2,907 | | | | 2,956 | |
Property, plant, and equipment | | | | | | | 1,847 | | | | 1,820 | |
Other financial assets | | | (10 | ) | | | 726 | | | | 607 | |
Trade and other receivables | | | (11 | ) | | | 80 | | | | 98 | |
Other non-financial assets | | | | | | | 105 | | | | 107 | |
Tax assets | | | | | | | 192 | | | | 172 | |
Deferred tax assets | | | | | | | 379 | | | | 292 | |
Total non-current assets | | | | | | | 20,616 | | | | 19,736 | |
Total assets | | | | | | | 28,226 | | | | 27,089 | |
as at June 30, 2014 and December 31, 2013
| | | | | | | | | | | | |
€ millions | | Notes | | | 2014 | | | 2013 | |
Trade and other payables | | | | | | | 846 | | | | 850 | |
Tax liabilities | | | | | | | 205 | | | | 433 | |
Financial liabilities | | | (12 | ) | | | 580 | | | | 748 | |
Other non-financial liabilities | | | | | | | 1,616 | | | | 2,263 | |
Provision TomorrowNow and Versata litigation | | | | | | | 514 | | | | 223 | |
Other provisions | | | | | | | 320 | | | | 422 | |
Provisions | | | | | | | 834 | | | | 645 | |
Deferred income | | | (13 | ) | | | 3,304 | | | | 1,408 | |
Total current liabilities | | | | | | | 7,385 | | | | 6,347 | |
| | | |
Trade and other payables | | | | | | | 50 | | | | 45 | |
Tax liabilities | | | | | | | 355 | | | | 318 | |
Financial liabilities | | | (12 | ) | | | 3,791 | | | | 3,758 | |
Other non-financial liabilities | | | | | | | 115 | | | | 112 | |
Provisions | | | | | | | 211 | | | | 278 | |
Deferred tax liabilities | | | | | | | 102 | | | | 109 | |
Deferred income | | | (13 | ) | | | 63 | | | | 74 | |
Total non-current liabilities | | | | | | | 4,687 | | | | 4,694 | |
Total liabilities | | | | | | | 12,072 | | | | 11,041 | |
| | | |
Issued capital | | | | | | | 1,229 | | | | 1,229 | |
Share premium | | | | | | | 578 | | | | 551 | |
Retained earnings | | | | | | | 16,156 | | | | 16,258 | |
Other components of equity | | | | | | | –582 | | | | –718 | |
Treasury shares | | | | | | | –1,234 | | | | –1,280 | |
Equity attributable to owners of parent | | | | | | | 16,147 | | | | 16,040 | |
| | | |
Non-controlling interests | | | | | | | 7 | | | | 8 | |
Total equity | | | (14 | ) | | | 16,154 | | | | 16,048 | |
Total equity and liabilities | | | | | | | 28,226 | | | | 27,089 | |
Due to rounding, numbers may not add up precisely.
| | |
| 30 | | CONSOLIDATED INTERIM FINANCIAL STATEMENTS – IFRS |
CONSOLIDATED STATEMENTS OF CHANGES IN EQUITY OF SAP GROUP
For the six months ended June 30
| | | | | | | | | | | | | | | | | | | | | | | | | | | | | | | | | | | | | | | | |
€ millions | | Equity Attributable to Owners of Parent | | | Non-
Controlling
Interests | | | Total
Equity | |
| | | Issued
Capital | | | Share
Premium | | | Retained
Earnings | | | Other Components of Equity | | | Treasury
Shares | | | Total | | | | | | | |
| | | | | | | | | | | | Exchange
Diffe-
rences | | | Available-
for-Sale
Financial
Assets | | | Cash
Flow
Hedges | | | | | | | | | | | | | |
1/1/2013 | | | 1,229 | | | | 492 | | | | 13,934 | | | | –236 | | | | 22 | | | | 20 | | | | –1,337 | | | | 14,125 | | | | 8 | | | | 14,133 | |
Profit after tax | | | | | | | | | | | 1,245 | | | | | | | | | | | | | | | | | | | | 1,245 | | | | | | | | 1,244 | |
Other comprehensive income | | | | | | | | | | | | | | | –87 | | | | 5 | | | | 13 | | | | | | | | –69 | | | | | | | | –69 | |
Comprehensive income | | | | | | | | | | | 1,245 | | | | –87 | | | | 5 | | | | 13 | | | | | | | | 1,175 | | | | | | | | 1,175 | |
Share-based payments | | | | | | | 25 | | | | | | | | | | | | | | | | | | | | | | | | 25 | | | | | | | | 25 | |
Dividends | | | | | | | | | | | –1,013 | | | | | | | | | | | | | | | | | | | | –1,013 | | | | | | | | –1,013 | |
Reissuance of treasury shares under share-based payments | | | | | | | 4 | | | | | | | | | | | | | | | | | | | | 7 | | | | 11 | | | | | | | | 11 | |
Other changes | | | | | | | | | | | –2 | | | | | | | | | | | | | | | | | | | | –2 | | | | | | | | –2 | |
6/30/2013 | | | 1,229 | | | | 521 | | | | 14,164 | | | | –323 | | | | 27 | | | | 33 | | | | –1,330 | | | | 14,321 | | | | 8 | | | | 14,329 | |
1/1/2014 | | | 1,229 | | | | 551 | | | | 16,258 | | | | –820 | | | | 82 | | | | 20 | | | | –1,280 | | | | 16,040 | | | | 8 | | | | 16,048 | |
Profit after tax | | | | | | | | | | | 1,091 | | | | | | | | | | | | | | | | | | | | 1,091 | | | | –1 | | | | 1,090 | |
Other comprehensive income | | | | | | | | | | | 2 | | | | 144 | | | | 17 | | | | –25 | | | | | | | | 138 | | | | | | | | 138 | |
Comprehensive income | | | | | | | | | | | 1,093 | | | | 144 | | | | 17 | | | | –25 | | | | | | | | 1,229 | | | | –1 | | | | 1,228 | |
Share-based payments | | | | | | | 3 | | | | | | | | | | | | | | | | | | | | | | | | 3 | | | | | | | | 3 | |
Dividends | | | | | | | | | | | –1,194 | | | | | | | | | | | | | | | | | | | | –1,194 | | | | | | | | –1,194 | |
Reissuance of treasury shares under share-based payments | | | | | | | 24 | | | | | | | | | | | | | | | | | | | | 47 | | | | 71 | | | | | | | | 71 | |
Other changes | | | | | | | | | | | –1 | | | | | | | | | | | | | | | | | | | | –1 | | | | | | | | –1 | |
6/30/2014 | | | 1,229 | | | | 578 | | | | 16,156 | | | | –676 | | | | 99 | | | | –5 | | | | –1,234 | | | | 16,147 | | | | 7 | | | | 16,154 | |
Due to rounding, numbers may not add up precisely.
| | |
| INTERIM REPORT JANUARY – JUNE 2014 | | 31 |
CONSOLIDATED STATEMENTS OF CASH FLOWS OF SAP GROUP
For the six months ended June 30
| | | | | | | | |
€ millions | | 2014 | | | 2013 | |
Profit after tax | | | 1,090 | | | | 1,244 | |
Adjustments to reconcile profit after taxes to net cash provided by operating activities: | | | | | �� | | | |
Depreciation and amortization | | | 478 | | | | 478 | |
Income tax expense | | | 332 | | | | 340 | |
Financial income, net | | | –9 | | | | 37 | |
Decrease/increase in sales and bad debt allowances on trade receivables | | | 16 | | | | 38 | |
Other adjustments for non-cash items | | | 52 | | | | 44 | |
Decrease/increase in trade and other receivables | | | 297 | | | | 470 | |
Decrease/increase in other assets | | | –188 | | | | –129 | |
Decrease/increase in trade payables, provisions, and other liabilities | | | –593 | | | | –945 | |
Decrease/increase in deferred income | | | 1,855 | | | | 1,735 | |
Cash outflows due to TomorrowNow and Versata litigation | | | 0 | | | | –1 | |
Interest paid | | | –73 | | | | –80 | |
Interest received | | | 27 | | | | 33 | |
Income taxes paid, net of refunds | | | –709 | | | | –782 | |
Net cash flows from operating activities | | | 2,575 | | | | 2,482 | |
| | |
Business combinations, net of cash and cash equivalents acquired | | | –729 | | | | –99 | |
Purchase of intangible assets and property, plant, and equipment | | | –304 | | | | –265 | |
Proceeds from sales of intangible assets or property, plant, and equipment | | | 27 | | | | 23 | |
Purchase of equity or debt instruments of other entities | | | –713 | | | | –1,200 | |
Proceeds from sales of equity or debt instruments of other entities | | | 721 | | | | 1,079 | |
Net cash flows from investing activities | | | –998 | | | | –462 | |
| | |
Dividends paid | | | –1,194 | | | | –1,013 | |
Proceeds from reissuance of treasury shares | | | 27 | | | | 9 | |
Proceeds from borrowings | | | 500 | | | | 0 | |
Repayments of borrowings | | | –586 | | | | 0 | |
Net cash flows from financing activities | | | –1,253 | | | | –1,004 | |
| | |
Effect of foreign exchange rates on cash and cash equivalents | | | 51 | | | | –107 | |
Net decrease/increase in cash and cash equivalents | | | 375 | | | | 909 | |
Cash and cash equivalents at the beginning of the period | | | 2,748 | | | | 2,477 | |
Cash and cash equivalents at the end of the period | | | 3,123 | | | | 3,386 | |
Due to rounding, numbers may not add up precisely.
| | |
| 32 | | CONSOLIDATED INTERIM FINANCIAL STATEMENTS – IFRS |
NOTES TO THE CONSOLIDATED INTERIM FINANCIAL STATEMENTS
(1) General Information About Consolidated Interim Financial Statements
The accompanying Consolidated Interim Financial Statements of SAP SE and its subsidiaries (collectively, “we,” “us,” “our,” “SAP,” “Group,” and “Company”) have been prepared in accordance with the International Financial Reporting Standards (IFRS) and in particular in compliance with International Accounting Standard (IAS) 34. The designation IFRS includes all standards issued by the International Accounting Standards Board (IASB) and related interpretations issued by the IFRS Interpretations Committee (IFRIC). The variances between the applicable IFRS standards as issued by the IASB and the standards as used by the European Union are not relevant to these financial statements.
With effect from July 7, 2014, SAP AG was converted to a European Company (Societas Europaea, SE), and since this date, the company’s legal form is SAP SE.
Certain information and disclosures normally included in the notes to annual financial statements prepared in accordance with IFRS have been condensed or omitted. We believe that the disclosures made are adequate and that the information gives a true and fair view.
Our business activities are influenced by certain seasonal effects. Historically, our overall revenue tends to be highest in the fourth quarter. Interim results are therefore not necessarily indicative of results for a full year.
Amounts reported in previous years have been reclassified as appropriate to conform to the presentation in this interim report.
These unaudited condensed Consolidated Interim Financial Statements should be read in conjunction with SAP’s audited Consolidated IFRS Financial Statements for the Year Ended December 31, 2013, included in our 2013 Annual Report (extract from our 2013 Integrated Report) and our 2013 Annual Report on Form 20-F.
Due to rounding, numbers presented throughout these Interim Financial Statements may not add up precisely to the totals we provide and percentages may not precisely reflect the absolute figures.
(2) Scope of Consolidation
The following table summarizes the change in the number of legal entities included in the Consolidated Financial Statements:
Entities Consolidated in the Financial Statements
| | | | | | | | | | | | |
| | | German | | | Foreign | | | Total | |
January 1, 2013 | | | 22 | | | | 245 | | | | 267 | |
Additions | | | 1 | | | | 24 | | | | 25 | |
Disposals | | | –1 | | | | –19 | | | | –20 | |
December 31, 2013 | | | 22 | | | | 250 | | | | 272 | |
Additions | | | 0 | | | | 5 | | | | 5 | |
Disposals | | | 0 | | | | –16 | | | | –16 | |
June 30, 2014 | | | 22 | | | | 239 | | | | 261 | |
The additions during the first half of 2014 relate to legal entities added in connection with acquisitions. The disposals are due to mergers and liquidations of operating and non-operating legal entities.
Our changes in the scope of consolidation in the first half of 2014 were not significant to our Consolidated Financial Statements.
For more information about our business combinations and the effect on our Consolidated Financial Statements, see Note (4) and our Annual Report for 2013.
(3) Summary of Significant Accounting Policies
The Interim Financial Statements were prepared based on the same accounting policies as those applied and described in the Consolidated Financial Statements as at December 31, 2013. Our significant accounting policies are summarized in the Notes to the Consolidated Financial Statements. For more information, see Note (3) in our Annual Report for 2013.
Newly Adopted Accounting Standards
The new accounting standards (for example the Amendments to IAS 32 (Financial Instruments: Presentation) – Offsetting financial assets and financial liabilities) adopted in the first half of 2014 did not have a material impact on our Consolidated Financial Statements.
New Accounting Standards Not Yet Adopted
On May 12, 2014, the IASB published amendments to IAS 16 (Property, Plant and Equipment) and IAS 38 (Intangible Assets). The amendments become
| | |
| INTERIM REPORT JANUARY – JUNE 2014 | | 33 |
mandatory for the Group’s 2016 Consolidated Financial Statements and clarify that – in general – the use of revenue-based methods to calculate the depreciation / amortization is not appropriate (this presumption, however, can be rebutted in certain limited circumstances for intangibles). We have not yet completed the determination of the impact on our Consolidated Financial Statements.
On May 28, 2014, the IASB issued IFRS 15 (Revenue from Contracts with Customers). The standard becomes effective in fiscal year 2017 with earlier application permitted. We are in the early stage of an analysis of the impact of the standard on our Consolidated Financial Statements. This impact could be material, in particular in the areas of allocating revenue to the different performance obligations under one contract and the timing of revenue recognition. The standard foresees different alternative approaches for the adoption of the new guidance. We have not yet taken a decision which of these alternatives we intend to apply.
For more information about new accounting standards not yet adopted, see Note (3) in our Annual Report for 2013.
(4) Business Combinations
We acquired the following businesses in the first half of 2014.
Acquired Businesses
| | | | | | | | |
| Acquired Businesses | | Sector | | Acquisition Type | | Acquired Voting Interest | | Acquisition Date |
| Fieldglass, Inc., Chicago, Illinois, USA | | Provider of SaaS solution to organizations to procure and manage their flexible workforces | | Share Deal | | 100% | | May 2, 2014 |
| SeeWhy, Inc., Boston, Massachusetts, USA | | Provider of behavioral marketing software | | Share Deal | | 100% | | June 13, 2014 |
We acquire businesses in specific areas of strategic interest to us. All of the acquisitions listed in the above table are neither individually nor in aggregate material to SAP.
For some acquisitions, for example hybris, we are still in the measurement period of 12 months after the acquisition date. Accordingly, some amounts recognized in our financial statements for these items might still be regarded provisional.
Acquisitions made in the preceding year, including the acquisition of hybris on August 1, 2013, are described in the Consolidated Financial Statements in our 2013 Annual Report.
(5) Professional Services and Other Service Revenue
Professional services and other service revenue comprises the following:
Professional Services and Other Service Revenue
| | | | | | | | | | | | | | | | |
€ millions | | Q2 2014 | | | 1/1-
6/30/2014 | | | Q2 2013 | | | 1/1-
6/30/2013 | |
Consulting | | | 520 | | | | 1,028 | | | | 580 | | | | 1,136 | |
Other services | | | 153 | | | | 288 | | | | 165 | | | | 306 | |
Professional services and other service | | | 673 | | | | 1,316 | | | | 744 | | | | 1,443 | |
The item includes professional services and other service revenue related to our cloud offerings of €54 million in the second quarter 2014 and €98 million in the first half of 2014 (Q2 2013: €39 million; first half of 2013: €82 million).
(6) Cost of Software and Software-Related Services
Cost of software and software-related service was €698 million in the second quarter of 2014 and €1,343 million in the first half of 2014 (Q2 2013: €630 million; first half of 2013: €1,234 million). The item includes cost of cloud subscriptions and support revenue of €105 million in the second quarter 2014 and €188 million in the first half of 2014 (Q2 2013: €71 million; first half of 2013: €154 million).
| | |
| 34 | | CONSOLIDATED INTERIM FINANCIAL STATEMENTS – IFRS |
(7) Employee Benefits Expense and Headcount
Employee benefits expense comprises the following:
Employee Benefits Expense
| | | | | | | | | | | | | | | | |
€ millions | | Q2 2014 | | | 1/1-
6/30/2014 | | | Q2 2013 | | | 1/1-
6/30/2013 | |
Salaries | | | 1,549 | | | | 3,015 | | | | 1,530 | | | | 2,929 | |
Social security expense | | | 217 | | | | 457 | | | | 203 | | | | 441 | |
Share-based payment expenses | | | 76 | | | | 124 | | | | 39 | | | | 109 | |
Pension expense | | | 53 | | | | 113 | | | | 50 | | | | 114 | |
Employee-related restructuring expenses | | | 38 | | | | 51 | | | | 17 | | | | 23 | |
Termination benefits | | | 4 | | | | 12 | | | | 9 | | | | 21 | |
Employee Benefits Expense | | | 1,937 | | | | 3,773 | | | | 1,848 | | | | 3,637 | |
Acquired companies are only included in the employee benefits expense as of the company’s acquisition date. hybris is therefore not included in prior year numbers.
On June 30, 2014, the breakdown of our full-time equivalent employee numbers by function and by region was as shown in the table below. The increase in headcount in the SAP Group to 67,008 employees is mainly due to additions from business combinations (especially hybris).
Number of Employees (in Full-Time Equivalents)
| | | | | | | | | | | | | | | | | | | | | | | | | | | | | | | | |
| | | June 30, 2014 | | | June 30, 2013 | |
| Full-Time Equivalents | | EMEA | | | Americas | | | APJ | | | Total | | | EMEA | | | Americas | | | APJ | | | Total | |
Software and software-related services | | | 5,126 | | | | 3,098 | | | | 3,707 | | | | 11,930 | | | | 4,622 | | | | 2,739 | | | | 3,350 | | | | 10,711 | |
Professional services and other services | | | 7,136 | | | | 4,432 | | | | 2,919 | | | | 14,487 | | | | 6,916 | | | | 4,388 | | | | 2,892 | | | | 14,197 | |
Research and development | | | 8,907 | | | | 3,652 | | | | 5,515 | | | | 18,074 | | | | 8,525 | | | | 3,516 | | | | 5,334 | | | | 17,374 | |
Sales and marketing | | | 6,593 | | | | 6,208 | | | | 3,173 | | | | 15,974 | | | | 6,301 | | | | 6,498 | | | | 3,050 | | | | 15,849 | |
General and administration | | | 2,421 | | | | 1,441 | | | | 758 | | | | 4,620 | | | | 2,285 | | | | 1,417 | | | | 661 | | | | 4,363 | |
Infrastructure | | | 1,431 | | | | 816 | | | | 319 | | | | 2,566 | | | | 1,309 | | | | 823 | | | | 312 | | | | 2,443 | |
SAP Group (June 30) | | | 31,614 | | | | 19,647 | | | | 16,391 | | | | 67,651 | | | | 29,957 | | | | 19,380 | | | | 15,600 | | | | 64,937 | |
Thereof acquisitions | | | 49 | | | | 324 | | | | 15 | | | | 388 | | | | 48 | | | | 221 | | | | 0 | | | | 269 | |
| | | | | | | | |
SAP Group (average first half) | | | 31,293 | | | | 19,582 | | | | 16,133 | | | | 67,008 | | | | 29,866 | | | | 19,296 | | | | 15,593 | | | | 64,756 | |
| | |
| INTERIM REPORT JANUARY – JUNE 2014 | | 35 |
The allocations of expenses for share-based payments to the various expense items are as follows:
Share-Based Payments
| | | | | | | | | | | | | | | | |
€ millions | | Q2 2014 | | | 1/1-
6/30/2014 | | | Q2 2013 | | | 1/1-
6/30/2013 | |
Cost of software and software-related services | | | 10 | | | | 15 | | | | 4 | | | | 13 | |
Cost of professional services and other services | | | 15 | | | | 23 | | | | 8 | | | | 20 | |
Research and development | | | 21 | | | | 31 | | | | 14 | | | | 33 | |
Sales and marketing | | | 22 | | | | 34 | | | | 10 | | | | 31 | |
General and administration | | | 8 | | | | 21 | | | | 3 | | | | 12 | |
Share-based payments | | | 76 | | | | 124 | | | | 39 | | | | 109 | |
(8) Income Taxes
In the second quarter and the first half of 2014, income taxes and the effective tax rate, each compared with the second quarter and the first half of 2013, were as follows:
Income Taxes
| | | | | | | | | | | | | | | | |
€ millions, unless stated otherwise | | Q2 2014 | | | 1/1-
6/30/2014 | | | Q2 2013 | | | 1/1-
6/30/2013 | |
Profit before income tax | | | 719 | | | | 1,423 | | | | 963 | | | | 1,584 | |
Income tax expense | | | –163 | | | | –332 | | | | –239 | | | | –340 | |
Effective tax rate (in%) | | | 22.6 | | | | 23.4 | | | | 24.8 | | | | 21.5 | |
We are subject to ongoing tax audits by domestic and foreign tax authorities. Currently, we are mainly in dispute with the German and the Brazilian tax authorities. The German dispute is in respect of intercompany financing matters while the Brazilian dispute is in respect of the license fee deductibility. In both cases, we expect that we will need to initiate litigation to prevail. For both of these matters, we have not recorded a provision as we believe that the tax authorities’ claims have no merit and that no adjustment is warranted. If, contrary to our view, the tax authorities were to prevail in their arguments before the court, we would expect to have an additional tax expense (including related interest expenses and penalties) of approximately €668 million in total.
(9) Earnings per Share
Earnings per Share
| | | | | | | | | | | | | | | | |
€ millions, unless otherwise stated | | Q2 2014 | | | 1/1- 6/30/2014 | | | Q2 2013 | | | 1/1- 6/30/2013 | |
Profit attributable to equity holders of SAP SE | | | 557 | | | | 1,091 | | | | 725 | | | | 1,245 | |
Issued ordinary shares1) | | | 1,229 | | | | 1,229 | | | | 1,229 | | | | 1,229 | |
Effect of treasury shares1) | | | –34 | | | | –34 | | | | –36 | | | | –36 | |
Weighted average shares outstanding, basic1) | | | 1,194 | | | | 1,194 | | | | 1,193 | | | | 1,193 | |
Dilutive effect of share-based payments1) | | | 3 | | | | 3 | | | | 2 | | | | 2 | |
Weighted average shares outstanding, diluted1) | | | 1,197 | | | | 1,197 | | | | 1,195 | | | | 1,195 | |
| | | | |
Earnings per share, basic, attributable to equity holders of SAP SE (in €) | | | 0.47 | | | | 0.91 | | | | 0.61 | | | | 1.04 | |
Earnings per share, diluted, attributable to equity holders of SAP SE (in €) | | | 0.47 | | | | 0.91 | | | | 0.61 | | | | 1.04 | |
| 1) | Number of shares in millions |
| | |
| 36 | | CONSOLIDATED INTERIM FINANCIAL STATEMENTS – IFRS |
(10) Other Financial Assets
Other financial assets comprise the following:
Other Financial Assets
| | | | | | | | | | | | |
| | | June 30, 2014 | |
| € millions | | Current | | | Non-Current | | | Total | |
Loans and other financial receivables | | | 75 | | | | 266 | | | | 341 | |
Debt investments | | | 30 | | | | 0 | | | | 30 | |
Equity investments | | | 0 | | | | 383 | | | | 383 | |
Available-for-sale financial assets | | | 30 | | | | 383 | | | | 413 | |
Derivatives | | | 125 | | | | 42 | | | | 167 | |
Investments in associates | | | 0 | | | | 35 | | | | 35 | |
Total | | | 230 | | | | 726 | | | | 957 | |
| | | | | | | | | | | | |
| | | December 31, 2013 | |
| € millions | | Current | | | Non-Current | | | Total | |
Loans and other financial receivables | | | 90 | | | | 243 | | | | 333 | |
Debt investments | | | 38 | | | | 0 | | | | 38 | |
Equity investments | | | 0 | | | | 322 | | | | 322 | |
Available-for-sale financial assets | | | 38 | | | | 322 | | | | 360 | |
Derivatives | | | 123 | | | | 6 | | | | 129 | |
Investments in associates | | | 0 | | | | 36 | | | | 36 | |
Total | | | 251 | | | | 607 | | | | 858 | |
(11) Trade and Other Receivables
Trade and other receivables comprise the following:
Trade and Other Receivables
| | | | | | | | | | | | |
| | | June 30, 2014 | |
| € millions | | Current | | | Non-Current | | | Total | |
Trade receivables, net | | | 3,573 | | | | 4 | | | | 3,577 | |
Other receivables | | | 42 | | | | 76 | | | | 117 | |
Total | | | 3,614 | | | | 80 | | | | 3,694 | |
| | | | | | | | | | | | |
| | | December 31, 2013 | |
| € millions | | Current | | | Non-Current | | | Total | |
Trade receivables, net | | | 3,802 | | | | 14 | | | | 3,816 | |
Other receivables | | | 63 | | | | 84 | | | | 147 | |
Total | | | 3,865 | | | | 98 | | | | 3,963 | |
The carrying amounts of our trade receivables and related allowances were as follows:
Carrying Amounts of Trade Receivables
| | | | | | | | |
| € millions | | 6/30/
2014 | | | 12/31/
2013 | |
Gross carrying amount | | | 3,731 | | | | 3,954 | |
Sales allowances charged to revenue | | | –106 | | | | –96 | |
Allowance for doubtful accounts charged to expense | | | –48 | | | | –42 | |
Carrying amount trade receivables, net | | | 3,577 | | | | 3,816 | |
| | |
| INTERIM REPORT JANUARY – JUNE 2014 | | 37 |
(12) Financial Liabilities
Financial liabilities comprise the following:
Financial Liabilities
| | | | | | | | | | | | | | | | | | | | |
| | | June 30, 2014 | |
| | | Nominal Volume | | | Carrying Amount | |
€ millions | | Current | | | Non-Current | | | Current | | | Non-Current | | | Total | |
Bank loans | | | 500 | | | | 0 | | | | 500 | | | | 0 | | | | 500 | |
Private placement transactions | | | 0 | | | | 1,940 | | | | 0 | | | | 1,935 | | | | 1,935 | |
Bonds | | | 0 | | | | 1,800 | | | | 0 | | | | 1,813 | | | | 1,813 | |
Financial debt | | | 500 | | | | 3,740 | | | | 500 | | | | 3,748 | | | | 4,248 | |
Other financial liabilities | | | NA | | | | NA | | | | 80 | | | | 43 | | | | 123 | |
Financial liabilities | | | | | | | | | | | 580 | | | | 3,791 | | | | 4,371 | |
| | | | | | | | | | | | | | | | | | | | |
| | | December 31, 2013 | |
| | | Nominal Volume | | | Carrying Amount | |
€ millions | | Current | | | Non-Current | | | Current | | | Non-Current | | | Total | |
Bank loans | | | 0 | | | | 0 | | | | 0 | | | | 0 | | | | 0 | |
Private placement transactions | | | 86 | | | | 1,922 | | | | 86 | | | | 1,891 | | | | 1,977 | |
Bonds | | | 500 | | | | 1,800 | | | | 500 | | | | 1,791 | | | | 2,291 | |
Financial debt | | | 586 | | | | 3,722 | | | | 586 | | | | 3,682 | | | | 4,268 | |
Other financial liabilities | | | NA | | | | NA | | | | 162 | | | | 76 | | | | 238 | |
Financial liabilities | | | | | | | | | | | 748 | | | | 3,758 | | | | 4,506 | |
(13) Deferred Income
On June 30, 2014, our current deferred income was €3,304 million (December 31, 2013: €1,408 million) and our non-current deferred income was €63 million (December 31, 2013: €74 million). On June 30, 2014, current deferred income includes a total of €445 million in deferred revenue (December 31, 2013: €443 million; June 30, 2013: €354 million), which in future will likely be recognized as revenue from cloud subscriptions and support.
(14) Total Equity
Issued Shares
On June 30, 2014, SAP SE had 1,228,504,232 no-par issued shares (December 31, 2013: 1,228,504,232) issued with a calculated nominal value of €1 per share. Thus, issued shares remain unchanged in the first half of 2014.
Treasury Shares
On June 30, 2014, we held 34 million treasury shares, representing €34 million or 2.7% of capital stock.
In the first half of 2014, we did not acquire shares for treasury, 1.3 million (Q2 2014: 1.2 million) shares were disposed at an average price of approximately €36.79 (Q2 2014: €36.79) per share.
In the first half of 2013, we did not acquire shares for treasury, 0.2 million (Q2 2013: 0.1 million) shares were disposed at an average price of approximately €36.80 (Q2 2013: €36.80) per share.
Share sales in 2014 and 2013 were in connection with our share-based payments, which are described in Note (27) in the Annual Report for 2013.
| | |
| 38 | | CONSOLIDATED INTERIM FINANCIAL STATEMENTS – IFRS |
Other Comprehensive Income
The component of other comprehensive income before tax that will be reclassified to profit or loss in the future includes the following items for the second quarter:
| | | | | | | | |
| € millions | | Q2 2014 | | | Q2 2013 | |
Gains (losses) on exchange differences on translation | | | 126 | | | | –319 | |
Reclassification adjustments on exchange differences on translation | | | 0 | | | | 0 | |
Exchange differences on translation | | | 126 | | | | –319 | |
Gains (losses) on remeasuring available-for-sale financial assets | | | 8 | | | | 5 | |
Reclassification adjustments on available-for-sale financial assets | | | 0 | | | | 0 | |
Available-for-sale financial assets | | | 8 | | | | 5 | |
Gains (losses) on cash flow hedges | | | –22 | | | | 37 | |
Reclassification adjustments on cash flow hedges | | | –4 | | | | –19 | |
Cash flow hedges | | | –26 | | | | 18 | |
The component of other comprehensive income before tax that will be reclassified to profit or loss in the future includes the following items for the first half year:
| | | | | | | | |
| € millions | | 1/1-
6/30/2014 | | | 1/1-
6/30/2013 | |
Gains (losses) on exchange differences on translation | | | 142 | | | | –90 | |
Reclassification adjustments on exchange differences on translation | | | 0 | | | | 0 | |
Exchange differences on translation | | | 142 | | �� | | –90 | |
Gains (losses) on remeasuring available-for-sale financial assets | | | 19 | | | | 5 | |
Reclassification adjustments on available-for-sale financial assets | | | –2 | | | | 0 | |
Available-for-sale financial assets | | | 17 | | | | 5 | |
Gains (losses) on cash flow hedges | | | –20 | | | | 50 | |
Reclassification adjustments on cash flow hedges | | | –14 | | | | –32 | |
Cash flow hedges | | | –34 | | | | 18 | |
(15) Contingent Liabilities
For a detailed description of our contingent liabilities, see Note (22) in our 2013 Annual Report, Notes to the Consolidated Financial Statements section. There have been no significant changes in contingent liabilities since December 31, 2013.
For information about contingent liabilities related to litigation, see Note (16).
(16) Litigation and Claims
We are subject to a variety of claims and lawsuits that arise from time to time in the ordinary course of our business, including proceedings and claims that relate to companies we have acquired, claims that relate to customers demanding indemnification for proceedings initiated against them based on their use of SAP software, and claims that relate to customers’ being dissatisfied with the products and services that we have delivered to them. We will continue to vigorously defend against all claims and lawsuits against us. We record a provision for such matters when it is probable that we have a present obligation that results from a past event, is reliably estimable, and the settlement of which is probable to require an outflow of resources embodying economic benefits. For the TomorrowNow and the Versata litigation, we have recorded provisions of US$306 million (US$306 million on December 31, 2013) and US$394 million (US$0 million on December 31, 2013), respectively. We currently believe that resolving all other claims and lawsuits against us, individually or in the aggregate, did not and will not have a material adverse effect on our business, financial position, profit, or cash flows. Consequently, the provisions currently recorded for these other claims and lawsuits are neither individually nor in aggregate material to SAP.
However, the outcome of litigation and other claims or lawsuits is intrinsically subject to considerable uncertainty. Management’s view of the litigation may also change in the future. Actual outcomes of litigation and other claims or lawsuits may differ from the assessments made by management in prior periods, which could result in a material impact on our business, financial position, profit, cash flows, or reputation. Most of the litigations and claims are of a very individual nature and claims are either not quantified by the claimants or claim amounts quantified are, based on historical evidence, not expected to be a good proxy for the expenditure that would be required to settle the case concerned. The specifics of the jurisdictions where most of the claims are located further impair the predictability of the outcome of the cases. Therefore, it is not practicable to reliably estimate the financial effect that these litigations and claims would have if SAP were to incur expenditure for these cases.
For more information about the provisions recorded for litigation, see our 2013 Annual Report, Notes to the Consolidated Financial Statements section, Note (18b).
Among the claims and lawsuits are the following:
Intellectual Property Litigation
In March 2007, United States-based Oracle Corporation and certain of its subsidiaries (Oracle) instituted legal proceedings in the United States against TomorrowNow, Inc., its parent company SAP America, Inc. and SAP America’s parent company SAP SE (SAP). Oracle filed several amended complaints between 2007 and 2009. As
| | |
| INTERIM REPORT JANUARY – JUNE 2014 | | 39 |
amended, the lawsuit alleges copyright infringement, violations of the Federal Computer Fraud and Abuse Act and the California Computer Data Access and Fraud Act, unfair competition, intentional and negligent interference with prospective economic advantage, and civil conspiracy. The lawsuit alleges that SAP unlawfully copied and misappropriated proprietary, copyrighted software products and other confidential materials developed by Oracle to service its own customers. The lawsuit sought injunctive relief and monetary damages, including punitive damages, alleged by Oracle to be in the billions of U.S. dollars. The trial was held in November 2010. Prior to trial, SAP SE, SAP America and TomorrowNow stipulated to liability for certain claims and SAP agreed to pay Oracle US$120 million for attorneys’ fees. After the trial, the jury returned a damages verdict of US$1.3 billion. The judgment, which was issued on February 3, 2011, additionally provided for prejudgment interest of US$15 million. The judgment amount is also subject to post-judgment interest, which accrues from the time judgment is entered.
The jury based its verdict on the theory of a hypothetical license, that is, the value of what TomorrowNow would have paid if it had negotiated with Oracle a license for the copyrights infringed by TomorrowNow. Before and during the course of the trial, various damages amounts had been presented by the parties to the litigation. They included the following:
a) Before the trial, Oracle had requested damages in excess of US$3.5 billion based on alleged “saved acquisition costs,” the court dismissed that damage claim based on a pretrial motion, but Oracle has the right to appeal that dismissal.
b) During the trial, Oracle’s damages experts presented an amount of US$408 million based on lost profits and disgorgement of infringer’s profit.
c) During the trial, members of Oracle management presented, as part of their testimonies, amounts of up to US$5 billion. Oracle’s damages expert presented a damages estimate of “at least” US$1.655 billion under a hypothetical license theory. Oracle’s counsel asked the jury to award “somewhere between US$1.65 and US$3 billion.”
d) During the trial, the damages expert for TomorrowNow and SAP presented an amount of US$28 million based on lost profits and infringer’s profits or, alternatively, US$40.6 million based on a hypothetical license theory. Counsel for SAP and TomorrowNow asked the jury to award US$28 million.
We believed both before and during the trial and continue to believe that the hypothetical license theory is not an appropriate basis for calculating the damages. Instead, we believe that damages should be based on lost profits and infringer’s profits. As such, SAP filed post-trial motions asking the judge to overturn the judgment. A hearing on the post-trial motions was held in July 2011. On September 1, 2011, the trial judge issued an order which set aside the jury verdict and vacated that part of the judgment awarding US$1.3 billion in damages. The trial judge also gave Oracle the choice of accepting reduced damages of US$272 million or having a new trial based on lost profits and infringer’s profits. Oracle filed a motion seeking an early appeal from the ruling vacating the jury’s damages award, which was denied by the judge. Consequently, Oracle elected to proceed with a new trial. In lieu of a new trial, the parties stipulated to a judgment of US$306 million while each preserving all rights for appeal. Both parties have filed their respective notice of appeal. On appeal, Oracle is seeking three forms of relief: (1) reinstatement of the November 2010 US$1.3 billion verdict; (2) as a first alternative, a new trial at which Oracle may again seek hypothetical license damages (based in part on evidence of alleged saved development costs) plus SAP’s alleged infringer’s profits without any deduction of expenses (Oracle does not put a number on its claim for the requested new trial); and (3) as a second alternative, increase of the remittitur (alternative to new trial) to US$408.7 million (versus the US$272 million Oracle had previously rejected). SAP has dismissed its cross-appeal. The hearing was held on May 13, 2014. A decision is expected later this year, perhaps even later.
Additionally, in June 2007, SAP became aware that the United States Department of Justice (U.S. DOJ) had opened an investigation concerning related issues and had issued subpoenas to SAP and TomorrowNow. The DOJ investigation has been resolved by way of a plea agreement which includes TomorrowNow pleading guilty to 11 counts of violations of the Computer Fraud and Abuse Act, one count of criminal copyright infringement, the payment of a US$20 million fine and three years’ probation. No charges were brought against SAP SE or subsidiaries thereof other than TomorrowNow.
In April 2007, United States-based Versata Software, Inc. (formerly Trilogy Software, Inc.) (Versata) instituted legal proceedings in the United States District Court for the Eastern District of Texas against SAP. Versata alleged that SAP’s products infringe one or more of the claims in each of five patents held by Versata. In its complaint, Versata sought unspecified monetary damages and
| | |
| 40 | | CONSOLIDATED INTERIM FINANCIAL STATEMENTS – IFRS |
permanent injunctive relief. The first trial was held in August 2009. The jury returned a verdict in favor of Versata and awarded Versata US$138.6 million for past damages. In January 2011, the court vacated the jury’s damages award and ordered a new trial on damages. The retrial was held in May 2011. The jury returned a verdict in favor of Versata and awarded Versata US$345 million for past damages. In September 2011, the judge denied SAP’s post-trial motions with the exception of reducing the damages verdict by US$16 million to approximately US$329 million. The judge also ordered approximately US$60 million in pre-judgment interest. Additionally, the judge granted Versata’s request for a broad injunction which prohibits SAP from 1) selling products in the United States with the infringing functionality, 2) providing maintenance to or accepting maintenance revenue from existing customers in the United States until such customers disable the infringing functionality and verify such disablement, and 3) licensing additional users to existing customers in the United States until such customers disable the infringing functionality and verify such disablement. Finally, the judge stayed the injunction pending the outcome of an appeal.
Both parties appealed to the U.S. Court of Appeals for the Federal Circuit. The appeal hearing occurred in February 2013 and a decision was issued on May 1, 2013. The three-judge panel ruled in Versata’s favor on infringement and damages, leaving both fully intact. The past damages verdict currently stands at approximately US$390 million. Regarding the injunction, the court ruled that the injunction was too broad, stating that SAP should be able to provide maintenance or additional seats for prior customers of the infringing products, so long as the maintenance or the additional seat does not involve, or allow access to, the “enjoined capability” where enjoined capability is defined as the capability to execute a pricing procedure using hierarchical access of customer and product data. SAP filed a petition seeking rehearing by the three-judge panel that issued this decision and/or by the entire appeals court. The appeals court requested that Versata respond to SAP’s petition no later than July 29, 2013. In August 2013, the appeals court denied SAP’s request for rehearing and issued its mandate passing jurisdiction to the district court.
Separately, SAP filed a petition with the United States Patent and Trademark Office (USPTO) challenging the validity of the asserted Versata patent. In January 2013, the USPTO granted SAP’s request to reconsider the validity of Versata’s patent and instituted the relevant procedure (transitional post grant review). A decision was issued in June 2013 rendering all challenged patent claims (including all the patent claims SAP was found to have infringed) unpatentable. Versata filed with the USPTO a request seeking reconsideration of the decision on six different grounds. The USPTO invited SAP to file an opposition responding to two of the six grounds. On September 13, 2013, the USPTO denied Versata’s request for reconsideration. In November, 2013, Versata sought appeals court review of the USPTO decision. That appeal is fully briefed and the parties await announcement of a hearing date.
In June 2013, following the determination of unpatentability, SAP filed a request with the appeals court to stay the litigation pending review of the USPTO decision. That request was denied in early July 2013.
In December 2013, SAP filed with the United States Supreme Court a petition for a writ of certiorari to review the decisions of the appeals court. That petition was denied in January 2014. Immediately thereafter, Versata requested that the District Court dismiss its remaining claims for injunctive and equitable relief. The District Court granted that request and deemed the previously entered judgment final. On that same day, SAP requested that the District Court vacate the judgment or stay the litigation, based on the USPTO decision declaring Versata’s patent claims unpatentable. Versata requested an order requiring SAP to pay the judgment. In April, 2014, the District Court denied SAP’s motion to vacate the judgment or stay the litigation. SAP filed an appeal seeking review of that district court decision. On motion by Versata, the appeals court dismissed SAP’s appeal in June 2014. On June 30, 2014, SAP filed a motion with the appeals court to stay issuance of its mandate. That motion is pending at the appeals court. Versata’s request for an order requiring SAP to pay the judgment remains undecided at the District Court.
In February 2010, United States-based TecSec, Inc. (TecSec) instituted legal proceedings in the United States against SAP, Sybase, IBM, and many other defendants. TecSec alleged that SAP’s and Sybase’s products infringe one or more of the claims in five patents held by TecSec. In its complaint, TecSec seeks unspecified monetary damages and permanent injunctive relief. The trial has not yet been scheduled. The legal proceedings were stayed against all defendants pending a decision from the U.S. Supreme Court on SAP’s and other defendants’ request for review. Supreme Court review was declined in June, 2014. We expect the lawsuit to resume at the district court in the coming months.
| | |
| INTERIM REPORT JANUARY – JUNE 2014 | | 41 |
In April 2010, SAP instituted legal proceedings (a Declaratory Judgment action) in the United States against Wellogix, Inc. and Wellogix Technology Licensing, LLC (Wellogix). The lawsuit seeks a declaratory judgment that five patents owned by Wellogix are invalid and/or not infringed by SAP. The trial has not yet been scheduled. The legal proceedings have been stayed pending the outcome of six reexaminations filed with the USPTO. In September 2013, the USPTO issued a decision on four of the six reexaminations, invalidating every claim of each of the four patents. SAP is awaiting a decision on the two remaining reexamination requests. In response to SAP’s patent DJ action, Wellogix has re-asserted trade secret misappropriation claims against SAP (which had previously been raised and abandoned). SAP has filed a motion for an early dispositive decision on the trade secret claims, and we expect the court to issue a decision on that motion later this year.
In August 2007, United States-based elcommerce.com, Inc. (elcommerce) instituted legal proceedings in the United States against SAP. elcommerce alleged that SAP’s products infringe one or more of the claims in one patent held by elcommerce. In its complaint, elcommerce sought unspecified monetary damages and permanent injunctive relief. The court in East Texas granted SAP’s request to transfer the litigation from East Texas to Pennsylvania. Subsequent to the Markman ruling by the court, the parties agreed to the entry of final judgment regarding non-infringement by SAP of the method claims of the patent and invalidity of the system claims. elcommerce has appealed the court’s Markman ruling. The hearing for the appeal was held in May 2012. SAP also filed a reexamination request with the USPTO to invalidate elcommerce’s patent. On September 23, 2013, the USPTO issued a decision invalidating the patent. elcommerce sought rehearing from the USPTO, but that request was denied in March, 2014. The Federal Circuit appeals court also issued a decision in February, 2014, confirming that SAP did not infringe some claims of the elcommerce patent, but reversing the district court’s decision of invalidity of the patent. SAP has asked the Federal Circuit court to reconsider its invalidity decision. In June 2014, elcommerce and SAP jointly moved to dismiss the appeal on the Federal Circuit court. The legal dispute is thus closed.
Other Litigation
In April 2008, South African-based Systems Applications Consultants (PTY) Limited (Securinfo) instituted legal proceedings in South Africa against SAP. Securinfo alleges that SAP has caused one of its subsidiaries to breach a software distribution agreement with Securinfo. In its complaint, Securinfo seeks damages of approximately €610 million plus interest. In September 2009, SAP filed a motion to dismiss which was rejected. A trial date which was scheduled for June 2011 has been postponed.
In November 2012, SAP filed a motion to dismiss based on a procedural aspect of the case. The court followed SAP’s argument and dismissed the claim by Securinfo. Securinfo appealed against this decision on December 19, 2012.
In March 2013, the court dismissed Securinfo’s appeal. Securinfo appealed against this decision to the Supreme Court of South Africa. The Supreme Court granted leave to appeal to the full bench of the court which had originally dismissed Securinfo’s appeals. Securinfo has applied for an appeal hearing date. The court has not yet provided a date.
We are subject to ongoing audits by domestic and foreign tax authorities. Along with many other companies operating in Brazil, we are involved in various proceedings with Brazilian authorities regarding assessments and litigation matters on non-income taxes on intercompany royalty payments and intercompany services. The total potential amount related to these matters for all applicable years is approximately €97 million. We have not recorded a provision for these matters, as we believe that we will prevail on these matters.
For more information about income tax risk-related litigation, see Note (8).
(17) Share-Based Payments
For a detailed description of our share-based payment plans, see Note (27) in our 2013 Annual Report, Notes to the Consolidated Financial Statements section.
Share Matching Plan 2014 (SMP 2014)
Under the SMP 2014, SAP offered its employees the opportunity to purchase SAP SE shares at a discount of 40%. The number of SAP shares an eligible employee was able to purchase was limited to a percentage of the employee’s annual base salary. After a holding period of three years, the
| | |
| 42 | | CONSOLIDATED INTERIM FINANCIAL STATEMENTS – IFRS |
employees receive one SAP share free of charge for every three shares held. The terms for the Global Executives are different. Instead of receiving a discount, Global Executives are granted two bonus shares for every three shares acquired and held during the three-year vesting period. In June 2014, the participants purchased 1.5 million SAP shares in aggregate at a discounted share price of €33.41. The discount of €35 million was expensed immediately. The fair value of the right to a bonus share was estimated on the grant date (June 4, 2014) at €52.49 per share, using a risk-free interest rate of 0.13%, a dividend yield of 1.87%, and an expected life of three years.
The outstanding bonus shares under the Share Matching Plan are as follows:
Outstanding Restricted Shares
| | | | | | | | |
| Number in thousands | | 6/30/
2014 | | | 12/31/
2013 | |
Share Matching Plan 2011 (Bonus shares) | | | 0 | | | | 429 | |
Share Matching Plan 2012 (Bonus shares) | | | 2,895 | | | | 2,983 | |
Share Matching Plan 2013 (Bonus shares) | | | 554 | | | | 572 | |
Share Matching Plan 2014 (Bonus shares) | | | 567 | | | | 0 | |
Stock Option Plan 2010 (2014 Tranche)
Under the Stock Option Plan 2010 (2014 Tranche), we granted 9.0 million cash-based virtual stock options to Global Executives and to SAP’s Top Rewards in 2014.
The vesting period is three years and the contractual term of the program is six years. The exercise price is €60.96 and the fair value on the grant date was €8.49.
(18) Other Financial Instruments
A detailed overview of our other financial instruments, financial risk factors, and the management of financial risks are presented in Notes (24) to (26) to our Consolidated Financial Statements for 2013, which are included in our 2013 Integrated Report, and our 2013 Annual Report on Form 20-F.
In the following, we disclose the fair value of financial instruments, valuation techniques and inputs used and the level of the fair value hierarchy within which the fair value measurements are categorized.
Fair Value of Financial Instruments
We use various types of financial instruments in the ordinary course of business which are grouped into the following categories: Loans and receivables (L&R), available-for-sale (AFS), held-for-trading (HFT), and amortized cost (AC). The table below shows the carrying amounts and fair values of financial assets and liabilities by category of financial instrument as well as by category of IAS 39. Since the line items “Trade receivables,” “Trade payables,” and “Other financial assets” contain both financial and non-financial assets or liabilities (such as other taxes or advance payments), the non-financial assets or liabilities are shown in the column headed “Not in Scope of IFRS 7” to allow a reconciliation to the corresponding line items in the Consolidated Statements of Financial Position. The carrying amounts and fair values of our financial instruments as of the reporting date, were as follows:
| | |
| INTERIM REPORT JANUARY – JUNE 2014 | | 43 |
Fair Values of Financial Instruments
| | | | | | | | | | | | | | | | | | | | | | | | | | | | |
| | | 2014 | |
| | | | | | | | | Measurement Categories | | | | | | Not in
Scope of
IFRS 7 | |
€ millions | | Category | | | Book Value
6/30/
2014 | | | At
Amortized
Cost | | | At
Cost | | | At
Fair
Value | | | Fair Value
6/30/
2014 | | |
Assets | | | | | | | | | | | | | | | | | | | | | | | | | | | | |
Cash and cash equivalents | | | L&R | | | | 3,123 | | | | 3,123 | | | | | | | | | | | | 3,123 | | | | | |
Trade receivables | | | L&R | | | | 3,694 | | | | 3,577 | | | | | | | | | | | | 3,577 | | | | 117 | |
Other financial assets | | | | | | | 957 | | | | | | | | | | | | | | | | | | | | | |
Debt investments | | | L&R/AFS | | | | | | | | | | | | | | | | 30 | | | | 30 | | | | | |
Equity investments | | | AFS/- | | | | | | | | | | | | 0 | | | | 383 | | | | 383 | | | | 35 | |
Other non-derivative financial assets | | | L&R | | | | | | | | 208 | | | | | | | | | | | | 208 | | | | 132 | |
Derivative assets | | | | | | | | | | | | | | | | | | | | | | | | | | | | |
With hedging relationship | | | – | | | | | | | | | | | | | | | | 44 | | | | 44 | | | | | |
Without hedging relationship | | | HFT | | | | | | | | | | | | | | | | 123 | | | | 123 | | | | | |
Liabilities | | | | | | | | | | | | | | | | | | | | | | | | | | | | |
Trade payables | | | AC | | | | –896 | | | | –645 | | | | | | | | | | | | –645 | | | | –251 | |
Financial liabilities | | | | | | | –4,371 | | | | | | | | | | | | | | | | | | | | | |
Non-derivative financial liabilities | | | AC | | | | | | | | –4,303 | | | | | | | | | | | | –4,454 | | | | | |
Derivative liabilities | | | | | | | | | | | | | | | | | | | | | | | | | | | | |
With hedging relationship | | | – | | | | | | | | | | | | | | | | –11 | | | | –11 | | | | | |
Without hedging relationship | | | HFT | | | | | | | | | | | | | | | | –56 | | | | –56 | | | | | |
Total financial instruments, net | | | | | | | 2,507 | | | | 1,960 | | | | 0 | | | | 513 | | | | 2,322 | | | | 34 | |
Aggregation according to IAS 39 | | | | | | | | | | | | | | | | | | | | | | | | | | | | |
Financial assets | | | | | | | | | | | | | | | | | | | | | | | | | | | | |
At fair value through profit or loss | | | HFT | | | | 123 | | | | | | | | | | | | 123 | | | | 123 | | | | | |
Available-for-sale | | | AFS | | | | 413 | | | | | | | | 0 | | | | 413 | | | | 413 | | | | | |
Loans and receivables | | | L&R | | | | 7,025 | | | | 6,908 | | | | | | | | | | | | 6,908 | | | | 117 | |
Financial liabilities | | | | | | | | | | | | | | | | | | | | | | | | | | | | |
At fair value through profit or loss | | | HFT | | | | –56 | | | | | | | | | | | | –56 | | | | –56 | | | | | |
At amortized cost | | | AC | | | | –5,199 | | | | –4,948 | | | | | | | | | | | | –5,099 | | | | –251 | |
Outside scope of IAS 39 | | | | | | | | | | | | | | | | | | | | | | | | | | | | |
Financial instruments related to employee benefit plans | | | | | | | 132 | | | | | | | | | | | | | | | | | | | | 132 | |
Investment in associates | | | | | | | 35 | | | | | | | | | | | | | | | | | | | | 35 | |
Derivatives with hedging relationship | | | | | | | 32 | | | | | | | | | | | | 32 | | | | 32 | | | | | |
Total financial instruments, net | | | | | | | 2,507 | | | | 1,960 | | | | 0 | | | | 513 | | | | 2,322 | | | | 34 | |
| | |
| 44 | | CONSOLIDATED INTERIM FINANCIAL STATEMENTS – IFRS |
| | | | | | | | | | | | | | | | | | | | | | | | | | | | |
€ millions | | 2013 | |
| | | | | | Book Value
12/31/
2013 | | | | | | Measurement Categories | | | Fair Value
12/31/
2013 | | | Not in
Scope of
IFRS 7 | |
| | | Category | | | | | | At
Amortized
Cost | | | At Cost | | | At Fair
Value | | | | | | | |
Assets | | | | | | | | | | | | | | | | | | | | | | | | | | | | |
Cash and cash equivalents | | | L&R | | | | 2,748 | | | | 2,748 | | | | | | | | | | | | 2,748 | | | | | |
Trade receivables | | | L&R | | | | 3,963 | | | | 3,816 | | | | | | | | | | | | 3,816 | | | | 147 | |
Other financial assets | | | | | | | 858 | | | | | | | | | | | | | | | | | | | | | |
Debt investments | | | L&R/AFS | | | | | | | | | | | | | | | | 38 | | | | 38 | | | | | |
Equity investments | | | AFS/- | | | | | | | | | | | | 0 | | | | 322 | | | | 322 | | | | 36 | |
Other non-derivative financial assets | | | L&R | | | | | | | | 214 | | | | | | | | | | | | 214 | | | | 119 | |
Derivative assets | | | | | | | | | | | | | | | | | | | | | | | | | | | | |
With hedging relationship | | | – | | | | | | | | | | | | | | | | 35 | | | | 35 | | | | | |
Without hedging relationship | | | HFT | | | | | | | | | | | | | | | | 94 | | | | 94 | | | | | |
Liabilities | | | | | | | | | | | | | | | | | | | | | | | | | | | | |
Trade payables | | | AC | | | | –895 | | | | –640 | | | | | | | | | | | | –640 | | | | –255 | |
Financial liabilities | | | | | | | –4,506 | | | | | | | | | | | | | | | | | | | | | |
Non-derivative financial liabilities | | | AC | | | | | | | | –4,336 | | | | | | | | | | | | –4,439 | | | | | |
Derivative liabilities | | | | | | | | | | | | | | | | | | | | | | | | | | | | |
With hedging relationship | | | - | | | | | | | | | | | | | | | | –26 | | | | –26 | | | | | |
Without hedging relationship | | | HFT | | | | | | | | | | | | | | | | –144 | | | | –144 | | | | | |
Total financial instruments, net | | | | | | | 2,168 | | | | 1,802 | | | | 0 | | | | 319 | | | | 2,018 | | | | 47 | |
Aggregation according to IAS 39 | | | | | | | | | | | | | | | | | | | | | | | | | | | | |
Financial assets | | | | | | | | | | | | | | | | | | | | | | | | | | | | |
At fair value through profit or loss | | | HFT | | | | 94 | | | | | | | | | | | | 94 | | | | 94 | | | | | |
Available-for-sale | | | AFS | | | | 360 | | | | | | | | 0 | | | | 360 | | | | 360 | | | | | |
Loans and receivables | | | L&R | | | | 6,925 | | | | 6,778 | | | | | | | | | | | | 6,778 | | | | 147 | |
Financial liabilities | | | | | | | | | | | | | | | | | | | | | | | | | | | | |
At fair value through profit or loss | | | HFT | | | | –144 | | | | | | | | | | | | –144 | | | | –144 | | | | | |
At amortized cost | | | AC | | | | –5,231 | | | | –4,976 | | | | | | | | | | | | –5,079 | | | | –255 | |
Outside scope of IAS 39 | | | | | | | | | | | | | | | | | | | | | | | | | | | | |
Financial instruments related to employee benefit plans | | | | | | | 119 | | | | | | | | | | | | | | | | | | | | 119 | |
Investment in associates | | | | | | | 36 | | | | | | | | | | | | | | | | | | | | 36 | |
Derivatives with hedging relationship | | | | | | | 9 | | | | | | | | | | | | 9 | | | | 9 | | | | | |
Total financial instruments, net | | | | | | | 2,168 | | | | 1,802 | | | | 0 | | | | 319 | | | | 2,018 | | | | 47 | |
Determination of Fair Value
A detailed overview of the determination of fair value, the respective inputs as well as the classification of our other financial instruments into the fair value hierarchy of IFRS 13 are presented in Note (26) to our Consolidated Financial Statements for 2013, which are included in our 2013 Integrated Report, and our 2013 Annual Report on Form 20-F.
The following table allocates those financial assets and liabilities that are measured at fair value in accordance with IAS 39 either through profit or loss or other comprehensive income as of the reporting date, to the three levels of the fair value hierarchy according to IFRS 13.
| | |
| INTERIM REPORT JANUARY – JUNE 2014 | | 45 |
Classification of Financial Instruments
| | | | | | | | | | | | | | | | | | | | | | | | | | | | | | | | |
| | | June 30, 2014 | | | December 31, 2013 | |
€ millions | | Level 1 | | | Level 2 | | | Level 3 | | | Total | | | Level 1 | | | Level 2 | | | Level 3 | | | Total | |
Financial assets | | | | | | | | | | | | | | | | | | | | | | | | | | | | | | | | |
Corporate bonds | | | 21 | | | | 0 | | | | 0 | | | | 21 | | | | 29 | | | | 0 | | | | 0 | | | | 29 | |
Government securities | | | 2 | | | | 0 | | | | 0 | | | | 2 | | | | 2 | | | | 0 | | | | 0 | | | | 2 | |
Municipal bonds | | | 7 | | | | 0 | | | | 0 | | | | 7 | | | | 7 | | | | 0 | | | | 0 | | | | 7 | |
Debt investments | | | 30 | | | | 0 | | | | 0 | | | | 30 | | | | 38 | | | | 0 | | | | 0 | | | | 38 | |
Software industry | | | 96 | | | | 5 | | | | 282 | | | | 383 | | | | 52 | | | | 31 | | | | 239 | | | | 322 | |
Equity investments | | | 96 | | | | 5 | | | | 282 | | | | 383 | | | | 52 | | | | 31 | | | | 239 | | | | 322 | |
Available-for-sale financial assets | | | 126 | | | | 5 | | | | 282 | | | | 413 | | | | 90 | | | | 31 | | | | 239 | | | | 360 | |
FX forward contracts | | | 0 | | | | 69 | | | | 0 | | | | 69 | | | | 0 | | | | 56 | | | | 0 | | | | 56 | |
Interest rate swaps | | | 0 | | | | 40 | | | | 0 | | | | 40 | | | | 0 | | | | 5 | | | | 0 | | | | 5 | |
Call options for share-based payments | | | 0 | | | | 48 | | | | 0 | | | | 48 | | | | 0 | | | | 68 | | | | 0 | | | | 68 | |
Call option on equity shares | | | 0 | | | | 0 | | | | 10 | | | | 10 | | | | 0 | | | | 0 | | | | 0 | | | | 0 | |
Derivative financial assets | | | 0 | | | | 157 | | | | 10 | | | | 167 | | | | 0 | | | | 129 | | | | 0 | | | | 129 | |
Total | | | 126 | | | | 162 | | | | 292 | | | | 580 | | | | 90 | | | | 160 | | | | 239 | | | | 489 | |
Financial liabilities | | | | | | | | | | | | | | | | | | | | | | | | | | | | | | | | |
FX forward contracts | | | 0 | | | | 67 | | | | 0 | | | | 67 | | | | 0 | | | | 147 | | | | 0 | | | | 147 | |
Interest rate swaps | | | 0 | | | | 1 | | | | 0 | | | | 1 | | | | 0 | | | | 23 | | | | 0 | | | | 23 | |
Derivative financial liabilities | | | 0 | | | | 68 | | | | 0 | | | | 68 | | | | 0 | | | | 170 | | | | 0 | | | | 170 | |
Total | | | 0 | | | | 68 | | | | 0 | | | | 68 | | | | 0 | | | | 170 | | | | 0 | | | | 170 | |
It is our policy to recognize transfers at the beginning of the respective period when the event or change in circumstances occurred that caused the transfer.
| | |
| 46 | | CONSOLIDATED INTERIM FINANCIAL STATEMENTS – IFRS |
(19) Segment and Geographic Information
General Information
Our internal reporting system produces reports in which information regarding our business activities is presented in a variety of ways, for example, by line of business, geography, and areas of responsibility of the individual Board members. Based on these reports, the Executive Board, which is responsible for assessing the performance of our Company and for making resource allocation decisions as our Chief Operating Decision Maker (CODM), evaluates business activities in a number of different ways.
In the first quarter 2014, we took significant steps to drive forward our strategy and our ambition to become THE cloud company powered by SAP HANA. To execute this strategy, we merged certain areas of the company that performed similar tasks (for example, the on-premise sales forces with the cloud sales forces, and the on-premise support units with the cloud support units) to achieve a seamless organization of SAP. Since this integration our cloud-related activities are no longer dealt with by separate components in our Company. There are no parts of our Company that qualify as operating segments under IFRS 8 and our Executive Board assesses the financial performance of our Company on an integrated basis only.
Consequently, with effect from the first quarter of 2014 SAP has one single operating segment.
Geographic Information
In the first quarter of 2014, we aligned our revenue by region disclosures with the changes we made to the structure of our income statement (see our Interim Management Report, Report on Economic Position, for details regarding these changes). With the full integration of our cloud activities, we furthermore refined the method of allocating cloud subscription revenues to the different geographies. Comparative prior period data have been adjusted accordingly.
The amounts for revenue by region in the following tables are based on the location of customers.
Revenue by Region
Cloud Subscriptions and Support Revenue by Region
| | | | | | | | | | | | | | | | |
€ millions | | Q2 2014 | | | 1/1-
6/30/2014 | | | Q2 2013 | | | 1/1-
6/30/2013 | |
EMEA | | | 60 | | | | 114 | | | | 41 | | | | 81 | |
Americas | | | 160 | | | | 307 | | | | 103 | | | | 186 | |
APJ | | | 21 | | | | 40 | | | | 15 | | | | 29 | |
SAP Group | | | 241 | | | | 460 | | | | 159 | | | | 296 | |
Software and Software-Related Service Revenue by Region
| | | | | | | | | | | | | | | | |
€ millions | | Q2 2014 | | | 1/1-
6/30/2014 | | | Q2 2013 | | | 1/1-
6/30/2013 | |
EMEA | | | 1,632 | | | | 3,071 | | | | 1,528 | | | | 2,878 | |
Americas | | | 1,290 | | | | 2,471 | | | | 1,263 | | | | 2,355 | |
APJ | | | 555 | | | | 992 | | | | 527 | | | | 987 | |
SAP Group | | | 3,478 | | | | 6,533 | | | | 3,318 | | | | 6,220 | |
Total Revenue by Region
| | | | | | | | | | | | | | | | |
€ millions | | Q2 2014 | | | 1/1-
6/30/2014 | | | Q2 2013 | | | 1/1-
6/30/2013 | |
Germany | | | 597 | | | | 1,132 | | | | 593 | | | | 1,121 | |
Rest of EMEA | | | 1,369 | | | | 2,602 | | | | 1,277 | | | | 2,427 | |
EMEA | | | 1,967 | | | | 3,734 | | | | 1,869 | | | | 3,547 | |
United States | | | 1,162 | | | | 2,225 | | | | 1,138 | | | | 2,123 | |
Rest of Americas | | | 384 | | | | 740 | | | | 431 | | | | 816 | |
Americas | | | 1,546 | | | | 2,965 | | | | 1,569 | | | | 2,939 | |
Japan | | | 134 | | | | 264 | | | | 147 | | | | 299 | |
Rest of APJ | | | 504 | | | | 886 | | | | 477 | | | | 877 | |
APJ | | | 638 | | | | 1,149 | | | | 623 | | | | 1,177 | |
SAP Group | | | 4,151 | | | | 7,849 | | | | 4,062 | | | | 7,663 | |
| | |
| INTERIM REPORT JANUARY – JUNE 2014 | | 47 |
(20) Related Party Transactions
Certain Executive Board and Supervisory Board members of SAP SE currently hold (or have held within the last year) positions of significant responsibility with other entities (see our 2013 Annual Report, Notes to the Consolidated Financial Statements section, Note (29)). We have relationships with certain of these entities in the ordinary course of business whereby we buy and sell a wide variety of services and products at prices believed to be consistent with those negotiated at arm’s length between unrelated parties.
During the reporting period, we had no related party transactions that had a material effect on our business, financial position, or results in the reporting period.
For more information about related party transactions, see our 2013 Integrated Report, Notes to the Consolidated Financial Statements section, Note (30).
(21) Subsequent Events
No events have occurred after June 30, 2014, which have a material impact on the Company’s consolidated financial statements.
Release of the Interim Financial Statements
The Executive Board of SAP SE approved these Consolidated Interim Financial Statements for the period ended June 30, 2014, for issuance on July 16, 2014.
| | |
| 48 | | CONSOLIDATED INTERIM FINANCIAL STATEMENTS – IFRS |
RESPONSIBILITY STATEMENT
To the best of our knowledge, and in accordance with the applicable reporting principles for interim financial reporting, the interim consolidated financial statements give a true and fair view of the assets, liabilities, financial position and profit or loss of the SAP-Group, and the interim Management Report of the SAP-Group includes a fair review of the development and performance of the business and the position of the SAP-Group, together with a description of the material opportunities and risks associated with the expected development of the SAP-Group for the remaining months of the financial year.
Walldorf, July 16, 2014
SAP SE
Walldorf, Baden
The Executive Board
| | |
Bill McDermott | | Robert Enslin |
| |
Bernd Leukert | | Luka Mucic |
| |
Gerhard Oswald | | |
| | |
| INTERIM REPORT JANUARY – JUNE 2014 | | 49 |
SUPPLEMENTARY FINANCIAL INFORMATION
(UNAUDITED)
RECONCILIATION FROM NON-IFRS NUMBERS TO IFRS NUMBERS
The following tables present a reconciliation from our non-IFRS numbers (including our non-IFRS at constant currency numbers) to the respective most comparable IFRS numbers. Note: Our non-IFRS numbers are not prepared under a comprehensive set of accounting rules or principles.
| | | | | | | | | | | | | | | | | | | | | | | | | | | | | | | | | | | | | | | | | | | | |
| | | For the three months ended June 30 | |
€ millions, unless
otherwise stated | | 2014 | | | 2013 | | | Change in % | |
| | | IFRS | | | Adj.* | | | Non-IFRS* | | | Currency
Impact** | | | Non-IFRS
Constant
Currency** | | | IFRS | | | Adj.* | | | Non-IFRS* | | | IFRS | | | Non-IFRS* | | | Non-IFRS
Constant
Currency** | |
Revenue Numbers | | | | | | | | | | | | | | | | | | | | | | | | | | | | | | | | | | | | | | | | | | | | |
Cloud subscriptions and support | | | 241 | | | | 1 | | | | 242 | | | | 12 | | | | 254 | | | | 159 | | | | 24 | | | | 183 | | | | 52 | | | | 32 | | | | 39 | |
Software | | | 957 | | | | 0 | | | | 957 | | | | 29 | | | | 987 | | | | 982 | | | | 0 | | | | 982 | | | | –2 | | | | –2 | | | | 1 | |
Support | | | 2,279 | | | | 1 | | | | 2,280 | | | | 90 | | | | 2,370 | | | | 2,177 | | | | 5 | | | | 2,182 | | | | 5 | | | | 4 | | | | 9 | |
Software and support | | | 3,237 | | | | 1 | | | | 3,238 | | | | 119 | | | | 3,357 | | | | 3,159 | | | | 5 | | | | 3,164 | | | | 2 | | | | 2 | | | | 6 | |
Software and software-related service revenue | | | 3,478 | | | | 2 | | | | 3,480 | | | | 131 | | | | 3,611 | | | | 3,318 | | | | 29 | | | | 3,347 | | | | 5 | | | | 4 | | | | 8 | |
Professional services and other service revenue | | | 673 | | | | 0 | | | | 673 | | | | 26 | | | | 699 | | | | 744 | | | | 0 | | | | 744 | | | | –10 | | | | –10 | | | | –6 | |
thereof cloud-related | | | 54 | | | | 0 | | | | 54 | | | | 2 | | | | 56 | | | | 39 | | | | 0 | | | | 39 | | | | 39 | | | | 39 | | | | 44 | |
Total revenue | | | 4,151 | | | | 2 | | | | 4,153 | | | | 157 | | | | 4,310 | | | | 4,062 | | | | 29 | | | | 4,091 | | | | 2 | | | | 2 | | | | 5 | |
| | | | | | | | | | | |
Cloud subscriptions and support | | | 241 | | | | 1 | | | | 242 | | | | 12 | | | | 254 | | | | 159 | | | | 24 | | | | 183 | | | | 52 | | | | 32 | | | | 39 | |
Cloud-related professional services revenue | | | 54 | | | | 0 | | | | 54 | | | | 2 | | | | 56 | | | | 39 | | | | 0 | | | | 39 | | | | 39 | | | | 39 | | | | 44 | |
Cloud revenue | | | 295 | | | | 1 | | | | 296 | | | | 14 | | | | 310 | | | | 198 | | | | 24 | | | | 222 | | | | 49 | | | | 34 | | | | 40 | |
| | | | | | | | | | | |
Operating Expense Numbers | | | | | | | | | | | | | | | | | | | | | | | | | | | | | | | | | | | | | | | | | | | | |
Cost of software and software-related services | | | –698 | | | | 86 | | | | –612 | | | | | | | | | | | | –630 | | | | 76 | | | | –554 | | | | 11 | | | | 10 | | | | | |
thereof cloud | | | –105 | | | | 17 | | | | –87 | | | | | | | | | | | | –71 | | | | 21 | | | | –50 | | | | 47 | | | | 75 | | | | | |
Cost of professional services and other services | | | –591 | | | | 33 | | | | –559 | | | | | | | | | | | | –609 | | | | 23 | | | | –586 | | | | –3 | | | | –5 | | | | | |
Total cost of revenue | | | –1,289 | | | | 118 | | | | –1,171 | | | | | | | | | | | | –1,240 | | | | 99 | | | | –1,140 | | | | 4 | | | | 3 | | | | | |
Gross profit | | | 2,862 | | | | 120 | | | | 2,982 | | | | | | | | | | | | 2,822 | | | | 129 | | | | 2,951 | | | | 1 | | | | 1 | | | | | |
Research and development | | | –566 | | | | 35 | | | | –531 | | | | | | | | | | | | –567 | | | | 17 | | | | –551 | | | | 0 | | | | –3 | | | | | |
Sales and marketing | | | –1,049 | | | | 43 | | | | –1,006 | | | | | | | | | | | | –1,059 | | | | 44 | | | | –1,015 | | | | –1 | | | | –1 | | | | | |
General and administration | | | –218 | | | | 12 | | | | –206 | | | | | | | | | | | | –232 | | | | 24 | | | | –208 | | | | –6 | | | | –1 | | | | | |
Restructuring | | | –39 | | | | 39 | | | | 0 | | | | | | | | | | | | –17 | | | | 17 | | | | 0 | | | | >100 | | | | 0 | | | | | |
TomorrowNow and Versata litigation | | | –289 | | | | 289 | | | | 0 | | | | | | | | | | | | 33 | | | | –33 | | | | 0 | | | | <-100 | | | | 0 | | | | | |
Other operating income/expense, net | | | –3 | | | | 0 | | | | –3 | | | | | | | | | | | | 9 | | | | 0 | | | | 9 | | | | <-100 | | | | <-100 | | | | | |
Total operating expenses | | | –3,453 | | | | 536 | | | | –2,917 | | | | –119 | | | | –3,036 | | | | –3,074 | | | | 168 | | | | –2,905 | | | | 12 | | | | 0 | | | | 5 | |
| | |
| 50 | | SUPPLEMENTARY FINANCIAL INFORMATION |
| | | | | | | | | | | | | | | | | | | | | | | | | | | | | | | | | | | | | | | | | | | | |
| | | For the three months ended June 30 | |
€ millions, unless
otherwise stated | | 2014 | | | 2013 | | | Change in % | |
| | | IFRS | | | Adj.* | | | Non-IFRS* | | | Currency
Impact** | | | Non-IFRS
Constant
Currency** | | | IFRS | | | Adj.* | | | Non-IFRS* | | | IFRS | | | Non-IFRS* | | | Non-IFRS
Constant
Currency** | |
Profit Numbers | | | | | | | | | | | | | | | | | | | | | | | | | | | | | | | | | | | | | | | | | | | | |
Operating profit | | | 698 | | | | 538 | | | | 1,236 | | | | 38 | | | | 1,273 | | | | 988 | | | | 198 | | | | 1,186 | | | | –29 | | | | 4 | | | | 7 | |
Other non-operating income/expense, net | | | 4 | | | | 0 | | | | 4 | | | | | | | | | | | | –2 | | | | 0 | | | | –2 | | | | <-100 | | | | <-100 | | | | | |
Finance income | | | 47 | | | | 0 | | | | 47 | | | | | | | | | | | | 26 | | | | 0 | | | | 26 | | | | 79 | | | | 79 | | | | | |
Finance costs | | | –30 | | | | 0 | | | | –30 | | | | | | | | | | | | –49 | | | | 0 | | | | –49 | | | | –39 | | | | –39 | | | | | |
Financial income, net | | | 17 | | | | 0 | | | | 17 | | | | | | | | | | | | –23 | | | | 0 | | | | –23 | | | | <-100 | | | | <-100 | | | | | |
Profit before tax | | | 719 | | | | 538 | | | | 1,257 | | | | | | | | | | | | 963 | | | | 198 | | | | 1,161 | | | | –25 | | | | 8 | | | | | |
Income tax TomorrowNow and Versata litigation | | | 76 | | | | –76 | | | | 0 | | | | | | | | | | | | –9 | | | | 9 | | | | 0 | | | | <-100 | | | | >100 | | | | | |
Other income tax expense | | | –239 | | | | –80 | | | | –319 | | | | | | | | | | | | –230 | | | | –81 | | | | –311 | | | | 4 | | | | 3 | | | | | |
Income tax expense | | | –163 | | | | –156 | | | | –319 | | | | | | | | | | | | –239 | | | | –72 | | | | –311 | | | | –32 | | | | 3 | | | | | |
Profit after tax | | | 556 | | | | 382 | | | | 938 | | | | | | | | | | | | 724 | | | | 125 | | | | 850 | | | | –23 | | | | 10 | | | | | |
Profit attributable to non-controlling interests | | | –1 | | | | 0 | | | | –1 | | | | | | | | | | | | 0 | | | | 0 | | | | 0 | | | | 38 | | | | 38 | | | | | |
Profit attributable to owners of parent | | | 557 | | | | 382 | | | | 939 | | | | | | | | | | | | 725 | | | | 125 | | | | 850 | | | | –23 | | | | 10 | | | | | |
| | | | | | | | | | | |
Key Ratios | | | | | | | | | | | | | | | | | | | | | | | | | | | | | | | | | | | | | | | | | | | | |
Operating margin (in %) | | | 16.8 | | | | | | | | 29.8 | | | | | | | | 29.5 | | | | 24.3 | | | | | | | | 29.0 | | | | –7.5pp | | | | 0.8pp | | | | 0.6pp | |
Effective tax rate (in %) | | | 22.6 | | | | | | | | 25.4 | | | | | | | | | | | | 24.8 | | | | | | | | 26.8 | | | | –2.2pp | | | | –1.4pp | | | | | |
Earnings per share, basic (in €) | | | 0.47 | | | | | | | | 0.79 | | | | | | | | | | | | 0.61 | | | | | | | | 0.71 | | | | –23 | | | | 10 | | | | | |
| | |
| INTERIM REPORT JANUARY – JUNE 2014 | | 51 |
| | | | | | | | | | | | | | | | | | | | | | | | | | | | | | | | | | | | | | | | | | | | |
| | | For the six months ended June 30 | |
€ millions, unless
otherwise stated | | 2014 | | | 2013 | | | Change in % | |
| | | IFRS | | | Adj.* | | | Non-IFRS* | | | Currency
Impact** | | | Non-IFRS
Constant
Currency** | | | IFRS | | | Adj.* | | | Non-IFRS* | | | IFRS | | | Non-IFRS* | | | Non-IFRS
Constant
Currency** | |
Revenue Numbers | | | | | | | | | | | | | | | | | | | | | | | | | | | | | | | | | | | | | | | | | | | | |
Cloud subscriptions and support | | | 460 | | | | 2 | | | | 463 | | | | 22 | | | | 485 | | | | 296 | | | | 54 | | | | 350 | | | | 55 | | | | 32 | | | | 38 | |
Software | | | 1,581 | | | | 0 | | | | 1,581 | | | | 67 | | | | 1,647 | | | | 1,638 | | | | 0 | | | | 1,638 | | | | –4 | | | | –4 | | | | 1 | |
Support | | | 4,492 | | | | 3 | | | | 4,495 | | | | 173 | | | | 4,667 | | | | 4,286 | | | | 10 | | | | 4,295 | | | | 5 | | | | 5 | | | | 9 | |
Software and support | | | 6,072 | | | | 3 | | | | 6,075 | | | | 239 | | | | 6,315 | | | | 5,924 | | | | 10 | | | | 5,934 | | | | 3 | | | | 2 | | | | 6 | |
Software and software-related service revenue | | | 6,533 | | | | 5 | | | | 6,538 | | | | 261 | | | | 6,800 | | | | 6,220 | | | | 64 | | | | 6,284 | | | | 5 | | | | 4 | | | | 8 | |
Professional services and other service revenue | | | 1,316 | | | | 0 | | | | 1,316 | | | | 56 | | | | 1,372 | | | | 1,443 | | | | 0 | | | | 1,443 | | | | –9 | | | | –9 | | | | –5 | |
thereof cloud-related | | | 98 | | | | 0 | | | | 98 | | | | 4 | | | | 102 | | | | 82 | | | | 0 | | | | 82 | | | | 19 | | | | 19 | | | | 24 | |
Total revenue | | | 7,849 | | | | 5 | | | | 7,854 | | | | 318 | | | | 8,172 | | | | 7,663 | | | | 64 | | | | 7,727 | | | | 2 | | | | 2 | | | | 6 | |
Cloud subscriptions and support | | | 460 | | | | 2 | | | | 463 | | | | 22 | | | | 485 | | | | 296 | | | | 54 | | | | 350 | | | | 55 | | | | 32 | | | | 38 | |
Cloud-related professional services revenue | | | 98 | | | | 0 | | | | 98 | | | | 4 | | | | 102 | | | | 82 | | | | 0 | | | | 82 | | | | 19 | | | | 19 | | | | 24 | |
Cloud revenue | | | 558 | | | | 2 | | | | 560 | | | | 26 | | | | 587 | | | | 378 | | | | 54 | | | | 433 | | | | 47 | | | | 30 | | | | 36 | |
| | | | | | | | | | | |
Operating Expense Numbers | | | | | | | | | | | | | | | | | | | | | | | | | | | | | | | | | | | | | | | | | | | | |
Cost of software and software-related services | | | –1,343 | | | | 165 | | | | –1,178 | | | | | | | | | | | | –1,234 | | | | 173 | | | | –1,060 | | | | 9 | | | | 11 | | | | | |
thereof cloud | | | –188 | | | | 36 | | | | –152 | | | | | | | | | | | | –154 | | | | 58 | | | | –96 | | | | 22 | | | | 58 | | | | | |
Cost of professional services and other services | | | –1,182 | | | | 58 | | | | –1,124 | | | | | | | | | | | | –1,215 | | | | 51 | | | | –1,164 | | | | –3 | | | | –3 | | | | | |
Total cost of revenue | | | –2,525 | | | | 223 | | | | –2,302 | | | | | | | | | | | | –2,448 | | | | 224 | | | | –2,224 | | | | 3 | | | | 4 | | | | | |
Gross profit | | | 5,324 | | | | 228 | | | | 5,552 | | | | | | | | | | | | 5,215 | | | | 288 | | | | 5,503 | | | | 2 | | | | 1 | | | | | |
Research and development | | | –1,116 | | | | 58 | | | | –1,057 | | | | | | | | | | | | –1,124 | | | | 38 | | | | –1,086 | | | | –1 | | | | –3 | | | | | |
Sales and marketing | | | –2,016 | | | | 77 | | | | –1,939 | | | | | | | | | | | | –2,034 | | | | 96 | | | | –1,939 | | | | –1 | | | | 0 | | | | | |
General and administration | | | –423 | | | | 27 | | | | –396 | | | | | | | | | | | | –429 | | | | 33 | | | | –396 | | | | –1 | | | | 0 | | | | | |
Restructuring | | | –54 | | | | 54 | | | | 0 | | | | | | | | | | | | –31 | | | | 31 | | | | 0 | | | | 78 | | | | 0 | | | | | |
TomorrowNow and Versata litigation | | | –290 | | | | 290 | | | | 0 | | | | | | | | | | | | 32 | | | | –32 | | | | 0 | | | | <-100 | | | | 0 | | | | | |
Other operating income/expense, net | | | –4 | | | | 0 | | | | –4 | | | | | | | | | | | | 5 | | | | 0 | | | | 5 | | | | <-100 | | | | <-100 | | | | | |
Total operating expenses | | | –6,428 | | | | 729 | | | | –5,699 | | | | –237 | | | | –5,936 | | | | –6,029 | | | | 390 | | | | –5,639 | | | | 7 | | | | 1 | | | | 5 | |
| | |
| 52 | | SUPPLEMENTARY FINANCIAL INFORMATION |
| | | | | | | | | | | | | | | | | | | | | | | | | | | | | | | | | | | | | | | | | | | | |
| | | For the six months ended June 30 | |
€ millions, unless
otherwise stated | | 2014 | | | 2013 | | | Change in % | |
| | | IFRS | | | Adj.* | | | Non-IFRS* | | | Currency
Impact** | | | Non-IFRS
Constant
Currency** | | | IFRS | | | Adj.* | | | Non-IFRS* | | | IFRS | | | Non-IFRS* | | | Non-IFRS
Constant
Currency** | |
Profit Numbers | | | | | | | | | | | | | | | | | | | | | | | | | | | | | | | | | | | | | | | | | | | | |
Operating profit | | | 1,421 | | | | 735 | | | | 2,155 | | | | 81 | | | | 2,236 | | | | 1,634 | | | | 454 | | | | 2,088 | | | | –13 | | | | 3 | | | | 7 | |
Other non-operating income/expense, net | | | –7 | | | | 0 | | | | –7 | | | | | | | | | | | | –13 | | | | 0 | | | | –13 | | | | –48 | | | | –48 | | | | | |
Finance income | | | 69 | | | | 0 | | | | 69 | | | | | | | | | | | | 56 | | | | 0 | | | | 56 | | | | 24 | | | | 24 | | | | | |
Finance costs | | | –61 | | | | 0 | | | | –61 | | | | | | | | | | | | –93 | | | | 0 | | | | –93 | | | | –35 | | | | –35 | | | | | |
Financial income, net | | | 9 | | | | 0 | | | | 9 | | | | | | | | | | | | –37 | | | | 0 | | | | –37 | | | | <-100 | | | | <-100 | | | | | |
Profit before tax | | | 1,423 | | | | 735 | | | | 2,157 | | | | | | | | | | | | 1,584 | | | | 454 | | | | 2,038 | | | | –10 | | | | 6 | | | | | |
Income tax TomorrowNow and Versata litigation | | | 77 | | | | –77 | | | | 0 | | | | | | | | | | | | –9 | | | | 9 | | | | 0 | | | | <-100 | | | | >100 | | | | | |
Other income tax expense | | | –409 | | | | –144 | | | | –553 | | | | | | | | | | | | –331 | | | | –168 | | | | –499 | | | | 23 | | | | 11 | | | | | |
Income tax expense | | | –332 | | | | –221 | | | | –553 | | | | | | | | | | | | –340 | | | | –159 | | | | –499 | | | | –2 | | | | 11 | | | | | |
Profit after tax | | | 1,090 | | | | 514 | | | | 1,604 | | | | | | | | | | | | 1,244 | | | | 295 | | | | 1,539 | | | | –12 | | | | 4 | | | | | |
Profit attributable to non-controlling interests | | | –1 | | | | 0 | | | | –1 | | | | | | | | | | | | 0 | | | | 0 | | | | 0 | | | | >100 | | | | >100 | | | | | |
Profit attributable to owners of parent | | | 1,091 | | | | 514 | | | | 1,605 | | | | | | | | | | | | 1,245 | | | | 295 | | | | 1,540 | | | | –12 | | | | 4 | | | | | |
| | | | | | | | | | | |
Key Ratios | | | | | | | | | | | | | | | | | | | | | | | | | | | | | | | | | | | | | | | | | | | | |
Operating margin (in %) | | | 18.1 | | | | | | | | 27.4 | | | | | | | | 27.4 | | | | 21.3 | | | | | | | | 27.0 | | | | –3.2pp | | | | 0.4pp | | | | 0.3pp | |
Effective tax rate (in %) | | | 23.4 | | | | | | | | 25.6 | | | | | | | | | | | | 21.5 | | | | | | | | 24.5 | | | | 1.9pp | | | | 1.2pp | | | | | |
Earnings per share, basic (in €) | | | 0.91 | | | | | | | | 1.34 | | | | | | | | | | | | 1.04 | | | | | | | | 1.29 | | | | –12 | | | | 4 | | | | | |
| * | Adjustments in the revenue line items are for support revenue, cloud subscriptions and support revenue, and other similarly recurring revenues that entities acquired by SAP would have recognized had they remained stand-alone entities but that SAP is not permitted to recognize as revenue under IFRS as a result of business combination accounting rules. Adjustments in the operating expense line items are for acquisition-related charges, share-based compensation expenses, restructuring expenses, discontinued activities, and the Versata litigation. |
| ** | Constant currency revenue and operating income figures are calculated by translating revenue and operating income of the current period using the average exchange rates from the previous year’s respective period instead of the current period. Constant currency period-over-period changes are calculated by comparing the current year’s non-IFRS constant currency numbers with the non-IFRS number of the previous year’s respective period. |
For a more detailed description of these adjustments and their limitations as well as our constant currency figures, see our Web site www.sap.com/corporate-en/investors/newsandreports/reporting-framework.epx under “Non-IFRS Measures and Estimates”.
Due to rounding, numbers may not add up precisely.
| | |
| INTERIM REPORT JANUARY – JUNE 2014 | | 53 |
CALCULATED CLOUD BILLINGS
The following table presents the calculated cloud billings metric which we define as the total of a period’s cloud subscription and support revenue and of the respective period’s change in the deferred cloud subscription and support revenue balance. The table also reconciles the non-IFRS calculated cloud billings metric (including our non-IFRS at constant currency metric) to the respective IFRS based calculated cloud billings metric.
| | | | | | | | | | | | | | | | | | | | | | | | | | | | | | | | | | | | | | | | |
| | | For the three months ended June 30 | |
€ millions, unless otherwise stated | | 2014 | | | 2013 | |
| | | IFRS | | | Adj.* | | | Non-
IFRS* | | | Currency
Impact** | | | Non-IFRS
Cons tant
Currency** | | | IFRS | | | Adj.* | | | Non-
IFRS* | | | Currency
Impact** | | | Non-IFRS
Constant
Currency** | |
Cloud subscriptions and support | | | 241 | | | | 1 | | | | 242 | | | | 12 | | | | 254 | | | | 159 | | | | 24 | | | | 183 | | | | 0 | | | | 183 | |
Closing balance deferred cloud subscriptions and support | | | 445 | | | | 3 | | | | 448 | | | | 30 | | | | 478 | | | | 354 | | | | 7 | | | | 361 | | | | 9 | | | | 370 | |
Opening balance deferred cloud subscriptions and support | | | 451 | | | | 3 | | | | 454 | | | | 37 | | | | 491 | | | | 344 | | | | 33 | | | | 377 | | | | 0 | | | | 377 | |
Change in deferred cloud subscriptions and support | | | –6 | | | | 0 | | | | –6 | | | | –7 | | | | –13 | | | | 10 | | | | –26 | | | | –16 | | | | 9 | | | | –7 | |
Calculated cloud billings | | | 235 | | | | 1 | | | | 236 | | | | 5 | | | | 241 | | | | 169 | | | | –2 | | | | 167 | | | | 9 | | | | 176 | |
| | | | | | | | | | |
Year-over-year changes (2014 vs. 2013, in %) | | | 39 | % | | | | | | | 41 | % | | | | | | | 37 | % | | | | | | | | | | | | | | | | | | | | |
| * | Adjustments in the revenue and deferred revenue line items are for cloud subscriptions and support revenue, and other similarly recurring revenues that entities acquired by SAP would have recognized had they remained stand-alone entities but that SAP is not permitted to recognize as revenue under IFRS as a result of business combination accounting rules. |
| ** | Constant currency revenue figures are calculated by translating revenue of the current period using the average exchange rates from the previous year’s respective period instead of the current period. Constant currency deferred revenue balances are calculated by translating the current period’s opening and closing deferred revenue balances as well as the comparative period’s closing deferred revenue balance using the opening exchange rates of the comparative period. |
For a more detailed description of these adjustments and their limitations as well as our constant currency figures, see our Web site www.sap.com/corporate-en/investors/newsandreports/reporting-framework.epx under “Non-IFRS Measures and Estimates”.
Due to rounding, numbers may not add up precisely.
| | |
| 54 | | SUPPLEMENTARY FINANCIAL INFORMATION |
REVENUE BY REGION
The following tables present our IFRS and non-IFRS revenue by region based on customer location. The tables also present a reconciliation from our non-IFRS revenue (including our non-IFRS revenue at constant currency) to the respective most comparable IFRS revenue.
Note: Our non-IFRS revenues are not prepared under a comprehensive set of accounting rules or principles.
| | | | | | | | | | | | | | | | | | | | | | | | | | | | | | | | | | | | | | | | | | | | |
| | | For the three months ended June 30 | |
€ millions | | 2014 | | | 2013 | | | Change in % | |
| | | IFRS | | | Adj.* | | | Non-IFRS* | | | Currency
Impact** | | | Non-IFRS
Constant
Currency** | | | IFRS | | | Adj.* | | | Non-IFRS* | | | IFRS | | | Non-IFRS* | | | Non-IFRS
Constant
Currency** | |
Cloud subscriptions and support revenue by region | | | | | | | | | | | | | | | | | | | | | | | | | | | | | | | | | | | | | | | | | | | | |
EMEA | | | 60 | | | | 0 | | | | 60 | | | | 2 | | | | 61 | | | | 41 | | | | 0 | | | | 41 | | | | 47 | | | | 47 | | | | 51 | |
Americas | | | 160 | | | | 1 | | | | 162 | | | | 9 | | | | 170 | | | | 103 | | | | 24 | | | | 127 | | | | 55 | | | | 27 | | | | 34 | |
APJ | | | 21 | | | | 0 | | | | 21 | | | | 1 | | | | 22 | | | | 15 | | | | 0 | | | | 15 | | | | 38 | | | | 38 | | | | 48 | |
Cloud subscriptions and support revenue | | | 241 | | | | 1 | | | | 242 | | | | 12 | | | | 254 | | | | 159 | | | | 24 | | | | 183 | | | | 52 | | | | 32 | | | | 39 | |
| | | | | | | | | | | |
Software and software-related service revenue by region | | | | | | | | | | | | | | | | | | | | | | | | | | | | | | | | | | | | | | | | | | | | |
EMEA | | | 1,632 | | | | 1 | | | | 1,633 | | | | 17 | | | | 1,650 | | | | 1,528 | | | | 0 | | | | 1,528 | | | | 7 | | | | 7 | | | | 8 | |
Americas | | | 1,290 | | | | 2 | | | | 1,292 | | | | 77 | | | | 1,369 | | | | 1,263 | | | | 29 | | | | 1,292 | | | | 2 | | | | 0 | | | | 6 | |
APJ | | | 555 | | | | 0 | | | | 555 | | | | 37 | | | | 592 | | | | 527 | | | | 0 | | | | 527 | | | | 5 | | | | 5 | | | | 12 | |
Software and software-related service revenue | | | 3,478 | | | | 2 | | | | 3,480 | | | | 131 | | | | 3,611 | | | | 3,318 | | | | 29 | | | | 3,347 | | | | 5 | | | | 4 | | | | 8 | |
| | | | | | | | | | | |
Total revenue by region | | | | | | | | | | | | | | | | | | | | | | | | | | | | | | | | | | | | | | | | | | | | |
Germany | | | 597 | | | | 0 | | | | 597 | | | | 0 | | | | 598 | | | | 593 | | | | 0 | | | | 593 | | | | 1 | | | | 1 | | | | 1 | |
Rest of EMEA | | | 1,369 | | | | 1 | | | | 1,370 | | | | 21 | | | | 1,391 | | | | 1,277 | | | | 0 | | | | 1,277 | | | | 7 | | | | 7 | | | | 9 | |
Total EMEA | | | 1,967 | | | | 1 | | | | 1,967 | | | | 21 | | | | 1,989 | | | | 1,869 | | | | 0 | | | | 1,869 | | | | 5 | | | | 5 | | | | 6 | |
United States | | | 1,162 | | | | 2 | | | | 1,163 | | | | 54 | | | | 1,217 | | | | 1,138 | | | | 29 | | | | 1,167 | | | | 2 | | | | 0 | | | | 4 | |
Rest of Americas | | | 384 | | | | 0 | | | | 384 | | | | 40 | | | | 424 | | | | 431 | | | | 0 | | | | 431 | | | | –11 | | | | –11 | | | | –2 | |
Total Americas | | | 1,546 | | | | 2 | | | | 1,547 | | | | 94 | | | | 1,641 | | | | 1,569 | | | | 29 | | | | 1,599 | | | | –2 | | | | –3 | | | | 3 | |
Japan | | | 134 | | | | 0 | | | | 134 | | | | 11 | | | | 146 | | | | 147 | | | | 0 | | | | 147 | | | | –8 | | | | –8 | | | | –1 | |
Rest of APJ | | | 504 | | | | 0 | | | | 504 | | | | 31 | | | | 535 | | | | 477 | | | | 0 | | | | 477 | | | | 6 | | | | 6 | | | | 12 | |
Total APJ | | | 638 | | | | 0 | | | | 638 | | | | 42 | | | | 681 | | | | 623 | | | | 0 | | | | 623 | | | | 2 | | | | 2 | | | | 9 | |
Total revenue | | | 4,151 | | | | 2 | | | | 4,153 | | | | 157 | | | | 4,310 | | | | 4,062 | | | | 29 | | | | 4,091 | | | | 2 | | | | 2 | | | | 5 | |
| | |
| INTERIM REPORT JANUARY – JUNE 2014 | | 55 |
| | | | | | | | | | | | | | | | | | | | | | | | | | | | | | | | | | | | | | | | | | | | |
| | | For the six months ended June 30 | |
€ millions | | 2014 | | | 2013 | | | Change in % | |
| | | IFRS | | | Adj.* | | | Non-IFRS* | | | Currency
Impact** | | | Non-IFRS
Constant
Currency** | | | IFRS | | | Adj.* | | | Non-IFRS* | | | IFRS | | | Non-IFRS* | | | Non-IFRS
Constant
Currency** | |
Cloud subscriptions and support revenue by region | | | | | | | | | | | | | | | | | | | | | | | | | | | | | | | | | | | | | | | | | | | | |
EMEA | | | 114 | | | | 0 | | | | 114 | | | | 3 | | | | 117 | | | | 81 | | | | 0 | | | | 81 | | | | 41 | | | | 41 | | | | 45 | |
Americas | | | 307 | | | | 2 | | | | 309 | | | | 16 | | | | 325 | | | | 186 | | | | 54 | | | | 241 | | | | 65 | | | | 29 | | | | 35 | |
APJ | | | 40 | | | | 0 | | | | 40 | | | | 3 | | | | 42 | | | | 29 | | | | 0 | | | | 29 | | | | 36 | | | | 36 | | | | 46 | |
Cloud subscriptions and support revenue | | | 460 | | | | 2 | | | | 463 | | | | 22 | | | | 485 | | | | 296 | | | | 54 | | | | 350 | | | | 55 | | | | 32 | | | | 38 | |
| | | | | | | | | | | |
Software and software-related service revenue by region | | | | | | | | | | | | | | | | | | | | | | | | | | | | | | | | | | | | | | | | | | | | |
EMEA | | | 3,071 | | | | 2 | | | | 3,072 | | | | 41 | | | | 3,113 | | | | 2,878 | | | | 0 | | | | 2,878 | | | | 7 | | | | 7 | | | | 8 | |
Americas | | | 2,471 | | | | 3 | | | | 2,474 | | | | 140 | | | | 2,614 | | | | 2,355 | | | | 64 | | | | 2,419 | | | | 5 | | | | 2 | | | | 8 | |
APJ | | | 992 | | | | 0 | | | | 992 | | | | 81 | | | | 1,073 | | | | 987 | | | | 0 | | | | 987 | | | | 1 | | | | 1 | | | | 9 | |
Software and software-related service revenue | | | 6,533 | | | | 5 | | | | 6,538 | | | | 261 | | | | 6,800 | | | | 6,220 | | | | 64 | | | | 6,284 | | | | 5 | | | | 4 | | | | 8 | |
| | | | | | | | | | | |
Total revenue by region | | | | | | | | | | | | | | | | | | | | | | | | | | | | | | | | | | | | | | | | | | | | |
Germany | | | 1,132 | | | | 0 | | | | 1,132 | | | | 1 | | | | 1,133 | | | | 1,121 | | | | 0 | | | | 1,121 | | | | 1 | | | | 1 | | | | 1 | |
Rest of EMEA | | | 2,602 | | | | 1 | | | | 2,604 | | | | 51 | | | | 2,655 | | | | 2,427 | | | | 0 | | | | 2,427 | | | | 7 | | | | 7 | | | | 9 | |
Total EMEA | | | 3,734 | | | | 2 | | | | 3,736 | | | | 51 | | | | 3,787 | | | | 3,547 | | | | 0 | | | | 3,547 | | | | 5 | | | | 5 | | | | 7 | |
United States | | | 2,225 | | | | 3 | | | | 2,228 | | | | 98 | | | | 2,326 | | | | 2,123 | | | | 64 | | | | 2,187 | | | | 5 | | | | 2 | | | | 6 | |
Rest of Americas | | | 740 | | | | 0 | | | | 740 | | | | 73 | | | | 813 | | | | 816 | | | | 0 | | | | 816 | | | | –9 | | | | –9 | | | | 0 | |
Total Americas | | | 2,965 | | | | 3 | | | | 2,968 | | | | 171 | | | | 3,139 | | | | 2,939 | | | | 64 | | | | 3,003 | | | | 1 | | | | –1 | | | | 5 | |
Japan | | | 264 | | | | 0 | | | | 264 | | | | 30 | | | | 294 | | | | 299 | | | | 0 | | | | 299 | | | | –12 | | | | –12 | | | | –2 | |
Rest of APJ | | | 886 | | | | 0 | | | | 886 | | | | 65 | | | | 950 | | | | 877 | | | | 0 | | | | 877 | | | | 1 | | | | 1 | | | | 8 | |
Total APJ | | | 1,149 | | | | 0 | | | | 1,150 | | | | 95 | | | | 1,245 | | | | 1,177 | | | | 0 | | | | 1,177 | | | | –2 | | | | –2 | | | | 6 | |
Total revenue | | | 7,849 | | | | 5 | | | | 7,854 | | | | 318 | | | | 8,172 | | | | 7,663 | | | | 64 | | | | 7,727 | | | | 2 | | | | 2 | | | | 6 | |
| * | Adjustments in the revenue line items are for support revenue, cloud subscriptions and support revenue, and other similarly recurring revenues that entities acquired by SAP would have recognized had they remained stand-alone entities but that SAP is not permitted to recognize as revenue under IFRS as a result of business combination accounting rules. |
| ** | Constant currency revenue figures are calculated by translating revenue of the current period using the average exchange rates from the previous year’s respective period instead of the current period. Constant currency period-over-period changes are calculated by comparing the current year’s non-IFRS constant currency numbers with the non-IFRS number of the previous year’s respective period. |
For a more detailed description of these adjustments and their limitations as well as our constant currency figures, see our Web site www.sap.com/corporate-en/investors/newsandreports/reporting-framework.epx under “Non-IFRS Measures and Estimates”.
Due to rounding, numbers may not add up precisely.
| | |
| 56 | | SUPPLEMENTARY FINANCIAL INFORMATION |
MULTI-QUARTER SUMMARY
(IFRS AND NON-IFRS)
| | | | | | | | | | | | | | | | | | | | | | | | | | | | | | |
€ millions, unless otherwise stated | | Q1 2013 | | | Q2 2013 | | | Q3 2013 | | | Q4 2013 | | | TY 2013 | | | Q1 2014 | | | Q2 2014 | | | |
Cloud subscriptions and support (IFRS) | | | 137 | | | | 159 | | | | 191 | | | | 208 | | | | 696 | | | | 219 | | | | 241 | | | |
Revenue adjustment* | | | 30 | | | | 24 | | | | 5 | | | | 1 | | | | 61 | | | | 1 | | | | 1 | | | |
Cloud subscriptions and support (non-IFRS) | | | 167 | | | | 183 | | | | 197 | | | | 210 | | | | 757 | | | | 221 | | | | 242 | | | |
Software (IFRS) | | | 657 | | | | 982 | | | | 975 | | | | 1,902 | | | | 4,516 | | | | 623 | | | | 957 | | | |
Revenue adjustment* | | | 0 | | | | 0 | | | | 2 | | | | 0 | | | | 2 | | | | 0 | | | | 0 | | | |
Software (non-IFRS) | | | 657 | | | | 982 | | | | 977 | | | | 1,903 | | | | 4,518 | | | | 623 | | | | 957 | | | |
Support (IFRS) | | | 2,109 | | | | 2,177 | | | | 2,184 | | | | 2,268 | | | | 8,738 | | | | 2,213 | | | | 2,279 | | | |
Revenue adjustment* | | | 4 | | | | 5 | | | | 5 | | | | 5 | | | | 19 | | | | 2 | | | | 1 | | | |
Support (non-IFRS) | | | 2,113 | | | | 2,182 | | | | 2,189 | | | | 2,272 | | | | 8,756 | | | | 2,214 | | | | 2,280 | | | |
Software and support (IFRS) | | | 2,765 | | | | 3,159 | | | | 3,159 | | | | 4,170 | | | | 13,254 | | | | 2,836 | | | | 3,237 | | | |
Revenue adjustment* | | | 4 | | | | 5 | | | | 7 | | | | 5 | | | | 21 | | | | 2 | | | | 1 | | | |
Software and support (non-IFRS) | | | 2,770 | | | | 3,164 | | | | 3,166 | | | | 4,175 | | | | 13,275 | | | | 2,838 | | | | 3,238 | | | |
Software and software-related service revenue (IFRS) | | | 2,903 | | | | 3,318 | | | | 3,351 | | | | 4,378 | | | | 13,950 | | | | 3,055 | | | | 3,478 | | | |
Revenue adjustment* | | | 35 | | | | 29 | | | | 12 | | | | 6 | | | | 82 | | | | 3 | | | | 2 | | | |
Software and software-related service revenue (non-IFRS) | | | 2,937 | | | | 3,347 | | | | 3,363 | | | | 4,385 | | | | 14,032 | | | | 3,058 | | | | 3,480 | | | |
Consulting | | | 557 | | | | 580 | | | | 553 | | | | 553 | | | | 2,242 | | | | 508 | | | | 520 | | | |
Other services | | | 142 | | | | 165 | | | | 142 | | | | 175 | | | | 623 | | | | 134 | | | | 153 | | | |
Professional services and other service revenue (IFRS = non-IFRS) | | | 698 | | | | 744 | | | | 695 | | | | 728 | | | | 2,865 | | | | 643 | | | | 673 | | | |
Total revenue (IFRS) | | | 3,601 | | | | 4,062 | | | | 4,045 | | | | 5,106 | | | | 16,815 | | | | 3,698 | | | | 4,151 | | | |
Revenue adjustment* | | | 35 | | | | 29 | | | | 12 | | | | 6 | | | | 82 | | | | 3 | | | | 2 | | | |
Total revenue (non-IFRS) | | | 3,636 | | | | 4,091 | | | | 4,057 | | | | 5,113 | | | | 16,897 | | | | 3,701 | | | | 4,153 | | | |
Operating profit (IFRS) | | | 646 | | | | 988 | | | | 1,043 | | | | 1,802 | | | | 4,479 | | | | 723 | | | | 698 | | | |
Revenue adjustment* | | | 35 | | | | 29 | | | | 12 | | | | 6 | | | | 82 | | | | 3 | | | | 2 | | | |
Expense adjustment* | | | 222 | | | | 168 | | | | 242 | | | | 290 | | | | 921 | | | | 193 | | | | 536 | | | |
Operating profit (non-IFRS) | | | 902 | | | | 1,186 | | | | 1,296 | | | | 2,098 | | | | 5,482 | | | | 919 | | | | 1,236 | | | |
Operating margin (IFRS, in %) | | | 17.9 | | | | 24.3 | | | | 25.8 | | | | 35.3 | | | | 26.6 | | | | 19.5 | | | | 16.8 | | | |
Operating margin (non-IFRS, in %) | | | 24.8 | | | | 29.0 | | | | 32.0 | | | | 41.0 | | | | 32.4 | | | | 24.8 | | | | 29.8 | | | |
Effective tax rate (IFRS, in %) | | | 16.3 | | | | 24.8 | | | | 26.4 | | | | 25.7 | | | | 24.4 | | | | 24.1 | | | | 22.6 | | | |
Effective tax rate (non-IFRS, in %) | | | 21.4 | | | | 26.8 | | | | 27.6 | | | | 26.6 | | | | 25.9 | | | | 25.9 | | | | 25.4 | | | |
Earnings per share, basic (IFRS, in €) | | | 0.44 | | | | 0.61 | | | | 0.64 | | | | 1.11 | | | | 2.79 | | | | 0.45 | | | | 0.47 | | | |
Earnings per share, basic (non-IFRS, in €) | | | 0.58 | | | | 0.71 | | | | 0.78 | | | | 1.28 | | | | 3.35 | | | | 0.56 | | | | 0.79 | | | |
| | |
| INTERIM REPORT JANUARY – JUNE 2014 | | 57 |
| | | | | | | | | | | | | | | | | | | | | | | | | | | | | | |
€ millions, unless otherwise stated | | Q1 2013 | | | Q2 2013 | | | Q3 2013 | | | Q4 2013 | | | TY 2013 | | | Q1 2014 | | | Q2 2014 | | | |
Net cash flows from operating activities | | | 2,162 | | | | 320 | | | | 558 | | | | 792 | | | | 3,832 | | | | 2,352 | | | | 223 | | | |
Purchases of intangible assets, and property, plant, and equipment | | | –113 | | | | –152 | | | | –136 | | | | –165 | | | | –566 | | | | –130 | | | | –174 | | | |
Free cash flow | | | 2,049 | | | | 168 | | | | 422 | | | | 627 | | | | 3,266 | | | | 2,222 | | | | 49 | | | |
| | | | | | | | | | | | | | | | | | | | | | | | | | | | | | |
Deferred cloud subscriptions and support revenue (IFRS, quarter end) | | | 344 | | | | 354 | | | | 376 | | | | 443 | | | | 443 | | | | 451 | | | | 445 | | | |
Revenue adjustment* | | | 33 | | | | 7 | | | | 6 | | | | 4 | | | | 4 | | | | 3 | | | | 3 | | | |
Deferred cloud subscriptions and support revenue (non-IFRS, quarter end) | | | 377 | | | | 361 | | | | 382 | | | | 447 | | | | 447 | | | | 454 | | | | 448 | | | |
| | | | | | | | | | | | | | | | | | | | | | | | | | | | | | |
Days’ sales outstanding (DSO, in days)** | | | 61 | | | | 62 | | | | 62 | | | | 62 | | | | 62 | | | | 63 | | | | 64 | | | |
Headcount (quarter end)*** | | | 64,598 | | | | 64,937 | | | | 66,061 | | | | 66,572 | | | | 66,572 | | | | 66,750 | | | | 67,651 | | | |
Employee retention (in %, rolling 12 months) | | | 93.9 | | | | 93.6 | | | | 93.6 | | | | 93.5 | | | | 93.5 | | | | 93.4 | | | | 93.5 | | | |
Women in management (in %, quarter end) | | | 21.4 | | | | 21.4 | | | | 21.0 | | | | 21.2 | | | | 21.2 | | | | 20.9 | | | | 21.1 | | | |
Greenhouse gas emissions (in kilotons) | | | 145 | | | | 145 | | | | 135 | | | | 120 | | | | 545 | | | | 125 | | | | 140 | | | |
| * | Adjustments in the revenue line items are for support revenue, cloud subscriptions and support revenue, and other similarly recurring revenues that entities acquired by SAP would have recognized had they remained stand-alone entities but that SAP is not permitted to recognize as revenue under IFRS as a result of business combination accounting rules. Adjustments in the operating expense line items are for acquisition-related charges, share-based compensation expenses, restructuring expenses, discontinued activities, and the Versata litigation. |
For a more detailed description of these adjustments and their limitations as well as our constant currency figures, see our Web site www.sap.com/corporate-en/investors/newsandreports/reporting-framework.epx under “Non-IFRS Measures and Estimates”.
| ** | Days’ Sales Outstanding measures the length of time it takes to collect receivables. SAP calculates DSO by dividing the average invoiced accounts receivables balance of the last 12 months by the average monthly sales of the last 12 months. |
| *** | In full-time equivalents |
Due to rounding, numbers may not add up precisely.
| | |
| 58 | | SUPPLEMENTARY FINANCIAL INFORMATION |
ADDITIONAL INFORMATION
Financial Calendar
October 20, 2014
Third-quarter earnings release, telephone conference
January 21, 2015
Fourth-quarter and full-year 2014 preliminary earnings release, telephone conference
Investor Services
Additional information about this interim report is available online at www.sap.com/corporate-en/investors, including the official press release, a presentation about the quarterly results, and a recording of the conference call for financial analysts.
The “Financial Reports” tab under “Financial News and Reports” contains the following publications:
| • | | The 2013 Integrated Report (IFRS, www.sapintegratedreport.com) |
| • | | The 2013 Annual Report (IFRS, PDF) |
| • | | The 2013 Annual Report 20-F (IFRS, PDF) |
| • | | The 2013 SAP AG Statutory Financial Statements and Review of Operations (HGB, German only, PDF) |
| • | | Interim reports (IFRS, PDF) |
| • | | XBRL versions of the Annual and Interim Reports |
You can also read SAP’s annual and interim reports on an iPad. The free and interactive app Publications is now available in the App Store.
www.sap.com/corporate-en/investors is also the place to look for in-depth information about stock, debt, and corporate governance; financial and event news; and various services designed to help investors find the information they need fast (see “Investor Services”). These include our free SAP INVESTOR magazine (www.sap-investor.com), an e-mail and text message news service, and a Twitter feed.
Print versions of the reports listed above can be ordered by phone, e-mail, or online. The SAP Integrated Report is only available online.
You can reach us by phone at +49 6227 7-67336, send a fax to +49 6227 7-40805, or e-mail us at investor@sap.com.
Addresses
SAP SE
Dietmar-Hopp-Allee 16
69190 Walldorf
Germany
Tel. +49 6227 7-47474
Fax +49 6227 7-57575
Internet www.sap.com
E-mail info@sap.com
The addresses of all our international subsidiaries and sales partners are available on our public Web site at www.sap.com/directory/main.html.
Information About Content:
Investor Relations:
Tel. +49 6227 7-67336
Fax +49 6227 7-40805
E-mail investor@sap.com
Twitter @SAPinvestor
Internet www.sap.com/investor
Imprint
Overall Responsibility:
SAP SE
Corporate Financial Reporting
Published on July 17, 2014
Copyright Usage in Collateral
© 2014 SAP SE or an SAP affiliate company. All rights reserved.
No part of this publication may be reproduced or transmitted in any form or for any purpose without the express permission of SAP SE or an SAP affiliate company.
SAP and other SAP products and services mentioned herein as well as their respective logos are trademarks or registered trademarks of SAP SE (or an SAP affiliate company) in Germany and other countries. Please see www.sap.com/corporate-en/legal/copyright for additional trademark information and notices.
| | |
| INTERIM REPORT JANUARY – JUNE 2014 | | 59 |
GROUP HEADQUARTERS
SAP SE
Dietmar-Hopp-Allee 16
69190 Walldorf
Germany
www.sap.com
www.sap.com/investor