Exhibit 99.2
INTERIM REPORT JANUARY – SEPTEMBER 2015
Run Simple
 The Best-Run Businesses Run SAP®
TABLE OF CONTENTS
INTERIM REPORT JANUARY – SEPTEMBER 2015
STOCK
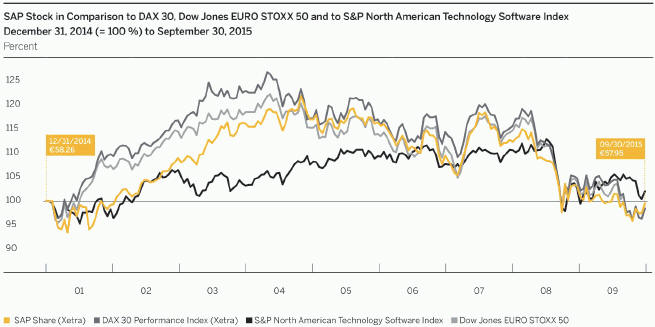
SAP SE common stock is listed on the Frankfurt Stock Exchange as well as on a number of other German exchanges. On the New York Stock Exchange (NYSE), SAP American depositary receipts (ADRs), each representing one common share, trade under the symbol SAP. SAP is a component of the DAX (the index of 30 German blue chip companies) and the Dow Jones EURO STOXX 50. We use the S&P North American Technology Software Index for comparison purposes.
Key Facts About SAP Stock / SAP ADRs
| | | | |
Listings | | | | |
Germany | | | Berlin, Frankfurt, Stuttgart | |
United States (ADR) | | | New York Stock Exchange | |
IDs andSymbols | | | | |
WKN/ISIN | | | 716460/DE0007164600 | |
NYSE (ADR) | | | 803054204 (CUSIP | ) |
Reuters | | | SAPG.F or .DE | |
Bloomberg | | | SAP GR | |
Weight (%) in Indices on 9/30/2015 | | | | |
DAX 30 | | | 6.8 | % |
Prime All Share | | | 5.1 | % |
CDAX | | | 5.3 | % |
HDAX | | | 5.4 | % |
Dow Jones STOXX 50 | | | 1.7 | % |
Dow Jones EURO STOXX 50 | | | 2.8 | % |
The third quarter of 2015 was overshadowed mainly by concerns about China’s economy. Nevertheless, over this period as well, the SAP stock fared better than the benchmark indexes: Our share price declined 7.4%, whereas the DAX lost 11.7 % and the EURO STOXX 50 fell 9.4 %.
SAP stock started the third quarter at €62.60, the Xetra closing price at the end of June. At the start of July, recovery in China’s stock market and agreement on a third loan program for Greece lifted stock markets. On July 16, SAP stock reached €68.69, its highest price for the quarter. Investors’ cautious response to SAP’s announcement of its second-quarter results on July 21, and another slump in China’s stock market on July 27, led European markets to a further decline.
Worries about China’s economy and mixed signals on the U.S. economy dampened sentiment throughout August. Consequently, on August 21 SAP stock traded below the €60.00 mark for the first time since February 11. Stock markets recovered only briefly following an interest rate cut in China. In the second half of September, the Federal Reserve delayed its plans to raise interest rates, which unsettled investors primarily in Europe and caused the DAX to move back below the 10,000-point mark. At the end of the month, the Volkswagen crisis also weighed on market sentiment, and SAP stock declined to €55.89, its lowest point in the quarter, and closed at €57.95 at quarter end.
Capital Stock
SAP’s capital stock on September 30, 2015, was €1,228,504,232 (December 31, 2014: €1,228,504,232). It is issued as 1,228,504,232 no-par shares, each with an attributable value of €1 in relation to the capital stock.
| | |
| INTERIM REPORT JANUARY – SEPTEMBER 2015 | | 3 |
Market Capitalization
With the Xetra closing price at €57.95 on the last trading day of the first nine months of the year, SAP’s market capitalization was €71.2 billion based on 1,228,504,232 million outstanding shares. SAP was therefore the third-largest DAX Company based on market capitalization.
Deutsche Börse uses the free-float factor to weight companies in the DAX. The proportion of SAP stock in free float stood at 76.1% on September 30, 2015 (at 74.6% on December 31, 2014). Based on this free-float factor, our free-float market capitalization was approximately €54.2 billion. When measured by our free-float market capitalization, SAP was the sixth-largest company listed on the DAX at the end of the third quarter.
For more information about SAP stock, see the SAP Web site at www.sap.com/investor.
| | |
| 4 | | INTERIM MANAGEMENT REPORT |
Introductory Notes
This interim group report meets the requirements of German Accounting Standard No. 16 “Zwischenberichterstattung” (DRS 16). We prepared the financial data in the Quarterly Financial Report (Unaudited) section for SAP SE and its subsidiaries in accordance with International Financial Reporting Standards (IFRS). In doing so, we observed the IFRS both as issued by the International Accounting Standards Board (IASB) and as endorsed by the European Union (EU). This does not apply to numbers expressly identified as non-IFRS. For additional IFRS and non-IFRS information, see the Supplementary Financial Information (Unaudited) section.
This quarterly financial report updates our consolidated financial statements 2014, presents significant events and transactions of the third quarter of 2015 and the first nine month of 2015, and updates the forward-looking information contained in our Management Report 2014. Both the 2014 consolidated financial statements and the 2014 Management Report are part of our 2014 Integrated Report which is available at www.sapintegratedreport.com.
All of the information in this interim group report is unaudited. This means the information has been subject neither to any audit nor to any review by an independent auditor.
| | |
| INTERIM REPORT JANUARY – SEPTEMBER 2015 | | 5 |
QUARTERLY FINANCIAL REPORT (UNAUDITED)
INTERIM MANAGEMENT REPORT
GENERAL INFORMATION
Forward-Looking Statements
This quarterly financial report contains forward-looking statements and information based on the beliefs of, and assumptions made by, our management using information currently available to them. Any statements contained in this report that are not historical facts are forward-looking statements as defined in the U.S. Private Securities Litigation Reform Act of 1995. We have based these forward-looking statements on our current expectations, assumptions, and projections about future conditions and events. As a result, our forward-looking statements and information are subject to uncertainties and risks, many of which are beyond our control. If one or more of these uncertainties or risks materializes, or if management’s underlying assumptions prove incorrect, our actual results could differ materially from those described in or inferred from our forward-looking statements and information. We describe these risks and uncertainties in the Risk Management and Risks section, respectively in the there-mentioned sources.
The words “aim,” “anticipate,” “assume,” “believe,” “continue,” “could,” “counting on,” “is confident,” “development,” “estimate,” “expect,” “forecast,” “future trends,” “guidance,” “intend,” “may,” “might,” “outlook,” “plan,” “project,” “predict,” “seek,” “should,” “strategy,” “want,” “will,” “would,” and similar expressions as they relate to us are intended to identify such forward-looking statements. Such statements include, for example, those made in the Operating Results section, the Risk Management and Risks section, the Expected Developments and Opportunities section, and other forward-looking information appearing in other parts of this quarterly financial report. To fully consider the factors that could affect our future financial results, both our 2014 Integrated Report and Annual Report on Form 20-F for December 31, 2014, should be considered, as well as all of our other filings with the Securities and Exchange Commission (SEC). Readers are cautioned not to place undue reliance on these forward-looking statements, which speak only as of the date specified or the date of this report. Except where legally required, we undertake no obligation to publicly update or revise any forward-looking statements as a result of new information that we receive about conditions that existed upon issuance of this report, future events, or otherwise unless we are required to do so by law.
Statistical Data
This report includes statistical data about the IT industry and global economic trends that comes from information published by sources including International Data Corporation (IDC), a provider of market information and advisory services for the information technology, telecommunications, and consumer technology markets; the European Central Bank (ECB); and the International Monetary Fund (IMF). This type of data represents only the estimates of IDC, ECB, IMF or the other mentioned sources of industry data. SAP does not adopt or endorse any of the statistical information. In addition, although we believe that data from these sources is generally reliable, this type of data can be imprecise. We caution readers not to place undue reliance on this data.
All of the information in this report relates to the situation on September 30, 2015, or the quarter ended on that date unless otherwise stated.
Non-IFRS Financial Information
This quarterly financial report contains non-IFRS measures as well as financial data prepared in accordance with IFRS. We present and discuss the reconciliation of these non-IFRS measures to the respective IFRS measures in the Supplementary Financial Information (Unaudited) section. For more information about non-IFRS measures, see our Web site www.sap.com/corporate-en/investors/newsandreports/reporting-framework.epx under “Non-IFRS Measures and Estimates.”
STRATEGY AND BUSINESS MODEL
We did not change our strategy and our Business Model in the first nine months of 2015. For a detailed description, see the 2014 Integrated Report and item 4 in the 2014 Annual Report on Form 20-F.
PRODUCTS, RESEARCH AND DEVELOPMENT, AND SERVICES
In the third quarter of 2015, we made the following enhancements to our portfolio of software and services. For a detailed description of our portfolio of software and services, see the Products, Research and Development, and Services section in our 2014 Integrated Report (www.sapintegratedreport.com) and item 4 in our 2014 Annual Report on Form 20-F.
| | |
| 6 | | INTERIM MANAGEMENT REPORT |
Product Portfolio
In our 2014 Integrated Report, SAP stated “Wherever they are on their journey, we are helping our customers reinvent how they do business while making the transition seamless and providing a holistic and consistent user experience. As we aim to become ‘THE cloud company powered by SAP HANA,’ we are going far beyond incremental change to achieve radical simplification – enabling our customers to stay ahead of trends, make better decisions faster, and propel innovation.” To support this mission, SAP announced Applications, Platform and Business Networks portfolio innovations in the third quarter of 2015 that will help customers run simpler both in the cloud and on premise.
Applications
In September we announced new innovations that go beyond CRM and are intended to redefine the tools of the front office, enabling real-time customer engagement. SAP hybris Profile and the SAP hybris Customer Experience solutions are planned innovations designed to simplify the front office, helping businesses get a single, contextual view of their customers while giving each customer a consistent, personalized experience across all channels.
General availability of the SAP Business Partner Screening application was announced in September. The application helps companies gauge risk when partnering with other organizations by simplifying business partner screening processes and reducing exposure to commercial, compliance and reputational risk.
We unveiled SAP Cloud for Product Stewardship, a new cloud-based solution used to assess, manage and ensure manufacturing product compliance and marketability by linking together in-house, supply chain and regulatory information.
The new SAP Engineering Control Center interface to EPLAN, a leading Electrical CAD engineering solution was announced in September. This allows interfaces that provide a complete view of a digital product, including mechanics, electrical, electronics, software and simulation to help create total transparency across engineering disciplines.
In support of human capital management (HCM) solutions new capabilities in the SAP SuccessFactors HCM Suite were announced in August. These capabilities will provide a simpler and more efficient experience by helping companies easily manage employee changes and transitions and reduce the costs of shared services. SAP also announced a series of new rapid-deployment solutions from SuccessFactors to simplify and accelerate implementations of HCM cloud solutions.
SAP and the Women’s Tennis Association (WTA) announced in August that together they have developed the SAP Tennis Analytics software to provide real-time insight to help players and coaches analyze match performance and optimize strategy.
In July, the SAP Activate consumption experience was introduced, which is an implementation methodology that combines best practices, methodology and guided configuration to help customers and partners to deploy SAP Business Suite 4 SAP HANA (SAP S/4HANA) quicker. Additionally, we announced that users can experience SAP S/4HANA with a 30-day trial offer for the on-premise edition. The trial software covers end-to-end digitized business processes in finance, procurement, sales, manufacturing and more to let customers discover the value of instant business insight.
Platform
SAP hybris as a Service on SAP HANA Cloud Platform was announced in September to simplify the front office. It is intended to become the modular business microservices layer on SAP HANA Cloud Platform to help customers with a wide range of business services.
SAP HANA Vora software, a new in-memory query engine that plugs into the Apache Spark execution framework to provide enriched interactive analytics on Hadoop was announced in September. SAP HANA Vora can benefit customers in industries in which highly interactive Big Data analytics in business process context is paramount, such as financial services, telecommunications, healthcare and manufacturing.
Additionally in September, new updates to the SAP HANA Cloud Platform offer developers and line-of-business users prebuilt and pretested business processes that can be quickly accessed, constructed and deployed in the cloud to create powerful transactional apps.
The latest release of SAP Adaptive Server Enterprise (SAP ASE) was announced in September. The new release can help customers and partners with transaction-intensive applications, such as those in financial services, telecommunications, retail, healthcare and transportation meet the increasing demands of having millions of transactions occurring 24x7 globally.
The successful completion of one of the largest crowdsourcing initiatives in the enterprise software industry was announced in July. This unique outcome is the highlight of an eight-week free openSAP course, “Build Your Own SAP Fiori App in the Cloud”. This course teaches thousands of developers how to design and build their own personalized SAP Fiori app on the SAP HANA Cloud Platform.
New capabilities in the SAP HANA platform geo-enable access to enterprise data to help break the silos between enterprise and geographic information systems (GIS). Announced in July, these capabilities enable companies to get more value from corporate data and uncover trends and patterns in a visually intuitive manner.
| | |
| INTERIM REPORT JANUARY – SEPTEMBER 2015 | | 7 |
A new release of the SAP SQL Anywhere suite was announced in July, which allows customers to collect and analyze the Internet of Things (IoT) data required for performing critical tasks at distant locations with low bandwidth, intermittent connections or even while offline.
SAP and City Football Group announced a global, multiyear marketing and technology partnership in July in which SAP will become the official cloud software provider and a trusted technology advisor to City Football Group and its clubs. City Football Group and its clubs will implement a wide variety of cloud-based solutions powered by the SAP HANA platform with the aim to simplify their worldwide operations, scale their business, increase productivity and enhance the fan experience.
Business Networks
Ariba announced expanded capabilities delivered as part of the latest release of the Ariba Network in July that allow companies to drive an end-to-end invoicing process that is global, more intelligent and simpler than ever.
It was also announced in July that Ariba and OpenText will team to provide B2B managed services capabilities to multinational businesses.
In September, Concur France announced a TripLink early adopter program for selected clients as well as partnerships with suppliers Capitaine Train, BusinessTable and City Bird.
Concur announced an important direct corporate booking partnership with Lufthansa in July that will connect bookings made on Lufthansa.com with Concur via TripLink. New partnerships with Hotel Tonight and Lyft were also announced.
In September, Fieldglass announced it is deployed at SAP, providing an end-to-end process to manage the global contingent labor and services spend. SAP is using Fieldglass as a centralized, single point of access to engage with more than 20,000 external workers via multiple service providers and global partners.
In July, Fieldglass introduced contract functionality, giving customers a more seamless experience managing workers in countries with unique contract requirements as well as when contracting directly with independent contractors.
Also as part of the July product release, Fieldglass delivered new capabilities to provide customers with a single view of supplier activities across both Fieldglass and Ariba. These capabilities further tighten the integration between the two solutions.
ACQUISITIONS
During the first nine months of 2015 we did not complete any acquisitions.
For more information about acquisitions in the prior year, see our 2014 Integrated Report, Notes to the Consolidated Financial Statements section, Note (4) and our 2014 Annual Report on Form 20-F.
EMPLOYEES AND SOCIAL PERFORMANCE
SAP’s long-term success is strongly influenced by the creativity, talent, and commitment of our people. Their ability to understand the needs of our customers and to innovate delivers sustainable value to our company, our customers, and society. Successful strategies to attract, retain, develop, and engage our employees, therefore, are critical to driving a culture of innovation, sustained growth, and profitability.
An important factor for our long-term success is our ability to attract and retain talented employees. In the third quarter of 2015, the employee retention rate was 91.9% (compared to 93.3% in the third quarter of 2014). This decrease is primarily due to SAP’s voluntary retirement scheme and voluntary separation scheme. We define employee retention rate as the ratio between the average number of employees less voluntary employee departures (fluctuation) and the average number of employees (in full-time equivalents) in the last 12 months.
One of SAP’s overall non-financial goals is fostering a diverse workforce, specifically increasing the number of women in management. At the end of the third quarter of 2015, 23.2% of all management positions at SAP were held by women, compared to 21.3% at the end of September 2014. SAP has set a long-term target to increase the share of women in management to 25% by the year 2017.
On September 30, 2015, we had 75,643 full-time equivalent (FTE) employees worldwide (September 30, 2014: 68,835; December 31, 2014: 74,406).
Those headcount numbers included 17,802 FTEs based in Germany (September 30, 2014: 17,343), and 15,576 FTEs based in the United States (September 30, 2014: 13,395).
ENVIRONMENTAL PERFORMANCE:
ENERGY AND EMISSIONS
Over the past several years, we have worked to better understand the connections between our energy consumption, its related cost, and the resulting environmental impact. Today we measure and address our energy usage throughout SAP, as well as our greenhouse gas (GHG) emissions across our entire value chain. Between the beginning of 2008 and the end of the third quarter of 2015, we calculate that energy efficiency initiatives have contributed to a cumulative cost avoidance of € 338 million, compared to a business-as-usual extrapolation.
| | |
| 8 | | INTERIM MANAGEMENT REPORT |
Our goal is to reduce the greenhouse gas emissions from our operations to levels of the year 2000 by 2020. SAP’s GHG emissions for the third quarter of 2015 totaled 110 kilotons CO2compared to 125 kilotons in the third quarter of 2014. This decrease is primarily due to a decrease in business flights.
As we measure our emissions per employee and per euro of revenue, we gain insight into our efficiency as we grow. Since 2007, we have increased our efficiency according to both measures, lowering our emissions per employee by about 38.9% and per euro of revenue by about 54.4% at the end of September 2015 (rolling four quarters).
In recognition of the exemplary actions SAP has taken to embed sustainability across its business worldwide, SAP has been included in various ratings and rankings. For the ninth time in a row SAP has maintained its position as the software-industry leader in the Dow Jones Sustainability Index (DJSI), with a total score of 76 points. In the Sustainalytics ESG Report, SAP has improved its score in every category. In the MSCI ESG Report, SAP’s rating stays unchanged at the highest score ‘AAA’. Also, SAP has been reconfirmed as a constituent of the Ethibel Sustainability Index (ESI) Excellence Europe and the Ethibel Sustainability Index (ESI) Excellence Global since September 21, 2015.
ORGANIZATION AND CHANGES IN MANAGEMENT
The Supervisory Board of SAP SE appointed Quentin Clark to the Global Managing Board, effective as of July 15, 2015 and he became the new Chief Business Officer, effective as of October 1, 2015.
| | |
| INTERIM REPORT JANUARY – SEPTEMBER 2015 | | 9 |
FINANCIAL PERFORMANCE: REVIEW AND ANALYSIS
Economy and the Market
Global Economic Trends
In its latest report, the European Central Bank (ECB) states that though growth in the global economy gradually picked up in the first three quarters of 2015, it remained uneven. Low oil prices and improving labor markets supported growth in the advanced economies. In emerging economies, however, lower commodity prices and restrictive financing conditions impeded growth. The lengthy negotiations over the Greek sovereign debt crisis at the end of June and in early July, and the devaluation of China’s currency, led to heightened tensions in the financial markets, the ECB said.
In the Europe, Middle East, and Africa (EMEA) region, the recovery of the euro area’s economy, which began at the start of the year, continued but was tempered by falling export demand in the second and third quarters. The Central and Eastern European economies grew steadily in the first nine months of the year, although Russia was in clear recession, the ECB found.
In the Americas region, the U.S. economy has sustained its recovery since the beginning of the year. In Brazil, though, the first three quarters of 2015 were characterized by a weak economy.
The ECB reports that economic performance in the Asia Pacific Japan (APJ) region varied regionally in the first nine months of the year. Japan’s economy grew in the first quarter but was significantly weaker in the second and third quarters. After a slow start to 2015, growth in China’s economy picked up, according to the ECB.
The IT Market
Global IT spending increased in the first nine months of 2015 much more than was expected at the start of the year, U.S. market research firm International Data Corporation (IDC) has reported. It attributes the increase to service providers’ investments in infrastructure (servers and storage) for cloud and Big Data applications, and to higher revenue from premium smartphones. January to September saw an above-average increase as well in investment in application software for cloud, Big Data, and enterprise mobility.
In the Europe, Middle East, and Africa (EMEA) region, investment in IT in the Western European market increased up to the end of the third quarter. In particular in Germany, IT spending increased more strongly than in the same period last year. In Russia, however, the IT market struggled in a difficult economy and declined overall in the first nine months of the year.
Since the start of the year, the IT market in the Americas region has grown more quickly than in 2014. The increase in IT spending in the United States remained largely stable, whereas the IT markets in Latin America grew much faster than the wider economy over the same period.
In the Asia Pacific Japan region, the increase in IT spending in the third quarter of 2015 was only slightly above the worldwide average. It was held back mainly by the first slight decline in IT spending in Japan after three years of growth. Even in China, growth in the IT market slowed since the beginning of year by several percentage points. In India, the IT market expanded more than in the same period last year.
Impact on SAP
The EMEA region saw an outstanding performance in the third quarter, with a 13% increase in non-IFRS cloud and software revenue. Non-IFRS cloud subscriptions and support revenue grew by 67% with high double-digit growth in new cloud bookings. Some highlights in the region included a strong software license performance in Germany and France.
The Americas region saw strong double-digit growth, with non-IFRS cloud and software revenue rising 32%. Cloud subscriptions and support revenue in the region grew 139% with new cloud bookings growing by triple-digits. This was helped by an improved performance in Latin America which stabilized amid macroeconomic challenges.
In the APJ region, non-IFRS cloud subscriptions and support revenue grew 88%, driving non-IFRS cloud and software revenue up 8%. New cloud bookings grew by double-digits. In the APJ region SAP saw strong growth in India and South Korea across cloud and software.
| | |
| 10 | | INTERIM MANAGEMENT REPORT |
Performance Against Our Outlook for 2015 (Non-IFRS)
In this section, all discussion of the first nine months’ contribution to target achievement is based exclusively on non-IFRS measures. However, the discussion of operating results refers to IFRS figures only, so those figures are not expressly identified as IFRS figures.
We present, discuss, and explain the reconciliation from IFRS measures to non-IFRS measures in the Supplementary Financial Information (Unaudited) section.
Guidance for 2015 (Non-IFRS)
For our guidance based on non-IFRS numbers, see the Operational Targets for 2015 (Non-IFRS) section in this interim management report.
Key Figures – SAP Group in the Third Quarter of 2015 (Non-IFRS)
| | | | | | | | | | | | | | | | |
| | | | | | | | | | | | Non-IFRS | |
€ millions, unless otherwise stated | | 7/1/ -
9/30/2015 | | | 7/1/ -
9/30/2014 | | | Change
in % | | | Change in %
(Constant
Currency) | |
Cloud subscriptions and support | | | 600 | | | | 278 | | | | 116 | | | | 90 | |
Software licenses | | | 1,015 | | | | 952 | | | | 7 | | | | 4 | |
Software support | | | 2,509 | | | | 2,233 | | | | 12 | | | | 6 | |
Cloud and software | | | 4,124 | | | | 3,463 | | | | 19 | | | | 12 | |
Total revenue | | | 4,987 | | | | 4,256 | | | | 17 | | | | 10 | |
Operating expense | | | –3,372 | | | | –2,901 | | | | 16 | | | | 8 | |
Operating profit | | | 1,616 | | | | 1,355 | | | | 19 | | | | 15 | |
Operating margin (in %) | | | 32.4 | | | | 31.8 | | | | 0.6pp | | | | 1.3pp | |
Profit after tax | | | 1,173 | | | | 1,010 | | | | 16 | | | | NA | |
Effective tax rate (in %) | | | 28.0 | | | | 27.7 | | | | 0.4pp | | | | NA | |
Earnings per share, basic (in €) | | | 0.98 | | | | 0.84 | | | | 16 | | | | NA | |
Actual Performance in the Third Quarter of 2015 (Non-IFRS)
Our revenue from cloud subscriptions and support (non-IFRS) was €600 million (Q3 2014: €278 million), an increase of 116% (90% at constant currencies) compared to the same period in 2014. Our cloud subscriptions and support margin (non-IFRS) increased 8.9 percentage points to 69%.
In the third quarter of 2015, Concur contributed €174 million (€149 million at constant currencies) to SAP’s cloud subscriptions and support revenue (non-IFRS). Additionally, in the third quarter of 2015 Concur generated €11 million of transactional network fee revenues (non-IFRS) that are classified as services revenue rather than cloud subscription revenue.
Starting with the reporting for the first quarter of 2015, SAP reports a new cloud related measure called ‘new cloud bookings’. This measure is an order entry measure that is determined as follows:
| • | | It includes all order entry of a given period that meets all of the following conditions: |
| | • | | The revenue from the orders is expected to be classified as cloud subscriptions and support revenue. |
| | • | | It results from purchases by new customers and incremental purchases by existing customers. Consequently, orders to renew existing contracts are not included. |
| | • | | The order amount is contractually committed (that is, variable amounts from pay-per-use and similar arrangements are not included). Consequently, due to their uncommitted pay-per-use nature, Ariba and Fieldglass transaction-based fees are not reflected in the new cloud bookings metric. |
| • | | Amounts are annualized. That is, for contracts with durations of more than one year the annual order entry amount is included in the number. |
Thus, the new cloud bookings measure is an indicator for our cloud-related sales success in a given period and for future cloud subscriptions revenue. New cloud bookings increased 102% in the third quarter of 2015 to €216 million (Q3 2014: €107 million). Concur contributed €59 million to SAP’s new cloud bookings in the third quarter of 2015. The new cloud bookings metric excludes transaction-based fees, e.g. transaction based fees from Ariba and Fieldglass.
In the third quarter of 2015, cloud and software revenue (non-IFRS) was €4,124 million (Q3 2014: €3,463 million), an increase of 19%. On a constant currency basis, the increase was 12%. This increase was mainly driven by the large increase in on-premise software sales in the third quarter 2015, and from the ongoing growth of sales in the cloud subscriptions and support portfolio which now becomes visibly reflected in our cloud subsciptions and support revenue numbers.
| | |
| INTERIM REPORT JANUARY – SEPTEMBER 2015 | | 11 |
Total revenue (non-IFRS) in the third quarter of 2015 was €4,987 million (Q3 2014: €4,256 million), an increase of 17%. On a constant currency basis, the increase was 10%.
Operating expense (non-IFRS) in the third quarter of 2015 was €3,372 million, an increase of 16% (Q3 2014: €2,901 million). On a constant currency basis, operating expense (non-IFRS) increased by 8%.
Operating profit (non-IFRS) was €1,616 million (Q3 2014: €1,355 million), an increase of 19% (15% at constant currencies). This increase was mainly driven by an increase in on-premise software sales in the third quarter 2015. Additionally, it also results from SAP’s ongoing efforts to drive the business transformation and improving operational efficiency of our cloud business. This ultimately resulted in an improved cloud subscriptions and support profitability.
Operating margin (non-IFRS) in the third quarter of 2015 was 32.4%, an increase of 0.6 percentage points (Q3 2014: 31.8 %). Operating margin (non-IFRS) on a constant currency basis was 33.1%, an increase of 1.3 percentage points,
In the third quarter of 2015, profit after tax (non-IFRS) was €1,173 million (Q3 2014: €1,010 million), an increase of 16%. Basic earnings per share (non-IFRS) was €0.98 (Q3 2014: €0.84), an increase of 16%.
The effective tax rate (non-IFRS) in the third quarter of 2015 was 28.0% (Q3 2014: 27.7%). The year-over-year increase in the effective tax rate mainly resulted from changes in the regional allocation of income and changes in foreign currency exchange rates which were partly compensated by a change in withholding taxes.
| | |
| 12 | | INTERIM MANAGEMENT REPORT |
Key Figures – SAP Group in the First Nine Months of 2015 (Non-IFRS)
| | | | | | | | | | | | | | | | |
| | | | | | | | | | | | Non-IFRS
Change in %
(Constant
Currency) | |
€ millions, unless otherwise stated | | 1/1/ -
9/30/2015 | | | 1/1/ -
9/30/2014 | | | Change
in % | | |
Cloud subscriptions and support | | | 1,664 | | | | 741 | | | | 124 | | | | 92 | |
Software licenses | | | 2,690 | | | | 2,532 | | | | 6 | | | | –1 | |
Software support | | | 7,494 | | | | 6,491 | | | | 15 | | | | 7 | |
Cloud and software | | | 11,848 | | | | 9,764 | | | | 21 | | | | 11 | |
Total revenue | | | 14,462 | | | | 12,110 | | | | 19 | | | | 9 | |
Operating expense | | | –10,396 | | | | –8,600 | | | | 21 | | | | 11 | |
Operating profit | | | 4,066 | | | | 3,510 | | | | 16 | | | | 5 | |
Operating margin (in %) | | | 28.1 | | | | 29.0 | | | | –0.9pp | | | | –1.0pp | |
Profit after tax | | | 2,831 | | | | 2,615 | | | | 8 | | | | NA | |
Effective tax rate (in %) | | | 26.6 | | | | 26.4 | | | | 0.2pp | | | | NA | |
Earnings per share, basic (in €) | | | 2.37 | | | | 2.19 | | | | 8 | | | | NA | |
Actual Performance in the First Nine Months of 2015 (Non-IFRS)
In the first nine months of 2015, our revenue from cloud subscriptions and support (non-IFRS) was €1,664 million (first nine months of 2014: €741 million), an increase of 124% (92% at constant currencies) compared to the same period in 2014. Our cloud subscriptions and support margin increased 2.6 percentage points to 67%. In the first nine months of 2015, Fieldglass contributed €75 million (€62 million at constant currencies) and Concur contributed €494 million (€414 million at constant currencies) to SAP’s cloud subscriptions and support revenue (non-IFRS). Additionally, in the first nine months of 2015, Concur generated €33 million of transactional network fee revenues (non-IFRS) that are classified as services revenue rather than cloud subscription revenue.
New cloud bookings increased 126% in the first nine months of 2015 to €539 million (first nine months of 2014: €239 million). Concur contributed €140 million to SAP’s new cloud bookings in the first nine months of 2015.
In the first nine months of 2015, cloud and software revenue (non-IFRS) was €11,848 million (first nine months of 2014: €9,764 million), an increase of 21%. On a constant currency basis, the increase was 11%. This increase was mainly driven by the large increase in on-premise software sales in the third quarter 2015, and from the growth of sales in the cloud subscriptions and support portfolio which now becomes visibly reflected in our cloud subsciptions and support revenue numbers.
Total revenue (non-IFRS) in the same period was €14,462 million (first nine months of 2014: €12,110 million), an increase of 19%. On a constant currency basis, the increase was 9%.
Operating expense (non-IFRS) in the first nine months of 2015 was €10,396 million (first nine months of 2014: €8,600 million), an increase of 21%. On a constant currency basis, the increase was 11%.
Operating profit (non-IFRS) was €4,066 million (first nine months of 2014: €3,510 million), an increase of 16%. On a constant currency basis, the increase was 5%.
Operating margin (non-IFRS) in the first nine months of 2015 was 28.1%, a decrease of 0.9 percentage points (first nine months of 2014: 29.0%). Operating margin (non-IFRS) on a constant currency basis was 28.0%, a decrease of 1.0 percentage point.
In the first nine months of 2015, profit after tax (non-IFRS) was €2,831 million (first nine months of 2014: €2,615 million), an increase of 8%. Basic earnings per share (non-IFRS) was €2.37 (first nine months of 2014: €2.19), an increase of 8%.
The effective tax rate (non-IFRS) in the first nine months of 2015 was 26.6% (first nine months of 2014: 26.4%).
| | |
| INTERIM REPORT JANUARY – SEPTEMBER 2015 | | 13 |
Segment Information
Applications, Technology & Services Segment
| | | | | | | | | | | | | | | | |
€ millions, unless otherwise stated | | 7/1–9/30/
2015 | | | 7/1–9/30/
2014 | | | Change in % | | | Change in %
(Constant
Currency) | |
Segment revenue | | | 4,567 | | | | 4,090 | | | | 12 | | | | 6 | |
Gross margin (in %) | | | 72 | | | | 73 | | | | 0pp | | | | 0pp | |
Cloud subscription and support margin (in %) | | | 57 | | | | 53 | | | | 5pp | | | | 2pp | |
Segment profit | | | 1,966 | | | | 1,715 | | | | 15 | | | | 10 | |
Segment margin (in %) | | | 43 | | | | 42 | | | | 1pp | | | | 2pp | |
| | | | |
€ millions, unless otherwise stated | | 1/1–9/30/
2015 | | | 1/1–9/30/
2014 | | | Change in % | | | Change in %
(Constant
Currency) | |
Segment revenue | | | 13,243 | | | | 11,652 | | | | 14 | | | | 5 | |
Gross margin (in %) | | | 71 | | | | 72 | | | | –1pp | | | | –1pp | |
Cloud subscription and support margin (in %) | | | 54 | | | | 58 | | | | –4pp | | | | –7pp | |
Segment profit | | | 5,189 | | | | 4,598 | | | | 13 | | | | 3 | |
Segment margin (in %) | | | 39 | | | | 39 | | | | 0pp | | | | –1pp | |
In the third quarter of 2015, Applications, Technology & Services segment revenue increased mainly driven by a strong increase in software licenses and support revenue.
As a consequence of a continuous strong demand in the human capital management and SAP HANA Enterprise Cloud line of business, we saw a strong increase in cloud subscription and support revenue in the Applications, Technology & Services segment. Our ongoing efforts to drive business transformation improving operational efficiency of our cloud business resulted in an improved cloud subscription and support profitability, which is shown in the third quarter 2015 cloud subscription and support margin.
SAP Business Network Segment
| | | | | | | | | | | | | | | | |
€ millions, unless otherwise stated | | 7/1–9/30/
2015 | | | 7/1–9/30/
2014 | | | Change in % | | | Change in %
(Constant
Currency) | |
Segment revenue | | | 412 | | | | 159 | �� | | | 159 | | | | 125 | |
Gross margin (in %) | | | 71 | | | | 65 | | | | 6pp | | | | 5pp | |
Cloud subscription and support margin (in %) | | | 78 | | | | 71 | | | | 7pp | | | | 7pp | |
Segment profit | | | 98 | | | | 28 | | | | 256 | | | | 192 | |
Segment margin (in %) | | | 24 | | | | 17 | | | | 6pp | | | | 5pp | |
| | | | |
€ millions, unless otherwise stated | | 1/1–9/30/
2015 | | | 1/1–9/30/
2014 | | | Change in % | | | Change in %
(Constant
Currency) | |
Segment revenue | | | 1,180 | | | | 415 | | | | 185 | | | | 141 | |
Gross margin (in %) | | | 69 | | | | 64 | | | | 5pp | | | | 4pp | |
Cloud subscription and support margin (in %) | | | 76 | | | | 74 | | | | 3pp | | | | 2pp | |
Segment profit | | | 228 | | | | 55 | | | | 312 | | | | 221 | |
Segment margin (in %) | | | 19 | | | | 13 | | | | 6pp | | | | 4pp | |
| | |
| 14 | | INTERIM MANAGEMENT REPORT |
Also in the Business Network segment our ongoing efforts to improve operational efficiency of our cloud business resulted in an improved cloud subscription and support profitability. In the third quarter of 2015, segment revenue growth was 30% and 14% on a constant currency basis excluding the revenue of the acquired Concur business.
Approximately 1.9 million connected companies trade over US$730 billion of commerce on the Ariba network.
For more information about our segments, see the Notes to the Consolidated Interim Financial Statements section, Note (16)
Key Figures – SAP Group in the Third Quarter of 2015 (IFRS)
| | | | | | | | | | | | | | | | |
€ millions, unless otherwise stated | | 7/1/ -
9/30/2015 | | | 7/1/ -
9/30/2014 | | | Change | | | Change
in % | |
Cloud subscriptions and support | | | 599 | | | | 277 | | | | 322 | | | | 116 | |
Software licenses | | | 1,014 | | | | 951 | | | | 63 | | | | 7 | |
Software support | | | 2,509 | | | | 2,232 | | | | 277 | | | | 12 | |
Cloud and software | | | 4,122 | | | | 3,461 | | | | 661 | | | | 19 | |
Total revenue | | | 4,985 | | | | 4,254 | | | | 730 | | | | 17 | |
Operating expense | | | –3,771 | | | | –3,097 | | | | –674 | | | | 22 | |
Operating profit | | | 1,214 | | | | 1,157 | | | | 57 | | | | 5 | |
Operating margin (in %) | | | 24.3 | | | | 27.2 | | | | –2.9pp | | | | NA | |
Profit after tax | | | 895 | | | | 881 | | | | 15 | | | | 2 | |
Effective tax rate (in %) | | | 27.1 | | | | 26.5 | | | | 0.6pp | | | | NA | |
Headcount (average first nine months) | | | 74,705 | | | | 67,478 | | | | 7,227 | | | | 11 | |
Days sales outstanding in days (September 30) | | | 69 | | | | 65 | | | | 4 | | | | 6 | |
Earnings per share, basic (in €) | | | 0.75 | | | | 0.74 | | | | 0.01 | | | | 2 | |
Deferred cloud subscriptions and support revenue (September 30) | | | 782 | | | | 498 | | | | 284 | | | | 57 | |
Operating Results in the Third Quarter 2015 (IFRS)
Orders
The total number of completed transactions for on-premise software in the third quarter of 2015 increased 12% year-over-year to 14,027 (Q3 2014: 12,544). In addition, the average value of software orders received for on-premise software deals decreased 3% compared to the previous year, caused by currency effects. Of all our software orders received in the third quarter of 2015, 24% were attributable to deals worth more than €5 million (Q3 2014: 27%), while 44% were attributable to deals worth less than €1 million (Q3 2014: 44%).
Revenue
Our revenue from cloud subscriptions and support was €599 million (Q3 2014: €277 million), an increase of 116% compared to the same period in 2014. In the third quarter 2015, Concur contributed €174 million to SAP’s cloud subscriptions and support revenue. Additionally, in the third quarter of 2015 Concur generated €11 million of transactional network fee revenues that are classified as services revenue rather than cloud subscription revenue.
In the third quarter of 2015, software licenses revenue was €1,014 million (Q3 2014: €951 million), an increase of 7% compared to the same period in 2014.
Total revenue was €4,985 million (Q3 2014: €4,254 million), an increase of 17% compared to the same period in 2014.
Operating Expense
In the third quarter of 2015, our operating expense increased 22% to €3,771 million (Q3 2014: €3,097 million). This increase was driven by increased restructuring costs and increased acquisition-related charges and the increasing sales in the cloud subscription business.
Operating Profit and Operating Margin
In the third quarter of 2015, operating profit increased 5% compared with the same period in the previous year to €1,214 million (Q3 2014: €1,157 million). Our operating margin decreased by 2.9 percentage points to 24.3% (Q3 2014: 27.2%).
| | |
| INTERIM REPORT JANUARY – SEPTEMBER 2015 | | 15 |
Profit After Tax and Earnings per Share
In the third quarter of 2015, profit after tax was €895 million (Q3 2014: €881 million), an increase of 2%. Basic earnings per share was €0.75 (Q3 2014: €0.74), an increase of 2%.
The effective tax rate in the third quarter of 2015 was 27.1% (Q3 2014: 26.5%). The year-over-year increase in the effective tax rate mainly resulted from changes in the regional allocation of income and changes in foreign currency exchange rates which were partly compensated by a change in withholding taxes.
Key Figures — SAP Group in the First Nine Months of 2015 (IFRS)
| | | | | | | | | | | | | | | | |
€ millions, unless otherwise stated | | 1/1/ -
9/30/2015 | | | 1/1/ -
9/30/2014 | | | Change | | | Change
in % | |
Cloud subscriptions and support | | | 1,654 | | | | 738 | | | | 917 | | | | 124 | |
Software licenses | | | 2,689 | | | | 2,532 | | | | 157 | | | | 6 | |
Software support | | | 7,494 | | | | 6,487 | | | | 1,006 | | | | 16 | |
Cloud and software | | | 11,837 | | | | 9,757 | | | | 2,080 | | | | 21 | |
Total revenue | | | 14,451 | | | | 12,103 | | | | 2,349 | | | | 19 | |
Operating expense | | | –11,899 | | | | –9,525 | | | | –2,374 | | | | 25 | |
Operating profit | | | 2,552 | | | | 2,578 | | | | –25 | | | | –1 | |
Operating margin (in %) | | | 17.7 | | | | 21.3 | | | | –3.6pp | | | | NA | |
Profit after tax | | | 1,778 | | | | 1,971 | | | | –193 | | | | –10 | |
Effective tax rate (in %) | | | 24.2 | | | | 24.8 | | | | –0.6pp | | | | NA | |
Earnings per share, basic (in €) | | | 1.49 | | | | 1.65 | | | | –0.16 | | | | –10 | |
Operating Results in the First Nine Months of 2015 (IFRS)
Orders
The total number of completed transactions for on-premise software in the first nine months of 2015 increased 5% year-over-year to 39,568 (first nine months of 2014: 37,628). In addition, the average value of software orders received for on-premise software deals increased 6% compared to the year before, helped by currency effects. Of all our software orders received in the first nine months of 2015, 24% were attributable to deals worth more than €5 million (first nine months of 2014: 22%), while 44% were attributable to deals worth less than €1 million (first nine months of 2014: 47%).
Revenue
Our revenue from cloud subscriptions and support was €1,654 million (first nine months of 2014: €738 million), an increase of 124% compared to the same period in 2014. In the first nine months of 2015, Fieldglass contributed €75 million and Concur contributed €494 million to SAP’s cloud subscriptions and support revenue. Additionally, in the first nine months of 2015 Concur generated €33 million of transactional network fee revenues that are classified as services revenue rather than cloud subscription revenue.
In the first nine months of 2015, software licenses revenue was €2,689 million (first nine months of 2014: €2,532 million), an increase of 6% compared to the same period in 2014. This increase was mainly driven by the large increase in on-premise software sales in the third quarter 2015.
Total revenue was €14,451 million (first nine months of 2014: €12,103 million), an increase of 19% compared to the same period in 2014.
Operating Expense
In the first nine months of 2015, our operating expense increased 25% to €11,899 million (first nine months of 2014: €9,525 million). This increase was driven by increased restructuring costs and increased acquisition-related charges throughout the first nine months of 2015 and the increasing sales in the cloud subscription business.
Operating Profit and Operating Margin
In the first nine months of 2015, operating profit decreased 1% compared with the same period in the previous year to €2,552 million (first nine months of 2014: €2,578 million). Our operating margin decreased by 3.6 percentage points to 17.7% (first nine months of 2014: 21.3%).
Profit After Tax and Earnings per Share
In the first nine months of 2015, profit after tax was €1,778 million (first nine months of 2014: €1,971 million), a decrease of 10%. Basic earnings per share was €1.49 (first nine months of 2014: €1.65), a decrease of 10%.
The effective tax rate in the first nine months of 2015 was 24.2% (first nine months of 2014: 24.8%).The year over year decrease in the effective tax rate mainly resulted from changes in taxes for prior years, which were partly compensated by tax effects relating to intercompany financing and by changes in the regional allocation of income.
| | |
| 16 | | INTERIM MANAGEMENT REPORT |
Finances (IFRS)
Cash Flow and Liquidity
Operating cash flow for the first nine months of 2015 was €3,241 million (first nine months of 2014: €3,082 million). Thus our operating cash flow increased 5% over the same period in the previous year.
Group liquidity stood at €4,608 million on September 30, 2015 (December 31, 2014: €3,423 million). Group liquidity comprised cash and cash equivalents totaling €3,844 million (December 31, 2014: €3,328 million) and current investments totaling €764 million (December 31, 2014: €95 million).
Group Liquidity of SAP Group
| | | | | | | | | | | | |
€ millions | | 09/30/
2015 | | | 12/31/
2014 | | | Change | |
Cash and cash equivalents | | | 3,844 | | | | 3,328 | | | | 516 | |
Current investments | | | 764 | | | | 95 | | | | 669 | |
Group liquidity, gross | | | 4,608 | | | | 3,423 | | | | 1,185 | |
Current financial debt | | | –1,366 | | | | –2,157 | | | | 791 | |
Net liquidity 1 | | | 3,242 | | | | 1,266 | | | | 1,976 | |
Non-current financial debt | | | –9,062 | | | | –8,936 | | | | –126 | |
Net liquidity 2 | | | –5,820 | | | | –7,670 | | | | 1,850 | |
Net liquidity 1 is total group liquidity minus current financial debt. It increased on a year-to-date basis by €1,976 million to €3,242 million.
Net liquidity 2, defined as net liquidity 1 minus non-current financial debt, was –€5,820 million (December 31, 2014: –€7,670 million).
Financial debt consists of current and non-current bank loans, bonds, and private placements. For more information about our financial debt, see the Notes to the Consolidated Interim Financial Statements section, Note (10).
Free Cash Flow and Days’ Sales Outstanding (DSO)
Our free cash flow and our DSO on September 30, 2015, were as follows:
Free Cash Flow
| | | | | | | | | | | | |
€ millions | | 1/1 -
09/30/ 2015 | | | 1/1 -
09/30/ 2014 | | | Change
in % | |
Free cash flow | | | 2,817 | | | | 2,610 | | | | 8 | |
We calculate free cash flow as net cash from operating activities minus purchases of intangible assets and property, plant, and equipment.
Days’ Sales Outstanding
| | | | | | | | | | | | |
| | | 09/30/
2015 | | | 09/30/
2014 | | | Change
in Days | |
Days’ sales outstanding (DSO) in days | | | 69 | | | | 65 | | | | 4 | |
Days’ sales outstanding (DSO) for receivables, defined as the average number of days from the raised invoice to the cash receipt from the customer, was 69 days, a 4-day increase year over year.
Assets (IFRS)
Analysis of Consolidated Statements of Financial Position
The total assets of the Group were €40,657 million on September 30, 2015, an increase of €2,200 million since December 31, 2014, resulting mainly from foreign exchange related revaluations and an increase in cash and cash equivalents from the operating cash flow.
The equity ratio on September 30, 2015, was 53% (December 31, 2014: 51%).
Investments
Investments in intangible assets and property, plant, and equipment were €421 million in the first nine months of 2015 (first nine months of 2014: €1,224 million). The decrease compared to the first nine months of 2014 is mainly due to the Fieldglass acquisition, which we concluded in the comparison period.
Off-Balance-Sheet Financial Instruments
There are no off-balance-sheet financial instruments, such as sale-and-lease-back transactions, asset-backed securities, or liabilities related to structured entities, that are not disclosed in our interim Consolidated Financial Statements.
Competitive Intangibles
The assets that are the basis for our current and future success do not appear on the Consolidated Statements of Financial Position. This is apparent from a comparison of the market capitalization of SAP SE on September 30, 2015, which was €71.2 billion, with the equity of the SAP Group on the Consolidated Statements of Financial Position, which was €21.5 billion. This means that the market capitalization of our equity is almost four times higher than the book value.
Customer capital, our employees and their knowledge and skills, our ecosystem of partners, the SAP brand, and our past investments in research and development are some of the most important competitive intangibles that influence our market value.
According to the 2015 Interbrand annual survey of the Top 100 Best Global Brands, SAP is ranked the 26th most valued brand in the world. Interbrand determined a value of US$18.8 billion.
| | |
| INTERIM REPORT JANUARY – SEPTEMBER 2015 | | 17 |
RISK MANAGEMENT AND RISKS
We have comprehensive risk-management structures in place, which are intended to enable us to recognize and analyze risks early and to take the appropriate action. For changes in our legal liability risks since our last annual report, see Note (14) in the Notes to the Interim Financial Statements. The other risk factors remain largely unchanged since 2014, and are discussed more fully in our 2014 Integrated Report and our Annual Report on Form 20-F for 2014. We do not believe the risks we have identified jeopardize our ability to continue as a going concern.
EXPECTED DEVELOPMENTS AND OPPORTUNITIES
Future Trends in the Global Economy
In its latest report, the European Central Bank (ECB) reports that it expects the recovery in the industrialized countries will support the global economy to grow over the rest of the current year. Low oil prices and higher employment rates in the advanced economies might improve global economic prospects. The ECB expects uneven and generally subdued growth in the emerging economies for the rest of the year.
Turning to the Europe, Middle East, and Africa (EMEA) region, the ECB expects weaker growth in the emerging economies to dampen demand for euro area exports. This will somewhat weaken economic recovery in the euro area in the coming months compared to the first three quarters of the year. The economies of Central and Eastern European countries are likely to benefit from improving labor markets and low oil prices. Russia will remain in recession for the rest of the year, the ECB reports. Here, lower oil revenue is likely to lead to further drastic repercussions.
In the Americas region, it expects lower oil prices will boost consumer spending in the United States and lift the economy, where a favorable lending market could ease investment. In contrast, the prospects for Brazil’s economy for the rest of this year have worsened, according to the ECB.
In the Asia Pacific Japan (APJ) region, the ECB expects demand for Japan’s exports to increase by the end of the year, which will enable its economy to grow again. The prospects for China’s economy after the latest stock market slump are uncertain, the ECB writes. It expects expansion in China to continue decelerating in the medium term.
Economic Trends – Year-Over-Year GDP Growth
| | | | | | | | | | | | |
% | | | | | | | | | | | | |
World | | | 2014e | | | | 2015p | | | | 2016p | |
World | | | 3.4 | | | | 3.1 | | | | 3.6 | |
Advanced economies | | | 1.8 | | | | 2.0 | | | | 2.2 | |
Developing and emerging economies | | | 4.6 | | | | 4.0 | | | | 4.5 | |
Europe, Middle East, and Africa (EMEA) | | | | | | | | | | | | |
Euro area | | | 0.9 | | | | 1.5 | | | | 1.6 | |
Germany | | | 1.6 | | | | 1.5 | | | | 1.6 | |
Central and Eastern Europe | | | 2.8 | | | | 3.0 | | | | 3.0 | |
Middle East and North Africa | | | 2.7 | | | | 2.5 | | | | 3.9 | |
Sub-Saharan Africa | | | 5.0 | | | | 3.8 | | | | 4.3 | |
Americas | | | | | | | | | | | | |
United States | | | 2.4 | | | | 2.6 | | | | 2.8 | |
Canada | | | 2.4 | | | | 1.0 | | | | 1.7 | |
Central and South America, Caribbean | | | 1.3 | | | | -0.3 | | | | 0.8 | |
Asia Pacific Japan (APJ) | | | | | | | | | | | | |
Asian developing economies | | | 6.8 | | | | 6.5 | | | | 6.4 | |
Japan | | | -0.1 | | | | 0.6 | | | | 1.0 | |
China | | | 7.3 | | | | 6.8 | | | | 6.3 | |
e = Estimate; p = Projection
Source: International Monetary Fund (IMF), World Economic Outlook October 2015, Adjusting To Lower Commodity Prices, as of October 2015
IT Market: The Outlook for 2015
U.S. market researcher International Data Corporation (IDC) expects year-over-year growth in the worldwide IT market to be 5.5% this year. It forecasts that the software market will grow at an above-average rate of 6.7%. As in the first three quarters of the year, servers and storage for cloud and Big Data applications, and smartphones, will drive growth.
IDC’s outlook for the Europe, Middle East, and Africa (EMEA) region is positive overall: It expects the IT market in Western Europe to grow 4.4% year-over-year (software 5.4%), which is more than double last year’s rate (1.9%). In Germany, IT spending might be significantly higher, according to IDC. However, it expects that the IT market in Russia will decline 2.6%, whereas in Central and Eastern Europe IT spending may increase 3.5% due to strong growth in the hardware market. In Middle East and Africa, it may grow 9.2%.
For the Americas region, IDC expects growth in the U.S. IT market this year to remain almost constant at 4.2% (6.9% for software). For Latin America, it forecasts that annual growth will once again be well into the double-digit range at 13.0% (Brazil: 14.3%, Mexico 12.3%) and that software spending will grow very strongly at 16.3% (Brazil: 17.3%, Mexico 13.4%).
In the Asia Pacific Japan region, IT spending this year will be above the global average only in the services market, according to IDC. It also reports that IT spending in Japan may in total decline 0.1% in 2015. However, software spending will grow 4.2%, which is almost at the 2014 level. IDC expects the IT market in China to grow by just 7.8% this year (2014: 11.8%). Yet investment in software might even accelerate from 8.3% in 2014 to 9.7% this year. India’s IT market is anticipated to expand 9.9% in 2015 (software 10.5%), IDC reports.
| | |
| 18 | | INTERIM MANAGEMENT REPORT |
Trends in the IT Market – Increased IT Spending Year-Over-Year
| | | | | | | | | | | | |
% | | | | | | | | | | | | |
World | | | 2014e | | | | 2015p | | | | 2016p | |
Total IT | | | 4.6 | | | | 5.5 | | | | 3.6 | |
Hardware | | | 5.1 | | | | 6.6 | | | | 2.3 | |
Packaged software | | | 5.9 | | | | 6.7 | | | | 6.8 | |
Applications | | | 7.1 | | | | 7.0 | | | | 7.1 | |
IT services | | | 3.0 | | | | 3.0 | | | | 3.5 | |
Europe, Middle East, Africa (EMEA) | | | | | | | | | | | | |
IT total | | | 3.8 | | | | 5.0 | | | | 3.0 | |
Packaged software | | | 4.0 | | | | 5.0 | | | | 5.3 | |
Applications | | | 4.5 | | | | 5.3 | | | | 5.7 | |
IT services | | | 2.1 | | | | 2.2 | | | | 2.8 | |
Americas | | | | | | | | | | | | |
IT total | | | 4.3 | | | | 5.6 | | | | 4.1 | |
Packaged software | | | 7.0 | | | | 7.7 | | | | 7.7 | |
Applications | | | 8.7 | | | | 8.2 | | | | 8.1 | |
IT services | | | 2.9 | | | | 2.7 | | | | 3.2 | |
Asia Pacific Japan (APJ) | | | | | | | | | | | | |
IT total | | | 6.0 | | | | 5.9 | | | | 3.5 | |
Packaged software | | | 5.7 | | | | 6.2 | | | | 6.4 | |
Applications | | | 6.9 | | | | 6.2 | | | | 6.3 | |
IT services | | | 5.0 | | | | 5.3 | | | | 5.6 | |
e = Estimate, p = Projection
Source: IDC Worldwide Black Book Pivot V2.2 2015
Impact on SAP
SAP expects to outperform the global economy and the IT industry again in 2015 in terms of revenue growth. The last years of growth momentum underscore our leadership in the transformation of the industry. In 2014, we delivered on our Run Simple strategy to help our customers transform their businesses. SAP’s strong growth is driven by the SAP HANA platform, the broadest cloud portfolio, and the largest business network in the world. SAP powers the clear path to growth for businesses in the 21st century: run real time, run networked, Run Simple. We will continue to push relentlessly toward a much more predictable business model, in parallel we will further expand our core business and at the same time we will continue to expand our operating profit.
We are well-positioned and therefore confident we can achieve our medium-term targets for 2017 and 2020, assuming that the economic environment and IT industry develop as currently forecasted.
Balanced in terms of regions as well as industries, we are well-positioned with our product offering to offset smaller individual fluctuations in the global economy and IT market.
The significantly more volatile market environment challenges also SAP to reach its ambitious targets. Our market and the demands of our customers are changing rapidly. We anticipated these changes early and positioned ourselves strategically. A comparison of our business outlook with forecasts for the global economy and IT industry shows that we can be successful even in a tough economic environment and will further strengthen our position as the market leader of enterprise application software.
We plan to continue to invest in countries in which we expect significant growth. Such countries include Brazil, China, India, Russia, as well as countries in the Middle East and Africa. We therefore expect to see further future growth potential not only regionally but also with our broad product offering helping us reach our ambitious 2015 outlook targets and medium-term aspirations for 2017 and 2020.
Operational Targets for 2015 (Non-IFRS)
Our outlook for 2015 and beyond as outlined below is based on the modified income statement described in the Changes to Income Statement Structure section in this interim management report.
Revenue and Operating Profit Outlook
We reiterate the following 2015 outlook:
| | • | | Based on the strong momentum in SAP’s cloud business the Company expects full-year 2015 non-IFRS cloud subscriptions and support revenue to be in a range of €1.95 - €2.05 billion at constant currencies (2014: €1.10 billion). The upper end of this range represents a growth rate of 86% at constant currencies. Concur and Fieldglass are expected to contribute approximately 50 percentage points to this growth. |
| | • | | The Company expects full-year 2015 non-IFRS cloud and software revenue to increase by 8% - 10% at constant currencies (2014: €14.33 billion). |
| | • | | The Company expects full-year 2015 non-IFRS operating profit to be in a range of €5.6 billion - €5.9 billion at constant currencies (2014: €5.64 billion). |
While the Company’s full-year 2015 business outlook is at constant currencies, actual currency reported figures are expected to continue to be impacted by currency exchange rate fluctuations. If exchange rates stay at the September 2015 average level for the rest of the year, the Company would expect approximately a 2 to 4 percentage points currency benefit on cloud and software growth and on operating profit growth for the fourth quarter of 2015 and 7 to 9 percentage points for the full-year 2015.
| | |
| INTERIM REPORT JANUARY – SEPTEMBER 2015 | | 19 |
The above mentioned indication for the expected currency exchange rate impact on actual currency reported figures replaces the earlier indication disclosed on April 21, 2015 in our Interim Report January – June 2015.
We expect that total revenue (non-IFRS) will continue to depend largely on the software license and support revenue (non-IFRS) which results mainly from the Applications, Technology & Services segment.
Since the revenue (non-IFRS) from Concur was for the first time consolidated and included in the SAP Business Network segment at the end of the fourth quarter of 2014, a particularly strong cloud subscriptions and support revenue (non-IFRS) growth is expected in this segment.
Differences Between IFRS and Non-IFRS Measures
As noted above, our guidance is based on non-IFRS measures at constant currencies. The following provides additional insight into the impact of the constant currency notion and the items by which our IFRS measures and non-IFRS measures differ.
The following table shows the estimates of the items that represent the differences between our non-IFRS financial measures and our IFRS financial measures.
Non-IFRS Measures
| | | | | | | | | | | | |
€ millions | | Estimated
Amounts
for 1/1 –
12/31/20151) | | | Actual
Amounts
from 1/1 –
9/30/2015 | | | Actual
Amounts
from 1/1 –
9/30/2014 | |
Revenue adjustments | | | <20 | | | | 11 | | | | 7 | |
Share-based payment expenses2),3) | | | 550 to 590 | | | | 386 | | | | 119 | |
Acquisition-related charges4) | | | 730 to 780 | | | | 554 | | | | 402 | |
Restructuring | | | 585 to 615 | | | | 563 | | | | 97 | |
| 1) | All adjusting items are partly incurred in currencies other than the euro. Consequently, the amounts are subject to currency volatility. All estimates for 2015 provided in the table are at actual currency and are calculated based on certain assumptions regarding the developments of the different currency exchange rates. Depending on the future development of these exchange rates, the total amounts for 2015 may differ significantly from the estimates provided in the table above. The reader should remember that SAP’s outlook is based on constant currency. |
| 2) | Our share-based payment expenses are subject, among other factors, to share price volatility, anticipated achievement of financial KPIs (Key Performance Indicators) objectives, and fluctuations in SAP’s workforce. The estimates in the table above are based on certain assumptions regarding these factors. Depending on how these factors change in the future, the total expense for 2015 may differ significantly from these estimates. |
| 3) | The estimates provided above for share-based payments expenses include grants under existing programs. New share-based payments plans may make the total amounts for 2015 differ significantly from these estimates. |
| 4) | The estimates provided above for acquisition-related charges are based on the acquisitions made by SAP up to the day of this document. Subsequent acquisitions may cause the total amounts for 2015 to differ from these estimates. |
The Company expects a full-year 2015 effective tax rate (IFRS) of 25.0% to 26.0% (2014: 24.7%) and an effective tax rate (non-IFRS) of 26.5% to 27.5% (2014: 26.1%).
Goals for Liquidity, Finance, Investments, and Dividends
On September 30, 2015, we had a negative net liquidity. We believe that our liquid assets combined with our undrawn credit facilities are sufficient to meet our present operating financing needs also in the fourth quarter of 2015 and, together with expected cash flows from operations, will support debt repayments and our currently planned capital expenditure requirements over the near term and medium term. In the course of 2015 we repaid already €770 million in bank loans that we had taken in connection with the Concur acquisition and refinanced another part through the issuance of Eurobonds amounting to €1.75 billion. In October 2015 we repaid €300 million in bank loans and a US$300 million U.S. private placement. In November 2015 we intend to repay a €550 million Eurobond. At the time of this report, we have no concrete plans for future share buybacks.
| | |
| 20 | | INTERIM MANAGEMENT REPORT |
Excepting acquisitions, our planned capital expenditures for 2015 and 2016 can be covered in full by operating cash flow. They will mainly be spent on property improvements planned in Bangalore (India), Dubai (United Arab Emirates), Shanghai (China), New York City (United States), San Ramon (United States), Potsdam (Germany), Walldorf (Germany), Prag (Czech Republic) and Ra’anana (Israel). In addition we plan to invest in two new Data Center in the western US. In total we expect investments of approximately €340 million during the next two years.
As discussed in our 2014 Integrated Report and our 2014 Annual Report on Form 20-F, we have amended our dividend policy: We intend to continue paying an annual dividend totaling more than 35% of profit after tax.
Premises on Which Our Outlook Is Based
In preparing our outlook guidance, we have taken into account all events known to us at the time we prepared this report that could influence SAP’s business going forward.
Among the premises on which this outlook is based are those presented concerning economic development and the assumption that there will be no effects from a major acquisition.
Non-Financial Goals 2015
In addition to our financial goals, we also focus on two non-financial targets: customer loyalty and employee engagement.
We believe it is essential that our employees are engaged, drive our success, and support our strategy. Therefore, we remain committed to increasing our employee engagement index score to 82% by the end of 2015 (2014: 79%).
Further, our customers’ satisfaction with the solutions we offer is very important to us. We want our customers to not only be satisfied, but also see us as a trusted partner for innovation. We measure this customer loyalty metric using the Customer Net Promoter Score (NPS). For 2015, we aim to achieve a combined (on-premise and cloud) NPS score of 24%.
Medium-Term Prospects
Our medium-term prospects as discussed in our 2014 Integrated Report and our 2014 Annual Report on Form 20-F did not change in the first nine months of 2015.
In this section, all discussion of the medium-term prospects is based exclusively on non-IFRS measures.
SAP expects to grow its more predictable revenue business while steadily increasing operating profit. Our strategic objectives are focused primarily on the following financial and non-financial objectives: growth, profitability, customer loyalty, and employee engagement.
Looking beyond 2015, SAP updated its ambition for 2017 in the beginning of the year. We continue to expect fast growth in our cloud business, with cloud subscriptions and support revenue reaching a range between €3.5 billion to €3.6 billion in 2017. Total revenue is expected to reach €21 billion to €22 billion and operating profit is expected to be between €6.3 billion and €7.0 billion in 2017.
The changes to the 2017 goals reflect the impact of the Concur acquisition and anticipated faster customer adoption of SAP’s managed cloud offering. SAP also anticipates that its fast-growing cloud business along with growth in support revenue will drive a higher share of more predictable revenue, with the total of cloud subscriptions and support revenue and software support revenue reaching 65% to 70% of total revenue in 2017 (2014: 57%).
By 2017, SAP’s rapidly growing cloud subscriptions and support revenue is expected to be close to software license revenue – and is expected to exceed software license revenue in 2018. At that time, SAP expects to reach a scale in its cloud business that will clear the way for accelerated operating profit expansion.
In the beginning of the year, SAP also set high-level ambitions for 2020, with 2020 cloud subscriptions and support revenue expected to reach €7.5 billion to €8.0 billion. Total revenue is expected to be between €26 billion and €28 billion and operating profit is expected to be in a range of €8 billion to €9 billion in 2020. We expect the share of more predictable revenue to grow further, with the total of cloud subscriptions and support revenue and software support revenue reaching between 70% and 75% of total revenue in 2020. To realize the expected increase in operating profit, until 2020 SAP aims to grow gross profit from cloud subscriptions and support (defined as the difference between cloud subscription and support revenue and the respective cost of revenue) by a compound annual growth rate of approximately 40% on the 2014 figure. This growth is expected to result in a cloud subscription and support gross margin; in other words, the gross margin derived from the cloud subscription and support gross profit that is approximately 9 percentage points higher in 2020 than in 2014 (2014: 64%). In the same period, our target is to grow gross profit from software licenses and support by a compound annual growth rate of approximately 3%, leading to an improvement in the software licenses and support gross margin of approximately 2 percentage points (2014: 86%).
SAP anticipates that the gross margins of the various cloud business models will continue to differ significantly in the long term. While the gross margin from public cloud subscriptions and from the business network are both expected to reach approximately 80% long term, we anticipate that in the long-term, gross margin on managed cloud offerings will be about 40%. In addition, based on subscription bookings, we expect, once our cloud business has achieved a mature state, approximately 80% of the cloud subscription business will be generated from existing contracts and their renewals (2014: approximately 60%) and approximately 20% from new business (2014: approximately 40%).
| | |
| INTERIM REPORT JANUARY – SEPTEMBER 2015 | | 21 |
Opportunities
We have comprehensive opportunity-management structures in place, which are intended to enable us to recognize and analyze opportunities early and to take the appropriate action. The opportunities remain largely unchanged since 2014, and are discussed more fully in our 2014 Integrated Report.
EVENTS AFTER THE REPORTING PERIOD
The Supervisory Board of SAP SE decided that Board member Gerd Oswald is taking over the new Board area Product Quality & Enablement, as of November 1, 2015.
Michael Kleinemeier has been named to the Executive Board of SAP, effective from November 1, 2015. He will assume sole responsibility for Global Service & Support.
| | |
| 22 | | INTERIM MANAGEMENT REPORT |
CONSOLIDATED INTERIM FINANCIAL STATEMENTS – IFRS
CONSOLIDATED INCOME STATEMENTS OF SAP GROUP – QUARTER
For the three months ended September 30
| | | | | | | | | | | | | | | | |
€ millions, unless otherwise stated | | Notes | | | 2015 | | | 2014 | | | Change
in % | |
Cloud subscriptions and support | | | | | | | 599 | | | | 277 | | | | 116 | |
Software licenses | | | | | | | 1,014 | | | | 951 | | | | 7 | |
Software support | | | | | | | 2,509 | | | | 2,232 | | | | 12 | |
Software licenses and support | | | | | | | 3,523 | | | | 3,184 | | | | 11 | |
Cloud and software | | | | | | | 4,122 | | | | 3,461 | | | | 19 | |
Services | | | | | | | 863 | | | | 793 | | | | 9 | |
Total revenue | | | | | | | 4,985 | | | | 4,254 | | | | 17 | |
| | | | |
Cost of cloud subscriptions and support | | | | | | | –249 | | | | –132 | | | | 89 | |
Cost of software licenses and support | | | | | | | –528 | | | | –490 | | | | 8 | |
Cost of cloud and software | | | | | | | –777 | | | | –622 | | | | 25 | |
Cost of services | | | | | | | –767 | | | | –662 | | | | 16 | |
Total cost of revenue | | | | | | | –1,544 | | | | –1,285 | | | | 20 | |
Gross profit | | | | | | | 3,440 | | | | 2,970 | | | | 16 | |
Research and development | | | | | | | –660 | | | | –545 | | | | 21 | |
Sales and marketing | | | | | | | –1,182 | | | | –1,018 | | | | 16 | |
General and administration | | | | | | | –239 | | | | –190 | | | | 26 | |
Restructuring | | | (5 | ) | | | –145 | | | | –43 | | | | >100 | |
TomorrowNow and Versata litigation | | | | | | | 0 | | | | –17 | | | | <-100 | |
Other operating income/expense, net | | | | | | | –3 | | | | 1 | | | | <-100 | |
Total operating expenses | | | | | | | –3,771 | | | | –3,097 | | | | 22 | |
Operating profit | | | | | | | 1,214 | | | | 1,157 | | | | 5 | |
| | | | |
Other non-operating income/expense, net | | | | | | | –26 | | | | 51 | | | | <-100 | |
Finance income | | | | | | | 102 | | | | 30 | | | | >100 | |
Finance costs | | | | | | | –60 | | | | –39 | | | | 53 | |
Financial income, net | | | | | | | 42 | | | | –9 | | | | <-100 | |
Profit before tax | | | | | | | 1,229 | | | | 1,199 | | | | 3 | |
Income tax TomorrowNow and Versata litigation | | | | | | | 0 | | | | 9 | | | | <-100 | |
Other income tax expense | | | | | | | –333 | | | | –327 | | | | 2 | |
Income tax expense | | | | | | | –333 | | | | –318 | | | | 5 | |
Profit after tax | | | | | | | 895 | | | | 881 | | | | 2 | |
attributable to owners of parent | | | | | | | 898 | | | | 880 | | | | 2 | |
attributable to non-controlling interests | | | | | | | –2 | | | | 1 | | | | <-100 | |
| | | | | | | | | | | | | | | | |
Earnings per share, basic (in €)1) | | | (8 | ) | | | 0.75 | | | | 0.74 | | | | 2 | |
Earnings per share, diluted (in €)1) | | | (8 | ) | | | 0.75 | | | | 0.73 | | | | 2 | |
| 1) | For the three months ended September 30, 2015 and 2014, the weighted average number of shares was 1,198 million (diluted 1,198 million) and 1,195 million (diluted: 1,198 million), respectively (treasury stock excluded). |
Due to rounding, numbers may not add up precisely.
| | |
| INTERIM REPORT JANUARY – SEPTEMBER 2015 | | 23 |
CONSOLIDATED STATEMENTS OF COMPREHENSIVE INCOME OF SAP GROUP – QUARTER
For the three months ended September 30
| | | | | | | | |
€ millions | | 2015 | | | 2014 | |
Profit after tax | | | 895 | | | | 881 | |
Items that will not be reclassified to profit or loss | | | | | | | | |
Remeasurements on defined benefit pension plans | | | 2 | | | | –7 | |
Income tax relating to items that will not be reclassified | | | –1 | | | | 0 | |
Other comprehensive income after tax for items that will not be reclassified to profit or loss | | | 1 | | | | –7 | |
Items that will be reclassified subsequently to profit or loss | | | | | | | | |
Exchange differences | | | –179 | | | | 676 | |
Available-for-sale financial assets | | | –45 | | | | 8 | |
Cash flow hedges | | | 43 | | | | –22 | |
Income tax relating to items that will be reclassified | | | 8 | | | | 18 | |
Other comprehensive income after tax for items that will be reclassified to profit or loss | | | –172 | | | | 680 | |
Other comprehensive income net of tax | | | –171 | | | | 673 | |
Total comprehensive income | | | 724 | | | | 1,554 | |
attributable to owners of parent | | | 727 | | | | 1,553 | |
attributable to non-controlling interests | | | –2 | | | | 1 | |
Due to rounding, numbers may not add up precisely.
| | |
| 24 | | CONSOLIDATED INTERIM FINANCIAL STATEMENTS - IFRS |
CONSOLIDATED INCOME STATEMENTS OF SAP GROUP – NINE MONTHS
For the nine months ended September 30
| | | | | | | | | | | | | | | | |
€ millions, unless otherwise stated | | Notes | | | 2015 | | | 2014 | | | Change
in % | |
Cloud subscriptions and support | | | | | | | 1,654 | | | | 738 | | | | 124 | |
Software licenses | | | | | | | 2,689 | | | | 2,532 | | | | 6 | |
Software support | | | | | | | 7,494 | | | | 6,487 | | | | 16 | |
Software licenses and support | | | | | | | 10,183 | | | | 9,019 | | | | 13 | |
Cloud and software | | | | | | | 11,837 | | | | 9,757 | | | | 21 | |
Services | | | | | | | 2,614 | | | | 2,346 | | | | 11 | |
Total revenue | | | | | | | 14,451 | | | | 12,103 | | | | 19 | |
| | | | |
Cost of cloud subscriptions and support | | | | | | | –708 | | | | –320 | | | | 121 | |
Cost of software licenses and support | | | | | | | –1,632 | | | | –1,506 | | | | 8 | |
Cost of cloud and software | | | | | | | –2,340 | | | | –1,826 | | | | 28 | |
Cost of services | | | | | | | –2,423 | | | | –1,983 | | | | 22 | |
Total cost of revenue | | | | | | | –4,763 | | | | –3,810 | | | | 25 | |
Gross profit | | | | | | | 9,689 | | | | 8,293 | | | | 17 | |
Research and development | | | | | | | –2,058 | | | | –1,661 | | | | 24 | |
Sales and marketing | | | | | | | –3,749 | | | | –3,035 | | | | 24 | |
General and administration | | | | | | | –766 | | | | –612 | | | | 25 | |
Restructuring | | | (5 | ) | | | –563 | | | | –97 | | | | >100 | |
TomorrowNow and Versata litigation | | | | | | | 0 | | | | –307 | | | | <-100 | |
Other operating income/expense, net | | | | | | | 0 | | | | –4 | | | | <-100 | |
Total operating expenses | | | | | | | –11,899 | | | | –9,525 | | | | 25 | |
Operating profit | | | | | | | 2,552 | | | | 2,578 | | | | –1 | |
| | | | |
Other non-operating income/expense, net | | | | | | | –228 | | | | 44 | | | | <-100 | |
Finance income | | | | | | | 189 | | | | 99 | | | | 91 | |
Finance costs | | | | | | | –169 | | | | –100 | | | | 70 | |
Financial income, net | | | | | | | 20 | | | | –1 | | | | <-100 | |
Profit before tax | | | | | | | 2,344 | | | | 2,621 | | | | –11 | |
Income tax TomorrowNow and Versata litigation | | | | | | | 0 | | | | 86 | | | | <-100 | |
Other income tax expense | | | | | | | –566 | | | | –736 | | | | –23 | |
Income tax expense | | | | | | | –567 | | | | –650 | | | | –13 | |
Profit after tax | | | | | | | 1,778 | | | | 1,971 | | | | –10 | |
attributable to owners of parent | | | | | | | 1,783 | | | | 1,971 | | | | –10 | |
attributable to non-controlling interests | | | | | | | –5 | | | | 0 | | | | >100 | |
| | | | | | | | | | | | | | | | |
Earnings per share, basic (in €)1) | | | (8 | ) | | | 1.49 | | | | 1.65 | | | | –10 | |
Earnings per share, diluted (in €)1) | | | (8 | ) | | | 1.49 | | | | 1.65 | | | | –10 | |
| 1) | For the nine months ended September 30, 2015 and 2014, the weighted average number of shares was 1,196 million (diluted 1,197 million) and 1,194 million (diluted: 1,197 million), respectively (treasury stock excluded). |
Due to rounding, numbers may not add up precisely.
| | |
| INTERIM REPORT JANUARY – SEPTEMBER 2015 | | 25 |
CONSOLIDATED STATEMENTS OF COMPREHENSIVE INCOME OF SAP GROUP – NINE MONTHS
For the nine months ended September 30
| | | | | | | | |
€ millions | | 2015 | | | 2014 | |
Profit after tax | | | 1,778 | | | | 1,971 | |
Items that will not be reclassified to profit or loss | | | | | | | | |
Remeasurements on defined benefit pension plans | | | 3 | | | | –6 | |
Income tax relating to items that will not be reclassified | | | –3 | | | | 1 | |
Other comprehensive income after tax for items that will not be reclassified to profit or loss | | | 0 | | | | –5 | |
Items that will be reclassified subsequently to profit or loss | | | | | | | | |
Exchange differences | | | 1,363 | | | | 818 | |
Available-for-sale financial assets | | | 106 | | | | 25 | |
Cash flow hedges | | | 30 | | | | –56 | |
Income tax relating to items that will be reclassified | | | 26 | | | | 29 | |
Other comprehensive income after tax for items that will be reclassified to profit or loss | | | 1,525 | | | | 816 | |
Other comprehensive income net of tax | | | 1,524 | | | | 811 | |
Total comprehensive income | | | 3,302 | | | | 2,782 | |
attributable to owners of parent | | | 3,307 | | | | 2,782 | |
attributable to non-controlling interests | | | –5 | | | | 0 | |
Due to rounding, numbers may not add up precisely.
| | |
| 26 | | CONSOLIDATED INTERIM FINANCIAL STATEMENTS - IFRS |
CONSOLIDATED STATEMENTS OF FINANCIAL POSITION OF SAP GROUP
as at September 30, 2015 and December 31, 2014
| | | | | | | | | | | | |
€ millions | | Notes | | | 2015 | | | 2014 | |
Cash and cash equivalents | | | | | | | 3,844 | | | | 3,328 | |
Other financial assets | | | | | | | 921 | | | | 678 | |
Trade and other receivables | | | (9 | ) | | | 4,120 | | | | 4,342 | |
Other non-financial assets | | | | | | | 531 | | | | 435 | |
Tax assets | | | | | | | 203 | | | | 215 | |
Total current assets | | | | | | | 9,618 | | | | 8,999 | |
| | | |
Goodwill | | | | | | | 22,231 | | | | 21,005 | |
Intangible assets | | | | | | | 4,353 | | | | 4,604 | |
Property, plant, and equipment | | | | | | | 2,122 | | | | 2,102 | |
Other financial assets | | | | | | | 1,324 | | | | 1,021 | |
Trade and other receivables | | | (9 | ) | | | 81 | | | | 100 | |
Other non-financial assets | | | | | | | 232 | | | | 164 | |
Tax assets | | | | | | | 245 | | | | 231 | |
Deferred tax assets | | | | | | | 452 | | | | 230 | |
Total non-current assets | | | | | | | 31,039 | | | | 29,459 | |
Total assets | | | | | | | 40,657 | | | | 38,458 | |
as at September 30, 2015 and December 31, 2014
| | | | | | | | | | | | |
€ millions | | Notes | | | 2015 | | | 2014 | |
Trade and other payables | | | | | | | 968 | | | | 1,035 | |
Tax liabilities | | | | | | | 99 | | | | 339 | |
Financial liabilities | | | (10 | ) | | | 1,742 | | | | 2,561 | |
Other non-financial liabilities | | | | | | | 2,268 | | | | 2,810 | |
Provision TomorrowNow and Versata litigation | | | | | | | 0 | | | | 1 | |
Other provisions | | | | | | | 557 | | | | 149 | |
Provisions | | | | | | | 557 | | | | 150 | |
Deferred income | | | (11 | ) | | | 2,961 | | | | 1,680 | |
Total current liabilities | | | | | | | 8,595 | | | | 8,575 | |
| | | |
Trade and other payables | | | | | | | 77 | | | | 55 | |
Tax liabilities | | | | | | | 397 | | | | 371 | |
Financial liabilities | | | (10 | ) | | | 9,117 | | | | 8,980 | |
Other non-financial liabilities | | | | | | | 199 | | | | 219 | |
Provisions | | | | | | | 150 | | | | 151 | |
Deferred tax liabilities | | | | | | | 512 | | | | 496 | |
Deferred income | | | (11 | ) | | | 70 | | | | 78 | |
Total non-current liabilities | | | | | | | 10,521 | | | | 10,350 | |
Total liabilities | | | | | | | 19,116 | | | | 18,925 | |
| | | |
Issued capital | | | | | | | 1,229 | | | | 1,229 | |
Share premium | | | | | | | 547 | | | | 614 | |
Retained earnings | | | | | | | 18,778 | | | | 18,317 | |
Other components of equity | | | | | | | 2,088 | | | | 563 | |
Treasury shares | | | | | | | –1,128 | | | | –1,224 | |
Equity attributable to owners of parent | | | | | | | 21,513 | | | | 19,499 | |
| | | |
Non-controlling interests | | | | | | | 28 | | | | 34 | |
Total equity | | | (12 | ) | | | 21,541 | | | | 19,533 | |
Total equity and liabilities | | | | | | | 40,657 | | | | 38,458 | |
Due to rounding, numbers may not add up precisely.
| | |
| INTERIM REPORT JANUARY – SEPTEMBER 2015 | | 27 |
CONSOLIDATED STATEMENTS OF CHANGES IN EQUITY OF SAP GROUP
For the nine months ended September 30
| | | | | | | | | | | | | | | | | | | | | | | | | | | | | | | | | | | | | | | | |
€ millions | | Equity Attributable to Owners of Parent | | | Non-
Controlling
Interests | | | Total
Equity | |
| | | Issued
Capital | | | Share
Premium | | | Retained
Earnings | | | Other Components of Equity | | | Treasury
Shares | | | Total | | | | | | | |
| | | | | | | | | | | | Exchange
Diffe-
rences | | | Available-
for-Sale
Financial
Assets | | | Cash
Flow
Hedges | | | | | | | | | | | | | |
January 1, 2014 | | | 1,229 | | | | 551 | | | | 16,258 | | | | –820 | | | | 82 | | | | 20 | | | | –1,280 | | | | 16,040 | | | | 8 | | | | 16,048 | |
Profit after tax | | | | | | | | | | | 1,971 | | | | | | | | | | | | | | | | | | | | 1,971 | | | | | | | | 1,971 | |
Other comprehensive income | | | | | | | | | | | –5 | | | | 832 | | | | 25 | | | | –41 | | | | | | | | 811 | | | | | | | | 811 | |
Comprehensive income | | | | | | | | | | | 1,966 | | | | 832 | | | | 25 | | | | –41 | | | | | | | | 2,782 | | | | | | | | 2,782 | |
Share-based payments | | | | | | | 20 | | | | | | | | | | | | | | | | | | | | | | | | 20 | | | | | | | | 20 | |
Dividends | | | | | | | | | | | –1,194 | | | | | | | | | | | | | | | | | | | | –1,194 | | | | | | | | –1,194 | |
Reissuance of treasury shares under share-based payments | | | | | | | 27 | | | | | | | | | | | | | | | | | | | | 51 | | | | 78 | | | | | | | | 78 | |
Other changes | | | | | | | | | | | –4 | | | | | | | | | | | | | | | | | | | | –4 | | | | | | | | –4 | |
September 30, 2014 | | | 1,229 | | | | 598 | | | | 17,025 | | | | 12 | | | | 107 | | | | –21 | | | | –1,229 | | | | 17,721 | | | | 8 | | | | 17,729 | |
January 1, 2015 | | | 1,229 | | | | 614 | | | | 18,317 | | | | 361 | | | | 211 | | | | –8 | | | | –1,224 | | | | 19,499 | | | | 34 | | | | 19,533 | |
Profit after tax | | | | | | | | | | | 1,783 | | | | | | | | | | | | | | | | | | | | 1,783 | | | | –5 | | | | 1,778 | |
Other comprehensive income | | | | | | | | | | | | | | | 1,397 | | | | 106 | | | | 22 | | | | | | | | 1,524 | | | | | | | | 1,524 | |
Comprehensive income | | | | | | | | | | | 1,783 | | | | 1,397 | | | | 106 | | | | 22 | | | | | | | | 3,307 | | | | –5 | | | | 3,302 | |
Share-based payments | | | | | | | –143 | | | | | | | | | | | | | | | | | | | | | | | | –143 | | | | | | | | –143 | |
Dividends | | | | | | | | | | | –1,316 | | | | | | | | | | | | | | | | | | | | –1,316 | | | | | | | | –1,316 | |
Reissuance of treasury shares under share-based payments | | | | | | | 76 | | | | | | | | | | | | | | | | | | | | 96 | | | | 172 | | | | | | | | 172 | |
Other changes | | | | | | | | | | | –5 | | | | | | | | | | | | | | | | | | | | –5 | | | | | | | | –5 | |
September 30, 2015 | | | 1,229 | | | | 547 | | | | 18,778 | | | | 1,758 | | | | 316 | | | | 13 | | | | –1,128 | | | | 21,513 | | | | 28 | | | | 21,541 | |
Due to rounding, numbers may not add up precisely.
| | |
| 28 | | CONSOLIDATED INTERIM FINANCIAL STATEMENTS - IFRS |
CONSOLIDATED STATEMENTS OF CASH FLOWS OF SAP GROUP
For the nine months ended September 30
| | | | | | | | |
€ millions | | 2015 | | | 2014 | |
Profit after tax | | | 1,778 | | | | 1,971 | |
Adjustments to reconcile profit after taxes to net cash provided by operating activities: | | | | | | | | |
Depreciation and amortization | | | 965 | | | | 733 | |
Income tax expense | | | 567 | | | | 650 | |
Financial income, net | | | –20 | | | | 1 | |
Decrease/increase in sales and bad debt allowances on trade receivables | | | 111 | | | | 29 | |
Other adjustments for non-cash items | | | –12 | | | | 53 | |
Decrease/increase in trade and other receivables | | | 197 | | | | 480 | |
Decrease/increase in other assets | | | –212 | | | | –295 | |
Decrease/increase in trade payables, provisions, and other liabilities | | | –248 | | | | –136 | |
Decrease/increase in deferred income | | | 1,216 | | | | 914 | |
Cash outflows due to TomorrowNow and Versata litigation | | | 0 | | | | –233 | |
Interest paid | | | –111 | | | | –83 | |
Interest received | | | 60 | | | | 46 | |
Income taxes paid, net of refunds | | | –1,049 | | | | –1,048 | |
Net cash flows from operating activities | | | 3,241 | | | | 3,082 | |
| | |
Business combinations, net of cash and cash equivalents acquired | | | –13 | | | | –730 | |
Cash receipts from derivative financial instruments related to business combinations | | | 266 | | | | –125 | |
Total cash flows for business combinations, net of cash and cash equivalents acquired | | | 253 | | | | –855 | |
Purchase of intangible assets and property, plant, and equipment | | | –424 | | | | –472 | |
Proceeds from sales of intangible assets or property, plant, and equipment | | | 46 | | | | 37 | |
Purchase of equity or debt instruments of other entities | | | –1,709 | | | | –726 | |
Proceeds from sales of equity or debt instruments of other entities | | | 1,042 | | | | 704 | |
Net cash flows from investing activities | | | –793 | | | | –1,312 | |
| | |
Dividends paid | | | –1,316 | | | | –1,194 | |
Proceeds from reissuance of treasury shares | | | 58 | | | | 45 | |
Proceeds from borrowings | | | 1,745 | | | | 501 | |
Repayments of borrowings | | | –2,520 | | | | –586 | |
Net cash flows from financing activities | | | –2,033 | | | | –1,234 | |
| | |
Effect of foreign currency rates on cash and cash equivalents | | | 101 | | | | 70 | |
Net decrease/increase in cash and cash equivalents | | | 516 | | | | 606 | |
Cash and cash equivalents at the beginning of the period | | | 3,328 | | | | 2,748 | |
Cash and cash equivalents at the end of the period | | | 3,844 | | | | 3,354 | |
Due to rounding, numbers may not add up precisely.
| | |
| INTERIM REPORT JANUARY – SEPTEMBER 2015 | | 29 |
NOTES TO THE CONSOLIDATED INTERIM FINANCIAL STATEMENTS
(1) General Information About Consolidated Interim Financial Statements
The accompanying Consolidated Interim Financial Statements of SAP SE and its subsidiaries (collectively, “we,” “us,” “our,” “SAP,” “Group,” and “Company”) have been prepared in accordance with the International Financial Reporting Standards (IFRS) and in particular in compliance with International Accounting Standard (IAS) 34. The designation IFRS includes all standards issued by the International Accounting Standards Board (IASB) and related interpretations issued by the IFRS Interpretations Committee (IFRIC). The variances between the applicable IFRS standards as issued by the IASB and the standards as used by the European Union are not relevant to these financial statements.
Certain information and disclosures normally included in the notes to annual financial statements prepared in accordance with IFRS have been condensed or omitted. We believe that the disclosures made are adequate and that the information gives a true and fair view.
Our business activities are influenced by certain seasonal effects. Historically, our overall revenue tends to be highest in the fourth quarter. Interim results are therefore not necessarily indicative of results for a full year.
Amounts reported in previous years have been reclassified as appropriate to conform to the presentation in this interim report.
These unaudited condensed Consolidated Interim Financial Statements should be read in conjunction with SAP’s audited Consolidated IFRS Financial Statements for the Year Ended December 31, 2014, included in our 2014 Integrated Report and our 2014 Annual Report on Form 20-F.
Due to rounding, numbers presented throughout these Interim Financial Statements may not add up precisely to the totals we provide and percentages may not precisely reflect the absolute figures.
(2) Scope of Consolidation
Our changes in the scope of consolidation in the first nine months of 2015 were not material to our Consolidated Financial Statements.
For more information about our business combinations and the effect on our Consolidated Financial Statements, see Note (4) and our 2014 Integrated Report.
(3) Summary of Significant Accounting Policies
The Interim Financial Statements were prepared based on the same accounting policies as those applied and described in the Consolidated Financial Statements as at December 31, 2014. Our significant accounting policies are summarized in the Notes to the Consolidated Financial Statements.
(4) Business Combinations
Acquisitions made in the preceding year, including the acquisition of Concur on December 4, 2014, are described in our 2014 Integrated Report.
Amounts reported in previous quarters have been updated to reflect new information about facts and circumstances that existed at the date of these acquisitions.
Primarily, we have retrospectively adjusted the provisional amounts recognized for deferred tax assets and liabilities related to the 2014 Concur business combination by a corresponding increase in goodwill in the amount of €136 million. This adjustment mainly results from new information about the valuation of the carrying amount of investments in subsidiaries.
| | |
| 30 | | CONSOLIDATED INTERIM FINANCIAL STATEMENTS - IFRS |
(5) Restructuring
| | | | | | | | | | | | | | | | |
€ millions | | Q3 2015 | | | 1/1-
9/30/2015 | | | Q3 2014 | | | 1/1-
9/30/2014 | |
Employee-related restructuring expenses | | | 145 | | | | 563 | | | | 39 | | | | 90 | |
Facility-related restructuring expenses | | | 0 | | | | 0 | | | | 4 | | | | 7 | |
Restructuring expenses | | | 145 | | | | 563 | | | | 43 | | | | 97 | |
If not presented separately, these expenses would break down in our income statements as follows:
Restructuring Expenses by Functional Area
| | | | | | | | | | | | | | | | |
€ millions | | Q3 2015 | | | 1/1-
9/30/2015 | | | Q3 2014 | | | 1/1-
9/30/2014 | |
Cost of cloud and software | | | 4 | | | | 64 | | | | 2 | | | | 8 | |
Cost of services | | | 35 | | | | 180 | | | | 16 | | | | 21 | |
Research and development | | | 69 | | | | 178 | | | | 6 | | | | 22 | |
Sales and marketing | | | 33 | | | | 121 | | | | 15 | | | | 35 | |
General and administration | | | 4 | | | | 20 | | | | 4 | | | | 11 | |
Restructuring expenses | | | 145 | | | | 563 | | | | 43 | | | | 97 | |
(6) Employee Benefits Expense and Headcount
Employee Benefits Expense
| | | | | | | | | | | | | | | | |
€ millions | | Q3 2015 | | | 1/1-
9/30/2015 | | | Q3 2014 | | | 1/1-
9/30/2014 | |
Salaries | | | 1,739 | | | | 5,339 | | | | 1,511 | | | | 4,526 | |
Social security expenses | | | 232 | | | | 786 | | | | 221 | | | | 678 | |
Share-based payment expenses | | | 72 | | | | 386 | | | | –5 | | | | 119 | |
Pension expenses | | | 61 | | | | 202 | | | | 51 | | | | 164 | |
Employee-related restructuring expenses | | | 145 | | | | 563 | | | | 39 | | | | 90 | |
Termination benefits | | | 7 | | | | 21 | | | | 6 | | | | 18 | |
Employee Benefits Expense | | | 2,256 | | | | 7,297 | | | | 1,823 | | | | 5,595 | |
Acquired companies are only included in the employee benefits expense as of the company’s acquisition date. Concur is therefore not included in prior year numbers, Fieldglass is included since May 2, 2014.
On September 30, 2015, the breakdown of our full-time equivalent employee numbers by function and by region was as shown in the table below. The increase in headcount in the SAP Group to 75,643 employees is mainly due to the acquisition of Concur in December 2014.
Number of Employees (in Full-Time Equivalents)
| | | | | | | | | | | | | | | | | | | | | | | | | | | | | | | | |
| | | 9/30/2015 | | | 9/30/2014 | |
Full-Time Equivalents | | EMEA | | | Americas | | | APJ | | | Total | | | EMEA | | | Americas | | | APJ | | | Total | |
Cloud and software | | | 5,986 | | | | 3,853 | | | | 4,778 | | | | 14,617 | | | | 5,430 | | | | 3,269 | | | | 3,953 | | | | 12,652 | |
Services | | | 7,044 | | | | 4,214 | | | | 3,821 | | | | 15,079 | | | | 7,138 | | | | 4,078 | | | | 2,908 | | | | 14,124 | |
Research and development | | | 9,399 | | | | 4,129 | | | | 6,723 | | | | 20,251 | | | | 8,935 | | | | 3,591 | | | | 5,796 | | | | 18,322 | |
Sales and marketing | | | 7,097 | | | | 7,166 | | | | 3,582 | | | | 17,845 | | | | 6,784 | | | | 6,409 | | | | 3,274 | | | | 16,466 | |
General and administration | | | 2,494 | | | | 1,665 | | | | 1,019 | | | | 5,177 | | | | 2,400 | | | | 1,469 | | | | 768 | | | | 4,637 | |
Infrastructure | | | 1,493 | | | | 789 | | | | 392 | | | | 2,674 | | | | 1,489 | | | | 797 | | | | 347 | | | | 2,633 | |
SAP Group (9/30/2015) | | | 33,512 | | | | 21,817 | | | | 20,315 | | | | 75,643 | | | | 32,175 | | | | 19,613 | | | | 17,046 | | | | 68,835 | |
Thereof acquisitions | | | 0 | | | | 0 | | | | 0 | | | | 0 | | | | 49 | | | | 324 | | | | 15 | | | | 388 | |
SAP Group (average first nine months) | | | 33,466 | | | | 21,751 | | | | 19,487 | | | | 74,705 | | | | 31,508 | | | | 19,591 | | | | 16,378 | | | | 67,478 | |
| | |
| INTERIM REPORT JANUARY – SEPTEMBER 2015 | | 31 |
The allocations of expenses for share-based payments to the various expense items are as follows:
Share-Based Payments
| | | | | | | | | | | | | | | | |
€ millions | | Q3 2015 | | | 1/1-
9/30/2015 | | | Q3 2014 | | | 1/1-
9/30/2014 | |
Cost of cloud and software | | | 10 | | | | 42 | | | | 2 | | | | 15 | |
Cost of services | | | 13 | | | | 70 | | | | –2 | | | | 23 | |
Research and development | | | 22 | | | | 102 | | | | –1 | | | | 30 | |
Sales and marketing | | | 19 | | | | 115 | | | | –2 | | | | 32 | |
General and administration | | | 7 | | | | 58 | | | | –2 | | | | 19 | |
Share-based payments | | | 72 | | | | 386 | | | | –5 | | | | 119 | |
For more information about our share-based payments, see Note 14.
(7) Income Taxes
The contingent liability resulting from the income tax-related litigation with the German and Brazilian tax authority decreased to approximately €775 million on September 30, 2015 (December 31, 2014: €871 million). The decrease resulted from a change in the foreign currency exchange rate which was partly compensated by an increase in the potential amount in dispute in local currency. For further information, see our 2014 Integrated Report, Notes to the Consolidated Financial Statements section, Note (11).
For information about adjustments to income taxes due to our previous year’s acquisitions, see Note (4).
(8) Earnings per Share
| | | | | | | | | | | | | | | | |
€ millions, unless otherwise stated | | Q3 2015 | | | 1/1-
9/30/2015 | | | Q3 2014 | | | 1/1-
9/30/2014 | |
Profit attributable to equity holders of SAP SE | | | 898 | | | | 1,783 | | | | 880 | | | | 1,971 | |
Issued ordinary shares1) | | | 1,229 | | | | 1,229 | | | | 1,229 | | | | 1,229 | |
Effect of treasury shares1) | | | –31 | | | | –32 | | | | –33 | | | | –34 | |
Weighted average shares outstanding, basic1) | | | 1,198 | | | | 1,196 | | | | 1,195 | | | | 1,194 | |
Dilutive effect of share-based payments1) | | | 1 | | | | 1 | | | | 3 | | | | 3 | |
Weighted average shares outstanding, diluted1) | | | 1,198 | | | | 1,197 | | | | 1,198 | | | | 1,197 | |
| | | | |
Earnings per share, basic, attributable to equity holders of SAP SE (in €) | | | 0.75 | | | | 1.49 | | | | 0.74 | | | | 1.65 | |
Earnings per share, diluted, attributable to equity holders of SAP SE (in €) | | | 0.75 | | | | 1.49 | | | | 0.73 | | | | 1.65 | |
| 1) | Number of shares in millions |
| | |
| 32 | | CONSOLIDATED INTERIM FINANCIAL STATEMENTS - IFRS |
(9) Trade and Other Receivables
| | | | | | | | | | | | |
| | | September 30, 2015 | |
€ millions | | Current | | | Non-
Current | | | Total | |
Trade receivables, net | | | 4,056 | | | | 1 | | | | 4,057 | |
Other receivables | | | 64 | | | | 80 | | | | 145 | |
Total | | | 4,120 | | | | 81 | | | | 4,201 | |
| | | | | | | | | | | | |
| | | December 31, 2014 | |
€ millions | | Current | | | Non-
Current | | | Total | |
Trade receivables, net | | | 4,253 | | | | 1 | | | | 4,254 | |
Other receivables | | | 89 | | | | 99 | | | | 188 | |
Total | | | 4,342 | | | | 100 | | | | 4,442 | |
The carrying amounts of our trade receivables and related allowances were as follows:
Carrying Amounts of Trade Receivables
| | | | | | | | |
€ millions | | 9/30/
2015 | | | 12/31/
2014 | |
Gross carrying amount | | | 4,351 | | | | 4,442 | |
Sales allowances charged to revenue | | | –229 | | | | –135 | |
Allowance for doubtful accounts charged to expense | | | –65 | | | | –52 | |
Carrying amount trade receivables, net | | | 4,057 | | | | 4,254 | |
(10) Financial Liabilities
| | | | | | | | | | | | | | | | | | | | |
€ millions | | September 30, 2015 | |
| | | Nominal Volume | | | Carrying Amount | |
| | | Current | | | Non-Current | | | Current | | | Non-Current | | | Total | |
Bonds | | | 551 | | | | 5,750 | | | | 551 | | | | 5,716 | | | | 6,267 | |
Private placement transactions | | | 803 | | | | 1,562 | | | | 803 | | | | 1,600 | | | | 2,403 | |
Bank loans | | | 11 | | | | 1,750 | | | | 11 | | | | 1,745 | | | | 1,756 | |
Financial debt | | | 1,366 | | | | 9,062 | | | | 1,365 | | | | 9,061 | | | | 10,426 | |
Derivatives | | | NA | | | | NA | | | | 186 | | | | 56 | | | | 242 | |
Other financial liabilities | | | NA | | | | NA | | | | 190 | | | | 0 | | | | 191 | |
Financial liabilities | | | | | | | | | | | 1,742 | | | | 9,117 | | | | 10,859 | |
| | | | | | | | | | | | | | | | | | | | |
€ millions | | December 31, 2014 | |
| | | Nominal Volume | | | Carrying Amount | |
| | | Current | | | Non-Current | | | Current | | | Non-Current | | | Total | |
Bonds | | | 631 | | | | 4,000 | | | | 630 | | | | 3,998 | | | | 4,628 | |
Private placement transactions | | | 247 | | | | 1,936 | | | | 247 | | | | 1,948 | | | | 2,195 | |
Bank loans | | | 1,279 | | | | 3,000 | | | | 1,277 | | | | 2,985 | | | | 4,262 | |
Financial debt | | | 2,157 | | | | 8,936 | | | | 2,154 | | | | 8,931 | | | | 11,085 | |
Derivatives | | | NA | | | | NA | | | | 287 | | | | 46 | | | | 333 | |
Other financial liabilities | | | NA | | | | NA | | | | 120 | | | | 4 | | | | 124 | |
Financial liabilities | | | | | | | | | | | 2,561 | | | | 8,980 | | | | 11,542 | |
Our current other financial liabilities comprise customer funding liabilities amounting to €74 million on September 30, 2015 (December 31, 2014: €58 million). We draw funds from and make payments on behalf of our customers for customer’s employee expense reimbursements, related credit card payments, and vendor payments. We hold these funds in cash and record our obligation to make these expense reimbursements and payments on behalf of our customers as customer funding liabilities.
| | |
| INTERIM REPORT JANUARY – SEPTEMBER 2015 | | 33 |
(11) Deferred Income
| | | | | | | | |
€ millions | | 9/30/
2015 | | | 12/31/
2014 | |
Current | | | 2,961 | | | | 1,680 | |
thereof deferred revenue from cloud subscriptions and support | | | 782 | | | | 689 | |
Non-current | | | 70 | | | | 78 | |
Total Deferred Income | | | 3,031 | | | | 1,758 | |
(12) Total Equity
Treasury Shares
In the first nine months of 2015, we did not acquire shares for treasury, and 2.6 million (Q3 2015: 0.1 million) shares were disposed at an average price of €36.80 (Q3 2015: €36.79) per share.
In the first nine months of 2014, we did not acquire shares for treasury, 1.4 million (Q3 2014: 0.1 million) shares were disposed at an average price of €36.79 (Q3 2014: €36.80) per share.
Share sales in 2015 and 2014 were in connection with our share-based payments, which are described in our 2014 Integrated Report, Notes to the Consolidated Financial Statements section, Note (28).
Other Comprehensive Income
The component of other comprehensive income before tax that will be reclassified to profit or loss in the future includes the following items for the third quarter:
| | | | | | | | |
€ millions | | Q3 2015 | | | Q3 2014 | |
Gains (losses) on exchange differences | | | –179 | | | | 676 | |
Gains (losses) on remeasuring available-for-sale financial assets | | | –44 | | | | 8 | |
Reclassification adjustments on available-for-sale financial assets | | | –1 | | | | 0 | |
Available-for-sale financial assets | | | –45 | | | | 8 | |
Gains (losses) on cash flow hedges | | | 44 | | | | –29 | |
Reclassification adjustments on cash flow hedges | | | –1 | | | | 7 | |
Cash flow hedges | | | 43 | | | | –22 | |
The component of other comprehensive income before tax that will be reclassified to profit or loss in the future includes the following items for the first nine months:
| | | | | | | | |
€ millions | | 1/1-
9/30/2015 | | | 1/1-
9/30/2014 | |
Gains (losses) on exchange differences | | | 1,363 | | | | 818 | |
Gains (losses) on remeasuring available-for-sale financial assets | | | 107 | | | | 27 | |
Reclassification adjustments on available-for-sale financial assets | | | –1 | | | | –2 | |
Available-for-sale financial assets | | | 106 | | | | 25 | |
Gains (losses) on cash flow hedges | | | –31 | | | | –49 | |
Reclassification adjustments on cash flow hedges | | | 61 | | | | –7 | |
Cash flow hedges | | | 30 | | | | –56 | |
(13) Litigation and Claims
We are subject to a variety of claims and lawsuits that arise from time to time in the ordinary course of our business, including proceedings and claims that relate to companies we have acquired, claims that relate to customers demanding indemnification for proceedings initiated against them based on their use of SAP software, and claims that relate to customers’ being dissatisfied with the products and services that we have delivered to them. We will continue to vigorously defend against all claims and lawsuits against us. We currently believe that resolving the claims and lawsuits pending as of September 30, 2015, will neither individually nor in the aggregate have a material adverse effect on our business, financial position, profit, or cash flows. Consequently, the provisions recorded for these claims and lawsuits as of September 30, 2015, are neither individually nor in aggregate material to SAP.
However, the outcome of litigation and claims is intrinsically subject to considerable uncertainty. Management’s view of the litigation may also change in the future. Actual outcomes of litigation and claims may differ from the assessments made by management in prior periods, which could result in a material impact on our business, financial position, profit, cash flows, or reputation. Most of the lawsuits and claims are of a very individual nature and claims are either not quantified by the claimants or claim amounts quantified are, based on historical evidence, not expected to be a good proxy for the expenditure that would be required to settle the case concerned. The specifics of the jurisdictions where most of the claims are located further impair the predictability of the outcome of the cases. Therefore, it is not practicable to reliably estimate the financial effect that these lawsuits and claims would have if SAP were to incur expenditure for these cases.
Among the claims and lawsuits are the following classes:
Intellectual Property-Related Litigation and Claims
| | |
| 34 | | CONSOLIDATED INTERIM FINANCIAL STATEMENTS - IFRS |
Intellectual property-related litigation and claims comprise cases in which third parties have threatened or initiated litigation claiming that SAP violates one or more intellectual property rights that they possess. Such intellectual property rights may include patents, copyrights, and other similar rights.
There have been no significant changes to the amount of provisions recorded for intellectual property-related litigation and claims compared to the amounts disclosed in our 2014 Integrated Report, Notes to the Consolidated Financial Statements section, Note (19b).
Contingent liabilities exist from intellectual property-related litigation and claims for which no provision has been recognized. There have been no significant changes in contingent liabilities since December 31, 2014.
Individual cases of intellectual property-related litigation and claims comprise:
In April 2007, United States-based Versata Software, Inc. (formerly Trilogy Software, Inc.) (Versata) instituted legal proceedings in the United States District Court for the Eastern District of Texas against SAP. Versata alleged that SAP’s products infringe one or more of the claims in patents held by Versata. In August 2014, after numerous legal proceedings (for details, see our 2014 Integrated Report, Notes to the Consolidated Financial Statements section, Note (24)), Versata and SAP entered into a Patent License and Settlement Agreement (the “Agreement”) to settle the patent litigation between the companies. Under the terms of the Agreement, Versata has licensed to SAP certain patents in exchange for a one-time cash payment and a potential additional contingent payment. The Agreement also provides for general releases, indemnification for its violation, and dismisses the existing litigation with prejudice.
In February 2010, United States-based TecSec, Inc. (TecSec) instituted legal proceedings in the United States against SAP (including its subsidiary Sybase), and many other defendants. TecSec alleged that SAP’s and Sybase’s products infringe one or more of the claims in five patents held by TecSec. In its complaint, TecSec seeks unspecified monetary damages and permanent injunctive relief. The trial has not yet been scheduled. The legal proceedings were stayed against all defendants pending a decision from the U.S. Supreme Court on SAP’s and other defendants’ request for review. Supreme Court review was declined in June 2014. The lawsuit has resumed at the district court but only with respect to one defendant. The lawsuit against SAP and Sybase remains stayed.
In April 2010, SAP instituted legal proceedings (a Declaratory Judgment action) in the United States against Wellogix, Inc. and Wellogix Technology Licensing, LLC (Wellogix). The lawsuit seeks a declaratory judgment that five patents owned by Wellogix are invalid and/or not infringed by SAP. The trial has not yet been scheduled. The legal proceedings have been stayed pending the outcome of six reexaminations filed with the United States Patent and Trademark Office (USPTO). In September 2013, the USPTO issued a decision on four of the six reexaminations, invalidating every claim of each of the four patents. SAP is awaiting a decision on the two remaining reexamination requests. In response to SAP’s patent Declaratory Judgment action, Wellogix has re-asserted trade secret misappropriation claims against SAP (which had previously been raised and abandoned). The court granted SAP’s motion for an early dispositive decision on the trade secret claims; Wellogix’s appeal of that decision is pending. In February 2015, SAP filed a declaratory judgment action in Frankfurt/Main, Germany, asking the German court to rule that SAP did not misappropriate any Wellogix trade secret.
Customer-Related Litigation and Claims
Customer-related litigation and claims include cases in which we indemnify our customers against liabilities arising from a claim that our products infringe a third party’s patent, copyright, trade secret, or other proprietary rights. Occasionally, consulting or software implementation projects result in disputes with customers. Where customers are dissatisfied with the products and services that we have delivered to them in routine consulting contracts or development arrangements, we may grant functions or performance guarantees.
For more information about provisions recorded for customer-related litigation and claims, see our 2014 Integrated Report, Notes to the Consolidated Financial Statements section, Note (19b).
Contingent liabilities exist from customer-related litigation and claims for which no provision has been recognized. There have been no significant changes in contingent liabilities since December 31, 2014.
Non-Income Tax-Related Litigation and Claims
We are subject to ongoing audits by domestic and foreign tax authorities. Along with many other companies operating in Brazil, we are involved in various proceedings with Brazilian authorities regarding assessments and litigation matters on non-income taxes on intercompany royalty payments and intercompany services. The total potential amount in dispute related to these matters for all applicable years is approximately €69 million on September 30, 2015 (December 31, 2014: €95 million). We have not recorded a provision for these matters, as we believe that we will prevail.
For more information about income tax-related litigation see Note (7).
| | |
| INTERIM REPORT JANUARY – SEPTEMBER 2015 | | 35 |
(14) Share-Based Payments
For a detailed description of our share-based payment plans, see our 2014 Integrated Report, Notes to the Consolidated Financial Statements section, Note (28).
Stock Option Plan 2010 (2015 Tranche)
Under the Stock Option Plan 2010 (2015 Tranche), we granted 10.9 million cash-based virtual stock options to global executives and to SAP’s Top Rewards in 2015.
The vesting period is three years and the contractual term of the program is six years. The exercise price is €72.18 and the fair value on the grant date was €8.88.
Share Matching Plan 2015 (SMP 2015)
Under the SMP 2015, SAP offered its employees the opportunity to purchase SAP SE shares at a discount of 40%. The number of SAP shares an eligible employee was able to purchase was limited to a percentage of the employee’s annual base salary. After a holding period of three years, the employees receive one SAP share free of charge for every three shares held. The terms for the global executives are different. Instead of receiving a discount, global executives are granted two bonus shares for every three shares acquired and held during the three-year vesting period. In June 2015, the participants purchased 1.5 million SAP shares in aggregate at a discounted share price of €40.51. The discount of €36 million was expensed immediately. The fair value of the right to a bonus share was estimated on the grant date (June 5, 2015) at €62.98 per share, using a risk-free interest rate of –0.08%, a dividend yield of 1.67%, and an expected life of three years.
The outstanding bonus shares under the Share Matching Plan (SMP) are as follows:
| | | | | | | | |
thousands | | 9/30/
2015 | | | 12/31/
2014 | |
Outstanding awards | | | 1,612 | | | | 3,935 | |
(15) Other Financial Instruments
A detailed overview of our other financial instruments, financial risk factors, and the management of financial risks are presented in Notes (25) to (27) to our Consolidated Financial Statements for 2014, which are included in our 2014 Integrated Report, and our 2014 Annual Report on Form 20-F.
Except for the issuance of a triple-tranche Eurobond transaction with a total volume of €1.75 billion there have been no significant changes to our financial risk management since December 31, 2014.
In the following, we disclose the fair value of financial instruments, valuation techniques and inputs used and the level of the fair value hierarchy within which the fair value measurements are categorized.
Fair Value of Financial Instruments
The table below shows the carrying amounts and fair values of financial assets and liabilities by category of financial instrument as well as by category in IAS 39 and the allocation to the fair value hierarchy as mandated by IFRS 13 as at the reporting date:
| | |
| 36 | | CONSOLIDATED INTERIM FINANCIAL STATEMENTS - IFRS |
Fair Values of Financial Instruments
| | | | | | | | | | | | | | | | | | | | | | | | | | | | | | | | |
€ millions | | | | | 2015 | |
| | | | | Carrying
Amount | | | Measurement Categories | | | Fair Value | |
| | Category | | | | | | At
Amortized
Cost | | | At Fair
Value | | | Level 1 | | | Level 2 | | | Level 3 | | | Total | |
Assets | | | | | | | | | | | | | | | | | | | | | | | | | | | | | | | | |
Cash and cash equivalents1 | | | L&R | | | | 3,844 | | | | 3,844 | | | | | | | | | | | | | | | | | | | | | |
Trade and other receivables | | | | | | | 4,201 | | | | | | | | | | | | | | | | | | | | | | | | | |
Trade receivables1 | | | L&R | | | | 4,057 | | | | 4,057 | | | | | | | | | | | | | | | | | | | | | |
Other receivables2 | | | – | | | | 145 | | | | | | | | | | | | | | | | | | | | | | | | | |
Other financial assets | | | | | | | 2,245 | | | | | | | | | | | | | | | | | | | | | | | | | |
Available-for-sale financial assets | | | | | | | | | | | | | | | | | | | | | | | | | | | | | | | | |
Debt investments | | | AFS | | | | 208 | | | | | | | | 208 | | | | 208 | | | | | | | | | | | | 208 | |
Equity investments | | | AFS | | | | 842 | | | | | | | | 842 | | | | 146 | | | | 195 | | | | 502 | | | | 842 | |
Investments in associates2 | | | – | | | | 64 | | | | | | | | | | | | | | | | | | | | | | | | | |
Loans and other financial receivables | | | | | | | | | | | | | | | | | | | | | | | | | | | | | | | | |
Financial instruments related to employee benefit plans2 | | | – | | | | 129 | | | | | | | | | | | | | | | | | | | | | | | | | |
Other loans and other financial receivables | | | L&R | | | | 767 | | | | 767 | | | | | | | | | | | | 767 | | | | | | | | 767 | |
Derivative assets | | | | | | | | | | | | | | | | | | | | | | | | | | | | | | | | |
Designated as hedging instrument | | | | | | | | | | | | | | | | | | | | | | | | | | | | | | | | |
FX forward contracts | | | – | | | | 36 | | | | | | | | 36 | | | | | | | | 36 | | | | | | | | 36 | |
Interest rate swaps | | | – | | | | 103 | | | | | | | | 103 | | | | | | | | 103 | | | | | | | | 103 | |
Not designated as hedging instrument | | | | | | | | | | | | | | | | | | | | | | | | | | | | | | | | |
FX forward contracts | | | HFT | | | | 34 | | | | | | | | 34 | | | | | | | | 34 | | | | | | | | 34 | |
Call options for share-based payments | | | HFT | | | | 48 | | | | | | | | 48 | | | | | | | | 48 | | | | | | | | 48 | |
Call option on equity shares | | | HFT | | | | 14 | | | | | | | | 14 | | | | | | | | | | | | 14 | | | | 14 | |
Liabilities | | | | | | | | | | | | | | | | | | | | | | | | | | | | | | | | |
Trade and other payables | | | | | | | –1,045 | | | | | | | | | | | | | | | | | | | | | | | | | |
Trade payables1 | | | AC | | | | –762 | | | | –762 | | | | | | | | | | | | | | | | | | | | | |
Other payables2 | | | – | | | | –283 | | | | | | | | | | | | | | | | | | | | | | | | | |
Financial liabilities | | | | | | | –10,859 | | | | | | | | | | | | | | | | | | | | | | | | | |
Non-derivative financial liabilities | | | | | | | | | | | | | | | | | | | | | | | | | | | | | | | | |
Loans | | | AC | | | | –1,756 | | | | –1,756 | | | | | | | | | | | | –1,756 | | | | | | | | –1,756 | |
Bonds | | | AC | | | | –6,267 | | | | –6,267 | | | | | | | | –6,327 | | | | | | | | | | | | –6,327 | |
Private placements | | | AC | | | | –2,403 | | | | –2,403 | | | | | | | | | | | | –2,506 | | | | | | | | –2,506 | |
Other non-derivative financial liabilities | | | AC | | | | –190 | | | | –190 | | | | | | | | | | | | –190 | | | | | | | | –190 | |
Derivatives | | | | | | | | | | | | | | | | | | | | | | | | | | | | | | | | |
Designated as hedging instrument | | | | | | | | | | | | | | | | | | | | | | | | | | | | | | | | |
FX forward contracts | | | – | | | | –17 | | | | | | | | –17 | | | | | | | | –17 | | | | | | | | –17 | |
Interest rate swaps | | | – | | | | 0 | | | | | | | | 0 | | | | | | | | 0 | | | | | | | | 0 | |
Not designated as hedging instrument | | | | | | | | | | | | | | | | | | | | | | | | | | | | | | | | |
FX forward contracts | | | HFT | | | | –226 | | | | | | | | –226 | | | | | | | | –226 | | | | | | | | –226 | |
Total financial instruments, net | | | | | | | –1,614 | | | | –2,710 | | | | 1,041 | | | | –5,974 | | | | –3,511 | | | | 515 | | | | –8,970 | |
| | |
| INTERIM REPORT JANUARY – SEPTEMBER 2015 | | 37 |
| | | | | | | | | | | | | | | | | | | | | | | | | | | | | | | | |
€ millions | | | | | 2014 | |
| | | | | Carrying
Amount | | | Measurement Categories | | | Fair Value | |
| | Category | | | | | | At
Amortized
Cost | | | At Fair
Value | | | Level 1 | | | Level 2 | | | Level 3 | | | Total | |
Assets | | | | | | | | | | | | | | | | | | | | | | | | | | | | | | | | |
Cash and cash equivalents1 | | | L&R | | | | 3,328 | | | | 3,328 | | | | | | | | | | | | | | | | | | | | | |
Trade and other receivables | | | | | | | 4,442 | | | | | | | | | | | | | | | | | | | | | | | | | |
Trade receivables1 | | | L&R | | | | 4,254 | | | | 4,254 | | | | | | | | | | | | | | | | | | | | | |
Other receivables2 | | | – | | | | 188 | | | | | | | | | | | | | | | | | | | | | | | | | |
Other financial assets | | | | | | | 1,699 | | | | | | | | | | | | | | | | | | | | | | | | | |
Available-for-sale financial assets | | | | | | | | | | | | | | | | | | | | | | | | | | | | | | | | |
Debt investments | | | AFS | | | | 40 | | | | | | | | 40 | | | | 40 | | | | | | | | | | | | 40 | |
Equity investments | | | AFS | | | | 597 | | | | | | | | 597 | | | | 108 | | | | 101 | | | | 388 | | | | 597 | |
Investments in associates2 | | | – | | | | 49 | | | | | | | | | | | | | | | | | | | | | | | | | |
Loans and other financial receivables | | | | | | | | | | | | | | | | | | | | | | | | | | | | | | | | |
Financial instruments related to employee benefit plans2 | | | – | | | | 136 | | | | | | | | | | | | | | | | | | | | | | | | | |
Other loans and other financial receivables | | | L&R | | | | 324 | | | | 324 | | | | | | | | | | | | 324 | | | | | | | | 324 | |
Derivative assets | | | | | | | | | | | | | | | | | | | | | | | | | | | | | | | | |
Designated as hedging instrument | | | | | | | | | | | | | | | | | | | | | | | | | | | | | | | | |
FX forward contracts | | | – | | | | 10 | | | | | | | | 10 | | | | | | | | 10 | | | | | | | | 10 | |
Interest rate swaps | | | – | | | | 77 | | | | | | | | 77 | | | | | | | | 77 | | | | | | | | 77 | |
Not designated as hedging instrument | | | | | | | | | | | | | | | | | | | | | | | | | | | | | | | | |
FX forward contracts | | | HFT | | | | 411 | | | | | | | | 411 | | | | | | | | 411 | | | | | | | | 411 | |
Call options for share-based payments | | | HFT | | | | 43 | | | | | | | | 43 | | | | | | | | 43 | | | | | | | | 43 | |
Call option on equity shares | | | HFT | | | | 13 | | | | | | | | 13 | | | | | | | | | | | | 13 | | | | 13 | |
Liabilities | | | | | | | | | | | | | | | | | | | | | | | | | | | | | | | | |
Trade and other payables | | | | | | | –1,061 | | | | | | | | | | | | | | | | | | | | | | | | | |
Trade payables1 | | | AC | | | | –756 | | | | –756 | | | | | | | | | | | | | | | | | | | | | |
Other payables2 | | | – | | | | –305 | | | | | | | | | | | | | | | | | | | | | | | | | |
Financial liabilities | | | | | | | –11,542 | | | | | | | | | | | | | | | | | | | | | | | | | |
Non-derivative financial liabilities | | | | | | | | | | | | | | | | | | | | | | | | | | | | | | | | |
Loans | | | AC | | | | –4,261 | | | | –4,261 | | | | | | | | | | | | –4,261 | | | | | | | | –4,261 | |
Bonds | | | AC | | | | –4,628 | | | | –4,628 | | | | | | | | –4,810 | | | | | | | | | | | | –4,810 | |
Private placements | | | AC | | | | –2,195 | | | | –2,195 | | | | | | | | | | | | –2,301 | | | | | | | | –2,301 | |
Other non-derivative financial liabilities | | | AC | | | | –124 | | | | –124 | | | | | | | | | | | | –124 | | | | | | | | –124 | |
Derivatives | | | | | | | | | | | | | | | | | | | | | | | | | | | | | | | | |
Designated as hedging instrument | | | | | | | | | | | | | | | | | | | | | | | | | | | | | | | | |
FX forward contracts | | | – | | | | –22 | | | | | | | | –22 | | | | | | | | –22 | | | | | | | | –22 | |
Interest rate swaps | | | – | | | | –1 | | | | | | | | –1 | | | | | | | | –1 | | | | | | | | –1 | |
Not designated as hedging instrument | | | | | | | | | | | | | | | | | | | | | | | | | | | | | | | | |
FX forward contracts | | | HFT | | | | –310 | | | | | | | | –310 | | | | | | | | –310 | | | | | | | | –310 | |
Total financial instruments, net | | | | | | | –3,134 | | | | –4,060 | | | | 858 | | | | –4,662 | | | | –6,054 | | | | 400 | | | | –10,315 | |
| 1 | We do not disclose the fair value of cash and cash equivalents, trade receivables, and accounts payable as their carrying amounts are a reasonable approximation of their fair values. |
| 2 | Since the line items trade receivables, trade payables and other financial assets contain both financial and non-financial assets or liabilities (such as other taxes or advance payments), the carrying amounts of non-financial assets or liabilities are shown to allow a reconciliation to the corresponding line item in the Consolidated Statements of Financial Position. |
| | |
| 38 | | CONSOLIDATED INTERIM FINANCIAL STATEMENTS - IFRS |
Fair Values of Financial Instruments Classified According IAS 39
| | | | | | | | | | | | | | | | | | | | |
€ millions | | | | | | | | | | | | | | 2015 | |
| | | | | | Carrying
Amount | | | At
Amortized
Cost | | | At
Fair
Value | | | Out of
scope of
IFRS 7 | |
Financial assets | | | | | | | | | | | | | | | | | | | | |
At fair value through profit or loss | | | HFT | | | | 96 | | | | | | | | 96 | | | | | |
Available-for-sale | | | AFS | | | | 1,050 | | | | | | | | 1,050 | | | | | |
Loans and receivables | | | L&R | | | | 8,668 | | | | 8,668 | | | | | | | | | |
Financial liabilities | | | | | | | | | | | | | | | | | | | | |
At fair value through profit or loss | | | HFT | | | | –226 | | | | | | | | –226 | | | | | |
At amortized cost | | | AC | | | | –11,378 | | | | –11,378 | | | | | | | | | |
Outside scope of IAS 39 | | | | | | | | | | | | | | | | | | | | |
Financial instruments related to employee benefit plans | | | | | | | 129 | | | | | | | | | | | | 129 | |
Investments in associates | | | | | | | 64 | | | | | | | | | | | | 64 | |
Other receivables | | | | | | | 145 | | | | | | | | | | | | 145 | |
Other payables | | | | | | | –283 | | | | | | | | | | | | –283 | |
Derivatives designated as hedging instrument | | | | | | | 121 | | | | | | | | 121 | | | | | |
Total financial instruments, net | | | | | | | –1,614 | | | | –2,710 | | | | 1,041 | | | | 54 | |
| | | | | | | | | | | | | | | | | | | | |
€ millions | | | | | | | | | | | | | | 2014 | |
| | | | | | Carrying
Amount | | | At
Amortized
Cost | | | At
Fair
Value | | | Out of
scope of
IFRS 7 | |
Financial assets | | | | | | | | | | | | | | | | | | | | |
At fair value through profit or loss | | | HFT | | | | 467 | | | | | | | | 467 | | | | | |
Available-for-sale | | | AFS | | | | 637 | | | | | | | | 637 | | | | | |
Loans and receivables | | | L&R | | | | 7,905 | | | | 7,905 | | | | | | | | | |
Financial liabilities | | | | | | | | | | | | | | | | | | | | |
At fair value through profit or loss | | | HFT | | | | –310 | | | | | | | | –310 | | | | | |
At amortized cost | | | AC | | | | –11,965 | | | | –11,965 | | | | | | | | | |
Outside scope of IAS 39 | | | | | | | | | | | | | | | | | | | | |
Financial instruments related to employee benefit plans | | | | | | | 136 | | | | | | | | | | | | 136 | |
Investments in associates | | | | | | | 49 | | | | | | | | | | | | 49 | |
Other receivables | | | | | | | 188 | | | | | | | | | | | | 188 | |
Other payables | | | | | | | –305 | | | | | | | | | | | | –305 | |
Derivatives designated as hedging instrument | | | | | | | 64 | | | | | | | | 64 | | | | | |
Total financial instruments, net | | | | | | | –3,134 | | | | –4,060 | | | | 858 | | | | 68 | |
Determination of Fair Value
It is our policy to recognize transfers between the levels of the fair value hierarchy at the beginning of the respective period when the event or change in circumstances occurred that caused the transfer.
A detailed overview of the determination of fair value, the respective inputs as well as the classification of our other financial instruments into the fair value hierarchy of IFRS 13 are presented in Note (27) to our Consolidated Financial Statements for 2014, which are included in our 2014 Integrated Report, and our 2014 Annual Report on Form 20-F.
| | |
| INTERIM REPORT JANUARY – SEPTEMBER 2015 | | 39 |
(16) Segment and Geographic Information
General Information
SAP has two reportable segments that are regularly reviewed by our Executive Board, which is responsible for assessing the performance of our Company and for making resource allocation decisions as our Chief Operating Decision Maker (CODM). One is our Applications, Technology & Services segment and the other is the SAP Business Network segment. These segments are largely organized and managed separately according to their product and service offerings, notably whether the products and services relate to our business network activities or cover other areas of our business.
The Applications, Technology & Services segment derives its revenue primarily from the sale of software licenses, subscriptions to our cloud applications and related services (mainly support services and various professional services and premium support services, as well as implementation services for our software products and education services on the use of our products).
The SAP Business Network segment emerged in early 2015 from combining all SAP network offerings (that is, predominantly the activities of the Concur business purchased at the end of 2014 and the activities of the Ariba and Fieldglass businesses acquired earlier) into one network of networks which covers temporary workforce sourcing, other procurement, and end-to-end travel and business travel expense management. The SAP Business Network segment derives its revenues mainly from transaction fees charged for the use of SAP’s cloud-based collaborative business network and from services relating to the SAP Business Network (including cloud applications, professional services, and education services). Within the SAP Business Network segment, we mainly market and sell the cloud offerings developed by Ariba, Fieldglass, and Concur.
An acquired company is only included as of that company’s acquisition date. Concur is therefore included since December 4, 2014, Fieldglass is included since May 2, 2014.
Revenue and Results of Segments
| | | | | | | | | | | | | | | | | | | | | | | | | | | | | | | | | | | | |
€ millions | | Applications, Technology & Services | | | SAP Business Network | | | Total Reportable Segments | |
| | | Q3 2015 | | | Q3 2014 | | | Q3 2015 | | | Q3 2014 | | | Q3 2015 | | | Q3 2014 | |
| | | Actual
Currency | | | Constant
Currency | | | Actual
Currency | | | Actual
Currency | | | Constant
Currency | | | Actual
Currency | | | Actual
Currency | | | Constant
Currency | | | Actual
Currency | |
Cloud subscriptions and support | | | 253 | | | | 226 | | | | 154 | | | | 347 | | | | 302 | | | | 124 | | | | 600 | | | | 528 | | | | 278 | |
Software licenses | | | 1,015 | | | | 986 | | | | 950 | | | | 0 | | | | 0 | | | | 0 | | | | 1,015 | | | | 986 | | | | 949 | |
Software support | | | 2,501 | | | | 2,370 | | | | 2,226 | | | | 8 | | | | 7 | | | | 7 | | | | 2,509 | | | | 2,377 | | | | 2,233 | |
Software licenses and support | | | 3,515 | | | | 3,356 | | | | 3,175 | | | | 8 | | | | 7 | | | | 7 | | | | 3,523 | | | | 3,362 | | | | 3,183 | |
Cloud and software | | | 3,768 | | | | 3,582 | | | | 3,329 | | | | 355 | | | | 308 | | | | 132 | | | | 4,123 | | | | 3,890 | | | | 3,461 | |
Services | | | 799 | | | | 753 | | | | 761 | | | | 57 | | | | 50 | | | | 27 | | | | 856 | | | | 802 | | | | 788 | |
Total segment revenue | | | 4,567 | | | | 4,335 | | | | 4,090 | | | | 412 | | | | 358 | | | | 159 | | | | 4,979 | | | | 4,692 | | | | 4,249 | |
Cost of cloud subscriptions and support | | | –108 | | | | –101 | | | | –73 | | | | –76 | | | | –67 | | | | –36 | | | | –184 | | | | –168 | | | | –108 | |
Cost of software licenses and support | | | –458 | | | | –418 | | | | –435 | | | | 0 | | | | 0 | | | | 1 | | | | –458 | | | | –418 | | | | –434 | |
Cost of cloud and software | | | –566 | | | | –519 | | | | –508 | | | | –76 | | | | –67 | | | | –34 | | | | –642 | | | | –586 | | | | –543 | |
Cost of services | | | –696 | | | | –665 | | | | –613 | | | | –44 | | | | –39 | | | | –21 | | | | –740 | | | | –705 | | | | –634 | |
Total cost of revenue | | | –1,262 | | | | –1,184 | | | | –1,121 | | | | –121 | | | | –106 | | | | –55 | | | | –1,383 | | | | –1,290 | | | | –1,177 | |
Segment gross profit | | | 3,305 | | | | 3,150 | | | | 2,969 | | | | 291 | | | | 252 | | | | 103 | | | | 3,596 | | | | 3,402 | | | | 3,073 | |
Total segment expenses | | | –1,339 | | | | –1,265 | | | | –1,254 | | | | –193 | | | | –171 | | | | –76 | | | | –1,532 | | | | –1,436 | | | | –1,330 | |
Segment profit | | | 1,966 | | | | 1,885 | | | | 1,715 | | | | 98 | | | | 80 | | | | 28 | | | | 2,064 | | | | 1,966 | | | | 1,743 | |
| | |
| 40 | | CONSOLIDATED INTERIM FINANCIAL STATEMENTS - IFRS |
| | | | | | | | | | | | | | | | | | | | | | | | | | | | | | | | | | | | |
€ millions | | Applications, Technology & Services | | | SAP Business Network | | | Total Reportable Segments | |
| | | 1/1-
9/30/2015 | | | 1/1-
9/30/2014 | | | 1/1-
9/30/2015 | | | 1/1-
9/30/2014 | | | 1/1-
9/30/2015 | | | 1/1-
9/30/2014 | |
| | | Actual
Currency | | | Constant
Currency | | | Actual
Currency | | | Actual
Currency | | | Constant
Currency | | | Actual
Currency | | | Actual
Currency | | | Constant
Currency | | | Actual
Currency | |
Cloud subscriptions and support | | | 681 | | | | 592 | | | | 415 | | | | 981 | | | | 831 | | | | 326 | | | | 1,662 | | | | 1,423 | | | | 741 | |
Software licenses | | | 2,690 | | | | 2,503 | | | | 2,516 | | | | 0 | | | | 0 | | | | 0 | | | | 2,689 | | | | 2,503 | | | | 2,516 | |
Software support | | | 7,468 | | | | 6,900 | | | | 6,470 | | | | 25 | | | | 20 | | | | 21 | | | | 7,493 | | | | 6,921 | | | | 6,491 | |
Software licenses and support | | | 10,158 | | | | 9,404 | | | | 8,985 | | | | 24 | | | | 20 | | | | 21 | | | | 10,182 | | | | 9,424 | | | | 9,006 | |
Cloud and software | | | 10,838 | | | | 9,996 | | | | 9,401 | | | | 1,006 | | | | 851 | | | | 346 | | | | 11,844 | | | | 10,847 | | | | 9,747 | |
Services | | | 2,405 | | | | 2,209 | | | | 2,252 | | | | 174 | | | | 147 | | | | 68 | | | | 2,579 | | | | 2,356 | | | | 2,320 | |
Total segment revenue | | | 13,243 | | | | 12,204 | | | | 11,652 | | | | 1,180 | | | | 998 | | | | 415 | | | | 14,423 | | | | 13,202 | | | | 12,067 | |
Cost of cloud subscriptions and support | | | –314 | | | | –290 | | | | –174 | | | | –231 | | | | –198 | | | | –85 | | | | –544 | | | | –488 | | | | –259 | |
Cost of software licenses and support | | | –1,416 | | | | –1,286 | | | | –1,313 | | | | –1 | | | | 0 | | | | –3 | | | | –1,416 | | | | –1,287 | | | | –1,316 | |
Cost of cloud and software | | | –1,729 | | | | –1,576 | | | | –1,487 | | | | –231 | | | | –199 | | | | –88 | | | | –1,961 | | | | –1,775 | | | | –1,575 | |
Cost of services | | | –2,143 | | | | –2,004 | | | | –1,833 | | | | –137 | | | | –119 | | | | –62 | | | | –2,281 | | | | –2,124 | | | | –1,894 | |
Total cost of revenue | | | –3,873 | | | | –3,581 | | | | –3,320 | | �� | | –369 | | | | –318 | | | | –149 | | | | –4,241 | | | | –3,898 | | | | –3,469 | |
Segment gross profit | | | 9,370 | | | | 8,624 | | | | 8,332 | | | | 811 | | | | 680 | | | | 265 | | | | 10,182 | | | | 9,304 | | | | 8,598 | |
Total segment expenses | | | –4,181 | | | | –3,873 | | | | –3,734 | | | | –584 | | | | –503 | | | | –210 | | | | –4,765 | | | | –4,376 | | | | –3,944 | |
Segment profit | | | 5,189 | | | | 4,750 | | | | 4,598 | | | | 228 | | | | 177 | | | | 55 | | | | 5,417 | | | | 4,927 | | | | 4,653 | |
Information about assets and liabilities and additions to non-current assets by segment are not regularly provided to our Executive Board.
Measurement and Presentation
Our management reporting system reports our intersegment services as cost reductions and does not track them as internal revenue. Intersegment services mainly represent utilization of human resources of one segment by another segment on a project-by-project basis. Intersegment services are charged based on internal cost rates including certain indirect overhead costs, excluding a profit margin.
Most of our depreciation and amortization expense affecting segment profits is allocated to the segments as part of broader infrastructure allocations and is thus not tracked separately on the operating segment level. Depreciation and amortization expense that is directly allocated to the operating segments is immaterial in all operating segments presented.
Our management reporting system produces a variety of reports that differ by the currency exchange rates used in the accounting for foreign-currency transactions and operations. Reports based on actual currencies use the same currency rates as are used in our financial statements. Reports based on constant currencies report revenues and expenses using the average exchange rates from the previous year’s corresponding period.
We use an operating profit indicator to measure the performance of our operating segments. However, the accounting policies applied in the measurement of operating segment revenue and profit differ as follows from the IFRS accounting principles used to determine the operating profit measure in our income statement:
| • | | The measurement of the segment revenue and results includes the recurring revenues that would have been recorded by acquired entities had they remained stand-alone entities but which are not recorded as revenue under IFRS due to fair value accounting for customer contracts in effect at the time of an acquisition. |
| • | | The measurement of the expenses exclude the following expenses: |
| | • | | Acquisition-related charges |
| | • | | Amortization expense and impairment charges for intangibles acquired in business combinations and certain stand-alone acquisitions of intellectual property (including purchased in-process research and development) |
| | • | | Settlements of pre-existing relationships in connection with a business combination |
| | • | | Acquisition-related third-party costs |
| | • | | Expenses from the TomorrowNow litigation and the Versata litigation |
| | • | | Share-based payment expenses |
| • | | Expenses of certain corporate-level activities are not allocated to our segments, including finance, accounting, legal, human resources, and marketing. They are disclosed in the reconciliation under other expenses. |
The segment information for prior periods has been restated to conform to the new two-segment structure.
| | |
| INTERIM REPORT JANUARY – SEPTEMBER 2015 | | 41 |
Reconciliation of Revenue and Results of Segments
| | | | | | | | | | | | | | | | | | | | | | | | |
€ millions | | Q3 2015 | | | Q3 2014 | | | 1/1-
9/30/2015 | | | 1/1-
9/30/2014 | |
| | | Actual
Currency | | | Constant
Currency | | | Actual
Currency | | | Actual
Currency | | | Constant
Currency | | | Actual
Currency | |
Total segment revenue for reportable segments | | | 4,979 | | | | 4,692 | | | | 4,249 | | | | 14,423 | | | | 13,202 | | | | 12,067 | |
Other revenue | | | 8 | | | | 8 | | | | 7 | | | | 39 | | | | 34 | | | | 43 | |
Adjustment for currency impact | | | 0 | | | | 287 | | | | 0 | | | | 0 | | | | 1,225 | | | | 0 | |
Adjustment of revenue under fair value accounting | | | –2 | | | | –2 | | | | –2 | | | | –11 | | | | –11 | | | | –7 | |
Total revenue | | | 4,985 | | | | 4,985 | | | | 4,254 | | | | 14,451 | | | | 14,451 | | | | 12,103 | |
| | | | | | |
Total segment profit for reportable segments | | | 2,064 | | | | 1,966 | | | | 1,743 | | | | 5,417 | | | | 4,927 | | | | 4,653 | |
Other revenue | | | 8 | | | | 8 | | | | 7 | | | | 39 | | | | 34 | | | | 43 | |
Other expenses | | | –456 | | | | –416 | | | | –394 | | | | –1,390 | | | | –1,259 | | | | –1,186 | |
Adjustment for currency impact | | | 0 | | | | 59 | | | | 0 | | | | 0 | | | | 363 | | | | 0 | |
Adjustment for | | | | | | | | | | | | | | | | | | | | | | | | |
Revenue under fair value accounting | | | –2 | | | | –2 | | | | –2 | | | | –11 | | | | –11 | | | | –7 | |
Acquisition-related charges | | | –183 | | | | –183 | | | | –141 | | | | –554 | | | | –554 | | | | –402 | |
Share-based payments expenses | | | –72 | | | | –72 | | | | 5 | | | | –386 | | | | –386 | | | | –119 | |
Restructuring | | | –145 | | | | –145 | | | | –43 | | | | –563 | | | | –563 | | | | –97 | |
TomorrowNow and Versata litigation | | | 0 | | | | 0 | | | | –17 | | | | 0 | | | | 0 | | | | –307 | |
Operating profit | | | 1,214 | | | | 1,214 | | | | 1,157 | | | | 2,552 | | | | 2,552 | | | | 2,578 | |
Other non-operating income/expense, net | | | –26 | | | | –26 | | | | 51 | | | | –228 | | | | –228 | | | | 44 | |
Financial income, net | | | 42 | | | | 42 | | | | –9 | | | | 20 | | | | 20 | | | | –1 | |
Profit before tax | | | 1,229 | | | | 1,229 | | | | 1,199 | | | | 2,344 | | | | 2,344 | | | | 2,621 | |
Geographic Information
The amounts for revenue by region in the following tables are based on the location of customers.
Revenue by Region
Cloud Subscriptions and Support Revenue by Region
| | | | | | | | | | | | | | | | |
€ millions | | Q3 2015 | | | 1/1-
9/30/2015 | | | Q3 2014 | | | 1/1-
9/30/2014 | |
EMEA | | | 119 | | | | 350 | | | | 71 | | | | 185 | |
Americas | | | 431 | | | | 1,163 | | | | 181 | | | | 488 | |
APJ | | | 48 | | | | 142 | | | | 26 | | | | 65 | |
SAP Group | | | 599 | | | | 1,654 | | | | 277 | | | | 738 | |
Cloud and Software Revenue by Region
| | | | | | | | | | | | | | | | |
€ millions | | Q3 2015 | | | 1/1-
9/30/2015 | | | Q3 2014 | | | 1/1-
9/30/2014 | |
EMEA | | | 1,817 | | | | 5,129 | | | | 1,614 | | | | 4,590 | |
Americas | | | 1,695 | | | | 4,888 | | | | 1,284 | | | | 3,656 | |
APJ | | | 610 | | | | 1,820 | | | | 563 | | | | 1,511 | |
SAP Group | | | 4,122 | | | | 11,837 | | | | 3,461 | | | | 9,757 | |
Total Revenue by Region
| | | | | | | | | | | | | | | | |
€ millions | | Q3 2015 | | | 1/1-
9/30/2015 | | | Q3 2014 | | | 1/1-
9/30/2014 | |
Germany | | | 685 | | | | 1,872 | | | | 639 | | | | 1,771 | |
Rest of EMEA | | | 1,503 | | | | 4,390 | | | | 1,342 | | | | 3,944 | |
EMEA | | | 2,188 | | | | 6,262 | | | | 1,981 | | | | 5,715 | |
United States | | | 1,681 | | | | 4,793 | | | | 1,193 | | | | 3,419 | |
Rest of Americas | | | 375 | | | | 1,187 | | | | 391 | | | | 1,131 | |
Americas | | | 2,056 | | | | 5,980 | | | | 1,585 | | | | 4,550 | |
Japan | | | 171 | | | | 477 | | | | 172 | | | | 436 | |
Rest of APJ | | | 569 | | | | 1,732 | | | | 516 | | | | 1,401 | |
APJ | | | 740 | | | | 2,209 | | | | 688 | | | | 1,838 | |
SAP Group | | | 4,985 | | | | 14,451 | | | | 4,254 | | | | 12,103 | |
| | |
| 42 | | CONSOLIDATED INTERIM FINANCIAL STATEMENTS - IFRS |
(17) Related Party Transactions
Certain Executive Board and Supervisory Board members of SAP SE currently hold (or have held within the last year) positions of significant responsibility with other entities (see our 2014 Integrated Report, Notes to the Consolidated Financial Statements section, Note (30)). We have relationships with certain of these entities in the ordinary course of business whereby we buy and sell a wide variety of services and products at prices believed to be consistent with those negotiated at arm’s length between unrelated parties.
During the reporting period, we had no related party transactions that had a material effect on our business, financial position, or results in the reporting period.
For more information about related party transactions, see our 2014 Integrated Report, Notes to the Consolidated Financial Statements section, Note (31).
(18) Events After the Reporting Period
In October we repaid an amount of €300 million in bank loans and a US$300 million U.S. private placement.
Release of the Interim Financial Statements
On behalf of the Executive Board of SAP SE, the Chief Financial officer of SAP SE approved these Consolidated Interim Financial Statements for the third quarter of 2015 on October 16, 2015, for submission to the Audit Committee of the Supervisory Board and for subsequent issuance.
| | |
| INTERIM REPORT JANUARY – SEPTEMBER 2015 | | 43 |
SUPPLEMENTARY FINANCIAL INFORMATION
(UNAUDITED)
RECONCILIATION FROM NON-IFRS NUMBERS TO IFRS NUMBERS
The following tables present a reconciliation from our non-IFRS numbers (including our non-IFRS at constant currency numbers) to the respective most comparable IFRS numbers. Note: Our non-IFRS numbers are not prepared under a comprehensive set of accounting rules or principles.
| | | | | | | | | | | | | | | | | | | | | | | | | | | | | | | | | | | | | | | | | | | | |
| | | For the three months ended September 30 | |
€ millions, unless otherwise stated | | 2015 | | | 2014 | | | Change in % | |
| | | IFRS | | | Adj.1) | | | Non-IFRS1) | | | Currency
Impact2) | | | Non-IFRS
Constant
Currency2) | | | IFRS | | | Adj.1) | | | Non-IFRS1) | | | IFRS | | | Non-IFRS1) | | | Non-IFRS
Constant
Currency2) | |
Revenue Numbers | | | | | | | | | | | | | | | | | | | | | | | | | | | | | | | | | | | | | | | | | | | | |
Cloud subscriptions and support | | | 599 | | | | 1 | | | | 600 | | | | –72 | | | | 528 | | | | 277 | | | | 1 | | | | 278 | | | | 116 | | | | 116 | | | | 90 | |
Software licenses | | | 1,014 | | | | 1 | | | | 1,015 | | | | –29 | | | | 986 | | | | 951 | | | | 0 | | | | 952 | | | | 7 | | | | 7 | | | | 4 | |
Software support | | | 2,509 | | | | 0 | | | | 2,509 | | | | –132 | | | | 2,377 | | | | 2,232 | | | | 1 | | | | 2,233 | | | | 12 | | | | 12 | | | | 6 | |
Software licenses and support | | | 3,523 | | | | 1 | | | | 3,524 | | | | –161 | | | | 3,363 | | | | 3,184 | | | | 1 | | | | 3,185 | | | | 11 | | | | 11 | | | | 6 | |
Cloud and software | | | 4,122 | | | | 2 | | | | 4,124 | | | | –233 | | | | 3,892 | | | | 3,461 | | | | 2 | | | | 3,463 | | | | 19 | | | | 19 | | | | 12 | |
Services | | | 863 | | | | 0 | | | | 863 | | | | –54 | | | | 808 | | | | 793 | | | | 0 | | | | 793 | | | | 9 | | | | 9 | | | | 2 | |
Total revenue | | | 4,985 | | | | 2 | | | | 4,987 | | | | –287 | | | | 4,700 | | | | 4,254 | | | | 2 | | | | 4,256 | | | | 17 | | | | 17 | | | | 10 | |
| | | | | | | | | | | |
Operating Expense Numbers | | | | | | | | | | | | | | | | | | | | | | | | | | | | | | | | | | | | | | | | | | | | |
Cost of cloud subscriptions and support | | | –249 | | | | 65 | | | | –184 | | | | | | | | | | | | –132 | | | | 22 | | | | –110 | | | | 89 | | | | 67 | | | | | |
Cost of software licenses and support | | | –528 | | | | 61 | | | | –468 | | | | | | | | | | | | –490 | | | | 59 | | | | –431 | | | | 8 | | | | 8 | | | | | |
Cost of cloud and software | | | –777 | | | | 126 | | | | –652 | | | | | | | | | | | | –622 | | | | 81 | | | | –541 | | | | 25 | | | | 20 | | | | | |
Cost of services | | | –767 | | | | 20 | | | | –747 | | | | | | | | | | | | –662 | | | | 16 | | | | –647 | | | | 16 | | | | 16 | | | | | |
Total cost of revenue | | | –1,544 | | | | 145 | | | | –1,399 | | | | | | | | | | | | –1,285 | | | | 97 | | | | –1,188 | | | | 20 | | | | 18 | | | | | |
Gross profit | | | 3,440 | | | | 148 | | | | 3,588 | | | | | | | | | | | | 2,970 | | | | 99 | | | | 3,068 | | | | 16 | | | | 17 | | | | | |
Research and development | | | –660 | | | | 25 | | | | –635 | | | | | | | | | | | | –545 | | | | 13 | | | | –532 | | | | 21 | | | | 19 | | | | | |
Sales and marketing | | | –1,182 | | | | 76 | | | | –1,105 | | | | | | | | | | | | –1,018 | | | | 24 | | | | –994 | | | | 16 | | | | 11 | | | | | |
General and administration | | | –239 | | | | 8 | | | | –230 | | | | | | | | | | | | –190 | | | | 3 | | | | –187 | | | | 26 | | | | 23 | | | | | |
Restructuring | | | –145 | | | | 145 | | | | 0 | | | | | | | | | | | | –43 | | | | 43 | | | | 0 | | | | >100 | | | | 0 | | | | | |
TomorrowNow and Versata litigation | | | 0 | | | | 0 | | | | 0 | | | | | | | | | | | | –17 | | | | 17 | | | | 0 | | | | <-100 | | | | 0 | | | | | |
Other operating income/expense, net | | | –3 | | | | 0 | | | | –3 | | | | | | | | | | | | 1 | | | | 0 | | | | 1 | | | | <-100 | | | | <-100 | | | | | |
Total operating expenses | | | –3,771 | | | | 400 | | | | –3,372 | | | | 228 | | | | –3,143 | | | | –3,097 | | | | 196 | | | | –2,901 | | | | 22 | | | | 16 | | | | 8 | |
| | | | | | | | | | | |
Profit Numbers | | | | | | | | | | | | | | | | | | | | | | | | | | | | | | | | | | | | | | | | | | | | |
Operating profit | | | 1,214 | | | | 402 | | | | 1,616 | | | | –59 | | | | 1,557 | | | | 1,157 | | | | 198 | | | | 1,355 | | | | 5 | | | | 19 | | | | 15 | |
Other non-operating income/expense, net | | | –26 | | | | 0 | | | | –26 | | | | | | | | | | | | 51 | | | | 0 | | | | 51 | | | | <-100 | | | | <-100 | | | | | |
Finance income | | | 102 | | | | 0 | | | | 102 | | | | | | | | | | | | 30 | | | | 0 | | | | 30 | | | | >100 | | | | >100 | | | | | |
Finance costs | | | –60 | | | | 0 | | | | –60 | | | | | | | | | | | | –39 | | | | 0 | | | | –39 | | | | 53 | | | | 53 | | | | | |
Financial income, net | | | 42 | | | | 0 | | | | 42 | | | | | | | | | | | | –9 | | | | 0 | | | | –9 | | | | <-100 | | | | <-100 | | | | | |
Profit before tax | | | 1,229 | | | | 402 | | | | 1,631 | | | | | | | | | | | | 1,199 | | | | 198 | | | | 1,397 | | | | 3 | | | | 17 | | | | | |
Income tax TomorrowNow and Versata litigation | | | 0 | | | | 0 | | | | 0 | | | | | | | | | | | | 9 | | | | –9 | | | | 0 | | | | <-100 | | | | 0 | | | | | |
Other income tax expense | | | –333 | | | | –124 | | | | –457 | | | | | | | | | | | | –327 | | | | –60 | | | | –387 | | | | 2 | | | | 18 | | | | | |
Income tax expense | | | –333 | | | | –124 | | | | –457 | | | | | | | | | | | | –318 | | | | –69 | | | | –387 | | | | 5 | | | | 18 | | | | | |
Profit after tax | | | 895 | | | | 278 | | | | 1,173 | | | | | | | | | | | | 881 | | | | 129 | | | | 1,010 | | | | 2 | | | | 16 | | | | | |
attributable to owners of parent | | | 898 | | | | 278 | | | | 1,176 | | | | | | | | | | | | 880 | | | | 129 | | | | 1,009 | | | | 2 | | | | 17 | | | | | |
attributable to non-controlling interests | | | –2 | | | | 0 | | | | –2 | | | | | | | | | | | | 1 | | | | 0 | | | | 1 | | | | <-100 | | | | <-100 | | | | | |
| | | | | | | | | | | |
Key Ratios | | | | | | | | | | | | | | | | | | | | | | | | | | | | | | | | | | | | | | | | | | | | |
Operating margin (in %) | | | 24.3 | | | | | | | | 32.4 | | | | | | | | 33.1 | | | | 27.2 | | | | | | | | 31.8 | | | | –2.9pp | | | | 0.6pp | | | | 1.3pp | |
Effective tax rate (in %) | | | 27.1 | | | | | | | | 28.0 | | | | | | | | | | | | 26.5 | | | | | | | | 27.7 | | | | 0.6pp | | | | 0.4pp | | | | | |
Earnings per share, basic (in €) | | | 0.75 | | | | | | | | 0.98 | | | | | | | | | | | | 0.74 | | | | | | | | 0.84 | | | | 2 | | | | 16 | | | | | |
| | |
| 44 | | Supplementary Financial Information |
| | | | | | | | | | | | | | | | | | | | | | | | | | | | | | | | | | | | | | | | | | | | |
| | | For the nine months ended September 30 | |
€ millions, unless otherwise stated | | 2015 | | | 2014 | | | Change in % | |
| | | IFRS | | | Adj.1) | | | Non-IFRS1) | | | Currency
Impact2) | | | Non-IFRS
Constant
Currency2) | | | IFRS | | | Adj.1) | | | Non-IFRS1) | | | IFRS | | | Non-IFRS1) | | | Non-IFRS
Constant
Currency2) | |
Revenue Numbers | | | | | | | | | | | | | | | | | | | | | | | | | | | | | | | | | | | | | | | | | | | | |
Cloud subscriptions and support | | | 1,654 | | | | 9 | | | | 1,664 | | | | –240 | | | | 1,424 | | | | 738 | | | | 3 | | | | 741 | | | | 124 | | | | 124 | | | | 92 | |
Software licenses | | | 2,689 | | | | 1 | | | | 2,690 | | | | –186 | | | | 2,504 | | | | 2,532 | | | | 0 | | | | 2,532 | | | | 6 | | | | 6 | | | | –1 | |
Software support | | | 7,494 | | | | 0 | | | | 7,494 | | | | –572 | | | | 6,922 | | | | 6,487 | | | | 3 | | | | 6,491 | | | | 16 | | | | 15 | | | | 7 | |
Software licenses and support | | | 10,183 | | | | 1 | | | | 10,184 | | | | –758 | | | | 9,426 | | | | 9,019 | | | | 4 | | | | 9,023 | | | | 13 | | | | 13 | | | | 4 | |
Cloud and software | | | 11,837 | | | | 11 | | | | 11,848 | | | | –998 | | | | 10,850 | | | | 9,757 | | | | 7 | | | | 9,764 | | | | 21 | | | | 21 | | | | 11 | |
Services | | | 2,614 | | | | 0 | | | | 2,614 | | | | –228 | | | | 2,386 | | | | 2,346 | | | | 0 | | | | 2,346 | | | | 11 | | | | 11 | | | | 2 | |
Total revenue | | | 14,451 | | | | 11 | | | | 14,462 | | | | –1,225 | | | | 13,237 | | | | 12,103 | | | | 7 | | | | 12,110 | | | | 19 | | | | 19 | | | | 9 | |
| | | | | | | | | | | |
Operating Expense Numbers | | | | | | | | | | | | | | | | | | | | | | | | | | | | | | | | | | | | | | | | | | | | |
Cost of cloud subscriptions and support | | | –708 | | | | 162 | | | | –546 | | | | | | | | | | | | –320 | | | | 58 | | | | –262 | | | | 121 | | | | 108 | | | | | |
Cost of software licenses and support | | | –1,632 | | | | 207 | | | | –1,425 | | | | | | | | | | | | –1,506 | | | | 185 | | | | –1,321 | | | | 8 | | | | 8 | | | | | |
Cost of cloud and software | | | –2,340 | | | | 369 | | | | –1,970 | | | | | | | | | | | | –1,826 | | | | 243 | | | | –1,583 | | | | 28 | | | | 24 | | | | | |
Cost of services | | | –2,423 | | | | 118 | | | | –2,305 | | | | | | | | | | | | –1,983 | | | | 76 | | | | –1,907 | | | | 22 | | | | 21 | | | | | |
Total cost of revenue | | | –4,763 | | | | 487 | | | | –4,276 | | | | | | | | | | | | –3,810 | | | | 319 | | | | –3,490 | | | | 25 | | | | 23 | | | | | |
Gross profit | | | 9,689 | | | | 498 | | | | 10,186 | | | | | | | | | | | | 8,293 | | | | 327 | | | | 8,620 | | | | 17 | | | | 18 | | | | | |
Research and development | | | –2,058 | | | | 133 | | | | –1,926 | | | | | | | | | | | | –1,661 | | | | 71 | | | | –1,590 | | | | 24 | | | | 21 | | | | | |
Sales and marketing | | | –3,749 | | | | 260 | | | | –3,489 | | | | | | | | | | | | –3,035 | | | | 101 | | | | –2,934 | | | | 24 | | | | 19 | | | | | |
General and administration | | | –766 | | | | 60 | | | | –706 | | | | | | | | | | | | –612 | | | | 30 | | | | –582 | | | | 25 | | | | 21 | | | | | |
Restructuring | | | –563 | | | | 563 | | | | 0 | | | | | | | | | | | | –97 | | | | 97 | | | | 0 | | | | >100 | | | | 0 | | | | | |
TomorrowNow and Versata litigation | | | 0 | | | | 0 | | | | 0 | | | | | | | | | | | | –307 | | | | 307 | | | | 0 | | | | <-100 | | | | 0 | | | | | |
Other operating income/expense, net | | | 0 | | | | 0 | | | | 0 | | | | | | | | | | | | –4 | | | | 0 | | | | –4 | | | | <-100 | | | | <-100 | | | | | |
Total operating expenses | | | –11,899 | | | | 1,504 | | | | –10,396 | | | | 862 | | | | –9,534 | | | | –9,525 | | | | 926 | | | | –8,600 | | | | 25 | | | | 21 | | | | 11 | |
| | | | | | | | | | | |
Profit Numbers | | | | | | | | | | | | | | | | | | | | | | | | | | | | | | | | | | | | | | | | | | | | |
Operating profit | | | 2,552 | | | | 1,514 | | | | 4,066 | | | | –363 | | | | 3,703 | | | | 2,578 | | | | 933 | | | | 3,510 | | | | –1 | | | | 16 | | | | 5 | |
Other non-operating income/expense, net | | | –228 | | | | 0 | | | | –228 | | | | | | | | | | | | 44 | | | | 0 | | | | 44 | | | | <-100 | | | | <-100 | | | | | |
Finance income | | | 189 | | | | 0 | | | | 189 | | | | | | | | | | | | 99 | | | | 0 | | | | 99 | | | | 91 | | | | 91 | | | | | |
Finance costs | | | –169 | | | | 0 | | | | –169 | | | | | | | | | | | | –100 | | | | 0 | | | | –100 | | | | 70 | | | | 70 | | | | | |
Financial income, net | | | 20 | | | | 0 | | | | 20 | | | | | | | | | | | | –1 | | | | 0 | | | | –1 | | | | <-100 | | | | <-100 | | | | | |
Profit before tax | | | 2,344 | | | | 1,514 | | | | 3,858 | | | | | | | | | | | | 2,621 | | | | 933 | | | | 3,554 | | | | –11 | | | | 9 | | | | | |
Income tax TomorrowNow and Versata litigation | | | 0 | | | | 0 | | | | 0 | | | | | | | | | | | | 86 | | | | –86 | | | | 0 | | | | <-100 | | | | 0 | | | | | |
Other income tax expense | | | –566 | | | | –461 | | | | –1,027 | | | | | | | | | | | | –736 | | | | –203 | | | | –939 | | | | –23 | | | | 9 | | | | | |
Income tax expense | | | –567 | | | | –461 | | | | –1,027 | | | | | | | | | | | | –650 | | | | –289 | | | | –939 | | | | –13 | | | | 9 | | | | | |
Profit after tax | | | 1,778 | | | | 1,053 | | | | 2,831 | | | | | | | | | | | | 1,971 | | | | 644 | | | | 2,615 | | | | –10 | | | | 8 | | | | | |
attributable to owners of parent | | | 1,783 | | | | 1,053 | | | | 2,836 | | | | | | | | | | | | 1,971 | | | | 644 | | | | 2,615 | | | | –10 | | | | 8 | | | | | |
attributable to non-controlling interests | | | –5 | | | | 0 | | | | –5 | | | | | | | | | | | | 0 | | | | 0 | | | | 0 | | | | >100 | | | | >100 | | | | | |
| | | | | | | | | | | |
Key Ratios | | | | | | | | | | | | | | | | | | | | | | | | | | | | | | | | | | | | | | | | | | | | |
Operating margin (in %) | | | 17.7 | | | | | | | | 28.1 | | | | | | | | 28.0 | | | | 21.3 | | | | | | | | 29.0 | | | | –3.6pp | | | | –0.9pp | | | | –1.0pp | |
Effective tax rate (in %) | | | 24.2 | | | | | | | | 26.6 | | | | | | | | | | | | 24.8 | | | | | | | | 26.4 | | | | –0.6pp | | | | 0.2pp | | | | | |
Earnings per share, basic (in €) | | | 1.49 | | | | | | | | 2.37 | | | | | | | | | | | | 1.65 | | | | | | | | 2.19 | | | | –10 | | | | 8 | | | | | |
| 1) | Adjustments in the revenue line items are for software support revenue, cloud subscriptions and support revenue, and other similarly recurring revenues that entities acquired by SAP would have recognized had they remained stand-alone entities but that SAP is not permitted to recognize as revenue under IFRS as a result of business combination accounting rules. Adjustments in the operating expense line items are for acquisition-related charges, share-based payment expenses, restructuring expenses, as well as the TomorrowNow and Versata litigation expenses. |
| 2) | Constant currency revenue and operating income figures are calculated by translating revenue and operating income of the current period using the average exchange rates from the previous year’s respective period instead of the current period. Constant currency period-over-period changes are calculated by comparing the current year’s non-IFRS constant currency numbers with the non-IFRS number of the previous year’s respective period. |
For a more detailed description of these adjustments and their limitations as well as our constant currency figures, see our Web site www.sap.com/corporate-en/investors/newsandreports/reporting-framework.epx under “Non-IFRS Measures and Estimates”.
Due to rounding, numbers may not add up precisely.
| | |
| INTERIM REPORT JANUARY – SEPTEMBER 2015 | | 45 |
EXPLANATION OF NON-IFRS ADJUSTMENTS
| | | | | | | | | | | | | | | | |
€ millions | | Q3
2015 | | | 1/1-
9/30/2015 | | | Q3
2014 | | | 1/1-
9/30/2014 | |
Operating profit (IFRS) | | | 1,214 | | | | 2,552 | | | | 1,157 | | | | 2,578 | |
Revenue adjustments | | | 2 | | | | 11 | | | | 2 | | | | 7 | |
Adjustment for acquisition-related charges | | | 183 | | | | 554 | | | | 141 | | | | 402 | |
Adjustment for share-based payment expenses | | | 72 | | | | 386 | | | | –5 | | | | 119 | |
Adjustment for restructuring | | | 145 | | | | 563 | | | | 43 | | | | 97 | |
Adjustment for TomorrowNow and Versata litigation | | | 0 | | | | 0 | | | | 17 | | | | 307 | |
Operating expense adjustments | | | 400 | | | | 1,504 | | | | 196 | | | | 926 | |
Operating profit adjustments | | | 402 | | | | 1,514 | | | | 198 | | | | 933 | |
Operating profit (non-IFRS) | | | 1,616 | | | | 4,066 | | | | 1,355 | | | | 3,510 | |
Due to rounding, numbers may not add up precisely.
| | |
| 46 | | Supplementary Financial Information |
REVENUE BY REGION
The following tables present our IFRS and non-IFRS revenue by region based on customer location. The tables also present a reconciliation from our non-IFRS revenue (including our non-IFRS revenue at constant currency) to the respective most comparable IFRS revenue.
Note: Our non-IFRS revenues are not prepared under a comprehensive set of accounting rules or principles.
| | | | | | | | | | | | | | | | | | | | | | | | | | | | | | | | | | | | | | | | | | | | |
| | | For the three months ended September 30 | |
€ millions | | 2015 | | | 2014 | | | Change in % | |
| | | IFRS | | | Adj.1) | | | Non-IFRS1) | | | Currency
Impact2) | | | Non-IFRS
Constant
Currency2) | | | IFRS | | | Adj.1) | | | Non-IFRS 1) | | | IFRS | | | Non-IFRS1) | | | Non-IFRS
Constant
Currency2) | |
Cloud subscriptions and support revenue by region | | | | | | | | | | | | | | | | | | | | | | | | | | | | | | | | | | | | | | | | | | | | |
EMEA | | | 119 | | | | 0 | | | | 119 | | | | –7 | | | | 112 | | | | 71 | | | | 0 | | | | 71 | | | | 68 | | | | 67 | | | | 57 | |
Americas | | | 431 | | | | 1 | | | | 432 | | | | –62 | | | | 370 | | | | 181 | | | | 1 | | | | 181 | | | | 139 | | | | 139 | | | | 104 | |
APJ | | | 48 | | | | 0 | | | | 49 | | | | –2 | | | | 46 | | | | 26 | | | | 0 | | | | 26 | | | | 88 | | | | 88 | | | | 78 | |
Cloud subscriptions and support revenue | | | 599 | | | | 1 | | | | 600 | | | | –72 | | | | 528 | | | | 277 | | | | 1 | | | | 278 | | | | 116 | | | | 116 | | | | 90 | |
| | | | | | | | | | | |
Cloud and software revenue by region | | | | | | | | | | | | | | | | | | | | | | | | | | | | | | | | | | | | | | | | | | | | |
EMEA | | | 1,817 | | | | 0 | | | | 1,817 | | | | –10 | | | | 1,807 | | | | 1,614 | | | | 1 | | | | 1,615 | | | | 13 | | | | 13 | | | | 12 | |
Americas | | | 1,695 | | | | 2 | | | | 1,697 | | | | –199 | | | | 1,498 | | | | 1,284 | | | | 1 | | | | 1,285 | | | | 32 | | | | 32 | | | | 17 | |
APJ | | | 610 | | | | 0 | | | | 610 | | | | –23 | | | | 587 | | | | 563 | | | | 0 | | | | 563 | | | | 8 | | | | 8 | | | | 4 | |
Cloud and software revenue | | | 4,122 | | | | 2 | | | | 4,124 | | | | –233 | | | | 3,892 | | | | 3,461 | | | | 2 | | | | 3,463 | | | | 19 | | | | 19 | | | | 12 | |
| | | | | | | | | | | |
Total revenue by region | | | | | | | | | | | | | | | | | | | | | | | | | | | | | | | | | | | | | | | | | | | | |
Germany | | | 685 | | | | 0 | | | | 685 | | | | 0 | | | | 685 | | | | 639 | | | | 0 | | | | 639 | | | | 7 | | | | 7 | | | | 7 | |
Rest of EMEA | | | 1,503 | | | | 0 | | | | 1,504 | | | | –16 | | | | 1,488 | | | | 1,342 | | | | 1 | | | | 1,342 | | | | 12 | | | | 12 | | | | 11 | |
Total EMEA | | | 2,188 | | | | 0 | | | | 2,189 | | | | –16 | | | | 2,172 | | | | 1,981 | | | | 1 | | | | 1,982 | | | | 10 | | | | 10 | | | | 10 | |
United States | | | 1,681 | | | | 2 | | | | 1,683 | | | | –261 | | | | 1,422 | | | | 1,193 | | | | 1 | | | | 1,195 | | | | 41 | | | | 41 | | | | 19 | |
Rest of Americas | | | 375 | | | | 0 | | | | 375 | | | | 18 | | | | 393 | | | | 391 | | | | 0 | | | | 391 | | | | –4 | | | | –4 | | | | 1 | |
Total Americas | | | 2,056 | | | | 2 | | | | 2,058 | | | | –243 | | | | 1,815 | | | | 1,585 | | | | 1 | | | | 1,586 | | | | 30 | | | | 30 | | | | 14 | |
Japan | | | 171 | | | | 0 | | | | 171 | | | | –3 | | | | 168 | | | | 172 | | | | 0 | | | | 172 | | | | –1 | | | | –1 | | | | –3 | |
Rest of APJ | | | 569 | | | | 0 | | | | 569 | | | | –25 | | | | 545 | | | | 516 | | | | 0 | | | | 516 | | | | 10 | | | | 10 | | | | 6 | |
Total APJ | | | 740 | | | | 0 | | | | 740 | | | | –27 | | | | 713 | | | | 688 | | | | 0 | | | | 688 | | | | 8 | | | | 8 | | | | 4 | |
Total revenue | | | 4,985 | | | | 2 | | | | 4,987 | | | | –287 | | | | 4,700 | | | | 4,254 | | | | 2 | | | | 4,256 | | | | 17 | | | | 17 | | | | 10 | |
| | |
| INTERIM REPORT JANUARY – SEPTEMBER 2015 | | 47 |
| | | | | | | | | | | | | | | | | | | | | | | | | | | | | | | | | | | | | | | | | | | | |
| | | For the nine months ended September 30 | |
€ millions | | 2015 | | | 2014 | | | Change in % | |
| | | IFRS | | | Adj.1) | | | Non-IFRS1) | | | Currency
Impact2) | | | Non-IFRS
Constant
Currency2) | | | IFRS | | | Adj.1) | | | Non-IFRS1) | | | IFRS | | | Non-IFRS1) | | | Non-IFRS
Constant
Currency2) | |
Cloud subscriptions and support revenue by region | | | | | | | | | | | | | | | | | | | | | | | | | | | | | | | | | | | | | | | | | | | | |
EMEA | | | 350 | | | | 1 | | | | 351 | | | | –30 | | | | 320 | | | | 185 | | | | 0 | | | | 185 | | | | 89 | | | | 90 | | | | 73 | |
Americas | | | 1,163 | | | | 8 | | | | 1,170 | | | | –195 | | | | 975 | | | | 488 | | | | 3 | | | | 491 | | | | 138 | | | | 138 | | | | 99 | |
APJ | | | 142 | | | | 0 | | | | 143 | | | | –14 | | | | 128 | | | | 65 | | | | 0 | | | | 65 | | | | 117 | | | | 118 | | | | 96 | |
Cloud subscriptions and support revenue | | | 1,654 | | | | 9 | | | | 1,664 | | | | –240 | | | | 1,424 | | | | 738 | | | | 3 | | | | 741 | | | | 124 | | | | 124 | | | | 92 | |
| | | | | | | | | | | |
Cloud and software revenue by region | | | | | | | | | | | | | | | | | | | | | | | | | | | | | | | | | | | | | | | | | | | | |
EMEA | | | 5,129 | | | | 1 | | | | 5,131 | | | | –98 | | | | 5,032 | | | | 4,590 | | | | 3 | | | | 4,593 | | | | 12 | | | | 12 | | | | 10 | |
Americas | | | 4,888 | | | | 9 | | | | 4,897 | | | | –747 | | | | 4,150 | | | | 3,656 | | | | 4 | | | | 3,661 | | | | 34 | | | | 34 | | | | 13 | |
APJ | | | 1,820 | | | | 0 | | | | 1,820 | | | | –152 | | | | 1,668 | | | | 1,511 | | | | 0 | | | | 1,511 | | | | 20 | | | | 20 | | | | 10 | |
Cloud and software revenue | | | 11,837 | | | | 11 | | | | 11,848 | | | | –998 | | | | 10,850 | | | | 9,757 | | | | 7 | | | | 9,764 | | | | 21 | | | | 21 | | | | 11 | |
| | | | | | | | | | | |
Total revenue by region | | | | | | | | | | | | | | | | | | | | | | | | | | | | | | | | | | | | | | | | | | | | |
Germany | | | 1,872 | | | | 0 | | | | 1,872 | | | | –2 | | | | 1,869 | | | | 1,771 | | | | 0 | | | | 1,772 | | | | 6 | | | | 6 | | | | 6 | |
Rest of EMEA | | | 4,390 | | | | 1 | | | | 4,392 | | | | –126 | | | | 4,266 | | | | 3,944 | | | | 2 | | | | 3,946 | | | | 11 | | | | 11 | | | | 8 | |
Total EMEA | | | 6,262 | | | | 1 | | | | 6,263 | | | | –128 | | | | 6,135 | | | | 5,715 | | | | 3 | | | | 5,718 | | | | 10 | | | | 10 | | | | 7 | |
United States | | | 4,793 | | | | 9 | | | | 4,802 | | | | –844 | | | | 3,958 | | | | 3,419 | | | | 4 | | | | 3,422 | | | | 40 | | | | 40 | | | | 16 | |
Rest of Americas | | | 1,187 | | | | 0 | | | | 1,187 | | | | –69 | | | | 1,118 | | | | 1,131 | | | | 0 | | | | 1,132 | | | | 5 | | | | 5 | | | | –1 | |
Total Americas | | | 5,980 | | | | 9 | | | | 5,989 | | | | –913 | | | | 5,076 | | | | 4,550 | | | | 4 | | | | 4,554 | | | | 31 | | | | 32 | | | | 11 | |
Japan | | | 477 | | | | 0 | | | | 477 | | | | –17 | | | | 460 | | | | 436 | | | | 0 | | | | 436 | | | | 9 | | | | 9 | | | | 5 | |
Rest of APJ | | | 1,732 | | | | 0 | | | | 1,732 | | | | –166 | | | | 1,565 | | | | 1,401 | | | | 0 | | | | 1,402 | | | | 24 | | | | 24 | | | | 12 | |
Total APJ | | | 2,209 | | | | 0 | | | | 2,209 | | | | –184 | | | | 2,026 | | | | 1,838 | | | | 0 | | | | 1,838 | | | | 20 | | | | 20 | | | | 10 | |
Total revenue | | | 14,451 | | | | 11 | | | | 14,462 | | | | –1,225 | | | | 13,237 | | | | 12,103 | | | | 7 | | | | 12,110 | | | | 19 | | | | 19 | | | | 9 | �� |
| 1) | Adjustments in the revenue line items are for software support revenue, cloud subscriptions and support revenue, and other similarly recurring revenues that entities acquired by SAP would have recognized had they remained stand-alone entities but that SAP is not permitted to recognize as revenue under IFRS as a result of business combination accounting rules. |
| 2) | Constant currency revenue figures are calculated by translating revenue of the current period using the average exchange rates from the previous year’s respective period instead of the current period. Constant currency period-over-period changes are calculated by comparing the current year’s non-IFRS constant currency numbers with the non-IFRS number of the previous year’s respective period. |
For a more detailed description of these adjustments and their limitations as well as our constant currency figures, see our Web site www.sap.com/corporate-en/investors/newsandreports/reporting-framework.epx under “Non-IFRS Measures and Estimates”.
| Due | to rounding, numbers may not add up precisely. |
| | |
| 48 | | Supplementary Financial Information |
MULTI-QUARTER SUMMARY (IFRS AND NON-IFRS)
| | | | | | | | | | | | | | | | | | | | | | | | | | | | | | | | |
€ millions, unless otherwise stated | | Q1
2014 | | | Q2
2014 | | | Q3
2014 | | | Q4
2014 | | | TY
2014 | | | Q1
2015 | | | Q2
2015 | | | Q3
2015 | |
Revenue Numbers | | | | | | | | | | | | | | | | | | | | | | | | | | | | | | | | |
Cloud subscriptions and support (IFRS) | | | 219 | | | | 241 | | | | 277 | | | | 349 | | | | 1,087 | | | | 503 | | | | 552 | | | | 599 | |
Cloud subscriptions and support (non-IFRS) | | | 221 | | | | 242 | | | | 278 | | | | 360 | | | | 1,101 | | | | 509 | | | | 555 | | | | 600 | |
Software licenses (IFRS) | | | 623 | | | | 957 | | | | 951 | | | | 1,867 | | | | 4,399 | | | | 696 | | | | 979 | | | | 1,014 | |
Software licenses (non-IFRS) | | | 623 | | | | 957 | | | | 952 | | | | 1,867 | | | | 4,399 | | | | 696 | | | | 979 | | | | 1,015 | |
Software support (IFRS) | | | 2,097 | | | | 2,158 | | | | 2,232 | | | | 2,342 | | | | 8,829 | | | | 2,454 | | | | 2,531 | | | | 2,509 | |
Software support (non-IFRS) | | | 2,098 | | | | 2,160 | | | | 2,233 | | | | 2,343 | | | | 8,834 | | | | 2,454 | | | | 2,531 | | | | 2,509 | |
Software licenses and support (IFRS) | | | 2,720 | | | | 3,116 | | | | 3,184 | | | | 4,209 | | | | 13,228 | | | | 3,150 | | | | 3,510 | | | | 3,523 | |
Software licenses and support (non-IFRS) | | | 2,722 | | | | 3,117 | | | | 3,185 | | | | 4,210 | | | | 13,233 | | | | 3,150 | | | | 3,510 | | | | 3,524 | |
Cloud and software (IFRS) | | | 2,939 | | | | 3,357 | | | | 3,461 | | | | 4,558 | | | | 14,315 | | | | 3,653 | | | | 4,062 | | | | 4,122 | |
Cloud and software (non-IFRS) | | | 2,942 | | | | 3,359 | | | | 3,463 | | | | 4,570 | | | | 14,334 | | | | 3,659 | | | | 4,065 | | | | 4,124 | |
Services (IFRS = non-IFRS) | | | 759 | | | | 794 | | | | 793 | | | | 899 | | | | 3,245 | | | | 844 | | | | 908 | | | | 863 | |
Total revenue (IFRS) | | | 3,698 | | | | 4,151 | | | | 4,254 | | | | 5,458 | | | | 17,560 | | | | 4,497 | | | | 4,970 | | | | 4,985 | |
Total revenue (non-IFRS) | | | 3,701 | | | | 4,153 | | | | 4,256 | | | | 5,469 | | | | 17,580 | | | | 4,502 | | | | 4,972 | | | | 4,987 | |
Operating profit (IFRS) | | | 723 | | | | 698 | | | | 1,157 | | | | 1,753 | | | | 4,331 | | | | 638 | | | | 701 | | | | 1,214 | |
Operating profit (non-IFRS) | | | 919 | | | | 1,236 | | | | 1,355 | | | | 2,127 | | | | 5,638 | | | | 1,056 | | | | 1,394 | | | | 1,616 | |
Operating margin (IFRS, in %) | | | 19.5 | | | | 16.8 | | | | 27.2 | | | | 32.1 | | | | 24.7 | | | | 14.2 | | | | 14.1 | | | | 24.3 | |
Operating margin (non-IFRS, in %) | | | 24.8 | | | | 29.8 | | | | 31.8 | | | | 38.9 | | | | 32.1 | | | | 23.5 | | | | 28.0 | | | | 32.4 | |
Effective tax rate (IFRS, in %) | | | 24.1 | | | | 22.6 | | | | 26.5 | | | | 24.5 | | | | 24.7 | | | | 13.6 | | | | 26.4 | | | | 27.1 | |
Effective tax rate (non-IFRS, in %) | | | 25.9 | | | | 25.4 | | | | 27.7 | | | | 25.5 | | | | 26.1 | | | | 22.3 | | | | 27.8 | | | | 28.0 | |
Earnings per share, basic (IFRS, in €) | | | 0.45 | | | | 0.47 | | | | 0.74 | | | | 1.10 | | | | 2.75 | | | | 0.35 | | | | 0.39 | | | | 0.75 | |
Earnings per share, basic (non-IFRS, in €) | | | 0.56 | | | | 0.79 | | | | 0.84 | | | | 1.31 | | | | 3.50 | | | | 0.58 | | | | 0.80 | | | | 0.98 | |
Net cash flows from operating activities | | | 2,352 | | | | 223 | | | | 507 | | | | 416 | | | | 3,499 | | | | 2,366 | | | | 410 | | | | 466 | |
Purchase of intangible assets and property, plant, and equipment (without acquisitions) | | | –130 | | | | –174 | | | | –168 | | | | –265 | | | | –737 | | | | –139 | | | | –137 | | | | –148 | |
Free cash flow | | | 2,222 | | | | 49 | | | | 339 | | | | 151 | | | | 2,762 | | | | 2,227 | | | | 273 | | | | 317 | |
| | | | | | | | |
Deferred cloud subscriptions and support revenue (IFRS, quarter end) | | | 451 | | | | 445 | | | | 498 | | | | 689 | | | | 689 | | | | 794 | | | | 789 | | | | 782 | |
| | | | | | | | |
Days’ sales outstanding (DSO, in days)1) | | | 63 | | | | 64 | | | | 65 | | | | 65 | | | | 65 | | | | 67 | | | | 68 | | | | 69 | |
Headcount (quarter end)2) | | | 66,750 | | | | 67,651 | | | | 68,835 | | | | 74,406 | | | | 74,406 | | | | 74,551 | | | | 74,497 | | | | 75,643 | |
Employee retention (in %, rolling 12 months) | | | 93.4 | | | | 93.5 | | | | 93.3 | | | | 93.5 | | | | 93.5 | | | | 93.3 | | | | 92.6 | | | | 91.9 | |
Women in management (in %, quarter end) | | | 20.9 | | | | 21.1 | | | | 21.3 | | | | 22.4 | | | | 22.4 | | | | 22.3 | | | | 22.9 | | | | 23.2 | |
Greenhouse gas emissions (in kilotons) | | | 120 | | | | 140 | | | | 125 | | | | 115 | | | | 500 | | | | 145 | | | | 125 | | | | 110 | |
| 1) | Days’ sales outstanding measures the length of time it takes to collect receivables. SAP calculates DSO by dividing the average invoiced accounts receivables balance of the last 12 months by the average monthly sales of the last 12 months. |
| 2) | In full-time equivalents |
Due to rounding, numbers may not add up precisely.
| | |
| INTERIM REPORT JANUARY – SEPTEMBER 2015 | | 49 |
ADDITIONAL INFORMATION
Financial Calendar
January 22, 2016
Fourth-quarter and full-year 2015 preliminary earnings release, telephone conference
May 12, 2016
Annual General Meeting of Shareholders,
Mannheim, Germany
Investor Services
Additional information about this interim report is available online at www.sap.com/investors, including the official press release, a presentation about the quarterly results, and a recording of the conference call for financial analysts.
The “Financial Reports” tab under “Financial News and Reports” contains the following publications:
| • | | The 2014 Integrated Report (IFRS, www.sapintegratedreport.com) |
| • | | The 2014 Annual Report (IFRS, PDF) |
| • | | The 2014 Annual Report 20-F (IFRS, PDF) |
| • | | The 2014 SAP SE Statutory Financial Statements and Review of Operations (HGB, German only, PDF) |
| • | | Interim reports (IFRS, PDF) |
| • | | XBRL versions of the Annual and Interim Reports |
You can also read SAP’s annual and interim reports on an iPad. The free and interactive app Publications is now available in the App Store.
www.sap.com/corporate-en/investors is also the place to look for in-depth information about stock, debt, and corporate governance; financial and event news; and various services designed to help investors find the information they need fast (see “Investor Services”). These include our free SAP INVESTOR magazine (www.sap-investor.com), an e-mail and text message news service, and a Twitter feed.
Print versions of the reports listed above can be ordered by phone, e-mail, or online. The SAP Integrated Report is only available online.
You can reach us by phone at +49 6227 7-67336, send a fax to +49 6227 7-40805, or e-mail us at investor@sap.com.
Addresses
SAP SE
Dietmar-Hopp-Allee 16
69190 Walldorf
Germany
Tel. +49 6227 7-47474
Fax +49 6227 7-57575
Internet www.sap.com
E-mail info@sap.com
The addresses of all our international subsidiaries and sales partners are available on our public Web site at www.sap.com/directory/main.html.
Information About Content:
Investor Relations:
Tel. +49 6227 7-67336
Fax +49 6227 7-40805
E-mail investor@sap.com
Twitter @SAPinvestor
Internet www.sap.com/investor
Imprint
Overall Responsibility:
SAP SE
Corporate Financial Reporting
Published on October 20, 2015
Copyright Usage in Collateral
© 2015 SAP SE or an SAP affiliate company. All rights reserved.
No part of this publication may be reproduced or transmitted in any form or for any purpose without the express permission of SAP SE or an SAP affiliate company.
SAP and other SAP products and services mentioned herein as well as their respective logos are trademarks or registered trademarks of SAP SE (or an SAP affiliate company) in Germany and other countries. Please see www.sap.com/corporate-en/legal/ copyright for additional trademark information and notices.
| | |
| 50 | | ADDITIONAL INFORMATION |
| | | | |
| GROUP HEADQUARTERS | | | | |
SAP SE Dietmar-Hopp-Allee 16 69190 Walldorf Germany www.sap.com | | www.sap.com/investor | | 
|
| | |
| | |
| | |