Exhibit 99.1
2015 ANNUAL REPORT
Reimagine Your Business
| | |
 | | The Best-Run Businesses Run SAP® |
Key Facts
PERFORMANCE SUMMARY
| | | | | | | | | | | | |
€ millions, unless otherwise stated | | 2015 | | | 2014 | | | D in % | |
| Revenues | | | | | | | | | | | | |
Cloud subscriptions and support (IFRS) | | | 2,286 | | | | 1,087 | | | | 110 | |
Cloud subscriptions and support (non-IFRS) | | | 2,296 | | | | 1,101 | | | | 109 | |
Software licenses and support (IFRS) | | | 14,928 | | | | 13,228 | | | | 13 | |
Software licenses and support (non-IFRS) | | | 14,930 | | | | 13,233 | | | | 13 | |
Cloud and software (IFRS) | | | 17,214 | | | | 14,315 | | | | 20 | |
Cloud and software (non-IFRS) | | | 17,226 | | | | 14,334 | | | | 20 | |
Services (IFRS = non-IFRS) | | | 3,579 | | | | 3,245 | | | | 10 | |
Total revenue (IFRS) | | | 20,793 | | | | 17,560 | | | | 18 | |
Total revenue (non-IFRS) | | | 20,805 | | | | 17,580 | | | | 18 | |
Applications, Technology & Services Segment revenue | | | 19,126 | | | | 16,871 | | | | 13 | |
SAP Business Network Segment revenue | | | 1,614 | | | | 644 | | | | 150 | |
| | | |
| Operating expenses | | | | | | | | | | | | |
Cost of cloud subscriptions and support (IFRS) | | | 1,022 | | | | 481 | | | | 112 | |
Cost of cloud subscriptions and support (non-IFRS) | | | 789 | | | | 393 | | | | 101 | |
Cost of software licenses and support (IFRS) | | | 2,291 | | | | 2,076 | | | | 10 | |
Cost of software licenses and support (non-IFRS) | | | 2,008 | | | | 1,818 | | | | 10 | |
Cost of cloud and software (IFRS) | | | 3,313 | | | | 2,557 | | | | 30 | |
Cost of cloud and software (non-IFRS) | | | 2,797 | | | | 2,211 | | | | 27 | |
Cost of services (IFRS) | | | 3,313 | | | | 2,716 | | | | 22 | |
Cost of services (non-IFRS) | | | 3,133 | | | | 2,590 | | | | 21 | |
Total cost of revenue (IFRS) | | | 6,626 | | | | 5,272 | | | | 26 | |
Total cost of revenue (non-IFRS) | | | 5,930 | | | | 4,801 | | | | 24 | |
Research and development (IFRS) | | | 2,845 | | | | 2,331 | | | | 22 | |
| | | |
| Profits and Margins | | | | | | | | | | | | |
Cloud subscriptions and support margin (as a percentage of corresponding revenue, IFRS) | | | 55.3 | | | | 55.8 | | | | -1 | |
Cloud subscriptions and support margin (as a percentage of corresponding revenue, non-IFRS) | | | 65.6 | | | | 64.3 | | | | 2 | |
Cloud and software margin (as a percentage of corresponding revenue, IFRS) | | | 80.8 | | | | 82.1 | | | | -2 | |
Cloud and software margin (as a percentage of corresponding revenue, non-IFRS) | | | 83.8 | | | | 84.6 | | | | -1 | |
Services margin (as a percentage of corresponding revenue, IFRS) | | | 7.4 | | | | 16.3 | | | | -54 | |
Services margin (as a percentage of corresponding revenue, non-IFRS) | | | 12.5 | | | | 20.2 | | | | -38 | |
Total gross margin (as a percentage of total revenue, IFRS) | | | 68.1 | | | | 70.0 | | | | -3 | |
| | | | | | | | | | | | |
€ millions, unless otherwise stated | | 2015 | | | 2014 | | | D in % | |
Total gross margin (as a percentage of total revenue, non-IFRS) | | | 71.5 | | | | 72.7 | | | | -2 | |
Applications, Technology & Services Segment gross margin (as a percentage of corresponding revenue, IFRS) | | | 72 | | | | 73 | | | | -1 | |
SAP Business Network Segment gross margin (as a percentage of corresponding revenue, IFRS) | | | 67 | | | | 66 | | | | 1 | |
Operating profit (IFRS) | | | 4,252 | | | | 4,331 | | | | -2 | |
Operating profit (non-IFRS) | | | 6,348 | | | | 5,638 | | | | 13 | |
Operating margin (as a percentage of total revenue, IFRS) | | | 20.5 | | | | 24.7 | | | | -17 | |
Operating margin (as a percentage of total revenue, non-IFRS) | | | 30.5 | | | | 32.1 | | | | -5 | |
Free cash flow | | | 3,001 | | | | 2,762 | | | | 9 | |
Net liquidity | | | -5,615 | | | | -7,670 | | | | -27 | |
Days’ sales outstanding (DSO, in days) | | | 71 | | | | 65 | | | | 9 | |
Equity ratio (total equity as a percentage of total assets) | | | 56 | | | | 51 | | | | 11 | |
| | | |
| Key SAP Stock Facts | | | | | | | | | | | | |
Issued shares1)(in millions) | | | 1,229 | | | | 1,229 | | | | 0 | |
Earnings per share, basic (in €) | | | 2.56 | | | | 2.75 | | | | -7 | |
Dividend per share2)(in €) | | | 1.15 | | | | 1.10 | | | | 5 | |
SAP share price1)(in €) | | | 73.38 | | | | 58.26 | | | | 26 | |
Market capitalization1)(in € billions) | | | 90.18 | | | | 71.60 | | | | 26 | |
| | | |
| Employees and personnel expenses | | | | | | | | | | | | |
Number of employees1),3) | | | 76,986 | | | | 74,406 | | | | 3 | |
Personnel expenses per employee – excluding share-based payments (in € thousands) | | | 126 | | | | 111 | | | | 13 | |
Women working at SAP (as a percentage) | | | 31 | | | | 31 | | | | 0 | |
Women in management1)(total, as a percentage of total number of employees) | | | 23.6 | | | | 21.3 | | | | 11 | |
Employee Engagement Index (as a percentage) | | | 81 | | | | 79 | | | | 3 | |
Business Health Culture Index4)(as a percentage) | | | 75 | | | | 72 | | | | 4 | |
Employee retention (as a percentage) | | | 91.8 | | | | 93.5 | | | | -2 | |
| | | |
| Customer | | | | | | | | | | | | |
Customer Net Promoter Score5)(as a percentage) | | | 22.4 | | | | 19.1 | | | | 17 | |
| | | |
| Environment | | | | | | | | | | | | |
Net Greenhouse gas emissions (in kilotons) | | | 455 | | | | 500 | | | | -9 | |
Greenhouse gas emissions per employee3)(in tons) | | | 6.0 | | | | 7.3 | | | | -18 | |
Total energy consumption (in GWh) | | | 965 | | | | 920 | | | | 5 | |
Energy consumed per employee3)(in kWh) | | | 12,500 | | | | 13,400 | | | | -7 | |
Data center energy consumed (in GWh) | | | 249 | | | | 179 | | | | 39 | |
Renewable energy sourced (as a percentage) | | | 100 | | | | 100 | | | | 0 | |
| 1) | Numbers based on year-end. |
| 2) | 2015 numbers are based on the proposed dividend for 2015 and on 2015 closing level of treasury stock. |
| 3) | Full-time equivalents. |
| 4) | The BHCI score for 2014 was recalculated from 70% to 72% based on two updated questions in the people survey concerning work-life balance. |
| 5) | The 2015 Customer NPS is not fully comparable to the prior year’s score. |
Contents
2
Letter from the CEO
Dear Stakeholders,
I’m honored to present the SAP Integrated Report 2015.
Six years ago, we charted a bold new course for SAP. We set a vision to help the world run better and improve people’s lives. We designed a strategy to transform SAP into THE cloud company powered by SAP HANA. We redoubled our focus on helping businesses grow and prosper in 25 distinctly different industries.
2010 was the year we started on this journey. 2015 was the year we proved it is the right one for the stakeholders of SAP – a course that is worthy of the rich traditions of market leadership that date back to our five original innovators and their audacious dream for a better way.
The history of SAP was especially meaningful last year as we mourned the loss of Klaus Tschira. More than four decades ago, Hasso Plattner, Dietmar Hopp, Claus Wellenreuther, Hans-Werner Hector and Klaus founded SAP by innovating a new way for businesses to run better. In honoring Klaus’s memory, we are reminded that we stand on the shoulders of giants. As part of the SAP family, we have a solemn obligation to constantly push the boundaries of what’s possible; to be curious and courageous; and to never tire of rising beyond the highest expectations for what our company can achieve. Those five partners set a course 44 years ago; we continue to follow it to this day.
THE BACKDROP: A FAST-CHANGING DIGITAL ECONOMY
In the spirit of design thinking and innovation, the mission of SAP is always driven by the state of the world.
| | |
| To Our StakeholdersLetter from the CEO | | 4 |
The theme of the 2016 World Economic Forum in Davos, Switzerland, said it all: we live and work in the midst of the “Fourth Industrial Revolution.” The world is changing faster today than ever. By 2020, 21 billion devices will be connected in the Internet of Things (IoT). Thriving economies like China are investing in digital technologies to deliver efficiency and accelerate growth. Industry lines are blurring as legacy businesses invent new business models to strengthen their long-term prospects.
In each and every example, yesterday’s technologies are not keeping pace with tomorrow’s opportunities.
SAP customers no longer compete in a business-to-business economy. It’s now a consumer-to-business economy that is generating unprecedented quantities of structured and unstructured information. In this era, individual consumers expect businesses to deliver relevant, personalized experiences to them – wherever they are, whenever they want. Businesses that rise to this expectation will win. Those that can’t, or choose not to, will lose.
As we have done many times in our history, SAP delivered a fundamentally new architecture engineered for a new economy. With SAP HANA, SAP is able to break with a 45+ old tradition: enterprise systems based on three data pillars – master data, transactional data and aggregations of transactional data – were the foundation for all these years. The real time management of aggregated data was the cornerstone of the system, enabling users to have instant insights along predefined hierarchies. Any change of these aggregations required programming and painful data restructuring. This new architecture is based on the assumption that all reports, statutory or analytical, key figures, prediction, simulation and optimization are a mapping between millions to billions of data and presentations of a few hundred characters.
This makes it possible to achieve transformative technology and business outcomes:
| ¡ | | Data entry transaction can run in parallel without database locking |
| ¡ | | Much higher transactional performance and much lower data footprint |
| ¡ | | Monitoring of social media data and IoT data in combination with marketing initiatives |
| ¡ | | Analysis of point of sales data for signals and trends in real time |
| ¡ | | Predictive analytics for forecasting new planning applications with more intelligence and speed |
| ¡ | | New applications for simulation and optimization |
| ¡ | | Real-time monitoring of company’s performance in a Digital Boardroom |
| ¡ | | A new multi-channel approach to customer engagement and commerce |
We have paved the way to bring simplicity into every aspect of enterprise computing – from the legacy IT stack to new, context-aware applications. As a trusted innovator, we have moved beyond the limitations of the past into a period of limitless possibilities for the digital, inter-connected future of the world.
HOW WE ARE LEADING: COMPLETENESS OF VISION
From the database to core applications, to the cloud and to business networks, SAP’s offerings are truly end-to-end.
The database
We engineered our entire software portfolio for the SAP HANA platform, the only true in-memory column store database in the marketplace. In just a few short years, nearly 10,000 customers and startup companies chose to innovate on SAP HANA, momentum that continued to accelerate in 2015 with the release of SAP HANA Vora. The in-memory revolution is real and SAP is several years ahead of our competition.
The core applications
With this massive new processing power, we turned our attention to SAP’s flagship suite of core business applications for finance and logistics. In February 2015, we made history by unveiling SAP S/4HANA, our next-generation suite engineered specifically to realize unprecedented functionality increases made possible by SAP HANA. SAP S/4HANA is delivering 25x higher transactional performance, nearly 13x reductions in data footprint and dramatically simplified application code, to name only a few. In less than one year, more than 2,700 customers adopted SAP S/4HANA, beginning a once-in-decades innovation cycle and proving that enterprise resource planning (ERP) has shifted from a system of record to a system of innovation. It took SAP R/3 two years to take off; SAP S/4HANA is already off to a much faster start.
The cloud
Whether for human capital management, customer engagement or to run an entire enterprise, SAP is excelling in the cloud. Because many companies want faster innovation cycles and time to value, we focused on choice of consumption as a major priority for SAP. Today, customers can run SAP software in a multitenant public cloud, their own private cloud, or with the SAP HANA Enterprise Cloud service. Our SAP SuccessFactors solutions, for example, combined with SAP Fieldglass solutions, are best-in-class applications to manage a total workforce, including temporary workers. Anchored by SAP Hybris solutions, our customer engagement and commerce solutions go way beyond the administrative functions of traditional customer relationship management (CRM). Altogether, SAP now reaches more than 95 million cloud users, more than any other company in enterprise software.
| | |
| To Our StakeholdersLetter from the CEO | | 5 |
Another critical piece of our cloud story is our Platform-as-a-Service, the SAP HANA Cloud Platform (HCP). HCP is a standards based, open platform that allows customers to easily extend and integrate any and all SAP applications (cloud and on-premise) including SAP S/4HANA, SAP SuccessFactors and business networks. Thousands of our customers are using HCP to maximize their investment in SAP applications and simultaneously empower their developers with the power of in-memory computing to build and deploy next-generation digital applications.
The business networks
Finally, we recognized that businesses would need to think about partnerships in an entirely new way. Whether procuring materials or hiring new workers, digital connections would need to be made more seamless than ever before. For a longstanding challenge like business travel and expense management, we needed a network approach that allows multiple businesses to collaborate for the ultimate benefit of the end user. With SAP Ariba, SAP Fieldglass, and Concur solutions, our business network companies are best-in-class and focused on extending the walls of a digital enterprise. These companies are magnets for other businesses in their respective categories – building new ecosystems to develop applications and create new value streams.
CEOs of large businesses and small businesses alike have made it clear: narrowly focused IT solutions have made things more complicated. They need full alignment between the supply chain and the demand chain. They need to run businesses based on live data and have the agility to make fast decisions. They need an intuitive user experience that empowers every employee and unleashes their unique abilities.
SAP is committed to delivering on these expectations.
SAP IS A PROFITABLE GROWTH COMPANY
The proof of our successful strategy lies in our 2015 achievements.
Non-IFRS total revenue for SAP was €20.8 billion, a 12% CAGR since we started in 2010. Even during the transformation of our company, our full-year non-IFRS operating profit was €6.35 billion, a 10% CAGR since 2010. Very few companies can claim this rate of growth on both the top and the bottom line. In addition, as SAP’s percentage of more predictable revenues increase, we are aggressively managing this transformation to protect our margin profile and ensure continued shareholder value.
In virtually every financial metric, 2015 was a record year. We grew our full-year non-IFRS cloud subscription and support revenue by 109%. Our full-year non-IFRS cloud and software revenue increased by 20%. Our fourth quarter was SAP’s best quarter ever, with all regions performing at record levels, despite continued uncertainty in many geographic markets.
Our core business has been accelerated by the fast adoption of SAP S/4HANA and the transformative business outcomes it is already enabling. Our cloud applications – led by the momentum of the SAP SuccessFactors Employee Central – are soaring. Our business network companies are shaping the future of commerce and growing in triple digits.
Through our direct-to-consumer business unit, SAP Digital, more than 50,000 transactions in 32 countries were processed in 2015 alone. We see this volume only accelerating as SAP develops even more offerings that can be bought and used with little or no human interaction, such as SAP Lumira and SAP Anywhere.
According to our employee survey, we finished the year with a 10-year high in employee engagement (81%), along with increases in leadership trust and work-life balance, including employee health. We also remained committed to our high standards for reducing carbon emissions and introduced new programs to support employees battling cancer. We continued our focus on building great careers for the people of SAP, whether they come to us direct from university or as experienced professionals. Our University Alliance program has momentum everywhere in the world, building on the 2,400+ university partnerships we already have and opening new doors in places like China, Russia and the Middle East. Our Autism at Work program continued as a role model for the world, proving that there is no limit to what any person can achieve when they are given the opportunity to share their unique talents.
On the world stage we acted with purpose as a true global market leader. We engaged with policy makers to forge a compromise on data sharing standards and joined the United Nations in setting clear benchmarks for a more sustainable planet. With the We Are Family Foundation, we gave brilliant young innovators the chance to be heard at TedxTeen. Through the unprecedented #One4 project, we stood with the refugees who escaped warzones in search of a more peaceful and promising future.
For SAP, doing well has always been about enabling us to do good. We’ve never been more committed to doing both.
THE ROAD AHEAD
The only constant in technology is change. With breakthroughs such as SAP HANA and SAP S/4HANA only just scratching the surface of their full potential, SAP is strongly positioned to shape the future.
Businesses are hungry for growth and looking to the Internet of Things, robotics, artificial intelligence, and context-rich applications. Smart cities and connected manufacturing are making it possible to deliver mass personalization at scale for end consumers. Industries like healthcare are about to experience wide-scale disruption as technology finally converges around a common vision for personalized medicine. Healthcare, in particular, is a vivid illustration of SAP’s long-term growth potential. The American Society of Clinical Oncology
| | |
| To Our StakeholdersLetter from the CEO | | 6 |
(ASCO) and the National Center for Tumor Diseases (NCT) in Germany are already transforming the treatment and effort to cure cancer with SAP HANA. The raw computing power of SAP HANA means that doctors can rely on genome sequencing at a fraction of the time and cost. It also means that data from diagnostic procedures and clinical trials can be aggregated and searched for powerful insights about how to treat specific tumors.
SAP is charging into this future with optimism. We’ll continue leading the reinvention of business technology as we look to help solve the world’s greatest challenges because we see them as our greatest opportunities.
IN SUMMARY
Over the past six years, whether you measure us on the basis of our customer satisfaction, extraordinary top line growth, dramatic expansion of operating profit, the successful management of our business model transformation, or our consistent commitment to corporate citizenship, SAP has never been in a stronger position. Our 77,000 colleagues are firmly united in purpose to serve the more than 300,000 customers who have placed their trust in SAP. Together with our open partner ecosystem, we are reshaping every sector of the modern economy in nearly every country.
This integrated report seeks to expand on this story in vivid detail. It also reflects our commitment to unprecedented transparency. We believe that our stakeholders deserve to understand the market conditions, strategy and software that will power SAP to deliver on our short, mid, and long-term expectations. We also believe that the full measure of a great business is not just in its financial results, but also in its social responsibility. That’s why we include metrics like environmental impact and diversity alongside revenue and operating income – to give you the full picture of an ambitious, successful, and sustainable company.
SAP’s vision is to help the world run better and improve people’s lives. We’re passionate in service to this enduring purpose. We also know that vision isn’t just what we see – it’s what we feel and how we make other people feel. Whether you rely on SAP as a customer, invest in us as a shareholder, work for us as an employee, or partner with us in the ecosystem, we work every day to make you feel proud of our success and confident in our future. We will never lose our sense of urgency. We’ll always be driven to rise even higher and to earn the privilege of following in the footsteps of our founders. Indeed, we aspire to leave footprints of our own for others to follow.
Thank you for your interest in and support of SAP.
Bill McDermott
Chief Executive Officer
| | |
| To Our StakeholdersLetter from the CEO | | 7 |
Global Managing Board
Bill McDermott
CEO and Member of the Executive Board
Luka Mucic
Member of the Executive Board
Chief Financial Officer and Chief Operating Officer
Robert Enslin
Member of the Executive Board
President, Global Customer Operations
Bernd Leukert
Member of the Executive Board Products & Innovation
| | |
| To Our StakeholdersGlobal Managing Board | | 8 |
Gerhard Oswald
Member of the Executive Board
Product Quality & Enablement
Steve Singh
Member of the Global Managing Board, CEO of Concur
Technologies, and Head of Business Network Group
Quentin Clark
Member of the Global Managing Board
Chief Business Officer
Ingrid-Helen Arnold
Member of the Global Managing Board
Chief Information Officer and Chief Process Officer
Michael Kleinemeier
Member of the Executive Board
Global Service & Support
Stefan Ries
Member of the Global Managing Board
Chief Human Resources Officer
| | |
| To Our StakeholdersGlobal Managing Board | | 9 |
Investor Relations
| ¡ | | SAP stock increased 26% in 2015. |
| ¡ | | The market capitalization of SAP exceeded US$97 billion at the end of 2015. |
| ¡ | | Recommended dividend payout is €1.15 per share. |
In 2015, our conversations with the financial community were highly focused on the soaring adoption of SAP S/4HANA, our strategy in business networks and the powerful combination of our rapidly expanding cloud business and our growing core business. Investors were keen to understand SAP’s position to capture the tremendous growth opportunities in the market.
SAP’s stock increased 26% in 2015 outperforming major indices such as the DAX. The market capitalization of SAP exceeded US$97 billion at the end of 2015. SAP is number 57 among the top 100 most valuable companies in the world.
PROVIDING TRANSPARENCY FOR INVESTORS
Investor Relations Team and Senior Management at SAP Held More Than 360 Meetings
In over 360 one-on-one meetings held during investor road shows worldwide, in virtual format over Telepresence or video conference, and at investor events, senior management at SAP and the Investor Relations (IR) team answered inquiries from institutional investors and analysts about SAP’s business strategy. We also held telephone conferences and analyst meetings when we published our quarterly results. In addition, we continued our dialog with the debt investor community through regular calls on SAP’s financial performance.
SAP Capital Markets Day at the New York Stock Exchange
A particular highlight of our global Investor Relations program in 2015 was the Capital Markets Day in conjunction with the SAP S/4HANA product launch held at the New York Stock Exchange. At the Capital Markets Day, our customers BASF, Shell, and UnderAmour spoke about their relationship with SAP. In addition, our events for investors and financial analysts at the CeBIT fair in Hanover, Germany, and the SAPPHIRE NOW conference in Orlando, Florida, in the United States, were key elements of our IR program. SAP engages in regular dialog with social responsible investors (SRIs), providing insight into SAP’s environmental, social, and corporate governance policies. SAP also speaks at various retail shareholder events.
Communication Across Multiple Channels
We provide a wide range of information for investors about SAP and SAP stock online, including social media information on the SAP Investor Relations Twitter feed @sapinvestor, the quarterly SAP INVESTOR magazine, which investors can subscribe to free of charge, and a text message service. Shareholders can reach the IR team directly through a hotline and e-mail at investor@sap.com. We also publish an overview of the latest analyst assessments in collaboration with Vara Research. All key investor events at which members of our Global Managing Board speak are broadcast live on the Internet, and we post the presentation materials on the investor relations area of our public Web site.
REWARDING OUR INVESTORS – DIVIDEND PAYOUT OF €1.15 PER SHARE
We believe our shareholders should benefit appropriately from the profit the Company made in 2015. In recent years, the payout has always been greater than 35% of profit after tax. We aim to continue our policy to pay a dividend totaling more than 35% of profit after tax in the future.
The Executive Board and the Supervisory Board will recommend to the Annual General Meeting of Shareholders that the total dividend will be increased by 5% to €1.15 per share (2014: €1.10). Based on this recommendation, the overall dividend payout ratio (which here means total distributed dividend as a percentage of profit) would be 45% (2014: 40%).
| | |
| To Our StakeholdersInvestor Relations | | 10 |
SAP Stock in Comparison to DAX 30, Dow Jones EURO STOXX 50, and S&P North American Technology Software Index
December 31, 2014 (=100%) to December 31, 2015
Percent
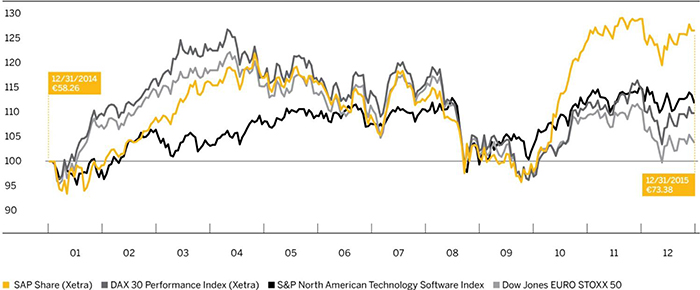
STOCK DEVELOPMENT AND COMPARISON TO PEER INDICES
Key Facts About SAP Stock/SAP ADRs
| | | | |
| Listings | | | | |
Germany | | | Berlin, Frankfurt, Stuttgart | |
United States (ADRs) | | | New York Stock Exchange | |
| IDs and symbols | | | | |
WKN/ISIN | | | 716460/DE0007164600 | |
NYSE (ADRs) | | | 803054204 (CUSIP) | |
Reuters | | | SAPG.F or .DE | |
Bloomberg | | | SAP GR | |
| Weight (%) in indexes at 12/31/2015 | | | | |
DAX 30 | | | 7.80 | |
Prime All Share | | | 5.78 | |
CDAX | | | 6.07 | |
HDAX | | | 6.20 | |
Dow Jones STOXX 50 | | | 2.02 | |
Dow Jones EURO STOXX 50 | | | 3.33 | |
A Volatile Year on Stock Markets Worldwide
Stock markets were volatile in 2015. The Greek debt crisis, fears over China’s economy, the decision of the Federal Reserve to delay plans to increase interest rates, the migrant crisis, terror attacks, and falling oil prices negatively impacted share prices worldwide. A third loan program for Greece and the European Central Bank’s commitment to its expansionary monetary policy lifted the markets and caused stocks to rally at the beginning and end of the year.
SAP Stock Outperforms the Indexes from the Second Quarter
Our stock reached its lowest price for the year on January 9, when it traded at €54.53. It recovered after the announcement of our preliminary results for full-year 2014 before fluctuating in its low range following the announcement of further results, outlook guidance, and medium-term targets for 2015. However, on February 12 it passed the €60 mark. The European Central
Bank’s loose monetary policy and its announcement of a bond purchase program at the end of January buoyed the markets. This helped lift the DAX 30, which crossed the 12,000 point level on March 12. Successful participation at the CeBIT trade fair and the Company’s proposal to increase the dividend also boosted the price of SAP stock.
The stock markets continued their climb in early April. On April 10, the DAX reached 12,374.73 points, an all-time high, and SAP stock surpassed €69. Shortly after, fears that Greece might leave the euro area weighed on stock markets for a time. After we published our first-quarter results on April 21, the price of SAP stock climbed to €68.94, and then to €70.72 on April 27, exceeding its record closing price from March 7, 2000. During the remainder of the second quarter, the price of SAP stock moved broadly in sympathy with general sentiment, which was disturbed by the crisis in Greece, weak economic data from the United States, and a strong euro.
| | |
| To Our StakeholdersInvestor Relations | | 11 |
The outcome of Greece’s referendum and China’s stock market crash weighed on markets in early July. After we announced our
second-quarter results on July 21, SAP stock fell to €67.80 in a weak market environment. The negative sentiment continued into August and dragged our stock down to below the €60 mark on August 21. In the second half of September, the Federal Reserve delayed its plans to raise interest rates, which unsettled investors primarily in Europe. The DAX moved back below the 10,000-point mark. The Volkswagen crisis also weighed on market sentiment, and, on September 24, SAP stock slipped to €55.89, its lowest point of the quarter.
At the start of October, hopes of a further central bank stimulus package temporarily lifted market sentiment. SAP stock also benefited from strong third-quarter results. After we presented our results, SAP stock rose to €66.50, while the DAX fell slightly. On October 27, our stock again passed the €70 mark and, on November 20, reached €74.85, its highest value for the year and an all-time high. In the first half of December, market sentiment was cautious following weak economic data from China and a strong euro before improving after the Federal Reserve raised interest rates. SAP stock ended the year at €73.38.
CAPITAL STOCK UNCHANGED
SAP’s capital stock as at December 31, 2015, was €1,228,504,232 (2014: €1,228,504,232). It is issued as 1,228,504,232 no-par shares, each with an attribute value of €1 in relation to capital stock.
SHAREHOLDER STRUCTURE
The proportion of our stock in free float increased again slightly in 2015. Applying the definition accepted on the Frankfurt Stock Exchange, which excludes treasury stock from the free float, as at December 31, 2015, the free float stood at 77.5% (December 31, 2014: 75.7%). In January 2016, approximately 20% (January 2015: 22%) of the stock was under the control of SAP founders Hasso Plattner, Dietmar Hopp, the Klaus Tschira community of heirs, and their trusts and holding companies.
Institutions in Ireland and the United Kingdom represented the largest regional group of shareholders, holding 17% of the stock in January 2016 (January 2015: 15%). Institutions in North America held around 16% of the stock in January 2016 (January 2015: 16%), followed by continental European investors outside Germany, who held approximately 14% in January 2016 (January 2015: 14%). Institutions in Germany held 8% (January 2015: 7%) and investors from the rest of the world held 2% (January 2015: 3%) of the stock in January 2015. Of these institutional investors, 10% were classified as socially responsible investors (SRIs) in January 2016 (January 2015: 10%). Private or unidentified investors held 18% (January 2015: 19%) in January 2016. Also as of January 2016, SAP held 2.5% (January 2015: 2.7%) of the stock in treasury.
Return on SAP Common Stock – WKN 716460/ISIN DE007164600
| | | | | | | | | | | | |
Percent, unless otherwise stated | | | | | | | | | |
| Initial investment €10,000 | | | | | | | | | | | | |
| Date of investment | | | 38,717 | | | | 40,543 | | | | 42,004 | |
| Period of investment | | | 10 years | | | | 5 years | | | | 1 year | |
| Value at 12/31/20151)(in €) | | | 22,317 | | | | 21,002 | | | | 12,798 | |
| Average annual return | | | 8.4 | | | | 16.0 | | | | 28.0 | |
| Performance comparators | | | | | | | | | | | | |
DAX 30 Performance – total return index | | | 7.1 | | | | 9.2 | | | | 9.6 | |
REX General Bond – total return index | | | 4.1 | | | | 4.0 | | | | 0.5 | |
S&P 500 Composite – total return index | | | 8.2 | | | | 17.4 | | | | 12.9 | |
S&P North American Technology Software Index | | | 11.4 | | | | 17.8 | | | | 25.3 | |
| 1) | Assuming all dividends were reinvested |
| | |
| To Our StakeholdersInvestor Relations | | 12 |
Return on SAP ADRs – 803054204 (CUSIP)
| | | | | | | | | | | | |
Percent, unless otherwise stated | | | | | | | | | |
| Initial investment €10,000 | | | | | | | | | | | | |
| Date of investment | | | 38,717 | | | | 40,543 | | | | 42,004 | |
| Period of investment | | | 10 years | | | | 5 years | | | | 1 year | |
| Value at 12/31/20151)(in US$) | | | 19,918 | | | | 16,870 | | | | 11,561 | |
| Average annual return | | | 7.1 | | | | 11.0 | | | | 15.6 | |
| Performance comparators | | | | | | | | | | | | |
S&P 500 Composite – total return index | | | 7.3 | | | | 12.6 | | | | 1.4 | |
| 1) | Assuming all dividends were reinvested |
Source: Datastream
| | |
| To Our StakeholdersInvestor Relations | | 13 |
Corporate Governance Report
We are a global company with an international shareholder base, so we need sound governance. Good corporate governance means managing the Company accountably and transparently to secure long-term value. We believe our shareholders, business partners, employees, and the financial markets reward good corporate governance with the increased trust they place in our Company.
CORPORATE GOVERNANCE PRINCIPLES AT SAP
SAP is an international firm with European roots, having the legal form of a European company (Societas Europaea, or SE). Being an SE headquartered in Germany, we are now subject to European and German law for SEs while remaining subject to German stock corporation law. Major characteristics of our governance structure remain in place since the conversion, notably our two-tier board comprising a Supervisory Board and an Executive Board, and parity for workforce representatives on the Supervisory Board. Because SAP SE is listed on a German stock exchange, our corporate governance is still based on the German Corporate Governance Code (the “Code” in this report). Every year, as required by the German Stock Corporation Act, section 161, the Executive Board and Supervisory Board issue a declaration stating whether SAP has implemented and is following the Code’s recommendations, and identifying any recommendations that the Company has not followed – with a full explanation of why it has not done so. Our latest section 161 declaration, published on October 29, 2015, is on the SAP Web site along with our declarations from previous years and links to the current and previous editions of the Code. As our 2015 declaration shows, we currently follow all but seven of the 102 recommendations and all of the suggestions in the current Code.
Since SAP is also listed in the United States, we comply with the rules that apply to non-U.S. companies listed on the New York Stock Exchange (NYSE). These include the requirements, as they apply to foreign private issuers, of the NYSE Corporate Governance Standards, the U.S. Sarbanes-Oxley Act of 2002, and the U.S. Securities and Exchange Commission (SEC).
CORPORATE GOVERNANCE STATEMENT
On February 24, 2016, the Executive Board published a corporate governance statement for 2015 as required by the German Commercial Code, section 289a. The statement is on the SAP Web site. It comprises the current declaration pursuant to the German Stock Corporation Act, section 161, certain details of our corporate governance practices, and an account of how the Executive Board and the Supervisory Board work, who serves on which Supervisory Board committees, and how those committees work. It also sets out the targets for the percentage of women on the Executive Board and the two management levels below Executive Board level.
EXECUTIVE BOARD
The Executive Board currently has six members. It is solely responsible for managing the Company. It has a duty to exercise its management powers in the interest of the Company and in pursuit of the sustained growth of corporate value. It discusses and agrees its strategy for the Company with the Supervisory Board, ensures compliance with the requirements of the law throughout the Group, and maintains effective risk management structures and internal risk controls. There is information about each member’s portfolio of responsibilities on the SAP Web site.
GLOBAL MANAGING BOARD
The Global Managing Board helps the Executive Board with its work. It currently comprises all of the Executive Board and four other global managers who play a part in directing large sections of the business. These additional members are appointed by the Executive Board with the Supervisory Board’s consent. The Global Managing Board has a coordinating function, advises the Executive Board, and helps it make decisions, but the Executive Board retains overall responsibility for everything the Company does. The Global Managing Board will be dissolved on March 31, 2016. Two of its members were appointed by the Supervisory Board to the Executive Board with effect from April 1, 2016.
SUPERVISORY BOARD
The size and composition of the Supervisory Board are governed not by the German Codetermination Act (which does not apply, because we are a European company) but by the Articles of Incorporation and the SAP SE Employee Involvement Agreement. Both documents are available on the SAP Web site.
| | |
| To Our StakeholdersCorporate Governance Report | | 14 |
The Supervisory Board has 18 members who, in equal numbers, represent the shareholders and the employees. It appoints, monitors, and advises the Executive Board. The Executive Board involves the Supervisory Board in decisions on matters of fundamental importance for the Company. The Supervisory Board has reserved to itself the approval of certain transactions of fundamental importance, as set out in the Articles of Incorporation and detailed in the Supervisory Board’s list of reserved categories of transactions. The Executive Board regularly provides the Supervisory Board with full and timely reports on all material matters of strategy, business planning, and performance, including any deviations of actual business performance from plan, risks, risk management, and corporate compliance. We provide our shareholders with in-depth information about how the Executive Board and the Supervisory Board work, how the committees are composed, and how these committees work, in our corporate governance statement. For more information about the joint work of the Executive Board and the Supervisory Board and about the work of the Supervisory Board and its committees in 2015, see theReport from the Supervisory Board.
COMPOSITION OF THE SUPERVISORY BOARD
The Supervisory Board members as a group possess the knowledge, ability, and expert experience required to properly perform its duties in our global IT company. At least one independent member has financial reporting and auditing expertise. The Supervisory Board has defined the following objectives for its own composition:
| ¡ | | There should never be fewer than three people from the international stage on the shareholder representatives’ side of the Supervisory Board. |
| ¡ | | No employee, consultant, or director of a significant SAP competitor should be a Supervisory Board member. |
| ¡ | | At least five shareholder representatives on the Supervisory Board should be independent members in the meaning of section 5.4.2 of the Code. |
| ¡ | | No member of the Supervisory Board should be older than 75 years. |
We believe the current composition of the Supervisory Board fulfills all of these objectives. There is information about each member, the committees, and who serves on which committee, on the SAP Web site.
INDEPENDENCE OF THE SUPERVISORY BOARD
We believe a sufficient degree of independence of our Supervisory Board members is essential for effective and responsible corporate management and control. Our Supervisory Board has a defined objective for its composition regarding the minimum number of independent members on the shareholder representative side, as recommended in the Code, section 5.4.1, paragraph 2. The objective is five such members. At its meeting on October 8, 2015, the Supervisory Board determined that all of its shareholder representative members are independent in the meaning of the Code, section 5.4.2 and that the number of independent members is sufficient in the meaning of that section. The Audit Committee is chaired by Erhard Schipporeit, who for many years was the chief financial officer of a DAX company that is also listed on a U.S. stock exchange and therefore qualifies as an independent financial expert in the meaning of the German Stock Corporation Act, section 100 (5).
DIVERSITY IN THE COMPANY
Starting 2016, a fixed gender quota of 30% applies for new appointments to the Supervisory Board of SAP SE pursuant to the law on the equal participation of men and women in leadership positions (German Equal Leadership Opportunities for Women Act). As such, the Supervisory Board’s previous voluntary objective for the composition of the Supervisory Board, based on an earlier Code recommendation, no longer applies. There are currently two women on the shareholder representatives’ side of the Supervisory Board and two women on the employee representatives’ side. The fixed quota applies to future appointments to the Supervisory Board; the current members of the Supervisory Board remain unaffected until the end of their term.
The Executive Board currently has six male members. Pursuant to the above Act, the Supervisory Board adopted by resolution at its meeting on March 19, 2015, a target of one for the number of Executive Board seats to be held by women by June 30, 2017.
The first and second management levels below the Executive Board are the Global Executive Team (GET, without the Global Managing Board) and the Senior Executive Team (SET), respectively. In accordance with the requirements of the Act, the Executive Board resolved on September 30, 2015, that the percentage of positions held by women on the first two management levels below the Executive Board should remain unchanged at 23% and 17%, respectively, to June 30, 2017.
The Executive Board continues to follow the recommendation in the Code that executive boards should generally have regard to diversity when appointing people to leadership positions, and in particular to employ appropriate numbers of women in such positions. In support of this, we maintain a diversity policy for company leadership appointments. SAP has set itself a target of increasing the overall percentage of positions in leadership held by women to 25% by 2017. It goes without saying that ability is still the primary selection criterion for any position at SAP. Globally, the percentage of leadership positions held by women at the end of 2015 was 23.6%.
| | |
| To Our StakeholdersCorporate Governance Report | | 15 |
CODE OF BUSINESS CONDUCT
SAP’s corporate governance includes our Code of Business Conduct for employees and members of the Executive Board. The Code of Business Conduct expresses the high standards that we require from our employees and Executive Board members and sets out the main principles that guide our business conduct toward customers, business partners, and shareholders. We see our Code of Business Conduct as the standard for our dealings involving customers, business partners, vendors, shareholders, and competitors. By following our Code of Business Conduct, we demonstrate a commitment against all forms of unfair competitive practice, corruption, and misrepresentation. Our global compliance organization monitors worldwide compliance with the Code of Business Conduct and other policies applying within the Group. It regularly reviews these internal policies, revises them if necessary, and delivers related employee training.
APPLYING INTERNATIONAL CORPORATE GOVERNANCE STANDARDS
SAP is a NYSE-listed company and we are therefore subject to certain U.S. financial legislation (including the Sarbanes-Oxley Act of 2002, among others) and to the applicable SEC and NYSE regulations. Besides implementing the requirements of the U.S. Sarbanes-Oxley Act, section 404, and other Sarbanes-Oxley Act requirements, including conducting an annual audit of our internal control over financial reporting, we comply with those of the corporate governance standards codified in the NYSE Listed Company Manual, section 303A, which bind foreign private issuers. The section 303A standards that apply to SAP include the requirement to have an audit committee composed of members who are independent in the meaning of the Sarbanes-Oxley Act, and related reporting requirements. Erhard Schipporeit, the chairperson of the Audit Committee, is an audit committee financial expert in the meaning of the Sarbanes-Oxley Act.
ANNUAL GENERAL MEETING OF SHAREHOLDERS
Our shareholders exercise their rights, such as the rights to put questions to the management and to vote, at the Annual General Meeting of Shareholders. Shareholders and the public are able to watch a live broadcast of the entire Annual General Meeting of Shareholders on the Internet. They can vote their shares at the Meeting or instruct a proxy of their choice or one of the proxies provided for that purpose by SAP. Alternatively, they can participate online or vote by mail. The invitation to the Annual General Meeting of Shareholders includes full details and instructions. Every shareholder can access all of the paperwork on the SAP Web site in good time for the meeting.
TRANSPARENCY, COMMUNICATION, AND SERVICE FOR SHAREHOLDERS
Our shareholders can obtain full and timely information about SAP on our Web site and can access current and historical Company data. Among other information, we post all of our financial reports, all relevant news about the Company’s governing bodies and their corporate governance documentation, information requiring ad hoc (current) disclosure, press releases, and news of notifiable directors’ dealings.
FINANCIAL ACCOUNTING, RISK MANAGEMENT, AND INTERNAL CONTROL
We prepare the SAP SE financial statements in accordance with the German Commercial Code and our consolidated financial statements in accordance with International Financial Reporting Standards (IFRSs). We prepare a management report, as required by the German Commercial Code, and the Form 20-F annual report in accordance with SEC requirements. The Executive Board is responsible for financial accounting. The Supervisory Board approves the SAP SE financial statements, the consolidated financial statements, and the combined management report. The SAP SE financial statements, the consolidated financial statements, and the combined management report are audited by KPMG AG Wirtschafts-prüfungsgesellschaft, the auditor elected for that purpose by the Annual General Meeting of Shareholders.
In addition to our annual financial statements, we also prepare interim reports for the first, second, and third quarters. Our quarterly reports comply with the German Securities Trading Act and are submitted to the Audit Committee of the Supervisory Board before they are published.
In German stock corporation and commercial law, there are special requirements for internal risk management that apply to SAP. To meet them, our global risk management system supports risk planning, identification, analysis, handling, and minimization. We maintain standard documentation of all our internal control structures, especially those that affect financial reporting, and continually evaluate their effectiveness. As a company listed on the NYSE, we instruct our auditor, KPMG, to conduct an annual audit of our internal control over financial reporting in accordance with the requirements of the U.S. Sarbanes-Oxley Act of 2002, section 404. The audit as of December 31, 2015, confirmed that our internal control is effective. In compliance with the reporting requirements in the German Commercial Code, sections 289 (5) and 315 (2)(5), the combined SAP SE and SAP Group management report contains full information about the principal features of the internal controls and risk management structure applying to SAP’s consolidated financial reporting.
EXECUTIVE BOARD AND SUPERVISORY BOARD SHAREHOLDINGS
Section 6.3, sentence 2, of the Code recommends that all directors’ shareholdings be reported in a corporate governance report, broken down by executive board and supervisory board memberships if the entire holdings exceed 1% of the shares issued by the Company. In fulfillment of this recommendation, see theCompensation Report in our combined management report for 2015, which contains the recommended information.
| | |
| To Our StakeholdersCorporate Governance Report | | 16 |
Report from the Supervisory Board
Dear Shareholders,
In 2015, as every year, the Supervisory Board continuously discharged all of the duties imposed on it by the law and by the Company’s Articles of Incorporation. We were consulted by the Executive Board throughout the year and kept the global management of the Company under continued observation and scrutiny for legal compliance, adherence to proper accounting principles, business focus, and efficiency. We agreed the Company’s strategy with the Executive Board and regularly discussed with the Executive Board the Company’s progress toward executing it. We were directly involved when the Executive Board made any decision of fundamental importance to SAP.
We received regular, full, and timely reports, both in writing and from Executive Board members in person. They kept us up to date on the Company’s strategy, plans, business performance, risks, risk management, compliance (in other words, adherence to laws, to the Company’s Articles of Incorporation, and to internal policies), and transactions of special significance for SAP. The Executive Board advised us when business deviated from plan or target, and why.
The content and scope of the Executive Board’s reports to us fully met our requirements for them. Whenever we asked for more information than was in the reports, the Executive Board gave us it. In particular, the Executive Board came to Supervisory Board meetings for discussion and to answer our questions. We questioned and probed the Executive Board to satisfy ourselves that the information it gave us was plausible. Section 11 (6) in the Articles of Incorporation lists certain transactions for which management must seek prior supervisory board approval. The Supervisory Board established a list of such transactions and other categories of transactions for which the Executive Board must obtain the Supervisory Board’s consent, in accordance with the German SE Implementation Act, section 19. The Supervisory Board carefully considered all transactions in the listed categories and discussed them with the Executive Board, focusing on the benefits, potential risks, and other effects of each transaction. The Supervisory Board agreed to all transactions for which its consent was sought by the Executive Board.
The Executive Board also kept the chairperson of the Supervisory Board fully informed between meetings of the Supervisory Board and its committees. In particular, the CEO met regularly with the chairperson of the Supervisory Board to discuss SAP’s strategy, planning, the Company’s business performance, risks, risk management, compliance, and other key topics and decisions. The CEO informed the Supervisory Board chairperson without delay of all important events that were significant for assessing SAP’s position and progress or for the management and governance of the Company.
SUPERVISORY BOARD MEETINGS AND RESOLUTIONS
In 2015, the Supervisory Board of SAP SE held four ordinary meetings and four extraordinary meetings at which we deliberated and resolved on all matters of relevance to the Company. We also adopted two resolutions by correspondence vote. It is customary practice at our meetings that the Executive Board withdraws while we deliberate on items that pertain to the Executive Board or require discussion among Supervisory Board members alone. This happened at three of our ordinary meetings in 2015. The Supervisory Board addressed the following key topics during the year:
SAP Business Network and Cloud Business
After dealing extensively with a number of major SAP acquisitions in 2013 and 2014, the Supervisory Board and the Finance and Investment Committee discussed the development and integration of the acquired entities on numerous occasions in 2015. The SAP Business Network segment, which combines the activities of the acquired Ariba, Concur, Fieldglass businesses, and the integration of these companies into the SAP Group, were key topics notably at the Supervisory Board meeting on February 12 and at the Finance and Investment Committee meetings in February, July, and December. Likewise in our line of focus were the development of the cloud business, and the cloud strategy. We explored these topics regularly, particularly in connection with the Executive Board’s business reports and in the course of Technology and Strategy Committee meetings.
| | |
| To Our StakeholdersReport from the Supervisory Board | | 17 |
Executive Board Compensation
Prompted by, among other things, the unexpectedly strong growth in SAP’s cloud business and the pending discontinuation of the RSU Milestone Plan 2015 at the end of the year, the Supervisory Board made a number of decisions about Executive Board compensation. Compensation was on the agenda of the ordinary Supervisory Board meetings in February, July, and October, and of the General and Compensation Committee meetings.
At our ordinary Supervisory Board meeting on February 12, we received and discussed the recommendations of the General and Compensation Committee concerning Executive Board compensation for 2014. Exercising our discretionary powers under the terms of the short-term incentive (STI) plan 2014, we first determined performance against the defined targets. We also looked at target achievement within the so-called performance period for the 2014 tranche of the RSU Milestone Plan 2015. Introduced in 2012, the RSU Milestone Plan 2015 is a long-term variable compensation element for SAP SE Executive Board members in which the members are granted a number of virtual shares (called restricted share units, or RSUs) for a given year (or “tranche”); the quantity of RSUs ultimately allocable for a plan tranche depends on SAP’s operating profit performance in the year it is allocated. In light of the unexpectedly strong growth in cloud business and its effects on SAP’s revenue development, the Supervisory Board resolved a number of amendments to the RSU Milestone Plan 2015 to preserve its fair and equitable nature.
We also deliberated on Executive Board compensation for 2015 in the February meeting. We identified the key performance indicators (KPIs) and set the target numbers for each KPI in the STI 2015 plan and their relative weightings. We revised the revenue and operating profit performance targets for the 2015 tranche of the RSU Milestone Plan 2015 to take account of the effects of the aforementioned cloud growth on the Company’s sales and profit planning. We adopted a resolution on Executive Board members’ individual allocation of rights under the RSU Milestone Plan 2015 (2015 tranche). The Supervisory Board, as required, evaluated the appropriateness of the Executive Board members’ compensation for 2015, and in each case found it to be appropriate in terms of amount, structure, objective criteria, and for each member’s responsibilities and tasks.
On July 9, we deliberated on the new model for Executive Board compensation for 2016, which had been prepared and discussed by the General and Compensation Committee at several meetings on account of the pending discontinuation of the RSU Milestone Plan 2015. Ahead of the meeting, we had received a legal opinion from Allen & Overy and a certificate from Ernst & Young on the compensation’s appropriateness. On this basis, we resolved to adopt the new Long-Term Incentive (LTI) Plan 2016 and agreed that the amount and structure of the Executive Board’s compensation for 2016 was appropriate. For more information about the LTI Plan 2016 and other elements of the compensation package for Executive Board members, see theCompensation Report.
Other matters addressed at our meetings in 2015 included:
Meeting in February
The compensation issues discussed at our February meeting are covered in the preceding section. In view of the retroactive changes to the Executive Board compensation as described, we also resolved in our February meeting to update the Company’s declaration of implementation of the German Corporate Governance Code (the “Code”) pursuant to the German Stock Corporation Act, section 161, by filing jointly with the Executive Board a precautionary declaration of deviation from the recommendation contained in section 4.2.3 (second paragraph, eighth sentence) of the Code.
The Executive Board gave us an overview of business in 2014 and presented other management information, such as SAP’s revenue growth in the individual business areas, regions, and product fields. It also explained SAP’s current market position and growth plan for the next five years. We discussed in detail the annual plan for 2015 as presented to us by the Executive Board, and we decided to vote on the 2015 capital expenditure budget and liquidity plan in a subsequent extraordinary Supervisory Board meeting. In addition, the Executive Board updated us on the status and lessons learned from the “Simplify & Optimize” personnel restructuring project launched in 2014/2015.
Extraordinary Meeting in February
The Supervisory Board held an extraordinary meeting on February 23 in which it continued its discussion from the preceding ordinary meeting and approved the annual plan and budget for 2015.
Meeting in March (Meeting to Discuss the Financial Statements)
At its March 19 meeting, the Supervisory Board turned its attention to SAP SE’s 2014 financial statements and the consolidated financial statements, the audits conducted by KPMG AG Wirtschaftsprüfungsgesellschaft (KPMG), and the Executive Board’s proposed resolution on the appropriation of retained earnings for 2014. The Audit Committee reported on all matters for which it is responsible in connection with the financial statements and the consolidated financial statements for 2014, particularly on the form and scope of its examination of the documents relating to the financial statements, and recommended that we approve them. The auditor attended the meeting and reported in detail on the audit and its findings for each of the focus areas the Audit Committee had selected. The auditor also related the discussions on those matters at the two preceding meetings of the Audit Committee. The auditor then discussed the results of the audit with the Supervisory Board and answered our questions. The Supervisory Board approved the audit. There were no findings from our own examination, so
| | |
| To Our StakeholdersReport from the Supervisory Board | | 18 |
we gave our consent to the SAP SE and consolidated financial statements for 2014. We checked and endorsed the Executive Board’s proposal to appropriate retained earnings in accordance with the Audit Committee’s recommendation. There were also a number of corporate governance matters on the meeting agenda. We discussed the impact of Germany’s new gender quota law and set a target for the percentage of women on SAP’s Executive Board. We decided on the resolutions we would propose for the agenda of the Annual General Meeting of Shareholders in May 2015. Among them was our recommendation to the shareholders concerning the auditor to elect for 2015; our recommendation followed that of the Audit Committee to us.
The Executive Board reported on its forecast for the first quarter of 2015 and offered insights into the implementation of the end-to-end delivery model, using the example of cloud-based human capital management (HCM) software. This delivery model is based on a standardized concept for the management and organization of all activities in the product lifecycle, from product development to sales to service and support services. Finally, it gave us an update on the status of the SAP ONE Service program restructuring designed to merge the services and support areas into a single organization.
Extraordinary Meeting in May
Elections for new employee representatives on the Supervisory Board were held in the spring of 2015 in accordance with the terms of the SAP SE Employee Involvement Agreement that was concluded on March 10, 2014, in the course of SAP’s conversion to an SE. Among other things, the SAP SE Employee Involvement Agreement governs the codetermination of employees on the Supervisory Board. The term of office of the elected employee representatives began after the Annual General Meeting of Shareholders on May 20, 2015. As a result, the Supervisory Board held an extraordinary meeting immediately following the Annual General Meeting. After welcoming the new members, the Supervisory Board chairperson introduced Gesche Joost, who was to be appointed as Hartmut Mehdorn’s successor to the Supervisory Board through application to the court. We then elected the new employee representative members to the various committees. Margret Klein-Magar was elected deputy chairperson of the Supervisory Board by circular correspondence vote following in-depth discussion of all proposed candidates during the meeting.
Meeting in July
At our ordinary meeting on July 9, we discussed in detail the directors’ and officers’ group liability insurance policies that we take out from year to year, and approved an increase in the insurance limit. We resolved to revise the list of transactions for which the Executive Board must obtain the Supervisory Board’s consent, in accordance with the German SE Implementation Act, section 19. We confirmed the appointment of Quentin Clark to the Global Managing Board. The Supervisory Board also resolved the appointments of new members to the committees, which became necessary following Hartmut Mehdorn’s departure from and Gesche Joost’s appointment to the Supervisory Board.
The Executive Board then gave us an account of business in the second quarter of 2015 and performance in the first half-year. Members of the Executive Board told us about second-quarter growth in cloud, about the SAP Business Network segment’s performance, and about SAP’s competitive situation. We also received updates on the Global Service & Support board area, the market launch of SAP S/4HANA, and the Company’s “Run Simple” campaign.
Extraordinary Meeting in September
In early July, we learned of Bill McDermott’s serious accident. The Supervisory Board chairperson thereafter maintained close regular contact with the CEO to check on his recovery. Having already advised by telephone during a break at the ordinary meeting on July 9 that he had been released from hospital, Bill McDermott joined our extraordinary meeting on September 10 personally to report in more detail about his accident, the injuries he suffered, and his recovery process. We were relieved to hear that despite the severe consequences of the accident, he now felt strong again and was able to continue devoting all of his energy to his work as CEO.
Meeting in October
At our ordinary meeting on October 8, we resolved, on the recommendation of the General and Compensation Committee, to appoint Michael Kleinemeier to the Executive Board effective on November 1, 2015, and we agreed the terms and conditions of his compensation.
The Executive Board reported on business in the third quarter, using the new SAP Digital Boardroom solution to present the data and detailed views on multiple interactive computer screens. The SAP Digital Boardroom is an innovative, analytical software solution that allows analysts to generate impressive graphics for all business area metrics in real time. The “Global Consolidation of Intellectual Property Rights” (IP Rights) project for Group-wide bundling of SAP’s IP rights was also presented to us. We consented to this project and its related planned measures. In agreement with the Executive Board, the Supervisory Board also adopted, for regular publication in October 2015, the annual declaration of implementation of the Code pursuant to the German Stock Corporation Act, section 161. The Supervisory Board determined that it has a sufficient number of independent members. Some Supervisory Board members currently have business dealings with SAP or hold senior positions or material equity in companies that currently have business dealings with SAP, or had done so in the course of the year. SAP’s business dealings with these persons or companies are or were at arm’s length. In our view, especially given the limited scope and materiality of those dealings, they did not affect the independence of the Supervisory Board members concerned and do not give rise to any substantial and
| | |
| To Our StakeholdersReport from the Supervisory Board | | 19 |
not merely temporary conflict of interest in the meaning of the Code. The Supervisory Board conducted its regular investigation into the efficiency of its own work. We then looked at the budget plan for the upcoming fiscal year and the Executive Board updated us on SAP’s current marketing strategy.
Extraordinary Meeting in December
At the extraordinary meeting on December 11, which was held in the form of a telephone conference, we discussed with the Executive Board the status of the budget planning for 2016, which the Executive Board explained to us in detail. The final adoption of the budget will occur, as is customary, at the February meeting of the new year.
THE WORK OF THE SUPERVISORY BOARD COMITTEES
The committees made a key contribution to the work of the Supervisory Board and reported on their work to us, including their preparatory work on the relevant agenda items of the full Supervisory Board. The following committees were in place in 2015 before the term of office of the newly elected employee representatives began:
| ¡ | | General and Compensation Committee: Hasso Plattner (chairperson), Panagiotis Bissiritsas, Wilhelm Haarmann, Jim Hagemann Snabe, Lars Lamadé, Bernard Liautaud, Margret Klein-Magar, Christiane Kuntz-Mayr |
| ¡ | | Audit Committee: Erhard Schipporeit (chairperson), Steffen Leskovar, Stefan Schulz, Klaus Wucherer |
| ¡ | | Finance and Investment Committee: Wilhelm Haarmann (chairperson), Panagiotis Bissiritsas, Hartmut Mehdorn, Kurt Reiner, Mario Rosa-Bian, Jim Hagemann Snabe |
| ¡ | | Technology and Strategy Committee: Hasso Plattner (chairperson), Stefan Schulz (deputy chairperson), Pekka Ala-Pietilä, Anja Feldmann, Steffen Leskovar, Bernard Liautaud, Margret Klein-Magar, Kurt Reiner |
| ¡ | | People and Organization Committee: Hasso Plattner (chairperson), Catherine Bordelon, Anja Feldmann, Wilhelm Haarmann, Christiane Kuntz-Mayr, Lars Lamadé, Hartmut Mehdorn, Mario Rosa-Bian |
| ¡ | | Nomination Committee: Hasso Plattner (chairperson), Pekka Ala-Pietilä, Bernard Liautaud |
| ¡ | | Special Committee: Hasso Plattner (chairperson), Pekka Ala-Pietilä, Wilhelm Haarmann, Margret Klein-Magar, Lars Lamadé, Erhard Schipporeit |
In the course of the election of new employee representatives to the Supervisory Board, we reconstituted the committees after the Annual General Meeting of Shareholders on May 20, 2015, as detailed below. The membership of the committees subsequently changed once more in July 2015 following the departure of Hartmut Mehdorn from and appointment of Gesche Joost to the Supervisory Board. Hartmut Mehdorn was succeeded by Pekka Ala-Pietilä on the Finance and Investment Committee, and by Gesche Joost on the People and Organization Committee. In addition, Gesche Joost and Panagiotis Bissiritsas joined theTechnology and StrategyCommittee, increasing the number of members on that committee from eight to 10.
| ¡ | | General and Compensation Committee: Hasso Plattner (chairperson), Wilhelm Haarmann, Andreas Hahn, Margret Klein-Magar, Lars Lamadé, Bernard Liautaud, Sebastian Sick, Jim Hagemann Snabe |
| ¡ | | Audit Committee: Erhard Schipporeit (chairperson), Panagiotis Bissiritsas, Martin Duffek, Klaus Wucherer |
| ¡ | | Finance and Investment Committee: Wilhelm Haarmann (chairperson), Pekka Ala-Pietilä (from July 9, 2015), Panagiotis Bissiritsas, Margret Klein-Magar, Sebastian Sick, Jim Hagemann Snabe |
| ¡ | | Technology and Strategy Committee: Hasso Plattner (chairperson), Christine Regitz (deputy chairperson), Pekka Ala-Pietilä, Panagiotis Bissiritsas (from July 9, 2015), Anja Feldmann, Andreas Hahn, Gesche Joost (from July 9, 2015), Margret Klein-Magar, Bernard Liautaud, Pierre Thiollet |
| ¡ | | People and Organization Committee: Hasso Plattner (chairperson), Martin Duffek, Anja Feldmann, Wilhelm Haarmann, Gesche Joost (from July 9, 2015), Lars Lamadé, Christine Regitz, Robert Schuschnig-Fowler |
| ¡ | | Nomination Committee: Hasso Plattner (chairperson), Pekka Ala-Pietilä, Bernard Liautaud |
| ¡ | | Special Committee: Hasso Plattner (chairperson), Pekka Ala-Pietilä, Wilhelm Haarmann, Lars Lamadé, Erhard Schipporeit, Sebastian Sick |
Each of the committees was active in 2015 except the Special Committee and the Nomination Committee.
For more information about the Supervisory Board committees and their duties, see SAP’s corporate governance statement pursuant to the German Commercial Code, section 289a, published on SAP’s Web site at: http://www.sap.com/investor.
In 2015, the committees focused on the following topics:
| ¡ | | TheGeneral and Compensation Committee held six regular meetings. It prepared and recommended the Supervisory Board’s resolutions, notably those on Executive Board compensation described above. It worked on the new model for Executive Board compensation for 2016 and frequently deliberated on Global Managing Board members’ compensation. It reviewed the annual report it receives from the capital market compliance officer and gave its approval for Bill McDermott to accept a seat on the supervisory board of a U.S. company. At its first meeting in March, the Committee prepared the Supervisory Board’s resolutions regarding the target for the percentage of women on the Executive Board. In a second meeting in March, the Committee received a report from the corporate governance officer and, in preparation for the upcoming Supervisory Board meeting, discussed the Government Commission for the German Corporate Governance Code’s proposed changes to the Code recommendations. At its October |
| | |
| To Our StakeholdersReport from the Supervisory Board | | 20 |
meeting, the Committee discussed the Company’s implementation of the Code recommendations and prepared the Supervisory Board’s decisions with respect to the submission of the declaration of implementation of the Code and ascertaining the independence of Supervisory Board members. It also prepared the Supervisory Board’s decision concerning Michael Kleinemeier’s appointment to the Executive Board. The Committee also discussed succession planning for the Executive Board and the Global Managing Board.
| ¡ | | TheFinance and Investment Committee held five physical meetings in 2015, one of which was a joint meeting with the Technology and Strategy Committee. At its January 27 meeting, representatives from Sapphire Ventures presented detailed information about the investment activities of the three SAP venture capital funds. The Committee discussed SAP’s process for mergers and acquisitions (M&A) and was given a comparison of standards with those of other IT companies. It learned about the standard clauses SAP uses in acquisition contracts, probed the tax treatment of past M&A transactions, and received a status report regarding the 2014 acquisition of SeeWhy, a leader in cloud solutions for behavior-based marketing. The annual report on SAP’s acquisitions was the focus of the meeting on February 11, during which the Committee discussed at length the employee feedback regarding past acquisitions. On July 8, the Finance and Investment Committee held a joint meeting with the Technology and Strategy Committee. Matters discussed included a comprehensive analysis of the major acquisitions in the past three years, SAP’s strategic alignment, and an overview of product developments in the field of analytics and the Internet of Things. When it met in October, the Committee focused solely on the global project to consolidate SAP SE’s IP rights. Focus topics at the December 16 meeting were an overview of the acquisition scene in Europe including startups, the acquisition of the HR software company Multiposting, and the adoption of the Committee’s rules of procedure. The Committee was also given a status update on the IP rights consolidation project, notably as regards the final legal and tax analysis. The Executive Board explained the principles of goodwill recognition, as well the results of the impairment test performed on the recognized goodwill in accordance with the relevant IFRS regulations. The Committee’s aim was to be able to better consider the subsequent accounting for goodwill arising from acquisitions when monitoring SAP’s acquisition activities in the future. |
| ¡ | | TheAudit Committee held four meetings at which members attended in person (“physical meetings”) and four telephone conference meetings. The telephone conference meetings were all ahead of the publication of interim reports for each quarter. At these meetings, the Committee primarily deliberated on the course of business over the quarter concerned, the process by which the quarterly financial reports were prepared, the interim report to be published, and insights gained from the auditor’s quarterly review of selected software agreements. The physical meetings in February and March concentrated on the SAP SE and consolidated financial reports for 2014 and the reporting process, the internal control structure for financial reporting, the most important accounting methods, and the audit. At the February meeting, the Committee also discussed the German Financial Reporting Enforcement Panel’s criteria and the internal audit service’s report for the previous year, organization and processes, and audit plan for 2015. At its meeting in March, the Committee did preparatory work on the Supervisory Board’s recommendations to the Annual General Meeting of Shareholders concerning the election of an auditor and the appropriation of retained earnings and discussed the Company’s compliance system. When it met in July, the Committee discussed the audit focus and fees with the auditor, dealt with the internal audit service’s work in the first half of the year and audit planning for the second half-year, and reviewed the Company’s internal controls. At its October meeting, the Committee discussed the report from the chief compliance officer and other compliance system matters and came to the conclusion that the compliance system was effective. |
The auditor attended all physical meetings and telephone conference meetings of the Audit Committee and reported in depth on its audit work and on its quarterly reviews of selected software agreements.
| ¡ | | TheTechnology and Strategy Committee held four meetings in 2015, one of which was a joint meeting with the Finance and Investment Committee. It discussed the key technology trends in the software industry in the years to come and SAP’s corporate and product strategies. At the Committee’s February 11 meeting, the Executive Board presented an overview of market development in 2014 and explained what it would mean for SAP’s business in 2015. Key topics included the strategic road map for SAP S/4HANA, its deployment in the cloud, and its market launch. When the Committee met on March 18, it discussed SAP HANA Cloud Platform and SAP HANA Enterprise Cloud. As reported in the Finance and Investment Committee section above, the Technology and Strategy Committee held a joint meeting with the Finance and Investment Committee on July 8. On October 7, the Committee engaged in detailed discussions about SAP’s user experience (UX) strategy, in other words, the planned measures to improve the user-friendliness of SAP software, taking a particular look at SAP Fiori UX and past successes. It also analyzed and discussed the outlook for the SAP Business Network segment. |
| ¡ | | ThePeople and Organization Committee held two meetings in 2015. In June, it was given an update on the current status of training and personal and professional development at SAP, with detailed information on the various training programs in each board area. The Committee also examined the current state of succession planning for the managers. The second meeting took place on September 10, at which the Committee reviewed the learning offerings available through SAP Development University, SAP’s internal academy for the professional training of its developers. In addition, the Committee discussed SAP’s collaboration with academia to promote young talents in a digitalized working world. |
| | |
| To Our StakeholdersReport from the Supervisory Board | | 21 |
Regular reports from the committees ensured that we were kept fully informed of all matters covered by the committees and were able to discuss them thoroughly.
CORPORATE GOVERNANCE
SAP’s corporate governance officer monitored our compliance with those recommendations in the Code with which in SAP SE’s declaration we claim to comply, and reported in full to the General and Compensation Committee. For more information about Code compliance, see theCorporate Governance Report from the Executive Board and Supervisory Board.
Members of the Executive Board and of the Supervisory Board had no conflicts of interest that sections 4.3.4 and 5.5.2 of the Code require to be disclosed to the Supervisory Board. The Supervisory Board consented to the mandating of a law firm with a legal opinion, and also approved cost calculations related to already authorized consulting services of that law firm, in which a Supervisory Board member is a partner. The member concerned was excluded from the deliberations and voting on the matter. In addition, there were a number of transactions involving members of the Executive Board in 2014, which were all consistent with industry standards and immaterial. These transactions were approved by the Executive and Compensation Committee during the year under review. The Company made no other contracts with members of the Executive Board or Supervisory Board that would have required a resolution of the Supervisory Board.
The Supervisory Board closely examined the Executive Board’s corporate governance statement pursuant to the German Commercial Code, section 289a. We approved the statement with the combined SAP Group and SAP SE management report.
SAP SE AND CONSOLIDATED FINANCIAL REPORTS FOR 2015
KPMG audited the SAP SE and consolidated financial reports for 2015. The Annual General Meeting of Shareholders elected KPMG as the SAP SE and SAP Group auditor on Wednesday, May 20, 2015. The Supervisory Board proposed the appointment of KPMG on the recommendation of the Audit Committee. Before proposing KPMG to the Annual General Meeting of Shareholders as auditor for the year, the chairperson of the Supervisory Board and the Audit Committee obtained confirmation from KPMG that circumstances did not exist that might prejudice or raise any doubt concerning its independence as the Company’s auditor. In that connection, KPMG informed us of the volume of the services that were not part of the audit that it had either provided to the Group in the past year or was engaged to provide in the year to come. The Supervisory Board has agreed with KPMG that the auditor should report to the Supervisory Board and record in the auditor’s report any fact found during the audit that is inconsistent with the declaration given by the Executive Board and the Supervisory Board concerning implementation of the German Corporate Governance Code. KPMG examined the SAP SE financial statements prepared in accordance with the German Commercial Code, the consolidated financial statements prepared in accordance with International Financial Reporting Standards (IFRSs) as required by the German Commercial Code, section 315a, and the combined SAP Group and SAP SE management report, and certified them without qualification. The auditor thus confirmed that, in its opinion and based on its audit in accordance with the applicable accounting principles, the SAP SE and consolidated financial statements give a true and fair view of the net assets, financial position, and results of operations of SAP SE and the SAP Group. The auditor also confirmed that the combined SAP SE and SAP Group management report is consistent with the corresponding financial statements and as a whole gives a suitable view of the position of SAP SE and the SAP Group and of foreseeable opportunities and risks. KPMG had completed its audit of SAP’s internal control over financial reporting and certified without qualification that it complies with the applicable U.S. standards. The auditor states in its opinion that it considers SAP’s internal controls over financial reporting to be effective in all material respects. All Audit Committee and Supervisory Board members received the documents concerning the financial statements mentioned above, the audit reports prepared by KPMG, and the Executive Board’s proposal concerning the appropriation of retained earnings in good time.
On February 25, 2016, the Executive Board prepared the financial accounts of SAP SE and the Group for 2015, comprising the SAP SE financial statements, the consolidated financial statements, and the combined management report, and submitted them without delay to the Supervisory Board.
At the meeting of the Audit Committee on March 23, 2016, and at the meeting of the Supervisory Board on March 24, 2016, the Executive Board explained the financial statements of SAP SE and the SAP Group and its proposal concerning the appropriation of retained earnings. Members of the Executive Board answered questions from the Audit Committee and the Supervisory Board. At the Audit Committee meeting, they also explained the annual report on Form 20-F.
After the Executive Board had explained them, the Audit Committee and the Supervisory Board reviewed the financial statement documents in the light of KPMG’s audit reports. The representatives of the auditor who attended presented full reports on the audit and the results of the audit to the Audit Committee and Supervisory Board meetings and explained the audit report. The auditor also reported that it had not identified any material weaknesses in our internal control and risk-management systems for financial reporting. Both the Audit Committee and the Supervisory Board asked detailed questions
| | |
| To Our StakeholdersReport from the Supervisory Board | | 22 |
about the form, scope, and results of the audit. The Audit Committee reported to the Supervisory Board on its own review of the financial statements of SAP SE and the SAP Group, its discussions with the Executive Board and with the auditor, and its supervision of the financial reporting process. It confirmed that as part of its supervisory work, it had addressed the effectiveness of the SAP Group internal control, risk management, and internal auditing systems and found the systems to be effective.
The Committee also reported that KPMG had told it no circumstances had arisen that might give cause for concern about KPMG’s impartiality, and informed us about the services KPMG had provided that were not part of the audit. The Committee reported that it had examined the auditor’s independence, taking the non-audit services it had rendered into consideration, and stated that in the Committee’s opinion the auditor possessed the required degree of independence.
The Audit Committee and the Supervisory Board satisfied themselves that KPMG had conducted the audit properly. In particular, they concluded that both the audit reports and the audit itself fulfilled the legal requirements. On the basis of the report and the Audit Committee’s recommendation, the Supervisory Board approved the audit and, since there were no findings from our own examination, we gave our consent to the SAP SE financial statements, the consolidated financial statements, and the combined management report (including the Executive Board’s corporate governance statement pursuant to the German Commercial Code, section 289a). The financial statements and combined management report were thus formally adopted. The Supervisory Board’s opinion of the Company and the Group coincided with that of the Executive Board as set out in the combined management report. The Supervisory Board considered the proposal presented by the Executive Board concerning the appropriation of retained earnings. We had regard to the requirements of dividends policy, the effects on the liquidity of the Group, and the interests of the shareholders. We also discussed these matters with the auditor. We then endorsed the Executive Board’s proposal concerning the appropriation of retained earnings, in accordance with the Audit Committee’s recommendation. Finally, we approved this present report.
CHANGES ON THE SUPERVISORY AND EXECUTIVE BOARDS
In 2015, we appointed Michael Kleinemeier to the Executive Board of SAP SE with effect from November 1, 2015. He had already been a member of the Global Managing Board since January 2015.
The employee representatives Panagiotis Bissiritsas, Martin Duffek, Andreas Hahn, Margret Klein-Magar, Lars Lamade, Christine Regitz, Robert Schuschnig-Fowler, Sebastian Sick, and Pierre Thiollet took office as newly elected members of the Supervisory Board of SAP SE on May 20, 2015. The term of office of Catherine Bordelon, Christiane Kuntz-Mayr, Steffen Leskovar, Kurt Reiner, Mario Rosa-Bian, and Stefan Schulz expired on May 20, 2015, as the employee representatives on the first Supervisory Board of SAP SE had only been appointed for a term ending at the conclusion of the 2015 Annual General Meeting of Shareholders, in accordance with the SAP SE Employee Involvement Agreement. Hartmut Mehdorn resigned from the Supervisory Board in May 2015. Gesche Joost was appointed by the court to the Supervisory Board as shareholder representative on May 28, 2015.
We thank the departing members of the Supervisory Board for their valued service to this body.
The Supervisory Board also thanks the Executive Board and Global Managing Board, the managing directors of the Group companies, and all of the employees for their hard work and dedication in 2015. We would also like to thank our customers and partners. Without them, our Company’s success would not be possible.
For the Supervisory Board
Professor Hasso Plattner
(Chairperson)
| | |
| To Our StakeholdersReport from the Supervisory Board | | 23 |
Compensation Report1)
COMPENSATION FOR EXECUTIVE AND SUPERVISORY BOARD MEMBERS
This compensation report outlines the criteria that we applied for the year 2015 to determine compensation for Executive Board and Supervisory Board members, discloses the amount of compensation paid, and describes the compensation systems. It also contains information about share-based payment plans for Executive Board members, shares held by Executive Board and Supervisory Board members, and the directors’ dealings required to be disclosed in accordance with the German Securities Trading Act.
COMPENSATION FOR EXECUTIVE BOARD MEMBERS
Compensation System for 2015
The compensation for 2015 for Executive Board members is intended to reflect SAP’s company size and global presence as well as our economic and financial standing. The compensation level is internationally competitive to reward committed, successful work in a dynamic business environment.
The Executive Board compensation package is performance-based. It has three elements:
| ¡ | | A fixed annual salary element |
| ¡ | | A variable short-term incentive (STI) element to reward performance in the plan year |
| ¡ | | A variable long-term incentive (LTI) element tied to the price of SAP shares to reward performance over multiple years |
The Supervisory Board sets a compensation target for the sum of the fixed and the variable elements. It reviews, and if appropriate, revises, this compensation target every year. The review takes into account SAP’s business performance and the compensation paid to board members at comparable companies on the international stage. The amount of variable compensation depends on SAP’s performance against performance targets that the Supervisory Board sets for each plan year. The performance targets are key performance indicator (KPI) values aligned to the SAP budget for the plan year.
The following criteria apply to the elements of Executive Board compensation for 2015:
| ¡ | | The fixed annual salary element is paid as a monthly salary. |
| ¡ | | The variable STI element was determined under the STI 2015 plan. Under this plan, the STI compensation depends on the SAP Group’s performance against the predefined target values for three KPIs: non-IFRS constant currency cloud and software growth; non-IFRS constant currency operating margin increase; and non-IFRS constant currency new and upsell bookings. In addition, the STI 2015 plan provides for a discretionary element that allows the Supervisory Board, after the end of the fiscal year 2015, to address not only an Executive Board member’s individual performance, but also SAP’s performance in terms of market position, innovative power, customer satisfaction, employee satisfaction, attractiveness as an employer and the performance in our Business Network Group. |
Moreover, if there has been any extraordinary and unforeseeable event, the Supervisory Board can, at its reasonable discretion, retroactively adjust payouts up or down in the interest of SAP. For 2014, this discretion was applied.
On February 18, 2016, the Supervisory Board assessed SAP’s performance against the agreed targets and determined the amount of compensation payable under the STI 2015 plan. The STI 2015 plan pays out after the Annual General Meeting of Shareholders in May 2016.
| ¡ | | The variable LTI element was determined under the RSU Milestone Plan 2015. “RSU” stands for “restricted share unit.” This originally four-year plan was established in 2012 and focuses on the SAP share price and on certain objectives derived from our Company strategy for the years through 2015. For each of the four years, the members of the Executive Board are allocated a certain number of RSUs for the respective year based on a budget amount that was granted to each Executive Board member in 2012 already for each of the years 2012 through 2015. The number of RSUs allocated to each member for a given year is their target amount (an amount in euros) for that year divided by the SAP share price over a reference period (defined in the RSU Milestone Plan 2015 terms) at the beginning of the respective year. |
The number of RSUs an Executive Board member actually earns in respect of a given year depends on the Company performance against the objectives for that year (a year is a “performance period” in the plan). The objectives derive from SAP’s strategy for the period to 2015. The plan objectives relate to two KPIs: non-IFRS total revenue and non-IFRS operating profit.
| 1) | This compensation report is part of the audited management report |
| | |
| To Our StakeholdersCompensation Report | | 24 |
After the end of each fiscal year, the Supervisory Board assesses the Company’s performance against the objectives set for that year and determines the number of RSUs to be finally allocated and vested in each Executive Board member. No RSUs vest if minimum performance levels of 60%, predefined for each of the two KPIs, are not achieved. There is also a cap. Normally, the quantity of vested RSUs a member can attain in respect of a plan year is capped at 150% of their initial RSU allocation for that year.
The Company strategy underlying the RSU Milestone Plan 2015 focuses on where SAP aimed to be by the end of 2015, so the plan gave greater weight to performance against the KPI targets for 2015 (the final year of the plan) than against the targets for 2012 through 2014. Due to the adjustment factor, the number of vested RSUs a member of the Executive Board actually received for 2015 has been revised according to plan terms.
All vested RSUs are subject to a three-year holding period. The holding period commences at the end of the year for which the RSUs were allocated. The amount an RSU eventually pays out depends on the SAP share price at the end of the holding period. A member who leaves the Executive Board before the end of the plan retains their vested RSUs for completed plan years but does not retain any allocated but unvested RSUs for the year during which they leave. If a member leaves the Executive Board before the beginning of the subsequent year, no RSUs are finally allocated.
Each vested RSU entitles its holder to a (gross) payout corresponding to the price of one SAP share after the end of the three-year holding period. The applicable share price is measured over a reference period defined in the RSU Milestone Plan 2015 terms.
For the terms and details of the RSU Milestone Plan 2015, see the Notes to Consolidated Financial Statements section,Note (27). The number of RSUs issued initially to each member of the Executive Board under the RSU Milestone Plan 2015 for 2015 was decided by the Supervisory Board on February 12, 2015. The number of RSUs allocated finally to each member of the Executive Board under the RSU Milestone Plan 2015 for 2015 was determined by the Supervisory Board on February 18, 2016.
The contracts of Executive Board members Bill McDermott and Robert Enslin require that compensation payments are made in U.S. dollars. The contracts include clauses that determine the exchange rates for the translation of euro-denominated compensation into U.S. dollars.
Changes to Compensation System in 2016
| ¡ | | As the RSU Milestone Plan 2015 expired at the end of 2015, the Supervisory Board developed a new LTI 2016 plan for the Executive Board effective January 1, 2016 with the first grant occurring in March 2016. The purpose of the LTI 2016 is to reflect the operating profit target achievement, to ensure long-term retention of our Executive Board members and to reward a share price outperformance by SAP as compared to a group of its peers (Peer Group). |
| ¡ | | The LTI 2016 is an annual revolving remuneration element that is linked to the price of the SAP share. A grant amount determined by the Supervisory Board is converted into virtual shares, referred to as Share Units, by dividing the grant amount by the price of the SAP share (calculated on the basis of a defined average value). The grant amount is determined by the Supervisory Board in its discretion for each financial year at a level of between 80% and 120% of the contractual target amount; taking into account the achievement of the operating profit targets set for the preceding financial year. |
| ¡ | | The Share Units granted comprise 40% Retention Share Units (RSUs) and 60% Performance Share Units (PSUs). Both types of Share Units have a vesting period of four years. Each share unit that finally vests entitles its holder to a (gross) payout corresponding to the price of one SAP share after the end of the four-year holding period, but capped at three times the SAP share price applied for the conversion of the grant amount into Share Units. |
The number of PSUs, that finally vests depends on the performance of the SAP share. If the increase of price of the SAP share over the four-year vesting period of the PSUs exceeds the increase of a defined Peer Group Index over the same period, the number of PSUs will be increased by a percentage equal to the outperformance expressed as percentage points. This percentage will be doubled if, in addition to the outperformance over the Peer Group Index, the price of the SAP share at the end of the vesting period of the PSUs is higher than the price at the start of this period. The number of vested PSUs a member can attain in respect of a plan year is capped at 150% of their initial PSU allocation for that year. Conversely, if the increase of price of the SAP share over the four-year vesting period of the PSUs underperforms the Peer Group Index, the number of PSUs will be reduced by a percentage equal to the under-performance expressed as percentage points. No PSUs vest if the underperformance exceeds 50%.
Amount of Compensation for 2015
We present separately Executive Board compensation disclosures under three different compensation disclosure approaches:
| ¡ | | Compensation disclosures under a management view that follows the requirements of sections 314 and 315 of the German Commercial Code (Handelsgesetzbuch, or “HGB”) as specified in the German Accounting Standards (“GAS 17”) except that it allocates share-based compensation to the periods to which this compensation economically belongs |
| ¡ | | Compensation disclosures fully in accordance the requirements of sections 314 and 315 of the HGB as specified in GAS 17 |
| ¡ | | Compensation disclosures in accordance with the recommendations of the German Corporate Governance Code (“Code”) |
| | |
| To Our StakeholdersCompensation Report | | 25 |
I. Executive Board Members’ Compensation – Management View
Executive Board Members’ Compensation for 2015 – Management View
| | | | | | | | | | | | | | | | | | | | |
€ thousands | | Fixed Elements | | | Performance-Related Element | | | Compensation
for 2015 | |
| | | | | | | | | Short-Term
Incentive
Element | | | Long-Term
Incentive
Element | | | | |
| | | Salary | | | Other1) | | | STI | | | Share-Based
Payment
(RSU Milestone
Plan 2015)2) | | | | |
| Bill McDermott (CEO) | | | 1,150.0 | | | | 1,258.0 | | | | 2,743.5 | | | | 4,127.5 | | | | 9,279.0 | |
| Robert Enslin | | | 700.0 | | | | 103.3 | | | | 1,660.5 | | | | 1,480.6 | | | | 3,944.4 | |
| Michael Kleinemeier (from November 1, 2015) | | | 116.7 | | | | 0 | | | | 277.5 | | | | 315.0 | | | | 709.2 | |
| Bernd Leukert | | | 700.0 | | | | 11.7 | | | | 1,660.5 | | | | 1,480.6 | | | | 3,852.8 | |
| Luka Mucic | | | 700.0 | | | | 12.1 | | | | 1,660.5 | | | | 1,480.6 | | | | 3,853.2 | |
| Gerhard Oswald | | | 700.0 | | | | 22.4 | | | | 1,660.5 | | | | 1,480.6 | | | | 3,863.5 | |
| | | | | | | | | | | | | | | | | | | | |
| Total | | | 4,066.7 | | | | 1,407.5 | | | | 9,663.0 | | | | 10,364.9 | | | | 25,502.1 | |
Executive Board Members’ Compensation for 2014 – Management View
| | | | | | | | | | | | | | | | | | | | |
€ thousands | | Fixed Elements | | | Performance-Related Element | | | Compensation
for 20141) | |
| | | | | | | | | Short-Term
Incentive
Elements | | | Long-Term
Incentive
Element | | | | |
| | | Salary | | | Other1) | | | STI | | | Share-Based
Payment
(RSU Milestone
Plan 2015)2) | | | | |
| Bill McDermott (CEO) | | | 1,150.0 | | | | 861.4 | | | | 2,036.7 | | | | 4,040.5 | | | | 8,088.6 | |
| Jim Hagemann Snabe (co-CEO and member until May 21, 2014) | | | 448.8 | | | | 2,647.1 | | | | – | | | | – | | | | 3,095.9 | |
| Dr. Werner Brandt (until June 30, 2014) | | | 350.0 | | | | 1,418.8 | | | | – | | | | – | | | | 1,768.8 | |
| Robert Enslin (from May 4, 2014) | | | 462.9 | | | | 121.0 | | | | 817.3 | | | | 939.4 | | | | 2,340.6 | |
| Bernd Leukert (from May 4, 2014) | | | 462.9 | | | | 12.2 | | | | 817.3 | | | | 939.4 | | | | 2,231.8 | |
| Luka Mucic (from July 1, 2014) | | | 350.0 | | | | 4.3 | | | | 621.4 | | | | 729.0 | | | | 1,704.7 | |
| Gerhard Oswald | | | 700.0 | | | | 22.0 | | | | 1,232.7 | | | | 1,449.4 | | | | 3,404.1 | |
| Dr. Vishal Sikka (until May 4, 2014) | | | 291.7 | | | | 1,367.5 | | | | – | | | | – | | | | 1,659.2 | |
| | | | | | | | | | | | | | | | | | | | |
| Total | | | 4,216.3 | | | | 6,454.3 | | | | 5,525.4 | | | | 8,097.7 | | | | 24,293.7 | |
| 1) | Insurance contributions, benefits in kind, expenses for maintenance of two households, non-recurring payments, use of aircraft, tax, cash disbursement of short-term and long-term incentive elements, and discrete payments arising through application of the fixed exchange-rate clause. |
| 2) | Compensation attributable to Executive Board members for the respective year, including the respective year’s plan tranche of LTI 2015 based on the grant value at time of grant. |
| | |
| To Our StakeholdersCompensation Report | | 26 |
The share-based payment amounts included in the 2015 and 2014 compensation result from the following RSUs under the RSU Milestone Plan 2015.
Share-Based Payment Under RSU Milestone Plan 2015 (Grants for 2015)
| | | | | | | | | | | | |
| | | Grants for 2015 | |
| | | Quantity | | | Grant Value per Unit
at Time of Grant | | | Total Grant Value
at Time of Grant | |
| | | | | | € | | | € thousands | |
| Bill McDermott (CEO) | | | 77,099 | | | | 53.53 | | | | 4,128 | |
| Robert Enslin | | | 27,656 | | | | 53.53 | | | | 1,481 | |
| Michael Kleinemeier (from November 1, 2015) | | | 4,622 | | | | 68.16 | | | | 315 | |
| Bernd Leukert | | | 27,656 | | | | 53.53 | | | | 1,481 | |
| Luka Mucic | | | 27,656 | | | | 53.53 | | | | 1,481 | |
| Gerhard Oswald | | | 27,656 | | | | 53.53 | | | | 1,481 | |
| | | | | | | | | | | | |
| Total | | | 192,345 | | | | | | | | 10,365 | |
Share-Based Payment Under RSU Milestone Plan 2015 (Grants for 2014)
| | | | | | | | | | | | |
| | | Grants for 2014 | |
| | | Quantity | | | Grant Value per Unit
at Time of Grant | | | Total Grant Value
at Time of Grant | |
| | | | | | € | | | € thousands | |
| Bill McDermott (CEO) | | | 76,374 | | | | 52.90 | | | | 4,040.50 | |
| Dr. Werner Brandt (until June 30, 2014)1) | | | – | | | | – | | | | – | |
| Robert Enslin (from May 4, 2014) | | | 18,164 | | | | 51.72 | | | | 939.40 | |
| Bernd Leukert (from May 4, 2014) | | | 18,164 | | | | 51.72 | | | | 939.40 | |
| Luka Mucic (from July 1, 2014) | | | 13,811 | | | | 52.78 | | | | 729.00 | |
| Gerhard Oswald | | | 27,396 | | | | 52.90 | | | | 1,449.40 | |
| Dr. Vishal Sikka (until May 4, 2014)1) | | | – | | | | – | | | | – | |
| | | | | | | | | | | | |
| Total | | | 153,909 | | | | | | | | 8,097.70 | |
| 1) | The allocations for Werner Brandt (27,396 RSUs), and Vishal Sikka (27,396 RSUs) were forfeited at the end of their contracts. Consequently, they are not disclosed in the table above. |
II. Executive Board Members’ Compensation According to HGB and GAS 17
Under the compensation disclosure rules of the German HGB and GAS 17, share-based compensation awards are to be included in the compensation of the year of grant, even if the awards are tied to future years. Accordingly, and in contrast to, the compensation amounts disclosed under the management view above, the Executive Board compensation amounts determined under HGB and GAS 17 for 2014 and 2015:
| ¡ | | Exclude the share-based compensation awards granted to Executive Board members in 2012 for the years 2014 and 2015 as these were already included in the 2012 compensation |
| ¡ | | Include in full the grants for 2014 and 2015 made to Executive Board members appointed in 2014, that is, also including the grant for 2015 |
| ¡ | | Include the grant for 2015 made to Michael Kleinemeier who was appointed to the Executive Board in 2015 |
Including RSU Milestone Plan 2015 awards for 2015 granted in 2015 to Michael Kleinemeier (€263,200) upon his appointment to the Executive Board, the total Executive Board compensation for 2015 calculated as required under section 314 of the German
| | |
| To Our StakeholdersCompensation Report | | 27 |
Commercial Code amounts to €15,400,400, thereof: Bill McDermott €5,151,500; Robert Enslin €2,463,800; Michael Kleinemeier €657,400; Bernd Leukert €2,372,200; Luka Mucic €2,372,600; and Gerhard Oswald €2,382,900.
Including RSU Milestone Plan 2015 awards for 2014 and 2015 granted in 2014 to Robert Enslin (€1,574,800 for each of the two years); Bernd Leukert (2014: €1,280,000; 2015: €1,574,800); and Luka Mucic (2014: €1,141,000; 2015: €1,574,800) upon their appointment to the Executive Board, the total Executive Board compensation for 2014 calculated as required under section 314 of the German Commercial Code amounts to €23,216,200, thereof: Bill McDermott €4,048,100; Jim Hagemann Snabe €1,395,900; Werner Brandt €1,768,800; Robert Enslin €4,550,800; Bernd Leukert €4,147,200; Luka Mucic €3,691,500; Gerhard Oswald €1,954,700; and Vishal Sikka €1,659,200.
All amounts as determined under HGB and GAS 17, other than share-based compensation, are identical to the amounts disclosed under the management view above.
III. Executive Board Members’ Compensation According to the Code
Pursuant to the recommendations of the Code, the value of benefits granted for the year under review as well as the allocation, that is the amounts disbursed for the year under review, are disclosed below based on the reference tables recommended in the Code.
In contrast to the disclosure rules stipulated in the German HGB and GAS 17, the Code includes the service cost according to IAS 19 in the Executive Board compensation and requires the additional disclosure of the target value for the one-year variable compensation and the maximum and minimum compensation amounts achievable for the variable compensation elements. However, due to the payouts under the RSU Milestone Plan 2015 not being capped, there is no disclosure to be made for the maximum variable compensation amount achievable (marked as “NA” in the table below).
German Corporate Governance Code (Benefits Granted in 2014 and 2015)
| | | | | | | | | | | | | | | | | | | | | | | | | | | | | | | | | | | | | | | | | | | | | | | | |
€ thousands | | Bill McDermott
CEO | | | Robert Enslin
Member of the Executive Board | | | Michael Kleinemeier
Member of the Executive
Board (from November 1, 2015) | |
| | | 20151) | | | 2015
(Min) | | | 2015
(Max) | | | 20141) | | | 20151) | | | 2015
(Min) | | | 2015
(Max) | | | 20141) | | | 2015 | | | 2015
(Min) | | | 2015
(Max) | | | 2014 | |
| Fixed compensation | | | 1,150.0 | | | | 1,150.0 | | | | 1,150.0 | | | | 1,150.0 | | | | 700.0 | | | | 700.0 | | | | 700.0 | | | | 462.9 | | | | 116.7 | | | | 116.7 | | | | 116.7 | | | | – | |
| Fringe benefits2) | | | 1,258.0 | | | | 1,258.0 | | | | 1,258.0 | | | | 861.4 | | | | 103.3 | | | | 103.3 | | | | 103.3 | | | | 121.0 | | | | 0 | | | | 0 | | | | 0 | | | | – | |
| | | | | | | | | | | | | | | | | | | | | | | | | | | | | | | | | | | | | | | | | | | | | | | | |
| Total | | | 2,408.0 | | | | 2,408.0 | | | | 2,408.0 | | | | 2,011.4 | | | | 803.3 | | | | 803.3 | | | | 803.3 | | | | 583.9 | | | | 116.7 | | | | 116.7 | | | | 116.7 | | | | – | |
| One-year variable compensation | | | 1,860.0 | | | | 0 | | | | 3,371.3 | | �� | | 1,860.0 | | | | 1,125.8 | | | | 0 | | | | 2,040.5 | | | | 746.4 | | | | 188.1 | | | | 0 | | | | 340.9 | | | | – | |
| Multiyear variable compensation | | | | | | | | | | | | | | | | | | | | | | | | | | | | | | | | | | | | | | | | | | | | | | | | |
RSU Milestone Plan 2015 | | | – | | | | 0 | | | | NA | | | | – | | | | – | | | | 0 | | | | NA | | | | 939.4 | | | | 315.0 | | | | 0 | | | | NA | | | | – | |
| | | | | | | | | | | | | | | | | | | | | | | | | | | | | | | | | | | | | | | | | | | | | | | | |
| Total | | | 4,268.0 | | | | 2,408.0 | | | | NA | | | | 3,871.4 | | | | 1,929.1 | | | | 803.3 | | | | NA | | | | 2,269.7 | | | | 619.8 | | | | 116.7 | | | | NA | | | | – | |
| Service cost | | | 682.4 | | | | 682.4 | | | | 682.4 | | | | 646.8 | | | | 308.0 | | | | 308.0 | | | | 308.0 | | | | 148.1 | | | | 0 | | | | 0 | | | | 0 | | | | – | |
| | | | | | | | | | | | | | | | | | | | | | | | | | | | | | | | | | | | | | | | | | | | | | | | |
| Total | | | 4,950.4 | | | | 3,090.4 | | | | NA | | | | 4,518.2 | | | | 2,237.1 | | | | 1,111.3 | | | | NA | | | | 2,417.8 | | | | 619.8 | | | | 116.7 | | | | NA | | | | – | |
| | |
| To Our StakeholdersCompensation Report | | 28 |
German Corporate Governance Code (Benefits Granted in 2014 and 2015)
| | | | | | | | | | | | | | | | | | | | | | | | | | | | | | | | | | | | | | | | | | | | | | | | |
| € thousands | | Bernd Leukert
Member of the Executive Board | | | Luka Mucic
Member of the Executive Board | | | Gerhard Oswald
Member of the Executive Board | |
| | | 2015 | | | 2015
(Min) | | | 2015
(Max) | | | 2014 | | | 2015 | | | 2015
(Min) | | | 2015
(Max) | | | 2014 | | | 2015 | | | 2015
(Min) | | | 2015
(Max) | | | 2014 | |
| Fixed compensation | | | 700.0 | | | | 700.0 | | | | 700.0 | | | | 462.9 | | | | 700.0 | | | | 700.0 | | | | 700.0 | | | | 350.0 | | | | 700.0 | | | | 700.0 | | | | 700.0 | | | | 700.0 | |
| Fringe benefits2) | | | 11.7 | | | | 11.7 | | | | 11.7 | | | | 12.2 | | | | 12.1 | | | | 12.1 | | | | 12.1 | | | | 4.3 | | | | 22.4 | | | | 22.4 | | | | 22.4 | | | | 22.0 | |
| | | | | | | | | | | | | | | | | | | | | | | | | | | | | | | | | | | | | | | | | | | | | | | | |
| Total | | | 711.7 | | | | 711.7 | | | | 711.7 | | | | 475.1 | | | | 712.1 | | | | 712.1 | | | | 712.1 | | | | 354.3 | | | | 722.4 | | | | 722.4 | | | | 722.4 | | | | 722.0 | |
| One-year variable compensation | | | 1,125.8 | | | | 0 | | | | 2,040.5 | | | | 746.4 | | | | 1,125.8 | | | | 0 | | | | 2,040.5 | | | | 567.5 | | | | 1,125.8 | | | | 0 | | | | 2,040.5 | | | | 1,125.8 | |
| Multiyear variable compensation | | | | | | | | | | | | | | | | | | | | | | | | | | | | | | | | | | | | | | | | | | | | | | | | |
RSU Milestone Plan 2015 | | | – | | | | 0 | | | | NA | | | | 939.4 | | | | – | | | | 0 | | | | NA | | | | 729.0 | | | | – | | | | 0 | | | | NA | | | | 1,449.4 | |
| | | | | | | | | | | | | | | | | | | | | | | | | | | | | | | | | | | | | | | | | | | | | | | | |
| Total | | | 1,837.5 | | | | 711.7 | | | | NA | | | | 2,160.9 | | | | 1,837.9 | | | | 712.1 | | | | NA | | | | 1,650.8 | | | | 1,848.2 | | | | 722.4 | | | | NA | | | | 3,297.2 | |
| Service cost | | | 0 | | | | 0 | | | | 0 | | | | 0 | | | | 0 | | | | 0 | | | | 0 | | | | 0 | | | | 0 | | | | 0 | | | | 0 | | | | 0 | |
| | | | | | | | | | | | | | | | | | | | | | | | | | | | | | | | | | | | | | | | | | | | | | | | |
| Total | | | 1,837.5 | | | | 711.7 | | | | NA | | | | 2,160.9 | | | | 1,837.9 | | | | 712.1 | | | | NA | | | | 1,650.8 | | | | 1,848.2 | | | | 722.4 | | | | NA | | | | 3,297.2 | |
| 1) | The value of the fixed and one-year variable elements is subject to a contractual exchange-rate clause applied at the end of the year, so the amounts actually paid may be greater. |
| 2) | Insurance contributions, benefits in kind, expenses for maintenance of two households, use of aircraft, tax and discrete payments arising through application of the fixed exchange-rate clause. |
The total Executive Board compensation granted according to the Code amounted to €13,330,900 (2014: €23,302,200).
German Corporate Governance Code (Allocation)
| | | | | | | | | | | | | | | | | | | | | | | | |
| € thousands | | Bill McDermott
CEO | | | Robert Enslin
Member of the
Executive Board | | | Michael Kleinemeier
Member of the
Executive Board
(from November 1, 2015) | |
| | | 2015 | | | 2014 | | | 2015 | | | 2014 | | | 2015 | | | 2014 | |
| Fixed compensation | | | 1,150.0 | | | | 1,150.0 | | | | 700.0 | | | | 462.9 | | | | 116.7 | | | | – | |
| Fringe benefits1) | | | 1,258.0 | | | | 861.4 | | | | 103.3 | | | | 121.0 | | | | 0 | | | | – | |
| | | | | | | | | | | | | | | | | | | | | | | | |
| Total | | | 2,408.0 | | | | 2,011.4 | | | | 803.3 | | | | 583.9 | | | | 116.7 | | | | – | |
| One-year variable compensation | | | 2,036.7 | | | | 1,737.2 | | | | 817.3 | | | | – | | | | – | | | | – | |
| Multi-year variable compensation | | | | | | | | | | | | | | | | | | | | | | | | |
RSU Milestone Plan 2015 | | | – | | | | – | | | | – | | | | – | | | | – | | | | – | |
MTI | | | – | | | | 1,011.1 | | | | – | | | | – | | | | – | | | | – | |
SAP SOP 2011 | | | – | | | | – | | | | – | | | | – | | | | – | | | | – | |
SAP SOP 2010 | | | – | | | | – | | | | – | | | | – | | | | – | | | | – | |
SAP SOP 2009 | | | – | | | | 378.7 | | | | – | | | | – | | | | – | | | | – | |
| Other | | | – | | | | – | | | | – | | | | – | | | | – | | | | – | |
| | | | | | | | | | | | | | | | | | | | | | | | |
| Total | | | 4,444.7 | | | | 5,138.4 | | | | 1,620.6 | | | | 583.9 | | | | 116.7 | | | | – | |
| Service cost | | | 682.4 | | | | 646.9 | | | | 308.0 | | | | 148.1 | | | | 0 | | | | – | |
| | | | | | | | | | | | | | | | | | | | | | | | |
| Total | | | 5,127.1 | | | | 5,785.3 | | | | 1,928.6 | | | | 732.0 | | | | 116.7 | | | | – | |
| | |
| To Our StakeholdersCompensation Report | | 29 |
German Corporate Governance Code (Allocation)
| | | | | | | | | | | | | | | | | | | | | | | | |
€ thousands | | Bernd Leukert
Member of the
Executive Board | | | Luka Mucic
Member of the
Executive Board | | | Gerhard Oswald
Member of the
Executive Board | |
| | | 2015 | | | 2014 | | | 2015 | | | 2014 | | | 2015 | | | 2014 | |
| Fixed compensation | | | 700.0 | | | | 462.9 | | | | 700.0 | | | | 350.0 | | | | 700.0 | | | | 700.0 | |
| Fringe benefits1) | | | 11.7 | | | | 12.2 | | | | 12.1 | | | | 4.3 | | | | 22.4 | | | | 22.0 | |
| | | | | | | | | | | | | | | | | | | | | | | | |
| Total | | | 711.7 | | | | 475.1 | | | | 712.1 | | | | 354.3 | | | | 722.4 | | | | 722.0 | |
| One-year variable compensation | | | 817.3 | | | | – | | | | 621.4 | | | | – | | | | 1,232.7 | | | | 1,051.5 | |
| Multi-year variable compensation | | | | | | | | | | | | | | | | | | | | | | | | |
RSU Milestone Plan 2015 | | | – | | | | – | | | | – | | | | – | | | | – | | | | – | |
MTI | | | – | | | | – | | | | – | | | | – | | | | – | | | | 611.0 | |
SAP SOP 2011 | | | – | | | | – | | | | – | | | | – | | | | 1,126.7 | | | | – | |
SAP SOP 2010 | | | – | | | | – | | | | – | | | | – | | | | – | | | | 1,590.9 | |
SAP SOP 2009 | | | – | | | | – | | | | – | | | | – | | | | – | | | | – | |
| Other | | | – | | | | – | | | | – | | | | – | | | | – | | | | – | |
| | | | | | | | | | | | | | | | | | | | | | | | |
| Total | | | 1,529.0 | | | | 475.1 | | | | 1,333.5 | | | | 354.3 | | | | 3,081.8 | | | | 3,975.4 | |
| Service cost | | | 0 | | | | 0 | | | | 0 | | | | 0 | | | | 0 | | | | 0 | |
| | | | | | | | | | | | | | | | | | | | | | | | |
| Total | | | 1,529.0 | | | | 475.1 | | | | 1,333.5 | | | | 354.3 | | | | 3,081.8 | | | | 3,975.4 | |
| 1) | Insurance contributions, benefits in kind, expenses for maintenance of two households, use of aircraft, tax and discrete payments arising through application of the fixed exchange-rate clause. |
The total Executive Board compensation allocated according to the Code amounted to €13,116,700 (2014: €32,687,400).
END-OF-SERVICE BENEFITS
Regular End-of-Service Undertakings
Retirement Pension Plan
The following retirement pension agreements apply to the individual members of the Executive Board:
| ¡ | | Michael Kleinemeier, Bernd Leukert, Luka Mucic, and Gerhard Oswald receive a retirement pension when they reach the retirement age of 60 (62 for Board Members appointed after January 1, 2012) and retire from their Executive Board seat, or a disability pension if, before reaching the regular retirement age, they become subject to occupational disability or permanent incapacity. A surviving dependent’s pension is paid on the death of a former member of the Executive Board. The disability pension is 100% of the vested retirement pension entitlement and is payable until the beneficiary’s 60th birthday, after which it is replaced by a retirement pension. The surviving dependent’s pension is 60% of the retirement pension or vested disability pension entitlement at death. Entitlements are enforceable against SAP SE. Current pension payments are reviewed annually for adjustments and, if applicable, increased according to the surplus in the pension liability insurance. If service is ended before the retirement age of 60 (62 for Board Members appointed after January 1, 2012), pension entitlement is reduced in proportion as the actual length of service stands in relation to the maximum possible length of service. The applied retirement pension plan is contributory. The contribution is 4% of applicable compensation up to the applicable income threshold plus 14% of applicable compensation above the applicable income threshold. For this purpose, applicable compensation is 180% of annual base salary. The applicable income threshold is the statutory annual income threshold for the state pension plan in Germany (West), as amended from time to time. Originally, Gerhard Oswald was under a performance-based retirement plan. This plan was discontinued when SAP introduced a contributory retirement pension plan in 2000. His pension benefits are derived from any accrued entitlements on December 31, 1999, under performance-based pension agreements and a salary-linked contribution for the period commencing January 1, 2000. Gerhard Oswald’s rights to retirement pension benefits will increase by further annual contributions because he remains a member of the Executive Board after his 60th birthday until his scheduled retirement on December 31, 2016. |
| ¡ | | Bill McDermott has rights to future benefits under the portion of the pension plan for SAP America classified as “Non-Qualified Retirement Plan” according to the U.S. Employee Retirement Income Security Act (ERISA). The “Non-Qualified” pension plan of SAP America is a cash balance plan that on retirement provides either monthly pension payments or a lump sum. The pension becomes available from the |
| | |
| To Our StakeholdersCompensation Report | | 30 |
beneficiary’s 65th birthday. Subject to certain conditions, the plan also provides earlier payment or invalidity benefits. The “Non-Qualified” pension plan closed with effect from January 1, 2009. Interest continues to be paid on the earned rights to benefits within this plan.
SAP made contributions to a third-party pension plan for Bill McDermott (2015: €682,400; 2014: €646,800) and Robert Enslin (2015: €308,000; 2014: €148,100). SAP’s contributions are based on payments by Bill McDermott and Robert Enslin into this pension plan.
Total Defined Benefit Obligations (DBO) and the Total Accruals for Pension Obligations to Executive Board Members
| | | | | | | | | | | | | | | | | | | | | | | | |
| € thousands | | Bill Mc Dermott
(CEO) | | | Michael
Kleinemeier
(from
November 1,
2015)1) | | | Bernd Leukert1) | | | Luka Mucic1) | | | Gerhard
Oswald | | | Total | |
DBO January 1, 2014 | | | 1,042.7 | | | | – | | | | – | | | | – | | | | 5,816.5 | | | | 6,859.2 | |
Less plan assets market value January 1, 2014 | | | – | | | | – | | | | – | | | | – | | | | 4,651.3 | | | | 4,651.3 | |
| | | | | | | | | | | | | | | | | | | | | | | | |
| Accrued January 1, 2014 | | | 1,042.7 | | | | – | | | | – | | | | – | | | | 1,165.2 | | | | 2,207.9 | |
DBO change in 2014 | | | 169.8 | | | | – | | | | 123.2 | | | | 102.8 | | | | 1,404.9 | | | | 1,800.7 | |
Plan assets change in 2014 | | | – | | | | – | | | | 94.6 | | | | 67.8 | | | | 341.1 | | | | 503.5 | |
DBO December 31, 2014 | | | 1,212.5 | | | | – | | | | 123.2 | | | | 102.8 | | | | 7,221.4 | | | | 8,659.9 | |
Less plan assets market value December 31, 2014 | | | – | | | | – | | | | 94.6 | | | | 67.8 | | | | 4,992.4 | | | | 5,154.8 | |
| | | | | | | | | | | | | | | | | | | | | | | | |
| Accrued December 31, 2014 | | | 1,212.5 | | | | – | | | | 28.6 | | | | 35.0 | | | | 2,229.0 | | | | 3,505.1 | |
DBO change in 2015 | | | 170.0 | | | | 29.7 | | | | 129.2 | | | | 129.9 | | | | –171.2 | | | | 287.6 | |
Plan assets change in 2015 | | | – | | | | 25.4 | | | | 145.6 | | | | 138.0 | | | | 356.9 | | | | 665.9 | |
DBO December 31, 2015 | | | 1,382.5 | | | | 29.7 | | | | 252.4 | | | | 232.7 | | | | 7,050.2 | | | | 8,947.5 | |
Less plan assets market value December 31, 2015 | | | – | | | | 25.4 | | | | 240.2 | | | | 205.8 | | | | 5,349.3 | | | | 5,820.7 | |
| | | | | | | | | | | | | | | | | | | | | | | | |
| Accrued December 31, 2015 | | | 1,382.5 | | | | 4.3 | | | | 12.2 | | | | 26.9 | | | | 1,700.9 | | | | 3,126.8 | |
| 1) | The values shown here only reflect the pension entitlements that Michael Kleinemeier, Bernd Leukert and Luka Mucic will receive from the retirement pension plan for Executive Board members. |
The table below shows the annual pension entitlement of each member of the Executive Board on reaching the scheduled retirement age (60 for Executive Board members initially appointed before 2012 and 62 for Executive Board members initially appointed after January 1, 2012) based on entitlements from SAP under performance-based and salary-linked plans vested on December 31, 2015.
Annual Pension Entitlement
| | | | | | | | |
| € thousands | | Vested on
December 31,
2015 | | | Vested on
December 31,
2014 | |
| Bill McDermott (CEO)1) | | | 106.9 | | | | 94.0 | |
| Michael Kleinemeier (from November 1, 2015) | | | 0.7 | | | | – | |
| Bernd Leukert | | | 8.8 | | | | 3.5 | |
| Luka Mucic | | | 7.8 | | | | 2.6 | |
| Gerhard Oswald2) | | | 302.5 | | | | 279.4 | |
| 1) | The rights shown here for Bill McDermott refer solely to rights under the pension plan for SAP America. |
| 2) | Due to the extension of Gerhard Oswald’s contract beyond June 30, 2014, these values represent the retirement pension entitlement that he would receive after his current Executive Board contract expires on December 31, 2016, based on the entitlements vested on December 31, 2015 (December 31, 2014). |
These are vested entitlements. To the extent that members continue to serve on the Executive Board and that therefore more contributions are made for them in the future, pensions actually payable at the scheduled retirement age will be higher than the amounts shown in the table.
Postcontractual Non-Compete Provisions
During the agreed 12-month postcontractual non-compete period, each Executive Board member receives abstention payments corresponding to 50% of the final average contractual compensation as agreed in the respective contract on an individual basis. Any other occupational income generated by the Executive Board member will be deducted from their compensation in accordance with section 74c of the German Commercial Code.
| | |
| To Our StakeholdersCompensation Report | | 31 |
The following table presents the net present values of the postcontractual non-compete abstention payments. The net present values in the table reflect the discounted present value of the amounts that would be paid in the fictitious scenario in which the Executive Board members leave SAP at the end of their respective current contract terms and their final average contractual compensation prior to their departure equals the compensation in 2015. Actual postcontractual non-compete payments will likely differ from these amounts depending on the time of departure and the compensation levels and target achievements at the time of departure.
Net Present Values of the Postcontractual Non-Compete Abstention Payments
| | | | | | | | |
€ thousands | | Contract Term
Expires | | | Net Present
Value of
Postcontractual
Non-Compete
Abstention
Payment1) | |
| Bill McDermott (CEO) | | | June 30, 2017 | | | | 4,627.7 | |
| Robert Enslin | | | June 30, 2017 | | | | 1,967.2 | |
| Michael Kleinemeier (from November 1, 2015) | | | October 31, 2018 | | | | 349.6 | |
| Bernd Leukert | | | June 30, 2017 | | | | 1,921.5 | |
| Luka Mucic | | | June 30, 2017 | | | | 1,921.7 | |
| Gerhard Oswald | | | December 31, 2016 | | | | 1,928.9 | |
| | | | | | | | |
| Total | | | | | | | 12,716.6 | |
| 1) | For the purpose of this calculation, the following discount rates have been applied: Bill McDermott 0.18% (2014: 0.46%); Robert Enslin 0.18% (2014: 0.46%); Michael Kleinemeier 0.50%; Bernd Leukert 0.18% (2014: 0.46%); Luka Mucic 0.18% (2014: 0.46%); Gerhard Oswald 0.15% (2014: 0.38%). |
Early End-of-Service Undertakings
Severance Payments
The standard contract for all Executive Board members provides that on termination before full term (for example, where the member’s appointment is revoked, where the member becomes occupationally disabled, or in connection with a change of control), SAP SE will pay to the member the outstanding part of the compensation target for the entire remainder of the term, appropriately discounted for early payment. A member has no claim to that payment if they have not served SAP as a member of the Executive Board for at least one year or if they leave SAP SE for reasons for which they are responsible. Upon the appointment of Robert Enslin, Bernd Leukert, Luka Mucic, and Michael Kleinemeier to the Executive Board, the Supervisory Board abstained from the waiting period of one year due to their previous membership to the Global Managing Board.
If an Executive Board member’s appointment to the Executive Board expires or ceases to exist because of, or as a conse-quence of, change or restructuring, or due to a change of control, SAP SE and each Executive Board member has the right to terminate the employment contract within eight weeks of the occurrence by giving six months’ notice. A change of control is deemed to occur when a third party is required to make a mandatory takeover offer to the shareholders of SAP SE under the German Securities Acquisition and Takeover Act, when SAP SE merges with another company and becomes the subsumed entity, or when a control or profit transfer agreement is concluded with SAP SE as the dependent company. An Executive Board member’s contract can also be terminated before full term if their appointment as an Executive Board member of SAP SE is revoked in connection with a change of control.
Postcontractual Non-Compete Provisions
Abstention compensation for the postcontractual non-compete period as described above is also payable on early contract termination.
Permanent Disability
In case of permanent disability, the contract will end at the end of the quarter in which the permanent inability to work was determined. The Executive Board member receives the monthly basic salary for a further 12 months starting from the date the permanent disability is determined.
Payments to Former Executive Board Members
In 2015, we paid pension benefits of €1,580,000 to Executive Board members who had retired before January 1, 2015 (2014: €1,425,000). At the end of the year, the DBO for former Executive Board members was €32,758,000 (2014: €33,764,000). Plan assets of €26,716,000 are available to meet these obligations (2014: €25,584,000).
Executive Board Members’ Holdings of Long-Term Incentives
Members of the Executive Board hold or held share-based payment rights throughout the year under the RSU Milestone Plan 2015 and the SAP SOP 2010 (which were granted in previous years). For information about the terms and details of these programs, see the Notes to the Consolidated Financial Statements section,Note (27).
RSU Milestone Plan 2015
The table below shows Executive Board members’ holdings, on December 31, 2015, of RSUs issued to them under the RSU Milestone Plan 2015. The plan is a cash-settled long-term incentive scheme with a payout subsequent to a performance period of one year and an additional holding period of three years. The RSU Milestone Plan 2015 consists of four plan tranches to be issued with respect to the calendar years 2012 through 2015.
| | |
| To Our StakeholdersCompensation Report | | 32 |
RSU Milestone Plan 2015 (2015 Tranche)
| | | | | | | | | | | | | | | | | | | | | | | | |
Quantity of RSUs | | Holding on
January 1,
2015 | | | Grants in 2015 | | | Performance-
Related
Adjustment | | | Exercised
Units | | | Forfeited
Units | | | Holding on
December 31,
2015 | |
| Bill McDermott (CEO) | | | 255,050 | | | | 77,099 | | | | 36,568 | | | | – | | | | – | | | | 368,717 | |
| Robert Enslin | | | 14,148 | | | | 27,656 | | | | 12,329 | | | | – | | | | – | | | | 54,133 | |
| Michael Kleinemeier (from November 1, 2015) | | | 0 | | | | 4,622 | | | | 599 | | | | – | | | | – | | | | 5,221 | |
| Bernd Leukert | | | 14,148 | | | | 27,656 | | | | 13,922 | | | | – | | | | – | | | | 55,726 | |
| Luka Mucic | | | 10,757 | | | | 27,656 | | | | 13,474 | | | | – | | | | – | | | | 51,887 | |
| Gerhard Oswald | | | 91,490 | | | | 27,656 | | | | 13,117 | | | | – | | | | – | | | | 132,263 | |
| | | | | | | | | | | | | | | | | | | | | | | | |
| Total | | | 385,593 | | | | 192,345 | | | | 90,009 | | | | 0 | | | | 0 | | | | 667,947 | |
The holding of RSUs on December 31, 2015, which were issued and not forfeited in 2015, reflects the number of RSUs multiplied by the total target achievement. The total target achievement consists of the addition of the target achievement of the financial KPIs of 112.96% and the adjustment factor based on individual plan participation. The RSUs allocated in 2012 have a remaining term of 0.08 years; the RSUs allocated in 2013 have a remaining term of 1.08 years; the RSUs allocated in 2014 have a remaining term of 2.08 years; and the RSUs allocated in 2015 have a remaining term of 3.08 years.
RSU Milestone Plan 2015 (2014 Tranche)
| | | | | | | | | | | | | | | | | | | | | | | | |
Quantity of RSUs | | Holding on
January 1,
2014 | | | Grants in 2014 | | | Performance-
Related
Adjustment | | | Exercised
Units | | | Forfeited
Units | | | Holding on
December 31,
2014 | |
| Bill McDermott (CEO) | | | 195,562 | | | | 76,374 | | | | -16,886 | | | | – | | | | – | | | | 255,050 | |
| Dr. Werner Brandt (until June 30, 2014) | | | 70,151 | | | | 27,396 | | | | – | | | | – | | | | 27,396 | | | | 70,151 | |
| Gerhard Oswald | | | 70,151 | | | | 27,396 | | | | -6,057 | | | | – | | | | – | | | | 91,490 | |
| Dr. Vishal Sikka (until May 4, 2014)1) | | | 70,151 | | | | 27,396 | | | | – | | | | 70,151 | | | | 27,396 | | | | – | |
| Robert Enslin (from May 4, 2014) | | | 0 | | | | 18,164 | | | | -4,016 | | | | – | | | | – | | | | 14,148 | |
| Bernd Leukert (from May 4, 2014) | | | 0 | | | | 18,164 | | | | -4,016 | | | | – | | | | – | | | | 14,148 | |
| Luka Mucic (from July 1, 2014) | | | 0 | | | | 13,811 | | | | -3,054 | | | | – | | | | – | | | | 10,757 | |
| | | | | | | | | | | | | | | | | | | | | | | | |
| Total | | | 406,014 | | | | 208,701 | | | | -34,029 | | | | 70,151 | | | | 54,792 | | | | 455,743 | |
| 1) | According to the termination agreement with Vishal Sikka, the 2012 grants will be paid out after the close of the Annual General Meeting of Shareholders in 2016, based on a fixed share price of €52.96. The 2013 grants will be paid out after the close of the Annual General Meeting of Shareholders in 2017 based on a fixed share price of €58.69. |
The holding of RSUs on December 31, 2014, which were issued and not forfeited in 2014, reflects the number of RSUs multiplied by the 77.89% target achievement.
| | |
| To Our StakeholdersCompensation Report | | 33 |
RSU Milestone Plan 2015 (2013 Tranche)
| | | | | | | | | | | | | | | | | | | | | | | | |
Quantity of RSUs | | Holding on
January 1,
2013 | | | Grants in 2013 | | | Performance-
Related
Adjustment | | | Exercised
Units | | | Forfeited
Units | | | Holding on
December 31,
2013 | |
| Bill McDermott (co-CEO) | | | 127,425 | | | | 73,289 | | | | -5,152 | | | | – | | | | – | | | | 195,562 | |
| Jim Hagemann Snabe (co-CEO)1) | | | 127,425 | | | | 73,289 | | | | -5,152 | | | | 195,562 | | | | – | | | | – | |
| Dr. Werner Brandt | | | 45,709 | | | | 26,290 | | | | -1,848 | | | | – | | | | – | | | | 70,151 | |
| Gerhard Oswald | | | 45,709 | | | | 26,290 | | | | -1,848 | | | | – | | | | – | | | | 70,151 | |
| Dr. Vishal Sikka | | | 45,709 | | | | 26,290 | | | | -1,848 | | | | – | | | | – | | | | 70,151 | |
| | | | | | | | | | | | | | | | | | | | | | | | |
| Total | | | 391,977 | | | | 225,448 | | | | -15,849 | | | | 195,562 | | | | 0 | | | | 406,014 | |
| 1) | According to the termination agreement with Jim Hagemann Snabe, the 2012 and 2013 grants were paid out after the close of the Annual General Meeting of Shareholders on May 21, 2014, based on a fixed share price of €52.96 for the 2012 grants and €58.69 for the 2013 grants. |
The holding of RSUs on December 31, 2013, which were issued and not forfeited in 2013, reflects the number of RSUs multiplied by the 92.97% target achievement.
RSU Milestone Plan 2015 (2012 Tranche)
| | | | | | | | | | | | | | | | | | | | | | | | |
Quantity of RSUs | | Holding on
January 1,
2012 | | | Grants in 2012 | | | Performance-
Related
Adjustment | | | Exercised
Units | | | Forfeited
Units | | | Holding on
December 31,
2012 | |
| Bill McDermott (co-CEO) | | | – | | | | 95,414 | | | | 32,011 | | | | – | | | | – | | | | 127,425 | |
| Jim Hagemann Snabe (co-CEO) | | | – | | | | 95,414 | | | | 32,011 | | | | – | | | | – | | | | 127,425 | |
| Dr. Werner Brandt | | | – | | | | 34,226 | | | | 11,483 | | | | – | | | | – | | | | 45,709 | |
| Gerhard Oswald | | | – | | | | 34,226 | | | | 11,483 | | | | – | | | | – | | | | 45,709 | |
| Dr. Vishal Sikka | | | – | | | | 34,226 | | | | 11,483 | | | | – | | | | – | | | | 45,709 | |
| | | | | | | | | | | | | | | | | | | | | | | | |
| Total | | | – | | | | 293,506 | | | | 98,471 | | | | – | | | | – | | | | 391,977 | |
The holding on December 31, 2012, reflects the number of RSUs issued in 2012 multiplied by the 133.55% target achievement.
SAP SOP 2010
The table below shows Executive Board members’ holdings, on December 31, 2015, of virtual share options issued to them under the SAP SOP 2010 since its inception. The strike price for an option is 115% of the base price. The issued options have a term of seven years and can only be exercised on specified dates after the vesting period. The options issued in 2010 were exercisable beginning in September 2014 and the options issued in 2011 were exercisable beginning in June 2015.
| | |
| To Our StakeholdersCompensation Report | | 34 |
SAP SOP 2010 Virtual Share Options
| | | | | | | | | | | | | | | | | | | | | | | | | | | | | | | | | | | | |
| | | Year
Granted | | | Holding on
January 1, 2015 | | | Strike
Price per
Option | | | Rights
Exercised
in 2015 | | | Price on
Exercise
Date | | | Forfeited
Rights | | | Holding on
December 31, 2015 | |
| | | | | | Quantity of
Options | | | Remaining
Term in
Years | | | € | | | Quantity of
Options | | | € | | | Quantity of
Options | | | Quantity of
Options | | | Remaining
Term in
Years | |
| Bill McDermott | | | 2010 | | | | 135,714 | | | | 2.69 | | | | 40.80 | | | | – | | | | – | | | | – | | | | 135,714 | | | | 1.69 | |
| (CEO) | | | 2011 | | | | 112,426 | | | | 3.44 | | | | 48.33 | | | | – | | | | – | | | | – | | | | 112,426 | | | | 2.44 | |
| Gerhard Oswald | | | 2010 | | | | 0 | | | | – | | | | – | | | | 0 | | | | – | | | | – | | | | – | | | | – | |
| | | 2011 | | | | 68,284 | | | | – | | | | 48.33 | | | | 68,284 | | | | 64.83 | | | | – | | | | – | | | | – | |
| | | | | | | | | | | | | | | | | | | | | | | | | | | | | | | | | | | | |
| Total | | | | | | | 316,424 | | | | | | | | | | | | 68,284 | | | | | | | | – | | | | 248,140 | | | | | |
Total Expense for Share-Based Payment
Total expense for the share-based payment plans of Executive Board members was recognized as follows.
Total Expense for Share-Based Payment
| | | | | | | | |
€ thousands | | 2015 | | | 2014 | |
| Bill McDermott (CEO) | | | 12,291.1 | | | | 5,063.8 | |
| Robert Enslin | | | 1,851.2 | | | | 1,833.5 | |
| Michael Kleinemeier (from November 1, 2015) | | | 364.7 | | | | – | |
| Bernd Leukert | | | 2,208.6 | | | | 1,759.7 | |
| Luka Mucic | | | 2,148.5 | | | | 1,577.2 | |
| Gerhard Oswald | | | 3,445.6 | | | | 1,891.1 | |
| | | | | | | | |
| Total | | | 22,309.7 | | | | 12,125.3 | |
The expense is recognized in accordance with IFRS 2 (Share-Based Payments) and consists exclusively of obligations arising from Executive Board activities.
Shareholdings and Transactions of Executive Board Members
No member of the Executive Board holds more than 1% of the ordinary shares of SAP SE. Members of the Executive Board held a total of 45,309 SAP shares on December 31, 2015 (2014: 36,426 shares).
The table below shows transactions by Executive Board members and persons closely associated with them notified to SAP pursuant to the German Securities Trading Act, section 15a, in 2015.
Transactions in SAP Shares
| | | | | | | | | | | | |
| | | Transaction Date | | Transaction | | Quantity | | | Unit Price | |
| Bill McDermott (CEO) | | August 11, 2015 | | Purchase of ADRs | | | 2,000 | | | | US$71.5845 | |
| Robert Enslin | | August 26, 2015 | | Purchase of ADRs | | | 1,145 | | | | US$66.3099 | |
| Bernd Leukert | | May 7, 2015 | | Share sale | | | 1,595 | | | | €66.2364 | |
| | August 13, 2015 | | Share purchase | | | 830 | | | | €63.7290 | |
| Luka Mucic | | May 20, 2015 | | Share purchase | | | 700 | | | | €68.9990 | |
| Gerhard Oswald | | July 22, 2015 | | Share purchase | | | 930 | | | | €66.7100 | |
EXECUTIVE BOARD: OTHER INFORMATION
We did not grant any compensation advance or credit to, or enter into any commitment for the benefit of, any member of our Executive Board in 2015 or the previous year.
As far as the law permits, SAP SE and its affiliated companies in Germany and elsewhere indemnify and hold harmless their respective directors and officers against and from the claims of third parties. To this end, we maintain directors’ and officers’ (D&O) group liability insurance. The policy is annual and is renewed from year to year. The insurance covers the personal liability of the insured group for financial loss caused by its managerial acts and omissions. The current D&O policy includes an individual deductible for Executive Board members of SAP SE as required by section 93 (2) of the German Stock Corporation Act.
| | |
| To Our StakeholdersCompensation Report | | 35 |
COMPENSATION FOR SUPERVISORY BOARD MEMBERS
Compensation System
Supervisory Board members’ compensation is governed by our Articles of Incorporation, section 16. By resolution of our May 20, 2015, Annual General Meeting of Shareholders the section was changed from the compensation with fixed and performance-related components to a fixed compensation plus fixed amounts for membership in and chairing of committees.
Each member of the Supervisory Board receives, in addition to the reimbursement of their expenses, an annual basic compensation of €165,000. The chairperson receives €275,000 and the deputy chairperson €220,000.
For membership of the Audit Committee, Supervisory Board members receive additional fixed annual compensation of €16,500, and for membership of any other Supervisory Board committee €11,000, provided that the committee concerned has met in the year. The chairperson of the Audit Committee receives €27,500, and the chairpersons of the other committees receive €22,000. The fixed remuneration is payable after the end of the year.
Any members of the Supervisory Board having served for less than the entire year receive one-twelfth of the annual remuneration for each month of service commenced. This also applies to the increased compensation of the chairperson and the deputy chairperson(s) and to the remuneration for the chairperson and the members of a committee.
| | |
| To Our StakeholdersCompensation Report | | 36 |
Supervisory Board Members’ Compensation in 2015
| | | | | | | | | | | | | | | | | | | | | | | | | | | | |
€ thousands | | 2015 | | | 2014 | |
| | | Fixed
Compensation | | | Compensation
for
Committee
Work | | | Total | | | Fixed
Compensation | | | Compensation
for
Committee
Work | | | Variable
Compensation | | | Total | |
| Prof. Dr. h.c. mult. Hasso Plattner (chairperson) | | | 275.0 | | | | 66.0 | | | | 341.0 | | | | 100.0 | | | | 100.0 | | | | 150.0 | | | | 350.0 | |
| Margret Klein-Magar (deputy chairperson from May 20, 2015) | | | 215.4 | | | | 29.3 | | | | 244.8 | | | | 50.0 | | | | 30.0 | | | | 100.0 | | | | 180.0 | |
| Pekka Ala-Pietilä | | | 165.0 | | | | 27.5 | | | | 192.5 | | | | 50.0 | | | | 30.0 | | | | 100.0 | | | | 180.0 | |
| Panagiotis Bissiritsas | | | 165.0 | | | | 32.1 | | | | 197.1 | | | | 50.0 | | | | 20.0 | | | | 100.0 | | | | 170.0 | |
| Catherine Bordelon (until May 20, 2015) | | | 68.8 | | | | 0 | | | | 68.8 | | | | 25.0 | | | | 5.0 | | | | 50.0 | | | | 80.0 | |
| Martin Duffek (from May 20, 2015) | | | 110.0 | | | | 18.3 | | | | 128.3 | | | | NA | | | | NA | | | | NA | | | | NA | |
| Prof. Anja Feldmann | | | 165.0 | | | | 22.0 | | | | 187.0 | | | | 50.0 | | | | 20.0 | | | | 100.0 | | | | 170.0 | |
| Prof. Dr. Wilhelm Haarmann | | | 165.0 | | | | 44.0 | | | | 209.0 | | | | 50.0 | | | | 50.0 | | | | 100.0 | | | | 200.0 | |
| Andreas Hahn (from May 20, 2015) | | | 110.0 | | | | 14.7 | | | | 124.7 | | | | NA | | | | NA | | | | NA | | | | NA | |
| Christiane Kuntz-Mayr (deputy chairperson and member until May 20, 2015) | | | 91.7 | | | | 9.2 | | | | 100.8 | | | | 70.0 | | | | 20.8 | | | | 130.0 | | | | 220.8 | |
| Prof. Dr. Gesche Joost (from May 28, 2015) | | | 110.0 | | | | 11.0 | | | | 121.0 | | | | NA | | | | NA | | | | NA | | | | NA | |
| Lars Lamadé | | | 165.0 | | | | 22.0 | | | | 187.0 | | | | 50.0 | | | | 30.0 | | | | 100.0 | | | | 180.0 | |
| Steffen Leskovar (until May 20, 2015) | | | 68.8 | | | | 11.5 | | | | 80.2 | | | | 25.0 | | | | 12.5 | | | | 50.0 | | | | 87.5 | |
| Bernard Liautaud | | | 165.0 | | | | 22.0 | | | | 187.0 | | | | 50.0 | | | | 30.0 | | | | 100.0 | | | | 180.0 | |
| Dr. h. c. Hartmut Mehdorn (until May 15, 2015) | | | 68.8 | | | | 9.2 | | | | 77.9 | | | | 50.0 | | | | 20.0 | | | | 100.0 | | | | 170.0 | |
| Christine Regitz (from May 20, 2015) | | | 110.0 | | | | 14.7 | | | | 124.7 | | | | NA | | | | NA | | | | NA | | | | NA | |
| Dr. Kurt Reiner (until May 20, 2015) | | | 68.8 | | | | 9.2 | | | | 77.9 | | | | 50.0 | | | | 20.0 | | | | 100.0 | | | | 170.0 | |
| Mario Rosa-Bian (until May 20, 2015) | | | 68.8 | | | | 9.2 | | | | 77.9 | | | | 50.0 | | | | 15.0 | | | | 100.0 | | | | 165.0 | |
| Dr. Erhard Schipporeit | | | 165.0 | | | | 27.5 | | | | 192.5 | | | | 50.0 | | | | 35.0 | | | | 100.0 | | | | 185.0 | |
| Stefan Schulz (until May 20, 2015) | | | 68.8 | | | | 11.5 | | | | 80.2 | | | | 50.0 | | | | 30.8 | | | | 100.0 | | | | 180.8 | |
| Robert Schuschnig-Fowler (from May 20, 2015) | | | 110.0 | | | | 7.3 | | | | 117.3 | | | | NA | | | | NA | | | | NA | | | | NA | |
| Dr. Sebastian Sick (from May 20, 2015) | | | 110.0 | | | | 14.7 | | | | 124.7 | | | | NA | | | | NA | | | | NA | | | | NA | |
| Jim Hagemann Snabe | | | 165.0 | | | | 22.0 | | | | 187.0 | | | | 25.0 | | | | 10.0 | | | | 50.0 | | | | 85.0 | |
| Pierre Thiollet (from May 20, 2015) | | | 110.0 | | | | 7.3 | | | | 117.3 | | | | NA | | | | NA | | | | NA | | | | NA | |
| Inga Wiele (until July 6 , 2014) | | | NA | | | | NA | | | | NA | | | | 29.2 | | | | 14.6 | | | | 58.3 | | | | 102.1 | |
| Prof. Dr.-Ing. Dr.-Ing. E.h. Klaus Wucherer | | | 165.0 | | | | 16.5 | | | | 181.5 | | | | 50.0 | | | | 20.8 | | | | 100.0 | | | | 170.8 | |
| | | | | | | | | | | | | | | | | | | | | | | | | | | | |
| Total | | | 3,249.6 | | | | 478.5 | | | | 3,728.1 | | | | 924.2 | | | | 514.5 | | | | 1,788.3 | | | | 3,227.0 | |
In addition, we reimburse members of the Supervisory Board for their expenses and the value-added tax payable on their compensation.
In total, we received services from members of the Supervisory Board (including services from employee representatives on the Supervisory Board in their capacity as employees of SAP) in the amount of €1,282,800 (2014: €2,295,000). This amount includes fees paid to Linklaters LLP in Frankfurt am Main, Germany (which Supervisory Board member Wilhelm Haarmann is a partner of) of €224,500 (2014: €1,001,700).
LONG-TERM INCENTIVES FOR THE SUPERVISORY BOARD
We do not offer members share options or other share-based payment for their Supervisory Board work. Any share options or other share-based payment received by employee-elected members relate to their position as SAP employees and not to their work on the Supervisory Board.
| | |
| To Our Stakeholders Compensation Report | | 37 |
Shareholdings and Transactions of Supervisory Board Members
Supervisory Board chairperson Hasso Plattner and the companies he controlled held 90,248,789 SAP shares on December 31, 2015 (December 31, 2014: 107,442,743 SAP
shares), representing 7.346% (2014: 8.746%) of SAP’s share capital. No other member of the Supervisory Board held more than 1% of the SAP SE share capital at the end of 2015 or of the previous year. Members of the Supervisory Board held a total of 90,262,686 SAP shares on December 31, 2015 (December 31, 2014: 107,467,372 SAP shares).
The table below shows transactions by Supervisory Board members and persons closely associated with them notified to SAP pursuant to the German Securities Trading Act, section 15a, in 2015:
Transactions in SAP Shares
| | | | | | | | | | | | |
| | | Transaction Date | | Transaction | | Quantity | | | Unit Price | |
| Andreas Hahn | | May 28, 2015 | | Share purchase | | | 12 | | | € | 57.3600 | |
| | June 2, 2015 | | Share sale | | | 100 | | | € | 67.4170 | |
| | August 5, 2015 | | Share sale | | | 115 | | | € | 66.2200 | |
| | October 28, 2015 | | Share sale | | | 38 | | | € | 70.0100 | |
| Margret Klein-Magar | | May 7, 2015 | | Share sale | | | 120 | | | € | 66.2364 | |
| Hasso Plattner | | December 18, 2015 | | Share purchase | | | 2,444,816 | | | € | 72.9300 | |
| Hasso Plattner GmbH & Co. Beteiligungs-KG | | December 23, 2015 | | Compensation in kind
(granting party) | | | 87,803,973 | | | | 1 | ) |
| HP Vermögensverwaltungs GmbH & Co. KG | | December 23, 2015 | | Compensation in kind
(receiving party) | | | 87,803,973 | | | | 1 | ) |
| Sabine Plattner GmbH & Co. Beteiligungs-KG | | November 25, 2015 | | Share sale | | | 480,000 | | | | 2 | ) |
| Riitta Schuschnig-Fowler | | December 8, 2015 | | Share sale | | | 50 | | | € | 72.4500 | |
| Robert Schuschnig-Fowler | | December 8, 2015 | | Share sale | | | 35 | | | € | 72.6500 | |
| Ingrid van Skyhawk | | May 28, 2015 | | Share purchase | | | 11 | | | € | 57.3600 | |
| | June 2, 2015 | | Share sale | | | 75 | | | € | 67.4170 | |
| | August 4, 2015 | | Share sale | | | 122 | | | € | 65.6800 | |
| | November 18, 2015 | | Share sale | | | 90 | | | € | 73.7700 | |
| 1) | Compensation in kind of 87,803,973 shares, hypothetical volume of the transaction €6,299,935,062.75. |
| 2) | The notifying party concluded a contract with a bank acting as commission agent for the sale of 10,000 SAP shares per week. The sale will be carried out at the bank’s own discretion in the stock market or over the counter in the months December 2015 through November 2016. |
SUPERVISORY BOARD: OTHER INFORMATION
We did not grant any compensation advance or credit to, or enter into any commitment for the benefit of, any member of our Supervisory Board in 2015 or the previous year.
Hasso Plattner, the chairperson of the Supervisory Board, entered into a consulting contract with SAP after he joined the Supervisory Board in May 2003. The contract does not provide for any compensation. The only cost we incurred under the contract was the reimbursement of expenses.
As far as the law permits, we indemnify Supervisory Board members against, and hold them harmless from, claims brought by third parties. To this end, we maintain directors’ and officers’ (D&O) group liability insurance. The current D&O policy does not include an individual deductible for Supervisory Board members as envisaged in the German Corporate Governance Code.
| | |
| To Our StakeholdersCompensation Report | | 38 |
Responsibility Statement
To the best of our knowledge, and in accordance with the applicable reporting principles, the Consolidated Financial Statements give a true and fair view of the assets, finances, and operating results of the SAP Group, and the management report of the Group and SAP SE includes a fair review of the development and performance of the business and the position of the Group and SAP SE, together with a description of the principal opportunities and risks associated with the expected development of the Group and SAP SE.
Walldorf, February 25, 2016
SAP SE
Walldorf, Germany
Executive Board of SAP SE
| | | | |
| | | | |
Bill McDermott, CEO | | | | Robert Enslin |
| | | | |
Michael Kleinemeier | | | | Bernd Leukert |
| | | | |
Luka Mucic | | | | Gerhard Oswald |
| | |
| To Our StakeholdersResponsibility Statement | | 39 |
Auditor’s Opinion
TO SAP SE
Report on the Consolidated Financial Statements
We have audited the accompanying consolidated financial statements of SAP SE, Walldorf (‘SAP’ or ‘the Company’), and its subsidiaries, which comprise the consolidated statement of financial position as at December 31, 2015, consolidated income statement, consolidated statement of comprehensive income, consolidated statement of changes in equity, consolidated statement of cash flows, and notes, for the year then ended.
Executive Board’s Responsibility for the Consolidated Financial Statements
The Executive Board of SAP SE is responsible for the preparation of these consolidated financial statements. This responsibility includes preparing these consolidated financial statements in accordance with International Financial Reporting Standards (IFRS), as adopted by the EU, and the additional requirements of German commercial law pursuant to Section 315a (1) of the German Commercial Code [HGB], as well as IFRS as adopted by the International Accounting Standards Board, to give a true and fair view of the consolidated financial position of the Group and of its financial performance and cash flows in accordance with these regulations. The Executive Board is also responsible for the internal controls that the Executive Board determines are necessary to enable the preparation of consolidated financial statements that are free from material misstatement, whether due to fraud or error.
Auditor’s Responsibility
Our responsibility is to express an opinion on these consolidated financial statements based on our audit. We conducted our audit in accordance with Section 317 HGB and the generally accepted standards for the audit of financial statements promulgated by the German Institute of Public Auditors [IDW] and also in compliance with the International Standards on Auditing (ISA) and guidelines of the Public Company Accounting Oversight Board (United States).
Those standards require that we comply with ethical requirements and plan and perform the audit to obtain reasonable assurance about whether the consolidated financial statements are free from material misstatement.
An audit involves performing procedures to obtain audit evidence about the amounts and disclosures in the consolidated financial statements. The selection of audit procedures depends on the auditor’s professional judgment. This includes the assessment of the risks of material misstatement of the consolidated financial statements, whether due to fraud or error. In assessing those risks, the auditor considers the internal control relevant to the entity’s preparation of the consolidated financial statements that give a true and fair view. The aim of this is to plan and perform audit procedures that are appropriate in the given circumstances. An audit also includes evaluating the appropriateness of accounting policies used and the reasonableness of accounting estimates made by the Executive Board, as well as evaluating the overall presentation of the consolidated financial statements.
We believe that the audit evidence we have obtained is sufficient and appropriate to provide a basis for our audit opinion.
Audit Opinion
Pursuant to Section 322 (3) sentence 1 HGB we state that our audit of the consolidated financial statements has not led to any reservations.
In our opinion, based on the findings of our audit, the consolidated financial statements comply in all material respects with IFRSs, as adopted by the EU, and the additional requirements of German commercial law pursuant to Section 315a (1) HGB as well as IFRS as adopted by the International Accounting Standards Board and give a true and fair view of the consolidated financial position of the Group as at December 31, 2015, and of its financial performance and cash flows in accordance with these regulations.
Report on the Group Management Report
We have audited the accompanying Group Management Report of SAP SE combined with the Management Report of SAP SE (‘Group Management Report’) for the financial year ended December 31, 2015.
Executive Board’s Responsibility for the Group Management Report
The Executive Board of SAP SE is responsible for the preparation and fair presentation of the Group Management Report. This responsibility includes preparing the Group Management Report in accordance with the provisions of German commercial law under Section 315a (1) HGB, German Accounting Standards number 17 and 20 (GAS 17, GAS 20) and the International Financial Reporting Standard (IFRS) Practice Statement Management Commentary.
| | |
| To Our StakeholdersAuditor’s Opinion | | 40 |
Auditor’s Responsibility
Our responsibility is to express an opinion on this Group Management Report based on our audit. We conducted our audit in accordance with Section 317 (2) HGB and the generally accepted standards for the audit of group management reports promulgated by the German Institute of Public Auditors. Accordingly, we are required to plan and perform the audit of the group management report to obtain reasonable assurance about whether the group management report is consistent with the consolidated financial statements and the audit findings, as a whole provides a suitable view of the Group’s position and suitably presents the opportunities and risks of future development.
We believe that the audit evidence we have obtained is sufficient and appropriate to provide a basis for our audit opinion.
Audit Opinion
Pursuant to Section 322 (3) sentence 1 HGB, we state that our audit of the Group Management Report has not led to any reservations.
In our opinion, based on the findings of our audit of the consolidated financial statements and of the group management report, the group management report is consistent with the consolidated financial statements, and as a whole provides a suitable view of the Group’s position and suitably presents the opportunities and risks of future development.
Report on the System of Internal Control over Consolidated Financial Reporting pursuant to PCAOB
We have audited the system of internal control over consolidated financial reporting of SAP SE and its subsidiaries in place as at December 31, 2015. This control system is based on criteria set out in the Internal Control – Integrated Framework of the Committee of Sponsoring Organizations of the Treadway Commission (COSO) (version of 2013).
Executive Board’s Responsibility for the Internal Control System
SAP SE’s Executive Board is responsible for maintaining an effective system of internal control over consolidated financial reporting and assessing its effectiveness, which is included in the Executive Board’s report on the system of internal control over consolidated financial reporting.
A company’s system of internal control over consolidated financial reporting is a process designed to provide reasonable assurance regarding the reliability of financial reporting in the consolidated financial statements and the preparation of financial statements for external purposes in accordance with generally accepted accounting principles. A company’s system of internal control over consolidated financial reporting includes policies and procedures to (1) ensure an accounting system that in reasonable detail accurately and fairly reflects the transactions and dispositions of the company’s assets, (2) provide reasonable assurance that transactions are recorded as necessary to permit preparation of financial statements in accordance with generally accepted accounting principles, and (3) provide reasonable assurance regarding prevention or timely detection of unauthorized acquisition, use or disposition of the company’s assets that could have a material effect on the financial statements.
Because of its inherent limitations, internal control over financial reporting may not prevent or detect material misstatements. Also, projections of any evaluation of effectiveness to future periods are subject to the risk that controls may become inadequate because of changes in conditions, or that the degree of compliance with the policies or procedures may deteriorate.
Auditor’s Responsibility
Our responsibility is to express an opinion on the system of internal control over consolidated financial reporting based on our audit. We conducted our audit in accordance with the standards of the Public Company Accounting Oversight Board (United States). Those standards require that we plan and perform the audits to obtain reasonable assurance about whether effective internal control over consolidated financial reporting was maintained in all material respects. Our audit of internal control over consolidated financial reporting included obtaining an understanding of internal control over financial reporting, assessing the risk of material deficiencies in internal control, testing and evaluating the design and operating effectiveness of internal control based on this assessment, and performing such other procedures as we considered necessary in the circumstances.
We believe that the audit evidence we have obtained is sufficient and appropriate to provide a basis for our audit opinion.
Audit Opinion
In our opinion, SAP maintained effective internal control over consolidated financial reporting as at December 31, 2015 based on the criteria set out in the Internal Control – Integrated Framework issued by COSO (in the version of 2013).
Mannheim, February 25, 2016
KPMG AG
Wirtschaftsprüfungsgesellschaft
| | |
| Dr. Böttcher | | Weise |
| Wirtschaftsprüfer | | Wirtschaftsprüfer |
| [German Public Auditor] | | [German Public Auditor] |
| | |
| To Our StakeholdersAuditor’s Opinion | | 41 |
General Information About This Management Report
BASIS OF PRESENTATION
This combined group management report by the SAP Group (collectively, “we,” “us,” “our,” “SAP,” “Group,” or “Company”) and the management report of SAP SE have been prepared in accordance with sections 289, 315, and 315a of the German Commercial Code and German Accounting Standards (GAS) No. 17 and 20. The management report is also a management commentary complying with the International Financial Reporting Standards (IFRS) Practice Statement Management Commentary.
All of the information in this report relates to the situation as at December 31, 2015, or the fiscal year ended on that date, unless otherwise stated.
The report contains references to additional information in other parts of the SAP Integrated Report that is available online. This additional information is not part of the management report.
FORWARD-LOOKING STATEMENTS
This management report contains forward-looking statements and information based on the beliefs of, and assumptions made by, our management using information currently available to them. Any statements contained in this report that are not historical facts are forward-looking statements as defined in the U.S. Private Securities Litigation Reform Act of 1995. We have based these forward-looking statements on our current expectations, assumptions, and projections about future conditions and events. As a result, our forward-looking statements and information are subject to uncertainties and risks, many of which are beyond our control. If one or more of these uncertainties or risks materializes, or if management’s underlying assumptions prove incorrect, our actual results could differ materially from those described in or inferred from our forward-looking statements and information. We describe these risks and uncertainties in theRisk Management and Riskssection.
The words “aim,” “anticipate,” “assume,” “believe,” “continue,” “could,” “counting on,” “is confident,” “development,” “estimate,” “expect,” “forecast,” “future trends,” “guidance,” “intend,” “may,” “might,” “outlook,” “plan,” “project,” “predict,” “seek,” “should,” “strategy,” “want,” “will,” “would,” and similar expressions as they relate to us are intended to identify such forward-looking statements. Such statements include, for example, those made in theOperating Results section, our quantitative and qualitative disclosures about market risk pursuant to the International Financial Reporting Standards (IFRS), namely IFRS 7 and related statements in ourNotes to the Consolidated Financial Statementssection,Expected Developments and Opportunities section;Risk Management and Risks section; and other forward-looking information appearing in other parts of this report. To fully consider the factors that could affect our future financial results, both this report and our Annual Report on Form 20-F should be considered, as well as all of our other filings with the Securities and Exchange Commission (SEC). Readers are cautioned not to place undue reliance on these forward-looking statements, which speak only as of the date specified or the date of this report. We undertake no obligation to publicly update or revise any forward-looking statements as a result of new information that we receive about conditions that existed upon issuance of this report, future events, or otherwise unless we are required to do so by law.
This report includes statistical data about the IT industry and global economic trends that comes from information published by sources including International Data Corporation (IDC), a provider of market information and advisory services for the information technology, telecommunications, and consumer technology markets; the European Central Bank (ECB); and the International Monetary Fund (IMF). This type of data represents only the estimates of IDC, ECB, IMF, and other sources of industry data. SAP does not adopt or endorse any of the statistical information provided by sources such as IDC, ECB, IMF, or other similar sources that is contained in this report. In addition, although we believe that data from these sources is generally reliable, this type of data is imprecise. We caution readers not to place undue reliance on this data.
| | |
| Combined Management ReportGeneral Information About ThisManagement Report | | 43 |
Overview of the SAP Group
| ¡ | | SAP is the global leader in business application and analytics software. |
| ¡ | | SAP is the enterprise cloud company with the greatest number of users. |
| ¡ | | The SAP Group includes subsidiaries in all major countries and employs approximately 77,000 people. |
Founded in 1972, SAP today is the global leader in business application and analytics software in terms of market share and the market leader in digital commerce. Further, SAP is the enterprise cloud company with the greatest number of users and the fastest-growing major database company. Our continued growth over more than four decades is attributable to relentless innovation, a diverse portfolio, our ability to anticipate everchanging customer requirements, and a broad ecosystem of partners. With approximately 300,000 customers in over 180 countries, the SAP Group includes subsidiaries in all major countries and employs approximately 77,000 people.
SAP is headquartered in Walldorf, Germany; our legal corporate name is SAP SE. Our ordinary shares are listed on the Frankfurt Stock Exchange, the Berlin Stock Exchange and the Stuttgart Stock Exchange. The principal trading market for the ordinary shares is Xetra, the electronic dealing platform of Deutsche Börse AG. American Depositary Receipts (ADRs) representing SAP SE ordinary shares are listed on the New York Stock Exchange (NYSE), and currently each ADR represents one ordinary share. As at December 31, 2015, our market capitalization was €90.1 billion on the DAX and US$97.2 billion on the NYSE. SAP is a member of Germany’s DAX, the Dow Jones EURO STOXX 50, and the Dow Jones Sustainability Index.
Our company culture puts our customers’ success at the center of everything we do. With our vision to help the world run better and improve people’s lives, and with Run Simple as our operating principle, we focus on helping our customers master complexity, and innovate and transform to become a sustainable digital business.
We derive our revenue from fees charged to our customers for the use of our cloud solutions, for licensing of on-premise software products and solutions, and transaction fees for activity on our business networks. Additional sources of revenue are support, professional services, development, training, and other services.
As at December 31, 2015, SAP SE directly or indirectly controlled a worldwide group of 255 subsidiaries in more than 180 countries to distribute our products, solutions, and services. Distributorship agreements are in place with independent resellers in many countries.
Our subsidiaries perform tasks such as sales and marketing, consulting, research and development, cloud delivery, customer support, training, or administration. For a list of subsidiaries, associates, and other equity investments, see the Notes to the Consolidated Financial Statements section,Note (34).
| | |
| Combined Management ReportOverview of the SAP Group | | 44 |
Strategy and Business Model
| ¡ | | SAP offers a portfolio of solutions built around SAP HANA providing organizations with what they need to become sustainable digital businesses. |
| ¡ | | Our business helps create long-term value by addressing customers’ current and future needs. |
| ¡ | | We use both financial and non-financial indicators to measure our success. |
HELPING OUR CUSTOMERS REIMAGINE THEIR BUSINESSES
The world is experiencing unprecedented change that is transforming both our use of technology and society more broadly. People are connected in ways like never before. Entire industries have been disrupted by innovations that have brought the once unimaginable within reach. Technology trends such as hyperconnectivity, cloud computing, and Big Data go hand-in-hand with social and business trends that are changing how we live and work. Rapid urbanization, the sharing economy, enormous demographic change, and resource scarcity are demanding that leaders of tomorrow adapt to a world in which the pace of change continues to accelerate.
To remain competitive – and create a sustainable competitive advantage – businesses today must become sustainable digital businesses. In fact, experts across industries know that in the new digital economy, only the most adaptive businesses will prevail. SAP provides what is needed to become a digital business. Our enduring vision is to help the world run better and improve people’s lives. Our vision is not just relevant in this time of change and disruption – it is essential.
Complexity has become a problem of staggering proportions and stands in the way of digital transformation and innovation. It is what keeps companies from turning the trends of our time – from the explosion of data to a rapidly growing middle class – into business opportunities. Becoming a digital business means that companies must first cut through this complexity, as simplicity is a prerequisite for innovation. Companies must make their digital strategy a core part of their business strategy.
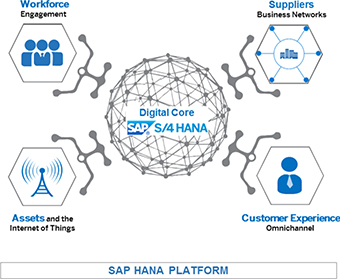
We enable organizations to tackle complexity by unlocking their ability to Run Simple. This principle guides everything we do and powers our customers’ transformation into digital businesses. We offer what is required to support this transformation – our deep experience as a leader in enterprise software for more than 40 years; our solutions and services; and our global reach, which includes a base of approximately 300,000 customers across 25 distinct industries; and an ecosystem of thousands of partners.
Our digital approach is built on two critical elements – our SAP Cloud portfolio and the SAP HANA platform. And our strategy to become THE cloud company powered by SAP HANA refers not just to our own transformation but that of our customers – and their customers.
| | |
| Combined Management ReportStrategy and Business Model | | 45 |
SAP Cloud powered by SAP HANA simplifies consumption and the user experience, while SAP HANA simplifies the IT landscape. SAP HANA enables business processes and analytics to run on the same platform, something that was simply not conceivable even five years ago.
With the release of SAP S/4HANA in 2015, our next-generation business suite, we have brought a new level of performance and simplicity to core business processes. And SAP HANA Cloud Platform is facilitating the development of a much broader and richer landscape of applications to support our customers’ needs.
With these capabilities, SAP partners with companies on every aspect of their digital transformation, helping them run better and improving people’s lives. As they become digital businesses, our customers are becoming more sustainable organizations by improving how they serve their customers, engaging and developing their workforce, increasing transparency of their suppliers’ social performance, using resources more efficiently, and interacting with local communities. Our global business networks expand the world that our customers operate in, connecting them with a vast ecosystem of partners that creates more efficient, powerful, and simpler ways of managing such key functions as procurement, travel, and workforce management.
Furthermore, we connect all of these realms to core business processes, such as finance and logistics, for a seamless and simplified customer experience. And we provide deep industry expertise to help our customers design an IT strategy that best supports their business strategy. While each of these capabilities would bring value on its own, together they set us apart – we are unique in our ability to guide customers on all essential elements of their digital transformation, enabling them to reimagine their business and then realize their vision for the future.
SAP has big ambitions. We measure our success across both financial and non-financial indicators: revenue growth, profitability, customer loyalty, and employee engagement. And we are creating value for our customers by helping them to navigate a changed world so that they can find business opportunities across social, environmental, and economic dimensions.
With our broad portfolio of solutions, we are convinced that we can position our customers for greater success in the digital world. SAP can help our customers better serve their customers with the sophisticated experiences they have come to expect; reach new markets as the world’s cities expand; find new customers as millions of people join the modern economy; and innovate in the face of resource scarcity and ever changing technologies. Most of all, we can help them understand and capitalize on the ways that technology and societal trends intersect, so that – along with SAP – they can not only become better organizations, but also help create a better world.
CREATING SOCIETAL IMPACT BY ENABLING OUR CUSTOMERS TO INNOVATE
As a software company that serves many of the world’s leading organizations, we have enormous opportunity to impact people and society by helping our customers innovate, run more efficiently, improve their IT security, and offer new products and services. For example, when major manufacturers gain greater transparency into their energy usage and create more efficient supply chains, they create a more positive impact on society while minimizing impact on environment. When banks offer mobile banking services to people who lack opportunities, they address inequality and promote economic growth. When healthcare companies utilize data in new and faster ways, they help patients gain access to potentially life-saving treatments.
In addition, at SAP and within our ecosystem, we support job creation and economic prosperity through demand for highly qualified workers to develop, sell, implement, and enhance our software for our customers. As our customers grow their own businesses, they also create opportunities for others through new products and services as well as economic growth.
At the heart of realizing these possibilities is our ability to help our customers cut through complexity and direct their resources to the work that matters most: new innovations that help the world run better and improve people’s lives. We work to create long-term value by addressing future needs as well as current ones, with the goal of helping to transform how people use software, conduct business, and live their lives.
To achieve our vision, SAP provides solutions and services to customers throughout the world based on our deep expertise in business processes across industries. As leader of the enterprise software market, we must continually adapt to new technology and business trends. For this reason, we rely on the people of SAP to drive our success – their intellectual and social capital provide us with key knowledge, expertise, and business relationships. Along with the financial capital of our investors, an engaged, highly skilled, and agile workforce is at the core of our business model.
Our organization must be as adaptable as our employees – and in recent years, we have made important shifts to our sales model to accommodate enormous changes in how companies use technology. In the past, our approach was focused on charging a one-time, upfront fee for a perpetual license to our software that is typically installed at the customer site. In addition, the customer usually concludes a support contract covering support, services, and software updates. As we have seen customer preferences evolve, we are increasingly delivering our solutions in the cloud through a software-as-a-service (SaaS) model. Depending on the solution, the customer pays either usage-based or periodic fees to use our software, which is hosted in the cloud, and accesses it over the Internet. Further, we receive transaction fees from business conducted over our business networks.
| | |
| Combined Management ReportStrategy and Business Model | | 46 |
Despite these shifts, we still rely on the strengths of our direct sales organizations to drive most business development. As a global company, we set our sales go-to-market strategies at the global level, with our regional subsidiaries then adapting and executing them. Our customer-facing employees, in close collaboration with sales support and marketing, drive demand, build pipeline, and enhance relationships with customers. Our marketing efforts cover large enterprises as well as small and midsize enterprises, with our broad portfolio of solutions and services addressing the needs of customers of all sizes across industries. Additional e-commerce and digitally native offerings further enable a low-touch or no-touch customer journey.
Our business model aligns with and supports our business strategy and puts us in a strong position to drive future growth. By helping organizations transform into digital businesses, we see enormous potential to increase our share of their overall IT spend while providing them with greater value. As our technology unlocks simplicity for our customers, they, in turn, bring new advances to their customers in areas that directly impact people’s lives.
OUR GOALS FOR SUSTAINED BUSINESS SUCCESS
We have strong ambitions for sustainable business success, both for our company and for our customers. We believe the most important indicators to measure this success comprise both financial and non-financial indicators: growth, profitability, customer loyalty, and employee engagement.
Growth: SAP uses various revenue metrics to measure growth. We expect full-year 2016 non-IFRS cloud subscriptions and support revenue to be in a range of €2.95 billion to €3.05 billion at constant currencies (2015: €2.30 billion). Further, we expect full-year 2016 non-IFRS cloud and software revenue to increase by 6% to 8% at constant currencies (2015: €17.23 billion). Looking beyond 2016, we have raised our 2017 ambition to reflect the current currency exchange rate environment and excellent business momentum. Assuming a stable exchange rate environment going forward, SAP now expects non-IFRS cloud subscriptions and support revenue in a range of €3.8 billion to €4.0 billion in 2017. By 2017, SAP continues to expect its rapidly growing cloud subscriptions and support revenue to be close to software license revenue and is expected to exceed software license revenue in 2018. Non-IFRS total revenue is expected to reach €23.0 billion to €23.5 billion in 2017. Our high-level 2020 ambitions remain unchanged, with 2020 non-IFRS cloud subscriptions and support revenue expected to reach €7.5 billion to €8.0 billion and total revenue is expected to be in a range of €26 billion to €28 billion.
Profitability: SAP expects full-year 2016 non-IFRS operating profit to be in a range of €6.4 billion to €6.7 billion at constant currencies (2015: €6.35 billion). We expect non-IFRS operating profit to be in a range of €6.7 billion to €7.0 billion in 2017 and to be in a range of €8.0 billion to €9.0 billion in 2020.
Customer loyalty: SAP uses the Customer Net Promoter Score (NPS) as a key performance indicator (KPI) to measure customer loyalty. We aim to achieve a Customer NPS score of 25% in 2016 (2015: 22.4%). Due to changes in sampling, resulting from ongoing efforts to implement the survey process holistically in recently acquired entities, the 2015 score is not fully comparable with the prior year score.
Employee engagement: We use the employee engagement index to measure motivation and loyalty of our employees, how proud they are of our company, and how strongly they identify with SAP. We remain committed to achieving 82% employee engagement score in 2016 (2015: 81%).
These four corporate objectives affirm our commitment to innovation and sustainability, and help us deliver on our vision.
In addition to primary KPIs, which directly measure our performance on our four goals, we manage a number of secondary performance indicators, which influence the primary KPIs in a variety of ways. You can read about some of these relationships, such as the link between our employee engagement and profitability, in the SAP Integrated Report online.
Our main objectives are presented with more detail throughout the report. For more information on our strategic goals, see thePerformance Management System section;Expected Developments and Opportunities section; Customers section; andEmployees and Social Investment section.
| | |
| Combined Management ReportStrategy and Business Model | | 47 |
Products, Research & Development, and Services
| ¡ | | In 2015, we unveiled SAP S/4HANA, a next-generation business suite designed to provide the digital core our customers need to run their entire business in a digitized world. |
| ¡ | | Our Business Network Group includes SAP Ariba, Concur, and SAP Fieldglass solutions, all supporting the interaction of companies with the outside world. |
| ¡ | | Our Global Service & Support organization guides companies at every stage of their digital transformation by accelerating innovation, driving simplification of business and IT, and ensuring business value is realized. |
UNLOCKING THE POTENTIAL OF DIGITAL TRANSFORMATION
For leading companies, the question is no longer whether they need to become a digital business, but how. The role of software has moved beyond enabling the realization of business strategy to becoming an intrinsic part of that strategy. In an increasingly complex landscape – with the amount of stored data doubling every 18 months – speed, innovation, and agility are the new differentiators. It is not just about doing yesterday’s work faster. Companies in every industry must take a unified approach to managing every aspect of their business, and they need solutions whose innovation matches their own ambitions to grow and win in the market.
In 2015, we unveiled one of the most important products in our history: SAP S/4HANA, our next-generation business suite, designed to provide the digital core our customers need to run their entire business in the new digital world. We expect SAP S/4HANA to drive our business for years to come, enabling companies to integrate their core business processes with running their key operations, from their supply chain to their workforce. With SAP S/4HANA, we provide companies a full business platform to reimagine their businesses and achieve the creation of their own next-generation products and services so critical in the digital economy.
SAP S/4HANA creates unique opportunities to simplify the IT landscape, helps reduce total cost of ownership with SAP HANA, and provides a simple and role-based user experience. Enterprises can now reduce their data footprint and work with larger data sets in one system to save hardware costs, operational costs, and time as well as reduce complexity.
After launching in February 2015, over 2,700 customers have chosen SAP S/4HANA, with approximately 100 customers live at the end of 2015.
DRIVING SIMPLICITY AND INNOVATION THROUGH SAP HANA AND SAP HANA CLOUD PLATFORM
SAP HANA remains at the center of our strategy to help our customers transform their businesses. The SAP HANA platform combines database, data processing, integration, and application platform capabilities in-memory. By providing advanced capabilities such as predictive analytics on the same architecture, it further simplifies application development and processing across Big Data sources and structures.
| | |
| Combined Management ReportProducts, Research & Development, and Services | | 48 |
The SAP HANA Vora engine adds a new dimension to these capabilities, allowing our customers to combine their business data with Big Data managed on Hadoop compute clusters. It simplifies ownership of Big Data and supports faster, interactive, and more precise decision making.
In addition to expanding our own portfolio, we are enabling others to develop a much broader landscape of applications through SAP HANA Cloud Platform, our strategic platform-as-a-service offering. Providing both ease and flexibility, this cloud platform allows our customers and partners to build, extend, run, and sell applications and services in the cloud. It includes infrastructure, data, and storage, as well as a toolbox of platform and application extension services. SAP HANA Cloud Platform also enables connectivity between SAP solutions, including on-premise software such as SAP Business Suite as well as software-as-a-service offerings such as SAP SuccessFactors solutions.
Building on our experience, we are developing a suite of SAP solutions for the Internet of Things (IoT). The functionalities of our SAP HANA Cloud Platform IoT services help accelerate development and deployment, as well as improve the ability to manage real-time IoT and machine-to-machine applications. To support the development of these new innovations, we continue to leverage our customer co-innovation framework, which helps us address the evolving digitization needs of our customers.
The road to becoming a digital business is unique to every organization. Our portfolio supports our customers wherever they are on their journey. We want to offer the broadest integration in the industry, with customers seamlessly connecting SAP and third-party software across a range of environments to reduce IT complexity. At the same time, our user experience provides both elegance and ease-of-use across multiple devices and interfaces. Customers also have the benefits of efficiency and flexibility through a variety of deployment models.
LAUNCHING SAP S/4HANA
SAP S/4HANA represents a huge step forward in simplifying how applications are built, consumed, and deployed. It provides real-time, mission-critical industry-specific business processes across organizations and lines of business. As a basis, enterprises can now support end-to-end operations across key business functions through a fully digitized enterprise management solution named SAP S/4HANA Enterprise Management.
A prime example of our innovations is SAP S/4HANA Finance, a comprehensive solution for the office of the CFO. This solution brings enhanced functionality to a range of key areas – from financial planning and analysis to collaborative finance operations. It also provides our customers with seamless flexibility, with deployment either on premise or in the cloud.
Beyond SAP S/4HANA Finance, the on-premise edition of SAP S/4HANA drives business value in other areas such as materials management as well as sales and distribution, among others, taking full advantage of a simplified data model and a responsive user experience.
INNOVATING FOR INDUSTRIES AND LINES OF BUSINESS
As the market leader in enterprise application software, we offer end-to-end solutions specific to 25 industries and 12 lines of business, localized by country and for companies of any size.
Industries
| | |
Industry Sector | | Industry Portfolio |
| Consumer | | SAP for Consumer Products |
| | SAP for Life Sciences |
| | SAP for Retail |
| | SAP for Wholesale Distribution |
| Discrete manufacturing | | SAP for Aerospace & Defense |
| | SAP for Automotive |
| | SAP for High Tech |
| | SAP for Industrial Machinery & Components |
| Energy and natural resources | | SAP for Chemicals |
| | SAP for Mill Products |
| | SAP for Mining |
| | SAP for Oil & Gas |
| | SAP for Utilities |
| Financial services | | SAP for Banking |
| | SAP for Insurance |
| Public services | | SAP for Defense & Security |
| | SAP for Healthcare |
| | SAP for Higher Education & Research |
| | SAP for Public Sector |
| Services | | SAP for Engineering, Construction & Operations |
| | SAP for Media |
| | SAP for Professional Services |
| | SAP for Sports & Entertainment |
| | SAP for Telecommunications |
| | SAP for Travel & Transportation |
| | |
| Combined Management ReportProducts, Research & Development, and Services | | 49 |
Lines of Business
| ¡ | | Sourcing and Procurement |
In addition, we are building other functional innovations that serve each line of business. For example:
Human capital management (HCM): Our HCM solutions, including SAP SuccessFactors solutions, help organizations increase the value of their total workforce by developing, managing, engaging, and empowering their people. These solutions address the full range of HR needs, from hiring the right people and managing contingent workers to simplifying the way people work. We focus on delivering a simple and intuitive user experience through mobile device or desktop.
Customer engagement and commerce (CEC): Our CEC solutions comprise SAP and SAP Hybris software that serve the commerce, marketing, sales, and service lines of business, enabling business-to-business and business-to-consumer companies to provide real-time, consistent, contextual, and relevant experiences to their customers. Regardless of channel or device, these solutions deliver personalized engagement based on context and proven industry expertise and therefore go beyond traditional customer relationship management, which no longer meets the needs of today’s consumer-driven market.
PROVIDING USERS WITH FREEDOM, FLEXIBILITY, AND ELEGANT DESIGN
We believe digital transformation must include a focus on the user experience, as expectations by our customers – and their customers – have risen enormously in recent years. For many, mobile has become the technology of choice, providing simple, always-on access to information, processes, and services. To that end, key mobile services such as app creation and management, security, and extensibility are available as part of SAP HANA Cloud Platform, giving our customers simple access to the technologies that support new business models.
Providing an elegant, intuitive user experience, SAP Fiori has evolved since its introduction in 2013 into the new user experience (UX) for SAP software. It reflects a broader shift in software design that puts as much focus on how people actually use technology as on specific features and functions. SAP Fiori offers innovative new features such as improved contextual interaction and action-oriented personal notifications. The updated design delivers improvements while staying consistent with our original UX principles of being role-based, responsive, simple, coherent, and delightful.
We were awarded the prestigious Red Dot Award for the SAP Fiori UX design concept in the Interaction Category in September 2015.
DELIVERING GREATER VALUE THROUGH THE POWER OF BUSINESS NETWORKS
In today’s hyperconnected business landscape, how companies interact with the outside world is undergoing profound change. At SAP, we are helping to lead this transformation through our business networks, which are helping drive innovation in key areas that impact an organization’s core operations. Our business network strategy is to bring the world’s vast network of partners, suppliers, and services to best-in-class solutions that fulfill the needs of specific lines of business – all within a few clicks. Moving far beyond basic automation, our network solutions are enabling new processes and outcomes for customers. They are also part of a new wave of solutions that are more consumer-friendly and business-ready than in the past.
We recognize that business applications today must deliver an effortless user experience while ensuring that information and data flow back into the business and across networks in a secure way. These applications serve to maintain compliance while enabling choice. They are designed for a more digital, highly mobile, and interconnected world, and help drive greater value for employees, organizations, and the vast networks of partners and individuals they rely on.
Today, our business network portfolio includes SAP Ariba, Concur, and SAP Fieldglass solutions. Each is a leading provider of cloud applications, services, and cloud networks through open platforms that connect internal business processes to a global ecosystem of partners.
The Ariba Network is a leading marketplace used by approximately two million companies to discover, connect, and collaborate over US$740 billion in commerce every year. The network connects companies across the full commerce process – from sourcing through payment settlement. It also provides insights and technology to help companies improve their operations – and to connect and collaborate in new ways that are only possible in a networked environment.
Concur Travel & Expense is the world’s leading travel and expense management system, with more than 32 million users. The Concur system goes beyond the basic automation of expense reports and provides visibility and insights that support better decision making for employee travel and spend, helping businesses to focus on what matters most.
| | |
| Combined Management ReportProducts, Research & Development, and Services | | 50 |
SAP Fieldglass solutions simplify the process of procuring and managing external workforce services. They provide visibility into service providers and non-employee workers and help improve compliance and cost control. As a centralized, single point of access to engage with more than 1.9 million external workers in approximately 130 countries, SAP Fieldglass solutions connect consultancies, staffing firms, independent contractors, and other service providers, so business users can procure services from anywhere in the world with just a few clicks. As an open platform, SAP Fieldglass also connects to financial, HR, payroll, and procurement systems.
Each of these three cloud network companies has made connecting to partners, suppliers, and services through an open platform a core part of their architecture and approach. Ultimately, we aim to go further, connecting all the world’s networks. We are working to create platforms for networks and services that will further transform the business landscape –with the purpose of creating new outcomes, services and experiences that make businesses run more simply and with greater opportunities for innovation.
PROVIDING REAL-TIME, ADVANCED ANALYTICS TO DRIVE BETTER DECISION MAKING
The speed of the digital economy demands that companies make informed decisions faster than ever before, as data can become obsolete in a matter of seconds. SAP HANA has vastly increased the efficiency with which our customers can use analytics to drive decision making. With transactions and analytics combined into a single in-memory platform, our customers can access a “single source of truth” for real-time planning, execution, reporting, analysis, and predictive modeling on very large volumes of data.
In 2015, we further simplified our offering with the introduction of the SAP Cloud for Analytics solution, a software as a service that aims to bring all analytics capabilities together for a richer user experience.
Based on SAP Cloud for Analytics, we also launched SAP Digital Boardroom, a multifaceted solution that offers executive decision makers new ease and elegance in accessing company data in real time, and the ability to engage in what-if queries and create visualizations. Designed to provide far greater transparency to board members, executives, and other decision makers, fully automated business intelligence capabilities in the solution not only improve the quality and speed of reporting, but also facilitate greater trust through more effective collaboration and decision making.
Whether in the cloud, on premise, or a combination of the two, our analytics solutions enable our customers to access immediate, actionable intelligence. Even as data volumes grow exponentially, companies can simplify their business processes and gain insights to better manage every aspect of their organization – from integrated planning to risk and compliance.
Among other features, key analytics solutions from SAP support:
| ¡ | | Trusted data discovery and agile visualization to bring reliable data to life in real time through intuitive visualizations |
| ¡ | | Advanced analytics to combine the power of predictive processing with intuitive modeling and advanced data visualization |
| ¡ | | Corporate performance management to set and track measurable performance objectives through planning, budgeting, forecasting, and financial consolidation tools |
RESEARCH AND DEVELOPMENT
With businesses shifting at an ever-accelerating pace towards digitalization and the cloud, leading our customers through change is more important than ever before. We do this every day by empowering our employees and collaborating with our customers to develop world-class software and next-generation solutions. SAP further strengthened our global research and development (R&D) efforts in 2015 by investing in our SAP Labs network and the new SAP Innovation Center Network.
Nearly all of our software products are developed at our 15 SAP Labs locations in 13 countries across the globe. This global reach means that we have access to leading talent worldwide; in addition, we can collaborate with top universities throughout the world and have access to major technology hubs as well as diverse and vibrant startup communities. By understanding trends in different regions, as well as the specific needs of our customers that operate there, SAP has a major strategic advantage in developing products and services for the future.
In addition to our SAP Labs, we also expanded from two SAP Innovation Center locations to an SAP Innovation Center Network of 10 locations across four continents. This network is a dedicated unit within our development organization that is responsible for identifying new markets for SAP and pioneering game-changing solutions using transformational technologies. Through the SAP Innovation Center Network, we can closely collaborate with customers, partners, and academia to explore trends such as machine learning and block chain, among others.
We have identified several key markets and opportunities that hold significant revenue potential and allow us to apply our unique capabilities. Currently, areas include future enterprise applications, personalized medicine, and smart cities. We are tackling a range of challenges facing these areas, from designing the future of business software to developing new approaches to treating cancer and helping decrease traffic congestion.
Our revitalized research organization has become an applied research entity with its main focus on machine learning for enterprise applications, personalized medicine, in-memory data management, and security. Our new research approach focuses sharply on potential business impact while collaborating with the best research institutions worldwide for selected topics.
| | |
| Combined Management ReportProducts, Research & Development, and Services | | 51 |
Our innovation stems from many places, and we draw on the ideas of our customers, partners, startups, academia, and, most importantly, our own employees. Our overarching goal is to foster organic innovation and support the transformation of great ideas into profitable business. In support of this vision, we established a Company-wide “intrapreneurship” program that enables employees to develop their ideas in an internal incubator at SAP.
In addition to our employees, our customers provide us with unique insights about their business models and digitization challenges. We also work with customers on co-innovation and custom development projects. Our partners and their solutions enhance these efforts in a range of ways, such as at our SAP Co-Innovation Lab locations, which support engagements ranging from strategic alliances to key proofs of concept.
R&D Investment
SAP’s strong commitment to R&D is reflected in our expenditures: In 2015, we increased our R&D expense (IFRS) by €515 million, to €2,845 million (2014: €2,331 million). We spent 13.7% of total revenue on R&D in 2015 (2014: 13.3%). Our non-IFRS R&D expense as a portion of total operating expenses declined slightly from 18.5% to 18.3% year-over-year.
At the end of 2015, our total full-time equivalent (FTE) count in development work was 20,938 (2014: 18,908). Measured in FTEs, our R&D headcount was 27% of total headcount (2014: 25%). Total R&D expense not only includes our own personnel costs but also the external cost of works and services from the providers and cooperation partners we work with to deliver and enhance our products. We also incur external costs for translating, localizing, and testing products, for obtaining certification for them in different markets, patent attorney services and fees, strategy consulting, and the professional development of our R&D workforce.
Research and Development (IFRS)
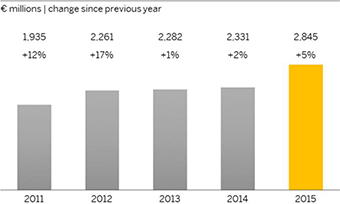
Patents
As a market leader in enterprise applications, SAP actively seeks intellectual property protection for innovations and proprietary information. Our software innovations continue to strengthen our market position in business solutions and services. Our investment in R&D has resulted in numerous patents. As at December 31, 2015, SAP holds a total of more than 7,224 validated patents worldwide. Of these, 893 were granted and validated in 2015.
While our intellectual property is important to our success, we believe our business as a whole is not dependent on any particular patent.
GUIDING OUR CUSTOMERS THROUGH EVERY STEP OF THEIR DIGITAL TRANSFORMATION
In addition to creating new solutions for the digital era, we recognize that we must partner with our customers to help them make the most of these innovations based on their unique needs and goals. Through our worldwide service and support, we guide companies at every stage of their digital transformation. We focus on creating and delivering strategies for our customers’ digital journey, accelerating innovation, driving simplification of business and IT, and ensuring that expected business value is realized and continuously optimized.
In 2015, we radically simplified how we engage with our customers and deliver services, greatly harmonizing our portfolio. Under the new SAP ONE Service approach, we also introduced a new commercial model providing one service portfolio, out of one global organization, and under one contract.
We see enormous potential for our customers to simplify their own businesses and seize new opportunities through SAP HANA, with SAP S/4HANA as their new digital core. For this reason, adoption of these innovations is a key pillar in our service and support strategy. To ensure the expected customer outcomes, we offer high-value services tailored to the various customer scenarios supporting the adoption of SAP S/4HANA:
| ¡ | | System conversion: Customers changing their current SAP system to SAP S/4HANA |
| ¡ | | Landscape transformation: Customers consolidating their landscape or carving out selected entities or processes into a system running SAP S/4HANA |
| ¡ | | New implementation: Customers migrating from a third- party legacy system or installation of SAP S/4HANA for a new customer |
In mid-2015, we also introduced SAP Activate, an innovation adoption framework to further support the fast and effective implementation of SAP S/4HANA. Offering a unique combination of SAP Best Practices and guided configuration, the new methodology provides ready-to-run digitized business processes optimized for SAP S/4HANA. It allows customers to flexibly choose the approach for their business needs, from a new implementation to an integration to a migration scenario.
| | |
| Combined Management ReportProducts, Research & Development, and Services | | 52 |
As they continue on their path to digitization, we work with large enterprise customers to forge a co-engineering and co-innovation relationship, so that they can influence and shape existing SAP solutions while gaining early access to product innovation. We help define future software solution standards together with our customers in comprehensive engagements and serve as a trusted advisor during delivery of innovative solutions for the future.
| | |
| Combined Management ReportProducts, Research & Development, and Services | | 53 |
Acquisitions
| ¡ | | Organic growth is the primary driver of our growth strategy. |
| ¡ | | We anticipate targeted and “fill-in” technology and software acquisitions, but no significant business combinations. |
| ¡ | | Sapphire Ventures continues to invest in the potential next generation of technology leaders worldwide. |
FOCUSING ON ORGANIC GROWTH AND TARGETING “FILL-IN” TECHNOLOGY THROUGH ACQUISITIONS
As SAP prepares itself for the new digital economy, we may make acquisitions that advance our strategic goals. In 2015, SAP acquired Multiposting, a French cloud-computing company with more than 80 employees that provides software for the automatic posting of jobs and internships on the Internet. Multiposting is based in Paris and a European leader in job posting solutions. With this acquisition, SAP plans to offer customers the best end-to-end cloud recruiting suite on the market, including the ability to efficiently post jobs to a global network of thousands of channels. The Multiposting solution will be available as part of the existing recruiting offering in our human capital management portfolio as well as in all its current forms – as a stand-alone product, as a Web service, and through import.
Organic growth is the primary driver of our growth strategy. We will invest in our own product development and technology innovation, improving the speed, number of projects, and innovations brought to market. We may also acquire targeted and “fill-in” technology and software to add to our broad solution offerings and improve coverage in key strategic markets. By doing so, we strive to best support our customers’ needs for simplified operations. We do not anticipate significant acquisitions in 2016 or 2017.
For more information about our acquisitions, see the Notes to the Consolidated Financial Statements section, Note (4).
INVESTING IN THE NEXT GENERATION OF TECHNOLOGY LEADERS THROUGH VENTURE ACTIVITIES
Through investments in venture capital funds managed by Sapphire Ventures (formerly called SAP Ventures), which comprises our consolidated investments in venture funds, SAP supports investments in entrepreneurs worldwide that aspire to build industry-leading businesses. Over the past 19 years, Sapphire Ventures has invested in more than 130 companies on five continents. Some of these companies have been acquired by third parties or have become publicly listed companies.
Sapphire Ventures aims to invest in the next generation of global category technology leaders as well as early-stage venture capital funds in enterprise and consumer technology. Specifically, Sapphire Ventures pursues opportunities in which it can help fuel growth by adding expertise, relationships, geographic reach, and capital. It invests globally with a particular focus on emerging companies and early stage funds in Europe, Israel, and the United States, as well as in Brazil, China, and India.
SAP’s total commitment to Sapphire Ventures is US$1.4 billion for use over the lifetime of its respective funds. Investments through the funds are currently ongoing.
For more information about our consolidated investment funds, see the Notes to the Consolidated Financial Statements section,Note (34).
| | |
| Combined Management ReportAcquisitions | | 54 |
Partner Ecosystem
| ¡ | | We work closely with partners to build, service, and sell SAP solutions for customers. |
| ¡ | | SAP has more than 13,000 partners worldwide. |
| ¡ | | Partners engaged with nearly 90% of new SAP customers in 2015. |
WORKING TOGETHER TO EXTEND SAP’S REACH IN THE MARKETPLACE
SAP proudly works with a network of more than 13,000 partners worldwide that helps companies of all sizes tackle complexity, grow their business, and Run Simple. SAP partners extend our reach in the marketplace and accelerate our Company’s growth, reaching thousands of new companies and millions of users each year. Our partner community plays an important role in our success, delivering expertise through pioneering solutions to provide our mutual customers tools to succeed in the developing digital and services-based economy.
Partners add tremendous value to both SAP and customers. They sell our software and cloud services, develop complementary software and solutions, and provide a broad portfolio of implementation and professional services that support customers across all geographies and industries.
Last year we saw outstanding growth in SAP’s partnerships. For example, partners were responsible for nearly 90% of new SAP software customers. SAP Business One, one of our core ERP solutions for small and midsize enterprises (SMEs) and sold exclusively through partners, reached its 50,000th customer. Nearly 55% of all SAP S/4HANA software license deals were won by partners and our cloud revenue through partners reported triple-digit growth. Together with our strategic technology and service partners, we created a number of powerful and compelling joint solutions and services that help customers transform and run their businesses simpler.
In the past year, SAP made several transformational moves designed to increase our joint success in the market, including:
| ¡ | | SAP SME Solutions: More than 80% of SAP customers are small and midsize enterprises (SMEs), and we support the majority through our partner networks and other channels. To boost our reach, we introduced this SME-specific portfolio marketing approach and a Run Simple advertising and demand generation campaign around our core ERP solutions for SMEs: SAP Business All-in-One, SAP Business ByDesign, and SAP Business One. As growing businesses transform in the digital economy, SAP has equipped partners with these and other tools, solutions, and programs they need to drive more demand in this important market. |
| ¡ | | SAP Anywhere debut: Late in 2015, we launched SAP Anywhere, a revolutionary cloud solution that allows small businesses to connect with customers anytime, anywhere on any device. It is now available in China and is expected to be introduced in the United Kingdom and the United States in 2016. SAP Anywhere represents a new opportunity for partners. With our commitment to “SAP Anywhere, Everywhere,” our partners can resell a complete cloud-based solution that manages marketing, sales, and e-commerce activities in one complete front-office system using real-time analytics. |
| ¡ | | SAP PartnerEdge program enhancements: To build stronger relationships and increased business opportunities, SAP introduced the next generation of its flagship partner program in 2015. Among the improvements, we reduced the number of partner engagement options from more than 30 to just four - Run, Build, Service, and Sell - making it easier for partners to engage with SAP. We streamlined processes and relaunched the SAP PartnerEdge Web site to give partners easier access to resources and real-time visibility into their SAP business. |
While reselling, implementation, and services are a large part of our ecosystem’s effort, SAP partner innovation on our technology platforms is also essential to market penetration. Partners develop their own applications and solutions called SAP Solution Extensions, which can then be sold to customers and other partners. These partner-developed solutions are tested, validated, approved, and supported by SAP.
| | |
| Combined Management ReportPartner Ecosystem | | 55 |
In addition, the SAP PartnerEdge program for Application Development, which grew to more than 1,100 active members in 2015, encourages partners to build complementary solutions on top of our technology platforms – and quickly monetize those solutions through SAP e-commerce channels.
Partners also embed SAP technology within their offerings under an original equipment manufacturer (OEM) licensing agreement, giving customers SAP software functionality backed by partner industry knowledge and expertise.
2015 was a seminal year for our partner managed cloud business, where our partner recruitment and enablement success has expanded the number of customers benefiting from the flexibility, rapid time to value, and pay-as-you-go economics of a managed cloud with enterprise-class SAP solutions.
SAP will continue to drive business growth through partners in 2016, continuing to identify and recruit key partners and develop the innovative programs and initiatives that fuel our mutual success.
| | |
| Combined Management ReportPartner Ecosystem | | 56 |
Customers
| ¡ | | SAP helps customers Run Simple for more sustainable business models. |
| ¡ | | The Customer Engagement Initiative offers customers early insight into planned innovations, so they can influence new developments. |
| ¡ | | We saw strong customer wins in every region. |
HELPING CUSTOMERS RUN SIMPLE
When SAP customers Run Simple, it improves their ability ultimately to become best-run businesses that create more sustainable business models – which, in turn, help us ensure our own long-term viability. That is why we strive to provide more than just software and services; we continually engage with our customers at every stage – not only during the sales and implementation phases, but also through the sharing of best practices and innovations.
One example of this strategy is our Customer Engagement Initiative. This program offers customers early insight into certain aspects of our planned innovations, so they can influence new developments. In addition, it offers customers the opportunity to network on topics of mutual interest. These networking opportunities take place at a variety of global events, including the SAPPHIRE NOW, SAP Select, SAP Forum, and SAP TechEd conferences, as well as virtual events.
CUSTOMER FOCUS REFLECTED IN CUSTOMER NET PROMOTER SCORE
Customer loyalty is one of our four Company-wide strategic objectives, along with growth, profitability, and employee engagement. In 2015, our combined on-premise and cloud Customer NPS is 22.4% (2014: 19.1%). Due to changes in sampling, resulting from ongoing efforts to implement the survey process holistically in recently acquired entities, the 2015 score is not fully comparable with the prior year’s score.
Our goal continues to be to best support our customers’ success and the success of SAP. For example, we are expanding on the insights provided by our surveys through root cause analysis to gain a better understanding of customer problems, why they happened, and what needs to be done to prevent those problems from happening again.
Our combined on-premise and cloud NPS target for 2016 is 25%, 2.6 percentage points above our 2015 achievement.
For more information about the Customer NPS, see thePerformance Management System section and theNon-Financial Notes section of the SAP Integrated Report 2015 online.
STRONG CUSTOMER DEMAND
Our strategy focuses on offering solutions and services to help customers Run Simple today and tomorrow. To do so, we offer a spectrum, from complete suites to applications that are lean, focused, quick to implement, and highly mobile. In 2015, we saw customers embrace this strategy by licensing or subscribing to the full range of SAP software, from comprehensive solutions for large enterprises to the latest mobile apps.
Some examples by region include the following customers:
NORTH AMERICA AND LATIN AMERICA (AMERICAS) REGION
| ¡ | | Adobe, a multinational computer software company, has chosen the SAP Hybris Billing solution as its monetization and billing platform to support a new SaaS business model. Adobe seeks to support fast subscription-revenue growth on a flexible and scalable platform, while significantly reducing time to launch innovative and flexible offers and promotions. |
| ¡ | | American Airlines, the world’s largest airline, has selected several SAP SuccessFactors solutions, as well as the SAP HANA Enterprise Cloud service and SAP HANA Cloud Platform. The company’s goal is to enhance service to its employees and reduce operating costs while remaining focused on its core business. |
| ¡ | | Eastman Kodak, a technology company focused on imaging, selected the SAP S/4HANA suite to help reduce total cost of IT ownership. In addition, Kodak plans to establish an IT infrastructure to position its organization for future growth and innovation. |
| | |
| Combined Management ReportCustomers | | 57 |
| ¡ | | Hewlett Packard Enterprise Company (HPE) has committed to and invested in implementing one of the largest installations of the SAP S/4HANA Finance solution for their internal foundational platform to support its digital transformation. With SAP S/4HANA, HPE aims to be better able to take advantage of real-time access to operational and financial data with the goal of improving the speed of decision making and operating more efficiently; reducing the time for financial close; and delivering actionable intelligence throughout its business. The aim is to ensure HPE becomes more competitive in the marketplace. |
| ¡ | | Stara, a leader in agricultural machinery headquartered in Brazil, selected SAP HANA Cloud Portal, as well as SAP Cloud for Customer, SAP SuccessFactors Employee Central, and SAP SuccessFactors Talent Management solutions. Stara expects to simplify its business processes while improving sales efficiency through greater control of critical company information. |
ASIA PACIFIC JAPAN (APJ) REGION
| ¡ | | Boryung Pharmaceutical, one of the leading pharmaceutical manufacturers in South Korea, selected SAP S/4HANA Finance for its simple user experience, simple business solution, simple data model, and shorter go-live time. |
| ¡ | | La Trobe University in Australia went live with SAP S/4HANA Finance. As one of the first organizations globally to adopt SAP S/4HANA Finance, La Trobe University aims to benefit from instant insight across financial and operational processes to drive value through planning, analysis, prediction and simulation. They have a term for it; they call it “Brilliant Basics”. |
| ¡ | | Lenovo Group, a multinational computer technology company, is expanding its HANA footprint by moving data from all systems to the SAP HANA platform. |
| ¡ | | PetroChina, China’s largest oil producer, has implemented SAP Business Warehouse powered by SAP HANA and SAP BusinessObjects Business Intelligence solutions. Since the system went live in late July, HR reporting performance is three to ten times faster than before, which has empowered HR director-level management to make strategic decisions based on Big Data analysis. |
| ¡ | | St Barbara, an Australian-based, ASX-listed gold producer and explorer, selected the SAP SuccessFactors Performance & Goals solution. The solution has enabled St Barbara to replace its paper-based performance management process with a cloud-based solution that also supports its offshore locations. |
EUROPE, MIDDLE EAST, AND AFRICA (EMEA) REGION
| ¡ | | ArcelorMittal, the world’s leading steel and mining company, selected SAP S/4HANA to streamline business processes, improve productivity, and decrease costs. The company seeks to enhance its position by serving an increasingly strong innovation agenda around the world. |
| ¡ | | Bosch Group, a leading global supplier of technology and services, has chosen SAP S/4HANA to rebuild its IT infrastructure, seeking a simplified and harmonized landscape that helps them offer connected services to customers. |
| ¡ | | City Football Group (CFG) is the owner of a number of soccer-related businesses including Manchester City Football Club and New York City Football Club. CFG and its clubs will implement a wide variety of cloud-based solutions powered by SAP HANA with the aim of simplifying their worldwide operations, scaling their business, increasing productivity, and enhancing the fan experience. |
| ¡ | | E.ON Group has chosen the limited runtime edition of SAP HANA; SAP Mobile Platform; and SAP SuccessFactors HCM Suite. The company, which is splitting into two entities, seeks to streamline its system landscape, replace homegrown software, and reduce its on-premise footprint. |
| ¡ | | Hydro, a global aluminium company based in Norway, selected SAP S/4HANA to “replatform” and renew its IT system landscape. With the suite, Hydro expects to have access to real time information, thereby running at optimal efficiency and safety, which are key elements of its strategic vision. |
HELPING CUSTOMERS INVEST
To help companies invest in SAP solutions and associated services and hardware, SAP Payment services offers customers payment plans. SAP Payment services can help preserve liquidity, provide an alternative to credit from customers’ existing banking relationships, and balance their budgetary priorities, while giving them the flexibility to choose their preferred solution.
| | |
| Combined Management ReportCustomers | | 58 |
Performance Management System
| ¡ | | In addition to our primary financial and non-financial measures, we use several other performance measures. |
| ¡ | | We use planning and control processes to manage the compilation of our key measures. |
| ¡ | | Our management additionally uses non-IFRS financial information to get more transparency on our past performance and our anticipated future results. |
We use various performance measures to help manage our performance with regard to our primary financial goals, which are growth and profitability, and our primary non-financial goals, which are customer loyalty and employee engagement. We view growth and profitability as indicators for our current performance, while customer loyalty and employee engagement are indicators for our future performance.
MEASURES WE USE TO MANAGE OUR FINANCIAL PERFORMANCE
Changes to Income Statement Structure
Starting with the first quarter of 2015, we modified our overall income statement structure. We reclassified premium support revenue and related costs to the respective services line items to align our financial reporting with the changes in our services business. We further simplified and clarified the labeling of several income statement line items. For more information about the changes to our income statement structure, see the Notes to the Consolidated Financial Statements section,Note (3).
Measures We Use to Manage Our Operating Financial Performance
In 2015, we used the following key measures to manage our operating financial performance:
| ¡ | | Cloud subscriptions and support revenue (non-IFRS): This revenue driver comprises the main revenues of our fast- growing cloud business. We generate cloud subscriptions and support revenue when we provide software functionality in a cloud-based infrastructure (SaaS) to our customers, when we provide our customers with access to a cloud-based infrastructure to develop, run, and manage applications (PaaS) and also when we provide hosting services for software hosted by SAP (IaaS). Cloud subscriptions and support revenue is also generated when providing additional premium cloud subscription support beyond the regular support, which is embedded in the basic cloud subscription fees as well as business network services to our customers. We use the measure cloud subscriptions and support revenue (non-IFRS) both at actual currency and at constant currency. |
| ¡ | | Cloud and software revenue (non-IFRS): We use cloud and software revenue (non-IFRS) and constant currency cloud and software revenue (non-IFRS) to measure our revenue growth. Our cloud and software revenue includes cloud subscriptions and support revenue plus software licenses and support revenue. Cloud subscriptions and support revenue and software revenue are our key revenue drivers because they tend to affect our other revenue streams. Generally, customers that buy software licenses also enter into related support contracts, and these generate recurring revenue in the form of support revenue after the software sale. Support contracts cover standardized support services that comprise unspecified future software updates and enhancements. Software licenses revenue as well as cloud subscriptions and support revenue also tend to stimulate services revenue earned from providing customers with professional services, premium support services, training services, messaging services, and payment services. |
| | |
| Combined Management ReportPerformance Management System | | 59 |
| ¡ | | New cloud bookings:For our cloud activities, we also look at new cloud bookings. This measure reflects the committed order entry from new customers and from incremental purchases by existing customers for offerings that generate cloud subscriptions and support revenue. In this way, it is an indicator for cloud-related sales success in a given period and for secured future cloud subscriptions and support revenue. We focus primarily on the average contract value variant of the new cloud bookings measure that takes into account annualized amounts for multiyear contracts. Additionally, we monitor the total contract value variant of the new cloud bookings measure that takes into account the total committed order entry amounts regardless of contract durations. There are no comparable IFRS measures for these bookings metrics. |
| ¡ | | Operating profit (non-IFRS): We use operating profit (non- IFRS) and constant currency operating profit (non-IFRS) to measure our overall operational process efficiency and overall business performance. See below for more information on the IFRS and non-IFRS measures we use. |
| ¡ | | Cloud subscriptions and support gross margin (non-IFRS): We use our cloud subscriptions and support gross margin (non-IFRS) to measure our process efficiency and our performance in our cloud business. Cloud subscriptions and support gross margin (non-IFRS) is the ratio of our cloud subscriptions and support gross profit (non-IFRS) to cloud subscriptions and support revenue (non-IFRS), expressed as a percentage. |
Measures We Use to Manage Our Non-Operating Financial Performance
We use the following measures to manage our non-operating financial performance:
| ¡ | | Financial income, net: This measure provides insight into the return on liquid assets and capital investments and the cost of borrowed funds. To manage our financial income, net, we focus on cash flow, the composition of our liquid assets and capital investment portfolio, and the average rate of interest at which assets are invested. We also monitor average outstanding borrowings and associated finance costs. |
| ¡ | | Days Sales Outstanding (DSO): We manage working capital by controlling the days sales outstanding (DSO) for operating receivables (defined as the average number of days from the raised invoice to cash receipt from the customer). |
Measures We Use to Manage Overall Financial Performance
We use the following measures to manage our overall financial performance:
| ¡ | | Earnings per share (EPS):EPS measures our overall performance because it captures all operating and non- operating elements of profit as well as income tax expense. It represents the portion of profit after tax allocable to each SAP share outstanding. EPS is influenced not only by our operating and non-operating business as well as income taxes but also by the number of shares outstanding. |
| ¡ | | Effective tax rate: We define our effective tax rate as the ratio of income tax expense to profit before tax, expressed as a percentage. |
| ¡ | | Operating, investing, and financing cash flows and free cash flow: Our consolidated statement of cash flows provides insight as to how we generated and used cash and cash equivalents. When applied in conjunction with the other primary financial statements, it provides information that helps us evaluate the changes of our net assets, our financial structure (including our liquidity and solvency), and our ability to affect the amounts and timing of cash flows to adapt to changing circumstances and opportunities. We use our free cash flow measure to determine the cash flow remaining after all expenditures required to maintain or expand our organic business have been paid off. This measure provides management with supplemental information to assess our liquidity needs. We calculate free cash flow as net cash from operating activities minus purchases (other than purchases made in connection with business combinations) of intangible assets and property, plant, and equipment. |
MEASURES WE USE TO MANAGE OUR NON-FINANCIAL PERFORMANCE
In 2015, we used the following key measures to manage our non-financial performance in the areas of employee engagement, customer loyalty and leadership trust:
| ¡ | | Employee Engagement Index: We use this index to measure the motivation and loyalty of our employees, how proud they are of our company, and how strongly they identify with SAP. The index is derived from surveys conducted among our employees. Applying this measure is recognition that our growth strategy depends on engaged employees. |
| ¡ | | Customer Net Promoter Score (NPS): This score measures the willingness of our customers to recommend or promote SAP to others. It is derived from our annual customer survey that identifies, on a scale of 0-10, whether a customer is loyal and likely to recommend SAP to friends or colleagues, is neutral, or is unhappy. We introduced this measure in 2012, as we are convinced that we can achieve our financial goals only when our customers are loyal to, and satisfied with, SAP and our solutions. To derive the Customer NPS, we start with the percentage of “promoters” of SAP – those who give us a score of 9 or 10 on a scale of 0-10. We then subtract the percentage of “detractors” – those who give us a score of 0 to 6. The method ignores “passives,” who give us a score of 7 or 8. Due to changes in sampling, resulting from ongoing efforts to implement the survey process holistically in recently acquired entities, the 2015 score is not fully comparable with the prior year’s score. |
| ¡ | | Leadership Trust Score: We use this score to further enhance accountability and to measure our collective effort to foster a work environment based on trust. It is derived from a question in our annual global employee survey that gauges employees’ trust in our leaders. We measure leadership trust by using the Net Promoter Score (NPS) methodology. |
| | |
| Combined Management ReportPerformance Management System | | 60 |
VALUE-BASED MANAGEMENT
Our holistic view of the performance measures described above, together with our associated analyses, comprises the information we use for value-based management. We use planning and control processes to manage the compilation of these key measures and their availability to our decision makers across various management levels.
SAP’s long-term strategic plans are the point of reference for our other planning and controlling processes, including a multiyear plan through 2020. We identify future growth and profitability drivers at a highly aggregated level. This process is intended to identify the best areas in which to target sustained investment. Next, we evaluate our multiyear plans for our support and development functions and break down the customer-facing plans by sales region. Based on our detailed annual plans, we determine the budget for the respective year. We also have processes in place to forecast revenue and profit on a quarterly basis, to quantify whether we expect to realize our financial goals, and to identify any deviations from plan. We continuously monitor the concerned units in the Group to analyze these developments and define any appropriate actions.
Our entire network of planning, control, and reporting processes is implemented in integrated planning and information systems, based on SAP software, across all organizational units so that we can conduct the evaluations and analyses needed to make informed decisions.
NON-IFRS FINANCIAL MEASURES CITED IN THIS REPORT
As in previous years, we provided our 2015 financial outlook on the basis of certain non-IFRS measures. Therefore, this report contains a non-IFRS based comparison of our actual performance in 2015 against our outlook in theFinancial Performance: Review and Analysissection.
Reconciliations of IFRS to Non-IFRS Financial Measures for 2015 and 2014
The following table reconciles our IFRS financial measures to the respective and most comparable non-IFRS financial measures of this report for each of 2015 and 2014. Due to rounding, the sum of the numbers presented in this table might not precisely equal the totals we provide.
| | |
| Combined Management ReportPerformance Management System | | 61 |
Reconciliation of IFRS to Non-IFRS Financial Measures for the Years Ended December 31
| | | | | | | | | | | | | | | | | | | | | | | | | | | | | | | | |
€ millions, unless otherwise stated | | 2015 | | | 2014 | |
| | | IFRS | | | Adj. | | | Non-IFRS | | | Currency
Impact | | | Non-IFRS
Constant
Currency | | | IFRS | | | Adj. | | | Non-IFRS | |
| Revenue measures | | | | | | | | | | | | | | | | | | | | | | | | | | | | | | | | |
Cloud subscriptions and support | | | 2,286 | | | | 10 | | | | 2,296 | | | | -297 | | | | 1,999 | | | | 1,087 | | | | 14 | | | | 1,101 | |
Software licenses | | | 4,835 | | | | 1 | | | | 4,836 | | | | -255 | | | | 4,581 | | | | 4,399 | | | | 0 | | | | 4,399 | |
Software support | | | 10,093 | | | | 0 | | | | 10,094 | | | | -678 | | | | 9,416 | | | | 8,829 | | | | 5 | | | | 8,834 | |
Software licenses and support | | | 14,928 | | | | 2 | | | | 14,930 | | | | -933 | | | | 13,997 | | | | 13,228 | | | | 5 | | | | 13,233 | |
| | | | | | | | | | | | | | | | | | | | | | | | | | | | | | | | |
Cloud and software | | | 17,214 | | | | 11 | | | | 17,226 | | | | -1,230 | | | | 15,996 | | | | 14,315 | | | | 19 | | | | 14,334 | |
| | | | | | | | | | | | | | | | | | | | | | | | | | | | | | | | |
Services | | | 3,579 | | | | 0 | | | | 3,579 | | | | -276 | | | | 3,304 | | | | 3,245 | | | | 0 | | | | 3,245 | |
| | | | | | | | | | | | | | | | | | | | | | | | | | | | | | | | |
| Total revenue | | | 20,793 | | | | 11 | | | | 20,805 | | | | -1,505 | | | | 19,299 | | | | 17,560 | | | | 19 | | | | 17,580 | |
| | | | | | | | |
| Operating expense measures | | | | | | | | | | | | | | | | | | | | | | | | | | | | | | | | |
Cost of cloud subscriptions and support | | | -1,022 | | | | 232 | | | | -789 | | | | | | | | | | | | -481 | | | | 88 | | | | -393 | |
Cost of software licenses and support | | | -2,291 | | | | 283 | | | | -2,008 | | | | | | | | | | | | -2,076 | | | | 258 | | | | -1,818 | |
Cost of cloud and software | | | -3,313 | | | | 516 | | | | -2,797 | | | | | | | | | | | | -2,557 | | | | 346 | | | | -2,211 | |
Cost of services | | | -3,313 | | | | 180 | | | | -3,133 | | | | | | | | | | | | -2,716 | | | | 125 | | | | -2,590 | |
| | | | | | | | | | | | | | | | | | | | | | | | | | | | | | | | |
Total cost of revenue | | | -6,626 | | | | 696 | | | | -5,930 | | | | | | | | | | | | -5,272 | | | | 471 | | | | -4,801 | |
| | | | | | | | | | | | | | | | | | | | | | | | | | | | | | | | |
Gross profit | | | 14,167 | | | | 707 | | | | 14,874 | | | | | | | | | | | | 12,288 | | | | 490 | | | | 12,778 | |
Research and development | | | -2,845 | | | | 202 | | | | -2,643 | | | | | | | | | | | | -2,331 | | | | 127 | | | | -2,204 | |
Sales and marketing | | | -5,401 | | | | 449 | | | | -4,952 | | | | | | | | | | | | -4,304 | | | | 170 | | | | -4,134 | |
General and administration | | | -1,048 | | | | 116 | | | | -932 | | | | | | | | | | | | -892 | | | | 86 | | | | -806 | |
Restructuring | | | -621 | | | | 621 | | | | 0 | | | | | | | | | | | | -126 | | | | 126 | | | | 0 | |
TomorrowNow and Versata litigation | | | 0 | | | | 0 | | | | 0 | | | | | | | | | | | | -309 | | | | 309 | | | | 0 | |
Other operating income/expense, net | | | 1 | | | | 0 | | | | 1 | | | | | | | | | | | | 4 | | | | 0 | | | | 4 | |
| | | | | | | | | | | | | | | | | | | | | | | | | | | | | | | | |
| Total operating expenses | | | -16,541 | | | | 2,084 | | | | -14,457 | | | | 1,062 | | | | -13,395 | | | | -13,230 | | | | 1,288 | | | | -11,942 | |
| | | | | | | | | | | | | | | | | | | | | | | | | | | | | | | | |
| Operating profit | | | 4,252 | | | | 2,095 | | | | 6,348 | | | | -443 | | | | 5,904 | | | | 4,331 | | | | 1,307 | | | | 5,638 | |
Explanation of Non-IFRS Measures
We disclose certain financial measures, such as revenue (non-IFRS), operating expenses (non-IFRS), operating profit (non-IFRS), operating margin (non-IFRS), and earnings per share (non-IFRS), as well as constant currency revenue, expense, and profit that are not prepared in accordance with IFRS and are therefore considered non-IFRS financial measures. Our non-IFRS financial measures may not correspond to non-IFRS financial measures that other companies report. The non-IFRS financial measures that we report should only be considered in addition to, and not as substitutes for or superior to, our IFRS financial measures.
We believe that the disclosed supplemental historical and prospective non-IFRS financial information provides useful information to investors because management uses this information, in addition to financial data prepared in accordance with IFRS, to attain a more transparent understanding of our past performance and our anticipated future results. We use the revenue (non-IFRS) and profit (non-IFRS) measures consistently in our internal planning and forecasting, reporting, and compensation, as well as in our external communications, as follows:
| ¡ | | Our management primarily uses these non-IFRS measures rather than IFRS measures as the basis for making financial, strategic, and operating decisions. |
| | |
| Combined Management ReportPerformance Management System | | 62 |
| ¡ | | The variable components of our Executive Board members’ and employees’ remuneration are based on revenue (non-IFRS), operating profit (non-IFRS), as well as new cloud bookings measures rather than the respective IFRS measures. |
| ¡ | | The annual budgeting process for all management units is based on revenue (non-IFRS) and operating profit (non-IFRS) numbers rather than the respective IFRS financial measures. |
| ¡ | | All forecast and performance reviews with all senior managers globally are based on these non-IFRS measures, rather than the respective IFRS financial measures. |
| ¡ | | Both our internal performance targets and the guidance we provided to the capital markets are based on revenue (non-IFRS) and profit (non-IFRS) measures rather than the respective IFRS financial measures. |
Our non-IFRS financial measures reflect adjustments based on the items below, as well as adjustments for the related income tax effects.
Revenue (Non-IFRS)
Revenue items identified as revenue (non-IFRS) have been adjusted from the respective IFRS financial measures by including the full amount of software support revenue, cloud subscriptions and support revenue, and other similarly recurring revenue that we are not permitted to record as revenue under IFRS due to fair value accounting for the contracts in effect at the time of the respective acquisitions.
Under IFRS, we record at fair value the contracts in effect at the time entities were acquired. Consequently, our IFRS software support revenue, IFRS cloud subscriptions and support revenue, IFRS cloud and software revenue, and IFRS total revenue for periods subsequent to acquisitions do not reflect the full amount of revenue that would have been recorded by entities acquired by SAP had they remained stand-alone entities. Adjusting revenue numbers for this revenue impact provides additional insight into the comparability of our ongoing performance across periods.
Operating Expense (Non-IFRS)
Operating expense numbers that are identified as operating expenses (non-IFRS) have been adjusted by excluding the following expenses:
| ¡ | | Acquisition-related charges |
| | – | | Amortization expense/impairment charges of intangibles acquired in business combinations and certain stand-alone acquisitions of intellectual property (including purchased in-process research and development) |
| | – | | Settlements of preexisting business relationships in connection with a business combination |
| | – | | Acquisition-related third-party expenses |
| ¡ | | Expenses from the TomorrowNow litigation (formerly labeled as “discontinued activities”) and the Versata litigation cases |
| ¡ | | Share-based payment expenses |
We exclude certain acquisition-related expenses for the purpose of calculating operating profit (non-IFRS), operating margin (non-IFRS), and earnings per share (non-IFRS) when evaluating SAP’s continuing operational performance because these expenses generally cannot be changed or influenced by management after the relevant acquisition other than by disposing of the acquired assets. Since management at levels below the Executive Board does not influence these expenses, we generally do not consider these expenses for the purpose of evaluating the performance of management units. Additionally, these non-IFRS measures have been adjusted from the respective IFRS measures for the results of the share-based payment expenses and restructuring expenses, as well as the TomorrowNow and Versata litigation expenses.
Operating Profit (Non-IFRS), Operating Margin (Non-IFRS), and Earnings per Share (Non-IFRS)
Operating profit, operating margin, and earnings per share identified as operating profit (non-IFRS), operating margin (non-IFRS), and earnings per share (non-IFRS) have been adjusted from the respective IFRS measures by adjusting for the aforementioned revenue (non-IFRS) and operating expenses (non-IFRS).
Constant Currency Information
We believe it is important for investors to have information that provides insight into our sales. Revenue measures determined under IFRS provide information that is useful in this regard. However, both sales volume and currency effects impact period-over-period changes in sales revenue. We do not sell standardized units of products and services, so we cannot provide relevant information on sales volume by providing data on the changes in product and service units sold. To provide additional information that may be useful to investors in breaking down and evaluating changes in sales volume, we present information about our revenue and various values and components relating to operating profit that are adjusted for foreign currency effects.
We calculate constant currency revenue and operating profit measures by translating foreign currencies using the average exchange rates from the comparative period instead of the current period.
| | |
| Combined Management ReportPerformance Management System | | 63 |
Free Cash Flow
The following table shows our free cash flow measure. We use this measure among others to manage our overall financial performance.
Free Cash Flow
| | | | | | | | | | | | |
€ millions | | 2015 | | | 2014 | | | D in % | |
| Net cash flows from operating activities | | | 3,638 | | | | 3,499 | | | | 4 | |
| Purchase of intangible assets and property, plant, and equipment (without acquisitions) | | | -636 | | | | -737 | | | | -14 | |
| | | | | | | | | | | | |
| Free cash flow | | | 3,001 | | | | 2,762 | | | | 9 | |
Usefulness of Non-IFRS Measures
We believe that our non-IFRS measures are useful to investors for the following reasons:
| ¡ | | Our revenue (non-IFRS), expense (non-IFRS), and profit (non-IFRS) measures provide investors with insight into management’s decision making because management uses these non-IFRS measures to run our business and make financial, strategic, and operating decisions. We include the revenue adjustments outlined above and exclude the expense adjustments outlined above when making decisions to allocate resources. In addition, we use these non-IFRS measures to gain a better understanding of SAP’s operating performance from period to period. |
| ¡ | | The non-IFRS measures provide investors with additional information that enables a comparison of year-over-year operating performance by eliminating certain direct effects of acquisitions, share-based compensation plans, restructuring plans, and the TomorrowNow and Versata litigation cases. |
| ¡ | | Non-IFRS and non-GAAP measures are widely used in the software industry. In many cases, inclusion of our non-IFRS measures may facilitate comparison with our competitors’ corresponding non-IFRS and non-GAAP measures. |
Limitations of Non-IFRS Measures
We believe that our non-IFRS financial measures described above have limitations, including but not limited to, the following:
| ¡ | | The eliminated amounts could be material to us. |
| ¡ | | Without being analyzed in conjunction with the corresponding IFRS measures, the non-IFRS measures are not indicative of our present and future performance, foremost for the following reasons: |
| | – | | While our profit (non-IFRS) numbers reflect the elimination of certain acquisition-related expenses, no eliminations are made for the additional revenue or other income that results from the acquisitions. |
| | – | | While we adjust for the fair value accounting of the acquired entities’ recurring revenue contracts, we do not adjust for the fair value accounting of deferred compensation items that result from commissions paid to the acquired company’s sales force and third parties for closing the respective customer contracts. |
| | – | | The acquisition-related charges that we eliminate in deriving our profit (non-IFRS) numbers are likely to recur should SAP enter into material business combinations in the future. Similarly, the restructuring expenses that we eliminate in deriving our profit (non-IFRS) numbers are likely to recur should SAP perform restructurings in the future. |
| | – | | The acquisition-related amortization expense that we eliminate in deriving our profit (non-IFRS) numbers is a recurring expense that will impact our financial performance in future years. |
| | – | | The revenue adjustment for the fair value accounting of the acquired entities’ contracts and the expense adjustment for acquisition-related charges do not arise from a common conceptual basis. This is because the revenue adjustment aims to improve the comparability of the initial post-acquisition period with future post- acquisition periods, while the expense adjustment aims to improve the comparability between post-acquisition periods and pre-acquisition periods. This should particularly be considered when evaluating our operating profit (non-IFRS) and operating margin (non-IFRS) numbers as these combine our revenue (non-IFRS) and expenses (non-IFRS) despite the absence of a common conceptual basis. |
| | – | | Our restructuring charges could result in significant cash outflows. The same applies to our share-based payment expense because most of our share-based payments are settled in cash rather than shares. |
| | – | | The valuation of our cash-settled share-based payments could vary significantly from period to period due to the fluctuation of our share price and other parameters used in the valuation of these plans. |
| | – | | In the past, we have issued share-based payment awards to our employees every year and we intend to continue doing so in the future. Thus, our share-based payment expenses are recurring although the amounts usually change from period to period. |
We believe that constant currency measures have limitations, particularly as the currency effects that are eliminated constitute a significant element of our revenue and expenses and could materially impact our performance. Therefore, we limit our use of constant currency measures to the analysis of changes in volume as one element of the full change in a financial measure. We do not evaluate our results and performance without considering both constant currency measures in revenue (non-IFRS) and operating profit (non-IFRS) measures on the one hand, and changes in revenue, operating expenses, operating profit, or other measures of financial
| | |
| Combined Management ReportPerformance Management System | | 64 |
performance prepared in accordance with IFRS on the other. We caution the readers of our financial reports to follow a similar approach by considering constant currency measures only in addition to, and not as a substitute for or superior to, changes in revenue, operating expenses, operating profit, or other measures of financial performance prepared in accordance with IFRS.
Despite these limitations, we believe that the presentation of the non-IFRS measures and the corresponding IFRS measures, together with the relevant reconciliations, provide useful information to management and investors regarding present and future business trends relating to our financial condition and results of operations. We do not evaluate our growth and performance without considering both non-IFRS measures and the comparable IFRS measures. We caution the readers of our financial reports to follow a similar approach by considering our non-IFRS measures only in addition to, and not as a substitute for or superior to, revenue or other measures of our financial performance prepared in accordance with IFRS.
| | |
| Combined Management ReportPerformance Management System | | 65 |
Employees and Social Investments
| ¡ | | At SAP, we encourage the well-being of our employees and our organization so we can master the challenges of a digital and global workplace. |
| ¡ | | We enable our people to perform at their best so they can help our customers succeed in the digital economy. At SAP, everyone is a talent. |
| ¡ | | Our “How We Run” set of behaviors describes how we get things done and is at the very heart of our culture. |
OUR HR STRATEGY IS BUILT FOR OUR PEOPLE
At SAP, we put our customers at the center of everything we do. It is our employees who are helping our customers succeed in the new digital economy and enabling us to become THE cloud company powered by SAP HANA. Therefore, we are fully committed to the people side of our business.
As digital advances change customer expectations, they also fundamentally change the ability of our employees to have a greater share of voice in defining their own work experiences. Today’s talents expect a diverse, agile, and yet highly personalized workplace that is in line with individual needs. They expect inspiring and caring leaders who can rethink how we collaborate to drive innovation. Similarly, they expect meaningful learning and career opportunities – all of which are powered by pervasive technology.
Our human resources (HR) strategy is to create a culture that is able to deal with the complexity, speed, and volume of a digital workplace – a culture that inspires innovation, leads change, and creates ultimate employee satisfaction. We want employees to learn and grow, leaders to engage and develop amazing talent, and organizations to be simple and agile. With our three guiding principles of simplification, standardization, and customer satisfaction, we stay focused on our ultimate goal, which is a seamless, simple employee experience. Ultimately, our HR strategy supports the creation of an HR organization that is built on cloud technology to Run Simple.
GETTING THE RIGHT TALENT IN THE RIGHT PLACE AT THE RIGHT TIME
To support SAP’s transformation to THE cloud company powered by SAP HANA, it is important to understand what it means to operate with a cloud mindset. Part of this transformation means not only changing the way we hire new talent, but also developing and retaining our employees.
In 2015, approximately one quarter of all external hires are considered “early talents” (hires with professional experience of up to two years). This success is due to ambitious early talent hiring targets, increased hiring activities in areas of diversity, expanded use of the SAP SuccessFactors Recruiting solution as our recruitment management system as well as the continued recognition of SAP as an employer of choice. In fact, SAP was recognized in Brazil, Greater China, India, and Japan by the Great Place to Work Institute, and named by Forbes as a “Best Employer” in 2015.
Once we hire new talent, we make sure that the onboarding experience is an engaging and inspiring one. To this end, we offer dedicated new-joiner programs. In addition, we closely collaborate with 2,300 universities on international events such as student meet-ups, info days, or coding events, such as InnoJams, and many other events through our SAP University Alliances program.
| | |
| Combined Management Report Employees and Social Investments | | 66 |
Another cornerstone in our efforts to recruit early talent is our vocational training program, which allows students to work towards their university degree while gaining valuable SAP business experience at the same time. The program has a clear focus on IT related areas such as Development, Services/Consulting and IT. As of October 2015, 880 vocational training students were enrolled in the program that originally started in Germany. A few years ago, we extended the program into key markets such as China and India, and added Hungary, Ireland, and the United States recently. In 2015, 210 vocational training graduates around the world started their professional careers with an SAP contract. Overall, we measured a conversion rate for vocational training students of 63% in 2015 (2014: 59%). The high-performance ratings of the students after graduating prove the success of the program.
In the area of people development, we continue with our philosophy of “everyone is a talent” that came to life in 2013. Major achievements are:
| ¡ | | Simplifications to our performance management process and tools to further improve the overall employee experience in our cloud-based Success Map tool |
| ¡ | | Development offerings for specific groups such as early talents, experts, and fast-track employees |
| ¡ | | Introduction of Career Success Centers around the world that provide dedicated career development support |
| ¡ | | Introduction of a globally consistent succession management approach for executive roles |
To fund our continued investments in growth areas including cloud, SAP HANA, and business networks we scaled back in areas where we see no significant growth in the future. As part of this program, roughly 3,000 employees moved into new jobs or left SAP. To manage these transitions while remaining people-centric, we use a mix of measures, including voluntary and early retirement programs that have proven very successful.
The overall retention rate in 2015 was 91.8% (2014: 93.5%). We define retention as the ratio of average number of employees minus voluntary attrition to the average number of employees (in full-time equivalents). High retention is something we are aiming for as reflected in all our activities to drive high employee engagement.
ENGAGING OUR PEOPLE THROUGH IMPACTFUL AND INSPIRATIONAL LEADERSHIP
At SAP, we see leadership as a profession. We make leaders accountable, and create a consistent leadership culture across the organization to ensure the engagement and advancement of our people.
Our leadership principles (ensuring customer success, driving simplicity, developing amazing talent) remain the foundation for leadership at SAP. With the demands of digitization, our leaders must operate with a comprehensive end-to-end view that focuses on delivering both immediate and long-term value for customers while optimizing operations. However, our leaders also need to focus on attracting and retaining talent with the right skills and digital mindset in a competitive market where digital skills are scarce.
In 2015, we continued to move the needle of leadership trust measured by our People Survey 2015 that ran in October. In 2015, the overall leadership trust score for people leaders, which uses the Net Promoter Score (NPS) methodology, was 52.3% compared to 46.8% for 2014 against a target of 51%. For 2016, we are committed to keep the 2015 leadership NPS value of more than 52%.
We need leaders at every level who internalize what it will take to achieve our strategy, have the mindset to amplify the intelligence and capabilities of everyone around them, and have the ability to accelerate business transformation. In 2015, we mandated a three-day program for all our top leaders that resulted in each leader creating an individual plan for how they will lead SAP’s transformation. In 2015, we also launched a flagship program for first-level people leaders who are responsible for guiding 75% of SAP’s workforce. Corresponding programs go live in the first quarter of 2016 for mid- and executive-level leaders. All programs are mandatory for people leaders who aspire to advance in their career.
In July 2015, leaders and selected high-performing employees participated in a virtual leadership summit with a focus on cascading consistent messaging for SAP’s digital business framework. This provided critical alignment for our strategy and the channels to communicate it throughout SAP. The summit included an in-depth financial update, positioning and messaging for the digital business framework and an aggregate report of the recently completed leadership assessments for the top 250 leaders.
MAKING LEARNING A COMPELLING EXPERIENCE FOR EVERYONE
Our learning culture supports employees at all levels and roles in their learning efforts. Building on our philosophy of “everyone is a talent,” we want to maximize the skills of all our employees. 2015 was a major year for learning at SAP, with a focus on stronger governance and increased transparency on how we spend our learning funds.
Professional development offerings (self-paced online programs that include language learning as well as technical and soft-skills training) are open to all employees. In addition to learning portfolios offered by board areas, virtual self-paced programs support employees building impactful development plans that meet their career goals. Our peer-to-peer learning portfolio includes coaching, mentoring, job shadowing, and facilitation opportunities. Our Global Coaching program received the 2015 International Coaching Federation Prism Award. Similarly, our Global Customer Operations (GCO) University program won the Brandon Hall Gold Award for Excellence in Sales Performance.
| | |
| Combined Management ReportEmployees and Social Investments | | 67 |
In 2015, we also hosted many learning culture workshops as well as virtual and in-person coffee corner sessions worldwide as an opportunity to foster exchange with peers and managers.
CREATING AN ENVIRONMENT THAT DRIVES INNOVATION, PERFORMANCE, AND ENGAGEMENT
It is our goal to create an environment and a workplace that drives innovation, high performance, and employee satisfaction; we do so by providing the following benefits and activities:
| ¡ | | In 2015, SAP again offered a Share Matching Plan (SMP) that enables employees to purchase discounted shares and receive additional matching shares. Employees also received Restricted Stock Units (RSUs) under the Employee Participation Plan (EPP), as well as a Stock Option Plan (SOP) that rewards selected employees and executives. |
| ¡ | | To help make our employees’ lives easier when dealing with people-related topics, we continue to transform our entire HR-IT landscape with the ongoing implementation of SAP SuccessFactors solutions. |
| ¡ | | With our “Accelerate Winning in HR” initiative, our HR organization helps support business goals with our domain and functional knowledge. In 2015, approximately 130 HR experts supported sales teams in HR deal engagements. We were able to convey a true “SAP Runs SAP” story to potential customers with our SAP expertise. |
As another example, SAP again sponsored “People Weeks,” a two-week program designed for employees to learn from each other, exchange ideas, and cultivate a greater connection across cultures, genders, and generations. Under the motto “Shine through the Cloud,” the event reached 25,000 employees in 75 locations and 52 countries.
PROMOTING INCLUSION, WELL-BEING, AND SOCIAL INNOVATION
Diversity and Inclusion
An inclusive culture inspires greater innovation, helps us better connect with and serve our customers, fosters employee engagement, and makes SAP a more attractive workplace. At SAP, our diversity and inclusion efforts focus on four key areas:
| ¡ | | Cross-generational intelligence |
| ¡ | | Differently-abled people |
SAP has publicly stated our commitment to achieve a workforce of 25% women in management by the end of 2017. We have made great strides toward our goal, with year-over-year growth from 21.3% in 2014 to 23.6% in 2015.
We offer executive sponsorships for women and strive for a qualified, equally distributed hiring shortlist that aligns with our corporate diversity targets. Additionally, we offer the Leadership Excellence Acceleration Program (LEAP), a highly respected and award-winning development program that helps prepare high-potential women for leadership roles at SAP. In May 2015, SAP co-sponsored the first Women’s Leadership Summit at the SAPPHIRE NOW conference.
Additional initiatives to support female careers at SAP include the Women’s Professional Growth Webinar series, the Business Women’s Network, and the Women@SAP online community.
For our commitment to gender equality in the workplace SAP America was awarded with the Economic Dividends for Gender Equality (EDGE) certificate as the first technology company in the United States.
Our Autism at Work program, an initiative that enables people with Autism Spectrum Disorder (ASD), continues to gain momentum and recognition. In October 2015, we also launched the program in Australia. Now implemented in eight countries, the program has won numerous accolades including the Catalyst Award of the US organization The Arc, for people with intellectual and developmental disabilities, and others. SAP is committed to having 1% of our total workforce composed of individuals with ASD by 2020. As of today, SAP counts a total of approximately 100 ASD employees. These employees can add enormous value to our ability to innovate with their high attention to detail in development and data analysis and contribute to us as a diverse company.
SAP has also made great strides in other areas such as the advancement of lesbian, gay, bisexual, and transgender (LGBT) rights. The Global Pride@SAP employee network has grown to more than 5,000 members, sponsoring numerous activities and initiatives throughout the year. In April, SAP joined the Human Rights Campaign (HRC) Business Coalition for Workplace Fairness in the United States, supporting the U.S. Employment Non-Discrimination Act (ENDA). SAP earned top scores in the HRC Foundation’s 2016 Corporate Equality Index.
In early 2015, our “How We Run” initiative was launched. Its outcome replaced the SAP passions by defining behaviors that describe what makes SAP unique. In a bottom-up approach, employees had the opportunity to define the behaviors that link SAP’s culture to its strategy. The result was five distinct behaviors:
| ¡ | | “Build bridges, not silos” |
| | |
| Combined Management ReportEmployees and Social Investments | | 68 |
Health and Well-Being
We invest in extensive employee benefits, programs, and services that truly make people’s lives better:
| ¡ | | Corporate Oncology Program for Employees (COPE) is available in Canada, Germany, and the United States, COPE offers employees facing cancer an individual, cost-free tumor analysis and interpretation based on TreatmentMAP™ by our external partner Molecular Health. |
| ¡ | | Health Checkup for Executives is a one-day, one-on-one health checkup program for executives. |
| ¡ | | Take Charge of Your Health and Well-Being program empowers employees to make the right decisions for their health and well-being. |
| ¡ | | Health Ambassador Network is a global network that strengthens our focus on health in office locations and helps identify best practices. |
| ¡ | | Local offerings, such as skin screening, on-site gyms and activity classes, mindfulness practice, eyesight testing, and health awareness sessions, are available to employees. |
Our Business Health Culture Index (BHCI), based on our People Survey, assesses the degree to which our workplace culture supports people’s well-being, work-life balance, and organizational health.
The positive trend of the BHCI continued, achieving 75% compared to 72% in 2014. The BHCI for 2014 was recalculated from 70% to 72% based on two questions in the People Survey concerning work-life balance. The changes were done to simplify the questionnaire and to achieve better comparability against external benchmarks. With the very positive result in 2015, we see the first indications that a health-focused culture has a significantly positive impact on employees. In an ever-changing environment and with SAP’s transition into the cloud, we firmly believe that the very good financial results of SAP for 2015 were supported by the BHCI results. Based on 2015 data, a change by one percentage point of the BHCI would have an impact of €75 million to €85 million on SAP’s operating profit. For more information, see theIntegrated Performance Analysis section of the SAP Integrated Report online.
Engaging in Social Investments
One of the major challenges for SAP and our customers on the digital transformation journey will be ensuring there is enough skilled talent around the world. The demographics are daunting with more than one billion young people on the planet, 85% living in developing countries, and more than 90 million unemployed. At the same time the global economy will be facing a shortage of 40 million highly-skilled workers by 2020. To help bridge this skills gap and support economic development, SAP’s social investments focus on equipping the world’s youth with the skills they need to tackle society’s problems and thrive in the digital economy.
Our corporate social responsibility (CSR) programs do this in two main focus areas: building the capacity of innovative social enterprises that put young people on the path to successful careers, and building a skilled workforce for the IT sector with skills, training or workforce development programs.
A core component of our CSR approach is pro-bono volunteering activities that use employees’ core skills for social good. These programs help strengthen leadership competencies while delivering needed services to communities and individuals worldwide. Now in its fourth year, the SAP Social Sabbatical is a short-term assignment for key talents who work in diverse teams to solve business challenges for the education and social entrepreneurship sector in emerging markets. In 2015, the program was expanded to include work with local organizations in an employee’s region. As of 2015, more than 40,000 pro-bono service hours were attributed to 163 employees for 57 organizations. These include AhoodooTec, a tech startup in Addis Ababa, Ethiopia, that develops Web applications and mobile apps for secondary school education, and Livox, a Brazilian startup that makes accessibility software to help people with disabilities speak and learn.
SAP launched the very successful Africa Code Week, which trained nearly 90,000 children on coding in one week in October 2015. Young people from 17 African countries took part in the more than 3,000 free coding workshops.
In 2015, the world’s eyes were opened to the breadth of the global refugee crisis. SAP’s leaders and employees felt strongly that SAP could make an important contribution and committed to a broad holistic approach. The program covered internship opportunities for at least 100 refugees as well as humanitarian assistance. Through employees giving more than €200,000 and CSR commitments, SAP pledged more than €900,000 to immediate relief, long-term education, and integration projects to assist refugees. In addition, SAP joined forces with the Grammy-award winning band Imagine Dragons to launch the One4 project under the hashtag #One4. Imagine Dragons donated the proceeds from their song “I Was Me” to the UN Refugee Agency (UNHCR). Further, SAP is donating 10 U.S. cents for every download up to the first five million downloads from iTunes.
Listening to Our People
Our past People Survey scores revealed that our employees were committed to executing the strategy but needed support to translate the strategic direction into their daily lives. Subsequently, we decided to continue our focus on this key topic in 2015. Across the five waves of our quarterly strategy checkpoint survey in 2014 and 2015, there was a steady increase in strategy adoption. By the end of September, more than 8 out of 10 employees say they are aware of the strategy, understand it, and are committed to executing it. We continue to measure the success of strategy adoption in 2016, along with the adoption of the key cultural elements that are the How We Run behaviors and leadership principles.
| | |
| Combined Management ReportEmployees and Social Investments | | 69 |
To measure the achievements of these respective initiatives, we conducted our People Survey from October to November. We are able to link our financial and non-financial performance to employee engagement. A change by one percentage point of the Employee Engagement Index (EEI) would have an impact of €40 million to €50 million on SAP’s operating profit. For more information, see theIntegrated Performance Analysis section of the SAP Integrated Report online. Employee engagement remains one of SAP’s corporate objectives, along with growth, profitability, and customer loyalty.
The 2015 People Survey results are extraordinarily positive. The Employee Engagement Index shows a steady increasing trend (81%, up by 2pp). This is the highest EEI score since 2010. The employee satisfaction went up in nearly all aspects and questionnaire items.
As a company that sets out to make the world run better and improve people lives, we cannot stop here. Based on the survey results, we decided to focus, in particular, on two areas in 2016: our efforts to simplify our processes and our ability to innovate. Employee engagement will remain one of our Company-wide strategic goals, and thus we remain committed to achieving 82% in 2016. This is an ambitious goal since in comparison to external norms as the current level of engagement is already in the top 10%. Similarly, we focus on the simplification of HR service offerings with our internal HR Run Simple program. The measurement of our internal HR customer satisfaction delivers actionable insights for prioritizing the strategic investments and deployment of resources as well as for creating efficiency through continuous improvements or decommissioning of services.
HEADCOUNT
On December 31, 2015, we had 76,986 full-time equivalent (FTE) employees worldwide (December 31, 2014: 74,406). This represents an increase in headcount of 2,579 FTEs in comparison to 2014. The average number of employees in 2015 was 75,180 (2014: 68,343).
We define FTE headcount as the number of people we would employ if we only employed people on full-time employment contracts. Students employed part-time and certain individuals employed by SAP but who, for various reasons, are not currently working, are excluded from our figures. Also, temporary employees are not included in the above figures. The number of temporary employees is not material.
On December 31, 2015, the largest number of SAP employees (44%) were employed in the Europe, Middle East, and Africa (EMEA) region (including 23% in Germany and 21% in other countries of the region), while 29% were employed in the North America and Latin America (Americas) region (including 21% in the United States and 8% in other countries of the region) and 27% in the Asia Pacific Japan (APJ) region.
Our worldwide headcount in the field of cloud and software decreased less than 1% to 14,991 FTEs (2014: 15,074). Services counted 15,085 FTEs at the end of 2015 – an increase of 3% (2014: 14,639). Our R&D headcount saw a year-over-year increase of 11% to 20,938 FTEs (2014: 18,908). Sales and marketing headcount grew by 1% to 18,206 FTEs at the end of the year (2014: 17,969). General and administration headcount stayed constant at 5,024 FTEs at the end of the year (2014: 5,023). Our infrastructure employees numbered 2,743 FTEs – a decrease of 2% (2014: 2,794).
In the Americas region, headcount (FTEs) increased by 95, or less than 1%; in the EMEA region, the increase was 566, or 2%; and in the APJ region, it was 1,919, or 10%.
Our personnel expense per employee increased to approximately €135,000 in 2015 (2014: approximately €115,000). This rise in expense is primarily attributable to an increase in salaries, employee-related restructuring expenses, share-based payments, and a significant rise in the share price in 2015. The personnel expense per employee is defined as the personnel expense divided by the average number of employees. For more information about employee compensation and a detailed overview of the number of people we employ, see the Notes to the Consolidated Financial Statements section,Note (7).
Number of Employees
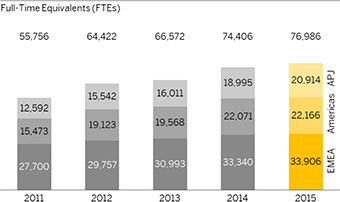
Employees by Functional Area
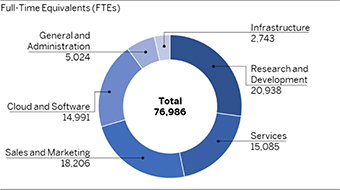
| | |
| Combined Management ReportEmployees and Social Investments | | 70 |
Environmental Performance: Energy and Emissions
| ¡ | | We continued to procure 100% renewable electricity in 2015. |
| ¡ | | Carbon emission offsets were introduced for business flights. |
| ¡ | | We continued to drive the expansion of the environmental management system (ISO 14001). |
In 2015, we made significant progress toward our goals for the reduction of greenhouse gas emissions, taking advantage of the digitalization and green technology trends that are driving transformational changes across the global economy. These trends can have a significant impact on energy consumption and greenhouse gas emissions. We are applying these trends to our own business and helping our customers apply them to their businesses. For example, by enabling business model transformation, using advances such as smart grids and the Internet of Things, SAP is helping connected digital business networks reduce overall carbon footprints.
STRENGTHENING OUR “GREEN CLOUD”
We see that energy consumption in data centers is closely related to innovation and customer adoption of our solutions. As we accelerate our shift to the cloud, we have tied our business strategy to our environmental strategy by creating a completely “green cloud” at SAP, referring to carbon neutrality, by purchasing 100% renewable electricity certificates and compensation by CO2 offsets. In assessing our environmental impact, we focus on energy usage throughout SAP, as well as greenhouse gas emissions across our value chain.
REDUCING GREENHOUSE GAS EMISSIONS
Our goal is to reduce the net greenhouse gas (GHG) emissions from our operations to levels of the year 2000 by 2020. This target includes all direct and indirect emissions from running our business (GHG Protocol Scopes 1 and 2), as well as a selected subset of other indirect (Scope 3) emissions. We do not include all of our Scope 3 emissions in our target because we choose to focus on those emissions over which we have direct control or ability to influence. However, we are increasingly addressing both our upstream and downstream emissions to support a comprehensive carbon strategy for SAP.
Specifically, we are working to reduce our emissions through three primary approaches: increasing our operational efficiency combined with innovative approaches to the way we do things; purchasing high-quality renewable electricity certificates; and investing in high-quality carbon credits.
In addition to our long-term commitment for 2020, we have derived annual targets for our internal operational steering. Despite integrating new acquisitions in 2015, our total net emissions decreased to 455 kilotons CO2 (2014: 500 kilotons). This decrease stems primarily from a reduction of business flights and compensation with carbon emission offsets. We are effectively compensating the emissions from those customer systems that have moved into our green cloud. Given the large size of our customers’ CO2 footprints and our growth strategy in the cloud, we see significant potential to reduce both our own and our customers’ environmental impact.
Since the beginning of 2008, our focus on carbon emissions has generated a cumulative cost avoidance of €346 million, compared to a business-as-usual scenario. This leads to an avoidance of €124 million in the past three years, with €39.8 million avoided in 2015 alone.
| | |
| Combined Management ReportEnvironmental Performance: Energy and Emissions | | 71 |
INVESTING IN ENVIRONMENTAL INNOVATIONS
We are pursuing new strategies to contend with the ongoing tension between growth in our business and our goal to reduce our emissions. One such approach is the introduction of carbon emission offsets for business flights in 2015. In addition to avoiding and reducing overall business flights, we began, in the second half of 2015, to offset selected business flights in the United States, as this is the country with the greatest number of business flights. This offset effort resulted in a compensation of 35 kilotons of CO2.
SAP continues to invest in technology that enables virtual collaboration, supporting our efforts to reduce the need for employees to travel. In addition to our TelePresence and video conferencing platforms, new collaboration rooms based on the Skype for Business communications platform bring new features that enable teamwork across borders and time zones. More than 100 collaboration rooms have been installed throughout SAP with more planned for 2016. Because more employees adopt video chat as their preferred method of communication, more than 1,200 meeting spaces have been equipped with 360-degree cameras – giving remote participants a more interactive experience. Skype for Business also enables each employee to video chat from their computer.
To further decrease car-related emissions, we plan to increase the portion of electric vehicles (or alternatives) in our company car fleet from the current 1% to 20% by 2020. At the end of 2015, we have 57 charging stations and 55 pure electric vehicles in our company car fleet at our headquarters in Walldorf, and approximately 300 e-cars globally. Our company car initiatives address a dilemma that has grown in recent years. As a result of our business expansion, the number of SAP employees eligible for a company car has increased annually. We want to ensure that we do not undo our efficiency gains with our growing car fleet.
In keeping with our existing policy for office buildings and data centers, all our electric company cars charged at SAP are powered with 100% renewable sources. In Germany, for example, we provide employees with an incentive to switch to electric alternatives by offering a battery subsidy that offsets the costs of using an electric vehicle. We believe that our electric car initiative will play a critical role in helping achieve our 2020 carbon reduction goal.
In 2015, emissions caused by SAP products in use at the sites of more than 300,000 customers were almost 15 times larger than SAP’s own footprint, meaning these products caused approximately 6,800 kilotons of CO2. By using 100% renewable electricity, we dramatically broaden our sustainability efforts and align them with our cloud strategy, reducing the carbon emissions of our cloud solutions to zero.
We continued to realize the benefits of our investment in the Livelihoods Fund, a unique investment fund whose returns consist of high-quality carbon credits. Several years ago, we made a commitment to investing €3 million covering a 20-year participation in the fund, which supports the sustainability of agricultural and rural communities worldwide. Projects of this fund focus on ecosystem restoration, agriculture, agroforestry, and rural energy. In eastern India, for example, the fund helped communities plant fruit trees to diversify food sources and address the overcultivation of soil. Instead of a charitable donation, we have made a long-term investment that brings benefits to society, the environment, and SAP. In 2015, we received carbon credits from the fund, which helped us to offset our carbon footprint by 23 kilotons.
Another important program in 2015 was the further implementation of ISO 14001 in SAP locations throughout the world. This well-accepted environmental management system is now in place at 32 of our locations worldwide, including our North America headquarters in Newtown Square, Pennsylvania, as well as in Palo Alto, San Francisco, Sunnyvale, and Dublin, California, both in the United States; and other countries including Austria, Canada, Czech Republic, France, Germany, Israel, Italy, and South Africa. New sites in Singapore and Switzerland, as well as Rio de Janeiro and São Paulo in Brazil, were certified in 2015. To act more quickly and achieve consistency, we created a template to roll out in other sites, enabling us to efficiently build a large global network where different sites interact and share best practices. Our goal is to continually increase the number of certified locations; we aim for total full-time equivalent (FTE) coverage of 70% by 2018. By end of 2015, SAP had an environmental management system (ISO 14001) in place in 15 countries and 32 single sites. This represents a total FTE coverage of 22.2%.
MEASURING OUR TOTAL ENERGY CONSUMED
Because our energy usage drives emissions, one of the most important measures for us is total energy consumed. This includes all energy that SAP generates or purchases to run our facilities, data centers, company cars, and corporate jets. Our total energy consumption increased to 965 gigawatt hours (GWh) in 2015, compared to 920 GWh in 2014.
This increase is due to growth in our workforce and business. In addition, as software usage shifts to the cloud, we are operating more of our customers’ systems in our data centers, as well as other locations where we supplement our servers. This additional cloud operation, along with accompanying servers and facilities, consumes more energy. At the same time, we believe this shift has the opposite effect for our customers that are now able to simplify their technology and save energy through our shared infrastructure. This reduces overall IT-related energy consumption through our highly energy-efficient cloud provisioning.
| | |
| Combined Management ReportEnvironmental Performance: Energy and Emissions | | 72 |
OPTIMIZING EFFICIENCY IN OUR DATA CENTERS
Data centers are at the heart of how SAP provides solutions to our customers and represents a significant part of our total greenhouse gas emissions. At the same time, with our energy consumption rising as more of our business moves to the cloud, data centers have become a primary focus of our carbon reduction efforts and the adoption of our technology innovations and solutions towards our customers. We continue to drive efficiency and innovation around buildings, data center operations, and infrastructure. For example, in one of our largest data centers in St. Leon-Rot, Germany, we received an energy efficiency certificate from TÜV Rheinland, a leading provider of technical, safety, and certification services, with an efficiency score of 98.7%. One hundred percent of our energy usage that provides internal and external computation power comes from renewable sources. Our total data center electricity consumption at both our internal and external sites increased from 179 in 2014 to 249 GWh in 2015. In recognition of the exemplary actions SAP has taken to improve our data centers, we were awarded the European Datacentre Sustainability Award in 2015.
REINFORCING OUR RENEWABLE ELECTRICITY STRATEGY
Our commitment to 100% renewable electricity in all of our internal and external data centers and facilities is one of the most significant steps toward making our operations more sustainable. In 2015, we mainly focused on wind and, to a lesser extent, on biomass. While we produce a small amount of renewable electricity through solar panels in some locations, we rely primarily on the purchase of renewable electricity certificates (RECs) to increase the renewable electricity in our energy mix. We procure RECs regionally that add value and drive change in the electricity market, adopting high-quality standards in our procurement guidelines that are aligned with two non-governmental organizations (NGOs). For example, we consider renewable electricity from biomass only if it is disconnected from coal or other fossil power plants and if the biomass itself is not related to deforestation. In addition, we require that power plants must be no more than 10 years old, as we aim to foster new innovation in the production of renewable electricity. Furthermore, SAP is not considering RECs from power plants that are currently supported by governments. As a vintage requirement, we define that renewable electricity must be produced in the same year or the year before the reporting period will be applied.
In 2015, SAP joined the green initiative RE100 and is now one of the global corporations that have signed on to the RE100 initiative. RE100 is led by The Climate Group in partnership with CDP (formerly Carbon Disclosure Project) and the goal of the campaign is to have 100 of the world’s most influential businesses committed to 100% renewable electricity.
| | |
| Combined Management ReportEnvironmental Performance: Energy and Emissions | | 73 |
Financial Performance: Review and Analysis
| ¡ | | Exceptional growth in cloud business, an overall strong top-line result generated highest non-IFRS operating profit in SAP’s history |
| ¡ | | Completeness of vision in the cloud combined with a soaring adoption of SAP S/4HANA gives us confidence for 2016 and beyond, reflected in an increase of our 2017 ambition |
| ¡ | | Stable total group liquidity despite repaying significant debt |
ECONOMY AND THE MARKET
Global Economic Trends
In its most recent report, the European Central Bank (ECB) concludes that the global economy grew gradually and unevenly in 2015. The ECB finds that low oil prices, favorable financing conditions, and improving labor markets helped advanced economies perform better than in previous years. However, growth in emerging markets and developing economies remained relatively weak, according to the ECB. It cites tight global financing conditions and declining commodity prices as the causes.
For the Europe, Middle East, and Africa (EMEA) region, the ECB reports contrasting developments. According to its calculations, the gross domestic product of the euro area grew 1.5% in 2015. It finds that this recovery was mainly due to increasing domestic demand. The economies of Central and Eastern European countries were robust, according to the ECB, while Russia was in significant recession.
The economic performance of the countries in the Americas region was also uneven. According to the ECB, the United States economy firmed in 2015, and weakened slightly only in the third quarter. However, a number of countries in Latin America slipped into recession; notably Brazil, where the downturn was mainly due to political uncertainty.
In the Asia Pacific Japan (APJ) region, Japan’s economy struggled to gain momentum in 2015, the ECB notes. However, the ECB also points to a slight recovery in the third quarter and signs of growth at the end of the year. China refocused its economy in 2015, easing its monetary policy and introducing a new exchange rate regime in the summer, the ECB reports. This increased political uncertainty and economic growth slowed. The ECB writes that business-friendly reforms in India boosted investment and, after a temporary decline in the second quarter, led to an increase in economic growth from mid-year onwards.
The IT Market
Growth in the global IT market slowed from the second quarter of 2015, U.S. market research firm International Data Corporation (IDC) reports. It attributes this development to the contracting PC market, the encroachment on traditional IT business by cloud services, and weak economic performance in countries such as Brazil, China, and Russia. IDC lowered its forecast for IT market growth in 2015, and at the end of the year it expected the global IT market to have grown 4.9% year over year – still ahead of the economy as a whole.
However, according to IDC, IT spending did not grow evenly across the segments. It pointed to strong growth in cloud, mobile, and Big Data, with service providers increasing investment in server and data storage hardware. IDC reports that smartphone market expansion, which had been rapid in the previous year, slowed significantly in 2015 due to saturation. In 2015, the rate of smartphone market growth was closer to that of the IT market as a whole. Even the tablet market was unable to make up for this loss of momentum, IDC notes.
By contrast, worldwide spending on business software increased significantly, at 6.8% in 2015, according to IDC. The share of investment in cloud, mobile, and Big Data solutions continued to increase. However, according to IDC, this had an adverse effect on services, which grew only 2.8%.
| | |
| Combined Management ReportFinancial Performance: Review and Analysis | | 74 |
IDC reports that IT spending in the Europe, Middle East, and Africa region (EMEA) increased 1.5% in 2015, and by as much as 5% in Western Europe due to the economic recovery there. In Germany, the IT market grew even more strongly at over 6%. In Russia, though, low oil prices, depreciation of the ruble, and economic sanctions had a significant negative impact, IDC reports. It expects the Russian IT market declined 15% in 2015.
In the Americas region, the IT market grew 4.6% according to IDC. In its view, the U.S. market remained largely stable. It grew 3% overall, somewhat less than in the previous year, mainly due to the weakening market for smartphones and tablets. Software, on the other hand, grew strongly at 7% in the United States, according to IDC. In Brazil, IT investment increased 11% in 2015, though this increase has to be seen in the context of high inflation. IDC put growth in the Mexican IT market at almost 13%.
In the Asia Pacific Japan (APJ) region, IDC reports that the IT market there grew almost 6% in 2015. The IT markets in individual countries performed very differently. In Japan, IT spending remained constant year over year. In China, growth in the IT market slowed to 8% (2014: 12%). In India, however, in 2015 IT spending grew very strongly at 11%, according to IDC.
Impact on SAP
Once again, growth in the overall global economy and in the IT industry was relatively slow in a volatile market environment in 2015. This confronted SAP with considerable challenges. But our tremendous 2015 results validate our strategy of innovating across the core, the cloud, and business networks to help our customers become true digital enterprises. We once again succeeded in significantly expanding our business and outperformed the overall global economy and IT industry in all regions in 2015 with regards to revenue growth.
Our non-IFRS cloud and software revenue increased 12% at constant currencies in 2015. Both our core business and our cloud business contributed substantially to the increase. Our core business grew with non-IFRS software and support revenue increasing 6% at constant currencies. This was driven by a 4% year-over-year increase in our non-IFRS software revenue at constant currencies, while our resilient constant currency non-IFRS support revenue grew 7%. Support revenue is a robust feature of our core business model because a maintenance contract generally continues for as long as the customer uses the software. Our cloud business growth was strong as well. Non-IFRS cloud subscriptions and support revenue grew 82% over the year at constant currencies.
For more details about our regional performance, see theRevenue by Region section below.
In 2015, we again demonstrated that we are consistently pursuing our strategy for innovation and growth – and that globally we are able to generate growth that few other IT companies can match.
OVERALL FINANCIAL POSITION
Executive Board’s Assessment
In 2015, SAP saw exceptional growth in its cloud business. Its core on-premise license business performed strongly as well, growing 10%. With the strong top line result we generated the highest non-IFRS operating profit in SAP’s history.
The exceptional strong cloud growth is driven by a broad cloud portfolio, the largest cloud business network in the world (SAP Ariba, Concur, and SAP Fieldglass solutions), and the SAP HANA Enterprise Cloud service.
We made substantial progress in transforming our Company by shifting investments from non-core activities to strategic growth areas, enabling us to capture the tremendous growth opportunities in the market. The completeness of vision in the cloud combined with a soaring adoption of SAP S/4HANA gives us confidence in our business in 2016 and beyond, which is reflected in an increase of our 2017 ambition. We exceeded our targets for cloud and software revenues and operating income and we are ever confident that SAP will remain a profitable growth business well into the future.
Influence of Accounting Policies on Our Financial Position
For more information about our accounting policies, see the Notes to the Consolidated Financial Statements section,Note (3).
There are no off-balance sheet financial instruments, such as sale-and-lease-back transactions, asset-backed securities, and liabilities related to structured entities, which are not disclosed in our Consolidated Financial Statements.
PERFORMANCE AGAINST OUTLOOK FOR 2015 (NON-IFRS)
Our 2015 operating profit-related internal management goals and published outlook were based on our non-IFRS financial measures. For this reason, in the next section we discuss performance against our outlook only in terms of non-IFRS numbers derived from IFRS measures. The subsequent section about IFRS operating results discusses numbers only in terms of the International Financial Reporting Standards (IFRSs). So the numbers in that section are not expressly identified as IFRS numbers.
We acquired Concur Technologies in December 2014, so Concur results are incorporated in our 2014 results only for December. We acquired Fieldglass in May 2014, so Fieldglass results are incorporated in our 2014 results only from May to December.
| | |
| Combined Management ReportFinancial Performance: Review and Analysis | | 75 |
Guidance for 2015 (Non-IFRS)
At the beginning of 2015, we projected, based on the strong momentum in our cloud business, that our non-IFRS cloud subscriptions and support revenue would end between €1.95 billion and €2.05 billion at constant currencies (2014: €1.10 billion). The upper end of this range represents a growth rate of 86% at constant currencies. The acquired companies Concur and Fieldglass were expected to contribute approximately 50 percentage points to this growth. SAP expected full-year 2015 non-IFRS cloud and software revenue to increase by 8% to 10% at constant currencies (2014: €14.33 billion). We also expected our full-year operating profit (non-IFRS) for 2015 to end between €5.6 billion and €5.9 billion (2014: €5.64 billion) at constant currencies. We anticipated an effective tax rate (IFRS) of between 25.0% and 26.0% (2014: 24.7%) and an effective tax rate (non-IFRS) of between 26.5% and 27.5% (2014: 26.1%).
Actual Performance Compared to Guidance 2015 (Non-IFRS)
We achieved or exceeded the amended outlook guidance for revenue and operating profit we published at the beginning of the year.
Comparison of Forecast and Results for 2015
| | | | | | | | |
| | | Forecast for 2015 | | | Results for 2015 | |
| Cloud subscriptions and support revenue (non-IFRS, at constant currencies) | |
| € 1.95 billion to
€ 2.05 billion |
| | | € 2.00 billion | |
| Cloud and software revenue (non-IFRS, at constant currencies) | | | +8% to +10 | % | | | +12 | % |
| Operating profit (non-IFRS, at constant currencies) | |
| €5.6 billion to
€5.9 billion |
| | | €5.90 billion | |
| Effective tax rate (IFRS) | | | 25.0% to 26.0 | % | | | 23.4 | % |
| Effective tax rate (non-IFRS) | | | 26.5% to 27.5 | % | | | 26.1 | % |
Despite ongoing economic uncertainty throughout 2015, our new and existing customers continued to show a strong willingness to invest in our solutions.
At constant currencies, non-IFRS cloud subscriptions and support revenue grew from €1.1 billion in 2014 to €2.0 billion in 2015. That represents an increase of 82% at constant currencies. The increase includes effects relating to acquisitions not included, or not included in full, in the 2014 amount. Besides these positive acquisition effects our cloud line of business also continued to benefit from strong organic growth (32% at constant currencies), which surpassed our long-term growth expectations for 2015.
Starting with the reporting for the first quarter of 2015, SAP reports a new cloud related measure called “new cloud bookings.” This measure is an order entry measure that is determined by including all order entry of a given period that meets all of the following conditions:
| ¡ | | The revenue from the orders is expected to be classified as cloud subscriptions and support revenue. |
| ¡ | | It results from purchases by new customers and incremental purchases by existing customers. Consequently, orders to renew existing contracts are not included. |
| ¡ | | The order amount is contractually committed (that is, variable amounts from pay-per-use and similar arrangements are not included). Consequently, due to their uncommitted pay-per-use nature, transaction-based fees from SAP Ariba and SAP Fieldglass solutions are not reflected in the new cloud bookings metric. |
| ¡ | | Amounts are annualized. That is, for contracts with durations of more than one year, the average annual order entry amount is included in the number. |
Thus, the new cloud bookings measure is an indicator for our cloud-related sales success in a given period and for future cloud subscriptions revenue. New cloud bookings increased 100% in 2015 to €874 million (2014: €436 million). Concur contributed €169 million to new cloud bookings. In addition to the strong growth of the new cloud bookings the combination of our cloud backlog (unbilled future revenue based on existing customer contracts) and deferred cloud revenue that together reflect the committed future cloud subscriptions and support revenue climbed by 53% to €4.6 billion (2014: €3.0 billion). This committed business will drive cloud growth in 2016 and beyond.
Besides the cloud business also our core on-premise business showed an exceptional growth in 2015. Cloud and software revenue (non-IFRS) was €17.2 billion (2014: €14.3 billion). On a constant currency basis, the increase was 12% and based on that result significantly above the forecast for 2015.
Our total revenue (non-IFRS) rose 18% in 2015 to €20.8 billion (2014: €17.6 billion). On a constant currency basis, the increase was 10%.
Operating expenses (non-IFRS) in 2015 were €14.5 billion (2014: €11.9 billion), an increase of 21%. On a constant currency basis the increase was 12%.
Our expense base in 2015 was impacted by the transformation to a fast-growing cloud business resulting in a significant higher share of more predictable revenue. The gross margins of our cloud offerings made good progress throughout 2015. Our gross
| | |
| Combined Management ReportFinancial Performance: Review and Analysis | | 76 |
margin (Non-IFRS) in our business network segment resulted in ~75% for 2015, already close to our long-term ambition of ~80%. This good result is based on an overall improved profitability as well as related to positive effects of the Concur acquisition. The revenue growth of our private cloud offering was more positive than expected. At the same time, the profitability of our private cloud offering could also be improved further; it is still negative but based on the good progress we saw throughout 2015, we expect break even in the course of 2016. Profitability in our public cloud offering was ~70% for 2015 compared to our long-term ambition of ~80%. Our overall cloud gross margin improved year over year from 64.3% in 2014 to 65.6% in 2015, despite incremental investments in the cloud infrastructure. These investments were necessary so as to be able in future periods to satisfy the increased customer demand that can be seen in the significantly higher cloud backlog as well as the increased cloud bookings.
Efficiency improvements in both our core and our cloud business drove absolute operating profit growth. Non-IFRS operating profit in 2015 was €5.904 billion, an increase of 5% at constant currencies. The growth in our operating profit in 2015 reflects the continued success of our business transformation in combination with the strong top-line growth. In 2015, we had a positive impact from our Company-wide transformation program in the triple-digit million euro range. On the other hand, we had a net increase of more than 2,500 employees in 2015 as we continued to invest in innovation and growth markets. Thus, constant currency non-IFRS operating profit amounting to €5.904 billion slightly exceeded the range (€5.6 billion to €5.9 billion) we had expected in our outlook.
We achieved an effective tax rate (IFRS) of 23.4% and an effective tax rate (non-IFRS) of 26.1%, which is below the outlook of 25.0% to 26.0% (IFRS) and 26.5% to 27.5% (non-IFRS). The reduction mainly results from taxes for prior years.
OPERATING RESULTS (IFRS)
This section on operating results (IFRS) discusses results only in terms of IFRS measures, so the IFRS numbers are not expressly identified as such.
We break our operations down into three regions: the Europe, Middle East, and Africa (EMEA) region, the Americas region, and the Asia Pacific Japan (APJ) region. We allocate revenue amounts to each region based on where the customer is located. For more information about revenue by geographic region, see the Notes to the Consolidated Financial Statements section,Note (28).
Revenue
Total Revenue
Total revenue increased from €17,560 million in 2014 to €20,793 million in 2015, representing an increase of €3,233 million, or 18%. This growth reflects a 10% increase from new business and a 9% increase from currency effects. The growth in revenue resulted primarily from a €1,264 million rise in support revenue, a €1,199 million increase in cloud subscriptions and support revenue, software license revenue increased €436 million and services revenue grew by €334 million. Cloud and software revenue climbed to €17,214 million in 2015, an increase of 20%. Cloud and software revenue represented 83% of total revenue in 2015 (2014: 82%). Service revenue increased 10% from €3,245 million in 2014 to €3,579 million, which was 17% of total revenue, in 2015.
Cloud Subscriptions and Support Revenue by Region (based on customer location)
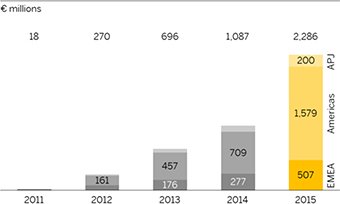
For more information about the breakdown of total revenue by region and industry, see theRevenue by Region and Industrysection below.
Cloud and Software Revenue
Software licenses revenue results from the fees earned from selling or licensing software to customers. Revenue from cloud subscriptions and support refers to the income earned from contracts that permit the customer to access specific software solutions hosted by SAP during the term of its contract with SAP. Support revenue represents fees earned from providing technical support services and unspecified software upgrades, updates, and enhancements to customers.
Cloud and Software Revenue by Region (based on customer location)
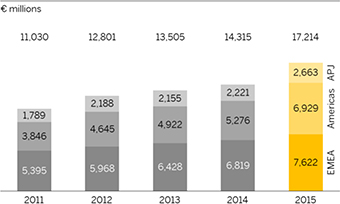
| | |
| Combined Management ReportFinancial Performance: Review and Analysis | | 77 |
Cloud subscriptions and support revenue increased from €1,087 million in 2014 to €2,286 million in 2015.
Despite a combination of a challenging macroeconomic and political environment and the accelerating industry shift to the cloud, we achieved a €436 million increase in software license revenue. This increase, from €4,399 million in 2014 to €4,835 million in 2015, reflects a 4% increase from new license business and a 6% increase from currency effects.
Our customer base continued to expand in 2015. Based on the number of contracts concluded, 13% of the orders we received for software in 2015 were from new customers (2014: 12%). The total value of software orders received increased 16% year-over-year. The total number of software license contracts increased 6% to 57,439 (2014: 54,120 contracts), while the average order value increased by 9%. Of all our software orders received in 2015, 27% were attributable to deals worth more than €5 million (2014: 22%), while 40% were attributable to deals worth less than €1 million (2014: 44%).
Our stable customer relations and continued investment in new software licenses by customers throughout 2015 and the previous year resulted in an increase in software support revenue from €8,829 million in 2014 to €10,093 million in 2015. The SAP Enterprise Support offering was the largest contributor to our software support revenue. The €1,264 million, or 14%, growth in software support revenue reflects a 7% increase from new support business and an 8% increase from currency effects. This growth is primarily attributable to SAP Product Support for Large Enterprises and SAP Enterprise Support. The acceptance rate for SAP Enterprise Support among new customers slightly increased to 99% in 2015 (2014: 98%).
Software licenses and software support revenue rose €1,700 million, or 13%, from €13,228 million in 2014 to €14,928 million in 2015. This growth breaks down into a 6% increase from new software licenses and software support business and a 7% increase from currency effects.
Cloud and software revenue grew from €14,315 million in 2014 to €17,214 million in 2015, an increase of 20%. This reflects a 12% increase from new cloud and software business and a 9% increase from currency effects.
Services Revenue
Services Revenue combines revenue from professional services, premium support services, training services, messaging services and payment services. Professional services primarily relate to the installation and configuration of our cloud subscriptions and on-premise software products. Our premium support offering consists of high-end support services tailored to customer requirements. Messaging services are primarily transmission of electronic text messages from one mobile phone provider to another. Payment services are primarily delivered in connection with our travel and expense management offerings.
Services revenue increased €334 million, or 10%, from €3,245 million in 2014 to €3,579 million in 2015. This increase reflects a 2% increase from new services business and an 8% increase from currency effects.
A solid market demand led to an 8% increase of €222 million in consulting revenue and premium support revenue from €2,634 million in 2014 to €2,856 million in 2015. This increase reflects a 0% increase from new business and an 8% increase from currency effects. Consulting and premium support revenue contributed 80% of the total service revenue (2014: 81%). Consulting and premium support revenue contributed 14% of total revenue in 2015 (2014: 15%).
Revenue from other services increased €112 million, or 18%, to €723 million in 2015 (2014: €611 million). This reflects a 9% increase from new business and a 10% increase from currency changes.
Revenue by Region and Industry
Revenue by Region
Revenue by Region (based on customer location)
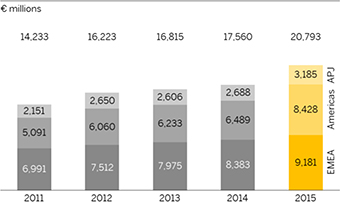
EMEA Region
In 2015, the EMEA region generated €9,181 million in revenue, which was 44% of total revenue (2014: €8,383 million; 48%). This represents a year-over-year increase of 10%. Revenue in Germany increased 8% to €2,771 million in 2015 (2014: €2,570 million). Germany contributed 30% (2014: 31%) of all EMEA region revenue. The remaining revenue in the EMEA region was primarily generated in France, Italy, the Netherlands, Russia, Switzerland, and the United Kingdom. Cloud and software revenue generated in the EMEA region in 2015 totaled €7,622 million (2014: €6,819 million). Cloud and software revenue represented 83% of all revenue in the region in 2015 (2014: 81%). Cloud subscriptions revenue rose 83% to €507 million in 2015 (2014: €277 million). This growth reflects a
| | |
| Combined Management ReportFinancial Performance: Review and Analysis | | 78 |
69% increase from new cloud business and a 14% increase from currency effects. Software licenses and software support revenue rose 9% to €7,115 million in 2015 (2014: €6,542 million). This growth reflects an 8% increase from new software license and software support business and a 1% increase from currency effects.
Americas Region
In 2015, 41% of our total revenue was generated in the Americas region (2014: 37%). Total revenue in the Americas region increased 30% to €8,428 million; revenue generated in the United States increased 38% to €6,750 million. This growth reflects a 16% increase from new business and a 22% increase from currency effects. The United States contributed 80% (2014: 75%) of all revenue generated in the Americas region. In the remaining countries of the Americas region, revenue increased 5% to €1,678 million. This reflects a 3% increase from new business and a 2% increase from currency effects. This revenue was primarily generated in Brazil, Canada, and Mexico. Cloud and software revenue generated in the Americas region in 2015 totaled €6,929 million (2014: €5,276 million). Cloud and software revenue represented 82% of all revenue in the Americas region in 2015 (2014: 81%). Cloud subscriptions revenue rose by 123% to €1,579 million in 2015 (2014: €709 million); currency effects were 34%, growth in new cloud business was 89%. Software licenses and software support revenue rose 17% to €5,350 million in 2015 (2014: €4,566 million). This growth reflects a 2% increase from new business; currency effects were 15%.
APJ Region
In 2015, 15% (2014: 15%) of our total revenue was generated in the APJ region, with the strongest revenue growth being achieved in India. Total revenue in the APJ region increased 18% to €3,185 million. In Japan, revenue increased 11% to €667 million. Revenue from Japan was 21% (2014: 22%) of all revenue generated in the APJ region. The revenue growth in Japan was attributable to a 6% increase from new business and a 5% increase from currency effects. In the remaining countries of the APJ region, revenue increased 21%. Revenue in the remaining countries of the APJ region was generated primarily in Australia, China, and India. Cloud and software revenue in the APJ region totaled €2,663 million in 2015 (2014: €2,221 million). That was 84% of all revenue from the region (2014: 83%). Cloud subscriptions revenue grew 98% to €200 million in 2015 (2014: €101 million). This growth reflects an 82% increase from new cloud business and a 17% increase from currency effects. Software licenses and software support revenue increased 16% to €2,463 million in 2015 (2014: €2,120 million). This increase reflects an 8% increase from new business and an 8% increase from currency effects.
Revenue by Industry
We allocate our customers to one of our industries at the outset of an initial arrangement. All subsequent revenue from a particular customer is recorded under that industry sector.
Revenue by Industry
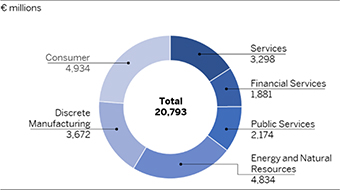
In 2015, we achieved above-average growth in the following industry sectors, measured by changes in total revenue: Public Services (€2,174 million, at a growth rate of 22%); Consumer (€4,934 million, at a growth rate of 22%); and Discrete Manufacturing (€3,672 million, at a growth rate of 20%). Revenue from the other industry sectors was Services (€3,298 million, at a growth rate of 17%); Energy & Natural Resources (€4,834 million, at a growth rate of 16%); and Financial Services (€1,881 million, at a growth rate of 11%).
Operating Profit and Operating Margin
SAP continued to invest in innovation and its cloud business and generated record turnover in 2015. The strong growth in revenue, however, also led to an increase in compensation payments to our employees, while the climbing stock price translated into higher share-based payment expenses. As a result, our operating profit declined slightly by 2% to €4,252 million (2014: €4,331 million).
In 2015, our operating expenses increased €3,311 million or 25% to €16,541 million (2014: €13,230 million). The main contributors to that increase were our acquisition of Concur in December 2014, our greater investment- and revenue-related cloud subscriptions and support costs, our continued investment in sales activities, and higher restructuring expenses.
The effect of acquisition-related expenses, which were €738 million (2014: €562 million), of restructuring expenses, which were €621 million (2014: €126 million), and of a €724 million expense for share-based payments (2014: €290 million) weighed more heavily on operating profit than in the previous year. The record revenue generated increased the cost of bonus payments, and the improving performance of the share price in 2015 pushed share-based payment expenses higher. Continuing investment in the cloud infrastructure, in sales activities around the world, and in research and development also affected operating profit. Our employee headcount (measured in full-time equivalents, or FTEs) increased by 2,579 year-over-year.
| | |
| Combined Management ReportFinancial Performance: Review and Analysis | | 79 |
Operating Profit
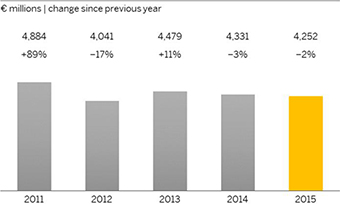
Operating Margin
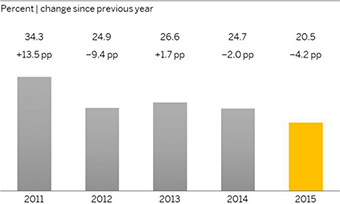
These short-term, negative effects on operating profit largely represent investments in the future and were in part offset by the increase in revenue.
The overall result of these effects on operating profit was a 4.2 percentage point narrowing of our operating margin in 2015 to 20.5 % (2014: 24.7 %).
Changes to the individual elements in our cost of revenue were as follows:
Cost of Cloud and Software
Cost of cloud and software consists primarily of customer support costs, cost of developing custom solutions that address customers’ specific business requirements, costs for deploying and operating cloud solutions, amortization expenses relating to intangibles, and license fees and commissions paid to third parties for databases and the other complementary third-party products sublicensed by us to our customers.
In 2015, the cost of cloud and software increased 30% to €3,313 million (2014: €2,557 million).
Significant costs included an additional €539 million year-over-year to extend our cloud business in response to the sustained strength of customer demand, with an associated increase in the expense of delivering and operating cloud applications, a €164 million revenue-related increase in the license fees we pay to third parties, and a €74 million rise in the cost of providing custom development projects. These investments contributed to revenue growth. Our margin on cloud subscriptions and support narrowed 0.4 percentage points to 55.3% (2014: 55.8%). This decrease was primarily due to increasing expenses related to the extension of our cloud infrastructure. These expenses represent an investment in our fast-growing cloud business of the future, and were in part already offset by a significant increase in cloud subscriptions and support revenue.
The gross margin on cloud and software, defined as cloud and software profit as a percentage of cloud and software revenue, narrowed to 80.8% in 2015 (2014: 82.1%). This change is driven by the revenue mix effect with a rising cloud subscriptions and support revenue share while both cloud subscriptions and support margin as well as software license and support margin only changed marginally.
Cost of Services
Cost of services consists primarily of the cost of consulting, premium services and training personnel and the cost of bought-in consulting and training resources. This item also includes sales and marketing expenses for our services resulting from sales and marketing efforts where those efforts cannot be clearly distinguished from providing the services.
Although we were able to increase our service revenue by 10% year-over-year to €3,579 million in 2015 (2014: €3,245 million), our service business continues to be greatly affected as we trend away from classic software licensing and consulting revenue toward more subscription revenue from cloud solutions. We are also investing in our SAP ONE Service organization. As a result, cost of service rose 22% to €3,313 million (2014: €2,716 million). Our gross margin on services, defined as services profit as a percentage of services revenue, narrowed to 7.4% (2014: 16.3%).
Research and Development Expense
Our research and development (R&D) expense consists primarily of the personnel cost of our R&D employees, costs incurred for independent contractors we retain to assist in our R&D activities, and amortization of the computer hardware and software we use for our R&D activities.
Due to growing personnel costs because of the 11% increase in our headcount by the end of the year, and the revenue-related year-over-year increase in compensation payments, our R&D expense increased by 22% to €2,845 million in 2015 from €2,331 million in 2014. R&D expense as a percentage of total revenue increased to 13.7% (2014: 13.3%). For more information, see theProducts, Research & Development, and Services section.
| | |
| Combined Management ReportFinancial Performance: Review and Analysis | | 80 |
Sales and Marketing Expense
Sales and marketing expense consists mainly of personnel costs, direct sales costs, and the cost of marketing our products and services.
Our sales and marketing expense rose 25% from €4,304 million in 2014 to €5,401 million in 2015. The increase was mainly the result of greater personnel costs as we expanded our global sales force, and of increased expenditure for bonus payments prompted by the strong revenue growth. The ratio of sales and marketing expense to total revenue, expressed as a percentage, increased to 26.0% year-over-year (2014: 24.5%), an increase of 1.5 percentage points.
General and Administration Expense
Our general and administration expense consists mainly of personnel costs to support our finance and administration functions.
General and administration expense increased 17% from €892 million in 2014 to €1,048 million in 2015. That this expense grew less rapidly than revenue is primarily the result of careful cost management. Consequently, the ratio of general and administration expense to total revenue dropped slightly in 2015 to 5.0% (2014: 5.1%).
Segment Information (Non-IFRS)
In 2015, SAP had two reportable segments: the Applications, Technology, and Services segment; and the SAP Business Network segment. These are the components of SAP that our Executive Board regularly reviews to assess the performance of our Company and to make resource allocation decisions.
Revenue and profit figures for each of our operating segments are calculated in line with our internal management reporting and therefore differ from the corresponding revenue and profit in our Consolidated Statements of Income prepared according to IFRS. For more information about our segment reporting, the activities that our two segments derive their revenues from, financial performance measures, and reconciliation from our internal management reporting to our external IFRS reporting, see the Notes to the Consolidated Financial Statements section,Note (28), and thePerformance Management System section.
The financial data presented for 2015 contain all revenues and expenses from Concur and Fieldglass, whereas the prior year’s comparison figures only include their financial data as of their respective acquisition dates. Fieldglass was acquired on May 2, 2014; Concur on December 4, 2014.
Applications, Technology & Services Segment
| | | | | | | | | | | | | | | | |
€ millions, unless otherwise stated (Non-IFRS) | | 2015 | | | 2014 | | | D in % | | | D in %
(Constant
Currency) | |
| Segment revenue | | | 19,126 | | | | 16,871 | | | | 13 | | | | 6 | |
| Gross margin (in %) | | | 72 | | | | 73 | | | | -1pp | | | | -1pp | |
| Cloud subscription and support margin (in %) | | | 53 | | | | 55 | | | | -2pp | | | | -5pp | |
| Segment profit | | | 7,918 | | | | 7,099 | | | | 12 | | | | 4 | |
| Segment margin (in %) | | | 41 | | | | 42 | | | | -1pp | | | | -1pp | |
| | |
| Combined Management ReportFinancial Performance: Review and Analysis | | 81 |
In 2015, the Applications, Technology & Services segment revenue increased 13% (6% at constant currencies) to €19,126 million (2014: €16,871 million). This increase was driven mainly by strong growth in software support revenue, which increased 14% (7% at constant currencies) to €10,061 million and a 10% increase in software licenses (5% at constant currencies) to €4,836 million. As a consequence of continuous strong demand in the human capital management, customer engagement and commerce, and SAP HANA Enterprise Cloud business, cloud subscriptions and support revenue in the Applications, Technology & Services segment grew 64% (45% at constant currencies) to €961 million.
The increase of cloud subscriptions and support revenue and software support revenue results in an increasing revenue share of more predictable revenue streams in this segment of 2 percentage points from 56% in 2014 to 58% in 2015. Software license revenue attributable to this segment increased 10% (5% at constant currencies) to €4,835 million (2014: €4,381 million).
The segment’s cost of revenue during the same time period increased 17% (9% at constant currencies) to €5,343 million (2014: €4,564 million). This increase in expenses was primarily the result of greater investment in expanding our cloud infrastructure and in providing and operating our cloud applications, as well as additional personnel expenses to support the growth of the SAP HANA Enterprise Cloud service. The cloud subscriptions and support margin for the segment, therefore, decreased by 2.2 percentage points to 52.9% (50.4% at constant currencies). Segment gross profit increased 12% in 2015 (5% at constant currencies) to €13,784 million (2014: €12,307 million), which resulted in a decrease of the segment gross margin from 72.9% to 72.1% (72.1% at constant currencies). Segment profit increased 12% (4% at constant currencies) to €7,918 million (2014: €7,099 million), while the segment margin decreased by 0.7 percentage points to 41.4% (41.3% at constant currencies).
SAP Business Network Segment
| | | | | | | | | | | | | | | | |
€ millions, unless otherwise stated (Non-IFRS) | | 2015 | | | 2014 | | | D in % | | | D in %
(Constant
Currency) | |
| Segment revenue | | | 1,614 | | | | 644 | | | | 150 | | | | 116 | |
| Gross margin (in %) | | | 67 | | | | 66 | | | | 1pp | | | | 0pp | |
| Cloud subscription and support margin (in %) | | | 75 | | | | 75 | | | | -0pp | | | | -1pp | |
| Segment profit | | | 312 | | | | 105 | | | | 199 | | | | 139 | |
| Segment margin (in %) | | | 19 | | | | 16 | | | | 3pp | | | | 2pp | |
In 2015, revenue from the SAP Business Network segment, which combines all of our business network solutions, increased 150% (116% at constant currencies) to €1,614 million (2014: €644 million). Concur and Fieldglass, which were acquired in 2014, together contributed €909 million (2014: €107 million) to the segment’s revenue. SAP internal analyses show that more than US$740 billion in commerce is conducted on the network annually.
The segment’s cost of revenue increased 144% in 2015 (114% at constant currencies) to €530 million (2014: €217 million), of which €299 million in expenses are attributable to Concur and SAP Fieldglass (2014: €28 million). The cloud subscriptions and support margin for the segment decreased by 0.4 percentage points to 74.9% (74.5% at constant currencies). The SAP Business Network segment achieved a segment gross profit of €1,084 million in 2015 (2014: €427 million), an increase of 154% (117% at constant currencies). This resulted in an increase of the segment gross margin from 66.3% to 67.2% (66.5% at constant currencies). Segment profit increased 199% year on year (139% at constant currencies) to €312 million (2014: €105 million), resulting in an increase in the segment margin of +3.1 percentage points to 19.4% (18.0% at constant currencies).
Financial Income, Net
Financial income, net, changed to -€5 million (2014: -€25 million). Our finance income was €241 million (2014: €127 million) and our finance costs were €246 million (2014: €152 million).
Finance income mainly consists of gains from disposal of equity securities and interest income from loans and receivables, financial assets (cash, cash equivalents, and current investments), and income of derivatives.
Finance costs mainly consist of interest expense on financial liabilities (€135 million in 2015 compared to €93 million in 2014) due to higher average indebtedness and negative effects from derivatives (€72 million in 2015 compared to €28 million in 2014). For more information about financing instruments, see the Notes to the Consolidated Financial Statements section,Note (17b).
| | |
| Combined Management ReportFinancial Performance: Review and Analysis | | 82 |
Income Tax
Our effective tax rate decreased to 23.4% in 2015 (2014: 24.7%). The year-over-year decrease in the effective tax rate mainly resulted from changes in taxes for prior years. For more information on income taxes, see the Notes to the Consolidated Financial Statements section,Note (10).
Profit After Tax and Earnings per Share
Profit after tax decreased to €3,056 million in 2015 (2014: €3,280 million).
Profit After Tax
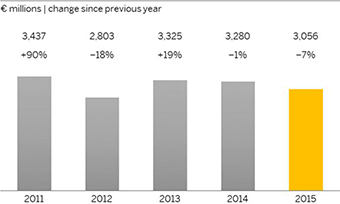
Basic earnings per share decreased to €2.56 (2014: €2.75). The number of shares outstanding increased to 1,197 million in 2015 (2014: 1,195 million).
Earnings per Share
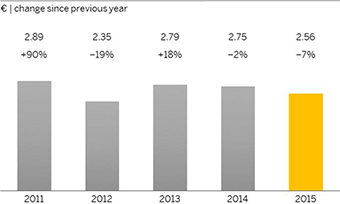
Dividend
We believe our shareholders should benefit appropriately from the profit the Company made in 2015. In recent years, the payout has always been greater than 35% of profit after tax. We aim to continue our policy to pay a dividend totaling more than 35% of profit after tax in the future.
The Executive Board and the Supervisory Board will recommend to the Annual General Meeting of Shareholders that the total dividend will be increased by 5 % to €1.15 per share (2014: €1.10). Based on this recommendation, the overall dividend payout ratio (which here means total distributed dividend as a percentage of profit) would be 45% (2014: 40 %).
If the shareholders approve this recommendation and if treasury shares remain at the 2015 closing level, the total amount distributed in dividends would be €1,378 million. The actual amount distributed may be different from this total because the number of shares held in treasury may change before the Annual General Meeting of Shareholders. In 2015, we distributed €1,316 million in dividends from our 2014 profit. In 2015 and 2014, we did not repurchase any SAP treasury shares.
Dividend per Share

In 2011, in addition to the regular dividend of €0.75 per share, we rewarded our shareholders with a special dividend of €0.35 per share to celebrate our 40th anniversary.
FINANCES (IFRS)
Overview
Global Financial Management
We use global centralized financial management to control liquid assets and monitor exposure to interest rates and currencies. The primary aim of our financial management is to maintain liquidity in the Group at a level that is adequate to meet our obligations. Most SAP companies have their liquidity managed centrally by the Group, so that liquid assets across the Group can be consolidated, monitored, and invested in accordance with Group policy. High levels of liquid assets help keep SAP flexible, sound, and independent. In addition, various credit facilities are currently available for additional liquidity, if required. For more information about these facilities, see theCredit Facilities section.
| | |
| Combined Management ReportFinancial Performance: Review and Analysis | | 83 |
We manage credit, liquidity, interest rate, equity price, and foreign exchange rate risks on a Group-wide basis. We use selected derivatives exclusively for this purpose and not for speculation, which is defined as entering into a derivative instrument for which we do not have a corresponding underlying transaction. The rules for the use of derivatives and other rules and processes concerning the management of financial risks are collected in our treasury guideline document, which applies globally to all companies in the Group. For more information about the management of each financial risk and about our risk exposure, see the Notes to the Consolidated Financial Statements section,Notes (24) to(26).
Liquidity Management
Our primary source of cash, cash equivalents, and current investments is funds generated from our business operations. Over the past several years, our principal use of cash has been to support operations and our capital expenditure requirements resulting from our growth, to quickly repay financial debt, to acquire businesses, to pay dividends on our shares, and to buy back SAP shares on the open market. On December 31, 2015, our cash, cash equivalents, and current investments were primarily held in euros and U.S. dollars. We generally invest only in the financial assets of issuers or funds with a minimum credit rating of BBB, and pursue a policy of cautious investment characterized by wide portfolio diversification with a variety of counterparties, predominantly short-term investments, and standard investment instruments. We rarely invest in the financial assets of issuers with a credit rating lower than BBB, and such investments were not material in 2015.
We believe that our liquid assets combined with our undrawn credit facilities are sufficient to meet our present operating needs and, together with expected cash flows from operations, will support debt repayments and our currently planned capital expenditure requirements over the near term and medium term. It may also be necessary to enter into financing transactions when additional funds are required that cannot be wholly sourced from free cash flow (for example, to finance large acquisitions).
To expand our business, we have made acquisitions of businesses, products, and technologies. Depending on our future cash position and future market conditions, we might issue additional debt instruments to fund acquisitions, maintain financial flexibility, and limit repayment risk. Therefore, we continuously monitor funding options available in the capital markets and trends in the availability of funds, as well as the cost of such funding. In recent years, we were able to repay additional debt within a short period of time due to our persistently strong free cash flow. For more information about the financial debt, see theCash Flows and Liquidity section.
Capital Structure Management
The primary objective of our capital structure management is to maintain a strong financial profile for investor, creditor, and customer confidence, and to support the growth of our business. We seek to maintain a capital structure that will allow us to cover our funding requirements through the capital markets at reasonable conditions, and in so doing, ensure a high level of independence, confidence, and financial flexibility.
The long-term credit rating for SAP SE is “A” by Standard and Poor’s and “A2” by Moody’s, both with stable outlook. Since their initial assignment in September 2014, the ratings and outlooks have not changed.
Our general intention is to remain in a position to return liquidity to our shareholders by distributing annual dividends totaling more than 35% of our profit after tax. There are currently no plans for future share buybacks.
Capital Structure
| | | | | | | | | | | | | | | | | | | | |
| | | 2015 | | | 2014 | | | D in % | |
| | | € millions | | | % of Total equity and
liabilities | | | € millions | | | % of Total equity and
liabilities | | | | |
| Equity | | | 23,295 | | | | 56 | | | | 19,534 | | | | 51 | | | | 19 | |
Current liabilities | | | 7,867 | | | | 19 | | | | 8,574 | | | | 22 | | | | -8 | |
Non-current liabilities | | | 10,228 | | | | 25 | | | | 10,457 | | | | 27 | | | | -2 | |
| Liabilities | | | 18,095 | | | | 44 | | | | 19,031 | | | | 49 | | | | -5 | |
| | | | | | | | | | | | | | | | | | | | |
| Total equity and liabilities | | | 41,390 | | | | 100 | | | | 38,565 | | | | 100 | | | | 7 | |
In 2015, we repaid €1,270 million in bank loans that we had taken to finance the Concur acquisition and refinanced another part of this loan through the issuance of a three-tranche Eurobond of €1.75 billion in total with maturities of two to ten years. We also repaid a €550 million Eurobond and a US$300 million U.S. private placement tranche at their maturity. Thus, the ratio of total financial debt to total equity and liabilities decreased by 7 percentage points to 22% at the end of 2015 (29% as at December 31, 2014).
| | |
| Combined Management ReportFinancial Performance: Review and Analysis | | 84 |
Total financial debt consists of current and non-current bank loans, bonds, and private placements. For more information about our financial debt, see the Notes to the Consolidated Financial Statements section, Note (17).
As part of our financing activities in 2016, the Company intends to repay a US$600 million U.S. private placement tranche when it matures and a further substantial portion of our outstanding bank loan.
Total liabilities on December 31, 2015, mainly comprised financial liabilities of €9,522 million (of which €8,681 million are non-current). Financial liabilities on December 31, 2015, consisted largely of financial debt, which included amounts in euros (€6,994 million) and U.S. dollars (€2,202 million). On December 31, 2015, approximately 64% of financial debt was held at variable interest rates, partially swapped from fixed into variable using interest rate swaps. Total liabilities on December 31, 2015, also comprised non-financial liabilities. Most of these non-financial liabilities result from employee-related obligations.
For more information about financial and non-financial liabilities, see the Notes to the Consolidated Financial Statements section,Note (18).
CASH FLOWS AND LIQUIDITY
Group liquidity on December 31, 2015, primarily comprised amounts in euros and U.S. dollars. Current investments are included in other financial assets in the statement of financial position. Financial debts are included within financial liabilities in the statement of financial position.
Group Liquidity of SAP Group
| | | | | | | | | | | | |
€ millions | | 2015 | | | 2014 | | | D | |
| Cash and cash equivalents | | | 3,411 | | | | 3,328 | | | | 83 | |
| Current investments | | | 148 | | | | 95 | | | | 53 | |
| | | | | | | | | | | | |
| Group liquidity | | | 3,559 | | | | 3,423 | | | | 136 | |
| Current financial debt | | | -567 | | | | -2,157 | | | | 1,590 | |
| | | | | | | | | | | | |
| Net liquidity 1 | | | 2,992 | | | | 1,266 | | | | 1,726 | |
| Non-current financial debt | | | -8,607 | | | | -8,936 | | | | 329 | |
| | | | | | | | | | | | |
| Net liquidity 2 | | | -5,615 | | | | -7,670 | | | | 2,055 | |
Group liquidity consists of cash and cash equivalents (for example, cash at banks, money market funds, and time deposits with original maturity of three months or less) and current investments (for example, investments with original maturities of greater than three months and remaining maturities of less than one year) as reported in our Consolidated Financial Statements.
| | |
| Combined Management ReportFinancial Performance: Review and Analysis | | 85 |
Group Liquidity Development
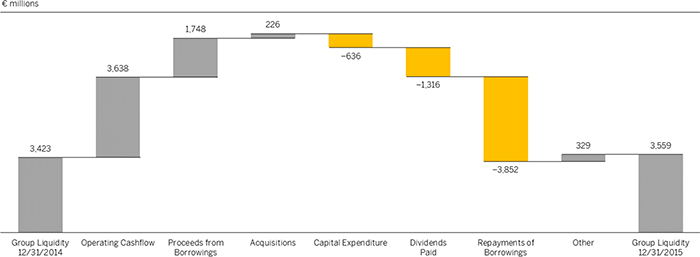
Net liquidity is Group liquidity less total financial debt as defined above.
The increase in Group liquidity compared to 2014 was mainly due to cash inflows from our operations and financing activities in issuing bonds. They were offset by cash outflows for dividend payments and repayments of borrowings.
For information about the impact of cash, cash equivalents, current investments, and our financial liabilities on our income statements, see the analysis of our financial income, net, in theOperating Results (IFRS) section.
Analysis of Consolidated Statements of Cash Flow
| | | | | | | | | | | | |
€ millions | | 2015 | | | 2014 | | | D in % | |
| Net cash flows from operating activities | | | 3,638 | | | | 3,499 | | | | 4 | |
| Net cash flows from investing activities | | | -334 | | | | -7,240 | | | | -95 | |
| Net cash flows from financing activities | | | -3,356 | | | | 4,298 | | | | <-100 | |
Net cash provided by operating activities increased 4% year-over-year to €3,638 million in 2015 (2014: €3,499 million). Payments in connection with the restructuring of €204 million to employees and €272 million to insurance policies have offset partly the non-recurring effect from litigations in 2014. In 2015, days’ sales outstanding (DSO) for receivables, defined as the average number of days from the raised invoice to cash receipt from the customer, increased six days to 71 days (2014: 65 days).
Cash outflows from investment activities decreased significantly to €334 million in 2015 (2014: €7,240 million). Cash outflows from purchase of intangible assets and property, plant, and equipment remained stable. Cash outflows in 2014 had resulted mainly from business combinations of Concur and Fieldglass. For more information about current and planned capital expenditures, see theAssets sectionand the Investment Goalssection.
Net cash outflows from financing activities were €3,356 million in 2015, compared to net cash inflows of €4,298 million in 2014. The 2015 cash outflows had resulted from repayments of €1,270 million bank loans, €550 million Eurobonds and US$300 million private placements. We refinanced another part of the bank loan through the issuance of a three-tranche Eurobond of €1,750 million in total. Cash inflows in 2014 were the result of issuing a €2,750 million Eurobond and drawing two tranches (of €1,270 million and €3,000 million) of a bank loan. Cash outflows in 2014 arose chiefly from repayments of €1,086 million borrowings and US$1,160 million convertible bonds that we assumed in connection with our acquisition of Concur.
The dividend payment of €1,316 million made in 2015 exceeded the amount of €1,194 million in the prior year resulting from the increased dividend paid per share from €1.00 to €1.10.
Credit Facilities
Other sources of capital are available to us through various credit facilities, if required.
We are party to a revolving €2.0 billion credit facility contract with maturity in November 2020. The credit line may be used for general corporate purposes. A possible future withdrawal is not subject to any financial covenants. Borrowings under the facility
| | |
| Combined Management ReportFinancial Performance: Review and Analysis | | 86 |
bear interest at the Euro Interbank Offered Rate (EURIBOR) or London Interbank Offered Rate (LIBOR) for the respective optional currency plus a margin ranging from 0.3% to 0.525%. We pay a commitment fee of 0.079% per annum on unused amounts of the available credit facility. So far, we have not used and do not currently foresee any need to use, this credit facility.
As at December 31, 2015, SAP SE had additional available credit facilities totaling €471 million. Several of our foreign subsidiaries have credit facilities available that allow them to borrow funds at prevailing interest rates. As at December 31, 2015, approximately €49 million was available through such arrangements. There were immaterial borrowings outstanding under these credit facilities from our foreign subsidiaries as at December 31, 2015.
ASSETS (IFRS)
Analysis of Consolidated Statements of Financial Position
Total assets increased by 7% year-over-year to €41,390 million.
Breakdown of Consolidated Statements of Financial Position

Total current assets increased by 8% in 2015 from €8,999 million to €9,739 million. This was mainly due to an increase in trade and other receivables to €5,275 million (2014: €4,342 million) stemming from strong business in the last quarter of 2015.
Total non-current assets increased by 7% in 2015 to €31,651 million compared to the previous year’s figure of €29,566 million. This change was mainly due to foreign exchange related revaluations.
Investment in Goodwill, Intangible Assets or Property, Plant, and Equipment
(incl. Capitalizations due to Acquisitions)
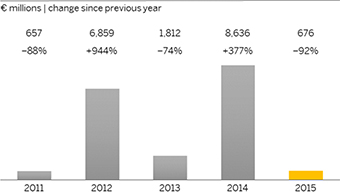
Current liabilities decreased by 8% to €7,867 million in 2015 as compared to the prior year (€8,574 million) which is mainly due to repayments of a short-term bank loan we took to finance the Concur acquisition.
Total non-current liabilities decreased slightly by €229 million in 2015 to €10,228 million compared to the previous year figure of €10,457 million.
For more information about financing activities in 2015, see theFinances (IFRS) section.
Thus, the equity ratio (that is, the ratio of shareholders’ equity to total assets) improved to 56% (prior year: 51%).
Equity Ratio
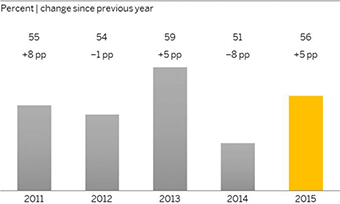
Principal Capital Expenditures and Divestitures Currently in Progress
In 2015, we continued with various construction projects and started new construction activities in several locations. The expansion of our data centers is again an important aspect of our investments planned for 2016. We aim to extend our office space to be able to cover future growth. We plan to cover all of these projects in full from operating cash flow. Our most important projects are:
| | |
| Combined Management ReportFinancial Performance: Review and Analysis | | 87 |
| ¡ | | In Bangalore, India, we want to add additional capacity of roughly 2,500 employees. We estimate the total cost to be approximately €50 million, of which we had paid approx- imately €7 million as at December 31, 2015. We expect to complete the construction of this office building in 2017. |
| ¡ | | In Ra’anana, Israel, we continued with the construction of a new building. We estimate the total cost of this project to be approximately €60 million, of which we had paid approx- imately €25 million as at December 31, 2015. We expect to complete the construction of this office building in 2016. |
| ¡ | | In our research center in Potsdam, Germany, we started a third construction phase to realize additional capacity for approximately 150 employees. With the extension of our research center, we aim to create the general conditions for further teams contributing innovations to SAP products in miscellaneous fields. We estimate the total cost to be approximately €16 million, of which we had paid approximately €11 million as at December 31, 2015. We expect to complete the construction of this office building in 2016. |
| ¡ | | In New York, New York, in the United States, we continued executing the leasehold improvements for our new office space. The project includes the consolidation of our New York City offices for approximately 450 employees. We estimate the total capital expenditures for this project to be approximately €34 million, of which we had paid approx- imately €3.5 million as at December 31, 2015. We expect to complete the leasehold improvements in 2016. |
| ¡ | | In Dubai, United Arab Emirates, we continued with our office consolidation project including an expansion of office space adding additional capacity for 100 employees. We estimate the total cost to be approximately €11 million, of which we had paid approximately €0.9 million as at December 31, 2015. We expect to complete the leasehold improvements in 2016. |
| ¡ | | In Walldorf, Germany, we started construction on a new office building for about 700 employees. We estimate the total cost to be approximately €71 million, of which we had paid approximately €0.5 million as of December 31, 2015. We expect to complete the construction in 2018. |
| ¡ | | In Walldorf, Germany, we also started construction on a new data center as well as a new power station. We estimate the total cost to be approximately €58 million, of which we had paid approximately €0.7 million as at December 31, 2015. We expect to complete the construction for both projects in 2017. |
| ¡ | | In Prague, Czech Republic, we started the expansion of an office building and began an office move. We estimate the total capital expenditures for this project to be approximately €19 million. We expect to complete the project in 2016. |
| ¡ | | In Colorado Springs, Colorado, in the United States, we started construction on a new data center in 2015. We estimate the total cost of this project to be approximately €75 million. We expect to complete the construction of this data center in 2017. |
| ¡ | | In San Ramon, California, in the United States, we began an office move. We estimate the total cost of this move to be approximately €22 million. We expect to complete this project in 2017. |
| ¡ | | In Shanghai, China, we started an expansion of our office building. We estimate the total cost to be approximately €15 million, of which we had paid approximately €2 million as at December 31, 2015. We expect to complete the construction in 2016. |
For more information about planned capital expenditures, see theInvestment Goals section. There were no material divestitures within the reporting period.
COMPETITIVE INTANGIBLES
The resources that are the basis for our current as well as future success do not appear on the Consolidated Statements of Financial Position. This is apparent from a comparison of the market capitalization of SAP SE (based on all outstanding shares), which was €90.1 billion at the end of 2015 (2014: €71.6 billion), with the book value of our equity on the Consolidated Statements of Financial Position, which was €23.3 billion (2014: €19.5 billion). This means that the market capitalization of our equity is nearly four times higher than the book value. The difference is mainly due to certain internally generated intangible resources that the applicable accounting standards do not allow to be recorded (at all or at fair value) on the Consolidated Statements of Financial Position. They include customer capital (our customer base and customer relations), employees and their knowledge and skills, our ecosystem of partners, software we developed ourselves, our ability to innovate, the brands we have built up – in particular, the SAP brand itself – and our organization.
As of December 31, 2015, SAP was the second most valuable companies in Germany in terms of market capitalization based on all outstanding shares.
According to the Interbrand “Best Global Brands” annual survey, SAP ranked as the 26th most valued brand in the world (2014: 25th). Against other German brands, the SAP brand ranks third behind Mercedes-Benz and BMW, and 9th globally against other IT brands. Interbrand determined our brand value as US$ 18.8 billion, an increase of 8 % compared to the previous year (2014: US$17.3 billion).
The results of our current and past investment in research and development are also a significant element in our competitive intangibles.
Our customer capital continued to grow in 2015. At the end of 2015 we had approx. 300,000 customers (2014: 282,000) in various market segments. The U.S. magazineForbes revealed in its World’s Most Valuable Brands report that 98% of the 100 most valued brands, 87% of the Forbes Global 2000 companies, and 100% of the Dow Jones top scoring sustainability
| | |
| Combined Management ReportFinancial Performance: Review and Analysis | | 88 |
companies are SAP customers. To help us improve insight into our customers’ view of SAP, in 2012 we began measuring our Customer Net Promoter Score (NPS), a metric that gives a more complete picture of customer loyalty as it answers the question of how likely our customers would be to recommend SAP. For more information about our new customers and the Customer NPS, see theCustomers section.
Employee-related activities increased the value of our employee base and our own software. For more information, see theEmployees and Social Investment section and theProducts, Research & Development, and Services section. We also increased the value of our partner ecosystem by continuing to develop sales and development partnerships.
REPORT ON THE ECONOMIC POSITION OF SAP SE
SAP SE is headquartered in Walldorf, Germany, and is the parent company of the SAP Group, which comprises 256 companies. SAP SE is the Group holding company and employs most of the Group’s Germany-based development and service and support personnel.
As the owner of the intellectual property in most SAP software, SAP SE derives its revenue mainly from software license fees paid by its subsidiaries for the right to market SAP solutions.
The SAP SE annual financial statements are prepared in accordance with the reporting standards in the German Commercial Code and the German Stock Corporation Act. The full SAP SE annual financial report and unqualified audit report are submitted to the operator of theElektronischer Bundesanzeiger (Online German Federal Gazette) for publication and inclusion in theUnternehmensregister (German Business Register). It is available from SAP SE on request.
Income
The income statement uses the nature of expense method and presents amounts in millions of euros.
SAP SE Income Statement – German Commercial Code (Short Version)
| | | | | | | | |
€ millions | | 2015 | | | 2014 | |
| Total revenue | | | 10,866 | | | | 8,957 | |
| Other operating income | | | 1,719 | | | | 722 | |
| Cost of services and materials | | | -4,031 | | | | -3,099 | |
| Personnel expenses | | | -1,764 | | | | -1,476 | |
| Depreciation and amortization | | | -263 | | | | -272 | |
| Other operating expenses | | | -3,955 | | | | -2,697 | |
| | | | | | | | |
| Operating profit | | | 2,573 | | | | 2,135 | |
| | | | | | | | |
| Finance income | | | 929 | | | | 921 | |
| | | | | | | | |
| Income from ordinary activities | | | 3,501 | | | | 3,056 | |
| Taxes | | | -837 | | | | -749 | |
| | | | | | | | |
| Net income | | | 2,664 | | | | 2,307 | |
The total revenue of SAP SE in 2015 was €10,866 million (2014: €8,957 million), an increase of 21%. Product revenue increased €1,125 million to €8,051 million (2014: €6,926 million). As in previous years, product revenue was primarily generated from license fees paid by subsidiaries of SAP SE. Therefore, the increase in SAP SE revenue in 2015 was principally a result of the increase in cloud and software revenue achieved by the SAP Group. Due to intensified pooling of services at SAP SE and positive currency effects, other revenues increased by 47% to €2,270 million.
SAP SE operating profit increased 21% to €2,573 million (2014: €2,135 million) owing to the growth in revenue. Other operating income increased €997 million to €1,719 million (2014: €722 million). The year-over-year increase is due primarily to an increase in gains from currency effects. SAP SE cost of services and materials increased 30% to €4,031 million (2014: €3,099 million). SAP SE cost of services and materials comprises third-party services, including those provided by SAP subsidiaries. The rise is mainly due to increased services received in the context of intra group cost allocations. SAP SE personnel expenses, mainly the labor cost of software developers, service and support employees, and administration staff employed by SAP SE, increased 20% to €1,764 million (2014: €1,476 million) primarily because of higher share-based compensation expenses and headcount increase over the year. Other operating expenses increased 47% to €3,955 million (2014: €2,697 million). This increase is mainly attributable to €722 million higher losses from currency effects, a €385 million increase in expenses for licenses and provisions and restructuring costs that increased by €261 million compared to the previous year. The effect was partly offset by a €256 million decrease in miscellaneous other expenses.
Finance income was €929 million (2014: €921 million), an increase of €8 million compared with the previous year. The increase is primarily due to a €48 million higher income from profit transfer agreements and a decrease of €11 million in write-downs of financial assets. These were partly offset by a decrease of €46 million in net interest income.
SAP SE income from ordinary activities, which is the sum of operating profit and finance income, increased €445 million to €3,501 million (2014: €3,056 million). Income and other taxes increased 12% to €837 million (2014: €749 million). After deducting taxes, the resultant net income is €2,664 million (2014: €2,307 million), an increase of €357 million year-over-year.
| | |
| Combined Management ReportFinancial Performance: Review and Analysis | | 89 |
Assets and Financial Position
In 2015, SAP SE total assets closed at €30,953 million (2014: €30,206 million).
SAP SE Balance Sheet – German Commercial Code (Short Version)
| | | | | | | | |
€ millions | | 12/31/2015 | | | 12/31/2014 | |
| Assets | | | | | | | | |
| Intangible assets | | | 184 | | | | 232 | |
| Property, plant, and equipment | | | 999 | | | | 994 | |
| Financial assets | | | 25,257 | | | | 24,953 | |
| Fixed assets | | | 26,440 | | | | 26,179 | |
| Inventories | | | 2 | | | | 2 | |
| Accounts receivable | | | 3,872 | | | | 3,085 | |
| Liquid assets | | | 360 | | | | 691 | |
| Short-term assets | | | 4,233 | | | | 3,778 | |
| Prepaid expenses and deferred charges | | | 173 | | | | 146 | |
| Deferred taxes | | | 106 | | | | 70 | |
| Surplus arising from offsetting | | | 1 | | | | 33 | |
| | | | | | | | |
| Total assets | | | 30,953 | | | | 30,206 | |
| | |
| Equity and liabilities | | | | | | | | |
| Shareholders’ equity | | | 14,024 | | | | 12,494 | |
| Provisions | | | 1,247 | | | | 1,102 | |
| Other liabilities | | | 15,679 | | | | 16,605 | |
| Deferred income | | | 3 | | | | 5 | |
| | | | | | | | |
| Total shareholders’ equity and liabilities | | | 30,953 | | | | 30,206 | |
Financial assets increased €304 million compared with the previous year to €25,257 million (2014: €24,953 million), due mainly to the increase in contributions to subsidiaries. Short-term assets stood at €4,233 million (2014: €3,778 million), a year-over-year increase of €455 million, reflecting a €787 million increase in accounts receivable and €331 million decrease in liquid assets.
SAP SE shareholders’ equity rose 12% to €14,024 million (2014: €12,494 million). Against outflows of €1,316 million associated with the payment of the 2014 dividend, there was a €2,664 million increase in net income and an inflow of €180 million from the issuance of shares to service the share-based payments of employees. The equity ratio (that is, the ratio of shareholders’ equity to total assets) increased from 41% in 2014 to 45% in 2015.
Provisions increased €145 million to €1,247 million (2014: €1,102 million). While the other provisions increased €170 million to €844 million primarily as a result of additions to the other employee-related liabilities, the reserves for tax decreased €28 million to €398 million (2014: €426 million).
Other liabilities decreased €926 million to €15,679 million (2014: €16,605 million). This decrease is mainly attributable to contrasting effects: On the one hand, SAP SE issued new debt in the amount of €1,750 million and liabilities to affiliated companies increased €817 million, primarily due to increased cash contributions by subsidiaries through SAP SE centralized management of finance and liquidity; on the other hand, SAP SE repaid €3,020 million in liabilities to banks and made a scheduled repayment of a bond in the amount of €550 million.
SAP SE Cash Flow Statement – German Commercial Code (Short Version)
| | | | | | | | |
€ millions | | 2015 | | | 2014 | |
| Net cash flows from operating activities | | | 1,835 | | | | 1,309 | |
| Net cash flows from investing activities | | | 447 | | | | -7,204 | |
| Net cash flows from financing activities | | | -3,118 | | | | 5,175 | |
| Net decrease/increase in funds of financial resources | | | -836 | | | | -720 | |
| | | | | | | | |
| Funds of financial resources at the beginning of the year | | | -5,368 | | | | -4,648 | |
| Cash and cash equivalents | | | 360 | | | | 691 | |
| Cash pool balances | | | -6,564 | | | | -6,059 | |
| | | | | | | | |
| Funds of financial resources at the end of the year | | | -6,204 | | | | -5,368 | |
Cash flow from operating activities increased €526 million to €1,835 million in 2015 (2014: €1,309 million), largely caused by the increase in net income.
SAP SE net cash flows from investing activities were €447 million in 2015 compared to a cash outflow of €7,204 million in 2014. Received finance income of €1,160 million and inflows of €76 million from sales of property, plant, and equipment were in part offset by outflows of €295 million for financial assets, €248 million for intangible assets and property, plant, and equipment and €244 million contributions to plan assets. The previous year net cash outflow from investing activities was notably due to the contributions to the capital of SAP America, Inc. in 2014 in connection with the acquisition of Concur and Fieldglass.
Net cash outflows from financing activities were €3,118 million in 2015 compared to a cash inflow of €5,175 million in 2014. Inflows of €1,926 million were attributable to issued new bonds of €1,750 million, taking up intercompany loans of €111 million and €65 million inflows were generated from the reissuance of treasury shares for share-based payments. SAP SE outflows included the dividend of €1,316 million (2014: €1,194 million), interest payments of €158 million (2014: €115 million) and repayments of financial liabilities of €3,570 million.
| | |
| Combined Management ReportFinancial Performance: Review and Analysis | | 90 |
At the close of the year, SAP SE funds of financial resources amounted to €-6,204 million (2014: €-5,368 million), a year-over-year decrease of €836 million; thereof €505 million were cash contributions by subsidiaries through SAP SE centralized management of finance and liquidity. In addition short-term liquid assets decreased by €331 million and closed at €360 million (2014: €691 million).
Opportunities and Risks
SAP SE is subject to materially the same opportunities and risks as the SAP Group. For more information, see theRisk Management and Risks section as well as theExpected Developments and Opportunitiessection.
| | |
| Combined Management ReportFinancial Performance: Review and Analysis | | 91 |
Corporate Governance Fundamentals
CORPORATE GOVERNANCE STATEMENT
The German Commercial Code, section 289a, requires that as a listed company, SAP SE publish a corporate governance statement either as part of our management report or on our Web site. The Executive Board of SAP SE filed the corporate governance statement on February 24, 2016, and published it on our public Web site at www.sap.com/corporate-en/investors/governance.
For more information about the corporate governance of SAP, see theCorporate Governance Report section.
CHANGES IN MANAGEMENT
On January 9, 2015, Michael Kleinemeier and Steve Singh were appointed to the Global Managing Board, with immediate effect. Steve Singh, CEO of Concur, is responsible for our business network strategy. Michael Kleinemeier led service and support efforts worldwide. As of November 1, 2015, Michael Kleinemeier was appointed to the Executive Board and assumed sole responsibility for the Global Service & Support organization.
With effect from July 15, 2015, the Executive Board appointed Quentin Clark to the Global Managing Board. He became our new chief business officer as of October 1, 2015.
On November 1, 2015, Gerhard Oswald assumed responsibility for our new Product Quality & Enablement organization.
INFORMATION CONCERNING TAKEOVERS
Information required under the German Commercial Code, sections 289 (4) and 315 (4), with explanatory report:
| ¡ | | Composition of share capital: For information about the composition of SAP SE share capital as at December 31, 2015, see the Notes to the Consolidated Financial Statements section,Note (20). Each share entitles the bearer to one vote. American depositary receipts (ADRs) representing our shares are listed on the New York Stock Exchange in the United States. ADRs are certificates representing non-U.S. shares and are traded on U.S. stock exchanges instead of the underlying shares. One SAP ADR corresponds to one SAP share. |
| ¡ | | Restrictions applying to share voting rights or transfers: SAP shares are not subject to transfer restrictions except the lock-in period under the SAP Share Matching Plan (SMP), described below. SAP held 30,551,035 treasury shares as at December 31, 2015. Treasury shares do not entitle us to any voting rights or dividend rights or other rights. Shares issued in 2015 under the employee SMP are subject to contractual transfer restrictions for a three-year lock-in period unless the plan member’s employment with SAP is ended during that period. Until that lock-in period has expired, the participating employees are not ordinarily allowed to dispose of the shares they have acquired under the plan. We are not aware of any other restrictions applying to share voting rights or to share transfers. |
| ¡ | | Shareholdings that exceed 10% of the voting rights: We are not aware of any direct or indirect SAP SE shareholdings that exceed 10% of the voting rights. |
| ¡ | | Shares with special rights conferring powers of control: No SAP shareholder has special rights conferring powers of control. |
| ¡ | | Type of control over voting rights applying to employee shareholders who do not directly exercise their control rights: As with other shareholders, employee holders of SAP shares exercise their control rights in accordance with the law and the Articles of Incorporation. In votes on the formal approval of their acts at the Annual General Meeting of Shareholders, employee representatives on the Supervisory Board, as all other members of the Supervisory Board, are prohibited from exercising the voting rights associated with their shares. |
| ¡ | | Requirements concerning appointments and dismissals of members of the Executive Board and amendments to the Articles of Incorporation: Conditions for the appointment and dismissal of members of the Executive Board and amendment to the Articles of Incorporation reflect the relevant provisions of applicable European and German law, including Council Regulation (EC) No. 2157/2001 on the Statute for a European Company (the “SE Regulation”) and the German Stock Corporation Act. Under the Articles of Incorporation, the Executive Board consists of at least two members who are appointed for a period of not more than five years by the Supervisory Board in accordance with the |
| | |
| Combined Management ReportCorporate Governance Fundamentals | | 92 |
| | SE Regulation, articles 39 and 46. The number of members of the Executive Board is decided by the Supervisory Board. Executive Board members may be reappointed for, or their term of office extended by, a maximum of five years. A simple majority of the Supervisory Board membership is required for Executive Board appointments. In the event of a tie, the chairperson of the Supervisory Board has the casting vote. The Supervisory Board can appoint a chairperson of the Executive Board and one or more deputy chairpersons from among the members of the Executive Board. The Supervisory Board can revoke appointments to the Executive Board in accordance with the SE Regulation, article 9, and the German Stock Corporation Act, section 84, if compelling reasons exist, such as gross negligence on the part of the Executive Board member. If the Executive Board is short of a required member, one may be appointed in urgent cases by a court in accordance with the SE Regulation, article 9, and the German Stock Corporation Act, section 85. In accordance with the SE Regulation, article 59, and the German Stock Corporation Act, section 179, an amendment of the Articles of Incorporation requires a resolution of the General Meeting of Shareholders with a majority of at least three-quarters of the valid votes cast. For any amendments of the Articles of Incorporation that require a simple majority for stock corporations established under German law, however, the simple majority of the valid votes cast is sufficient if at least half of the subscribed capital is represented or, in the absence of such quorum, the majority prescribed by law (that is, two-thirds of the votes cast, pursuant to article 59 of the SE Regulation) is sufficient. Section 11 (2) of the Articles of Incorporation authorizes the Supervisory Board to amend the Articles of Incorporation where such amendments only concern the wording. |
| ¡ | | Power to issue and repurchase shares: The Annual General Meeting of Shareholders on May 25, 2011, granted powers to the Executive Board, subject to the consent of the Supervisory Board, to issue convertible and warrant-linked bonds and to grant conversion and option rights in respect of SAP SE shares representing a total attributable portion of the share capital of not more than €100 million secured by a corresponding amount of contingent capital. These powers will expire on May 24, 2016. The Executive Board is also authorized until May 19, 2020, to increase the share capital by not more than €250 million by issuing new shares against contributions in cash and to increase the share capital by not more than €250 million by issuing new shares against contributions in cash or in kind. For more details about the different tranches of authorized capital and the aforementioned contingent capital, see the Articles of Incorporation, section 4. The Annual General Meeting of Shareholders on June 4, 2013, granted a power to the Executive Board in accordance with the German Stock Corporation Act, section 71 (1)(8), to buy back for treasury on or before June 3, 2018, SAP SE shares attributable in total to not more than €120 million of the share capital. The power is subject to the proviso that the shares repurchased, together with any shares that were previously acquired and are still held by SAP in treasury and any other shares controlled by SAP, must not in total exceed 10% of SAP’s share capital. Executive Board powers, such as those described to issue and repurchase stock and to grant rights of conversion and subscription to shares of SAP, are widely followed common practice among German companies such as SAP. They give the Executive Board the flexibility it needs, in particular, the options to use SAP shares as consideration in equity investments, raise funds on the financial markets at short notice on favorable terms, or return value to shareholders during the course of the year. |
| ¡ | | Material agreements with change of control provisions: SAP SE has concluded the following material agreements with provisions that take effect in the event of a change of control, whether following a takeover bid or otherwise: |
The terms of SAP’s syndicated €2 billion revolving credit facility include a change-of-control clause. For more information about this syndicated credit facility, see the Notes to the Consolidated Financial Statements section,Note (25). This clause obliges SAP SE to notify the banks in case of a change of control. If, on receiving the notification, banks that represent at least two-thirds of the credit volume so require, the banks have the right to cancel the credit facility and demand complete repayment of the outstanding debt. If no continuation agreement is reached, the credit facility would end and the obligation to repay would become effective at an ascertainable time.
In agreements between SAP SE and various banks for bilateral credit facilities that totaled €471 million as at December 31, 2015, we have agreed customary material adverse change clauses permitting the banks to terminate if events occur that are materially averse to the economic standing of SAP SE, which may possibly also include a change of control. We believe that in view of our current liquidity situation, termination of these credit facilities would not have a material adverse effect, at least in the near term.
In 2012, SAP set up a Debt Issuance Program that currently has a volume of €8 billion. Of SAP’s total amount of Eurobonds of €5.75 billion outstanding as of December 31, 2015, €5.25 billion were issued under the Debt Issuance Program. For more information about SAP’s Eurobonds, see the Notes to the Consolidated Financial Statements section,Note (17b). Under the terms agreed with the buyers, we are required to notify the buyers of any change of control without delay. If there is a change of control and SAP is consequently assigned a lower credit rating within a defined period, buyers are entitled to demand repayment.
Under the terms of our U.S. private placements totaling US$2.35 billion, we are required to offer lenders repayment of outstanding debt if there is a change of control and SAP is consequently assigned a lower credit rating within a defined period. For more information about these private placements, see the Notes to the Consolidated Financial Statements section,Note (17b). Lenders would have at least 30 days to accept the offer.
| | |
| Combined Management ReportCorporate Governance Fundamentals | | 93 |
| | We have entered into relationships with other companies to jointly develop and market new software products. These relationships are governed by development and marketing agreements with the respective companies. Some of the agreements include provisions that, in the event of a change of control over one of the parties, give the other party a right to consent to the assignment of the agreement or to terminate it. |
| ¡ | | Change of control provisions in Executive Board compensation agreements: Agreements have been concluded with the members of the Executive Board concerning compensation in the event of a change of control. These agreements, which are customary in Germany and elsewhere, are described in the compensation report, which is an integral part of this management report. We have no analogous compensation agreements with other employees. |
| | |
| Combined Management ReportCorporate Governance Fundamentals | | 94 |
Risk Management and Risks
OUR RISK MANAGEMENT
Internal Control and Risk Management System
As a global company, SAP is exposed to a broad range of risks across our business operations. As a consequence, our Executive Board has put comprehensive risk management and internal control structures in place that enable SAP to identify and analyze risks early and take appropriate action. Our risk management and internal control system is designed to identify potential events that could negatively impact the Company and to provide reasonable assurance regarding the operating effectiveness over our financial reporting in place ensuring the achievement of the Company objectives, specifically our ability to achieve our financial, operational, or strategic goals as planned.
This system comprises numerous control mechanisms and is an important element of our corporate decision-making process; it is therefore implemented as an integral part of SAP’s business processes across the entire Group. To ensure that our global risk management efforts are effective while also enabling us to aggregate risks and report on them transparently, we have adopted an integrated risk management and internal control approach.
Due to our public listings in both, Germany and the United States, we are subject to both, German and U.S. regulatory requirements that relate to risk management and internal controls over financial reporting, such as provisions in the German Stock Corporation Act, section 91 (2) and the U.S. Sarbanes-Oxley Act (SOX) of 2002, specifically sections 302 and 404. Hence, our Executive Board has established an early warning system (risk management system) to ensure compliance with applicable regulations and an effective management of risks.
Our risk management system is based on five pillars, which include a dedicated risk management policy and a standardized risk management methodology as well as a global risk management organization. Our internal control system consists of the internal control and risk management system for financial reporting (ICRMSFR) that also covers the broader business environment. In 2015, we adjusted existing control designs to adequately address the changed risk environment and continued to automate our internal control landscape leveraging continuous control monitoring and continuous auditing activities in selected business areas. Using the current Committee of Sponsoring Organizations of the Treadway Commission (COSO) framework of 2013, we define and cover internal controls along the value chain on a process and subprocess level to ensure that sound business objectives are set in line with the organization’s strategic, operational, financial, and compliance goals. In addition, we have a governance model in place across risk management and the internal control system to ensure both systems are effective, as well as a central software solution to store, maintain, and report all risk-relevant information.
Risk Management Policy and Framework
The risk management policy issued by our Executive Board governs how we handle risk in line with the Company’s risk appetite and defines a methodology that is applied uniformly across all parts of the Group. The policy stipulates who is responsible for conducting risk management activities and defines reporting and monitoring structures. In 2015, as part of our regular review, we updated and rolled out this mandatory policy to all employees. Our global corporate audit function conducts regular audits to assess the effectiveness of our risk management system. Every year, SAP’s external auditor assesses if the SAP SE early risk identification system is adequate to identify risks that may endanger our ability to continue as a going concern. SAP’s enterprise risk management covers risks in the areas of strategy, operational business, financial reporting, and compliance. As of today, the risk management system analyzes risks and only assesses or analyzes opportunities where deemed appropriate.
Risk Management Methodology and Reporting
The following sections describe the key elements of the risk management process as part of SAP’s risk management policy: risk planning, identification, analysis, response, and monitoring.
| | |
| Combined Management ReportRisk Management and Risks | | 95 |
Risk planning and risk identification for both internal and external risks are conducted in cooperation between risk managers and the business units or subsidiaries across the Group. We use various techniques to identify risks. For example, we have identified risk indicators and developed a comprehensive risk catalog that includes risk mitigation strategies for known product and project risks. Risk identification takes place at various levels of our organization to ensure that common risk trends are identified and end-to-end risk management across organizational borders is enabled. We apply both a qualitative and quantitative risk analysis as well as other risk analysis methods such as sensitivity analyses and simulation techniques.
To determine which risks pose the highest threat to the viability of the SAP Group, we classify them as “high,” “medium,” or “low” based on the likelihood that a risk will occur within the assessment horizon as well as the impact the risk would have on SAP’s business objectives if it were to occur. The scales for measuring these two indicators are given in the following tables.
| | |
Probability/Likelihood of Occurrence | | Description |
| 1% to 19% | | Remote |
| 20% to 39% | | Unlikely |
| 40% to 59% | | Likely |
| 60% to 79% | | Highly Likely |
| 80% to 99% | | Near Certainty |
In this framework, we define a remote risk as one that will occur only under exceptional circumstances and a near certain risk as one that can be expected to occur within the specified time horizon. The period for analyzing our risks is at least the used forecast period. The period for analyzing our risks that could be possible threats to the Group’s ability to continue as a going concern is eight rolling quarters.
| | |
Impact Level | | Impact Definition |
| Insignificant | | Negligible negative impact on business, financial position, profit, and cash flows |
| Minor | | Limited negative impact on business, financial position, profit, and cash flows |
| Moderate | | Some potential negative impact on business, financial position, profit, and cash flows |
| Major | | Considerable negative impact on business, financial position, profit, and cash flows |
| Business-Critical | | Detrimental negative impact on business, financial position, profit, and cash flows |
Based on the combination of the likelihood that a risk will occur and its impact on SAP’s reputation, business, financial position, profit, and cash flow classify the risks as “high,” “medium,” or “low.”
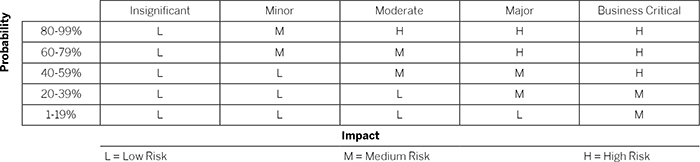
| | |
| Combined Management ReportRisk Management and Risks | | 96 |
Risk analysis is followed by risk response and risk monitoring. Our risk managers work in close cooperation with the business owners, ensuring that effective strategies are implemented to address risks. Business owners are responsible for continuously monitoring the risks and the effectiveness of mitigation strategies, with support from the respective risk managers. Risks may be reduced by taking active steps based on risk approval. To provide greater risk transparency and enable appropriate decision making for business owners, we have established a risk delegation of authority (RDOA) for relevant parts of the organization as deemed appropriate. Risk DOA is a risk management decision-making hierarchy that helps business owners gain timely insight into projects and processes with the greatest risk, so they are better able to review the relevant information, understand the risk profile and associated mitigation strategies, and determine if their approval is warranted. Depending on the exposure, approval is required at different levels of the Company, up to and including the Executive Board.
All identified and relevant risks are reported at the local, regional, and global levels in accordance with our risk management policy. At local, regional, and global levels, we have established executive risk councils that regularly discuss risks and countermeasures and that monitor the success of risk mitigation. In addition, the Executive Board is informed quarterly about individual risks based on clearly defined reporting criteria. Newly identified or existing significant risks that are above a defined threshold or with a potential significant impact are also reported to the chairperson of the Supervisory Board and to the Audit Committee of the Supervisory Board. This includes any risks of potential ongoing concern.
We also have a process in place that analyzes those risks with respect to potential effects on liquidity, excessive indebtedness, and insolvency, which could be possible threats to the Group’s ability to continue as a going concern.
Risk Management Organization
Our risk management organization ensures the coverage of the functions of risk management governance, strategic, operational, financial, and compliance risk management. Our Global Governance, Risk & Compliance (GRC) organization comprises a Group-wide governance function, including regular maintenance and implementation of our risk management policy. The uniform process model comprises all essential elements of risk management: risk planning, risk identification, risk analysis, risk response, and risk monitoring. This function is also responsible for standardized risk reporting to risk committees at different levels of the Company, including the Executive Board as well as the chairperson and the Audit Committee of the Supervisory Board.
Our strategic risk management function resides within our Global Controlling organization and is responsible for enabling early identification and mitigation of risks that could threaten the successful execution of SAP’s strategic priorities and targets. It also supports the successful execution of our corporate strategy by creating transparency regarding risks that could threaten commercial interests or intangible assets such as corporate or product reputation and brand image.
Operational and financial risk management is uniformly implemented at SAP. Independent GRC risk managers are assigned to each of SAP’s important business units and business activities and to selected strategic initiatives. All GRC risk managers, together with assigned risk contacts in the business units, continuously identify and assess risks associated with material business operations using a uniform approach and monitor the implementation and effectiveness of the measures chosen to mitigate risks. Further financial risk management activities are performed by our global treasury function.
During the merger and acquisition and post-merger integration phase, newly acquired companies are subject to risk management performed by our Corporate Development M&A function. Furthermore, as long as they are not integrated, existing risk management structures are maintained or enhanced within the acquired companies to ensure that legal requirements are met.
Risk managers are responsible for supporting and monitoring the implementation of risk management across the Group that is both effective and compliant with regulatory requirements and SAP’s global risk management policy. Based on our risk management policy, all risks and risk-related matters have to be reported to the Global GRC organization.
The head of Global GRC, together with other key functions (for example, Global Controlling or Global Treasury), is responsible for SAP’s internal control and risk management program, and provides regular updates to the Audit Committee of the Supervisory Board. The overall risk profile of the Group is consolidated by the head of Global GRC, who reports to the Group CFO.
Internal Control and Risk Management System for Financial Reporting
The purpose of our system of internal control over financial reporting is to ensure with sufficient certainty that its financial reporting is reliable and in compliance with applicable generally accepted accounting principles. Because of the inherent limitations of internal control over financial reporting, it may not prevent or bring to light all potential misstatements in our financial statements.
SAP’s internal control and risk management system for financial reporting (ICRMSFR) is based on our Group-wide risk management methodology. The ICRMSFR includes organizational, control, and monitoring structures designed to ensure that data and information concerning our business are collected, compiled, and analyzed in accordance with applicable laws and properly reflected in the IFRS Consolidated Financial Statements.
| | |
| Combined Management ReportRisk Management and Risks | | 97 |
Our ICRMSFR also includes policies, procedures, and measures designed to ensure compliance of SAP’s financial reports with applicable laws and standards. We analyze new statutes, standards, and other pronouncements concerning IFRS accounting and its impact on our financial statements and ICRMSFR. Failure to adhere to these new statutes, standards, and other pronouncements would present a substantial risk to the compliance of our financial reporting. Finally, the ICRMSFR has both preventive and detective controls, including, for example, automated and non-automated reconciliations, segregated duties with two-person responsibility, authorization concepts in our software systems, and monitoring.
Our Corporate Financial Reporting department codifies all accounting policies in our global Group Accounting and Revenue Recognition Guidelines. These policies, the corporate closing schedule, and our process handbooks together define the closing process. Under this closing process, we prepare, predominately through centralized and outsourced services, the financial statements of all SAP legal entities for consolidation by our Corporate Financial Reporting department. The Corporate Financial Reporting department and other corporate departments assist in the efforts to comply with Group accounting policies and monitor the accounting work. Our Corporate Financial Reporting department conducts reviews of our accounting processes and books.
We have outsourced some work, such as valuing projected benefit obligations and share-based payment obligations, quarterly tax calculations for most entities, and purchase price allocations in the context of asset acquisitions and business combinations. We have also outsourced the preparation of the local statutory financial statements of most of our subsidiaries. The employees who work on SAP’s financial reporting receive training in the respective policies and processes.
Based on an analysis of the design and operating effectiveness of our respective internal controls over financial reporting, a committee presents the results of the assessment on the ICRMSFR effectiveness with respect to our IFRS Consolidated Financial Statements as at December 31 each year to the Group CFO. The committee meets regularly to set the annual scope for the test of effectiveness, to evaluate any possible weaknesses in the controls, and to determine measures to address them adequately. During its own meetings, the Audit Committee of the Supervisory Board regularly scrutinizes the resulting assessments of the effectiveness of the internal controls over financial reporting with respect to the IFRS consolidated financial statements.
The assessment of the effectiveness of the ICRMSFR related to our IFRS consolidated financial statements was that on December 31, 2015, the Group had an effective internal control system over financial reporting in place.
Risk Management and Internal Control Governance
Our Executive Board is responsible for ensuring the effectiveness of the risk management and internal control system. The effectiveness of both systems and their implementation in the different Executive Board areas is monitored by each board member. We regularly provide a status on the risk management and the internal control system to the Audit Committee. Key risks are reported quarterly to the chairperson of the Supervisory Board and to the Audit Committee of the Supervisory Board. The Audit Committee of our Supervisory Board regularly monitors the effectiveness of SAP’s risk management and internal control system. In this regard, our Audit Committee requested the Corporate Audit department to regularly audit various aspects of the risk management system and its effectiveness. Additional reassurance is obtained through the external audit of the effectiveness of our internal control system over financial reporting and the internal warning system.
Software Solution Deployed
We use our own risk management software (SAP solutions for GRC) powered by SAP HANA to effectively support the governance process. Risk managers record and address identified risks using our risk management software to create transparency across all known risks that exist in the Group, as well as to facilitate risk management and the associated risk reporting. This information is available to managers through a mobile app as well as regularly issued reports, and is consolidated and aggregated for the quarterly risk report to the Executive Board. The solution also supports the risk-based approach of SAP’s internal control and risk management system for financial reporting (ICRMSFR).
RISK FACTORS
The following sections outline risk factors that we identify and track using our risk management software (SAP solutions for GRC) powered by SAP HANA. They are presented below at a more aggregated level as compared to their use in internal controlling, but are broken down by the same risk categories we use in our internal risk management system reporting structure. An overview of the risk factors presented below is outlined in the following table. It shows the clarification of the risk factors according to our framework detailed in theRisk Management Methodology and Reporting section.
| | |
| Combined Management ReportRisk Management and Risks | | 98 |
Overview Risk Factors
| | | | | | | | |
| | | Probability | | Impact | | Risk Level | | Evolution1) |
| Economic, Political, Social, and Regulatory Risks | | | | | | | | |
Global Economy | | likely | | business critical | | high | | ® |
International Business Activities | | unlikely | | major | | medium | | ® |
Environmental, Social and Political Instability | | unlikely | | business critical | | medium | | ® |
| Market Risks | | | | | | | | |
Demand for New and Existing Solutions | | unlikely | | business critical | | medium | | ® |
Market Development for Cloud | | unlikely | | business critical | | medium | | ® |
Market Share and Profit | | unlikely | | major | | medium | | ® |
| Business Strategy Risks | | | | | | | | |
Solution Demand | | remote | | business critical | | medium | | ® |
Cloud Business Model | | remote | | business critical | | medium | | ® |
Relationships with Partners | | likely | | major | | medium | | ® |
| Human Capital Risks | | | | | | | | |
Managing the Geographically Dispersed Workforce | | remote | | major | | low | | ® |
Attracting, Develop, and Retaining People | | unlikely | | major | | medium | | ® |
| Organizational and Governance-Related Risks | | | | | | | | |
Corporate Governance Laws and Regulations | | unlikely | | major | | medium | | ® |
Data Protection and Privacy | | unlikely | | business critical | | medium | | ® |
Climate Change, Energy and Emissions | | unlikely | | moderate | | low | | ® |
Ethical Behavior | | remote | | major | | low | | ® |
| Communication and Information Risks | | | | | | | | |
Unauthorized Disclosure of Information | | remote | | business critical | | medium | | ® |
| Financial Risks | | | | | | | | |
Quarterly Sales Fluctuations | | unlikely | | moderate | | low | | ® |
Liquidity | | remote | | business critical | | medium | | ® |
Management Use of Estimates | | unlikely | | moderate | | low | | ® |
Accounting Pronouncement | | unlikely | | major | | medium | | ® |
Currency and Interest Rate Fluctuations | | remote | | major | | low | | ® |
Derivative Instruments for Share-Based Payment Plans | | remote | | minor | | low | | ® |
| | |
| Combined Management ReportRisk Management and Risks | | 99 |
Overview Risk Factors
| | | | | | | | |
| | | Probability | | Impact | | Risk Level | | Evolution1) |
| Project Risks | | | | | | | | |
Implementation Projects | | unlikely | | major | | medium | | ® |
| Product and Technology Risks | | | | | | | | |
Product Security | | unlikely | | business critical | | medium | | ® |
Undectected Defects in Products | | unlikely | | business critical | | medium | | ® |
Third Party Licensing | | likely | | major | | medium | | ® |
Innovation | | remote | | business critical | | medium | | ® |
Technology and Product Strategy | | unlikely | | business critical | | medium | | ® |
Cloud Performance | | unlikely | | business critical | | medium | | ® |
| Operational Risks | | | | | | | | |
Infringement of Intellectual Property | | likely | | business critical | | high | | ® |
Lawsuits | | likely | | business critical | | high | | ® |
Mergers and Acquisitions | | unlikely | | business critical | | medium | | ® |
Enforcement of Intellectual Property | | likely | | business critical | | high | | ® |
Cybersecurity | | unlikely | | business critical | | medium | | ® |
Business Operations | | unlikely | | major | | medium | | ì |
Insurance | | remote | | business critical | | medium | | ® |
Venture Capital | | remote | | minor | | low | | ® |
| | | | | | Icon: | | decreased î |
| | | | | | | | unchanged ® |
| | | | | | | | increased ì |
| 1) | Evolution: Risk Level compared with previous year. |
All described risks are applicable to a different extent to our reportable segments (Applications, Technology, and Services and SAP Business Network) unless otherwise noted.
SAP SE is the parent company of the SAP Group. Consequently, the risks described below also apply, directly or indirectly, to SAP SE.
Economic, Political, Social, and Regulatory Risk
Uncertainty in the global economy, financial markets, or political conditions could have a negative impact on our business, financial position, profit, as well as cash flows, and put pressure on our operating profit.
Our business is influenced by multiple risk factors that are both difficult to predict and beyond our influence and control. These factors include global economic and business conditions, and fluctuations in national currencies. Other examples are political developments and general regulations as well as budgetary constraints or shifts in spending priorities of national governments.
Macroeconomic developments, such as financial market volatility episodes, global economic crises, chronic fiscal imbalances, slowing economic conditions, or disruptions in emerging markets, could limit our customers’ ability and willingness to invest in our solutions or delay purchases. In addition, changes in the euro conversion rates for particular currencies might have an adverse effect on business activities with local customers and partners. Furthermore, political instabilities in regions such as the Middle East and Africa, political crises (such as in Greece or Ukraine), natural disasters, pandemic diseases (such as Ebola in West Africa) and terrorist attacks (such as the attacks in Paris, France, in November 2015) could contribute to economic and political uncertainty.
| | |
| Combined Management ReportRisk Management and Risks | | 100 |
These events could reduce the demand for SAP software and services, and lead to:
| ¡ | | Delays in purchases, decreased deal size, or cancellations of proposed investments |
| ¡ | | Potential lawsuits from customers due to denied provision of service as a result of sanctioned-party lists or export control issues |
| ¡ | | Higher credit barriers for customers, reducing their ability to finance software purchases |
| ¡ | | Increased number of bankruptcies among customers, business partners, and key suppliers |
| ¡ | | Increased default risk, which may lead to significant impairment charges in the future |
| ¡ | | Market disruption from aggressive competitive behavior, acquisitions, or business practices |
| ¡ | | Increased price competition and demand for cheaper products and services |
Any one or more of these developments could reduce our ability to sell and deliver our software and services which could have an adverse effect on our business, financial position, profit, and cash flows.
SAP has established measures and conducted scenario analyses to address and mitigate the described risks and adverse effects to the extent possible. We offer our customers standard software and product packages that are fast and easy to install, as well as financially attractive financing, software licensing, and subscription models. Our ongoing shift to a higher share of cloud subscriptions and software support revenue streams will lead to more predictable streams over time providing increased stability against financial volatilities. Furthermore, we continue to apply cost discipline internally and have a conservative financial planning policy. Additionally, SAP is continuously reshaping its organizational structure and processes to increase efficiency.
We estimate the probability of occurrence of this risk to be likely. Therefore, we cannot completely exclude the possibility that it will have a business-critical impact on our business, financial position, profit, and cash flows. This could exacerbate the other risks we describe in this report or cause a negative deviation from our revenue and operating profit target. We classify this risk as a high risk.
Our international business activities and processes expose us to numerous and often conflicting laws and regulations, policies, standards or other requirements and sometimes even conflicting regulatory requirements, and to risks that could harm our business, financial position, profit, and cash flows.
We are a global company and currently market our products and services in more than 180 countries and territories in the Americas (Latin America and North America); Asia Pacific Japan (APJ); China, Hong Kong, Macau, and Taiwan (Greater China); Europe, Middle East, and Africa (EMEA); and Middle and Eastern Europe (MEE) regions. Our business in these countries is subject to numerous risks inherent in international business operations. Among others, these risks include:
| ¡ | | Data protection and privacy regulation regarding access by government authorities to customer, partner, or employee data |
| ¡ | | Data residency requirements (the requirement to store certain data only in and, in some cases, also to access such data only from within a certain jurisdiction) |
| ¡ | | Conflict and overlap among tax regimes |
| ¡ | | Possible tax constraints impeding business operations in certain countries |
| ¡ | | Expenses associated with the localization of our products and compliance with local regulatory requirements |
| ¡ | | Discriminatory or conflicting fiscal policies |
| ¡ | | Operational difficulties in countries with a high corruption perceptions index |
| ¡ | | Protectionist trade policies, import and export regulations, and trade sanctions and embargoes |
| ¡ | | Works councils, labor unions, and immigration laws in different countries |
| ¡ | | Difficulties enforcing intellectual property and contractual rights in certain jurisdictions |
| ¡ | | Country-specific software certification requirements |
| ¡ | | Challenges with effectively managing a large distribution network of third-party companies |
| ¡ | | Compliance with various industry standards (such as Payment Card Industry Data Security Standard) |
As we expand into new countries and markets, these risks could intensify. The application of these laws and regulations to our business is sometimes unclear, subject to change over time, and often conflict among jurisdictions. Additionally, these laws and government approaches to enforcement are continuing to change and evolve, just as our products and services continually evolve. Compliance with these varying laws and regulations could involve significant costs or require changes in products or business practices. Non-compliance could result in the imposition of penalties or cessation of orders due to alleged non-compliant activity. One or more of these factors could have an adverse effect on our operations globally or in one or more countries or regions, which could have an adverse effect on our business, financial position, profit, and cash flows.
We address these risks with various measures depending on the circumstances, including, for example, a strong legal and compliance office presence in the main countries, maintaining an effective data protection and privacy office and associated policy, receiving guidance from external economics consultants, law firms, tax advisors, and authorities in the concerned countries, and taking legal actions.
| | |
| Combined Management ReportRisk Management and Risks | | 101 |
Although we estimate the probability of occurrence of this risk to be unlikely, we cannot completely exclude the possibility that this risk could have a major impact on our business, financial position, profit, and cash flows, or cause a negative deviation from our revenue and operating profit target. We classify this risk as a medium risk.
Social and political instability caused by state-based conflicts, terrorist attacks, civil unrest, war, or international hostilities, as well as pandemic disease outbreaks or natural disasters, may disrupt SAP’s business operations.
Terrorist attacks (such as the attacks in Paris in November 2015) as well as other acts of violence or war, civil, religious, and political unrest (such as in Ukraine, Israel, Syria, and in other parts of the Middle East, Libya, and in other parts of Africa); natural disasters (such as hurricanes, flooding, or similar events); or pandemic diseases (such as Ebola in West Africa) could have a significant adverse effect on the local economy and beyond. Such an event could lead, for example, to the loss of a significant number of our employees, or to the disruption or disablement of operations at our locations, and could affect our ability to provide business services and maintain effective business operations. Furthermore, this could have a significant adverse effect on our partners as well as our customers and their investment decisions, which could have an adverse effect on our reputation, business, financial position, profit, and cash flows.
Our mitigation measures have been designed and implemented to minimize such adverse effects. To ensure continuous operations of all business processes, we have been implementing and operating a worldwide business continuity management and crisis management system. To enable effective response and minimize possible losses in case of crisis situations, we have installed local crisis management teams at our main locations, supplemented by regional crisis management teams for the Americas (including Latin America and North America), APJ (including Greater China), EMEA, and MEE regions, and a global crisis management team.
To protect our key IT infrastructure (especially our data centers), critical business systems, and processes from material adverse effects in crisis situations, disaster recovery and business continuity plans have been developed that include implementation of data redundancies and daily data backup strategies. To verify and improve our approach, our IT-related organizations have been certified to the internationally recognized ISO 22301:2013 (Business Continuity Management) standard with regards to the Applications, Technology, and Services segment. In addition, our corporate headquarters, which houses certain critical business functions, is located in the German state of Baden-Württemberg. This area has historically been free of natural disasters.
With regards to the relevance of current and anticipated political crisis situations and acts of violence as well as pandemic diseases impacting SAP’s business, we believe that the likelihood of this risk materializing is unlikely; however, we cannot exclude the possibility of such a risk occurring and having a business-critical impact on our reputation, business, financial position, profit, and cash flows, or causing a negative deviation from our revenue and operating profit target. We classify this risk as a medium risk.
Market Risks
Our established customers might not buy additional software solutions, subscribe to our cloud offerings, renew maintenance agreements, purchase additional professional services, or they might switch to other products or service offerings (including competitive products).
In 2015, we continued to depend materially on the success of our support portfolio and on our ability to deliver high-quality services. Traditionally, our large installed customer base generates additional new software, maintenance, consulting, and training revenue. Despite the high quality and service level of our transformed and expanded service offering in the area of premium support services, we may be unable to meet customer expectations with regards to delivery and value proposition. This may lead to a potentially adverse impact on customer experience. Existing customers might cancel or not renew their maintenance contracts, decide not to buy additional products and services, not subscribe to our cloud offerings, or accept alternative offerings from other vendors. In addition, the increasing volume in our cloud business as well as the conversion of traditional on-premise licenses to cloud subscriptions licenses could have a potential negative impact on our software and maintenance revenue streams. This could have an adverse effect on our business, financial position, profit, and cash flows.
Working closely with SAP user groups, we continuously demonstrate the business value and the benefits of our solution, service and support portfolio in terms of innovation, quality, and high service level as well as through customer references and success stories. Additionally, we continuously monitor the performance and the perceived value of our services and the satisfaction of our customers. We implement mitigating steps where required.
In early 2015, we combined organizationally two main departments responsible for services and support at SAP in regards to the Applications, Technology, and Services segment, into one Global Service & Support unit. This combined organization offers a wide range of support, including premium support services (SAP MaxAttention and SAP ActiveEmbedded), and professional services to increase business benefit for our customers. For the SAP Business Network segment, we continue the established service and support models.
| | |
| Combined Management ReportRisk Management and Risks | | 102 |
With regards to our volume in cloud business as well as the conversion of traditional on-premise licenses to cloud subscriptions licenses, we estimate the probability of this risk materializing to be unlikely. However, we cannot completely exclude the possibility that it could have a business-critical impact on our business, financial position, profit, and cash flows, or cause a negative deviation from our revenue and operating profit target. Overall, we classify this risk as medium risk.
The success of our cloud computing strategy depends on market perception and an increasing market adoption of our cloud solutions and managed cloud services. Insufficient adoption of our solutions and services could lead to a loss of SAP’s position as a leading cloud company.
The market for cloud computing is increasing and shows strong growth relative to the market for our on-premise solutions. To offer a broad cloud service portfolio and generate the associated business value for our customers, we have acquired cloud computing companies such as Ariba, Concur, Fieldglass, and SuccessFactors. Due to ongoing contracts and previous substantial investments to integrate traditional on-premise enterprise software into their businesses, as well as concerns about data protection, security capabilities, and reliability, customers and partners might be reluctant or unwilling to migrate to the cloud.
Other factors that could affect the market acceptance of cloud solutions and services include:
| ¡ | | Concerns with entrusting a third-party to store and manage critical employee or company confidential data |
| ¡ | | Customer concerns about security capabilities and reliability |
| ¡ | | Customer concerns about the ability to scale operations for large enterprise customers |
| ¡ | | The level of configurability or customizability of the software |
| ¡ | | Missing integration scenarios between on-premise products and cloud-to-cloud solutions |
| ¡ | | Failure to securely and successfully deliver cloud services by any cloud service provider could have a negative impact on customer trust in cloud solutions |
| ¡ | | Strategic alliances among our competitors in the cloud area could lead to significantly increased competition in the market with regards to pricing and ability to integrate solutions |
| ¡ | | Failure to get the full commitment of our partners might reduce speed and impact in the market reach |
If organizations do not perceive the benefits of cloud computing, the market for cloud business might not develop further, or it may develop more slowly than we expect, either of which could have an adverse effect on our business, financial position, profit, reputation and cash flows.
In addition to measures to communicate the business value of our cloud solutions to the market, we invest significantly in infrastructure and processes that ensure secure operations of our cloud solutions including the adaption of cloud service delivery to local and/or specific market requirements (such as local or regional data centers) and the compliance with all local legal regulations regarding data protection and privacy as well as data security.
Although we estimate the probability of occurrence of this risk to be unlikely, we cannot completely exclude the possibility that this risk could have a business-critical impact on our reputation, business, financial position, profit, and cash flows, or cause a negative deviation from our revenue and operating profit target. We classify the risk as a medium risk.
Our market share and profit could decline due to increased competition, market consolidation and technological innovation as well as new business models in the software industry.
The software industry continues to evolve rapidly and is currently undergoing a significant shift due to innovations in the areas of enterprise mobility, cybersecurity, Big Data, hyperconnectivity, the Internet of Things, digitization, supercomputing, cloud computing, and social media. While smaller innovative companies tend to create new markets continuously and expand their reach through mergers, large traditional IT vendors tend to enter such markets mostly through acquisitions. SAP faces increased competition in our business environment from traditional as well as new competitors. This competition could cause price pressure, cost increases, and loss of market share, which could have an adverse effect on our business, financial position, profit, and cash flows.
Additionally, related to our Applications, Technology, and Services segment, customers could change their buying behavior by accelerating their acceptance of cloud solutions to reduce their investments, which might have a temporary adverse effect on our operating results. Furthermore, the trend in the market to invest more in cloud solutions might lead to a risk of the potential loss of existing on-premise customers. It may also have a temporary adverse effect on our revenue due to the number of conversions from on-premise licenses to cloud subscriptions from existing SAP customers in our installed base, as we recognize cloud subscriptions revenue over the respective service provision, and that typically ranges from one-to-three years with some up to five years.
We believe we will be able to protect our leadership in the market by continuing to execute successfully on our customer-centric innovation strategy, which is driven by a mix of organic growth, targeted acquisitions, and attractive cloud solution offerings. To compete successfully in the market, we continuously enhance our global processes and adjust our organizational structures. Furthermore, in the Application, Technology, and Services segment, we have policies in place to effectively manage conversions from on-premise software arrangement to cloud arrangements.
| | |
| Combined Management ReportRisk Management and Risks | | 103 |
Although we estimate the probability of this risk being a major impact unlikely, we cannot completely exclude the possibility that this risk could have a major impact on our business, financial position, profit, and cash flows, or cause a negative deviation from our revenue and operating profit target. We classify this risk as a medium risk.
Business Strategy Risks
Demand for our new solutions may not develop as planned and our strategy on new business models and flexible consumption models may not be successful.
Our business consists of new software licenses, software license updates, and support and maintenance fees as well as of cloud subscriptions. Our customers are expecting to take advantage of technological breakthroughs from SAP without compromising their previous IT investments. However, the introduction of new SAP solutions, technologies, and business models as well as delivery and consumption models is subject to uncertainties as to whether customers will be able to perceive the additional value and realize the expected benefits we deliver along our road maps. There is a risk that such uncertainties may lead customers to wait for proof of concept through reference customers or more mature versions first, which might result in a lower level of adoption of our new solutions, technologies, business models, and flexible consumption models, or no adoption at all. This could have an adverse effect on our business, financial position, profit, and cash flows.
To mitigate this risk, SAP is balancing the distribution of our strategic investments by evolving and protecting our core businesses and simultaneously developing new solutions, technologies, and business models for markets, such as those in analytics, applications, and database and technology. Furthermore, we continuously demonstrate the benefits of our solution and services portfolio through customer references and success stories as well as the provision of support excellence to ensure customer satisfaction with and after the implementation of our solution.
We estimate the probability of occurrence of this risk to be remote, but cannot completely exclude the possibility that this risk could have a business-critical impact on our business, financial position, profit, and cash flows, or cause a negative deviation from our revenue and operating profit target. We classify this risk as a medium risk.
Though downturns or upturns in cloud sales may not be immediately reflected in our operating results, any decline in our customer renewals would harm the future operating results of our cloud business.
We recognize cloud subscriptions revenue as we provide the respective services, which typically range from one-to-three years with some up to five years. This revenue recognition and our increasing subscription revenues could have a temporary adverse effect on our financial position, profit, and cash flows.
To maintain or improve our operating results in the cloud business, it is important that our customers renew their agreements with us when the initial contract term expires and purchase additional modules or additional capacities. Our customers have no obligation to renew their subscriptions after the initial subscription period, and we cannot assure that customers will renew subscriptions at the same or at a higher level of service, or at all. Our customers’ renewal rates may decline or fluctuate as a result of various factors, including their satisfaction or dissatisfaction with our cloud solution and services portfolio; our ability to efficiently provide cloud services according to customer expectations and meeting the service level agreements, service availability and provisioning, the integration capabilities of our cloud solutions into their existing IT environment (including hybrid solutions combining both cloud and on-premise solutions); our customer support; concerns regarding stable, efficient, and secure cloud operations and compliance with legal and regulatory requirements; our pricing; the pricing of competing products or services; mergers and acquisitions affecting our customer base; global economic conditions; and reductions in our customers’ spending levels.
If our customers do not renew their subscriptions, renew on terms less favorable to us, or fail to purchase additional modules or users, our revenue and billings will decline, and we may not realize significantly improved operating results from our customer base. This could have an adverse effect on our business, financial position, profit, and cash flows.
We share our overall long-term cloud strategy and our integration road map with our customers and continuously implement improvements that enhance our cloud solutions, including instant provisioning, a consumer-grade user experience, and a fast time to value, among others. To continuously improve our services, we closely monitor any issue and work together with customers to perform a root-cause analysis and provide a solution. We have a strong focus on providing our cloud services efficiently and according to customer expectations, including service provisioning, quality, and security as well as data protection and privacy.
Furthermore, we are continuously improving and adapting cloud services delivery to local and/or specific market requirements (such as local or regional data centers, customer expectations, and in accordance with legal and regulatory requirements).
| | |
| Combined Management ReportRisk Management and Risks | | 104 |
Although we estimate the probability of occurrence of this risk to be remote, we cannot completely exclude the possibility that this risk could have a business-critical impact on our business, financial position, profit, and cash flows, or cause a negative deviation from our revenue and operating profit target. We classify this risk as a medium risk.
If we are unable to scale and enhance an effective partner ecosystem, revenue might not increase as expected.
An open and vibrant partner ecosystem is a fundamental pillar of our success and growth strategy. We have entered into partnership agreements that drive co-innovation on our platforms, profitably expand all our routes to market to optimize market coverage, optimize cloud delivery, and provide high-quality services capacity in all market segments. Partners play a key role in driving market adoption of our entire solutions portfolio, by co-innovating on our platforms, embedding our technology, and reselling and/or implementing our software.
If partners consider our products or services model less strategic and/or financially less attractive compared to our competition and/or less appropriate for their respective channel and target market, if partners fear direct competition by SAP or if SAP fails to establish and enable a network of qualified partners meeting our quality requirements and the requirements of our customers, then, among other things, partners might not:
| ¡ | | Develop a sufficient number of new solutions and content on our platforms |
| ¡ | | Provide high-quality products and services to meet customer expectations |
| ¡ | | Drive growth of references by creating customer use cases and demo systems |
| ¡ | | Embed our solutions sufficiently enough to profitably drive product adoption, especially with innovations such as SAP S/4HANA and SAP HANA Cloud Platform |
| ¡ | | Enable and train sufficient resources to promote, sell, and support to scale to targeted markets |
| ¡ | | Comply with applicable laws and regulations, resulting in delayed, disrupted, or terminated sales and services |
| ¡ | | Transform their business model in accordance with the transformation of SAP’s business model in a timely manner |
| ¡ | | Renew their existing agreements with us or enter into new agreements on terms acceptable to us or at all |
| ¡ | | Provide ability and capacity to meet customer expectations regarding service provisioning. |
If one or more of these risks materialize, this may have an adverse effect on the demand for our products and services as well as the partner’s loyalty and ability to deliver. As a result, we may not be able to scale our business to compete successfully with other software vendors, which could have an adverse effect on our reputation, business, financial position, profit, and cash flows.
SAP continues to invest in long-term, mutually beneficial relationships and agreements with partners. We continue to develop and enhance a wide range of partner programs to retain existing and attract new partners of all types. We offer training opportunities to a wide range of resources for our partners and additionally provide demo solutions to enable partners to lead business value discussions on cloud and on-premise solutions with customers. A thorough certification process for third-party solutions has been designed and established to ensure consistent high-quality and seamless integration.
With the transformation of SAP’s business model, partners play an increasingly important role in co-locating our cloud solutions as well as operating SAP’s cloud solutions for their customers. Therefore, we estimate the probability of occurrence of this risk to be likely, and we cannot exclude the possibility that this risk could have a major impact on our reputation, business, financial position, profit, and cash flows, or cause a negative deviation from our revenue and operating profit target if it were to materialize. We classify this risk as a medium risk.
Human Capital Risks
If we do not effectively manage our geographically dispersed workforce, we may not be able to run our business efficiently and successfully.
Our success is dependent on appropriate alignment of our internal and external workforce planning processes and our location strategy with our general strategy. It is critical that we manage our internationally dispersed workforce effectively, taking short- and long-term workforce and skill requirements into consideration. This applies to the management of our internal as well as our external workforce. Changes in headcount and infrastructure needs as well as local legal or tax regulations could result in a mismatch between our expenses and revenue. Failure to manage our geographically dispersed workforce effectively could hinder our ability to run our business efficiently and successfully and could have an adverse effect on our business, financial position, profit, and cash flows.
We focus on mitigating this risk through a range of activities including succession management; workforce planning (which aims to achieve diversity and the right mix of talent and to take account of demographic changes); outsourcing; external short-term staffing; employer branding; career management (such as offering opportunities for short-term assignments and opportunities to improve skills, competencies, and qualifications); and extended benefit programs – for example, a performance-oriented remuneration system, an employer-financed pension plan in certain countries, and long-term incentive plans.
We estimate this risk to be a remote possibility, but we cannot completely exclude the possibility of this risk to have a major impact on our business, financial position, profit, and cash flows, or cause a negative deviation from our revenue and operating profit target. We classify this risk as a low risk.
| | |
| Combined Management ReportRisk Management and Risks | | 105 |
If we are unable to attract, develop, and retain leaders and employees with specialized knowledge and technology skills, or are unable to achieve internal diversity and inclusion objectives, we might not be able to manage our operations effectively and successfully, or develop successful new solutions and services.
Our highly qualified workforce is the foundation for our continued success. In certain regions and specific technology and solution areas, we continue to set very high growth targets, specifically in countries and regions such as Africa, China, Latin America, and the Middle East. In the execution of SAP’s strategic priorities, we depend on highly skilled and specialized personnel and leaders, both male and female. Successful maintenance and expansion of our highly skilled and specialized workforce in the area of cloud is a key success factor for our transition to be the leading cloud company. The availability of such personnel is limited and, as a result, competition in our industry is intense and could expose us to claims by other companies seeking to prevent their employees from working for a competitor. If we are unable to identify, attract, develop, motivate, adequately compensate, and retain well-qualified and engaged personnel, or if existing highly skilled and specialized personnel leave SAP and ready successors or adequate replacements are not available, we may not be able to manage our operations effectively, which could have an adverse effect on our reputation, business, financial position, profit, and cash flows. Furthermore, we may not be able to develop, sell, or implement successful new solutions and services as planned. This is particularly true as we continue to introduce new and innovative technology offerings and expand our business in emerging markets. The lack of appropriate or inadequately executed benefit and compensation programs could limit SAP’s ability to attract or retain qualified employees and lead to financial losses. In addition, we might not be able to achieve our internal gender diversity objectives to increase the number of women in management from 18% in 2010 to 25% by 2017.
These risks notwithstanding, we continue to believe our leading market position, employer brand, and extended benefit programs will enable us to hire top talent internationally with the potential to contribute to SAP’s growing business success in the future. We address the risk of an adverse effect on our business operations from a failure to recruit the employees we need or from the loss of leaders and employees by seeking to build employee and leadership strengths through a range of targeted professional development, mentoring, and coaching programs, a gender diversity program, and a special focus on accelerated high-potential employee development that aims to develop talent as well as leadership talent, in particular. A strong focus on succession planning for leadership and key positions seeks to ensure sustainable leadership and to safeguard the business from disruption caused by staff turnover.
Although the risks related to failure to attract, develop, and retain talent could materialize, we believe that this is unlikely and that the impact on our reputation, business, financial position, profit, and cash flows, or potential negative deviation from our revenue and operating profit target would be major. We classify this risk as a medium risk.
Organizational and Governance-Related Risks
Laws and regulatory requirements in Germany, the United States, and elsewhere have become much more stringent.
As a European company domiciled in Germany with securities listed in Germany and the United States, we are subject to European, German, U.S., and other governance-related regulatory requirements. Changes in laws and regulations and related interpretations, including changes in accounting standards and taxation requirements, and increased enforcement actions and penalties may alter the business environment in which we operate. Regulatory requirements have become significantly more stringent in recent years, and some legislation, such as the anticorruption legislation in Germany, the U.S. Foreign Corrupt Practices Act, the UK Bribery Act, and other local laws prohibiting corrupt payments by employees, vendors, distributors, or agents, is being applied more rigorously. Emerging markets are a significant focus of our international growth strategy. The nature of these markets presents a number of inherent risks. A failure by SAP to comply with applicable laws and regulations, or any related allegations of wrongdoing against us, whether merited or not, could have an adverse effect on our business, financial position, profit, cash flows and reputation.
It is difficult to assess the precise potential risk, because there is a wide variety of complex legal and regulatory requirements that apply, and therefore an equally wide variety of potential non-compliance scenarios exist.
However, we continuously monitor new and increased regulatory requirements, updated or new enforcement trends, and publicly available information on compliance issues in the computer software industry, the emerging markets where we invest our resources, and in the business environment in general to cope with an increase in regulation enforcement efforts of certain countries or state-driven protectionism. Based on this information and any other available sources, we continuously update and refresh our compliance programs to achieve the most effective approach possible and to ensure that our employees understand and comply with the SAP Code of Business Conduct. This process is coordinated by our Legal Compliance and Integrity Office, a team of dedicated resources who are tasked with managing our policy-related compliance measures. Our chief compliance officer coordinates policy implementation, training, and enforcement efforts throughout SAP. Those efforts are monitored and tracked to allow trending and risk analysis and to ensure consistent policy application throughout the SAP Group. Despite our comprehensive compliance programs and established internal controls, intentional efforts of individuals to circumvent controls or engage in fraud for personal gains cannot always be prevented.
| | |
| Combined Management ReportRisk Management and Risks | | 106 |
With regards to the increase of regulation enforcement efforts we have already experienced and continue to expect as well as state-driven protectionism, we estimate the likelihood of this risk to be unlikely. We cannot completely exclude the possibility that this risk could have a major impact on our reputation, business, financial position, profit, and cash flows, or cause a negative deviation from our revenue and operating profit target. We classify this risk as a medium risk.
Non-compliance with applicable data protection and privacy laws or failure to adequately meet the requirements of SAP’s customers with respect to our products and services could lead to civil liabilities and fines, as well as loss of customers and damage to SAP’s reputation.
As a global software and service provider, SAP is required to comply with local laws wherever SAP does business. Consequently, we must ensure that any legal requirements in connection with the provision of products and services are properly implemented. With regards to data protection requirements, significant changes are expected subject to the upcoming European Data Protection Regulation. Furthermore, SAP is affected by the consequences of the decision of the European Court of Justice (ECJ), which declared Safe Harbor invalid, so that data transfers from within the European Union (EU) to the United States are no longer permitted based on Safe Harbor. This means that acquired SAP affiliates that have not already implemented the requirements for data transfers based on the Standard Contractual Clauses will have to implement these requirements immediately. However, this will be ensured by the implementation of the new Intra Group Agreement that provides a data protection level at the Standard Contractual Clauses within the SAP Group. These laws and regulations amend and supplement existing requirements regarding the processing of personal data that SAP and SAP customers must fulfill and which we must consequently address with our products and services, including cloud delivery. Failure to comply with applicable laws or to adequately address privacy concerns of customers, even if unfounded, could lead to investigations by supervisory authorities, civil liability, fines, (in the future, potentially calculated based on the Company’s annual revenue), loss of customers, damage to our reputation, and could have an adverse effect on our business, financial position, profit, and cash flows.
Further, recent landmark decisions by the ECJ on data protection matters, as well as official statements made by the European data protection supervisory authorities, require SAP to carefully review our globalized business practices. Most importantly, the ECJ on October 6, 2015, ruled that data transfers by European companies to data processors in the United States can no longer be based on Safe Harbor. While SAP has not widely relied upon Safe Harbor, the data protection supervisory authorities have challenged the legality of other transfer mechanisms, such as the Standard Contractual Clauses used by SAP, on the same grounds by which the ECJ has declared Safe Harbor invalid. The data protection supervisory authorities have threatened to start enforcement activities as early as end of January 2016 against European companies that still transfer data to the United States (or grant U.S. companies remote access to systems containing personal data in the EU) based on a transfer mechanism that the authorities consider invalid. Enforcement activities against SAP or against SAP customers because of services and products that SAP provides with the help of our U.S.-based entities and/or U.S.-based suppliers could lead to fines, civil liability, loss of customers, and damage to our reputation, and could have an adverse effect on our business, financial position, profit, and cash flows.
It is conceivable that data transfers to further countries that do not provide a level of data protection and privacy comparable to the European level may be challenged, too.
To mitigate risks due to legal non-compliance, SAP actively monitors changes to applicable laws and regulations so that we can take adequate measures and certify our existing standards and policies on an ongoing basis. We have implemented a wide range of measures to protect data controlled by SAP and our customers from unauthorized access and processing, as well as from accidental loss or destruction. This includes, among others, a continuous enhancement of our data center operations worldwide, also taking into account local and/or sector-specific market and legal requirements. We have implemented a certified data protection management system in areas critical to data protection, such as global service and support, human resources (HR), marketing, products and innovation, and custom development, whereby implementation is audited internally as well as externally by the British Standard Institutions on an annual basis. Furthermore, customers are provided with security certifications (such as ISO/IEC 27001), security white papers, and reports from our independent auditors and certification bodies.
Notwithstanding the aforementioned, and to address the potential risks resulting from the ECJ ruling on Safe Harbor in particular, we are analyzing all processes by which personal data is transferred to or remotely accessed by U.S.-based SAP entities or external third parties. Any of these processes that are still based upon Safe Harbor will be amended to address any requirements based upon the Standard Contractual Clauses that are still considered a valid legal basis to transfer personal data from within the EU to the United States. SAP further works on investigating possibilities to host and process all personal data that is in the legal responsibility of EU/ European Economic Area (EEA)-based SAP entities in the EU/EEA only. With respect to customers, the EU Access service by which already today many European customers can be supported from within the EU/EEA countries shall be expanded.
| | |
| Combined Management ReportRisk Management and Risks | | 107 |
We estimate this risk to be unlikely, and cannot rule out the possibility of it having a business-critical impact on our business, financial position, profit, and cash flows, and causing damage to our reputation, or causing a negative deviation from our revenue and operating profit target. We classify this risk as a medium risk.
Failure to meet customer, partner, or other stakeholder expectations or generally accepted standards on climate change, energy constraints, and our social investment strategy could negatively impact SAP’s business, results of operations, and reputation.
Energy and emissions management are an integral component of our holistic management of social, environmental, and economic risks and opportunities. We have identified risks in these major areas:
| ¡ | | Our own operations – energy management and other environmental issues such as carbon management, water use, and waste |
Because our customers, employees, and investors expect a reliable energy and carbon strategy, we have reemphasized our previously communicated targets, especially our 2020 target for greenhouse gas emissions. In case these targets cannot be achieved, our customers might no longer recognize SAP for our environmental leadership and might buy other vendors’ products and services. Consequently, we could fail to achieve our revenue target. If we do not meet stakeholder expectations in the areas identified, our rating in sustainable investment indexes might decrease, which could have an adverse effect on our reputation, business, financial position, profit, and cash flows.
In recent years, SAP has shown that it is possible to take a proactive position on social and environmental issues while delivering robust financial growth. As a result, we received great recognition for our sustainability efforts. As a proof point for SAP’s sustainability performance, we continue to be listed in the most prominent and recognized sustainability indexes, such as the Dow Jones Sustainability Indices and the CDP Climate Performance and Disclosure Leadership Indices. In 2015, SAP’s greenhouse gas emissions added up to 455 kilotons CO2, which means we did not meet our greenhouse gas emissions target of 420 kilotons by 35 kilotons. If we do not meet our greenhouse gas emissions target for 2020, we might fail to meet expectations regarding our energy and emission performance.
However, we believe that the risk of failing to meet expectations regarding our energy and emission strategy is unlikely to occur and that if the risk were to occur, it would only have a moderate impact on our reputation, business, financial position, profit, and cash flows, as well as on the achievement of our revenue and operating profit target. We classify this risk as a low risk.
Unethical behavior and non-compliance with our integrity standards due to intentional and fraudulent employee behavior could seriously harm our business, financial position, profit, and reputation.
SAP’s leadership position in the global market is founded on the long-term and sustainable trust of our stakeholders worldwide. Our heritage is one of corporate transparency, open communication with financial markets, and adherence to recognized standards of business integrity. The SAP Code of Business Conduct, adopted by the Executive Board on January 29, 2003, and updated as necessary since then, memorialized and supplemented the already existing guidelines and expectations for the business behavior practiced at SAP.
However, we may encounter unethical behavior and non-compliance with our integrity standards due to intentional and fraudulent behavior of individual employees, possibly in collusion with external third parties. In addition to intentional behavior, problems could also arise due to negligence in the adherence to rules and regulations. Unethical behavior and misconduct attributable to SAP could not only lead to criminal charges, fines, and claims by injured parties, but also to financial loss, and severe reputational damage. This could have an adverse effect on our business, financial position, profit, and cash flows.
To help prevent this, we instituted a comprehensive compliance management system (CMS), which is based on the three pillars of prevention, detection, and reaction. Our CMS program comprises several educational, counseling, control, and investigative instruments. The objective is to minimize and mitigate the risk of unethical behavior, whether intentional or negligent.
The SAP Code of Business Conduct is mandatory and applies to every SAP employee. It provides legal compliance guidance on how to avoid unethical behavior and solve dilemma situations. On an annual basis, the SAP Code of Business Conduct is re-confirmed by SAP’s workforce (except where disallowed by local legal regulations). We also rolled out and enforced various additional compliance policies aimed at managing third parties and preventing misuse of third-party payments for illegal purposes; ensuring controls around travel, entertainment, gift, and expense policies; and promoting a commitment to business with integrity through our partner and vendor ecosystems. These efforts are flanked by continuous education including e-learning and classroom training to target audiences as identified by compliance risk assessment. The overall CMS approach by SAP is continuously monitored internally and externally, and adapted accordingly, if needed.
| | |
| Combined Management ReportRisk Management and Risks | | 108 |
Although we estimate the probability of occurrence of intentional or negligent major unethical conduct to be remote, we cannot exclude the possibility that this risk could materialize. In that event, this risk could have a major impact on our reputation, business, financial position, profit, and cash flows and could cause a negative deviation from our operating profit target. We classify this risk as a low risk.
Communication and Information Risks
Our controls and efforts to prevent the unauthorized disclosure of confidential information might not be effective.
Confidential information and internal information related to topics such as our strategy, new technologies, mergers and acquisitions, unpublished financial results, or personal data, could be prematurely or inadvertently disclosed and subsequently lead to market misperception and volatility. This could require us to notify multiple regulatory agencies and comply with applicable regulatory requirements and, where appropriate, the data owner, which could result in a loss of reputation for SAP. For example, leaked information during a merger or acquisition deal could cause the loss of our deal target, or our share price could react significantly in case of prematurely published financial results. This could have an adverse effect on our market position and lead to fines and penalties. In addition, this could have an adverse effect on our business, financial position, profit, and cash flows.
We take a wide range of actions to prevent unauthorized disclosure of information, including procedural and organizational measures. These measures include mandatory security awareness training for all employees, social engineering tests, standards for safe internal and external communication, and technical security features in our IT hardware and communication channels, such as mandatory encryption of sensitive data.
Although we estimate the likelihood of occurrence of this risk to be remote, we cannot completely exclude the possibility that this risk could have a business-critical impact on our reputation, business, financial position, profit, and cash flows, or cause a negative deviation from our operating profit target. We classify this risk as a medium risk.
Financial Risks
Our sales are subject to quarterly fluctuations and our sales forecasts may not be accurate.
Our revenue and operating results can vary and have varied in the past, sometimes substantially, from quarter to quarter. Our revenue in general, and our software revenue in particular, is difficult to forecast for a number of reasons, including:
| ¡ | | The relatively long sales cycles for our products |
| ¡ | | The large size, complexity, and extended timing of individual customer transactions |
| ¡ | | The introduction of licensing and deployment models such as cloud subscription models |
| ¡ | | The timing of the introduction of new products or product enhancements by SAP or our competitors |
| ¡ | | Changes in customer budgets |
| ¡ | | Decreased software sales that could have an adverse effect on related maintenance and services revenue |
| ¡ | | The timing, size, and length of customers’ services projects |
| ¡ | | Deployment models that require the recognition of revenue over an extended period of time |
| ¡ | | Adoption of, and conversion to, new business models leading to changed or delayed payment terms |
| ¡ | | Seasonality of a customers’ technology purchases |
| ¡ | | Limited visibility during the ongoing integration of acquired companies into their ability to accurately predict their sales pipelines and the likelihood that the projected pipeline will convert favorably into sales |
| ¡ | | Other general economic, social, environmental, and market conditions, such as a global economic crisis and difficulties for countries with large debt |
Since many of our customers make their IT purchasing decisions near the end of calendar quarters, and with a significant percentage of those decisions being made during our fourth quarter, even a small delay in purchasing decisions for our on-premise software could have an adverse effect on our revenue results for a given year. Our dependence on large transactions has decreased in recent years with a trend towards an increased number of transactions coupled with a decrease in deal size. However, the loss or delay of one or a few large opportunities could have an adverse effect on our business, financial position, profit, and cash flows.
We use a “pipeline” system for forecasting sales and trends in our business. Pipeline analysis informs and guides our business planning, budgeting, and forecasting, but pipeline estimates do not necessarily consistently correlate to revenue in a particular quarter, potentially due to one or more of the reasons outlined above. The reliability of our plans, budgets, and forecasts may therefore be compromised. Because our operating expenses are based upon anticipated revenue levels and a high percentage of our expenses are relatively fixed in the near term, any shortfall in anticipated revenue or delay in revenue recognition could result in significant variations in our operating results from quarter to quarter or year to year. Continued deterioration in global economic conditions would make it increasingly difficult for us to accurately forecast demand for our products and services, and could cause our revenue, operating results, and cash flows to fall short of our expectations and public forecasts. This could have an adverse effect on our stock price. To the extent any future expenditure fails to generate the anticipated increase in revenue, our quarterly or annual operating results may be subject to an adverse effect and may vary significantly compared to preceding or subsequent periods. As we recognize cloud subscriptions and support revenue over the respective service period that typically ranges from one-to-three years with some up to five years, the relevance and impact of sales fluctuations decrease along with the growing importance of these revenues.
| | |
| Combined Management ReportRisk Management and Risks | | 109 |
Although we estimate the probability of occurrence of this risk to be unlikely, we cannot completely exclude the possibility that this risk could have a moderate impact on our business, financial position, profit, and cash flows, or cause a negative deviation from our revenue and operating profit target. We classify this risk as a low risk.
External factors could impact our liquidity and increase the default risk associated with, and the valuation of, our financial assets.
Macroeconomic factors such as an economic downturn could have an adverse effect on our future liquidity. We use a globally centralized financial management to control financial risk, such as liquidity, exchange rate, interest rate, counterparty, and equity price risks. The primary aim is to maintain liquidity in the SAP Group at a level that is adequate to meet our obligations at any time. Our total Group liquidity is supported by our strong operating cash flows, of which a large part is recurring, and by credit facilities from which we can draw if necessary. However, adverse macroeconomic factors could increase the default risk associated with the investment of our total Group liquidity including possible liquidity shortages limiting SAP’s ability to repay financial debt. This could have an impact on the value of our financial assets, which could have an adverse effect on our business, financial position, profit, and cash flows.
SAP’s investment policy with regards to total Group liquidity is set out in our internal treasury guideline, which is a collection of uniform rules that apply globally to all companies in the SAP Group. Among others, it requires that we invest, with limited exceptions, only in assets and funds rated BBB flat or better. The weighted average rating of the investments of our total Group liquidity is in the range A to A-. We continue to pursue a policy of cautious investment characterized by wide portfolio diversification with a variety of counterparties, predominantly short-term investments, and standard investment instruments.
Although we estimate the probability of occurrence of this risk to be remote, there can be no assurance that the prescribed measures will be successful or that uncertainty in global economic conditions could not have a business-critical impact on our business, financial position, profit, cash flows, or operating profit target. We classify this risk as a medium risk.
Management use of estimates could negatively affect our business, financial position, profit, and cash flows.
To comply with IFRS, management is required to make numerous judgments, estimates, and assumptions (among others for our major patent disputes) that affect the reported financial figures. The facts and circumstances, as well as assumptions on which management bases these estimates and judgments and management’s judgment regarding the facts and circumstances, may change from time to time and this could result in significant changes in the estimates and judgments and, consequently, in the reported financials. Such changes could have an adverse effect on our business, financial position, profit and cash flows.
We have a number of control procedures in place to make sure that our estimates and judgments are adequate. For example, we apply two-person verification to significant estimating.
Although we estimate the probability of occurrence of the risk to be unlikely, we cannot completely exclude the possibility of a moderate impact on our business, financial position, profit, and cash flows, or a negative deviation from our revenue and operating profit target. We classify this risk as a low risk.
Current and future accounting pronouncements and other financial reporting standards, especially but not only concerning revenue recognition, may negatively impact our financial results.
We regularly monitor our compliance with applicable financial reporting standards and review new pronouncements and drafts thereof that are relevant to us. As a result of new standards, changes to existing standards (including the new IFRS 15 on revenue from contracts with customers that we will need to adopt in 2018) and changes in their interpretation, we might be required to change our accounting policies, particularly concerning revenue recognition, to alter our operational policies so that they reflect new or amended financial reporting standards, or to restate our published financial statements. Such changes may have an adverse effect on our reputation, business, financial position, and profit, or cause an adverse deviation from our revenue and operating profit target.
Although we estimate the probability of occurrence of the risk to be unlikely, we cannot completely exclude the possibility of a major impact. We classify this risk as a medium risk.
Because we conduct operations throughout the world, our business, financial position, profit, and cash flows may be affected by currency and interest rate fluctuations.
Our Group-wide management reporting and our external financial reporting are both in euros. Nevertheless, a significant portion of our business is conducted in currencies other than the euro. Approximately 74% of our revenue in 2015 was attributable to operations outside the euro area and was translated into euros. Consequently, period-over-period changes in the euro rates for particular currencies can significantly affect our reported revenues, profits and cash flows. In general, appreciation of the euro relative to another
| | |
| Combined Management ReportRisk Management and Risks | | 110 |
currency has an adverse effect while depreciation of the euro relative to another currency has a positive effect. Variable interest balance-sheet items are also subject to changes in interest rates. Such changes may have an adverse effect on our business, financial position, profit and cash flows or cause an adverse deviation from our revenue and operating profit target.
We continuously monitor our exposure to currency fluctuation risks based on balance-sheet items and expected cash flows, and pursue a Group-wide foreign exchange risk management strategy using, for example, derivative financial instruments as appropriate. With regards to our financial debt, we have a very balanced maturity profile and mixture of fixed and floating interest rate arrangements in place.
We believe that the likelihood of this risk of significant currency and interest rate fluctuations affecting our reported revenue and income materializing is remote and that if the risk were to occur, its impact on our business, financial position, profit, and cash flows could be major, or cause a negative deviation from our revenue and operating profit target. We classify this risk as a low risk.
For more information about risks arising from financial instruments, including our currency and interest rate risks and our related hedging activity, see the Notes to the Consolidated Financial Statements section,Notes (24) to(25).
The cost of using derivative instruments to hedge share-based payments may exceed the benefits of hedging them.
We use derivative instruments to reduce the impact of our share-based payments on our income statement and to limit future expense associated with those plans. Based on a defined hedging strategy, we align the decision of individual hedging transactions with the Group CFO in the Treasury Committee. The expense of hedging the share-based payments could exceed the benefit achieved by hedging them. On the other hand, a decision to leave the plans materially unhedged could prove disadvantageous. This could have an adverse effect on our business, financial position, profit and cash flows or cause an adverse deviation from our revenue and operating profit target.
We believe that the likelihood of this risk materializing is remote and that if the risk were to occur, its potential impact on our business, financial position, profit, cash flows, and operating profit target would be minor. We classify this risk as a low risk.
Project Risks
Implementation of SAP software often involves a significant commitment of resources by our customers and is subject to a number of significant risks over which we often have no control.
A core element of our business is the successful implementation of software solutions to enable our customers to master complexity and help our customers’ business run at their best. The implementation of SAP software is led by SAP, by partners, by customers, or by a combination thereof. Depending on various factors, such as the complexity of solutions, the customer’s implementation, integration and migration needs, or the resources required, SAP faces a number of different risks. For example, functional requirement changes, delays in timeline, or deviation from recommended best practices may occur during the course of a project. These scenarios have a direct impact on the project resource model and on securing adequate internal personnel or consultants in a timely manner and could therefore prove challenging.
As a result of these and other risks, SAP and/or some of our customers have incurred significant implementation costs in connection with the purchase and installation of SAP software products. Some customer implementations have taken longer than planned. We cannot guarantee that we can reduce or eliminate protracted installation or significant third-party consulting costs, for example, that trained consultants will be readily available, that our costs will not exceed the fees agreed in fixed-price contracts, or that customers will be satisfied with the implementation of our software and solutions. Unsuccessful, lengthy, or costly customer implementation and integration projects could result in claims from customers, harm SAP’s reputation, and could have an adverse effect on our business, financial position, profit, and cash flows.
Our customers continue to follow project approaches to optimize their IT solutions in a non-disruptive manner. Our projects also include risk management processes that are integrated into SAP project management methods intended to safeguard implementations with coordinated risk and quality management programs. As part of our processes, we make adequate financial planning provisions for the remaining individual risks.
We estimate the probability of occurrence of this risk to be unlikely, but we cannot completely exclude the possibility that this risk could have a major negative impact on our reputation, business, financial position, profit, and cash flows, or cause a negative deviation from our revenue and operating profit target. We classify this risk as a medium risk.
| | |
| Combined Management ReportRisk Management and Risks | | 111 |
Product and Technology Risks
Undetected security vulnerabilities shipped and deployed within our products might cause damage to SAP and our customers, and partners.
Customer systems or systems operated by SAP itself to provide services could potentially be compromised by vulnerabilities if they are exploited by hackers. This could lead to theft, destruction, or abuse of data, or systems could be rendered unusable (for example, due to distributed denial of service attacks). The detection of security vulnerabilities in our software, our customers’ systems, or SAP systems used in the provision of services, especially in case of exploitation, could prevent us from meeting our contractual obligations and subsequently might lead to customer claims and reputational damage, which might have an adverse effect on our business, financial position, profit, and cash flows.
We have implemented a software security development lifecycle as a mandatory integral part of our software development process. We systematically align our software security development lifecycle to the recommendations of ISO/IEC 27034, applying methods to develop secure software in all development phases starting early in the design phase. This includes industry best practices such as security risk identification, threat modeling, a comprehensive security testing strategy, mandatory security training for all developers, and security validation of our products, patches, and services before shipment.
SAP has a software security response process in place to rapidly react to detected vulnerabilities and provide fixes. We have also improved the roll-out procedures for security-relevant notes, patches, and service packs to ensure easy and fast consumption on the customer side. However, with regards to the Applications, Technology and Services segment, there is a risk that customers do not upgrade or patch their business systems on a timely basis according to SAP’s recommendations.
We cannot completely exclude the possibility of a negative impact on our customers’ and partners’ or our own operations globally or in one or more countries or regions. We estimate the probability of occurrence of the risk of severe damages to customers and SAP to be unlikely. If such an occurrence happens, it could have a business-critical impact on our reputation, business, financial position, profit, and cash flows as well as on the achievement of our revenue and operating profit target. We classify this risk as a medium risk.
Undetected defects in the introduction of new products and product enhancements could increase our costs, and reduce customer demand.
Our development investment, including new product launches and enhancements, is subject to risks. For example, software products and services might not completely meet our high-quality standards, including security standards; might not fulfill market needs or customer expectations; or might not comply with local standards and requirements. Furthermore, this risk also exists with respect to acquired companies’ technologies and products where we might not be able to manage these as quickly and successfully as expected. Therefore, market launches, entering new markets, or the introduction of new innovations could be delayed or not be successful.
In addition, new products and cloud offerings, including third-party technologies we have licensed and open source software components we use in those products, could contain undetected defects or they might not be mature enough from the customer’s point of view for business-critical solutions. The detection and correction of any defects especially after delivery could be expensive and time-consuming and we might not be able to meet the expectations of customers regarding time and quality in the defect resolution process. In some circumstances, we might not be in a position to rectify such defects or entirely meet the expectations of customers, specifically as we are expanding our product portfolio into additional markets. As a result, we might be faced with customer claims for cash refunds, damages, replacement software, or other concessions. The risk of defects and their adverse consequences could increase as we seek to introduce a variety of new software products and product enhancements at a higher innovation rate. This is especially relevant for cloud products as delivery cycles are even shorter (up to daily deliveries) and our complete cloud product customer base could receive undetected defects simultaneously. Furthermore, for products that use third-party (not SAP) cloud services, we cannot detect defects in advance. Significant undetected defects or delays in introducing new products or product enhancements could affect market acceptance of SAP software products and could have an adverse effect on our reputation, business, financial position, profit, and cash flows.
The use of existing SAP software products by customers in business-critical solutions and processes and the relative complexity and technical interdependency of our software products and services create a risk that customers or third parties may pursue warranty, performance, or other claims against us for actual or alleged defects in SAP software products, in our provision of services, or in our application hosting services. We have in the past been, and may in the future be, subject to warranty, performance, or other similar claims.
Although our contracts generally contain provisions designed to limit our exposure due to actual or alleged defects in SAP software products or in our provision of services, these provisions may not cover every eventuality or be effective under the applicable law. Regardless of its merits, any claim could entail substantial expense and require the devotion of significant time and attention by key management personnel. Publicity surrounding such claims could affect our reputation and the demand for our software.
| | |
| Combined Management ReportRisk Management and Risks | | 112 |
We counter these risks using a broad range of techniques, including project management, project monitoring, product standards and governance, and rigid and regular quality assurance measures certified to ISO 9001:2008, applicable to the Applications, Technology and Services segment. Additionally, we conduct program risk assessments during product development as well as market introduction phases, and direct customer feedback is considered in the market release decision process. Delivering high-quality software products is a priority and part of our core business. Our strong investment and permanent efforts lead to a generally high level of quality of our products, which is made transparent in the defined quality perception and support index and confirmed by our constantly high customer satisfaction ratings as measured by customer quality perception reporting.
With regards to the increased volume of open source software components used in our software products and services as well as in the products and services of our acquired companies, we see a probability of this risk to materialize but rate the probability as unlikely. We cannot completely exclude the possibility that this risk, if it were to occur, could have a business-critical impact on our reputation, business, financial position, profit, and cash flows, or cause a negative deviation from our revenue and operating profit target. We classify this risk as a medium risk.
Changes in our rights to use software, cloud services, and technologies we license from third parties that are an integral part of SAP’s products could slow down time to market and influence our license pricing and therefore the competitiveness with other software vendors. Furthermore, it could diminish our software’s or cloud functional capabilities and therefore could jeopardize the stability of our solution portfolio offering.
The numerous third-party solutions we have licensed and certain open source software components we use have become an integral part of our product and service portfolio. We depend on those solutions for the functionality of our software and cloud services. Changes to, or the loss of, third-party licenses as well as open source licenses being construed could significantly increase the cost of these licenses and significantly reduce software or cloud functionality and/or usability of SAP’s software or cloud offerings. As a result, we might incur additional development or license costs to ensure the continued functionality of our products, which could have an adverse effect on our business, financial position, profit, and cash flows. This risk increases with each of our acquisitions of a company or a company’s intellectual property assets that had been subject to third-party solution licensing, open source software and product standards less rigorous than our own.
We strive to execute appropriate due diligence and contract management processes and to continuously monitor development projects through our product implementation lifecycle process and monitoring as part of our cloud deployment.
We believe that the probability of occurrence of this risk is likely and we cannot exclude the possibility of a major impact on our business, financial position, profit, and cash flows, or the possibility of a negative deviation from our revenue and operating profit target. We classify this risk as a medium risk.
If we are unable to keep up with rapid technological, process and service innovations, and new business models as well as changing market expectations, we might not be able to compete effectively.
Our future success depends upon our ability to keep pace with technological and process innovations and new business models, as well as our ability to develop new products and services, enhance and expand our existing products and services portfolio, and integrate products and services we obtain through acquisitions. To be successful, we are required to adapt our products and our go-to-market approach to a cloud-based delivery model to satisfy changing customer demand.
We might not be successful in bringing new business models, solutions, solution enhancements, and/or services to market before our competitors. We may also face increasing competition from open source software initiatives in which competitors may provide software and intellectual property free and/or under terms and conditions unfavorable for SAP. In addition, we might not be able to generate enough revenue to offset the significant research and development costs we incur to deliver technological innovations or to offset the required infrastructure costs to deliver our solutions and services as part of our new business models. Moreover, we might not anticipate and develop technological improvements or succeed in adapting our products, services, processes, and business models to technological change, changing regulatory requirements, emerging industry standards, and changing requirements of our customers and partners. Finally, we might not succeed in producing high-quality products, enhancements, and releases in a timely and cost-effective manner to compete with products, solutions, and other technologies offered by our competitors, which could have an adverse effect on our reputation, business, financial position, profit, and cash flows.
We will continue to align our organization, processes, products, delivery models, and services to changing markets and customer and partner demands. We develop new technology and new solutions such as the next-generation suite SAP S/4HANA or adopt the latest technology if there is a clear business opportunity for SAP and if it provides value to our customers. To ensure that we remain competitive in the future, we still conduct wide-ranging market and technology analyses and research projects, often in close cooperation with our customers and partners. We strive for strategic acquisitions with the potential to drive innovation and contribute to achieving our growth target.
| | |
| Combined Management ReportRisk Management and Risks | | 113 |
We believe that the likelihood of this risk materializing is remote; however, we cannot exclude the business-critical impact this risk would have on our reputation, business, financial position, profit, and cash flows, or the potential negative deviation from our revenue and operating profit target if it were to materialize. We classify this risk as a medium risk.
Our technology and/or product strategy may not be successful or our customers and partners might not adopt our technology platforms and other innovations accordingly.
We offer customers a broad portfolio of products, solutions, and services. Our technology strategy centers on SAP HANA as a real-time in-memory computing platform for analytics and applications, the SAP S/4HANA suite as the digital core, the business network, and SAP HANA Cloud Platform as our platform-as-a-service offering. The success of our technology strategy depends on the delivery of the new digital framework, as our technology continues to deliver business value to meet changing customer expectations. Our technology strategy also relies on our ability to maintain a dynamic network of partner organizations developing their own business applications using our technology platforms.
We might not be successful in integrating our platforms, enabling the complete product and cloud service portfolio, harmonizing our user interface design and technology, integrating acquired technologies, or bringing new solutions based on the SAP HANA platform as well as SAP HANA Cloud Platform to the market as fast as expected, in particular, innovative applications such as SAP S/4HANA. In addition, we may not be able to compete effectively in the area of cloud services and our new applications and services might not meet customer expectations. As a result, our partner organizations and customers might not adopt our technology platforms, applications, or cloud services quickly enough or they might consider competitive solutions. This could have an adverse effect on our reputation, business, financial position, profit, and cash flows.
We believe that we will be able to deliver additional business value with minimum disruption to our customers if we can successfully drive the integration and convergence of our technology platform offerings, SAP S/4HANA, as well as acquired technologies, enable our current product portfolio for SAP HANA, develop new solutions based on SAP HANA, and offer comprehensive cloud-based services, extendable with SAP HANA Cloud Platform. We enable and encourage partners to leverage SAP technology by providing guidance about business opportunities, architecture, and technology, as well as a comprehensive certification program designed to ensure that relevant third-party solutions are of consistently high quality.
We believe that the likelihood of this risk materializing is unlikely. If this risk were to occur, its impact on our reputation, business, financial position, profit, cash flows, and revenue and operating profit target would be business-critical. We classify this risk as a medium risk.
Our cloud offerings might be subject to a security attack, become unavailable, or fail to perform properly.
The software used in our cloud portfolio is inherently complex and any defects in product functionality, data center operations, or system stability that cause interruptions in the availability of our application portfolio could result in the following:
| ¡ | | Lost or delayed market acceptance and sales |
| ¡ | | Breach of warranty or other contract breach or misrepresentation claims |
| ¡ | | Sales credits or refunds to our customers or partners |
| ¡ | | Loss of customers and/or partners |
| ¡ | | Diversion of development and customer service resources |
| ¡ | | Breach of data protection and privacy laws and regulations |
| ¡ | | Customers considering competitive cloud offerings |
| ¡ | | Loss of customer satisfaction and brand reputation |
The costs incurred in correcting any defects or errors might be substantial and could have an adverse effect on our reputation, business, financial position, profit, and cash flows. The availability of our cloud applications could be interrupted by a number of factors, resulting in customers’ inability to access their cloud applications, system outages, failure of our network due to human or other errors, security breaches, or variability in user traffic for our cloud applications. Because of the large amount of data that we collect and manage, hardware failures, defects in our software, or errors in our systems could result in data loss or corruption, or cause the information that we collect to be incomplete or contain inaccuracies that our customers regard as significant. Additionally, any loss of the right to use hardware purchased or leased from third parties could result in delays in our ability to provide our cloud applications until equivalent technology is either developed by us or, if available, identified. Furthermore, our cooperation with partners in the area of cloud includes the co-location of data centers that might expose SAP to additional risks in the area of security and data protection, as well as the potential for breached service-level agreements by partners.
We have administrative, technical, and physical security measures in place as well as contracts that require third-party data centers to have appropriate security and data protection and privacy measures in place. In this context, customers might demand to use only specific and/or local data centers. However, if these security measures are breached as a result of third-party action, employee error or malfeasance, or otherwise, and
| | |
| Combined Management ReportRisk Management and Risks | | 114 |
if, as a result, someone obtains unauthorized access to our customers’ data, which may include personally identifiable information regarding users, our reputation could be damaged, our business may suffer, local data protection and privacy laws or regulations might be breached, and we could incur significant liability.
In addition, our insurance coverage might not cover claims against us for loss or security breach of data or other indirect or consequential damages. Moreover, defending a suit, regardless of its merit, could be costly and time-consuming. In addition to potential liability, if we experience interruptions in the availability of our cloud applications, our reputation could be harmed and we could lose customers.
Our mitigation measures have been designed and implemented to minimize such adverse effects. We continuously invest in protecting the integrity and security of our products and services as well as internal and external data that is managed within our data centers. We are consolidating and harmonizing our data centers and our data protection measures, including implementing security information and event management solutions as well as network access control enforcement, to run a homogeneous landscape that supports the complex infrastructure, application, and security requirements so that we can deliver the required service level for cloud services.
Although we estimate the probability of occurrence of this risk to be unlikely, we cannot completely exclude the possibility that any disruption of our cloud operations could result in a business-critical impact on our reputation, business, financial position, profit, cash flows, and revenue and operating profit target. We classify this risk as a medium risk.
Operational Risks
Third parties have claimed, and might claim in the future, that we infringe their intellectual property rights, which could lead to damages being awarded against us and limit our ability to use certain technologies in the future.
We believe that we will increasingly be subject to intellectual property infringement claims as our solution portfolio grows; as we acquire companies with increased use of third-party code including open source code; as we expand into new industries with our offerings, resulting in greater overlap in the functional scope of offerings; and as non-practicing entities that do not design, manufacture, or distribute products increasingly assert intellectual property infringement claims.
Any claims, with or without merit, and negotiations or litigation relating to such claims, could preclude us from utilizing certain technologies in our products, be time-consuming, result in costly litigation, and require us to pay damages to third parties, stop selling or reconfigure our products and, under certain circumstances, pay fines and indemnify our customers, which could have an adverse effect on our business, financial profile, profit, cash flows, and reputation. They could also require us to enter into royalty and licensing arrangements on terms that are not favorable to us, cause product shipment delays, subject our products to injunctions, require a complete or partial redesign of products, result in delays to our customers’ investment decisions, and damage our reputation.
Software includes many components or modules that provide different features and perform different functions. Some of these features or functions may be subject to third-party intellectual property rights. The rights of another party could encompass technical aspects that are similar to one or more technologies in one or more of our products. Intellectual property rights of third parties could preclude us from using certain technologies in our products or require us to enter into royalty and licensing arrangements on unfavorable or expensive terms.
The software industry is making increasing use of open source software in its development work on solutions. We also integrate certain open source software components from third parties into our software. Open source licenses may require that the software code in those components or the software into which they are integrated be freely accessible under open source terms. Third-party claims may require us to make freely accessible under open source terms one of our products or third-party (not SAP) software upon which we depend.
SAP continues to expand our participation in standards organizations and increase the use of such standards in our products. Participation in standards organizations might require the licensing of SAP’s intellectual property to contributors to the standard and to all standards implementers, including competitors, on a non-discriminatory basis in accordance with licensing terms defined by standards organizations. Within the software-related standards field, there is a trend toward expanding the scope of licensing obligations and narrowing an intellectual property owner’s right to revoke a license if sued by a licensee. In certain situations, limitations on SAP’s rights to revoke a license could reduce SAP’s ability to assert a patent infringement claim against a third-party. Assertion of patents inadvertently licensed through standards could expose SAP to third-party claims.
Our Legal Compliance and Integrity Office is responsible for constantly assessing and managing risks associated with third-party intellectual property. It works closely with our Global GRC organization. The Legal Compliance and Integrity Office investigates the way we handle intellectual property, sets internal policies, and monitors compliance with these policies.
We consider the probability of this risk materializing to be likely, and that any claims concerning intellectual property rights of third parties, open source requirements, or certain standards could have a business-critical impact on our business, financial position, profit, cash flows and reputation, as well as on the achievement of our revenue and operating profit target, and could also exacerbate the other risks we describe in this report. We classify this risk as a high risk.
| | |
| Combined Management ReportRisk Management and Risks | | 115 |
We are named as a defendant in various legal proceedings for alleged intellectual property infringements. For more information and a more detailed report relating to certain of these legal proceedings, see the Notes to the Consolidated Financial Statements,Note (23).
Claims and lawsuits against us could have an adverse effect on our business, financial position, profit, cash flows, and reputation.
Claims and lawsuits are brought against us, including claims and lawsuits involving businesses we have acquired. Adverse outcomes to some or all of the claims and lawsuits pending against us might result in the award of significant damages or injunctive relief against us that could hinder our ability to conduct our business and could have an adverse effect on our reputation, business, financial position, profit, and cash flows.
The outcome of litigation and other claims or lawsuits is intrinsically uncertain. Management’s view of the litigation may also change in the future. Actual outcomes of litigation and other claims or lawsuits could differ from the assessments made by management in prior periods, which are the basis for our accounting for these litigations and claims under IFRS.
We consider the probability of occurrence of this risk to be likely, and cannot exclude its business-critical impact on our reputation, business, financial position, profit, cash flows, and revenue and operating profit target if it were to materialize. We classify this risk as a high risk.
For more information and a more detailed report relating to certain of these legal proceedings, see the Notes to the Consolidated Financial Statements,Note (23).
We might not acquire and integrate companies effectively or successfully and our strategic alliances might not be successful.
To expand our business, we acquire businesses, products, and technologies, and we expect to continue to make acquisitions in the future. Over time certain of these acquisitions have increased in size and in strategic importance for SAP, Management negotiation of potential acquisitions and alliances and integration of acquired businesses, products, or technologies demands time, focus, and resources of management and of the workforce. Acquisitions of companies, businesses, and technology expose us to unpredictable operational difficulties, expenditures, and risks. These risks include, among others:
| ¡ | | Selection of the wrong integration model for the acquired company and/or technology |
| ¡ | | Failure to properly evaluate the acquired business and its different business and licensing models |
| ¡ | | Failure to successfully integrate acquired technologies or solutions into SAP’s solution portfolio and strategy in a timely and profitable manner |
| ¡ | | Failure to integrate the acquired company’s operations across SAP’s different cultures, languages, and local protocols, all within the constraints of applicable local laws |
| ¡ | | Failure to meet the needs of the acquired company’s customers and partners in the combined company |
| ¡ | | The diversion of management’s time and attention from daily operations |
| ¡ | | Loss of key personnel of the acquired business |
| ¡ | | Material unknown liabilities and contingent liabilities of acquired companies, including legal, tax, accounting, intellectual property, or other significant liabilities that may not be detected through the acquisition due diligence process |
| ¡ | | Legal and regulatory constraints (such as contract obligations, privacy frameworks, and agreements) |
| ¡ | | Difficulties in implementing, restoring, or maintaining internal controls, procedures, and policies |
| ¡ | | Practices or policies of the acquired company that may be incompatible with our compliance requirements |
| ¡ | | An adverse effect on relationships with existing customers, partners, or third-party providers of technology or products |
| ¡ | | Difficulties in integrating the acquired company’s accounting, HR, and other administrative systems and coordination of the acquired company’s research and development (R&D), sales, and marketing functions |
| ¡ | | Debt incurrence or significant cash expenditures |
| ¡ | | Constraints in enforcing acquired companies’ compliance with existing SAP security standards in a timely manner |
| ¡ | | Difficulties in customer implementation projects combining technologies and solutions from both SAP and the acquired company |
In addition, acquired businesses might not perform as anticipated, resulting in charges for the impairment of goodwill and other intangible assets on our statements of financial position. Such charges may have an adverse effect on our business, financial position, profit, and cash flows. We have entered into, and expect to continue to enter into, alliance arrangements for a variety of purposes, including the development of new products and services. There can be no assurance that any such products or services will be successfully developed or that we will not incur significant unanticipated liabilities in connection with such arrangements. We may not be successful in overcoming these risks and we may therefore not benefit as anticipated from acquisitions or alliances.
| | |
| Combined Management ReportRisk Management and Risks | | 116 |
We counter these acquisition-related risks with many different methodological and organizational measures. These include technical, operational, financial, and legal due diligence on the company or assets to be acquired and a holistic evaluation of material transaction and integration risks. The methods we use depend on the integration scenario. Our integration planning is detailed and standardized, and carried out by a dedicated integration team. We therefore believe we have minimized this risk.
Although we estimate this risk to be unlikely, we cannot completely exclude the possibility that this risk could have a business-critical impact on our business, financial position, profit, cash flows, and revenue and operating profit target. We classify this risk as a medium risk.
We may not be able to obtain adequate title to, or licenses in, or to enforce, intellectual property.
Protecting and defending our intellectual property is crucial to our success. We use a variety of means to identify and monitor potential risks and to protect our intellectual property. These include applying for patents, registering trademarks and other marks and copyrights, implementing measures to stop copyright and trademark infringement, entering into licensing, confidentiality, and non-disclosure agreements, and deploying protection technology. Despite our efforts, we might not be able to prevent third parties from obtaining, using, or selling without authorization what we regard as our proprietary technology and information. All of these measures afford only limited protection, and our proprietary rights could be challenged, invalidated, held unenforceable, or otherwise affected. Some intellectual property might be vulnerable to disclosure or misappropriation by employees, partners, or other third parties. Third parties might independently develop technologies that are substantially equivalent or superior to our technology. Finally, third parties might reverse-engineer or otherwise obtain and use technology and information that we regard as proprietary. Accordingly, we might not be able to protect our proprietary rights against unauthorized third-party copying or utilization, which could have an adverse effect on our competitive and financial positions, and result in reduced sales. Any legal action we bring to enforce our proprietary rights could also involve enforcement against a partner or other third party, which may have an adverse effect on our ability, and our customers’ ability, to use that partner’s or other third parties’ products. In addition, the laws and courts of certain countries may not offer effective means to enforce our intellectual property rights. This could have an adverse effect on our reputation, business, financial position, profit, and cash flows.
We rely on a combination of the protections provided by applicable statutory and common law rights, including trade secret, copyright, patent, and trademark laws, license and non-disclosure agreements, and technical measures to establish and protect our proprietary rights in our products. We have established various internal programs, such as internal policies, processes, and monitoring, to assess and manage the risks associated with standards organizations, open source, and third-party intellectual property.
We may be dependent in the aggregate on technology that we license from third parties that is embedded in our products or that we resell to our customers. We have licensed and will continue to license numerous third-party software products that we incorporate into and/or distribute with our existing products. We endeavor to protect ourselves in the respective agreements by obtaining certain rights in case such agreements are terminated.
We are party to certain patent cross-license agreements with third parties.
We estimate the probability of this risk occurring as likely, and that it could have a business-critical impact on our reputation, business, financial position, profit, cash flows, and revenue and operating profit target. We classify this risk as a high risk.
SAP’s business strategy focuses on certain business models that are highly dependent on a working cyberspace. A cybersecurity breach could have an adverse effect on our customers, our reputation, and our business.
The key cybersecurity risks currently applicable to us include state-driven economic espionage as well as competitor-driven industrial espionage, and criminal activities including, but not limited to, cyberattacks and “mega breaches” against cloud services and hosted on-premise software. This might result in, for example, disclosure of confidential information and intellectual property, defective products, production downtimes, supply shortages, and compromised data (including personal data). A failure of our cybersecurity measures could impact our compliance with legal demands (for example, Sarbanes-Oxley Act, Payment Card Industry Data Security Standard, data privacy) and expose our business operations as well as service delivery to the described risks, for example, virtual attack, disruption, damage, and/or unauthorized access. Additionally, we could be subject to recovery costs, for example, as well as significant contractual and legal claims by customers, partners, authorities, and third-party service providers for damages against us, which could have an adverse effect on our reputation, business, financial position, profit, and cash flows.
To address the increasing cybersecurity threats, we are continuously adapting and modifying our security procedures. We have multiple security measures in place, such as technical IT security measures, identity and access management, and mandatory security and compliance training. In addition, our security governance model clearly defines security management accountabilities for all security areas regarding product security and corporate security, which enables us to respond quickly to identified cybersecurity risks. In 2015, we have established a global security function as well as an independent security audit department within the Corporate Audit organization to appropriately address potential security threats.
| | |
| Combined Management ReportRisk Management and Risks | | 117 |
Although we still consider the occurrence of this risk to be unlikely, we cannot completely exclude the possibility that this risk could have a business-critical impact on our business, financial position, profit, cash flows, and reputation as well as revenue and operating profit target. We classify this risk as a medium risk.
We may not be able to protect our critical information and assets or to safeguard our business operations against disruption.
SAP is highly dependent on the exchange of a wide range of information across our global operations and on the availability of our infrastructure. With regards to our physical environment, we face several key security risks such as industrial and/or economic espionage, serious and organized crime, and other illegal activities, as well as violent extremism and terrorism. We might be endangered by threats including, but not limited to, social engineering, misuse, or theft of information or assets, or damage to assets by trespassers in our facilities or by people who have gained unauthorized physical access to our facilities, systems, or information. These could have an adverse effect on our business, financial profile, profit, and cash flows.
To minimize these risks, we have implemented several technical and organizational measures designed to safeguard our information, IT and facility infrastructure, and other assets. These measures include, for example, physical access control systems at facilities, multilevel access controls, closed-circuit television surveillance, security personnel in all critical areas, and recurring social engineering tests for SAP premises and data centers. Access to information and information systems is controlled using authorization concepts. Managers and employees are regularly sensitized to the issues and given mandatory security and compliance training. We keep these measures under continuous review to mitigate current threats.
Although we estimate the probability of occurrence of this risk to be unlikely, we cannot completely exclude the possibility that any misuse, theft, or breach of security could have a major impact on our business, financial position, profit, and cash flows as well as on our revenue and operating profit target. Due to our strategic transition into cloud business operations, we classify this increased risk as a medium risk.
Our insurance coverage might not be sufficient and we might be subject to uninsured losses.
We maintain insurance coverage to protect us against a broad range of risks, at levels we believe are appropriate and consistent with current industry practice. Our objective is to exclude or minimize risk of financial loss at reasonable cost. However, we may incur losses that may be beyond the limits, or outside the scope, of coverage of our insurance and that may limit or prevent indemnification under our insurance policies. In addition, we might not be able to maintain adequate insurance coverage on commercially reasonable terms in the future. Further, certain categories of risks are currently not insurable at reasonable cost, which could have an adverse effect on our business, financial position, profit, and cash flows. Finally, there can be no assurance of the financial ability of the insurance companies to meet their claim payment obligations.
In view of the scope of our insurance coverage and our selection of insurers, and because we keep our insurance programs under constant review, we believe that the likelihood of this risk materializing is remote.
However, we cannot exclude the possibility of a business-critical impact on our business, financial position, profit, cash flows, and operating profit target if the risk were to occur. We classify this risk as a medium risk.
We could incur significant losses in connection with venture capital investments.
Through Sapphire Ventures (formerly SAP Ventures), our consolidated venture investment funds, we plan to continue investing in new and promising technology businesses. Many such investments initially generate net losses and require additional expenditures from their investors. Changes to planned business operations have, in the past affected, and may in the future affect, the performance of companies in which Sapphire Ventures holds investments, and that could have an adverse effect on the value of our investments in Sapphire Ventures, which could have an adverse effect on our business, financial position, profit, and cash flows. Furthermore, tax deductibility of capital losses and impairment in connection with equity securities are often restricted and could therefore have an adverse effect on our effective tax rate.
To address this risk, Sapphire Ventures diversifies its portfolio and manages our investments actively. In addition, our venture capital activities have a limited scope.
We believe that the likelihood of this risk materializing is remote and that if the risk were to occur, its potential impact on our business, financial position, profit, cash flows, and operating profit target would be minor. We classify this risk as a low risk.
Consolidated Risk Profile
SAP consolidates and aggregates all risks reported by the different business units and functions following our risk management policy, monitored by a Group-wide risk management governance function.
In 2015, we recognized only minor changes in the percentages of all reported risks categorized as “high” or “medium” in our risk-level matrix. The number of risks categorized as “high” accounted for 11% of all reported risks, while the risks categorized as “medium” accounted for 68% of all risks reported in theRisk Factors section.
| | |
| Combined Management ReportRisk Management and Risks | | 118 |
In our view, considering their likelihood of occurrence and impact level, the risks described in our aggregated risk report do not individually or cumulatively threaten our ability to continue as a going concern. Management remains confident that the Group’s earnings strength forms a solid basis for our future business development and provides the necessary resource to pursue the opportunities available to the Group. Because of our strong position in the market, our technological leadership, our highly motivated employees, and our structured processes for early risk identification, we are confident that we can continue to successfully counter the challenges arising from the risks in our risk profile in 2016.
| | |
| Combined Management ReportRisk Management and Risks | | 119 |
Expected Developments and Opportunities
FUTURE TRENDS IN THE GLOBAL ECONOMY
In its most recent report, the European Central Bank (ECB) forecasts moderate growth in the world economy and it expects that this growth will vary across regions and countries in 2016. It foresees more favorable prospects for advanced economies than for emerging markets and developing economies. Geopolitical risks, especially of heightened tensions in the Middle East, could undermine global economic performance, the ECB warns.
In the Europe, Middle East, and Africa (EMEA) region, the ECB expects the euro-area economy to recover slightly more rapidly in 2016 than in the previous year. It suggests that low oil prices, increased publicsector spending on assistance for refugees, and its own monetary measures may encourage that acceleration. In Central and Eastern Europe, the ECB expects economic activity to remain stable but for performance to vary from country to country. The European Union’s structural funds and strong consumer spending may be principal factors behind such growth. In Russia, on the other hand, the economic situation is expected to remain difficult. The ECB expects further cuts in public spending as a consequence of declining oil revenue.
The ECB’s forecasts for 2016 for a number of major countries in the Americas region are cautious. For the United States, the ECB expects that economic growth may slow following the Federal Reserve’s move on interest rates in December 2015. The ECB expects political uncertainty, a tightening of monetary policy, and more restrictive financing conditions to continue to weigh on Brazil’s economy.
For the Asia Pacific Japan (APJ) region, the ECB expects that wage increases and low oil prices will improve consumer spending in Japan. Japan’s exports should also pick up. For China, though, the ECB expects that economic growth will continue to slow following the refocusing of its economy. It believes that the prospects for India’s economy are positive in 2016.
Economic Trends – Year-Over-Year GDP Growth
| | | | | | | | | | | | |
Percent | | 2014e | | | 2015p | | | 2016p | |
| World | | | 3.4 | | | | 3.1 | | | | 3.4 | |
| Advanced economies | | | 1.8 | | | | 1.9 | | | | 2.1 | |
| Developing and emerging economies | | | 4.6 | | | | 4.0 | | | | 4.3 | |
| Europe, Middle East, and Africa (EMEA) | | | | | | | | | | | | |
| Euro area | | | 0.9 | | | | 1.5 | | | | 1.7 | |
| Germany | | | 1.6 | | | | 1.5 | | | | 1.7 | |
| Central and Eastern Europe | | | 2.8 | | | | 3.4 | | | | 3.1 | |
| Middle East and North Africa | | | 2.8 | | | | 2.5 | | | | 3.6 | |
| Sub- Saharan Africa | | | 5.0 | | | | 3.5 | | | | 4.0 | |
| Americas | | | | | | | | | | | | |
| United States | | | 2.4 | | | | 2.5 | | | | 2.6 | |
| Canada | | | 2.5 | | | | 1.2 | | | | 1.7 | |
| Central and South America, Caribbean | | | 1.3 | | | | -0.3 | | | | -0.3 | |
| Asia Pacific Japan (APJ) | | | | | | | | | | | | |
| Japan | | | 0.0 | | | | 0.6 | | | | 1.0 | |
| Asian developing economies | | | 6.8 | | | | 6.6 | | | | 6.3 | |
| China | | | 7.3 | | | | 6.9 | | | | 6.3 | |
e = estimate; p = projection
Source: International Monetary Fund (IMF), World Economic Outlook Update January 2016, Subdued Demand, Diminished Prospects, as of January 19, 2016, p. 6.
| | |
| Combined Management ReportExpected Developments and Opportunities | | 120 |
IT MARKET: THE OUTLOOK FOR 2016
The worldwide IT market is at the dawn of a new era, according to U.S. market research firm IDC. It expects IT market growth to decline in a number of emerging economies, notably Brazil, China, and Russia. For a decade, these countries were the driving force in all segments of the global IT market while the advanced economies were already focusing on the transition from traditional technologies to innovations such as cloud and mobile computing. IDC expects that the growth in traditional IT will also slow in the emerging markets and developing economies in the years ahead. It believes that cloud, mobile, and Big Data will offer the main opportunities for growth. In view of that prediction, IDC expects the worldwide IT market to grow just 2.8% in 2016. Hardware spending is expected to increase by about 1%, and software spending by almost 7% (mainly due to software-as-a-service and platform-as-a-service solutions).
In the Europe, Middle East, and Africa (EMEA) region, IDC expects overall IT market growth to decelerate to 2% in 2016. Notably, the IT market in Western Europe is expected to grow just 1% to 2% in the coming years. The IT market in Germany is not expected to grow much above these rates either, according to IDC. The institute believes that IT spending in Russia might recover as early as 2016 and grow 6% as a result of short-term government stimulus measures.
IDC expects the Americas region IT spending to increase 3.7% in 2016. It believes the IT market in the United States will grow at a similar rate and that, with 7% growth, the software segment will again be the fastest to expand there. For Brazil, IDC expects that the government will pursue a strict program of economic reform in the next few years, which could slow growth in the IT market to a rate of 3% or 4%. IDC forecasts that the IT market in Mexico will also grow by about 3% annually in the next few years.
In the Asia Pacific Japan (APJ) region, IDC believes growth in the IT market might reach 2.5%. However, growth rates again are expected to vary from country to country. IDC expects the IT market in Japan will grow by about 3% in 2016. It anticipates that China’s IT market will expand only in the low to middle single-digit percentage range in the years ahead. The IT market in India, on the other hand, might continue to grow by rates at or above 10% a year, according to IDC.
Trends in the IT Market – Increased IT Spending Year-Over-Year
| | | | | | | | | | | | |
Percent | | 2014e | | | 2015p | | | 2016p | |
| World | | | | | | | | | | | | |
| Total IT | | | 4.5 | | | | 4.9 | | | | 2.8 | |
Hardware | | | 5.2 | | | | 5.5 | | | | 1.1 | |
Packaged software | | | 5.6 | | | | 6.8 | | | | 6.8 | |
Applications | | | 6.9 | | | | 7.3 | | | | 7.1 | |
IT services | | | 3.0 | | | | 2.8 | | | | 3.0 | |
| Europe, Middle East, and Africa (EMEA) | | | | | | | | | | | | |
| Total IT | | | 3.9 | | | | 4.6 | | | | 2.0 | |
Packaged software | | | 4.0 | | | | 4.8 | | | | 5.2 | |
Applications | | | 4.5 | | | | 5.4 | | | | 5.6 | |
IT services | | | 2.2 | | | | 1.9 | | | | 2.6 | |
| Americas | | | | | | | | | | | | |
| Total IT | | | 4.2 | | | | 4.6 | | | | 3.7 | |
Packaged software | | | 6.8 | | | | 8.4 | | | | 7.3 | |
Applications | | | 8.5 | | | | 8.9 | | | | 7.8 | |
IT services | | | 2.8 | | | | 2.8 | | | | 2.6 | |
| Asia Pacific Japan (APJ) | | | | | | | | | | | | |
| Total IT | | | 5.9 | | | | 5.9 | | | | 2.5 | |
Packaged software | | | 4.5 | | | | 4.9 | | | | 8.0 | |
Applications | | | 5.6 | | | | 5.1 | | | | 7.7 | |
IT services | | | 5.3 | | | | 4.6 | | | | 4.6 | |
e = estimate, p = projection
Source: IDC Worldwide Black Book Pivot V3.1, 2015
IMPACT ON SAP
SAP expects to outperform the global economy and the IT industry again in 2016 in terms of revenue growth.
Our 2015 results validate our strategy of innovating across the core, the cloud, and business networks to help our customers become true digital enterprises.
Our innovation cycle for SAP S/4HANA is well underway and the completeness of our vision in the cloud has distinguished SAP from both legacy players and point solution providers. We have beaten our guidance for 2015 on cloud and software as well as on operating income.
In 2015, we have transformed our Company and made it leaner by shifting investments from non-core activities to strategic growth areas enabling us to capture the growth opportunities in the market.
We are well-positioned for the future as reflected in the increase of our ambition for 2017.
| | |
| Combined Management ReportExpected Developments and Opportunities | | 121 |
We plan to continue to invest in countries in which we expect significant growth, helping us reach our ambitious 2016 outlook targets and medium-term aspirations for 2017 and 2020.
We are confident we can achieve our medium-term targets for 2017 and 2020, assuming that the economic environment and IT industry develop as currently forecasted. Balanced in terms of regions as well as industries, we are well-positioned with our product offering to offset smaller individual fluctuations in the global economy and IT market.
A comparison of our business outlook with forecasts for the global economy and IT industry shows that we can be successful even in a tough economic environment and will further strengthen our position as the market leader of enterprise application software.
OPERATIONAL TARGETS FOR 2016 (NON-IFRS)
Revenue and Operating Profit Outlook
We are providing the following outlook for the full-year 2016:
| ¡ | | Based on the continued strong momentum in SAP’s cloud business the Company expects full year 2016 non-IFRS cloud subscriptions and support revenue to be in a range of €2.95 billion to €3.05 billion at constant currencies (2015: €2.30 billion). The upper end of this range represents a growth rate of 33% at constant currencies. |
| ¡ | | SAP expects full year 2016 non-IFRS cloud and software revenue to increase by 6% to 8% at constant currencies (2015: €17.23 billion). |
| ¡ | | SAP expects full-year 2016 non-IFRS operating profit to be in a range of €6.4 billion to €6.7 billion at constant currencies (2015: €6.35 billion). |
We expect our headcount to experience an increase similar to the increase in 2015.
While our full-year 2016 business outlook is at constant currencies, actual currency reported figures are expected to continue to be impacted by currency exchange rate fluctuations.
We expect that non-IFRS total revenue will continue to depend largely on the revenue from cloud and software. However, the revenue growth we expect from this is below the outlook provided for non-IFRS cloud subscriptions and support revenue. We expect the software license revenue in 2016 to be at the same level as in 2015 with SAP gaining market share against our main on-premise license competitors.
We expect that most of the total revenue growth (non-IFRS) will come from the Applications, Technology, and Services segment, equally distributed into software licenses and support revenue growth and cloud subscriptions and support revenue growth. Nevertheless, we anticipate our SAP Business Network segment will outpace the Applications, Technology, and Services segment with a significantly higher total revenue growth rate at lower absolute levels. As such, we expect we will seize a huge market opportunity with continued strong mid- and long-term growth potential.
We continuously strive for profit expansion in all our segments, therefore, we expect an increase in both segments’ profits. The vast majority of the profit expansion comes from our Applications, Technology, and Services segment. Overall, in the SAP Business Network segment, operating profit growth is higher than in the Applications, Technology, and Services segment, but at significantly lower volume.
Across all segments we expect our 2016 non-IFRS cloud subscriptions and support gross margin to be at least stable or to slightly increase compared to 2015. For SAP’s managed-cloud offerings, we still expect negative margins in 2016 which by 2017 are expected to break even.
The following table shows the estimates of the items that represent the differences between our non-IFRS financial measures and our IFRS financial measures.
Non-IFRS Measures
| | | | | | | | |
€ millions | | Estimated
Amounts for 2016 | | | Actual
Amounts for 2015 | |
| Revenue adjustments | | | < 20 | | | | 11 | |
| Share-based payment expenses | | | 590 to 630 | | | | 724 | |
| Acquisition-related charges | | | 690 to 740 | | | | 738 | |
| Restructuring | | | 40 to 60 | | | | 621 | |
We do not expect any Company-wide restructuring programs in 2016.
The Company expects a full-year 2016 effective tax rate (IFRS) of 22.5% to 23.5% (2015: 23.4%) and an effective tax rate (non-IFRS) of 24.5% to 25.5% (2015: 26.1%).
Goals for Liquidity and Finance
On December 31, 2015, we had a negative net liquidity. We believe that our liquid assets combined with our undrawn credit facilities are sufficient to meet our present operating financing needs also in 2016 and, together with expected cash flows from operations, will support debt repayments and our currently planned capital expenditure requirements over the near term and medium term.
In 2016, we expect a positive development of our operating cash flow mainly due to lower restructuring related payments.
| | |
| Combined Management ReportExpected Developments and Opportunities | | 122 |
We intend to repay a US$600 million U.S. private placement when it matures in June. Additionally, we are planning to further repay our outstanding €1.25 billion bank loan.
By the time of this report, we have no concrete plans for future share buybacks.
Based on this planning, at this point in time we expect we will noticeably reduce our net debt in 2016 and gradually return to a positive net liquidity in subsequent years.
Investment Goals
Our planned capital expenditures for 2016 and 2017, other than from business combinations, mainly comprise the construction activities described in theAssets (IFRS) section of this report. We expect investments from these activities of approximately €450 million during the next two years. These investments can be covered in full by operating cash flow.
SAP does not plan any significant acquisitions in 2016 and 2017 but will rather focus on organic growth.
Proposed Dividend
We intend to continue our dividend policy in 2017 as well, which is to pay a dividend totaling more than 35% of the prior year’s profit after tax.
Premises on Which Our Outlook Is Based
In preparing our outlook guidance, we have taken into account all events known to us at the time we prepared this report that could influence SAP’s business going forward.
Among the premises on which this outlook is based are those presented concerning economic development and the assumption that there will be no effects from major acquisitions in 2016 and 2017.
OUTLOOK FOR SAP SE
The primary source of revenue for SAP SE is the license fees it charges subsidiaries for the right to market and maintain SAP software solutions. Consequently, the performance of SAP SE in operating terms is closely tied to the cloud and software revenue of the SAP Group.
In December 2015, SAP SE concluded license agreements with affiliated companies granting SAP SE as of January 2016 worldwide distribution and utilization rights of IP held by these companies. This mainly concerns the IP rights of our acquisitions from the passed years: Ariba, Concur, Fieldglass, SuccessFactors, and Sybase. The planned centralization of the IP rights at SAP SE pursues the goal of simplifying enterprise processes as well as of steering future strategic development decisions more efficiently and more directly.
Against this background and due to the rise in cloud and software anticipated for the SAP Group in 2016 of around 6% to 8% (non-IFRS, at constant currencies), we expect a very strong growth of SAP SEs product revenue at constant currencies.
As the granted IP rights are accompanied by royalty payments and IP-related research and development costs, we also expect the operating expenses to rise noticeably. Thus, we anticipate the operating result of SAP SE to be similar to 2015, provided SAP Group achieves its targets set for 2016 and there are no non-recurring negative effects.
Provided the SAP Group continues to hit its revenue and profit targets, we expect SAP SE to sustain revenue and operating income growth into the medium term.
We believe SAP SE, the parent company of the SAP Group, will receive investment income in the form of profit transfers and dividends again in the future. The growth we expect from the SAP Group should have a positive effect on SAP SE investment income.
The outlook projections for the SAP Group in respect of liquidity, finance, investment, and dividend are equally applicable to SAP SE.
Among the assumptions underlying this outlook are those presented above concerning the economy and our expectations for the performance of the SAP Group.
MEDIUM-TERM PROSPECTS
In this section, all discussion of the medium-term prospects is based exclusively on non-IFRS measures.
We expect to grow our more predictable revenue business while steadily increasing operating profit. Our strategic objectives are focused primarily on the following financial and non-financial objectives: growth, profitability, customer loyalty, and employee engagement.
We are raising our 2017 ambition compared to our outlook previously communicated in 2015 to reflect both the current exchange rate environment and our excellent business momentum.
Assuming a stable exchange rate environment going forward, SAP now expects non-IFRS cloud subscriptions and support revenue in a range of €3.8 billion to €4.0 billion in 2017. The upper end of this range represents a 2015 to 2017 compound annual growth rate (CAGR) of 32%. Non-IFRS total revenue is expected to be in a range of €23.0 billion to €23.5 billion in 2017. We now expect our 2017 non-IFRS operating profit to be in a range of €6.7 billion to €7.0 billion.
We continue to anticipate that the fast-growing cloud business along with growth in support revenue will drive a higher share of more predictable revenue. Given the current software license revenue momentum, we now expect the total of cloud subscriptions and support revenue and software support revenue to be in a range of 63% to 65% of total revenue in 2017.
| | |
| Combined Management ReportExpected Developments and Opportunities | | 123 |
By 2017, we continue to expect the rapidly growing cloud subscriptions and support revenue to be close to software license revenue and they are expected to exceed software license revenue in 2018. At that time, SAP expects to reach a scale in its cloud business that will clear the way for accelerated operating profit expansion.
In 2015, we communicated our long term, high-level ambitions for the year 2020. We are not adjusting this long-term ambition at this time. Thus, we continue to strive for reaching the following by 2020:
| ¡ | | €7.5 billion to €8.0 billion non-IFRS cloud subscriptions and support revenue |
| ¡ | | €26 billion to €28 billion non-IFRS total revenue |
| ¡ | | €8.0 billion to €9.0 billion non-IFRS operating profit |
| ¡ | | 70% to 75% share of more predictable revenue (defined as the total of cloud subscriptions and support revenue and software support revenue) |
By 2020, we expect our business network offering to generate the largest portion of the cloud subscriptions and support revenue. The share of this portion of revenue is expected to be followed by our public cloud offerings. Both of these offerings are expected to each generate, in 2020, cloud subscriptions and support revenues that are significantly higher than the cloud subscriptions and support revenue generated from our private cloud offerings.
We also strive for significantly improving, over the next few years, the profitability of our cloud business. We expect that the flat or slightly increasing cloud subscriptions and support margin development in 2016 will be followed by further margin increases in the following years until we reach our envisioned long-term cloud subscriptions and support margin targets in 2020. These will continue to increase at different rates: We expect the gross margin from our public cloud to reach approximately 80% (2015: approximately 70%) in 2020. Likewise, we expect our business network gross margin to reach approximately 80% (2015: approximately 75%) in 2020. The gross margin for our private cloud is expected to break even in 2016 and reach about 40% in 2020.
In a mature state of our cloud business, we expect that approximately 80% of the cloud subscription business will be generated from existing contracts and their renewals and approximately 20% from new business. This is compared to approximately 60% from existing contracts and renewals and 40% from new business in the fast-growth phase of our cloud business.
We also communicated in 2015 that we aim at further improving the profitability of our on-premise software business. It is our target, from that point in time, to grow, until 2020, our gross profit from software licenses and support by a compound annual growth rate of approximately 3%, leading to an improvement in the software licenses and support gross margin of approximately 2 percentage points.
NON-FINANCIAL GOALS 2016
In addition to our financial goals, we also focus on two non-financial targets: customer loyalty and employee engagement.
We believe it is essential that our employees are engaged, drive our success, and support our strategy. We remain committed to achieving an 82% employee engagement score in 2016 (2015: 81%).
Further, our customers’ satisfaction with the solutions we offer is very important to us. We want our customers not only to be satisfied, but also to see us as a trusted partner for innovation. We measure this customer loyalty metric using the Customer Net Promoter Score (NPS). For 2016, we aim to achieve a Customer NPS of 25% (2015: 22.4%).
OPPORTUNITIES
Our customers rely on SAP as the trusted partner in their business transformation, not only for providing in-memory technology, standardized on-premise and cloud solutions, and access to business networks, but also for helping them drive new business outcomes and enabling business model innovations. To meet these expectations, we must grow consistently and accelerate the pace of our own business transformation by exploiting new opportunities.
We have established a framework for opportunity management by evaluating and analyzing four key areas: current markets, competitive landscapes, external scenarios, and technological trends. Additionally, we have delved into customer and product segmentation, growth drivers, and industry-specific success factors. Based on these combined insights, our Executive Board defines our market strategies. Our shareholder value relies heavily upon a fine balance of risk mitigation and value-driven opportunities. Therefore, our strong governance model ensures that decisions are based on return, investment required, and risk mitigation. We rely on the talent and resources within SAP and our entire ecosystem.
As far as opportunities are likely to occur, we have incorporated them into our business plans, our outlook for 2016, and our medium-term prospects outlined in this report. Therefore, the following section focuses on future trends or events that might result in an uplift of our outlook and medium-term prospects, if they develop better than we have anticipated in our forecasts.
SAP SE is the parent company of the SAP Group and earns most of its revenue from software license fees, subscriptions fees, and dividends paid by affiliates. Consequently, the opportunities described below also apply – directly or indirectly – to SAP SE.
| | |
| Combined Management ReportExpected Developments and Opportunities | | 124 |
Opportunities from Economic Conditions
Economic conditions have a clear influence on our business, financial position, profit, and cash flows. Should the global economy experience a more sustained growth than is reflected in our plans today, our revenue and profit may exceed our current outlook and medium-term prospects.
Our midterm planning is based on unchanged market conditions in emerging markets. Should their stability increase again, this would be an upside to our midterm planning.
For more information about future trends in the global economy and the IT market outlook as well as their potential influence on SAP, see theExpected Developments and Opportunities section.
Opportunities from Research and Development Traction
Our continued growth through innovation is based on our ability to leverage research and development resources effectively. We continue to improve our development processes through design thinking and lean methodologies. We are accelerating innovation cycles especially in the area of cloud solutions and engaging more closely with our customers to ensure accuracy and success.
While speed is a key strength, we also focus on ease of adoption and providing compelling returns. This allows our customers to easily consume technologies and software applications with immediate benefits for their businesses. If we make innovations available faster than currently anticipated, or if customers adopt the innovations faster than currently expected, for example, shifting faster to managed clouds for enterprise resource planning, or shifting faster to our new SAP S/4HANA solutions, this could positively impact our revenue, profit, and cash flows, and result in their exceeding our stated outlook and medium-term prospects.
For more information about future opportunities in research and development for SAP, see theProducts, Research & Development, and Servicessection as well as the Expected Developments and Opportunitiessection.
Opportunities from Our Strategy for Profitable Growth
SAP strives to generate profitable growth across our portfolio of products, solutions, and services to keep or improve its market position. Our aim is to continue to expand our addressable market to €320 billion in 2020, based on new assets in our SAP Business Network Segment, our new technologies, and the extension of our cloud portfolio.
We see opportunities in growing product and market areas, such as in-memory computing, cloud, mobile, business networks, digital marketing, social media, Big Data, the Internet of Things, and predictive analytics. In addition to organic developments and tuck-in acquisitions, large strategic acquisitions in particular may boost our revenue and profits significantly. For example, the acquisition of Concur significantly strengthens the value proposition of a business network from SAP by addressing one of the most important enterprise spend categories – travel expenses. Furthermore, SAP seeks to establish new business models and leverage our expanding ecosystem of partners to achieve scale and maximize opportunities.
Our strong assets in applications and analytics, as well as database and technology, continue to offer solid multiyear growth opportunities as we bring innovative technologies with simplified consumption to our installed base and continue to add net-new customers. Unexpected portfolio growth may positively impact our revenue, profit, and cash flows, and result in their exceeding our stated outlook and medium-term prospects. Specifically, the SAP HANA platform, cloud offerings, and SAP S/4HANA solutions, could create even more demand than is reflected in our stated outlook and medium-term prospects. Further upside potential is possible by higher than expected renewal rates of our cloud solutions.
For more information about future opportunities for SAP, see theStrategy and Business Model section as well asExpected Developments and Opportunities section.
Opportunities from Our Partner Ecosystem
SAP continues to grow and develop a global partner ecosystem. To increase market coverage, we want to enhance our portfolio and spur innovation with the specified objective of increasing the partner revenue contribution to SAP’s overall revenue target. In addition to strengthening our core, we will leverage our entire ecosystem to drive adoption of SAP HANA, cloud solutions, SAP S/4HANA, and SAP HANA Cloud Platform. This includes strategic partnerships across all areas: third-party software vendors, systems integrators, service providers, and infrastructure providers. As a result, we are creating an ever-stronger setup, where SAP, along with our customers and partners, co-innovate and develop new innovative solutions on top of SAP HANA. Should the business of our partners develop better than currently expected, our indirect sales (partner revenue) could grow stronger than reflected in our outlook and medium-term prospects. This may positively impact our revenue, profit, and cash flows, and result in their exceeding our stated medium-term prospects.
For more information about opportunities arising from our partner ecosystem, see thePartner Ecosystem as well asExpected Developments and Opportunities sections.
Opportunities from Our Employees
Our employees drive our innovation, are the value to our customers, and consistently promote our growth and profitability. In 2015, we increased the number of full-time employees accompanied with balanced job restructurings to drive our simplification and growth. We anticipate improvements in employee productivity as a result of our continued endeavors in design-thinking principles. As described in theEmployees and Social Investment section, we constantly invest in our talents to increase engagement, collaboration, social innovation, and health.
| | |
| Combined Management ReportExpected Developments and Opportunities | | 125 |
To ensure continuous innovation and sustained business success, we need to continuously tap into the global talent pool and bring the best and brightest talent to SAP. To do so, we aim to further strengthen our brand perception in the market and optimize our recruiting experience to emphasize our focus on helping the world run better and improving people’s lives. Furthermore, we will maximize mobile channels and innovative talent strategies to tap into new talent pools.
Our outlook and medium-term prospects are based on certain assumptions regarding employee turnover and our Business Health Culture Index (as defined in theEmployees and Social Investmentsection. Should these develop better than expected there might be an upside to employee productivity and engagement. In turn, this might positively impact our revenue, profit, and cash flows, and result in their exceeding our stated medium-term prospects.
For more information about future opportunities from our employees, see theEmployees and Social Performance section.
Opportunities from Our Customer Engagement
SAP goes to market by region, customer segments, line of business, and industry. We evolve and invest in our go-to-market coverage model to effectively sell industry-specific solutions while increasing our engagement with customers. We focus on the dynamic and fast-changing landscape each industry faces as technology evolves.
We offer unique services that support a significant return on investment, and continue to actively look at new opportunities to increase the value we deliver to our customers. In 2015, we closely aligned two main organizations responsible for service and support to the Applications, Technology, and Services segment to increase the benefit for our customers. This could potentially lead to an increased level of customer loyalty and higher renewal rates.
In general, our outlook and medium-term prospects are based on certain assumptions regarding the success of our go-to-market approaches. If the actual go-to-market success exceeds these assumptions, this could positively impact our revenue, profit, and cash flows, and result in their exceeding our stated medium-term prospects.
| | |
| Combined Management ReportExpected Developments and Opportunities | | 126 |
Events after the Reporting Period
We are in the process of preparing the consolidation of intellectual property rights from hybris AG to SAP SE. For more information about this transfer, seeNote (33).
The Supervisory Board of SAP SE appointed Stefan Ries and Steve Singh to the SAP Executive Board, with effect from April 1, 2016.
Stefan Ries will continue his role as Chief Human Resources Officer and also take on the role of SAP Labor Relations Director. Steve Singh will continue to lead the SAP Business Network Group.
The Global Managing Board will be dissolved on March 31, 2016.
| | |
| Combined Management ReportEvents after the Reporting Period | | 127 |
128
Consolidated Income Statements of SAP Group for the Years Ended December 31
| | | | | | | | | | | | | | | | |
€ millions, unless otherwise stated | | Notes | | | 2015 | | | 2014 | | | 2013 | |
Cloud subscriptions and support | | | | | | | 2,286 | | | | 1,087 | | | | 696 | |
Software licenses | | | | | | | 4,835 | | | | 4,399 | | | | 4,516 | |
Software support | | | | | | | 10,093 | | | | 8,829 | | | | 8,293 | |
Software licenses and support | | | | | | | 14,928 | | | | 13,228 | | | | 12,809 | |
| | | | | | | | | | | | | | | | |
Cloud and software | | | | | | | 17,214 | | | | 14,315 | | | | 13,505 | |
Services | | | | | | | 3,579 | | | | 3,245 | | | | 3,310 | |
| | | | | | | | | | | | | | | | |
| Total revenue | | | (5 | ) | | | 20,793 | | | | 17,560 | | | | 16,815 | |
| | | | |
Cost of cloud subscriptions and support | | | | | | | -1,022 | | | | -481 | | | | -314 | |
Cost of software licenses and support | | | | | | | -2,291 | | | | -2,076 | | | | -2,056 | |
Cost of cloud and software | | | | | | | -3,313 | | | | -2,557 | | | | -2,370 | |
Cost of services | | | | | | | -3,313 | | | | -2,716 | | | | -2,660 | |
Total cost of revenue | | | | | | | -6,626 | | | | -5,272 | | | | -5,031 | |
Gross profit | | | | | | | 14,167 | | | | 12,288 | | | | 11,784 | |
Research and development | | | | | | | -2,845 | | | | -2,331 | | | | -2,282 | |
Sales and marketing | | | | | | | -5,401 | | | | -4,304 | | | | -4,131 | |
General and administration | | | | | | | -1,048 | | | | -892 | | | | -866 | |
Restructuring | | | (6 | ) | | | -621 | | | | -126 | | | | -70 | |
TomorrowNow and Versata litigation | | | (23 | ) | | | 0 | | | | -309 | | | | 31 | |
Other operating income/expense, net | | | | | | | 1 | | | | 4 | | | | 12 | |
| Total operating expenses | | | | | | | -16,541 | | | | -13,230 | | | | -12,336 | |
| | | | | | | | | | | | | | | | |
| Operating profit | | | | | | | 4,252 | | | | 4,331 | | | | 4,479 | |
| | | | | | | | | | | | | | | | |
| | | | |
| Other non-operating income/expense, net | | | (8 | ) | | | -256 | | | | 49 | | | | -17 | |
Finance income | | | | | | | 241 | | | | 127 | | | | 115 | |
Finance costs | | | | | | | -246 | | | | -152 | | | | -181 | |
| Financial income, net | | | (9 | ) | | | -5 | | | | -25 | | | | -66 | |
| | | | | | | | | | | | | | | | |
| Profit before tax | | | | | | | 3,991 | | | | 4,355 | | | | 4,396 | |
| | | | |
Income tax TomorrowNow and Versata litigation | | | | | | | 0 | | | | 86 | | | | -8 | |
Other income tax expense | | | | | | | -935 | | | | -1,161 | | | | -1,063 | |
Income tax expense | | | (10 | ) | | | -935 | | | | -1,075 | | | | -1,071 | |
| | | | | | | | | | | | | | | | |
| Profit after tax | | | | | | | 3,056 | | | | 3,280 | | | | 3,325 | |
Attributable to owners of parent | | | | | | | 3,064 | | | | 3,280 | | | | 3,326 | |
Attributable to non-controlling interests | | | | | | | -8 | | | | 0 | | | | -1 | |
| | | | |
| Earnings per share, basic (in €) | | | (11 | ) | | | 2.56 | | | | 2.75 | | | | 2.79 | |
| Earnings per share, diluted (in €) | | | (11 | ) | | | 2.56 | | | | 2.74 | | | | 2.78 | |
The accompanying Notes are an integral part of these Consolidated Financial Statements.
| | |
| Consolidated Financial Statements IFRS | | 129 |
Consolidated Statements of Comprehensive Income of SAP Group for the Years Ended December 31
| | | | | | | | | | | | | | | | |
€ millions | | Notes | | | 2015 | | | 2014 | | | 2013 | |
| Profit after tax | | | | | | | 3,056 | | | | 3,280 | | | | 3,325 | |
| Items that will not be reclassified to profit or loss | | | | | | | | | | | | | | | | |
Remeasurements on defined benefit pension plans | | | (18 | ) | | | -19 | | | | -30 | | | | 16 | |
Income tax relating to items that will not be reclassified | | | (10 | ) | | | 2 | | | | 7 | | | | -3 | |
| | | | | | | | | | | | | | | | |
| Other comprehensive income after tax for items that will not be reclassified to profit or loss | | | | | | | -17 | | | | -23 | | | | 13 | |
| Items that will be reclassified subsequently to profit or loss | | | (20 | ) | | | | | | | | | | | | |
Exchange differences | | | | | | | 1,845 | | | | 1,161 | | | | -576 | |
Available-for-sale financial assets | | | (26 | ) | | | 128 | | | | 128 | | | | 60 | |
Cash flow hedges | | | (25 | ) | | | 15 | | | | -38 | | | | 0 | |
Income tax relating to items that will be reclassified | | | (10 | ) | | | 10 | | | | 31 | | | | -8 | |
| | | | | | | | | | | | | | | | |
| Other comprehensive income after tax for items that will be reclassified to profit or loss | | | | | | | 1,997 | | | | 1,282 | | | | -524 | |
| Other comprehensive income net of tax | | | | | | | 1,980 | | | | 1,259 | | | | -511 | |
| | | | | | | | | | | | | | | | |
| Total comprehensive income | | | | | | | 5,036 | | | | 4,539 | | | | 2,814 | |
Attributable to owners of parent | | | | | | | 5,044 | | | | 4,539 | | | | 2,815 | |
Attributable to non-controlling interests | | | | | | | -8 | | | | 0 | | | | -1 | |
The accompanying Notes are an integral part of these Consolidated Financial Statements.
| | |
| Consolidated Financial Statements IFRS | | 130 |
Consolidated Statements of Financial Position of SAP Group as at December 31
| | | | | | | | | | | | |
€ millions | | Notes | | | 2015 | | | 2014 | |
Cash and cash equivalents | | | | | | | 3,411 | | | | 3,328 | |
Other financial assets | | | (12 | ) | | | 351 | | | | 678 | |
Trade and other receivables | | | (13 | ) | | | 5,275 | | | | 4,342 | |
Other non-financial assets | | | (14 | ) | | | 468 | | | | 435 | |
Tax assets | | | | | | | 235 | | | | 215 | |
| | | | | | | | | | | | |
Total current assets | | | | | | | 9,739 | | | | 8,999 | |
Goodwill | | | (15 | ) | | | 22,689 | | | | 21,000 | |
Intangible assets | | | (15 | ) | | | 4,280 | | | | 4,604 | |
Property, plant, and equipment | | | (16 | ) | | | 2,192 | | | | 2,102 | |
Other financial assets | | | (12 | ) | | | 1,336 | | | | 1,021 | |
Trade and other receivables | | | (13 | ) | | | 87 | | | | 100 | |
Other non-financial assets | | | (14 | ) | | | 332 | | | | 164 | |
Tax assets | | | | | | | 282 | | | | 231 | |
Deferred tax assets | | | (10 | ) | | | 453 | | | | 343 | |
| | | | | | | | | | | | |
Total non-current assets | | | | | | | 31,651 | | | | 29,566 | |
| | | | | | | | | | | | |
| Total assets | | | | | | | 41,390 | | | | 38,565 | |
| | |
| Consolidated Financial Statements IFRS | | 131 |
Consolidated Statements of Financial Position of SAP Group as at December 31
| | | | | | | | | | | | |
€ millions | | Notes | | | 2015 | | | 2014 | |
Trade and other payables | | | (17 | ) | | | 1,088 | | | | 1,032 | |
Tax liabilities | | | | | | | 230 | | | | 339 | |
Financial liabilities | | | (17 | ) | | | 841 | | | | 2,561 | |
Other non-financial liabilities | | | (17 | ) | | | 3,407 | | | | 2,811 | |
Provisions | | | (18 | ) | | | 299 | | | | 150 | |
Deferred income | | | (19 | ) | | | 2,001 | | | | 1,680 | |
| | | | | | | | | | | | |
Total current liabilities | | | | | | | 7,867 | | | | 8,574 | |
Trade and other payables | | | (17 | ) | | | 81 | | | | 55 | |
Tax liabilities | | | | | | | 402 | | | | 371 | |
Financial liabilities | | | (17 | ) | | | 8,681 | | | | 8,980 | |
Other non-financial liabilities | | | (17 | ) | | | 331 | | | | 219 | |
Provisions | | | (18 | ) | | | 180 | | | | 151 | |
Deferred tax liabilities | | | (10 | ) | | | 448 | | | | 603 | |
Deferred income | | | (19 | ) | | | 106 | | | | 78 | |
Total non-current liabilities | | | | | | | 10,228 | | | | 10,457 | |
| | | | | | | | | | | | |
Total liabilities | | | | | | | 18,095 | | | | 19,031 | |
Issued capital | | | | | | | 1,229 | | | | 1,229 | |
Share premium | | | | | | | 558 | | | | 614 | |
Retained earnings | | | | | | | 20,044 | | | | 18,317 | |
Other components of equity | | | | | | | 2,561 | | | | 564 | |
Treasury shares | | | | | | | -1,124 | | | | -1,224 | |
Equity attributable to owners of parent | | | | | | | 23,267 | | | | 19,499 | |
| | | |
Non-controlling interests | | | | | | | 28 | | | | 34 | |
| | | | | | | | | | | | |
Total equity | | | (20 | ) | | | 23,295 | | | | 19,534 | |
| | | | | | | | | | | | |
| Total equity and liabilities | | | | | | | 41,390 | | | | 38,565 | |
The accompanying Notes are an integral part of these Consolidated Financial Statements.
| | |
| Consolidated Financial Statements IFRS | | 132 |
Consolidated Statements of Changes in Equity of SAP Group for the Years Ended December 31
| | | | | | | | | | | | | | | | | | | | | | | | | | | | | | | | | | | | | | | | |
€ millions | | Equity Attributable to Owners of Parent | | | Non-
Controlling
Interests | | | Total
Equity | |
| | | Issued
Capital | | | Share
Premium | | | Retained
Earnings | | | Other Components of Equity | | | Treasury
Shares | | | Total | | | | | | | |
| | | | | | | | | | | | Exchange
Differences | | | Available-
for-Sale
Financial
Assets | | | Cash
Flow
Hedges | | | | | | | | | | | | | |
Notes | | (20) | | | (20) | | | (20) | | | Statement of Comprehensive Income | | | (20) | | | | | | | | | | |
| January 1, 2013 | | | 1,229 | | | | 492 | | | | 13,934 | | | | -236 | | | | 22 | | | | 20 | | | | -1,337 | | | | 14,125 | | | | 8 | | | | 14,133 | |
Profit after tax | | | | | | | | | | | 3,326 | | | | | | | | | | | | | | | | | | | | 3,326 | | | | -1 | | | | 3,325 | |
Other comprehensive income | | | | | | | | | | | 13 | | | | -584 | | | | 60 | | | | | | | | | | | | -511 | | | | | | | | -511 | |
| Comprehensive income | | | | | | | | | | | 3,339 | | | | -584 | | | | 60 | | | | | | | | | | | | 2,815 | | | | -1 | | | | 2,814 | |
| Share-based payments | | | | | | | 30 | | | | | | | | | | | | | | | | | | | | | | | | 30 | | | | | | | | 30 | |
| Dividends | | | | | | | | | | | -1,013 | | | | | | | | | | | | | | | | | | | | -1,013 | | | | | | | | -1,013 | |
| Reissuance of treasury shares under share-based payments | | | | | | | 29 | | | | | | | | | | | | | | | | | | | | 57 | | | | 86 | | | | | | | | 86 | |
| Other changes | | | | | | | | | | | -2 | | | | | | | | | | | | | | | | | | | | -2 | | | | 1 | | | | -1 | |
| | | | | | | | | | | | | | | | | | | | | | | | | | | | | | | | | | | | | | | | |
| December 31, 2013 | | | 1,229 | | | | 551 | | | | 16,258 | | | | -820 | | | | 82 | | | | 20 | | | | -1,280 | | | | 16,040 | | | | 8 | | | | 16,048 | |
Profit after tax | | | | | | | | | | | 3,280 | | | | | | | | | | | | | | | | | | | | 3,280 | | | | | | | | 3,280 | |
Other comprehensive income | | | | | | | | | | | -23 | | | | 1,182 | | | | 128 | | | | -28 | | | | | | | | 1,259 | | | | | | | | 1,259 | |
| Comprehensive income | | | | | | | | | | | 3,257 | | | | 1,182 | | | | 128 | | | | -28 | | | | | | | | 4,539 | | | | | | | | 4,539 | |
| Share-based payments | | | | | | | 34 | | | | | | | | | | | | | | | | | | | | | | | | 34 | | | | | | | | 34 | |
| Dividends | | | | | | | | | | | -1,194 | | | | | | | | | | | | | | | | | | | | -1,194 | | | | | | | | -1,194 | |
| Reissuance of treasury shares under share-based payments | | | | | | | 29 | | | | | | | | | | | | | | | | | | | | 56 | | | | 85 | | | | | | | | 85 | |
| Additions from business combinations | | | | | | | | | | | | | | | | | | | | | | | | | | | | | | | | | | | 26 | | | | 26 | |
| Other changes | | | | | | | | | | | -4 | | | | | | | | | | | | | | | | | | | | -4 | | | | | | | | -4 | |
| | | | | | | | | | | | | | | | | | | | | | | | | | | | | | | | | | | | | | | | |
| December 31, 2014 | | | 1,229 | | | | 614 | | | | 18,317 | | | | 362 | | | | 211 | | | | -8 | | | | -1,224 | | | | 19,499 | | | | 34 | | | | 19,534 | |
Profit after tax | | | | | | | | | | | 3,064 | | | | | | | | | | | | | | | | | | | | 3,064 | | | | -8 | | | | 3,056 | |
Other comprehensive income | | | | | | | | | | | -17 | | | | 1,861 | | | | 125 | | | | 11 | | | | | | | | 1,980 | | | | | | | | 1,980 | |
| Comprehensive income | | | | | | | | | | | 3,047 | | | | 1,861 | | | | 125 | | | | 11 | | | | | | | | 5,044 | | | | -8 | | | | 5,036 | |
| Share-based payments | | | | | | | -136 | | | | | | | | | | | | | | | | | | | | | | | | -136 | | | | | | | | -136 | |
| Dividends | | | | | | | | | | | -1,316 | | | | | | | | | | | | | | | | | | | | -1,316 | | | | | | | | -1,316 | |
| Reissuance of treasury shares under share-based payments | | | | | | | 80 | | | | | | | | | | | | | | | | | | | | 100 | | | | 180 | | | | | | | | 180 | |
| Other changes | | | | | | | | | | | -4 | | | | | | | | | | | | | | | | | | | | -4 | | | | 2 | | | | -2 | |
| | | | | | | | | | | | | | | | | | | | | | | | | | | | | | | | | | | | | | | | |
| December 31, 2015 | | | 1,229 | | | | 558 | | | | 20,044 | | | | 2,223 | | | | 336 | | | | 3 | | | | -1,124 | | | | 23,267 | | | | 28 | | | | 23,295 | |
The accompanying Notes are an integral part of these Consolidated Financial Statements.
| | |
| Consolidated Financial Statements IFRS | | 133 |
Consolidated Statements of Cash Flows of SAP Group for the Years Ended December 31
| | | | | | | | | | | | | | | | |
€ millions | | Note | | | 2015 | | | 2014 | | | 2013 | |
| Profit after tax | | | | | | | 3,056 | | | | 3,280 | | | | 3,325 | |
| Adjustments to reconcile profit after taxes to net cash provided by operating activities: | | | | | | | | | | | | | | | | |
Depreciation and amortization | | | (15), (16 | ) | | | 1,289 | | | | 1,010 | | | | 951 | |
Income tax expense | | | (10 | ) | | | 935 | | | | 1,075 | | | | 1,071 | |
Financial income, net | | | (9 | ) | | | 5 | | | | 25 | | | | 66 | |
Decrease/increase in sales and bad debt allowances on trade receivables | | | | | | | 45 | | | | 47 | | | | 42 | |
Other adjustments for non-cash items | | | | | | | -2 | | | | 70 | | | | 62 | |
Decrease/increase in trade and other receivables | | | | | | | -844 | | | | -286 | | | | -110 | |
Decrease/increase in other assets | | | | | | | -313 | | | | -329 | | | | -136 | |
Decrease/increase in trade payables, provisions, and other liabilities | | | | | | | 757 | | | | 573 | | | | -176 | |
Decrease/increase in deferred income | | | | | | | 218 | | | | 16 | | | | 125 | |
| Cash outflows due to TomorrowNow and Versata litigation | | | (23 | ) | | | 0 | | | | -555 | | | | -1 | |
| Interest paid | | | | | | | -172 | | | | -130 | | | | -159 | |
| Interest received | | | | | | | 82 | | | | 59 | | | | 67 | |
| Income taxes paid, net of refunds | | | | | | | -1,420 | | | | -1,356 | | | | -1,295 | |
| | | | | | | | | | | | | | | | |
| Net cash flows from operating activities | | | | | | | 3,638 | | | | 3,499 | | | | 3,832 | |
Business combinations, net of cash and cash equivalents acquired | | | | | | | -39 | | | | -6,360 | | | | -1,160 | |
Cash receipts from derivative financial instruments related to business combinations | | | | | | | 266 | | | | -111 | | | | 0 | |
| Total cash flows for business combinations, net of cash and cash equivalents acquired | | | (4 | ) | | | 226 | | | | -6,472 | | | | -1,160 | |
| Purchase of intangible assets and property, plant, and equipment | | | | | | | -636 | | | | -737 | | | | -566 | |
| Proceeds from sales of intangible assets or property, plant, and equipment | | | | | | | 68 | | | | 46 | | | | 55 | |
| Purchase of equity or debt instruments of other entities | | | | | | | -1,871 | | | | -910 | | | | -1,531 | |
| Proceeds from sales of equity or debt instruments of other entities | | | | | | | 1,880 | | | | 833 | | | | 1,421 | |
| | | | | | | | | | | | | | | | |
| Net cash flows from investing activities | | | | | | | -334 | | | | -7,240 | | | | -1,781 | |
| Dividends paid | | | (20 | ) | | | -1,316 | | | | -1,194 | | | | -1,013 | |
| Proceeds from reissuance of treasury shares | | | | | | | 64 | | | | 51 | | | | 49 | |
| Proceeds from borrowings | | | | | | | 1,748 | | | | 7,503 | | | | 1,000 | |
| Repayments of borrowings | | | | | | | -3,852 | | | | -2,062 | | | | -1,625 | |
| | | | | | | | | | | | | | | | |
| Net cash flows from financing activities | | | | | | | -3,356 | | | | 4,298 | | | | -1,589 | |
| Effect of foreign currency rates on cash and cash equivalents | | | | | | | 135 | | | | 23 | | | | -191 | |
| Net decrease/increase in cash and cash equivalents | | | | | | | 83 | | | | 580 | | | | 271 | |
| | | | | | | | | | | | | | | | |
| Cash and cash equivalents at the beginning of the period | | | (20 | ) | | | 3,328 | | | | 2,748 | | | | 2,477 | |
| | | | | | | | | | | | | | | | |
| Cash and cash equivalents at the end of the period | | | (20 | ) | | | 3,411 | | | | 3,328 | | | | 2,748 | |
The accompanying Notes are an integral part of these Consolidated Financial Statements.
| | |
| Consolidated Financial Statements IFRS | | 134 |
Notes
(1) GENERAL INFORMATION ABOUT CONSOLIDATED FINANCIAL STATEMENTS
The accompanying Consolidated Financial Statements of SAP SE and its subsidiaries (collectively, “we,” “us,” “our,” “SAP,” “Group,” and “Company”) have been prepared in accordance with International Financial Reporting Standards (IFRS).
We have applied all standards and interpretations that were effective on and endorsed by the European Union (EU) as at December 31, 2015. There were no standards or interpretations impacting our Consolidated Financial Statements for the years ended December 31, 2015, 2014, and 2013, that were effective but not yet endorsed. Therefore, our Consolidated Financial Statements comply with both IFRS as issued by the International Accounting Standards Board (IASB) and with IFRS as endorsed by the EU.
Our Executive Board approved the Consolidated Financial Statements on February 25, 2016, for submission to our Supervisory Board.
All amounts included in the Consolidated Financial Statements are reported in millions of euros (€ millions) except where otherwise stated. Due to rounding, numbers presented throughout this document may not add up precisely to the totals we provide and percentages may not precisely reflect the absolute figures.
(2) SCOPE OF CONSOLIDATION
Entities Consolidated in the Financial Statements
| | | | |
| | | Total | |
| December 31, 2013 | | | 272 | |
| Additions | | | 58 | |
| Disposals | | | -43 | |
| | | | |
| December 31, 2014 | | | 287 | |
| Additions | | | 8 | |
| Disposals | | | -40 | |
| | | | |
| December 31, 2015 | | | 255 | |
The additions relate to legal entities added in connection with acquisitions and foundations. The disposals are mainly due to mergers and liquidations of legal entities.
(3) SUMMARY OF SIGNIFICANT ACCOUNTING POLICIES
(3a) Bases of Measurement
The Consolidated Financial Statements have been prepared on the historical cost basis except for the following:
| ¡ | | Derivative financial instruments, available-for-sale financial assets, and liabilities for cash-settled share-based payments are measured at fair value. |
| ¡ | | Monetary assets and liabilities denominated in foreign currencies are translated at period-end exchange rates. |
| ¡ | | Post-employment benefits are measured according to IAS 19 (Employee Benefits) as described inNote (18a). |
Where applicable, information about the methods and assumptions used in determining the respective measurement bases is disclosed in the Notes specific to that asset or liability.
(3b) Relevant Accounting Policies
Reclassifications
We modified and simplified the presentation of our services revenue in our income statement starting with the first quarter of 2015 to align our financial reporting with the change in our services business under the ONE Service approach. Under this approach, we combine premium support services and professional services in a way that no longer allows us to separate premium support revenues from professional services revenues or to separate their related cost of services.
Consequently, we have combined the revenue from premium support services with the revenue from professional services and other services in a new services revenue line item. Previously, revenues from premium support services were classified as support revenues (2014: €539 million, 2013: €445 million) and related costs were classified as cost of software and software-related services (2014: €337 million, 2013: €259 million). Simultaneously with this change, we simplified and clarified the labeling of several income statement line items. This includes renaming the previous revenue subtotal labeled software and support (which included premium support revenues) to software licenses and support (which no longer includes premium support revenues). The previous revenue subtotal labeled software and software-related service revenue is renamed cloud and software and accordingly no longer includes premium support revenue. All of these changes have been applied retrospectively.
| | |
| Consolidated Financial Statements IFRSNotes | | 135 |
The two other revenue line items cloud subscriptions and support and total revenue are not affected by any of these changes and remain unaltered.
Business Combinations and Goodwill
We decide on a transaction-by-transaction basis whether to measure the non-controlling interest in the acquiree at fair value or at the proportionate share of the acquiree’s identifiable net assets. Acquisition-related costs are accounted as expense in the periods in which the costs are incurred and the services are received, with the expense being classified as general and administration expense.
Foreign Currencies
Income and expenses and operating cash flows of our foreign subsidiaries that use a functional currency other than the euro are translated at average rates of foreign exchange (FX) computed on a monthly basis. Exchange differences resulting from foreign currency transactions are recognized in other non-operating income/expense, net.
The exchange rates of key currencies affecting the Company were as follows:
Exchange Rates
| | | | | | | | | | | | | | | | | | | | | | | | |
Equivalent to €1 | | | | | Middle Rate as at December 31 | | | Annual Average Exchange Rate | |
| | | | | | 2015 | | | 2014 | | | 2015 | | | 2014 | | | 2013 | |
| U.S. dollar | | | USD | | | | 1.0887 | | | | 1.2141 | | | | 1.1071 | | | | 1.3198 | | | | 1.3301 | |
| Pound sterling | | | GBP | | | | 0.7340 | | | | 0.7789 | | | | 0.7255 | | | | 0.8037 | | | | 0.8482 | |
| Japanese yen | | | JPY | | | | 131.07 | | | | 145.23 | | | | 134.12 | | | | 140.61 | | | | 130.21 | |
| Swiss franc | | | CHF | | | | 1.0835 | | | | 1.2024 | | | | 1.0688 | | | | 1.2132 | | | | 1.2302 | |
| Canadian dollar | | | CAD | | | | 1.5116 | | | | 1.4063 | | | | 1.4227 | | | | 1.4645 | | | | 1.3710 | |
| Australian dollar | | | AUD | | | | 1.4897 | | | | 1.4829 | | | | 1.4753 | | | | 1.4650 | | | | 1.3944 | |
Revenue Recognition
Classes of Revenue
We derive our revenue from fees charged to our customers for (a) the use of our hosted cloud offerings, (b) licenses to our on-premise software products, and (c) standardized and premium support services, consulting, customer-specific on-premise software development agreements, training, and other services.
Cloud and software revenue, as presented in our Consolidated Income Statements, is the sum of our cloud subscriptions and support revenue, our software licenses revenue, and our software support revenue.
| ¡ | | Revenue from cloud subscriptions and support represents fees earned from providing customers with: |
| | – | Software-as-a-Service (SaaS), that is, a right to use software functionality in a cloud-based-infrastructure (hosting) provided by SAP, where the customer does not have the right to terminate the hosting contract and take possession of the software to run it on the customer’s own IT infrastructure or by a third-party hosting provider without significant penalty, or |
| | – | Platform-as-a-Service (PaaS), that is, access to a cloud-based infrastructure to develop, run, and manage applications, or |
| | – | Infrastructure-as-a-Service (IaaS), that is, hosting services for software hosted by SAP, where the customer has the right to terminate the hosting contract and take possession of the software at any time without significant penalty and related application management services, or |
| | – | Additional premium cloud subscription support beyond the regular support that is embedded in the basic cloud subscription fees, or |
| | – | Business Network Services, that is, connecting companies in a cloud-based-environment to perform business processes between the connected companies. |
| ¡ | | Software licenses revenue represents fees earned from the sale or license of software to customers for use on the customer’s premises, in other words, where the customer has the right to take possession of the software for installation on the customer’s premises (on-premise software). Software licenses revenue includes revenue from both the sale of our standard software products and customer-specific on-premise software development agreements. |
| ¡ | | Software support revenue represents fees earned from providing customers with standardized support services which comprise unspecified future software updates, upgrades, enhancements, and technical product support services for on-premise software products. We do not sell separately technical product support or unspecified software upgrades, updates, and enhancements. Accordingly, we do not distinguish within software support revenue or within cost of software support the amounts attributable to technical support services and unspecified software upgrades, updates, and enhancements. |
| | |
| Consolidated Financial Statements IFRSNotes | | 136 |
Services revenue as presented in our Consolidated Income Statements represents fees earned from providing customers with:
| ¡ | | Professional services, that is, consulting services that primarily relate to the installation and configuration of our cloud subscriptions and on-premise software products, |
| ¡ | | Premium support services, that is, high-end support services tailored to customer requirements, |
| ¡ | | Messaging services (primarly transmission of electronic text messages from one mobile phone provider to another), and |
| ¡ | | Payment services in connection with our travel and expense management offerings. |
We account for out-of-pocket expenses invoiced by SAP and reimbursed by customers as cloud subscriptions and support, software support, or services revenue, depending on the nature of the service for which the out-of-pocket expenses were incurred.
Timing of Revenue Recognition
We do not start recognizing revenue from customer arrangements before evidence of an arrangement exists and the amount of revenue and associated costs can be measured reliably and collection of the related receivable is probable. If, for any of our product or service offerings, we determine at the outset of an arrangement that the amount of revenue cannot be measured reliably, we conclude that the inflow of economic benefits associated with the transaction is not probable, and we defer revenue recognition until the arrangement fee becomes due and payable by the customer. If, at the outset of an arrangement, we determine that collectability is not probable, we conclude that the inflow of economic benefits associated with the transaction is not probable, and we defer revenue recognition until the earlier of when collectability becomes probable or payment is received. If a customer is specifically identified as a bad debtor, we stop recognizing revenue from the customer except to the extent of the fees that have already been collected.
In general, we invoice fees for standard software upon contract closure and delivery. Periodical fixed fees for cloud subscription services and software support services are mostly invoiced yearly or quarterly in advance. Fees based on actual transaction volumes for cloud subscriptions and fees charged for non-periodical services are invoiced as the services are delivered.
Cloud subscriptions and support revenue is recognized as the services are performed. Where a periodical fixed fee is agreed for the right to continuously access and use a cloud offering for a certain term, the fee is recognized ratably over the term covered by the fixed fee. Fees that are based on actual transaction volumes are recognized as the transactions occur.
In general, our cloud subscriptions and support contracts include certain set-up activities. If these set-up activities have stand-alone value, they are accounted for as distinct deliverables with the respective revenue being classified as service revenue and recognized as the set-up activity is performed. If we conclude that such set-up activities are not distinct deliverables, we do not account for them separately.
Revenue from the sale of perpetual licenses of our standard on-premise software products is recognized upon delivery of the software, that is, when the customer has access to the software. Occasionally, we license on-premise software for a specified period of time. Revenue from short-term time-based licenses, which usually include support services during the license period, is recognized ratably over the license term. Revenue from multi-year time-based licenses that include support services, whether separately priced or not, is recognized ratably over the license term unless a substantive support service renewal rate exists; if this is the case, the amount allocated to the delivered software is recognized as software licenses revenue based on the residual method once the basic criteria described above have been met.
In general, our on-premise software license agreements include neither acceptance-testing provisions nor rights to return the software. If an arrangement allows for customer acceptance-testing of the software, we defer revenue until the earlier of customer acceptance or when the acceptance right lapses. If an arrangement allows for returning the software, we defer recognition of software revenue until the right to return expires.
We usually recognize revenue from on-premise software arrangements involving resellers on evidence of sell-through by the reseller to the end-customer, because the inflow of the economic benefits associated with the arrangements to us is not probable before sell-through has occurred.
Software licenses revenue from customer-specific on-premise software development agreements that qualify for revenue recognition by reference to the stage of completion of the contract activity is recognized using the percentage-of-completion method based on contract costs incurred to date as a percentage of total estimated contract costs required to complete the development work.
On-premise software subscription contracts combine software and support service elements, as under these contracts the customer is provided with current software products, rights to receive unspecified future software products, and rights to product support during the on-premise software subscription term. Typically, customers pay a periodic fee for a defined subscription term, and we recognize such fees ratably over the term of the arrangement beginning with the delivery of the first product. Revenue from on-premise software subscription contracts is allocated to the software licenses revenue and software support revenue line items in our Consolidated Income Statements.
| | |
| Consolidated Financial Statements IFRSNotes | | 137 |
Under our standardized support services, our performance obligation is to stand ready to provide technical product support and unspecified updates, upgrades, and enhancements on a when-and-if-available basis. Consequently, we recognize support revenue ratably over the term of the support arrangement.
We recognize services revenue as the services are rendered. Usually, our professional services contracts and premium support services contracts do not involve significant production, modification, or customization of software and the related revenue is recognized as the services are provided using the percentage-of-completion method of accounting. For messaging services, we measure the progress of service rendering based on the number of messages successfully processed and delivered except for fixed-price messaging arrangements, for which revenue is recognized ratably over the contractual term of the arrangement. Revenue from our training services is recognized when the customer consumes the respective classroom training. For on-demand training services, whereby our performance obligation is to stand ready and provide the customer with access to the training courses and learning content services, revenue is recognized ratably over the contractual term of the arrangement.
Measurement of Revenue
Revenue is recognized net of returns and allowances, trade discounts, and volume rebates.
Our contributions to resellers that allow our resellers to execute qualified and approved marketing activities are recognized as an offset to revenue, unless we obtain a separate identifiable benefit for the contribution and the fair value of that benefit is reasonably estimable.
Multiple-Element Arrangements
We combine two or more customer contracts with the same customer and account for the contracts as a single contract if the contracts are negotiated as a package or otherwise linked. Thus, the majority of our contracts that contain cloud offerings or on-premise software also include other goods or services (multiple-element arrangements).
We account for the different goods and services promised under our customer contracts as separate units of account (distinct deliverables) unless:
| ¡ | | The contract involves significant production, modification, or customization of the cloud subscription or on-premise software; and |
| ¡ | | The services are not available from third-party vendors and are therefore deemed essential to the cloud subscription or on-premise software. |
Goods and services that do not qualify as distinct deliverables are combined into one unit of account (combined deliverables).
The portion of the transaction fee allocated to one distinct deliverable is recognized in revenue separately under the policies applicable to the respective deliverable. For combined deliverables consisting of cloud offerings or on-premise software and other services, the allocated portion of the transaction fee is recognized using the percentage-of-completion method, as outlined above, or over the cloud subscription term, if applicable, depending on which service term is longer.
We allocate the total transaction fee of a customer contract to the distinct deliverables under the contract based on their fair values. The allocation is done relative to the distinct deliverables’ individual fair values unless the residual method is applied as outlined below. Fair value is determined by company-specific objective evidence of fair value which is the price charged consistently when that element is sold separately or, for elements not yet sold separately, the price established by our management if it is probable that the price will not change before the element is sold separately. Where company-specific objective evidence of fair value and third-party evidence of selling price cannot be established due to lacking stand-alone sales or lacking pricing consistency, we determine the fair value of a distinct deliverable by estimating its stand-alone selling price. Company-specific objective evidence of fair value and estimated stand-alone selling prices (ESP) for our major products and services are determined as follows:
| ¡ | | We derive the company-specific objective evidence of fair value for our renewable support services from the rates charged to renew the support services annually after an initial period. Such renewal rates generally represent a fixed percentage of the discounted software license fee charged to the customer. The majority of our customers renew their annual support service contracts at these rates. |
| ¡ | | Company-specific objective evidence of fair value for our professional services is derived from our consistently priced historic sales. |
| ¡ | | Company-specific objective evidence of fair value can generally not be established for our cloud subscriptions. ESP for these offerings is determined based on the rates agreed with the individual customers to apply if and when the subscription arrangement renews. We determine ESP by considering multiple factors which include, but are not limited to, the following: |
| | – | Substantive renewal rates stipulated in the cloud arrangement; and |
| | – | Gross margin expectations and expected internal costs of the respective cloud business model. |
| ¡ | | For our on-premise software offerings, company-specific objective evidence of fair value can generally not be established and representative stand-alone selling prices are not discernible from past transactions. We therefore apply the residual method to multiple-element arrangements that include on-premise software. Under this method, the transaction fee is allocated to all undelivered elements in the amount of their respective fair values and the remaining |
| | |
| Consolidated Financial Statements IFRSNotes | | 138 |
| | amount of the arrangement fee is allocated to the delivered element. With this policy, we have considered the guidance provided by FASB ASC Subtopic 985-605 (Software Revenue Recognition), where applicable, as authorized by IAS 8 (Accounting Policies, Changes in Accounting Estimates and Errors). |
We also consider FASB ASC 985-605 in our accounting for options that entitle the customer to purchase, in the future, additional on-premise software or services. We allocate revenue to future incremental discounts whenever customers are granted a material right, that is, the right to license additional on-premise software at a higher discount than the one given within the initial software license arrangement, or to purchase or renew services at rates below the fair values established for these services. We also consider whether future purchase options included in arrangements for cloud subscription deliverables constitute a material right.
Cost of Cloud and Software
Cost of cloud and software includes the costs incurred in producing the goods and providing the services that generate cloud and software revenue. Consequently, this line item primarily includes employee expenses relating to these services, amortization of acquired intangibles, fees for third-party licenses, shipping, ramp-up cost, and depreciation of our property, plant, and equipment.
Cost of Services
Cost of services includes the costs incurred in providing the services that generate service revenue including messaging revenues. The item also includes sales and marketing expenses related to our services that result from sales and marketing efforts that cannot be clearly separated from providing the services.
Research and Development
Research and development includes the costs incurred by activities related to the development of software solutions (new products, updates, and enhancements) including resource and hardware costs for the development systems.
We have determined that the conditions for recognizing internally generated intangible assets from our software development activities are not met until shortly before the products are available for sale. Development costs incurred after the recognition criteria are met have not been material. Consequently, research and development costs are expensed as incurred.
Sales and Marketing
Sales and marketing includes costs incurred for the selling and marketing activities related to our software and cloud solutions.
General and Administration
General and administration includes costs related to finance and administrative functions, human resources, and general management as long as they are not directly attributable to one of the other operating expense line items.
Accounting for Uncertainties in Income Taxes
We measure current and deferred tax liabilities and assets for uncertainties in income taxes based on our best estimate of the most likely amount payable to or recoverable from the tax authorities, assuming that the tax authorities will examine the amounts reported to them and have full knowledge of all relevant information.
Share-Based Payments
Share-based payments cover cash-settled and equity-settled awards issued to our employees. The respective expenses are recognized as employee benefits expenses and classified in our Consolidated Income Statements according to the activities that the employees owning the awards perform.
We grant our employees discounts on certain share-based payment awards. Since those discounts are not dependent on future services to be provided by our employees, the discount is recognized as an expense when the rights are granted.
Where we hedge our exposure to cash-settled awards, changes in the fair value of the respective hedging instruments are also recognized as employee benefits expenses in profit or loss. The fair values of hedging instruments are based on market data reflecting current market expectations.
For more information about our share-based payments, seeNote (27).
Financial Assets
Our financial assets comprise cash and cash equivalents (highly liquid investments with original maturities of three months or less), loans and receivables, acquired equity and debt investments, and derivative financial instruments (derivatives) with positive fair values. Financial assets are only classified as financial assets at fair value through profit or loss if they are held for trading, as we do not designate financial assets at fair value through profit or loss. All other financial assets are classified as loans and receivables if we do not designate them as available-for-sale financial assets.
Regular way purchases and sales of financial assets are recorded as at the trade date.
Among the other impairment indicators in IAS 39 (Financial Instruments: Recognition and Measurement), for an investment in an equity security, objective evidence of impairment includes a significant (more than 20%) or prolonged (a period of more than nine months) decline in its fair value. Impairment losses on financial assets are recognized in financial income, net. For
| | |
| Consolidated Financial Statements IFRSNotes | | 139 |
available-for-sale financial assets, which are non-derivative financial assets that are not assigned to loans and receivables or financial assets at fair value through profit or loss, impairment losses directly reduce an asset’s carrying amount, while impairments on loans and receivables are recorded using allowance accounts. Such allowance accounts are always presented together with the accounts containing the asset’s cost in other financial assets. Account balances are charged off against the respective allowance after all collection efforts have been exhausted and the likelihood of recovery is considered remote.
Derivatives
Derivatives Not Designated as Hedging Instruments
Many transactions constitute economic hedges, and therefore contribute effectively to the securing of financial risks but do not qualify for hedge accounting under IAS 39. To hedge currency risks inherent in foreign-currency denominated and recognized monetary assets and liabilities, we do not designate our held-for-trading derivative financial instruments as accounting hedges, because the profits and losses from the underlying transactions are recognized in profit or loss in the same periods as the profits or losses from the derivatives.
In addition, we occasionally have contracts that contain foreign currency embedded derivatives to be accounted for separately.
Derivatives Designated as Hedging Instruments
We use derivatives to hedge foreign currency risk or interest-rate risk and designate them as cash flow or fair value hedges if they qualify for hedge accounting under IAS 39. For more information about our hedges, seeNote (24).
a) Cash Flow Hedge
In general, we apply cash flow hedge accounting to the foreign currency risk of highly probable forecasted transactions and interest-rate risk on variable rate financial liabilities.
With regard to foreign currency risk, hedge accounting relates to the spot price and the intrinsic values of the derivatives designated and qualifying as cash flow hedges, while gains and losses on the interest element and on those time values excluded from the hedging relationship as well as the ineffective portion of gains or losses are recognized in profit or loss as they occur.
b) Fair Value Hedge
We apply fair value hedge accounting for certain of our fixed rate financial liabilities.
Valuation and Testing of Effectiveness
The effectiveness of the hedging relationship is tested prospectively and retrospectively. Prospectively, we apply the critical terms match for our foreign currency hedges as currencies, maturities, and the amounts are identical for the forecasted transactions and the spot element of the forward exchange rate contract or intrinsic value of the currency options, respectively. For interest-rate swaps, we also apply the critical terms match as the notional amounts, currencies, maturities, basis of the variable legs or fixed legs, respectively, reset dates, and the dates of the interest and principal payments are identical for the debt instrument and the corresponding interest-rate swaps. Therefore, over the life of the hedging instrument, the changes in the designated components of the hedging instrument will offset the impact of fluctuations of the underlying hedged items.
The method of retrospectively testing effectiveness depends on the type of the hedge as described further below:
a) Cash Flow Hedge
Retrospectively, effectiveness is tested on a cumulative basis applying the dollar offset method by using the hypothetical derivative method. Under this approach, the change in fair value of a constructed hypothetical derivative with terms reflecting the relevant terms of the hedged item is compared to the change in the fair value of the hedging instrument employing its relevant terms. The hedge is deemed highly effective if the results are within the range 80% to 125%.
b) Fair Value Hedge
Retrospectively, effectiveness is tested using statistical methods in the form of a regression analysis by which the validity and extent of the relationship between the change in value of the hedged items as the independent variable and the fair value change of the derivatives as the dependent variable is determined. The hedge is deemed highly effective if the determination coefficient between the hedged items and the hedging instruments exceeds 0.8 and the slope coefficient lies within a range of –0.8 to –1.25.
Trade and Other Receivables
Trade receivables are recorded at invoiced amounts less sales allowances and allowances for doubtful accounts. We record these allowances based on a specific review of all significant outstanding invoices. When analyzing the recoverability of our trade receivables, we consider the following factors:
| ¡ | | First, we consider the financial solvency of specific customers and record an allowance for specific customer balances when we believe it is probable that we will not collect the amount due according to the contractual terms of the arrangement. |
| ¡ | | Second, we evaluate homogenous portfolios of trade receivables according to their default risk primarily based on the age of the receivable and historical loss experience, but also taking into consideration general market factors that might impact our trade receivable portfolio. We record a general bad debt allowance to record impairment losses for a portfolio of trade receivables when we believe that the age of the receivables indicates that it is probable that a loss has occurred and we will not collect some or all of the amounts due. |
| | |
| Consolidated Financial Statements IFRSNotes | | 140 |
Account balances are written off, that is, charged off against the allowance after all collection efforts have been exhausted and the likelihood of recovery is considered remote.
In our Consolidated Income Statements, expenses from recording bad debt allowances for a portfolio of trade receivables are classified as other operating income, net, whereas expenses from recording bad debt allowances for specific customer balances are classified as cost of cloud and software or cost of services, depending on the transaction from which the respective trade receivable results. Sales allowances are recorded as an offset to the respective revenue item.
Included in trade receivables are unbilled receivables related to fixed-fee and time-and-material consulting arrangements for contract work performed to date.
Other Non-Financial Assets
Other non-financial assets are recorded at amortized cost. We recognize as an asset the direct and incremental cost incurred when obtaining a customer cloud subscription contract. We amortize these assets on a straight line basis over the period of providing the cloud subscriptions to which the assets relate.
Intangible Assets
We classify intangible assets according to their nature and use in our operation. Software and database licenses consist primarily of technology for internal use, whereas acquired technology consists primarily of purchased software to be incorporated into our product offerings and in-process research and development. Customer relationship and other intangibles consist primarily of customer contracts and acquired trademark licenses.
All our purchased intangible assets other than goodwill have finite useful lives. They are initially measured at acquisition cost and subsequently amortized either based on expected consumption of economic benefits or on a straight-line basis over their estimated useful lives ranging from two to 20 years.
Amortization for acquired in-process research and development project assets starts when the projects are complete and the developed software is taken to the market. We typically amortize these intangibles over five to seven years.
Amortization expenses of intangible assets are classified as cost of cloud and software, cost of services, research and development, sales and marketing, and general and administration, depending on the use of the respective intangible assets.
Property, Plant, and Equipment
Property, plant, and equipment are carried at acquisition cost plus the fair value of related asset retirement costs if any and if reasonably estimable, less accumulated depreciation.
Property, plant, and equipment are depreciated over their expected useful lives, generally using the straight-line method.
Useful Lives of Property, Plant, and Equipment
| | |
| Buildings | | 25 to 50 years |
| Leasehold improvements | | Based on the term of the lease contract |
| Information technology equipment | | 3 to 5 years |
| Office furniture | | 4 to 20 years |
| Automobiles | | 4 to 5 years |
Impairment of Goodwill and Non-Current Assets
The annual goodwill impairment test is performed at the level of our operating segments since there are no lower levels in SAP at which goodwill is monitored for internal management purposes. The test is performed at the same time for all operating segments.
Impairment losses are presented in other operating income/expense, net in profit or loss.
Liabilities
Financial Liabilities
Financial liabilities include trade and other payables, bank loans, issued bonds, private placements, and other financial liabilities that comprise derivative and non-derivative financial liabilities. They are classified as financial liabilities at amortized cost and at fair value through profit or loss. The latter include only those financial liabilities that are held for trading, as we do not designate financial liabilities at fair value through profit or loss.
Customer funding liabilities are funds we draw from and make payments on on behalf of our customers for customers’ employee expense reimbursements, related credit card payments, and vendor payments. We present these funds in cash and cash equivalents and record our obligation to make these expense reimbursements and payments on behalf of our customers as customer funding liabilities.
Expenses and gains/losses on financial liabilities mainly consist of interest expense, which is recognized based on the effective interest method.
Provisions
The employee-related provisions include, amongst others, long-term employee benefits. They are secured by pledged reinsurance coverage and are offset against the settlement amount of the secured commitment.
| | |
| Consolidated Financial Statements IFRSNotes | | 141 |
Post-Employment Benefits
The discount rates used in measuring our post-employment benefit assets and liabilities are derived from rates available on high-quality corporate bonds and government bonds for which the timing and amounts of payments match the timing and the amounts of our projected pension payments. The assumptions used to calculate pension liabilities and costs are disclosed inNote (18a). Net interest expense and other expenses related to defined benefit plans are recognized in employee expenses.
Since our domestic defined benefit pension plans primarily consist of an employee-financed post-retirement plan that is fully financed with qualifying insurance policies, current service cost may become a credit as a result of adjusting the defined benefit liability’s carrying amount to the fair value of the qualifying plan assets. Such adjustments are recorded in service cost.
Deferred Income
Deferred income is recognized as cloud subscriptions and support revenue, software licenses revenue, software support revenue, or services revenue, depending on the reason for the deferral, once the basic applicable revenue recognition criteria have been met. These criteria are met, for example, when the services are performed or when the discounts that relate to a material right granted in a purchase option are applied.
(3c) Management Judgments and Sources of Estimation Uncertainty
The preparation of the Consolidated Financial Statements in conformity with IFRS requires management to make judgments, estimates, and assumptions that affect the application of accounting policies and the reported amounts of assets, liabilities, revenues, and expenses, as well as disclosure of contingent assets and liabilities.
We base our judgments, estimates, and assumptions on historical and forecast information, as well as on regional and industry economic conditions in which we or our customers operate, changes to which could adversely affect our estimates. Although we believe we have made reasonable estimates about the ultimate resolution of the underlying uncertainties, no assurance can be given that the final outcome of these matters will be consistent with what is reflected in our assets, liabilities, revenues, and expenses. Actual results could differ from original estimates.
The accounting policies that most frequently require us to make judgments, estimates, and assumptions, and therefore are critical to understanding our results of operations, include the following:
| ¡ | | Valuation of trade receivables |
| ¡ | | Accounting for share-based payments |
| ¡ | | Accounting for income tax |
| ¡ | | Accounting for business combinations |
| ¡ | | Subsequent accounting for goodwill and other intangible assets |
| ¡ | | Accounting for legal contingencies |
| ¡ | | Recognition of internally generated intangible assets from development |
Our management periodically discusses these critical accounting policies with the Audit Committee of the Supervisory Board.
Revenue Recognition
As described in the Revenue Recognition section ofNote (3b), we do not recognize revenue before the amount of revenue can be measured reliably and collection of the related receivable is probable. The determination of whether the amount of revenue can be measured reliably or whether the fees are collectible is inherently judgmental, as it requires estimates as to whether and to what extent subsequent concessions may be granted to customers and whether the customer is expected to pay the contractual fees. The timing and amount of revenue recognition can vary depending on what assessments have been made.
The application of the percentage-of-completion method requires us to make estimates about total revenue, total cost to complete the project, and the stage of completion. The assumptions, estimates, and uncertainties inherent in determining the stage of completion affect the timing and amounts of revenue recognized.
In the accounting for our multiple-element arrangements, we have to determine the following:
| ¡ | | Which contracts with the same customer are to be accounted for as one single contract |
| ¡ | | Which deliverables under one contract are distinct and thus to be accounted for separately |
| ¡ | | How to allocate the total arrangement fee to the deliverables of one contract |
The determination of whether different contracts with the same customer are to be accounted for as one contract is highly judgmental, as it requires us to evaluate whether the contracts are negotiated together or linked in any other way. The timing and amount of revenue recognition can vary depending on whether two contracts are accounted for separately or as one single contract.
Under a multiple-element arrangement including a cloud subscription, or on-premise software, and other deliverables, we do not account for the cloud subscription, or on-premise software, and the other deliverables separately if one of the other deliverables (such as consulting services) is deemed to be essential to the functionality of the cloud subscription or on-premise software. The determination whether an undelivered element is essential to the functionality of the delivered element requires the use of judgment. The timing and amount of revenue recognition can vary depending on how that judgment is exercised, because revenue may be recognized over a longer service term.
| | |
| Consolidated Financial Statements IFRSNotes | | 142 |
In the area of allocating the transaction fee to the different deliverables under the respective customer contract, judgment is required in the determination of an appropriate fair value measurement which may impact the timing and amount of revenue recognized depending on the following:
| ¡ | | Whether an appropriate measurement of fair value can be demonstrated for undelivered elements |
| ¡ | | The approaches used to establish fair value |
Additionally, our revenue for on-premise software contracts would be significantly different if we applied a revenue allocation policy other than the residual method.
Valuation of Trade Receivables
As described in the Trade and Other Receivables section inNote (3b), we account for impairments of trade receivables by recording sales allowances and allowances for doubtful accounts on an individual receivable basis and on a portfolio basis. The assessment of whether a receivable is collectible is inherently judgmental and requires the use of assumptions about customer defaults that could change significantly. Judgment is required when we evaluate available information about a particular customer’s financial situation to determine whether it is probable that a credit loss will occur and the amount of such loss is reasonably estimable and thus an allowance for that specific account is necessary. Basing the general allowance for the remaining receivables on our historical loss experience, too, is highly judgmental, as history may not be indicative of future development. Changes in our estimates about the allowance for doubtful accounts could materially impact reported assets and expenses, and our profit could be adversely affected if actual credit losses exceed our estimates.
Accounting for Share-Based Payments
We use certain assumptions in estimating the fair values for our share-based payments, including expected future share price volatility and expected option life (which represents our estimate of the average amount of time remaining until the options are exercised or expire unexercised). In addition, the final payout for these plans also depends on our share price at the respective exercise dates. Changes to these assumptions and outcomes that differ from these assumptions could require material adjustments to the carrying amount of the liabilities we have recognized for these share-based payments.
For the purpose of determining the estimated fair value of our stock options, we believe expected volatility is the most sensitive assumption. Regarding future payout under our cash-settled plans, the price of SAP stock will be the most relevant factor. Changes in these factors could significantly affect the estimated fair values as calculated by the option-pricing model, and the future payout. For more information about these plans, seeNote (27).
Accounting for Income Tax
We are subject to changing tax laws in multiple jurisdictions within the countries in which we operate. Our ordinary business activities also include transactions where the ultimate tax outcome is uncertain, such as those involving revenue sharing and cost reimbursement arrangements between SAP Group entities. In addition, the amount of income tax we pay is generally subject to ongoing audits by domestic and foreign tax authorities. As a result, judgment is necessary in determining our worldwide income tax provisions. We make our estimates about the ultimate resolution of our tax uncertainties based on current tax laws and our interpretation thereof. Changes to the assumptions underlying these estimates and outcomes that differ from these assumptions could require material adjustments to the carrying amount of our income tax provisions.
The assessment whether a deferred tax asset is impaired requires management judgment, as we need to estimate future taxable profits to determine whether the utilization of the deferred tax asset is probable. In evaluating our ability to utilize our deferred tax assets, we consider all available positive and negative evidence, including the level of historical taxable income and projections for future taxable income over the periods in which the deferred tax assets are recoverable. Our judgment regarding future taxable income is based on assumptions about future market conditions and future profits of SAP. Changes to these assumptions and outcomes that differ from these assumptions could require material adjustments to the carrying amount of our deferred tax assets.
For more information about our income tax, seeNote (10).
Accounting for Business Combinations
In our accounting for business combinations, judgment is required in determining whether an intangible asset is identifiable, and should be recorded separately from goodwill. Additionally, estimating the acquisition date fair values of the identifiable assets acquired and liabilities assumed involves considerable management judgment. The necessary measurements are based on information available on the acquisition date and are based on expectations and assumptions that have been deemed reasonable by management. These judgments, estimates, and assumptions can materially affect our financial position and profit for several reasons, including the following:
| ¡ | | Fair values assigned to assets subject to depreciation and amortization affect the amounts of depreciation and amortization to be recorded in operating profit in the periods following the acquisition. |
| ¡ | | Subsequent negative changes in the estimated fair values of assets may result in additional expense from impairment charges. |
| ¡ | | Subsequent changes in the estimated fair values of liabilities and provisions may result in additional expense (if increasing the estimated fair value) or additional income (if decreasing the estimated fair value). |
| | |
| Consolidated Financial Statements IFRSNotes | | 143 |
Subsequent Accounting for Goodwill and Other Intangible Assets
As described in the Intangible Assets section inNote (3b), all of our intangible assets other than goodwill have finite useful lives. Consequently, the depreciable amount of the intangible assets is amortized on a systematic basis over their useful lives. Judgment is required in determining the following:
| ¡ | | The useful life of an intangible asset, as this determination is based on our estimates regarding the period over which the intangible asset is expected to produce economic benefits to us |
| ¡ | | The amortization method, as IFRS requires the straight-line method to be used unless we can reliably determine the pattern in which the asset’s future economic benefits are expected to be consumed by us |
Both the amortization period and the amortization method have an impact on the amortization expense that is recorded in each period.
In making impairment assessments for our intangible assets and goodwill, the outcome of these tests is highly dependent on management’s latest estimates and assumptions regarding future cash flow projections and economic risks, which are complex and require significant judgment and assumptions about future developments. They can be affected by a variety of factors, including changes in our business strategy, our internal forecasts, and an estimate of our weighted-average cost of capital. These judgments impact the carrying amounts of our intangible assets and goodwill as well as the amounts of impairment charges recognized in profit or loss.
The outcome of goodwill impairment tests and thus the carrying amounts of our recognized goodwill may depend on the allocation of goodwill to our operating segments. This allocation involves judgment as it is based on our estimates regarding which operating segments are expected to benefit from the synergies of the business combination. Additionally, judgment is required in the determination of our operating segments. Changes to the assumptions underlying our goodwill impairment tests could require material adjustments to the carrying amount of our recognized goodwill. For more information about the goodwill allocation and impairment testing, seeNote (15).
Accounting for Legal Contingencies
As described inNote (23), we are currently involved in various claims and legal proceedings. We review the status of each significant matter not less frequently than each quarter and assess our potential financial and business exposures related to such matters. Significant judgment is required in the determination of whether a provision is to be recorded and what the appropriate amount for such provision should be. Notably, judgment is required in the following:
| ¡ | | Determining whether an obligation exists |
| ¡ | | Determining the probability of outflow of economic benefits |
| ¡ | | Determining whether the amount of an obligation is reliably estimable |
| ¡ | | Estimating the amount of the expenditure required to settle the present obligation |
Due to uncertainties relating to these matters, provisions are based on the best information available at the time.
At the end of each reporting period, we reassess the potential obligations related to our pending claims and litigation and adjust our respective provisions to reflect the current best estimate. In addition, we monitor and evaluate new information that we receive after the end of the respective reporting period but before the Consolidated Financial Statements are authorized for issue to determine whether this provides additional information regarding conditions that existed at the end of the reporting period. Changes to the estimates and assumptions underlying our accounting for legal contingencies and outcomes that differ from these estimates and assumptions could require material adjustments to the carrying amounts of the respective provisions recorded as well as additional provisions. For more information about legal contingencies, seeNotes (18b) and(23).
Recognition of Internally Generated Intangible Assets from Development
We believe that determining whether internally generated intangible assets from development are to be recognized as intangible assets requires significant judgment, particularly in the following areas:
| ¡ | | Determining whether activities should be considered research activities or development activities. |
| ¡ | | Determining whether the conditions for recognizing an intangible asset are met requires assumptions about future market conditions, customer demand, and other developments. |
| ¡ | | The term “technical feasibility” is not defined in IFRS, and therefore determining whether the completion of an asset is technically feasible requires judgment and a company-specific approach. |
| ¡ | | Determining the future ability to use or sell the intangible asset arising from the development and the determination of the probability of future benefits from sale or use. |
| ¡ | | Determining whether a cost is directly or indirectly attributable to an intangible asset and whether a cost is necessary for completing a development. |
These judgments impact the total amount of intangible assets that we present in our balance sheet as well as the timing of recognizing development expenses in profit or loss.
| | |
| Consolidated Financial Statements IFRSNotes | | 144 |
(3d) New Accounting Standards Adopted in the Current Period
No new accounting standards adopted in 2015 had a material impact on our Consolidated Financial Statements.
(3e) New Accounting Standards Not Yet Adopted
The standards and interpretations (relevant to the Group) that are issued, but not yet effective, up to the date of issuance of the Group’s financial statements are disclosed below. The Group intends to adopt these standards, if applicable, when they become effective:
| ¡ | | On May 28, 2014, the IASB issued IFRS 15 (Revenue from Contracts with Customers). The standard becomes effective in fiscal year 2018 with earlier application permitted. We have not yet completed the determination of the impact on our Consolidated Financial Statements, and whether the overall impact will be material, but we expect the standard - for some of our contracts and business models - to impact the timing of recognizing revenue and the revenue classification. IFRS 15 includes a cohesive set of disclosure requirements which we expect to lead to additional and amended disclosures. The standard foresees two possible transition methods for the adoption of the new guidance. We have not finally decided yet which of these two methods we intend to apply. |
| ¡ | | On July 24, 2014, the IASB issued the fourth and final version of IFRS 9 (Financial Instruments), which will be applicable in fiscal year 2018 with earlier application permitted. The new guidance is expected to mainly impact the classification and measurement of financial assets and will result in additional disclosures. We have not yet completed the determination of the impact on our Consolidated Financial Statements. |
| ¡ | | On January 13, 2016, the IASB issued IFRS 16 (Leases). The standard becomes effective in fiscal year 2019 with earlier application permitted for those companies that also apply IFRS 15. The new standard is a major revision of lease accounting; whereas the accounting by lessors remains substantially unchanged, the lease accounting by lessees will change significantly as all leases (the majority of which were “off balance” in the past as they were operating leases) need to be recognized on a company’s balance sheet as assets and liabilities. We have not yet completed the determination of the impact on our Consolidated Financial Statements. |
| ¡ | | On January 29, 2016, the IASB published amendments to IAS 7 (Statement of Cash Flows). The standard becomes effective in fiscal year 2017 with earlier application permitted. The aim of the amendments is to improve the information provided to users of financial statements about an entity’s financing activities and will most likely result in additional disclosures. We have not yet completed the determination of the impact on our Consolidated Financial Statements. |
| | |
| Consolidated Financial Statements IFRSNotes | | 145 |
(4) BUSINESS COMBINATIONS
In 2015, we did not conclude any significant business combinations.
Prior-year acquisitions are described in our 2014 Consolidated Financial Statements.
We have retrospectively adjusted the provisional amounts recognized as at the dates of these acquisitions to reflect new information obtained about facts and circumstances that existed on the respective acquisition dates. For more information about significant adjustments, seeNotes (10) and(15).
(5) REVENUE
For detailed information about our revenue recognition policies, seeNote (3).
For revenue information by geographic region, seeNote (28).
Revenue from construction contracts (contract revenue) is mainly included in software revenue and services revenue depending on the type of contract. In 2015, contract revenue of €292 million was recognized for all our construction contracts (2014: €285 million, 2013: €261 million). The status of our construction contracts in progress at the end of the reporting period accounted for under IAS 11 (Construction Contracts) was as follows:
Construction Contracts in Progress
| | | | | | | | | | | | |
€ millions | | 2015 | | | 2014 | | | 2013 | |
| Aggregate cost recognized (multi-year) | | | 294 | | | | 201 | | | | 221 | |
| Recognized result (+ profit/– loss; multi-year) | | | 20 | | | | 92 | | | | 87 | |
(6) RESTRUCTURING
| | | | | | | | | | | | |
€ millions | | 2015 | | | 2014 | | | 2013 | |
| Employee-related restructuring expenses | | | 610 | | | | 119 | | | | 57 | |
| Onerous contract-related restructuring expenses | | | 11 | | | | 7 | | | | 13 | |
| | | | | | | | | | | | |
| Restructuring expenses | | | 621 | | | | 126 | | | | 70 | |
To further drive our transition from an on-premise software vendor to a cloud company, we have carried out additional organizational changes as part of a new restructuring plan, which is intended to minimize cost-intensive and low-growth business activities worldwide. In addition, more redundancies resulted from the integration of our acquired companies.
Restructuring provisions primarily include personnel costs that result from severance payments for employee terminations and onerous contract costs. Prior-year restructuring provisions relate to restructuring activities incurred in connection with the organizational changes triggered by our new cloud and simplification strategy and the integration of employees of our acquisitions. For more information, seeNote (18b).
If not presented separately in our income statement, restructuring expenses would break down by functional area as follows:
Restructuring Expenses by Functional Area
| | | | | | | | | | | | |
€ millions | | 2015 | | | 2014 | | | 2013 | |
| Cost of cloud and software | | | 80 | | | | 9 | | | | 12 | |
| Cost of services | | | 218 | | | | 24 | | | | 14 | |
| Research and development | | | 156 | | | | 24 | | | | 0 | |
| Sales and marketing | | | 147 | | | | 41 | | | | 29 | |
| General and administration | | | 20 | | | | 28 | | | | 15 | |
| | | | | | | | | | | | |
| Restructuring expenses | | | 621 | | | | 126 | | | | 70 | |
| | |
| Consolidated Financial Statements IFRSNotes | | 146 |
(7) EMPLOYEE BENEFITS EXPENSE AND HEADCOUNT
Employee Benefits Expense
| | | | | | | | | | | | |
€ millions | | 2015 | | | 2014 | | | 2013 | |
| Salaries | | | 7,483 | | | | 6,319 | | | | 5,997 | |
| Social security expense | | | 1,067 | | | | 916 | | | | 857 | |
| Share-based payment expense | | | 724 | | | | 290 | | | | 327 | |
| Pension expense | | | 258 | | | | 211 | | | | 212 | |
| Employee-related restructuring expense | | | 610 | | | | 119 | | | | 57 | |
| Termination benefits outside of restructuring plans | | | 28 | | | | 22 | | | | 39 | |
| | | | | | | | | | | | |
| Employee benefits expense | | | 10,170 | | | | 7,877 | | | | 7,489 | |
Pension expense includes the amounts recorded for our defined benefit and defined contribution plans as described inNote (18a). Expenses for local state pension plans are included in social security expense.
The number of employees in the following table is broken down by function and by the regions EMEA (Europe, Middle East, and Africa), Americas (North America and Latin America), and APJ (Asia Pacific Japan).
Number of Employees
| | | | | | | | | | | | | | | | | | | | | | | | | | | | | | | | | | | | | | | | | | | | | | | | |
Full-time equivalents | | December 31, 2015 | | | December 31, 2014 | | | December 31, 2013 | |
| | EMEA | | | Americas | | | APJ | | | Total | | | EMEA | | | Americas | | | APJ | | | Total | | | EMEA | | | Americas | | | APJ | | | Total | |
| Cloud and software | | | 6,095 | | | | 3,920 | | | | 4,976 | | | | 14,991 | | | | 5,953 | | | | 3,983 | | | | 5,138 | | | | 15,074 | | | | 4,859 | | | | 2,861 | | | | 3,541 | | | | 11,261 | |
| Services | | | 6,980 | | | | 4,264 | | | | 3,841 | | | | 15,085 | | | | 7,291 | | | | 4,304 | | | | 3,044 | | | | 14,639 | | | | 7,177 | | | | 4,406 | | | | 3,047 | | | | 14,629 | |
| Research and development | | | 9,676 | | | | 4,233 | | | | 7,029 | | | | 20,938 | | | | 9,049 | | | | 3,974 | | | | 5,885 | | | | 18,908 | | | | 8,806 | | | | 3,630 | | | | 5,367 | | | | 17,804 | |
| Sales and marketing | | | 7,186 | | | | 7,314 | | | | 3,706 | | | | 18,206 | | | | 7,069 | | | | 7,288 | | | | 3,611 | | | | 17,969 | | | | 6,346 | | | | 6,437 | | | | 3,041 | | | | 15,824 | |
| General and administration | | | 2,434 | | | | 1,653 | | | | 937 | | | | 5,024 | | | | 2,436 | | | | 1,643 | | | | 944 | | | | 5,023 | | | | 2,424 | | | | 1,445 | | | | 697 | | | | 4,566 | |
| Infrastructure | | | 1,535 | | | | 783 | | | | 425 | | | | 2,743 | | | | 1,542 | | | | 879 | | | | 373 | | | | 2,794 | | | | 1,380 | | | | 790 | | | | 318 | | | | 2,488 | |
| | | | | | | | | | | | | | | | | | | | | | | | | | | | | | | | | | | | | | | | | | | | | | | | |
| SAP Group (December 31) | | | 33,906 | | | | 22,166 | | | | 20,914 | | | | 76,986 | | | | 33,340 | | | | 22,071 | | | | 18,995 | | | | 74,406 | | | | 30,993 | | | | 19,568 | | | | 16,011 | | | | 66,572 | |
Thereof acquisitions | | | 73 | | | | 0 | | | | 0 | | | | 73 | | | | 814 | | | | 2,890 | | | | 1,831 | | | | 5,535 | | | | 511 | | | | 571 | | | | 29 | | | | 1,111 | |
| | | | | | | | | | | | | | | | | | | | | | | | | | | | | | | | | | | | | | | | | | | | | | | | |
| SAP Group (months’ end average) | | | 33,561 | | | | 21,832 | | | | 19,788 | | | | 75,180 | | | | 31,821 | | | | 19,797 | | | | 16,725 | | | | 68,343 | | | | 30,238 | | | | 19,418 | | | | 15,752 | | | | 65,409 | |
| | |
| Consolidated Financial Statements IFRSNotes | | 147 |
Allocation of Share-Based Payment Expense
The allocation of expense for share-based payments, net of the effects from hedging these instruments, to the various operating expense items is as follows:
Share-Based Payments
| | | | | | | | | | | | |
€ millions | | 2015 | | | 2014 | | | 2013 | |
| Cost of cloud and software | | | 74 | | | | 28 | | | | 35 | |
| Cost of services | | | 126 | | | | 53 | | | | 66 | |
| Research and development | | | 166 | | | | 71 | | | | 90 | |
| Sales and marketing | | | 247 | | | | 76 | | | | 96 | |
| General and administration | | | 113 | | | | 62 | | | | 40 | |
| | | | | | | | | | | | |
| Share-based payments | | | 724 | | | | 290 | | | | 327 | |
Thereof cash-settled share-based payments | | | 637 | | | | 193 | | | | 240 | |
Thereof equity-settled share-based payments | | | 87 | | | | 96 | | | | 87 | |
For more information about our share-based payments,see Note (27).
(8) OTHER NON-OPERATING INCOME/EXPENSE, NET
| | | | | | | | | | | | |
€ millions | | 2015 | | | 2014 | | | 2013 | |
| Foreign currency exchange gain/loss, net | | | -230 | | | | 71 | | | | 4 | |
Thereof from financial assets/liabilities at fair value through profit or loss | | | -12 | | | | 83 | | | | -75 | |
Thereof from available for sale financial assets | | | -1 | | | | 0 | | | | 0 | |
Thereof from loans and receivables | | | -213 | | | | -219 | | | | 184 | |
Thereof from financial liabilities at amortized cost | | | -2 | | | | 226 | | | | -105 | |
Thereof from non-financial assets/liabilities | | | -3 | | | | -13 | | | | 0 | |
| Miscellaneous income | | | 1 | | | | 3 | | | | 1 | |
| Miscellaneous expense | | | -27 | | | | -25 | | | | -22 | |
| | | | | | | | | | | | |
| Other non-operating income/expense, net | | | -256 | | | | 49 | | | | -17 | |
(9) FINANCIAL INCOME, NET
| | | | | | | | | | | | |
€ millions | | 2015 | | | 2014 | | | 2013 | |
| Finance income | | | 241 | | | | 127 | | | | 115 | |
| | | | | | | | | | | | |
Thereof available-for-sale financial assets (equity) | | | 176 | | | | 30 | | | | 46 | |
| | | | | | | | | | | | |
| Finance costs | | | -246 | | | | -152 | | | | -181 | |
Thereof interest expense from financial liabilities at amortized cost | | | -135 | | | | -93 | | | | -131 | |
Thereof interest expense from derivatives | | | -72 | | | | -28 | | | | -23 | |
| | | | | | | | | | | | |
| Financial income, net | | | -5 | | | | -25 | | | | -66 | |
(10) INCOME TAX
Tax Expense According to Region
| | | | | | | | | | | | |
€ millions | | 2015 | | | 2014 | | | 2013 | |
| Current tax expense | | | | | | | | | | | | |
| Germany | | | 859 | | | | 770 | | | | 836 | |
| Foreign | | | 408 | | | | 422 | | | | 326 | |
| | | | | | | | | | | | |
| Total current tax expense | | | 1,267 | | | | 1,192 | | | | 1,162 | |
| Deferred tax expense/income | | | | | | | | | | | | |
| Germany | | | -74 | | | | 84 | | | | 51 | |
| Foreign | | | -258 | | | | -201 | | | | -142 | |
| | | | | | | | | | | | |
| Total deferred tax income | | | -332 | | | | -117 | | | | -91 | |
| | | | | | | | | | | | |
| Total income tax expense | | | 935 | | | | 1,075 | | | | 1,071 | |
Major Components of Tax Expense
| | | | | | | | | | | | |
€ millions | | 2015 | | | 2014 | | | 2013 | |
| Current tax expense/income | | | | | | | | | | | | |
| Tax expense for current year | | | 1,278 | | | | 1,168 | | | | 1,249 | |
| Taxes for prior years | | | -11 | | | | 24 | | | | -87 | |
| | | | | | | | | | | | |
| Total current tax expense | | | 1,267 | | | | 1,192 | | | | 1,162 | |
| Deferred tax expense/income | | | | | | | | | | | | |
| Origination and reversal of temporary differences | | | -428 | | | | -126 | | | | -168 | |
| Unused tax losses, research and development tax credits, and foreign tax credits | | | 96 | | | | 9 | | | | 77 | |
| | | | | | | | | | | | |
| Total deferred tax income | | | -332 | | | | -117 | | | | -91 | |
| | | | | | | | | | | | |
| Total income tax expense | | | 935 | | | | 1,075 | | | | 1,071 | |
| | |
| Consolidated Financial Statements IFRSNotes | | 148 |
Profit Before Tax
| | | | | | | | | | | | |
€ millions | | 2015 | | | 2014 | | | 2013 | |
| Germany | | | 3,161 | | | | 3,338 | | | | 3,126 | |
| Foreign | | | 830 | | | | 1,017 | | | | 1,270 | |
| | | | | | | | | | | | |
| Total | | | 3,991 | | | | 4,355 | | | | 4,396 | |
The following table reconciles the expected income tax expense computed by applying our combined German tax rate of 26.4% (2014: 26.4%; 2013: 26.4%) to the actual income tax expense. Our 2015 combined German tax rate includes a corporate income tax rate of 15.0% (2014: 15.0%; 2013: 15.0%), plus a solidarity surcharge of 5.5% (2014: 5.5%; 2013: 5.5%) thereon, and trade taxes of 10.6% (2014: 10.6%; 2013: 10.6%).
Relationship Between Tax Expense and Profit Before Tax
| | | | | | | | | | | | |
€ millions, unless otherwise stated | | 2015 | | | 2014 | | | 2013 | |
| Profit before tax | | | 3,991 | | | | 4,355 | | | | 4,396 | |
| Tax expense at applicable tax rate of 26.4% (2014: 26.4%; 2013: 26.4%) | | | 1,055 | | | | 1,151 | | | | 1,161 | |
| Tax effect of: | | | | | | | | | | | | |
Foreign tax rates | | | -126 | | | | -117 | | | | -116 | |
Non-deductible expenses | | | 61 | | | | 63 | | | | 158 | |
Tax exempt income | | | -103 | | | | -86 | | | | -146 | |
Withholding taxes | | | 115 | | | | 111 | | | | 87 | |
Research and development and foreign tax credits | | | -31 | | | | -41 | | | | -41 | |
Prior-year taxes | | | -55 | | | | -10 | | | | -113 | |
Reassessment of deferred tax assets, research and development tax credits, and foreign tax credits | | | 43 | | | | 41 | | | | 60 | |
Other | | | -24 | | | | -37 | | | | 21 | |
| | | | | | | | | | | | |
| Total income tax expense | | | 935 | | | | 1,075 | | | | 1,071 | |
| | | | | | | | | | | | |
| Effective tax rate (in %) | | | 23.4 | | | | 24.7 | | | | 24.4 | |
Recognized Deferred Tax Assets and Liabilities
| | | | | | | | |
€ millions | | 2015 | | | 2014 | |
| Deferred tax assets | | | | | | | | |
| Intangible assets | | | 99 | | | | 104 | |
| Property, plant, and equipment | | | 24 | | | | 18 | |
| Other financial assets | | | 15 | | | | 12 | |
| Trade and other receivables | | | 64 | | | | 53 | |
| Pension provisions | | | 98 | | | | 87 | |
| Share-based payments | | | 163 | | | | 107 | |
| Other provisions and obligations | | | 431 | | | | 403 | |
| Deferred income | | | 104 | | | | 76 | |
| Carryforwards of unused tax losses | | | 621 | | | | 752 | |
| Research and development and foreign tax credits | | | 187 | | | | 85 | |
| Other | | | 149 | | | | 172 | |
| | | | | | | | |
| Total deferred tax assets | | | 1,955 | | | | 1,869 | |
| Deferred tax liabilities | | | | | | | | |
| Intangible assets | | | 1,234 | | | | 1,241 | |
| Property, plant, and equipment | | | 62 | | | | 51 | |
| Other financial assets | | | 389 | | | | 623 | |
| Trade and other receivables | | | 93 | | | | 69 | |
| Pension provisions | | | 5 | | | | 4 | |
| Share-based payments | | | 4 | | | | 3 | |
| Other provisions and obligations | | | 112 | | | | 118 | |
| Deferred income | | | 40 | | | | 11 | |
| Other | | | 11 | | | | 9 | |
| | | | | | | | |
| Total deferred tax liabilities | | | 1,950 | | | | 2,129 | |
| | | | | | | | |
| Total deferred tax assets/liabilities, net | | | 5 | | | | -260 | |
We retrospectively adjusted the provisional amounts recognized for deferred tax assets and liabilities related to the 2014 business combinations by a corresponding increase in goodwill in the amount of €102 million. The adjustments reflect new information obtained about facts and circumstances as of the acquisition date, mainly about the valuation of the carrying amount of investments in subsidiaries and the utilization of carryforwards of unused tax losses.
| | |
| Consolidated Financial Statements IFRSNotes | | 149 |
Items Not Resulting in a Deferred Tax Asset
| | | | | | | | | | | | |
€ millions | | 2015 | | | 2014 | | | 2013 | |
| Unused tax losses | | | | | | | | | | | | |
| Not expiring | | | 279 | | | | 140 | | | | 68 | |
| Expiring in the following year | | | 95 | | | | 63 | | | | 43 | |
| Expiring after the following year | | | 704 | | | | 672 | | | | 525 | |
| | | | | | | | | | | | |
| Total unused tax losses | | | 1,078 | | | | 875 | | | | 636 | |
| Deductible temporary differences | | | 122 | | | | 96 | | | | 178 | |
| Unused research and development and foreign tax credits | | | | | | | | | | | | |
| Not expiring | | | 34 | | | | 32 | | | | 25 | |
| Expiring in the following year | | | 0 | | | | 0 | | | | 1 | |
| Expiring after the following year | | | 20 | | | | 22 | | | | 1 | |
| | | | | | | | | | | | |
| Total unused tax credits | | | 54 | | | | 54 | | | | 27 | |
€429 million (2014: €441 million; 2013: €421 million) of the unused tax losses relate to U.S. state tax loss carryforwards. As described above, prior-year numbers for unused tax losses related to the 2014 business combinations were adjusted, resulting in a decrease in the amount of €235 million.
In 2015, subsidiaries that suffered a tax loss in either the current or the preceding period recognized deferred tax assets in excess of deferred tax liabilities amounting to €129 million (2014: €73 million, 2013: €61 million), because it is probable that sufficient future taxable profit will be available to allow the benefit of the deferred tax assets to be utilized.
We have not recognized a deferred tax liability on approximately €9.95 billion (2014: €8.87 billion) for undistributed profits of our subsidiaries, because we are in a position to control the timing of the reversal of the temporary difference and it is probable that such differences will not reverse in the foreseeable future.
The proposed dividend payment of €1.15 per share for the year ended December 31, 2015, will not have any effects on the income tax of SAP SE.
Total Income Tax
| | | | | | | | | | | | |
€ millions | | 2015 | | | 2014 | | | 2013 | |
| Income tax recorded in profit | | | 935 | | | | 1,075 | | | | 1,071 | |
| Income tax recorded in share premium | | | -14 | | | | -3 | | | | -5 | |
| Income tax recorded in other comprehensive income that will not be reclassified to profit and loss | | | | | | | | | | | | |
Remeasurements on defined benefit pension plans | | | -2 | | | | -7 | | | | 3 | |
| Income tax recorded in other comprehensive income that will be reclassified to profit and loss | | | | | | | | | | | | |
Available-for-sale financial assets | | | 2 | | | | 0 | | | | 0 | |
Cash flow hedges | | | 4 | | | | -10 | | | | 0 | |
Exchange differences | | | -16 | | | | -21 | | | | 8 | |
| | | | | | | | | | | | |
| Total | | | 909 | | | | 1,034 | | | | 1,077 | |
We are subject to ongoing tax audits by domestic and foreign tax authorities. Currently, we are mainly in dispute with the German and the Brazilian tax authorities. The German dispute is in respect of intercompany financing matters and certain secured capital investments, while the Brazilian dispute is in respect of license fee deductibility. In all cases, we expect that we will need to initiate litigation to prevail. For all of these matters, we have not recorded a provision as we believe that the tax authorities’ claims have no merit and that no adjustment is warranted. If, contrary to our view, the tax authorities were to prevail in their arguments before the court, we would expect to have an additional tax expense (including related interest expenses and penalties) of approximately €1,045 million in total.
| | |
| Consolidated Financial Statements IFRSNotes | | 150 |
(11) EARNINGS PER SHARE
| | | | | | | | | | | | |
€ millions, unless otherwise stated | | 2015 | | | 2014 | | | 2013 | |
| Profit attributable to equity holders of SAP SE | | | 3,064 | | | | 3,280 | | | | 3,326 | |
| Issued ordinary shares1) | | | 1,229 | | | | 1,229 | | | | 1,229 | |
| Effect of treasury shares1) | | | -32 | | | | -34 | | | | -35 | |
| Weighted average shares outstanding, basic1) | | | 1,197 | | | | 1,195 | | | | 1,193 | |
| Dilutive effect of share-based payments1) | | | 2 | | | | 3 | | | | 2 | |
| Weighted average shares outstanding, diluted1) | | | 1,198 | | | | 1,197 | | | | 1,195 | |
| | | | | | | | | | | | |
| Earnings per share, basic, attributable to equity holders of SAP SE (in €) | | | 2.56 | | | | 2.75 | | | | 2.79 | |
| | | | | | | | | | | | |
| Earnings per share, diluted, attributable to equity holders of SAP SE (in €) | | | 2.56 | | | | 2.74 | | | | 2.78 | |
| 1) | Number of shares in millions |
(12) OTHER FINANCIAL ASSETS
| | | | | | | | | | | | | | | | | | | | | | | | |
€ millions | | 2015 | | | 2014 | |
| | | Current | | | Non-Current | | | Total | | | Current | | | Non-Current | | | Total | |
| Loans and other financial receivables | | | 195 | | | | 243 | | | | 437 | | | | 173 | | | | 286 | | | | 459 | |
Debt investments | | | 26 | | | | 0 | | | | 26 | | | | 40 | | | | 0 | | | | 40 | |
Equity investments | | | 1 | | | | 881 | | | | 882 | | | | 1 | | | | 596 | | | | 597 | |
| Available-for-sale financial assets | | | 27 | | | | 881 | | | | 908 | | | | 41 | | | | 596 | | | | 637 | |
| Derivatives | | | 129 | | | | 154 | | | | 283 | | | | 464 | | | | 90 | | | | 554 | |
| Investments in associates | | | 0 | | | | 58 | | | | 58 | | | | 0 | | | | 49 | | | | 49 | |
| | | | | | | | | | | | | | | | | | | | | | | | |
| Total | | | 351 | | | | 1,336 | | | | 1,687 | | | | 678 | | | | 1,021 | | | | 1,699 | |
Loans and Other Financial Receivables
Loans and other financial receivables mainly consist of time deposits, investments in pension assets for which the corresponding liability is included in employee-related obligations (seeNote (18b)), other receivables, and loans to employees and third parties. The majority of our loans and other financial receivables are concentrated in the United States.
As at December 31, 2015, there were no loans and other financial receivables past due but not impaired. We have no indications of impairments of loans and other financial receivables that are not past due and not impaired as at the reporting date. For general information about financial risk and the nature of risk, seeNote (24).
Available-for-Sale Financial Assets
Our available-for-sale financial assets consist of debt investments in bonds of mainly financial and non-financial corporations and municipalities and equity investments in listed and unlisted securities, mainly held in U.S. dollars.
For more information about fair value measurement with regard to our equity investments, seeNote (26).
Derivatives
Detailed information about our derivative financial instruments is presented inNote (25).
| | |
| Consolidated Financial Statements IFRSNotes | | 151 |
(13) TRADE AND OTHER RECEIVABLES
| | | | | | | | | | | | | | | | | | | | | | | | |
€ millions | | 2015 | | | 2014 | |
| | | Current | | | Non-Current | | | Total | | | Current | | | Non-Current | | | Total | |
| Trade receivables, net | | | 5,198 | | | | 2 | | | | 5,199 | | | | 4,253 | | | | 2 | | | | 4,255 | |
| Other receivables | | | 77 | | | | 86 | | | | 163 | | | | 89 | | | | 99 | | | | 188 | |
| | | | | | | | | | | | | | | | | | | | | | | | |
| Total | | | 5,275 | | | | 87 | | | | 5,362 | | | | 4,342 | | | | 100 | | | | 4,443 | |
Carrying Amounts of Trade Receivables
| | | | | | | | |
€ millions | | 2015 | | | 2014 | |
| Gross carrying amount | | | 5,428 | | | | 4,440 | |
| Sales allowances charged to revenue | | | -153 | | | | -134 | |
| Allowance for doubtful accounts charged to expense | | | -75 | | | | -52 | |
| | | | | | | | |
| Carrying amount trade receivables, net | | | 5,199 | | | | 4,255 | |
The changes in the allowance for doubtful accounts charged to expense were immaterial in all periods presented.
Aging of Trade Receivables
| | | | | | | | |
€ millions | | 2015 | | | 2014 | |
| Not past due and not individually impaired | | | 3,918 | | | | 3,362 | |
| Past due but not individually impaired | | | | |
Past due 1 to 30 days | | | 473 | | | | 345 | |
Past due 31 to 120 days | | | 428 | | | | 339 | |
Past due 121 to 365 days | | | 257 | | | | 118 | |
Past due over 365 days | | | 38 | | | | 16 | |
| | | | | | | | |
| Total past due but not individually impaired | | | 1,196 | | | | 818 | |
| Individually impaired, net of allowances | | | 85 | | | | 75 | |
| | | | | | | | |
| Carrying amount of trade receivables, net | | | 5,199 | | | | 4,255 | |
For more information about financial risk and how we manage it, seeNotes (24) and(25).
(14) OTHER NON-FINANCIAL ASSETS
| | | | | | | | | | | | | | | | | | | | | | | | |
€ millions | | 2015 | | | 2014 | |
| | | Current | | | Non-Current | | | Total | | | Current | | | Non-Current | | | Total | |
| Prepaid expenses | | | 232 | | | | 83 | | | | 315 | | | | 212 | | | | 66 | | | | 277 | |
| Other tax assets | | | 113 | | | | 0 | | | | 113 | | | | 101 | | | | 0 | | | | 101 | |
| Capitalized contract cost | | | 77 | | | | 250 | | | | 327 | | | | 90 | | | | 99 | | | | 188 | |
| Miscellaneous other assets | | | 46 | | | | 0 | | | | 46 | | | | 33 | | | | 0 | | | | 33 | |
| | | | | | | | | | | | | | | | | | | | | | | | |
| Total | | | 468 | | | | 332 | | | | 800 | | | | 435 | | | | 164 | | | | 599 | |
Prepaid expenses primarily consist of prepayments for operating leases, support services, and software royalties.
| | |
| Consolidated Financial Statements IFRSNotes | | 152 |
(15) GOODWILL AND INTANGIBLE ASSETS
| | | | | | | | | | | | | | | | | | | | |
€ millions | | Goodwill | | | Software and
Database Licenses | | | Acquired
Technology/ IPRD | | | Customer
Relationship and
Other Intangibles | | | Total | |
| Historical cost | | | | | | | | | | | | | | | | | | | | |
| January 1, 2014 | | | 13,785 | | | | 558 | | | | 1,929 | | | | 3,036 | | | | 19,308 | |
| Foreign currency exchange differences | | | 1,242 | | | | 13 | | | | 160 | | | | 297 | | | | 1,712 | |
| Additions from business combinations | | | 6,072 | | | | 14 | | | | 540 | | | | 1,312 | | | | 7,938 | |
| Other additions | | | 0 | | | | 86 | | | | 0 | | | | 2 | | | | 88 | |
| Retirements/disposals | | | 0 | | | | -4 | | | | -42 | | | | -3 | | | | -49 | |
| December 31, 2014 | | | 21,099 | | | | 667 | | | | 2,587 | | | | 4,644 | | | | 28,997 | |
| Foreign currency exchange differences | | | 1,666 | | | | 15 | | | | 204 | | | | 379 | | | | 2,264 | |
| Additions from business combinations | | | 27 | | | | 0 | | | | 6 | | | | 5 | | | | 38 | |
| Other additions | | | 0 | | | | 53 | | | | 0 | | | | 6 | | | | 59 | |
| Retirements/disposals | | | 0 | | | | -8 | | | | -1 | | | | -1 | | | | -10 | |
| | | | | | | | | | | | | | | | | | | | |
| December 31, 2015 | | | 22,792 | | | | 727 | | | | 2,796 | | | | 5,033 | | | | 31,348 | |
| | | | | |
| Accumulated amortization | | | | | | | | | | | | | | | | | | | | |
| January 1, 2014 | | | 95 | | | | 367 | | | | 1,071 | | | | 1,129 | | | | 2,662 | |
| Foreign currency exchange differences | | | 4 | | | | 7 | | | | 73 | | | | 81 | | | | 165 | |
| Additions amortization | | | 0 | | | | 78 | | | | 255 | | | | 282 | | | | 615 | |
| Retirements/disposals | | | 0 | | | | -4 | | | | -42 | | | | -3 | | | | -49 | |
| December 31, 2014 | | | 99 | | | | 448 | | | | 1,357 | | | | 1,489 | | | | 3,393 | |
| Foreign currency exchange differences | | | 4 | | | | 10 | | | | 84 | | | | 89 | | | | 187 | |
| Additions amortization | | | 0 | | | | 76 | | | | 372 | | | | 361 | | | | 809 | |
| Retirements/disposals | | | 0 | | | | -8 | | | | -1 | | | | -1 | | | | -10 | |
| | | | | | | | | | | | | | | | | | | | |
| December 31, 2015 | | | 103 | | | | 526 | | | | 1,812 | | | | 1,938 | | | | 4,379 | |
| | | | | |
| Carrying amount | | | | | | | | | | | | | | | | | | | | |
| | | | | | | | | | | | | | | | | | | | |
| December 31, 2014 | | | 21,000 | | | | 219 | | | | 1,230 | | | | 3,155 | | | | 25,604 | |
| | | | | | | | | | | | | | | | | | | | |
| December 31, 2015 | | | 22,689 | | | | 201 | | | | 984 | | | | 3,095 | | | | 26,969 | |
The additions, other than from business combinations, to individually acquired from third parties and include cross-license software and database licenses in 2015 and 2014 were agreements and patents.
| | |
| Consolidated Financial Statements IFRSNotes | | 153 |
Significant Intangible Assets
| | | | | | | | | | | | |
| € millions, unless otherwise stated | | Carrying
Amount | | | Remaining
Useful Life
(in years) | |
| | | 2015 | | | 2014 | | | | |
| Business Objects – Customer relationships: Maintenance | | | 104 | | | | 126 | | | | 6 to 9 | |
| Sybase – Acquired technologies | | | 80 | | | | 149 | | | | approx. 1 | |
| Sybase – Customer relationships: Maintenance | | | 363 | | | | 418 | | | | 8 | |
| SuccessFactors – Acquired technologies | | | 149 | | | | 184 | | | | 4 | |
| SuccessFactors – Customer relationships: Subscription | | | 395 | | | | 402 | | | | 10 | |
| Ariba – Acquired technologies | | | 137 | | | | 166 | | | | 5 | |
| Ariba – Customer relationships | | | 525 | | | | 516 | | | | 10 to 12 | |
| hybris – Acquired technologies | | | 100 | | | | 128 | | | | 5 | |
| hybris – Customer relationships | | | 127 | | | | 136 | | | | 2 to12 | |
| Fieldglass – Acquired technologies | | | 89 | | | | 96 | | | | 7 | |
| Concur – Acquired technologies | | | 387 | | | | 445 | | | | 6 | |
| Concur – Customer relationships | | | 1,299 | | | | 1,233 | | | | 15 to 19 | |
| | | | | | | | | | | | |
| Total significant intangible assets | | | 3,755 | | | | 3,999 | | | | | |
Goodwill Impairment Testing
SAP had two operating segments in 2015 (in 2014, we had a single operating segment). The carrying amount of goodwill has been allocated for impairment testing purposes to SAP’s operating segments.
Goodwill by Operating Segment
| | | | | | | | | | | | | | | | | | | | |
€ millions | | Applications,
Technology &
Services | | | SAP Business
Network | | | Single
Segment
(2014) | | | Unallocated | | | Total | |
| January 1, 2015, prior to adjustment | | | 0 | | | | 0 | | | | 15,412 | | | | 5,533 | | | | 20,945 | |
| Adjustment | | | 0 | | | | 0 | | | | -31 | | | | 86 | | | | 55 | |
| January 1, 2015, after adjustment | | | 0 | | | | 0 | | | | 15,381 | | | | 5,619 | | | | 21,000 | |
| Reallocation due to changes in segment composition | | | 14,401 | | | | 6,599 | | | | -15,381 | | | | -5,619 | | | | 0 | |
| Additions from business combinations | | | 27 | | | | 0 | | | | 0 | | | | 0 | | | | 27 | |
| Foreign currency exchange differences | | | 1,070 | | | | 592 | | | | 0 | | | | 0 | | | | 1,662 | |
| | | | | | | | | | | | | | | | | | | | |
| December 31, 2015 | | | 15,497 | | | | 7,191 | | | | 0 | | | | 0 | | | | 22,689 | |
The amount unallocated on January 1, 2015, relates to the goodwill from the acquisition of Concur in December 2014.
Prior-year goodwill amounts have been adjusted by €55 million relating mainly to tax and non-controlling interest adjustments. For more information, seeNote (10).
| | |
| Consolidated Financial Statements IFRSNotes | | 154 |
The key assumptions on which management based its cash flow projections for the period covered by the underlying business plans are as follows:
| | |
Key Assumption | | Basis for Determining Values Assigned to Key Assumption |
| Budgeted revenue growth | | Revenue growth rate achieved in the current fiscal year, adjusted for an expected increase in SAP’s addressable cloud, mobility, and database markets; expected growth in the established applications and analytics markets. Values assigned reflect our past experience and our expectations regarding an increase in the addressable markets. |
| |
| Budgeted operating margin | | Operating margin budgeted for a given budget period equals the operating margin achieved in the current fiscal year, increased by expected efficiency gains. Values assigned reflect past experience, except for efficiency gains. |
| |
| Pre-tax discount rates | | Our estimated cash flow projections are discounted to present value using pre-tax discount rates. Pre-tax discount rates are based on the weighted average cost of capital (WACC) approach. |
| |
| Terminal growth rate | | Our estimated cash flow projections for periods beyond the business plan were extrapolated using the segment-specific terminal growth rates. These growth rates do not exceed the long-term average growth rates for the markets in which our segments operate. |
Key Assumptions
| | | | | | | | |
Percent | | Applications,
Technology &
Services | | | SAP Business
Network | |
| Budgeted revenue growth (average of the budgeted period) | | | 4.5 | | | | 16.2 | |
| Pre-tax discount rate | | | 11.7 | | | | 13.0 | |
| Terminal growth rate | | | 3.0 | | | | 3.0 | |
Applications, Technology & Services
The recoverable amounts of the segment have been determined based on value-in-use calculations. The calculations use cash flow projections based on actual operating results and a group-wide five-year business plan approved by management.
We believe that any reasonably possible change in any of the above key assumptions would not cause the carrying amount of our Applications, Technology & Services segment to exceed the recoverable amount.
SAP Business Network
The recoverable amounts of the segment have been determined based on fair value less costs of disposal calculations. The fair value measurement was categorized as a level 3 fair value based on the inputs used in the valuation technique. The cash flow projections are based on actual operating results and specific estimates covering a ten-year period and the terminal growth rate thereafter. The calculations use cash flow projections based on actual operating results and a group-wide five-year business plan approved by management. The projected results were determined based on management’s estimates and are consistent with the assumptions a market participant would make. The segment operates in a relatively immature area with significant growth rates projected for the near future. We therefore have a longer and more detailed planning period than one would apply in a more mature segment.
We are using a target margin of 33% for the segment at the end of the budgeted period as a key assumption, which is within the range of expectations of market participants (for example, industry analysts).
The recoverable amount exceeds the carrying amount by €1,764 million.
The following table shows amounts by which the key assumptions would need to change individually for the recoverable amount to be equal to the carrying amount:
Sensitivity to Change in Assumptions
| | | | |
Percentage points | | SAP Business
Network | |
| Budgeted revenue growth (average of the budgeted period) | | | -2.1 | |
| Pre-tax discount rate | | | 1.4 | |
| Terminal growth rate | | | -1.7 | |
The recoverable amount for the SAP Business Network segment would equal the carrying amount if a margin of only 27% was achieved by 2022.
| | |
| Consolidated Financial Statements IFRSNotes | | 155 |
(16) PROPERTY, PLANT, AND EQUIPMENT
| | | | | | | | | | | | | | | | |
€ millions | | Land and
Buildings | | | Other Property,
Plant, and
Equipment | | | Advance
Payments and
Construction
in Progress | | | Total | |
| Carrying amount | | | | | | | | | | | | | | | | |
| December 31, 2014 | | | 1,010 | | | | 1,050 | | | | 42 | | | | 2,102 | |
| | | | | | | | | | | | | | | | |
| December 31, 2015 | | | 1,053 | | | | 1,073 | | | | 66 | | | | 2,192 | |
Total additions (other than from business combinations) amounted to €580 million (2014: €629 million) and relate primarily to the replacement and purchase of computer hardware and vehicles acquired in the normal course of business and investments in data centers.
(17) TRADE AND OTHER PAYABLES, FINANCIAL LIABILITIES, AND OTHER NON-FINANCIAL LIABILITIES
(17a) Trade and Other Payables
| | | | | | | | | | | | | | | | | | | | | | | | |
€ millions | | 2015 | | | 2014 | |
| | | Current | | | Non-Current | | | Total | | | Current | | | Non-Current | | | Total | |
| Trade payables | | | 893 | | | | 0 | | | | 893 | | | | 782 | | | | 0 | | | | 782 | |
| Advance payments received | | | 110 | | | | 0 | | | | 110 | | | | 112 | | | | 0 | | | | 112 | |
| Miscellaneous other liabilities | | | 85 | | | | 81 | | | | 166 | | | | 138 | | | | 55 | | | | 193 | |
| | | | | | | | | | | | | | | | | | | | | | | | |
| Trade and other payables | | | 1,088 | | | | 81 | | | | 1,169 | | | | 1,032 | | | | 55 | | | | 1,087 | |
Miscellaneous other liabilities mainly include deferral amounts for free rent periods and liabilities related to government grants.
(17b) Financial Liabilities
| | | | | | | | | | | | | | | | | | | | | | | | | | | | | | | | | | | | | | | | |
€ millions | | 2015 | | | 2014 | |
| | | Nominal Volume | | | Carrying Amount | | | Nominal Volume | | | Carrying Amount | |
| | | Current | | | Non-Current | | | Current | | | Non-Current | | | Total | | | Current | | | Non-Current | | | Current | | | Non-Current | | | Total | |
Bonds | | | 0 | | | | 5,750 | | | | 0 | | | | 5,733 | | | | 5,733 | | | | 631 | | | | 4,000 | | | | 631 | | | | 3,998 | | | | 4,629 | |
Private placement transactions | | | 551 | | | | 1,607 | | | | 551 | | | | 1,651 | | | | 2,202 | | | | 247 | | | | 1,936 | | | | 247 | | | | 1,948 | | | | 2,195 | |
Bank loans | | | 16 | | | | 1,250 | | | | 16 | | | | 1,245 | | | | 1,261 | | | | 1,279 | | | | 3,000 | | | | 1,277 | | | | 2,985 | | | | 4,261 | |
| | | | | | | | | | | | | | | | | | | | | | | | | | | | | | | | | | | | | | | | |
| Financial debt | | | 567 | | | | 8,607 | | | | 567 | | | | 8,628 | | | | 9,195 | | | | 2,157 | | | | 8,936 | | | | 2,155 | | | | 8,931 | | | | 11,086 | |
| Derivatives | | | NA | | | | NA | | | | 70 | | | | 58 | | | | 128 | | | | NA | | | | NA | | | | 287 | | | | 46 | | | | 333 | |
| Other financial liabilities | | | NA | | | | NA | | | | 204 | | | | -5 | | | | 199 | | | | NA | | | | NA | | | | 119 | | | | 4 | | | | 123 | |
| | | | | | | | | | | | | | | | | | | | | | | | | | | | | | | | | | | | | | | | |
| Financial liabilities | | | | | | | | | | | 841 | | | | 8,681 | | | | 9,522 | | | | | | | | | | | | 2,561 | | | | 8,980 | | | | 11,542 | |
Financial liabilities are unsecured, except for the retention of title and similar rights customary in our industry. Effective interest rates on our financial debt (including the effects from interest-rate swaps) were 1.30% in 2015, 1.77% in 2014, and 2.48% in 2013.
| | |
| Consolidated Financial Statements IFRSNotes | | 156 |
For an analysis of the contractual cash flows of our financial liabilities based on maturity, seeNote (24). For information about the risk associated with our financial liabilities, seeNote (25). For information about fair values, seeNote (26).
Bonds
| | | | | | | | | | | | | | | | | | | | | | | | | | |
| | | | | | | | | | | | | | | | | 2015 | | | 2014 | |
| | | Maturity | | | Issue Price | | | Coupon Rate | | Effective
Interest Rate | | | Nominal Volume
(in respective
currency in millions) | | | Carrying Amount
(in € millions) | | | Carrying Amount
(in € millions) | |
| Eurobond 2 – 2010 | | | 2017 | | | | 99.780 | % | | 3.50% (fix) | | | 3.59 | % | | | €500 | | | | 488 | | | | 490 | |
| Eurobond 5 – 2012 | | | 2015 | | | | NA | | | NA | | | NA | | | | €0 | | | | 0 | | | | 549 | |
| Eurobond 6 – 2012 | | | 2019 | | | | 99.307 | % | | 2.125% (fix) | | | 2.29 | % | | | €750 | | | | 774 | | | | 778 | |
| Eurobond 7 – 2014 | | | 2018 | | | | 100.000 | % | | 0.208% (var.) | | | 0.23 | % | | | €750 | | | | 749 | | | | 748 | |
| Eurobond 8 – 2014 | | | 2023 | | | | 99.478 | % | | 1.125% (fix) | | | 1.24 | % | | | €1,000 | | | | 993 | | | | 992 | |
| Eurobond 9 – 2014 | | | 2027 | | | | 99.284 | % | | 1.75% (fix) | | | 1.86 | % | | | €1,000 | | | | 989 | | | | 990 | |
| Eurobond 10 – 2015 | | | 2017 | | | | 100.000 | % | | 0.127% (var.) | | | 0.14 | % | | | €500 | | | | 499 | | | | 0 | |
| Eurobond 11 – 2015 | | | 2020 | | | | 100.000 | % | | 0.259% (var.) | | | 0.23 | % | | | €650 | | | | 648 | | | | 0 | |
| Eurobond 12 – 2015 | | | 2025 | | | | 99.264 | % | | 1.00% (fix) | | | 1.13 | % | | | €600 | | | | 593 | | | | 0 | |
| | | | | | | | | | | | | | | | | | | | | | | | | | |
| Eurobonds | | | | | | | | | | | | | | | | | | | | | 5,733 | | | | 4,547 | |
| Other bonds | | | | | | | | | | | | | | | | | | | | | 0 | | | | 82 | |
| | | | | | | | | | | | | | | | | | | | | | | | | | |
| Bonds | | | | | | | | | | | | | | | | | | | | | 5,733 | | | | 4,629 | |
Since September 2012, we have used a debt issuance program to issue bonds in a number of tranches. Currently, the total volume available under the program (including the amounts issued) is €8 billion.
All of our Eurobonds are listed for trading on the Luxembourg Stock Exchange.
Private Placement Transactions
| | | | | | | | | | | | | | | | | | | | | | |
| | | | | | | | | | | | | | 2015 | | | 2014 | |
| | | Maturity | | | Coupon Rate | | Effective
Interest Rate | | | Nominal Volume
(in respective
currency in millions) | | | Carrying Amount
(in € millions) | | | Carrying Amount
(in € millions) | |
| U.S. private placements | | | | | | | | | | | | | | | | | | | | | | |
Tranche 1 – 2010 | | | 2015 | | | NA | | | NA | | | | US$0 | | | | 0 | | | | 247 | |
Tranche 2 – 2010 | | | 2017 | | | 2.95% (fix) | | | 3.03 | % | | | US$200 | | | | 180 | | | | 161 | |
Tranche 3 – 2011 | | | 2016 | | | 2.77% (fix) | | | 2.82 | % | | | US$600 | | | | 551 | | | | 494 | |
Tranche 4 – 2011 | | | 2018 | | | 3.43% (fix) | | | 3.50 | % | | | US$150 | | | | 135 | | | | 121 | |
Tranche 5 – 2012 | | | 2017 | | | 2.13% (fix) | | | 2.16 | % | | | US$242.5 | | | | 221 | | | | 197 | |
Tranche 6 – 2012 | | | 2020 | | | 2.82% (fix) | | | 2.86 | % | | | US$290 | | | | 271 | | | | 238 | |
Tranche 7 – 2012 | | | 2022 | | | 3.18% (fix) | | | 3.22 | % | | | US$444.5 | | | | 426 | | | | 372 | |
Tranche 8 – 2012 | | | 2024 | | | 3.33% (fix) | | | 3.37 | % | | | US$323 | | | | 318 | | | | 277 | |
Tranche 9 – 2012 | | | 2027 | | | 3.53% (fix) | | | 3.57 | % | | | US$100 | | | | 100 | | | | 88 | |
| | | | | | | | | | | | | | | | | | | | | | |
| Private placements | | | | | | | | | | | | | | | | | 2,202 | | | | 2,195 | |
| | | | | | | | | | | | | | | | | | | | | | |
| | |
| Consolidated Financial Statements IFRSNotes | | 157 |
The U.S. private placement notes were issued by one of our subsidiaries that has the U.S. dollar as its functional currency.
Bank Loans
| | | | | | | | | | | | | | | | | | | | | | | | |
| | | | | | | | | | | | | | | 2015 | | | 2014 | |
| | | Maturity | | | Coupon Rate | | | Effective
Interest Rate | | | Nominal Volume
(in respective
currency in millions) | | | Carrying Amount
(in € millions) | | | Carrying Amount
(in € millions) | |
| Concur term loan – Facility A | | | 2015 | | | | NA | | | | NA | | | | €0 | | | | 0 | | | | 1,268 | |
| Concur term loan – Facility B | | | 2017 | | | | 0.45% (var.) | | | | 0.93 | % | | | €1,250 | | | | 1,245 | | | | 2,984 | |
| Other loans | | | | | | | | | | | | | | | INR 1026 | | | | 16 | | | | 9 | |
| | | | | | | | | | | | | | | | | | | | | | | | |
| Bank loans | | | | | | | | | | | | | | | | | | | 1,261 | | | | 4,261 | |
| | | | | | | | | | | | | | | | | | | | | | | | |
Other Financial Liabilities
Our current other financial liabilities mainly comprise liabilities for accrued interest and customer funding liabilities amounting to €90 million (2014: €58 million).
(17c) Other Non-Financial Liabilities
| | | | | | | | | | | | | | | | | | | | | | | | |
€ millions | | 2015 | | | 2014 | |
| | | Current | | | Non-Current | | | Total | | | Current | | | Non-Current | | | Total | |
| Other employee-related liabilities | | | 2,255 | | | | 126 | | | | 2,381 | | | | 1,979 | | | | 122 | | | | 2,101 | |
| Share-based payment liabilities | | | 555 | | | | 205 | | | | 760 | | | | 289 | | | | 97 | | | | 386 | |
| Other taxes | | | 597 | | | | 0 | | | | 597 | | | | 543 | | | | 0 | | | | 543 | |
| | | | | | | | | | | | | | | | | | | | | | | | |
| Other non-financial liabilities | | | 3,407 | | | | 331 | | | | 3,738 | | | | 2,811 | | | | 219 | | | | 3,030 | |
Other employee-related liabilities mainly relate to vacation accruals, bonus and sales commission accruals, as well as employee-related social security obligations.
For more information about our share-based payments, seeNote (27).
Other taxes mainly comprise payroll tax liabilities and value-added tax liabilities.
(18) PROVISIONS
| | | | | | | | | | | | | | | | | | | | | | | | |
€ millions | | 2015 | | | 2014 | |
| | | Current | | | Non-Current | | | Total | | | Current | | | Non-Current | | | Total | |
| Pension plans and similar obligations (see Note (18a)) | | | 0 | | | | 117 | | | | 117 | | | | 2 | | | | 86 | | | | 88 | |
| Other provisions (see Note (18b)) | | | 299 | | | | 63 | | | | 362 | | | | 148 | | | | 65 | | | | 213 | |
| | | | | | | | | | | | | | | | | | | | | | | | |
| Total | | | 299 | | | | 180 | | | | 479 | | | | 150 | | | | 151 | | | | 301 | |
| | |
| Consolidated Financial Statements IFRSNotes | | 158 |
(18a) Pension Plans and Similar Obligations
Defined Benefit Plans
The measurement dates for our domestic and foreign benefit plans are December 31.
Present Value of the Defined Benefit Obligations (DBO) and the Fair Value of the Plan Assets
| | | | | | | | | | | | | | | | | | | | | | | | | | | | | | | | |
€ millions | | Domestic Plans | | | Foreign Plans | | | Other Post-
Employment Plans | | | Total | |
| | | 2015 | | | 2014 | | | 2015 | | | 2014 | | | 2015 | | | 2014 | | | 2015 | | | 2014 | |
| Present value of the DBO | | | 724 | | | | 780 | | | | 333 | | | | 276 | | | | 82 | | | | 46 | | | | 1,139 | | | | 1,102 | |
Thereof fully or partially funded plans | | | 724 | | | | 780 | | | | 293 | | | | 239 | | | | 61 | | | | 26 | | | | 1,078 | | | | 1,045 | |
Thereof unfunded plans | | | 0 | | | | 0 | | | | 40 | | | | 37 | | | | 21 | | | | 20 | | | | 61 | | | | 57 | |
| | | | | | | | | | | | | | | | | | | | | | | | | | | | | | | | |
| Fair value of the plan assets | | | 716 | | | | 767 | | | | 265 | | | | 234 | | | | 42 | | | | 13 | | | | 1,023 | | | | 1,014 | |
| | | | | | | | | | | | | | | | | | | | | | | | | | | | | | | | |
| Net defined benefit liability (asset) | | | 8 | | | | 13 | | | | 69 | | | | 42 | | | | 40 | | | | 33 | | | | 117 | | | | 88 | |
| Amounts recognized in the Consolidated Statement of Financial Position: | | | | | | | | | | | | | | | | | | | | | | | | | | | | | | | | |
| Non-current other financial assets | | | 0 | | | | 0 | | | | 0 | | | | 0 | | | | 0 | | | | 0 | | | | 0 | | | | 0 | |
| Current provisions | | | 0 | | | | 0 | | | | 0 | | | | -2 | | | | 0 | | | | 0 | | | | 0 | | | | -2 | |
| Non-current provisions | | | -8 | | | | -13 | | | | -69 | | | | -40 | | | | -40 | | | | -33 | | | | -117 | | | | -86 | |
| | | | | | | | | | | | | | | | | | | | | | | | | | | | | | | | |
| Total | | | -8 | | | | -13 | | | | -69 | | | | -42 | | | | -40 | | | | -33 | | | | -117 | | | | -88 | |
€664 million (2014: €714 million) of the present value of the DBO of our domestic plans relate to plans that provide for lump sum payments not based on final salary, and €287 million (2014: €234 million) of the present value of the DBO of our foreign plans relate to plans that provide for annuity payments not based on final salary.
The following weighted average assumptions were used for the actuarial valuation of our domestic and foreign pension liabilities as well as other post-employment benefit obligations as at the respective measurement date:
Actuarial Assumptions
| | | | | | | | | | | | | | | | | | | | | | | | | | | | | | | | | | | | |
Percent | | Domestic Plans | | | Foreign Plans | | | Other Post-
Employment Plans | |
| | | 2015 | | | 2014 | | | 2013 | | | 2015 | | | 2014 | | | 2013 | | | 2015 | | | 2014 | | | 2013 | |
| Discount rate | | | 2.7 | | | | 2.2 | | | | 3.6 | | | | 0.7 | | | | 1.1 | | | | 2.1 | | | | 4.0 | | | | 4.2 | | | | 5.2 | |
| Future salary increases | | | 2.5 | | | | 2.5 | | | | 2.5 | | | | 1.7 | | | | 1.7 | | | | 1.7 | | | | 6.3 | | | | 3.8 | | | | 4.7 | |
| Future pension increases | | | 2.0 | | | | 2.0 | | | | 2.0 | | | | 0 | | | | 0 | | | | 0 | | | | 0.0 | | | | 0 | | | | 0.0 | |
| Employee turnover | | | 2.0 | | | | 2.0 | | | | 2.0 | | | | 10.3 | | | | 10.1 | | | | 9.9 | | | | 8.7 | | | | 1.3 | | | | 2.5 | |
| Inflation | | | 2.0 | | | | 0 | | | | 0 | | | | 1.4 | | | | 1.3 | | | | 1.3 | | | | 1.0 | | | | 1.3 | | | | 1.1 | |
The sensitivity analysis table shows how the present value of all defined benefit obligations would have been influenced by reasonable possible changes to above actuarial assumptions. The sensitivity analysis table presented below considers change in one actuarial assumption at a time, holding all other actuarial assumptions constant. A reasonable possible change in actuarial assumptions of 50 basis points in either direction, except for the discount rate assumption, would not materially influence the present value of all defined benefit obligations.
| | |
| Consolidated Financial Statements IFRSNotes | | 159 |
Sensitivity Analysis
| | | | | | | | | | | | | | | | | | | | | | | | | | | | | | | | | | | | | | | | | | | | | | | | |
€ millions | | Domestic Plans | | | Foreign Plans | | | Other Post-
Employment Plans | | | Total | |
| | | 2015 | | | 2014 | | | 2013 | | | 2015 | | | 2014 | | | 2013 | | | 2015 | | | 2014 | | | 2013 | | | 2015 | | | 2014 | | | 2013 | |
| Present value of all defined benefit obligations if: | | | | | | | | | | | | | | | | | | | | | | | | | | | | | | | | | | | | | | | | | | | | | | | | |
| Discount rate was 50 basis points higher | | | 678 | | | | 725 | | | | 585 | | | | 311 | | | | 259 | | | | 217 | | | | 79 | | | | 44 | | | | 32 | | | | 1,068 | | | | 1,028 | | | | 834 | |
| Discount rate was 50 basis points lower | | | 775 | | | | 840 | | | | 675 | | | | 359 | | | | 296 | | | | 246 | | | | 87 | | | | 49 | | | | 36 | | | | 1,221 | | | | 1,185 | | | | 957 | |
Total Expense of Defined Benefit Pension Plans
| | | | | | | | | | | | | | | | | | | | | | | | | | | | | | | | | | | | | | | | | | | | | | | | |
| € millions | | Domestic Plans | | | Foreign Plans | | | Other Post-
Employment Plans | | | Total | |
| | | 2015 | | | 2014 | | | 2013 | | | 2015 | | | 2014 | | | 2013 | | | 2015 | | | 2014 | | | 2013 | | | 2015 | | | 2014 | | | 2013 | |
| Current service cost | | | 10 | | | | 3 | | | | 7 | | | | 21 | | | | 16 | | | | 15 | | | | 9 | | | | 6 | | | | 3 | | | | 40 | | | | 25 | | | | 25 | |
| Interest expense | | | 17 | | | | 22 | | | | 19 | | | | 3 | | | | 5 | | | | 4 | | | | 3 | | | | 2 | | | | 1 | | | | 23 | | | | 29 | | | | 24 | |
| Interest income | | | -17 | | | | -23 | | | | -20 | | | | -3 | | | | -5 | | | | -4 | | | | -2 | | | | -1 | | | | -1 | | | | -22 | | | | -29 | | | | -25 | |
| Past service cost | | | 0 | | | | 0 | | | | 0 | | | | 0 | | | | 0 | | | | 1 | | | | 0 | | | | 0 | | | | 0 | | | | 0 | | | | 0 | | | | 1 | |
| | | | | | | | | | | | | | | | | | | | | | | | | | | | | | | | | | | | | | | | | | | | | | | | |
| Total expense | | | 10 | | | | 3 | | | | 6 | | | | 21 | | | | 16 | | | | 16 | | | | 10 | | | | 7 | | | | 4 | | | | 41 | | | | 26 | | | | 26 | |
| Actual return on plan assets | | | -76 | | | | 133 | | | | 10 | | | | 0 | | | | 10 | | | | 9 | | | | 2 | | | | 1 | | | | 1 | | | | -74 | | | | 144 | | | | 20 | |
Our investment strategy on domestic benefit plans is to invest all contributions in stable insurance policies.
Our investment strategies for foreign benefit plans vary according to the conditions in the country in which the respective benefit plans are situated. Generally, a long-term investment horizon has been adopted for all major foreign benefit plans. Although our policy is to invest in a risk-diversified portfolio consisting of a mix of assets, both the defined benefit obligation and plan assets can fluctuate over time, which exposes the Group to actuarial and market (investment) risks. Depending on the statutory requirements in each country, it might be necessary to reduce any underfunding by addition of liquid assets.
Plan Asset Allocation
| | | | | | | | | | | | | | | | |
€ millions | | 2015 | | | 2014 | |
| | | Quoted in an
Active Market | | | Not Quoted in an
Active Market | | | Quoted in an
Active Market | | | Not Quoted in an
Active Market | |
| Asset category | | | | | | | | | | | | | | | | |
| Equity investments | | | 93 | | | | 0 | | | | 75 | | | | 0 | |
| Corporate bonds | | | 101 | | | | 0 | | | | 60 | | | | 0 | |
| Government bonds | | | 5 | | | | 0 | | | | 1 | | | | 0 | |
| Real estate | | | 43 | | | | 0 | | | | 31 | | | | 0 | |
| Insurance policies | | | 0 | | | | 736 | | | | 0 | | | | 780 | |
| Cash and cash equivalents | | | 9 | | | | 0 | | | | 41 | | | | 0 | |
| Others | | | 36 | | | | 0 | | | | 27 | | | | 0 | |
| | | | | | | | | | | | | | | | |
| Total | | | 287 | | | | 736 | | | | 234 | | | | 780 | |
| | |
| Consolidated Financial Statements IFRSNotes | | 160 |
Our expected contribution in 2016 to our domestic and foreign defined benefit pension plans is immaterial. The weighted duration of our defined benefit plans amounted to 14 years as at December 31, 2015, and 14 years as at December 31, 2014.
Total future benefit payments from our defined benefit plans as at December 31, 2015, are expected to be €1,432 million (2014: €1,409 million). Eighty-three percent of this amount has maturities of over five years.
Maturity Analysis
| | | | | | | | | | | | | | | | | | | | | | | | |
€ millions | | Domestic Plans | | | Foreign Plans | | | Other Post-
Employment Plans | |
| | | 2015 | | | 2014 | | | 2015 | | | 2014 | | | 2015 | | | 2014 | |
| Less than a year | | | 19 | | | | 10 | | | | 26 | | | | 23 | | | | 2 | | | | 2 | |
| Between 1 and 2 years | | | 18 | | | | 17 | | | | 43 | | | | 40 | | | | 2 | | | | 2 | |
| Between 2 and 5 years | | | 65 | | | | 56 | | | | 63 | | | | 58 | | | | 8 | | | | 6 | |
| Over 5 years | | | 935 | | | | 983 | | | | 223 | | | | 195 | | | | 28 | | | | 17 | |
| | | | | | | | | | | | | | | | | | | | | | | | |
| Total | | | 1,037 | | | | 1,066 | | | | 355 | | | | 316 | | | | 40 | | | | 27 | |
Defined Contribution Plans/State Plans
We also maintain domestic and foreign defined contribution plans. Amounts contributed by us under such plans are based on a percentage of the employees’ salaries or the amount of contributions made by employees. Furthermore, in Germany and some other countries we make contributions to public pension plans that are operated by national or local government or a similar institution.
Total Expense of Defined Contribution Plans and State Plans
| | | | | | | | | | | | |
€ millions | | 2015 | | | 2014 | | | 2013 | |
| Defined contribution plans | | | 218 | | | | 188 | | | | 182 | |
| State plans | | | 429 | | | | 360 | | | | 316 | |
| | | | | | | | | | | | |
| Total expense | | | 647 | | | | 548 | | | | 498 | |
| | |
| Consolidated Financial Statements IFRSNotes | | 161 |
(18b) Other Provisions
| | | | | | | | | | | | | | | | | | | | | | | | | | | | |
€ millions | | 1/1/ 2015 | | | Addition | | | Accretion | | | Utilization | | | Release | | | Currency
Impact | | | 12/31/ 2015 | |
| Employee-related provisions | | | 47 | | | | 59 | | | | 0 | | | | -46 | | | | -3 | | | | 1 | | | | 58 | |
| Customer-related provisions | | | 39 | | | | 91 | | | | 0 | | | | -71 | | | | -1 | | | | 3 | | | | 61 | |
| Intellectual property-related provisions | | | 12 | | | | 5 | | | | 0 | | | | -1 | | | | -6 | | | | 1 | | | | 11 | |
| Restructuring provisions | | | 60 | | | | 638 | | | | 0 | | | | -496 | | | | -17 | | | | -1 | | | | 184 | |
| Onerous contract provisions (other than from customer contracts) | | | 24 | | | | 1 | | | | 2 | | | | -13 | | | | -1 | | | | 2 | | | | 15 | |
| Other provisions | | | 31 | | | | 3 | | | | 0 | | | | 0 | | | | -2 | | | | 1 | | | | 33 | |
| | | | | | | | | | | | | | | | | | | | | | | | | | | | |
| Total other provisions | | | 213 | | | | 797 | | | | 2 | | | | -627 | | | | -30 | | | | 7 | | | | 362 | |
Thereof current | | | 148 | | | | | | | | | | | | | | | | | | | | | | | | 299 | |
Thereof non-current | | | 65 | | | | | | | | | | | | | | | | | | | | | | | | 63 | |
Intellectual property-related provisions relate to litigation matters. Customer-related provisions relate primarily to disputes with individual customers. Both classes of provision are described inNote (23).
For more information about our restructuring plans, seeNote (6).
The cash outflows associated with employee-related restructuring costs are substantially short-term in nature. In 2015, employees received, under certain restructuring activities, credits to their working time accounts which will allow them to discontinue work earlier than their retirement date. These obligations are classified as employee-related provisions rather than restructuring provisions.
Onerous contract and other provisions comprise facility-related and supplier-related provisions. The timing of these cash outflows associated is dependent on the remaining term of the underlying lease and of the supplier contract.
(19) DEFERRED INCOME
Deferred income consists mainly of prepayments made by our customers for cloud subscriptions and support; software support and services; fees from multiple-element arrangements allocated to undelivered elements; and amounts recorded in purchase accounting at fair value for obligations to perform under acquired contracts in connection with acquisitions.
| | | | | | | | | | | | | | | | | | | | | | | | |
€ millions | | 2015 | | | 2014 | |
| | | Current | | | Non-
Current | | | Total | | | Current | | | Non-
Current | | | Total | |
| Deferred Income | | | 2,001 | | | | 106 | | | | 2,107 | | | | 1,680 | | | | 78 | | | | 1,758 | |
| | | | | | | | | | | | | | | | | | | | | | | | |
Thereof deferred revenue from cloud subscriptions and | | | 957 | | | | 0 | | | | 957 | | | | 689 | | | | 0 | | | | 689 | |
support | | | | | | | | | | | | | | | | | | | | | | | | |
| | |
| Consolidated Financial Statements IFRSNotes | | 162 |
(20) TOTAL EQUITY
Issued Capital
As at December 31, 2015, SAP SE had issued 1,228,504,232 no-par value bearer shares (December 31, 2014: 1,228,504,232) with a calculated nominal value of €1 per share. All the shares issued are fully paid.
Change in Issued Capital and Treasury Shares
| | | | | | | | | | | | | | | | |
| | | Shares (in millions) | | | Value (in € millions) | |
| | | Issued Capital | | | Treasury Shares | | | Issued Capital | | | Treasury Shares | |
| January 1, 2013 | | | 1,229 | | | | -37 | | | | 1,229 | | | | -1,337 | |
| Reissuance of treasury shares under share-based payments | | | 0 | | | | 2 | | | | 0 | | | | 57 | |
| | | | | | | | | | | | | | | | |
| December 31, 2013 | | | 1,229 | | | | -35 | | | | 1,229 | | | | -1,280 | |
| Reissuance of treasury shares under share-based payments | | | 0 | | | | 2 | | | | 0 | | | | 56 | |
| | | | | | | | | | | | | | | | |
| December 31, 2014 | | | 1,229 | | | | -33 | | | | 1,229 | | | | -1,224 | |
| Reissuance of treasury shares under share-based payments | | | 0 | | | | 2 | | | | 0 | | | | 100 | |
| | | | | | | | | | | | | | | | |
| December 31, 2015 | | | 1,229 | | | | -31 | | | | 1,229 | | | | -1,124 | |
Authorized Shares
The Articles of Incorporation authorize the Executive Board to increase the issued capital by:
| ¡ | | Up to a total amount of €250 million by issuing new no-par value bearer shares against contributions in cash until May 19, 2020 (Authorized Capital I). The issuance is subject to the statutory subscription rights of existing shareholders. |
| ¡ | | Up to a total amount of €250 million by issuing new no-par value bearer shares against contributions in cash or in kind until May 19, 2020 (Authorized Capital II). Subject to the consent of the Supervisory Board, the Executive Board is authorized to exclude the shareholders’ statutory subscription rights in certain cases. |
Contingent Shares
SAP SE’s share capital is subject to a contingent capital increase which may be effected only to the extent that the holders or creditors of convertible bonds or stock options issued or guaranteed by SAP SE or any of its directly or indirectly controlled subsidiaries under certain share-based payments exercise their conversion or subscription rights, and no other methods for servicing these rights are used. As at December 31, 2015, €100 million, representing 100 million shares, was still available for issuance (2014: €100 million).
Other Comprehensive Income
Items Recognized in Other Comprehensive Income That Will Be Reclassified to Profit or Loss Before Tax
| | | | | | | | | | | | |
€ millions | | 2015 | | | 2014 | | | 2013 | |
| Gains (losses) on exchange differences | | | 1,845 | | | | 1,161 | | | | -576 | |
| Gains (losses) on remeasuring available-for-sale financial assets | | | 181 | | | | 130 | | | | 79 | |
| Reclassification adjustments on available-for-sale financial assets | | | -53 | | | | -2 | | | | -19 | |
| | | | | | | | | | | | |
| Available-for-sale financial assets | | | 128 | | | | 128 | | | | 60 | |
| Gains (losses) on cash-flow hedges | | | -59 | | | | -41 | | | | 78 | |
| Reclassification adjustments on cash-flow hedges | | | 74 | | | | 3 | | | | -78 | |
| | | | | | | | | | | | |
| Cash-flow hedges | | | 15 | | | | -38 | | | | 0 | |
Treasury Shares
By resolution of SAP SE’s General Meeting of Shareholders held on June 4, 2013, the authorization granted by the General Meeting of Shareholders of June 8, 2010, regarding the acquisition of treasury shares was revoked to the extent it had not been exercised at that time, and replaced by a new authorization of the Executive Board of SAP SE to acquire, on or before June 3, 2018, shares of SAP SE representing a pro rata amount of capital stock of up to €120 million in aggregate,
| | |
| Consolidated Financial Statements IFRSNotes | | 163 |
provided that the shares purchased under the authorization, together with any other shares in the Company previously acquired and held by, or attributable to, SAP SE do not account for more than 10% of SAP SE’s issued share capital. Although treasury shares are legally considered outstanding, there are no dividend or voting rights associated with shares held in treasury. We may redeem or resell shares held in treasury, or we may use treasury shares for the purpose of servicing option or conversion rights under the Company’s share-based payment plans. Also, we may use shares held in treasury as consideration in connection with mergers with, or acquisitions of, other companies.
Dividends
The total dividend available for distribution to SAP SE shareholders is based on the profits of SAP SE as reported in its statutory financial statements prepared under the accounting rules in the German Commercial Code (Handelsgesetzbuch). For the year ended December 31, 2015, the Executive Board intends to propose that a dividend of €1.15 per share (that is, an estimated total dividend of €1,378 million), be paid from the profits of SAP SE.
Dividends per share for 2014 and 2013 were €1.10 and €1.00 respectively and were paid in the succeeding year.
(21) ADDITIONAL CAPITAL DISCLOSURES
Capital Structure Management
The primary objective of our capital structure management is to maintain a strong financial profile for investor, creditor, and customer confidence, and to support the growth of our business. We seek to maintain a capital structure that will allow us to cover our funding requirements through the capital markets at reasonable conditions, and in so doing, ensure a high level of independence, confidence, and financial flexibility.
SAP SE’s long-term credit rating is “A” by Standard and Poor’s and “A2” by Moody’s, both with stable outlook. Since their initial assignment in September 2014, the ratings and outlooks have not changed.
Capital Structure
| | | | | | | | | | | | | | | | | | | | |
| | | 2015 | | | 2014 | | | | |
| | | € millions | | | % of Total equity
and liabilities | | | € millions | | | % of Total equity
and liabilities | | | D in % | |
| Equity | | | 23,295 | | | | 56 | | | | 19,534 | | | | 51 | | | | 19 | |
Current liabilities | | | 7,867 | | | | 19 | | | | 8,574 | | | | 22 | | | | -8 | |
Non-current liabilities | | | 10,228 | | | | 25 | | | | 10,457 | | | | 27 | | | | -2 | |
| Liabilities | | | 18,095 | | | | 44 | | | | 19,031 | | | | 49 | | | | -5 | |
| | | | | | | | | | | | | | | | | | | | |
| Total equity and liabilities | | | 41,390 | | | | 100 | | | | 38,565 | | | | 100 | | | | 7 | |
In 2015, we repaid €1,270 million in bank loans that we had taken to finance the Concur acquisition and refinanced another part of this loan through the issuance of a three-tranche Eurobond of €1.75 billion in total with maturities of two to 10 years. We also repaid a €550 million Eurobond and a US$300 million U.S. private placement tranche at their maturity. Thus, the ratio of total financial debt to total equity and liabilities decreased by seven percentage points to 22% at the end of 2015 (29% as at December 31, 2014).
Total financial debt consists of current and non-current bank loans, bonds, and private placements. For more information about our financial debt, seeNote (17).
As part of our financing activities in 2016, the Company intends to repay a US$600 million U.S. private placement tranche when it matures and a further substantial portion of our outstanding bank loans.
While we continuously monitor the ratios presented in and below the table above, we actively manage our liquidity and structure of our financial indebtedness:
Group Liquidity of SAP Group
| | | | | | | | | | | | |
€ millions | | 2015 | | | 2014 | | | D | |
Cash and cash equivalents | | | 3,411 | | | | 3,328 | | | | 83 | |
Current investments | | | 148 | | | | 95 | | | | 53 | |
| | | | | | | | | | | | |
| Group liquidity | | | 3,559 | | | | 3,423 | | | | 136 | |
Current financial debt | | | -567 | | | | -2,157 | | | | 1,590 | |
| | | | | | | | | | | | |
| Net liquidity 1 | | | 2,992 | | | | 1,266 | | | | 1,726 | |
Non-current financial debt | | | -8,607 | | | | -8,936 | | | | 329 | |
| | | | | | | | | | | | |
| Net liquidity 2 | | | -5,615 | | | | -7,670 | | | | 2,055 | |
| | |
| Consolidated Financial Statements IFRSNotes | | 164 |
Distribution Policy
Our general intention is to remain in a position to return liquidity to our shareholders by distributing annual dividends totaling more than 35% of our profit after tax. There are currently no plans for future share buybacks.
In 2015, we distributed €1,316 million in dividends from our 2014 profit (compared to €1,194 million in 2014 and €1,013 million in
2013 related to 2013 and 2012 profit, respectively), representing €1.10 per share.
As a result of our equity-settled share-based payments transactions (as described inNote (27)), we have commitments to grant SAP shares to employees. We intend to meet these commitments by reissuing treasury shares or issuing ordinary shares. For more information about contingent capital, seeNote (20).
(22) OTHER FINANCIAL COMMITMENTS
| | | | | | | | |
€ millions | | 2015 | | | 2014 | |
| Operating leases | | | 1,347 | | | | 1,332 | |
| Contractual obligations for acquisition of property, plant, and equipment and intangible assets | | | 162 | | | | 111 | |
| Other purchase obligations | | | 710 | | | | 748 | |
| Purchase obligations | | | 872 | | | | 859 | |
| Capital contribution commitments | | | 111 | | | | 77 | |
| | | | | | | | |
| Total | | | 2,330 | | | | 2,268 | |
Our operating leases relate primarily to the lease of office space, hardware, and vehicles, with remaining non-cancelable lease terms between less than one and 33 years. On a limited scale, the operating lease contracts include escalation clauses (based, for example, on the consumer price index) and renewal options. The contractual obligations for acquisition of property, plant, and equipment and intangible assets relate primarily to the construction of new and existing facilities and to the purchase of hardware, software, patents, office equipment, and vehicles. The remaining obligations relate mainly to marketing, consulting, maintenance, license agreements, and other third-party agreements. Historically, the majority of such purchase obligations have been realized.
SAP invests and holds interests in other entities. As of December 31, 2015, total commitments to make such equity investments amounted to €197 million (2014: €123 million) of which €86 million had been drawn (2014: €46 million). By investing in such equity investments, we are exposed to the risks inherent in the business segments in which these entities operate. Our maximum exposure to loss is the amount invested plus unavoidable future capital contributions.
| | | | | | | | | | | | |
€ millions | | December 31, 2015 | |
| | | Operating Leases | | | Purchase Obligations | | | Capital Contribution
Commitments | |
| Due 2016 | | | 294 | | | | 428 | | | | 111 | |
| Due 2017 to 2020 | | | 657 | | | | 378 | | | | 0 | |
| Due thereafter | | | 396 | | | | 66 | | | | 0 | |
| | | | | | | | | | | | |
| Total | | | 1,347 | | | | 872 | | | | 111 | |
Our rental and operating lease expenses were €386 million, €291 million, and €273 million for the years 2015, 2014, and 2013, respectively.
| | |
| Consolidated Financial Statements IFRSNotes | | 165 |
(23) LITIGATION AND CLAIMS
We are subject to a variety of claims and lawsuits that arise from time to time in the ordinary course of our business, including proceedings and claims that relate to companies we have acquired, claims that relate to customers demanding indemnification for proceedings initiated against them based on their use of SAP software, and claims that relate to customers being dissatisfied with the products and services that we have delivered to them. We will continue to vigorously defend against all claims and lawsuits against us. We currently believe that resolving the claims and lawsuits pending as of December 31, 2015, will neither individually nor in the aggregate have a material adverse effect on our business, financial position, profit, or cash flows. Consequently, the provisions recorded for these claims and lawsuits as of December 31, 2015, are neither individually nor in the aggregate material to SAP.
However, the outcome of litigation and claims is intrinsically subject to considerable uncertainty. Management’s view of the litigation may also change in the future. Actual outcomes of litigation and claims may differ from the assessments made by management in prior periods, which could result in a material impact on our business, financial position, profit, cash flows, or reputation. Most of the lawsuits and claims are of a very individual nature and claims are either not quantified by the claimants or claim amounts quantified are, based on historical evidence, not expected to be a good proxy for the expenditure that would be required to settle the case concerned. The specifics of the jurisdictions where most of the claims are located further impair the predictability of the outcome of the cases. Therefore, it is not practicable to reliably estimate the financial effect that these lawsuits and claims would have if SAP were to incur expenditure for these cases.
Among the claims and lawsuits are the following classes:
Intellectual Property-Related Litigation and Claims
Intellectual property-related litigation and claims are cases in which third parties have threatened or initiated litigation claiming that SAP violates one or more intellectual property rights that they possess. Such intellectual property rights may include patents, copyrights, and other similar rights.
The carrying amount of the provisions recognized for intellectual property-related litigation and claims and the change in the carrying amount in the reporting period are disclosed inNote (18b). The expected timing of any resulting outflows of economic benefits from these lawsuits and claims is uncertain and not estimable as it depends generally on the duration of the legal proceedings and settlement negotiations required to resolve them. Uncertainties about the amounts result primarily from the unpredictability of the outcomes of legal disputes in several jurisdictions. For more information, seeNote (3c).
Contingent liabilities exist from intellectual property-related litigation and claims for which no provision has been recognized. Generally, it is not practicable to estimate the financial impact of these contingent liabilities due to the uncertainties around the litigation and claims, as outlined above. The total amounts claimed by plaintiffs in those intellectual property-related lawsuits or claims in which a claim has been quantified were not material to us as of December 31, 2015 and 2014. Based on our past experience, most of the intellectual property-related litigation and claims tend to be either dismissed in court or settled out of court for amounts significantly below the originally claimed amounts and not material to our consolidated financial statements. Only a few cases (specifically the TomorrowNow and the Versata litigation) ultimately resulted in a significant cash outflow in 2014.
The individual cases of intellectual property-related litigation and claims are:
In April 2007, United States-based Versata Software, Inc. (formerly Trilogy Software, Inc.) (Versata) instituted legal proceedings in the United States District Court for the Eastern District of Texas against SAP. Versata alleged that SAP’s products infringe one or more of the claims in patents held by Versata. In August 2014, after numerous legal proceedings (for details, see our 2014 Integrated Report, Notes to the Consolidated Financial Statements section,Note (24)), Versata and SAP entered into a Patent License and Settlement Agreement (the “Agreement”) to settle the patent litigation between the companies. Under the terms of the Agreement, Versata has licensed to SAP certain patents in exchange for a one-time cash payment and a potential additional contingent payment. Such contingent payment is not material to SAP. The Agreement also provides for general releases, indemnification for its violation, and dismisses the existing litigation with prejudice.
In February 2010, United States-based TecSec, Inc. (TecSec) instituted legal proceedings in the United States against SAP (including its subsidiary Sybase) and many other defendants. TecSec alleged that SAP’s and Sybase’s products infringe one or more of the claims in five patents held by TecSec. In its complaint, TecSec seeks unspecified monetary damages and permanent injunctive relief. The lawsuit is proceeding but only with respect to one defendant. The trial for SAP (including its subsidiary Sybase) has not yet been scheduled – the lawsuit for SAP (including its subsidiary Sybase) remains stayed.
In April 2010, SAP instituted legal proceedings (a declaratory judgment action) in the United States against Wellogix, Inc. and Wellogix Technology Licensing, LLC (Wellogix). The lawsuit seeks a declaratory judgment that five patents owned by Wellogix are invalid or not infringed by SAP. The trial has not yet been scheduled. The legal proceedings have been stayed pending the outcome of six reexaminations filed with the United States Patent and Trademark Office (USPTO). In September
| | |
| Consolidated Financial Statements IFRSNotes | | 166 |
2013, the USPTO issued a decision on four of the six reexaminations, invalidating every claim of each of the four patents. SAP is awaiting a decision on the two remaining reexamination requests. In response to SAP’s patent Declaratory Judgment action, Wellogix has re-asserted trade secret misappropriation claims against SAP (which had previously been raised and abandoned). The court granted SAP’s motion for an early dispositive decision on the trade secret claims; Wellogix’s appeal of that decision is pending. In
February 2015, SAP filed a declaratory judgment action in Frankfurt/Main, Germany, asking the German court to rule that SAP did not misappropriate any Wellogix trade secrets.
Customer-Related Litigation and Claims
Customer-related litigation and claims include cases in which we indemnify our customers against liabilities arising from a claim that our products infringe a third party’s patent, copyright, trade secret, or other proprietary rights. Occasionally, consulting or software implementation projects result in disputes with customers. Where customers are dissatisfied with the products and services that we have delivered to them in routine consulting contracts or development arrangements, we may grant functions or performance guarantees.
The carrying amount of the provisions recorded for customer-related litigation and claims and the development of the carrying amount in the reporting period are disclosed inNote (18b). The expected timing or amounts of any resulting outflows of economic benefits from these lawsuits and claims is uncertain and not estimable as they generally depend on the duration of the legal proceedings and settlement negotiations required to resolve the litigation and claims and the unpredictability of the outcomes of legal disputes in several jurisdictions. For more information, seeNote (3c).
Contingent liabilities exist from customer-related litigation and claims for which no provision has been recognized. Generally, it is not practicable to estimate the financial impact of these contingent liabilities due to the uncertainties around these lawsuits and claims outlined above.
Non-Income Tax-Related Litigation and Claims
We are subject to ongoing audits by domestic and foreign tax authorities. Along with many other companies operating in Brazil, we are involved in various proceedings with Brazilian authorities regarding assessments and litigation matters on non-income taxes on intercompany royalty payments and intercompany services. The total potential amount related to these matters for all applicable years is approximately €75 million. We have not recorded a provision for these matters, as we believe that we will prevail.
For more information about income tax-related litigation, seeNote (10).
(24) FINANCIAL RISK FACTORS
We are exposed to various financial risks, such as market risks (including foreign currency exchange rate risk, interest-rate risk, and equity price risk), credit risk, and liquidity risk.
Market Risk
a) Foreign Currency Exchange Rate Risk
As we are active worldwide, our ordinary operations are subject to risks associated with fluctuations in foreign currencies. Since the Group’s entities mainly conduct their operating business in their own functional currencies, our risk of exchange rate fluctuations from ongoing ordinary operations is not considered significant. However, we occasionally generate foreign currency-denominated receivables, payables, and other monetary items by transacting in a currency other than the functional currency. To mitigate the extent of the associated foreign currency exchange rate risk, the majority of these transactions are hedged as described inNote (25).
In rare circumstances, transacting in a currency other than the functional currency also leads to embedded foreign currency derivatives being separated and measured at fair value through profit or loss.
In addition, the intellectual property (IP) holders in the SAP Group are exposed to risks associated with forecasted intercompany cash flows in foreign currencies. These cash flows arise out of royalty payments from subsidiaries to the respective IP holder. The royalties are linked to the subsidiaries’ external revenue. This arrangement leads to a concentration of the foreign currency exchange rate risk with the IP holders, as the royalties are mostly denominated in the subsidiaries’ local currencies, while the functional currency of the IP holders with the highest royalty volume is the euro. The highest foreign currency exchange rate exposure of this kind relates to the currencies of subsidiaries with significant operations, for example the U.S. dollar, the pound sterling, the Japanese yen, the Swiss franc, the Brazilian real, and the Australian dollar.
Generally, we are not exposed to any significant foreign currency exchange rate risk with regard to our investing and financing activities, as such activities are normally conducted in the functional currency of the investing or borrowing entity. However, we were exposed to a cash flow risk from the consideration to be paid in U.S. dollars for the acquisition of Concur and Fieldglass in 2014, as the funds were provided through our free cash and acquisition term loans, both mostly generated in euros. For more information, seeNote (25).
| | |
| Consolidated Financial Statements IFRSNotes | | 167 |
b) Interest-Rate Risk
We are exposed to interest-rate risk as a result of our investing and financing activities mainly in euros and U.S. dollars as follows:
| | | | | | | | | | | | | | | | |
| € millions | | 2015 | | | 2014 | |
| | | Cash Flow Risk | | | Fair Value Risk | | | Cash Flow Risk | | | Fair Value Risk | |
| Investing activities | | | 3,078 | | | | 480 | | | | 2,445 | | | | 1,003 | |
| Financing activities | | | 3,157 | | | | 6,038 | | | | 5,009 | | | | 6,077 | |
c) Equity Price Risk
We are exposed to equity price risk with regard to our investments in listed equity securities (2015: €320 million; 2014: €209 million) and our share-based payments (for the exposure from these plans, seeNote (27)).
Credit Risk
To reduce the credit risk in investments, we arrange to receive rights to collateral for certain investing activities in the full amount of the investment volume, which we would be allowed to make use of only in the case of default of the counterparty to the investment. In the absence of other significant agreements to reduce our credit risk exposure, the total amounts recognized as cash and cash equivalents, current investments, loans and other financial receivables, trade receivables, and derivative financial assets represent our maximum exposure to credit risks, except for the agreements mentioned above.
Liquidity Risk
The table below is an analysis of the remaining contractual maturities of all our financial liabilities held at December 31, 2015. Financial liabilities for which repayment can be requested by the contract partner at any time are assigned to the earliest possible period. Variable interest payments were calculated using the latest relevant interest rate fixed as at December 31, 2015. As we generally settle our derivative contracts gross, we show the pay and receive legs separately for all our currency and interest-rate derivatives, whether or not the fair value of the derivative is negative, except for the derivative forward contracts entered into in connection with the acquisition of Concur, where we bought and sold US$8.5 billion because we settled those net. The cash outflows for the currency derivatives are translated using the applicable forward rate.
For more information about the cash flows for unrecognized but contractually agreed financial commitments, seeNote (22).
Contractual Maturities of Non-Derivative Financial Liabilities
| | | | | | | | | | | | | | | | | | | | | | | | | | | | |
€ millions | | Carrying
Amount | | | | | | | | | | | | | | | Contractual Cash Flows | |
| | | 12/31/2015 | | | 2016 | | | 2017 | | | 2018 | | | 2019 | | | 2020 | | | Thereafter | |
| Trade payables | | | -893 | | | | -893 | | | | 0 | | | | 0 | | | | 0 | | | | 0 | | | | 0 | |
| Financial liabilities | | | -9,395 | | | | -863 | | | | -2,778 | | | | -980 | | | | -836 | | | | -986 | | | | -3,683 | |
| | | | | | | | | | | | | | | | | | | | | | | | | | | | |
| Total of non-derivative financial liabilities | | | -10,288 | | | | -1,756 | | | | -2,778 | | | | -980 | | | | -836 | | | | -986 | | | | -3,683 | |
| | | | | | |
€ millions | | Carrying
Amount | | | | | | | | | | | | | | | Contractual Cash Flows | |
| | | 12/31/2014 | | | 2015 | | | 2016 | | | 2017 | | | 2018 | | | 2019 | | | Thereafter | |
| Trade payables | | | -782 | | | | -782 | | | | 0 | | | | 0 | | | | 0 | | | | 0 | | | | 0 | |
| Financial liabilities | | | -11,209 | | | | -2,377 | | | | -625 | | | | -3,976 | | | | -958 | | | | -827 | | | | -3,262 | |
| | | | | | | | | | | | | | | | | | | | | | | | | | | | |
| Total of non-derivative financial liabilities | | | -11,990 | | | | -3,159 | | | | -625 | | | | -3,976 | | | | -958 | | | | -827 | | | | -3,262 | |
| | |
| Consolidated Financial Statements IFRSNotes | | 168 |
Contractual Maturities of Derivative Financial Liabilities and Financial Assets
| | | | | | | | | | | | | | | | | | | | | | | | |
€ millions | | Carrying
Amount | | | Contractual Cash
Flows | | | Carrying
Amount | | | Contractual Cash
Flows | |
| | | 12/31/2015 | | | 2016 | | | Thereafter | | | 12/31/2014 | | | 2015 | | | Thereafter | |
| Derivative financial liabilities | | | | | | | | | | | | | | | | | | | | | | | | |
Currency derivatives not designated as hedging instruments | | | -117 | | | | | | | | | | | | -310 | | | | | | | | | |
Cash outflows | | | | | | | -2,896 | | | | -58 | | | | | | | | -4,110 | | | | -44 | |
Cash inflows | | | | | | | 2,834 | | | | 0 | | | | | | | | 3,836 | | | | 0 | |
Currency derivatives designated as hedging instruments | | | -10 | | | | | | | | | | | | -22 | | | | | | | | | |
Cash outflows | | | | | | | -489 | | | | 0 | | | | | | | | -487 | | | | 0 | |
Cash inflows | | | | | | | 475 | | | | 0 | | | | | | | | 464 | | | | 0 | |
Interest-rate derivatives designated as hedging instruments | | | 0 | | | | | | | | | | | | -1 | | | | | | | | | |
Cash outflows | | | | | | | 0 | | | | 0 | | | | | | | | -7 | | | | -24 | |
Cash inflows | | | | | | | 0 | | | | 0 | | | | | | | | 9 | | | | 19 | |
| | | | | | | | | | | | | | | | | | | | | | | | |
| Total of derivative financial liabilities | | | -128 | | | | -76 | | | | -58 | | | | -333 | | | | -295 | | | | -49 | |
| Derivative financial assets | | | | | | | | | | | | | | | | | | | | | | | | |
Currency derivatives not designated as hedging instruments | | | 69 | | | | | | | | | | | | 411 | | | | | | | | | |
Cash outflows | | | | | | | -3,010 | | | | 0 | | | | | | | | -1,236 | | | | 0 | |
Cash inflows | | | | | | | 3,073 | | | | 0 | | | | | | | | 1,656 | | | | 0 | |
Currency derivatives designated as hedging instruments | | | 14 | | | | | | | | | | | | 10 | | | | | | | | | |
Cash outflows | | | | | | | -266 | | | | 0 | | | | | | | | -162 | | | | 0 | |
Cash inflows | | | | | | | 275 | | | | 0 | | | | | | | | 163 | | | | 0 | |
Interest-rate derivatives designated as hedging instruments | | | 100 | | | | | | | | | | | | 77 | | | | | | | | | |
Cash outflows | | | | | | | -43 | | | | -225 | | | | | | | | -34 | | | | -293 | |
Cash inflows | | | | | | | 77 | | | | 300 | | | | | | | | 62 | | | | 313 | |
| | | | | | | | | | | | | | | | | | | | | | | | |
| Total of derivative financial assets | | | 183 | | | | 106 | | | | 75 | | | | 498 | | | | 449 | | | | 20 | |
| | | | | | | | | | | | | | | | | | | | | | | | |
| Total of derivative financial liabilities and assets | | | 55 | | | | 30 | | | | 17 | | | | 165 | | | | 154 | | | | -29 | |
(25) FINANCIAL RISK MANAGEMENT
We manage market risks (including foreign currency exchange rate risk, interest-rate risk, and equity price risk), credit risk, and liquidity risk on a Group-wide basis through our global treasury department. Our risk management and hedging strategy is set by our treasury guideline and other internal guidelines, and is subject to continuous internal risk analysis. Derivative financial instruments are only purchased to reduce risks and not for speculation, which is defined as entering into derivative instruments without a corresponding underlying transaction.
In the following sections we provide details on the management of each respective financial risk and our related risk exposure. In the sensitivity analyses that show the effects of hypothetical changes of relevant risk variables on profit or other comprehensive income, we determine the periodic effects by relating the hypothetical changes in the risk variables to the balance of financial instruments at the reporting date.
Foreign Currency Exchange Rate Risk Management
We continually monitor our exposure to currency fluctuation risks based on monetary items and forecasted transactions and pursue a Group-wide strategy to manage foreign currency exchange rate risk, using derivative financial instruments, primarily foreign exchange forward contracts, as appropriate, with the primary aim of reducing profit or loss volatility.
Currency Hedges Not Designated as Hedging Instruments
The foreign exchange forward contracts we enter into to offset exposure relating to foreign-currency denominated monetary assets and liabilities are not designated as being in a hedge accounting relationship, seeNote (3a).
| | |
| Consolidated Financial Statements IFRSNotes | | 169 |
Currency hedges not designated as hedging instruments also include foreign currency derivatives embedded in non-derivative host contracts that are separated and accounted for as derivatives according to the requirements of IAS 39 (Financial Instruments: Recognition and Measurement).
In addition, during 2014 we held foreign exchange forward contracts and foreign currency options to hedge the cash flow risk from the consideration paid in U.S. dollars for the acquisition of Concur.
Currency Hedges Designated as Hedging Instruments (Cash Flow Hedges)
We enter into derivative financial instruments, primarily foreign exchange forward contracts, to hedge significant forecasted cash flows (royalties) from foreign subsidiaries denominated in foreign currencies with a defined set of hedge ratios and a hedge horizon of up to 12 months. Specifically, we exclude the interest component and only designate the spot rate of the foreign exchange forward contracts as the hedging instrument to offset anticipated cash flows relating to the subsidiaries with significant operations. We generally use foreign exchange derivatives that have maturities of 12 months or less, which may be rolled over to provide continuous coverage until the applicable royalties are received.
For the years ended December 31, 2015 and 2014, no previously highly probable transaction designated as a hedged item in a foreign currency cash flow hedge relationship ceased to be probable. Therefore, we did not discontinue any of our cash flow hedge relationships. Also, we identified no ineffectiveness in all years reported. Generally, the cash flows of the hedged forecasted transactions are expected to occur and to be recognized in profit or loss monthly within a time frame of 12 months from the date of the statement of financial position.
Foreign Currency Exchange Rate Exposure
In line with our internal risk reporting process, we use the cash flow-at-risk method to quantify our risk positions with regard to our forecasted intercompany transactions and value-at-risk for our foreign-currency denominated financial instruments. In order not to provide two different methodologies, we have opted to disclose our risk exposure based on a sensitivity analysis considering the following:
| ¡ | | The SAP Group’s entities generally operate in their functional currencies. In exceptional cases and limited economic environments, operating transactions are denominated in currencies other than the functional currency, leading to a foreign currency exchange rate risk for the related monetary instruments. Where material, this foreign currency exchange rate risk is hedged. Therefore, fluctuations in foreign currency exchange rates neither have a significant impact on profit nor on other comprehensive income with regard to our non-derivative monetary financial instruments and related income or expenses. |
| ¡ | | Our free-standing derivatives designed for hedging foreign currency exchange rate risks almost completely balance the changes in the fair values of the hedged item attributable to exchange rate movements in the Consolidated Income Statements in the same period. As a consequence, the hedged items and the hedging instruments are not exposed to foreign currency exchange rate risks, and thereby have no effect on profit. |
Consequently, we are only exposed to significant foreign currency exchange rate fluctuations with regard to the following:
| ¡ | | Derivatives held within a designated cash flow hedge relationship (excluding the interest element, which is not part of the assigned cash flow hedge relationships) affecting other comprehensive income |
| ¡ | | Foreign currency embedded derivatives affecting other non-operating expense, net. |
We calculate our sensitivity on an upward/downward shift of +/–25% of the foreign currency exchange rate between euro and Brazil real and +/–10% of the foreign currency exchange rate between euro and all other major currencies (2014: upward shift for Swiss franc +20%, all other major currencies +10%, downward shift for all major currencies –10%; 2013: upward/downward shift of +/–10% for all major currencies). If on December 31, 2015, 2014, and 2013, the foreign currency exchange rates had been higher/lower as described above, this would not have had a material effect on other non-operating expense, net and other comprehensive income.
Our foreign currency exposure as at December 31 (and if year-end exposure is not representative, also our average/high/low exposure) was as follows:
Foreign Currency Exposure
| | | | | | | | |
€ billions | | 2015 | | | 2014 | |
| Year-end exposure toward all our major currencies | | | 1.0 | | | | 1.0 | |
| Average exposure | | | 1.1 | | | | 2.7 | |
| Highest exposure | | | 1.2 | | | | 7.7 | |
| Lowest exposure | | | 1.0 | | | | 1.0 | |
During 2015, our sensitivity to foreign currency exchange rate fluctuations decreased compared to the year ended December 31, 2014, mainly due to the hedging transactions for the acquisition of Concur in 2014.
Interest-Rate Risk Management
The aim of our interest-rate risk management is to reduce profit or loss volatility and optimize our interest result by creating a balanced structure of fixed and variable cash flows. We therefore manage interest-rate risks by adding interest-rate- related derivative instruments to a given portfolio of investments and debt financing.
| | |
| Consolidated Financial Statements IFRSNotes | | 170 |
Derivatives Designated as Hedging Instruments (Fair Value Hedges)
The majority of our investments are based on variable rates and/or short maturities (2015: 87%; 2014: 71%) while most of our financing transactions are based on fixed rates and long maturities (2015: 66%; 2014: 55%). To match the interest-rate risk from our financing transactions to our investments, we use receiver interest-rate swaps to convert certain fixed rate financial liabilities to floating, and by this means secure the fair value of the swapped financing transactions. The desired fix-floating mix of our net debt is set by the Treasury Committee. Including interest-rate swaps, 36% (2014: 30%) of our total interest-bearing financial liabilities outstanding as at December 31, 2015, had a fixed interest rate.
None of the fair value adjustment from the receiver swaps, the basis adjustment on the underlying hedged items held in fair value hedge relationships, and the difference between the two recognized in financial income, net is material in any of the years presented.
Interest-Rate Exposure
A sensitivity analysis is provided to show the impact of our interest-rate risk exposure on profit or loss and equity in accordance with IFRS 7, considering the following:
| ¡ | | Changes in interest rates only affect the accounting for non-derivative fixed rate financial instruments if they are recognized at fair value. Therefore, such interest-rate changes do not change the carrying amounts of our non-derivative fixed rate financial liabilities as we account for them at amortized cost. Investments in fixed rate financial assets classified as available-for-sale were not material at each year end reported. Thus, we do not consider any fixed rate instruments in the equity-related sensitivity calculation. |
| ¡ | | Income or expenses recorded in connection with non-derivative financial instruments with variable interest rates are subject to interest-rate risk if they are not hedged items in an effective hedge relationship. Thus, we take into consideration interest-rate changes relating to our variable rate financing and our investments in money market instruments in the profit-related sensitivity calculation. |
The designation of interest-rate receiver swaps in a fair value hedge relationship leads to interest-rate changes affecting financial income, net. The fair value movements related to the interest-rate swaps are not reflected in the sensitivity calculation, as they offset the fixed interest-rate payments for the bonds and private placements as hedged items. However, changes in market interest rates affect the amount of interest payments from the interest-rate swap. As a consequence, those effects of market interest rates on interest payments are included in the profit-related sensitivity calculation.
Due to the different interest-rate expectations for the U.S. dollar and the euro area, we base our sensitivity analyses on a yield curve upward shift of +100/+50 basis points for the U.S. dollar/euro area (2014: +100/+50 basis points for the U.S. dollar/euro area; 2013: +100 bps) and a yield curve downward shift of -50 basis points for both the U.S. dollar/euro area (2014: -50 bps; 2013: -20 bps).
If, on December 31, 2015, 2014, and 2013, interest rates had been higher/lower as described above, this would not have had a material effect on financial income, net for our variable interest-rate investments and would have had the following effects on financial income, net.
Interest-Rate Sensitivity
| | | | | | | | | | | | |
€ millions | | Effects on Financial Income, Net | |
| | | 2015 | | | 2014 | | | 2013 | |
| Derivatives held within a designated fair value hedge relationship | | | | | | | | |
Interest rates +100 bps in U.S. dollar area/+50 bps in euro area (2014: +100 bps in U.S. dollar area/+50 bps in euro area; 2013: +100 bps in U.S. dollar/euro area) | | | -105 | | | | -116 | | | | -24 | |
Interest rates -50 bps in U.S. dollar/euro area (2014: -50 bps in U.S. dollar/euro area; 2013: -20 bps in U.S. dollar/euro area) | | | 62 | | | | 70 | | | | 5 | |
| Variable rate financing | | | | | | | | | | | | |
Interest rates +50 bps in euro area | | | -39 | | | | -65 | | | | 0 | |
Interest rates -50 bps in euro area | | | 19 | | | | 65 | | | | 0 | |
| | |
| Consolidated Financial Statements IFRSNotes | | 171 |
Our interest-rate exposure as at December 31 (and if year-end exposure is not representative, also our average/high/low exposure) was as follows:
Interest-Rate Risk Exposure
| | | | | | | | | | | | | | | | | | | | | | | | | | | | | | | | |
€ billion | | 2015 | | | 2014 | |
| | | Year-End | | | Average | | | High | | | Low | | | Year-End | | | Average | | | High | | | Low | |
| Fair value interest-rate risk | | | | | | | | | | | | | | | | | | | | | | | | | | | | | | | | |
From investments | | | 0.03 | | | | 0.05 | | | | 0.07 | | | | 0.03 | | | | 0.04 | | | | 0.05 | | | | 0.08 | | | | 0.04 | |
| Cash flow interest-rate risk | | | | | | | | | | | | | | | | | | | | | | | | | | | | | | | | |
From investments (including cash) | | | 3.08 | | | | 3.09 | | | | 3.37 | | | | 2.62 | | | | 2.45 | | | | 2.48 | | | | 2.74 | | | | 2.13 | |
From financing | | | 3.16 | | | | 3.73 | | | | 4.63 | | | | 3.16 | | | | 5.03 | | | | 0.75 | | | | 5.03 | | | | 0 | |
From interest-rate swaps | | | 2.69 | | | | 2.67 | | | | 2.74 | | | | 2.64 | | | | 2.55 | | | | 2.44 | | | | 2.55 | | | | 2.39 | |
Equity Price Risk Management
Our investments in equity instruments with quoted market prices in active markets (2015: €320 million; 2014: €209 million) are monitored based on the current market value that is affected by the fluctuations in the volatile stock markets worldwide. An assumed 20% increase (decrease) in equity prices as at December 31, 2015 (2014), would not have a material impact on the value of our investments in marketable equity securities and the corresponding entries in other comprehensive income.
We are exposed to equity price risk with regard to our share-based payments. In order to reduce resulting profit or loss volatility, we hedge certain cash flow exposures associated with these plans through the purchase of derivative instruments, but do not establish a designated hedge relationship. In our sensitivity analysis we include the underlying share-based payments and the hedging instruments. Thus, we base the calculation on our net exposure to equity prices as we believe taking only the derivative instrument into account would not properly reflect our equity price risk exposure. An assumed 20% increase (decrease) in equity prices as at December 31, 2015, would have increased (decreased) our share-based payment expenses by €200 million (€198 million) (2014: increased by €158 million (decreased by €80 million); 2013: increased by €126 million (decreased by €90 million)).
Credit Risk Management
To mitigate the credit risk from our investing activities and derivative financial assets, we conduct all our activities only with approved major financial institutions and issuers that carry high external ratings, as required by our internal treasury guideline. Among its stipulations, the guideline requires that we invest only in assets from issuers with a minimum rating of at least “BBB flat”. We only make investments in issuers with a lower rating in exceptional cases. Such investments were not material in 2015. The weighted average rating of our financial assets is in the range A+ to A. We pursue a policy of cautious investments characterized by predominantly current investments, standard investment instruments, as well as a wide portfolio diversification by doing business with a variety of counterparties.
To further reduce our credit risk, we require collateral for certain investments in the full amount of the investment volume which we would be allowed to make use of in the case of default of the counterparty to the investment. As such collateral, we only accept bonds with at least investment grade rating level.
In addition, the concentration of credit risk that exists when counterparties are involved in similar activities by instrument, sector, or geographic area is further mitigated by diversification of counterparties throughout the world and adherence to an internal limit system for each counterparty. This internal limit system stipulates that the business volume with individual counterparties is restricted to a defined limit, which depends on the lowest official long-term credit rating available by at least one of the major rating agencies, the Tier 1 capital of the respective financial institution, or participation in the German Depositors’ Guarantee Fund or similar protection schemes. We continuously monitor strict compliance with these counterparty limits. As the premium for credit default swaps mainly depends on market participants’ assessments of the creditworthiness of a debtor, we also closely observe the development of credit default swap spreads in the market to evaluate probable risk developments to timely react to changes if these should manifest.
The default risk of our trade receivables is managed separately, mainly based on assessing the creditworthiness of customers through external ratings and our past experience with the customers concerned. Outstanding receivables are continuously monitored locally. For more information, seeNote (3). The impact of default on our trade receivables from individual customers is mitigated by our large customer base and its distribution across many different industries, company sizes, and countries worldwide. For more information about our trade receivables, seeNote (13). For information about the maximum exposure to credit risk, seeNote (24).
| | |
| Consolidated Financial Statements IFRSNotes | | 172 |
Liquidity Risk Management
Our liquidity is managed by our global treasury department with the primary aim of maintaining liquidity at a level that is adequate to meet our financial obligations.
Generally, our primary source of liquidity is funds generated from our business operations. The majority of our subsidiaries pool their cash surplus to our global treasury department, which then arranges to fund other subsidiaries’ requirements or invest any net surplus in the market. With this strategy we seek to optimize yields, while ensuring liquidity, by investing only with counterparties and issuers of high credit quality, as explained above. Hence, high levels of liquid assets and marketable securities provide a strategic reserve, helping keep SAP flexible, sound, and independent.
Apart from effective working capital and cash management, we have reduced the liquidity risk inherent in managing our day-to-day operations and meeting our financing responsibilities by arranging an adequate volume of available credit facilities with various financial institutions on which we can draw if necessary.
In order to retain high financial flexibility, on November 13, 2013, SAP SE entered into a €2.0 billion syndicated credit facility agreement with an initial term of five years plus two one-year extension options. In 2015, the original term of this facility was extended for an additional period of one year to November 2020. The use of the facility is not restricted by any financial covenants. Borrowings under the facility bear interest of EURIBOR or LIBOR for the respective currency plus a margin of 22.5 basis points. We are also required to pay a commitment fee of 7.88 basis points per annum on the unused available credit. We have never drawn on the facility.
Additionally, as at December 31, 2015, and 2014, SAP SE had available lines of credit totaling €471 million and €471 million, respectively. As at December 31, 2015, and 2014, there were no borrowings outstanding under these lines of credit.
(26) ADDITIONAL FAIR VALUE DISCLOSURES ON FINANCIAL INSTRUMENTS
Fair Value of Financial Instruments
We use various types of financial instrument in the ordinary course of business, which are classified as either: loans and receivables (L&R), available-for-sale (AFS), held-for-trading (HFT), or amortized cost (AC). For those financial instruments measured at fair value or for which fair value must be disclosed, we have categorized the financial instruments into a three-level fair value hierarchy depending on the inputs used to determine fair value and their significance for the valuation techniques.
| | |
| Consolidated Financial Statements IFRSNotes | | 173 |
Fair Values of Financial Instruments and Classification Within the Fair Value Hierarchy
| | | | | | | | | | | | | | | | | | | | | | | | | | | | | | |
€ millions | | | | December 31, 2015 | |
| | | | | Carrying Amount | | | Measurement Categories | | | Fair Value | |
| | | Category | | | | | At
Amortized
Cost | | | At Fair
Value | | | Level 1 | | | Level 2 | | | Level 3 | | | Total | |
| Assets | | | | | | | | | | | | | | | | | | | | | | | | | | | | | | |
Cash and cash equivalents1) | | L&R | | | 3,411 | | | | 3,411 | | | | | | | | | | | | | | | | | | | | | |
Trade and other receivables | | | | | 5,362 | | | | | | | | | | | | | | | | | | | | | | | | | |
Trade receivables1) | | L&R | | | 5,199 | | | | 5,199 | | | | | | | | | | | | | | | | | | | | | |
Other receivables2) | | – | | | 163 | | | | | | | | | | | | | | | | | | | | | | | | | |
| Other financial assets | | | | | 1,687 | | | | | | | | | | | | | | | | | | | | | | | | | |
Available-for-sale financial assets | | | | | | | | | | | | | | | | | | | | | | | | | | | | | | |
Debt investments | | AFS | | | 26 | | | | | | | | 26 | | | | 26 | | | | | | | | | | | | 26 | |
Equity investments | | AFS | | | 882 | | | | | | | | 882 | | | | 299 | | | | 21 | | | | 562 | | | | 882 | |
Investments in associates2) | | – | | | 58 | | | | | | | | | | | | | | | | | | | | | | | | | |
Loans and other financial receivables | | | | | | | | | | | | | | | | | | | | | | | | | | | | | | |
Financial instruments related to employee benefit plans2) | | – | | | 121 | | | | | | | | | | | | | | | | | | | | | | | | | |
Other loans and other financial receivables | | L&R | | | 316 | | | | 316 | | | | | | | | | | | | 316 | | | | | | | | 316 | |
Derivative assets | | | | | | | | | | | | | | | | | | | | | | | | | | | | | | |
Designated as hedging instrument | | | | | | | | | | | | | | | | | | | | | | | | | | | | | | |
FX forward contracts | | – | | | 14 | | | | | | | | 14 | | | | | | | | 14 | | | | | | | | 14 | |
Interest-rate swaps | | – | | | 100 | | | | | | | | 100 | | | | | | | | 100 | | | | | | | | 100 | |
Not designated as hedging instrument | | | | | | | | | | | | | | | | | | | | | | | | | | | | | | |
FX forward contracts | | HFT | | | 69 | | | | | | | | 69 | | | | | | | | 69 | | | | | | | | 69 | |
Call options for share-based payments | | HFT | | | 94 | | | | | | | | 94 | | | | | | | | 94 | | | | | | | | 94 | |
Call option on equity shares | | HFT | | | 6 | | | | | | | | 6 | | | | | | | | | | | | 6 | | | | 6 | |
| Liabilities | | | | | | | | | | | | | | | | | | | | | | | | | | | | | | |
| Trade and other payables | | | | | -1,169 | | | | | | | | | | | | | | | | | | | | | | | | | |
Trade payables1) | | AC | | | -893 | | | | -893 | | | | | | | | | | | | | | | | | | | | | |
Other payables2) | | – | | | -276 | | | | | | | | | | | | | | | | | | | | | | | | | |
| Financial liabilities | | | | | -9,522 | | | | | | | | | | | | | | | | | | | | | | | | | |
Non-derivative financial liabilities | | | | | | | | | | | | | | | | | | | | | | | | | | | | | | |
Loans | | AC | | | -1,261 | | | | -1,261 | | | | | | | | | | | | -1,261 | | | | | | | | -1,261 | |
Bonds | | AC | | | -5,733 | | | | -5,733 | | | | | | | | -5,825 | | | | | | | | | | | | -5,825 | |
Private placements | | AC | | | -2,202 | | | | -2,202 | | | | | | | | | | | | -2,288 | | | | | | | | -2,288 | |
Other non-derivative financial liabilities | | AC | | | -199 | | | | -199 | | | | | | | | | | | | -199 | | | | | | | | -199 | |
Derivatives | | | | | | | | | | | | | | | | | | | | | | | | | | | | | | |
Designated as hedging instrument | | | | | | | | | | | | | | | | | | | | | | | | | | | | | | |
FX forward contracts | | – | | | -10 | | | | | | | | -10 | | | | | | | | -10 | | | | | | | | -10 | |
Interest-rate swaps | | – | | | 0 | | | | | | | | 0 | | | | | | | | 0 | | | | | | | | 0 | |
Not designated as hedging instrument | | | | | | | | | | | | | | | | | | | | | | | | | | | | | | |
FX forward contracts | | HFT | | | -117 | | | | | | | | -117 | | | | | | | | -117 | | | | | | | | -117 | |
| | | | | | | | | | | | | | | | | | | | | | | | | | | | | | |
| Total financial instruments, net | | | | | -232 | | | | -1,361 | | | | 1,064 | | | | -5,500 | | | | -3,261 | | | | 568 | | | | -8,192 | |
| | |
| Consolidated Financial Statements IFRSNotes | | 174 |
Fair Values of Financial Instruments and Classification Within the Fair Value Hierarchy
| | | | | | | | | | | | | | | | | | | | | | | | | | | | | | |
€ millions | | | | December 31, 2014 | |
| | | | | Carrying Amount | | | Measurement Categories | | | Fair Value | |
| | | Category | | | | | At
Amortized
Cost | | | At Fair
Value | | | Level 1 | | | Level 2 | | | Level 3 | | | Total | |
| Assets | | | | | | | | | | | | | | | | | | | | | | | | | | | | | | |
| Cash and cash equivalents1) | | L&R | | | 3,328 | | | | 3,328 | | | | | | | | | | | | | | | | | | | | | |
| Trade and other receivables | | | | | 4,443 | | | | | | | | | | | | | | | | | | | | | | | | | |
Trade receivables1) | | L&R | | | 4,255 | | | | 4,255 | | | | | | | | | | | | | | | | | | | | | |
Other receivables2) | | – | | | 188 | | | | | | | | | | | | | | | | | | | | | | | | | |
| Other financial assets | | | | | 1,699 | | | | | | | | | | | | | | | | | | | | | | | | | |
Available-for-sale financial assets | | | | | | | | | | | | | | | | | | | | | | | | | | | | | | |
Debt investments | | AFS | | | 40 | | | | | | | | 40 | | | | 40 | | | | | | | | | | | | 40 | |
Equity investments | | AFS | | | 597 | | | | | | | | 597 | | | | 108 | | | | 101 | | | | 388 | | | | 597 | |
Investments in associates2) | | – | | | 49 | | | | | | | | | | | | | | | | | | | | | | | | | |
Loans and other financial receivables | | | | | | | | | | | | | | | | | | | | | | | | | | | | | | |
Financial instruments related to employee benefit plans2) | | – | | | 136 | | | | | | | | | | | | | | | | | | | | | | | | | |
Other loans and other financial receivables | | L&R | | | 324 | | | | 324 | | | | | | | | | | | | 324 | | | | | | | | 324 | |
Derivative assets | | | | | | | | | | | | | | | | | | | | | | | | | | | | | | |
Designated as hedging instrument | | | | | | | | | | | | | | | | | | | | | | | | | | | | | | |
FX forward contracts | | – | | | 10 | | | | | | | | 10 | | | | | | | | 10 | | | | | | | | 10 | |
Interest-rate swaps | | – | | | 77 | | | | | | | | 77 | | | | | | | | 77 | | | | | | | | 77 | |
Not designated as hedging instrument | | | | | | | | | | | | | | | | | | | | | | | | | | | | | | |
FX forward contracts | | HFT | | | 411 | | | | | | | | 411 | | | | | | | | 411 | | | | | | | | 411 | |
Call options for share-based payments | | HFT | | | 43 | | | | | | | | 43 | | | | | | | | 43 | | | | | | | | 43 | |
Call option on equity shares | | HFT | | | 13 | | | | | | | | 13 | | | | | | | | | | | | 13 | | | | 13 | |
| | |
| Consolidated Financial Statements IFRSNotes | | 175 |
Fair Values of Financial Instruments and Classification Within the Fair Value Hierarchy
| | | | | | | | | | | | | | | | | | | | | | | | | | | | | | |
€ millions | | | | December 31, 2015 | |
| | | | | Carrying Amount | | | Measurement Categories | | | Fair Value | |
| | | Category | | | | | At
Amortized
Cost | | | At Fair
Value | | | Level 1 | | | Level 2 | | | Level 3 | | | Total | |
| Liabilities | | | | | | | | | | | | | | | | | | | | | | | | | | | | | | |
| Trade and other payables | | | | | -1,087 | | | | | | | | | | | | | | | | | | | | | | | | | |
Trade payables1) | | AC | | | -782 | | | | -782 | | | | | | | | | | | | | | | | | | | | | |
Other payables2) | | – | | | -305 | | | | | | | | | | | | | | | | | | | | | | | | | |
| Financial liabilities | | | | | -11,542 | | | | | | | | | | | | | | | | | | | | | | | | | |
Non-derivative financial liabilities | | | | | | | | | | | | | | | | | | | | | | | | | | | | | | |
Loans | | AC | | | -4,261 | | | | -4,261 | | | | | | | | | | | | -4,261 | | | | | | | | -4,261 | |
Bonds | | AC | | | -4,629 | | | | -4,629 | | | | | | | | -4,811 | | | | | | | | | | | | -4,811 | |
Private placements | | AC | | | -2,195 | | | | -2,195 | | | | | | | | | | | | -2,301 | | | | | | | | -2,301 | |
Other non-derivative financial liabilities | | AC | | | -123 | | | | -123 | | | | | | | | | | | | -123 | | | | | | | | -123 | |
Derivatives | | | | | | | | | | | | | | | | | | | | | | | | | | | | | | |
Designated as hedging instrument | | | | | | | | | | | | | | | | | | | | | | | | | | | | | | |
FX forward contracts | | – | | | -22 | | | | | | | | -22 | | | | | | | | -22 | | | | | | | | -22 | |
Interest-rate swaps | | – | | | -1 | | | | | | | | -1 | | | | | | | | -1 | | | | | | | | -1 | |
Not designated as hedging instrument | | | | | | | | | | | | | | | | | | | | | | | | | | | | | | |
FX forward contracts | | HFT | | | -310 | | | | | | | | -310 | | | | | | | | -310 | | | | | | | | -310 | |
| | | | | | | | | | | | | | | | | | | | | | | | | | | | | | |
| Total financial instruments, net | | | | | -3,159 | | | | -4,084 | | | | 858 | | | | -4,663 | | | | -6,053 | | | | 400 | | | | -10,315 | |
| 1) | We do not separately disclose the fair value for cash and cash equivalents, trade receivables, and accounts payable as their carrying amounts are a reasonable approximation of their fair values. |
| 2) | Since the line items trade receivables, trade payables, and other financial assets contain both financial and non-financial assets or liabilities (such as other taxes or advance payments), the carrying amounts of non-financial assets or liabilities are shown to allow a reconciliation to the corresponding line items in the Consolidated Statements of Financial Position. |
Fair Values of Financial Instruments Classified According to IAS 39
| | | | | | | | | | | | | | | | |
€ millions | | | | | December 31, 2015 | |
| | | Category | | | Carrying
Amount | | | At
Amortized
Cost | | | At Fair
Value | |
| Financial assets | | | | | | | | | | | | | | | | |
At fair value through profit or loss | | | HFT | | | | 169 | | | | | | | | 169 | |
Available-for-sale | | | AFS | | | | 908 | | | | | | | | 908 | |
Loans and receivables | | | L&R | | | | 8,926 | | | | 8,926 | | | | | |
| Financial liabilities | | | | | | | | | | | | | | | | |
At fair value through profit or loss | | | HFT | | | | -117 | | | | | | | | -117 | |
At amortized cost | | | AC | | | | -10,288 | | | | -10,288 | | | | | |
| | |
| Consolidated Financial Statements IFRSNotes | | 176 |
| | | | | | | | | | | | | | |
€ millions | | | | December 31, 2014 | |
| | | Category | | Carrying
Amount | | | At
Amortized
Cost | | | At Fair
Value | |
| Financial assets | | | | | | | | | | | | | | |
At fair value through profit or loss | | HFT | | | 467 | | | | | | | | 467 | |
Available-for-sale | | AFS | | | 637 | | | | | | | | 637 | |
Loans and receivables | | L&R | | | 7,906 | | | | 7,906 | | | | | |
| Financial liabilities | | | | | | | | | | | | | | |
At fair value through profit or loss | | HFT | | | -310 | | | | | | | | -310 | |
At amortized cost | | AC | | | -11,991 | | | | -11,991 | | | | | |
Determination of Fair Values
It is our policy that transfers between the different levels of the fair value hierarchy are deemed to have occurred at the beginning of the period of the event or change in circumstances that caused the transfer. A description of the valuation techniques and the inputs used in the fair value measurement is given below:
Financial Instruments Measured at Fair Value on a Recurring Basis
| | | | | | | | |
Type | | Fair Value
Hierarchy | | Determination of Fair Value/
Valuation Technique | | Significant Unobservable Inputs | | Interrelationship Between
Significant Unobservable Inputs
and Fair Value Measurement |
| Other financial assets | | | | | | | | |
| Debt investments | | Level 1 | | Quoted prices in an active market | | NA | | NA |
| | | | |
| Listed equity investments | | Level 1 | | Quoted prices in an active market | | NA | | NA |
| | | | |
| | Level 2 | | Quoted prices in an active market deducting a discount for the disposal restriction derived from the premium for a respective put option. | | NA | | NA |
| | | | |
| Unlisted equity investments | | Level 3 | | Market approach. Comparable company valuation using revenue multiples derived from companies comparable to the investee. | | Peer companies used (revenue multiples range from 2.7 to 8.3) Revenues of investees; Discounts for lack of marketability (10% to 30%) | | The estimated fair value would increase (decrease) if: The revenue multiples were higher (lower) The investees’ revenues were higher (lower) The liquidity discounts were lower (higher). |
| | | | |
| | | | Market approach. Venture capital method evaluating a variety of quantitative and qualitative factors such as actual and forecasted results, cash position, recent or planned transactions, and market comparable companies. | | NA | | NA |
| | | | |
| | | | Last financing round valuations | | NA | | NA |
| | | | |
| | | | Liquidation preferences | | NA | | NA |
| | | | |
| | | | Net asset value/Fair market value as reported by the respective funds | | NA | | NA |
| | |
| Consolidated Financial Statements IFRSNotes | | 177 |
| | | | | | | | |
Type | | Fair Value
Hierarchy | | Determination of Fair Value/
Valuation Technique | | Significant Unobservable Inputs | | Interrelationship Between
Significant Unobservable Inputs
and Fair Value Measurement |
| Other financial assets (continued) | | | | | | | | |
| Call options for share-based payment plans | | Level 2 | | Monte-Carlo Model. Calculated considering risk-free interest rates, the remaining term of the derivatives, the dividend yields, the stock price, and the volatility of our share. | | NA | | NA |
| | | | |
| Call option on equity shares | | Level 3 | | Market approach. Company valuation using EBITDA multiples based on actual results derived from the investee. | | EBITDA multiples used EBITDA of the investee | | The estimated fair value would increase (decrease) if: The EBITDA multiples were higher (lower) The investees’ EBITDA were higher (lower) |
| Other financial assets/Financial liabilities | | | | | | | | |
| | | | |
| FX forward contracts | | Level 2 | | Discounted cash flow using Par- Method. Expected future cash flows based on forward exchange rates are discounted over the respective remaining term of the contracts using the respective deposit interest rates and spot rates. | | NA | | NA |
| | | | |
| Interest-rate swaps | | Level 2 | | Discounted cash flow. Expected future cash flows are estimated based on forward interest rates from observable yield curves and contract interest rates, discounted at a rate that reflects the credit risk of the counterparty. | | NA | | NA |
Financial Instruments Not Measured at Fair Value
| | | | |
Type | | Fair Value
Hierarchy | | Determination of Fair Value/ Valuation Technique |
| Financial liabilities | | | | |
Fixed rate bonds (financial liabilities) | | Level 1 | | Quoted prices in an active market |
| | |
Fixed rate private placements/ loans (financial liabilities) | | Level 2 | | Discounted cash flows. Future cash outflows for fixed interest and principal are discounted over the term of the respective contracts using the market interest rates as of the reporting date. |
For other non-derivative financial assets/liabilities and variable rate financial debt, it is assumed that their carrying value reasonably approximates their fair values.
Transfers Between Levels 1 and 2
Transfers of available-for-sale equity investments from Level 2 to Level 1 which occurred because disposal restrictions lapsed and deducting a discount for such restriction was no longer necessary were not material in all years presented, while transfers from Level 1 to Level 2 did not occur at all.
| | |
| Consolidated Financial Statements IFRSNotes | | 178 |
Level 3 Disclosures
The following table shows the reconciliation from the opening to the closing balances for our unlisted equity investments and call options on equity shares classified as Level 3 fair values:
Reconciliation of Level 3 Fair Values
| | | | | | | | |
€ millions | | 2015 | | | 2014 | |
| | | Unlisted Equity
Investments and Call
Options on Equity
Shares | | | Unlisted Equity
Investments | |
| January 1 | | | 400 | | | | 239 | |
| Transfers | | | | | | | | |
Into Level 3 | | | 12 | | | | 0 | |
Out of Level 3 | | | -80 | | | | -29 | |
| Purchases | | | 170 | | | | 141 | |
| Sales | | | -22 | | | | -36 | |
| Gains/losses | | | | | | | | |
Included in financial income, net in profit and loss | | | 9 | | | | 27 | |
Included in available-for-sale financial assets in other comprehensive income | | | 34 | | | | 21 | |
Included in exchange differences in other comprehensive income | | | 45 | | | | 37 | |
| | | | | | | | |
| December 31 | | | 568 | | | | 400 | |
| Change in unrealized gains/losses in profit and loss for investments held at the end of the reporting period | | | 0 | | | | 0 | |
Changing the unobservable inputs to reflect reasonably possible alternative assumptions would not have a material impact on the fair values of our unlisted equity investments held as available-for-sale as of the reporting date.
| | |
| Consolidated Financial Statements IFRSNotes | | 179 |
(27) SHARE-BASED PAYMENTS
SAP has granted awards under various cash-settled and equity-settled share-based payments to its directors and employees. Most of these awards are described in detail below. SAP has other share-based payment plans not described below, which are individually and in aggregate, immaterial to our Consolidated Financial Statements.
a) Cash-Settled Share-Based Payments
SAP’s cash-settled share-based payments include the following programs: Employee Participation Plan (EPP) and Long-Term Incentive Plan (LTI Plan for the Global Managing Board) 2015, Stock Option Plan 2010 (SOP 2010 (2010–2015 tranches)), Restricted Stock Unit Plan (RSU (2013–2015 tranches)).
As at December 31, 2015, the valuation of our outstanding cash-settled plans was based on the following parameters and assumptions:
Fair Value and Parameters Used at Year End 2015 for Cash-Settled Plans
| | | | | | | | | | | | | | | | |
| | | LTI Plan 2015
(2012 – 2015
tranches) | | | EPP 2015
(2015 tranche) | | | SOP 2010
(2010 – 2015
tranches) | | | RSU
(2013 – 2015
tranches) | |
| Weighted average fair value as at 12/31/2015 | | | €71.45 | | | | €73.38 | | | | €16.06 | | | | €71.90 | |
| Information how fair value was measured at measurement date | | | | | | | | | | | | | | | | |
Option pricing model used | | | Other | 1) | | | Other | 1) | | | Monte-Carlo | | | | Other | 1) |
Share price | | | | | | | €73.38 | | | | | | | | €73.24 | |
Risk-free interest rate (depending on maturity) | |
| -0.25% to
-0.39% |
| | | NA | | |
| -0.03% to
-0.38% |
| |
| -0.16% to
-0.39% |
|
Expected volatility SAP shares | | | NA | | | | NA | | |
| 22.0% to
41.9% |
| | | NA | |
Expected dividend yield SAP shares | | | 1.56 | % | | | NA | | | | 1.56 | % | | | 1.56 | % |
| Weighted average remaining life of options outstanding as at 12/31/2015 (in years) | | | 1.7 | | | | 0.1 | | | | 3.4 | | | | 1.2 | |
| 1) | For these awards, the fair value is calculated by subtracting the net present value of expected future dividend payments, if any, until maturity of the respective award from the prevailing share price as of the valuation date. |
As at December 31, 2014, the valuation of our outstanding cash-settled plans was based on the following parameters and assumptions:
Fair Value and Parameters Used at Year End 2014 for Cash-Settled Plans
| | | | | | | | | | | | | | | | |
| | | LTI Plan 2015
(2012 – 2014
tranches) | | | EPP 2015
(2014 tranche) | | | SOP 2010
(2010 – 2014
tranches) | | | RSU
(2013 – 2014
tranches) | |
| Weighted average fair value as at 12/31/2014 | | | €56.40 | | | | €58.26 | | | | €10.17 | | | | €54.09 | |
| Information how fair value was measured at measurement date | | | | | | | | | | | | | | | | |
Option pricing model used | | | Other | 1) | | | Other | 1) | | | Monte-Carlo | | | | Other | 1) |
Share price | | | | | | | €58.26 | | | | | | | | €57.37 | |
Risk-free interest rate (depending on maturity) | | | -0.1 | % | | | NA | | |
| -0.1% to
0.02% |
| |
| -0.1% to
-0.01% |
|
Expected volatility SAP shares | | | NA | | | | NA | | |
| 19.9 % to
23.4% |
| | | NA | |
Expected dividend yield SAP shares | | | 1.74 | % | | | NA | | | | 1.74 | % | | | 1.76 | % |
| Weighted average remaining life of options outstanding as at 12/31/2014 (in years) | | | 1.8 | | | | 0.1 | | | | 3.5 | | | | 1.1 | |
| 1) | For these awards, the fair value is calculated by subtracting the net present value of expected future dividend payments, if any, until maturity of the respective award from the prevailing share price as of the valuation date. |
| | |
| Consolidated Financial Statements IFRSNotes | | 180 |
Expected volatility of the SAP share price is based on a blend of implied volatility from traded options with corresponding lifetimes and exercise prices as well as historical volatility with the same expected life as the options granted.
Expected remaining life of the options reflects both the contractual term and the expected, or historical, exercise behavior. The risk-free interest rate is derived from German government bonds with a similar duration. Dividend yield is based on expected future dividends.
Changes in Numbers of Outstanding Awards Under Our Cash-Settled Plans
| | | | | | | | | | | | | | | | |
thousands | | LTI Plan 2015
(2012 – 2015
tranches) | | | EPP 2015
(2013 – 2015
tranches) | | | SOP 2010
(2010 – 2015
tranches) | | | RSU
(2013 – 2015
tranches) | |
| Outstanding as at 12/31/2013 | | | 515 | | | | 1,845 | | | | 21,666 | | | | 1,427 | |
Granted in 2014 | | | 242 | | | | 2,177 | | | | 8,965 | | | | 2,001 | |
Adjustment based upon KPI target achievement in 2014 | | | -41 | | | | -458 | | | | NA | | | | -88 | |
Exercised in 2014 | | | -70 | | | | -1,845 | | | | -2,730 | | | | -734 | |
Forfeited in 2014 | | | -55 | | | | -104 | | | | -1,619 | | | | -378 | |
| | | | | | | | | | | | | | | | |
| Outstanding as at 12/31/2014 | | | 591 | | | | 1,615 | | | | 26,282 | | | | 2,228 | |
Granted in 2015 | | | 277 | | | | 2,605 | | | | 10,866 | | | | 5,125 | |
Adjustment based upon KPI target achievement in 2015 | | | 109 | | | | 495 | | | | NA | | | | 109 | |
Exercised in 2015 | | | 0 | | | | -1,614 | | | | -6,585 | | | | -1,337 | |
Forfeited in 2015 | | | 0 | | | | -131 | | | | -1,436 | | | | -548 | |
| | | | | | | | | | | | | | | | |
| Outstanding as at 12/31/2015 | | | 977 | | | | 2,970 | | | | 29,127 | | | | 5,577 | |
| Outstanding awards exercisable as at | | | | | | | | | | | | | | | | |
12/31/2014 | | | 0 | | | | 0 | | | | 3,313 | | | | 0 | |
| | | | | | | | | | | | | | | | |
12/31/2015 | | | 0 | | | | 0 | | | | 4,120 | | | | 0 | |
| Total carrying amount (in € millions) of liabilities as at | | | | | | | | | | | | | | | | |
12/31/2014 | | | 45 | | | | 94 | | | | 167 | | | | 56 | |
| | | | | | | | | | | | | | | | |
12/31/2015 | | | 74 | | | | 205 | | | | 283 | | | | 166 | |
| Total intrinsic value of vested awards (in € millions) as at | | | | | | | | | | | | | | | | |
12/31/2014 | | | 38 | | | | 94 | | | | 49 | | | | 0 | |
| | | | | | | | | | | | | | | | |
12/31/2015 | | | 76 | | | | 218 | | | | 110 | | | | 0 | |
| Weighted average share price (in €) for share options exercised in | | | | | | | | | | | | | | | | |
2014 | | | 54.96 | | | | 57.48 | | | | 56.65 | | | | 56.62 | |
| | | | | | | | | | | | | | | | |
2015 | | | NA | | | | 56.94 | | | | 66.20 | | | | 65.83 | |
| Total expense (in € millions) recognized in | | | | | | | | | | | | | | | | |
2013 | | | -11 | | | | 118 | | | | 83 | | | | 34 | |
2014 | | | 13 | | | | 82 | | | | 29 | | | | 58 | |
| | | | | | | | | | | | | | | | |
2015 | | | 28 | | | | 200 | | | | 187 | | | | 193 | |
| | |
| Consolidated Financial Statements IFRSNotes | | 181 |
a.1) Employee Participation Plan (EPP) and Long-Term Incentive Plan (LTI Plan) 2015
SAP implemented two share-based payments in 2012: an Employee Participation Plan (EPP) 2015 for employees and a Long-Term Incentive (LTI) Plan 2015 for members of the Global Managing Board.
The plans are focused on SAP’s share price and the achievement of two financial key performance indicators (KPIs): non-IFRS total revenue and non-IFRS operating profit, which are derived from the Company’s 2015 financial KPIs. Under these plans, virtual shares, called restricted share units (RSUs), are granted to participants. Participants are paid out in cash based on the number of RSUs that vest.
The RSUs were granted and allocated at the beginning of each year through 2015, with EPP 2015 RSUs subject to annual Executive Board approval. Participants in the LTI Plan 2015 have already been granted a budget for the years 2012 to 2015 (2015 for new plan participants joining in 2015). All participants in the LTI Plan 2015 are members of the Global Managing Board.
The RSU allocation process took place at the beginning of each year based on SAP’s share price after the publication of its preliminary annual results for the last financial year prior to the performance period.
At the end of the given year, the number of RSUs that finally vest with plan participants depends on SAP’s actual performance for the given year, and might be higher or lower than the number of RSUs originally granted. If performance against both KPI targets reaches at least the defined 60% (80% for 2012 and 2013 tranches) threshold, the RSUs vest. Depending on performance, the vesting can reach a maximum of 150% of the budgeted amount. If performance against either or both of those KPI targets does not reach the defined threshold of 60% (80% for 2012 and 2013 tranches), no RSUs vest and RSUs granted for that year will be forfeited. The adjustment to the threshold of those performance indicators was made to reflect our updated expectations due to the accelerated shift to the cloud. For the year 2015, the RSUs granted at the beginning of the year vested with 112.96% (2014: 77.89%) achievement of the KPI targets for the LTI Plan. For the EPP, the Executive Board set the achievement of the KPI targets at 120.00% (2014: 77.89%) .
Under the EPP 2015, the RSUs are paid out in the first quarter of the year after the one-year performance period, whereas the RSUs for members of the Global Managing Board under the LTI Plan 2015 are subject to a three-year holding period before payout, which occurs starting in 2016.
The LTI Plan 2015 includes a “look-back” provision, due to the fact that this plan is based on certain KPI targets in 2015. The number of RSUs vested under the 2015 tranche was adjusted to reflect the overall achievement for 2015 than represented by the number of RSUs vested from the 2012 to 2014 tranches.
However, RSUs that were already fully vested in prior years did not forfeit.
The final financial effect of each tranche of the EPP 2015 and the LTI Plan 2015 will depend on the number of vested RSUs and the SAP share price, which is set directly after the announcement of the preliminary fourth quarter and full-year results for the last financial year under the EPP 2015 (of the respective three-year holding period under the LTI Plan 2015), and thus may be significantly above or below the budgeted amounts.
a.2) SAP Stock Option Plan 2010 (SOP 2010 (2010–2015 Tranches))
Under the SAP Stock Option Plan 2010, we granted members of the Senior Leadership Team/Global Executives, SAP’s Top Rewards (employees with an exceptional rating/high potentials) between 2010 and 2015 and only in 2010 and 2011 members of the Executive Board cash-based virtual stock options, the value of which depends on the multi-year performance of the SAP share.
The grant-base value is based on the average fair market value of one ordinary share over the five business days prior to the Executive Board resolution date.
The virtual stock options granted under the SOP 2010 give the employees the right to receive a certain amount of money by exercising the options under the terms and conditions of this plan. After a three-year vesting period (four years for members of the Executive Board), the plan provides for 11 predetermined exercise dates every calendar year (one date per month except in April) until the rights lapse six years after the grant date (seven years for members of the Executive Board). Employees can exercise their virtual stock options only if they are employed by SAP; if they leave the Company, they forfeit them. Executive Board members’ options are non-forfeitable once granted – if the service agreement ends in the grant year, the number of options is reducedpro rata temporis. Any options not exercised at the end of their term expire.
The exercise price is 110% of the grant base value (115% for members of the Executive Board) which is €39.03 (€40.80) for the 2010 tranche, €46.23 (€48.33) for the 2011 tranche, €49.28 for the 2012 tranche, €59.85 for the 2013 tranche, €60.96 for the 2014 tranche, and €72.18 for the 2015 tranche.
Monetary benefits will be capped at 100% of the exercise price (150% for members of the Executive Board).
a.3) Restricted Stock Unit Plan (RSU Plan (2013–2015 tranches))
We maintain share-based payment plans that allow for the issuance of restricted stock units (RSU) to retain and motivate executives and certain employees.
| | |
| Consolidated Financial Statements IFRSNotes | | 182 |
Under the RSU Plan, we granted a certain number of RSUs between 2013 and 2015 representing a contingent right to receive a cash payment determined by the market value of the same number of SAP SE shares (or SAP SE American Depositary Receipts on the New York Stock Exchange) and the number of RSUs that ultimately vest. Granted RSUs will vest in different tranches, either:
| – | Over a one-to-three year service period only, or |
| – | Over a one-to-three year service period and upon meeting certain key performance indicators (KPIs). |
The number of RSUs that could vest under the 2015 tranche with performance-based grants was mostly contingent upon a weighted achievement of the following performance milestones for the fiscal year ended on December 31, 2015:
| – | Non-IFRS total revenue (50%); and |
| – | Non-IFRS operating profit (50%). |
Depending on performance, the number of RSUs vesting could have ranged between 50% and 150% of the number initially granted. Performance against the KPI targets was 112.96% (2014: 90.27%) in fiscal year 2015.
The RSUs are paid out in cash upon vesting.
b) Equity-Settled Share-Based Payments: Share Matching Plan (SMP)
Under the Share Matching Plan (SMP) implemented in 2010, SAP offers its employees the opportunity to purchase SAP SE shares at a discount of 40%. The number of SAP shares an eligible employee may purchase through the SMP is limited to a percentage of the employee’s annual base salary. After a three-year holding period, such plan participants will receive one free matching share of SAP for every three SAP shares acquired.
The terms for the members of the Senior Leadership Team/Global Executives are slightly different than those for the other employees. They do not receive a discount when purchasing the shares. However, after a three-year holding period, they receive two free matching SAP shares for every three SAP shares acquired. This plan is not open to members of the SAP Executive Board.
The following table shows the parameters and assumptions used at grant date to determine the fair value of free matching shares, as well as the quantity of shares purchased and free matching shares granted through this program in 2015, 2014, and 2013:
Fair Value and Parameters at Grant Date for SMP
| | | | | | | | | | | | |
| | | 2015 | | | 2014 | | | 2013 | |
| Grant date | | | 6/5/2015 | | | | 6/4/2014 | | | | 9/4/2013 | |
| Fair value of granted awards | | | €62.98 | | | | €52.49 | | | | €51.09 | |
| | | |
| Information how fair value was measured at grant date | | | | | | | | | | | | |
Option pricing model used | | | | | | | Other | 1) | | | | |
Share price | | | €66.31 | | | | €55.61 | | | | €54.20 | |
Risk-free interest rate | | | -0.08 | % | | | 0.13 | % | | | 0.43 | % |
Expected dividend yield | | | 1.67 | % | | | 1.87 | % | | | 1.92 | % |
| | | | | | | | | | | | |
| | | |
| Weighted average remaining contractual life of awards outstanding at year end (in years) | | | 1.5 | | | | 0.9 | | | | 1.6 | |
| | | | | | | | | | | | |
| | | |
| Number of investment shares purchased (in thousands) | | | 1,492 | | | | 1,550 | | | | 1,559 | |
| 1) | For these awards, the fair value is calculated by subtracting the net present value of expected future dividend payments, if any, until maturity of the respective award from the prevailing share price as of the valuation date. |
| | |
| Consolidated Financial Statements IFRSNotes | | 183 |
Changes in Numbers of Outstanding Awards Under SMP
| | | | |
thousands | | SMP | |
| Outstanding as at 12/31/2013 | | | 3,986 | |
Granted in 2014 | | | 568 | |
Exercised in 2014 | | | -432 | |
Forfeited in 2014 | | | -187 | |
| | | | |
| Outstanding as at 12/31/2014 | | | 3,935 | |
Granted in 2015 | | | 551 | |
Exercised in 2015 | | | -2,808 | |
Forfeited in 2015 | | | -78 | |
| | | | |
| Outstanding as at 12/31/2015 | | | 1,600 | |
Recognized Expense at Year End for SMP
| | | | | | | | | | | | |
€ millions | | 2015 | | | 2014 | | | 2013 | |
| Expense recognized relating to discount | | | 36 | | | | 35 | | | | 32 | |
| Expense recognized relating to vesting of free matching shares | | | 44 | | | | 54 | | | | 51 | |
| | | | | | | | | | | | |
| Total expense relating to SMP | | | 80 | | | | 89 | | | | 83 | |
(28) SEGMENT AND GEOGRAPHIC INFORMATION
General Information
On December 4, 2014, we completed our acquisition of Concur and in the first quarter of 2015 we announced our intention to combine all SAP network offerings (that is, predominantly the activities of the purchased Concur business and the network activities of the Ariba and Fieldglass businesses acquired earlier) and launch the SAP Business Network, a network of networks which covers sourcing, procurement, and travel and expenses.
The SAP Business Network qualifies as an operating segment and as a reportable segment under IFRS 8.
Since fiscal year 2015 SAP thus has two reportable segments that are regularly reviewed by our Executive Board, which is responsible for assessing the performance of our Company and for making resource allocation decisions as our Chief Operating Decision Maker (CODM): the Applications, Technology & Services segment and the SAP Business Network segment. These two segments are largely organized and managed separately according to their product and service offerings, notably whether the products and services relate to our business network activities or cover other areas of our business.
The Applications, Technology & Services segment derives its revenue primarily from the sale of software licenses, subscriptions to our cloud applications, and related services (mainly support services and various professional services and premium support services, as well as implementation services of our software products and education services on the use of our products).
The SAP Business Network segment emerged from combining all SAP network offerings into one network of networks that covers temporary workforce sourcing, other procurement, and end-to-end travel and business travel expense management. The SAP Business Network segment derives its revenues mainly from transaction fees charged for the use of SAP’s cloud-based collaborative business network and from services relating to the SAP Business Network (including cloud applications, professional services, and education services). Within the SAP Business Network segment, we mainly market and sell the cloud offerings developed by Ariba, Fieldglass, and Concur.
Our Concur and Fieldglass acquisitions are included in the segment information since their respective acquisition dates (December 4, 2014, for Concur and May 2, 2014, for Fieldglass).
| | |
| Consolidated Financial Statements IFRSNotes | | 184 |
Revenue and Results of Segments
| | | | | | | | | | | | | | | | | | | | | | | | | | | | | | | | | | | | |
€ millions | | Applications, Technology &
Services | | | SAP Business Network | | | Total Reportable Segments | |
| | | 2015 | | | 2014 | | | 2015 | | | 2014 | | | 2015 | | | 2014 | |
| | | Actual
Currency | | | Constant
Currency | | | Actual
Currency | | | Actual
Currency | | | Constant
Currency | | | Actual
Currency | | | Actual
Currency | | | Constant
Currency | | | Actual
Currency | |
Cloud subscriptions and support | | | 961 | | | | 849 | | | | 585 | | | | 1,337 | | | | 1,151 | | | | 515 | | | | 2,297 | | | | 2,000 | | | | 1,101 | |
Software licenses | | | 4,835 | | | | 4,580 | | | | 4,381 | | | | -1 | | | | -1 | | | | 0 | | | | 4,834 | | | | 4,579 | | | | 4,381 | |
Software support | | | 10,061 | | | | 9,388 | | | | 8,806 | | | | 31 | | | | 26 | | | | 29 | | | | 10,092 | | | | 9,414 | | | | 8,835 | |
Software licenses and support | | | 14,896 | | | | 13,968 | | | | 13,187 | | | | 30 | | | | 25 | | | | 28 | | | | 14,926 | | | | 13,993 | | | | 13,216 | |
| Cloud and software | | | 15,856 | | | | 14,817 | | | | 13,772 | | | | 1,367 | | | | 1,176 | | | | 544 | | | | 17,223 | | | | 15,993 | | | | 14,316 | |
| Services | | | 3,270 | | | | 3,035 | | | | 3,099 | | | | 247 | | | | 213 | | | | 101 | | | | 3,517 | | | | 3,248 | | | | 3,199 | |
| | | | | | | | | | | | | | | | | | | | | | | | | | | | | | | | | | | | |
| Total segment revenue | | | 19,126 | | | | 17,852 | | | | 16,871 | | | | 1,614 | | | | 1,389 | | | | 644 | | | | 20,740 | | | | 19,241 | | | | 17,515 | |
Cost of cloud subscriptions and support | | | -452 | | | | -421 | | | | -263 | | | | -336 | | | | -293 | | | | -128 | | | | -788 | | | | -715 | | | | -390 | |
Cost of software licenses and support | | | -1,994 | | | | -1,831 | | | | -1,823 | | | | -1 | | | | -1 | | | | -3 | | | | -1,994 | | | | -1,831 | | | | -1,826 | |
Cost of cloud and software | | | -2,446 | | | | -2,252 | | | | -2,085 | | | | -337 | | | | -294 | | | | -131 | | | | -2,783 | | | | -2,546 | | | | -2,216 | |
Cost of services | | | -2,897 | | | | -2,735 | | | | -2,479 | | | | -193 | | | | -171 | | | | -87 | | | | -3,090 | | | | -2,905 | | | | -2,565 | |
| | | | | | | | | | | | | | | | | | | | | | | | | | | | | | | | | | | | |
Total cost of revenue | | | -5,343 | | | | -4,987 | | | | -4,564 | | | | -530 | | | | -465 | | | | -217 | | | | -5,873 | | | | -5,451 | | | | -4,781 | |
| Segment gross profit | | | 13,784 | | | | 12,865 | | | | 12,307 | | | | 1,084 | | | | 924 | | | | 427 | | | | 14,868 | | | | 13,790 | | | | 12,734 | |
| Total segment expenses | | | -5,865 | | | | -5,484 | | | | -5,207 | | | | -771 | | | | -675 | | | | -322 | | | | -6,637 | | | | -6,158 | | | | -5,530 | |
| Segment profit | | | 7,918 | | | | 7,382 | | | | 7,099 | | | | 312 | | | | 250 | | | | 105 | | | | 8,231 | | | | 7,631 | | | | 7,204 | |
| | |
| Consolidated Financial Statements IFRSNotes | | 185 |
Revenue and Results of Segments
| | | | | | | | | | | | | | | | | | | | | | | | | | | | | | | | | | | | |
€ millions | | Applications, Technology &
Services | | | SAP Business Network | | | Total Reportable Segments | |
| | | 2014 | | | 2013 | | | 2014 | | | 2013 | | | 2014 | | | 2013 | |
| | | Actual
Currency | | | Constant
Currency | | | Actual
Currency | | | Actual
Currency | | | Constant
Currency | | | Actual
Currency | | | Actual
Currency | | | Constant
Currency | | | Actual
Currency | |
Cloud subscriptions and support | | | 585 | | | | 585 | | | | 413 | | | | 515 | | | | 512 | | | | 344 | | | | 1,101 | | | | 1,097 | | | | 757 | |
Software licenses | | | 4,381 | | | | 4,381 | | | | 4,519 | | | | 0 | | | | 0 | | | | 0 | | | | 4,381 | | | | 4,381 | | | | 4,519 | |
Software support | | | 8,806 | | | | 8,915 | | | | 8,280 | | | | 29 | | | | 29 | | | | 30 | | | | 8,835 | | | | 8,943 | | | | 8,310 | |
Software licenses and support | | | 13,187 | | | | 13,296 | | | | 12,799 | | | | 28 | | | | 28 | | | | 31 | | | | 13,216 | | | | 13,324 | | | | 12,829 | |
| Cloud and software | | | 13,772 | | | | 13,881 | | | | 13,211 | | | | 544 | | | | 541 | | | | 375 | | | | 14,316 | | | | 14,422 | | | | 13,586 | |
| Services | | | 3,099 | | | | 3,136 | | | | 3,175 | | | | 101 | | | | 101 | | | | 85 | | | | 3,199 | | | | 3,236 | | | | 3,259 | |
| | | | | | | | | | | | | | | | | | | | | | | | | | | | | | | | | | | | |
| Total segment revenue | | | 16,871 | | | | 17,017 | | | | 16,386 | | | | 644 | | | | 641 | | | | 460 | | | | 17,515 | | | | 17,658 | | | | 16,846 | |
Cost of cloud subscriptions and support | | | -263 | | | | -263 | | | | -124 | | | | -128 | | | | -127 | | | | -84 | | | | -390 | | | | -389 | | | | -208 | |
Cost of software licenses and support | | | -1,823 | | | | -1,839 | | | | -1,741 | | | | -3 | | | | -3 | | | | -8 | | | | -1,826 | | | | -1,842 | | | | -1,749 | |
Cost of cloud and software | | | -2,085 | | | | -2,102 | | | | -1,865 | | | | -131 | | | | -130 | | | | -91 | | | | -2,216 | | | | -2,232 | | | | -1,956 | |
Cost of services | | | -2,479 | | | | -2,518 | | | | -2,447 | | | | -87 | | | | -88 | | | | -68 | | | | -2,565 | | | | -2,606 | | | | -2,516 | |
| Total cost of revenue | | | -4,564 | | | | -4,619 | | | | -4,312 | | | | -217 | | | | -218 | | | | -160 | | | | -4,781 | | | | -4,837 | | | | -4,472 | |
| Segment gross profit | | | 12,307 | | | | 12,397 | | | | 12,074 | | | | 427 | | | | 423 | | | | 300 | | | | 12,734 | | | | 12,820 | | | | 12,374 | |
| Total segment expenses | | | -5,207 | | | | -5,269 | | | | -5,018 | | | | -322 | | | | -322 | | | | -201 | | | | -5,530 | | | | -5,591 | | | | -5,218 | |
| | | | | | | | | | | | | | | | | | | | | | | | | | | | | | | | | | | | |
| Segment profit | | | 7,099 | | | | 7,128 | | | | 7,056 | | | | 105 | | | | 101 | | | | 99 | | | | 7,204 | | | | 7,229 | | | | 7,155 | |
Segment asset/liability information is not regularly provided to our CODM. Goodwill by operating segment is disclosed inNote (15).
Measurement and Presentation
Our management reporting system reports our intersegment services as cost reductions and does not track them as internal revenue. Intersegment services mainly represent utilization of human resources of one segment by another segment on a project-by-project basis. Intersegment services are charged based on internal cost rates including certain indirect overhead costs, excluding a profit margin.
Most of our depreciation and amortization expense affecting segment profits is allocated to the segments as part of broader infrastructure allocations and is thus not tracked separately on the operating segment level. Depreciation and amortization expense that is directly allocated to the operating segments is immaterial in all operating segments presented.
Our management reporting system produces a variety of reports that differ by the currency exchange rates used in the accounting for foreign-currency transactions and operations.
Reports based on actual currencies use the same currency rates as are used in our financial statements. Reports based on constant currencies report revenues and expenses using the average exchange rates from the previous year’s corresponding period.
We use an operating profit indicator to measure the performance of our operating segments. However, the accounting policies applied in the measurement of operating segment revenue and profit differ as follows from the IFRS accounting principles used to determine the operating profit measure in our income statement:
The measurements of segment revenue and results include the recurring revenues that would have been recorded by acquired entities had they remained stand-alone entities but which are not recorded as revenue under IFRS due to fair value accounting for customer contracts in effect at the time of an acquisition.
The expenses measured exclude:
| ¡ | | Acquisition-related charges |
| | – | | Amortization expense and impairment charges for intangibles acquired in business combinations and certain stand-alone acquisitions of intellectual property (including purchased in-process research and development) |
| | |
| Consolidated Financial Statements IFRSNotes | | 186 |
| | – | | Settlements of pre-existing relationships in connection with a business combination |
| | – | | Acquisition-related third-party costs |
| ¡ | | Expenses from the TomorrowNow litigation and the Versata litigation |
| ¡ | | Share-based payment expenses |
Certain corporate-level activities are not allocated to our segments, including finance, accounting, legal, human resources, and marketing. They are disclosed in the reconciliation under other expenses and other revenue respectively.
The segment information for prior periods has been restated to conform to the new two-segment structure.
Reconciliation of Revenue and Segment Results
| | | | | | | | | | | | | | | | | | | | |
€ millions | | 2015 | | | 2014 | | | 2013 | |
| | | Actual
Currency | | | Constant
Currency | | | Actual
Currency | | | Constant
Currency | | | Actual
Currency | |
| Total segment revenue for reportable segments | | | 20,740 | | | | 19,241 | | | | 17,515 | | | | 17,658 | | | | 16,846 | |
| Other revenue | | | 64 | | | | 58 | | | | 64 | | | | 65 | | | | 51 | |
| Adjustment for currency impact | | | 0 | | | | 1,505 | | | | 0 | | | | -142 | | | | 0 | |
| Adjustment of revenue under fair value accounting | | | -11 | | | | -11 | | | | -19 | | | | -19 | | | | -82 | |
| | | | | | | | | | | | | | | | | | | | |
| Total revenue | | | 20,793 | | | | 20,793 | | | | 17,560 | | | | 17,560 | | | | 16,815 | |
| | | | | |
| Total segment profit for reportable segments | | | 8,231 | | | | 7,631 | | | | 7,204 | | | | 7,229 | | | | 7,155 | |
| Other revenue | | | 64 | | | | 58 | | | | 64 | | | | 65 | | | | 51 | |
| Other expenses | | | -1,947 | | | | -1,786 | | | | -1,631 | | | | -1,665 | | | | -1,725 | |
| Adjustment for currency impact | | | 0 | | | | 443 | | | | 0 | | | | -9 | | | | 0 | |
| Adjustment for | | | | | | | | | | | | | | | | | | | | |
| Revenue under fair value accounting | | | -11 | | | | -11 | | | | -19 | | | | -19 | | | | -82 | |
| Acquisition-related charges | | | -738 | | | | -738 | | | | -562 | | | | -562 | | | | -555 | |
| Share-based payment expenses | | | -724 | | | | -724 | | | | -290 | | | | -290 | | | | -327 | |
| Restructuring | | | -621 | | | | -621 | | | | -126 | | | | -126 | | | | -70 | |
| TomorrowNow and Versata litigation | | | 0 | | | | 0 | | | | -309 | | | | -309 | | | | 31 | |
| | | | | | | | | | | | | | | | | | | | |
| Operating profit | | | 4,252 | | | | 4,252 | | | | 4,331 | | | | 4,331 | | | | 4,479 | |
| Other non-operating income/expense, net | | | -256 | | | | -256 | | | | 49 | | | | 49 | | | | -17 | |
| Financial income, net | | | -5 | | | | -5 | | | | -25 | | | | -25 | | | | -66 | |
| | | | | | | | | | | | | | | | | | | | |
| Profit before tax | | | 3,991 | | | | 3,991 | | | | 4,355 | | | | 4,355 | | | | 4,396 | |
Geographic Information
We have aligned our revenue by region disclosures with the changes made to the structure of our income statement as outlined inNote (3b).
The amounts for revenue by region in the following tables are based on the location of customers. The regions in the following table are broken down into EMEA (Europe, Middle East, and Africa), Americas (North America and Latin America) and APJ (Asia Pacific Japan).
| | |
| Consolidated Financial Statements IFRSNotes | | 187 |
Revenue by Region
| | | | | | | | | | | | | | | | | | | | | | | | |
€ millions | | Cloud Subscriptions and
Support Revenue | | | Cloud and Software Revenue | |
| | | 2015 | | | 2014 | | | 2013 | | | 2015 | | | 2014 | | | 2013 | |
| EMEA | | | 507 | | | | 277 | | | | 176 | | | | 7,622 | | | | 6,819 | | | | 6,616 | |
| Americas | | | 1,579 | | | | 709 | | | | 457 | | | | 6,929 | | | | 5,276 | | | | 5,097 | |
| APJ | | | 200 | | | | 101 | | | | 64 | | | | 2,663 | | | | 2,221 | | | | 2,237 | |
| | | | | | | | | | | | | | | | | | | | | | | | |
| SAP Group | | | 2,286 | | | | 1,087 | | | | 696 | | | | 17,214 | | | | 14,315 | | | | 13,950 | |
Total Revenue by Region
| | | | | | | | | | | | |
€ millions | | 2015 | | | 2014 | | | 2013 | |
| Germany | | | 2,771 | | | | 2,570 | | | | 2,513 | |
| Rest of EMEA | | | 6,409 | | | | 5,813 | | | | 5,462 | |
| EMEA | | | 9,181 | | | | 8,383 | | | | 7,975 | |
| United States | | | 6,750 | | | | 4,898 | | | | 4,487 | |
| Rest of Americas | | | 1,678 | | | | 1,591 | | | | 1,746 | |
| Americas | | | 8,428 | | | | 6,489 | | | | 6,233 | |
| Japan | | | 667 | | | | 600 | | | | 631 | |
| Rest of APJ | | | 2,517 | | | | 2,088 | | | | 1,975 | |
| APJ | | | 3,185 | | | | 2,688 | | | | 2,606 | |
| | | | | | | | | | | | |
| SAP Group | | | 20,793 | | | | 17,560 | | | | 16,815 | |
Non-Current Assets by Region
| | | | | | | | |
€ millions | | 2015 | | | 2014 | |
| Germany | | | 2,395 | | | | 2,399 | |
| The Netherlands | | | 2,843 | | | | 2,917 | |
| France | | | 2,175 | | | | 2,116 | |
| Rest of EMEA | | | 2,557 | | | | 2,477 | |
| EMEA | | | 9,969 | | | | 9,909 | |
| United States | | | 19,124 | | | | 17,568 | |
| Rest of Americas | | | 139 | | | | 152 | |
| Americas | | | 19,264 | | | | 17,720 | |
| APJ | | | 599 | | | | 518 | |
| | | | | | | | |
| SAP Group | | | 29,832 | | | | 28,147 | |
The table above shows non-current assets excluding financial instruments, deferred tax assets, post-employment benefits, and rights arising under insurance contracts.
For information about the breakdown of our workforce by region, seeNote (7).
| | |
| Consolidated Financial Statements IFRSNotes | | 188 |
(29) BOARD OF DIRECTORS
Executive Board
Memberships on supervisory boards and other comparable governing bodies of enterprises, other than subsidiaries of SAP on December 31, 2015
Bill McDermott
Chief Executive Officer, Labor Relations Director
Strategy, Governance, Business Development,
Corporate Development, Communications and Marketing, Human Resources, Business Network
Board of Directors, ANSYS, Inc., Canonsburg, PA, United States
Board of Directors, Under Armour, Inc., Baltimore, MD, United States
Robert Enslin
Global Customer Operations
Global Sales, Industry & LoB Solutions Sales, Services Sales, Sales Operations, Global Customer Office
Michael Kleinemeier (from November 1, 2015)
Global Service & Support
Global Consulting Delivery, Global and Regional Support and Premium Engagement Functions, Maintenance Go-to-Market, Global User Groups, Mobile Services
Bernd Leukert
Chief Technology Officer
Products & Innovation Global Development Organization, Innovation & Cloud Delivery, Product Strategy, Development Services, SAP Global Security
Supervisory Board, DFKI (Deutsches Forschungszentrum für Künstliche Intelligenz GmbH), Kaiserslautern, Germany (from October 13, 2015)
Luka Mucic
Chief Financial Officer, Chief Operating Officer
Global Finance and Administration including Investor Relations and Data Protection & Privacy, Process Office, Business Innovation & IT
Gerhard Oswald
Product Quality & Enablement
Quality Governance & Validation, Scale, Enablement & Transformation, Logistics Services
Supervisory Board
Memberships on supervisory boards and other comparable governing bodies of enterprises, other than subsidiaries of SAP on December 31, 2015
Prof. Dr. h.c. mult. Hasso Plattner 2), 4), 6), 7), 8)
Chairman
Margret Klein-Magar 1), 2), 4)
Deputy Chairperson
Vice President, Head of SAP Alumni Relations Chairperson of the Spokespersons’ Committee of Senior
Managers of SAP SE
Pekka Ala-Pietilä4), 5), 6), 7)
Chairman of the Board of Directors, Huhtamäki Oyj, Espoo, Finland
Chairman of the Board of Directors, Solidium Oy, Helsinki, Finland (until April 22, 2015)
Board of Directors, Pöyry Plc, Vantaa, Finland
Chairman of the Board of Directors, CVON Group Limited, London, United Kingdom
Board of Directors, CVON Limited, London, United Kingdom
Chairman of the Board of Directors, CVON Innovation Services Oy, Turku, Finland
Board of Directors, CVON Future Limited, London, United Kingdom
Chairman of the Board of Directors, Blyk International Ltd., London, United Kingdom
Board of Directors, Sanoma Corporation, Helsinki, Finland
Panagiotis Bissiritsas 1),3), 4), 5)
Support Expert
Martin Duffek (from May 20, 2015)1),3), 8)
Product Manager
Prof. Anja Feldmann4), 8)
Professor at the Electrical Engineering and Computer Science Faculty at the Technische Universität Berlin
| | |
| Consolidated Financial Statements IFRSNotes | | 189 |
Prof. Dr. Wilhelm Haarmann 2),5), 7),8)
Attorney-at-law, certified public auditor, certified tax advisor
Linklaters LLP, Rechtsanwälte, Notare, Steuerberater, Frankfurt am Main, Germany
Supervisory Board, Celesio AG, Stuttgart, Germany (until March 1, 2015)
Andreas Hahn (from May 20, 2015)1), 2), 4)
Product Expert, Industry Standards & Open Source
Prof. Dr. Gesche Joost (from May 28, 2015)4), 8)
Professor for Design Research and Head of the Design Research Lab, University of Arts Berlin
Lars Lamadé 1),2), 7),8)
Head of Customer & Events GSS COO
Managing Director, Rhein Neckar-Loewen GmbH, Kronau, Germany
Bernard Liautaud 2),4), 6)
General Partner Balderton Capital, London, United Kingdom
Board of Directors, nlyte Software Ltd., London, United Kingdom
Board of Directors, Talend SA, Suresnes, France
Board of Directors, Wonga Group Ltd., London, United Kingdom
Board of Directors, SCYTL Secure Electronic Voting SA, Barcelona, Spain
Board of Directors, Vestiaire Collective SA, Levallois-Perret, France
Board of Directors, Dashlane, Inc., New York, NY, United States
Board of Directors, Recorded Future, Inc., Cambridge, MA, United States
Board of Directors, eWise Group, Inc., Redwood City, CA, United States
Board of Directors, Qubit Digital Ltd., London, United Kingdom
Board of Directors, Stanford University, Stanford, CA, United States
Board of Directors, Citymapper Ltd., London, United Kingdom
Board of Directors, Sunrise Atelier, Inc., New York, NY, United States (until February 11, 2015)
Board of Directors, Opbeat Inc., San Francisco, CA, United States
Christine Regitz(from May 20, 2015)1),4), 8)
Vice President User Experience
Chief Product Expert
Dr. Erhard Schipporeit 3), 7)
Independent Management Consultant
Supervisory Board, Talanx AG, Hanover, Germany
Supervisory Board, Deutsche Börse AG, Frankfurt am Main, Germany
Supervisory Board, HDI V.a.G., Hanover, Germany
Supervisory Board, Hannover Rückversicherung SE, Hanover, Germany
Supervisory Board, Fuchs Petrolub SE, Mannheim, Germany
Supervisory Board, BDO AG, Hamburg, Germany
Board of Directors, Fidelity Funds SICAV, Luxembourg
Supervisory Board, Rocket Internet AG, Berlin, Germany (until June 23, 2015)
Robert Schuschnig-Fowler (from May 20, 2015)1), 8)
Account Manager, Senior Support Engineer
Dr. Sebastian Sick (from May 20, 2015)1),2), 5),7)
Head of Company Law Unit, Hans Böckler Foundation
Supervisory Board, Georgsmarienhütte GmbH, Georgsmarienhütte, Germany
Jim Hagemann Snabe 2), 5)
Supervisory Board Member
Board of Directors, Bang & Olufsen A/S, Struer, Denmark
Board of Directors, Danske Bank A/S, Copenhagen, Denmark
Supervisory Board, Allianz SE, Munich, Germany
Supervisory Board, Siemens AG, Munich, Germany
Pierre Thiollet(from May 20, 2015)1), 4)
Webmaster
Prof. Dr.-Ing. Dr.-Ing. E. h. Klaus Wucherer 3)
Managing Director of Dr. Klaus Wucherer Innovations- und Technologieberatung GmbH, Erlangen, Germany
Deputy Chairman of the Supervisory Board, HEITEC AG, Erlangen, Germany
Supervisory Board, Dürr AG, Bietigheim-Bissingen, Germany (until December 31, 2015)
Deputy Chairman of the Supervisory Board, LEONI AG, Nuremberg, Germany
Chairman of the Supervisory Board, Festo AG & Co. KG, Esslingen, Germany
| | |
| Consolidated Financial Statements IFRSNotes | | 190 |
Supervisory Board Members Who Left During 2015
Catherine Bordelon (until May 20, 2015)
Christiane Kuntz-Mayr (until May 20, 2015)
Steffen Leskovar (until May 20, 2015)
Dr. h. c. Hartmut Mehdorn (until May 15, 2015)
Dr. Kurt Reiner (until May 20, 2015) Mario
Rosa-Bian(until May 20, 2015)
Stefan Schulz (until May 20, 2015)
Information as at December 31, 2015
| 1) | Elected by the employees |
| 2) | Member of the Company’s General and Compensation Committee |
| 3) | Member of the Company’s Audit Committee |
| 4) | Member of the Company’s Technology and Strategy Committee |
| 5) | Member of the Company’s Finance and Investment Committee |
| 6) | Member of the Company’s Nomination Committee |
| 7) | Member of the Company’s Special Committee |
| 8) | Member of the Company’s People and Organization Committee |
Allocating the fair value of the share-based payments to the respective years they are economically linked to the total compensation of the Executive Board members for the years 2015, 2014, and 2013 was as follows:
Executive Board Compensation
| | | | | | | | | | | | |
€ thousands | | 2015 | | | 2014 | | | 2013 | |
| Short-term employee benefits | | | 15,137 | | | | 16,196 | | | | 24,728 | |
| Share-based payment1) | | | 10,365 | | | | 8,098 | | | | 8,603 | |
| Subtotal1) | | | 25,502 | | | | 24,294 | | | | 33,331 | |
| Post-employment benefits | | | 1,278 | | | | 3,249 | | | | 1,324 | |
Thereof defined-benefit | | | 288 | | | | 2,276 | | | | 189 | |
Thereof defined- contribution | | | 990 | | | | 973 | | | | 1,135 | |
| | | | | | | | | | | | |
| Total1) | | | 26,780 | | | | 27,543 | | | | 34,655 | |
| 1) | Portion of total executive compensation allocated to the respective year based on management view |
The share-based payment amounts disclosed above are based on the grant date fair value of the restricted share units (RSUs) issued to Executive Board members during the year.
The Executive Board members already received, in 2012, the LTI grants for the years 2012 to 2015 subject to continuous service as member of the Executive Board in the respective years. Although these grants are linked to and thus, economically, compensation for the Executive Board members in the respective years, section 314 of the German Commercial Code (HGB) requires them to be included in the total compensation number for the year of grant. Upon his appointment to the Executive Board in 2015, Michael Kleinemeier received a grant related to 2015. Vesting of the LTI grants is dependent on the respective Executive Board member’s continuous service for the Company.
The share-based payment as defined in section 314 of the German Commercial Code (HGB) amounts to €263,200 and 4,622 RSUs respectively (2014: €8,720,200) based on the allocation for 2015 for Michael Kleinemeier, which was granted in 2015 in line with his appointment to the Executive Board. The prior-year amount includes the allocations for 2014 and 2015 for Robert Enslin, Bernd Leukert and Luka Mucic, which were granted in 2014 in line with their appointment to the Executive Board.
Considering the grant date fair value of the RSUs allocated during the year instead of the economically allocated amount of share-based payments in the table above, the sum of short-term employee benefits and share-based payment amounts to €15,400,400 (2014: €23,216,200) and the total Executive Board compensation amounts to €16,678,400 (2014: €26,464,700).
Share-Based Payment for Executive Board Members
| | | | | | | | | | | | |
| | | 2015 | | | 2014 | | | 2013 | |
| Number of RSUs granted | | | 192,345 | | | | 153,909 | | | | 152,159 | |
| Number of stock options granted | | | 0 | | | | 0 | | | | 0 | |
| Total expense in € thousands | | | 22,310 | | | | 11,133 | | | | -8,596 | |
In the table above, the share-based payment expense is the amount recorded in profit or loss under IFRS 2 in the respective period.
The defined benefit obligation (DBO) for pensions to Executive Board members and the annual pension entitlement of the members of the Executive Board on reaching age 60 based on entitlements from performance-based and salary-linked plans were as follows:
Retirement Pension Plan for Executive Board Members
| | | | | | | | | | | | |
€ thousands | | 2015 | | | 2014 | | | 2013 | |
| DBO December 31 | | | 8,948 | | | | 11,273 | | | | 9,077 | |
| Annual pension entitlement | | | 427 | | | | 475 | | | | 452 | |
| | |
| Consolidated Financial Statements IFRSNotes | | 191 |
The total annual compensation of the Supervisory Board members for 2015 is as follows:
Supervisory Board Compensation
| | | | | | | | | | | | |
€ thousands | | 2015 | | | 2014 | | | 2013 | |
| Total compensation | | | 3,728 | | | | 3,227 | | | | 2,966 | |
Thereof fixed compensation | | | 3,250 | | | | 924 | | | | 870 | |
Thereof committee remuneration | | | 479 | | | | 515 | | | | 416 | |
Thereof variable compensation | | | NA | | | | 1,788 | | | | 1,680 | |
The Supervisory Board members do not receive any share-based payment for their services. As far as members who are employee representatives on the Supervisory Board receive share-based payment, such compensation is for their services as employees only and is unrelated to their status as members of the Supervisory Board.
Payments to/DBO for Former Executive Board Members
| | | | | | | | | | | | |
€ thousands | | 2015 | | | 2014 | | | 2013 | |
| Payments | | | 1,580 | | | | 3,462 | | | | 1,387 | |
| DBO December 31 | | | 32,758 | | | | 33,764 | | | | 29,181 | |
SAP did not grant any compensation advance or credit to, or enter into any commitment for the benefit of, any member of the Executive Board or Supervisory Board in 2015, 2014, or 2013.
Shareholdings of Executive and Supervisory Board Members
| | | | | | | | | | | | |
Number of SAP shares | | 2015 | | | 2014 | | | 2013 | |
| Executive Board | | | 45,309 | | | | 36,426 | | | | 30,201 | |
| Supervisory Board | | | 90,262,686 | | | | 107,467,372 | | | | 119,316,444 | |
Detailed information about the different elements of the compensation as well as the number of shares owned by members of the Executive Board and the Supervisory Board are disclosed in the Compensation Report, which is part of our Management Report and of our Annual Report on Form 20-F, both of which are available on SAP’s Web site.
| | |
| Consolidated Financial Statements IFRSNotes | | 192 |
(30) RELATED PARTY TRANSACTIONS
Certain Executive Board and Supervisory Board members of SAP SE currently hold, or held within the last year, positions of significant responsibility with other entities, as presented inNote (29). We have relationships with certain of these entities in the ordinary course of business, whereby we buy and sell products, assets and services at prices believed to be consistent with those negotiated at arm’s length between unrelated parties.
Companies controlled by Hasso Plattner, chairman of our Supervisory Board and Chief Software Advisor of SAP, engaged in the following transactions with SAP: providing consulting services to SAP, receiving sport sponsoring from SAP, making purchases of SAP products and services.
Christiane Kuntz-Mayr, vice chairperson and member of the SAP Supervisory Board until May 20, 2015, acted as a managing director of family & kids @ work gemeinnützige UG (“family & kids @ work”).
Wilhelm Haarmann practices as a partner in the law firm Linklaters LLP in Frankfurt am Main, Germany. SAP occasionally purchased and purchases legal and similar services from Linklaters.
Occasionally, members of the Executive Board of SAP SE obtain services from SAP for which they pay a consideration believed to be consistent with those negotiated at arm’s length between unrelated parties.
All amounts related to the abovementioned transactions were immaterial to SAP in all periods presented.
In total, we sold products and services to companies controlled by members of the Supervisory Board in the amount of €1 million (2014: €4 million), we bought products and services from such companies in the amount of €7 million (2014: €1 million), and we provided sponsoring and other financial support to such companies in the amount of €5 million (2014: €7 million). Outstanding balances at year end from transactions with such companies were €0 million (2014: €2 million) for amounts owed to such companies and €0 million (2014: €1 million) for amounts owed by such companies. All these balances are unsecured and interest free and settlement is expected to occur in cash. Commitments (the longest of which is for 10 years) made by us to purchase further goods or services from these companies and to provide further sponsoring and other financial support amount to €11 million as at December 31, 2015 (2014: €13 million).
In total, we sold services to members of the Executive Board and the Supervisory Board in the amount of €2 million (2014:
€0 million) and we received services from members of the Supervisory Board (including services from employee representatives on the Supervisory Board in their capacity as employees of SAP) in the amount of €1 million (2014: €2 million). Amounts owed to Supervisory Board members from these transactions were €0 million as at December 31, 2015 (2014: €0 million). All these balances are unsecured and interest free and settlement is expected to occur in cash.
For information about the compensation of our Executive Board and Supervisory Board members, seeNote (29).
| | |
| Consolidated Financial Statements IFRSNotes | | 193 |
(31) PRINCIPAL ACCOUNTANT FEES AND SERVICES
At the Annual General Meeting of Shareholders held on May 20, 2015, our shareholders elected KPMG AG Wirtschafts-prüfungsgesellschaft as SAP’s independent auditor for 2015.
KPMG AG Wirtschaftsprüfungsgesellschaft and other firms in the global KPMG network charged the following fees to SAP for audit and other professional services related to 2015 and the previous years:
Fees for Audit and Other Professional Services
| | | | | | | | | | | | | | | | | | | | | | | | | | | | | | | | | | | | |
€ millions | | 2015 | | | 2014 | | | 2013 | |
| | | KPMG AG
(Germany) | | | Foreign
KPMG
Firms | | | Total | | | KPMG AG
(Germany) | | | Foreign
KPMG
Firms | | | Total | | | KPMG AG
(Germany) | | | Foreign
KPMG
Firms | | | Total | |
| Audit fees | | | 3 | | | | 6 | | | | 9 | | | | 2 | | | | 6 | | | | 8 | | | | 2 | | | | 7 | | | | 9 | |
| Audit-related fees | | | 0 | | | | 0 | | | | 0 | | | | 0 | | | | 0 | | | | 0 | | | | 1 | | | | 0 | | | | 1 | |
| Tax fees | | | 0 | | | | 0 | | | | 0 | | | | 0 | | | | 0 | | | | 0 | | | | 0 | | | | 0 | | | | 0 | |
| All other fees | | | 0 | | | | 0 | | | | 0 | | | | 0 | | | | 0 | | | | 0 | | | | 0 | | | | 0 | | | | 0 | |
| | | | | | | | | | | | | | | | | | | | | | | | | | | | | | | | | | | | |
| Total | | | 3 | | | | 6 | | | | 9 | | | | 2 | | | | 6 | | | | 8 | | | | 3 | | | | 7 | | | | 10 | |
Audit fees are the aggregate fees charged by KPMG for auditing our consolidated financial statements and the statutory financial statements of SAP SE and its subsidiaries. Audit-related fees are fees charged by KPMG for assurance and related services that are reasonably related to the performance of the audit or review of our financial statements and are not reported under audit fees. Tax fees are fees for professional services rendered by KPMG for tax advice on transfer pricing, restructuring, and tax compliance on current, past, or contemplated transactions. The All other fees category includes other support services, such as training and advisory services on issues unrelated to accounting and taxes.
(32) GERMAN CODE OF CORPORATE GOVERNANCE
The German federal government published the German Code of Corporate Governance in February 2002. The Code contains statutory requirements and a number of recommendations and suggestions. Only the legal requirements are binding for German companies. With regard to the recommendations, the German Stock Corporation Act, section 161, requires that every year listed companies publicly state the extent to which they have implemented them. Companies can deviate from the suggestions without having to make any public statements.
In 2015 and 2014, our Executive Board and Supervisory Board issued the required declarations of implementation. The declaration for 2014 was modified in February 2015. The declaration for 2015 was issued on October 29, 2015. These statements are available on our Web site: www.sap.com/corporate-en/investors/governance.
(33) EVENTS AFTER THE REPORTING PERIOD
After December 31, 2015, the following change took place:
We are in the process of preparing the consolidation of intellectual property rights held by SAP’s group company hybris AG at the level of SAP SE in Germany. Based on deviating applicable tax rates, the Group expects an overall positive income tax effect in a range between approximately €180 million and €220 million in 2016.
| | |
| Consolidated Financial Statements IFRSNotes | | 194 |
(34) SUBSIDIARIES AND OTHER EQUITY INVESTMENTS
Subsidiaries
| | | | | | | | | | | | | | | | | | | | | | |
Name and Location of Company | | Ownership | | | Total
Revenue in
20151) | | | Profit/
Loss (-)
after Tax
for 20151) | | | Total Equity
as at
12/31/20151) | | | Number of
Employees
as at
12/31/20152) | | | Footnote |
| | | % | | | €thousands | | | € thousands | | | € thousands | | | | | | |
| Major Subsidiaries | | | | | | | | | | | | | | | | | | | | | | |
| Ariba, Inc., Palo Alto, CA, United States | | | 100.0 | | | | 642,877 | | | | -145,271 | | | | 3,697,333 | | | | 1,425 | | | |
| Concur Technologies, Inc., Bellevue, WA, United States | | | 100.0 | | | | 638,122 | | | | -18,115 | | | | 6,552,341 | | | | 2,741 | | | |
| LLC SAP CIS, Moscow, Russia | | | 100.0 | | | | 356,480 | | | | -18,607 | | | | 42,319 | | | | 659 | | | |
| SAP (Beijing) Software System Co., Ltd., Beijing, China | | | 100.0 | | | | 759,818 | | | | -83,167 | | | | -94,864 | | | | 4,562 | | | |
| SAP (Schweiz) AG, Biel, Switzerland | | | 100.0 | | | | 751,860 | | | | 45,934 | | | | 44,193 | | | | 611 | | | |
| SAP (UK) Limited, Feltham, United Kingdom | | | 100.0 | | | | 1,132,753 | | | | 16,073 | | | | 15,358 | | | | 1,511 | | | 10) |
| SAP America, Inc., Newtown Square, PA, United States | | | 100.0 | | | | 4,559,147 | | | | -402,385 | | | | 14,709,940 | | | | 6,114 | | | |
| SAP Asia Pte Ltd, Singapore, Singapore | | | 100.0 | | | | 386,585 | | | | -35,614 | | | | 34,567 | | | | 1,020 | | | |
| SAP Australia Pty Ltd, Sydney, Australia | | | 100.0 | | | | 631,863 | | | | -7,537 | | | | 187,392 | | | | 1,064 | | | |
| SAP Brasil Ltda, São Paulo, Brazil | | | 100.0 | | | | 527,180 | | | | -15,176 | | | | 17,826 | | | | 1,481 | | | |
| SAP Canada, Inc., Toronto, Canada | | | 100.0 | | | | 669,947 | | | | 22,740 | | | | 455,322 | | | | 2,598 | | | |
| SAP Deutschland SE & Co. KG, Walldorf, Germany | | | 100.0 | | | | 3,477,774 | | | | 466,454 | | | | 1,258,713 | | | | 4,505 | | | 7),9) |
| SAP France, Levallois Perret, France | | | 100.0 | | | | 1,095,886 | | | | 218,454 | | | | 1,582,376 | | | | 1,427 | | | |
| SAP India Private Limited, Bangalore, India | | | 100.0 | | | | 488,794 | | | | 53,742 | | | | 254,822 | | | | 1,800 | | | |
| SAP Industries, Inc., Newtown Square, PA, United States | | | 100.0 | | | | 601,898 | | | | 40,492 | | | | 538,411 | | | | 385 | | | |
| SAP Italia Sistemi Applicazioni Prodotti in Data Processing S.p.A., Vimercate, Italy | | | 100.0 | | | | 464,458 | | | | 20,554 | | | | 337,584 | | | | 601 | | | |
| SAP Japan Co., Ltd., Tokyo, Japan | | | 100.0 | | | | 681,109 | | | | 30,866 | | | | 515,703 | | | | 994 | | | |
| SAP Labs India Private Limited, Bangalore, India | | | 100.0 | | | | 285,633 | | | | 26,359 | | | | 28,703 | | | | 5,947 | | | |
| SAP Labs, LLC, Palo Alto, CA, United States | | | 100.0 | | | | 582,128 | | | | 10,367 | | | | 314,276 | | | | 1,924 | | | |
| SAP Nederland B.V., ‘s-Hertogenbosch, the Netherlands | | | 100.0 | | | | 494,173 | | | | 21,096 | | | | 17,016 | | | | 504 | | | 11) |
| SAP Service and Support Centre (Ireland) Limited, Dublin, Ireland | | | 100.0 | | | | 114,647 | | | | 6,430 | | | | 41,152 | | | | 1,131 | | | |
| SuccessFactors, Inc., South San Francisco, CA, United States | | | 100.0 | | | | 714,646 | | | | 21,254 | | | | 3,152,160 | | | | 1,104 | | | |
| Sybase, Inc., Dublin, CA, United States | | | 100.0 | | | | 597,125 | | | | 390,137 | | | | 5,897,666 | | | | 677 | | | |
| | | | | | |
Name and Location of Company | | Ownership | | | Footnote |
| | | % | | | |
| Other Subsidiaries3) | | | | | | |
| “SAP Kazakhstan“ LLP, Almaty, Kazakhstan | | | 100.0 | | | |
| 110405, Inc., Newtown Square, PA, United States | | | 100.0 | | | |
| Ambin Properties (Proprietary) Limited, Johannesburg, South Africa | | | 100.0 | | | |
| Ariba Czech s.r.o., Prague, Czech Republic | | | 100.0 | | | |
| Ariba India Private Limited, Gurgaon, India | | | 100.0 | | | |
| Ariba International Holdings, Inc., Wilmington, DE, United States | | | 100.0 | | | |
| Ariba International Singapore Pte Ltd, Singapore, Singapore | | | 100.0 | | | |
| Ariba International, Inc., Wilmington, DE, United States | | | 100.0 | | | |
| Ariba Investment Company, Inc., Wilmington, DE, United States | | | 100.0 | | | |
| Ariba Slovak Republic s.r.o., Košice, Slovakia | | | 100.0 | | | |
| Ariba Software Technology Services (Shanghai) Co., Ltd., Shanghai, China | | | 100.0 | | | |
| Ariba Technologies India Private Limited, Bangalore, India | | | 100.0 | | | |
| | |
| Consolidated Financial Statements IFRSNotes | | 195 |
| | | | | | | | |
Name and Location of Company | | Ownership | | | Footnote | |
| | | % | | | | |
| Ariba Technologies Netherlands B.V., ‘s- Hertogenbosch, the Netherlands | | | 100.0 | | | | 11 | ) |
| Beijing Zhang Zhong Hu Dong Information Technology Co., Ltd., Beijing, China | | | 0 | | | | 5 | ) |
| b-process, Paris, France | | | 100.0 | | | | | |
| Business Objects (UK) Limited, London, United Kingdom | | | 100.0 | | | | | |
| Business Objects Holding B.V., ‘s-Hertogenbosch, the Netherlands | | | 100.0 | | | | 11 | ) |
| Business Objects Option LLC, Wilmington, DE, United States | | | 100.0 | | | | | |
| Business Objects Software (Shanghai) Co., Ltd., Shanghai, China | | | 100.0 | | | | | |
| Business Objects Software Limited, Dublin, Ireland | | | 100.0 | | | | | |
| Christie Partners Holding C.V., Utrecht, the Netherlands | | | 100.0 | | | | | |
| ClearTrip Inc. (Mauritius), Ebene, Mauritius | | | 54.2 | | | | | |
| ClearTrip Inc., George Town, Cayman Islands | | | 54.2 | | | | | |
| Cleartrip MEA FZ LLC, Dubai, United Arab Emirates | | | 54.2 | | | | | |
| ClearTrip Private Limited, Mumbai, India | | | 54.2 | | | | | |
| CNQR Operations Mexico S. de. R.L. de. C.V., San Pedro Garza Garcia, Mexico | | | 100.0 | | | | | |
| Concur (Austria) GmbH, Vienna, Austria | | | 100.0 | | | | | |
| Concur (Canada), Inc., Toronto, Canada | | | 100.0 | | | | | |
| Concur (France) SAS, Paris, France | | | 100.0 | | | | | |
| Concur (Germany) GmbH, Frankfurt am Main, Germany | | | 100.0 | | | | | |
| Concur (Italy) S.r.l., Milan, Italy | | | 100.0 | | | | | |
| Concur (Japan) Ltd., Bunkyo-ku, Japan | | | 75.0 | | | | | |
| Concur (New Zealand) Limited, Wellington, New Zealand | | | 100.0 | | | | | |
| Concur (Philippines) Inc., Makati City, Philippines | | | 100.0 | | | | | |
| Concur (Switzerland) GmbH, Zurich, Switzerland | | | 100.0 | | | | | |
| Concur Czech (s.r.o.), Prague, Czech Republic | | | 100.0 | | | | | |
| Concur Denmark ApS, Frederiksberg, Denmark | | | 100.0 | | | | | |
| Concur Holdings (France) SAS, Paris, France | | | 100.0 | | | | | |
| Concur Holdings (Netherlands) B.V., Amsterdam, the Netherlands | | | 100.0 | | | | 11 | ) |
| Concur Holdings (US) LLC, Wilmington, DE, United States | | | 100.0 | | | | | |
| Concur International Holdings (Netherlands) CV, Amsterdam, the Netherlands | | | 100.0 | | | | | |
| Concur Technologies (Australia) Pty. Limited, Sydney, Australia | | | 100.0 | | | | | |
| Concur Technologies (Hong Kong) Limited, Hong Kong, China | | | 100.0 | | | | | |
| Concur Technologies (India) Private Limited, Bangalore, India | | | 100.0 | | | | | |
| Concur Technologies (Singapore) Pte Ltd, Singapore, Singapore | | | 100.0 | | | | | |
| Concur Technologies (UK) Limited, London, United Kingdom | | | 100.0 | | | | 10 | ) |
| ConTgo Consulting Limited, London, United Kingdom | | | 100.0 | | | | 10 | ) |
| ConTgo Limited, London, United Kingdom | | | 100.0 | | | | 10 | ) |
| ConTgo MTA Limited, London, United Kingdom | | | 100.0 | | | | 10 | ) |
| ConTgo Pty. Ltd., Sydney, Australia | | | 100.0 | | | | | |
| Crossgate UK Limited, Slough, United Kingdom | | | 100.0 | | | | | |
| Crystal Decisions (Ireland) Limited, Dublin, Ireland | | | 100.0 | | | | | |
| Crystal Decisions Holdings Limited, Dublin, Ireland | | | 100.0 | | | | | |
| Crystal Decisions UK Limited, London, United Kingdom | | | 100.0 | | | | | |
| EssCubed Procurement Pty. Ltd., Johannesburg, South Africa | | | 100.0 | | | | | |
| Extended Systems, Inc., Dublin, CA, United States | | | 100.0 | | | | | |
| Fieldglass AsiaPac PTY Ltd, Brisbane, Australia | | | 100.0 | | | | | |
| Fieldglass Europe Limited, London, United Kingdom | | | 100.0 | | | | 10 | ) |
| Financial Fusion, Inc., Dublin, CA, United States | | | 100.0 | | | | | |
| FreeMarkets International Holdings Inc. de Mexico, de S. de R.L. de C.V., Mexico City, Mexico | | | 100.0 | | | | | |
| FreeMarkets Ltda., São Paulo, Brazil | | | 100.0 | | | | | |
| Gelco Information Network, Inc., Minneapolis, MN, United States | | | 100.0 | | | | | |
| GlobalExpense (Consulting) Limited, London, United Kingdom | | | 100.0 | | | | | |
| GlobalExpense (UK) Limited, London, United Kingdom | | | 100.0 | | | | 10 | ) |
| H-G Holdings, Inc., Wilmington, DE, United States | | | 100.0 | | | | | |
| H-G Intermediate Holdings, Inc., Wilmington, DE, United States | | | 100.0 | | | | | |
| hybris (US) Corp., Wilmington, DE, United States | | | 100.0 | | | | | |
| hybris AG, Zug, Switzerland | | | 100.0 | | | | | |
| hybris Australia Pty Limited, Surry Hills, Australia | | | 100.0 | | | | | |
| hybris GmbH, Munich, Germany | | | 100.0 | | | | 9 | ) |
| hybris Hong Kong Limited, Hong Kong, China | | | 100.0 | | | | | |
| hybris UK Limited, London, United Kingdom | | | 100.0 | | | | 10 | ) |
| Inxight Federal Systems Group, Inc., Wilmington, DE, United States | | | 100.0 | | | | | |
| KXEN Limited, Feltham, United Kingdom | | | 100.0 | | | | | |
| LLC “SAP Labs”, Moscow, Russia | | | 100.0 | | | | | |
| LLC “SAP Ukraine”, Kiev, Ukraine | | | 100.0 | | | | | |
| Merlin Systems Oy, Espoo, Finland | | | 100.0 | | | | | |
| Multiposting SAS, Paris, France | | | 100.0 | | | | 4 | ) |
| Multiposting Sp.z o.o., Warsaw, Poland | | | 100.0 | | | | 4 | ) |
| Nihon Ariba K.K., Tokyo, Japan | | | 100.0 | | | | | |
| OutlookSoft Deutschland GmbH, Walldorf, Germany | | | 100.0 | | | | | |
| Plateau Systems Australia Ltd, Brisbane, Australia | | | 100.0 | | | | | |
| | |
| Consolidated Financial Statements IFRSNotes | | 196 |
| | | | | | | | |
Name and Location of Company | | Ownership | | | Footnote | |
| | | % | | | | |
| Plateau Systems LLC, South San Francisco, CA, United States | | | 100.0 | | | | | |
| PT SAP Indonesia, Jakarta, Indonesia | | | 99.0 | | | | | |
| PT Sybase 365 Indonesia, Jakarta, Indonesia | | | 100.0 | | | | | |
| Quadrem Africa Pty. Ltd., Johannesburg, South Africa | | | 100.0 | | | | | |
| Quadrem Australia Pty Ltd., Brisbane, Australia | | | 100.0 | | | | | |
| Quadrem Brazil Ltda., Rio de Janeiro, Brazil | | | 100.0 | | | | | |
| Quadrem Chile Ltda., Santiago de Chile, Chile | | | 100.0 | | | | | |
| Quadrem Colombia SAS, Bogotá, Colombia | | | 100.0 | | | | | |
| Quadrem International Ltd., Hamilton, Bermuda | | | 100.0 | | | | | |
| Quadrem Netherlands B.V., Amsterdam, the Netherlands | | | 100.0 | | | | 11 | ) |
| Quadrem Overseas Cooperatief U.A., Amsterdam, the Netherlands | | | 100.0 | | | | | |
| Quadrem Peru S.A.C., Lima, Peru | | | 100.0 | | | | | |
| Ruan Lian Technologies (Beijing) Co., Ltd., Beijing, China | | | 100.0 | | | | | |
| San Borja Partricipadoes LTDA, São Paulo, Brazil | | | 100.0 | | | | | |
| SAP Andina y del Caribe, C.A., Caracas, Venezuela | | | 100.0 | | | | | |
| SAP Argentina S.A., Buenos Aires, Argentina | | | 100.0 | | | | | |
| SAP Asia (Vietnam) Co., Ltd., Ho Chi Minh City, Vietnam | | | 100.0 | | | | | |
| SAP Azerbaijan LLC, Baku, Azerbaijan | | | 100.0 | | | | 4 | ) |
| SAP Belgium NV/SA, Brussels, Belgium | | | 100.0 | | | | | |
| SAP Beteiligungs GmbH, Walldorf, Germany | | | 100.0 | | | | | |
| SAP Bulgaria EOOD, Sofia, Bulgaria | | | 100.0 | | | | | |
| SAP Business Compliance Services GmbH, Siegen, Germany | | | 100.0 | | | | | |
| SAP Business Services Center Europe s.r.o., Prague, Czech Republic | | | 100.0 | | | | | |
| SAP Business Services Center Nederland B.V., ‘s- Hertogenbosch, the Netherlands | | | 100.0 | | | | 11 | ) |
| SAP Chile Limitada, Santiago, Chile | | | 100.0 | | | | | |
| SAP China Co., Ltd., Shanghai, China | | | 100.0 | | | | 4 | ) |
| SAP China Holding Co., Ltd., Beijing, China | | | 100.0 | | | | 4 | ) |
| SAP Colombia SAS., Bogotá, Colombia | | | 100.0 | | | | | |
| SAP Commercial Services Ltd., Valletta, Malta | | | 100.0 | | | | | |
| SAP Costa Rica, S.A., San José, Costa Rica | | | 100.0 | | | | | |
| SAP ČR, spol. s r.o., Prague, Czech Republic | | | 100.0 | | | | | |
| SAP Cyprus Ltd, Nicosia, Cyprus | | | 100.0 | | | | | |
| SAP d.o.o., Zagreb, Croatia | | | 100.0 | | | | | |
| SAP Danmark A/S, Copenhagen, Denmark | | | 100.0 | | | | | |
| SAP Dritte Beteiligungs- und Vermögensverwaltungs GmbH, Walldorf, Germany | | | 100.0 | | | | 8 | ),9) |
| SAP East Africa Limited, Nairobi, Kenya | | | 100.0 | | | | | |
| SAP Egypt LLC, Cairo, Egypt | | | 100.0 | | | | | |
| SAP EMEA Inside Sales S.L., Barcelona, Spain | | | 100.0 | | | | | |
| SAP Erste Beteiligungs- und Vermögensverwaltungs GmbH, Walldorf, Germany | | | 100.0 | | | | 8 | ),9) |
| SAP España – Sistemas, Aplicaciones y Productos en la Informática, S.A., Madrid, Spain | | | 100.0 | | | | | |
| SAP Estonia OÜ, Tallinn, Estonia | | | 100.0 | | | | | |
| SAP Financial, Inc., Toronto, Canada | | | 100.0 | | | | | |
| SAP Finland Oy, Espoo, Finland | | | 100.0 | | | | | |
| SAP Foreign Holdings GmbH, Walldorf, Germany | | | 100.0 | | | | | |
| SAP France Holding, Levallois Perret, France | | | 100.0 | | | | | |
| SAP Fünfte Beteiligungs- und Vermögensverwaltungs GmbH, Walldorf, Germany | | | 100.0 | | | | 9 | ) |
| SAP Global Marketing, Inc., New York, NY, United States | | | 100.0 | | | | | |
| SAP Hellas S.A., Athens, Greece | | | 100.0 | | | | | |
| SAP Holdings (UK) Limited, Feltham, United Kingdom | | | 100.0 | | | | 10 | ) |
| SAP Hong Kong Co., Ltd., Hong Kong, China | | | 100.0 | | | | | |
| SAP Hosting Beteiligungs GmbH, St. Leon-Rot, Germany | | | 100.0 | | | | | |
| SAP Hungary Rendszerek, Alkalmazások és Termékek az Adatfeldolgozásban Informatikai Kft., Budapest, Hungary | | | 100.0 | | | | | |
| SAP India (Holding) Pte Ltd, Singapore, Singapore | | | 100.0 | | | | | |
| SAP International Panama, S.A., Panama City, Panama | | | 100.0 | | | | | |
| SAP International, Inc., Miami, FL, United States | | | 100.0 | | | | | |
| SAP Investments, Inc., Wilmington, DE, United States | | | 100.0 | | | | | |
| SAP Ireland Limited, Dublin, Ireland | | | 100.0 | | | | | |
| SAP Ireland-US Financial Services Ltd., Dublin, Ireland | | | 100.0 | | | | | |
| SAP Israel Ltd., Ra’anana, Israel | | | 100.0 | | | | | |
| SAP Korea Ltd., Seoul, South Korea | | | 100.0 | | | | | |
| SAP Labs Bulgaria EOOD, Sofia, Bulgaria | | | 100.0 | | | | | |
| SAP Labs Finland Oy, Espoo, Finland | | | 100.0 | | | | | |
| SAP Labs France SAS, Mougins, France | | | 100.0 | | | | | |
| SAP Labs Israel Ltd., Ra’anana, Israel | | | 100.0 | | | | | |
| SAP Labs Korea, Inc., Seoul, South Korea | | | 100.0 | | | | | |
| SAP Latvia SIA, Riga, Latvia | | | 100.0 | | | | | |
| SAP Malaysia Sdn. Bhd., Kuala Lumpur, Malaysia | | | 100.0 | | | | | |
| SAP Malta Investments Ltd., Valletta, Malta | | | 100.0 | | | | | |
| SAP México S.A. de C.V., Mexico City, Mexico | | | 100.0 | | | | | |
| SAP Middle East and North Africa L.L.C., Dubai, United Arab Emirates | | | 49.0 | | | | 5 | ) |
| SAP National Security Services, Inc., Newtown Square, PA, United States | | | 100.0 | | | | | |
| SAP Nederland Holding B.V., ‘s-Hertogenbosch, the Netherlands | | | 100.0 | | | | 11 | ) |
| | |
| Consolidated Financial Statements IFRSNotes | | 197 |
| | | | | | | | |
Name and Location of Company | | Ownership | | | Footnote | |
| | | % | | | | |
| SAP New Zealand Limited, Auckland, New Zealand | | | 100.0 | | | | | |
| SAP Norge AS, Lysaker, Norway | | | 100.0 | | | | | |
| SAP North West Africa Ltd, Casablanca, Morocco | | | 100.0 | | | | 4 | ) |
| SAP Österreich GmbH, Vienna, Austria | | | 100.0 | | | | | |
| SAP PERU S.A.C., Lima, Peru | | | 100.0 | | | | | |
| SAP Philippines, Inc., Makati, Philippines | | | 100.0 | | | | | |
| SAP Polska Sp. z o.o., Warsaw, Poland | | | 100.0 | | | | | |
| SAP Portals Europe GmbH, Walldorf, Germany | | | 100.0 | | | | | |
| SAP Portals Holding Beteiligungs GmbH, Walldorf, Germany | | | 100.0 | | | | | |
| SAP Portals Israel Ltd., Ra’anana, Israel | | | 100.0 | | | | | |
| SAP Portugal – Sistemas, Aplicações e Produtos Informáticos, Sociedade Unipessoal, Lda., Porto Salvo, Portugal | | | 100.0 | | | | | |
| SAP Projektverwaltungs- und Beteiligungs GmbH, Walldorf, Germany | | | 100.0 | | | | 8 | ) |
| SAP Public Services Hungary Kft., Budapest, Hungary | | | 100.0 | | | | | |
| SAP Public Services, Inc., Washington, DC, United States | | | 100.0 | | | | | |
| SAP Puerto Rico GmbH, Walldorf, Germany | | | 100.0 | | | | 9 | ) |
| SAP Retail Solutions Beteiligungsgesellschaft mbH, Walldorf, Germany | | | 100.0 | | | | | |
| SAP Romania SRL, Bucharest, Romania | | | 100.0 | | | | | |
| SAP Saudi Arabia Software Services Ltd, Riyadh, Kingdom of Saudi Arabia | | | 100.0 | | | | | |
| SAP Saudi Arabia Software Trading Ltd, Riyadh, Kingdom of Saudi Arabia | | | 75.0 | | | | | |
| SAP Sechste Beteiligungs- und Vermögensverwaltungs GmbH, Walldorf, Germany | | | 100.0 | | | | 9 | ) |
| SAP sistemi, aplikacije in produkti za obdelavo podatkov d.o.o., Ljubljana, Slovenia | | | 100.0 | | | | | |
| SAP Slovensko s.r.o., Bratislava, Slovakia | | | 100.0 | | | | | |
| SAP Software and Services LLC, Doha, Qatar | | | 49.0 | | | | 4 | ),5) |
| SAP Svenska Aktiebolag, Stockholm, Sweden | | | 100.0 | | | | | |
| SAP Systems, Applications and Products in Data Processing (Thailand) Ltd., Bangkok, Thailand | | | 100.0 | | | | | |
| SAP Taiwan Co., Ltd., Taipei, Taiwan | | | 100.0 | | | | | |
| SAP Technologies Inc., Palo Alto, CA, United States | | | 100.0 | | | | | |
| SAP Training and Development Institute FZCO, Dubai, United Arab Emirates | | | 100.0 | | | | | |
| SAP Türkiye Yazilim Üretim ve Ticaret AŞ., Istanbul, Turkey | | | 100.0 | | | | | |
| SAP UAB, Vilnius, Lithuania | | | 100.0 | | | | | |
| SAP Ventures Investment GmbH, Walldorf, Germany | | | 100.0 | | | | 9 | ) |
| SAP Vierte Beteiligungs- und Vermögensverwaltungs GmbH, Walldorf, Germany | | | 100.0 | | | | | |
| SAP West Balkans d.o.o., Belgrade, Serbia | | | 100.0 | | | | | |
| SAP Zweite Beteiligungs- und Vermögensverwaltungs GmbH, Walldorf, Germany | | | 100.0 | | | | 8 | ),9) |
| Sapphire SAP HANA Fund of Funds, L.P., Wilmington, DE, United States | | | 0 | | | | 6 | ) |
| Sapphire Ventures Fund I, L.P., Wilmington, DE, United States | | | 0 | | | | 6 | ) |
| Sapphire Ventures Fund II, L.P., Wilmington, DE, United States | | | 0 | | | | 6 | ) |
| SAPV (Mauritius), Ebene, Mauritius | | | 0 | | | | 6 | ) |
| SAS Financière Multiposting, Paris, France | | | 100.0 | | | | 4 | ) |
| SeeWhy (UK) Limited, Windsor, United Kingdom | | | 100.0 | | | | 10 | ) |
| Shanghai SuccessFactors Software Technology Co., Ltd., Shanghai, China | | | 100.0 | | | | | |
| SuccessFactors (Philippines), Inc., Pasig City, Philippines | | | 100.0 | | | | | |
| SuccessFactors (UK) Limited, London, United Kingdom | | | 100.0 | | | | 10 | ) |
| SuccessFactors Asia Pacific Limited, Hong Kong, China | | | 100.0 | | | | | |
| SuccessFactors Australia Holdings Pty Ltd, Brisbane, Australia | | | 100.0 | | | | | |
| SuccessFactors Australia Pty Limited, Brisbane, Australia | | | 100.0 | | | | | |
| SuccessFactors Cayman, Ltd., Grand Cayman, Cayman Islands | | | 100.0 | | | | | |
| SuccessFactors Hong Kong Limited, Hong Kong, China | | | 100.0 | | | | | |
| SuccessFactors International Holdings, LLC, San Mateo, CA, United States | | | 100.0 | | | | | |
| Sybase (UK) Limited, Maidenhead, United Kingdom | | | 100.0 | | | | | |
| Sybase 365 Ltd., Tortola, British Virgin Islands | | | 100.0 | | | | | |
| Sybase 365, LLC, Dublin, CA, United States | | | 100.0 | | | | | |
| Sybase Angola, LDA, Luanda, Angola | | | 100.0 | | | | | |
| Sybase Iberia S.L., Madrid, Spain | | | 100.0 | | | | | |
| Sybase India Ltd., Mumbai, India | | | 100.0 | | | | | |
| Sybase International Holdings Corporation, LLC, Dublin, CA, United States | | | 100.0 | | | | | |
| Sybase Philippines, Inc., Makati City, Philippines | | | 100.0 | | | | | |
| Sybase Software (China) Co., Ltd., Beijing, China | | | 100.0 | | | | | |
| Sybase Software (India) Private Ltd., Mumbai, India | | | 100.0 | | | | | |
| Syclo International Limited, Leeds, United Kingdom | | | 100.0 | | | | | |
| Systems Applications Products Africa (Proprietary) Limited, Johannesburg, South Africa | | | 100.0 | | | | | |
| Systems Applications Products Africa Region (Proprietary) Limited, Johannesburg, South Africa | | | 100.0 | | | | | |
| Systems Applications Products Nigeria Limited, Victoria Island, Nigeria | | | 100.0 | | | | | |
| Systems Applications Products South Africa (Proprietary) Limited, Johannesburg, South Africa | | | 89.5 | | | | | |
| TechniData GmbH, Markdorf, Germany | | | 100.0 | | | | | |
| | |
| Consolidated Financial Statements IFRSNotes | | 198 |
| | | | | | | | |
Name and Location of Company | | Ownership | | | Footnote | |
| | | % | | | | |
| Technology Licensing Company, LLC, Atlanta, GA, United States | | | 100.0 | | | | | |
| TomorrowNow, Inc., Bryan, TX, United States | | | 100.0 | | | | | |
| Travel Technology, LLC, Atlanta, GA, United States | | | 100.0 | | | | | |
| TripIt LLC, Wilmington, DE, United States | | | 100.0 | | | | | |
| TRX Data Service, Inc., Glen Allen, VA, United States | | | 100.0 | | | | | |
| TRX Europe Limited, London, United Kingdom | | | 100.0 | | | | 10 | ) |
| TRX Fulfillment Services, LLC, Atlanta, GA, United States | | | 100.0 | | | | | |
| TRX Germany GmbH, Berlin, Germany | | | 100.0 | | | | | |
| TRX Luxembourg, S.a.r.l., Luxembourg City, Luxembourg | | | 100.0 | | | | | |
| TRX Technologies India Private Limited, Raman Nagar, India | | | 100.0 | | | | | |
| TRX Technology Services, L.P., Atlanta, GA, United States | | | 100.0 | | | | | |
| TRX UK Limited, London, United Kingdom | | | 100.0 | | | | 10 | ) |
| TRX, Inc., Atlanta, GA, United States | | | 100.0 | | | | | |
| 1) | These figures are based on our local IFRS financial statements prior to eliminations resulting from consolidation and therefore do not reflect the contribution of these companies included in the Consolidated Financial Statements. The translation of the equity into Group currency is based on period-end closing exchange rates, and on average exchange rates for revenue and net income/loss. |
| 2) | As at December 31, 2015, including managing directors, in FTE. |
| 3) | Figures for profit/loss after tax and total equity pursuant to HGB, section 285 and section 313 are not disclosed if they are of minor significance for a fair presentation of the profitability, liquidity, capital resources and financial position of SAP SE, pursuant to HGB, section 313 (2) sentence 3 no. 4 and section 286 (3) sentence 1 no. 1. |
| 4) | Consolidated for the first time in 2015. |
| 5) | Agreements with the other shareholders provide that SAP SE fully controls the entity. |
| 6) | SAP SE does not hold any ownership interests in four structured entities, SAPV (Mauritius), Sapphire SAP HANA Fund of Funds, L.P., Sapphire Ventures Fund I, L.P. and Sapphire Ventures Fund II, L.P. However, based on the terms of limited partnership agreements under which these entities were established, SAP SE is exposed to the majority of the returns related to their operations and has the current ability to direct these entities’ activities that affect these returns, in accordance with IFRS 10 (Consolidated Financial Statements). Accordingly, the results of operations are included in SAP’s consolidated financial statements. |
| 7) | Entity whose personally liable partner is SAP SE. |
| 8) | Entity with profit and loss transfer agreement. |
| 9) | Pursuant to HGB, section 264 (3) or section 264b, the subsidiary is exempt from applying certain legal requirements to their statutory stand-alone financial statements including the requirement to prepare notes to the financial statements and a review of operations, the requirement of independent audit and the requirement of public disclosure. |
| 10) | Pursuant to sections 479A to 479C of the UK Companies Act 2006, the entity is exempt from having its financial statements audited on the basis that SAP SE has provided a guarantee of the entity’s liabilities in respect of its financial year ended 31 December 2015. |
| 11) | Pursuant to article 2:403 of the Dutch Civil Code, the entity is exempt from applying certain legal requirements to their statutory stand-alone financial statements including the requirement to prepare the financial statements, the requirement of independent audit and the requirement of public disclosure on the basis that SAP SE has provided a guarantee of the entity’s liabilities in respect of its financial year ended 31 December 2015. |
Other Equity Investments
| | | | |
Name and Location of Company | | Ownership | |
| | | % | |
| Joint Arrangements and Investments in Associates | | | | |
| China DataCom Corporation Limited, Guangzhou, China | | | 28.30 | |
| Convercent, Inc., Denver, CO, United States | | | 44.16 | |
| Evature Technologies (2009) Ltd., Ramat Gan, Israel | | | 30.46 | |
| Greater Pacific Capital (Cayman) L.P., Grand Cayman, Cayman Islands | | | 5.35 | |
| Nor1, Inc., Santa Clara, CA, United States | | | 18.64 | |
| Procurement Negócios Eletrônicos S/A, Rio de Janeiro, Brazil | | | 17.00 | |
| SAP - NOVABASE, A.C.E., Porto Salvo, Portugal | | | 66.66 | |
| StayNTouch Inc., Bethesda, MD, United States | | | 37.40 | |
| Visage Mobile Inc., San Francisco, CA, United States | | | 40.60 | |
| Yapta, Inc., Seattle, WA , United States | | | 46.49 | |
| |
Name and Location of Company | | | |
| |
| Equity Investments with Ownership of at Least 5% | | | | |
| Alchemist Accelerator Fund I LLC, San Francisco, CA, United States | | | | |
| All Tax Platform - Solucoes Tributarias S.A., São Paulo, Brazil | | | | |
| Alteryx, Inc., Irvine, CA, United States | | | | |
| Amplify Partners II L.P., Cambridge, MA, United States | | | | |
| Amplify Partners L.P., Cambridge, MA, United States | | | | |
| AP Opportunity Fund, LLC, Menlo Park, CA, United States | | | | |
| ArisGlobal Holdings LLC, Stamford, CT, United States | | | | |
| Char Software, Inc., Boston, MA, United States | | | | |
| Costanoa Venture Capital II L.P., Palo Alto, CA, United States | | | | |
| Costanoa Venture Capital QZ, LLC, Palo Alto, CA, United States | | | | |
| Cyphort, Inc., Santa Clara, CA, United States | | | | |
| Data Collective II L.P., San Francisco, CA, United States | | | | |
| Data Collective III L.P., San Francisco, CA, United States | | | | |
| EIT ICT Labs GmbH, Berlin, Germany | | | | |
| FeedZai S.A., Lisbon, Portugal | | | | |
| Follow Analytics, Inc., San Francisco, CA, United States | | | | |
| GK Software AG, Schöneck, Germany | | | | |
| IDG Ventures USA III, L.P., San Francisco, CA, United States | | | | |
| InnovationLab GmbH, Heidelberg, Germany | | | | |
| Integral Ad Science, Inc., New York, NY, United States | | | | |
| iYogi Holdings Pvt. Ltd., Port Louis, Mauritius | | | | |
| Jibe, Inc., New York, NY, United States | | | | |
| Kaltura, Inc., New York, NY, United States | | | | |
| Krux Digital, Inc., San Francisco, CA, United States | | | | |
| | |
| Consolidated Financial Statements IFRSNotes | | 199 |
|
Name and Location of Company |
| Lavante, Inc., San Jose, CA, United States |
| Local Globe VII, L.P., St. Peter Port, Guernsey, Channel Islands |
| Looker Data Sciences, Inc., Santa Cruz, CA, United States |
| MuleSoft, Inc., San Francisco, CA, United States |
| MVP Strategic Partnership Fund GmbH & Co. KG, Grünwald, Germany |
| Narrative Science, Inc., Chicago, IL, United States |
| Notation Capital, L.P., Brooklyn, NY, United States |
| On Deck Capital, Inc., New York, NY, United States |
| OpenX Software Limited, Pasadena, CA, United States |
| Patent Quality, Inc., Bellevue, WA, United States |
| Point Nine Capital Fund II GmbH & Co. KG, Berlin, Germany |
| Point Nine Capital Fund III GmbH & Co. KG, Berlin, Germany |
| Post for Systems, Cairo, Egypt |
| PubNub, Inc., San Francisco, CA, United States |
| Realize Corporation, Tokyo, Japan |
| Return Path, Inc., New York, NY, United States |
| Rome2rio Pty. Ltd., Albert Park, Australia |
| Scytl, S.A., Barcelona, Spain |
| Smart City Planning, Inc., Tokyo, Japan |
| Socrata, Inc., Seattle, WA, United States |
| Storm Ventures V, L.P., Menlo Park, CA, United States |
| SV Angel IV L.P., San Francisco, CA, United States |
| T3C Inc., Mountain View, CA, United States |
| TableNow, Inc., San Francisco, CA, United States |
| Technologie- und Gründerzentrum Walldorf Stiftung GmbH, |
| Walldorf, Germany |
| The Currency Cloud Group Limited, London, United Kingdom |
| The SAVO Group Ltd., Chicago, IL, United States |
| TidalScale, Inc., Santa Clara, CA, United States |
| Upfront V, L.P., Santa Monica, CA, United States |
Walldorf, February 25, 2016
SAP SE
Walldorf, Baden
The Executive Board
| | |
| |
| Bill McDermott | | Robert Enslin |
| |
| Michael Kleinemeier | | Bernd Leukert |
| |
| Luka Mucic | | Gerhard Oswald |
| | |
| Consolidated Financial Statements IFRSNotes | | 200 |
Management’s Annual Report on Internal Control over Financial Reporting in the Consolidated Financial Statements
U.S. law requires that management submit a report on the effectiveness of internal control over financial reporting in the consolidated financial statements. For 2015, that report is as follows:
The management of SAP is responsible for establishing and maintaining adequate internal control over financial reporting as such term is defined in Rules 13a–15(f) and 15d–15(f) under the U.S. Securities Exchange Act of 1934. SAP’s internal control over financial reporting is a process designed under the supervision of SAP’s CEO and CFO to provide reasonable assurance regarding the reliability of financial reporting and the preparation of financial statements for external reporting purposes in accordance with International Financial Reporting Standards (IFRS) as issued by the International Accounting Standards Board (IASB).
SAP’s management assessed the effectiveness of the Company’s internal control over financial reporting as at December 31, 2015. In making this assessment, it used the criteria set forth by the Committee of Sponsoring Organizations of the Treadway Commission (COSO) in Internal Control — Integrated Framework (2013).
Based on the assessment under these criteria, SAP management has concluded that, as at December 31, 2015, the Company’s internal control over financial reporting was effective.
KPMG AG Wirtschaftsprüfungsgesellschaft, our independent registered public accounting firm, has issued its attestation report on the effectiveness of SAP’s internal control over financial reporting. It is included in the independent auditor’s report on the Consolidated Financial Statements as at December 31, 2015.
| | |
Consolidated Financial Statements IFRS Management’s Annual Report on Internal Control over Financial Reporting in the Consolidated Financial Statements | | 201 |
Additional Information
202
Five-Year Summary 1)
SAP GROUP
| | | | | | | | | | | | | | | | | | | | |
€ millions, unless otherwise stated | | 2015 | | | 2014 | | | 2013 | | | 2012 | | | 2011 | |
| Revenues | | | | | | | | | | | | | | | | | | | | |
Cloud subscriptions and support (IFRS) | | | 2,286 | | | | 1,087 | | | | 696 | | | | 270 | | | | 18 | |
Non-IFRS adjustments | | | 10 | | | | 14 | | | | 61 | | | | 73 | | | | 0 | |
Cloud subscriptions and support (non-IFRS) | | | 2,296 | | | | 1,101 | | | | 757 | | | | 343 | | | | 18 | |
Software licenses and support (IFRS) | | | 14,928 | | | | 13,228 | | | | 12,809 | | | | 12,532 | | | | 11,012 | |
Non-IFRS adjustments | | | 2 | | | | 5 | | | | 21 | | | | 9 | | | | 27 | |
Software licenses and support (non-IFRS) | | | 14,930 | | | | 13,233 | | | | 12,830 | | | | 12,540 | | | | 11,038 | |
Cloud and software (IFRS) | | | 17,214 | | | | 14,315 | | | | 13,505 | | | | 12,801 | | | | 11,030 | |
Non-IFRS adjustments | | | 11 | | | | 19 | | | | 82 | | | | 81 | | | | 27 | |
Cloud and software (non-IFRS) | | | 17,226 | | | | 14,334 | | | | 13,587 | | | | 12,883 | | | | 11,057 | |
Services (IFRS = non-IFRS) | | | 3,579 | | | | 3,245 | | | | 3,310 | | | | 3,421 | | | | 3,203 | |
Total revenue (IFRS) | | | 20,793 | | | | 17,560 | | | | 16,815 | | | | 16,223 | | | | 14,233 | |
Non-IFRS adjustments | | | 11 | | | | 19 | | | | 82 | | | | 81 | | | | 27 | |
Total revenue (non-IFRS) | | | 20,805 | | | | 17,580 | | | | 16,897 | | | | 16,304 | | | | 14,260 | |
| | | | | |
| Operating expenses | | | | | | | | | | | | | | | | | | | | |
Cost of cloud subscriptions and support2)(IFRS) | | | 1,022 | | | | 481 | | | | 314 | | | | NA | | | | NA | |
Non-IFRS adjustments2) | | | -232 | | | | -88 | | | | -97 | | | | NA | | | | NA | |
Cost of cloud subscriptions and support2)(non-IFRS) | | | 789 | | | | 393 | | | | 218 | | | | NA | | | | NA | |
Cost of software licenses and support2)(IFRS) | | | 2,291 | | | | 2,076 | | | | 2,056 | | | | NA | | | | NA | |
Non-IFRS adjustments2) | | | -283 | | | | -258 | | | | -263 | | | | NA | | | | NA | |
Cost of software licenses and support2)(non-IFRS) | | | 2,008 | | | | 1,818 | | | | 1,793 | | | | NA | | | | NA | |
Cost of cloud and software (IFRS) | | | 3,313 | | | | 2,557 | | | | 2,370 | | | | 2,339 | | | | 1,948 | |
Non-IFRS adjustments | | | -516 | | | | -346 | | | | -360 | | | | -411 | | | | -285 | |
Cost of cloud and software (non-IFRS) | | | 2,797 | | | | 2,211 | | | | 2,011 | | | | 1,929 | | | | 1,663 | |
Cost of services (IFRS) | | | 3,313 | | | | 2,716 | | | | 2,660 | | | | 2,734 | | | | 2,406 | |
Non-IFRS adjustments | | | -180 | | | | -125 | | | | -128 | | | | -132 | | | | -33 | |
Cost of services (non-IFRS) | | | 3,133 | | | | 2,590 | | | | 2,533 | | | | 2,602 | | | | 2,373 | |
Total cost of revenue (IFRS) | | | 6,626 | | | | 5,272 | | | | 5,031 | | | | 5,073 | | | | 4,354 | |
Non-IFRS adjustments | | | -696 | | | | -471 | | | | -487 | | | | -542 | | | | -318 | |
Total cost of revenue (non-IFRS) | | | 5,930 | | | | 4,801 | | | | 4,543 | | | | 4,531 | | | | 4,036 | |
Research and development (IFRS) | | | 2,845 | | | | 2,331 | | | | 2,282 | | | | 2,261 | | | | 1,935 | |
Research and development (as a percentage of total revenue, IFRS) | | | 13.7 | | | | 13.3 | | | | 13.6 | | | | 13.9 | | | | 13.6 | |
Research and development (as a percentage of total operating expenses, IFRS) | | | 17.2 | | | | 17.6 | | | | 18.5 | | | | 18.6 | | | | 20.7 | |
Sales and marketing (IFRS) | | | 5,401 | | | | 4,304 | | | | 4,131 | | | | 3,912 | | | | 3,083 | |
General and administration (IFRS) | | | 1,048 | | | | 892 | | | | 866 | | | | 949 | | | | 715 | |
Depreciation and amortization (IFRS) | | | 1,289 | | | | 1,010 | | | | 951 | | | | 863 | | | | 724 | |
| | | | | | | | | | | | | | | | | | | | |
€ millions, unless otherwise stated | | 2015 | | | 2014 | | | 2013 | | | 2012 | | | 2011 | |
| Profits and Margins | | | | | | | | | | | | | | | | | | | | |
Cloud subscriptions and support margin2)(as a percentage of corresponding revenue, IFRS) | | | 55.3 | | | | 55.8 | | | | 54.8 | | | | NA | | | | NA | |
Cloud subscriptions and support margin2)(as a percentage of corresponding revenue, non-IFRS) | | | 65.6 | | | | 64.3 | | | | 71.2 | | | | NA | | | | NA | |
Cloud and software margin (as a percentage of corresponding revenue, IFRS) | | | 80.8 | | | | 82.1 | | | | 82.4 | | | | 81.7 | | | | 82.3 | |
Cloud and software margin (as a percentage of corresponding revenue, non-IFRS) | | | 83.8 | | | | 84.6 | | | | 85.2 | | | | 85.0 | | | | 85.0 | |
Services margin (as a percentage of corresponding revenue, IFRS) | | | 7.4 | | | | 16.3 | | | | 19.6 | | | | 20.1 | | | | 24.9 | |
Services margin (as a percentage of corresponding revenue, non-IFRS) | | | 12.5 | | | | 20.2 | | | | 23.5 | | | | 23.9 | | | | 25.9 | |
Total gross margin ( as a percentage of total revenue, IFRS) | | | 68.1 | | | | 70.0 | | | | 70.1 | | | | 68.7 | | | | 69.4 | |
Total gross margin ( as a percentage of total revenue, non-IFRS) | | | 71.5 | | | | 72.7 | | | | 73.1 | | | | 72.2 | | | | 71.7 | |
Operating profit (IFRS) | | | 4,252 | | | | 4,331 | | | | 4,479 | | | | 4,041 | | | | 4,884 | |
Non-IFRS adjustments | | | 2,095 | | | | 1,307 | | | | 1,003 | | | | 1,150 | | | | -171 | |
Operating profit (non-IFRS) | | | 6,348 | | | | 5,638 | | | | 5,482 | | | | 5,192 | | | | 4,713 | |
Operating margin (as a percentage of total revenue, IFRS) | | | 20.5 | | | | 24.7 | | | | 26.6 | | | | 24.9 | | | | 34.3 | |
Operating margin (as a percentage of total revenue, non-IFRS) | | | 30.5 | | | | 32.1 | | | | 32.4 | | | | 31.8 | | | | 33.1 | |
Financial income, net | | | -5 | | | | -25 | | | | -66 | | | | -72 | | | | -42 | |
Profit before tax (PBT) | | | 3,991 | | | | 4,355 | | | | 4,396 | | | | 3,796 | | | | 4,767 | |
PBT margin (as a percentage of revenues) | | | 19 | | | | 25 | | | | 26 | | | | 23 | | | | 33 | |
Income tax expense | | | -935 | | | | -1,075 | | | | -1,071 | | | | -993 | | | | -1,331 | |
Profit after tax | | | 3,056 | | | | 3,280 | | | | 3,325 | | | | 2,803 | | | | 3,437 | |
Return on equity (profit after tax in percentage of average equity) | | | 14 | | | | 18 | | | | 22 | | | | 21 | | | | 31 | |
| | | | | |
| Non-IFRS Adjustments | | | | | | | | | | | | | | | | | | | | |
Revenue adjustments | | | 11 | | | | 19 | | | | 82 | | | | 81 | | | | 27 | |
Adjustment for acquisition-related charges | | | 738 | | | | 562 | | | | 555 | | | | 537 | | | | 447 | |
Adjustment for share-based payment expenses | | | 724 | | | | 290 | | | | 327 | | | | 522 | | | | 68 | |
Adjustment for restructuring | | | 621 | | | | 126 | | | | 70 | | | | 8 | | | | 4 | |
Adjustment for TomorrowNow and Versata litigation | | | 0 | | | | 309 | | | | -31 | | | | 0 | | | | 0 | |
| | | | | |
| Segment results | | | | | | | | | | | | | | | | | | | | |
Applications, Technology & Services Segment | | | | | | | | | | | | | | | | | | | | |
Segment revenue2) | | | 19,126 | | | | 16,871 | | | | 16,386 | | | | NA | | | | NA | |
Gross margin2)(as a percentage of corresponding revenue, IFRS) | | | 72 | | | | 73 | | | | 74 | | | | NA | | | | NA | |
Segment profit2) | | | 7,918 | | | | 7,099 | | | | 7,056 | | | | NA | | | | NA | |
Segment margin2)(Segment profit as a percentage of Segment revenue, IFRS) | | | 41 | | | | 42 | | | | 43 | | | | NA | | | | NA | |
SAP Business Network Segment | | | | | | | | | | | | | | | | | | | | |
Segment revenue2) | | | 1,614 | | | | 644 | | | | 460 | | | | NA | | | | NA | |
Gross margin2)(as a percentage of corresponding revenue, IFRS) | | | 67 | | | | 66 | | | | 65 | | | | NA | | | | NA | |
Segment profit2) | | | 312 | | | | 105 | | | | 99 | | | | NA | | | | NA | |
Segment margin2)(Segment profit as a percentage of Segment revenue, IFRS) | | | 19 | | | | 16 | | | | 22 | | | | NA | | | | NA | |
| | | | | | | | | | | | | | | | | | | | |
€ millions, unless otherwise stated | | 2015 | | | 2014 | | | 2013 | | | 2012 | | | 2011 | |
| Liquidity and cash flow | | | | | | | | | | | | | | | | | | | | |
Net cash flows from operating activities | | | 3,638 | | | | 3,499 | | | | 3,832 | | | | 3,822 | | | | 3,775 | |
Net cash flows from investing activities | | | -334 | | | | -7,240 | | | | -1,781 | | | | -5,964 | | | | -1,226 | |
Net cash flows from financing activities | | | -3,356 | | | | 4,298 | | | | -1,589 | | | | -194 | | | | -1,176 | |
Free cash flow | | | 3,001 | | | | 2,762 | | | | 3,266 | | | | 3,281 | | | | 3,330 | |
Free cash flow as percentage of total revenue | | | 14 | | | | 16 | | | | 19 | | | | 20 | | | | 23 | |
Cash conversion rate (net cash flows from operating activities as a percentage of profit after tax) | | | 119 | | | | 107 | | | | 115 | | | | 136 | | | | 110 | |
Cash and cash equivalents | | | 3,411 | | | | 3,328 | | | | 2,748 | | | | 2,477 | | | | 4,965 | |
Short-term investments | | | 148 | | | | 95 | | | | 93 | | | | 15 | | | | 636 | |
Group liquidity (cash and cash equivalents/short-term investments/restricted cash) | | | 3,559 | | | | 3,423 | | | | 2,841 | | | | 2,492 | | | | 5,601 | |
Financial debts (due to banks, private placements, bonds) | | | 9,174 | | | | 11,093 | | | | 4,308 | | | | 4,994 | | | | 3,965 | |
Net liquidity | | | -5,615 | | | | -7,670 | | | | -1,467 | | | | -2,502 | | | | 1,636 | |
Days’ sales outstanding (DSO, in days) | | | 71 | | | | 65 | | | | 62 | | | | 59 | | | | 60 | |
| | | | | |
| Assets, equity and liabilities | | | | | | | | | | | | | | | | | | | | |
Trade and other receivables | | | 5,362 | | | | 4,443 | | | | 3,962 | | | | 4,006 | | | | 3,577 | |
Total current assets | | | 9,739 | | | | 8,999 | | | | 7,351 | | | | 6,928 | | | | 9,628 | |
Total non-current assets | | | 31,651 | | | | 29,566 | | | | 19,739 | | | | 19,378 | | | | 13,313 | |
Deferred cloud subscriptions and support revenue (IFRS) | | | 957 | | | | 689 | | | | 443 | | | | 317 | | | | 4 | |
Total current liabilities (including deferred income) | | | 7,867 | | | | 8,574 | | | | 6,347 | | | | 6,546 | | | | 6,199 | |
Total non-current liabilities (including deferred income) | | | 10,228 | | | | 10,457 | | | | 4,695 | | | | 5,627 | | | | 4,053 | |
Total equity (including non-controlling interests) | | | 23,295 | | | | 19,534 | | | | 16,048 | | | | 14,133 | | | | 12,689 | |
Total assets | | | 41,390 | | | | 38,565 | | | | 27,091 | | | | 26,306 | | | | 22,941 | |
Equity ratio (total equity as a percentage of total assets) | | | 56 | | | | 51 | | | | 59 | | | | 54 | | | | 55 | |
Debt ratio (total liabilities3)as a percentage of total assets) | | | 44 | | | | 49 | | | | 41 | | | | 46 | | | | 45 | |
Investments in goodwill, intangible assets or property, plant, and equipment (including capitalizations due to acquisitions) | | | 676 | | | | 8,636 | | | | 1,813 | | | | 6,939 | | | | 657 | |
| | | | | |
| Key SAP Stock Facts | | | | | | | | | | | | | | | | | | | | |
Issued shares8)(in millions) | | | 1,229 | | | | 1,229 | | | | 1,229 | | | | 1,229 | | | | 1,228 | |
Earnings per share, basic (in €) | | | 2.56 | | | | 2.75 | | | | 2.79 | | | | 2.35 | | | | 2.89 | |
Earnings per share, diluted (in €) | | | 2.56 | | | | 2.74 | | | | 2.78 | | | | 2.35 | | | | 2.89 | |
Dividend per share4)(in €) | | | 1.15 | | | | 1.10 | | | | 1.00 | | | | 0.85 | | | | 1.10 | |
Total dividend distributed4) | | | 1,378 | | | | 1,315 | | | | 1,194 | | | | 1,013 | | | | 1,310 | |
Total dividend distributed as a percentage of profit after tax4) | | | 45 | | | | 40 | | | | 36 | | | | 36 | | | | 38 | |
SAP share price8)(in €) | | | 73.38 | | | | 58.26 | | | | 62.31 | | | | 60.69 | | | | 40.85 | |
SAP share price - peak (in €) | | | 74.85 | | | | 62.55 | | | | 64.80 | | | | 61.43 | | | | 45.90 | |
SAP share price - low (in €) | | | 54.53 | | | | 50.90 | | | | 52.20 | | | | 41.45 | | | | 34.26 | |
Market capitalization8)(in € billions) | | | 90.18 | | | | 71.60 | | | | 76.50 | | | | 74.70 | | | | 50.20 | |
Return on SAP shares5)1-year investment period (as a percentage) | | | 25.87 | | | | -4.80 | | | | 4.20 | | | | 52.10 | | | | 8.70 | |
Return on SAP shares5)5-year investment period (as a percentage) | | | 13.99 | | | | 13.90 | | | | 21.80 | | | | 13.10 | | | | 1.70 | |
Return on SAP shares5)10-year investment period (as a percentage) | | | 6.72 | | | | 7.40 | | | | 7.90 | | | | 13.80 | | | | 2.20 | |
| | | | | | | | | | | | | | | | | | | | |
€ millions, unless otherwise stated | | 2015 | | | 2014 | | | 2013 | | | 2012 | | | 2011 | |
| Employees and personnel expenses | | | | | | | | | | | | | | | | | | | | |
Number of employees6),8) | | | 76,986 | | | | 74,406 | | | | 66,572 | | | | 64,422 | | | | 55,765 | |
Number of employees, annual average6) | | | 75,180 | | | | 68,343 | | | | 65,409 | | | | 61,134 | | | | 54,346 | |
Number of employees in research and development6),8) | | | 20,938 | | | | 18,908 | | | | 17,804 | | | | 18,012 | | | | 15,861 | |
Personnel expenses | | | 10,170 | | | | 7,877 | | | | 7,489 | | | | 7,286 | | | | 5,880 | |
Personnel expenses – excluding share-based payments | | | 9,446 | | | | 7,587 | | | | 7,162 | | | | 6,764 | | | | 5,812 | |
Personnel expenses per employee – excluding share-based payments (in € thousands) | | | 126 | | | | 111 | | | | 109 | | | | 111 | | | | 107 | |
Women working at SAP (as a percentage) | | | 31 | | | | 31 | | | | 31 | | | | 30 | | | | 30 | |
Women in management8)(total, as a percentage of total number of employees) | | | 23.6 | | | | 21.3 | | | | 21.2 | | | | 20.8 | | | | 19.5 | |
Women managing managers7), 8)(as a percentage) | | | 19.2 | | | | 15.9 | | | | 14.3 | | | | 14.5 | | | | 13.5 | |
Women managing teams7), 8)(as a percentage) | | | 25.3 | | | | 23.3 | | | | 21.7 | | | | 21.1 | | | | 20.5 | |
Employee Engagement Index (as a percentage) | | | 81 | | | | 79 | | | | 77 | | | | 79 | | | | 77 | |
Business Health Culture Index13)(BHCI, as a percentage) | | | 75 | | | | 72 | | | | 67 | | | | 66 | | | | 65 | |
Employee retention (as a percentage) | | | 91.8 | | | | 93.5 | | | | 93.5 | | | | 94.0 | | | | 92.8 | |
Total turnover rate (as a percentage) | | | 11 | | | | 9 | | | | 8 | | | | 7 | | | | 9 | |
| | | | | |
| Customer | | | | | | | | | | | | | | | | | | | | |
Customer Net Promoter Score9),12)(as a percentage) | | | 22.4 | | | | 19.1 | | | | 12.1 | | | | 8.9 | | | | NA | |
| | | | | |
| Environment | | | | | | | | | | | | | | | | | | | | |
Net Greenhouse gas emissions (in kilotons) | | | 455 | | | | 500 | | | | 545 | | | | 485 | | | | 490 | |
Greenhouse gas emissions per employee6)(in tons) | | | 6.0 | | | | 7.3 | | | | 8.3 | | | | 7.9 | | | | 9.0 | |
Greenhouse gas emissions per € revenue (in grams) | | | 21.9 | | | | 28.4 | | | | 32.4 | | | | 30.0 | | | | 34.4 | |
Total energy consumption (in GWh) | | | 965 | | | | 920 | | | | 910 | | | | 860 | | | | 860 | |
Energy consumed per employee6)(in kWh) | | | 12,500 | | | | 13,400 | | | | 13,900 | | | | 14,000 | | | | 15,700 | |
Data center energy consumed (in GWh) | | | 249 | | | | 179 | | | | 173 | | | | 160 | | | | 154 | |
Data center energy per employee6), 10)(in kWh) | | | NA | | | | NA | | | | 2,633 | | | | 2,598 | | | | 2,824 | |
Data center energy per € revenue11)(in kWh) | | | 12 | | | | 10 | | | | NA | | | | NA | | | | NA | |
Renewable energy sourced (as a percentage) | | | 100 | | | | 100 | | | | 43 | | | | 51 | | | | 32 | |
| 1) | Amounts for 2011 to 2015 according to IFRS, unless otherwise stated. |
| 2) | 2012 and 2011 amounts are not available. |
| 3) | As sum of current and non-current liability. |
| 4) | 2015 numbers are based on the proposed dividend for 2015 and on 2015 closing level of treasury stock. |
| 5) | Average Annual Return. Assuming all dividends are reinvested. |
| 6) | Full-time equivalents. |
| 7) | Relates to different levels of management position. |
| 8) | Numbers based on year-end. |
| 9) | In 2012, we adopted a new methodology for measuring customer loyalty: Net promoter score (NPS). There are therefore no comparable NPS values for years prior to 2012. |
| 10) | Due to the integration of cloud capacity of external non-SAP data centers normalizing energy consumption against SAP employees becomes meaningsless. KPI discontinued. |
| 11) | Data center energy consumption normalized against € revenue combines a relative measure of required energy to develop and operate solution in internal and external data center. |
| 12) | The 2015 Customer NPS is not fully comparable to the prior year’s score. |
| 13) | The BHCI score for 2014 was recalculated from 70% to 72% based on two updated questions in the people survey concerning work-life balance. |
Glossary
A
AA1000 AccountAbility Principles Standard (AA1000APS) –A framework for organizations to identify, prioritize, and respond to sustainability challenges. The other AA1000 standards – the Assurance Standard and the Stakeholder Engagement Standard – are based on the APS principles and support their achievement.
Africa Code Week – SAP-led corporate social responsibility initiative initiated in 2015 in cooperation with partners. Planned as an annual event, children in African countries where SAP has a market are introduced to computer programming to increase awareness of, and interest in, the software development career field.
Americas’ SAP Users’ Group (ASUG) – Non-profit organization comprising customer companies dedicated to providing educational and networking opportunities in support of SAP software and implementation. User groups are established in regions around the world to share knowledge and influence SAP development efforts. ASUG is the largest user group with more than 140,000 individuals at 3,700 companies in more than 17 industries across the SAP ecosystem.
analytics solutions from SAP – Category of software solutions that help customers achieve the power of collective insight in Big Data by empowering them with the right information at the right time to make insightful business decisions, anticipate change, and uncover new opportunities. Analytics solutions cover the areas of business intelligence, enterprise performance management, and governance, risk, and compliance.
Ariba – See “SAP Ariba.”
Ariba Network – Business commerce network where companies of all sizes can connect to their trading partners anywhere, at any time, from any application or device to buy, sell, and manage their cash more efficiently and effectively than ever before. Companies around the world use the Ariba Network to simplify interenterprise commerce and enhance the results they deliver. See “business network.”
B
Big Data – The large volume of data created by billions of connected devices and people generating a tremendous amount of information about their behavior, location, and activity. This availability of massive amounts of data requires companies to rethink technology architecture and database structures.
Build – A cloud-based, collaborative design tool from SAP that allows app designers and business experts to compose interactive prototypes, making it easier to capture more accurate user feedback and jump-start development.
Business Health Culture Index – A score for the general cultural conditions in an organization that enable employees to stay healthy and balanced. The index is calculated based on the results of regular employee surveys.
business network – An online service that connects businesses and their systems to those of their trading partners and enables new processes and information and insight sharing only possible in a digital environment. See “Ariba Network.”
C
carbon offset or greenhouse gas (GHG) offset – A unit of carbon dioxide-equivalent (CO2 equivalent) that is reduced, avoided, or sequestered to compensate for emissions occurring elsewhere.
cloud computing – Generic term for flexible, IT-related services available through, or hosted on, the Internet for consumers and business, including storage, computing power, software development environments, and applications, combined with service delivery. Accessed as needed “in the cloud,” these services eliminate the need for in-house IT resources. See “cloud service model.”
cloud deployment models – The different infrastructure, software lifecycle management, and licensing models used for deploying software, that is, where the software is running and how much control and flexibility a customer has.
cloud service model – “As-a-service” offerings where cloud services are offered as infrastructure as a service (IaaS), platform as a service (PaaS), or software as a service (SaaS).
| | |
| Additional InformationGlossary | | 207 |
cloud solutions from SAP – Category used to communicate all of SAP offerings and efforts related to the cloud, including platform, managed services, solutions, technology, and infrastructure. It includes SAP and SAP SuccessFactors offerings.
CO2 equivalent – A measure to compare the emissions of various greenhouse gases based upon their global warming potential. For example, the global warming potential for methane over 100 years is 21. This means that emissions of one million metric tons of methane are equivalent to emissions of 21 million metric tons of carbon dioxide.
Concur Technologies – Acquired by SAP in 2014, this travel and expense management company helps customers manage business resources, processes, and spend through the world’s largest business network in the cloud for comprehensive travel and expense management. The Concur platform offers an integrated system for expense, invoice, travel, and spend intelligence in the cloud.
corporate social responsibility – SAP’s corporate social responsibility (CSR) program is about how the company creates social impact for people, both inside and outside SAP, to help make society more sustainable and the world run better.
customer connection – A simple process directed at incrementally enhancing and improving the products and solutions SAP customers are using today. It offers SAP customers the opportunity to suggest small enhancements to products and solutions in mainstream maintenance, for fast and non-disruptive delivery using notes and support packages.
Customer Net Promoter Score (NPS)– Describes the willingness of customers to recommend or promote an organization or company to others. It is defined as the percentage of customers that are likely to recommend an organization or company to friends or colleagues (promoters) minus the percentage of customers that are unlikely to do so.
D
data center – A physical facility used to house computer systems and associated components.
data center energy – The amount of energy consumed in SAP’s data centers related to the number of employees (expressed in full-time equivalents/FTEs).
dematerialization – Refers to reducing the total material that goes toward providing products or services to customers. SAP achieves this effect through greater efficiency in the usage of materials, such as default double-sided printing, or by increasing online conferencing to reduce business travel.
digital core – An integrated system that enables customers to predict, simulate, plan, and even anticipate future business outcomes in a digital economy. SAP offers the SAP S/4HANA suite as a digital core, providing the framework that allows customers to run an entire enterprise in the cloud – such as finance, procurement, sales, inventory management, project system, and product lifecycle management. In this way, companies can achieve the real-time visibility they need into all mission-critical business processes and processes around their customers, suppliers, workforce, Big Data, and the Internet of Things.
E
ecosystem – Construct encompassing SAP and its customers and partners that extends the value SAP provides to its customers. By bringing together community-based insight, innovative partner solutions, and industry-leading collaboration and co-innovation, it enables customers to extract the greatest possible value from their SAP investments.
Edge edition – Version of existing SAP software product or solution designed for, and marketed to, small businesses and midsize companies. These offerings may be streamlined versions, limited scope, or customized functionality of existing software that is targeted to the business needs of small and midsize enterprises. The phrase “Edge edition” is added as a qualifier to indicate the nature of the offering. Examples: SAP Lumira, Edge edition; SAP Data Services, Edge edition.
electronic waste (e-waste)– Electronic products that are discarded by consumers or companies, such as computers, computer monitors, or mobile devices.
Employee Engagement Index – A score for the level of employee commitment, pride, and loyalty, as well as the feeling of employees of being advocates for their company. The index is calculated based on the results of regular employee surveys.
employee retention – The ratio of the average headcount (expressed in full-time equivalents/FTEs) minus employee-initiated terminations (turnover) divided by the average headcount, taking into account the past 12 months.
enabler effect – Reduction of greenhouse gas emissions and increase of energy savings in the entire economy through innovative technology provided by the ICT sector.
end-to-end solution – Software solution that drives strategic business outcomes and directly contributes to a business priority in an industry, line of business, or technology area. These solutions are structured into solution capabilities that comprise a number of individual software products, instances, and/or license materials. End-to-end solutions provide a business scope with a comprehensive value proposition. See “business priority.”
| | |
| Additional InformationGlossary | | 208 |
enterprise resource planning – See “SAP ERP.”
environmental impact – A positive or negative change to the natural environment.
EU Access from SAP – This service allows customers to limit access when necessary to customer data during maintenance or delivery of SAP Service and Support from suppliers outside of the European Union to adhere to company guidelines, local statutory requirements, or industry regulation.
F
Fieldglass – Company acquired by SAP in May 2014 and fully integrated in SAP. Our solutions for contingent workforce management are marketed under the SAP Fieldglass brand. See “SAP Fieldglass.”
G
Global Customer Reference Program – SAP program offering detailed information about reference customers from around the world, using a database that channel partners can access to help close a deal with a new SAP customer. Reference customers have agreed to participate in one or more reference activities on behalf of SAP.
Global Partner Operations (GPO) – Organization created in mid-2014 at SAP that is responsible for all SAP partner relationships. It includes the former SAP Ecosystem & Channels team and is responsible for managing strategic partnerships, as well as the SAP Business One channel and the growing OEM business.
Global Reporting Initiative (GRI) – A non-profit organization that provides companies and organizations with a comprehensive sustainability reporting framework that is widely used around the world.
Global Service & Support (GSS) – Organization at SAP responsible for all global and regional service, support, and consulting delivery, as well as portfolio management, maintenance go-to-market activities, mobile services, development of service and solution best practices, learning content development, global customer centers of expertise, management of SAP user groups, and SAP University Alliances. It includes the former SAP Active Global Support organization. GSS advises and works in partnership with SAP customers to implement, run, optimize, and help them derive value from their SAP solutions through a comprehensive SAP Service and Support portfolio. See “SAP Service and Support”
greenhouse gas footprint – The sum of all greenhouse gas emissions measured and reported, including renewable energy and third-party reductions, for example, offsets.
Greenhouse Gas Protocol (GHG Protocol) – The most widely used international accounting tool to understand, quantify, and manage greenhouse gas emissions.
H
Hadoop– Part of the Apache project sponsored by the Apache Software Foundation, this open source, Java-based programming framework supports the processing of large data sets in a distributed computing environment. As open source technology, Hadoop is an efficient distributed file system that enables the analysis and processing of very large volumes of data from a great number of varied, structured, and unstructured sources. SAP Distribution for Hadoop software provides redistribution of Apache Hadoop developed by Hortonworks.
hybrid cloud – Deployment model that uses resources comprised of a mix of two or more distinct cloud deployment models that are integrated by standardized or proprietary technology enabling data and application portability.
hybrid cloud deployment model – Deployment model that uses resources comprised of a mix of two or more distinct cloud deployment models that are integrated by standardized or proprietary technology enabling data and application portability.
hybrid landscape – A mix of on-premise and any cloud deployment model(s). Alternatively referred to as an “on premise to cloud” or “hybrid environment.”
hybris – See “SAP Hybris.”
I
inclusivity – For an organization that accepts its accountability to those it impacts and who impact it: The participation of stakeholders in developing and achieving a strategic and accountable response to sustainability.
industry– An economic sector characterized by a typical value chain, business processes, and set of products and services that the companies operating in it have in common. At SAP, “industries” is also used as a term to differentiate between lines-of-business functions such as marketing, procurement, and finance, and those functions specific to an industry.
industry portfolios – Software portfolios from SAP that address the business needs of 25 different industries.
industry segment – An economic subsector within an industry that is characterized by a typical value chain, business processes, and set of products and services that the companies operating in it have in common. Examples include agribusiness and paper and packaging.
| | |
| Additional InformationGlossary | | 209 |
infrastructure as a service (IaaS) – Processing, storage, network, other computing resources and typically a defined level of support for consumers to deploy software (such as operating systems and applications). IaaS consumers do not manage underlying cloud infrastructure but may control networking components (such as host firewalls).
in-memory computing – A major advance in information technology that creates a dramatic change in computing, analytics, and data storage. Combining advances in multicore processing with more affordable servers, in-memory computing allows information to be stored in the main memory rather than in relational databases to greatly accelerate processing times. It disrupts the traditional IT stack comprised of hardware, middleware, and software, where disk-based relational databases can become bottlenecks.
in-memory database– Database that keeps all active records in main memory rather than on disk. Accessing in-memory records is considerably faster than retrieving them from the disk, significantly increasing performance. SAP HANA is SAP’s groundbreaking database that allows businesses to take advantage of in-memory computing. See “SAP HANA.”
ISO 14001 – A standard for environmental management systems that provides practical tools for companies and organizations to identify and control their environmental impact and constantly improve their environmental performance.
K
key performance indicator (KPI) – Performance figure for which threshold values are defined and against which validation is executed.
L
Leadership Trust Score – Based on the Net Promoter Score (NPS) methodology that results from a question in our annual global employee survey that gauges employees’ trust in our leaders. It measures our collective effort to foster a work environment based on trust. We use this score to further enhance accountability for our leaders and executive management.
line of business (LoB) – Internal organizational area or high-level business unit in a company (division) that combines all responsibilities for a particular product, group, or set of processes. Examples include sales, purchasing, human resources, finance, marketing, and so on.
line-of-business portfolios – SAP offers software portfolios that address the needs of organizations in 12 lines of business, or functional areas. The following solution portfolios are currently available: SAP for Asset Management, SAP for Commerce, SAP for Finance, SAP for Human Resources, SAP for Manufacturing, SAP for Marketing, SAP for R&D/Engineering, SAP for Sales, SAP for Service, SAP for Sourcing and Procurement, SAP for Supply Chain Management, and SAP for Sustainability.
Live Business– SAP’s campaign platform that refers to our vision of a seamless digital business that enables our customers to Run Simple by sensing, responding to, learning from, adapting to, and predicting business data in real time.
M
maintenance – Software support comprising support for legal changes and corrections delivered through the SAP Notes tool, support packages, problem support, and access to information and online service channels – depending on the maintenance phase.
maintenance strategy – Set of rules that determine the length and conditions of maintenance for SAP software product releases. Detailed rules can differ depending on the type of application.
managed cloud – Deployment model that implies resources are dedicated to one customer and accessed through a virtual private network (VPN). The infrastructure is owned, managed, and operated by the cloud provider in the cloud provider’s data center. SAP HANA Enterprise Cloud is SAP’s managed cloud service.
materiality – Determines the relevance and significance of an issue to an organization and its stakeholders. A material issue is an issue that will influence the decisions, actions, and performance of an organization or its stakeholders.
mobile solutions from SAP – Provide a foundation for enterprise mobility and seamless integration with the core enterprise applications of our customers. The portfolio of mobile solutions includes enterprise mobility management, including the SAP Afaria mobile device management solution and the SAP Mobile Documents solution; mobile apps; and SAP Mobile Platform.
O
on premise – A deployment model where a software license is purchased and deployed on the servers at the premises of the customer. The customer manages and controls the software.
One4 – Launched in November 2015, the One4 project (www.sapsponsorships.com/categories/one4-project) is an initiative led by SAP that aims to support different social causes and charities. The first project is being conducted together with the band Imagine Dragons, Apple, and KIDinaKORNER/Interscope to help support the UN Refugee Agency (UNHCR).
| | |
| Additional InformationGlossary | | 210 |
P
platform as a service (PaaS) – Cloud infrastructure, operating system, programming languages, libraries, services, tools and typically a defined level of support for consumers to deploy consumer-created or acquired applications. PaaS consumers do not manage underlying cloud infrastructure but have control over deployed applications.
powered by SAP HANA – An SAP offering powered by SAP HANA runs on the SAP HANA platform. More than 100 SAP applications are currently “powered by SAP HANA.” Partner solutions or applications that are powered by SAP HANA are certified by SAP to run on the SAP HANA platform. These applications take advantage of distinctive capabilities of SAP HANA to deliver key benefits, such as simpler administration, reduced overhead, and better business intelligence over conventional traditional technology platforms.
private cloud – Deployment model that implies resources are dedicated to one customer and accessed through the Internet. The infrastructure is owned, managed and operated by the customer, a third-party, or both, and is on the premises of the customer, cloud provider, or a third party.
product footprint – The environmental impact of products, processes, or services by production, usage, and disposal.
public cloud – Provides consumers access to a provider’s software applications running on a cloud infrastructure. The resources are located on the premises of the cloud provider, not of the customer, and are shared by multiple customers accessing them through the Internet.
R
renewable energy – The shares and types of electricity obtained from renewable sources such as hydro, wind, solar, geothermal, and biomass. It is calculated by adding the amount of renewable energy specifically sourced, produced on-site by our own solar cells and covered by Renewable Energy Certificates (RECs).
road map – Product timeline that has a variety of objectives, including communication to customers, users, or other parties interested in the timing of future product releases; the features planned for those releases; general prioritization of features; and in some cases, the requirements of features in enough detail that current and prospective customers can give feedback on the feature itself and the product’s direction.
S
SAP Activate – Innovation adoption framework introduced for SAP S/4HANA that combines SAP Best Practices, methodology, and guided configuration delivered with a reference landscape. The SAP Activate methodology is the SAP guidance for implementation, enhancements, upgrades, or co-innovation of SAP solutions starting with SAP S/4HANA. It enables cost-effective, agile, and fast delivery of the SAP solution to the customer and supports deployments in the cloud, on premise, or in hybrid deployment.
SAP Active Global Support (SAP AGS) – See “Global Service & Support.”
SAP ActiveEmbedded – Enhanced engagement services for optimizing solutions and accelerating adoption of technologies without disrupting customer businesses.
SAP Anywhere – An HTML5 solution that runs in the cloud designed for smaller companies with up to 50 employees that need a seamless and affordable way to manage their customer interactions in a single front-office system. Accessible through a Web browser on a desktop, laptop, or mobile device, it delivers a consistent customer experience with the seamless integration of marketing, sales, and commerce activities. See also “SAP SME Solutions.”
SAP API Management – New cloud offering that helps customers manage their application programming interfaces; an on-premise edition is also available.
SAP Ariba – Category of offerings resulting from the acquisition of Ariba in October 2012. All cloud-related supplier assets of SAP and Ariba are now consolidated under the SAP Ariba brand. Ariba, an SAP company, continues to operate as an independent business. Ariba solutions for procurement, financials, and sourcing, as well as the Ariba Network, keep their original Ariba offering names at present.
SAP Asset Intelligence Network – A cloud subscription-based network hosted by SAP where manufacturers, asset owners, operators, regulators, and service providers can connect to each other. Maintenance and service applications can be delivered through the network.
SAP Best Practices – Packages that provide proven methods and tools for organizations to implement best business practices in key areas and a range of industries using SAP software. The packages deliver methodology, documentation, and preconfiguration that enable rapid, reliable deployment with quick return on investment.
SAP Business All-in-One – Comprehensive and flexible business management solution targeted to midsize companies with up to 2,500 employees that are looking for a comprehensive, integrated industry-specific ERP solution with built-in best practices.
| | |
| Additional InformationGlossary | | 211 |
SAP Business ByDesign – Adaptable, cloud-based business management solution delivered in the cloud, ideally suited for growing midsize companies as well as for subsidiaries of larger corporations. It is a complete, integrated suite that can run an entire enterprise – financials, human resources, sales, procurement, customer service, and supply chain. The latest versions enable partners and customers to extend the system capabilities or build cloud-based applications using SAP Business ByDesign Studio.
SAP Business One – Application designed especially for small businesses with up to 100 employees, providing a single, integrated solution for managing the entire business across financials, sales, customer relationships, purchasing, inventory, analytics, and operations.
SAP Business Suite – Software applications that help create a comprehensive business process platform for enterprises and enables them to execute and optimize their business and IT strategies. These applications give organizations the unique ability to perform their essential business processes with modular software that is designed to work with other SAP and non-SAP software. The main applications in the suite are SAP CRM, SAP ERP, SAP PLM, SAP SRM, and SAP SCM. SAP Business Suite, SAP CRM, and SAP ERP are now available powered by SAP HANA.
SAP Business Suite 4 SAP HANA – See “SAP S/4HANA.”
SAP Business Suite powered by SAP HANA – In January 2013, SAP launched SAP Business Suite powered by SAP HANA, a next-generation business suite that captures and analyzes data in real time on a single in-memory platform empowering customers to run their business in real time to transact, analyze, and predict instantly and proactively. The core applications in the suite now take advantage of SAP HANA for smarter innovations, faster business processes, and simpler interactions.
SAP Business Warehouse (SAP BW) – An application of the SAP NetWeaver technology platform that provides a complete view of a company and the tools needed to make the right decisions, optimize processes, and measure strategic success, such as business-critical factors and benchmarks. Formerly called SAP NetWeaver Business Warehouse.
SAP City Connect – Solution that helps urban organizations and small-business owners with tourism development, visitor and crowd management, business event subscriptions, and neighborhood development. Part of the SAP Future Cities initiative. See “SAP Future Cities.”
SAP Cloud for Analytics – Intuitive cloud solution for simplifying financial planning and analysis, featuring easy-to-use yet powerful modeling, analytics, and data integration. Includes built-in collaboration, mobile capabilities, and calendar-based event management. Formerly called SAP Cloud for Planning.
SAP Cloud for Customer – A cloud-based offering of CRM applications and tools developed for sales, service, and marketing teams that provides an overview of your end-to-end business, as well as deep customer insight and personalized engagement, so that they can deliver a relevant experience at every step of your customer’s journey. It also offers designed-in social collaboration to help transform social media conversations into business insight. The offering currently includes SAP Cloud for Sales, SAP Cloud for Service, SAP Cloud for Marketing, and SAP Cloud for Social Engagement solutions. An Edge edition is available for small and midsize enterprises.
SAP Cloud for Planning –See “SAP Cloud for Analytics.”
SAP Cloud powered by SAP HANA – Term that refers to all of SAP and SAP SuccessFactors offerings related to the cloud, including platforms, services, applications, technology, and infrastructure. It is not the name of a single offering or a category of solutions. SAP Cloud powered by SAP HANA comprises public cloud applications, managed cloud applications delivered via SAP HANA Enterprise Cloud, and SAP HANA Cloud Platform. SAP Cloud always refers to more than just solutions or applications.
SAP Co-Innovation Lab – SAP location featuring a simulated, heterogeneous data center that incorporates hardware and infrastructure software from various vendors. The lab provides a hands-on environment for SAP, customers, and partners to innovate, accelerate, and showcase new business solutions and technologies collaboratively. Customers and partners can visit the lab to evaluate the latest SAP and partner solutions in a simulated, real-world infrastructure.
SAP Community Network – Online portal with nearly two million members in more than 200 countries, providing individuals with the opportunity to trade experience and insights, pursue business opportunities, and learn from each other. SAP offers distinct communities in the network that offer information, trusted resources, and co-innovation. See “SAP Developer Network” and “SAP University Alliances community.”
SAP Custom Development – SAP organization that specializes in building individual software solutions that address the unique needs of customers, and that fit seamlessly with existing SAP software. The organization draws on SAP innovations, especially SAP HANA, to deliver unmatched impact and value for specific customer use cases. See “custom development project.”
SAP Developer Network – Part of SAP Community Network, this online community offers deep technical content and expertise for SAP developers, analysts, consultants, and administrators.
SAP Digital – Integrated digital business unit responsible for delivering e-commerce and digital native offerings to users who
can discover, try, buy, implement, use, and renew SAP solutions in a simple online interaction.
| | |
| Additional InformationGlossary | | 212 |
SAP Digital Boardroom – Showcased at SAPPHIRE NOW in 2015 as the “Boardroom Redefined,” this offering contextualizes the boardroom, locations, and devices into a real-time enterprise experience. Powered by SAP HANA and experienced through the SAP S/4HANA suite and the SAP Cloud for Analytics solution, this next-generation solution empowers leaders to monitor, simulate, and drive change in a digital economy. See “SAP Cloud for Analytics.”
SAP Digital Customer Engagement – A scalable, cloud subscription-based customer engagement solution purpose-built for individuals and small teams. It brings together sales, customer service, marketing, and reporting functions with integration, collaboration, and personalization options to help them sell smarter, work more efficiently, and collaborate more effectively.
SAP EcoHub– Online solution marketplace that centralizes information about SAP and partner solutions – and includes features such as feedback, ratings, and demos to help discover, evaluate, and buy solutions to complement an investment in SAP software.
SAP Ecosystem & Channels– See “Global Partner Operations.”
SAP Education – An organization with more than 1,000 resources on global scale that provides a complete and high-quality enablement offering across the entire customer lifecycle for all target audiences (business users, project teams, customers, partners, and so on). The comprehensive portfolio of educational products and services leverages a multimodal offering (on-site, e-learning, and virtual classrooms) to accelerate enablement and reduce cost and certifications paths to help ensure enablement quality.
SAP Enterprise Support – Services that provide proactive support in addition to all features of SAP Standard Support services. These proactive support services encompass tools, processes, and services that enable continuous improvement, holistic application lifecycle management for continuous innovation, business and operational process improvements, and levers to address the total cost of operation (TCO).
SAP ERP – Application designed to optimize business and IT processes by reducing IT complexity, increasing adaptability, and delivering more IT value at a lower cost than traditional ERP solutions. It can support mission-critical, end-to-end business processes for finance, human capital management, asset management, sales, procurement, and other essential corporate functions. SAP ERP can also support industry-specific processes by providing industry-specific business functions that can be activated selectively via the switch framework, keeping the application core stable and helping ensure maximum performance.
SAP ERP Central Component (SAP ECC) – Main software component in the SAP ERP application.
SAP Exchange Media (SAP XM) – A brand-new private premium media exchange (http://sapexchange.media/) powered by SAP HANA that is purpose-built to support real-time digital advertising and maximize return on media for advertisers, publishers, and consumers.
SAP Executive Board – The official governing body of SAP, overseeing and deciding on the activities of the company. Subject to the requirements of stock corporation law, the SAP Executive Board is committed to the interests of SAP and bound by company policy. It provides the SAP Supervisory Board with regular, prompt, and comprehensive reports about all essential issues of business, corporate strategy, and potential risks. Membership in the SAP Executive Board is part of the official titles for these board members.
SAP Fieldglass – Category of offerings resulting from the acquisition of Fieldglass that help companies manage their entire workforce including contract workers and permanent staff. SAP Fieldglass solutions currently include SAP Fieldglass Approvals, SAP Fieldglass Contingent Workforce Management, SAP Fieldglass Services Procurement, SAP Fieldglass Vendor Management, and SAP Fieldglass Worker Profile Management. See “Fieldglass.”
SAP Financing – See “SAP Payment service.”
SAP Fiori – First developed as a set of extensible HTML5 apps specific to key user roles, offering a seamless user experience across devices using responsive design principles. SAP Fiori apps target all employees of existing SAP customers, addressing the most common business functions, such as workflow approvals, information lookups, and self-service tasks. A free launchpad allows users to access their SAP Fiori apps from one single entry point.
SAP Fiori user experience (UX) – As of May 2014, SAP Fiori UX is the user experience for SAP software. Based on modern design principles, it represents a consumer-like, consistent experience across devices, including tablets and smartphones.
SAP for Aerospace & Defense (SAP for A&D) – Solution portfolio specifically designed to meet the needs of the aerospace and defense industry. It offers capabilities for maintenance, repair and overhaul, airline operations, defense, manufacturing, contract and program management, and business acquisitions.
| | |
| Additional InformationGlossary | | 213 |
SAP for Automotive – Solution portfolio designed to meet the specific needs of the automotive industry. Its capabilities help link complex business processes into a logical flow, maximizing efficiency and profitability and satisfying customers’ expectations.
SAP for Banking – Solution portfolio that enables banks to obtain all customer information at a glance and offers a full complement of high-performance capabilities for strategic planning, financial accounting, costing, and enterprise-wide control. It also features key industry-specific applications for profitability management, risk management, customer relationship management, and integrated customer account systems.
SAP for Chemicals – Solution portfolio that delivers support for specific processes and tools that chemical companies require. Industry-specific capabilities include recipe management, batch management, and version control.
SAP for Consumer Products – Solution portfolio that supports the integration of every step of the consumer product value chain – from suppliers to consumers. Key capabilities include mobile and Internet sales, trade promotion management, inventory management, brand and channel management, and demand signal management.
SAP for Defense & Security – Solution portfolio that offers a variety of capabilities that meet the critical needs of the defense and security sector. Key industry-specific capabilities include acquisition and materials management; force planning; maintenance, repair, and overhaul (MRO); personnel and organization; infrastructure management; planning and support for deployed operations; in-service support; and line maintenance.
SAP for Engineering, Construction & Operations (SAP for EC&O) – Solution portfolio designed to meet the specific requirements of project-oriented enterprises that offers capabilities for industrial plant construction, construction of commercial and private buildings, and shipbuilding.
SAP for Healthcare – Solution portfolio for hospitals and clinics to manage a variety of required administrative and clinical processes.
SAP for High Tech – Solution portfolio that meets the demands of high-tech industries, including RosettaNet support.
SAP for Higher Education and Research (SAP for HE&R)– Solution portfolio that supports organizational processes and unique needs of public and private universities, multicampus institutions, research agencies, and medical colleges, including campus management, grants management, student lifecycle management, financials, operations, human capital management, procurement, analytics, research, and asset management.
SAP for Industrial Machinery & Components (SAP for IM&C) – Solution portfolio that coordinates the entire scope of business activities (estimating, order entry, project management, and production planning) for the industrial sector and supports areas ranging from maintenance and services to billing and profitability analysis.
SAP for Insurance – Solution portfolio that integrates steps in the insurance business process, including capabilities for customer contact, policy and product management, collections and disbursement, and claims management.
SAP for Life Sciences – Solution portfolio that meets the requirements of pharmaceutical, biotechnology, and diagnostics companies, as well as manufacturers of medical devices and products.
SAP for Media– Solution portfolio that supports processes specific to the media industry with capabilities that include sales and distribution, advertising management, product development, and intellectual property management.
SAP for Mill Products – Solution portfolio for manufacturers of building materials, the paper and timber industry, metal and primary metal producers, and textile and furniture manufacturers.
SAP for Mining– Solution portfolio that supports processes specific to the mining industry, including mining operations and asset performance; sales and supply chain management; operational risk and compliance; as well as human resources; finance; procurement; and IT management.
SAP for Oil & Gas (SAP for O&G)– Solution portfolio that meets the demands of oil and gas companies of all sizes.
SAP for Professional Services– Solution portfolio that delivers integrated tools, best practices, and support for automated processes designed specifically for the demands of the professional services industry, including management consultancies as well as accounting and legal firms.
SAP for Public Sector – Solution portfolio for public administration, providing an electronic framework that enables online communication through various applications for the public, government authorities, and related entities.
SAP for Retail – Solution portfolio that offers multichannel applications designed specifically to provide the best retail services to a large customer base.
SAP for Sports & Entertainment – Solution portfolio that comprises solutions for sports teams, leagues, and venues, designed to help them deepen fan engagement, drive on-field performance, and optimize business efficiency.
| | |
| Additional InformationGlossary | | 214 |
SAP for Telecommunications – Solution portfolio that provides telecommunications enterprises of all types and sizes with a range of industry-specific capabilities, including support for convergent invoicing and contract accounting.
SAP for Transportation & Logistics– Solution portfolio that covers the unique business needs of postal services, railways, airlines, and toll collection companies, as well as logistics service providers, to optimize supply chain and planning.
SAP for Utilities – Solution portfolio for all supply and energy industries, with capabilities ranging from call centers and Internet communications to consumption billing.
SAP for Wholesale Distribution – Solution portfolio that addresses the needs of midsize and large wholesale distribution businesses in a wide range of segments. Industry-specific capabilities support new business models and strategies that meet the needs of an important supply sector.
SAP Foundation for Health– A common database schema, functional libraries, and algorithms implemented in SAP HANA to meet the requirements of IT-supported personalized medicine. In combination with the SAP HANA platform (separate license required), healthcare providers can use this foundational software to help build a platform on which to run diverse health-association applications and even create their own.
SAP Future Cities– Umbrella term for an initiative that includes the strategy, solutions, and vision associated with smart urban management, targeting state and local governments worldwide. It represents a unified range of SAP offerings for government organizations that help them improve the lives of their citizens and make urban living sustainable. See “SAP City Connect.”
SAP Global Managing Board– Extended management board established in May 2012 by the SAP Executive Board that allows SAP to appoint a broader range of global leaders to help steer the organization. It comprises members of the SAP Executive Board and selected additional executives, and has advisory and decision-supporting functions for the SAP Executive Board. Per definition, all members of the SAP Executive Board are members of the SAP Global Managing Board.
SAP HANA– Flexible, data-agnostic, in-memory platform that helps organizations analyze their business operations, using huge volumes of detailed transactional and analytic information from virtually any data source. The platform provides the foundation for innovative applications that take advantage of an in-memory database and calculation engine, allowing customers to conduct complex planning, forecasting, and simulation based on real-time data. Software products built for SAP HANA have been specifically designed or at least adapted to take advantage of the enhanced capabilities of the SAP HANA platform.
SAP HANA App Center– One-stop shop (www.sapappcenter.com) where customers, partners, and developers can find, buy, and sell solutions developed on SAP HANA Cloud Platform. Provides links to SAP Store, where transactions take place. Formerly known as SAP HANA Marketplace.
SAP HANA Cloud Integration – Technology that integrates cloud applications with on-premise solutions from SAP and other vendors. Based on a multitenant cloud infrastructure, it allows customers to unite business processes and data in a secure, reliable environment.
SAP HANA Cloud Platform – An open cloud platform that is the foundation for running applications and analytics today and allows developers to build custom applications in the cloud as either stand-alone or connected to on-premise solutions. It includes infrastructure, application, and database services in a subscription model. Separately licensed, SAP HANA Cloud Platform is part of SAP Cloud powered by SAP HANA.
SAP HANA Cloud Platform for the Internet of Things – A version of SAP HANA Cloud Platform that provides large-scale connectivity and integration between the SAP HANA platform and SAP solutions for the Internet of Things. It enables capabilities for device management and remote control, data and metrics, device modeling, and device and application development.
SAP HANA Enterprise Cloud – This service enables customers to access solutions in the cloud. It contains managed cloud applications, in-memory infrastructure, managed services, and through an additional license, SAP HANA Cloud Platform, to build custom applications in the cloud. On-premise applications from SAP can be delivered to customers via SAP HANA Enterprise Cloud.
SAP HANA Live – Umbrella term for a group of analytics foundations for SAP HANA, specific to an industry or for a particular software (SAP HANA Live for Event Management, SAP HANA Live for SAP CRM), and so on, as well as SAP HANA Live Browser.
SAP HANA One – Deployment of SAP HANA certified for productive use on the Amazon Web Services Cloud. SAP HANA One can be deployed for production use with small data sets, in minutes, opening a door to starter projects from customers, ISVs, and startups.
SAP HANA Vora – An in-memory, massively distributed data processing engine for Hadoop that provides simple business-oriented scale-out processing of data. This engine allows distributed Hadoop data to be analyzed together with enterprise data using the SAP HANA platform.
| | |
| Additional InformationGlossary | | 215 |
SAP Health Engagement– Solution that enables the interaction between individuals and doctors or healthcare providers in order to track their wellbeing.
SAP Health Link – Cloud solution that enables doctors and life science companies to access and analyze patients’ vital data, which is provided by patients through the SAP Health Link mobile app.
SAP Hybris – Unified brand resulting from the acquisition of hybris in August 2013. All e-commerce solutions from SAP and hybris are now consolidated under the SAP Hybris brand. hybris, an SAP company, continues to operate as an independent business. SAP Hybris solutions help businesses sell more goods, services, and digital content through every touch point, channel, and device.
SAP Jam – Social software platform that enables sales teams and internal experts to socially connect and communicate with customers in the context of each opportunity. Customers can also easily provide feedback and share what is important to them to strengthen relationships. Available in two compatible elements, SAP Jam Collaboration and SAP Jam Communities.
SAP Learning Solution – Portfolio of learning tools including a learning portal, learning management system, authoring tools, and content management system. Individual training and strategic personnel development are supported in the solution.
SAP Lumira – Data visualization software that helps connect, access, and visualize data without a single line of code.
SAP Match Insights– A showcase on-premise solution developed as part of a customer co-innovation project for the German Soccer Association (DFB). The solution was available for DFB coaches and players in a pilot trial during the preparation phase and throughout the 2014 FIFA World Cup in Brazil. The solution enables members across the DFB team to analyze players’ and teams’ performances in individual matches using streamed video from the match combined with analytics powered by SAP HANA.
SAP MaxAttention – SAP’s premium support offering, designed specifically for customers whose operations demand mission-critical customized support. The support option includes a full range of services for individual customer needs and covers all stages of an SAP solution’s lifecycle.
SAP Medical Research Insights – A solution that helps researchers and clinicians to access and analyze patient data in real time and process it for clinical and life sciences research.
SAP Mobile – Category term used to communicate all SAP mobile offerings together. These include any type of mobile apps, solutions, technology, or platform (including SAP Mobile Platform), as well as solution extensions and rapid-deployment solutions.
SAP Mobile Platform – A platform of mobile capabilities and technology that bundles three existing offerings under one name (Sybase Unwired Platform, Sybase Mobiliser, and a Syclo offering named Agentry). SAP Mobile Platform is offered in enterprise or consumer editions and each edition is available as either an on-premise or a cloud version.
SAP Mobile Secure – A set of solutions that provide enterprise security for mobile devices, apps, content, and communications that include SAP Afaria, SAP Mobile Device Management, SAP Mobile Documents, SAP Mobile Place, SAP Enterprise Store, and SAP App Protection by Mocana.
SAP Month of Service – Held in October, SAP’s signature corporate volunteerism effort offers SAP employees around the world opportunities to come together to support social change in their communities.
SAP ONE Service– A single channel for SAP support and maintenance customers to access all SAP support delivery engagements that come with SAP MaxAttention and SAP ActiveEmbedded offerings.
SAP ONE Support– A program to simplify the delivery and consumption of support and maintenance for a growing portfolio of solutions from both SAP and acquired companies. The program provides customers with comprehensive and harmonized support, regardless of whether their SAP solutions operate on premise or in the cloud.
SAP PartnerEdge – Global, partner-to-partner business collaboration network where SAP partners can share expertise, development capabilities, solutions, and knowledge to extend their market reach. In late 2012, SAP’s extranet for partners, SAP Channel Partner Portal, merged with SAP PartnerEdge. The combined site, available at www.sappartneredge.com, now gives partners access to information, product and business news, tools, training, and business resources to order products. Partners can also manage their relationship with SAP and collaborate with other SAP partners through SAP PartnerEdge.
SAP Payment service – Service that helps companies invest in SAP solutions implemented by a strategic partner of SAP: Siemens Financial Services GmbH (SFS). SFS targets the financing service chiefly at midsize companies. Depending on local conditions, the SFS plan leases solutions to customers and provides loan finance. Formerly called SAP Financing service.
SAP Pinnacle Award– Annual partner recognition awarded to SAP partners in various categories.
| | |
| Additional Information Glossary | | 216 |
SAPPHIRE NOW – SAP’s signature business technology event and the largest SAP customer-driven conference is held annually in several locations around the globe. The global event in the United States is co-located with the Americas’ SAP Users’ Group (ASUG) annual conference. Attendees discover new initiatives, solutions, products, and services, as well as unique access to the latest business strategies and industry best practices from SAP customers, partners, executives, and industry experts to help them drive business results across all levels.
Sapphire Ventures– Name of independent venture firm spun off from SAP, providing the agility of a start-up while allowing companies to tap into SAP’s global enterprise ecosystem of customers and partners. The firm partners with outstanding entrepreneurs and venture firms worldwide to build industry-leading businesses. Formerly called SAP Ventures.
SAP Predictive Analytics – Software that offers an intuitive tool for predictive model design and visualization for statistical analysis and data mining. Combining functionality from the retired offerings SAP Predictive Analysis and SAP InfiniteInsight in a single desktop installation, it helps uncover hidden insights and relationships in data so companies can make predictions about future events.
SAP Premier Customer Network – Exclusive SAP community of top industry leaders representing some of the world’s largest and best-run businesses. For these premier customers, SAP aims to simplify and tailor the partnership toward the unique needs of each customer by proactively assembling the best talent and synchronization across all SAP lines of business (product development, sales, services, support, and marketing) globally.
SAP R/2– Business software for mainframe computers launched by SAP in 1979; precursor to SAP R/3.
SAP R/3 – Business software for client/server environments launched by SAP in 1992 with enterprise software components for human resources, logistics, financials, sales and distribution, and others; precursor to SAP ERP.
SAP Ramp-Up – Program SAP uses to introduce new application releases on the market to selected customers during the restricted shipment phase.
SAP Rapid Deployment solutions – Packages of preconfigured software and predefined services with content including best practices, templates, tools, and business user enablement with predetermined scope, time, and costs. Because the solutions are installed quickly, customers can benefit from crucial software functionality within as little as 12 weeks, helping lower the total cost of implementation and giving customers immediate and tangible value.
SAP road maps – Available for industries, lines of business, and technology, SAP road maps highlight the SAP solutions available today, planned innovation, and the SAP vision for the future.
SAP S/4HANA – Launched in February 2015, SAP’s next-generation business suite offered exclusively on the SAP HANA platform, with on-premise and cloud deployment editions, designed with the role-based user experience of SAP Fiori. Cloud editions are available for marketing, project services, and the enterprise. Also known by as SAP Business Suite 4 SAP HANA.
SAP S/4HANA Enterprise Management – A core solution that covers all mission-critical business processes of an enterprise. It is natively built on the SAP HANA platform, designed with SAP Fiori user experience (UX), and delivered in the cloud and on premise. It is a core element of the new SAP S/4HANA Line-of-Business (LoB) Solutions.
SAP S/4HANA Finance– A global financial solution powered by SAP HANA offering a complete choice of deployment (cloud, on premise, hybrid). It is part of the modular SAP S/4HANA Line-of-Business (LoB) Solutions.
SAP S/4HANA Line-of-Business Solutions – Solutions that combine the core capabilities included in the SAP S/4HANA Enterprise Management solution with the solutions in the SAP portfolio (on premise and cloud) for a specific line of business.
SAP Safeguarding – Project-based support option that helps customers manage risks and enable the technical robustness of SAP solutions during implementation, upgrade, and operations.
SAP Service and Support– Portfolio that encompasses service and support offerings from SAP, which provide a simplified engagement, delivery, and overall experience with SAP. Delivered by Global Service & Support organization helps customers derive value from their SAP solutions in a fast, cost-effective, and predictable way. The SAP Service and Support portfolio includes a variety of named services and support offerings including SAP MaxAttention, SAP Safeguarding, SAP Enterprise Support, and others. See “Global Service & Support.”
SAP Service Marketplace – Extranet platform that offers capabilities for collaboration between SAP, customers, and partners. The extranet provides central access and guided navigation to SAP’s complete product listing with support, maintenance, and upgrade information.
SAP Simple Finance – See “SAP S/4HANA Finance.”
SAP Smart Business – Cockpit dashboards that enable users to quickly aggregate data, perform analytics, and gain insights into KPIs related to various corporate functions. A variety of options are available for specific use cases/roles including accounts payable, event management, financial close, purchasing, and other corporate functions. An executive edition of SAP Smart Business uses SAP HANA extended application services to analyze Big Data at granular levels in real time for fast decision making by executive management.
| | |
| Additional Information Glossary | | 217 |
SAP SME Solutions– A subset of the portfolio of SAP solutions for small businesses and midsize companies. It is essentially a family name for four specific offerings: SAP Anywhere, SAP Business One, SAP Business ByDesign, and SAP Business All-in-One. By consolidating these four offerings under one umbrella name, we focus on a portfolio of SME offerings that helps our customers choose the best solution for their business size and needs. Cockpit dashboards that enable users to quickly aggregate data, perform analytics, and gain insights into KPIs related to various corporate functions. A variety of options are available for specific use cases/roles including accounts payable, event management, financial close, purchasing, and other corporate functions. An executive edition of SAP Smart Business uses SAP HANA extended application services to analyze Big Data at granular levels in real time for fast decision making by executive management.
SAP Solution Extensions – Category name of solutions that are developed by independent partners. Solution extensions integrate easily with SAP software, offering customers cross-solution and cross-industry functions that complement SAP software. These select third-party offerings are branded with “SAP,” and sold and supported by SAP and partners.
SAP Solution Manager– Application management solution that enables customers to manage their SAP and non-SAP applications better. With SAP Solution Manager, customers can centralize, enhance, automate, and improve the management of their entire system landscape, thus reducing total cost of ownership. The solution includes features such as diagnostics, testing, root cause analysis, and solution monitoring.
SAP solutions for customer engagement and commerce – Category of solutions that help businesses create experiences that engage customers like never before and can lead to more effective marketing promotions, increased revenue share of new customers, reduced customer churn, increased revenue growth, and improved cart-to-order conversion rate.
SAP solutions for small businesses and midsize companies – Category of solutions that combine business management and business intelligence software for small and midsize enterprises (SMEs). It currently includes SAP SME Solutions, SAP BusinessObjects Edge solutions, Edge editions or existing SAP software products, and other SME services. As with large enterprises, these firms seek to streamline business processes, cut costs, drive growth, and increase profitability by receiving the right information at the right time – across all operations.
SAP Sports One – Solution comprising a suite of Web applications (Match Insights, Player Fitness, Scouting Insights, Team Manager, and Training Planner) and mobile apps (SAP Player Fitness, SAP Team One) built on SAP HANA Cloud Platform that gives sport clubs the team management tools they need to operate effectively.
SAP Standard Support – Support option offering a reliable response to technical disruptions and for maintaining system health and integrity. This basic support offering features updates, problem resolution, knowledge transfer, quality management, and more to keep IT landscapes up to date and stable.
SAP Startup Focus – Program that offers a variety of resources for young companies including technology, training, technical advice and valuable go-to-market support. It serves as a development and growth accelerator that provides an integrated approach for startups to innovate on the SAP HANA platform.
SAP Store – Public online store (www.sapstore.com) where you can discover, download, and buy SAP solutions, services, mobile apps, demos, and free trials from SAP and partners.
SAP SuccessFactors – Unified brand resulting from the acquisition of SuccessFactors in August 2013. All cloud HR assets of SAP and SuccessFactors are now consolidated under the SAP SuccessFactors brand. SuccessFactors, an SAP company, continues to operate as an independent business. SAP SuccessFactors solutions help businesses sell more goods, services, and digital content through every touch point, channel, and device.
SAP SuccessFactors Employee Central– The foundation of the SAP SuccessFactors HCM Suite of solutions, Employee Central is core HR software delivered securely as a service from the cloud. It offers one global system of record, complete workforce overview combining HR and talent data, powerful analytics, and social collaboration fine-tuned to meet local needs.
SAP SuccessFactors HCM Suite – Suite of HR solutions for talent management, core HR, collaboration, and workforce analytics. The cloud-based suite provides solutions to bridge the gap between strategy and execution with tools to hire, reward, and develop the right people with the right skills to grow a business sustainably.
SAP TechEd– Annual technical education conference that encompasses a broad scope of topics and audience, focusing on technology with an emphasis on collaboration and hands-on workshops.
SAP University Alliances– Program that introduces students to the exciting technologies shaping business today, and designed to connect students around the world interested in SAP solutions, careers, and research opportunities. Students participate in classroom sessions, app development, networking opportunities, events, and more. The SAP University Alliances community provides connections between university leaders and students, SAP customers and partners, and SAP internal experts.
| | |
| Additional Information Glossary | | 218 |
SAP Urban Matters– see “SAP Future Cities.”
SAP User Group Executive Network (SUGEN)– In 2007, SAP initiated a program that encouraged all SAP user groups to share their expertise and recommended practices with the wider user-group community. It kindled some valuable discussion, which, in the end, is good for all SAP stakeholders. An umbrella organization, SUGEN embraces 12 national SAP user groups with the shared aim of defining priorities and agreeing on plans of action to bring greater focus to the dialog between SAP and its user groups on the global plane.
SAP Ventures– see “Sapphire Ventures.”
Scope 1 (emissions)– Direct greenhouse gas emissions from sources that are owned or controlled by the reporting company, for example, fuel burned in corporate cars.
Scope 2 (emissions)– Indirect greenhouse gas emissions from consumption of purchased electricity, heat, or steam.
Scope 3 (emissions) – Indirect emissions that are a consequence of the activities of the reporting company, but occur from sources owned or controlled by another company, such as business flights.
SMB Solutions Group– Business unit created at SAP in 2014 responsible for the go-to-market strategy and development of innovative solutions for the small and midsize business (SMB) market, comprising companies with <500 employees only. Includes all corporate areas (marketing, sales, and development) responsible for SAP Business ByDesign, SAP
Business One, and SAP Anywhere. See “SAP SME Solutions.”
software as a service (SaaS) – Software that is provided literally “as a service.” Software applications are delivered and managed remotely over a secure Internet connection and a standard Web browser. Access is charged on a subscription basis usually on a dedicated time basis and with expandable feature access options. Typically a defined level of support is included. See “cloud computing.”
solution– A solution enables a customer to meet a challenge or take advantage of an opportunity and are built or assembled by flexibly combining software products and technology. SAP solutions may include support for best business practices and be aided by consulting and ongoing support. They may also be enhanced or extended by applications and services from partners.
SuccessFactors – See “SAP SuccessFactors.”
T
total energy consumed – The sum of all energy consumed through SAP’s own operations, including energy from renewable sources and energy consumed by external data centers delivering our cloud offerings.
U
United Nations Global Compact (UN Global Compact)– A policy initiative for businesses that are committed to aligning their operations and strategies with ten universally accepted principles in the areas of human rights, labor standards, environment, and anti-corruption.
W
women in management– Phrase used to refer to the percentage of women in management positions (managing teams, managing managers, executive boards) as compared to the total number of managers, expressed by the number of individuals and not full-time equivalents (FTEs).
| | |
| Additional Information Glossary | | 219 |
Financial Calendar
2016
March 29
Publication of SAP Integrated Report
April 20
Results for the first quarter of 2016
May 12
Annual General Meeting of Shareholders, Mannheim, Germany
May 13
Dividend Payment
July 20
Results for the second quarter of 2016
October 21
Results for the third quarter of 2016
2017
January 24
Preliminary results for fiscal year 2016
May 10
Annual General Meeting of Shareholders, Mannheim, Germany
May 11
Dividend Payment
| | |
| Additional InformationFinancial Calendar | | 220 |
Addresses
GROUP HEADQUARTERS
SAP SE
Dietmar-Hopp-Allee 16
69190 Walldorf
Germany
Tel. +49 6227 74 74 74
Fax +49 6227 75 75 75
E-mail info@sap.com
Web site www.sap.com
The addresses of all our international subsidiaries and sales partners are available on our public Web site at
www.sap.com/directory/main.html.
For more information about the matters discussed in the report, contact:
Investor Relations
Tel. +49 6227 76 73 36
Fax +49 6227 74 08 05
E-mail investor@sap.com
Web site www.sap.com/investor
Press
Tel. +49 6227 74 63 15
E-mail press@sap.com
Web site www-sap.com/press
| | |
| Additional InformationAddresses | | 221 |
Financial and Sustainability Publications
We present our financial, social, and environmental performance in the SAP Integrated Report 2015, which is available at www.sapintegratedreport.com. This Annual Report 2015 is an extract from the SAP Integrated Report 2015. It comprises all of the information required by accounting and disclosure standards applicable to us.
The SAP Integrated Report is available online only at www.sapintegratedreport.com.
The following publications are available in English at www.sap.com/investor, or in German at www.sap.de/investor:
| ¡ | | SAP Group Annual Report (IFRS, in English and German) |
| ¡ | | Annual Report on Form 20-F (IFRS, in English) |
| ¡ | | SAP SE Statutory Financial Statements and Review of Operations (HGB, in German) |
| ¡ | | Interim Reports (in English and German) |
| ¡ | | XBRL versions of the annual and interim reports |
| ¡ | | SAP INVESTOR, SAP’s quarterly shareholder magazine (www.sap-investor.com, in English and German) |
Complete information on the governance of SAP is available at www.sap.com/corpgovernance. Materials include:
| ¡ | | Information about the management of the company, including the directors on the governing bodies |
| ¡ | | Details of the directors’ dealings in SAP shares |
| ¡ | | Shareholder meeting documents and ballot results |
| ¡ | | Articles of Incorporation |
| ¡ | | Agreement on the Involvement of Employees in SAP SE |
| ¡ | | German Code of Corporate Governance |
| ¡ | | Declaration of Implementation pursuant to the German Stock Corporation Act, Section 161 |
| ¡ | | Code of Business Conduct for Employees |
| ¡ | | Corporate Governance Statement pursuant to the German Commercial Code, Section 289a |
| ¡ | | Corporate Governance Report |
Additional SAP policies are made public at www.sap.com/corporate-en/sustainability:
| ¡ | | SAP Code of Business Conduct for Employees |
| ¡ | | SAP Human Rights Commitment |
| ¡ | | SAP Global Health and Safety Management Policy |
| ¡ | | SAP Environmental Policy |
| ¡ | | SAP Supplier Code of Conduct |
| ¡ | | SAP Partner Code of Conduct |
| | |
| Additional Information Financial and Sustainability Publications | | 222 |
Publication Details
PUBLISHER
SAP SE
Investor Relations
CONCEPT AND PRODUCTION SUPPORT
Kammann Rossi, GmbH, Cologne, Germany
REALIZATION
This Annual Report was created with SAP S/4HANA and SAP Disclosure Management
PHOTOGRAPHY GLOBAL MANAGING BOARD
Andreas Pohlmann, Munich, Germany
PRINTING
ABC Druck, Heidelberg, Germany
COPYRIGHT
©2016 SAP SE
Dietmar-Hopp-Allee 16
69190 Walldorf
Germany
TRADEMARKS
© 2016 SAP SE or an SAP affiliate company. All rights reserved.
No part of this publication may be reproduced or transmitted in any form or for any purpose without the express permission of SAP SE or an SAP affiliate company.
SAP and other SAP products and services mentioned herein as well as their respective logos are trademarks or registered trademarks of SAP SE or an SAP affiliate company in Germany and other countries.
Please see http://www.sap.com/about/legal/copyright.html for additional trademark information and notices.
| | |
| Additional InformationPublication Details | | 223 |
GROUP HEADQUARTERS
SAP SE
Dietmar-Hopp-Allee 16
69190 Walldorf
Germany
| | |
| www.sap.com | | |
| |
www.sap.com/investor | | |