Exhibit 99.1
| | |
| SAP Q3 2017 Quarterly Statement | |  |
SAP Raises Outlook Backed by Outstanding S/4HANA Momentum
| | ◾ | | Digital core business soars with over 6,900 S/4HANA customers – around 70% growth year over year |
| | ◾ | | Continued strong business performance despite significant currency headwinds |
| | ◾ | | Software revenue stable (IFRS) and up 3%(Non-IFRS at constant currencies) |
| | ◾ | | Cloud subscriptions and support revenue up 22% (IFRS) and up 27%(Non-IFRS at constant currencies) |
| | ◾ | | EPS up 35% (IFRS) and up 10%(Non-IFRS) |
| | ◾ | | On track to execute €500 million share buy back by year end, €288 million bought back in Q3 |
| | | | | | | | | | | | | | |
Cloud Subscriptions & | | | | Share of | | | | Total Revenue |
Support Revenue | | | | Predictable Revenue | | | | | | |
in € millions | | | | in percent | | | | in € millions |
| IFRS | | Non-IFRS | | | | Q3 2017 | | | | IFRS | | Non-IFRS |
937 | | 938 | | | | 65% | | | | 5,590 | | 5,590 |
+22% | | +22% (+27% cc) | | | | +1 p.p. | | | | +4% | | +4% (+8% cc) |
| | | | | | | | | | | | | |
| | | | | | | | |
“SAP has evolved from the world’s system of record to the platform for the digital revolution. Led by S/4HANA, we are delivering intelligent business applications built on the most data rich architecture ever created. We see growth in every corner of the business, which is why we are again raising our guidance for the full year.” Bill McDermott, CEO | | | | | | “I am very pleased that we continue to have excellent software revenue and thatnon-IFRS earnings per share are up again double-digit. We now expect a strongnon-IFRS earnings per share performance for the entire year. Our performance, portfolio and pipeline make me truly confident that we will deliver on ourmid-term ambitions.” Luka Mucic, CFO | | |
| | | | |
SAP Q3 2017 Quarterly Statement | | | 1 | |
Walldorf, Germany – October 19, 2017
SAP SE (NYSE: SAP) today announced its financial results for the third quarter 2017 ended September 30, 2017.
Business Highlights
Financial Highlights
Third Quarter 2017
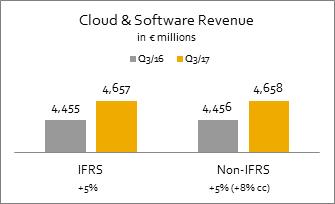
SAP’s fast revenue growth in the cloud continued in the third quarter. New cloud bookings1 grew by 14% (19% at constant currencies) in the third quarter and reached €302 million. IFRS cloud subscriptions and support revenue grew 22% year over year to €937 million andnon-IFRS cloud subscriptions and support revenue grew 22% year over year (27% at constant currencies) to €938 million. IFRS andnon-IFRS software revenue was €1.03 billion, stable year over year (up 3% at constant currencies). New cloud and software license order entry2 grew by 15% year over year in the third quarter. IFRS andnon-IFRS cloud and software revenue was €4.66 billion, an increase of 5% (8% at constant currencies). SAP’s “predictable revenue”, i.e. the total of cloud subscriptions & support revenue and software support revenue, was 65% of total revenue, up 1 percentage point year over year.
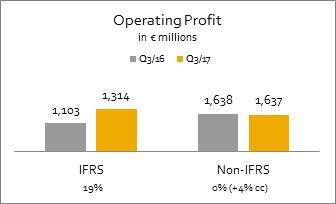
IFRS operating profit was up 19% to €1.3 billion.Non-IFRS operating profit was stable at €1.64 billion (up 4% at constant currencies). IFRS earnings per share increased 35% to €0.82.Non-IFRS earnings per share increased 10% to €1.01.
Operating cash flow for the first nine months was €4.13 billion, an increase of 14% year over year. Free cash flow increased 7% year over year to €3.16 billion. At quarter end, net debt was €1.71 billion, an improvement of €2 billion year over year. SAP’s strong growth and cash generation provide significant flexibility around capital allocation aimed at driving shareholder value. Consistent with the Company’s announcement in the second quarter, SAP is on track to buy back €500 million in shares. As of the end of the third quarter, the company has bought back €288 million.
SAP S/4HANA
With S/4HANA customers can massively simplify their IT landscape, run live and reinvent their business model for the digital economy across both cloud andon-premise deployments. S/4HANA adoption grew to more than 6,900 customers, up around 70% year over year. In the third quarter, approximately 600 additional customers signed up of which more than 40% were net new. S/4HANA continues to be adopted by the most forward thinking global companies, including Shell and China International Marine Containers.
SAP Leonardo
SAP Leonardo brings together deep process and industry expertise, advanced design thinking methodology and cutting edge software capabilities such as IoT, Big Data, Machine Learning, Analytics, and Blockchain. SAP Leonardo is about orchestrating these disruptive capabilities to create completely new ways of working and new business models. Hanon Systems (Korea) and Citco Technology Management (USA) among many others adopted SAP Leonardo solutions in the third quarter to redefine their businesses and become intelligent enterprises.
1 New cloud bookings is the total of all orders received in a given period the revenue from which is expected to be classified as cloud subscription and support revenue and that result from purchases by new customers and from incremental purchases by existing customers. Consequently, orders to renew existing contracts are not included in this metric. The order amount must be committed. Consequently, due to theirpay-per-use nature, business network transaction fees which do not include a committed minimum consumption are not reflected in the bookings metric (e.g. SAP Ariba and SAP Fieldglass transaction-based fees). Amounts included in the measures are generally annualized (annualized contract value ACV).
2 New cloud and software license order entry is the total of new cloud order entry and software license order entry. The new cloud order entry metric is identical to the new cloud bookings metric defined above except that it considers the total contract value (TCV) of the orders where the new cloud bookings metric considers the orders’ annualized contract value (ACV). Software license order entry is the total of all orders received in a given period, the revenue from which is expected to be classified as software license revenue. The support services commonly sold with the software licenses are not included in the software license order entry metric.
| | | | |
SAP Q3 2017 Quarterly Statement | | | 2 | |
Human Capital Management
With SuccessFactors and Fieldglass, SAP delivers total workforce management across both permanent and contingent labor, localized for 84 countries and 42 languages. SuccessFactors Employee Central, which is the core of our HCM offering, had more than 2,000 customers at the end of the third quarter. SAP SuccessFactors was named a leader in Forrester Research Inc.’s “The Forrester Wave™: SaaS Human Resource Management Systems, Q3 2017.” La Liga (Spanish Football League) and Bancolombia, the largest commercial bank in Colombia, selected SAP’s workforce management solutions in the third quarter to deliver unified, high-quality employee experiences.
Customer Engagement and Commerce
SAP’s next generation customer engagement solutions enable businesses to manage their front office across the entire spectrum from marketing to sales to services – seamlessly and in real-time. Businesses get a single view of their customer – be it social, retail ore-commerce. SAP’s Customer Engagement and Commerce (CEC) solutions serve both B2C and B2B across a wide range of industries, including retail, telco, financial services, manufacturing and the public sector. SAP’s CEC solutions once again achieved double-digit growth in new cloud bookings and software revenue. In September, SAP announced that it would acquire Gigya. This will further enhance SAP’s CEC solutions by allowing companies to better manage customers’ profile, preference,opt-in and consent settings, with customers maintaining control of their data at all times.
Business Networks
Each of SAP’s business network solutions provides a rich, open, global platform that connects a large ecosystem of customers, suppliers, partners and developers delivering ever expanding content and innovation. On the Ariba Network, approximately 3 million companies in over 180 countries collaborate and trade around $1 trillion in goods and services annually. Concur helps close to 50 million end users effortlessly process travel and expenses. With SAP Fieldglass customers manage over 3.9 million contingent workers in more than 180 countries. Total revenue in the SAP Business Network segment was up 19% in the third quarter to €578 million at constant currencies.
Regional Revenue Performance in the Third Quarter 2017
SAP had a strong performance in the EMEA region with cloud and software revenue increasing 8% (IFRS) and 9%(non-IFRS constant currencies). Cloud subscriptions and support revenue grew by 42% (IFRS) and 46%(non-IFRS at constant currencies) with an especially strong quarter in Germany and Spain. In addition, SAP had strong double-digit software revenue growth in Germany, Russia and the Middle East & North Africa (MENA) region.
The Company had solid growth in the Americas region, despite the natural disasters that plagued both the United States and Mexico. Cloud and software revenue grew by 2% (IFRS) and 7%(non-IFRS constant currencies). Cloud subscriptions and support revenue increased by 13% (IFRS) and 19%(non-IFRS at constant currencies). In Cloud subscriptions and support revenue Brazil was a highlight, while the United States had a strong quarter in software revenue.
In the APJ region, SAP had a strong performance in both cloud and software revenue and cloud subscriptions and support revenue. Cloud and software revenue was up 2% (IFRS) and 9%(non-IFRS constant currencies). Cloud subscriptions and support revenue grew by 30% (IFRS) and 37%(non-IFRS at constant currencies). Japan and Australia were very strong in cloud subscriptions and support revenue. For software revenue, Australia had triple digit growth and China had strong double-digit growth.
| | | | |
SAP Q3 2017 Quarterly Statement | | | 3 | |
Financial Results at a Glance
| | | | | | | | | | | | | | | | | | | | | | | | | | | | |
Third Quarter 20171) | |
| | | IFRS | | | Non-IFRS2) | |
€ million, unless otherwise stated | | Q3 2017 | | | Q3 2016 | | | D in % | | | Q3 2017 | | | Q3 2016 | | | D in % | | | D in %
const.
curr. | |
New Cloud Bookings3) | | | N/A | | | | N/A | | | | N/A | | | | 302 | | | | 265 | | | | 14 | | | | 19 | |
Cloud subscriptions and support | | | 937 | | | | 769 | | | | 22 | | | | 938 | | | | 769 | | | | 22 | | | | 27 | |
Software licenses and support | | | 3,720 | | | | 3,686 | | | | 1 | | | | 3,720 | | | | 3,687 | | | | 1 | | | | 4 | |
Cloud and software | | | 4,657 | | | | 4,455 | | | | 5 | | | | 4,658 | | | | 4,456 | | | | 5 | | | | 8 | |
Total revenue | | | 5,590 | | | | 5,375 | | | | 4 | | | | 5,590 | | | | 5,375 | | | | 4 | | | | 8 | |
Share of predictable revenue (in %) | | | 65 | | | | 64 | | | | 1pp | | | | 65 | | | | 64 | | | | 1pp | | | | | |
Operating profit | | | 1,314 | | | | 1,103 | | | | 19 | | | | 1,637 | | | | 1,638 | | | | 0 | | | | 4 | |
Profit after tax | | | 993 | | | | 725 | | | | 37 | | | | 1,214 | | | | 1,089 | | | | 11 | | | | | |
Basic earnings per share (€) | | | 0.82 | | | | 0.61 | | | | 35 | | | | 1.01 | | | | 0.91 | | | | 10 | | | | | |
Number of employees (FTE, September 30) | | | 87,874 | | | | 82,426 | | | | 7 | | | | N/A | | | | N/A | | | | N/A | | | | N/A | |
| | | | | | | | | | | | | | | | | | | | | | | | | | | | |
Nine months ended September 20171) | |
| | | IFRS | | | Non-IFRS2) | |
€ million, unless otherwise stated | | Q1–Q3 2017 | | | Q1–Q3 2016 | | | D in % | | | Q1–Q3 2017 | | | Q1–Q3 2016 | | | D in % | | | D in %
const.
curr. | |
New Cloud Bookings3) | | | N/A | | | | N/A | | | | N/A | | | | 857 | | | | 664 | | | | 29 | | | | 30 | |
Cloud subscriptions and support | | | 2,775 | | | | 2,166 | | | | 28 | | | | 2,775 | | | | 2,168 | | | | 28 | | | | 28 | |
Software licenses and support | | | 10,968 | | | | 10,497 | | | | 4 | | | | 10,968 | | | | 10,500 | | | | 4 | | | | 4 | |
Cloud and software | | | 13,742 | | | | 12,663 | | | | 9 | | | | 13,743 | | | | 12,668 | | | | 8 | | | | 8 | |
Total revenue | | | 16,656 | | | | 15,339 | | | | 9 | | | | 16,657 | | | | 15,343 | | | | 9 | | | | 8 | |
Share of predictable revenue (in %) | | | 66 | | | | 65 | | | | 1pp | | | | 66 | | | | 65 | | | | 1pp | | | | | |
Operating profit | | | 2,913 | | | | 3,184 | | | | –9 | | | | 4,405 | | | | 4,258 | | | | 3 | | | | 3 | |
Profit after tax | | | 2,189 | | | | 2,108 | | | | 4 | | | | 3,220 | | | | 2,832 | | | | 14 | | | | | |
Basic earnings per share (€) | | | 1.81 | | | | 1.77 | | | | 3 | | | | 2.67 | | | | 2.37 | | | | 13 | | | | | |
Number of employees (FTE, September 30) | | | 87,874 | | | | 82,426 | | | | 7 | | | | N/A | | | | N/A | | | | N/A | | | | N/A | |
1) All figures are unaudited.
2) For a detailed description of SAP’snon-IFRS measures seeExplanation ofNon-IFRS Measures online. For a breakdown of the individual adjustments see table“Non-IFRS Adjustments by Functional Areas” in this Quarterly Statement.
3) As this is an order entry metric, there is no IFRS equivalent.
Due to rounding, numbers may not add up precisely.
| | | | |
SAP Q3 2017 Quarterly Statement | | | 4 | |
Business Outlook 2017
The Company is raising its outlook for the full year 2017:
| | – | | Based on the strong momentum in SAP’s cloud business, the Company continues to expect full year 2017non-IFRS cloud subscriptions and support revenue to be in a range of €3.8 billion to €4.0 billion at constant currencies (2016: €2.99 billion). |
| | – | | Due to increasing adoption of S/4HANA and our Digital Business Platform the Company now expects full year 2017non-IFRS cloud & software revenue to increase by 7.0% to 8.5% at constant currencies (2016: €18.43 billion). The lower end of the range was previously 6.5%. |
| | – | | The Company now expects full year 2017non-IFRS total revenue in a range of €23.4 billion to €23.8 billion at constant currencies (2016: €22.07 billion). The previous range was €23.3 billion to €23.7 billion at constant currencies. |
| | – | | The Company now expects full-year 2017non-IFRS operating profit to be in a range of €6.85 billion to €7.0 billion at constant currencies (2016: €6.63 billion). The lower end of the range was previously €6.8 billion. |
While the Company’s full-year 2017 business outlook is at constant currencies, actual currency reported figures are expected to continue to be impacted by exchange rate fluctuations. If exchange rates remain at the September 2017 average level for the rest of the year, we expectnon-IFRS cloud and software revenue andnon-IFRS operating profit growth rates to experience a currency headwind in a range of-5 to-8pp in Q4 2017(-1 to-3pp for the full year 2017).
The Company now expects its full-year 2017 effective tax rates (IFRS andnon-IFRS) to be below the previous outlook. The previous outlook for the effective tax rate (IFRS) was 26.0% to 27.0% (2016: 25.3%) and for the effective tax rate(non-IFRS) 27.0% to 28.0% (2016: 26.8%). The decrease in comparison to the previous outlook mainly results from aone-time tax benefit relating to an intra-group transfer of intellectual property rights expected to be executed in the fourth quarter. As soon as the impact can be determined the Company will update the effective tax rate outlook.
| | | | |
SAP Q3 2017 Quarterly Statement | | | 5 | |
Additional Information
Extension of the SAP Executive Board
The Supervisory Board of SAP SE has named Christian Klein (Chief Operating Officer) to the SAP Executive Board heading the new board area Global Business Operations effective January 1, 2018.
Additionally, the Supervisory Board of SAP SE has extended Michael Kleinemeier’s Executive Board contract until December 31, 2019.
Acquisition of Gigya, Inc.
On September 24, 2017, SAP announced that it has entered into an agreement to acquireUS-based Gigya, Inc., a market leader for customer identity and access management. The transaction is expected to close in the final quarter of 2017, subject to regulatory approval.
General Remarks about this Quarterly Statement and the SAP Integrated Report
Since Q1 2016, we issue a quarterly statement for each of the four fiscal quarters. Additionally, we issue a half year report and a full year integrated report. SAP’s 2016 Integrated Report and Annual Report to Shareholders, and 2016 Annual Report on Form20-F were published on February 28, 2017, and are available for download atwww.sapintegratedreport.com.
For a more detailed description of all of SAP’snon-IFRS measures and their limitations as well as our constant currency and free cash flow figures seeExplanation ofNon-IFRS Measures online.
Webcast
SAP senior management will host a financial analyst conference call today at 2:00 PM (CET) / 1:00 PM (GMT) / 8:00 AM (Eastern) / 5:00 AM (Pacific). The call will be webcast live on the Company’s website atwww.sap.com/investor and will be available for replay. Supplementary financial information pertaining to the third quarter results can be found atwww.sap.com/investor.
About SAP
As market leader in enterprise application software, SAP (NYSE: SAP) helps companies of all sizes and industries run better. From back office to boardroom, warehouse to storefront, desktop to mobile device – SAP empowers people and organizations to work together more efficiently and use business insight more effectively to stay ahead of the competition. SAP applications and services enable more than 365,000 business and public sector customers to operate profitably, adapt continuously, and grow sustainably. For more information, visitwww.sap.com.
| | | | |
For more information, financial community only: |
| Stefan Gruber | | +49 (6227)7-44872 | | investor@sap.com, CET |
| Follow SAP Investor Relations on Twitter at @sapinvestor. | | |
| |
For more information, press only: | | |
| Nicola Leske | | +49 (6227)7-50852 | | nicola.leske@sap.com, CET |
| Daniel Reinhardt | | +49 (6227)7-40201 | | daniel.reinhardt@sap.com, CET |
| Rajiv Sekhri | | +49 (6227)7-74871 | | rajiv.sekhri@sap.com, CET |
|
For customers interested in learning more about SAP products: |
| Global Customer Center: | | +49 180534-34-24 |
| United States Only: | | +1 (800)872-1SAP(+1-800-872-1727) |
Note to editors:
To preview and download broadcast-standard stock footage and press photos digitally, please visit www.sap.com/photos. On this platform, you can find high resolution material for your media channels. To view video stories on diverse topics, visitwww.sap-tv.com. From this site, you can embed videos into your own Web pages, share video viae-mail links and subscribe to RSS feeds from SAP TV.
| | | | |
SAP Q3 2017 Quarterly Statement | | | 6 | |
Any statements contained in this document that are not historical facts are forward-looking statements as defined in the U.S. Private Securities Litigation Reform Act of 1995. Words such as “anticipate,” “believe,” “estimate,” “expect,” “forecast,” “intend,” “may,” “plan,” “project,” “predict,” “should” and “will” and similar expressions as they relate to SAP are intended to identify such forward-looking statements. SAP undertakes no obligation to publicly update or revise any forward-looking statements. All forward-looking statements are subject to various risks and uncertainties that could cause actual results to differ materially from expectations. The factors that could affect SAP’s future financial results are discussed more fully in SAP’s filings with the U.S. Securities and Exchange Commission (“SEC”), including SAP’s most recent Annual Report on Form20-F filed with the SEC. Readers are cautioned not to place undue reliance on these forward-looking statements, which speak only as of their dates.
© 2017 SAP SE. All rights reserved.
No part of this publication may be reproduced or transmitted in any form or for any purpose without the express permission of SAP SE. The information contained herein may be changed without prior notice.
Some software products marketed by SAP SE and its distributors contain proprietary software components of other software vendors. National product specifications may vary.
These materials are provided by SAP SE and its affiliated companies (“SAP Group”) for informational purposes only, without representation or warranty of any kind, and SAP Group shall not be liable for errors or omissions with respect to the materials. The only warranties for SAP Group products and services are those that are set forth in the express warranty statements accompanying such products and services, if any. Nothing herein should be construed as constituting an additional warranty.
SAP and other SAP products and services mentioned herein as well as their respective logos are trademarks or registered trademarks of SAP SE (or an SAP affiliate company) in Germany and other countries. Please seehttp://www.sap.com/corporate-en/legal/copyright/index.epx#trademark for additional trademark information and notices.
| | | | |
SAP Q3 2017 Quarterly Statement | | | 7 | |
Financial andNon-Financial Key Facts (IFRS andNon-IFRS)
| | | | | | | | | | | | | | | | | | | | | | | | | | | | | | | | |
| € millions, unless otherwise stated | | Q1 2016 | | | Q2 2016 | | | Q3 2016 | | | Q4 2016 | | | TY 2016 | | | Q1 2017 | | | Q2 2017 | | | Q3 2017 | |
Revenues | | | | | | | | | | | | | | | | | | | | | | | | | | | | | | | | |
Cloud subscriptions and support (IFRS) | | | 677 | | | | 720 | | | | 769 | | | | 827 | | | | 2,993 | | | | 905 | | | | 932 | | | | 937 | |
Cloud subscriptions and support(non-IFRS) | | | 678 | | | | 721 | | | | 769 | | | | 827 | | | | 2,995 | | | | 906 | | | | 932 | | | | 938 | |
| | | | | | | | |
% change – yoy | | | 33 | | | | 30 | | | | 28 | | | | 31 | | | | 30 | | | | 34 | | | | 29 | | | | 22 | |
| | | | | | | | |
% change constant currency – yoy | | | 33 | | | | 33 | | | | 29 | | | | 29 | | | | 31 | | | | 30 | | | | 27 | | | | 27 | |
Software licenses (IFRS) | | | 609 | | | | 1,040 | | | | 1,034 | | | | 2,177 | | | | 4,860 | | | | 691 | | | | 1,090 | | | | 1,033 | |
Software licenses(non-IFRS) | | | 609 | | | | 1,042 | | | | 1,034 | | | | 2,177 | | | | 4,862 | | | | 691 | | | | 1,090 | | | | 1,033 | |
| | | | | | | | |
% change – yoy | | | –13 | | | | 6 | | | | 2 | | | | 1 | | | | 1 | | | | 13 | | | | 5 | | | | 0 | |
| | | | | | | | |
% change constant currency – yoy | | | –10 | | | | 10 | | | | 2 | | | | 0 | | | | 1 | | | | 10 | | | | 4 | | | | 3 | |
Software support (IFRS) | | | 2,564 | | | | 2,598 | | | | 2,653 | | | | 2,756 | | | | 10,571 | | | | 2,731 | | | | 2,736 | | | | 2,687 | |
Software support(non-IFRS) | | | 2,564 | | | | 2,598 | | | | 2,653 | | | | 2,756 | | | | 10,572 | | | | 2,731 | | | | 2,736 | | | | 2,687 | |
| | | | | | | | |
% change – yoy | | | 5 | | | | 3 | | | | 6 | | | | 6 | | | | 5 | | | | 7 | | | | 5 | | | | 1 | |
| | | | | | | | |
% change constant currency – yoy | | | 5 | | | | 6 | | | | 6 | | | | 5 | | | | 6 | | | | 3 | | | | 4 | | | | 4 | |
Software licenses and support (IFRS) | | | 3,172 | | | | 3,639 | | | | 3,686 | | | | 4,933 | | | | 15,431 | | | | 3,422 | | | | 3,826 | | | | 3,720 | |
Software licenses and support(non-IFRS) | | | 3,173 | | | | 3,640 | | | | 3,687 | | | | 4,934 | | | | 15,434 | | | | 3,422 | | | | 3,826 | | | | 3,720 | |
| | | | | | | | |
% change – yoy | | | 1 | | | | 4 | | | | 5 | | | | 4 | | | | 3 | | | | 8 | | | | 5 | | | | 1 | |
| | | | | | | | |
% change constant currency – yoy | | | 2 | | | | 7 | | | | 5 | | | | 3 | | | | 4 | | | | 5 | | | | 4 | | | | 4 | |
Cloud and software (IFRS) | | | 3,850 | | | | 4,359 | | | | 4,455 | | | | 5,760 | | | | 18,424 | | | | 4,328 | | | | 4,757 | | | | 4,657 | |
Cloud and software(non-IFRS) | | | 3,851 | | | | 4,361 | | | | 4,456 | | | | 5,761 | | | | 18,428 | | | | 4,328 | | | | 4,758 | | | | 4,658 | |
| | | | | | | | |
% change – yoy | | | 5 | | | | 7 | | | | 8 | | | | 7 | | | | 7 | | | | 12 | | | | 9 | | | | 5 | |
| | | | | | | | |
% change constant currency – yoy | | | 6 | | | | 11 | | | | 9 | | | | 6 | | | | 8 | | | | 9 | | | | 8 | | | | 8 | |
Total revenue (IFRS) | | | 4,727 | | | | 5,237 | | | | 5,375 | | | | 6,724 | | | | 22,062 | | | | 5,285 | | | | 5,782 | | | | 5,590 | |
Total revenue(non-IFRS) | | | 4,728 | | | | 5,239 | | | | 5,375 | | | | 6,724 | | | | 22,067 | | | | 5,285 | | | | 5,782 | | | | 5,590 | |
| | | | | | | | |
% change – yoy | | | 5 | | | | 5 | | | | 8 | | | | 6 | | | | 6 | | | | 12 | | | | 10 | | | | 4 | |
| | | | | | | | |
% change constant currency – yoy | | | 6 | | | | 9 | | | | 8 | | | | 5 | | | | 7 | | | | 8 | | | | 9 | | | | 8 | |
Share of predictable revenue (IFRS, in %) | | | 69 | | | | 63 | | | | 64 | | | | 53 | | | | 61 | | | | 69 | | | | 63 | | | | 65 | |
Share of predictable revenue(non-IFRS, in %) | | | 69 | | | | 63 | | | | 64 | | | | 53 | | | | 61 | | | | 69 | | | | 63 | | | | 65 | |
| | | | | | | | | |
| | | | | | | | | | | | | | | | | | | | | | | | | | | | | | | | |
Profits | | | | | | | | | | | | | | | | | | | | | | | | | | | | | | | | |
Operating profit (IFRS) | | | 813 | | | | 1,269 | | | | 1,103 | | | | 1,950 | | | | 5,135 | | | | 673 | | | | 926 | | | | 1,314 | |
Operating profit(non-IFRS) | | | 1,104 | | | | 1,516 | | | | 1,638 | | | | 2,375 | | | | 6,633 | | | | 1,198 | | | | 1,570 | | | | 1,637 | |
| | | | | | | | |
% change | | | 5 | | | | 9 | | | | 1 | | | | 4 | | | | 4 | | | | 8 | | | | 4 | | | | 0 | |
| | | | | | | | |
% change constant currency | | | 4 | | | | 11 | | | | 1 | | | | 2 | | | | 4 | | | | 2 | | | | 3 | | | | 4 | |
Profit after tax (IFRS) | | | 570 | | | | 813 | | | | 725 | | | | 1,526 | | | | 3,634 | | | | 530 | | | | 666 | | | | 993 | |
Profit after tax(non-IFRS) | | | 763 | | | | 979 | | | | 1,089 | | | | 1,826 | | | | 4,658 | | | | 887 | | | | 1,120 | | | | 1,214 | |
% change | | | 9 | | | | 2 | | | | –7 | | | | 9 | | | | 3 | | | | 16 | | | | 14 | | | | 11 | |
| | | | | | | | | |
| | | | | | | | | | | | | | | | | | | | | | | | | | | | | | | | |
Margins | | | | | | | | | | | | | | | | | | | | | | | | | | | | | | | | |
Cloud subscriptions and support gross margin (IFRS, in %) | | | 57.0 | | | | 56.6 | | | | 56.3 | | | | 54.8 | | | | 56.1 | | | | 57.7 | | | | 56.0 | | | | 54.8 | |
Cloud subscriptions and support gross margin(non-IFRS, in %) | | | 65.9 | | | | 64.8 | | | | 64.5 | | | | 62.7 | | | | 64.4 | | | | 64.6 | | | | 62.4 | | | | 60.8 | |
Software license and support gross margin (IFRS, in %) | | | 84.2 | | | | 86.1 | | | | 85.4 | | | | 87.1 | | | | 85.9 | | | | 83.3 | | | | 85.3 | | | | 86.2 | |
Software license and support gross margin(non-IFRS, in %) | | | 85.9 | | | | 87.4 | | | | 87.4 | | | | 88.4 | | | | 87.4 | | | | 85.1 | | | | 86.6 | | | | 87.3 | |
Cloud and software gross margin (IFRS, in %) | | | 79.4 | | | | 81.2 | | | | 80.4 | | | | 82.4 | | | | 81.0 | | | | 77.9 | | | | 79.6 | | | | 79.9 | |
Cloud and software gross margin(non-IFRS, in %) | | | 82.3 | | | | 83.6 | | | | 83.4 | | | | 84.7 | | | | 83.7 | | | | 80.8 | | | | 81.8 | | | | 82.0 | |
Gross margin (IFRS, in %) | | | 66.9 | | | | 70.4 | | | | 69.3 | | | | 73.0 | | | | 70.2 | | | | 66.7 | | | | 69.0 | | | | 70.1 | |
Gross margin(non-IFRS, in %) | | | 69.6 | | | | 72.6 | | | | 72.7 | | | | 75.5 | | | | 72.9 | | | | 69.9 | | | | 71.5 | | | | 72.5 | |
Operating margin (IFRS, in %) | | | 17.2 | | | | 24.2 | | | | 20.5 | | | | 29.0 | | | | 23.3 | | | | 12.7 | | | | 16.0 | | | | 23.5 | |
Operating margin(non-IFRS, in %) | | | 23.4 | | | | 28.9 | | | | 30.5 | | | | 35.3 | | | | 30.1 | | | | 22.7 | | | | 27.2 | | | | 29.3 | |
AT&S segment – Cloud subscriptions and support gross margin (in %) | | | 54 | | | | 52 | | | | 51 | | | | 49 | | | | 52 | | | | 52 | | | | 49 | | | | 47 | |
AT&S segment – Gross margin (in %) | | | 70 | | | | 73 | | | | 74 | | | | 77 | | | | 74 | | | | 70 | | | | 72 | | | | 73 | |
AT&S segment – Segment margin (in %) | | | 34 | | | | 39 | | | | 40 | | | | 45 | | | | 40 | | | | 32 | | | | 37 | | | | 39 | |
| | | | |
SAP Q3 2017 Quarterly Statement | | | 8 | |
| | | | | | | | | | | | | | | | | | | | | | | | | | | | | | | | |
| € millions, unless otherwise stated | | Q1 2016 | | | Q2 2016 | | | Q3 2016 | | | Q4 2016 | | | TY 2016 | | | Q1 2017 | | | Q2 2017 | | | Q3 2017 | |
SAP BN segment – Cloud subscriptions and support gross margin (in %) | | | 75 | | | | 76 | | | | 77 | | | | 75 | | | | 76 | | | | 77 | | | | 77 | | | | 76 | |
SAP BN segment – Gross margin (in %) | | | 67 | | | | 68 | | | | 68 | | | | 66 | | | | 67 | | | | 68 | | | | 68 | | | | 68 | |
SAP BN segment – Segment margin (in %) | | | 17 | | | | 18 | | | | 20 | | | | 16 | | | | 18 | | | | 16 | | | | 17 | | | | 17 | |
| | | | | | | | | | | | | | | | | | | | | | | | | | | | | | | | |
Key Profit Ratios | | | | | | | | | | | | | | | | | | | | | | | | | | | | | | | | |
Effective tax rate (IFRS, in %) | | | 23.3 | | | | 28.9 | | | | 28.4 | | | | 22.3 | | | | 25.3 | | | | 20.6 | | | | 26.6 | | | | 28.6 | |
Effective tax rate(non-IFRS, in %) | | | 26.2 | | | | 29.6 | | | | 29.7 | | | | 23.5 | | | | 26.8 | | | | 25.7 | | | | 27.8 | | | | 29.2 | |
| | | | | | | | | | | | | | | | | | | | | | | | | | | | | | | | | |
Earnings per share, basic (IFRS, in €) | | | 0.48 | | | | 0.68 | | | | 0.61 | | | | 1.27 | | | | 3.04 | | | | 0.43 | | | | 0.56 | | | | 0.82 | |
Earnings per share, basic(non-IFRS, in €) | | | 0.64 | | | | 0.82 | | | | 0.91 | | | | 1.53 | | | | 3.90 | | | | 0.73 | | | | 0.94 | | | | 1.01 | |
Order Entry | | | | | | | | | | | | | | | | | | | | | | | | | | | | | | | | |
New Cloud Bookings | | | 145 | | | | 255 | | | | 265 | | | | 483 | | | | 1,147 | | | | 215 | | | | 340 | | | | 302 | |
Deferred income (current)1) | | | 5,265 | | | | 4,470 | | | | 3,373 | | | | 2,383 | | | | 2,383 | | | | 6,215 | | | | 4,898 | | | | 3,531 | |
Orders – Number ofon-premise software deals (in transactions) | | | 12,884 | | | | 14,468 | | | | 13,048 | | | | 16,891 | | | | 57,291 | | | | 13,115 | | | | 14,361 | | | | 13,889 | |
Share of orders greater than € 5 million based on total software order entry volume (in %) | | | 17 | | | | 29 | | | | 26 | | | | 34 | | | | 29 | | | | 27 | | | | 31 | | | | 29 | |
Share of orders smaller than € 1 million based on total software order entry volume (in %) | | | 48 | | | | 38 | | | | 40 | | | | 35 | | | | 38 | | | | 46 | | | | 40 | | | | 41 | |
| | | | | | | | | | | | | | | | | | | | | | | | | | | | | | | | |
Liquidity and Cash Flow | | | | | | | | | | | | | | | | | | | | | | | | | | | | | | | | |
Net cash flows from operating activities | | | 2,482 | | | | 439 | | | | 707 | | | | 1,000 | | | | 4,628 | | | | 2,872 | | | | 642 | | | | 611 | |
Free cash flow | | | 2,313 | | | | 202 | | | | 446 | | | | 665 | | | | 3,627 | | | | 2,581 | | | | 322 | | | | 258 | |
| | | | | | | | |
% of total revenue (IFRS) | | | 49 | | | | 4 | | | | 8 | | | | 10 | | | | 16 | | | | 49 | | | | 6 | | | | 5 | |
| | | | | | | | |
% of profit after tax (IFRS) | | | 406 | | | | 25 | | | | 61 | | | | 44 | | | | 100 | | | | 487 | | | | 48 | | | | 26 | |
Group liquidity, gross | | | 5,853 | | | | 4,347 | | | | 4,388 | | | | 4,673 | | | | 4,673 | | | | 7,345 | | | | 4,927 | | | | 4,960 | |
Group debt | | | –9,080 | | | | –8,593 | | | | –8,134 | | | | –7,826 | | | | –7,826 | | | | –7,805 | | | | –6,716 | | | | –6,667 | |
Group liquidity, net | | | –3,227 | | | | –4,245 | | | | –3,746 | | | | –3,153 | | | | –3,153 | | | | –460 | | | | –1,789 | | | | –1,706 | |
Days’ sales outstanding (DSO, in days)2) | | | 72 | | | | 73 | | | | 74 | | | | 74 | | | | 74 | | | | 72 | | | | 72 | | | | 72 | |
| | | | | | | | | | | | | | | | | | | | | | | | | | | | | | | | |
Financial Position | | | | | | | | | | | | | | | | | | | | | | | | | | | | | | | | |
Cash and cash equivalents | | | 5,743 | | | | 4,206 | | | | 4,112 | | | | 3,702 | | | | 3,702 | | | | 5,937 | | | | 4,236 | | | | 4,220 | |
Goodwill | | | 21,922 | | | | 22,354 | | | | 22,279 | | | | 23,311 | | | | 23,311 | | | | 23,091 | | | | 21,949 | | | | 21,353 | |
Total assets | | | 42,884 | | | | 41,788 | | | | 41,604 | | | | 44,277 | | | | 44,277 | | | | 47,724 | | | | 42,900 | | | | 41,430 | |
Equity ratio (total equity in % of total assets) | | | 53 | | | | 55 | | | | 57 | | | | 60 | | | | 60 | | | | 56 | | | | 57 | | | | 59 | |
| | | | | | | | | | | | | | | | | | | | | | | | | | | | | | | | |
Non-Financials | | | | | | | | | | | | | | | | | | | | | | | | | | | | | | | | |
Number of employees (quarter end)3) | | | 78,230 | | | | 79,962 | | | | 82,426 | | | | 84,183 | | | | 84,183 | | | | 85,751 | | | | 87,114 | | | | 87,874 | |
Employee retention (in %, rolling 12 months) | | | 92.0 | | | | 92.6 | | | | 93.4 | | | | 93.7 | | | | 93.7 | | | | 94.1 | | | | 94.3 | | | | 94.2 | |
Women in management (in %, quarter end) | | | 23.6 | | | | 24.1 | | | | 24.3 | | | | 24.5 | | | | 24.5 | | | | 24.8 | | | | 25.0 | | | | 25.2 | |
Greenhouse gas emissions (in kilotons) | | | 120 | | | | 95 | | | | 85 | | | | 80 | | | | 380 | | | | 100 | | | | 55 | | | | 80 | |
1) SAP is in the final stage of migrating its processes and customer contracts to IFRS 15. At this point of the migration, there is no reliable way to report deferred cloud revenue any longer, therefore the separate disclosure of the cloud portion of deferred income is discontinued. SAP will continue to disclose new cloud bookings as the key metric to measure SAP’s sales success in the cloud.
2) Days’ sales outstanding measures the length of time it takes to collect receivables. SAP calculates DSO by dividing the average invoiced accounts receivables balance of the last 12 months by the average monthly sales of the last 12 months.
3) In full-time equivalents
Due to rounding, numbers may not add up precisely.
| | | | |
SAP Q3 2017 Quarterly Statement | | | 9 | |
Consolidated Income Statements of SAP Group (IFRS) – Quarter
| | | | | | | | | | | | |
€ millions, unless otherwise stated | | Q3 2017 | | | Q3 2016 | | | D in % | |
| | | |
Cloud subscriptions and support | | | 937 | | | | 769 | | | | 22 | |
| | | |
Software licenses | | | 1,033 | | | | 1,034 | | | | 0 | |
| | | |
Software support | | | 2,687 | | | | 2,653 | | | | 1 | |
| | | |
Software licenses and support | | | 3,720 | | | | 3,686 | | | | 1 | |
| | | |
Cloud and software | | | 4,657 | | | | 4,455 | | | | 5 | |
| | | |
Services | | | 932 | | | | 920 | | | | 1 | |
| | | |
Total revenue | | | 5,590 | | | | 5,375 | | | | 4 | |
| | | |
| | | | | | | | | | | | | |
| | | |
Cost of cloud subscriptions and support | | | –423 | | | | –336 | | | | 26 | |
| | | |
Cost of software licenses and support | | | –512 | | | | –537 | | | | –5 | |
| | | |
Cost of cloud and software | | | –935 | | | | –873 | | | | 7 | |
| | | |
Cost of services | | | –738 | | | | –776 | | | | –5 | |
| | | |
Total cost of revenue | | | –1,673 | | | | –1,649 | | | | 1 | |
| | | |
Gross profit | | | 3,917 | | | | 3,726 | | | | 5 | |
| | | |
Research and development | | | –781 | | | | –766 | | | | 2 | |
| | | |
Sales and marketing | | | –1,640 | | | | –1,587 | | | | 3 | |
| | | |
General and administration | | | –251 | | | | –268 | | | | –6 | |
| | | |
Restructuring | | | 67 | | | | 1 | | | | >100 | |
| | | |
Other operating income/expense, net | | | 1 | | | | –4 | | | | <-100 | |
| | | |
Total operating expenses | | | –4,276 | | | | –4,272 | | | | 0 | |
| | | |
Operating profit | | | 1,314 | | | | 1,103 | | | | 19 | |
| | | |
| | | | | | | | | | | | | |
| | | |
Othernon-operating income/expense, net | | | 4 | | | | –43 | | | | <-100 | |
| | | |
Finance income | | | 130 | | | | 32 | | | | >100 | |
| | | |
Finance costs | | | –58 | | | | –78 | | | | –26 | |
| | | |
Financial income, net | | | 73 | | | | –46 | | | | <-100 | |
| | | |
Profit before tax | | | 1,390 | | | | 1,013 | | | | 37 | |
| | | |
| | | | | | | | | | | | | |
| | | |
Income tax expense | | | –398 | | | | –288 | | | | 38 | |
| | | |
Profit after tax | | | 993 | | | | 725 | | | | 37 | |
| | | |
Attributable to owners of parent | | | 983 | | | | 730 | | | | 35 | |
| | | |
Attributable tonon-controlling interests | | | 9 | | | | –5 | | | | <-100 | |
| | | |
| | | | | | | | | | | | | |
| | | |
Earnings per share, basic (in €)1) | | | 0.82 | | | | 0.61 | | | | 35 | |
| | | |
Earnings per share, diluted (in €)1) | | | 0.82 | | | | 0.61 | | | | 35 | |
1) For the three months ended September 30, 2017 and 2016, the weighted average number of shares was 1,198 million (diluted 1,198 million) and 1,198 million (diluted: 1,199 million), respectively (treasury stock excluded).
Due to rounding, numbers may not add up precisely.
| | | | |
SAP Q3 2017 Quarterly Statement | | | 10 | |
Consolidated Income Statements of SAP Group (IFRS) –Year-to-Date
| | | | | | | | | | | | |
€ millions, unless otherwise stated | | Q1–Q3 2017 | | | Q1–Q3 2016 | | | D in % | |
| | | |
Cloud subscriptions and support | | | 2,775 | | | | 2,166 | | | | 28 | |
| | | |
Software licenses | | | 2,814 | | | | 2,682 | | | | 5 | |
| | | |
Software support | | | 8,154 | | | | 7,815 | | | | 4 | |
| | | |
Software licenses and support | | | 10,968 | | | | 10,497 | | | | 4 | |
| | | |
Cloud and software | | | 13,742 | | | | 12,663 | | | | 9 | |
| | | |
Services | | | 2,914 | | | | 2,675 | | | | 9 | |
| | | |
Total revenue | | | 16,656 | | | | 15,339 | | | | 9 | |
| | | |
| | | | | | | | | | | | | |
| | | |
Cost of cloud subscriptions and support | | | –1,216 | | | | –939 | | | | 29 | |
| | | |
Cost of software licenses and support | | | –1,646 | | | | –1,543 | | | | 7 | |
| | | |
Cost of cloud and software | | | –2,862 | | | | –2,483 | | | | 15 | |
| | | |
Cost of services | | | –2,366 | | | | –2,282 | | | | 4 | |
| | | |
Total cost of revenue | | | –5,228 | | | | –4,765 | | | | 10 | |
| | | |
Gross profit | | | 11,428 | | | | 10,574 | | | | 8 | |
| | | |
Research and development | | | –2,475 | | | | –2,184 | | | | 13 | |
| | | |
Sales and marketing | | | –5,055 | | | | –4,452 | | | | 14 | |
| | | |
General and administration | | | –820 | | | | –727 | | | | 13 | |
| | | |
Restructuring | | | –174 | | | | –20 | | | | >100 | |
| | | |
Other operating income/expense, net | | | 9 | | | | –5 | | | | <-100 | |
| | | |
Total operating expenses | | | –13,743 | | | | –12,154 | | | | 13 | |
| | | |
Operating profit | | | 2,913 | | | | 3,184 | | | | –9 | |
| | | |
| | | | | | | | | | | | | |
| | | |
Othernon-operating income/expense, net | | | –6 | | | | –180 | | | | –97 | |
| | | |
Finance income | | | 273 | | | | 105 | | | | >100 | |
| | | |
Finance costs | | | –213 | | | | –210 | | | | 2 | |
| | | |
Financial income, net | | | 59 | | | | –105 | | | | <-100 | |
| | | |
Profit before tax | | | 2,966 | | | | 2,900 | | | | 2 | |
| | | |
| | | | | | | | | | | | | |
| | | |
Income tax expense | | | –777 | | | | –792 | | | | –2 | |
| | | |
Profit after tax | | | 2,189 | | | | 2,108 | | | | 4 | |
| | | |
Attributable to owners of parent | | | 2,172 | | | | 2,118 | | | | 3 | |
| | | |
Attributable tonon-controlling interests | | | 17 | | | | –10 | | | | <-100 | |
| | | |
| | | | | | | | | | | | | |
| | | |
Earnings per share, basic (in €)1) | | | 1.81 | | | | 1.77 | | | | 3 | |
| | | |
Earnings per share, diluted (in €)1) | | | 1.81 | | | | 1.77 | | | | 3 | |
1) For the nine months ended September 30, 2017 and 2016, the weighted average number of shares was 1,198 million (diluted 1,199 million) and 1,198 million (diluted: 1,199 million), respectively (treasury stock excluded).
Due to rounding, numbers may not add up precisely.
| | | | |
SAP Q3 2017 Quarterly Statement | | | 11 | |
Consolidated Statements of Financial Position of SAP Group (IFRS)
| | | | | | | | |
as at September 30, 2017 and December 31, 2016 | |
€ millions | | 2017 | | | 2016 | |
Cash and cash equivalents | | | 4,220 | | | | 3,702 | |
Other financial assets | | | 1,013 | | | | 1,124 | |
Trade and other receivables | | | 4,869 | | | | 5,924 | |
Othernon-financial assets | | | 756 | | | | 581 | |
Tax assets | | | 361 | | | | 233 | |
Total current assets | | | 11,219 | | | | 11,564 | |
Goodwill | | | 21,353 | | | | 23,311 | |
Intangible assets | | | 3,038 | | | | 3,786 | |
Property, plant, and equipment | | | 2,806 | | | | 2,580 | |
Other financial assets | | | 1,233 | | | | 1,358 | |
Trade and other receivables | | | 124 | | | | 126 | |
Othernon-financial assets | | | 552 | | | | 532 | |
Tax assets | | | 434 | | | | 450 | |
Deferred tax assets | | | 672 | | | | 571 | |
Totalnon-current assets | | | 30,212 | | | | 32,713 | |
Total assets | | | 41,430 | | | | 44,277 | |
| | | | | | | |
€ millions | | 2017 | | | 2016 | |
Trade and other payables | | | 1,089 | | | | 1,281 | |
Tax liabilities | | | 256 | | | | 316 | |
Financial liabilities | | | 1,289 | | | | 1,813 | |
Othernon-financial liabilities | | | 3,077 | | | | 3,699 | |
Provisions | | | 266 | | | | 183 | |
Deferred income | | | 3,531 | | | | 2,383 | |
Total current liabilities | | | 9,507 | | | | 9,674 | |
Trade and other payables | | | 118 | | | | 127 | |
Tax liabilities | | | 442 | | | | 365 | |
Financial liabilities | | | 5,811 | | | | 6,481 | |
Othernon-financial liabilities | | | 465 | | | | 461 | |
Provisions | | | 211 | | | | 217 | |
Deferred tax liabilities | | | 422 | | | | 411 | |
Deferred income | | | 84 | | | | 143 | |
Totalnon-current liabilities | | | 7,553 | | | | 8,205 | |
Total liabilities | | | 17,060 | | | | 17,880 | |
Issued capital | | | 1,229 | | | | 1,229 | |
Share premium | | | 568 | | | | 599 | |
Retained earnings | | | 22,992 | | | | 22,302 | |
Other components of equity | | | 960 | | | | 3,346 | |
Treasury shares | | | –1,379 | | | | –1,099 | |
Equity attributable to owners of parent | | | 24,369 | | | | 26,376 | |
| | | | | | | | | |
Non-controlling interests | | | 1 | | | | 21 | |
Total equity | | | 24,370 | | | | 26,397 | |
Total equity and liabilities | | | 41,430 | | | | 44,277 | |
Due to rounding, numbers may not add up precisely.
| | | | |
SAP Q3 2017 Quarterly Statement | | | 12 | |
Consolidated Statements of Cash Flows of SAP Group (IFRS)
| | | | | | | | |
€ millions | | Q1–Q3 2017 | | | Q1–Q3 2016 | |
Profit after tax | | | 2,189 | | | | 2,108 | |
Adjustments to reconcile profit after tax to net cash flows from operating activities: | | | | | | | | |
Depreciation and amortization | | | 961 | | | | 932 | |
Income tax expense | | | 777 | | | | 792 | |
Financial income, net | | | –59 | | | | 105 | |
Decrease/increase in sales and bad debt allowances on trade receivables | | | –15 | | | | 61 | |
Other adjustments fornon-cash items | | | –35 | | | | 8 | |
Decrease/increase in trade and other receivables | | | 731 | | | | 290 | |
Decrease/increase in other assets | | | –338 | | | | –351 | |
Decrease/increase in trade payables, provisions, and other liabilities | | | –456 | | | | –583 | |
Decrease/increase in deferred income | | | 1,480 | | | | 1,402 | |
Interest paid | | | –145 | | | | –145 | |
Interest received | | | 53 | | | | 57 | |
Income tax paid, net of refunds | | | –1,016 | | | | –1,048 | |
Net cash flows from operating activities | | | 4,125 | | | | 3,628 | |
Business combinations, net of cash and cash equivalents acquired | | | –22 | | | | –54 | |
Purchase of intangible assets or property, plant, and equipment | | | –964 | | | | –666 | |
Proceeds from sales of intangible assets or property, plant, and equipment | | | 77 | | | | 48 | |
Purchase of equity or debt instruments of other entities | | | –2,098 | | | | –559 | |
Proceeds from sales of equity or debt instruments of other entities | | | 2,371 | | | | 457 | |
Net cash flows from investing activities | | | –636 | | | | –773 | |
Dividends paid | | | –1,499 | | | | –1,378 | |
Dividends paid onnon-controlling interests | | | –39 | | | | 0 | |
Purchase of treasury shares | | | –288 | | | | 0 | |
Proceeds from reissuance of treasury shares | | | 0 | | | | 24 | |
Proceeds from borrowings | | | 27 | | | | 401 | |
Repayments of borrowings | | | –1,007 | | | | –1,394 | |
Transactions withnon-controlling interests | | | 0 | | | | 3 | |
Net cash flows from financing activities | | | –2,806 | | | | –2,345 | |
Effect of foreign currency rates on cash and cash equivalents | | | –165 | | | | 192 | |
Net decrease/increase in cash and cash equivalents | | | 518 | | | | 702 | |
Cash and cash equivalents at the beginning of the period | | | 3,702 | | | | 3,411 | |
Cash and cash equivalents at the end of the period | | | 4,220 | | | | 4,112 | |
Due to rounding, numbers may not add up precisely.
| | | | |
SAP Q3 2017 Quarterly Statement | | | 13 | |
Segment Reporting – Quarter
Applications, Technology & Services1)
| | | | | | | | | | | | | | | | | | | | |
€ millions, unless otherwise stated | | | | | Q3 2017 | | | Q3 2016 | | | D in % | | | D in % | |
| | | Actual Currency | | | Constant Currency | | | Actual Currency | | | Actual Currency | | | Constant Currency | |
Cloud subscriptions and support – SaaS/PaaS2) | | | 408 | | | | 424 | | | | 307 | | | | 33 | | | | 38 | |
Cloud subscriptions and support – IaaS3) | | | 77 | | | | 80 | | | | 58 | | | | 34 | | | | 39 | |
Cloud subscriptions and support | | | 485 | | | | 504 | | | | 365 | | | | 33 | | | | 38 | |
Software licenses | | | 1,042 | | | | 1,076 | | | | 1,033 | | | | 1 | | | | 4 | |
Software support | | | 2,683 | | | | 2,767 | | | | 2,647 | | | | 1 | | | | 5 | |
Software licenses and support | | | 3,725 | | | | 3,842 | | | | 3,680 | | | | 1 | | | | 4 | |
Cloud and software | | | 4,210 | | | | 4,346 | | | | 4,045 | | | | 4 | | | | 7 | |
Services | | | 823 | | | | 850 | | | | 824 | | | | 0 | | | | 3 | |
Total segment revenue | | | 5,033 | | | | 5,196 | | | | 4,869 | | | | 3 | | | | 7 | |
Cost of cloud subscriptions and support – SaaS/PaaS2) | | | –178 | | | | –184 | | | | –120 | | | | 48 | | | | 53 | |
Cost of cloud subscriptions and support – IaaS3) | | | –79 | | | | –81 | | | | –57 | | | | 39 | | | | 42 | |
Cost of cloud subscriptions and support | | | –257 | | | | –265 | | | | –177 | | | | 45 | | | | 50 | |
Cost of software licenses and support | | | –466 | | | | –478 | | | | –466 | | | | 0 | | | | 3 | |
Cost of cloud and software | | | –723 | | | | –743 | | | | –643 | | | | 12 | | | | 16 | |
Cost of services | | | –632 | | | | –648 | | | | –636 | | | | –1 | | | | 2 | |
Total cost of revenue | | | –1,355 | | | | –1,391 | | | | –1,279 | | | | 6 | | | | 9 | |
Segment gross profit | | | 3,677 | | | | 3,805 | | | | 3,589 | | | | 2 | | | | 6 | |
Other segment expenses | | | –1,730 | | | | –1,779 | | | | –1,633 | | | | 6 | | | | 9 | |
Segment profit | | | 1,947 | | | | 2,026 | | | | 1,956 | | | | 0 | | | | 4 | |
Margins | | | | | | | | | | | | | | | | | | | | |
Cloud subscriptions and support gross margin – SaaS/PaaS2) (in %) | | | 56 | | | | 57 | | | | 61 | | | | –4pp | | | | –4pp | |
Cloud subscriptions and support gross margin – IaaS3) (in %) | | | –3 | | | | –1 | | | | 1 | | | | –4pp | | | | –2pp | |
Cloud subscriptions and support gross margin (in %) | | | 47 | | | | 47 | | | | 51 | | | | –4pp | | | | –4pp | |
Gross margin (in %) | | | 73 | | | | 73 | | | | 74 | | | | –1pp | | | | –0pp | |
Segment margin (in %) | | | 39 | | | | 39 | | | | 40 | | | | –1pp | | | | –1pp | |
1) The segment that focuses on our small andmedium-sized customers is no longer an operating segment, and its activities were included in the Applications, Technology & Services segment. We have retrospectively adjusted the revenue and results for the Applications, Technology & Services segment to reflect this change.
2) Software as a Service/Platform as a Service
3) Infrastructure as a Service
Due to rounding, numbers may not add up precisely.
| | | | |
SAP Q3 2017 Quarterly Statement | | | 14 | |
SAP Business Network
| | | | | | | | | | | | | | | | | | | | |
€ millions, unless otherwise stated | | | | | Q3 2017 | | | Q3 2016 | | | D in % | | | D in % | |
| | | Actual Currency | | | Constant Currency | | | Actual Currency | | | Actual Currency | | | Constant Currency | |
Cloud subscriptions and support – SaaS/PaaS1) | | | 453 | | | | 474 | | | | 404 | | | | 12 | | | | 17 | |
Cloud subscriptions and support – IaaS2) | | | 0 | | | | 0 | | | | 0 | | | | NA | | | | NA | |
Cloud subscriptions and support | | | 453 | | | | 474 | | | | 404 | | | | 12 | | | | 17 | |
Software licenses | | | 0 | | | | 0 | | | | 0 | | | | NA | | | | NA | |
Software support | | | 4 | | | | 4 | | | | 6 | | | | –25 | | | | –25 | |
Software licenses and support | | | 4 | | | | 4 | | | | 5 | | | | –21 | | | | –21 | |
Cloud and software | | | 457 | | | | 478 | | | | 410 | | | | 12 | | | | 17 | |
Services | | | 95 | | | | 100 | | | | 75 | | | | 26 | | | | 32 | |
Total segment revenue | | | 552 | | | | 578 | | | | 485 | | | | 14 | | | | 19 | |
Cost of cloud subscriptions and support – SaaS/PaaS1) | | | –109 | | | | –114 | | | | –94 | | | | 16 | | | | 21 | |
Cost of cloud subscriptions and support – IaaS2) | | | 0 | | | | 0 | | | | 0 | | | | NA | | | | NA | |
Cost of cloud subscriptions and support | | | –109 | | | | –114 | | | | –94 | | | | 16 | | | | 21 | |
Cost of software licenses and support | | | –1 | | | | –1 | | | | 0 | | | | >100 | | | | >100 | |
Cost of cloud and software | | | –111 | | | | –115 | | | | –94 | | | | 18 | | | | 23 | |
Cost of services | | | –66 | | | | –69 | | | | –61 | | | | 8 | | | | 13 | |
Total cost of revenue | | | –177 | | | | –185 | | | | –155 | | | | 14 | | | | 19 | |
Segment gross profit | | | 375 | | | | 393 | | | | 330 | | | | 14 | | | | 19 | |
Other segment expenses | | | –279 | | | | –290 | | | | –234 | | | | 19 | | | | 24 | |
Segment profit | | | 96 | | | | 103 | | | | 96 | | | | 0 | | | | 7 | |
Margins | | | | | | | | | | | | | | | | | | | | |
Cloud subscriptions and support gross margin – SaaS/PaaS1) (in %) | | | 76 | | | | 76 | | | | 77 | | | | –1pp | | | | –1pp | |
Cloud subscriptions and support gross margin – IaaS2) (in %) | | | NA | | | | NA | | | | NA | | | | NA | | | | NA | |
Cloud subscriptions and support gross margin (in %) | | | 76 | | | | 76 | | | | 77 | | | | –1pp | | | | –1pp | |
Gross margin (in %) | | | 68 | | | | 68 | | | | 68 | | | | –0pp | | | | 0pp | |
Segment margin (in %) | | | 17 | | | | 18 | | | | 20 | | | | –2pp | | | | –2pp | |
1) Software as a Service/Platform as a Service
2) Infrastructure as a Service
Due to rounding, numbers may not add up precisely.
| | | | |
SAP Q3 2017 Quarterly Statement | | | 15 | |
Reconciliation of Cloud Subscription Revenues and Margins
| | | | | | | | | | | | | | | | | | | | | | |
€ millions, unless otherwise stated | | | | | | | Q3 2017 | | | Q3 2016 | | | D in % | | | D in % | |
| | | | | Actual Currency | | | Constant Currency | | | Actual Currency | | | Actual Currency | | | Constant Currency | |
Cloud subscriptions and support revenue – SaaS/PaaS1) | | SAP Business Network segment | | | 453 | | | | 474 | | | | 404 | | | | 12 | | | | 17 | |
| | Other | | | 409 | | | | 424 | | | | 307 | | | | 33 | | | | 38 | |
| | Total | | | 861 | | | | 898 | | | | 711 | | | | 21 | | | | 26 | |
Cloud subscriptions and support revenue – IaaS2) | | | | | 77 | | | | 80 | | | | 58 | | | | 34 | | | | 39 | |
Cloud subscriptions and support revenue | | | | | 938 | | | | 978 | | | | 769 | | | | 22 | | | | 27 | |
Cloud subscriptions and support gross margin – SaaS/PaaS1) (in %) | | SAP Business Network segment | | | 76 | | | | 76 | | | | 77 | | | | –1pp | | | | –1pp | |
| | Other | | | 56 | | | | 57 | | | | 60 | | | | –4pp | | | | –4pp | |
| | Total | | | 66 | | | | 67 | | | | 70 | | | | –3pp | | | | –3pp | |
Cloud subscriptions and support gross margin –
IaaS2) (in %) | | | | | –3 | | | | –1 | | | | 1 | | | | –4pp | | | | –2pp | |
Cloud subscriptions and support gross margin (in %) | | | | | 61 | | | | 61 | | | | 65 | | | | –4pp | | | | –3pp | |
1) Software as a Service/Platform as a Service
2) Infrastructure as a Service
Due to rounding, numbers may not add up precisely.
| | | | |
SAP Q3 2017 Quarterly Statement | | | 16 | |
Segment Reporting –Year-to-Date
Applications, Technology & Services1)
| | | | | | | | | | | | | | | | | | | | |
€ millions, unless otherwise stated | | | | | Q1–Q3 2017 | | | Q1–Q3 2016 | | | D in % | | | D in % | |
| | | Actual Currency | | | Constant Currency | | | Actual Currency | | | Actual Currency | | | Constant Currency | |
Cloud subscriptions and support – SaaS/PaaS2) | | | 1,163 | | | | 1,162 | | | | 856 | | | | 36 | | | | 36 | |
Cloud subscriptions and support – IaaS3) | | | 234 | | | | 235 | | | | 146 | | | | 60 | | | | 60 | |
Cloud subscriptions and support | | | 1,397 | | | | 1,396 | | | | 1,002 | | | | 39 | | | | 39 | |
Software licenses | | | 2,813 | | | | 2,821 | | | | 2,685 | | | | 5 | | | | 5 | |
Software support | | | 8,139 | | | | 8,101 | | | | 7,796 | | | | 4 | | | | 4 | |
Software licenses and support | | | 10,953 | | | | 10,922 | | | | 10,481 | | | | 4 | | | | 4 | |
Cloud and software | | | 12,350 | | | | 12,318 | | | | 11,483 | | | | 8 | | | | 7 | |
Services | | | 2,569 | | | | 2,557 | | | | 2,455 | | | | 5 | | | | 4 | |
Total segment revenue | | | 14,919 | | | | 14,875 | | | | 13,938 | | | | 7 | | | | 7 | |
Cost of cloud subscriptions and support – SaaS/PaaS2) | | | –489 | | | | –487 | | | | –317 | | | | 54 | | | | 53 | |
Cost of cloud subscriptions and support – IaaS3) | | | –222 | | | | –221 | | | | –159 | | | | 39 | | | | 39 | |
Cost of cloud subscriptions and support | | | –710 | | | | –707 | | | | –476 | | | | 49 | | | | 48 | |
Cost of software licenses and support | | | –1,472 | | | | –1,465 | | | | –1,399 | | | | 5 | | | | 5 | |
Cost of cloud and software | | | –2,182 | | | | –2,173 | | | | –1,876 | | | | 16 | | | | 16 | |
Cost of services | | | –2,030 | | | | –2,021 | | | | –1,983 | | | | 2 | | | | 2 | |
Total cost of revenue | | | –4,212 | | | | –4,193 | | | | –3,859 | | | | 9 | | | | 9 | |
Segment gross profit | | | 10,707 | | | | 10,682 | | | | 10,079 | | | | 6 | | | | 6 | |
Other segment expenses | | | –5,348 | | | | –5,336 | | | | –4,802 | | | | 11 | | | | 11 | |
Segment profit | | | 5,359 | | | | 5,346 | | | | 5,277 | | | | 2 | | | | 1 | |
Margins | | | | | | | | | | | | | | | | | | | | |
Cloud subscriptions and support gross margin – SaaS/PaaS2) (in %) | | | 58 | | | | 58 | | | | 63 | | | | –5pp | | | | –5pp | |
Cloud subscriptions and support gross margin – IaaS3) (in %) | | | 5 | | | | 6 | | | | –9 | | | | 14pp | | | | 15pp | |
Cloud subscriptions and support gross margin (in %) | | | 49 | | | | 49 | | | | 52 | | | | –3pp | | | | –3pp | |
Gross margin (in %) | | | 72 | | | | 72 | | | | 72 | | | | –1pp | | | | –1pp | |
Segment margin (in %) | | | 36 | | | | 36 | | | | 38 | | | | –2pp | | | | –2pp | |
1) The segment that focuses on our small andmedium-sized customers is no longer an operating segment, and its activities were included in the Applications, Technology & Services segment. We have retrospectively adjusted the revenue and results for the Applications, Technology & Services segment to reflect this change.
2) Software as a Service/Platform as a Service
3) Infrastructure as a Service
Due to rounding, numbers may not add up precisely.
| | | | |
SAP Q3 2017 Quarterly Statement | | | 17 | |
SAP Business Network
| | | | | | | | | | | | | | | | | | | | |
€ millions, unless otherwise stated | | | | | Q1–Q3 2017 | | | Q1–Q3 2016 | | | D in % | | | D in % | |
| | | Actual Currency | | | Constant Currency | | | Actual Currency | | | Actual Currency | | | Constant Currency | |
Cloud subscriptions and support – SaaS/PaaS1) | | | 1,378 | | | | 1,373 | | | | 1,166 | | | | 18 | | | | 18 | |
Cloud subscriptions and support – IaaS2) | | | 0 | | | | 0 | | | | 0 | | | | NA | | | | NA | |
Cloud subscriptions and support | | | 1,378 | | | | 1,373 | | | | 1,166 | | | | 18 | | | | 18 | |
Software licenses | | | 0 | | | | 0 | | | | 0 | | | | NA | | | | NA | |
Software support | | | 15 | | | | 15 | | | | 20 | | | | –26 | | | | –25 | |
Software licenses and support | | | 15 | | | | 15 | | | | 20 | | | | –24 | | | | –24 | |
Cloud and software | | | 1,393 | | | | 1,388 | | | | 1,185 | | | | 17 | | | | 17 | |
Services | | | 297 | | | | 297 | | | | 218 | | | | 36 | | | | 36 | |
Total segment revenue | | | 1,690 | | | | 1,685 | | | | 1,404 | | | | 20 | | | | 20 | |
Cost of cloud subscriptions and support – SaaS/PaaS1) | | | –322 | | | | –322 | | | | –278 | | | | 16 | | | | 16 | |
Cost of cloud subscriptions and support – IaaS2) | | | 0 | | | | 0 | | | | 0 | | | | NA | | | | NA | |
Cost of cloud subscriptions and support | | | –322 | | | | –322 | | | | –278 | | | | 16 | | | | 16 | |
Cost of software licenses and support | | | –3 | | | | –3 | | | | 0 | | | | >100 | | | | >100 | |
Cost of cloud and software | | | –326 | | | | –325 | | | | –278 | | | | 17 | | | | 17 | |
Cost of services | | | –218 | | | | –218 | | | | –177 | | | | 23 | | | | 23 | |
Total cost of revenue | | | –544 | | | | –543 | | | | –455 | | | | 20 | | | | 19 | |
Segment gross profit | | | 1,146 | | | | 1,142 | | | | 949 | | | | 21 | | | | 20 | |
Other segment expenses | | | –861 | | | | –858 | | | | –692 | | | | 24 | | | | 24 | |
Segment profit | | | 286 | | | | 284 | | | | 256 | | | | 11 | | | | 11 | |
Margins | | | | | | | | | | | | | | | | | | | | |
Cloud subscriptions and support gross margin – SaaS/PaaS1) (in %) | | | 77 | | | | 77 | | | | 76 | | | | 0pp | | | | 0pp | |
Cloud subscriptions and support gross margin – IaaS2) (in %) | | | NA | | | | NA | | | | NA | | | | NA | | | | NA | |
Cloud subscriptions and support gross margin (in %) | | | 77 | | | | 77 | | | | 76 | | | | 0pp | | | | 0pp | |
Gross margin (in %) | | | 68 | | | | 68 | | | | 68 | | | | 0pp | | | | 0pp | |
Segment margin (in %) | | | 17 | | | | 17 | | | | 18 | | | | –1pp | | | | –1pp | |
1) Software as a Service/Platform as a Service
2) Infrastructure as a Service
Due to rounding, numbers may not add up precisely.
| | | | |
SAP Q3 2017 Quarterly Statement | | | 18 | |
Reconciliation of Cloud Subscription Revenues and Margins
| | | | | | | | | | | | | | | | | | | | | | |
€ millions, unless otherwise stated | | | | | | | Q1–Q3 2017 | | | Q1–Q3 2016 | | | D in % | | | D in % | |
| | | | | Actual Currency | | | Constant Currency | | | Actual Currency | | | Actual Currency | | | Constant Currency | |
Cloud subscriptions and support revenue – SaaS/PaaS1) | | SAP Business Network segment | | | 1,378 | | | | 1,373 | | | | 1,166 | | | | 18 | | | | 18 | |
| | Other | | | 1,163 | | | | 1,162 | | | | 856 | | | | 36 | | | | 36 | |
| | Total | | | 2,541 | | | | 2,534 | | | | 2,021 | | | | 26 | | | | 25 | |
Cloud subscriptions and support revenue – IaaS2) | | | | | 234 | | | | 235 | | | | 146 | | | | 60 | | | | 60 | |
Cloud subscriptions and support revenue | | | | | 2,775 | | | | 2,769 | | | | 2,168 | | | | 28 | | | | 28 | |
Cloud subscriptions and support gross margin – SaaS/PaaS1) (in %) | | SAP Business Network segment | | | 77 | | | | 77 | | | | 76 | | | | 0pp | | | | 0pp | |
| | Other | | | 57 | | | | 58 | | | | 63 | | | | –5pp | | | | –4pp | |
| | Total | | | 68 | | | | 68 | | | | 70 | | | | –3pp | | | | –2pp | |
Cloud subscriptions and support gross margin –
IaaS2) (in %) | | | | | 5 | | | | 6 | | | | –9 | | | | 14pp | | | | 15pp | |
Cloud subscriptions and support gross margin (in %) | | | | | 63 | | | | 63 | | | | 65 | | | | –2pp | | | | –2pp | |
1) Software as a Service/Platform as a Service
2) Infrastructure as a Service
Due to rounding, numbers may not add up precisely.
| | | | |
SAP Q3 2017 Quarterly Statement | | | 19 | |
Reconciliation fromNon-IFRS Numbers to IFRS Numbers – Quarter
| | | | | | | | | | | | | | | | | | | | | | | | | | | | | | | | | | | | | | | | | | | | |
| € millions, unless otherwise stated | | | | | | | | | | | | | | Q3 2017 | | | | | | | | | Q3 2016 | | | | | | | | | D in % | |
| | | IFRS | | | Adj.1) | | | Non-IFRS1) | | | Currency Impact2) | | | Non-IFRS
Constant
Currency2) | | | IFRS | | | Adj.1) | | | Non-IFRS1) | | | IFRS | | | Non-IFRS1) | | | Non-IFRS
Constant
Currency2) | |
Revenue Numbers | | | | | | | | | | | | | | | | | | | | | | | | | | | | | | | | | | | | | | | | | | | | |
Cloud subscriptions and support | | | 937 | | | | 0 | | | | 938 | | | | 41 | | | | 978 | | | | 769 | | | | 0 | | | | 769 | | | | 22 | | | | 22 | | | | 27 | |
Software licenses | | | 1,033 | | | | 0 | | | | 1,033 | | | | 33 | | | | 1,067 | | | | 1,034 | | | | 0 | | | | 1,034 | | | | 0 | | | | 0 | | | | 3 | |
Software support | | | 2,687 | | | | 0 | | | | 2,687 | | | | 84 | | | | 2,771 | | | | 2,653 | | | | 0 | | | | 2,653 | | | | 1 | | | | 1 | | | | 4 | |
Software licenses and support | | | 3,720 | | | | 0 | | | | 3,720 | | | | 117 | | | | 3,837 | | | | 3,686 | | | | 0 | | | | 3,687 | | | | 1 | | | | 1 | | | | 4 | |
Cloud and software | | | 4,657 | | | | 0 | | | | 4,658 | | | | 158 | | | | 4,815 | | | | 4,455 | | | | 1 | | | | 4,456 | | | | 5 | | | | 5 | | | | 8 | |
Services | | | 932 | | | | 0 | | | | 932 | | | | 32 | | | | 965 | | | | 920 | | | | 0 | | | | 920 | | | | 1 | | | | 1 | | | | 5 | |
Total revenue | | | 5,590 | | | | 0 | | | | 5,590 | | | | 190 | | | | 5,780 | | | | 5,375 | | | | 1 | | | | 5,375 | | | | 4 | | | | 4 | | | | 8 | |
| | | | | | | | | | | | | | | | | | | | | | | | | | | | | | | | | | | | | | | | | | | | |
Operating Expense Numbers | | | | | | | | | | | | | | | | | | | | | | | | | | | | | | | | | | | | | | | | | | | | |
Cost of cloud subscriptions and support | | | –423 | | | | 56 | | | | –368 | | | | | | | | | | | | –336 | | | | 63 | | | | –273 | | | | 26 | | | | 35 | | | | | |
Cost of software licenses and support | | | –512 | | | | 41 | | | | –471 | | | | | | | | | | | | –537 | | | | 71 | | | | –465 | | | | –5 | | | | 1 | | | | | |
Cost of cloud and software | | | –935 | | | | 97 | | | | –839 | | | | | | | | | | | | –873 | | | | 135 | | | | –738 | | | | 7 | | | | 14 | | | | | |
Cost of services | | | –738 | | | | 41 | | | | –697 | | | | | | | | | | | | –776 | | | | 45 | | | | –732 | | | | –5 | | | | –5 | | | | | |
Total cost of revenue | | | –1,673 | | | | 137 | | | | –1,536 | | | | | | | | | | | | –1,649 | | | | 179 | | | | –1,469 | | | | 1 | | | | 4 | | | | | |
Gross profit | | | 3,917 | | | | 138 | | | | 4,055 | | | | | | | | | | | | 3,726 | | | | 180 | | | | 3,906 | | | | 5 | | | | 4 | | | | | |
Research and development | | | –781 | | | | 64 | | | | –717 | | | | | | | | | | | | –766 | | | | 86 | | | | –679 | | | | 2 | | | | 6 | | | | | |
Sales and marketing | | | –1,640 | | | | 162 | | | | –1,478 | | | | | | | | | | | | –1,587 | | | | 214 | | | | –1,373 | | | | 3 | | | | 8 | | | | | |
General and administration | | | –251 | | | | 28 | | | | –223 | | | | | | | | | | | | –268 | | | | 56 | | | | –211 | | | | –6 | | | | 6 | | | | | |
Restructuring | | | 67 | | | | –67 | | | | 0 | | | | | | | | | | | | 1 | | | | –1 | | | | 0 | | | | >100 | | | | NA | | | | | |
Other operating income/expense, net | | | 1 | | | | 0 | | | | 1 | | | | | | | | | | | | –4 | | | | 0 | | | | –4 | | | | <-100 | | | | <-100 | | | | | |
Total operating expenses | | | –4,276 | | | | 323 | | | | –3,953 | | | | –118 | | | | –4,071 | | | | –4,272 | | | | 534 | | | | –3,738 | | | | 0 | | | | 6 | | | | 9 | |
| | | | | | | | | | | | | | | | | | | | | | | | | | | | | | | | | | | | | | | | | | | | |
Profit Numbers | | | | | | | | | | | | | | | | | | | | | | | | | | | | | | | | | | | | | | | | | | | | |
Operating profit | | | 1,314 | | | | 323 | | | | 1,637 | | | | 72 | | | | 1,709 | | | | 1,103 | | | | 535 | | | | 1,638 | | | | 19 | | | | 0 | | | | 4 | |
Othernon-operating income/expense, net | | | 4 | | | | 0 | | | | 4 | | | | | | | | | | | | –43 | | | | 0 | | | | –43 | | | | <-100 | | | | <-100 | | | | | |
Finance income | | | 130 | | | | 0 | | | | 130 | | | | | | | | | | | | 32 | | | | 0 | | | | 32 | | | | >100 | | | | >100 | | | | | |
Finance costs | | | –58 | | | | 0 | | | | –58 | | | | | | | | | | | | –78 | | | | 0 | | | | –78 | | | | –26 | | | | –26 | | | | | |
Financial income, net | | | 73 | | | | 0 | | | | 73 | | | | | | | | | | | | –46 | | | | 0 | | | | –46 | | | | <-100 | | | | <-100 | | | | | |
Profit before tax | | | 1,390 | | | | 323 | | | | 1,714 | | | | | | | | | | | | 1,013 | | | | 535 | | | | 1,548 | | | | 37 | | | | 11 | | | | | |
Income tax expense | | | –398 | | | | –102 | | | | –500 | | | | | | | | | | | | –288 | | | | –171 | | | | –459 | | | | 38 | | | | 9 | | | | | |
Profit after tax | | | 993 | | | | 221 | | | | 1,214 | | | | | | | | | | | | 725 | | | | 364 | | | | 1,089 | | | | 37 | | | | 11 | | | | | |
Attributable to owners of parent | | | 983 | | | | 221 | | | | 1,204 | | | | | | | | | | | | 730 | | | | 364 | | | | 1,094 | | | | 35 | | | | 10 | | | | | |
Attributable tonon-controlling interests | | | 9 | | | | 0 | | | | 9 | | | | | | | | | | | | –5 | | | | 0 | | | | –5 | | | | <-100 | | | | <-100 | | | | | |
| | | | | | | | | | | | | | | | | | | | | | | | | | | | | | | | | | | | | | | | | | | | |
Key Ratios | | | | | | | | | | | | | | | | | | | | | | | | | | | | | | | | | | | | | | | | | | | | |
Operating margin (in %) | | | 23.5 | | | | | | | | 29.3 | | | | | | | | 29.6 | | | | 20.5 | | | | | | | | 30.5 | | | | 3.0pp | | | | –1.2pp | | | | –0.9pp | |
Effective tax rate (in %)3) | | | 28.6 | | | | | | | | 29.2 | | | | | | | | | | | | 28.4 | | | | | | | | 29.7 | | | | 0.2pp | | | | –0.5pp | | | | | |
Earnings per share, basic (in €) | | | 0.82 | | | | | | | | 1.01 | | | | | | | | | | | | 0.61 | | | | | | | | 0.91 | | | | 35 | | | | 10 | | | | | |
1) Adjustments in the revenue line items are for software support revenue, cloud subscriptions and support revenue, and other similarly recurring revenues that entities acquired by SAP would have recognized had they remained stand-alone entities but that SAP is not permitted to recognize as revenue under IFRS as a result of business combination accounting rules. Adjustments in the operating expense line items are for acquisition-related charges, share-based payment expenses, as well as restructuring expenses.
| | | | |
SAP Q3 2017 Quarterly Statement | | | 20 | |
2) Constant currency revenue and operating income figures are calculated by translating revenue and operating income of the current period using the average exchange rates from the previous year’s respective period instead of the current period. Constant currency period-over-period changes are calculated by comparing the current year’snon-IFRS constant currency numbers with thenon-IFRS number of the previous year’s respective period.
For a more detailed description of these adjustments and their limitations as well as our constant currency figures, see our Web sitewww.sap.com/corporate-en/investors/newsandreports/reporting-framework.epx under“Non-IFRS Measures, Adjustments and Full-Year Estimates”.
3) The difference between our effective tax rate (IFRS) and effective tax rate(non-IFRS) in Q3 2017 mainly results from tax effects of acquisition-related charges. The difference between our effective tax rate (IFRS) and effective tax rate(non-IFRS) in Q3 2016 mainly results from tax effects of acquisition-related charges and share-based payment expenses.
Due to rounding, numbers may not add up precisely.
| | | | |
SAP Q3 2017 Quarterly Statement | | | 21 | |
Reconciliation fromNon-IFRS Numbers to IFRS Numbers –Year-to-Date
| | | | | | | | | | | | | | | | | | | | | | | | | | | | | | | | | | | | | | | | | | | | |
| € millions, unless otherwise stated | | | | | | | | | | | | | | Q1–Q3 2017 | | | | | | | | | Q1–Q3 2016 | | | | | | | | | D in % | |
| | | IFRS | | | Adj.1) | | | Non-IFRS1) | | | Currency Impact2) | | | Non-IFRS
Constant
Currency2) | | | IFRS | | | Adj.1) | | | Non-IFRS1) | | | IFRS | | | Non-IFRS1) | | | Non-IFRS
Constant
Currency2) | |
Revenue Numbers | | | | | | | | | | | | | | | | | | | | | | | | | | | | | | | | | | | | | | | | | | | | |
Cloud subscriptions and support | | | 2,775 | | | | 0 | | | | 2,775 | | | | –6 | | | | 2,769 | | | | 2,166 | | | | 2 | | | | 2,168 | | | | 28 | | | | 28 | | | | 28 | |
Software licenses | | | 2,814 | | | | 0 | | | | 2,814 | | | | 8 | | | | 2,822 | | | | 2,682 | | | | 2 | | | | 2,685 | | | | 5 | | | | 5 | | | | 5 | |
Software support | | | 8,154 | | | | 0 | | | | 8,154 | | | | –39 | | | | 8,116 | | | | 7,815 | | | | 0 | | | | 7,815 | | | | 4 | | | | 4 | | | | 4 | |
Software licenses and support | | | 10,968 | | | | 0 | | | | 10,968 | | | | –31 | | | | 10,937 | | | | 10,497 | | | | 3 | | | | 10,500 | | | | 4 | | | | 4 | | | | 4 | |
Cloud and software | | | 13,742 | | | | 1 | | | | 13,743 | | | | –37 | | | | 13,706 | | | | 12,663 | | | | 4 | | | | 12,668 | | | | 9 | | | | 8 | | | | 8 | |
Services | | | 2,914 | | | | 0 | | | | 2,914 | | | | –12 | | | | 2,902 | | | | 2,675 | | | | 0 | | | | 2,675 | | | | 9 | | | | 9 | | | | 8 | |
Total revenue | | | 16,656 | | | | 1 | | | | 16,657 | | | | –49 | | | | 16,608 | | | | 15,339 | | | | 4 | | | | 15,343 | | | | 9 | | | | 9 | | | | 8 | |
| | | | | | | | | | | | | | | | | | | | | | | | | | | | | | | | | | | | | | | | | | | | |
Operating Expense Numbers | | | | | | | | | | | | | | | | | | | | | | | | | | | | | | | | | | | | | | | | | | | | |
Cost of cloud subscriptions and support | | | –1,216 | | | | 178 | | | | –1,039 | | | | | | | | | | | | –939 | | | | 182 | | | | –758 | | | | 29 | | | | 37 | | | | | |
Cost of software licenses and support | | | –1,646 | | | | 151 | | | | –1,495 | | | | | | | | | | | | –1,543 | | | | 170 | | | | –1,373 | | | | 7 | | | | 9 | | | | | |
Cost of cloud and software | | | –2,862 | | | | 329 | | | | –2,533 | | | | | | | | | | | | –2,483 | | | | 352 | | | | –2,131 | | | | 15 | | | | 19 | | | | | |
Cost of services | | | –2,366 | | | | 126 | | | | –2,240 | | | | | | | | | | | | –2,282 | | | | 74 | | | | –2,208 | | | | 4 | | | | 1 | | | | | |
Total cost of revenue | | | –5,228 | | | | 455 | | | | –4,773 | | | | | | | | | | | | –4,765 | | | | 426 | | | | –4,339 | | | | 10 | | | | 10 | | | | | |
Gross profit | | | 11,428 | | | | 455 | | | | 11,884 | | | | | | | | | | | | 10,574 | | | | 430 | | | | 11,004 | | | | 8 | | | | 8 | | | | | |
Research and development | | | –2,475 | | | | 216 | | | | –2,258 | | | | | | | | | | | | –2,184 | | | | 135 | | | | –2,049 | | | | 13 | | | | 10 | | | | | |
Sales and marketing | | | –5,055 | | | | 536 | | | | –4,519 | | | | | | | | | | | | –4,452 | | | | 404 | | | | –4,048 | | | | 14 | | | | 12 | | | | | |
General and administration | | | –820 | | | | 109 | | | | –710 | | | | | | | | | | | | –727 | | | | 83 | | | | –644 | | | | 13 | | | | 10 | | | | | |
Restructuring | | | –174 | | | | 174 | | | | 0 | | | | | | | | | | | | –20 | | | | 20 | | | | 0 | | | | >100 | | | | NA | | | | | |
Other operating income/expense, net | | | 9 | | | | 0 | | | | 9 | | | | | | | | | | | | –5 | | | | 0 | | | | –5 | | | | <-100 | | | | <-100 | | | | | |
Total operating expenses | | | –13,743 | | | | 1,491 | | | | –12,252 | | | | 46 | | | | –12,206 | | | | –12,154 | | | | 1,069 | | | | –11,085 | | | | 13 | | | | 11 | | | | 10 | |
| | | | | | | | | | | | | | | | | | | | | | | | | | | | | | | | | | | | | | | | | | | | |
Profit Numbers | | | | | | | | | | | | | | | | | | | | | | | | | | | | | | | | | | | | | | | | | | | | |
Operating profit | | | 2,913 | | | | 1,492 | | | | 4,405 | | | | –3 | | | | 4,402 | | | | 3,184 | | | | 1,073 | | | | 4,258 | | | | –9 | | | | 3 | | | | 3 | |
Othernon-operating income/expense, net | | | –6 | | | | 0 | | | | –6 | | | | | | | | | | | | –180 | | | | 0 | | | | –180 | | | | –97 | | | | –97 | | | | | |
Finance income | | | 273 | | | | 0 | | | | 273 | | | | | | | | | | | | 105 | | | | 0 | | | | 105 | | | | >100 | | | | >100 | | | | | |
Finance costs | | | –213 | | | | 0 | | | | –213 | | | | | | | | | | | | –210 | | | | 0 | | | | –210 | | | | 2 | | | | 2 | | | | | |
Financial income, net | | | 59 | | | | 0 | | | | 59 | | | | | | | | | | | | –105 | | | | 0 | | | | –105 | | | | <-100 | | | | <-100 | | | | | |
Profit before tax | | | 2,966 | | | | 1,492 | | | | 4,458 | | | | | | | | | | | | 2,900 | | | | 1,073 | | | | 3,973 | | | | 2 | | | | 12 | | | | | |
Income tax expense | | | –777 | | | | –461 | | | | –1,238 | | | | | | | | | | | | –792 | | | | –350 | | | | –1,142 | | | | –2 | | | | 8 | | | | | |
Profit after tax | | | 2,189 | | | | 1,031 | | | | 3,220 | | | | | | | | | | | | 2,108 | | | | 724 | | | | 2,832 | | | | 4 | | | | 14 | | | | | |
Attributable to owners of parent | | | 2,172 | | | | 1,031 | | | | 3,203 | | | | | | | | | | | | 2,118 | | | | 724 | | | | 2,842 | | | | 3 | | | | 13 | | | | | |
Attributable tonon-controlling interests | | | 17 | | | | 0 | | | | 17 | | | | | | | | | | | | –10 | | | | 0 | | | | –10 | | | | <-100 | | | | <-100 | | | | | |
| | | | | | | | | | | | | | | | | | | | | | | | | | | | | | | | | | | | | | | | | | | | |
Key Ratios | | | | | | | | | | | | | | | | | | | | | | | | | | | | | | | | | | | | | | | | | | | | |
Operating margin (in %) | | | 17.5 | | | | | | | | 26.4 | | | | | | | | 26.5 | | | | 20.8 | | | | | | | | 27.8 | | | | –3.3pp | | | | –1.3pp | | | | –1.2pp | |
Effective tax rate (in %)3) | | | 26.2 | | | | | | | | 27.8 | | | | | | | | | | | | 27.3 | | | | | | | | 28.7 | | | | –1.1pp | | | | –1.0pp | | | | | |
Earnings per share, basic (in €) | | | 1.81 | | | | | | | | 2.67 | | | | | | | | | | | | 1.77 | | | | | | | | 2.37 | | | | 3 | | | | 13 | | | | | |
| | | | |
SAP Q3 2017 Quarterly Statement | | | 22 | |
1) Adjustments in the revenue line items are for software support revenue, cloud subscriptions and support revenue, and other similarly recurring revenues that entities acquired by SAP would have recognized had they remained stand-alone entities but that SAP is not permitted to recognize as revenue under IFRS as a result of business combination accounting rules. Adjustments in the operating expense line items are for acquisition-related charges, share-based payment expenses, as well as restructuring expenses.
2) Constant currency revenue and operating income figures are calculated by translating revenue and operating income of the current period using the average exchange rates from the previous year’s respective period instead of the current period. Constant currency period-over-period changes are calculated by comparing the current year’snon-IFRS constant currency numbers with thenon-IFRS number of the previous year’s respective period.
For a more detailed description of these adjustments and their limitations as well as our constant currency figures, see our Web sitewww.sap.com/corporate-en/investors/newsandreports/reporting-framework.epx under“Non-IFRS Measures, Adjustments and Full-Year Estimates”.
3) The difference between our effective tax rate (IFRS) and effective tax rate(non-IFRS) in the first nine months of 2017 and 2016 mainly results from tax effects of acquisition-related charges and share-based payment expenses.
Due to rounding, numbers may not add up precisely.
| | | | |
SAP Q3 2017 Quarterly Statement | | | 23 | |
Non-IFRS Adjustments – Actuals and Estimates
| | | | | | | | | | | | | | | | | | | | |
€ millions | | Estimated Amounts for Full Year 2017 | | | Q3 2017 | | | Q1–Q3
2017 | | | Q3 2016 | | | Q1–Q3
2016 | |
Operating profit (IFRS) | | | | | | | 1,314 | | | | 2,913 | | | | 1,103 | | | | 3,184 | |
Revenue adjustments | | | <20 | | | | 0 | | | | 1 | | | | 1 | | | | 4 | |
Adjustment for acquisition-related charges | | | 580 to 610 | | | | 140 | | | | 449 | | | | 168 | | | | 504 | |
Adjustment for share-based payment expenses | | | 1,000 to 1,150 | | | | 250 | | | | 868 | | | | 368 | | | | 545 | |
Adjustment for restructuring1) | | | 150 to 200 | | | | –67 | | | | 174 | | | | –1 | | | | 20 | |
Operating expense adjustments | | | | | | | 323 | | | | 1,491 | | | | 534 | | | | 1,069 | |
Operating profit adjustments | | | | | | | 323 | | | | 1,492 | | | | 535 | | | | 1,073 | |
Operating profit(non-IFRS) | | | | | | | 1,637 | | | | 4,405 | | | | 1,638 | | | | 4,258 | |
1) reflects our expectations for restructuring activities in our services and support business
| | | | |
SAP Q3 2017 Quarterly Statement | | | 24 | |
Non-IFRS Adjustments by Functional Areas
| | | | | | | | | | | | | | | | | | | | | | | | | | | | | | | | | | | | | | | | | | | | | | | | | | | | | | | | | | | | | | |
€ millions | | Q3 2017 | | | | | | | | | Q3 2016 |
| | IFRS | | | | | | Acquisition-
Related | | | | | | SBP1) | | | Restruc-
turing | | | Non-IFRS | | | | | | IFRS | | | | | | Acquisition-
Related | | | | | | SBP1) | | | | | | Restruc-
turing | | | Non-IFRS |
Cost of cloud and software | | | –935 | | | | | | | | 72 | | | | | | | | 24 | | | | 0 | | | | –839 | | | | | | | | –873 | | | | | | | | 98 | | | | | | | | 37 | | | | | | | | 0 | | | –738 |
Cost of services | | | –738 | | | | | | | | 2 | | | | | | | | 39 | | | | 0 | | | | –697 | | | | | | | | –776 | | | | | | | | 3 | | | | | | | | 42 | | | | | | | | 0 | | | –732 |
Research and development | | | –781 | | | | | | | | 3 | | | | | | | | 61 | | | | 0 | | | | –717 | | | | | | | | –766 | | | | | | | | 3 | | | | | | | | 84 | | | | | | | | 0 | | | –679 |
Sales and marketing | | | –1,640 | | | | | | | | 62 | | | | | | | | 100 | | | | 0 | | | | –1,478 | | | | | | | | –1,587 | | | | | | | | 67 | | | | | | | | 147 | | | | | | | | 0 | | | –1,373 |
General and administration | | | –251 | | | | | | | | 1 | | | | | | | | 26 | | | | 0 | | | | –223 | | | | | | | | –268 | | | | | | | | –3 | | | | | | | | 59 | | | | | | | | 0 | | | –211 |
Restructuring | | | 67 | | | | | | | | 0 | | | | | | | | 0 | | | | –67 | | | | 0 | | | | | | | | 1 | | | | | | | | 0 | | | | | | | | 0 | | | | | | | | –1 | | | 0 |
Other operating income/expense, net | | | 1 | | | | | | | | 0 | | | | | | | | 0 | | | | 0 | | | | 1 | | | | | | | | –4 | | | | | | | | 0 | | | | | | | | 0 | | | | | | | | 0 | | | –4 |
Total operating expenses | | | –4,276 | | | | | | | | 140 | | | | | | | | 250 | | | | –67 | | | | –3,953 | | | | | | | | –4,272 | | | | | | | | 168 | | | | | | | | 368 | | | | | | | | –1 | | | –3,738 |
1) Share-based Payments |
| | | | | | | | | | | | | | | | | | | | | | | | | | | | | | | | | | | | | | | | | | | | | | | | | | | | | | | | | | | | | | |
€ millions | | Q1–Q3 2017 | | | | | | | | | Q1–Q3 2016 |
| | IFRS | | | | | | Acquisition- Related | | | | | | SBP1) | | | Restruc-
turing | | | Non-IFRS | | | | | | IFRS | | | | | | Acquisition- Related | | | | | | SBP1) | | | | | | Restruc-
turing | | | Non-IFRS |
Cost of cloud and software | | | –2,862 | | | | | | | | 236 | | | | | | | | 92 | | | | 0 | | | | –2,533 | | | | | | | | –2,483 | | | | | | | | 293 | | | | | | | | 58 | | | | | | | | 0 | | | –2,131 |
Cost of services | | | –2,366 | | | | | | | | 6 | | | | | | | | 120 | | | | 0 | | | | –2,240 | | | | | | | | –2,282 | | | | | | | | 9 | | | | | | | | 65 | | | | | | | | 0 | | | –2,208 |
Research and development | | | –2,475 | | | | | | | | 8 | | | | | | | | 208 | | | | 0 | | | | –2,258 | | | | | | | | –2,184 | | | | | | | | 7 | | | | | | | | 128 | | | | | | | | 0 | | | –2,049 |
Sales and marketing | | | –5,055 | | | | | | | | 196 | | | | | | | | 340 | | | | 0 | | | | –4,519 | | | | | | | | –4,452 | | | | | | | | 190 | | | | | | | | 214 | | | | | | | | 0 | | | –4,048 |
General and administration | | | –820 | | | | | | | | 2 | | | | | | | | 107 | | | | 0 | | | | –710 | | | | | | | | –727 | | | | | | | | 4 | | | | | | | | 79 | | | | | | | | 0 | | | –644 |
Restructuring | | | –174 | | | | | | | | 0 | | | | | | | | 0 | | | | 174 | | | | 0 | | | | | | | | –20 | | | | | | | | 0 | | | | | | | | 0 | | | | | | | | 20 | | | 0 |
Other operating income/expense, net | | | 9 | | | | | | | | 0 | | | | | | | | 0 | | | | 0 | | | | 9 | | | | | | | | –5 | | | | | | | | 0 | | | | | | | | 0 | | | | | | | | 0 | | | –5 |
Total operating expenses | | | –13,743 | | | | | | | | 449 | | | | | | | | 868 | | | | 174 | | | | –12,252 | | | | | | | | –12,154 | | | | | | | | 504 | | | | | | | | 545 | | | | | | | | 20 | | | –11,085 |
1) Share-based payments |
If not presented in a separate line item in our income statement, the restructuring expenses would break down as follows:
| | | | | | | | | | | | | | | | |
€ millions | | Q3 2017 | | | Q1–Q3
2017 | | | Q3 2016 | | | Q1–Q3
2016 | |
Cost of cloud and software | | | –50 | | | | 55 | | | | 0 | | | | 2 | |
Cost of services | | | –3 | | | | 107 | | | | 0 | | | | 5 | |
Research and development | | | –7 | | | | 10 | | | | 1 | | | | 4 | |
Sales and marketing | | | –7 | | | | 2 | | | | –2 | | | | 8 | |
General and administration | | | 0 | | | | 0 | | | | 0 | | | | 1 | |
Restructuring expenses | | | –67 | | | | 174 | | | | –1 | | | | 20 | |
| | | | |
SAP Q3 2017 Quarterly Statement | | | 25 | |
Revenue by Region (IFRS andNon-IFRS) – Quarter
| | | | | | | | | | | | | | | | | | | | | | | | | | | | | | | | | | | | | | | | | | | | | | | | | | | | | | | | | | | | |
€ millions | | | | Q3 2017 | | | | | Q3 2016 | | | | | D in % | |
| | | | | IFRS | | | | | Adj.1) | | | Non-IFRS1) | | | | | Currency Impact2) | | | | | Non-IFRS Constant Currency2) | | | | | IFRS | | | | | Adj.1) | | | Non-IFRS1) | | | | | IFRS | | | Non-IFRS1) | | | | | Non-IFRS Constant Currency2) | |
Cloud subscriptions and support revenue by region | | | | | | | | | | | | | | | | | | | | | | | | | | | |
EMEA | | | | | 259 | | | | | | 0 | | | | 259 | | | | | | 7 | | | | | | 267 | | | | | | 182 | | | | | | 0 | | | | 182 | | | | | | 42 | | | | 42 | | | | | | 46 | |
Americas | | | | | 576 | | | | | | 0 | | | | 576 | | | | | | 28 | | | | | | 604 | | | | | | 508 | | | | | | 0 | | | | 508 | | | | | | 13 | | | | 13 | | | | | | 19 | |
APJ | | | | | 102 | | | | | | 0 | | | | 102 | | | | | | 5 | | | | | | 108 | | | | | | 78 | | | | | | 0 | | | | 78 | | | | | | 30 | | | | 30 | | | | | | 37 | |
Cloud subscriptions and support revenue | | | | | 937 | | | | | | 0 | | | | 938 | | | | | | 41 | | | | | | 978 | | | | | | 769 | | | | | | 0 | | | | 769 | | | | | | 22 | | | | 22 | | | | | | 27 | |
| | | | | | | | | | | | | | | | | | | | | | | | | | | | | | | | | | | | | | | | | | | | | | | | | | | | | | | | | | | | |
Cloud and software revenue by region | | | | | | | | | | | | | | | | | | | | | | | | | | | |
EMEA | | | | | 2,099 | | | | | | 0 | | | | 2,099 | | | | | | 22 | | | | | | 2,121 | | | | | | 1,942 | | | | | | 0 | | | | 1,942 | | | | | | 8 | | | | 8 | | | | | | 9 | |
Americas | | | | | 1,849 | | | | | | 0 | | | | 1,849 | | | | | | 92 | | | | | | 1,942 | | | | | | 1,820 | | | | | | 1 | | | | 1,821 | | | | | | 2 | | | | 2 | | | | | | 7 | |
APJ | | | | | 709 | | | | | | 0 | | | | 709 | | | | | | 44 | | | | | | 753 | | | | | | 693 | | | | | | 0 | | | | 693 | | | | | | 2 | | | | 2 | | | | | | 9 | |
Cloud and software revenue | | | | | 4,657 | | | | | | 0 | | | | 4,658 | | | | | | 158 | | | | | | 4,815 | | | | | | 4,455 | | | | | | 1 | | | | 4,456 | | | | | | 5 | | | | 5 | | | | | | 8 | |
| | | | | | | | | | | | | | | | | | | | | | | | | | | | | | | | | | | | | | | | | | | | | | | | | | | | | | | | | | | | |
Total revenue by region | | | | | | | | | | | | | | | | | | | | | | | | | | | |
Germany | | | | | 857 | | | | | | 0 | | | | 857 | | | | | | 1 | | | | | | 858 | | | | | | 749 | | | | | | 0 | | | | 749 | | | | | | 14 | | | | 14 | | | | | | 15 | |
Rest of EMEA | | | | | 1,636 | | | | | | 0 | | | | 1,637 | | | | | | 25 | | | | | | 1,662 | | | | | | 1,567 | | | | | | 0 | | | | 1,567 | | | | | | 4 | | | | 4 | | | | | | 6 | |
Total EMEA | | | | | 2,494 | | | | | | 0 | | | | 2,494 | | | | | | 26 | | | | | | 2,520 | | | | | | 2,315 | | | | | | 0 | | | | 2,315 | | | | | | 8 | | | | 8 | | | | | | 9 | |
United States | | | | | 1,800 | | | | | | 0 | | | | 1,800 | | | | | | 94 | | | | | | 1,894 | | | | | | 1,772 | | | | | | 1 | | | | 1,773 | | | | | | 2 | | | | 2 | | | | | | 7 | |
Rest of Americas | | | | | 447 | | | | | | 0 | | | | 447 | | | | | | 19 | | | | | | 465 | | | | | | 462 | | | | | | 0 | | | | 462 | | | | | | –3 | | | | –3 | | | | | | 1 | |
Total Americas | | | | | 2,247 | | | | | | 0 | | | | 2,247 | | | | | | 112 | | | | | | 2,360 | | | | | | 2,234 | | | | | | 1 | | | | 2,235 | | | | | | 1 | | | | 1 | | | | | | 6 | |
Japan | | | | | 198 | | | | | | 0 | | | | 198 | | | | | | 28 | | | | | | 225 | | | | | | 214 | | | | | | 0 | | | | 214 | | | | | | –8 | | | | –8 | | | | | | 5 | |
Rest of APJ | | | | | 651 | | | | | | 0 | | | | 651 | | | | | | 24 | | | | | | 676 | | | | | | 611 | | | | | | 0 | | | | 611 | | | | | | 7 | | | | 7 | | | | | | 11 | |
Total APJ | | | | | 849 | | | | | | 0 | | | | 849 | | | | | | 52 | | | | | | 901 | | | | | | 825 | | | | | | 0 | | | | 825 | | | | | | 3 | | | | 3 | | | | | | 9 | |
Total revenue | | | | | 5,590 | | | | | | 0 | | | | 5,590 | | | | | | 190 | | | | | | 5,780 | | | | | | 5,375 | | | | | | 1 | | | | 5,375 | | | | | | 4 | | | | 4 | | | | | | 8 | |
1) Adjustments in the revenue line items are for support revenue, cloud subscriptions and support revenue, and other similarly recurring revenues that entities acquired by SAP would have recognized had they remained stand-alone entities but that SAP is not permitted to recognize as revenue under IFRS as a result of business combination accounting rules.
2) Constant currency revenue figures are calculated by translating revenue of the current period using the average exchange rates from the previous year’s respective period instead of the current period. Constant currency period-over-period changes are calculated by comparing the current year’snon-IFRS constant currency numbers with thenon-IFRS number of the previous year’s respective period.
For a more detailed description of these adjustments and their limitations as well as our constant currency figures, see our Web sitewww.sap.com/corporate-en/investors/newsandreports/reporting-framework.epx under“Non-IFRS Measures and Estimates”.
Due to rounding, numbers may not add up precisely.
| | | | |
SAP Q3 2017 Quarterly Statement | | | 26 | |
Revenue by Region (IFRS andNon-IFRS) –Year-to-Date
| | | | | | | | | | | | | | | | | | | | | | | | | | | | | | | | | | | | | | | | | | | | | | | | | | | | | | | | | | | | |
€ millions | | | | Q1–Q3 2017 | | | | | Q1–Q3 2016 | | | | | D in % | |
| | | | | IFRS | | | | | Adj.1) | | | Non-IFRS1) | | | | | Currency Impact2) | | | | | Non-IFRS Constant Currency2) | | | | | IFRS | | | | | Adj.1) | | | Non-IFRS1) | | | | | IFRS | | | Non-IFRS1) | | | | | Non-IFRS Constant Currency2) | |
Cloud subscriptions and support revenue by region | | | | | | | | | | | | | | | | | | | | | | | | | | | |
EMEA | | | | | 738 | | | | | | 0 | | | | 738 | | | | | | 6 | | | | | | 744 | | | | | | 511 | | | | | | 0 | | | | 512 | | | | | | 44 | | | | 44 | | | | | | 45 | |
Americas | | | | | 1,735 | | | | | | 0 | | | | 1,735 | | | | | | –9 | | | | | | 1,726 | | | | | | 1,450 | | | | | | 1 | | | | 1,451 | | | | | | 20 | | | | 20 | | | | | | 19 | |
APJ | | | | | 302 | | | | | | 0 | | | | 302 | | | | | | –3 | | | | | | 299 | | | | | | 205 | | | | | | 0 | | | | 205 | | | | | | 47 | | | | 47 | | | | | | 46 | |
Cloud subscriptions and support revenue | | | | | 2,775 | | | | | | 0 | | | | 2,775 | | | | | | –6 | | | | | | 2,769 | | | | | | 2,166 | | | | | | 2 | | | | 2,168 | | | | | | 28 | | | | 28 | | | | | | 28 | |
| | | | | | | | | | | | | | | | | | | | | | | | | | | | | | | | | | | | | | | | | | | | | | | | | | | | | | | | | | | | |
Cloud and software revenue by region | | | | | | | | | | | | | | | | | | | | | | | | | | | |
EMEA | | | | | 5,992 | | | | | | 0 | | | | 5,992 | | | | | | –22 | | | | | | 5,970 | | | | | | 5,499 | | | | | | 1 | | | | 5,499 | | | | | | 9 | | | | 9 | | | | | | 9 | |
Americas | | | | | 5,572 | | | | | | 1 | | | | 5,573 | | | | | | –18 | | | | | | 5,555 | | | | | | 5,213 | | | | | | 4 | | | | 5,216 | | | | | | 7 | | | | 7 | | | | | | 6 | |
APJ | | | | | 2,178 | | | | | | 0 | | | | 2,178 | | | | | | 3 | | | | | | 2,182 | | | | | | 1,952 | | | | | | 0 | | | | 1,952 | | | | | | 12 | | | | 12 | | | | | | 12 | |
Cloud and software revenue | | | | | 13,742 | | | | | | 1 | | | | 13,743 | | | | | | –37 | | | | | | 13,706 | | | | | | 12,663 | | | | | | 4 | | | | 12,668 | | | | | | 9 | | | | 8 | | | | | | 8 | |
| | | | | | | | | | | | | | | | | | | | | | | | | | | | | | | | | | | | | | | | | | | | | | | | | | | | | | | | | | | | |
Total revenue by region | | | | | | | | | | | | | | | | | | | | | | | | | | | |
Germany | | | | | 2,312 | | | | | | 0 | | | | 2,312 | | | | | | –2 | | | | | | 2,310 | | | | | | 2,035 | | | | | | 0 | | | | 2,035 | | | | | | 14 | | | | 14 | | | | | | 14 | |
Rest of EMEA | | | | | 4,886 | | | | | | 0 | | | | 4,886 | | | | | | –22 | | | | | | 4,864 | | | | | | 4,597 | | | | | | 1 | | | | 4,597 | | | | | | 6 | | | | 6 | | | | | | 6 | |
Total EMEA | | | | | 7,198 | | | | | | 0 | | | | 7,199 | | | | | | –24 | | | | | | 7,174 | | | | | | 6,632 | | | | | | 1 | | | | 6,632 | | | | | | 9 | | | | 9 | | | | | | 8 | |
United States | | | | | 5,488 | | | | | | 1 | | | | 5,488 | | | | | | –7 | | | | | | 5,481 | | | | | | 5,116 | | | | | | 4 | | | | 5,120 | | | | | | 7 | | | | 7 | | | | | | 7 | |
Rest of Americas | | | | | 1,358 | | | | | | 0 | | | | 1,358 | | | | | | –19 | | | | | | 1,339 | | | | | | 1,260 | | | | | | 0 | | | | 1,260 | | | | | | 8 | | | | 8 | | | | | | 6 | |
Total Americas | | | | | 6,846 | | | | | | 1 | | | | 6,847 | | | | | | –27 | | | | | | 6,820 | | | | | | 6,376 | | | | | | 4 | | | | 6,380 | | | | | | 7 | | | | 7 | | | | | | 7 | |
Japan | | | | | 647 | | | | | | 0 | | | | 647 | | | | | | 23 | | | | | | 670 | | | | | | 583 | | | | | | 0 | | | | 583 | | | | | | 11 | | | | 11 | | | | | | 15 | |
Rest of APJ | | | | | 1,964 | | | | | | 0 | | | | 1,964 | | | | | | –20 | | | | | | 1,944 | | | | | | 1,748 | | | | | | 0 | | | | 1,748 | | | | | | 12 | | | | 12 | | | | | | 11 | |
Total APJ | | | | | 2,612 | | | | | | 0 | | | | 2,612 | | | | | | 2 | | | | | | 2,614 | | | | | | 2,331 | | | | | | 0 | | | | 2,331 | | | | | | 12 | | | | 12 | | | | | | 12 | |
Total revenue | | | | | 16,656 | | | | | | 1 | | | | 16,657 | | | | | | –49 | | | | | | 16,608 | | | | | | 15,339 | | | | | | 4 | | | | 15,343 | | | | |
| 9
|
| | | 9 | | | | | | 8 | |
1) Adjustments in the revenue line items are for support revenue, cloud subscriptions and support revenue, and other similarly recurring revenues that entities acquired by SAP would have recognized had they remained stand-alone entities but that SAP is not permitted to recognize as revenue under IFRS as a result of business combination accounting rules.
2) Constant currency revenue figures are calculated by translating revenue of the current period using the average exchange rates from the previous year’s respective period instead of the current period. Constant currency period-over-period changes are calculated by comparing the current year’snon-IFRS constant currency numbers with thenon-IFRS number of the previous year’s respective period.
For a more detailed description of these adjustments and their limitations as well as our constant currency figures, see our Web sitewww.sap.com/corporate-en/investors/newsandreports/reporting-framework.epx under“Non-IFRS Measures and Estimates”.
Due to rounding, numbers may not add up precisely.
| | | | |
SAP Q3 2017 Quarterly Statement | | | 27 | |
Employees by Region and Functional Areas
| | | | | | | | | | | | | | | | | | | | | | | | | | | | | | |
| | | 30.9.2017 | | | 30.9.2016 |
Full-time equivalents | | | EMEA | | | | Americas | | | | APJ | | | | Total | | | | EMEA | | | | Americas | | | | APJ | | | Total |
Cloud and software | | | 5,760 | | | | 3,839 | | | | 4,707 | | | | 14,306 | | | | 6,260 | | | | 3,996 | | | | 5,330 | | | 15,586 |
Services | | | 7,407 | | | | 4,792 | | | | 4,751 | | | | 16,951 | | | | 6,423 | | | | 4,044 | | | | 3,921 | | | 14,388 |
Research and development | | | 11,199 | | | | 5,240 | | | | 8,386 | | | | 24,826 | | | | 10,219 | | | | 4,704 | | | | 7,780 | | | 22,702 |
Sales and marketing | | | 9,199 | | | | 9,118 | | | | 4,889 | | | | 23,206 | | | | 8,425 | | | | 8,861 | | | | 4,365 | | | 21,651 |
General and administration | | | 2,706 | | | | 1,801 | | | | 1,041 | | | | 5,548 | | | | 2,578 | | | | 1,723 | | | | 1,012 | | | 5,314 |
Infrastructure | | | 1,688 | | | | 852 | | | | 498 | | | | 3,038 | | | | 1,552 | | | | 785 | | | | 447 | | | 2,784 |
SAP Group (September 30) | | | 37,960 | | | | 25,642 | | | | 24,272 | | | | 87,874 | | | | 35,458 | | | | 24,113 | | | | 22,855 | | | 82,426 |
Thereof acquisitions1) | | | 4 | | | | 13 | | | | 0 | | | | 17 | | | | 37 | | | | 68 | | | | 0 | | | 105 |
SAP Group (nine months’ end average) | | | 37,250 | | | | 25,359 | | | | 23,925 | | | | 86,534 | | | | 34,552 | | | | 23,193 | | | | 21,809 | | | 79,555 |
1) Acquisitions closed between January 1 and September 30 of the respective year
| | | | |
SAP Q3 2017 Quarterly Statement | | | 28 | |
Any statements contained in this document that are not historical facts are forward-looking statements as defined in the U.S. Private Securities Litigation Reform Act of 1995. Words such as “anticipate,” “believe,” “estimate,” “expect,” “forecast,” “intend,” “may,” “plan,” “project,” “predict,” “should” and “will” and similar expressions as they relate to SAP are intended to identify such forward-looking statements. SAP undertakes no obligation to publicly update or revise any forward-looking statements. All forward-looking statements are subject to various risks and uncertainties that could cause actual results to differ materially from expectations. The factors that could affect SAP’s future financial results are discussed more fully in SAP’s filings with the U.S. Securities and Exchange Commission (“SEC”), including SAP’s most recent Annual Report on Form20-F filed with the SEC. Readers are cautioned not to place undue reliance on these forward-looking statements, which speak only as of their dates.
© 2017 SAP SE. All rights reserved.
No part of this publication may be reproduced or transmitted in any form or for any purpose without the express permission of SAP SE. The information contained herein may be changed without prior notice.
Some software products marketed by SAP SE and its distributors contain proprietary software components of other software vendors. National product specifications may vary.
These materials are provided by SAP SE and its affiliated companies (“SAP Group”) for informational purposes only, without representation or warranty of any kind, and SAP Group shall not be liable for errors or omissions with respect to the materials. The only warranties for SAP Group products and services are those that are set forth in the express warranty statements accompanying such products and services, if any. Nothing herein should be construed as constituting an additional warranty.
SAP and other SAP products and services mentioned herein as well as their respective logos are trademarks or registered trademarks of SAP SE (or an SAP affiliate company) in Germany and other countries. Please seehttp://www.sap.com/corporate-en/legal/copyright/index.epx#trademark for additional trademark information and notices.
| | | | |
SAP Q3 2017 Quarterly Statement | | | 29 | |