Exhibit 99.1

| | |
| FOR FURTHER INFORMATION: | | |
| |
| AT THE COMPANY: | | AT ZLOKOWER COMPANY |
| |
| Medallion Financial Corp. | | |
| 437 Madison Avenue | | |
| New York, New York 10022 | | |
| |
| Andrew M. Murstein, President | | Public Relations |
| Larry D. Hall, CFO | | Harry Zlokower/Dave Closs |
| 1-212-328-2100 | | 1-212-447-9292 |
| 1-877-MEDALLION | | |
FOR IMMEDIATE RELEASE:
MEDALLION FINANCIAL CORP. REPORTS RECORD
2005 FOURTH QUARTER AND FULL YEAR RESULTS
Quarterly Highlights
| | • | | 4th quarter net investment income after taxes increased 75% to $0.21 per share from $0.12 per share. |
| | • | | 4th quarter net interest margin increased to 4.66% from 3.96%. |
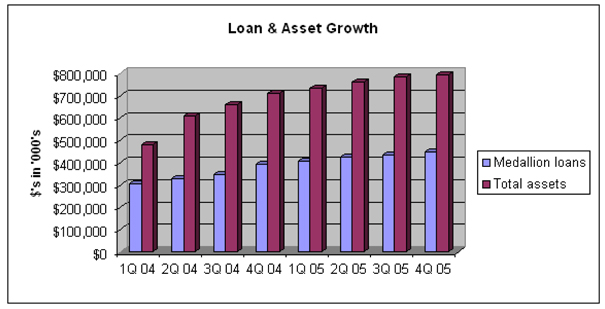
| | • | | Medallion loans and total assets reach all-time highs. |
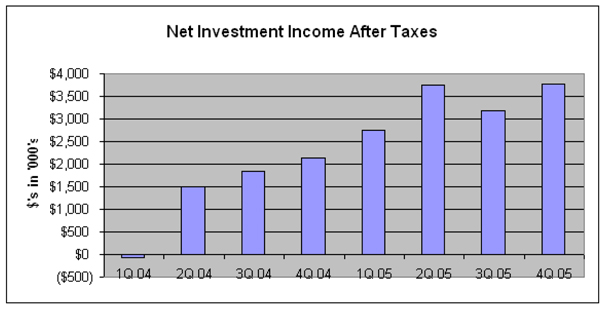
NEW YORK, NY – March 2, 2006— Medallion Financial Corp. (Nasdaq: TAXI), a specialty finance company with a leading position servicing the taxicab industry and other niche markets in small business and consumer lending, announced net investment income after taxes increased 75% to $3,763,000, or $0.21 per diluted common share in the 2005 fourth quarter, up from $2,138,000, or $0.12 per share in the 2004 fourth quarter.
Net investment income after taxes increased 148% to $13,462,000, or $0.77 per diluted common share for 2005, up from $5,427,000 or $0.29 per share for 2004. This was the highest operating earnings, in total and per share, that the company has earned since it went public in 1996.
(more)
Medallion Announces Fourth Quarter and 2005 Year End Results, p. 2
Andrew Murstein, President of Medallion Financial stated, “We are very pleased with the year’s results, and especially this quarter. We greatly improved our net investment income. As a result, net investment income in the fourth quarter was the highest it has ever been.”
Mr. Murstein continued, “We grew our taxicab medallion loan portfolio by 15%. Medallion loans reached approximately $450,000,000, an all-time high. Medallion Bank grew as we continued to take in federally insured deposits at the lowest relative cost of funds in our history. We increased our annual dividend by 46%. Following the sale of our Business Lenders unit, we are focusing on our medallion lending and other profitable divisions. We are confident that we are well positioned to build on this success, and we remain optimistic about our prospects for the future.”
Larry Hall, Medallion’s CFO stated, “During the year our net interest margin increased. In January 2006, we extended the term and increased our main credit facility with Merrill Lynch to $475,000,000 from $325,000,000. We remain extremely well capitalized, with a total debt to equity ratio of only 3.7 to 1. In the last two years we have reduced our operating expense ratio, which is our operating expenses divided by our average interest-earnings assets, by 34%. This is still a little high, and our goal is to further reduce it by using our existing infrastructure and available liquidity to leverage our balance sheet by adding assets and increasing earnings.”
Mr. Hall continued, “In addition to improvements in profitability and asset growth, medallion prices have also continued to grow, with corporate medallion values growing from $200,000 a few years ago to $425,000 as of March 1. This represents the highest values ever in the history of New York city taxi medallions. The average loan-to-value ratio on our loan portfolio is now under 60%, and our customers have more equity to tap into by borrowing from us to grow their businesses. In addition we anticipate the City of New York will conduct another taxi medallion auction within the next 120 days. Many of our customers should be winning bidders, thus we anticipate further increasing the size of our New York portfolio.”
(more)
Medallion Announces Fourth Quarter and 2005 Year End Results, p.3
Mr. Hall continued, “During the year we made over $330,000,000 of investments. Loan quality remains a trademark of Medallion, as loans 90 days or more past due decreased to 2.5% from 3.2% a year ago.”
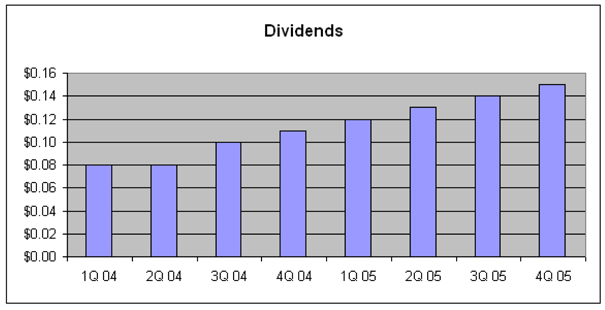
The Company also announced that it is increasing its quarterly dividend to $0.15 per share from $0.11 in the 2004 fourth quarter. For the year, the Company declared dividends of $0.54 per share, up from $0.37 in 2004. Over the last eight quarters, dividends, as well as other key measures, have increased steadily, as indicated on the attached exhibit. The current dividend will be paid on March 27, 2005, to shareholders of record on March 10, 2005. Since our initial public offering in 1996, the Company has paid in excess of $90,000,000 or $6.31 per share in dividends.
* * *
Medallion Financial Corp. is a specialty finance company with a leading position in the origination and servicing of loans financing the purchase of taxicab medallions and related assets. The Company also originates and services commercial and consumer loans in targeted niche industries. The Company and its subsidiaries have lent over $2 billion to its taxicab, commercial, and consumer customers.
Please note that this press release contains forward-looking statements that involve risks and uncertainties relating to business performance, cash flow, costs, sales, net investment income, earnings, and growth. Medallion’s actual results may differ significantly from the results discussed in such forward-looking statements. Factors that might cause such a difference include, but are not limited to, those factors discussed under the heading “Investment Considerations,” in Medallion’s 2004 Annual Report on Form 10-K.
* * * Financial Tables Follow * * *
Medallion Financial Corp.
Consolidated Income Statements
| | | | | | | | | | | | | | | | |
| | | Quarter Ended | | | Year Ended | |
| | | December 31,
2005 | | | December 31,
2004 | | | December 31,
2005 | | | December 31,
2004 | |
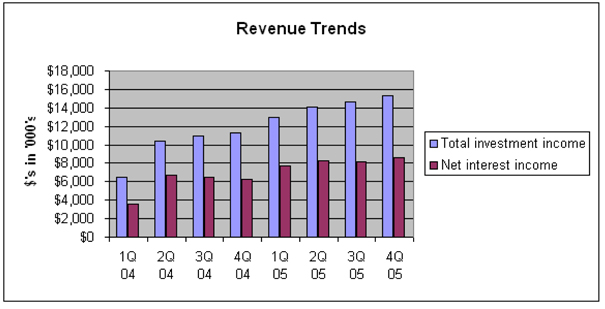
Total investment income | | $ | 15,370,385 | | | $ | 11,255,249 | | | $ | 57,173,216 | | | $ | 39,119,381 | |
Total interest expense | | | 6,807,594 | | | | 4,982,920 | | | | 24,396,773 | | | | 16,063,583 | |
| | | | | | | | | | | | | | | | |
Net interest income | | | 8,562,791 | | | | 6,272,329 | | | | 32,776,443 | | | | 23,055,798 | |
| | | | | | | | | | | | | | | | |
Gain on sale of loans | | | 46,874 | | | | 173,948 | | | | 884,608 | | | | 904,074 | |
Other income | | | 544,219 | | | | 757,133 | | | | 2,995,749 | | | | 2,575,355 | |
| | | | | | | | | | | | | | | | |
Total noninterest income | | | 591,093 | | | | 931,081 | | | | 3,880,357 | | | | 3,479,429 | |
| | | | | | | | | | | | | | | | |
Salaries and benefits | | | 2,423,767 | | | | 2,249,618 | | | | 10,930,137 | | | | 9,417,185 | |
Professional fees | | | 716,618 | | | | 465,118 | | | | 2,266,839 | | | | 1,776,251 | |
Other operating expenses | | | 1,828,683 | | | | 1,854,145 | | | | 8,038,363 | | | | 7,743,645 | |
| | | | | | | | | | | | | | | | |
Total operating expenses | | | 4,969,068 | | | | 4,568,881 | | | | 21,235,339 | | | | 18,937,081 | |
| | | | | | | | | | | | | | | | |
Income tax provision | | | 422,061 | | | | 496,460 | | | | 1,959,095 | | | | 2,170,737 | |
| | | | | | | | | | | | | | | | |
Net investment income after taxes | | | 3,762,755 | | | | 2,138,069 | | | | 13,462,366 | | | | 5,427,409 | |
| | | | | | | | | | | | | | | | |
Net realized gains (losses) on investments | | | (2,434,258 | ) | | | 3,272,873 | | | | 1,081,005 | | | | (25,791 | ) |
Net change in unrealized depreciation on investments | | | (725,938 | ) | | | (1,823,409 | ) | | | (7,681,869 | ) | | | 17,110,411 | |
| | | | | | | | | | | | | | | | |
Net realized/unrealized losses on investments | | | (3,160,196 | ) | | | 1,449,464 | | | | (6,600,864 | ) | | | 17,084,620 | |
| | | | | | | | | | | | | | | | |
Net increase (decrease) in net assets from operations | | $ | 602,559 | | | $ | 3,587,533 | | | $ | 6,861,502 | | | $ | 22,512,029 | |
| | | | | | | | | | | | | | | | |
Weighted average shares | | | | | | | | | | | | | | | | |
Basic | | | 17,155,302 | | | | 17,575,356 | | | | 17,087,034 | | | | 18,001,604 | |
Diluted | | | 17,591,130 | | | | 18,030,899 | | | | 17,552,228 | | | | 18,424,518 | |
| | | | | | | | | | | | | | | | |
Net investment income after income taxes per share | | | | | | | | | | | | | | | | |
Basic | | $ | 0.22 | | | $ | 0.12 | | | $ | 0.79 | | | $ | 0.30 | |
Diluted | | | 0.21 | | | | 0.12 | | | | 0.77 | | | | 0.29 | |
| | | | | | | | | | | | | | | | |
Net increase (decrease) in net assets from operations per share | | | | | | | | | | | | | | | | |
Basic | | $ | 0.04 | | | $ | 0.20 | | | $ | 0.40 | | | $ | 1.25 | |
Diluted | | | 0.03 | | | | 0.20 | | | | 0.39 | | | | 1.22 | |
| | | | | | | | | | | | | | | | |
Dividends declared per share | | $ | 0.15 | | | $ | 0.11 | | | $ | 0.54 | | | $ | 0.37 | |
| | | | | | | | | | | | | | | | |
Medallion Financial Corp.
Consolidated Balance Sheets
| | | | | | |
| | | December 31, |
| | | 2005 | | 2004 |
ASSETS | | | | | | |
Medallion loans | | $ | 449,672,510 | | $ | 392,131,108 |
Commercial loans | | | 145,796,651 | | | 136,834,891 |
Consumer loans | | | 85,678,412 | | | 66,330,748 |
Equity investments | | | 24,012,508 | | | 33,645,424 |
Investment securities | | | 18,092,838 | | | 14,598,837 |
| | | | | | |
Net investments | | | 723,252,919 | | | 643,541,008 |
| | |
Cash | | | 43,035,506 | | | 37,267,122 |
Accrued interest receivable | | | 3,580,460 | | | 3,062,608 |
Servicing fee receivable | | | — | | | 2,312,040 |
Fixed assets, net | | | 614,858 | | | 991,901 |
Goodwill, net | | | 5,007,583 | | | 5,007,583 |
Other assets | | | 17,481,876 | | | 17,727,362 |
| | | | | | |
Total assets | | $ | 792,973,202 | | $ | 709,909,624 |
| | | | | | |
LIABILITIES AND SHAREHOLDERS’ EQUITY | | | | | | |
Accounts payable and accrued expenses | | $ | 4,837,461 | | $ | 11,756,337 |
Accrued interest payable | | | 1,759,737 | | | 1,758,956 |
Floating rate borrowings | | | 323,664,951 | | | 274,959,911 |
Fixed rate borrowings | | | 296,357,214 | | | 250,973,035 |
| | | | | | |
Total liabilities | | | 626,619,363 | | | 539,448,239 |
| | | | | | |
Total shareholders’ equity | | | 166,353,839 | | | 170,461,385 |
| | | | | | |
Total liabilities and shareholders’ equity | | $ | 792,973,202 | | $ | 709,909,624 |
| | | | | | |
Number of common shares outstanding | | | 17,173,297 | | | 17,344,999 |
Net asset value per share | | $ | 9.69 | | $ | 9.83 |
| | | | | | |
Medallion Financial Corp.
Selected Financial Trends
Medallion Financial Corp.
Selected Financial Trends