Exhibit 99.1

| | |
FOR FURTHER INFORMATION: | | |
AT MEDALLION FINANCIAL CORP. | | AT ZLOKOWER COMPANY |
437 Madison Avenue, New York, NY 10022 | | PUBLIC RELATIONS |
Andrew Murstein, President | | Harry Zlokower |
Larry D. Hall, CFO | | David Closs |
(212) 328-2100 | | (212) 447-9292 |
FOR IMMEDIATE RELEASE
MEDALLION FINANCIAL CORP. REPORTS
RECORD 2006 FIRST QUARTER RESULTS
| | • | | Net investment income after taxes increases 36% to $0.21 per share. |
| | • | | Net interest margin increases to 4.89%. |
| | • | | Loan portfolio reaches record highs with more than 10,000 loans. |
| | • | | Corporate NYC Medallion prices reach record highs of $450,000. |
| | • | | Dividend increased 33% from last year’s quarter to $0.16 per share. |
NEW YORK, N.Y. — May 9, 2006 — Medallion Financial Corp. (NASDAQ:TAXI), a specialty finance company with a leading position servicing the taxicab industry and other niche markets in small business commercial and consumer lending, announced that net investment income after taxes increased 36% to $3,766,000 or $0.21 per diluted common share for the 2006 first quarter, up from $2,760,000 or $0.16 per diluted common share for the 2005 first quarter. Net investment income before taxes increased 44% to $4,768,000 or $0.27 per diluted common share for the 2006 first quarter, up from $3,317,000 or $0.19 per diluted common share for the 2005 first quarter.
Medallion loans increased 22% to $498,000,000, from $408,000,000 during the last 12 months. Commercial loans remained at $147,000,000. Consumer loans increased 31% to $90,000,000, from $69,000,000. Total assets increased 14% to $836,000,000, from $735,000,000. Medallion loans, consumer loans, and total assets were record highs for the Company.
(more)
Medallion Financial Corp. Announces Record First Quarter Results – p. 2
Andrew Murstein, President of Medallion stated, “We are very pleased with our continuing trends of strong net interest margins and solid and improving quarterly earnings. During this quarter, New York City medallion prices continued to rise. Since late 2001, corporate medallion values have increased from $195,000 per medallion to approximately $450,000 today. With another New York City taxicab medallion auction of newly issued medallions scheduled for June of this year, we think the prices may continue to increase during 2006.”
Larry Hall, CFO stated, “During the quarter we experienced a new level of growth for Medallion, as we now have more than 10,000 loans on our books for the very first time. In addition, as we use our bank, which has been growing rapidly, our margins have continued to increase. As our bank is our only large taxable entity, we are also able to retain its earnings for future growth. That is partly why our pre-tax earnings were so high this quarter. Our loan quality continues to remain strong, and remains one of the hallmarks of Medallion. Delinquent loans 90 days or more past due for the entire Company have decreased to 2.2% of the loan portfolio, from 2.9% one year ago. Loan losses in our bank were also better than anticipated, and loans 90 days or more past due were less than one half of one percent.”
The Company also announced that its Board of Directors declared a dividend of $0.16 per share on its common stock for the 2006 first quarter, an increase from $0.12 a year ago. The dividend is payable on May 25, 2006 to shareholders of record on May 12, 2006. Since the Company’s initial public offering in 1996, the Company has paid out over $95,000,000 in dividends, or $6.47 per share.
Medallion Financial Corp. is a specialty finance company with a leading position in the origination and servicing of loans financing the purchase of taxicab medallions and related assets. The Company also originates and services commercial and consumer loans in targeted niche industries. The Company and its subsidiaries have lent over $2.3 billion, primarily to the taxicab industry and also to various commercial enterprises and to consumers.
(more)
Please note that this press release contains forward-looking statements that involve risks and uncertainties relating to business performance, cash flow, costs, sales, net investment income, earnings, and growth. Medallion’s actual results may differ significantly from the results discussed in such forward-looking statements. Factors that might cause such a difference include, but are not limited to, those factors discussed under the heading “Risk Factors,” in Medallion’s 2005 Annual Report on Form 10-K.
(Financial tables follow)
Medallion Financial Corp.
Consolidated Income Statements
(Unaudited)
| | | | | | | | |
| | | Quarter Ended | |
| | | March 31,
2006 | | | March 31,
2005 | |
Total investment income | | $ | 16,447,194 | | | $ | 12,966,259 | |
Total interest expense | | | 7,428,730 | | | | 5,221,336 | |
| | | | | | | | |
Net interest income | | | 9,018,464 | | | | 7,744,923 | |
| | | | | | | | |
Gain on sales of loans | | | — | | | | 239,520 | |
Other income | | | 399,917 | | | | 673,238 | |
| | | | | | | | |
Total noninterest income | | | 399,917 | | | | 912,758 | |
| | | | | | | | |
Salaries and benefits | | | 2,439,233 | | | | 2,912,428 | |
Professional fees | | | 610,783 | | | | 505,257 | |
Other operating expenses | | | 1,600,488 | | | | 1,923,308 | |
| | | | | | | | |
Total operating expenses | | | 4,650,504 | | | | 5,340,993 | |
| | | | | | | | |
Net investment income before income taxes | | | 4,767,877 | | | | 3,316,688 | |
Income tax provision | | | 1,001,571 | | | | 556,661 | |
| | | | | | | | |
Net investment income after taxes | | | 3,766,306 | | | | 2,760,027 | |
| | | | | | | | |
Net realized gains (losses) on investments | | | (2,241,423 | ) | | | 2,047,887 | |
Net change in unrealized appreciation (depreciation) on investments | | | 261,287 | | | | (2,572,235 | ) |
| | | | | | | | |
Net realized/unrealized loss on investments | | | (1,980,136 | ) | | | (524,348 | ) |
| | | | | | | | |
Net increase in net assets resulting from operations | | $ | 1,786,170 | | | $ | 2,235,679 | |
| | | | | | | | |
Weighted average common shares outstanding | | | | | | | | |
Basic | | | 17,211,707 | | | | 17,135,682 | |
Diluted | | | 17,722,064 | | | | 17,605,676 | |
| | | | | | | | |
Net investment income after income taxes per share | | | | | | | | |
Basic | | $ | 0.22 | | | $ | 0.16 | |
Diluted | | | 0.21 | | | | 0.16 | |
| | | | | | | | |
Net increase in net assets resulting from operations per share | | | | | | | | |
Basic | | $ | 0.10 | | | $ | 0.13 | |
Diluted | | | 0.10 | | | | 0.13 | |
| | | | | | | | |
Dividends declared per share | | $ | 0.16 | | | $ | 0.12 | |
| | | | | | | | |
Medallion Financial Corp.
Consolidated Balance Sheet
(Unaudited)
| | | | | | |
| | | March 31, 2006 | | December 31,
2005 |
ASSETS | | | | | | |
Medallion loans | | $ | 497,763,372 | | $ | 449,672,510 |
Commercial loans | | | 146,998,855 | | | 145,796,651 |
Consumer loans | | | 90,290,515 | | | 85,678,412 |
Equity investments | | | 23,610,251 | | | 24,012,508 |
Investment securities | | | 18,790,633 | | | 18,092,838 |
| | | | | | |
Net investments | | | 777,453,626 | | | 723,252,919 |
| | |
Cash | | | 32,865,475 | | | 43,035,506 |
Accrued interest receivable | | | 3,299,740 | | | 3,580,460 |
Fixed assets, net | | | 632,652 | | | 614,858 |
Goodwill, net | | | 5,007,583 | | | 5,007,583 |
Other assets | | | 17,006,832 | | | 17,481,876 |
| | | | | | |
Total assets | | $ | 836,265,908 | | $ | 792,973,202 |
| | | | | | |
LIABILITIES AND SHAREHOLDERS’ EQUITY | | | | | | |
Accounts payable and accrued expenses | | $ | 3,703,482 | | $ | 4,837,461 |
Accrued interest payable | | | 925,982 | | | 1,759,737 |
Floating rate borrowings | | | 370,885,658 | | | 323,664,951 |
Fixed rate borrowings | | | 294,721,694 | | | 296,357,214 |
| | | | | | |
Total liabilities | | | 670,236,816 | | | 626,619,363 |
| | | | | | |
Total shareholders’ equity | | | 166,029,092 | | | 166,353,839 |
| | | | | | |
Total liabilities and shareholders’ equity | | $ | 836,265,908 | | $ | 792,973,202 |
| | | | | | |
Number of common shares outstanding | | | 17,265,415 | | | 17,173,297 |
Net asset value per share | | $ | 9.62 | | $ | 9.69 |
| | | | | | |
Total managed loans | | $ | 742,290,230 | | $ | 690,280,561 |
Total managed assets | | | 843,503,396 | | | 802,106,190 |
| | | | | | |
SELECTED FINANCIAL INFORMATION
(Unaudited, in thousands, except for dividends per share)
| | | | | | | | | | | | | | | | | | | |
| | | 1Q 04 | | | 2Q 04 | | 3Q 04 | | 4Q 04 | | 1Q 05 | | 2Q 05 | | 3Q 05 | | 4Q 05 | | 1Q 06 |
Medallion | | | | | | | | | | | | | | | | | | | |
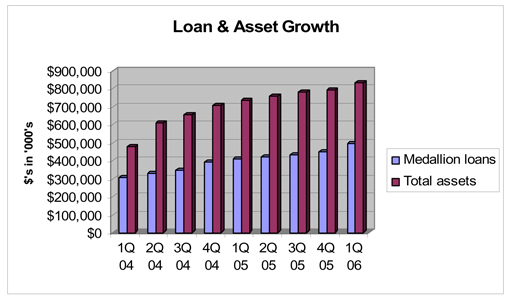
loans | | 306,331 | | | 328,616 | | 348,413 | | 392,131 | | 408,271 | | 423,799 | | 434,085 | | 449,673 | | 497,763 |
Total assets | | 478,876 | | | 608,709 | | 658,021 | | 709,910 | | 734,817 | | 761,001 | | 783,007 | | 792,973 | | 836,266 |
| | | | | | | | | |
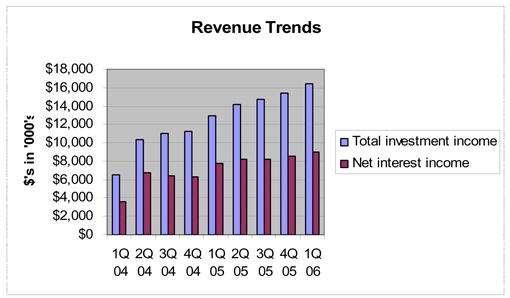
Total investment income | | 6,485 | | | 10,401 | | 10,978 | | 11,255 | | 12,966 | | 14,138 | | 14,699 | | 15,370 | | 16,447 |
Net interest income | | 3,588 | | | 6,744 | | 6,451 | | 6,272 | | 7,745 | | 8,267 | | 8,202 | | 8,563 | | 9,018 |
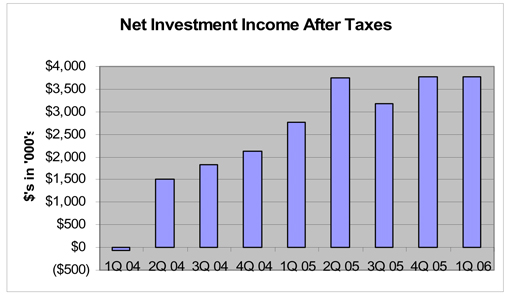
Net investment income after taxes | | (62 | ) | | 1,510 | | 1,841 | | 2,138 | | 2,760 | | 3,753 | | 3,186 | | 3,763 | | 3,766 |
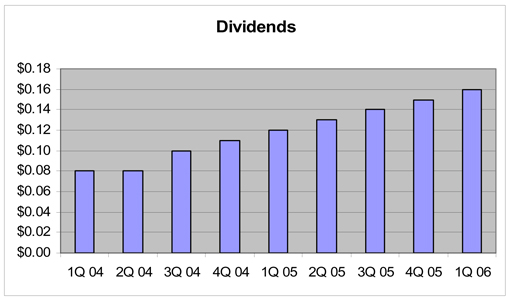
Dividends | | 0.08 | | | 0.08 | | 0.10 | | 0.11 | | 0.12 | | 0.13 | | 0.14 | | 0.15 | | 0.16 |
SELECTED FINANCIAL INFORMATION
(Unaudited, in thousands, except for dividends per share)