Filed Pursuant to Rule 433
Registration Statement No. 333-259205
Registration Statement No. 333-259205
August 9, 2022
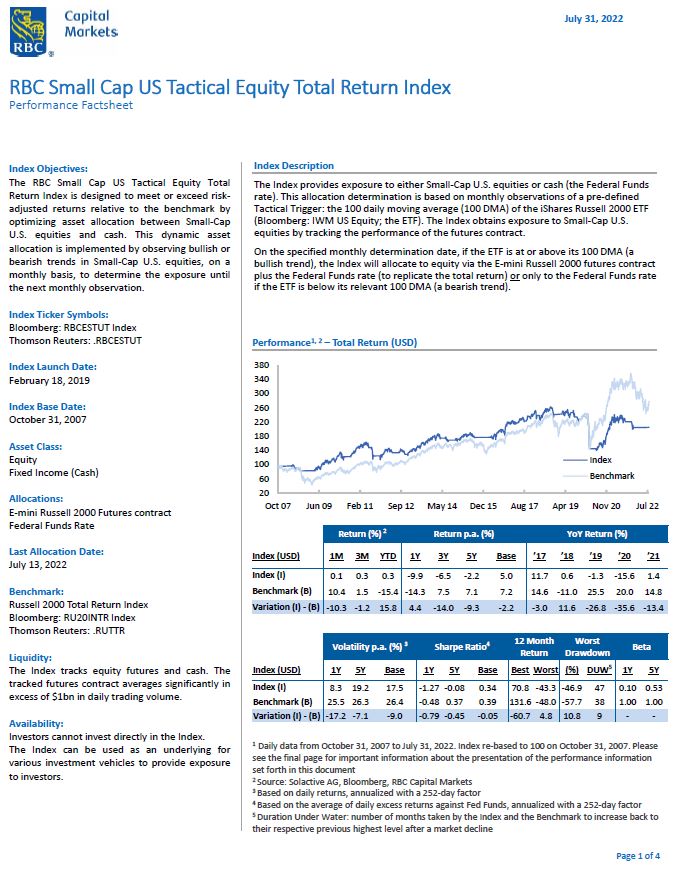
July 31, 2022 RBC Small Cap US Tactical Equity Total Return Index Performance Factsheet Index Objectives: The RBC Small Cap US Tactical Equity Total Return Index is designed to meet or exceed riskadjusted returns relative to the benchmark by optimizing asset allocation between Small‐Cap U.S. equities and cash. This dynamic asset allocation is implemented by observing bullish or bearish trends in Small‐Cap U.S. equities, on a monthly basis, to determine the exposure until the next monthly observation. Index Ticker Symbols: Bloomberg: RBCESTUT IndexThomson Reuters: .RBCESTUT Index Launch Date: February 18, 2019 Index Base Date: October 31, 2007 Asset Class: Equity Fixed Income (Cash) Allocations: E‐mini Russell 2000 Futures contract Federal Funds Rate Last Allocation Date: Benchmark: Russell 2000 Total Return Index Bloomberg: RU20INTR Index Thomson Reuters: .RUTTR Liquidity: The Index tracks equity futures and cash. The tracked futures contract averages significantly in excess of $1bn in daily trading volume. Availability: Investors cannot invest directly in the Index. The Index can be used as an underlying for various investment vehicles to provide exposure to investors. Index Description The Index provides exposure to either Small‐Cap U.S. equities or cash (the Federal Funds rate). This allocation determination is based on monthly observations of a pre‐defined Tactical Trigger: the 100 daily moving average (100 DMA) of the iShares Russell 2000 ETF (Bloomberg: IWM US Equity; the ETF). The Index obtains exposure to Small‐Cap U.S. equities by tracking the performance of the futures contract. On the specified monthly determination date, if the ETF is at or above its 100 DMA (a bullish trend), the Index will allocate to equity via the E‐mini Russell 2000 futures contract plus the Federal Funds rate (to replicate the total return) or only to the Federal Funds rate if the ETF is below its relevant 100 DMA (a bearish trend). Performance1, 2 – Total Return (USD) Index (USD) 1M 3M YTD 1Y 3Y 5Y Base ’17 ’18 ’19 ’20 ’21 Index (I) 0.1 0.3 0.3 ‐9.9 ‐6.5 ‐2.2 5.0 11.7 0.6 ‐1.3 ‐15.6 1.4 Benchmark (B) 10.4 1.5 ‐15.4 ‐14.3 7.5 7.1 7.2 14.6 ‐11.0 25.5 20.0 14.8 Variation (I) ‐ (B) ‐10.3 ‐1.2 15.8 4.4 ‐14.0 ‐9.3 ‐2.2 ‐3.0 11.6 ‐26.8 ‐35.6 ‐13.4 Index (USD) 1Y 5Y Base 1Y 5Y Base Best Worst (%) DUW5 1Y 5Y Index (I) 8.3 19.2 17.5 ‐1.27 ‐0.08 0.34 70.8 ‐43.3 ‐46.9 47 0.10 0.53 Benchmark (B) 25.5 26.3 26.4 ‐0.48 0.37 0.39 131.6 ‐48.0 ‐57.7 38 1.00 1.00 Variation (I) ‐ (B) ‐17.2 ‐7.1 ‐9.0 ‐0.79 ‐0.45 ‐0.05 ‐60.7 4.8 10.8 9 ‐ ‐ Daily data from October 31, 2007 to July 31, 2022. Index re‐based to 100 on October 31, 2007. Please see the final page for important information about the presentation of the performance information set forth in this document 2 Source: Solactive AG, Bloomberg, RBC Capital Markets 3 Based on daily returns, annualized with a 252‐day factor 4 Based on the average of daily excess returns against Fed Funds, annualized with a 252‐day factor 5 Duration Under Water: number of months taken by the Index and the Benchmark to increase back to their respective previous highest level after a market decline
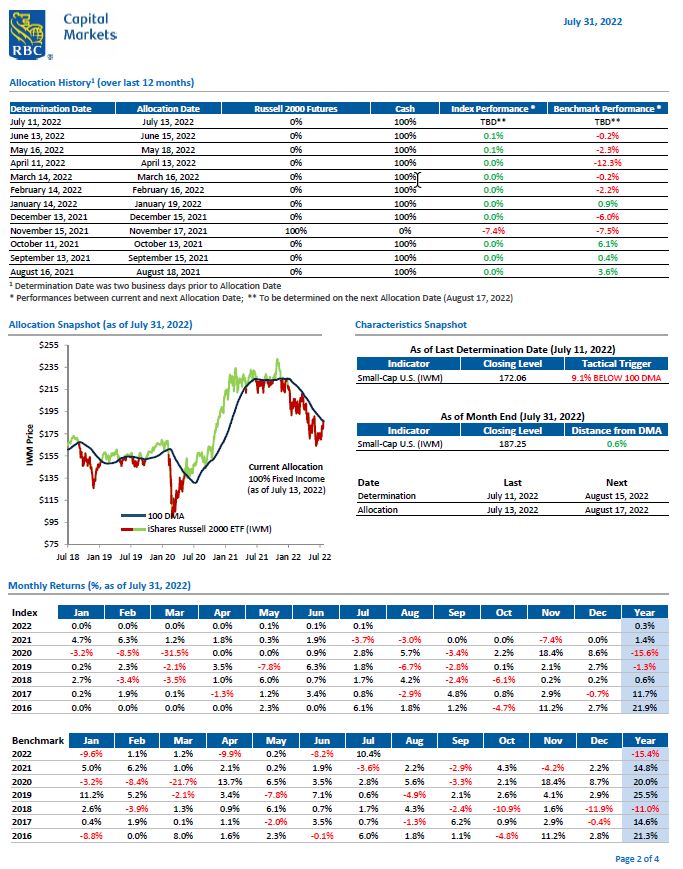
July 31, 2022 Allocation History1 (over last 12 months) July 11, 2022 July 13, 2022 0% 100% TBD** TBD** June 13, 2022 June 15, 2022 0% 100% 0.1% ‐0.2% May 16, 2022 May 18, 2022 0% 100% 0.1% ‐2.3% April 11, 2022 April 13, 2022 0% 100% 0.0% ‐12.3% March 14, 2022 March 16, 2022 0% 100% 0.0% ‐0.2% February 14, 2022 February 16, 2022 0% 100% 0.0% ‐2.2% January 14, 2022 January 19, 2022 0% 100% 0.0% 0.9% December 13, 2021 December 15, 2021 0% 100% 0.0% ‐6.0% November 15, 2021 November 17, 2021 100% 0% ‐7.4% ‐7.5% October 11, 2021 October 13, 2021 0% 100% 0.0% 6.1% September 13, 2021 September 15, 2021 0% 100% 0.0% 0.4% August 16, 2021 August 18, 2021 0% 100% 0.0% 3.6% 1 Determination Date was two business days prior to Allocation Date * Performances between current and next Allocation Date; ** To be determined on the next Allocation Date (August 17, 2022) Allocation Snapshot (as of July 31, 2022) Characteristics Snapshot As of Last Determination Date (July 11, 2022) Small‐Cap U.S. (IWM) 172.06 9.1% BELOW 100 DMA As of Month End (July 31, 2022) Small‐Cap U.S. (IWM) 187.25 0.6% Date Last Next Determination July 11, 2022 August 15, 2022 Allocation July 13, 2022 August 17, 2022 Monthly Returns (%, as of July 31, 2022) Index 2022 0.0% 0.0% 0.0% 0.0% 0.1% 0.1% 0.1% 0.3% 2021 4.7% 6.3% 1.2% 1.8% 0.3% 1.9% ‐3.7% ‐3.0% 0.0% 0.0% ‐7.4% 0.0% 1.4% 2020 ‐3.2% ‐8.5% ‐31.5% 0.0% 0.0% 0.9% 2.8% 5.7% ‐3.4% 2.2% 18.4% 8.6% ‐15.6% 2019 0.2% 2.3% ‐2.1% 3.5% ‐7.8% 6.3% 1.8% ‐6.7% ‐2.8% 0.1% 2.1% 2.7% ‐1.3% 2018 2.7% ‐3.4% ‐3.5% 1.0% 6.0% 0.7% 1.7% 4.2% ‐2.4% ‐6.1% 0.2% 0.2% 0.6% 2017 0.2% 1.9% 0.1% ‐1.3% 1.2% 3.4% 0.8% ‐2.9% 4.8% 0.8% 2.9% ‐0.7% 11.7% 2016 0.0% 0.0% 0.0% 0.0% 2.3% 0.0% 6.1% 1.8% 1.2% ‐4.7% 11.2% 2.7% 21.9% Benchmark 2022 ‐9.6% 1.1% 1.2% ‐9.9% 0.2% ‐8.2% 10.4% ‐15.4% 2021 5.0% 6.2% 1.0% 2.1% 0.2% 1.9% ‐3.6% 2.2% ‐2.9% 4.3% ‐4.2% 2.2% 14.8% 2020 ‐3.2% ‐8.4% ‐21.7% 13.7% 6.5% 3.5% 2.8% 5.6% ‐3.3% 2.1% 18.4% 8.7% 20.0% 2019 11.2% 5.2% ‐2.1% 3.4% ‐7.8% 7.1% 0.6% ‐4.9% 2.1% 2.6% 4.1% 2.9% 25.5% 2018 2.6% ‐3.9% 1.3% 0.9% 6.1% 0.7% 1.7% 4.3% ‐2.4% ‐10.9% 1.6% ‐11.9% ‐11.0% 2017 0.4% 1.9% 0.1% 1.1% ‐2.0% 3.5% 0.7% ‐1.3% 6.2% 0.9% 2.9% ‐0.4% 14.6% 2016 ‐8.8% 0.0% 8.0% 1.6% 2.3% ‐0.1% 6.0% 1.8% 1.1% ‐4.8% 11.2% 2.8% 21.3%
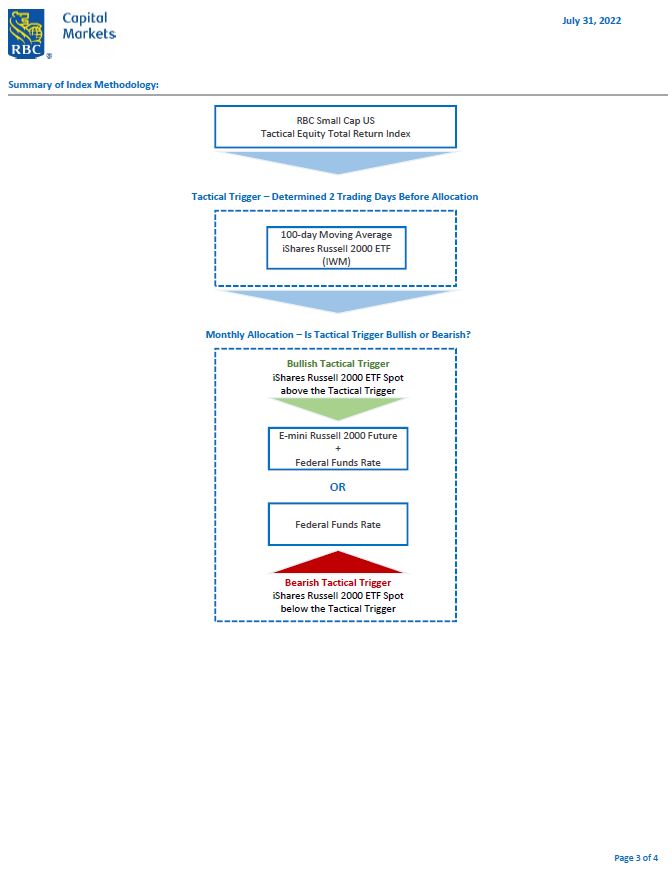
July 31, 2022 Summary of Index Methodology: RBC Small Cap USTactical Equity Total Return Index Tactical Trigger – Determined 2 Trading Days Before Allocation 100‐day Moving Average iShares Russell 2000 ETF (IWM) Monthly Allocation – Is Tactical Trigger Bullish or Bearish? Bullish Tactical Trigger iShares Russell 2000 ETF Spot above the Tactical Trigger E‐mini Russell 2000 Future + Federal Funds Rate OR Federal Funds Rate Bearish Tactical Trigger iShares Russell 2000 ETF Spot below the Tactical Trigger
July 31, 2022 This communication has been generated by employees of RBC Capital Markets’ Global Equity Linked Products, and is not a research report or a product of RBC Capital Markets’ Research Department. This document is for informational purposes only and is not intended to set forth a final expression of the terms and conditions of any offering, and may be amended, superseded or replaced in its entirety by subsequent summaries. When making an investment decision, any prospective investor should rely solely on the relevant transaction documentation, which will contain the final terms and conditions of the transaction. The information contained herein has been compiled from sources believed to be reliable by RBC Capital Markets or any of its businesses. Neither RBC Capital Markets nor any of its businesses or representatives has undertaken any independent review or due diligence of such sources. This document shall not constitute a commitment or recommendation to enter into any transaction by any RBC entity. All information, terms and pricing set forth herein is indicative and subject to change without notice. Any opinions expressed herein reflect our judgment at the date and time hereof and are subject to change without notice. The information contained in this document has been internally developed or taken from trade and statistical services and other sources which we deem reliable. Transactions of the type described herein may involve a high degree of risk and the value of such investments may be highly volatile. Such risks may include, without limitation, risk of adverse or unanticipated market developments, risk of issuer default and risk of illiquidity. In certain transactions, counterparties may lose their entire investment or incur an unlimited loss. This brief statement does not purport to identify or suggest all the risks (directly or indirectly) and other significant aspects in connection with transactions of the type described herein, and investors should ensure that they fully understand the terms of the transaction, including the relevant risk factors and any legal, tax, regulatory or accounting considerations applicable to them, prior to transacting. No representation is made concerning the legal, tax, regulatory or accounting implications in any applicable jurisdiction, and we are not advising you in respect of such matters. Accordingly you must independently determine, with your own advisors, the appropriateness for you of the transaction before transacting. RBC is acting solely in the capacity of an arm’s length contractual counterparty and not in the capacity of your financial adviser or fiduciary. RBC Capital Markets is the global brand name for the capital markets business of Royal Bank of Canada and its affiliates, including RBC Capital Markets, LLC (member FINRA, NYSE and SIPC); RBC Dominion Securities Inc. (member IIROC and CIPF); Royal Bank of Canada ‐ Sydney Branch (ABN 86 076 940 880); RBC Capital Markets (Hong Kong) Limited (regulated by the Securities and Futures Commission of Hong Kong and the Hong Kong Monetary Authority) and RBC Europe Limited (authorized by the Prudential Regulation Authority and regulated by the Financial Conduct Authority and Prudential Regulation Authority.) Royal Bank of Canada has filed a registration statement (including a prospectus) with the SEC for the offerings to which this document relates. Before you invest, you should read those documents and the other documents relating to these offerings that Royal Bank of Canada has filed with the SEC for more complete information about us and these offerings. You may obtain these documents without cost by visiting EDGAR on the SEC website at www.sec.gov. Alternatively, Royal Bank of Canada, any agent or any dealer participating in this offering will arrange to send you the prospectus and any related supplements if you so request by calling tollfree at 1‐877‐688‐2301. ® Registered trademark of Royal Bank of Canada. Used under license. All rights reserved. Important Information About the Historical Performance of the Index The Index was launched on February 18, 2019. Accordingly, all of the information about the performance of the Index prior to that date is based on hypothetical back‐tested information. The hypothetical performance of the Index is based on criteria that have been applied retroactively with the benefit of hindsight; these criteria cannot account for all financial risk that may affect the actual performance of the Index in the future. The future performance of the Index may vary significantly from the hypothetical performance data in this document. For example, not all of the futures contracts and ETFs upon which the Index is based existed during all the periods shown; accordingly, we have used other related financial assets for those periods, when needed. In addition, please note that the back‐tested performance of the Index set forth in this document does not reflect the deduction of any fees and charges that would be applicable to a financial instrument that references the Index. For the full Index methodology, please visit the following link: www.solactive.com