Filed Pursuant to Rule 433
Registration Statement No. 333-259205
Registration Statement No. 333-259205
Dated March, 29, 2023

MSCI USA ESG Quality Select Low Volatility 10% Risk Control 2% Decrement Index Sustainable Investment Solutions E S G

2 | RBC CAPITAL MARKETS MSCI USA ESG QUALITY SELECT LOW VOLATILITY 10% RISK CONTROL 2% DECREMENT INDEX OVERVIEW OF RESPONSIBLE & ESG INVESTING Responsible investing is an investment strategy that aligns investors’ financial goals with their personal values. A part of Responsible investing is ESG investing, a strategy that considers Environmental, Social, and Governance factors alongside financial factors in the investment decision-making process.1 ENVIRONMENTAL Climate Change Natural Capital Pollution & Waste Environmental Opportunities SOCIAL Human Capital Product Liability Stakeholder Opposition Social Opportunities GOVERNANCE Corporate Governance Corporate Behavior $8.4 Trillion of responsible investing assets in the US as of 20212 64% of high-net-worth individuals surveyed said they utilize ESG considerations when making investment decisions.3 90% of financial advisors surveyed said their clients had asked them about ESG or responsible investing.3 ESG RATINGS – HELPING INVESTORS IDENTIFY A PORTFOLIO’S ESG RISK MSCI, a leading provider of financial indexes, multi-asset class research, and risk analytics has developed a ratings system that aims to measure a company’s resilience to long-term, financially relevant ESG risks. Companies are rated on a ‘AAA to CCC’ scale according to how well they manage these risks and opportunities relative to their peers. 1 Analysis begins with a deep governance assessment 2 Focus on most relevant ESG factors by industry 3 Focus on risk exposure, not just disclosure 4 Identify leaders and laggards within each industry MSCI ESG RATINGS CCC LAGGARD LEADER AVERAGE B BB BBB A AA AAA
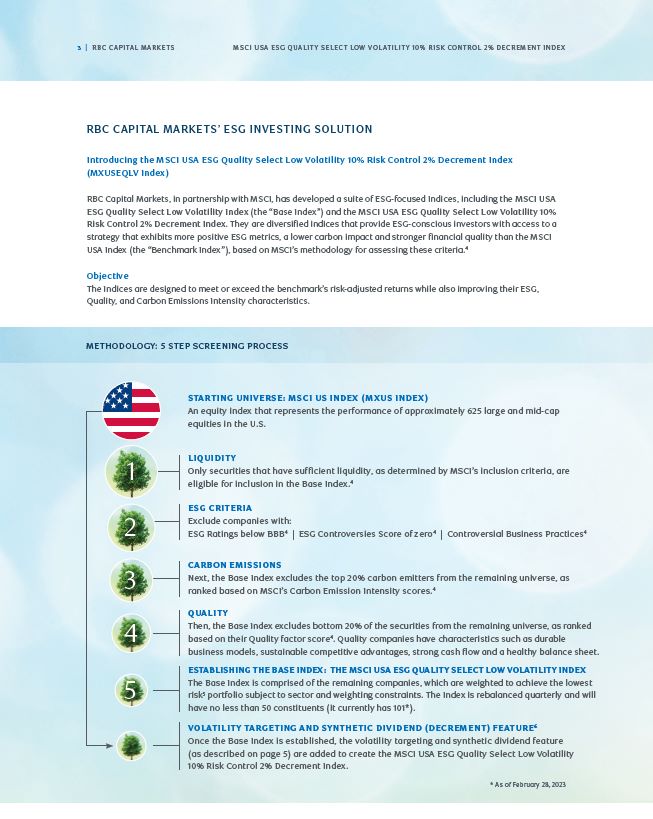
3 | RBC CAPITAL MARKETS MSCI USA ESG QUALITY SELECT LOW VOLATILITY 10% RISK CONTROL 2% DECREMENT INDEX RBC CAPITAL MARKETS’ ESG INVESTING SOLUTION Introducing the MSCI USA ESG Quality Select Low Volatility 10% Risk Control 2% Decrement Index (MXUSEQLV Index) RBC Capital Markets, in partnership with MSCI, has developed a suite of ESG-focused Indices, including the MSCI USA ESG Quality Select Low Volatility Index (the “Base Index”) and the MSCI USA ESG Quality Select Low Volatility 10% Risk Control 2% Decrement Index. They are diversified indices that provide ESG-conscious investors with access to a strategy that exhibits more positive ESG metrics, a lower carbon impact and stronger financial quality than the MSCI USA Index (the “Benchmark Index”), based on MSCI’s methodology for assessing these criteria.4 Objective The Indices are designed to meet or exceed the benchmark’s risk-adjusted returns while also improving their ESG, Quality, and Carbon Emissions Intensity characteristics. 1 2 3 4 5 METHODOLOGY: 5 STEP SCREENING PROCESS LIQUIDITY Only securities that have sufficient liquidity, as determined by MSCI’s inclusion criteria, are eligible for inclusion in the Base Index.4 STARTING UNIVERSE: MSCI US INDEX (MXUS INDEX) An equity index that represents the performance of approximately 625 large and mid-cap equities in the U.S. ESG CRITERIA Exclude companies with: ESG Ratings below BBB4 | ESG Controversies Score of zero4 | Controversial Business Practices4 CARBON EMISSIONS Next, the Base Index excludes the top 20% carbon emitters from the remaining universe, as ranked based on MSCI’s Carbon Emission Intensity scores.4 QUALITY Then, the Base Index excludes bottom 20% of the securities from the remaining universe, as ranked based on their Quality factor score4. Quality companies have characteristics such as durable business models, sustainable competitive advantages, strong cash flow and a healthy balance sheet. ESTABLISHING THE BASE INDEX: THE MSCI USA ESG QUALITY SELECT LOW VOLATILITY INDEX The Base Index is comprised of the remaining companies, which are weighted to achieve the lowest risk5 portfolio subject to sector and weighting constraints. The Index is rebalanced quarterly and will have no less than 50 constituents (it currently has 101*). VOLATILITY TARGETING AND SYNTHETIC DIVIDEND (DECREMENT) FEATURE6 Once the Base Index is established, the volatility targeting and synthetic dividend feature (as described on page 5) are added to create the MSCI USA ESG Quality Select Low Volatility 10% Risk Control 2% Decrement Index. * As of February 28, 2023
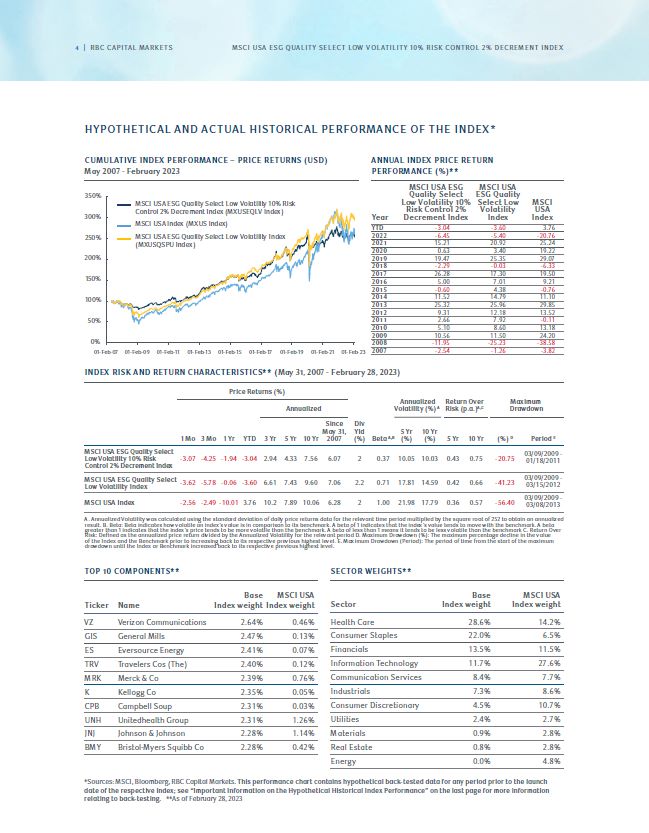
CUMULATIVE INDEX PERFORMANCE – PRICE RETURNS (USD) May 2007 - February 2023 Year MSCI USA ESG Quality Select Low Volatility 10% Risk Control 2% Decrement Index MSCI USA ESG Quality Select Low Volatility Index MSCI USA Index YTD -3.04 -3.60 3.76 2022 -6.45 -5.40 -20.76 2021 15.21 20.92 25.24 2020 0.63 3.40 19.22 2019 19.47 25.35 29.07 2018 -2.29 -0.03 -6.33 2017 26.28 17.30 19.50 2016 5.00 7.01 9.21 2015 -0.60 4.38 -0.76 2014 11.52 14.79 11.10 2013 25.32 25.96 29.85 2012 9.31 12.18 13.52 2011 2.66 7.92 -0.11 2010 5.10 8.60 13.18 2009 10.56 11.50 24.20 2008 -11.95 -25.23 -38.58 2007 -2.54 -1.26 -3.82 ANNUAL INDEX PRICE RETURN PERFORMANCE (%)** MSCI USA ESG Quality Select Low Volatility 10% Risk Control 2% Decrement Index (MXUSEQLV Index) MSCI USA Index (MXUS Index) MSCI USA ESG Quality Select Low Volatility Index (MXUSQSPU Index) 250% 300% 350% 200% 150% 100% 50% 0% 01-Feb-07 01-Feb-09 01-Feb-11 01-Feb-13 01-Feb-15 01-Feb-17 01-Feb-19 01-Feb-21 01-Feb-23 INDEX RISK AND RETURN CHARACTERISTICS** (May 31, 2007 - February 28, 2023) Price Returns (%) Annualized Annualized Volatility (%) A Return Over Risk (p.a.)A,C Maximum Drawdown 1 Mo 3 Mo 1 Yr YTD 3 Yr 5 Yr 10 Yr Since May 31, 2007 Div Yld (%) Beta A,B 5 Yr (%) 10 Yr (%) 5 Yr 10 Yr (%) D Period E MSCI USA ESG Quality Select Low Volatility 10% Risk Control 2% Decrement Index -3.07 -4.25 -1.94 -3.04 2.94 4.33 7.56 6.07 2 0.37 10.05 10.03 0.43 0.75 -20.75 03/09/2009 - 01/18/2011 MSCI USA ESG Quality Select Low Volatility Index -3.62 -5.78 -0.06 -3.60 6.61 7.43 9.60 7.06 2.2 0.71 17.81 14.59 0.42 0.66 -41.23 03/09/2009 - 03/15/2012 MSCI USA Index -2.56 -2.49 -10.01 3.76 10.2 7.89 10.06 6.28 2 1.00 21.98 17.79 0.36 0.57 -56.40 03/09/2009 - 03/08/2013 A. Annualized Volatility was calculated using the standard deviation of daily price returns data for the relevant time period multiplied by the square root of 252 to obtain an annualized result. B. Beta: Beta indicates how volatile an index’s value is in comparison to its benchmark. A beta of 1 indicates that the index’s value tends to move with the benchmark. A beta greater than 1 indicates that the index’s price tends to be more volatile than the benchmark. A beta of less than 1 means it tends to be less volatile than the benchmark C. Return Over Risk: Defined as the annualized price return divided by the Annualized Volatility for the relevant period D. Maximum Drawdown (%): The maximum percentage decline in the value of the Index and the Benchmark prior to increasing back to its respective previous highest level. E. Maximum Drawdown (Period): The period of time from the start of the maximum drawdown until the Index or Benchmark increased back to its respective previous highest level. Ticker Name Base Index weight MSCI USA Index weight VZ Verizon Communications 2.64% 0.46% GIS General Mills 2.47% 0.13% ES Eversource Energy 2.41% 0.07% TRV Travelers Cos (The) 2.40% 0.12% MRK Merck & Co 2.39% 0.76% K Kellogg Co 2.35% 0.05% CPB Campbell Soup 2.31% 0.03% UNH Unitedhealth Group 2.31% 1.26% JNJ Johnson & Johnson 2.28% 1.14% BMY Bristol-Myers Squibb Co 2.28% 0.42% TOP 10 COMPONENTS** Sector Base Index weight MSCI USA Index weight Health Care 28.6% 14.2% Consumer Staples 22.0% 6.5% Financials 13.5% 11.5% Information Technology 11.7% 27.6% Communication Services 8.4% 7.7% Industrials 7.3% 8.6% Consumer Discretionary 4.5% 10.7% Utilities 2.4% 2.7% Materials 0.9% 2.8% Real Estate 0.8% 2.8% Energy 0.0% 4.8% SECTOR WEIGHTS** 4 | RBC CAPITAL MARKETS MSCI USA ESG QUALITY SELECT LOW VOLATILITY 10% RISK CONTROL 2% DECREMENT INDEX *Sources: MSCI, Bloomberg, RBC Capital Markets. This performance chart contains hypothetical back-tested data for any period prior to the launch date of the respective index; see “Important Information on the Hypothetical Historical Index Performance” on the last page for more information relating to back-testing. **As of February 28, 2023 HYPOTHETICAL AND ACTUAL HISTORICAL PERFORMANCE OF THE INDEX*
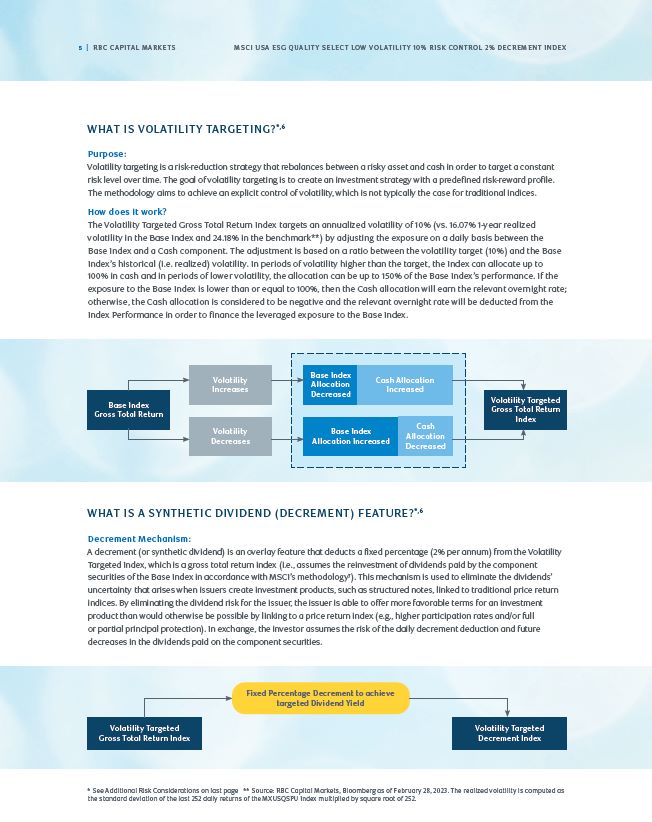
5 | RBC CAPITAL MARKETS MSCI USA ESG QUALITY SELECT LOW VOLATILITY 10% RISK CONTROL 2% DECREMENT INDEX WHAT IS VOLATILITY TARGETING?*,6 Purpose: Volatility targeting is a risk-reduction strategy that rebalances between a risky asset and cash in order to target a constant risk level over time. The goal of volatility targeting is to create an investment strategy with a predefined risk-reward profile. The methodology aims to achieve an explicit control of volatility, which is not typically the case for traditional indices. How does it work? The Volatility Targeted Gross Total Return Index targets an annualized volatility of 10% (vs. 16.07% 1-year realized volatility in the Base Index and 24.18% in the benchmark**) by adjusting the exposure on a daily basis between the Base Index and a Cash component. The adjustment is based on a ratio between the volatility target (10%) and the Base Index’s historical (i.e. realized) volatility. In periods of volatility higher than the target, the Index can allocate up to 100% in cash and in periods of lower volatility, the allocation can be up to 150% of the Base Index’s performance. If the exposure to the Base Index is lower than or equal to 100%, then the Cash allocation will earn the relevant overnight rate; otherwise, the Cash allocation is considered to be negative and the relevant overnight rate will be deducted from the Index Performance in order to finance the leveraged exposure to the Base Index. WHAT IS A SYNTHETIC DIVIDEND (DECREMENT) FEATURE?*,6 Decrement Mechanism: A decrement (or synthetic dividend) is an overlay feature that deducts a fixed percentage (2% per annum) from the Volatility Targeted Index, which is a gross total return index (i.e., assumes the reinvestment of dividends paid by the component securities of the Base Index in accordance with MSCI’s methodology7). This mechanism is used to eliminate the dividends’ uncertainty that arises when issuers create investment products, such as structured notes, linked to traditional price return indices. By eliminating the dividend risk for the issuer, the issuer is able to offer more favorable terms for an investment product than would otherwise be possible by linking to a price return index (e.g., higher participation rates and/or full or partial principal protection). In exchange, the investor assumes the risk of the daily decrement deduction and future decreases in the dividends paid on the component securities. * See Additional Risk Considerations on last page ** Source: RBC Capital Markets, Bloomberg as of February 28, 2023. The realized volatility is computed as the standard deviation of the last 252 daily returns of the MXUSQSPU Index multiplied by square root of 252. Base Index Gross Total Return Volatility Targeted Gross Total Return Index Volatility Increases Base Index Allocation Decreased Cash Allocation Increased Volatility Decreases Base Index Allocation Increased Cash Allocation Decreased Volatility Targeted Gross Total Return Index Fixed Percentage Decrement to achieve targeted Dividend Yield Volatility Targeted Decrement Index
6 | RBC CAPITAL MARKETS MSCI USA ESG QUALITY SELECT LOW VOLATILITY 10% RISK CONTROL 2% DECREMENT INDEX ADDITIONAL RISKS AND CONSIDERATIONS RELATING TO THE INDEX The following is an abbreviated summary of select risks and considerations associated with the Index and does not purport to identify or describe all of the potential risks and considerations. Anyone considering an investment in any financial product referencing the Index should carefully review the relevant offering materials for any such product, along with the Index methodology. There is no assurance that the strategies employed by the Base Index or the Index will be successful and there are risks associated with the strategy. There is no guarantee that the index will achieve its volatility target due to, among other reasons, the time lag of the volatility control adjustments. Upon leveraging or deleveraging, the Index may materially underperform its benchmark that does not apply a volatility targeting strategy due to, among other reasons, allocating up to 100% in cash during periods when an investment solely in the Base Index would have exhibited positive performance or allocating up to 150% to the Base Index during a period in which the Base Index exhibits negative performance. In particular, the Index may perform poorly in periods characterized by short-term volatility. Achieving and/or maintaining the volatility target does not mean the level of Index will not decrease in value. The level of the gross total return may decrease in periods of low volatility and when the Index volatility is at or below the target. The Index is a gross total return index, which means that dividends paid on the component securities of the Base Index are re-invested in accordance with the Index methodology. The synthetic dividend or decrement feature involves deducting a fixed percentage per annum from the daily Index performance, and will therefore adversely affect the performance of the Index. As a result of the decrement feature, the level of the Index may decline even if the component securities appreciate. While the decrement is intended to offset the expected dividend yield of the Base Index and eliminate dividend uncertainty for an issuer of products linked to the Index (thereby enabling the issuer to offer better terms and pricing for such products linked to the Index), the decrement may exceed the yield for the Index. It will be deducted even when the Index is allocated wholly or partially to cash and will be deducted regardless of whether dividends are paid on the component securities. Therefore, the Index will always underperform a comparable gross total return index without a decrement feature and will underperform a price return index unless the dividend yield for the Index were to increase above the fixed percentage decrement, such that the dividend yield fully offset or exceeded the fixed percentage decrement.
Please note the following links are provided for reference only and RBC does not take any responsibility for the content or any statements contained therein. https://www.msci.com/what-is-esg https://trends2022highlights.com/ Federated Investors - Responsible Investing Survey 2020 The definitions and criteria are defined in MSCI methodology available here: https://www.msci.com/eqb/methodology/meth_docs/MSCI_USA_ESG_Quality_Select_Low_ Volatility_Indexes_Methodology.pdf As defined by MSCI in pages 4 and 9 of the Index Methodology available here: https://www.msci.com/eqb/methodology/meth_docs/MSCI_USA_ESG_Quality_Select_Low_ Volatility_Indexes_Methodology.pdf The parameters for this index can be found on page 16 and 17 of the Index Methodology here: https://www.msci.com/eqb/methodology/meth_docs/MSCI_USA_ESG_ Quality_Select_Low_Volatility_Indexes_Methodology.pdf As described in Section 2.2 of the MSCI methodology available here: https://www.msci.com/eqb/methodology/meth_docs/MSCI_January2018_IndexCalcMethodology.pdf. Disclosures: This communication has been prepared by RBC Capital Markets (“RBCCM”), and is not a research report prepared by the RBCCM Research Department. Unless otherwise specified, the views expressed herein may differ from the views of RBCCM’s Research Department and from the views of others within RBCCM. The information in the body of this communication is intended to provide general market commentary, is not intended to provide a sufficient basis for an investment decision and should not be considered a research report. You should assume that trading desks at RBCCM or its affiliates make markets and/or hold positions, and may have conducted underwriting or other investment banking work in any of the securities referenced herein. Information contained herein has been compiled by RBCCM from sources believed to be reliable, without independent investigation. Every province in Canada, state in the U.S., and most countries throughout the world have their own laws regulating the types of securities and other investment products which may be offered to their residents, as well as the process for doing so. As a result, the securities discussed in this communication may not be eligible for sale in some jurisdictions. No matter contained in this communication may be reproduced or copied by any means without the prior consent of RBCCM. RBC Capital Markets is the global brand name for the capital markets business of Royal Bank of Canada and its affiliates. United States: This communication has been approved by RBC Capital Markets, LLC (member FINRA, NYSE, SIPC), which is a U.S. registered broker-dealer and which accepts responsibility for this communication and its dissemination in the United States. Any U.S. recipient of this communication that is not a registered broker-dealer or a bank acting in a broker or dealer capacity and that wishes further information regarding, or to effect any transaction in, any of the securities discussed in this communication, should contact and place orders with RBC Capital Markets, LLC. This communication is not a research report or a product of RBCCM’s Research Department. Canada: RBC Dominion Securities Inc. (member IIROC and CIPF). France: RBC Paris Branch, RBC Capital Markets (Europe) GmbH Paris Branch are regulated by the Autorité de Contrôle Prudentiel et de Résolution and the Autorité des Marchés Financiers. Germany: This publication has been approved by RBC Capital Markets (Europe) GmbH, which is a company authorized by BaFin. United Kingdom: This publication has been approved by RBC Europe Limited, which is authorized by the Prudential Regulation Authority (“PRA”) and regulated by the Financial Conduct Authority and PRA. Hong Kong: Royal Bank of Canada, Hong Kong (regulated by HKMA and SFC). Australia: Royal Bank of Canada, Sydney Branch (regulated by the Australian Securities & Investments Commission and the Australian Prudential Regulation Authority; AFSL 246521; ABN 86 076 940 880). This document is distributed only to persons who satisfy the definition of wholesale client for the purposes of the Corporations Act 2001 and not intended for distribution to retail clients. Japan: Securities business (as defined under the Financial Instruments and Exchange Law) in Japan will be carried out by RBC Capital Markets (Japan) Ltd. in compliance with all applicable laws and regulations. RBC Capital Markets (Japan) Ltd. is a Financial Instrument Dealer registered with the Kanto Financial Bureau (Kinsho #203) and a member of Japan Securities Dealers Association (“JSDA”) and the Financial Futures Association of Japan (“FFAJ”). Banking business (as defined under the Banking Law) in Japan will be carried out by Royal Bank of Canada, Tokyo Branch in compliance with applicable laws and regulations. Singapore: Royal Bank of Canada, Singapore Branch (regulated by the Monetary Authority of Singapore). ® Registered trademark of Royal Bank of Canada. Used under license. © 2023. All rights reserved. Royal Bank of Canada has filed a registration statement (including a prospectus) with the SEC for the offerings to which this document relates. Before you invest, you should read those documents and the other documents relating to these offerings that Royal Bank of Canada has filed with the SEC for more complete information about us and these offerings. You may obtain these documents without cost by visiting EDGAR on the SEC website at HYPERLINK “http://www.sec.gov” www.sec.gov. Alternatively, Royal Bank of Canada, any agent or any dealer participating in this offering will arrange to send you the prospectus and any related supplements if you so request by calling toll free at 1-877-688-2301. IMPORTANT INFORMATION ABOUT THE HYPOTHETICAL HISTORICAL PERFORMANCE OF THE INDEX The MSCI USA ESG Quality Select Low Volatility 10% Risk Control 2% Decrement Index and the MSCI USA ESG Quality Select Low Volatility Index (the “Base Index”) were each launched on March 3, 2023. Accordingly, all of the information about the performance of each index prior to its respective launch date is based on hypothetical back-tested information. There are differences between the current index methodology described herein and the index methodology that was applied to generate the hypothetical and actual historical performance data. For example, (i) the carbon emissions screening was not applied prior to December 1, 2010 due to the unavailability of the necessary carbon data and (ii) the controversial business practices screen was added to the index methodology for the Base Index and applied starting on September 1, 2020. Therefore, each index may have been comprised of different components and performed differently than it would have if the current index methodology was applied for the full duration of the hypothetical historical and historical period. The hypothetical performance of each index is based on criteria that have been applied retroactively with the benefit of hindsight; these criteria cannot account for all financial risk that may affect the actual performance of the index in the future. The future performance of each index may vary significantly from the hypothetical performance data in this document. In addition, please note that the back-tested performance of each index set forth in this document does not reflect the deduction of any fees and charges that would be applicable to a financial instrument that references the index. For the full Index methodology, please visit the following link: https://www.msci.com/eqb/methodology/meth_docs/MSCI_USA_ESG_Quality_Select_Low_Volatility_Indexes_Methodology.pdf ALTHOUGH MSCI SHALL OBTAIN INFORMATION FOR INCLUSION IN OR FOR USE IN THE CALCULATION OF THE MSCI INDEXES FROM SOURCES WHICH MSCI CONSIDERS RELIABLE, NEITHER MSCI, ANY OF ITS AFFILIATES NOR ANY OTHER PARTY INVOLVED IN, OR RELATED TO MAKING OR COMPILING ANY MSCI INDEX WARRANTS OR GUARANTEES THE ORIGINALITY, ACCURACY AND/OR THE COMPLETENESS OF ANY MSCI INDEX OR ANY DATA INCLUDED THEREIN. NEITHER MSCI, ANY OF ITS AFFILIATES NOR ANY OTHER PARTY INVOLVED IN, OR RELATED TO, MAKING OR COMPILING ANY MSCI INDEX MAKES ANY WARRANTY, EXPRESS OR IMPLIED, AS TO RESULTS TO BE OBTAINED BY LICENSEE, LICENSEE’S CUSTOMERS OR COUNTERPARTIES, ISSUERS OF THE FINANCIAL SECURITIES, OWNERS OF THE FINANCIAL SECURITIES, OR ANY OTHER PERSON OR ENTITY, FROM THE USE OF ANY MSCI INDEX OR ANY DATA INCLUDED THEREIN IN CONNECTION WITH THE RIGHTS LICENSED HEREUNDER OR FOR ANY OTHER USE. NEITHER MSCI, ANY OF ITS AFFILIATES NOR ANY OTHER PARTY INVOLVED IN, OR RELATED TO, MAKING OR COMPILING ANY MSCI INDEX SHALL HAVE ANY LIABILITY FOR ANY ERRORS, OMISSIONS OR INTERRUPTIONS OF OR IN CONNECTION WITH ANY MSCI INDEX OR ANY DATA INCLUDED THEREIN. FURTHER, NEITHER MSCI, ANY OF ITS AFFILIATES NOR ANY OTHER PARTY INVOLVED IN, OR RELATED TO, MAKING OR COMPILING ANY MSCI INDEX MAKES ANY EXPRESS OR IMPLIED WARRANTIES OF ANY KIND, AND MSCI, ANY OF ITS AFFILIATES AND ANY OTHER PARTY INVOLVED IN, OR RELATED TO MAKING OR COMPILING ANY MSCI INDEX HEREBY EXPRESSLY DISCLAIM ALL WARRANTIES OF MERCHANTABILITY OR FITNESS FOR A PARTICULAR PURPOSE, WITH RESPECT TO ANY MSCI INDEX AND ANY DATA INCLUDED THEREIN. WITHOUT LIMITING ANY OF THE FOREGOING, IN NO EVENT SHALL MSCI, ANY OF ITS AFFILIATES OR ANY OTHER PARTY INVOLVED IN, OR RELATED TO, MAKING OR COMPILING ANY MSCI INDEX HAVE ANY LIABILITY FOR ANY DIRECT, INDIRECT, SPECIAL, PUNITIVE, CONSEQUENTIAL OR ANY OTHER DAMAGES (INCLUDING LOST PROFITS) EVEN IF NOTIFIED OF THE POSSIBILITY OF SUCH DAMAGES. The MSCI indexes are the exclusive property of MSCI Inc. (“MSCI”). MSCI and the MSCI index names are service mark(s) of MSCI or its affiliates and have been licensed for use for certain purposes by Royal Bank of Canada. The financial securities (if any) referred to herein are not sponsored, endorsed, or promoted by MSCI, and MSCI bears no liability with respect to any such financial securities. The prospectus for any such financial securities contains a more detailed description of the limited relationship MSCI has with Royal Bank of Canada and the related financial securities. No purchaser, seller or holder of any product referencing an MSCI index, or any other person or entity, should use or refer to any MSCI trade name, trademark or service mark to sponsor, endorse, market or promote such product without first contacting MSCI to determine whether MSCI’s permission is required. Under no circumstances may any person or entity claim any affiliation with MSCI without the prior written permission of MSCI. GEQ_Multipager_03.23 rbccm.com/en/insights/esg.page