Table of Contents
Exhibit 2
DISCUSSION
AND ANALYSIS
Management’s Discussion and Analysis (MD&A) is provided to enable a reader to assess our results of operations and financial condition for the fiscal year ended October 31, 2013, compared to the preceding two years. This MD&A should be read in conjunction with our 2013 Annual Consolidated Financial Statements and related notes and is dated December 4, 2013. All amounts are in Canadian dollars, unless otherwise specified, and are based on financial statements prepared in accordance with International Financial Reporting Standards (IFRS) as issued by the International Accounting Standards Board (IASB), unless otherwise noted.
Additional information about us, including our 2013 Annual Information Form, is available free of charge on our website at rbc.com/investorrelations, on the Canadian Securities Administrators’ website at sedar.com and on the EDGAR section of the United States (U.S.) Securities and Exchange Commission’s (SEC) website at sec.gov.
|
| 11 | ||||
| 11 | ||||
| 12 | ||||
| 12 | ||||
| 12 | ||||
| 14 | ||||
| 14 | ||||
| 14 | ||||
| 18 | ||||
| 18 | ||||
| 18 | ||||
| 19 | ||||
| 21 | ||||
| 26 | ||||
| 29 | ||||
| 32 |
| 33 | ||||
| 36 | ||||
| 37 | ||||
| 37 | ||||
| 38 | ||||
| 39 | ||||
| 40 | ||||
| 40 | ||||
| 41 | ||||
| 44 | ||||
| 44 | ||||
| 44 | ||||
| 44 | ||||
| 46 | ||||
| 50 | ||||
| 58 |
| 60 | ||||
| 64 | ||||
| 73 | ||||
| 73 | ||||
| 74 | ||||
| 74 | ||||
| 74 | ||||
| 74 | ||||
| 74 | ||||
| 76 | ||||
| 84 | ||||
| 84 | ||||
| 85 | ||||
| 90 | ||||
| 91 |
 See our Glossary for definitions of terms used throughout this document
Caution regarding forward-looking statements
From time to time, we make written or oral forward-looking statements within the meaning of certain securities laws, including the “safe harbour” provisions of theUnited States Private Securities Litigation Reform Act of 1995 and any applicable Canadian securities legislation. We may make forward-looking statements in this 2013 Annual Report, in other filings with Canadian regulators or the SEC, in other reports to shareholders and in other communications. Forward-looking statements in this document include, but are not limited to, statements relating to our financial performance objectives, vision and strategic goals, the economic and market review and outlook for Canadian, U.S., European and global economies, the regulatory environment in which we operate, the outlook and priorities for each of our business segments, and the risk environment including our liquidity and funding management. The forward-looking information contained in this document is presented for the purpose of assisting the holders of our securities and financial analysts in understanding our financial position and results of operations as at and for the periods ended on the dates presented and our financial performance objectives, vision and strategic goals, and may not be appropriate for other purposes. Forward-looking statements are typically identified by words such as “believe”, “expect”, “foresee”, “forecast”, “anticipate”, “intend”, “estimate”, “goal”, “plan” and “project” and similar expressions of future or conditional verbs such as “will”, “may”, “should”, “could” or “would”.
By their very nature, forward-looking statements require us to make assumptions and are subject to inherent risks and uncertainties, which give rise to the possibility that our predictions, forecasts, projections, expectations or conclusions will not prove to be accurate, that our assumptions may not be correct and that our financial performance objectives, vision and strategic goals will not be achieved. We caution readers not to place undue reliance on these statements as a number of risk factors could cause our actual results to differ materially from the expectations expressed in such forward-looking statements. These factors – many of which are beyond our control and the effects of which can be difficult to predict – include: credit, market, liquidity and funding, insurance, regulatory compliance, operational, strategic, reputation and competitive risks and other risks discussed in the Risk management and Overview of other risks sections; the impact of regulatory reforms, including relating to the Basel Committee on Banking Supervision’s (BCBS) global standards for capital and liquidity reform, theDodd-Frank Wall Street Reform and Consumer Protection Actand the regulations issued and to be issued thereunder, over-the-counter derivatives reform, the payments system in Canada, the U.S.Foreign Account Tax Compliance Act (FATCA), and regulatory reforms in the United Kingdom (U.K.) and Europe; the high levels of Canadian household debt; cybersecurity; the business and economic conditions in Canada, the U.S. and certain other countries in which we operate; the effects of changes in government fiscal, monetary and other policies; our ability to attract and retain employees; the accuracy and completeness of information concerning our clients and counterparties; the development and integration of our distribution networks; model, information technology and social media risk; and the impact of environmental issues.
We caution that the foregoing list of risk factors is not exhaustive and other factors could also adversely affect our results. When relying on our forward-looking statements to make decisions with respect to us, investors and others should carefully consider the foregoing factors and other uncertainties and potential events. Material economic assumptions underlying the forward looking statements contained in this 2013 Annual Report are set out in the Overview and outlook section and for each business segment under the heading Outlook and priorities. Except as required by law, we do not undertake to update any forward-looking statement, whether written or oral, that may be made from time to time by us or on our behalf.
Additional information about these and other factors can be found in the Risk management and Overview of other risks sections.
Information contained in or otherwise accessible through the websites mentioned does not form part of this report. All references in this report to websites are inactive textual references and are for your information only.
10 Royal Bank of Canada: Annual Report 2013 Management’s Discussion and Analysis
Table of Contents
|
| (1) | Average amounts are calculated using methods intended to approximate the average of the daily balances for the period. This includes ROE and Average common equity. For further details, refer to the Key performance and non-GAAP measures section. |
| (2) | These measures may not have a standardized meaning under generally accepted accounting principles (GAAP) and may not be comparable to similar measures disclosed by other financial institutions. For further details, refer to the Key performance and non-GAAP measures section. |
| (3) | Effective the first quarter of 2013, we calculate capital ratios and Assets-to-capital multiple using the Basel III framework. The capital ratios are calculated on the “all-in” basis. The prior periods’ capital ratios and Assets-to-capital multiple were calculated using the Basel II framework. Basel III and Basel II are not directly comparable. Capital ratios and multiples for 2011 comparative amounts in the MD&A were determined under Canadian GAAP. The CET1 ratio is a new regulatory measure under the Basel III framework. The CET1 ratio is not applicable (n.a.) for prior periods as Basel III was adopted prospectively, effective the first quarter of 2013. For further details, refer to the Capital management section. |
| (4) | Effective the first quarter of 2013, Assets-to-capital multiple is calculated on a transitional basis as per the Office of the Superintendent of Financial Institutions (OSFI) Capital Adequacy Requirements (CAR) Guideline. |
| (5) | Includes AUA from Investor Services and $32.6 billion (2012 – $38.4 billion, 2011 – $36.0 billion) of securitized mortgages and credit card loans. |
| (6) | Defined as dividends per common share divided by the average of the high and low share price in the relevant period. |
| (7) | Average amounts are calculated using month-end spot rates for the period. |
| n.m. | not meaningful |
Management’s Discussion and Analysis Royal Bank of Canada: Annual Report 2013 11
Table of Contents
|
Royal Bank of Canada (RY on TSX and NYSE) is Canada’s largest bank as measured by assets and market capitalization, and is among the largest banks in the world, based on market capitalization. We are one of North America’s leading diversified financial services companies, and provide personal and commercial banking, wealth management services, insurance, investor services and capital markets products and services on a global basis. We employ approximately 79,000 full- and part-time employees who serve more than 15 million personal, business, public sector and institutional clients through offices in Canada, the U.S. and 44 other countries. For more information, please visit rbc.com.
Our business segments are described below.
Personal & Commercial Banking comprises our personal and business banking operations, as well as certain investment businesses in Canada, the Caribbean and the U.S.
Wealth Management serves affluent, high net worth and ultra-high net worth clients from our offices in key financial centres mainly in Canada, the U.S., the U.K., continental Europe, and Asia with a comprehensive suite of investment, trust, banking, credit and other wealth management solutions. We also provide asset management products and services directly to institutional and individual clients as well as through RBC distribution channels and third-party distributors.
Insurance offers insurance products and services through our proprietary distribution channels, comprised of the field sales force which includes retail insurance branches, our field sales representatives, call centres and online, as well as through independent insurance advisors and affinity relationships in Canada. Outside North America, we operate in reinsurance markets globally.
Investor & Treasury Services serves the needs of institutional investing clients by providing custodial asset servicing, advisory, financing and other services to safeguard assets, maximize liquidity and manage risk in multiple jurisdictions around the world. We also provide funding and liquidity management for the enterprise.
Capital Markets provides public and private companies, institutional investors, governments and central banks with a wide range of products and services. In North America, we offer a full suite of products and services which include corporate and investment banking, equity and debt origination and distribution, and structuring and trading. Outside North America, we offer a diversified set of capabilities in our key sectors of expertise such as energy, mining and infrastructure.
Our business segments are supported by Corporate Support, which consists of Technology & Operations and Functions. Technology & Operations provides the technological and operational foundation required to effectively deliver products and services to our clients, while Functions includes our finance, human resources, risk management, internal audit and other functional groups.
The following chart presents our business segments and respective lines of business:
ROYAL BANK OF CANADA
|
| Personal & Commercial Banking | Wealth Management | Insurance | Investor & Treasury Services | Capital Markets | ||||||||||||
¡ Canadian Banking ¡ Caribbean & | ¡ Canadian Wealth Management ¡ U.S. & International Wealth Management ¡ Global Asset Management | ¡ Canadian Insurance ¡ International Insurance | ¡ Corporate and Investment Banking ¡ Global Markets ¡ Other |
| Corporate Support | ||
| ¡ Technology & Operations | ¡ Functions | |
|
Our business strategies and actions are guided by our vision of“Always earning the right to be our clients’ first choice.” Our strategic goals are:
| • | In Canada, to be the undisputed leader in financial services; |
| • | Globally, to be a leading provider of capital markets, investor, and wealth management solutions; and |
| • | In targeted markets, to be a leading provider of select financial services complementary to our core strengths. |
For our progress in 2013 against our business strategies and strategic goals, refer to the Business segment results section.
Overview and outlook
|
Economic and market review and outlook – data as at December 4, 2013
Canada
The Canadian economy is expected to grow at an estimated rate of 1.7% during calendar 2013, which is below our estimate of 2.4% as at November 28, 2012. Growth continues to be driven by consumer spending and business investment, moderated by weak net exports. The unemployment rate decreased to 6.9% in October 2013, supported by improvement during the year in labour markets. Housing market activity continues to benefit from these positive employment trends and the continuing low interest rate environment. Although the Canadian economy is growing at a moderate pace, concerns about the export outlook and continued low inflation led the Bank of Canada (BoC) to maintain its overnight rate at 1% in October 2013.
In calendar 2014, we expect the Canadian economy to grow at a rate of 2.6%, driven by solid consumer and investment spending and an improvement in global demand for exports. Given the ongoing low inflation environment and the factors restraining the growth of global demand for Canadian exports, we do not expect the BoC to change its overnight rate from the current 1% until at least the second quarter of 2015.
12 Royal Bank of Canada: Annual Report 2013 Management’s Discussion and Analysis
Table of Contents
U.S.
We expect the U.S. economy to grow at an estimated rate of 1.7% during calendar 2013, below our estimate of 2.3% as at November 28, 2012. Moderate consumer spending and the improvement in the housing market more than offset a decline in government spending, and continue to drive moderate economic growth. The impact of the October 2013 federal government partial shutdown on the economy is not expected to be significant. Business investment continues to recover, and the unemployment rate improved to 7.3% in October 2013. In order to provide stimulus to the economy, the Federal Reserve (Fed) is maintaining interest rates at low levels, and maintained the size of its monthly asset purchases, despite market expectations of a reduction in the program in 2013.
In calendar 2014, we expect the U.S. economy to grow at a rate of 2.7%, driven by solid consumer spending and housing market activity as well as stronger business investment. The impact on consumer confidence of a failure by the government to complete debt negotiations could reduce spending activity in the near term. We expect the Fed to reduce its monthly asset purchases starting in March 2014 and cease making purchases by the end of 2014 as labour market conditions and the inflation rate approach the Fed’s targeted levels.
Europe
The Eurozone economy is expected to contract at an estimated rate of (0.4%) during calendar 2013, below our estimate of growth of 0.1% as at November 28, 2012. The economy emerged from recession in the second quarter of 2013, but continues to show the effects of fiscal austerity measures and limited access to funding. The unemployment rate stabilized at 12.1% in October, reflecting limited improvement in labour markets. The European Central Bank (ECB) is continuing to provide stimulus to the Eurozone economy and decreased interest rates by 25 bps in May 2013 to 0.50% and by a further 25 bps in November 2013 to 0.25%.
We expect the Eurozone economy to grow at a rate of 1.0% in calendar 2014 as the ECB’s policy actions continue to take effect. We expect the ECB to maintain its current low interest rates throughout 2014 in order to mitigate the impact of continuing fiscal austerity measures and encourage demand for credit.
Financial markets
Capital markets in Canada and the U.S. gradually improved during 2013, resulting from modest economic growth in both countries as well as the maintenance of stimulative monetary policy by the BoC and the Fed. Yields on long-term Canadian and U.S. government bonds rose from May to September 2013, following a period of historical lows as markets anticipated a reduction in the Fed’s monthly asset purchase program. Credit spreads on corporate bonds started to widen in the U.S. in the latter half of 2013 after remaining low for most of the year. Equity markets improved throughout the year, despite some uncertainty regarding the outcome of the U.S. government’s efforts to avoid hitting the debt ceiling. Despite continued uncertainty in global financial markets, there were slight signs of overall improvement in 2013.
The predictions and forecasts in this section are based on information and assumptions from sources we consider reliable. If this information or these assumptions are not accurate, actual economic outcomes may differ materially from the outlook presented in this section.
For details on risk factors from general business and economic conditions that may affect our business and financial results, refer to the Overview of other risks section.
Regulatory environment
We continue to monitor and prepare for regulatory developments by identifying and working to mitigate any potential negative business or economic impact resulting from the global proliferation of regulatory reform initiatives. These developments include prohibitions on proprietary trading and certain investment in hedge and other investment funds (the Volcker Rule) under the U.S.Dodd-Frank Wall Street Reform and Consumer Protection Act (“Dodd-Frank”), the Fed’s proposal for Enhanced Supervision of Foreign Banking Organizations, and other Dodd-Frank initiatives; changes to capital and liquidity rules under the Basel Committee on Banking Supervision’s global standards (Basel III); over-the-counter derivatives reform; the U.S.Foreign Account Tax Compliance Act (FATCA); enhanced risk disclosures recommended by the Enhanced Disclosure Task Force (EDTF) of the Financial Stability Board; and other reforms.
For a discussion on risk factors resulting from these and other regulatory developments which may affect our business and financial results, refer to the Risk management – Top and emerging risks section. For further details on our framework and activities to manage risks, refer to the Risk management and Capital management sections.
Defining and measuring success through Total Shareholder Returns (TSR)
Our focus is to maximize total shareholder returns through the achievement of top quartile performance over the medium term (3-5 years) which we believe reflects a longer term view of strong and consistent financial performance.
Maximizing TSR is aligned with our three strategic goals and we believe represents the most appropriate measure of shareholder value creation. TSR is a concept used to compare the performance of our common shares over a period of time, reflecting share price appreciation and dividends paid to common shareholders. The absolute size of the TSR will vary depending on market conditions, and the relative position reflects the market’s perception of our overall performance relative to our peers over a period of time.
Financial performance objectives are used to measure progress against our medium-term TSR objectives. We review and revise these financial performance objectives as economic, market and regulatory environments change. By focusing on our medium-term objectives in our decision-making, we believe we will be well positioned to provide sustainable earnings growth and solid returns to our common shareholders.
We compared favourably to all our performance objectives in 2013. The following table provides a summary of our performance against our financial performance objectives in 2013:
Financial performance objectives
| Table 2 | |||||||
2013 results | Achieved | |||||||
Diluted EPS growth of 7% + | 12.4% | ü | ||||||
ROE of 18% + | 19.4% | ü | ||||||
Strong capital ratios (CET1) (1) | 9.6% | ü | ||||||
Dividend payout ratio 40% – 50% | 45% | ü | ||||||
| (1) | For further details on the CET1 ratio, refer to the Capital management section. |
For 2014, our financial performance objectives will remain unchanged.
Management’s Discussion and Analysis Royal Bank of Canada: Annual Report 2013 13
Table of Contents
Medium-term objectives – three and five year TSR vs. peer group average
|
|
Table 3
|
| |||||
| three year TSR (1) | five year TSR (1) | |||||||
Royal Bank of Canada | 13% | 13% | ||||||
| Second quartile | Second quartile | |||||||
Peer group average (excluding RBC) (2) | 11% | 9% |
| (1) | The three and the five year average annual TSR are calculated based on our common share price appreciation plus reinvested dividends for the period October 31, 2010 to October 31, 2013 and October 31, 2008 to October 31, 2013 respectively, based on information as disclosed by Bloomberg L.P. |
| (2) | We compare our TSR to that of a global peer group approved by our Board of Directors and consisting of the following 20 financial institutions: seven large Canadian financial institutions in addition to us (Bank of Montreal, Canadian Imperial Bank of Commerce, Manulife Financial Corporation, National Bank of Canada, Power Financial Corporation, The Bank of Nova Scotia and The Toronto-Dominion Bank), five U.S. financial institutions (Bank of America Corporation, JPMorgan Chase & Co., The Bank of New York Mellon Corporation, U.S. Bancorp and Wells Fargo & Company), five European financial institutions (Banco Bilbao Vizcaya Argentaria Group (BBVA), Barclays PLC, BNP Paribas, Credit Suisse Group AG and Deutsche Bank Group) and two Australian financial institutions (National Australia Bank and Westpac Banking Corporation). |
Our three and five year average annual TSR of 13% ranked us in the second quartile for both periods within our global peer group. The three year and five year average annual TSR for our global peer group was 11% and 9% respectively.
Common share and dividend information
|
|
Table 4
|
| |||||||||||||||||
| For the year ended October 31 | 2013 | 2012 | 2011 | 2010 | 2009 | |||||||||||||||
Common share price (RY on TSX) – close, end of period | $ | 70.02 | $ | 56.94 | $ | 48.62 | $ | 54.39 | $ | 54.80 | ||||||||||
Dividends paid per share | 2.46 | 2.22 | 2.04 | 2.00 | 2.00 | |||||||||||||||
Increase (decrease) in share price | 23.0% | 17.1% | (10.6)% | (0.7)% | 17.0% | |||||||||||||||
Total shareholder return | 28.0% | 22.0% | (6.7)% | 2.9% | 22.7% | |||||||||||||||
|
Canadian auto finance and deposit business of Ally Financial Inc. (Ally Canada)
On February 1, 2013, we completed the acquisition of Ally Canada for total cash consideration of $3.7 billion. Ally Canada’s operations provide financial services, including floor plan financing, directly to auto dealers and also offer financing for consumers through dealerships. The acquisition adds scale to our existing consumer and commercial auto financing businesses. For further details, refer to Note 11 of our 2013 Annual Consolidated Financial Statements.
|
|
2013 vs. 2012
Net income of $8,429 million was up $890 million or 12% from a year ago. Diluted earnings per share (EPS) of $5.54 was up $0.61 and return on common equity (ROE) of 19.4% increased from 19.3% in 2012. At October 31, 2013, our Common Equity Tier 1 (CET1) ratio was 9.6%.
Our results reflected strong earnings growth across most of our business segments and were driven by solid volume growth across all our Canadian Banking businesses, partially offset by spread compression, strong growth in our corporate and investment banking businesses, and higher average fee-based client assets in Wealth Management. Favourable income tax adjustments in 2013 of $214 million related to prior years, lower provision for credit losses (PCL) reflecting improved credit quality, improved business performance in Investor Services, and continuing benefits from our ongoing focus on efficiency management activities also contributed to the increase. These factors were partially offset by lower trading revenue in Capital Markets and a charge of $160 million ($118 million after-tax) in Insurance as a result of proposed legislation in Canada, which would affect the policyholders’ tax treatment of certain individual life insurance policies.
In addition, our prior year results were impacted by net favourable adjustments of $60 million after-tax including a release of $128 million of tax uncertainty provisions and interest income of $72 million ($53 million after-tax) related to a refund of taxes paid due to the settlement of several tax matters with the Canada Revenue Agency (CRA), an adjustment related to a change in estimate of mortgage prepayment interest of $125 million ($92 million after-tax), and a loss of $224 million ($213 million after-tax) related to the acquisition of the remaining 50% stake of RBC Dexia Investor Services Limited (RBC Dexia).
Our ROE was up 10 basis points (bps) despite holding higher common equity as a result of Basel lll capital requirements effective the first quarter of 2013, reflecting our solid earnings growth.
For further details on our results and CET1 ratio, refer to the Business segment results and Capital management sections, respectively.
Summary of 2012 vs. 2011
In 2012, net income of $7,539 million was up $1,095 million or 17% from 2011. Diluted EPS of $4.93 was up $0.74 and ROE of 19.3% was up 60 bps.
Effective the third quarter of 2012, we no longer have discontinued operations, as the sale of our U.S. regional retail banking operations closed in the second quarter of 2012. Net loss from discontinued operations in 2012 was $51 million due to operating losses related to our U.S. regional retail banking operations.
Continuing operations
In 2012, net income from continuing operations of $7,590 million was up $620 million or 9% from 2011. The increase in net income was driven by higher fixed income trading and corporate and investment banking results as well as strong volume growth across most of our domestic banking businesses. Lower claims costs in Insurance, higher funding and liquidity trading in Investor & Treasury Services, increased average fee-based client assets in Wealth Management, and continuing benefits from our ongoing focus on efficiency management activities also contributed to the increase. In addition, net income in 2012 was favourably impacted by the release of tax uncertainty provisions and interest income and the adjustment related to a change in estimate of mortgage prepayment interest, as described above. These factors were partially offset by higher costs in support of business growth, increased PCL in Capital Markets and our Caribbean portfolio, and lower transaction
14 Royal Bank of Canada: Annual Report 2013 Management’s Discussion and Analysis
Table of Contents
volumes in Wealth Management. The loss related to the acquisition of the remaining 50% stake of RBC Dexia also negatively impacted net income in 2012.
Discontinued operations
In 2012, net loss from discontinued operations was $51 million as compared to a net loss of $526 million in 2011, primarily reflecting a loss on sale of our U.S. regional retail banking operations in 2011. Net loss from discontinued operations in 2012 included only four months of operating losses related to our U.S. regional retail banking operations compared to a full year of results in 2011.
Estimated impact of foreign currency translation on our consolidated financial results
Our foreign currency-denominated results are impacted by exchange rate fluctuations. Revenue, PCL, insurance policyholder benefits, claims and acquisition expense (PBCAE), non-interest expense and net income denominated in foreign currency are translated at the average rate of exchange for the year.
The estimated impact of foreign currency translation on our results was not significant in 2013 as compared to 2012.
Changes in the relevant average exchange rates that impact our business are shown in the following table:
Table 5
| ||||||||||||
| (Average foreign currency equivalent of C$1.00) (1) | 2013 | 2012 | 2011 | |||||||||
U.S. dollar | 0.977 | 0.997 | 1.015 | |||||||||
British pound | 0.626 | 0.630 | 0.631 | |||||||||
Euro | 0.740 | 0.771 | 0.727 | |||||||||
| (1) | Average amounts are calculated using month-end spot rates for the period. |
Total revenue
Table 6
| ||||||||||||
| (Millions of Canadian dollars) | 2013 | 2012 | 2011 | |||||||||
Interest income | $ | 21,150 | $ | 20,852 | $ | 20,813 | ||||||
Interest expense | 7,899 | 8,354 | 9,456 | |||||||||
Net interest income | $ | 13,251 | $ | 12,498 | $ | 11,357 | ||||||
Investments (1) | $ | 6,408 | $ | 5,375 | $ | 5,305 | ||||||
Insurance (2) | 3,911 | 4,897 | 4,474 | |||||||||
Trading | 867 | 1,298 | 655 | |||||||||
Banking (3) | 4,244 | 3,799 | 3,596 | |||||||||
Underwriting and other advisory | 1,569 | 1,434 | 1,485 | |||||||||
Other (4) | 617 | 471 | 766 | |||||||||
Non-interest income | $ | 17,616 | $ | 17,274 | $ | 16,281 | ||||||
Total revenue | $ | 30,867 | $ | 29,772 | $ | 27,638 | ||||||
Additional trading information | ||||||||||||
Total trading revenue | ||||||||||||
Net interest income | $ | 1,661 | $ | 1,532 | $ | 1,377 | ||||||
Non-interest income | 867 | 1,298 | 655 | |||||||||
Total trading revenue | $ | 2,528 | $ | 2,830 | $ | 2,032 | ||||||
Total trading revenue by product | ||||||||||||
Interest rate and credit | $ | 1,611 | $ | 1,923 | $ | 1,218 | ||||||
Equities | 594 | 516 | 463 | |||||||||
Foreign exchange and commodities | 323 | 391 | 351 | |||||||||
Total trading revenue | $ | 2,528 | $ | 2,830 | $ | 2,032 | ||||||
Trading revenue (teb) by product | ||||||||||||
Interest rate and credit | $ | 1,611 | $ | 1,923 | $ | 1,218 | ||||||
Equities | 972 | 945 | 920 | |||||||||
Foreign exchange and commodities | 323 | 391 | 351 | |||||||||
Total trading revenue (teb) | $ | 2,906 | $ | 3,259 | $ | 2,489 | ||||||
Trading revenue (teb) by product – Capital Markets | ||||||||||||
Interest rate and credit | $ | 1,350 | $ | 1,584 | $ | 968 | ||||||
Equities | 942 | 925 | 906 | |||||||||
Foreign exchange and commodities | 286 | 323 | 289 | |||||||||
Total Capital Markets trading revenue (teb) | $ | 2,578 | $ | 2,832 | $ | 2,163 | ||||||
| (1) | Includes securities brokerage commissions, investment management and custodial fees, and mutual fund revenue. |
| (2) | Includes premiums and investment and fee income. Investment income includes the change in fair value of investments backing policyholder liabilities and is largely offset in PBCAE. |
| (3) | Includes service charges, foreign exchange revenue other than trading, card service revenue and credit fees. |
| (4) | Includes other non-interest income, net gain (loss) on available-for-sale (AFS) securities and share of profit in associates. |
Management’s Discussion and Analysis Royal Bank of Canada: Annual Report 2013 15
Table of Contents
2013 vs. 2012
Total revenue increased $1,095 million or 4% from last year.
Net interest income increased $753 million or 6%, mainly due to solid volume growth across all businesses in Canadian Banking. The inclusion of our acquisition of Ally Canada and strong growth in our lending portfolio in Capital Markets also contributed to the increase. These factors were partially offset by spread compression. In addition, the prior year was favourably impacted by a mortgage prepayment interest adjustment (prepayment adjustment) of $125 million resulting from a change in methodology with respect to the timing of recognition of mortgage prepayment interest, and interest income of $72 million related to a refund of taxes paid of $128 million due to the settlement of several tax matters with the CRA.
Investments revenue increased $1,033 million or 19%, mainly due to higher average fee-based client assets across all businesses in Wealth Management resulting from net sales and capital appreciation, and incremental revenue related to our additional 50% ownership of Investor Services.
Insurance revenue decreased $986 million or 20%, mainly due to a change in fair value of investments backing our policyholder liabilities resulting from an increase in long-term interest rates, largely offset in PBCAE.
Trading revenue in Non-interest income decreased $431 million or 33%. Total trading revenue of $2,528 million, which comprises trading-related revenue recorded in Net interest income and Non-interest income, decreased $302 million, or 11%, mainly due to lower fixed income trading revenue, largely in Europe, as a result of challenging market conditions.
Banking revenue increased $445 million or 12%, mainly due to strong growth in our loan syndication business primarily in the U.S. Higher service fee revenue and higher credit card transaction volumes in Personal & Commercial Banking, and increased foreign exchange revenue in Investor Services primarily driven by higher transaction volumes also contributed to the increase.
Underwriting and other advisory revenue increased $135 million or 9%, mainly due to higher debt origination reflecting solid issuance activity. Higher mergers and acquisitions (M&A) activity reflecting increased mandates mainly in Canada and the U.S. also contributed to the increase.
Other revenue increased $146 million or 31%, mainly due to gains on the disposition of our London Metal Exchange (LME) shares. In addition, the prior year was unfavourably impacted by our proportionate share of a securities exchange and trading loss of $36 million ($26 million after-tax) related to the acquisition of RBC Dexia.
2012 vs. 2011
Total revenue increased $2,134 million or 8% from 2011, mainly due to strong trading revenue reflecting improved market conditions compared to the unfavourable conditions in 2011 and strong growth in lending and increased loan syndication activity in our corporate and investment banking businesses. Strong volume growth across most of our Canadian banking businesses, higher average fee-based client assets in Wealth Management, and incremental revenue related to our additional 50% ownership of Investor Services also contributed to the increase. Volume growth across most insurance products, and the change in fair value of investments backing our policyholder liabilities, which was largely offset in PBCAE, also contributed to the increase. These factors were partially offset by losses compared to gains in 2011 in Other revenue and lower transaction volumes mainly in Wealth Management.
Provision for credit losses
2013 vs. 2012
Total PCL decreased $62 million or 5% from a year ago, mainly reflecting improved credit quality in our Canadian Banking and Caribbean portfolios, partially offset by higher provisions in Capital Markets and Wealth Management.
2012 vs. 2011
Total PCL increased $168 million or 15% as compared to 2011, mainly due to higher provisions related to Capital Markets and our Caribbean portfolios. Higher average loan balances reflecting volume growth in Canadian home equity products also contributed to the increase. These factors were partially offset by lower PCL in our Canadian credit card portfolio.
For further details on PCL, refer to the Credit quality performance section.
Insurance policyholder benefits, claims and acquisition expense
2013 vs. 2012
PBCAE decreased $837 million or 23% from a year ago, mainly due to the change in fair value of investments backing our policyholder liabilities, which was largely offset in insurance revenue. Favourable actuarial adjustments reflecting management actions and assumption changes also contributed to the decrease. These factors were partially offset by the charge of $160 million as a result of proposed legislation in Canada, which would affect the policyholders’ tax treatment of certain individual life insurance policies.
2012 vs. 2011
PBCAE increased $263 million or 8% as compared to 2011, mainly due to the change in fair value of investments backing our policyholder liabilities, largely offset in insurance revenue, and volume growth across most products. These factors were partially offset by lower claims costs in Canadian insurance products and a reduction of policy acquisition cost-related liabilities reflecting changes to our proprietary distribution channel.
16 Royal Bank of Canada: Annual Report 2013 Management’s Discussion and Analysis
Table of Contents
Non-interest expense
|
Table 7
|
| ||||||||||||
| (Millions of Canadian dollars) | 2013 | 2012 | 2011 | |||||||||||
Salaries | $ | 4,665 | $ | 4,313 | $ | 4,074 | ||||||||
Variable compensation | 3,924 | 3,650 | 3,300 | |||||||||||
Benefits and retention compensation | 1,345 | 1,185 | 1,099 | |||||||||||
Share-based compensation | 256 | 139 | 188 | |||||||||||
Human resources | $ | 10,190 | $ | 9,287 | $ | 8,661 | ||||||||
Impairment of goodwill and other intangibles | 10 | 168 | – | |||||||||||
Equipment | 1,135 | 1,020 | 960 | |||||||||||
Occupancy | 1,246 | 1,170 | 1,076 | |||||||||||
Communications | 742 | 764 | 746 | |||||||||||
Professional and other external services | 1,003 | 949 | 958 | |||||||||||
Other expenses | 1,901 | 1,802 | 1,766 | |||||||||||
Non-interest expense | $ | 16,227 | $ | 15,160 | $ | 14,167 | ||||||||
2013 vs. 2012
Non-interest expense increased $1,067 million or 7%, primarily reflecting incremental costs related to our additional 50% ownership of Investor Services and higher variable compensation mainly driven by higher revenue in Wealth Management. The inclusion of our acquisition of Ally Canada, higher costs in support of business growth, and higher litigation provisions and related legal costs in Capital Markets also contributed to the increase. These factors were partially offset by continued benefits from our ongoing focus on efficiency management activities, and lower variable compensation in Capital Markets reflecting a lower compensation to revenue ratio. In addition, the prior year was unfavourably impacted by an impairment loss and other costs of $188 million related to the acquisition of RBC Dexia.
2012 vs. 2011
Non-interest expense increased $993 million or 7% as compared to 2011, primarily due to higher variable compensation, largely driven by improved results in Capital Markets and higher revenue in Wealth Management. Higher costs in support of business and volume growth and the impact of a full quarter of non-interest expense related to our additional 50% ownership of Investor Services also contributed to the increase. In addition, our non-interest expense was negatively impacted by the loss relating to the acquisition of RBC Dexia noted above. The increase in non-interest expense was partially offset by continuing benefits from our efficiency management activities.
Income and other taxes
|
Table 8
|
| ||||||||||
| (Millions of Canadian dollars, except percentage amounts) | 2013 | 2012 | 2011 | |||||||||
Income taxes | $ | 2,188 | $ | 2,100 | $ | 2,010 | ||||||
Other taxes | ||||||||||||
Goods and services sales taxes | $ | 370 | 343 | 338 | ||||||||
Payroll taxes | 384 | 371 | 349 | |||||||||
Capital taxes | 85 | 80 | 75 | |||||||||
Property taxes | 119 | 124 | 107 | |||||||||
Insurance premium taxes | 50 | 50 | 49 | |||||||||
Business taxes | 25 | 21 | 18 | |||||||||
| $ | 1,033 | $ | 989 | $ | 936 | |||||||
Total income and other taxes | $ | 3,221 | $ | 3,089 | $ | 2,946 | ||||||
Net income before income taxes | $ | 10,617 | $ | 9,690 | $ | 8,980 | ||||||
Effective income tax rate | 20.6% | 21.7% | 22.4% | |||||||||
Effective total tax rate(1) | 27.6% | 28.9% | 29.7% | |||||||||
| (1) | Total income and other taxes as a percentage of net income before income taxes and other taxes. |
2013 vs. 2012
Income tax expense increased $88 million or 4% from the prior year, mainly due to higher earnings before income tax. The effective income tax rate of 20.6% decreased 110 bps from 21.7% in the prior year, mainly due to favourable income tax adjustments in 2013 related to prior years. Our prior year results were favourably impacted by the release of $128 million of tax uncertainty provisions and interest income of $72 million ($53 million after-tax) related to a refund of taxes paid due to the settlement of several tax matters with the CRA in 2012.
Other taxes increased $44 million or 4%, mainly due to higher sales taxes and payroll taxes. In addition to the income and other taxes reported in our Consolidated Statements of Income, we recorded income tax recoveries of $352 million, as compared to income taxes of $72 million in 2012, in shareholders’ equity, primarily reflecting foreign currency translation losses from hedging activities.
2012 vs. 2011
Income tax expense increased $90 million or 4% from 2011, mainly due to higher earnings before income taxes. The effective income tax rate of 21.7% decreased 70 bps from 22.4% in 2011, mainly due to a reduction in statutory Canadian corporate income tax rates and the release of the tax uncertainty provisions noted above. These factors were partially offset by a loss related to our acquisition of the remaining 50% stake of RBC Dexia, which was not deductible for tax purposes.
Other taxes increased $53 million or 6% from 2011, mainly due to higher payroll and property taxes.
Management’s Discussion and Analysis Royal Bank of Canada: Annual Report 2013 17
Table of Contents
|
|
|
Table 9
|
| |||||||||||||||||||||||||||||||||||
| 2013 | 2012 | 2011 | ||||||||||||||||||||||||||||||||||||
| (Millions of Canadian dollars, except percentage amounts) | Personal & Commercial Banking | Wealth Management | Insurance | Investor & Treasury Services | Capital Markets (1) | Corporate Support (1) | Total | Total | Total | |||||||||||||||||||||||||||||
Net interest income | $ | 9,435 | $ | 396 | $ | – | $ | 671 | $ | 2,872 | $ | (123 | ) | $ | 13,251 | $ | 12,498 | $ | 11,357 | |||||||||||||||||||
Non-interest income | 3,788 | 5,091 | 3,928 | 1,133 | 3,708 | (32 | ) | 17,616 | 17,274 | 16,281 | ||||||||||||||||||||||||||||
Total revenue | $ | 13,223 | $ | 5,487 | $ | 3,928 | $ | 1,804 | $ | 6,580 | $ | (155 | ) | $ | 30,867 | $ | 29,772 | $ | 27,638 | |||||||||||||||||||
PCL | 997 | 51 | – | – | 188 | 3 | 1,239 | 1,301 | 1,133 | |||||||||||||||||||||||||||||
PBCAE | – | – | 2,784 | – | – | – | 2,784 | 3,621 | 3,358 | |||||||||||||||||||||||||||||
Non-interest expense | 6,240 | 4,201 | 549 | 1,343 | 3,844 | 50 | 16,227 | 15,160 | 14,167 | |||||||||||||||||||||||||||||
Net income before income taxes | $ | 5,986 | $ | 1,235 | $ | 595 | $ | 461 | $ | 2,548 | $ | (208 | ) | $ | 10,617 | $ | 9,690 | $ | 8,980 | |||||||||||||||||||
Income tax | 1,548 | 336 | (2 | ) | 118 | 838 | (650 | ) | 2,188 | 2,100 | 2,010 | |||||||||||||||||||||||||||
Net income from continuing operations | $ | 4,438 | $ | 899 | $ | 597 | $ | 343 | $ | 1,710 | $ | 442 | $ | 8,429 | $ | 7,590 | $ | 6,970 | ||||||||||||||||||||
Loss from discontinued operations | – | – | – | – | – | – | – | (51 | ) | (526 | ) | |||||||||||||||||||||||||||
Net income | $ | 4,438 | $ | 899 | $ | 597 | $ | 343 | $ | 1,710 | $ | 442 | $ | 8,429 | $ | 7,539 | $ | 6,444 | ||||||||||||||||||||
ROE from continuing operations | 31.0% | 16.1% | 41.6% | 16.7% | 14.2% | n.m. | 19.4% | 19.5% | 20.3% | |||||||||||||||||||||||||||||
ROE | 19.4% | 19.3% | 18.7% | |||||||||||||||||||||||||||||||||||
Average assets | $ | 356,000 | $ | 21,600 | $ | 11,900 | $ | 83,100 | $ | 368,300 | $ | 12,300 | $ | 853,200 | $ | 810,600 | $ | 778,900 | ||||||||||||||||||||
| (1) | Net interest income, total revenue and net income before income taxes are presented in Capital Markets on a taxable equivalent basis (tab). The taxable equivalent basis adjustment is eliminated in the Corporate Support segment. For a further discussion, refer to the How we measure and report our business segments section. |
How we measure and report our business segments
|
Our management reporting framework is intended to measure the performance of each business segment as if it were a stand-alone business and reflect the way that the business segment is managed. This approach is intended to ensure that our business segments’ results include all applicable revenue and expenses associated with the conduct of their business and depicts how management views those results. The following highlights the key aspects of how our business segments are managed and reported:
| • | Personal & Commercial Banking reported results include securitized Canadian residential mortgage and credit card loans and related amounts for income and provisions for credit losses on impaired loans. |
| • | Wealth Management reported results also include disclosure in U.S. dollars as we review and manage the results of certain businesses largely in this currency. |
| • | Insurance reported results include the change in fair value of investments mainly backing our Canadian life policyholder liabilities recorded as revenue, which is largely offset in PBCAE. |
| • | Capital Markets results are reported on a taxable equivalent basis (teb), which grosses up net interest income from certain tax-advantaged sources (Canadian taxable corporate dividends) to their effective taxable equivalent value with a corresponding offset recorded in the provision for income taxes. We record the elimination of the teb adjustments in Corporate Support. We believe these adjustments are useful and reflect how Capital Markets manages its business, since it enhances the comparability of revenue and related ratios across taxable revenue and our principal tax-advantaged source of revenue. The use of teb adjustments and measures may not be comparable to similar GAAP measures or similarly adjusted amounts disclosed by other financial institutions. |
| • | Corporate Support results include all enterprise-level activities that are undertaken for the benefit of the organization that are not allocated to our five business segments, including residual asset/liability management results, impact from income tax adjustments, net charges associated with unattributed capital and PCL on loans not yet identified as impaired. |
Key methodologies
The following outlines the key methodologies and assumptions used in our management reporting framework. These are periodically reviewed by management to ensure they remain valid.
Expense allocation
To ensure that our business segments’ results include expenses associated with the conduct of their business, we allocate costs incurred or services provided by Technology & Operations and Functions, which were directly undertaken or provided on the business segments’ behalf. For other costs not directly attributable to our business segments, including overhead costs and other indirect expenses, we use our management reporting framework for allocating these costs to each business segment in a manner that is intended to reflect the underlying benefits.
Capital attribution
Our framework also determines the attribution of capital to our business segments in a manner that is intended to consistently measure and align economic costs with the underlying benefits and risks associated with the activities of each business segment. The amount of capital assigned to each business segment is referred to as attributed capital. Unattributed capital and associated net charges are reported in Corporate Support. For further information, refer to the Capital management section.
Funds transfer pricing
A funds transfer pricing methodology is used to allocate interest income and expense by product to each business segment. This allocation considers the interest rate risk, liquidity and funding risk and regulatory requirements of each of our business segments. We base transfer pricing on external market costs and each business segment fully absorbs the costs of running its business. Our business segments may retain certain interest rate exposures subject to management approval that would be expected in the normal course of operations.
18 Royal Bank of Canada: Annual Report 2013 Management’s Discussion and Analysis
Table of Contents
Net interest margin
We report net interest margin (NIM) for Personal & Commercial Banking and our Canadian banking businesses based on average earning assets which includes only those assets that give rise to net interest income including deposits with other banks, certain securities and loans.
PCL
PCL are recorded to recognize estimated losses on impaired loans, as well as losses that have been incurred but are not yet identified in our loans portfolio. This portfolio includes on-balance sheet exposures, such as loans and acceptances, and off-balance sheet items such as letters of credit, guarantees and unfunded commitments. PCL on impaired loans are included in the results of each business segment to fully reflect the appropriate expenses related to the conduct of each business segment. PCL on loans not yet identified as impaired are included in Corporate Support, as Group Risk Management effectively controls this through its monitoring and oversight of various lending portfolios throughout the enterprise. For details on our accounting policy on Allowance for credit losses, refer to Note 2 of our 2013 Annual Consolidated Financial Statements.
Key performance and non-GAAP measures
|
Performance measures
|
Return on common equity
We measure and evaluate the performance of our consolidated operations and each business segment using a number of financial metrics such as net income and ROE. We use ROE, at both the consolidated and business segment levels, as a measure of return on total capital invested in our business. Management views the business segment ROE measure as a useful measure for supporting investment and resource allocation decisions because it adjusts for certain items that may affect comparability between business segments and certain competitors.
Our consolidated ROE calculation is based on net income available to common shareholders divided by total average common equity for the period. Business segment ROE calculations are based on net income available to common shareholders divided by average attributed capital for the period. For each segment, average attributed capital includes the capital required to underpin various risks as described in the Capital Management section and amounts invested in goodwill and intangibles.
The attribution of capital and risk capital involves the use of assumptions, judgments and methodologies that are regularly reviewed and revised by management as necessary. Changes to such assumptions, judgments and methodologies can have a material effect on the segment ROE information that we report. Other companies that disclose information on similar attributions and related return measures may use different assumptions, judgments and methodologies.
The following table provides a summary of our ROE calculations:
Calculation of ROE
|
|
Table 10
|
| |||||||||||||||||||||||||||||||||
| 2013 | 2012 | 2011 | ||||||||||||||||||||||||||||||||||
| (Millions of Canadian dollars, except percentage amounts) | Personal & Commercial Banking | Wealth Management | Insurance | Investor & Treasury Services | Capital Markets | Corporate Support | Total | Total | Total | |||||||||||||||||||||||||||
Net income available to common shareholders from continuing operations | $ | 4,349 | $ | 866 | $ | 589 | $ | 330 | $ | 1,640 | $ | 304 | $ | 8,078 | $ | 7,235 | $ | 6,611 | ||||||||||||||||||
Loss to common shareholders from discontinued operations | – | (51 | ) | (526 | ) | |||||||||||||||||||||||||||||||
Net income available to common shareholders | $ | 4,349 | $ | 866 | $ | 589 | $ | 330 | $ | 1,640 | $ | 304 | $ | 8,078 | $ | 7,184 | $ | 6,085 | ||||||||||||||||||
Average common equity from continuing operations (1), (2) | $ | 14,050 | $ | 5,400 | $ | 1,400 | $ | 2,000 | $ | 11,500 | $ | 7,300 | $ | 41,650 | $ | 36,750 | $ | 29,800 | ||||||||||||||||||
Average common equity from discontinued operations (1) | – | 400 | 2,800 | |||||||||||||||||||||||||||||||||
Total average common | $ | 14,050 | $ | 5,400 | $ | 1,400 | $ | 2,000 | $ | 11,500 | $ | 7,300 | $ | 41,650 | $ | 37,150 | $ | 32,600 | ||||||||||||||||||
ROE (3) | 31.0% | 16.1% | 41.6% | 16.7% | 14.2% | n.m. | 19.4% | 19.3% | 18.7% | |||||||||||||||||||||||||||
| (1) | Average common equity represent rounded figures. |
| (2) | The amounts for the segments are referred to as attributed capital or economic capital. |
| (3) | Calculated under Basel lll, including comparative periods. ROE is based on actual balances of average common equity before rounding. |
| n.m. | not meaningful |
Embedded value for Insurance operations
Embedded value is a measure of shareholder value embedded in the balance sheet of our Insurance segment, excluding any value from future new sales. We use the change in embedded value between reporting periods as a measure of the value created by the insurance operations during the period.
We define embedded value as the value of equity held in our Insurance segment and the value of in-force business (existing policies). The value of in-force business is calculated as the present value of future expected earnings on in-force business less the present value of capital required to support in-force business. We use discount rates that are consistent with those used by other insurance companies. Required capital uses the capital frameworks in the jurisdictions in which we operate.
Key drivers affecting the change in embedded value from period to period are new sales, investment performance, claims and policyholder experience, change in actuarial assumptions, changes in foreign exchange rates and changes in shareholder equity arising from transfers in capital.
Embedded value does not have a standardized meaning under GAAP and may not be directly comparable to similar measures disclosed by other companies. Given that this measure is specifically used for our Insurance segment and involves the use of discount rates to present value the future expected earnings and capital required for the in-force business, reconciliation to financial statements information is not applicable.
Management’s Discussion and Analysis Royal Bank of Canada: Annual Report 2013 19
Table of Contents
Non-GAAP measures
|
Economic profit
Economic profit is net income excluding the after-tax effect of amortization of other intangibles less a capital charge for use of attributed capital. It measures the return generated by our businesses in excess of our cost of capital, thus enabling users to identify relative contributions to shareholder value. Economic profit is a non-GAAP measure, does not have a standardized meaning under GAAP and may not be comparable to similar measures disclosed by other financial institutions.
The capital charge includes a charge for common equity and preferred shares. We prospectively revised our cost of equity in the first quarter of 2013 to 8.5% from 9.5% in 2012, largely as a result of the continuing low interest rate environment. Effective Q1 2014, our cost of equity will increase to 9.0% due to higher long-term interest rates.
The following table provides a summary of our Economic profit on a continuing basis:
Economic profit from continuing operations
|
|
|
Table 11
|
| ||||||||||||||||||||||||||||||||
| 2013 | 2012 | 2011 | ||||||||||||||||||||||||||||||||||
| (Millions of Canadian dollars) | Personal & Commercial Banking | Wealth Management | Insurance | Investor & Treasury Services | Capital Markets | Corporate Support | Total | Total | Total | |||||||||||||||||||||||||||
Net income from continuing operations | $ | 4,438 | $ | 899 | $ | 597 | $ | 343 | $ | 1,710 | $ | 442 | $ | 8,429 | $ | 7,590 | $ | 6,970 | ||||||||||||||||||
add: Non-controlling interests | (4 | ) | – | – | (1 | ) | – | (93 | ) | (98 | ) | (97 | ) | (101 | ) | |||||||||||||||||||||
After-tax effect of amortization of other intangibles | 26 | 67 | – | 21 | 1 | 2 | 117 | 112 | 123 | |||||||||||||||||||||||||||
Goodwill and intangibles writedown | – | – | – | – | – | – | – | 168 | – | |||||||||||||||||||||||||||
Adjusted net income | $ | 4,460 | $ | 966 | $ | 597 | $ | 363 | $ | 1,711 | $ | 351 | $ | 8,448 | $ | 7,773 | $ | 6,992 | ||||||||||||||||||
less: Capital charge | 1,285 | 492 | 129 | 180 | 1,053 | 653 | 3,792 | 3,744 | 3,213 | |||||||||||||||||||||||||||
Economic profit from continuing operations | $ | 3,175 | $ | 474 | $ | 468 | $ | 183 | $ | 658 | $ | (302 | ) | $ | 4,656 | $ | 4,029 | $ | 3,779 | |||||||||||||||||
Results excluding specified items
Our results include specified items as described below. We believe excluding these specified items from our results is more indicative of our ongoing operating results, which will provide readers with a better understanding of management’s perspective on our performance, and should enhance the comparability of our financial performance for the fiscal year ended October 31, 2013 with the fiscal year ended October 31, 2012. These measures are non-GAAP, do not have a standardized meaning under GAAP and may not be comparable to similar measures disclosed by other financial institutions.
A charge related to proposed legislation in Canada relating to certain individual life insurance policies in Insurance
Our Insurance results were impacted by a charge of $160 million ($118 million after-tax) recorded in the current year, as a result of proposed legislation in Canada, which would affect the policyholders’ tax treatment of certain individual life insurance policies.
The following table provides calculations of our Insurance results excluding this charge:
Insurance
|
| Table 12
|
| |||||||||
| 2013 | ||||||||||||
| (Millions of Canadian dollars, except percentage amounts) | As reported | Charge related to certain individual life insurance policies | Adjusted | |||||||||
Revenue | $ | 3,928 | $ | – | $ | 3,928 | ||||||
PBCAE | 2,784 | (160 | ) | 2,624 | ||||||||
Non-interest expense | 549 | – | 549 | |||||||||
Net income before income taxes | $ | 595 | $ | 160 | $ | 755 | ||||||
Net income | $ | 597 | $ | 118 | $ | 715 | ||||||
Selected balance and other information | ||||||||||||
Net income available to common shareholders | $ | 589 | $ | 118 | $ | 707 | ||||||
Average common equity | 1,400 | – | 1,400 | |||||||||
ROE | 41.6% | – | 49.9% | |||||||||
Acquisition of the remaining 50% stake of RBC Dexia included in Investor & Treasury Services
Our Investor & Treasury Services results were impacted in the prior year by a loss of $224 million ($213 million after-tax) related to our acquisition of the remaining 50% stake of RBC Dexia.
20 Royal Bank of Canada: Annual Report 2013 Management’s Discussion and Analysis
Table of Contents
The following table provides calculations of our Investor & Treasury Services results and measures excluding this specified item:
Investor & Treasury Services
|
|
Table 13
|
| |||||||||||
| 2012 | ||||||||||||||
| (Millions of Canadian dollars, except percentage amounts) | As reported | Loss related to the acquisition of the remaining 50% stake of RBC Dexia (1) | Adjusted | |||||||||||
Net interest income | $ | 668 | $ | – | $ | 668 | ||||||||
Non-interest income | 657 | 36 | 693 | |||||||||||
Total Revenue | $ | 1,325 | 36 | $ | 1,361 | |||||||||
Non-interest expense | 1,134 | (188 | ) | 946 | ||||||||||
Net income before income taxes | $ | 191 | $ | 224 | $ | 415 | ||||||||
Net income | $ | 85 | $ | 213 | $ | 298 | ||||||||
Selected balances and other information | ||||||||||||||
Net income available to common shareholders | $ | 85 | $ | 213 | $ | 298 | ||||||||
Average common equity | 1,700 | 1,700 | ||||||||||||
ROE (2) | 4.3% | 16.9% | ||||||||||||
| (1) | Consisted of an impairment loss of $168 million (before- and after-tax), comprised of a writedown of goodwill and other intangibles, other costs relating to the acquisition of $20 million ($19 million after-tax), and a loss of $36 million ($26 million after-tax), which was our proportionate share of the loss recorded by RBC Dexia from the securities exchange with Dexia Group and trading losses on the sale of a majority of the securities received in the exchange. |
| (2) | Based on actual balances before rounding. |
|
Personal & Commercial Banking is comprised of our personal and business banking operations, as well as our expanded auto financing and certain retail investment businesses, including our online discount brokerage channel, and operates through two business lines: Canadian Banking, and Caribbean & U.S. Banking. We provide services to 13 million individual, business and institutional clients across Canada, the Caribbean and the U.S. In Canada, we provide a broad suite of financial products and services through our extensive branch, automated teller machine (ATM), online and telephone banking networks, as well as through a large number of proprietary sales professionals. In the Caribbean, we offer a broad range of financial products and services to individuals, business clients and public institutions in various markets. In the U.S., we serve the cross-border banking needs of Canadian clients within the U.S. through online channels, as well as the banking product needs of our U.S. wealth management clients.
Our banking-related operations compete in the Canadian financial services industry, which consists of other Schedule I banks, independent trust companies, foreign banks, credit unions, caisses populaires, and auto financing companies. We maintain top rankings in market share in this competitive environment for most retail and business financial product categories, and have the largest branch network, the most ATMs and the largest mobile sales network across Canada. In the Caribbean, our competition includes banks, trust companies and investment management companies serving retail and corporate customers and public institutions. We are the second largest bank as measured by assets in the English Caribbean, with 116 branches in 19 countries and territories. In the U.S., we compete primarily with other Canadian banking institutions with operations in the U.S.
Economic and market review
We continued to see solid volume growth across most of our Canadian banking businesses, reflecting gradual improvements in the Canadian economy and the continuing low interest rate environment. Improved credit loss rates across our portfolios reflected stable and improving labour markets. Our businesses continued to be impacted by spread compression and certain regulatory measures which scaled back the pace of borrowing. In the Caribbean, unfavourable economic conditions continued to negatively impact our results through spread compression and lower loan volumes.
Highlights
| • | We completed the acquisition of Ally Canada on February 1, 2013 and fully integrated it in 2013, adding scale to our existing consumer and commercial auto financing businesses and extending our leadership position in Canadian auto financing. |
| • | We were named “Best Retail Bank in North America” byRetail Banker International for the second consecutive year and we took the top spot in the highly competitive “Innovation in Customer Service” category byRetail Banker International. |
| • | We were named “Best Commercial Bank in Canada” in World Finance’s 2013 Banking Awards with strong leadership position and overall financial strength and stability in Canada. |
| • | We launched a co-branded Target‡ RBC MasterCard‡ to provide clients instant savings at Target stores or earnings towards Target‡ GiftCard Rewards based on purchases made everywhere else. |
| • | We continued to innovate by introducing RBC Secure Cloud, a mobile payments service that allows clients to more safely and securely pay for purchases using their mobile devices. |
| • | In the Caribbean, we continued to focus on improving and sustaining performance through strategic growth, client care, market focus, and sound banking practices across the region in a difficult operating environment. |
Outlook and priorities
Financial conditions in Canada are expected to remain favourable, supported by the continuing low rate environment. We expect continued volume growth across most of our products. However, due to moderating housing activity resulting from regulatory changes and elevated consumer debt levels, growth in our home equity products and personal loans is expected to slow. We anticipate our business lending will remain strong as business investment is expected to improve further, reflecting favourable credit conditions and the continuing low interest rate environment. Spread compression related to low interest rates and the highly competitive environment is expected to continue to put pressure on our net interest margins.
Management’s Discussion and Analysis Royal Bank of Canada: Annual Report 2013 21
Table of Contents
In the Caribbean, challenging market conditions and a slow economic recovery continue to constrain our outlook. Net interest margins will likely remain challenged by strong competition and spread compression. However, efficiency is expected to improve and result in volume growth as well as a reduction in expenses as we leverage our common operating model in our Caribbean platforms.
For further details on our general economic review and outlook, refer to the Economic and market review and outlook section.
Key strategic priorities for 2014
In Canada, our priorities are to continue to:
| • | Provide a superior client experience through relevant and tailored advice in order to achieve industry leading volume growth. |
| • | Leverage our sales capabilities, strategic partnerships and innovative distribution channels to help broaden our client base and strengthen our distribution channels. |
| • | Enhance our services and products in the emerging payments market. |
| • | Streamline our business processes to improve the customer experience and maintain our industry-leading efficiency. |
In the Caribbean and the U.S., we are focused on:
| • | Continuing to integrate our businesses in the Caribbean to reduce costs and enhancing the client experience by simplifying the way we do business, and improving productivity in our banking network. |
| • | Strengthening the cross-border business in the U.S. and continuing to assess the market and our strategic business development options. |
Personal & Commercial Banking
|
|
Table 14
|
| |||||||||
| (Millions of Canadian dollars, except number of and percentage amounts and as otherwise noted) | 2013 | 2012 | 2011 | |||||||||
Net interest income | $ | 9,435 | $ | 9,061 | $ | 8,515 | ||||||
Non-interest income | 3,788 | 3,582 | 3,510 | |||||||||
Total revenue | 13,223 | 12,643 | 12,025 | |||||||||
PCL | 997 | 1,167 | 1,142 | |||||||||
Non-interest expense | 6,240 | 5,932 | 5,682 | |||||||||
Net income before income taxes | 5,986 | 5,544 | 5,201 | |||||||||
Net income | $ | 4,438 | $ | 4,088 | $ | 3,740 | ||||||
Revenue by business | ||||||||||||
Canadian Banking | $ | 12,422 | $ | 11,815 | $ | 11,199 | ||||||
Caribbean & U.S. Banking | 801 | 828 | 826 | |||||||||
Key ratios | ||||||||||||
ROE | 31.0% | 31.5% | 30.9% | |||||||||
NIM (1) | 2.78% | 2.86% | 2.86% | |||||||||
Efficiency ratio (2) | 47.2% | 46.9% | 47.3% | |||||||||
Operating leverage | (0.6)% | 0.7% | n.a. | |||||||||
Selected average balance sheet information | ||||||||||||
Total assets | $ | 356,000 | $ | 331,500 | $ | 310,700 | ||||||
Total earning assets (3) | 338,900 | 316,400 | 297,200 | |||||||||
Loans and acceptances (3) | 337,700 | 315,400 | 294,800 | |||||||||
Deposits | 262,300 | 243,900 | 221,200 | |||||||||
Attributed capital | 14,050 | 12,700 | 11,800 | |||||||||
Other information | ||||||||||||
AUA (4) | $ | 192,200 | $ | 179,200 | $ | 165,900 | ||||||
AUM | 3,400 | 3,100 | 2,700 | |||||||||
Number of employees (FTE) | 37,997 | 38,231 | 38,216 | |||||||||
Effective income tax rate | 25.9% | 26.3% | 28.1% | |||||||||
Credit information | ||||||||||||
Gross impaired loans as a % of average net loans and acceptances | 0.55% | 0.58% | 0.70% | |||||||||
PCL on impaired loans as a % of average net loans and acceptances | 0.30% | 0.37% | 0.39% | |||||||||
| (1) | NIM is calculated as Net interest income divided by Average total earning assets. |
| (2) | Efficiency ratio is calculated as Non-interest expense divided by Total revenue. |
| (3) | Average total earning assets and average loans and acceptances include average securitized residential mortgages and credit card loans for the year of $53.9 billion and $7.2 billion, respectively (2012 – $44.9 billion and $7.3 billion; 2011 – $42.0 billion and $4.0 billion). |
| (4) | AUA includes securitized residential mortgages and credit card loans as at October 31, 2013 of $25.4 billion and $7.2 billion respectively (October 31, 2012 – $31.0 billion and $7.4 billion; October 31, 2011 – $32.1 billion and $3.9 billion). |
| n.a. | not applicable |
Financial performance
2013 vs. 2012
Net income increased $350 million or 9% compared to the prior year, reflecting solid volume growth across all our domestic businesses, improved credit quality in our Canadian and Caribbean portfolios, and the inclusion of our acquisition of Ally Canada. These factors were partially offset by spread compression, and a provision related to post-employment benefits and restructuring charges in the Caribbean of $40 million ($31 million after-tax). The prior year was favourably impacted by a mortgage prepayment interest adjustment (prepayment adjustment) of $125 million ($92 million after-tax) resulting from a change in methodology with respect to the timing of recognition of mortgage prepayment interest.
Total revenue increased $580 million or 5% from the previous year, mainly due to solid volume growth across all businesses in Canada, and the inclusion of our acquisition of Ally Canada, partially offset by spread compression. The prior year was favourably impacted by the prepayment adjustment as noted above.
Net interest margin decreased 8 bps as the prior year was favourably impacted by 4 bps due to the prepayment adjustment noted above. The continuing low interest rate environment and competitive pricing pressures also contributed to the decrease.
PCL decreased $170 million, and the PCL ratio decreased 7 bps, mainly due to lower PCL in both our Canadian and Caribbean portfolios, reflecting improved credit quality. For further details, refer to the Credit quality performance section.
Non-interest expense increased $308 million or 5%, mainly due to the inclusion of our acquisition of Ally Canada, higher costs in support of business growth, including higher staff costs, and higher pension expense. The provision related to post-employment benefits and restructuring charges in the Caribbean also contributed to the increase. These factors were partially offset by continuing benefits from our ongoing focus on efficiency management activities.
Average loans and acceptances increased $22 billion or 7%, mainly due to growth in Canadian home equity products, personal loans, and business loans. Average deposits increased $18 billion or 8%, reflecting solid growth in both business and personal deposits.
22 Royal Bank of Canada: Annual Report 2013 Management’s Discussion and Analysis
Table of Contents
2012 vs. 2011
Net income was up $348 million or 9% from 2011, reflecting strong volume growth across most of our domestic businesses, a lower effective tax rate in Canada and the favourable prepayment adjustment as noted above. These factors were partially offset by continued spread compression in Canada as well as higher PCL in the Caribbean.
Total revenue was up $618 million or 5% from 2011, reflecting strong volume growth in Canada in personal deposits, residential mortgages, business deposits and loans and personal loans. The favourable impact of the prepayment adjustment as well as higher credit card transaction volumes also contributed to the increase.
Net interest margin remained flat as the favourable impact of the prepayment adjustment was largely offset by spread compression reflecting the continuing low interest rate environment.
PCL was up $25 million or 2% from 2011, mainly due to higher provisions in our Caribbean portfolio and higher PCL in our Canadian secured retail and business lending portfolios. These factors were partially offset by lower write-offs related to our Canadian credit card portfolio.
Non-interest expense was up $250 million or 4% from 2011, mainly due to higher costs in support of business growth in Canada. Higher staff costs in the Caribbean and set-up costs in our U.S. cross border banking business also contributed to the increase. These factors were partially offset by continuing benefits from our ongoing focus on efficiency management activities. In addition, our results in 2011 included net stamp tax and accounting adjustments in Caribbean banking, which favourably impacted our results in that year.
Average loans and acceptances increased $21 billion or 7% from 2011, mainly due to continued growth in Canadian home equity and business and personal lending products. Average deposits were up $23 billion or 10% from 2011, primarily in Canada, reflecting solid growth in personal and business deposits.
In Canada, we operate through three business lines: Personal Financial Services, Business Financial Services and Cards and Payments Solutions. The following provides a discussion of our consolidated Canadian Banking results.
Canadian Banking financial highlights
|
|
Table 15
|
| |||||||||||
(Millions of Canadian dollars, except number of and percentage amounts and as otherwise noted) | 2013 | 2012 | 2011 | |||||||||||
Net interest income | $ | 8,874 | $ | 8,483 | $ | 7,960 | ||||||||
Non-interest income | 3,548 | 3,332 | 3,239 | |||||||||||
Total revenue | 12,422 | 11,815 | 11,199 | |||||||||||
PCL | 910 | 1,017 | 1,033 | |||||||||||
Non-interest expense | 5,530 | 5,258 | 5,082 | |||||||||||
Net income before income taxes | 5,982 | 5,540 | 5,084 | |||||||||||
Net income | $ | 4,414 | $ | 4,085 | $ | 3,664 | ||||||||
Revenue by business | ||||||||||||||
Personal Financial Services | $ | 6,948 | $ | 6,591 | $ | 6,192 | ||||||||
Business Financial Services | 2,990 | 2,894 | 2,750 | |||||||||||
Cards and Payment Solutions | 2,484 | 2,330 | 2,257 | |||||||||||
Key ratios | ||||||||||||||
ROE | 38.1% | 39.3% | 38.0% | |||||||||||
NIM (1) | 2.72% | 2.78% | 2.77% | |||||||||||
Efficiency ratio (2) | 44.5% | 44.5% | 45.4% | |||||||||||
Operating leverage | 0.0% | 2.0% | n.a. | |||||||||||
Selected average balance sheet information | ||||||||||||||
Total assets | $ | 338,600 | $ | 315,400 | $ | 296,100 | ||||||||
Total earning assets (3) | 326,600 | 305,300 | 287,200 | |||||||||||
Loans and acceptances (3) | 330,400 | 307,900 | 287,300 | |||||||||||
Deposits | 248,100 | 230,300 | �� | 208,600 | ||||||||||
Attributed capital | 11,400 | 10,200 | 9,450 | |||||||||||
Other information | ||||||||||||||
AUA (4) | 183,600 | 171,100 | 158,000 | |||||||||||
Number of employees (FTE) | 31,956 | 31,787 | 31,607 | |||||||||||
Effective income tax rate | 26.2% | 26.3% | 27.9% | |||||||||||
Credit information | ||||||||||||||
Gross impaired loans as a % of average net loans and acceptances | 0.36% | 0.37% | 0.44% | |||||||||||
PCL on impaired loans as a % of average net loans and acceptances | 0.28% | 0.33% | 0.36% | |||||||||||
| (1) | NIM is calculated as Net interest income divided by Average total earning assets. |
| (2) | Efficiency ratio is calculated as Non-interest expense divided by Total revenue. |
| (3) | Average total earning assets and average loans and acceptances include average securitized residential mortgages and credit card loans for the year of $53.9 billion and $7.2 billion, respectively (2012 – $44.9 billion and $7.3 billion; 2011 – $42.0 billion and $4.0 billion). |
| (4) | AUA includes securitized residential mortgages and credit card loans as at October 31, 2013 of $25.4 billion and $7.2 billion respectively (October 31, 2012 – $31.0 billion and $7.4 billion; October 31, 2011 – $32.1 billion and $3.9 billion). |
| n.a. | not applicable |
Financial performance
2013 vs. 2012
Net income increased $329 million or 8%, compared to the prior year, reflecting solid volume growth across all businesses, improved credit quality, and the contribution of our acquisition of Ally Canada of $65 million, net of integration and intangible amortization costs of $58 million ($43 million after-tax). These factors were partially offset by spread compression. The prior year was favourably impacted by a mortgage prepayment adjustment(prepayment adjustment) of $125 million ($92 million after-tax) resulting from a change in methodology with respect to the timing of recognition of mortgage prepayment interest.
Management’s Discussion and Analysis Royal Bank of Canada: Annual Report 2013 23
Table of Contents
Total revenue increased $607 million or 5%, from the previous year, primarily due to solid volume growth across all businesses, including higher credit card transaction volumes and higher mutual fund assets. The inclusion of our acquisition of Ally Canada contributed $222 million during the year. These factors were partially offset by spread compression. The prior year results were favourably impacted by the prepayment adjustment as noted above.
Net interest margin decreased 6 bps from the previous year as the prior year was favourably impacted by 4 bps due to the prepayment adjustment noted above. The continuing low interest rate environment and competitive pricing pressures also contributed to the decrease.
PCL decreased $107 million, and the PCL ratio decreased 5 bps, mainly due to improved credit quality in our business, credit card and personal loans portfolios.
Non-interest expense increased $272 million or 5%, largely reflecting the inclusion of our acquisition of Ally Canada which contributed $119 million, including integration and intangible amortization costs of $58 million. Higher costs in support of business growth, including higher staff costs, and higher pension expense also contributed to the increase. These factors were partially offset by continuing benefits from our ongoing focus on efficiency management activities.
Average loans and acceptances increased $23 billion or 7%, mainly due to growth in home equity products, personal loans, and business loans, as well as the inclusion of our acquisition of Ally Canada. Average deposits increased $18 billion or 8%, primarily reflecting growth in business and personal deposits.
2012 vs. 2011
Net income increased $421 million or 11% from 2011, reflecting strong volume growth across most of our businesses, a lower effective tax rate and the favourable prepayment adjustment noted above. These factors were partially offset by spread compression.
Total revenue increased $616 million or 6% from 2011, reflecting strong volume growth in personal deposits, residential mortgages, business deposits and loans and personal loans. The favourable prepayment adjustment and higher credit card transaction volumes also contributed to the increase. These factors were partially offset by spread compression.
Net interest margin increased 1 bp mainly due to the prepayment adjustment and a favourable change in product mix, largely offset by spread compression reflecting the low interest rate environment.
PCL decreased $16 million or 2% from 2011, mainly due to lower write-offs related to our credit card portfolio, partially offset by higher provisions in our secured retail and business lending portfolios.
Non-interest expense increased $176 million or 3% from 2011, mainly due to higher costs in support of business growth, partially offset by continuing benefits from our ongoing focus on efficiency management activities.
Business line review
|
Personal Financial Services
|
Personal Financial Services focuses on meeting the needs of our individual Canadian clients at every stage of their lives through a wide range of financing and investment products and services, including home equity financing, personal lending, deposit accounts, Canadian private banking, indirect lending (including auto financing), mutual funds and self-directed brokerage accounts, and Guaranteed Investment Certificates (GICs). We rank first or second in market share for most personal banking products in Canada and our retail banking network is the largest in Canada with 1,255 branches and 4,622 ATMs.
Financial performance
Total revenue increased $357 million or 5% compared to the prior year, reflecting solid volume growth across all businesses, and the inclusion of our acquisition of Ally Canada. These factors were partially offset by lower spreads. The prior year results were favourably impacted by the prepayment adjustment as noted above.
Average residential mortgages increased by 5% compared to 2012, resulting from the ongoing low interest rate environment and improving housing market activity. Average personal loans grew by 10% from last year largely due to the inclusion of our acquisition of Ally Canada, and solid growth in indirect lending and home equity products. Average personal deposits grew by 7% from last year, as new and existing clients continued to use savings and other deposit products.
Selected highlights
|
|
|
Table 16
|
| ||||||||||
(Millions of Canadian dollars, except number of) | 2013 | 2012 | 2011 | |||||||||||
Total revenue | $ | 6,948 | $ | 6,591 | $ | 6,192 | ||||||||
Other information (average) | ||||||||||||||
Residential mortgages | 178,700 | 170,400 | 159,700 | |||||||||||
Personal loans | 83,800 | 76,300 | 70,500 | |||||||||||
Personal deposits | 93,700 | 87,300 | 75,200 | |||||||||||
Personal GICs | 63,100 | 59,100 | 56,900 | |||||||||||
Branch mutual fund | 95,300 | 82,300 | 74,500 | |||||||||||
AUA – Self-directed | 53,300 | 48,900 | 45,500 | |||||||||||
Number of: | ||||||||||||||
New deposit accounts opened (thousands) | 1,285 | 1,204 | 1,158 | |||||||||||
Branches | 1,255 | 1,239 | 1,214 | |||||||||||
ATM | 4,622 | 4,724 | 4,293 | |||||||||||
| (1) | Represents year-end spot balances. |
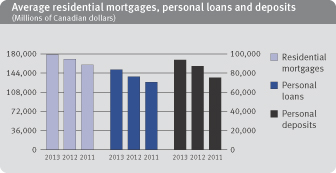
24 Royal Bank of Canada: Annual Report 2013 Management’s Discussion and Analysis
Table of Contents
Business Financial Services
|
Business Financial Services offers a wide range of lending, leasing, deposit, investment, foreign exchange, cash management, auto dealer financing (floorplan), and trade products and services to small, medium-sized and commercial businesses and agriculture and agribusiness clients across Canada. Our business banking network has the largest team of relationship managers and specialists in the industry. Our strong commitment to our clients has resulted in our leading market share in business loans and deposits.
Financial performance
Total revenue increased $96 million or 3% compared to the prior year, primarily due to solid volume growth in business deposits and business loans, and the inclusion of our acquisition of Ally Canada, partially offset by lower spreads.
Average loans and acceptances were up 12% and average business deposits were up 9%, due to the acquisition of new clients, along with increased activity from existing clients.
Selected highlights
|
|
|
Table 17
|
| ||||||||
| (Millions of Canadian dollars) | 2013 | 2012 | 2011 | |||||||||
Total revenue | $ | 2,990 | $ | 2,894 | $ | 2,750 | ||||||
Other information (average) | ||||||||||||
Business loans and acceptances | 54,300 | 48,300 | 44,200 | |||||||||
Business deposits (1) | 91,300 | 83,900 | 76,500 | |||||||||
| (1) | Includes GIC balances. |
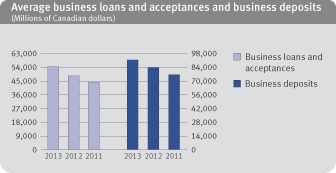
Card and Payment Solutions
|
Cards and Payment Solutions provides a wide array of convenient credit cards with loyalty and reward benefits, and payment products and solutions within Canada. We have over 6.5 million credit card accounts and have approximately 22% market share of Canada’s credit card purchase volume.
In addition, this business line includes our 50% interest in Moneris Solutions, Inc., our merchant card processing joint venture with the Bank of Montreal.
Financial performance
Total revenue increased $154 million or 7%, compared to the prior year, driven by higher credit card transaction volumes, higher balances, and higher spreads, partially offset by higher points costs.
Average credit card balances increased 5% and net purchase volumes increased 8% due to strength in new account acquisitions, driving higher active account growth.
Selected highlights
|
|
|
Table 18
|
| ||||||||
| (Millions of Canadian dollars) | 2013 | 2012 | 2011 | |||||||||
Total revenue | $ | 2,484 | $ | 2,330 | $ | 2,257 | ||||||
Other information | ||||||||||||
Average credit card balances | 13,600 | 12,900 | 12,900 | |||||||||
Net purchase volumes | 76,200 | 70,500 | 64,300 | |||||||||

Caribbean & U.S. Banking
|
Our Caribbean banking business offers a comprehensive suite of banking products and services, as well as international financing and trade promotion services through an extensive branch and ATM network, and online banking.
Our U.S. cross-border banking business serves the needs of our Canadian clients within the U.S. through online channels, and offers a broad range of financial products and services to individuals across all 50 states. As well, we serve the banking product needs of our U.S. wealth management clients.
Management’s Discussion and Analysis Royal Bank of Canada: Annual Report 2013 25
Table of Contents
Financial performance
Total revenue decreased $27 million or 3% from the prior year, due to lower loan balances reflecting continuing unfavourable economic conditions, as well as spread compression in the Caribbean resulting from the low interest rate environment and a change in product mix, partially offset by the favourable impact of the weaker Canadian dollar.
Average loans and acceptances decreased by $200 million or 3%, primarily due to lower loan balances driven by weak economic conditions in the Caribbean. Average deposits increased by $600 million or 4%, mostly due to increased liquidity in the Caribbean leading to higher savings and current account balances.
Selected highlights �� |
|
Table 19
|
| |||||||||
| (Millions of Canadian dollars, except number of and percentage amounts) | 2013 | 2012 | 2011 | |||||||||
Total revenue | $ | 801 | $ | 828 | $ | 826 | ||||||
Other information | ||||||||||||
Net interest margin | 4.57% | 5.21% | 5.52% | |||||||||
Average loans and acceptances | 7,300 | 7,500 | 7,500 | |||||||||
Average deposits | 14,200 | 13,600 | 12,600 | |||||||||
AUA | 8,600 | 8,100 | 7,900 | |||||||||
AUM | 3,400 | 3,100 | 2,700 | |||||||||
Average AUA | 8,300 | 8,000 | 7,500 | |||||||||
Average AUM | 3,300 | 2,800 | 2,600 | |||||||||
Number of: | ||||||||||||
Branches | 116 | 121 | 123 | |||||||||
ATM | 351 | 341 | 333 | |||||||||
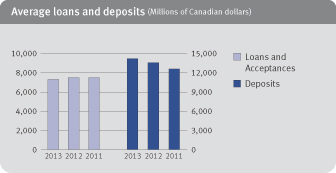
|
Wealth Management comprises Canadian Wealth Management, U.S. & International Wealth Management and Global Asset Management (GAM). We serve affluent, high net worth (HNW) and ultra-high net worth (UHNW) clients in over 180 countries from our offices in key financial centres mainly in Canada, the U.S., the U.K., continental Europe, and Asia with a comprehensive suite of investment, trust, banking, credit and other wealth management solutions. We also provide asset management products and services directly to institutional and individual clients as well as through RBC distribution channels andthird-party distributors. Our competitive environment is discussed below in each business.
Economic and market review
Economic and financial market conditions in Canada and the U.S. gradually improved during the year, although market conditions remained uncertain in some European countries, driving higher average fee-based client assets reflecting net sales and capital appreciation and higher transactions volumes. The continuing low interest rate environment resulted in spread compression and money market fee waivers.
Highlights
| • | Client assets have surpassed $1 trillion, a 12% increase from last year largely reflecting capital appreciation and net sales. We realized strong growth in our credit and deposit-taking businesses, with loans up 22% and deposits up 9% compared to last year. |
| • | In connection with growing our high-performing global asset management business, we maintained our leadership position in retail asset management with a 14.5% market share, continued to leverage BlueBay Asset Management’s (BlueBay) leading fixed income and alternatives expertise to expand our product offering in Canada and the U.S. and deepened our relationships with HNW and UHNW clients globally. |
| • | We continued to execute on our growth strategies to deliver integrated global wealth management advice, solutions and services to HNW and UHNW clients. In 2013 we were recognized as a top 10 global wealth manager, ranking sixth globally by client assets for the third consecutive year in Scorpio Partnership’s 2013 Global Private Banking KPI Benchmark. We received numerous significant industry awards from around the world during the year, reflecting the strength of our global capabilities and commitment to client service. |
| • | In Canada, our full service wealth management business continued to extend its industry lead in HNW share. |
| • | Outside Canada, we have grown client assets by 14% through our continued focus on improving advisor productivity and efficiency in the U.S., and the execution of our long-term growth strategy outside North America. |
Outlook and priorities
We expect that as global market conditions continue to improve, our revenues will grow driven by higher client assets and transaction volumes. The low interest rate environment is expected to continue, and we anticipate ongoing interest rate spread compression and continuing money market fund fee waivers in the U.S. We will continue to leverage our reputation, brand and financial strength to increase our market share of HNW and UHNW globally. For further details on our general economic review and outlook, refer to the Economic and market review and outlook section.
Key strategic priorities for 2014
| • | Leverage and grow our high-performing asset management business. |
| • | Focus growth on the HNW and UHNW client segment in our geographic wealth businesses. |
| • | Leverage the RBC brand and competitive strengths to seamlessly bring the full value of RBC to our clients around the world. |
26 Royal Bank of Canada: Annual Report 2013 Management’s Discussion and Analysis
Table of Contents
Wealth Management
|
|
Table 20
|
| |||||||||||
| (Millions of Canadian dollars, except number of and percentage amounts and as otherwise noted) | 2013 | 2012 | 2011 | |||||||||||
Net interest income | $ | 396 | $ | 393 | $ | 365 | ||||||||
Non-interest income | ||||||||||||||
Fee-based revenue | 3,463 | 2,964 | 2,821 | |||||||||||
Transactional and other revenue | 1,628 | 1,478 | 1,522 | |||||||||||
Total revenue | 5,487 | 4,835 | 4,708 | |||||||||||
PCL | 51 | (1 | ) | – | ||||||||||
Non-interest expense | 4,201 | 3,796 | 3,586 | |||||||||||
Net income before income taxes | 1,235 | 1,040 | 1,122 | |||||||||||
Net income | $ | 899 | $ | 763 | $ | 811 | ||||||||
Revenue by business | ||||||||||||||
Canadian Wealth Management | $ | 1,889 | $ | 1,741 | $ | 1,724 | ||||||||
U.S. & International Wealth Management | 2,225 | 1,977 | 1,948 | |||||||||||
U.S. & International Wealth Management (US$ millions) | 2,174 | 1,973 | 1,980 | |||||||||||
Global Asset Management | 1,373 | 1,117 | 1,036 | |||||||||||
Key ratios | ||||||||||||||
ROE | 16.1% | 14.1% | 15.9% | |||||||||||
Pre-tax margin (1) | 22.5% | 21.5% | 23.8% | |||||||||||
Selected average balance sheet information | ||||||||||||||
Total assets | $ | 21,600 | $ | 20,900 | $ | 20,900 | ||||||||
Loans and acceptances | 12,100 | 9,900 | 8,200 | |||||||||||
Deposits | 31,900 | 29,200 | 28,200 | |||||||||||
Attributed capital | 5,400 | 5,150 | 4,850 | |||||||||||
Other information | ||||||||||||||
Revenue per advisor (000s) (2) | $ | 862 | $ | 793 | $ | 784 | ||||||||
AUA | 639,200 | 577,800 | 527,200 | |||||||||||
AUM | 387,200 | 339,600 | 305,700 | |||||||||||
Average AUA | 609,500 | 554,800 | 532,300 | |||||||||||
Average AUM | 367,600 | 322,500 | 302,800 | |||||||||||
Number of employees (FTE) (3) | 12,462 | 12,139 | 12,063 | |||||||||||
Number of advisors (4) | 4,366 | 4,388 | 4,281 | |||||||||||
| (1) | Pre-tax margin is defined as net income before income taxes divided by Total revenue. |
| (2) | Represents investment advisors and financial consultants of our Canadian and U.S. full-service wealth businesses. |
| (3) | FTE numbers have been restated to account for the transfer of Wealth Management Operations from Corporate Support into Wealth Management during 2013. |
| (4) | Represents client-facing advisors across all our wealth management businesses. |
2013 vs. 2012
Net income increased $136 million or 18% from a year ago, mainly due to higher average fee-based client assets and higher transaction volumes, partially offset by higher PCL.
Total revenue increased $652 million or 13%, mainly due to higher average fee-based client assets across all business lines resulting from net sales and capital appreciation and higher transaction volumes reflecting improved market conditions.
PCL increased $52 million mainly reflecting provisions on a few accounts. For further details, refer to the Credit quality performance section.
Non-interest expense increased $405 million or 11%, mainly due to higher variable compensation driven by higher revenue and increased staff levels and infrastructure investments in support of business growth.
2012 vs. 2011
Net income decreased $48 million or 6% from 2011, mainly due to lower transaction volumes partially offset by higher average fee-based client assets and a lower effective tax rate. In addition, our 2012 results included the unfavourable impact of certain regulatory and legal matters of $29 million ($21 million after-tax) and our 2011 results included favourable accounting and tax adjustments of $39 million after-tax.
Total revenue increased $127 million or 3%, mainly due to higher average fee-based client assets across all business lines resulting from capital appreciation and net sales, and volume growth in loans and deposits. The increase in fair value of our U.S. share-based compensation plan and the favourable impact of the weaker Canadian dollar also contributed to the increase. These factors were partially offset by lower transaction volumes.
Non-interest expense increased $210 million or 6% mainly due to higher staff levels and infrastructure investments in support of business growth. The unfavourable impact of certain regulatory and legal matters noted above and the unfavourable impact of the weaker Canadian dollar also contributed to the increase. In addition, our 2011 results included favourable accounting adjustments of $42 million related to our deferred compensation plan.
Business line review
|
Canadian Wealth Management
|
Canadian Wealth Management includes our full-service Canadian wealth advisory business, which is the largest as measured by AUA, with over 1,500 investment advisors providing comprehensive advice-based financial solutions to affluent, HNW and UHNW clients. Additionally, we provide discretionary investment management and estate and trust services to our clients through approximately 60 investment counsellors and 110 trust professionals in locations across Canada. We also serve international clients through a team of over 35 private bankers in key centres across Canada.
We compete with domestic banks and trust companies, investment counselling firms, bank-owned full service brokerages and boutique brokerages, mutual fund companies and global private banks. In Canada, bank-owned wealth managers continue to be the major players.
Management’s Discussion and Analysis Royal Bank of Canada: Annual Report 2013 27
Table of Contents
Financial performance
Revenue increased $148 million or 9%. The 9% increase in AUA from a year ago was mainly due to higher average fee-based client assets resulting from net sales and capital appreciation, and higher transaction volumes reflecting improved market conditions.
Selected highlights
|
|
Table 21
|
| |||||||||
| (Millions of Canadian dollars) | 2013 | 2012 | 2011 | |||||||||
Total revenue | $ | 1,889 | $ | 1,741 | $ | 1,724 | ||||||
Other information | ||||||||||||
Total loans and acceptances (1) | 2,500 | 2,300 | 1,900 | |||||||||
Total deposits (1) | 13,400 | 11,900 | 11,000 | |||||||||
AUA | 251,400 | 230,400 | 209,700 | |||||||||
AUM | 43,600 | 36,100 | 31,700 | |||||||||
Average AUA | 239,100 | 222,100 | 210,900 | |||||||||
Average AUM | 40,000 | 34,400 | 31,500 | |||||||||
Total assets under fee-based programs | 139,400 | 120,700 | 109,000 | |||||||||
| (1) | Represents an average amount, which is calculated using methods intended to approximate the average of the daily balances for the period. |
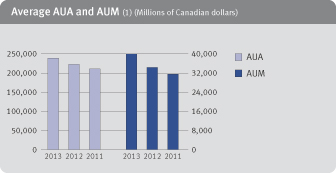
| (1) | Represents average balances, which are more representative of the impact client balances have upon our revenue. |
U.S. & International Wealth Management
|
U.S. Wealth Management includes our private client group, which is the seventh largest full-service wealth advisory firm in the U.S., as measured by number of advisors, with over 1,900 financial advisors. It also serves international clients through a team of more than 80 financial advisors and private bankers in key centres across the U.S. Additionally, our correspondent and advisor services businesses deliver clearing and execution services for small to mid-sized independent broker-dealers and registered investment advisor firms. In the U.S., we operate in a fragmented and extremely competitive industry. There are approximately 4,500 registered broker-dealers in the U.S., comprising independent, regional and global players.
International Wealth Management includes Wealth Management – British Isles & Caribbean, and Wealth Management – Emerging Markets. We provide customized and integrated trust, banking, credit, and investment solutions to HNW and UHNW clients and corporate clients with over 1,500 employees located in 18 countries around the world. Competitors in International Wealth Management comprise global wealth managers, traditional offshore private banks, domestic wealth managers and U.S. investment-led private client operations.
Financial performance
Revenue increased $248 million or 13% from a year ago. In U.S. dollars, revenue increased $201 million or 10%, mainly due to a 7% increase in AUA reflecting capital appreciation and net sales and higher transaction volumes reflecting improved market conditions.
Selected highlights
|
|
|
Table 22
|
| ||||||||
| (Millions of Canadian dollars) | 2013 | 2012 | 2011 | |||||||||
Total revenue | $ | 2,225 | $ | 1,977 | $ | 1,948 | ||||||
Other information(US $ millions) | ||||||||||||
Total revenue | 2,174 | 1,973 | 1,980 | |||||||||
Total loans, guarantees and letters of credit (1) | 12,100 | 10,200 | 8,800 | |||||||||
Total deposits (1) | 18,000 | 17,200 | 17,400 | |||||||||
AUA | 371,900 | 347,800 | 318,600 | |||||||||
AUM | 35,600 | 31,300 | 26,900 | |||||||||
Average AUA | 361,800 | 331,700 | 326,500 | |||||||||
Average AUM | 34,700 | 29,000 | 24,900 | |||||||||
Total assets under fee-based programs (2) | 83,200 | 71,700 | 66,900 | |||||||||
| (1) | Represents an average amount, which is calculated using methods intended to approximate the average of the daily balances for the period. |
| (2) | Represents amounts related to our U.S. wealth management businesses. |
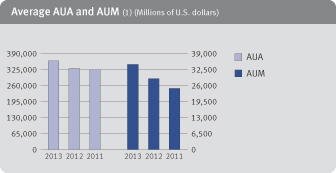
| (1) | Represents average balances, which are more representative of the impact client balances have upon our revenue. |
Global Asset Management
|
Global Asset Management provides global investment management services and solutions for individual and institutional investors in Canada, the U.S., the U.K., Europe and emerging markets. We provide a broad range of investment management services through mutual, pooled and hedge funds, fee-based accounts and separately managed portfolios. We distribute our investment solutions through a broad network of bank branches, our self-directed and full-service wealth advisory businesses, independent third party advisors and private bank, and directly to individual clients. We also provide investment solutions directly to institutional clients, including pension plans, endowments and foundations.
We are the largest retail fund company in Canada as well as a leading institutional asset manager. We face competition in Canada from major banks, insurance companies, asset management organizations and boutique firms. The Canadian fund management industry is large and mature, but still a relatively fragmented industry.
In the U.S., our asset management business offers investment management solutions and services primarily to institutional investors and competes with independent asset management firms, as well as those that are part of national and international banks, insurance companies and boutique asset managers.
28 Royal Bank of Canada: Annual Report 2013 Management’s Discussion and Analysis
Table of Contents
Internationally, through our leading global capabilities of BlueBay and RBC Global Asset Management, we offer investment management solutions for institutions and, through private banks including RBC Wealth Management, to HNW and UHNW investors. We face competition from asset managers that are part of international banks as well as national, regional and boutique asset managers in the geographies where we serve clients.
Financial performance
Revenue increased $256 million or 23% from a year ago, mainly due to a 13% increase in AUM reflecting net sales and capital appreciation and higher semi-annual performance fees.
Selected highlights
|
|
|
Table 23
|
| 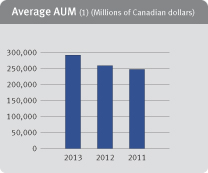
(1) Represents average balances, which are more | |||||||||||
| (Millions of Canadian dollars) | 2013 | 2012 | 2011 | |||||||||||||
Total revenue(1) | $ | 1,373 | $ | 1,117 | $ | 1,036 | ||||||||||
Other information | ||||||||||||||||
Canadian net long-term mutual fund sales | 8,064 | 7,906 | 7,300 | |||||||||||||
Canadian net money | (1,348 | ) | (1,981 | ) | (3,400 | ) | ||||||||||
AUM | 306,500 | 272,200 | 247,200 | |||||||||||||
Average AUM | 292,100 | 259,100 | 246,700 | |||||||||||||
(1) Includes BlueBay results which are reported on a one-month lag. |
| |||||||||||||||
|
Insurance comprises our insurance operations in Canada and globally and operates under two business lines: Canadian Insurance and International Insurance. In Canada, we offer our products and services through our proprietary distribution channels, comprised of the field sales force which includes retail insurance branches, our field sales representatives, call centres as well as online, through independent insurance advisors and affinity relationships. Outside North America, we operate in reinsurance markets globally. Our competitive environment is discussed below in each business.
Economic and market review
Continued low interest rates, uncertain global market conditions and changes in the regulatory environment continued to impact the insurance marketplace resulting in price increases, product refinements and competitors exiting certain lines of business. These factors have impacted our businesses; however, product and pricing actions taken in recent years, conservative investment practices and diversified product lines have mitigated this challenging environment.
Highlights
| • | In Canada, we continued to focus on our newly integrated field sales channel, providing tools, processes and products to further enable the delivery of advice-based solutions, enhance the overall client experience and increase cross-sell opportunities. |
| • | We signed an agreement to transition the sales and distribution support of our travel agency insurance business to Manulife Financial. We remain committed to the direct travel insurance business and continue to look for ways to grow the business by offering our travel insurance solutions through proprietary channels. |
| • | In the fourth quarter, we expanded our products and services based on the unique needs of our clients by launching our new Group Benefit solutions which include health and dental coverage for small and medium businesses. |
| • | Internationally, we continued to work successfully with our existing partners and added new counterparties in order to grow our diversified business, reflecting our strong credit rating and our expertise. |
| • | We were ranked highest overall in customer satisfaction for auto insurance claims experience among insurance companies in Canada, according to the inaugural J.D. Power 2013 Canadian Auto Claims Satisfaction Study. |
| • | On October 22, 2013, the federal government’s Bill C-4 received first reading in the House of Commons. The second reading forBill C-4 was on October 29, 2013. Bill C-4 affects the policyholders’ tax treatment of certain individual life insurance policies. As a result of this substantially enacted legislation, we recognized a charge in PBCAE of $160 million ($118 million after-tax). The charge is based on our current assumptions and will be updated, if necessary, to reflect any changes in policyholder experience or regulations. |
Outlook and priorities
Financial conditions are expected to remain stable and we expect continued growth. We anticipate the product and pricing actions taken during the last few years, including increasing volumes through our growing proprietary channels and the execution of efficiency management initiatives will mitigate economic and regulatory challenges. For further details on our general economic review and outlook, refer to the Economic and market review and outlook section.
Key strategic priorities for 2014
| • | Leverage the field sales force through streamlined processes, tools and products, and continue to deliver a variety of insurance products and services to our clients through advice-based cross-sell strategies. |
| • | Deepen client relationships by continuing to provide our customers with a comprehensive suite of insurance products and services based on their unique family needs. |
| • | Grow our new Group Benefit solutions launched in the latter part of 2013 that include health and dental coverage. |
| • | Continue to simplify the way we do business by streamlining all business processes to ensure that clients find it easy to do business with us, while diligently managing our expenses. |
| • | Pursue select international niche opportunities, within our risk appetite, with the aim of continuing to grow our core reinsurance business. |
Management’s Discussion and Analysis Royal Bank of Canada: Annual Report 2013 29
Table of Contents
Insurance
|
|
Table 24
|
| |||||||||
| (Millions of Canadian dollars, except percentage amounts and as otherwise noted) | 2013 | 2012 | 2011 | |||||||||
Non-interest income | ||||||||||||
Net earned premiums | $ | 3,674 | $ | 3,705 | $ | 3,533 | ||||||
Investment income (1) | (17 | ) | 929 | 703 | ||||||||
Fee income | 271 | 263 | 239 | |||||||||
Total revenue | 3,928 | 4,897 | 4,475 | |||||||||
Insurance policyholder benefits and claims (1) | 2,326 | 3,055 | 2,757 | |||||||||
Insurance policyholder acquisition expense | 458 | 566 | 601 | |||||||||
Non-interest expense | 549 | 515 | 498 | |||||||||
Net income before income taxes | 595 | 761 | 619 | |||||||||
Net income | $ | 597 | $ | 714 | $ | 600 | ||||||
Revenue by business | ||||||||||||
Canadian Insurance | $ | 1,962 | $ | 2,992 | $ | 2,676 | ||||||
International Insurance | 1,966 | 1,905 | 1,799 | |||||||||
Key ratios | ||||||||||||
ROE | 41.6% | 46.8% | 37.6% | |||||||||
Selected average balance sheet information | ||||||||||||
Total assets | $ | 11,900 | $ | 11,500 | $ | 10,500 | ||||||
Attributed capital | 1,400 | 1,500 | 1,550 | |||||||||
Other information | ||||||||||||
Premiums and deposits (2) | $ | 4,924 | $ | 4,849 | $ | 4,701 | ||||||
Canadian Insurance | 2,344 | 2,362 | 2,355 | |||||||||
International Insurance | 2,580 | 2,487 | 2,346 | |||||||||
Insurance claims and policy benefit liabilities | 8,034 | 7,921 | 7,119 | |||||||||
Fair value changes on investments backing policyholder liabilities (1) | (491 | ) | 410 | 214 | ||||||||
Embedded value (3) | 6,302 | 5,861 | 5,327 | |||||||||
AUM | 500 | 300 | 300 | |||||||||
Number of employees (FTE) | 2,965 | 2,744 | 2,859 | |||||||||
| (1) | Investment income can experience volatility arising from fluctuation in the fair value of fair value through profit or loss (FVTPL) assets. The investments which support actuarial liabilities are predominantly fixed income assets designated as at FVTPL. Consequently changes in the fair values of these assets are recorded in investment income in the consolidated statement of income and are largely offset by changes in the fair value of the actuarial liabilities, the impact of which is reflected in insurance policyholder benefits and claims. |
| (2) | Premiums and deposits include premiums on risk-based insurance and annuity products, and individual and group segregated fund deposits, consistent with insurance industry practices. |
| (3) | Embedded value is defined as the sum of value of equity held in our Insurance segment and the value of in-force business (existing policies). For further details, refer to the Key performance and non-GAAP measures section. |
Financial performance
2013 vs. 2012
Net income decreased $117 million or 16%, mainly due to a charge of $160 million ($118 million after-tax) as a result of proposed legislation in Canada, which would affect the policyholders’ tax treatment of certain individual life insurance policies. Excluding this charge, net income of $715 million was relatively flat compared to the prior year as favourable actuarial adjustments and the continuing benefit from our ongoing focus on efficiency management activities were mostly offset by higher net claims costs.
Total revenue decreased $969 million or 20%, mainly due to the change in fair value of investments backing our policyholder liabilities resulting from an increase in long-term interest rates, largely offset in PBCAE.
PBCAE decreased $837 million or 23%, mainly due to the change in fair value of investments backing our policyholder liabilities, which was largely offset in revenue. Favourable actuarial adjustments reflecting management actions and assumption changes also contributed to the decrease. These factors were partially offset by the charge related to certain individual life insurance policies as noted above.
Non-interest expense increased $34 million or 7%, mainly due to the reclassification of certain acquisition expenses from PBCAE and higher costs in support of business growth, partially offset by continuing benefits from our ongoing focus on efficiency management activities.
Premiums and deposits were up $75 million or 2%, mainly reflecting volume growth in International Insurance.
Embedded value increased $441 million or 8%, mainly reflecting growth from operations partially offset by the impact of increased discount rates and the transfer of capital for our insurance businesses through dividend payments. For further details, refer to the Key performance and non-GAAP measures section.
Results excluding the charge related to certain individual life insurance policies are non-GAAP measures. For further details, including a reconciliation, refer to the Key performance and non-GAAP measures section.
2012 vs. 2011
Net income increased $114 million or 19% from 2011, mainly due to lower claims costs in disability, home and auto products and the favourable impact of a $33 million ($24 million after-tax) reduction of policy acquisition cost-related liabilities reflecting changes to our proprietary distribution channel. Higher net investment gains and volume growth in our reinsurance products also contributed to the increase. These factors were partially offset by higher claims costs in our reinsurance products.
Total revenue increased $422 million or 9%, mainly due to volume growth across reinsurance, life and home and auto products and the change in fair value of investments backing our policyholder liabilities, which was largely offset in PBCAE.
30 Royal Bank of Canada: Annual Report 2013 Management’s Discussion and Analysis
Table of Contents
PBCAE increased $263 million or 8%, mainly due to the change in fair value of investments backing our policyholder liabilities, largely offset in revenue, and volume growth across reinsurance, life, home and auto products. These factors were partially offset by lower claims costs in disability, home and auto products and the reduction of policy acquisition cost-related liabilities as noted above.
Non-interest expense increased $17 million or 3%, mainly due to higher costs in support of business growth, partially offset by continuing benefits from our ongoing focus on efficiency management activities.
Business line review
|
Canadian Insurance
|
We offer life, health, property and casualty insurance products as well as wealth accumulation solutions, to individual and group clients across Canada. Our life and health portfolio includes universal life, term life, critical illness, disability, long-term care insurance and group benefits. We offer a wide range of property and casualty products including home, auto and travel insurance. Our travel products include out of province/country medical coverage, trip cancellation insurance and interruption insurance.
In Canada, we compete against over 200 insurance companies, with the majority of the organizations specializing in either life and health, or property and casualty products. We hold a leading market position in disability insurance products, have a significant presence in life and travel products, and have a growing presence in the home, auto and wealth markets.
Financial performance
Total revenue decreased $1,030 million or 34% from last year, mainly due to the change in fair value of investments backing our policyholder liabilities resulting from the increase in long-term interest rates, which was largely offset in PBCAE.
Premiums and deposits decreased $18 million or 1% due to lower volumes in both life and health and travel product lines.
Selected highlights
|
|
|
Table 25
|
| 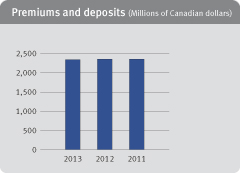 | |||||||||||
| (Millions of Canadian dollars) | 2013 | 2012 | 2011 | |||||||||||||
Total revenue | $ | 1,962 | $ | 2,992 | $ | 2,676 | ||||||||||
Other information | ||||||||||||||||
Premiums and deposits | ||||||||||||||||
Life and health | 1,245 | 1,280 | 1,274 | |||||||||||||
Property and casualty | 942 | 965 | 962 | |||||||||||||
Annuity and segregated fund deposits | 157 | 117 | 119 | |||||||||||||
Fair value changes on | (510 | ) | 408 | 209 | ||||||||||||
International Insurance
|
International Insurance is primarily comprised of our reinsurance businesses which insure risks of other insurance and reinsurance companies. We offer life and health, accident and annuity reinsurance products.
The global reinsurance market is dominated by a few large players, with significant presence in the U.S., U.K. and Eurozone. The reinsurance industry is competitive but barriers to entry remain high.
Financial performance
Total revenue increased $61 million or 3%, mainly due to volume growth in our U.K. annuity and European life products.
Premiums and deposits increased $93 million, or 4% driven by the growth mentioned above.
Selected highlights
|
|
|
Table 26
|
| 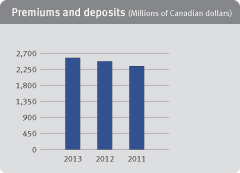
| |||||||||||
| (Millions of Canadian dollars) | 2013 | 2012 | 2011 | |||||||||||||
Total revenue | $ | 1,966 | $ | 1,905 | $ | 1,799 | ||||||||||
Other information | ||||||||||||||||
Premiums and deposits | ||||||||||||||||
Life and health | 2,069 | 1,980 | 1,969 | |||||||||||||
Property and casualty | 50 | 56 | 38 | |||||||||||||
Annuity | 461 | 451 | 339 | |||||||||||||
Management’s Discussion and Analysis Royal Bank of Canada: Annual Report 2013 31
Table of Contents
|
Investor & Treasury Services is a specialist provider of asset servicing, custody, payments, and treasury services for financial institutions and other institutional investors worldwide. We deliver custodial, advisory, financing and other services to safeguard client assets, maximize liquidity, and manage risk across multiple jurisdictions. We also provide funding and liquidity management for RBC. We are a top 10 global custodian by assets under administration with a network of 18 offices across North America, Europe and Asia-Pacific. While we compete against the world’s largest global custodians, we remain a specialist provider and our transaction banking business competes primarily with major Canadian banks.
Economic and market review
The highly competitive environment in the global custody industry continued to pressure our margins. Overall, investor confidence increased as market conditions in Canada and the U.S. gradually improved during 2013, driving higher transaction volumes. Nonetheless, European market conditions in select markets remained uncertain reflecting continued concerns about the European sovereign debt crisis.
Highlights
| • | Our earnings improved with the reorganization and integration efforts over the past year, driven by new client and business mandates and our ongoing focus on cost management activities. |
| • | Following the RBC Dexia acquisition, we continued to integrate our investor services business and implemented key organizational changes that focused on deepening client relationships and cross-selling opportunities. |
| • | In 2013, we were ranked best custodian overall (Global Investor), fund administrator of the year in Canada (Custody Risk Americas Awards) and top overall for customer service (R&M Fund Services.net). |
Outlook and priorities
In 2014, as a result of the integration of our investor services business, we expect to further leverage our integrated capabilities to deliver a specialised service offering to our institutional clients while continuing to focus on their asset servicing needs. We expect that the global economy will improve gradually as ongoing concerns around the European sovereign debt crisis continue to subside. We believe there are strong long-term prospects for our business, largely underpinned by our operating model as a specialist provider, which will position us competitively in a rapidly-changing operating environment. For further details on our general economic review and outlook, refer to the Economic and market review and outlook section.
Key strategic priorities for 2014
| • | Focus on maintaining our superior customer service for custody and asset servicing amidst the competitive industry environment. |
| • | Grow our Treasury & Market Services businesses as part of our full-service offering and to support our enterprise funding and liquidity management objectives. |
| • | Maintain our highly disciplined approach to risk management in support of all client activities. |
| • | Align our technological capabilities, to support our business activities and meet our clients’ rapidly evolving needs. |
Investor & Treasury Services
|
|
Table 27
|
| |||||||||
| (Millions of Canadian dollars, except percentage amounts and as otherwise noted) | 2013 | 2012 | 2011 | |||||||||
Net interest income | $ | 671 | $ | 668 | $ | 573 | ||||||
Non-interest income | 1,133 | 657 | 569 | |||||||||
Total revenue | 1,804 | 1,325 | 1,142 | |||||||||
Non-interest expense | 1,343 | 1,134 | 821 | |||||||||
Net income before income taxes | 461 | 191 | 321 | |||||||||
Net income | $ | 343 | $ | 85 | $ | 230 | ||||||
Key Ratios | ||||||||||||
ROE | 16.7% | 4.3% | 18.4% | |||||||||
ROE adjusted (1) | n.a. | 16.9% | n.a. | |||||||||
Selected average balance sheet information | ||||||||||||
Total assets | $ | 83,100 | $ | 73,600 | $ | 70,000 | ||||||
Deposits | 104,300 | 102,200 | 103,200 | |||||||||
Client deposits | 36,100 | 23,400 | 19,300 | |||||||||
Wholesale funding deposits | 68,200 | 78,800 | 83,900 | |||||||||
Attributed capital | 2,000 | 1,700 | 1,200 | |||||||||
Other Information | ||||||||||||
Economic profit (2) | $ | 183 | $ | 107 | $ | 133 | ||||||
AUA (3) | 3,208,800 | 2,886,900 | 2,744,400 | |||||||||
Average AUA (3) | 3,052,600 | 2,781,800 | 2,825,100 | |||||||||
Number of employees (FTE) (4) | 5,208 | 6,084 | 112 | |||||||||
| (1) | Measure has been adjusted for the acquisition of the remaining 50% stake of RBC Dexia. For further details, refer to the Key performance and non-GAAP measures section. |
| (2) | Economic profit is a non-GAAP measure. For further details, refer to the Key performance and non-GAAP measures section. |
| (3) | AUA and average AUA represented the total AUA of Investor Services, formerly RBC Dexia, of which we had a 50% ownership interest prior to July 27, 2012. |
| (4) | On July 27, 2012, we completed our acquisition of the remaining 50% stake of RBC Dexia. Prior to this acquisition, FTE numbers do not include our RBC Dexia joint venture. |
| n.a. | not applicable |
32 Royal Bank of Canada: Annual Report 2013 Management’s Discussion and Analysis
Table of Contents
Financial performance
2013 vs. 2012
Net income increased $258 million from the prior year. Excluding a prior year loss of $224 million ($213 million after-tax) related to the acquisition of the remaining 50% stake of RBC Dexia, net income increased $45 million or 15%, primarily reflecting improved business performance in Investor Services including higher revenue and continuing benefits from our ongoing focus on efficiency management activities. Incremental earnings related to our additional 50% ownership of Investor Services also contributed to the increase. These factors were partially offset by lower funding and liquidity revenue and a restructuring charge of $44 million ($31 million after-tax) in the current year related to the integration of Investor Services, primarily in Europe.
Total revenue increased $479 million or 36% from the prior year. Excluding our proportionate share of the securities exchange and trading loss in the prior year of $36 million ($26 million after-tax) related to the acquisition of RBC Dexia, total revenue increased $443 million or 33%, largely reflecting incremental revenue related to our additional 50% ownership of Investor Services. Higher custodial fees, mainly driven by growth in average fee-based client assets, and increased foreign exchange revenue in Investor Services, primarily driven by higher transaction volumes, also positively impacted our revenue. These factors were partially offset by lower funding and liquidity revenue across most geographies as the prior year benefited from tightening credit spreads.
Non-interest expense increased $209 million or 18% from the prior year. Excluding an impairment loss and other costs in the prior year of $188 million ($187 million after-tax) related to the acquisition of RBC Dexia, non-interest expense increased $397 million as continuing benefits from our ongoing focus on efficiency management activities was more than offset by incremental costs related to our additional 50% ownership of Investor Services, the restructuring charge related to the integration of Investor Services noted above and higher infrastructure costs.
2012 vs. 2011
Net income was down $145 million or 63% from 2011. Excluding the loss in 2012 related to the acquisition of the remaining 50% stake of RBC Dexia, net income increased $68 million or 30%. The increase was mainly due to higher funding and liquidity trading results, partially offset by lower foreign exchange revenue and decreased custodial fees.
Total revenue was up $183 million or 16% from 2011. Excluding our proportionate share of the securities exchange and trading loss in 2012 related to the acquisition of RBC Dexia, total revenue increased $219 million or 19%, largely related to higher funding and liquidity trading revenue across all geographies. Higher interest income on assets held for liquidity purposes and a full quarter of revenue related to our additional 50% ownership of Investor Services, partially offset by lower foreign exchange revenue and decreased custodial fees, also contributed to the increase. The increase in revenue was partially offset by the unfavourable impact of the depreciation of the Euro against the Canadian dollar.
Non-interest expense was up $313 million or 38% from 2011. Excluding the impairment loss and other costs in 2012 related to the acquisition of RBC Dexia, non-interest expense increased $125 million or 15%, mainly due to a full quarter of costs related to our additional 50% ownership of Investor Services. Higher staff costs, including increased variable compensation on improved results also contributed to the increase. These factors were partially offset by the depreciation of the Euro against the Canadian dollar.
Results excluding the loss related to the acquisition of the remaining 50% stake of RBC Dexia for the fiscal year ended October 31, 2012 are non-GAAP measures. For further details on this specified item impacting our results, including a reconciliation, refer to the Key performance and non-GAAP measures section.
|
Capital Markets provides public and private companies, institutional investors, governments and central banks globally with a wide range of capital markets products and services across our two main business lines, Corporate and Investment Banking and Global Markets. Our legacy portfolio is grouped under Other.
In North America, we offer a full suite of products and services which include corporate and investment banking, equity and debt origination and distribution, and structuring and trading. Outside North America, we have a select presence in the U.K. and Europe, and Asia-Pacific, where we offer a diversified set of capabilities in our key sectors of expertise such as energy, mining and infrastructure.
In Canada, we compete mainly with Canadian banks where we are the premier global investment bank and market leader with a strategic presence in all lines of capital markets businesses. In the U.S., we have full industry sector coverage and investment banking product range and compete with large U.S. and global investment banks as well as smaller regional firms. In the U.K. and Europe, we compete in our key sectors of expertise with global and regional investment banks. In Asia-Pacific, we compete with global and regional investment banks in select products, consisting of our fixed income distribution and currencies trading in Asia and our corporate and investment banking in Australia.
Economic and market review
Capital markets in Canada and the U.S. gradually improved during 2013 resulting from modest economic growth in both countries and ongoing stimulative monetary policy. European market conditions in select markets, remained uncertain as sovereign debt issues continued.
Higher client activity driven by improvements in the global economy and the low interest rate environment led to strong issuance activity throughout most of the year, with our corporate and investment banking businesses performing well, driven by higher lending, loan syndication, debt origination, and M&A. This was despite a continued challenging trading environment with yields on long-term government and corporate bonds at historically low levels in the first half of the year and yields and volatility in credit spreads increasing in the latter half of 2013 as a result of market concerns related to uncertainty about the direction of U.S. fiscal and monetary policies. As a result of these market conditions, our fixed income trading businesses were unfavourably impacted.
Highlights
| • | We continued to focus on growing our corporate and investment banking businesses, particularly in the U.S. and Europe, while rebalancing our global markets businesses by leveraging our investments that were made in prior years, redeploying capital from trading to corporate and investment banking businesses and managing risks by narrowing our focus of trading products. |
| • | In Canada, we maintained our market leadership by deepening our existing client relationships, gaining new clients, and offering a full suite of global capabilities. We were named Best Investment Bank in Canada by Euromoney Magazine for the sixth consecutive year and we continued to win significant mandates including acting as financial advisor to Nexen Inc. on its $15.1 billion acquisition by CNOOC Limited. |
| • | In the U.S., we leveraged our key strategic investments made in recent years to expand our corporate and investment banking businesses, developed new lending relationships and increased focus on our origination and client flow businesses. We had a record year in U.S. corporate and investment banking and were ranked 10th largest investment bank in the Americas by fees for the first nine months of 2013 (Thomson Reuters). We attained this by gaining market share, growing our businesses and winning several significant mandates including acting as a joint bookrunner on the $49 billion of senior unsecured notes offerings by Verizon Communications Inc, joint lead arranger and joint bookrunner on the $24.9 billion leveraged buyout of Dell Inc., and joint lead arranger and joint bookrunner on the acquisition financing of the $6 billion acquisition of Neiman Marcus Group. |
Management’s Discussion and Analysis Royal Bank of Canada: Annual Report 2013 33
Table of Contents
| • | In the U.K. and Europe, we continued to expand our corporate and investment banking businesses. We accomplished this by selectively growing in our key sectors of expertise, focused on gaining new clients through our continued focus on increasing lending activity and market positions. We won new mandates including leading an offer for the U.K.’s Debt Management Office for $2 billion. Due to the challenging trading environment, we refocused our efforts on improving returns in our core global markets businesses and exited non-performing businesses such as our European government bond business. |
| • | In Asia, we continued to focus on our fixed income trading distribution and foreign exchange trading capabilities, while in Australia, we continued to selectively grow our corporate and investment banking business in mining, energy and infrastructure. |
Outlook and priorities
In 2014, we anticipate continuing growth in our equity and debt origination, M&A advisory services, and lending businesses as a result of expected continuing improvement in economic and market environments, and strategic investments in our U.S. corporate and investment banking businesses in recent years.
Overall we anticipate net improvements in our global markets businesses driven by growth in our fixed income, currencies and commodities businesses reflecting stabilizing market conditions particularly in the U.S., as compared to the challenging market conditions in 2013. However improvements in the global economy and stabilizing market conditions will be dependent on market responses to resolutions surrounding uncertainty about the direction of U.S. fiscal and monetary policies particularly in the first half of 2014, and further resolutions of European sovereign debt concerns. We also anticipate that regulatory reforms, in particular related to over-the-counter (OTC) derivatives reform, the Volcker Rule and Basel III will unfavourably impact growth in our trading businesses.
For further details, refer to our Risk management – Top and emerging risks section. For further details on our general economic outlook, refer to the Economic and market review and outlook section.
Key strategic priorities for 2014
| • | Maintain our clear leadership position in Canada by focusing on execution and long-term client relationships, increasing our market share with small- and medium-sized companies and leveraging our global capabilities. |
| • | Expand and strengthen client relationships in the U.S. by leveraging industry sector coverage and our lending relationships to increase market share and drive fee-based revenues, while improving margins. |
| • | Build on our core strengths in Europe and Asia in both Corporate and Investment Banking and Global Markets by improving profitability, selectively growing Corporate and Investment Banking in our sectors of expertise and focusing on the sustainability of trading through origination and sales. |
| • | Deepen client relationships and optimize capital employed to earn high risk-adjusted returns on assets and equity, effectively manage risk by maintaining discipline within our risk tolerance framework and drive efficiency in our business model. |
| • | Manage through the significant changes to the regulatory environment specifically related to OTC derivatives reform, the Volcker Rule, and Basel III changes related to credit valuation adjustments (CVA), Liquidity Coverage Ratio (LCR) and revised leverage framework. |
Capital Markets financial highlights
|
|
Table 28
|
| |||||||||||
| (Millions of Canadian dollars, except number of percentage amounts and as otherwise noted) | 2013 | 2012 | 2011 | |||||||||||
Net interest income (1) | $ | 2,872 | $ | 2,559 | $ | 2,197 | ||||||||
Non-interest income | 3,708 | 3,629 | 3,127 | |||||||||||
Total revenue(1) | 6,580 | 6,188 | 5,324 | |||||||||||
PCL | 188 | 135 | (14 | ) | ||||||||||
Non-interest expense | 3,844 | 3,746 | 3,487 | |||||||||||
Net income before income taxes | 2,548 | 2,307 | 1,851 | |||||||||||
Net income | $ | 1,710 | $ | 1,581 | $ | 1,292 | ||||||||
Revenue by business | ||||||||||||||
Corporate and Investment Banking | $ | 3,014 | $ | 2,533 | $ | 2,371 | ||||||||
Global Markets | 3,492 | 3,635 | 3,143 | |||||||||||
Other | 74 | 20 | (190 | ) | ||||||||||
Key ratios | ||||||||||||||
ROE | 14.2% | 13.5% | 15.2% | |||||||||||
Selected average balance sheet information | ||||||||||||||
Total assets | $ | 368,300 | $ | 349,200 | $ | 322,000 | ||||||||
Trading securities | 100,800 | 90,400 | 112,300 | |||||||||||
Loans and acceptances | 54,700 | 47,000 | 35,300 | |||||||||||
Deposits | 35,300 | 30,900 | 26,500 | |||||||||||
Attributed capital | 11,500 | 11,150 | 8,000 | |||||||||||
Other information | ||||||||||||||
Number of employees (FTE) | 3,644 | 3,560 | 3,537 | |||||||||||
Credit information | ||||||||||||||
Gross impaired loans as a % of average net loans and acceptances | 0.42% | 0.83% | 0.65% | |||||||||||
PCL on impaired loans as a % of average net loans and acceptances | 0.34% | 0.29% | (0.04)% | |||||||||||
| (1) | The teb adjustment for 2013 was $380 million (2012 – $431 million, 2011 – $459 million). For further discussion, refer to the How we measure and report our business segments section. |
34 Royal Bank of Canada: Annual Report 2013 Management’s Discussion and Analysis
Table of Contents
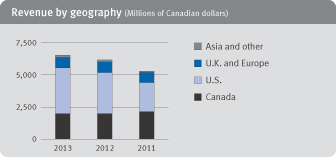
Financial performance
2013 vs. 2012
Net income increased $129 million or 8%, driven primarily by strong growth in Corporate and Investment Banking mainly in the U.S. and lower variable compensation. These factors were partially offset by lower trading revenue and higher PCL.
Total revenue increased $392 million or 6%, largely due to strong growth in our corporate and investment banking businesses driven by higher lending, loan syndication and debt origination mainly in the U.S. and increased volumes from our cash equities business across most geographies. These factors were partially offset by lower revenue in our fixed income trading businesses largely in Europe, as a result of challenging market conditions in the current year.
PCL increased $53 million or 39%, mainly reflecting provisions on a few accounts. For further details, refer to the Credit quality performance section.
Non-interest expense increased $98 million or 3%, mainly due to higher litigation provisions and related legal costs, and higher support costs related to infrastructure, control initiatives and increased regulation. These factors were partially offset by lower variable compensation reflecting a lower compensation to revenue ratio and continuing benefits from our ongoing focus on efficiency management activities.
2012 vs. 2011
Net income increased $289 million or 22% from 2011, driven primarily by our global markets businesses due to higher fixed income trading results reflecting improved market conditions as compared to the challenging market conditions in the latter half of 2011. Strong growth in our corporate and investment banking results driven by higher lending and increased loan syndication activity primarily in the U.S. also contributed to the increase. These factors were partially offset by higher PCL, as compared to recoveries in 2011 and a higher effective tax rate reflecting increased earnings in higher tax jurisdictions.
Total revenue increased $864 million or 16%, largely due to higher fixed income trading primarily driven by improved market conditions mainly in the U.S. as compared to the challenging market conditions in the latter half of 2011, resulting in increased client activity, greater market liquidity and tightening credit spreads. In our corporate and investment banking businesses, strong client growth in lending and increased loan syndication activity also contributed to the increase.
PCL of $135 million compared to a recovery of $14 million in 2011, largely reflecting provisions on a few accounts in 2012.
Non-interest expense increased $259 million or 7%, mainly due to higher variable compensation on improved results. Higher costs in support of business growth, primarily in our corporate and investment banking businesses in the U.S. and U.K., also contributed to the increase. This increase was partially offset by continuing benefits from our ongoing focus on efficiency management activities.
Business line review
|
Corporate and Investment Banking
|
Corporate and Investment Banking comprises our corporate lending, loan syndications, debt and equity origination, M&A advisory services, private equity, research, client securitization and the global credit businesses. For debt and equity origination, revenues are allocated between Corporate and Investment Banking and Global Markets based on the contribution of each group in accordance with an established agreement.
Financial performance
Corporate and Investment Banking revenue of $3,014 million increased $481 million or 19%, as compared to the prior year.
Investment banking revenue increased $236 million or 18%, mainly driven by strong growth in our loan syndication business primarily in the U.S. Higher debt origination reflecting solid issuance activity primarily in the U.S. and Europe and higher M&A activity reflecting increased mandates mainly in Canada and the U.S. also contributed to the increase.
Lending and other revenue increased $245 million or 21%, primarily due to strong growth in our lending portfolio largely in the U.S.
Selected highlights
|
|
Table 29
|
| |||||||||||
| (Millions of Canadian dollars) | 2013 | 2012 | 2011 | |||||||||||
Total revenue(1) | $ | 3,014 | $ | 2,533 | $ | 2,371 | ||||||||
Breakdown of revenue(1) | ||||||||||||||
Investment banking | 1,574 | 1,338 | 1,306 | |||||||||||
Lending and other (2) | 1,440 | 1,195 | 1,065 | |||||||||||
Other information | ||||||||||||||
Average assets | 40,000 | 33,800 | 21,300 | |||||||||||
| (1) | The teb adjustment for 2013 was $2 million (2012 – $10 million, 2011 – $20 million). For further discussion, refer to the How we measure and report our business segments section. |
| (2) | Comprises our corporate lending, client securitization, and global credit businesses. |
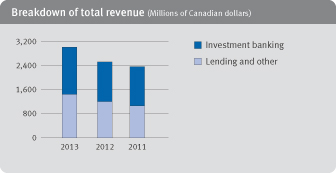
Management’s Discussion and Analysis Royal Bank of Canada: Annual Report 2013 35
Table of Contents
Global Markets
|
Global Markets comprises our fixed income, foreign exchange, equity sales and trading, repos and secured financing and commodities businesses.
Financial performance
Total revenue of $3,492 million decreased $143 million or 4% as compared to the prior year.
Revenue in our Fixed income, currencies and commodities business decreased $218 million or 11%, largely due to significantly lower fixed income trading revenue driven by challenging market conditions reflecting uncertainty about the direction of U.S. fiscal and monetary policy, and lower client volumes and narrower bid/ask spreads in the first half of the year. These factors were partially offset by strong growth in debt origination primarily in the U.S. and Europe driven by increased client activity.
Revenue in our Equities business increased $62 million or 7%, largely reflecting improved trading results and volume growth in our cash equities business. Higher equity origination mainly in the U.S. reflecting stronger issuance activity also contributed to the increase.
Selected highlights
|
|
Table 30
|
| |||||||||||
| (Millions of Canadian dollars ) | 2013 | 2012 | 2011 | |||||||||||
Total revenue(1) | $ | 3,492 | $ | 3,635 | $ | 3,143 | ||||||||
Breakdown of revenue(1) | ||||||||||||||
Fixed income, currencies and commodities | 1,834 | 2,052 | 1,584 | |||||||||||
Equities | 989 | 927 | 1,033 | |||||||||||
Repo and secured financing (2) | 669 | 656 | 526 | |||||||||||
Other information | ||||||||||||||
Average assets | 351,100 | 311,700 | 278,500 | |||||||||||
| (1) | The teb adjustment for 2013 was $378 million (2012 – $421 million, 2011 – $439 million). For further discussion, refer to the How we measure and report our business segments section. |
| (2) | Comprises our secured funding businesses for internal businesses and external clients. |
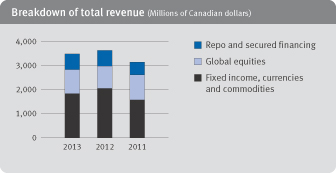
Other
|
Other comprises our legacy portfolio which consists of our bank-owned life insurance (BOLI) stable value products, U.S. commercial mortgage-backed securities and U.S. auction rate securities (ARS). In recent years, in order to optimize our capital employed to improve our risk-adjusted returns and reduce our liquidity risk on various products, we have significantly reduced several of our legacy portfolios.
Financial performance
Revenue of $74 million increased $54 million as compared to the prior year, mainly due to higher gains on our U.S. student loan auction rate securities legacy portfolios.
|
Corporate Support comprises Technology & Operations which provide the technological and operational foundation required to effectively deliver products and services to our clients, and Functions which includes our finance, human resources, risk management, internal audit and other functional groups. Reported results for Corporate Support mainly reflect certain activities related to monitoring and oversight of enterprise activities which are not allocated to business segments. Corporate Support also includes our Corporate Treasury function. For further details, refer to the How we measure and report our business segments section.
Corporate Support
|
|
Table 31
|
| |||||||||||
| (Millions of Canadian dollars, except number of) | 2013 | 2012 | 2011 | |||||||||||
Net interest income (loss) (1) | $ | (123 | ) | $ | (183 | ) | $ | (293 | ) | |||||
Non-interest income (loss) | (32 | ) | 67 | 257 | ||||||||||
Total revenue(1) | (155 | ) | (116 | ) | (36 | ) | ||||||||
PCL | 3 | – | 5 | |||||||||||
Non-interest expense | 50 | 37 | 93 | |||||||||||
Net income (loss) before income taxes(1) | (208 | ) | (153 | ) | (134 | ) | ||||||||
Income taxes (recoveries) (1) | (650 | ) | (512 | ) | (431 | ) | ||||||||
Net income(2) | $ | 442 | $ | 359 | $ | 297 | ||||||||
Other information | ||||||||||||||
Number of employees (FTE) | 11,971 | 11,618 | 11,694 | |||||||||||
| (1) | Teb adjusted. |
| (2) | Net income reflects income attributable to both shareholders and Non-Controlling Interests (NCI). Net income attributable to NCI for the year ended October 31, 2013 was $93 million (October 31, 2012 – $92 million; October 31, 2011 – $92 million). |
36 Royal Bank of Canada: Annual Report 2013 Management’s Discussion and Analysis
Table of Contents
Due to the nature of activities and consolidated adjustments reported in this segment, we believe that a comparative period analysis is not relevant. The following identifies material items affecting the reported results in each period.
Net interest income (loss) and income taxes (recoveries) in each period in Corporate Support include the deduction of the teb adjustments related to the gross-up of income from Canadian taxable corporate dividends recorded in Capital Markets. The amount deducted from net interest income (loss) was offset by an equivalent increase in income taxes (recoveries). The teb amount for the year ended October 31, 2013 was $380 million as compared to $431 million in the prior year and $459 million for the year ended October 31, 2011. For further discussion, refer to the How we measure and report our business segments section.
In addition to the teb impacts noted above, the following identifies the other material items affecting the reported results in each period.
2013
Net income was $442 million largely reflecting net favourable tax adjustments, including $214 million of income tax adjustments related to prior years, and asset/liability management activities.
2012
Net income was $359 million largely reflecting the settlement of several tax matters with the CRA which resulted in the release of $128 million of tax uncertainty provisions and interest income of $72 million ($53 million after-tax) related to a refund of taxes paid and asset/liability management activities.
2011
Net income was $297 million largely due to asset/liability management activities and gains related to the change in fair value of certain derivatives used to economically hedge our funding activities.
Quarterly financial information
|
Fourth quarter 2013 performance
|
Q4 2013 vs. Q4 2012
Fourth quarter net income was $2,119 million, up $208 million or 11% from the prior year. Diluted EPS of $1.40 was up $0.15 and ROE of 18.6% was down 10 bps. Our fourth quarter earnings reflected strong growth in our corporate and investment banking businesses and solid volume growth across all our Canadian Banking businesses. Higher average fee-based client assets in Wealth Management and improved business performance in Investor Services also contributed to the increase. In addition, our results were positively impacted by a lower effective tax rate, largely reflecting favourable income tax adjustments of $124 million related to prior years and lower PCL. These factors were partially offset by a charge of $160 million ($118 million after-tax) as a result of proposed legislation in Canada, which would affect the policyholders’ tax treatment of certain individual life insurance policies.
Total revenue increased $452 million or 6%, mainly due to higher average fee-based client assets in Wealth Management, higher loan syndication activity in Capital Markets, as well as the inclusion of our acquisition of Ally Canada, and solid volume growth across all our Canadian Banking businesses. Higher trading revenue and improved business performance in Investor Services also contributed to the increase. These factors were partially offset by spread compression due to the continuing low rate environment and competitive pricing pressures in Canadian Banking, and lower equity origination in Capital Markets.
Total PCL decreased $27 million or 7% from a year ago, mainly reflecting a provision taken in the prior year on a single account in Capital Markets and lower provisions in our Canadian Banking business lending portfolios. These factors were partially offset by higher PCL on a few accounts in Wealth Management.
PBCAE increased $108 million or 14%, mainly due to the charge related to certain individual life insurance policies as noted above and higher net claims costs. These factors were partially offset by favourable actuarial adjustments reflecting management actions and assumption changes.
Non-interest expense increased $291 million or 8%, primarily reflecting higher variable compensation driven by higher revenue in Wealth Management and a provision related to post-employment benefits and restructuring charges in the Caribbean of $40 million. Higher litigation provisions and related legal costs in Capital Markets, the inclusion of our acquisition of Ally Canada, and higher costs in support of business growth also contributed to the increase. These factors were partially offset by the continuing benefits from our ongoing focus on efficiency management activities.
Management’s Discussion and Analysis Royal Bank of Canada: Annual Report 2013 37
Table of Contents
Quarterly results and trend analysis
|
Our quarterly results are impacted by a number of trends and recurring factors, which include seasonality of certain businesses, general economic and market conditions, and fluctuations in the Canadian dollar relative to other foreign currencies. The following table summarizes our results for the last eight quarters (the period):
Quarterly results(1)
|
|
Table 32
|
| |||||||||||||||||||||||||||||
| 2013 | 2012 | |||||||||||||||||||||||||||||||
| (Millions of Canadian dollars, except per share and percentage amounts) | Q4 | Q3 | Q2 | Q1 | Q4 | Q3 | Q2 | Q1 | ||||||||||||||||||||||||
Continuing operations | ||||||||||||||||||||||||||||||||
Net interest income | $ | 3,350 | $ | 3,393 | $ | 3,223 | $ | 3,285 | $ | 3,175 | $ | 3,289 | $ | 3,031 | $ | 3,003 | ||||||||||||||||
Non-interest income | 4,620 | 3,825 | 4,546 | 4,625 | 4,343 | 4,467 | 3,893 | 4,571 | ||||||||||||||||||||||||
Total revenue | $ | 7,970 | $ | 7,218 | $ | 7,769 | $ | 7,910 | $ | 7,518 | $ | 7,756 | $ | 6,924 | $ | 7,574 | ||||||||||||||||
PCL | 335 | 267 | 288 | 349 | 362 | 324 | 348 | 267 | ||||||||||||||||||||||||
PBCAE | 878 | 263 | 938 | 705 | 770 | 1,000 | 640 | 1,211 | ||||||||||||||||||||||||
Non-interest expense | 4,164 | 4,001 | 4,011 | 4,051 | 3,873 | 3,759 | 3,857 | 3,671 | ||||||||||||||||||||||||
Net income before income taxes | $ | 2,593 | $ | 2,687 | $ | 2,532 | $ | 2,805 | $ | 2,513 | $ | 2,673 | $ | 2,079 | $ | 2,425 | ||||||||||||||||
Income taxes | 474 | 383 | 596 | 735 | 602 | 433 | 516 | 549 | ||||||||||||||||||||||||
Net income from continuing operations | $ | 2,119 | $ | 2,304 | $ | 1,936 | $ | 2,070 | $ | 1,911 | $ | 2,240 | $ | 1,563 | $ | 1,876 | ||||||||||||||||
Net loss from discontinued operations | – | – | – | – | – | �� | – | (30 | ) | (21 | ) | |||||||||||||||||||||
Net income | $ | 2,119 | $ | 2,304 | $ | 1,936 | $ | 2,070 | $ | 1,911 | $ | 2,240 | $ | 1,533 | $ | 1,855 | ||||||||||||||||
EPS – basic | $ | 1.41 | $ | 1.54 | $ | 1.28 | $ | 1.37 | $ | 1.26 | $ | 1.49 | $ | 1.00 | $ | 1.23 | ||||||||||||||||
– diluted | 1.40 | 1.52 | 1.27 | 1.36 | 1.25 | 1.47 | 0.99 | 1.22 | ||||||||||||||||||||||||
EPS from continuing operations – basic | $ | 1.41 | $ | 1.54 | $ | 1.28 | $ | 1.37 | $ | 1.26 | $ | 1.49 | $ | 1.02 | $ | 1.24 | ||||||||||||||||
– diluted | 1.40 | 1.52 | 1.27 | 1.36 | 1.25 | 1.47 | 1.01 | 1.23 | ||||||||||||||||||||||||
Segments – net income (loss) from continuing operations | ||||||||||||||||||||||||||||||||
Personal & Commercial Banking | $ | 1,081 | $ | 1,180 | $ | 1,057 | $ | 1,120 | $ | 1,034 | $ | 1,102 | $ | 940 | $ | 1,012 | ||||||||||||||||
Wealth Management | 205 | 236 | 225 | 233 | 207 | 156 | 212 | 188 | ||||||||||||||||||||||||
Insurance | 107 | 160 | 166 | 164 | 194 | 179 | 151 | 190 | ||||||||||||||||||||||||
Investor & Treasury Services | 92 | 104 | 67 | 80 | 72 | 51 | (121 | ) | 83 | |||||||||||||||||||||||
Capital Markets | 472 | 388 | 386 | 464 | 410 | 429 | 371 | 371 | ||||||||||||||||||||||||
Corporate Support | 162 | 236 | 35 | 9 | (6 | ) | 323 | 10 | 32 | |||||||||||||||||||||||
Net income from continuing operations | $ | 2,119 | $ | 2,304 | $ | 1,936 | $ | 2,070 | $ | 1,911 | $ | 2,240 | $ | 1,563 | $ | 1,876 | ||||||||||||||||
Net income – total | $ | 2,119 | $ | 2,304 | $ | 1,936 | $ | 2,070 | $ | 1,911 | $ | 2,240 | $ | 1,533 | $ | 1,855 | ||||||||||||||||
Effective income tax rate from continuing operations | 18.3% | 14.3% | 23.5% | 26.2% | 24.0% | 16.2% | 24.8% | 22.6% | ||||||||||||||||||||||||
Period average US$ equivalent of C$1.00 | $ | 0.960 | $ | 0.963 | $ | 0.982 | $ | 1.005 | $ | 1.011 | $ | 0.982 | $ | 1.008 | $ | 0.987 | ||||||||||||||||
| (1) | Fluctuations in the Canadian dollar relative to other foreign currencies have affected our consolidated results over the period. |
Seasonality
Seasonal factors impact our results in most quarters. The first quarter is seasonally stronger for our capital markets businesses. The second quarter has fewer days than the other quarters, generally resulting in a decrease in net interest income and certain expense items. The third quarter results for Investor Services are generally favourably impacted by higher securities lending as a result of the European dividend season. The third and fourth quarters include the summer months during which market activity generally tends to slow, negatively impacting the results of our capital markets, brokerage and investment management businesses.
Notable items affecting our consolidated results
| • | In the fourth quarter of 2013, our results included a charge of $160 million ($118 million after-tax) as a result of proposed legislation in Canada, which would affect the policyholders’ tax treatment of certain individual life insurance policies, as well as net favourable income tax adjustments including a $124 million income tax adjustment related to prior years. |
| • | In the third quarter of 2013, our results included net favourable income tax adjustments including a $90 million income tax adjustment related to the prior year. |
| • | In the second quarter of 2013, our results included a restructuring charge of $44 million ($31 million after-tax) related to the integration of Investor Services, primarily in Europe. |
| • | In the third quarter of 2012, our results included a release of $128 million of tax uncertainty provisions and interest income of $72 million ($53 million after-tax) related to a refund of taxes paid due to the settlement of several tax matters with the CRA, as well as a favourable adjustment of $125 million ($92 million after-tax) resulting from a change in methodology with respect to the timing of recognition of mortgage prepayment interest, and an additional loss of $12 million ($11 million after-tax) related to the acquisition of the remaining 50% stake of RBC Dexia. |
| • | In the second quarter of 2012, our results included a loss of $212 million ($202 million after-tax) related to the acquisition of the remaining 50% stake of RBC Dexia. |
Trend analysis
Economic conditions in Canada and the U.S. gradually improved over the period, with capital markets in Canada and the U.S. generally showing improvement in 2013. Conditions in global financial markets remained generally uncertain during the period due to ongoing European sovereign debt issues.
Earnings have been generally robust over the period, driven largely by solid volume growth in our Canadian Banking businesses and generally solid results in Capital Markets including a strong fourth quarter of 2013. Wealth Management results have generally trended upwards since the third quarter of 2012 due to higher average fee-based client assets and higher transaction volumes, with the current quarter decline
38 Royal Bank of Canada: Annual Report 2013 Management’s Discussion and Analysis
Table of Contents
primarily due to higher PCL. Insurance results have continued to fluctuate over the period, due to the timing of new U.K. annuity contracts and actuarial adjustments, and have been unfavourably impacted in the current quarter by a charge as a result of proposed legislation in Canada relating to certain individual life insurance policies. Investor & Treasury Services’ results in the five quarters since our acquisition of the remaining 50% stake of RBC Dexia have fluctuated, with solid results in the latter half of fiscal 2013.
Revenue continued to trend upwards with some fluctuations over the period. The general increase in revenue over the period continued to be driven by solid volume growth across most of our Canadian Banking businesses, growth in our corporate and investment banking business, and higher average fee-based client assets in Wealth Management. Our ownership of the additional 50% of Investor Services has contributed incremental revenue since the third quarter of 2012 and our acquisition of Ally Canada has contributed incremental revenue since the second quarter of 2013. Trading revenue fluctuated over the period due to challenging market conditions. Net interest income continued to trend up over the period, primarily due to solid volume growth across most of our Canadian Banking businesses, partially offset by spread compression caused by the continuing low interest rate environment and increased competitive pricing pressures.
PCL generally has been stable over the period, and has generally trended downwards since the fourth quarter of 2012 due to stabilizing asset quality in the Canadian retail portfolio and the improving credit quality of our Caribbean portfolio. The current quarter increase in PCL is largely due to provisions on a few accounts in Wealth Management. Provisions in Capital Markets have fluctuated, and have trended down over the past three quarters.
PBCAE has fluctuated quarterly as it reflects the changes to the fair value of investments backing our policyholder liabilities, largely offset in revenue. PBCAE has also been impacted by volume growth in our Insurance businesses as well as actuarial liability adjustments and generally lower claims costs. PBCAE in the current quarter included a charge as a result of proposed legislation in Canada relating to certain individual life insurance policies as noted above.
Non-interest expense has generally trended upwards over the period, mainly driven by higher variable compensation due to increased revenue in Wealth Management, and higher costs in support of business growth. Incremental costs related to our additional 50% ownership of Investor Services since the third quarter of 2012 and our acquisition of Ally Canada in the second quarter of 2013 have also contributed to the increase. These factors were partially offset by continuing benefits from our ongoing focus on efficiency management activities.
Our effective income tax rate fluctuated over the period, resulting from varying levels of income being reported in jurisdictions with different tax rates, as well as fluctuating levels of income from tax-advantaged sources (Canadian taxable corporate dividends), and various tax adjustments. The reduction in statutory Canadian corporate tax rates over the period generally lowered our effective tax rate. In the third and fourth quarters of 2013, the effective tax rate was impacted by net favourable income tax adjustments related to prior years as noted above.
Results by geographic segment(1)
|
For geographic reporting, our segments are grouped into Canada, U.S. and Other International. Transactions are primarily recorded in the location that best reflects the risk due to negative changes in economic conditions and prospects for growth due to positive economic changes. The following table summarizes our financial results by geographic region.
|
Table 33
|
| ||||||||||||||||||||||||||||||||||||||||||||||||
| 2013 | 2012 | 2011 | ||||||||||||||||||||||||||||||||||||||||||||||||
| (Millions of Canadian dollars) | Canada | U.S. | Other International | Total | Canada | U.S. | Other International | Total | Canada | U.S. | Other International | Total | ||||||||||||||||||||||||||||||||||||||
Continuing operations | ||||||||||||||||||||||||||||||||||||||||||||||||||
Net interest income | $ | 10,960 | $ | 1,602 | $ | 689 | $ | 13,251 | $ | 10,413 | $ | 1,308 | $ | 777 | $ | 12,498 | $ | 9,641 | $ | 1,091 | $ | 625 | $ | 11,357 | ||||||||||||||||||||||||||
Non-interest income | 8,855 | 3,834 | 4,927 | 17,616 | 9,378 | 3,564 | 4,332 | 17,274 | 9,270 | 2,815 | 4,196 | 16,281 | ||||||||||||||||||||||||||||||||||||||
Total revenue | $ | 19,815 | $ | 5,436 | $ | 5,616 | $ | 30,867 | $ | 19,791 | $ | 4,872 | $ | 5,109 | $ | 29,772 | $ | 18,911 | $ | 3,906 | $ | 4,821 | $ | 27,638 | ||||||||||||||||||||||||||
PCL | 898 | 77 | 264 | 1,239 | 1,021 | 90 | 190 | 1,301 | 1,016 | (12 | ) | 129 | 1,133 | |||||||||||||||||||||||||||||||||||||
PBCAE | 1,425 | 10 | 1,349 | 2,784 | 2,320 | 16 | 1,285 | 3,621 | 2,124 | 21 | 1,213 | 3,358 | ||||||||||||||||||||||||||||||||||||||
Non-interest expense | 9,345 | 3,677 | 3,205 | 16,227 | 8,809 | 3,404 | 2,947 | 15,160 | 8,376 | 3,159 | 2,632 | 14,167 | ||||||||||||||||||||||||||||||||||||||
Income taxes | 1,754 | 402 | 32 | 2,188 | 1,600 | 519 | (19 | ) | 2,100 | 1,728 | 259 | 23 | 2,010 | |||||||||||||||||||||||||||||||||||||
Net income from continuing operations | $ | 6,393 | $ | 1,270 | $ | 766 | $ | 8,429 | $ | 6,041 | $ | 843 | $ | 706 | $ | 7,590 | $ | 5,667 | $ | 479 | $ | 824 | $ | 6,970 | ||||||||||||||||||||||||||
Net loss from discontinued operations | – | – | – | – | – | (51 | ) | – | (51 | ) | – | (526 | ) | – | (526 | ) | ||||||||||||||||||||||||||||||||||
Net income | $ | 6,393 | $ | 1,270 | $ | 766 | $ | 8,429 | $ | 6,041 | $ | 792 | $ | 706 | $ | 7,539 | $ | 5,667 | $ | (47 | ) | $ | 824 | $ | 6,444 | |||||||||||||||||||||||||
| (1) | For geographic reporting, our segments are grouped into Canada, U.S. and Other International. For further details, refer to Note 29 of our 2013 Annual Consolidated Financial Statements. |
2013 vs. 2012
Net income in Canada was up $352 million or 6% from the prior year, mainly due to solid volume growth across all businesses in Canadian Banking. Higher average fee-based client assets in Wealth Management, strong growth in our corporate and investment banking businesses driven by higher lending, M&A and loan syndication, improved credit quality in our Canadian Banking portfolio, and the contribution of our acquisition of Ally Canada also contributed to the increase. These factors were partially offset by spread compression and a charge of $160 million ($118 million after-tax) in Insurance as a result of proposed legislation in Canada, which would affect the policyholders’ tax treatment of certain individual life insurance policies. In addition, the prior year results were favourably impacted by a settlement of several tax matters with the CRA which resulted in the release of $128 million of tax uncertainty provisions and interest income of $72 million ($53 million after-tax) and a favourable adjustment related to a change in estimate of mortgage prepayment interest of $125 million ($92 million after-tax). Our results in the prior year were also unfavourably impacted by an impairment loss related to the acquisition of the remaining 50% stake of RBC Dexia of which $105 million (before- and after-tax) was recorded in our Canadian operations.
U.S. net income increased $478 million or 60% from the prior year, largely due to favourable income tax adjustments of $214 million related to prior years. Strong growth in our corporate and investment banking businesses mainly driven by higher loan syndication and higher lending, and higher average fee-based client assets and higher transaction volumes in Wealth Management also contributed to the increase. These factors were partially offset by higher variable compensation in Wealth Management and Capital Markets.
Other International net income was up $60 million or 8% from the previous year, largely due to strong growth in our corporate and investment banking businesses. Improved business performance in Investor Services including higher revenue and continuing benefits from our
Management’s Discussion and Analysis Royal Bank of Canada: Annual Report 2013 39
Table of Contents
ongoing focus on efficiency management activities, lower variable compensation in Capital Markets, and higher average fee-based client assets and higher transaction volumes in Wealth Management also contributed to the increase. In addition, the prior year results were unfavourably impacted by the impairment loss related to our acquisition of RBC Dexia as noted above of which $63 million (before- and after-tax) was recorded in our Other International operations, and our proportionate share of the loss on the securities exchange and trading losses recorded by RBC Dexia. These factors were partially offset by lower trading revenue largely in Europe, higher PCL in Wealth Management and Capital Markets, and a provision related to post-employment benefits and restructuring charges in the Caribbean of $40 million ($31 million after-tax).
2012 vs. 2011
Continuing operations
Net income in Canada was up $374 million or 7% compared to 2011, mainly due to strong volume growth across most of our Canadian banking businesses, the release of tax uncertainty provisions and interest income as noted above, a lower effective tax rate due to a reduction in statutory Canadian corporate income tax rates, and the mortgage prepayment interest adjustment as noted above. These factors were partially offset by increased costs in support of business growth partially offset by continuing benefits from our ongoing focus on efficiency management activities, and the impairment loss related to the acquisition of the remaining 50% stake of RBC Dexia as noted above.
U.S. net income increased $364 million or 76% compared to 2011, largely due to higher trading results, reflecting improved market conditions as compared to the challenging market conditions in the latter half of 2011. Strong growth in our corporate and investment banking results driven by client growth in our lending, loan syndication and origination businesses also contributed to the increase. These factors were partially offset by higher PCL in Capital Markets.
Other International net income was down $118 million or 14% compared to 2011, largely due to the impairment loss related to our acquisition of RBC Dexia as noted above, and higher PCL in Caribbean banking. These factors were partially offset by higher fixed income trading results in Capital Markets. In addition, 2011 included a gain related to MBIA which favourably impacted results in that year.
Discontinued operations
For details on results for our discontinued operations, refer to the Financial performance section.
|
|
|
Table 34
|
| |||||||||
| As at October 31 (Millions of Canadian dollars) | 2013 | 2012 | 2011 | |||||||||
Assets | ||||||||||||
Cash and due from banks | $ | 15,870 | $ | 12,617 | $ | 12,428 | ||||||
Interest-bearing deposits with banks | 9,061 | 10,255 | 6,460 | |||||||||
Securities | 182,718 | 161,611 | 167,022 | |||||||||
Assets purchased under reverse repurchase agreements and securities borrowed | 117,517 | 112,257 | 84,947 | |||||||||
Loans | ||||||||||||
Retail | 321,678 | 301,185 | 284,745 | |||||||||
Wholesale | 88,947 | 79,056 | 64,752 | |||||||||
Allowance for loan losses | (1,959 | ) | (1,997 | ) | (1,967 | ) | ||||||
Investments for account of segregated fund holders | 513 | 383 | 320 | |||||||||
Other – Derivatives | 74,822 | 91,293 | 99,650 | |||||||||
– Assets of discontinued operations | – | – | 27,152 | |||||||||
– Other | 51,652 | 58,440 | 48,324 | |||||||||
Total assets | $ | 860,819 | $ | 825,100 | $ | 793,833 | ||||||
Liabilities | ||||||||||||
Deposits | $ | 558,480 | $ | 508,219 | 479,102 | |||||||
Insurance and investment contracts for account of segregated fund holders | 513 | 383 | 320 | |||||||||
Other – Derivatives | 76,745 | 96,761 | 100,522 | |||||||||
– Liabilities of discontinued operations | – | – | 20,076 | |||||||||
– Other | 166,403 | 165,194 | 142,707 | |||||||||
Subordinated debentures | 7,443 | 7,615 | 8,749 | |||||||||
Trust capital securities | 900 | 900 | 894 | |||||||||
Total liabilities | 810,484 | 779,072 | 752,370 | |||||||||
Equity attributable to shareholders | 48,540 | 44,267 | 39,702 | |||||||||
Non-controlling interests | 1,795 | 1,761 | 1,761 | |||||||||
Total equity | 50,335 | 46,028 | 41,463 | |||||||||
Total liabilities and equity | $ | 860,819 | $ | 825,100 | $ | 793,833 | ||||||
| (1) | Foreign currency-denominated assets and liabilities are translated to Canadian dollars. |
2013 vs. 2012
Total assets were up $36 billion or 4% from the previous year.
Interest-bearing deposits with banks decreased by $1 billion or 12% largely reflecting the increased placement of our deposits internally as a result of our acquisition of the remaining 50% stake of RBC Dexia, partially offset by higher overnight deposits.
Securities were up $21 billion or 13% compared to the prior year, primarily due to an increase in government and corporate debt securities as part of our management of liquidity and funding risk.
Assets purchased under reverse repurchase agreements (reverse repos) and securities borrowed increased by $5 billion or 5%, mainly attributable to the impact of the depreciation of the Canadian dollar against certain other currencies.
Loans were up $30 billion or 8%, predominantly due to solid volume growth in Canadian home equity products reflecting the ongoing low interest rate environment and our acquisition of Ally Canada. Higher corporate lending in Capital Markets also contributed to the increase.
40 Royal Bank of Canada: Annual Report 2013 Management’s Discussion and Analysis
Table of Contents
Derivative assets were down $16 billion or 18%, mainly attributable to lower fair values of interest rate swaps due to an increase in interest rates.
Other assets were down $7 billion or 12%, primarily reflecting a decrease in cash collateral requirements.
Total liabilities were up $31 billion or 4% from the previous year.
Deposits increased $50 billion or 10%, mainly reflecting our issuances of covered bonds and other fixed term notes for funding requirements and growth in business deposits. Demand for our high-yield savings accounts and other product offerings in our retail business as well as the impact of the depreciation of the Canadian dollar against certain other currencies also contributed to the increase.
Derivative liabilities were down $20 billion or 21%, primarily attributable to lower fair values of interest rate swaps due to an increase in interest rates.
Other liabilities increased by $1 billion or 1%, mainly resulting from higher obligations related to securities sold short and the impact of the depreciation of the Canadian dollar against certain other currencies. These factors were partially offset by a decrease in repurchase agreements as a result of lower funding requirements and a decrease in cash collateral requirements.
Total equity increased by $4 billion or 9%, largely reflecting earnings, net of dividends.
Our consolidated balance sheet was impacted by foreign currency translation which increased our total assets and our total liabilities and equity by approximately $14 billion due to the depreciation of the Canadian dollar against certain other currencies as compared to last year.
Off-balance sheet arrangements
|
In the normal course of business, we engage in a variety of financial transactions that, for accounting purposes, are not recorded on our Consolidated Balance Sheets. Off-balance sheet transactions are generally undertaken for risk, capital and funding management purposes which benefit us and our clients. These include transactions with special purpose entities (SPEs) and may also include the issuance of guarantees. These transactions give rise to, among other risks, varying degrees of market, credit, liquidity and funding risk, which are discussed in the Risk management section.
We use SPEs to securitize our financial assets as well as assist our clients in securitizing their financial assets. These entities are not operating entities, typically have no employees, and may or may not be recorded on our Consolidated Balance Sheets.
Securitizations of our financial assets
We periodically securitize our credit card receivables, residential and commercial mortgage loans and bond participation certificates primarily to diversify our funding sources, enhance our liquidity position and for capital purposes. We also securitize residential and commercial mortgage loans for sales and trading activities. Securitization can be used as a cost-effective fund raising technique compared to the relative cost of issuing unsecured wholesale debt.
The majority of our securitization activities are recorded on our Consolidated Balance Sheets. We securitize our credit card receivables, on a revolving basis, through a consolidated SPE. We securitize single and multiple-family residential mortgages through the NHA MBS program, which are not derecognized from our Consolidated Balance Sheets. For details of these activities, refer to Note 6 and Note 7 of our 2013 Annual Consolidated Financial Statements.
We have also securitized residential mortgage loans through the Canadian social housing program which are derecognized from our Consolidated Balance Sheets when sold to third party investors. During 2013, we did not securitize mortgages through the Canadian social housing program (2012 – $21 million).
In prior years, we securitized commercial mortgages by selling them in collateral pools, which met certain diversification, leverage and debt coverage criteria, to SPEs, one of which is sponsored by us. We also participated in bond securitization activities where we purchased government, government related and corporate bonds and repackaged those bonds in participation certificates, which were sold to third party investors. Securitized commercial mortgage loans and bond participation certificates are derecognized from our Consolidated Balance Sheets as we have transferred substantially all of the risk and rewards of ownership of the securitized assets. Our continuing involvement with the transferred assets is limited to servicing the underlying bonds and the commercial mortgages sold to our sponsored SPE. As at October 31, 2013, there were $1.3 billion of commercial mortgages (October 31, 2012 – $1.4 billion) and $624 million of bond participation certificates (October 31, 2012 – $661 million) outstanding related to these prior period securitization activities. During 2013, we did not securitized bond participation certificates, or commercial mortgages.
Involvement with unconsolidated special purpose entities
In the normal course of business, we engage in a variety of financial transactions with SPEs to support our customers’ financing and investing needs, including securitization of client financial assets, creation of investment products, and other types of structured financing. The following table summarizes SPEs in which we have significant financial interests, but have not consolidated.
Special Purpose Entities
|
|
|
Table 35
|
| ||||||||||||||||||||||||||||||||||||||||||||||||||||||||||
| 2013 | 2012 | |||||||||||||||||||||||||||||||||||||||||||||||||||||||||||||
| Total assets by credit ratings | Total assets by average maturities | Total assets by geographic location of borrowers | ||||||||||||||||||||||||||||||||||||||||||||||||||||||||||||
As at October 31 (Millions of Canadian | Total assets (1) | Maximum exposure (1)(2) | Investment grade (3) | Non- Investment grade (3) | Not Rated | Under year | 1 to 5 years | Over 5 years | Not applicable | Canada | U.S. | Other International | Total assets (1) | Maximum exposure (1) | ||||||||||||||||||||||||||||||||||||||||||||||||
Unconsolidated SPEs | ||||||||||||||||||||||||||||||||||||||||||||||||||||||||||||||
Multi-seller conduits (4) | $ | 31,075 | $ | 31,556 | $ | 30,919 | $ | 156 | $ | – | $ | 6,000 | $ | 24,143 | $ | 932 | $ | – | $ | 5,570 | $ | 22,549 | $ | 2,956 | $ | 29,582 | $ | 30,029 | ||||||||||||||||||||||||||||||||||
Structured finance | 3,895 | 1,272 | 3,745 | 150 | – | 200 | – | 3,695 | – | 200 | 3,695 | – | 5,039 | 1,760 | ||||||||||||||||||||||||||||||||||||||||||||||||
Investment funds | 1,621 | 1,461 | 584 | – | 1,037 | – | – | 584 | 1,037 | 32 | 656 | 933 | 1,584 | 1,082 | ||||||||||||||||||||||||||||||||||||||||||||||||
Credit investment | 74 | 15 | – | 74 | – | – | – | 74 | – | – | – | 74 | 852 | 169 | ||||||||||||||||||||||||||||||||||||||||||||||||
Third-party securitization vehicles | 8,098 | 992 | 1,688 | 33 | 6,377 | – | 105 | 3,601 | 4,392 | – | 3,706 | 4,392 | 6,811 | 1,266 | ||||||||||||||||||||||||||||||||||||||||||||||||
Other | 241 | 76 | – | – | 241 | – | – | – | 241 | 36 | 200 | 5 | 368 | 103 | ||||||||||||||||||||||||||||||||||||||||||||||||
| $ | 45,004 | $ | 35,372 | $ | 36,936 | $ | 413 | $ | 7,655 | $ | 6,200 | $ | 24,248 | $ | 8,886 | $ | 5,670 | $ | 5,838 | $ | 30,806 | $ | 8,360 | $ | 44,236 | $ | 34,409 | |||||||||||||||||||||||||||||||||||
| (1) | Total assets and maximum exposure to loss correspond to disclosures provided in Note 7 to our 2013 Annual Consolidated Financial Statements. Total asset amounts may differ from those presented in Note 7 due to certain entities, primarily mutual and pooled funds, which we sponsor but where we do not hold a significant financial interest. |
Management’s Discussion and Analysis Royal Bank of Canada: Annual Report 2013 41
Table of Contents
| (2) | The maximum exposure to loss resulting from significant financial interests in these SPEs consists mostly of investments, loans, liquidity and credit enhancement facilities and fair value of derivatives. The maximum exposure to loss may exceed the total assets in the multi-seller conduits, as our liquidity facilities may sometimes be extended for up to 102% of the total value of the assets in the conduits. |
| (3) | Our internal risk ratings for major counterparty types approximate those of public rating agencies. Ratings of AAA, AA, A, and BBB represent investment grade ratings and ratings of BB or lower represent non-investment grade ratings. |
| (4) | Represents multi-seller conduits that we administer. |
We have the ability to use credit mitigation tools such as third party guarantees, credit default swaps, and collateral to mitigate risks assumed through securitization and re-securitization exposures. The process in place to monitor the credit quality of our securitization and re-securitization exposures involves, among other things, reviewing the performance data of the underlying assets. We affirm our ratings each quarter and formally confirm or assign a new rating at least annually. For further details on our activities to manage risks, refer to the Risk management section.
Approximately 81% of assets in unconsolidated SPEs in which we have significant financial interests were internally rated A or above, compared to 79% in the prior year. For multi-seller conduits, 99% of assets were internally rated A or above, consistent with the prior year. All transactions funded by the unconsolidated multi-seller conduits are internally rated using a rating system which is largely consistent with that of the external rating agencies.
The assets in unconsolidated SPEs as at October 31, 2013 have varying maturities and a remaining expected weighted average life of approximately 3.5 years.
RBC-administered multi-seller conduits
We administer multi-seller conduits which are used primarily for the securitization of our clients’ financial assets. We are involved in these conduit markets because our clients value these transactions. Our clients primarily use multi-seller conduits to diversify their financing sources and to reduce funding costs by leveraging the value of high-quality collateral. The conduits offer us a favourable revenue stream, risk-adjusted return and cross-selling opportunities.
We provide services such as transaction structuring, administration, backstop liquidity facilities and partial credit enhancements to the multi-seller conduits. Fee revenue for all such services amounted to $158 million during the year (2012 – $146 million). We do not maintain any ownership or retained interests in these multi-seller conduits and have no rights to, or control of, their assets.
Our total commitment to the conduits in the form of backstop liquidity and credit enhancement facilities is shown below. The total committed amount of these facilities exceeds the total amount of the maximum assets that may have to be purchased by the conduits under the purchase agreements. As a result, the maximum exposure to loss attributable to our backstop liquidity and credit enhancement facilities is less than the total committed amounts of these facilities.
Liquidity and credit enhancement facilities
|
|
|
Table 36
|
| ||||||||||||||||||||||||||||
| 2013 | 2012 | |||||||||||||||||||||||||||||||
| As at October 31 (Millions of Canadian dollars) | Notional of committed amounts (1) | Allocable notional amounts | Outstanding loans (2) | Total maximum exposure to loss | Notional of committed amounts (1) | Allocable notional amounts | Outstanding loans (2) | Total maximum exposure to loss | ||||||||||||||||||||||||
Backstop liquidity facilities | $ | 31,675 | $ | 27,875 | $ | 896 | $ | 28,771 | $ | 30,143 | $ | 25,935 | $ | 1,391 | $ | 27,326 | ||||||||||||||||
Credit enhancement facilities | 2,889 | 2,785 | – | 2,785 | 2,703 | 2,703 | – | 2,703 | ||||||||||||||||||||||||
Total | $ | 34,564 | $ | 30,660 | $ | 896 | $ | 31,556 | $ | 32,846 | $ | 28,638 | $ | 1,391 | $ | 30,029 | ||||||||||||||||
| (1) | Based on total committed financing limit. |
| (2) | Net of allowance for loan losses and write-offs. |
As at October 31, 2013, the notional amount of backstop liquidity facilities we provide increased by $1.5 billion or 5.1% from the prior year. Total loans extended to the multi-seller conduits under the backstop liquidity facilities decreased by $495 million from the prior year primarily due to principal repayments. The partial credit enhancement facilities we provide increased by $186 million from the prior year. The increase in the amount of backstop liquidity facilities and partial credit enhancement facilities provided to the multi-seller conduits compared to the prior year primarily reflects a fluctuation in exchange rates and an expansion of the outstanding securitized assets of the multi-seller conduits in support of our clients’ securitization needs.
Maximum exposure to loss by client type
|
|
Table 37
|
| |||||||||||||||||||||
| 2013 | 2012 | |||||||||||||||||||||||
| As at October 31 (Millions) | (US$) | (C$) | Total (C$) | (US$) | (C$) | Total (C$) | ||||||||||||||||||
Outstanding securitized assets | ||||||||||||||||||||||||
Credit cards | $ | 6,096 | $ | 510 | $ | 6,866 | $ | 7,410 | $ | 510 | $ | 7,912 | ||||||||||||
Auto loans and leases | 8,643 | 2,252 | 11,264 | 7,903 | 2,193 | 10,087 | ||||||||||||||||||
Student loans | 3,374 | – | 3,518 | 2,429 | – | 2,427 | ||||||||||||||||||
Trade receivables | 2,688 | 56 | 2,859 | 2,290 | 112 | 2,400 | ||||||||||||||||||
Asset-backed securities | 859 | – | 896 | 1,454 | – | 1,453 | ||||||||||||||||||
Equipment receivables | 1,649 | – | 1,720 | 1,275 | – | 1,274 | ||||||||||||||||||
Consumer loans | – | – | – | 1,020 | – | 1,019 | ||||||||||||||||||
Electricity market receivables | – | 173 | 173 | – | 255 | 255 | ||||||||||||||||||
Dealer floor plan receivables | 765 | 740 | 1,538 | 587 | 561 | 1,147 | ||||||||||||||||||
Fleet finance receivables | 313 | 265 | 592 | 310 | 265 | 575 | ||||||||||||||||||
Insurance premiums | 87 | – | 90 | 87 | – | 87 | ||||||||||||||||||
Corporate loan receivables | 75 | – | 78 | 101 | – | 101 | ||||||||||||||||||
Residential mortgages | – | 1,530 | 1,530 | – | 1,020 | 1,020 | ||||||||||||||||||
Transportation finance | 415 | – | 432 | 272 | – | 272 | ||||||||||||||||||
Total | $ | 24,964 | $ | 5,526 | $ | 31,556 | $ | 25,138 | $ | 4,916 | $ | 30,029 | ||||||||||||
Canadian equivalent | $ | 26,030 | $ | 5,526 | $ | 31,556 | $ | 25,113 | $ | 4,916 | $ | 30,029 | ||||||||||||
42 Royal Bank of Canada: Annual Report 2013 Management’s Discussion and Analysis
Table of Contents
Our overall exposure increased 5.1% compared to the prior year reflecting a fluctuation in exchange rates and improved business conditions which led to an expansion of the outstanding securitized assets of the multi-seller conduits. Correspondingly, total assets of the multi-seller conduits increased by $1.5 billion or 5.0% over the prior year, primarily due to increase in the Auto loans and leases, Student loans, Trade and Equipment receivables and Residential mortgages asset classes, which was offset partially by decreases in the Credit cards, Consumer loans and Asset-backed securities asset classes.
Multiple independent debt rating agencies review all of the transactions in the multi-seller conduits. Transactions financed in the U.S. multi-seller conduits are reviewed by Moody’s Investors Service (Moody’s), Standard & Poor’s (S&P) and Fitch Ratings (Fitch). Transactions in the Canadian multi-seller conduits are also reviewed by Dominion Bond Rating Services (DBRS). Each applicable rating agency also reviews ongoing transaction performance on a monthly basis and may publish reports detailing portfolio and program information related to the conduits.
As at October 31, 2013, the total asset-backed commercial paper (ABCP) issued by the conduits amounted to $18.8 billion, an increase of $1.7 billion or 9.9% since the prior year. The increase in the amount of ABCP issued by the multi-seller conduits compared to the prior year is primarily due to increased client usage. The rating agencies that rate the ABCP rated 75% of the total amount issued within the top ratings category and the remaining amount in the second highest ratings category compared with 71% in the prior year.
We sometimes purchase ABCP issued by the multi-seller conduits in our capacity as a placement agent in order to facilitate overall program liquidity. As at October 31, 2013, the fair value of our inventory was $14 million, a decrease of $13 million from the prior year. The fluctuations in inventory held reflect normal trading activity. This inventory is classified as Securities – Trading on our Consolidated Balance Sheets.
Structured finance SPEs
We invest in ARS of entities which fund their long-term investments in student loans by issuing short-term senior and subordinated notes. As at October 31, 2013, the total assets of the unconsolidated ARS trusts in which we have significant investments were $2.8 billion (2012 – $3.9 billion). Our maximum exposure to loss in these ARS trusts as at October 31, 2013 was $680 million (2012 – $1.1 billion). The decrease in total assets and our maximum exposure to loss is primarily related to the sale, redemption or defeasement of the underlying ARS investment securities. As at October 31, 2013, approximately 89% of these investments were AAA rated. Interest income from the ARS investments, which is reported in Net-interest income was $6.5 million during the year (2012 – $19 million).
We also provide liquidity facilities to certain municipal bond Tender Option Bond (TOB) programs in which we have a significant interest but do not consolidate because the residual certificates are held by third parties. As at October 31, 2013, the total assets of these unconsolidated municipal bond TOB trusts were $941 million (2012 – $856 million) and our maximum exposure to loss was $572 million (2012 – $552 million). The increase in total assets of these TOB trusts and in our maximum exposure to loss relative to the prior year is primarily related to new TOB trusts and an increase in our TOB funding limits. Fee revenue from provision of liquidity facilities to these entities reported in Non-interest income was $3 million during the year (2012 – $2 million).
Investment funds
We enter into fee-based equity derivative transactions with third parties including mutual funds, unit investment trusts and other investment funds. These transactions provide their investors with the desired exposure to the referenced funds, and we economically hedge our exposure from these derivatives by investing in those third party managed referenced funds. Our maximum exposure as at October 31, 2013, which is primarily related to our investments in the reference funds, was $867 million (October 31, 2012 – $1.1 billion). The total assets held in the unconsolidated reference funds as at October 31, 2013 were $1.0 billion (October 31, 2012 – $1.6 billion). The decreases in total assets and our maximum exposure compared to the prior year are primarily due to negative performance of the reference funds and redemptions of capital by us and third-party investors in the funds.
Beginning in the first quarter of 2013, we also provide liquidity facilities to certain third party investment funds. The funds issue unsecured variable-rate preferred shares and invest in portfolios of tax exempt bonds. As at October 31, 2013, total assets in these funds were $584 million (October 31, 2012 – $nil).
Third-party securitization vehicles
We hold significant interests in certain unconsolidated third-party securitization vehicles, which are SPEs. We, as well as other financial institutions, are obligated to provide funding to these SPEs up to our maximum commitment level and are exposed to credit losses on the underlying assets after various credit enhancements. As at October 31, 2013, total assets of these funds were $4.4 billion (October 31, 2012 – $3.9 billion) and our maximum exposure to loss in these entities was $774 million (October 31, 2012 – $1.1 billion). The increase in total assets compared to the prior year reflects additional securitized assets funded by other investors in one of our SPEs. The decrease in our maximum exposure compared to prior periods reflects the amortizing nature of several of these transactions. Interest income earned in respect of these investments reported in Net-interest income was $10 million (2012 – $15 million).
We also invest in the securities issued by unconsolidated third-party SPEs, including government-sponsored SPEs, as part of our trading activities. These investments do not carry a funding commitment; therefore our maximum exposure to loss is limited to our investment. As at October 31, 2013, total assets of SPEs in which we have significant investments were $3.7 billion (October 31, 2012 – $2.9 billion). Our maximum exposure to loss in these entities was $218 million (October 31, 2012 – $118 million). Fluctuations in the amounts presented for these SPEs reflect normal trading activity and the extent to which our investments in certain entities are significant as at the end of the reporting period.
Credit investment product SPEs and Others
We use SPEs to create customized credit products to meet investors’ specific requirements and created tax credit funds. Refer to Note 7 to our 2013 Annual Consolidated Financial Statements for more detail on these SPEs.
Guarantees, retail and commercial commitments
We provide guarantees and commitments to our clients that expose us to liquidity and funding risks. Our maximum potential amount of future payments in relation to our commitments and guarantee products as at October 31, 2013 amounted to $232 billion compared to $204 billion in the prior year. The increase compared to the prior year relates primarily to business growth in wholesale commitments. Refer to Liquidity and Funding Management and Note 26 to our 2013 Annual Consolidated Financial Statements for details regarding our guarantees and commitments.
Management’s Discussion and Analysis Royal Bank of Canada: Annual Report 2013 43
Table of Contents
|
|
Our diversified business activities expose us to a wide variety of risks in virtually all aspects of our operations. Our ability to manage these risks is a key competency within RBC, and is supported by a strong risk culture and an effective risk management approach. We define risk as the potential for loss or an undesirable outcome with respect to volatility of actual earnings in relation to expected earnings, capital adequacy or liquidity.
We manage our risks by seeking to ensure that business activities and transactions provide an appropriate balance of return for the risks assumed and remain within our Risk Appetite, which is collectively managed throughout RBC, through adherence to our Enterprise Risk Appetite Framework. These risks include credit, market, liquidity and funding, insurance, regulatory compliance, operational, strategic, reputation and competitive risk. For further details, refer to the respective risk sections.
Enhanced Disclosure Task Force
|
On October 29, 2012, the Enhanced Disclosure Task Force (EDTF), established by the Financial Stability Board, issued its report “Enhancing the Risk Disclosures of Banks”, which included 32 recommendations aimed at improving clarity, comparability and transparency of risk disclosures. For a listing of the location of the related disclosures, refer to the Index for Enhanced Disclosure Task Force recommendations on page 98.
|
Our view of risks is not static. An important component of our enterprise risk management approach is to ensure that top risks which are evolving or emerging risks are appropriately identified, managed, and incorporated into existing enterprise risk management assessment, measurement, monitoring and escalation processes.
These practices ensure management is forward-looking in its assessment of risks to the organization. Identification of top and emerging risks occurs in the course of businesses developing and pursuing approved strategies and as part of the execution of risk oversight responsibilities by Group Risk Management (GRM), Finance, Corporate Treasury, Global Compliance and other control functions.
Risk oversight activities which can lead to identification of new, evolving or emerging risks include control mechanisms (e.g. approval of new products, transactions, projects or initiatives), business strategy development, stress testing, portfolio level measurement, monitoring and reporting activities, and the ongoing assessment of industry and regulatory developments.
Details of the top and emerging risks we are facing are discussed below.
Regulatory environment
Certain regulatory reforms will impact the way in which we operate, both in Canada and abroad. We continue to respond to these and other developments and are working to minimize any potential business or economic impact. The following regulatory reforms have potential to increase our operational, compliance, and technology costs.
Basel Committee on Banking Supervision global standards for capital and liquidity reform (Basel III)
The Basel Committee’s new standards for capital and liquidity establish minimum requirements for common equity, increased capital requirements for counterparty credit exposures, a new global leverage ratio and measures to promote the build up of capital that can be drawn down in periods of stress. Banks around the world have begun to implement these new standards (commonly referred to as Basel III).
On January 7, 2013, the Basel Committee released final rules for the short-term Basel III Liquidity Coverage Ratio (LCR), including phased timelines for compliance. The Basel global timeline sets the minimum required coverage at 60% for 2015 (increasing 10% per annum until full compliance is achieved by January 2019). While the Basel III long-term liquidity standard (the Net Stable Funding Ratio, or NSFR) has not been finalized, we continue to measure our liquidity position and make adjustments that we believe are appropriate in anticipation of the Basel Committee’s final NSFR implementation schedule.
In June 2013, the Basel Committee issued a revised leverage framework for industry consultation. Various jurisdictions including the U.S. have proposed or are in the process of developing national requirements for leverage. The Office of the Superintendent of Financial Institutions (OSFI) has not yet published a Canadian Basel III leverage requirement. Depending on the final leverage rules, the leverage ratio may require us to hold more capital than otherwise required under our risk-based measures.
In June 2013, the European Commission published the final Capital Requirements Directive (CRD 4) and the accompanying Capital Requirements Regulation (CRR) which implement the Basel III requirements in the European Union (EU), effective January 1, 2014. In addition to the Basel III requirements, CRD 4 / CRR introduces improvements to the transparency of activities of banks and investment funds in different countries, adds a host of governance standards (including standards for executive compensation and bonuses, board oversight of risk and board diversity), and implements a common reporting framework for regulatory reporting. This change may also result in higher capital requirements for our European subsidiaries.
Dodd-Frank – Enhanced Supervision of Foreign Banking Organizations
On December 14, 2012, the U.S. Federal Reserve proposed a new oversight regime for foreign banks operating in the United States, pursuant to sections 165 and 166 of theDodd-Frank Act. The rule is proposed to take effect in July 2015 and is intended to address the perceived systemic risk that large foreign banks could pose to the U.S. financial markets. Under the rule as proposed, we would be required to re-organize all of our U.S. bank and non-bank subsidiaries into a separately capitalized U.S. holding company, against which U.S. prudential regulations for capital, liquidity and enhanced supervision would apply. These include U.S. focused requirements for capital, liquidity, leverage, risk management, stress testing and early remediation, as well as limits on exposures to single counterparties. The majority of the proposed requirements would apply at the U.S. holding company level, while notably, the liquidity rules would extend to business activities conducted within our U.S. banking operations. We continue to assess the full implications of the proposal, and if adopted, there may be a need to develop a separate, U.S.-based infrastructure to meet these U.S.-specific requirements.
Dodd-Frank – Volcker Rule
The industry continues to await final implementation rules from U.S. federal financial regulators relating to the Volcker Rule. As currently drafted, the proposed rule would impact our global capital markets activities and funding activities as its extraterritorial reach extends to the bank and each of its subsidiaries and affiliates. Under the proposal, certain activities may be permitted to continue (e.g. exemptions available for
44 Royal Bank of Canada: Annual Report 2013 Management’s Discussion and Analysis
Table of Contents
underwriting, market making, and risk mitigating/hedging activities), although under new, restrictive definitions. Trading and investment activities outside of the U.S. may be permitted if conducted in accordance with certain exemptions from the regulation (e.g. activities found to be conducted solely outside of the U.S.), that may limit wholesale activities conducted in Canada or elsewhere. In anticipation of final rule issuance, we are continuing to analyze our investment, trading and funding activities across all of our businesses as part of our good faith compliance efforts to conform. This includes assessing our compliance and risk management programs as they relate to the proposed rule. Depending on the manner in which the rule is ultimately implemented, the proposed restrictions on proprietary trading and certain fund activities may have an adverse impact on our results of operations. U.S. regulators estimate final rules will be published by the end of 2013.
Over-the-counter (OTC) derivatives reform
Reforms in the OTC derivatives markets continue on a global basis, with the governments of the G20 nations proceeding with plans to transform the capital regimes, national regulatory frameworks and infrastructures in which we and other market participants operate. We, along with other Canadian banks, will experience changes in our wholesale banking business, some of which will impact our client- and trading-related derivatives revenues in Capital Markets. As part of this, we are implementing a compliance framework to adhere to the new mandatory clearing and reporting requirements of the U.S.Dodd-Frank and European Market Infrastructure Rules (EMIR) as they come into effect.
On December 31, 2012, we registered as a swaps dealer in the U.S. pursuant to the U.S. Commodity Futures Trading Commission (CFTC) requirements. To avoid the imposition of duplicative prudential requirements (and mitigate some of the expected compliance and operating costs), we are working with similarly-affected Canadian banks and Canadian and U.S. authorities to encourage reliance on the Canadian framework. The deadline for concluding discussions on a substitute compliance framework is December 21, 2013.
The payments system in Canada
The Federal government is currently reviewing a number of aspects of the Canadian payments system, including governance, mobile payments, debit and credit cards, and the state of the regulatory framework. Potential changes arising from the review could have implications for the bank from technological, systems, operational and regulatory perspectives. While the review is still at an early stage, risks associated with the implementation of these reforms could include implications for revenues and business strategies.
Foreign Account Tax Compliance Act (FATCA)
In 2010, the U.S. government passed legislation requiring non-U.S. financial institutions operating in the U.S. to provide information to U.S. tax authorities on non-U.S. persons’ financial accounts in order to identify persons evading U.S. taxes through the use of foreign (non-U.S.) accounts. Final regulations implementing FATCA were published on January 17, 2013. The rules are scheduled to take effect starting July 1, 2014. The U.S. is working to facilitate implementation with certain jurisdictions through the negotiation of Inter-Governmental Agreements (IGAs) and it is expected that Canada will ultimately sign such an agreement.
Regulatory reform in the U.K. and Europe
The regulatory framework in the U.K. and Europe continues to undergo significant reform and reorganization. In the U.K. we continue to monitor developments arising from recommendations made by the Independent Commission on Banking and endorsed by the U.K. government, in particular the requirement that banks ring-fence their retail banking activities from their investment banking operations. As currently proposed, our U.K. entities would be exempt from the requirement to separate our retail banking and investment banking activities, by virtue of meeting prescribedde minimis thresholds. The EMIR require firms to clear certain OTC standardized derivative contracts through central counterparties, establish risk mitigation controls for OTC derivatives transactions that cannot be cleared, and report both cleared and non-cleared contracts to trade repositories. The majority of the requirements came into force on March 15, 2013, while certain others are expected to come into force in 2014. The review of Markets in Financial Instruments Directive (MiFID II) is another key initiative seeking to achieve greater trade transparency, enhanced investor protection and more oversight of OTC derivatives and fixed income products, primarily through the introduction of new types of regulated trading platforms and increased governance over certain trading activities. Negotiations on the final shape of MiFID II are ongoing and are not expected to come into force before 2015.
High levels of Canadian household debt
Growing Canadian household debt levels and elevated housing prices are resulting in increasing vulnerability to external risk factors. Growth in consumer debt has been driven by rising housing prices and high debt levels could amplify the effect of an external shock to the Canadian economy. In an increasing interest rate environment the debt service capacity of Canadian consumers will be negatively impacted. This will be more challenging for consumers with floating rate debt or impending mortgage renewals. The combination of increasing unemployment, rising interest rates, and a downturn in real estate markets would pose a risk to the credit quality of our retail lending portfolio. We actively manage our lending portfolios and stress test them against various scenarios. Our stress testing shows that the vast majority of our mortgage clients have sufficient capacity to absorb interest rate increases in the ranges currently forecast. For further discussion relating to our retail portfolio, refer to the Credit risk section.
Cybersecurity
Given our reliance on digital and internet technologies to conduct and expand our global operations, we are increasingly exposed to risks related to cybersecurity. Such incidents may include unauthorized access to our systems for purposes of misappropriating assets, gaining access to sensitive information, corrupting data, or causing operational disruption. Although our computer systems continue to be subject to cyber attacks, to date we have not experienced a material breach of cybersecurity. Such an event could compromise our confidential information as well as that of our clients and third parties with whom we interact and may result in negative consequences, including remediation costs, loss of revenue, additional regulatory scrutiny, litigation and reputational damage. We continue to place a significant focus on enhancing our cybersecurity technologies, processes and practices to protect our networks, systems, computers and data from attack, damage or unauthorized access. We will continue to actively monitor the cybersecurity threat landscape to review best practices and to implement additional controls to mitigate this risk.
Management’s Discussion and Analysis Royal Bank of Canada: Annual Report 2013 45
Table of Contents
|
Our Enterprise Risk Management Framework provides an overview of our enterprise-wide programs for identifying, measuring, controlling and reporting on the significant risks that face the organization.
Risk culture
Our strong risk culture begins with setting the right tone at the top, from the Board of Directors to senior management, and across all businesses and employees. In order to reinforce our strong risk culture, risk accountabilities play an important part in performance evaluations. We are committed to maintaining our strong risk culture which is built on fostering risk awareness, a clear understanding of the risks that one can take and in developing a strong sense of responsibility for risk.
We have a strong ethical culture of integrity and compliance grounded in our Code of Conduct. The Code of Conduct broadly addresses a variety of ethical and legal concerns that our employees face on a daily basis. Our Code of Conduct is supported by a number of global and regional compliance frameworks, policies, training programs, online tools, job aids, new employee orientation materials, and the direction of senior management.
Risk Appetite
Our Risk Appetite is the amount and type of risk we are able and willing to accept in the pursuit of our business objectives. Our Risk Appetite Framework has four major components as illustrated below:
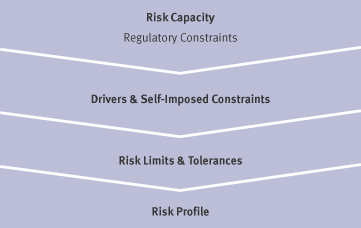
The framework provides a structured approach to:
| 1. | Define ourRisk Capacity by identifying regulatory constraints that restrict our ability to accept risk. |
| 2. | Establish and regularly confirm our Risk Appetite, comprised ofDriversthat are the business objectives which include risks we must accept to generate desired financial returns, andSelf-Imposed Constraints that limit or otherwise influence the amount of risk undertaken. Our Self-Imposed Constraints include: |
| • | maintaining stability of earnings; |
| • | avoiding excessive concentrations of risk; |
| • | maintaining low exposure to stress events; |
| • | ensuring sound management of regulatory compliance risk and operational risk; |
| • | ensuring sound management of liquidity and funding risk; |
| • | ensuring capital adequacy by maintaining capital ratios in excess of rating agency and regulatory expectations; |
| • | maintaining a AA rating; and |
| • | maintaining a Risk Profile that is consistent with our international peer group. |
| 3. | SetRisk Limits and Tolerances to ensure that risk-taking activities are within Risk Appetite. |
| 4. | Regularly measure and evaluate ourRisk Profile, representing the risks we are exposed to, relative to our Risk Appetite, and ensure appropriate action is taken prior to Risk Profile surpassing Risk Appetite. |
The Enterprise Risk Appetite Framework is structured in such a way that it can be applied at the enterprise, business segment, business unit, and legal entity levels. Risk Appetite is integrated into our business strategies and capital plan. As part of strategic planning, each business segment’s risk posture is assessed to anticipate the impact of strategic priorities and growth objectives on Risk Profile. We also ensure that the business strategy aligns with the enterprise and business segment level Risk Appetite.
Risk management principles
The following principles guide our enterprise-wide management of risk:
| 1. | Effective balancing of risk and reward by aligning Risk Appetite with business strategy, diversifying risk, pricing appropriately for risk, mitigating risk through preventive and detective controls and transferring risk to third parties. |
| 2. | Shared responsibility for risk managementas business segments are responsible for active management of their risks, with direction and oversight provided by GRM and other corporate functions groups. |
| 3. | Business decisions are based on an understanding of riskas we perform rigorous assessment of risks in relationships, products, transactions and other business activities. |
| 4. | Avoid activities that are not consistent with our values, Code of Conduct or policies, which contributes to the protection of our reputation. |
| 5. | Proper focus on clients reduces our risks by knowing our clients and ensuring that all products and transactions are suitable for, and understood by our clients. |
| 6. | Use of judgment and common sense in order to manage risk throughout the organization. |
46 Royal Bank of Canada: Annual Report 2013 Management’s Discussion and Analysis
Table of Contents
Risk governance
Our overall risk governance structure shown below illustrates our Three Lines of Defence governance model.
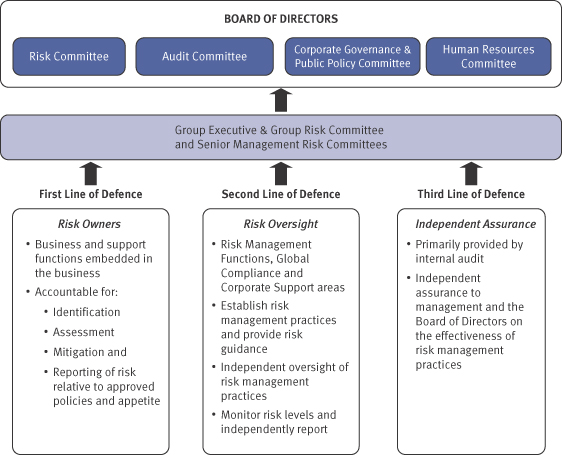
The Board of Directors provides oversight and carries out its risk management mandate primarily through its committees which include the Risk Committee, the Audit Committee, the Corporate Governance & Public Policy Committee and the Human Resources Committee. The Board of Directors has responsibility for approving our Risk Appetite.
The purpose of the Risk Committee is to oversee our risk management program. The Risk Committee’s oversight role is designed to ensure that the risk management function is adequately independent from the businesses whose activities it reviews, and that the policies, procedures and controls used by management are sufficient to keep risks within our risk appetite.
The Audit Committee also has a risk oversight role through its responsibilities to review our internal controls and the control environment, and to ensure that policies related to capital management and adequacy are in place and effective. The Audit Committee regularly reviews reporting on legal and regulatory compliance risks including significant litigation issues and regulatory compliance matters.
In addition, the following board committees have specific reputation risk oversight responsibilities:
| • | Corporate Governance & Public Policy Committee monitors the effectiveness of our corporate governance, reviews policies and programs, reviews our efforts to understand and meet changing public values and expectations, and identifies, assesses and advises management on public affairs issues related to our image and reputation. |
| • | Human Resources Committee, along with the Risk Committee, is jointly responsible for our Code of Conduct, and actively oversees the design and operation of our compensation system. |
The Group Executive (GE) is comprised of our senior management team and is led by the President & Chief Executive Officer (CEO). The GE is responsible for our strategy and its execution and establishing the “tone at the top”. The GE actively shapes and recommends our Risk Appetite for approval by the Board of Directors. The GE’s risk oversight role is executed primarily through the mandate of the Group Risk Committee (GRC). The GRC with the assistance of its supporting senior management risk committees is responsible for ensuring that our overall Risk Profile is consistent with our strategic objectives and remains within Risk Appetite and there are ongoing, appropriate and effective risk management processes.
TheFirst Line of Defence is provided by the business as well as support functions embedded in the business. The First Line of Defence has ownership and accountability for:
| • | Risk identification, assessment, mitigation, control and reporting in accordance with established enterprise risk policies; and |
| • | Alignment of business and operational strategies with corporate risk culture and Risk Appetite. |
TheSecond Line of Defence is provided by functions with independent oversight accountabilities such as GRM, Global Compliance, and other corporate support areas. The Second Line of Defence:
| • | Establishes the enterprise level risk management frameworks and policies, and provides risk guidance, |
| • | Provides oversight of the effectiveness of First Line risk management practices, and |
| • | Monitors and independently reports on the level of risk relative to established appetite. |
The Chief Risk Officer (CRO) and GRM have overall responsibility for promoting our risk culture; monitoring our Risk Profile relative to our Risk Appetite; and maintaining our enterprise-wide program for identifying, measuring, controlling and reporting the significant risks that we face. The Chief Compliance Officer and Global Compliance are responsible for our policies and processes designed to mitigate and manage regulatory compliance risk. Corporate Treasury manages and oversees our capital position, structural interest rate risk and liquidity and funding risks.
Management’s Discussion and Analysis Royal Bank of Canada: Annual Report 2013 47
Table of Contents
TheThird Line of Defence is primarily provided by internal audit. The Third Line of Defence provides independent assurance to senior management and the Board of Directors on the effectiveness of risk management policies, processes and practices in all areas of our organization.
The roles of the various stakeholders in our enterprise risk management program are described further in the discussion of specific risks in the following pages.
Risk measurement
Our ability to measure risks is a key component of our enterprise-wide risk and capital management processes. Certain measurement methodologies are common to a number of risk types, while others only apply to a single risk type. While quantitative risk measurement is important, we also place reliance on qualitative factors. Our measurement models and techniques are continually subject to independent assessment for appropriateness and reliability. For those risk types that are difficult to quantify, we place greater emphasis on qualitative risk factors and assessment of activities to gauge the overall level of risk to ensure that they are within our Risk Appetite.
Quantifying expected loss
Expected loss represents losses that are statistically expected to occur in the normal course of business in a given period of time. For credit risk, the key parameters used to measure our exposure to expected loss are probability of default, loss given default, and exposure at default. For market risk, a statistical technique known as Value-at-Risk (VaR) is used to measure losses under normal market conditions.
Quantifying unexpected loss
Unexpected loss is a statistical estimate of the amount by which actual losses can exceed expected loss over a specified time horizon, measured at a specified level of confidence. We hold capital to withstand these unexpected losses, should they occur. For further information, refer to the Capital management section.
Stress testing
Stress testing examines potential effects resulting from changes in risk drivers corresponding to exceptional but plausible adverse events, and is an important component of our risk management framework. Stress testing results are used in:
| • | monitoring our risk profile relative to risk appetite; |
| • | setting limits; |
| • | identifying key risks to and potential shifts in our capital levels and financial position; |
| • | enhancing our understanding of available mitigating actions in response to adverse events; and |
| • | assessing the adequacy of our target capital levels. |
Our enterprise-wide stress tests evaluate key balance sheet, income statement, and capital impacts arising from risk exposures and changes in earnings. The results are used by our senior management risk committees, the GRC, and the Board of Directors to understand our performance drivers under stress, and review stressed capital ratios against regulatory constraints and internal targets. The results are also explicitly incorporated into our Internal Capital Adequacy Assessment Process (ICAAP) and Capital Plan analyses.
We annually evaluate a number of enterprise-wide stress test scenarios over a multi-year horizon, featuring a range of severities. Our Board of Directors approves the recommended scenarios, and GRM leads the scenario assessment process. Results from across the organization are integrated to develop an enterprise-wide view of the impacts, with input from subject matter experts in GRM, Corporate Treasury, Finance, and Economics. Recent scenarios evaluated include severe recessions, energy price shocks, and natural catastrophe events.
Stress testing of specific risk types such as market risk, liquidity risk, structural interest rate risk, retail and wholesale credit risk, operational risk, and insurance risk supplement our enterprise-wide stress tests. Results may be used in a variety of decision-making processes including risk limit setting, portfolio composition, or business implementation strategies. For further details of some of these programs, refer to the Market risk and Liquidity and funding management sections.
Ad-hoc stress tests are used periodically to inform business planning and risk management decisions related to a particular line of business or portfolio. Along with our internal stress testing program, we also participate in a number of regulator-required stress test exercises at both the consolidated and subsidiary levels.
Validation of measurement models
We widely use models for many purposes, including validation of financial products and the measurement and management of different types of risk. Models are subject to validation by qualified employees that are sufficiently independent of the model design and development, or by approved external parties. Model validation is a comprehensive independent review of a model that checks the applicability of the model’s logic, its assumptions and theoretical underpinnings, the appropriateness of input data sources, and provides an interpretation of the model results and the strategic use of the model outputs. By reviewing and evaluating a model’s assumptions as well as its limitations, initial and ongoing model validation helps ensure the model incorporates current market developments and industry trends. Our model validation process is designed to ensure that all underlying model risk factors are identified and successfully mitigated.
Risk control
Our enterprise-wide risk management approach is supported by a comprehensive set of risk controls. The controls are anchored by our Enterprise Risk Management and Risk-Specific Frameworks. These frameworks lay the foundation for the development and communication of policies, establishment of formal risk review and approval processes, and the establishment of delegated authorities and limits. The implementation of robust risk controls enables the optimization of risk and return on both a portfolio and a transactional basis.
Our risk management frameworks and policies are organized into the following five levels:
Level 1: Enterprise Risk Management Framework provides an overview of our enterprise-wide program for identifying, measuring, controlling and reporting on the significant risks we face. The Risk Appetite Framework underpins this framework.
Level 2: Risk-Specific Frameworkselaborate on each specific risk type and the mechanisms for identifying, measuring, monitoring and reporting of risks; key policies; and roles and responsibilities.
Level 3: Enterprise Risk Policies articulate minimum requirements, within which businesses and employees must operate.
Level 4: “Multi-risk” Enterprise Risk Policies govern activities such as product risk review and approval, stress testing, risk limits, risk approval authorities and model risk management.
Level 5: Business Segments and Corporate Support; Specific Policies and Procedures are established to manage the risks that are unique to their operations.
48 Royal Bank of Canada: Annual Report 2013 Management’s Discussion and Analysis
Table of Contents
Risk review and approval processes
Risk review and approval processes are established by GRM based on the nature, size, and complexity of the risk involved. In general, the risk review and approval process involves a formal review and approval by an individual, group or committee that is independent from the originator. The approval responsibilities are governed by delegated authorities based on the following categories: transactions, structured credit, projects and initiatives, and new products and services.
Authorities and limits
The Risk Committee of the Board of Directors delegates credit, market, and insurance risk authorities to the President & CEO and the CRO. These delegated authorities allow these officers to approve single name, geographic (country and region) and industry sector exposures within defined parameters to manage concentration risk, establish underwriting and inventory limits for trading and investment banking activities and set market risk tolerances.
The Board of Directors also delegates liquidity risk authorities to the President & CEO, Chief Administrative Officer and Chief Financial Officer, and the CRO. These limits act as a key risk control designed to ensure that reliable and cost-effective sources of cash or its equivalent are available to satisfy our current and prospective commitments.
Reporting
Enterprise level risk monitoring and reporting are critical components of our enterprise risk management program and support the ability of senior management and the Board of Directors to effectively perform their risk management and oversight responsibilities. On a quarterly basis, we provide to senior management and the Board of Directors the Enterprise Risk Report which includes a comprehensive review of our Risk Profile relative to our Risk Appetite and focuses on the range of risks we face along with analysis of the related issues and trends. In addition to our regular risk monitoring, other risk specific presentations are provided to and discussed with senior management and the Board of Directors on top and emerging risk issues or significant changes in our level of risk.
Risk in the context of our business activities
In carrying out our business activities, we are exposed to a range of risks. The following chart provides a high level view of risks within our business segments. We have used risk capital (i.e. economic capital less capital attribution for goodwill and intangibles) to illustrate the relative size of the risks in each of our businesses. The risk capital distribution reflects the diversified nature of our business activities.
Within Personal & Commercial Banking credit risk is the most significant risk, largely related to our personal financial services, business financial services and cards businesses. The primary risks within Wealth Management, which provides services to institutional and individual clients, are operational risk and credit risk. Risks within our Insurance operations primarily relate to insurance risk in our life, health, home and auto businesses followed by market risk and operational risk. The largest risk within Investor & Treasury Services is credit risk, followed by market risk and operational risk. The most significant risk within Capital Markets is credit risk followed by market risk.
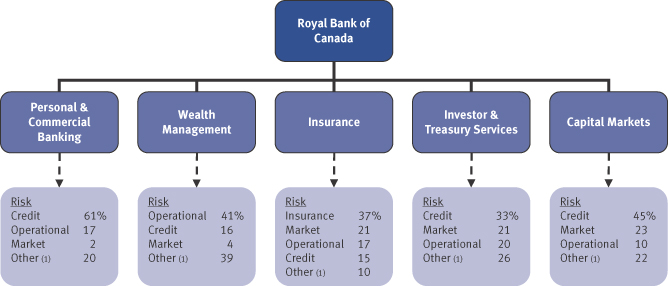
| (1) | Other risks include regulatory capital allocation, business risk, and fixed assets risk. |
The shaded texts along with the tables specifically marked with an asterisk(*) in the following sections of the MD&A represent our disclosures on credit, market and liquidity and funding risks in accordance with IFRS 7, Financial Instruments: Disclosures, and include discussion on how we measure our risks and the objectives, policies and methodologies for managing these risks. Therefore, these shaded texts and tables represent an integral part of our 2013 Annual Consolidated Financial Statements.
Management’s Discussion and Analysis Royal Bank of Canada: Annual Report 2013 49
Table of Contents
|
| Credit risk is the risk of loss associated with an obligor’s potential inability or unwillingness to fulfill their contractual obligations. Credit risk may arise directly from the risk of default of a primary obligor (e.g. issuer, debtor, counterparty, borrower or policyholder), or indirectly from a secondary obligor (e.g. guarantor or reinsurer). |
The failure to effectively manage credit risk across all our products, services and activities can have a direct, immediate and material impact on our earnings and reputation.
We balance our risk and return by: • Ensuring credit quality is not compromised for growth; • Diversifying credit risks in transactions, relationships and portfolios; • Using our credit risk rating and scoring systems or other approved credit risk assessment or rating methodologies, policies and tools; • Pricing appropriately for the credit risk taken; • Applying consistent credit risk exposure measurements; • Mitigating credit risk through preventive and detective controls; • Transferring credit risk to third parties, where appropriate, through approved credit risk mitigation techniques, including hedging activities and insurance coverage; and • Ongoing credit risk monitoring and administration. |
Risk measurement
We quantify credit risk, at both the individual obligor and portfolio levels, to manage expected credit losses and minimize unexpected losses in order to limit earnings volatility. We employ different risk measurement processes for our wholesale and retail credit portfolios. The wholesale portfolio comprises businesses, sovereigns, public sector entities, banks and other financial institutions, and certain individuals and small businesses that are managed on an individual client basis. The retail portfolio is comprised of residential mortgages and personal, credit card and small business loans, which are managed on a pooled basis. Credit risk rating systems are designed to assess and quantify the risk inherent in credit activities in an accurate and consistent manner. In measuring credit risk and setting regulatory capital, two principal approaches are available: Internal Ratings Based (IRB) Approach and Standardized Approach. Most of our credit risk exposure is measured under the IRB Approach. Economic capital, which is our internal quantification of risks, is used extensively for performance measurement, limit setting and internal capital adequacy. The key parameters that form the basis of our credit risk measures for both regulatory and economic capital are: • Probability of default (PD): An estimated percentage that represents the likelihood of default within a one-year period of an obligor for a specific rating grade or for a particular pool of exposure. • Exposure at default (EAD): An amount expected to be owed by an obligor at the time of default. • Loss given default (LGD): An estimated percentage of EAD that is not expected to be recovered during the collections and recovery process.
These parameters are determined based on historical experience from internal credit risk rating systems in accordance with supervisory standards, and are independently validated and updated on a regular basis. Under the Standardized Approach, used primarily for Investor Services and our Caribbean and U.S. banking operations, risk weights prescribed by OSFI are used to calculate risk-weighted assets (RWA) for credit risk exposure. |
50 Royal Bank of Canada: Annual Report 2013 Management’s Discussion and Analysis
Table of Contents
Wholesale credit portfolio
| The wholesale credit risk rating system is designed to measure the credit risk inherent in our wholesale lending activities. |
Each obligor is assigned a borrower risk rating (BRR), reflecting an assessment of the credit quality of the obligor. Each BRR has a PD assigned to it. The BRR differentiates the riskiness of obligors and represents our evaluation of the obligor’s ability and willingness to meet its contractual obligations on time over a three year time horizon. The assignment of BRRs is based on the evaluation of the obligor’s business risk and financial risk and is based on a fundamental credit analysis. The determination of the PD associated with each BRR relies primarily on internal default history since the late 1990s augmented where necessary with reference to external data. PD estimates are designed to be a conservative reflection of our experience across the economic cycle including periods of stress or economic downturn. Our rating system is largely consistent with that of external rating agencies. The following table maps our 22-grade internal risk ratings compared to ratings by external rating agencies. |
Internal ratings map*
|
Table 38
| |||||
| Ratings | Standard & Poor’s (S&P) | Moody’s Investors Service (Moody’s) | Description | |||
1 | AAA | Aaa | Investment Grade | |||
2 | AA+ | Aa1 | ||||
3 | AA | Aa2 | ||||
4 | AA- | Aa3 | ||||
5 | A+ | A1 | ||||
6 | A | A2 | ||||
7 | A- | A3 | ||||
8 | BBB+ | Baa1 | ||||
9 | BBB | Baa2 | ||||
10 | BBB- | Baa3 | ||||
11 | BB+ | Ba1 | Non-investment Grade | |||
12 | BB | Ba2 | ||||
13 | BB- | Ba3 | ||||
14 | B+ | B1 | ||||
15 | B | B2 | ||||
16 | B- | B3 | ||||
17 | CCC+ | Caa1 | ||||
18 | CCC | Caa2 | ||||
19 | CCC- | Caa3 | ||||
20 | CC | Ca | ||||
21 | D | C | Impaired | |||
22 | Bankruptcy | Bankruptcy | ||||
| * | This table represents an integral part of our 2013 Annual Consolidated Financial Statements. |
Each credit facility is assigned an LGD rate. LGD rates are largely driven by factors that will impact the extent of any losses in the event the obligor defaults and include seniority of debt, collateral security, and the industry sector in which the obligor operates. Estimated LGD rates draw primarily on internal loss experience since the late 1990s. Where we have limited internal loss data we also look to external data to inform the estimation. LGD rates are estimated to reflect conditions that might be expected to prevail in a period of an economic downturn, with additional conservatism added to reflect data limitations and judgments made in the estimation process. EAD is estimated based on the current exposure to the obligor and the possible future changes in that exposure driven by factors such as the nature of the credit commitment and the type of obligor. As with LGD, rates are estimated to reflect downturn conditions, with added conservatism to reflect data and modeling uncertainty. Estimates are based on internal data dating back to the late 1990s. Estimates of PD, LGD, and EAD are updated, and then validated and back-tested by an independent team within the Bank, on an annual basis. In addition, quarterly monitoring and back-testing is performed by the estimation team. These ratings and risk measurements are used in the determination of our expected losses and unexpected losses as well as economic and regulatory capital, setting of risk limits, portfolio management and product pricing. |
Retail credit portfolio
Credit scoring is the primary risk rating system for assessing obligor and transaction risk for retail exposures. Credit scores along with decision strategies are employed in the acquisition of new clients (acquisition) and management of existing clients (behavioural). Criteria used to pool exposures for risk quantification include behavioural score, product type (mortgages, credit cards, lines of credit and instalment loans), collateral type (chattel, liquid assets and real estate), loan to value, and the delinquency status (performing, delinquent and default) of the exposure. Regular monitoring and periodic adjustments and alignments are conducted to ensure that this process provides for a meaningful differentiation of risk. Migration between the pools is considered when assessing credit quality. The pools are also assessed based on credit risk parameters (PD and EAD) which consider borrower and transaction characteristics, including behavioural credit score, product type and delinquency status. LGD is reviewed and re-estimated on an annual basis under the Basel III IRB Approach. The estimation is based on transaction specific factors, including product, loan to value and collateral types. LGD is determined based on over 10 years of historical economic losses with the highest degree of granularity and sufficient margin of conservatism. Parameters are validated and back-tested by an independent team within the bank. |
Management’s Discussion and Analysis Royal Bank of Canada: Annual Report 2013 51
Table of Contents
The following table maps PD bands to various risk levels:
Internal ratings map*
|
Table 39
| |
| PD bands | Description | |
0% – 1.0% | Low risk | |
1.1% – 6.4% | Medium risk | |
6.5% – 99.99% | High risk | |
100.00% | Impaired/Default |
| * | This table represents an integral part of our 2013 Annual Consolidated Financial Statements. |
Risk control
The Board of Directors and its committees, the GE, the GRC and other senior management risk committees work together to ensure a Credit Risk Framework and supporting policies, processes and procedures exist to manage credit risk and approve related credit risk limits. Reports are distributed to the Board of Directors, the GRC, and senior executives to keep them informed of our Risk Profile, including trending information and significant credit risk issues and shifts in exposures to ensure appropriate actions can be taken where necessary. Our enterprise-wide credit risk policies set out the minimum requirements for the management of credit risk in a variety of borrower, transactional and portfolio management contexts. Credit policies are an integral component of our Credit Risk Management Framework and set out the minimum requirements for the management of credit risk as follows:
Credit risk assessment • Mandatory use of credit risk rating and scoring systems. • Consistent credit risk assessment criteria. • Standard content requirements in credit application documents.
Credit risk mitigation Structuring of transactions • Specific credit policies and procedures set out the requirements for structuring transactions. Risk mitigants include the use of guarantees, seniority, loan-to-value requirements and covenants. Product-specific guidelines set out appropriate product structuring as well as client and guarantor criteria. The third-party guarantors that we deal with are primarily sovereign-sponsored agencies. Collateral • We often require obligors to pledge collateral as security when we advance credit. The extent of risk mitigation provided by collateral depends on the amount, type and quality of the collateral taken. Specific requirements relating to collateral valuation and management are documented in our credit risk management policies. Credit derivatives • Used as a tool to mitigate industry sector concentration and single-name exposure. For a more detailed description of the types of credit derivatives we enter into and how we manage related credit risk, refer to Note 8 of our 2013 Annual Consolidated Financial Statements.
Product approval • Proposals for credit products and services are comprehensively reviewed and approved under a risk assessment framework.
Credit portfolio management • Limits are used to ensure our portfolio is well-diversified, manage concentration risk and remain within our Risk Appetite. Limits are reviewed on a regular basis taking into account the business, economic, financial and regulatory environments. • Our credit limits are established at the following levels: single name limits (notional and economic capital), underwriting risk limits, geographic (country and region) limits, industry sector limits (notional and economic capital), and product and portfolio limits, where deemed necessary.
|
Gross credit risk exposure Gross credit risk exposure is calculated based on the definitions provided under the Basel II and Basel III frameworks. Under this method, risk exposure is calculated before taking into account any collateral and inclusive of an estimate of potential future changes to that credit exposure. Gross credit risk is categorized into lending-related and other, and trading-related. |
Lending-related and other includes: • Loans and acceptances outstanding, undrawn commitments, and other exposures including contingent liabilities such as letters of credit and guarantees, Available-for-sale (AFS) debt securities and deposits with financial institutions. Undrawn commitments represent an estimate of the contractual amount that may be drawn upon at the time of default of an obligor. |
Trading-related credit includes: • Repo-style transactions which include repurchase and reverse repurchase agreements and securities lending and borrowing transactions. For repo-style transactions, gross exposure represents the amount at which securities were initially financed, before taking into account collateral. • Derivatives gross exposure amount which represents the credit equivalent amount, which is defined by OSFI as the replacement cost plus an amount for potential future credit exposure. |
52 Royal Bank of Canada: Annual Report 2013 Management’s Discussion and Analysis
Table of Contents
Gross (excluding allowance for loan losses) credit risk exposure by portfolio and sector*
|
|
Table 40
|
| |||||||||||||||||||||||||||||||||||||||||||||||||
| As at | ||||||||||||||||||||||||||||||||||||||||||||||||||||
October 31 2013 | October 31 2012 | |||||||||||||||||||||||||||||||||||||||||||||||||||
| Lending-related and other | Trading-related | Lending-related and other | Trading-related | |||||||||||||||||||||||||||||||||||||||||||||||||
| Loans and acceptances | Loans and acceptances | |||||||||||||||||||||||||||||||||||||||||||||||||||
(Millions of Canadian dollars) | Outstanding | | Undrawn commitments | | Other (1) | | Repo-style transactions | | Derivatives (2) | | Total exposure (3) | | Outstanding | | Undrawn commitments | | Other (1) | | Repo-style transactions | | Derivatives (2) | | Total exposure (3) | | ||||||||||||||||||||||||||||
Residential mortgages | $ | 209,238 | $ | – | $ | – | $ | – | $ | – | $ | 209,238 | $ | 198,324 | $ | – | $ | – | $ | – | $ | – | $ | 198,324 | ||||||||||||||||||||||||||||
Personal | 94,311 | 77,463 | 32 | – | – | 171,806 | 86,697 | 70,274 | 39 | – | – | 157,010 | ||||||||||||||||||||||||||||||||||||||||
Credit cards | 14,142 | 20,347 | – | – | – | 34,489 | 13,661 | 18,036 | – | – | – | 31,697 | ||||||||||||||||||||||||||||||||||||||||
Small business (4) | 3,987 | 4,043 | 41 | – | – | 8,071 | 2,503 | 3,933 | 40 | – | – | 6,476 | ||||||||||||||||||||||||||||||||||||||||
Retail | $ | 321,678 | $ | 101,853 | $ | 73 | $ | – | $ | – | $ | 423,604 | $ | 301,185 | $ | 92,243 | $ | 79 | $ | – | $ | – | $ | 393,507 | ||||||||||||||||||||||||||||
Business (4) | ||||||||||||||||||||||||||||||||||||||||||||||||||||
Agriculture | $ | 5,441 | $ | 630 | $ | 51 | $ | – | $ | 30 | $ | 6,152 | $ | 5,202 | $ | 659 | $ | 29 | $ | – | $ | 29 | $ | 5,919 | ||||||||||||||||||||||||||||
Automotive | 6,167 | 3,602 | 255 | – | 451 | 10,475 | 3,585 | 3,219 | 240 | – | 546 | 7,590 | ||||||||||||||||||||||||||||||||||||||||
Consumer goods | 6,230 | 5,786 | 509 | – | 142 | 12,667 | 5,432 | 3,510 | 467 | – | 224 | 9,633 | ||||||||||||||||||||||||||||||||||||||||
Energy | 8,906 | 19,843 | 3,140 | – | 2,047 | 33,936 | 8,802 | 17,229 | 2,762 | 29 | 1,598 | 30,420 | ||||||||||||||||||||||||||||||||||||||||
Non-bank financial services | 4,903 | 8,529 | 13,374 | 134,290 | 18,368 | 179,464 | 3,895 | 6,954 | 11,149 | 124,925 | 6,051 | 152,974 | ||||||||||||||||||||||||||||||||||||||||
Forest products | 893 | 434 | 104 | – | 15 | 1,446 | 811 | 398 | 97 | – | 11 | 1,317 | ||||||||||||||||||||||||||||||||||||||||
Industrial products | 4,038 | 3,656 | 384 | – | 266 | 8,344 | 3,938 | 2,727 | 292 | – | 197 | 7,154 | ||||||||||||||||||||||||||||||||||||||||
Mining & metals | 1,074 | 2,648 | 807 | – | 158 | 4,687 | 965 | 2,630 | 681 | 91 | 113 | 4,480 | ||||||||||||||||||||||||||||||||||||||||
Real estate & related | 24,413 | 5,461 | 1,487 | 7 | 295 | 31,663 | 20,650 | 4,531 | 1,366 | – | 337 | 26,884 | ||||||||||||||||||||||||||||||||||||||||
Technology & media | 4,006 | 6,883 | 500 | 3 | 620 | 12,012 | 4,203 | 4,922 | 242 | 2 | 359 | 9,728 | ||||||||||||||||||||||||||||||||||||||||
Transportation & environment | 5,593 | 3,032 | 1,574 | – | 564 | 10,763 | 5,221 | 2,515 | 1,069 | – | 976 | 9,781 | ||||||||||||||||||||||||||||||||||||||||
Other | 21,520 | 9,989 | 9,060 | 2,202 | 14,537 | 57,308 | 20,554 | 8,575 | 7,783 | 25,807 | 3,964 | 66,683 | ||||||||||||||||||||||||||||||||||||||||
Sovereign (4), (5) | 4,396 | 5,527 | 34,789 | 27,193 | 8,319 | 80,224 | 4,193 | 5,026 | 36,239 | 20,130 | 7,868 | 73,456 | ||||||||||||||||||||||||||||||||||||||||
Bank (4) | 1,320 | 270 | 67,007 | 87,953 | 21,243 | 177,793 | 990 | 406 | 66,878 | 85,164 | 21,868 | 175,306 | ||||||||||||||||||||||||||||||||||||||||
Wholesale | $ | 98,900 | $ | 76,290 | $ | 133,041 | $ | 251,648 | $ | 67,055 | $ | 626,934 | $ | 88,441 | $ | 63,301 | $ | 129,294 | $ | 256,148 | $ | 44,141 | $ | 581,325 | ||||||||||||||||||||||||||||
Total exposure | $ | 420,578 | $ | 178,143 | $ | 133,114 | $ | 251,648 | $ | 67,055 | $ | 1,050,538 | $ | 389,626 | $ | 155,544 | $ | 129,373 | $ | 256,148 | $ | 44,141 | $ | 974,832 | ||||||||||||||||||||||||||||
| * | This table represents an integral part of our 2013 Annual Consolidated Financial Statements. |
| (1) | Includes contingent liabilities such as letters of credit and guarantees, AFS debt securities and deposits with financial institutions. |
| (2) | Credit equivalent amount after factoring in master netting agreements. |
| (3) | Gross credit risk exposure is before allowance for loan losses. Exposure under Basel III (2013) and Basel II (2012) asset classes of qualifying revolving retail and other retail are largely included within Personal and Credit cards, while home equity lines of credit are included in Personal. |
| (4) | Refer to Note 5 of our 2013 Annual Consolidated Financial Statements for the definition of these terms. |
| (5) | Sovereign as at October 31, 2012 was previously restated to include deposits with a central bank, which were previously not included in our exposure. |
2013 vs. 2012
Total gross credit risk exposure increased $76 billion or 8% from the prior year, largely reflecting increases in outstanding loans, undrawn lending commitments and derivatives.
Retail exposure increased $30 billion or 8%, primarily due to solid volume growth in Canadian home equity products reflecting the ongoing low interest rate environment and our acquisition of Ally Canada.
Wholesale exposure increased $46 billion or 8%, largely due to an increase in outstanding loans and undrawn commitments driven by higher corporate lending along with an increase in derivatives. Derivatives increased as a result of the implementation of Basel III and now includes exposures related to exchange traded derivatives and derivatives with central clearing counterparties in the calculation of Total exposure. Wholesale loan utilization was 37%, unchanged from the prior year.
Gross (excluding allowance for loan losses) credit risk exposure by geography*
|
|
Table 41
|
| |||||||||||||||||||||||||||||||||||||||||||||||||
| As at | ||||||||||||||||||||||||||||||||||||||||||||||||||||
October 31 2013 | October 31 2012 | |||||||||||||||||||||||||||||||||||||||||||||||||||
| Lending-related and other | Trading-related | Lending-related and other | Trading-related | |||||||||||||||||||||||||||||||||||||||||||||||||
| Loans and acceptances | Loans and acceptances | |||||||||||||||||||||||||||||||||||||||||||||||||||
| (Millions of Canadian dollars) | Outstanding | Undrawn commitments | Other | Repo-style transactions | Derivatives (1) | Total exposure (2) | Outstanding | Undrawn commitments | Other | Repo-style transactions | Derivatives (1) | Total exposure (2) | ||||||||||||||||||||||||||||||||||||||||
Canada | $ | 373,530 | $ | 129,632 | $ | 58,048 | $ | 55,394 | $ | 23,619 | $ | 640,223 | $ | 346,834 | $ | 117,797 | $ | 55,548 | $ | 81,691 | $ | 9,820 | $ | 611,690 | ||||||||||||||||||||||||||||
U.S. | 23,177 | 35,633 | 20,811 | 120,482 | 11,829 | 211,932 | 20,219 | 28,172 | 19,088 | 92,056 | 10,157 | 169,692 | ||||||||||||||||||||||||||||||||||||||||
Europe (3) | 11,471 | 10,200 | 39,111 | 55,928 | 27,215 | 143,925 | 10,679 | 7,705 | 39,357 | 65,329 | 19,941 | 143,011 | ||||||||||||||||||||||||||||||||||||||||
Other International | 12,400 | 2,678 | 15,144 | 19,844 | 4,392 | 54,458 | 11,894 | 1,870 | 15,380 | 17,072 | 4,223 | 50,439 | ||||||||||||||||||||||||||||||||||||||||
Total | $ | 420,578 | $ | 178,143 | $ | 133,114 | $ | 251,648 | $ | 67,055 | $ | 1,050,538 | $ | 389,626 | $ | 155,544 | $ | 129,373 | $ | 256,148 | $ | 44,141 | $ | 974,832 | ||||||||||||||||||||||||||||
| * | This table represents an integral part of our 2013 Annual Consolidated Financial Statements. |
| (1) | Credit equivalent amount after factoring in master netting agreements. |
| (2) | Gross credit risk exposure is before allowance for loan losses. |
| (3) | Europe as at October 31, 2012 was previously restated to include deposits with a central bank, which were previously not included in our exposure. |
| (4) | Geographic profile is based on country of residence of the borrower. |
Management’s Discussion and Analysis Royal Bank of Canada: Annual Report 2013 53
Table of Contents
2013 vs. 2012
The geographic mix of our gross credit risk exposure did not change significantly from the prior year as Canada, U.S., Europe and Other International ended the year at 61%, 20%, 14% and 5% respectively. Growth in U.S. lending is driven by continuing efforts to strengthen our wholesale business in that market.
Loans and acceptance outstanding and undrawn commitments*(1), (2)
|
|
|
Table 42
|
| ||||||||||||||||||||||||||||||||||||
| As at | ||||||||||||||||||||||||||||||||||||||||
October 31 2013 | October 31 2012 | |||||||||||||||||||||||||||||||||||||||
| (Millions of Canadian dollars) | Low risk | Medium risk | High risk | Impaired | Total | Low risk | Medium risk | High risk | Impaired | Total | ||||||||||||||||||||||||||||||
Retail(3) | ||||||||||||||||||||||||||||||||||||||||
Residential mortgages | $ | 178,353 | $ | 24,011 | $ | 6,183 | $ | 691 | $ | 209,238 | $ | 166,217 | $ | 24,772 | $ | 6,661 | $ | 674 | $ | 198,324 | ||||||||||||||||||||
Personal | 143,747 | 23,890 | 3,774 | 363 | 171,774 | 133,711 | 19,418 | 3,569 | 273 | 156,971 | ||||||||||||||||||||||||||||||
Credit cards | 25,429 | 7,907 | 1,153 | – | 34,489 | 24,022 | 6,592 | 1,083 | – | 31,697 | ||||||||||||||||||||||||||||||
Small business | 4,567 | 2,214 | 1,212 | 37 | 8,030 | 3,201 | 2,201 | 1,001 | 33 | 6,436 | ||||||||||||||||||||||||||||||
| $ | 352,096 | $ | 58,022 | $ | 12,322 | $ | 1,091 | $ | 423,531 | $ | 327,151 | $ | 52,983 | $ | 12,314 | $ | 980 | $ | 393,428 | |||||||||||||||||||||
| As at | ||||||||||||||||||||||||||||||||
October 31 2013 | October 31 2012 | |||||||||||||||||||||||||||||||
| (Millions of Canadian dollars) | Investment grade | Non-investment grade | Impaired | Total | Investment grade | Non-investment grade | Impaired | Total | ||||||||||||||||||||||||
Wholesale(4) | ||||||||||||||||||||||||||||||||
Business | $ | 73,865 | $ | 88,705 | $ | 1,107 | $ | 163,677 | $ | 65,781 | $ | 74,078 | $ | 1,268 | $ | 141,127 | ||||||||||||||||
Sovereign | 9,582 | 341 | – | 9,923 | 9,021 | 198 | – | 9,219 | ||||||||||||||||||||||||
Bank | 1,387 | 200 | 3 | 1,590 | 1,255 | 139 | 2 | 1,396 | ||||||||||||||||||||||||
| $ | 84,834 | $ | 89,246 | $ | 1,110 | $ | 175,190 | $ | 76,057 | $ | 74,415 | $ | 1,270 | $ | 151,742 | |||||||||||||||||
| * | This table represents an integral part of our 2013 Annual Consolidated Financial Statements. |
| (1) | This table represents our retail and wholesale loans and acceptances outstanding and undrawn commitments by portfolio and risk category. For a qualitative description of the credit risk assessment process, refer to the Risk measurement section. |
| (2) | Based on exposure at default, which is the expected gross exposure upon the default of an obligor. This amount is before allowance for impaired loans and does not reflect the impact of credit risk mitigation such as guarantees. |
| (3) | Includes undrawn commitments of $nil, $77.5 billion, $20.3 billion, and $4 billion for residential mortgages, personal, credit cards and small business, respectively. |
| (4) | Includes undrawn commitments of $70.5 billion, $5.5 billion, and $0.3 billion for business, sovereign and bank, respectively. |
2013 vs. 2012
For our retail portfolio, there was no significant shift in the overall distribution of exposures across the various credit quality categories as 83% of our portfolio is low risk, 14% is medium risk and 3% is high risk. Within our wholesale portfolio the increase in Business exposure is due to portfolio growth and our acquisition of Ally Canada.
|
European exposure
|
|
|
Table 43
|
| ||||||||||||||||||||||||||||||
| As at | ||||||||||||||||||||||||||||||||||
October 31 2013 | October 31 2012 | |||||||||||||||||||||||||||||||||
| Loans and acceptances | Other | |||||||||||||||||||||||||||||||||
| (Millions of Canadian dollars) | Outstanding | Undrawn commitments (1) | Securities (2) | Letters of credit and guarantees | Repo-style transactions | Derivatives | Total European exposure | Total European exposure | ||||||||||||||||||||||||||
Gross exposure to Europe(3) | $ | 11,471 | $ | 10,200 | $ | 21,592 | $ | 17,519 | $ | 55,928 | $ | 27,215 | $ | 143,925 | $ | 143,011 | ||||||||||||||||||
Less: Collateral held | – | – | – | – | 54,416 | – | 54,416 | 63,887 | ||||||||||||||||||||||||||
Potential future | – | – | – | – | – | 18,827 | 18,827 | 10,536 | ||||||||||||||||||||||||||
Undrawn | – | 10,200 | – | 17,519 | – | – | 27,719 | 27,781 | ||||||||||||||||||||||||||
Gross drawn exposure to | $ | 11,471 | $ | – | $ | 21,592 | $ | – | $ | 1,512 | $ | 8,388 | $ | 42,963 | $ | 40,807 | ||||||||||||||||||
Less: Collateral applied | – | – | – | – | – | 6,306 | 6,306 | 6,495 | ||||||||||||||||||||||||||
Add: Trading securities | – | – | 13,816 | – | – | – | 13,816 | 11,742 | ||||||||||||||||||||||||||
Net exposure to Europe(4) | $ | 11,471 | $ | – | $ | 35,408 | $ | – | $ | 1,512 | $ | 2,082 | $ | 50,473 | $ | 46,054 | ||||||||||||||||||
| (1) | Comprised of undrawn commitments of $7.4 billion to corporate entities, $2 billion to financial entities and $0.8 billion to sovereign entities. On a country basis, exposure is comprised of $3.8 billion to U.K., $2.3 billion to France, $1.9 billion to Germany, $232 million to Ireland, $134 million to Spain, with the remaining $1.8 billion related to Other Europe. Of the undrawn commitments, over 86% are to investment grade entities. |
| (2) | Securities include $13.8 billion of trading securities (2012 – $11.7 billion), $13.8 billion of deposits (2012 – $12.5 billion) and $7.8 billion of AFS securities (2012 – $6.8 billion). |
| (3) | Gross exposure to Europe as at October 31, 2012 was previously restated to include deposits with a central bank, which were previously not included in our exposure. |
| (4) | Excludes $1 billion (2012 – $0.6 billion) of exposures to supranational agencies and $2.4 billion (2012 – $1.9 billion) of exposures to trade credit reinsurance. |
54 Royal Bank of Canada: Annual Report 2013 Management’s Discussion and Analysis
Table of Contents
Our gross credit risk exposure is calculated based on the definitions provided under the Basel III (2013) and Basel II (2012) frameworks whereby risk exposure is calculated before taking into account any collateral and inclusive of an estimate of potential future changes to that credit exposure. On that basis, our total European exposure as at October 31, 2013 was $144 billion. Our gross drawn exposure to Europe was $43 billion, after taking into account collateral held against repo-style transactions of $54 billion, letters of credit and guarantees, and undrawn commitments for loans of $28 billion and potential future credit exposure to derivatives of $19 billion. Our net exposure to Europe was $51 billion, after taking into account $6 billion of collateral, primarily in cash, we hold against derivatives and the addition of trading securities of $14 billion held in our trading book. Our net exposure to Europe also reflected $0.7 billion of mitigation through credit default swaps, which are largely used to hedge single name exposures and market risk.
Net European exposure
|
|
Table 44
|
| |||||||||||||||||||||
| As at | ||||||||||||||||||||||||
October 31 2013 | October 31 2012 | |||||||||||||||||||||||
| (Millions of Canadian dollars) | Loans outstanding | Securities (1) | Repo-style transactions | Derivatives | Total | Total | ||||||||||||||||||
U.K. (2) | $ | 7,288 | $ | 8,387 | $ | 1,241 | $ | 599 | $ | 17,515 | $ | 14,887 | ||||||||||||
Germany | 272 | 7,350 | 34 | 614 | 8,270 | 6,815 | ||||||||||||||||||
France | 634 | 2,901 | 36 | 285 | 3,856 | 3,786 | ||||||||||||||||||
Total U.K., Germany, France | $ | 8,194 | $ | 18,638 | $ | 1,311 | $ | 1,498 | $ | 29,641 | $ | 25,488 | ||||||||||||
Greece | $ | – | $ | – | $ | – | $ | – | $ | – | $ | 14 | ||||||||||||
Ireland | 59 | 39 | 11 | 65 | 174 | 498 | ||||||||||||||||||
Italy | 208 | 104 | – | 13 | 325 | 157 | ||||||||||||||||||
Portugal | 5 | – | – | 1 | 6 | 1 | ||||||||||||||||||
Spain | 363 | 127 | – | 1 | 491 | 803 | ||||||||||||||||||
Total Peripheral (3) | $ | 635 | $ | 270 | $ | 11 | $ | 80 | $ | 996 | $ | 1,473 | ||||||||||||
Luxembourg | $ | 494 | $ | 5,103 | $ | 13 | $ | 56 | $ | 5,666 | $ | 6,900 | ||||||||||||
Netherlands | 559 | 2,062 | – | 240 | 2,861 | 3,283 | ||||||||||||||||||
Norway | 339 | 2,558 | – | 28 | 2,925 | 1,632 | ||||||||||||||||||
Sweden | 1 | 2,781 | 49 | – | 2,831 | 1,371 | ||||||||||||||||||
Switzerland | 349 | 2,602 | 102 | 41 | 3,094 | 3,233 | ||||||||||||||||||
Other | 900 | 1,394 | 26 | 139 | 2,459 | 2,674 | ||||||||||||||||||
Total Other Europe | $ | 2,642 | $ | 16,500 | $ | 190 | $ | 504 | $ | 19,836 | $ | 19,093 | ||||||||||||
Total exposure to Europe (4), (5) | $ | 11,471 | $ | 35,408 | $ | 1,512 | $ | 2,082 | $ | 50,473 | $ | 46,054 | ||||||||||||
| (1) | Securities include $13.8 billion of trading securities (2012 – $11.7 billion), $13.8 billion of deposits (2012 – $12.5 billion) and $7.8 billion of AFS securities (2012 – $6.8 billion). |
| (2) | U.K. as at October 31, 2012 was previously restated to include deposits with a central bank, which were previously not included in our exposure. |
| (3) | Gross credit risk exposure to peripheral Europe is comprised of $nil to Greece (2012 – $nil), Ireland $1.5 billion (2012 – $3.8 billion), Italy $0.3 billion (2012 – $0.2 billion), Portugal $0.1 billion (2012 – $0.1 billion), and Spain $0.9 billion (2012 – $1.1 billion). |
| (4) | Excludes $1 billion (2012 – $0.6 billion) of exposures to supranational agencies. |
| (5) | Geographic profile is based on country of risk, which reflects our assessment of the geographic risk associated with a given exposure. Typically, this is the residence of the borrower. |
2013 vs. 2012
Net credit risk exposure to Europe increased $4 billion from the prior year, primarily in the U.K., Sweden and Germany, largely due to an increase in deposits, trading securities and AFS securities.
Our net exposure to peripheral Europe, which includes Greece, Ireland, Italy, Portugal and Spain, remained minimal, slightly down from the prior year. This exposure was predominantly investment grade. Our net exposure to larger European countries, including the U.K., Germany and France, was primarily related to our capital markets, wealth management and investor services businesses, particularly in fixed income, treasury services, derivatives, and corporate and individual lending. These are predominantly client-driven businesses where we transact with a range of European financial institutions, corporations and individuals. In addition, we engage in primary dealer activities in the U.K., where we participate in auctions of government debt and act as a market maker and provide liquidity to clients. Exposures to other European countries are largely related to securities which include trading securities, deposits, and AFS securities.
Our trading securities are related to both client market making activities and our funding and liquidity management needs. All of our trading securities are marked-to-market on a daily basis. Deposits primarily included deposits with central banks or financial institutions and also included deposits related to our wealth management business in the Channel Islands. AFS securities largely comprised of Organization of Economic Co-operation and Development government and corporate debt. Our European corporate loan book is run on a global basis and the underwriting standards for this loan book reflect the same approach to the use of our balance sheet as we have applied in both Canada and the U.S. We had credit losses of $127 million on this portfolio for this year, primarily related to a couple of accounts. The gross impaired loans ratio of this loan book was 0.69%.
Management’s Discussion and Analysis Royal Bank of Canada: Annual Report 2013 55
Table of Contents
Net European exposure by client type
|
|
|
Table 45
|
| ||||||||||||||||||||||||||||||||||||||||||||||||
| As at | ||||||||||||||||||||||||||||||||||||||||||||||||||||
October 31 2013 | October 31 2012 | |||||||||||||||||||||||||||||||||||||||||||||||||||
| (Millions of Canadian dollars) | U.K. | Germany | France | Total U.K., Germany, France | Greece | Ireland | Italy | Portugal | Spain | Total Peripheral | Other Europe | Total Europe | Total Europe | |||||||||||||||||||||||||||||||||||||||
Financials | $ | 4,265 | $ | 5,999 | $ | 1,296 | $ | 11,560 | $ | – | $ | 85 | $ | 40 | $ | 1 | $ | 32 | $ | 158 | $ | 9,875 | $ | 21,593 | $ | 21,944 | ||||||||||||||||||||||||||
Sovereign (1) | 5,834 | 1,534 | 1,692 | 9,060 | – | 21 | 5 | – | 23 | 49 | 7,096 | 16,205 | 12,661 | |||||||||||||||||||||||||||||||||||||||
Corporate | 7,416 | 737 | 868 | 9,021 | – | 68 | 280 | 5 | 436 | 789 | 2,865 | 12,675 | 11,449 | |||||||||||||||||||||||||||||||||||||||
Total(2) | $ | 17,515 | $ | 8,270 | $ | 3,856 | $ | 29,641 | $ | – | $ | 174 | $ | 325 | $ | 6 | $ | 491 | $ | 996 | $ | 19,836 | $ | 50,473 | $ | 46,054 | ||||||||||||||||||||||||||
| (1) | Sovereign as at October 31, 2012 was previously restated to include deposits with a central bank, which were previously not included in our exposure. |
| (2) | Geographic profile is based on country of risk, which reflects our assessment of the geographic risk associated with a given exposure. Typically, this is the residence of the borrower. |
2013 vs. 2012
Our net exposure to Sovereign increased $4 billion, largely due to higher deposits with the Bank of England. The increase in Corporate net exposure of $1 billion was largely in the U.K. Our net exposure to Financials decreased by $0.4 billion as reductions in France and the U.K. were partially offset by an increase in Germany.
Residential mortgages and home equity lines of credit
|
Residential mortgages and home equity lines of credit (insured vs. uninsured)
Residential mortgages and home equity lines of credit are secured by residential properties. The following table presents a breakdown by geographic region:
Residential mortgages and home equity lines of credit
|
|
Table 46
|
| |||||||||||||||||||||||||||
| As at October 31, 2013 | ||||||||||||||||||||||||||||||
| Residential mortgages(1) | Home equity lines of credit | |||||||||||||||||||||||||||||
| (Millions of Canadian dollars, except percentage amounts) | Insured(2) | Uninsured | Total | Total | ||||||||||||||||||||||||||
Region (3) | ||||||||||||||||||||||||||||||
Canada | ||||||||||||||||||||||||||||||
Atlantic provinces | $ | 6,388 | 57 | % | $ | 4,729 | 43 | % | $ | 11,117 | $ | 1,986 | ||||||||||||||||||
Quebec | 12,552 | 52 | 11,652 | 48 | 24,204 | 4,045 | ||||||||||||||||||||||||
Ontario | 36,491 | 44 | 46,582 | 56 | 83,073 | 16,609 | ||||||||||||||||||||||||
Prairie provinces | 25,099 | 54 | 21,063 | 46 | 46,162 | 10,422 | ||||||||||||||||||||||||
B.C. and territories | 16,078 | 39 | 24,708 | 61 | 40,786 | 10,018 | ||||||||||||||||||||||||
Total Canada (4) | $ | 96,608 | 47 | % | $ | 108,734 | 53 | % | $ | 205,342 | $ | 43,080 | ||||||||||||||||||
U.S. | 5 | 1 | 373 | 99 | 378 | 270 | ||||||||||||||||||||||||
Other International | 11 | – | 2,715 | 100 | 2,726 | 2,144 | ||||||||||||||||||||||||
Total International | $ | 16 | 1 | % | $ | 3,088 | 99 | % | $ | 3,104 | $ | 2,414 | ||||||||||||||||||
Total | $ | 96,624 | 46 | % | $ | 111,822 | 54 | % | $ | 208,446 | $ | 45,494 | ||||||||||||||||||
Total – 2012 | $ | 82,104 | 42 | % | $ | 114,393 | 58 | % | $ | 196,497 | $ | 45,073 | ||||||||||||||||||
| (1) | The residential mortgages amounts exclude our third party mortgage-backed securities (MBS) of $792 million (2012 – $1,827 million). |
| (2) | Insured residential mortgages are mortgages whereby our exposure to default is mitigated by insurance through the Canadian Mortgage and Housing Corporation (CMHC) or other private mortgage default insurers. |
| (3) | Region is based upon address of the property mortgaged. The Atlantic provinces are comprised of Newfoundland and Labrador, Prince Edward Island, Nova Scotia and New Brunswick, the Prairie provinces are comprised of Manitoba, Saskatchewan and Alberta, and B.C. and territories are comprised of British Columbia, Nunavut, Northwest Territories and Yukon. |
| (4) | Total Canada residential mortgages balance of $205 billion consolidated is comprised of $183 billion of residential mortgages and $5 billion of mortgages with commercial clients of which $3.8 billion are insured mortgages, both in Canadian Banking, and $17 billion of securitized residential mortgages in Capital Markets. |
Home equity lines of credit are uninsured and reported within the personal loan category. As at October 31, 2013, home equity lines of credit in Canadian Banking were $43 billion (2012 – $44 billion). Approximately 97% of these home equity lines of credit (2012 – 97%) are secured by a first lien on real estate, and less than 8% (2012 – 7%) of these clients pay the scheduled interest payment only.
56 Royal Bank of Canada: Annual Report 2013 Management’s Discussion and Analysis
Table of Contents
Residential mortgages portfolio by amortization period
The following table provides a summary of the percentage of residential mortgages that fall within the remaining amortization periods based upon current customer payment amounts, which incorporate payments larger than the minimum contractual amount and/or higher frequency of payments:
Residential mortgages portfolio by amortization period
|
|
|
Table 47
|
| ||||||||||||
| As at | ||||||||||||||||
October 31 2013 | October 31 2012 | |||||||||||||||
| Canada | U.S. and Other International | Total | Total | |||||||||||||
Amortization period | ||||||||||||||||
£ 25 years | 68 | % | 86 | % | 68 | % | 63 | % | ||||||||
>25 years£ 30 years | 22 | 14 | 22 | 23 | ||||||||||||
> 30 years£ 35 years | 8 | – | 8 | 10 | ||||||||||||
> 35 years | 2 | – | 2 | 4 | ||||||||||||
Total | 100 | % | 100 | % | 100 | % | 100 | % | ||||||||
Average loan-to-value (LTV) ratio for newly originated and acquired uninsured residential mortgages and homeline products
The following table provides a summary of our average LTV ratio for newly originated and acquired uninsured residential mortgages and homeline products by geographic region:
Average LTV ratio
|
|
Table 48
|
| |||||
| 2013 | ||||||||
| Uninsured | ||||||||
| Residential mortgages (1) | Homeline products (2) | |||||||
Region (3) | ||||||||
Atlantic provinces | 73 | % | 74% | |||||
Quebec | 71 | 73 | ||||||
Ontario | 71 | 71 | ||||||
Prairie provinces | 73 | 73 | ||||||
B.C. and territories | 69 | 67 | ||||||
U.S. | 69 | n.m. | ||||||
Other International | 83 | n.m. | ||||||
Average (4), (5), (6) | 71 | % | 71% | |||||
| (1) | Residential mortgages excludes residential mortgages within the homeline products. |
| (2) | Homeline products are comprised of both residential mortgages and home equity lines of credit. |
| (3) | Region is based upon address of the property mortgaged. The Atlantic provinces are comprised of Newfoundland and Labrador, Prince Edward Island, Nova Scotia and New Brunswick, the Prairie provinces are comprised of Manitoba, Saskatchewan and Alberta, and B.C. and territories are comprised of British Columbia, Nunavut, Northwest Territories and Yukon. |
| (4) | Effective the fourth quarter of 2013, we calculate the average LTV ratio for newly originated and acquired uninsured residential mortgages and homeline products on a weighted basis by mortgage amounts at origination. |
| (5) | The average LTV ratio for our uninsured residential mortgages and homeline products was 72% and 73%, respectively, for the fiscal year ended October 31, 2012. |
| (6) | For newly originated mortgages and homeline products, LTV is calculated based on the total facility amount for the residential mortgage and homeline product divided by the value of the related residential property. |
| n.m. | not meaningful |
While the above table provides the LTV ratios for the current year originations, the LTV ratio on our outstanding balances of the entire Canadian Banking uninsured residential mortgages including homeline products is 56% as at October 31, 2013 (2012 – 56%). Effective the fourth quarter of 2013 we revised our calculation methodology. The new calculation is both weighted by mortgage balances and adjusted for property values based on the Teranet – National Bank National Composite House Price Index. Previously this calculation was both adjusted for property values based on a Statistics Canada provincial housing price index and weighted by property values.
We employ a risk-based approach to property valuation. Property valuation methods include automated valuation models (AVM) and appraisals. An AVM is a tool that estimates the value of a property by reference to market data including sales of comparable properties and price trends specific to the Metropolitan Statistical Area in which the property being valued is located. Using arisk-based approach, we also employ appraisals which can include drive-by or full on-site appraisals.
We continue to actively manage our entire mortgage portfolio and perform stress testing, based on a combination of increasing unemployment, rising interest rates, and a downturn in real estate markets. Our stress test results indicate the vast majority of our residential mortgage and homeline clients have sufficient capacity to continue making payments in the event of a shock to one of the above noted parameters.
Management’s Discussion and Analysis Royal Bank of Canada: Annual Report 2013 57
Table of Contents
|
Provision for (recovery of) credit losses
|
|
Table 49
|
| |||||
| (Millions of Canadian dollars) | 2013 | 2012 | ||||||
Personal & Commercial Banking | $ | 997 | $ | 1,167 | ||||
Wealth Management | 51 | (1 | ) | |||||
Capital Markets | 188 | 135 | ||||||
Corporate Support and Other (1) | 3 | – | ||||||
Total PCL | $ | 1,239 | $ | 1,301 | ||||
Canada (2) | ||||||||
Residential mortgages | $ | 27 | $ | 34 | ||||
Personal | 391 | 413 | ||||||
Credit cards | 346 | 391 | ||||||
Small business | 32 | 43 | ||||||
Retail | 796 | 881 | ||||||
Wholesale | 151 | 209 | ||||||
PCL on impaired loans | 947 | 1,090 | ||||||
U.S. (2) | ||||||||
Retail | $ | 3 | $ | 4 | ||||
Wholesale | 32 | 29 | ||||||
PCL on impaired loans | 35 | 33 | ||||||
Other International (2) | ||||||||
Retail | $ | 86 | $ | 64 | ||||
Wholesale | 171 | 116 | ||||||
PCL on impaired loans | 257 | 180 | ||||||
Total PCL on impaired loans | 1,239 | 1,303 | ||||||
PCL on loans not yet identified as impaired | – | (2 | ) | |||||
Total PCL | $ | 1,239 | $ | 1,301 | ||||
PCL ratio (3) | ||||||||
Total PCL ratio | 0.31% | 0.35% | ||||||
Personal & Commercial Banking | 0.30% | 0.37% | ||||||
Canadian Banking | 0.28% | 0.33% | ||||||
Caribbean Banking | 1.24% | 2.08% | ||||||
Capital Markets | 0.34% | 0.29% | ||||||
| (1) | PCL in Corporate Support and Other primarily comprised of PCL for loans not yet identified as impaired. For further information, refer to the How we measure and report our business segments section. |
| (2) | Geographic information is based on residence of borrower. |
| (3) | PCL on impaired loans as a % of average net loans and acceptances. |
2013 vs. 2012
Total PCL decreased $62 million, or 5%, from a year ago. The PCL ratio decreased 4 bps.
PCL in Personal & Commercial Banking decreased $170 million or 15%, and the PCL ratio decreased 7 bps, mainly reflecting improved credit quality in our Canadian business lending, credit card and personal loans portfolios as well as our Caribbean portfolio.
PCL in Wealth Management increased $52 million, mainly reflecting provisions on a few accounts.
PCL in Capital Markets increased $53 million or 39%, mainly reflecting provisions on a few accounts largely in the technology & media sector.
58 Royal Bank of Canada: Annual Report 2013 Management’s Discussion and Analysis
Table of Contents
Gross impaired loans (GIL)
|
|
Table 50
|
| |||||
| (Millions of Canadian dollars) | 2013 | 2012 | ||||||
Personal & Commercial Banking | $ | 1,872 | $ | 1,820 | ||||
Wealth Management | 96 | 6 | ||||||
Capital Markets | 229 | 389 | ||||||
Investor & Treasury Services | 3 | 2 | ||||||
Corporate Support and Other | 1 | 33 | ||||||
Total GIL | $ | 2,201 | $ | 2,250 | ||||
Canada (1) | ||||||||
Retail | $ | 729 | $ | 715 | ||||
Wholesale | 526 | 641 | ||||||
GIL | 1,255 | 1,356 | ||||||
U.S. (1) | ||||||||
Retail | $ | 14 | $ | 7 | ||||
Wholesale | 98 | 162 | ||||||
GIL | 112 | 169 | ||||||
Other International (1) | ||||||||
Retail | $ | 348 | $ | 258 | ||||
Wholesale | 486 | 467 | ||||||
GIL | 834 | 725 | ||||||
Total GIL | $ | 2,201 | $ | 2,250 | ||||
| (1) | Geographic information is based on residence of borrower. |
2013 vs. 2012
Total GIL decreased $49 million or 2% from a year ago.
GIL in Personal & Commercial Banking increased $52 million or 3%, mainly due to higher impaired loans in our Canadian business lending portfolios.
GIL in Wealth Management increased $90 million, mainly due to a few accounts.
GIL in Capital Markets decreased $160 million or 41%, primarily due to write-offs in our technology & media sector.
Allowance for credit losses (ACL)
|
|
Table 51
|
| |||||
| (Millions of Canadian dollars) | 2013 | 2012 | ||||||
Allowance for impaired loans | ||||||||
Personal & Commercial Banking | $ | 486 | $ | 507 | ||||
Wealth Management | 53 | – | ||||||
Capital Markets | 58 | 126 | ||||||
Investor & Treasury Services | 2 | 2 | ||||||
Corporate Support and Other | – | 2 | ||||||
Total allowance for impaired loans | 599 | 637 | ||||||
Canada (1) | ||||||||
Retail | $ | 149 | $ | 142 | ||||
Wholesale | 170 | 239 | ||||||
Allowance for impaired loans | 319 | 381 | ||||||
U.S. (1) | ||||||||
Retail | $ | 2 | $ | 1 | ||||
Wholesale | 19 | 38 | ||||||
Allowance for impaired loans | 21 | 39 | ||||||
Other International (1) | ||||||||
Retail | $ | 146 | $ | 96 | ||||
Wholesale | 113 | 121 | ||||||
Allowance for impaired loans | 259 | 217 | ||||||
Total allowance for impaired loans | 599 | 637 | ||||||
Allowance for loans not yet identified as impaired | 1,451 | 1,451 | ||||||
Total ACL | $ | 2,050 | $ | 2,088 | ||||
| (1) | Geographic information is based on residence of borrower. |
2013 vs. 2012
Total ACL decreased $38 million or 2% from a year ago, mainly related to lower ACL in our Capital Markets and Caribbean portfolios, partially offset by higher ACL in Wealth Management.
Management’s Discussion and Analysis Royal Bank of Canada: Annual Report 2013 59
Table of Contents
|
Market risk is defined to be the potential loss due to changes in market determined variables such as interest rates, credit spreads, equity prices, commodity prices, foreign exchange rates and implied volatilities.
|
Market risk manifests itself in the following ways:
| • | Fair Value Through Profit or Loss (FVTPL) positions whose revaluation gains and losses are reported in Revenue; |
| • | AFS securities where revaluation gains and losses are reported as Other comprehensive income; |
| • | The structural interest rate mismatch between assets and liabilities that are not marked-to-market which affects Net Interest Income; and |
| • | Other positions whose financial performance is a function of market determined pricing variables. |
Market risk controls – FVTPL positions
As an element of the Enterprise Risk Appetite Framework, the Board of Directors approves the overall market risk constraints for RBC. GRM creates and manages the control structure for FVTPL positions that ensures that business is conducted consistent with Board requirements. The Market and Trading Credit Risk function within GRM is responsible for creating and managing the controls and governance procedures that ensure that risk taken is consistent with risk appetite constraints set by the Board. These controls include limits on: • Market risk positions; • Probabilistic measures of potential loss such as Value-at-Risk (VaR) and Stressed Value-at-Risk defined below, and; • Scenario based stress tests which utilize both actual historical market scenarios such as the global financial crisis of 2008 and hypothetical scenarios designed to be more forward looking. These stress tests apply severe and long duration stresses to market variables.
Market Risk Positions – are measures of potential loss due to changes in market variables.
Value-at-Risk (VaR) – is a statistical measure of potential loss for a financial portfolio computed at a given level of confidence and over a defined holding period. We measure VaR at the 99th percentile confidence level for price movements over a 1 day holding period using historic simulation of the last two years of equally weighted historic market data. These calculations are updated daily with current risk positions with the exception of CVA and certain other positions which are updated weekly.
Stressed Value-at-Risk (SVaR)– is calculated in an identical manner as VaR with the exception that it is computed using a fixed historical one year period of extreme volatility and its inverse rather than the most recent two year history. The stress period used is the interval from September 2008 through August 2009. Stressed VaR is calculated weekly for all portfolios.
VaR and SVaR are statistical estimates based on historical market data and should be interpreted with knowledge of their limitations –which include the following: • VaR and SVaR will not be predictive of future losses if the realized market movements differ significantly from the periods used to compute them. • VaR and SVaR project potential losses over a one day holding period and do not project potential losses for risk positions held over longer time periods. • VaR and SVaR are measured using positions at close of business and do not include the impact of trading activity over the course of a day. |
We validate our VaR and SVaR measures through a variety of means – including subjecting the models to vetting and validation by a group independent of the model developers and by back-testing the VaR against daily marked-to-market revenue to identify and examine events in which actual outcomes in trading revenue exceed the VaR projections.
Stress Tests– Our market risk stress testing program is used to identify and control risk due to large changes in market prices and rates. We conduct stress testing daily on positions that are marked-to-market. The stress tests simulate both historical and hypothetical events which are severe and long term in duration. Historical scenarios are taken from actual market events over the last 30 years and range in duration up to 90 days. Examples include the equity market crash of 1987 and the global financial crisis of 2008. Hypothetical scenarios are designed to be forward looking at potential future market stresses, and are designed to be severe but plausible. We are constantly evaluating and refining these scenarios as market conditions change. Stress results are calculated assuming an instantaneous revaluation of our positions with no management action.
These measures are computed on all positions that are FVTPL for financial reporting purposes, with the exception of those in a designated hedging relationship and those in our insurance businesses.
|
60 Royal Bank of Canada: Annual Report 2013 Management’s Discussion and Analysis
Table of Contents
Market risk measures – FVTPL positions
VaR and Stress VaR
The following table presents our Market risk VaR and Market risk Stressed VaR figures for 2013 and 2012:
Market Risk VaR*
|
Table 52
| |||||||||||||||||||||
| 2013 | 2012 | |||||||||||||||||||||||||||||||||
As at Oct. 31 | For the year ended October 31 | As at Oct. 31 | For the year ended October 31 | |||||||||||||||||||||||||||||||
| (Millions of Canadian dollars) | Average | High | Low | Average | High | Low | ||||||||||||||||||||||||||||
Equity | $ | 8 | $ | 9 | $ | 19 | $ | 5 | $ | 10 | $ | 11 | $ | 21 | $ | 5 | ||||||||||||||||||
Foreign exchange | 5 | 4 | 7 | 1 | 2 | 4 | 7 | 1 | ||||||||||||||||||||||||||
Commodities | 3 | 3 | 5 | 2 | 3 | 2 | 4 | 1 | ||||||||||||||||||||||||||
Interest rate | 38 | 41 | 51 | 36 | 50 | 50 | 65 | 34 | ||||||||||||||||||||||||||
Credit specific (1) | 10 | 10 | 12 | 7 | 10 | 9 | 12 | 7 | ||||||||||||||||||||||||||
Diversification (2) | (23 | ) | (23 | ) | (31 | ) | (16 | ) | (28 | ) | (24 | ) | (41 | ) | (13 | ) | ||||||||||||||||||
Market risk VaR | $ | 41 | $ | 44 | $ | 51 | $ | 38 | $ | 47 | $ | 52 | $ | 66 | $ | 43 | ||||||||||||||||||
Market risk Stressed VaR | $ | 117 | $ | 95 | $ | 123 | $ | 73 | $ | 79 | $ | 78 | $ | 107 | $ | 62 | ||||||||||||||||||
| * | This table represents an integral part of our 2013 Annual Consolidated Financial Statements. |
| (1) | General credit spread risk is measured under interest rate VaR while credit specific risk captures issuer-specific credit spread volatility. |
| (2) | Market risk VaR is less than the sum of the individual risk factor VaR results due to portfolio diversification. |
Average Market risk VaR of $44 million was down $8 million compared to the prior year, mainly driven by lower risk in fixed income portfolios in the current year and the roll forward of the historical VaR window. Average Stressed VaR of $95 million increased $17 million from $78 million in the prior year, largely due to increased positions and higher measured risk in certain mortgage-backed securities (MBS) and high grade credit-sensitive fixed income debt whose price behavior was particularly volatile in the historical period used for Stressed VaR when compared to more recent history. The higher risk attributed to MBS was in part due to changes in methodology which more accurately reflected the price behaviour of MBS during the global financial crisis of 2008 and 2009, which is the historical period used for SVaR.
The following chart graphically displays a bar chart of our daily trading profit and loss and a line chart of our daily Market risk VaR for the current year. We incurred net trading losses on seven days in the year, as compared to 20 days last year, totaling $14 million, with none of the losses exceeding VaR.
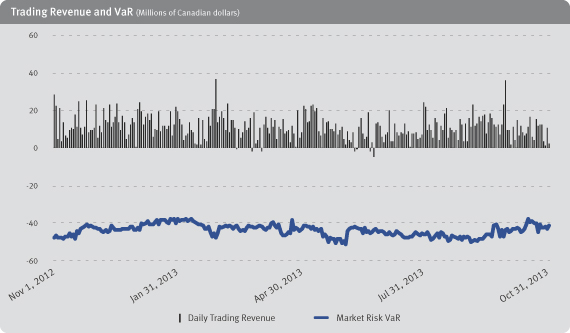
Management’s Discussion and Analysis Royal Bank of Canada: Annual Report 2013 61
Table of Contents
The following chart displays the distribution of daily trading profit and loss. The largest reported profit in the current year was $36 million with an average daily profit of $11 million. The largest daily reported loss of $5 million, which occurred on June 25, 2013, was largely driven by RBC credit spread tightening.

Market risk measures for other FVTPL positions
Assets and liabilities of RBC Insurance
We offer a range of insurance products to clients and hold investments to meet the future obligations to policyholders. The investments which support actuarial liabilities are predominantly fixed income assets designated as at FVTPL. Consequently changes in the fair values of these assets are recorded in investment income in the consolidated statements of income and are largely offset by changes in the fair value of the actuarial liabilities, the impact of which is reflected in insurance policyholder benefits and claims. Liabilities with respect to insurance obligations are reported at $8.0 billion as of October 2013. We held $5.9 billion of trading securities in support of the liabilities. We also held $2.2 billion of securities classified as AFS as investments.
Market Risk – AFS
Securities classified as AFS of $38 billion as at October 31, 2013, compared to $40 billion as at October 31, 2012. We hold debt securities designated as AFS primarily as investments and to manage interest rate risk in our non-trading banking activity (as described above). Certain legacy debt portfolios are also classified as AFS. Our portfolio of AFS securities expose us to interest rate risk, measured as the change in the value of the securities for a one basis point parallel increase in yields, and credit spread risk, measured as a change in the value for a one basis point widening of credit spreads. Changes in the value of these securities are reported in other comprehensive income. As at October 31, 2013, the interest rate risk for the portfolio was $3.8 million and the credit spread risk was $6.1 million (1). Our AFS securities also include equity investments of $1.7 billion as at October 31, 2013, down from $1.8 billion last year.
| (1) | Interest rate and credit spread risks are represented on a pre-tax basis and exclude the securities held in our insurance businesses. |
Market risk controls – Structural Interest Rate Risk (SIRR) Positions (2)
The asset/liability mismatch of positions not marked-to-market is referred to as SIRR and is subject to a separate set of limits and controls.
|
| (2) | SIRR positions include impact of derivatives in hedge accounting relationships and AFS securities used for interest rate risk management. |
Risk measurement
SIRR measures the potential loss of both one year net interest income and instantaneous economic value of equity due to interest rate changes. These measures are reported on a weekly basis and are subject to limits and controls set by ALCO and GRM. We further supplement our assessment by measuring interest rate risk for a range of dynamic and static market scenarios. Dynamic scenarios simulate our interest income in response to various combinations of business and market factors. Business factors include assumptions about future pricing strategies and volume and mix of new business, whereas market factors include assumed changes in interest rate levels and changes in the shape of the yield curve. Static scenarios supplement dynamic scenarios and are employed for assessing the risks to the value of equity and net interest income. As part of our monitoring process, the effectiveness of our interest rate risk mitigation activity is assessed on value and earnings bases, and model assumptions are validated against actual client behavior. |
Market risk measures – Structural Interest Rate Positions The following table provides the potential before-tax impact of an immediate and sustained 100 bps and 200 bps increase or decrease in interest rates on net interest income and economic value of equity of our non-trading portfolio, assuming that no further hedging is undertaken. These measures are based upon assumptions made by senior management and validated by empirical research. All interest rate risk measures are based upon interest rate exposures at a specific time and continuously change as a result of business activities and our risk management actions. Over the course of 2013, our interest rate risk exposure was well within our target level. |
62 Royal Bank of Canada: Annual Report 2013 Management’s Discussion and Analysis
Table of Contents
Market risk measures – Non-trading banking activities*
|
|
|
Table 53
|
| ||||||||||||||||||||||||||||||||||||||||
| 2013 | 2012 | 2011 | ||||||||||||||||||||||||||||||||||||||||||
| Economic value of equity risk | Net interest income risk(2) | Economic value of equity risk | Net interest income risk (2) | Economic value of equity risk | Net interest income risk (2) | |||||||||||||||||||||||||||||||||||||||
| (Millions of Canadian dollars) | Canadian dollar impact | U.S. dollar impact (1) | Total | Canadian dollar impact | U.S. dollar impact (1) | Total | ||||||||||||||||||||||||||||||||||||||
Before-tax impact of: | ||||||||||||||||||||||||||||||||||||||||||||
100bps increase in rates | $ | (537 | ) | $ | (3 | ) | $ | (540 | ) | $ | 381 | $ | 10 | $ | 391 | $ | (497 | ) | $ | 397 | $ | (454 | ) | $ | 307 | |||||||||||||||||||
100bps decrease in rates | 444 | 2 | 446 | (302 | ) | (1 | ) | (303 | ) | 405 | (322 | ) | 412 | (161 | ) | |||||||||||||||||||||||||||||
Before-tax impact of: | ||||||||||||||||||||||||||||||||||||||||||||
200bps increase in rates | (1,152 | ) | (8 | ) | (1,160 | ) | 733 | 25 | 758 | (1,005 | ) | 842 | (925 | ) | 708 | |||||||||||||||||||||||||||||
200bps decrease in rates | 793 | 6 | 799 | (397 | ) | (1 | ) | (398 | ) | 651 | (370 | ) | 615 | (189 | ) | |||||||||||||||||||||||||||||
| * | This table represents an integral part of our 2013 Annual Consolidated Financial Statements. |
| (1) | Represents the impact on the non-trading portfolios held in our U.S. banking operations. |
| (2) | Represents the 12-month Net interest income exposure to an instantaneous and sustained shift in interest rates. |
Non-trading foreign exchange rate risk
Foreign exchange rate risk is the potential adverse impact on earnings and economic value due to changes in foreign currency rates. Our revenue, expenses and income denominated in currencies other than the Canadian dollar are subject to fluctuations as a result of changes in the value of the average Canadian dollar relative to the average value of those currencies. Our most significant exposure is to the U.S. dollar due to our level of operations in the U.S., and other activities conducted in U.S. dollars. Other significant exposures are to the British pound and the Euro due to our activities conducted internationally in these currencies. A strengthening or weakening of the Canadian dollar compared to the U.S. dollar, British pound and the Euro could reduce or increase, as applicable, the translated value of our foreign currency denominated revenue, expenses and earnings and could have a significant effect on the results of our operations. We are also exposed to foreign exchange rate risk arising from our investments in foreign operations. For un-hedged equity investments, when the Canadian dollar appreciates against other currencies, the unrealized translation losses on net foreign investments decreases our shareholders’ equity through the other components of equity and decreases the translated value of the RWA of the foreign currency-denominated operations. The reverse is true when the Canadian dollar depreciates against other currencies. Consequently, we consider these impacts in selecting an appropriate level of our investments in foreign operations to be hedged. Our overall trading and non-trading market risk objectives, policies and methodologies have not changed significantly from 2012.
|
Market risk measures for other material non-trading portfolios
Derivatives in hedge accounting relationships
Derivative assets in a designated hedge accounting relationship of $2.0 billion as at October 31, 2013 were down from $2.7 billion in the prior year, and derivative liabilities of $931 million as at October 31, 2013 were down from $1.1 billion in the prior year. We use interest rate swaps to manage our structural interest rate risk as described above. To the extent these swaps are considered effective hedges, changes in their fair value are recognized in other comprehensive income. The interest rate risk for the designated cash flow hedges, measured as the change in the value of the derivatives for a one basis point parallel increase in yields, was $6.9 million as of October 31, 2013.
We also use interest rate swaps to hedge changes in the fair value of certain fixed-rate instruments. Changes in fair value of the interest rate swaps and the hedged instruments that are related to interest rate movements are reflected in income.
We also use foreign exchange derivatives to manage our exposure to equity investments in subsidiaries that are denominated in foreign currencies, particularly the U.S. dollar and British pound. Changes in the fair value of these hedges and the cumulative translation adjustment related to our structural foreign exchange risk are reported in other comprehensive income.
Management’s Discussion and Analysis Royal Bank of Canada: Annual Report 2013 63
Table of Contents
Linkage of market risk to selected balance sheet items
The following table provides the linkages between selected balance sheet items with positions included in our trading market risk and non-trading market risk disclosures, which illustrates how we manage market risk for our assets and liabilities through different risk measures.
Linkage of market risk to selected balance sheet items
|
| Table 54
|
| |||||||||||||||||
| As at October 31, 2013 | ||||||||||||||||||||
| (Millions of Canadian dollars) | Balance Sheet amount | Included in testing | Included in Structural Interest Rate Risk | Included in other risk controls (1) | Not subject to market risk (1),(2) | |||||||||||||||
Assets | ||||||||||||||||||||
Cash and due from banks | $ | 15,870 | $ | 8,202 | $ | 6,716 | $ | 952 | $ | – | ||||||||||
Interest-bearing deposits with banks | 9,061 | 2,833 | 6,228 | – | – | |||||||||||||||
Securities | ||||||||||||||||||||
Trading | 144,023 | 137,718 | – | 6,305 | – | |||||||||||||||
Available-for-sale | 38,695 | – | 34,315 | 4,380 | – | |||||||||||||||
Assets purchased under reverse repurchase agreements and securities borrowed | 117,517 | 116,703 | 814 | – | – | |||||||||||||||
Loans | 408,666 | 16,555 | 391,085 | 1,026 | – | |||||||||||||||
Investments for account of segregated fund holders | 513 | – | – | 513 | – | |||||||||||||||
Derivatives | 74,822 | 71,678 | 3,144 | – | – | |||||||||||||||
Other assets | 51,652 | 12,631 | 29,620 | 2,616 | 6,785 | |||||||||||||||
Total assets | $ | 860,819 | $ | 366,320 | $ | 471,922 | $ | 15,792 | $ | 6,785 | ||||||||||
Liabilities | ||||||||||||||||||||
Deposits | $ | 558,480 | $ | 101,584 | $ | 456,896 | $ | – | $ | – | ||||||||||
Insurance and Investment contracts for account of segregated fund holders | 513 | – | – | 513 | – | |||||||||||||||
Obligations related to securities sold short | 47,128 | 47,128 | – | – | – | |||||||||||||||
Obligations related to assets sold under repurchase | 60,416 | 60,147 | 269 | – | – | |||||||||||||||
Derivatives | 76,745 | 75,368 | 1,377 | – | – | |||||||||||||||
Other liabilities | 58,859 | 12,962 | 24,682 | 8,724 | 12,491 | |||||||||||||||
Subordinated debentures | 7,443 | – | 7,443 | – | – | |||||||||||||||
Trust capital securities | 900 | – | 900 | – | – | |||||||||||||||
Total liabilities | 810,484 | 297,189 | 491,567 | 9,237 | 12,491 | |||||||||||||||
Total equity | 50,335 | |||||||||||||||||||
Total liabilities and equity | $ | 860,819 | ||||||||||||||||||
| (1) | “Included in other risk controls” includes $12.3 billion of assets and $8.7 billion of liabilities (net of intra-group liabilities) in RBC Insurance which are subject to a separate risk control framework. These amounts include trading securities of $5.9 billion, AFS securities of $2.2 billion and fair valued liabilities of $8.0 billion. In addition to the RBC Insurance positions, $442 million of trading securities and $2.2 billion in AFS and held-to-maturity (HTM) securities are included in other risk controls. |
| (2) | Other assets under “Not subject to market risk” include certain receivable amounts and physical and intangible assets. Other liabilities include certain payable amounts. For further details, refer to Note 18 of our 2013 Annual Consolidated Financial Statements. |
Liquidity and funding management
|
Liquidity and funding risk (liquidity risk) is the risk that we may be unable to generate or obtain sufficient cash or its equivalent in a timely and cost-effective manner to meet our commitments as they come due. The nature of banking services inherently exposes us to various types of liquidity risk. The most common sources of liquidity risk arise from mismatches in the timing and value of cash inflows and outflows, both from on- and off-balance sheet exposures. Our liquidity position is established to satisfy our current and prospective commitments in normal business conditions, and in conjunction with our capital position, to maintain safety and soundness in times of stress. To achieve these goals, we operate under a comprehensive Liquidity Management Framework and employ key liquidity risk mitigation strategies that include the maintenance of: • An appropriate balance between the level of exposure allowed under our risk appetite given the potential impact of extreme but plausible events and the cost of its mitigation; • Broad funding access, including preserving and promoting a reliable base of core client deposits, ongoing access to diversified sources of wholesale funding and demonstrated capacities to monetize specific asset classes; |
• A comprehensive enterprise-wide liquidity contingency plan that is supported by unencumbered marketable securities, a portion of which consists of an earmarked contingency pool that provides assured access to cash and is available to supplement other sources of cash in a crisis; and • Appropriate and transparent liquidity transfer pricing and cost allocation.
Our liquidity management policies, practices and processes reinforce these risk mitigation strategies. In managing liquidity risk, we favour a centralized management approach to the extent possible given the various considerations outlined in this section.
|
64 Royal Bank of Canada: Annual Report 2013 Management’s Discussion and Analysis
Table of Contents
In 2010, OSFI introduced a regulatory enterprise liquidity metric, Net Cumulative Cash Flow. Limits are applicable for both Canadian dollars and foreign currencies and on an all currency basis and we submit a formal compliance report to OSFI on a monthly basis. We also continue to prepare for Basel III regulatory reforms led by the BCBS and supported by OSFI and other jurisdictions. The BCBS liquidity standards include minimum requirements for two regulatory measures, the Liquidity Coverage Ratio (LCR) and Net Stable Funding Ratio (NSFR). In January 2013, the BCBS released its final rules for LCR, with phased timelines for compliance, starting with a minimum of 60% coverage in 2015 and increasing by 10% annually to 100% in 2019. The BCBS continues to review the NSFR guidelines, with planned implementation effective 2018. We submit LCR and NSFR reports to OSFI regularly. In July 2013, the BCBS published a consultative paper on “Liquidity coverage ratio disclosure standards”. Comments on this consultative document were submitted in October 2013 to the BCBS. Banks are expected to comply with the BCBS disclosure standards beginning in 2015.
Our liquidity risk objectives, policies and methodologies have not changed materially from 2012. However, certain limits and risk practices have been modified as a result of market conditions and to align with local regulatory developments and to position ourselves for the prospective Basel III regulatory liquidity standards. We continue to maintain liquidity and funding that is appropriate for the execution of our strategy. Liquidity risk remains well within our risk appetite. However, our liquidity management policies, practices and processes will be modified to take into account evolving regulatory requirements, as appropriate.
|
Risk measurement
| To monitor and control risk within appropriate tolerances, limits are set on various metrics reflecting a range of time horizons and severity of stress conditions. Risk methodologies and underlying assumptions are periodically reviewed and validated to ensure alignment with our operating environment, expected economic and market conditions, rating agency preferences, regulatory requirements and accepted practices. Liquidity risk is measured using contractual maturity dates for some assets and liabilities (e.g., wholesale lending and funding) and effective maturity for others. In the effective maturity approach, the liquidity value of assets and liabilities is determined based on observed behavioural or market-based patterns unrelated to contractual maturity. For example, effective maturity may be shorter than contractual maturity if the demonstrated behaviour of the asset suggests that it can be monetized before maturity. Effective maturity for a liability may be longer than contractual maturity if the demonstrated behaviour of the liability suggests that it will be extended or rolled over at maturity. Specific examples include government bonds for assets as they can be quickly and reliably monetized and relationship-based deposits for liabilities where a significant portion is typically assigned core value although contractual maturity dates may be quite short or even legally characterized as available on demand (conversely, demand loans display attributes of longer term assets and are treated accordingly from an effective maturity perspective). Internally derived assumptions consider all relevant material and available data, information and methods of quantifying liquidity risk. We measure and manage our liquidity position from three risk perspectives as follows: |
Structural (longer-term) liquidity risk We use cash capital and other structural metrics, which focus on mismatches in effective maturity between all assets and liabilities, to measure and control balance sheet risk and to assist in the determination of our term funding strategy. Stressed conditions are considered, including a protracted loss of unsecured wholesale deposits that fund illiquid assets. |
Tactical (shorter-term) liquidity risk We apply net cash flow limits in Canadian dollar and foreign currencies for key short-term time horizons (overnight to nine weeks) under various stages of stress and assign a risk-adjusted limit to our aggregate pledging exposure and individual limits by types of pledging activities to measure our shorter-term liquidity exposures. Net cash flow positions reflect known and anticipated cash flows for all material unencumbered assets, liabilities and off-balance sheet activities. Pledged assets are not considered a source of available liquidity. We also control this risk by adhering to group-wide and unit-specific prescribed regulatory standards. |
Contingency liquidity risk Contingency liquidity risk management assesses the impact of and our intended responses to sudden stressful events. Our liquidity contingency plan, maintained and administered by Corporate Treasury, guides our actions and responses to liquidity crises. The Liquidity Crisis Team, consisting of senior representatives with relevant subject matter expertise from key business segments and Corporate Support, contributes to the development of stress tests and funding plans and meets regularly to assess our liquidity status, conduct stress tests and review liquidity contingency preparedness. Our stress tests, which include elements of scenario and sensitivity analyses, are based on models that measure our potential exposure to global, country-specific and RBC-specific events (or combinations thereof) and consider both historical and hypothetical events over a nine week period consistent with our internal tactical liquidity risk measure and our view of the most critical time span for such events. Different levels of severity are considered for each type of crisis with some scenarios reflecting multiple notch downgrades to our credit ratings. Key tests are run monthly, while others are run quarterly. The frequency of review is determined by considering a combination of likelihood and impact.
|
In a particularly acute short-term crisis or if a crisis was to extend over a number of months, actions would be taken to supplement liquidity available from our earmarked contingency asset pool by limiting cash and collateral outflows and by accessing new sources of liquidity and funding; for example, through sales of liquid assets and securitization and, in extraordinary circumstances, sales of core assets. As well, in light of our current credit ratings and well-developed market relationships and access, it is expected that even under extreme but plausible scenarios, we would continue to be able to access wholesale funding markets, albeit possibly at reduced overall capacity, higher costs and for shorter average maturities.
While we also have potential access to various normal course and emergency central bank lending facilities in Canada, the U.S. and Europe, such facilities are not considered a source of funding in our contingency planning for scenarios identified as extreme but plausible.
Management’s Discussion and Analysis Royal Bank of Canada: Annual Report 2013 65
Table of Contents
After reviewing test results, the liquidity contingency plan and other liquidity risk management practices and limits may be modified accordingly. The risk of more prolonged crises is addressed through measures of structural liquidity risk that assume stress conditions.
Our liquid assets consist primarily of a diversified pool of highly rated and liquid marketable securities and include segregated portfolios (in both Canadian and U.S. dollars) of contingency liquidity assets to address potential on- and off-balance sheet liquidity exposures (such as deposit erosion, loan drawdowns and higher collateral demands), that have been sized through models we have developed or by the scenario analyses and stress tests we conduct periodically. These portfolios are subject to minimum asset quality levels and, as appropriate, other strict eligibility guidelines (e.g., maturity, diversification and eligibility for central bank advances) to maximize ready access to cash in emergencies. Examples of assets held in these portfolios include U.S. and Canadian federal government treasury bills and bonds, U.S. Agency bonds, U.S. and Canadian government guaranteed and sponsored entity bonds, other highly rated foreign sovereign bonds and their guaranteed debt, supranational bonds and Canadian provincial bonds. Our total pool of unencumbered liquid assets, whether held specifically for contingency liquidity purposes or for investment or trading activities, would be available during times of crisis as sources of liquidity, either via outright sale or to obtain secured funding.
Risk profile
As at October 31, 2013, relationship-based deposits which are the primary source of funding for retail loans and mortgages, were $359 billion or 54% of our total funding (October 31, 2012 – $329 billion or 54%). Funding for highly liquid assets consisted primarily of short-term wholesale funding that reflects the expected monetization period of these assets. This wholesale funding comprised unsecured short-term liabilities of $67 billion and secured (repos and short sales) liabilities of $111 billion, and represented 10% and 17% of total funding as at October 31, 2013, respectively (October 31, 2012 – $84 billion and $105 billion or 14% and 17% of total funding, respectively). Long-term wholesale funding is mostly used to fund less liquid wholesale assets. Additional quantitative information is provided in the following Funding section.
As at October 31, 2013, we held earmarked contingency liquidity assets of $11.5 billion, of which $6.5 billion was in U.S. currency and $5 billion was in Canadian currency (October 31, 2012 – $9.7 billion of which $5.2 billion was in U.S. currency and $4.5 billion was in Canadian currency). During the year ended October 31, 2013, we increased our earmarked contingency liquidity assets and, as a result, held on average $10 billion, of which $5.5 billion was in U.S. currency and $4.5 billion was in Canadian currency (October 31, 2012 – $8.3 billion of which $4.9 billion was in U.S. currency and $3.4 billion was in Canadian currency). We also held a derivatives pledging liquid asset buffer of US$3.7 billion as at October 31, 2013 to mitigate the volatility of our net pledging requirements for derivatives trading (October 31, 2012 – US$1.3 billion). This buffer averaged US$2.3 billion during the year ended October 31, 2013 (October 31, 2012 – US$1.3 billion). Our buffers were resized during the year to reflect changes in our liquidity policies and balance sheet composition.
As recommended by the EDTF, the following table provides a summary of our liquidity reserve and encumbered assets, according to level of liquidity. Unencumbered assets available as collateral represent, for the most part, a ready source of funding that can be accessed quickly, when required. Liquid assets available as collateral consist of on-balance sheet cash and securities holdings as well as securities received as collateral from securities financing (reverse repos and off-balance sheet collateral swaps) and derivative transactions and constitute the preferred source for quickly accessing liquidity. Illiquid assets for which there are established funding markets, such as mortgages and credit card receivables, can be monetized although requiring more lead times relative to liquid assets. We do not include encumbered assets as a source of available liquidity in measuring liquidity risk. As at October 31, 2013, our unencumbered highly marketable liquid assets comprised 54% of our total liquid assets. For the purpose of constructing the following table, encumbered assets include: (i) Bank-owned liquid assets that are either pledged as collateral (e.g., repo financing and derivative pledging) or not freely available due to regulatory or internal policy requirements (e.g., earmarked to satisfy mandatory reserve or local capital adequacy requirements and to maintain continuous access to payment and settlement systems); (ii) securities received as collateral from securities financing and derivative transactions which have either been re-hypothecated where permissible (e.g., to obtain financing through repos or to cover securities sold short) or have no liquidity value since re-hypothecation is prohibited; and iii) illiquid assets that have been securitized and sold into the market or that have been pledged as collateral in support of structured term funding vehicles. Unencumbered assets are the difference between total and encumbered assets from both on- and off-balance sheet sources.
66 Royal Bank of Canada: Annual Report 2013 Management’s Discussion and Analysis
Table of Contents
Liquidity reserve and asset encumbrance(1)
|
|
|
Table 55
|
| ||||||||||||||||||||||||||
| As at October 31, 2013 | ||||||||||||||||||||||||||||||
| Encumbered assets | Unencumbered assets | |||||||||||||||||||||||||||||
| (Millions of Canadian dollars) | On-balance sheet assets | Off-balance received as transactions | Total assets | Pledged as collateral | Other (2) | Available as collateral (3) | Other(4) | |||||||||||||||||||||||
Liquid assets | ||||||||||||||||||||||||||||||
Cash and deposits with central banks | $ | 12,711 | $ | – | $ | 12,711 | $ | – | $ | 980 | $ | 11,731 | $ | – | ||||||||||||||||
Deposits with financial institutions | 12,220 | – | 12,220 | 287 | – | 11,933 | – | |||||||||||||||||||||||
Precious metals | 173 | – | 173 | – | – | 173 | – | |||||||||||||||||||||||
Securities and reverse repos (5) | ||||||||||||||||||||||||||||||
Canadian government obligations | 59,760 | 11,120 | 70,880 | 40,164 | – | 30,716 | – | |||||||||||||||||||||||
Foreign government obligations | 113,464 | 4,350 | 117,814 | 54,053 | – | 63,761 | – | |||||||||||||||||||||||
Other securities | 72,133 | 11,953 | 84,086 | 40,743 | 48 | 43,295 | – | |||||||||||||||||||||||
Loans | ||||||||||||||||||||||||||||||
NHA mortgage-backed securities | 32,556 | – | 32,556 | 10,738 | – | 21,818 | – | |||||||||||||||||||||||
Other assets | 11,678 | – | 11,678 | 11,678 | – | – | – | |||||||||||||||||||||||
Total liquid assets | $ | 314,695 | $ | 27,423 | $ | 342,118 | $ | 157,663 | $ | 1,028 | $ | 183,427 | $ | – | ||||||||||||||||
Other illiquid assets | �� | |||||||||||||||||||||||||||||
Securities and reverse repos not included above | $ | 54,878 | $ | 14,781 | $ | 69,659 | $ | 23,349 | $ | – | $ | 37,114 | $ | 9,196 | ||||||||||||||||
Loans | 378,069 | – | 378,069 | 64,775 | – | 125,789 | 187,505 | |||||||||||||||||||||||
Other assets | 113,177 | – | 113,177 | – | – | – | 113,177 | |||||||||||||||||||||||
Total other illiquid assets | $ | 546,124 | $ | 14,781 | $ | 560,905 | $ | 88,124 | $ | – | $ | 162,903 | $ | 309,878 | ||||||||||||||||
| $ | 860,819 | $ | 42,204 | $ | 903,023 | $ | 245,787 | $ | 1,028 | $ | 346,330 | $ | 309,878 | |||||||||||||||||
As at October 31 | ||||||||||||||||||||||||||||||
| (Millions of Canadian dollars) | Unencumbered assets | |||||||||||||||||||||||||||||
Royal Bank of Canada | $ | 351,398 | ||||||||||||||||||||||||||||
Foreign branches | 129,796 | |||||||||||||||||||||||||||||
Subsidiaries | 175,014 | |||||||||||||||||||||||||||||
| $ | 656,208 | |||||||||||||||||||||||||||||
| (1) | Information is provided from an enterprise-wide perspective. In managing liquidity risk, we consider market, legal, regulatory, tax and other constraints that may impede transferability of liquidity among RBC units. |
| (2) | Includes assets which are believed to be restricted from being used to secure funding for legal or other reasons. |
| (3) | Includes assets that are readily available in the normal course of business to secure funding or meet collateral needs. |
| (4) | Other unencumbered assets are not subject to any restrictions on their use to secure funding or as collateral, but would not be considered readily available because they may not be readily acceptable at central banks or other lending programs. |
| (5) | Includes investment grade government, public sector entities and corporate bonds and money market securities, exchange-traded funds, and equities traded as part of a major stock index but excludes auction rate and non-agency asset-backed securities as well as non-index equities and mutual funds. All securities are recorded at market value. |
Other sources of liquidity that could be available to mitigate stressed conditions include: (i) our unused wholesale funding capacity, which is regularly assessed using an established methodology that is periodically reviewed and, as necessary, revised, and (ii) central bank borrowing facilities if, in extraordinary circumstances, market sources were not sufficient to allow us to monetize our assets available as collateral to meet our requirements (e.g., Bank of Canada, Federal Reserve Bank, Bank of England, and Bank of France).
Management’s Discussion and Analysis Royal Bank of Canada: Annual Report 2013 67
Table of Contents
Risk control
| The Board of Directors annually approves delegation of liquidity risk authorities to senior management. The Risk Committee of the Board annually approves the Liquidity Management Framework and is responsible for its oversight. The Board of Directors and the Risk Committee also review, on a regular basis, reporting on our enterprise-wide liquidity position and status. The GRC and ALCO share management oversight responsibility and review all liquidity documents prepared for the Board of Directors or its committees. ALCO annually approves the Liquidity Management Framework’s key supporting documents and provides strategic direction and primary management oversight to Corporate Treasury, GRM, other functions and business platforms in the area of liquidity risk management. To maximize funding and operational efficiencies, we monitor and manage our liquidity position on a consolidated basis and for key units taking into account market, legal, regulatory, tax, operational and any other applicable restrictions that may impede transferability of liquidity between RBC units. This includes analyzing our ability to lend or borrow funds between branches and subsidiaries, and converting funds between currencies. The outcome of this analysis is considered in liquidity metrics and our Recovery Plan. |
| Policies |
| Our principal liquidity policies define risk tolerance parameters. They authorize senior management committees, Corporate Treasury or GRM to approve more detailed policies and limits that govern management, measurement and reporting requirements for specific businesses and products. |
| Authorities and limits |
| Limits for our structural liquidity risk positions are approved at least annually and monitored regularly. Net cash flow limits are approved at least annually. Depending on the significance of each reporting entity, net cash flow limits are monitored daily or weekly by major currency, branches, subsidiaries and geographic locations. Any potential exceptions to established limits are reported immediately to Corporate Treasury and GRM, who provide or arrange for approval where appropriate after reviewing remedial action plans. |
The liquidity factors for cash flow assets and liabilities under varying conditions are reviewed periodically by Corporate Treasury, GRM and the business segments to determine if they remain valid or changes to assumptions and limits are required. Through this process, we ensure that a close link is maintained between the management of liquidity risk, market liquidity risk and credit risk, including GRM approval of credit lines between entities. In response to our experience during periods of market volatility over the past six years, we have modified the liquidity treatment of certain asset classes to reflect changes in market liquidity. Where required, limits are reduced in consideration of the results of stress tests.
|
Funding
| Funding strategy |
Core funding, comprising capital, longer-term wholesale liabilities and a diversified pool of personal and, to a lesser extent, commercial and institutional deposits, is the foundation of our structural liquidity position.
|
Deposit profile
We continued to focus on building our core deposit base in Canada. Our relationship-based deposits, including our personal deposit franchise and our commercial and institutional client groups, maintain balances with relatively low volatility profiles and constitute our principal source of reliable funding. Reflecting deposit insurance and at times, exclusive relationships with us, these balances represent a highly stable source of core deposits in most conceivable environments as they are typically less responsive to market developments than those from transactional lenders and investors. Core deposits, consisting of our own statistically derived liquidity adjusted estimates of the highly stable portions of our relationship-based balances (demand, notice and fixed-term) together with wholesale funds maturing beyond one year have increased approximately 2% during the year and represent 70% of our total deposits, up from 68% last year. During the year, core deposits grew by about 10% with the most material contribution coming from an extension of our wholesale funding maturity profile. For further details on the gross dollar amounts of our relationship-based deposits and our wholesale funds maturing beyond one year, refer to the Risk profile section and the following Remaining maturity of wholesale debt issued table, respectively.
Long-term debt issuance
| During 2013, we continued to experience more favourable unsecured wholesale funding access and pricing compared to global peers. As demonstrated in the following table, we also continued to expand our unsecured long-term funding base by selectively issuing, either directly or through our subsidiaries, $31 billion of term funding in various currencies and markets. Total unsecured long-term funding outstanding increased by $10.2 billion. |
We use residential mortgage and credit card and auto receivable-backed securitization programs as alternative sources of funding and for liquidity and asset/liability management purposes. Our total secured long-term funding includes outstanding MBS sold, covered bonds that are collateralized with residential mortgages, and credit card and auto receivables. Compared to 2012, our outstanding MBS sold decreased $1.4 billion while our covered bonds and credit card and auto receivables increased $9.4 billion and $1 billion, respectively. |
For further details, refer to the Off-balance sheet arrangements section. |
Long-term funding sources*
|
|
Table 56
|
| |||||
| (Millions of Canadian dollars) | 2013 | 2012 | ||||||
Unsecured long-term funding | $ | 69,903 | $ | 59,661 | ||||
Secured long-term funding | 59,285 | 50,321 | ||||||
Commercial mortgage-backed securities sold | 1,304 | 1,434 | ||||||
Subordinated debentures | 7,408 | 7,416 | ||||||
| $ | 137,900 | $ | 118,832 | |||||
| * | This table represents an integral part of our 2013 Annual Consolidated Financial Statements. |
Our wholesale funding activities are well-diversified by geography, investor segment, instrument, currency, structure and maturity. We maintain an ongoing presence in different funding markets, which allows us to continuously monitor market developments and trends, identify opportunities and risks, and take appropriate and timely actions. We operate longer-term debt issuance registered programs. The following table summarizes these programs with their authorized limits by geography.
68 Royal Bank of Canada: Annual Report 2013 Management’s Discussion and Analysis
Table of Contents
Programs by geography
|
Table 57
| |||
| Canada | U.S. | Europe/Asia | ||
• Canadian Shelf – $15 billion | • SEC Registered – US$25 billion
• SEC Registered Covered Bonds –
| • European Debt Issuance Program –
• Covered Bond Program –
• Japanese Issuance Programs –
| ||
We also raise long-term funding using Canadian Deposit Notes, Canadian NHA MBS, Canada Mortgage Bonds, credit card receivable-backed securities, Kangaroo Bonds (issued in the Australian domestic market by foreign firms) and Yankee Certificates of Deposit (issued in the U.S. domestic market by foreign firms), We continuously evaluate expansion into new markets and untapped investor segments against relative issuance costs since diversification expands our wholesale funding flexibility and minimizes funding concentration and dependency, and generally reduces financing costs. As presented in the following charts, our current long-term debt profile is well diversified by currency as well as by type of long-term funding products. Maintaining competitive credit ratings is also critical to cost-effective funding.
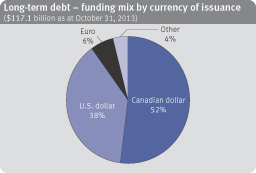 |
(1) Mortgage-backed securities and Canada Mortgage Bonds |

The following table provides the remaining maturity of our wholesale debt issued and represents our enhanced disclosure in response to EDTF recommendations.
Remaining maturity of wholesale debt issued(1)
|
Table 58
| |||||||||||||||||||||||||||||||
| As at October 31, 2013 | ||||||||||||||||||||||||||||||||
| (Millions of Canadian dollars) | Less than 1 month | 1 to 3 months | 3 to 6 months | 6 to 12 months | Less than 1 year sub-total | 1 to 2 years | 2 years and greater | Total | ||||||||||||||||||||||||
Bearer deposit notes, certificates of deposit and commercial paper | $ | 5,886 | $ | 5,564 | $ | 20,253 | $ | 14,370 | $ | 46,073 | $ | 261 | $ | 3,523 | $ | 49,857 | ||||||||||||||||
Deposit and medium-term notes | 1,154 | 3,984 | 3,652 | 5,467 | 14,257 | 12,327 | 41,216 | 67,800 | ||||||||||||||||||||||||
Mortgage securitization | 757 | 2,565 | 4,211 | 2,154 | 9,687 | 2,371 | 18,392 | 30,450 | ||||||||||||||||||||||||
Covered bonds | – | – | – | – | – | 3,164 | 17,713 | 20,877 | ||||||||||||||||||||||||
Cards and auto securitization | 54 | 94 | 132 | 213 | 493 | 2,965 | 4,501 | 7,959 | ||||||||||||||||||||||||
Total | $ | 7,851 | $ | 12,207 | $ | 28,248 | $ | 22,204 | $ | 70,510 | $ | 21,088 | $ | 85,345 | $ | 176,943 | ||||||||||||||||
Comprises: | ||||||||||||||||||||||||||||||||
- Unsecured | $ | 7,040 | $ | 9,548 | $ | 23,905 | $ | 19,837 | $ | 60,330 | $ | 12,588 | $ | 44,739 | $ | 117,657 | ||||||||||||||||
- Secured | 811 | 2,659 | 4,343 | 2,367 | 10,180 | 8,500 | 40,606 | 59,286 | ||||||||||||||||||||||||
| (1) | Excludes short-term wholesale deposits, bankers’ acceptances and subordinated debt. |
Contractual maturities of financial assets, financial liabilities and off-balance sheet items
The following tables provide remaining contractual maturity profiles of all our assets, liabilities, and off-balance sheet items at their carrying value (i.e. amortized cost or fair value) at the balance sheet date and have been enhanced in response to EDTF recommendations. Off-balance sheet items are allocated based on the expiry date of the contract.
Details of contractual maturities and commitments to extend funds are a source of information for the management of liquidity risk. Among other purposes, these details form a basis for modeling a behavioural balance sheet with effective maturities to calculate liquidity risk measures. For further details, refer to the Risk measurement section.
Management’s Discussion and Analysis Royal Bank of Canada: Annual Report 2013 69
Table of Contents
Contractual maturities of financial assets, financial liabilities and off-balance sheet items
|
|
|
Table 59
|
| ||||||||||||||||||||||||||||||||||||
| As at October 31, 2013 | ||||||||||||||||||||||||||||||||||||||||
| (Millions of Canadian dollars) | Less than 1 month | 1 to 3 months | 3 to 6 months | 6 to 9 months | 9 to 12 months | 1 year to 3 years | 3 years to 5 years | 5 years and greater | With no specific maturity | Total | ||||||||||||||||||||||||||||||
Assets | ||||||||||||||||||||||||||||||||||||||||
Cash and deposits with banks | $ | – | $ | – | $ | – | $ | – | $ | – | $ | – | $ | – | $ | – | $ | 24,931 | $ | 24,931 | ||||||||||||||||||||
Securities | ||||||||||||||||||||||||||||||||||||||||
Trading (1) | 93,407 | 40 | 19 | 40 | 38 | 502 | 281 | 4,507 | 45,189 | 144,023 | ||||||||||||||||||||||||||||||
Available-for-sale | 3,420 | 4,641 | 1,268 | 796 | 1,116 | 5,317 | 7,156 | 13,140 | 1,841 | 38,695 | ||||||||||||||||||||||||||||||
Assets purchased under reverse repurchase agreements and securities borrowed | 61,871 | 18,388 | 17,985 | 6,268 | 6,980 | 1,151 | – | – | 4,874 | 117,517 | ||||||||||||||||||||||||||||||
Loans (net of allowance for loan losses) | 15,698 | 11,662 | 5,568 | 10,208 | 18,855 | 128,918 | 97,938 | 29,761 | 90,058 | 408,666 | ||||||||||||||||||||||||||||||
Other | ||||||||||||||||||||||||||||||||||||||||
Customers’ liability under acceptances | 1,240 | 501 | 563 | 705 | 2,617 | 2,393 | 1,671 | 263 | – | 9,953 | ||||||||||||||||||||||||||||||
Derivatives | 2,349 | 5,028 | 2,338 | 2,353 | 1,627 | 14,939 | 12,401 | 33,786 | 1 | 74,822 | ||||||||||||||||||||||||||||||
Other financial assets | 16,247 | 989 | 780 | 112 | 119 | 477 | 239 | 639 | 575 | 20,177 | ||||||||||||||||||||||||||||||
Total financial assets | $ | 194,232 | $ | 41,249 | $ | 28,521 | $ | 20,482 | $ | 31,352 | $ | 153,697 | $ | 119,686 | $ | 82,096 | $ | 167,469 | $ | 838,784 | ||||||||||||||||||||
Other non-financial assets | 1,275 | 455 | 313 | 149 | 743 | 1,745 | 2 | 1,939 | 15,414 | 22,035 | ||||||||||||||||||||||||||||||
Total assets | $ | 195,507 | $ | 41,704 | $ | 28,834 | $ | 20,631 | $ | 32,095 | $ | 155,442 | $ | 119,688 | $ | 84,035 | $ | 182,883 | $ | 860,819 | ||||||||||||||||||||
Liabilities and equity | ||||||||||||||||||||||||||||||||||||||||
Deposits (2) | ||||||||||||||||||||||||||||||||||||||||
Unsecured borrowing | $ | 22,589 | $ | 16,026 | $ | 31,266 | $ | 12,330 | $ | 16,785 | $ | 65,341 | $ | 25,978 | $ | 14,658 | $ | 281,237 | $ | 486,210 | ||||||||||||||||||||
Secured borrowing | 812 | 3,129 | 5,048 | 2,129 | 1,905 | 16,257 | 11,394 | 10,288 | – | 50,962 | ||||||||||||||||||||||||||||||
Covered bonds | – | – | – | – | – | 7,851 | 9,987 | 3,470 | – | 21,308 | ||||||||||||||||||||||||||||||
Other | ||||||||||||||||||||||||||||||||||||||||
Acceptances | 1,240 | 501 | 563 | 705 | 2,617 | 2,393 | 1,671 | 263 | – | 9,953 | ||||||||||||||||||||||||||||||
Obligations related to securities sold short | 47,128 | – | – | – | – | – | – | – | – | 47,128 | ||||||||||||||||||||||||||||||
Obligations related to assets sold under repurchase agreements and securities loaned | 53,389 | 1,991 | 1,308 | 877 | 290 | 1,500 | – | – | 1,061 | 60,416 | ||||||||||||||||||||||||||||||
Derivatives | 3,021 | 5,233 | 2,569 | 2,536 | 2,312 | 16,971 | 12,133 | 31,970 | – | 76,745 | ||||||||||||||||||||||||||||||
Other financial liabilities | 20,995 | 1,090 | 720 | 261 | 336 | 667 | 391 | 3,969 | 60 | 28,489 | ||||||||||||||||||||||||||||||
Subordinated debentures | 1,005 | – | – | 603 | – | 3,214 | – | 2,621 | – | 7,443 | ||||||||||||||||||||||||||||||
Trust capital securities | – | 900 | – | – | – | – | – | – | – | 900 | ||||||||||||||||||||||||||||||
Total financial liabilities | $ | 150,179 | $ | 28,870 | $ | 41,474 | $ | 19,441 | $ | 24,245 | $ | 114,194 | $ | 61,554 | $ | 67,239 | $ | 282,358 | $ | 789,554 | ||||||||||||||||||||
Other non-financial liabilities | 1,697 | 2,834 | 686 | 114 | 135 | 1,832 | 965 | 7,374 | 5,293 | 20,930 | ||||||||||||||||||||||||||||||
Equity | – | – | – | – | – | – | – | – | 50,335 | 50,335 | ||||||||||||||||||||||||||||||
Total liabilities and equity | $ | 151,876 | $ | 31,704 | $ | 42,160 | $ | 19,555 | $ | 24,380 | $ | 116,026 | $ | 62,519 | $ | 74,613 | $ | 337,986 | $ | 860,819 | ||||||||||||||||||||
Off-balance sheet items | ||||||||||||||||||||||||||||||||||||||||
Financial guarantees | $ | 2,203 | $ | 854 | $ | 1,824 | $ | 1,714 | $ | 2,567 | $ | 3,166 | $ | 3,074 | $ | 139 | $ | 51 | $ | 15,592 | ||||||||||||||||||||
Lease commitments | 62 | 122 | 181 | 179 | 173 | 1,264 | 787 | 1,346 | – | 4,114 | ||||||||||||||||||||||||||||||
Commitments to extend credit | 3,757 | 6,843 | 4,780 | 6,488 | 7,320 | 44,043 | 65,276 | 13,615 | 1,044 | 153,166 | ||||||||||||||||||||||||||||||
Other commitments | 2,291 | 37 | 13 | 210 | 1,733 | 350 | 418 | 169 | 57,749 | 62,970 | ||||||||||||||||||||||||||||||
Total off-balance sheet items | $ | 8,313 | $ | 7,856 | $ | 6,798 | $ | 8,591 | $ | 11,793 | $ | 48,823 | $ | 69,555 | $ | 15,269 | $ | 58,844 | $ | 235,842 | ||||||||||||||||||||
| (1) | Trading debt securities classified as fair value through profit or loss have been included in the less than 1 month category as there is no expectation to hold these assets to their contractual maturity. |
| (2) | A major portion of relationship-based deposits are repayable on demand or at short notice on a contractual basis while, in practice, these customer balances form a core base, as explained in the preceding Deposit profile section, for our operations and liquidity needs. |
70 Royal Bank of Canada: Annual Report 2013 Management’s Discussion and Analysis
Table of Contents
| As at October 31, 2012 | ||||||||||||||||||||||||||||||||||||||||
| (Millions of Canadian dollars) | Less than 1 month | 1 to 3 months | 3 to 6 months | 6 to 9 months | 9 to 12 months | 1 year to 3 years | 3 years to 5 years | 5 years and greater | With no specific maturity | Total | ||||||||||||||||||||||||||||||
Assets | ||||||||||||||||||||||||||||||||||||||||
Cash and deposits with banks | $ | – | $ | – | $ | – | $ | – | $ | – | $ | – | $ | – | $ | – | $ | 22,872 | $ | 22,872 | ||||||||||||||||||||
Securities | ||||||||||||||||||||||||||||||||||||||||
Trading (1) | 74,067 | 102 | 694 | 37 | 11 | 296 | 360 | 4,911 | 40,305 | 120,783 | ||||||||||||||||||||||||||||||
Available-for-sale | 3,698 | 6,749 | 2,496 | 1,543 | 491 | 4,963 | 5,838 | 12,998 | 2,052 | 40,828 | ||||||||||||||||||||||||||||||
Assets purchased under reverse repurchase agreements and securities borrowed (2) | 65,988 | 22,677 | 7,473 | 5,211 | 3,385 | 2,205 | – | – | 5,318 | 112,257 | ||||||||||||||||||||||||||||||
Loans (net of allowance for loan losses) (2) | 12,444 | 9,546 | 8,487 | 11,989 | 20,918 | 83,635 | 124,218 | 22,060 | 84,947 | 378,244 | ||||||||||||||||||||||||||||||
Other | ||||||||||||||||||||||||||||||||||||||||
Customers’ liability under acceptances | 1,329 | 435 | 404 | 624 | 2,406 | 1,907 | 2,167 | 113 | – | 9,385 | ||||||||||||||||||||||||||||||
Derivatives | 2,517 | 3,799 | 2,891 | 2,379 | 1,372 | 15,735 | 14,222 | 48,374 | 4 | 91,293 | ||||||||||||||||||||||||||||||
Other financial assets | 24,912 | 952 | 618 | 169 | 637 | 216 | 113 | 190 | – | 27,807 | ||||||||||||||||||||||||||||||
Total financial assets | $ | 184,955 | $ | 44,260 | $ | 23,063 | $ | 21,952 | $ | 29,220 | $ | 108,957 | $ | 146,918 | $ | 88,646 | $ | 155,498 | $ | 803,469 | ||||||||||||||||||||
Other non-financial assets (2) | 2,646 | 594 | 298 | 277 | 193 | 1,427 | – | 1,859 | 14,337 | 21,631 | ||||||||||||||||||||||||||||||
Total assets | $ | 187,601 | $ | 44,854 | $ | 23,361 | $ | 22,229 | $ | 29,413 | $ | 110,384 | $ | 146,918 | $ | 90,505 | $ | 169,835 | $ | 825,100 | ||||||||||||||||||||
Liabilities and equity | ||||||||||||||||||||||||||||||||||||||||
Deposits (3) | ||||||||||||||||||||||||||||||||||||||||
Unsecured borrowing | $ | 36,012 | $ | 14,247 | $ | 21,947 | $ | 14,865 | $ | 22,299 | $ | 49,577 | $ | 22,470 | $ | 8,525 | $ | 252,947 | $ | 442,889 | ||||||||||||||||||||
Secured borrowing | – | 2,423 | 546 | 2,613 | 3,509 | 21,150 | 14,733 | 8,384 | – | 53,358 | ||||||||||||||||||||||||||||||
Covered bonds | 2,592 | – | – | – | – | 3,204 | 2,499 | 3,677 | – | 11,972 | ||||||||||||||||||||||||||||||
Other | ||||||||||||||||||||||||||||||||||||||||
Acceptances | 1,329 | 435 | 404 | 624 | 2,406 | 1,907 | 2,167 | 113 | – | 9,385 | ||||||||||||||||||||||||||||||
Obligations related to securities sold short | 40,756 | – | – | – | – | – | – | – | – | 40,756 | ||||||||||||||||||||||||||||||
Obligations related to assets sold under repurchase agreements and securities loaned (2) | 58,494 | 1,835 | 1,009 | 560 | 654 | – | – | – | 1,480 | 64,032 | ||||||||||||||||||||||||||||||
Derivatives | 2,793 | 4,794 | 2,162 | 2,701 | 1,979 | 19,703 | 15,659 | 46,969 | 1 | 96,761 | ||||||||||||||||||||||||||||||
Other financial liabilities (2) | 25,789 | 652 | 816 | 291 | 437 | 274 | 108 | 3,730 | – | 32,097 | ||||||||||||||||||||||||||||||
Subordinated debentures | – | – | – | – | – | 233 | – | 7,382 | – | 7,615 | ||||||||||||||||||||||||||||||
Trust capital securities | – | – | – | – | – | 900 | – | – | – | 900 | ||||||||||||||||||||||||||||||
Total financial liabilities | $ | 167,765 | $ | 24,386 | $ | 26,884 | $ | 21,654 | $ | 31,284 | $ | 96,948 | $ | 57,636 | $ | 78,780 | $ | 254,428 | $ | 759,765 | ||||||||||||||||||||
Other non-financial liabilities (2) | 1,707 | 2,087 | 329 | 199 | 912 | 2,096 | 729 | 7,211 | 4,037 | 19,307 | ||||||||||||||||||||||||||||||
Equity | – | – | – | – | – | – | – | – | 46,028 | 46,028 | ||||||||||||||||||||||||||||||
Total liabilities and equity | $ | 169,472 | $ | 26,473 | $ | 27,213 | $ | 21,853 | $ | 32,196 | $ | 99,044 | $ | 58,365 | $ | 85,991 | $ | 304,493 | $ | 825,100 | ||||||||||||||||||||
Off-balance sheet items | ||||||||||||||||||||||||||||||||||||||||
Financial guarantees | $ | 340 | $ | 2,061 | $ | 2,445 | $ | 2,234 | $ | 1,941 | $ | 2,791 | $ | 2,532 | $ | 317 | $ | 22 | $ | 14,683 | ||||||||||||||||||||
Lease commitments | 58 | 117 | 174 | 172 | 167 | 1,246 | 856 | 1,258 | – | 4,048 | ||||||||||||||||||||||||||||||
Commitments to extend credit | 3,273 | 3,603 | 3,956 | 4,064 | 7,448 | 36,992 | 57,871 | 10,169 | 1,033 | 128,409 | ||||||||||||||||||||||||||||||
Other commitments | 145 | 614 | 707 | 1,102 | 2,110 | 374 | 181 | 163 | 56,141 | 61,537 | ||||||||||||||||||||||||||||||
Total off-balance sheet items | $ | 3,816 | $ | 6,395 | $ | 7,282 | $ | 7,572 | $ | 11,666 | $ | 41,403 | $ | 61,440 | $ | 11,907 | $ | 57,196 | $ | 208,677 | ||||||||||||||||||||
| (1) | Trading debt securities classified as fair value through profit or loss have been included in the less than 1 month category as there is no expectation to hold these assets to their contractual maturity. |
| (2) | Amounts have been revised from those previously presented. |
| (3) | A major portion of relationship-based deposits are repayable on demand or at short notice on a contractual basis while, in practice, these customer balances form a core base, as explained in the preceding Deposit profile section, for our operations and liquidity needs. |
Contractual maturities of financial liabilities and off-balance sheet items – undiscounted basis The following tables provide remaining contractual maturity analysis of our financial liabilities and off-balance sheet items. The amounts disclosed in the following table are the contractual undiscounted cash flows of all financial liabilities (i.e. par value or amount payable upon maturity). The amounts do not reconcile directly with those in our consolidated balance sheets as the table only incorporates cash flows relating to payments on maturity of the instrument and do not recognize premiums, discounts or mark-to-market adjustments recognized in the instruments’ carrying value as at the balance sheet date. Financial liabilities are based upon earliest period in which they are required to be paid. For off-balance sheet items, the undiscounted cash flows potentially payable under financial guarantees and commitments to extend credit are classified on the basis of the earliest date they can be called. |
Management’s Discussion and Analysis Royal Bank of Canada: Annual Report 2013 71
Table of Contents
Contractual maturities of financial liabilities and off-balance sheet items – undiscounted basis*
|
Table 60
|
| As at October 31, 2013 | ||||||||||||||||||||||||
| (Millions of Canadian dollars) | On demand | Within 1 year | 1 to 3 years | 3 to 5 years | Over 5 years | Total | ||||||||||||||||||
Financial liabilities | ||||||||||||||||||||||||
Deposits (1) | $ | 264,287 | $ | 128,884 | $ | 89,003 | $ | 46,895 | $ | 28,432 | $ | 557,501 | ||||||||||||
Other | ||||||||||||||||||||||||
Acceptances | – | 5,626 | 2,393 | 1,671 | 263 | 9,953 | ||||||||||||||||||
Obligations related to securities sold short | – | 47,128 | – | – | – | 47,128 | ||||||||||||||||||
Obligations related to assets sold under repurchase agreements and securities loaned | 1,061 | 57,855 | 1,500 | – | – | 60,416 | ||||||||||||||||||
Other liabilities | 60 | 23,378 | 635 | 406 | 4,095 | 28,574 | ||||||||||||||||||
Subordinated debentures | – | – | 200 | – | 7,208 | 7,408 | ||||||||||||||||||
Trust capital securities | – | 900 | – | – | – | 900 | ||||||||||||||||||
| 265,408 | 263,771 | 93,731 | 48,972 | 39,998 | 711,880 | |||||||||||||||||||
Off-balance sheet items | ||||||||||||||||||||||||
Financial guarantees (2) | 5,850 | 9,550 | 181 | 11 | – | 15,592 | ||||||||||||||||||
Operating leases | – | 717 | 1,264 | 787 | 1,346 | 4,114 | ||||||||||||||||||
Commitments to extend credit (2) | 117,753 | 35,413 | – | – | – | 153,166 | ||||||||||||||||||
| 123,603 | 45,680 | 1,445 | 798 | 1,346 | 172,872 | |||||||||||||||||||
Total financial liabilities and off balance-sheet items | $ | 389,011 | $ | 309,451 | $ | 95,176 | $ | 49,770 | $ | 41,344 | $ | 884,752 | ||||||||||||
| As at October 31, 2012 | ||||||||||||||||||||||||
| (Millions of Canadian dollars) | On demand | Within 1 year | 1 to 3 years | 3 to 5 years | Over 5 years | Total | ||||||||||||||||||
Financial liabilities | ||||||||||||||||||||||||
Deposits (1), (3) | $ | 237,643 | $ | 136,244 | $ | 73,722 | $ | 39,326 | $ | 19,902 | $ | 506,837 | ||||||||||||
Other | ||||||||||||||||||||||||
Acceptances | – | 5,198 | 1,907 | 2,167 | 113 | 9,385 | ||||||||||||||||||
Obligations related to securities sold short | – | 40,756 | – | – | – | 40,756 | ||||||||||||||||||
Obligations related to assets sold under repurchase agreements and securities loaned (3) | 1,480 | 62,552 | – | – | – | 64,032 | ||||||||||||||||||
Other liabilities (3) | 426 | 27,915 | 197 | 87 | 3,464 | 32,089 | ||||||||||||||||||
Subordinated debentures | – | – | 199 | – | 7,217 | 7,416 | ||||||||||||||||||
Trust capital securities | – | – | 900 | – | – | 900 | ||||||||||||||||||
| 239,549 | 272,665 | 76,925 | 41,580 | 30,696 | 661,415 | |||||||||||||||||||
Off-balance sheet items | ||||||||||||||||||||||||
Financial guarantees (2) | 11,406 | 2,965 | 291 | 20 | 1 | 14,683 | ||||||||||||||||||
Operating leases | – | 688 | 1,246 | 856 | 1,258 | 4,048 | ||||||||||||||||||
Commitments to extend credit (2) | 128,239 | 170 | – | – | – | 128,409 | ||||||||||||||||||
| 139,645 | 3,823 | 1,537 | 876 | 1,259 | 147,140 | |||||||||||||||||||
Total financial liabilities and off balance-sheet items | $ | 379,194 | $ | 276,488 | $ | 78,462 | $ | 42,456 | $ | 31,955 | $ | 808,555 | ||||||||||||
| * | This table represents an integral part of our 2013 Annual Consolidated Financial Statements. |
| (1) | A major portion of relationship-based deposits are repayable on demand or at short notice on a contractual basis while, in practice, these customer balances form a core base, as explained in the preceding Deposit profile section, for our operations and liquidity needs. |
| (2) | We believe that it is highly unlikely that all or substantially all of these guarantees and commitments will be drawn or settled within one year, and contracts may expire without being drawn or settled. The management of the liquidity risk associated with potential extensions of funds is outlined in the preceding Risk measurement section. |
| (3) | Amounts have been revised from those previously presented. |
Credit ratings
Our ability to access unsecured funding markets and to engage in certain collateralized business activities on a cost-effective basis are primarily dependent upon maintaining competitive credit ratings. Credit ratings and outlooks provided by rating agencies reflect their views and are based on their methodologies. Ratings are subject to change from time to time, based on a number of factors including, but not limited to, our financial strength, competitive position and liquidity and other factors not completely within our control.
On October 23, 2013, S&P again affirmed our ratings with a stable outlook reflecting S&P’s expectations that we will continue to manage our balance sheet prudently, maintain favourable asset quality, and generate consistent though slower earnings growth through our premier Canadian businesses.
On July 22, 2013, Moody’s affirmed our ratings with a stable outlook. On January 28, 2013, Moody’s removed systematic support from the subordinated debt ratings of RBC and all other Canadian banks, consistent with their announcement in October 2012.
On July 9, 2013, DBRS affirmed our ratings with a stable outlook, which are underpinned by our highly diversified business model, strong Canadian retail franchise and well positioned capital markets business.
On December 13, 2012, S&P upgraded our outlook to stable from negative and affirmed our long- and short-term issuer credit ratings. The outlook revision followed a review by S&P of banking sector industry and economic risks in Canada, which resulted in a revision to their Banking Industry Country Risk Assessment for Canada to group 2 from 1.
72 Royal Bank of Canada: Annual Report 2013 Management’s Discussion and Analysis
Table of Contents
The following table presents our major credit ratings and outlooks as at December 4, 2013:
Credit ratings
|
Table 61
| |||||||
| As at December 4, 2013(1) | ||||||||
| Short-term debt | Senior long-term debt | Outlook | ||||||
Moody’s | P-1 | Aa3 | stable | |||||
S&P | A-1+ | AA- | stable | (2) | ||||
Fitch Ratings | F1+ | AA | stable | |||||
DBRS | R-1(high) | AA | stable | |||||
| (1) | Credit ratings are not recommendations to purchase, sell or hold a financial obligation inasmuch as they do not comment on market price or suitability for a particular investor. Ratings are determined by the rating agencies based on criteria established from time to time by them, and are subject to revision or withdrawal at any time by the rating organization. |
| (2) | On December 13, 2012, S&P upgraded our outlook to stable from negative. |
On October 23, 2013, Kroll Bond Rating Agency (KBRA), a registered National Recognized Statistical Rating Organization with the SEC, assigned us senior long-term and short-term debt and deposit ratings of AA and K1+, respectively, with a stable outlook. KBRA was requested to rate a commercial MBS multi-borrower transaction where RBC was one of four third party interest rate cap providers. Given KBRA’s policy to rate all parties to a transaction, it was required to issue a rating on RBC. These ratings were unsolicited and we did not participate in the rating process.
Additional contractual obligations for rating downgrades
A lowering of our credit rating may have potentially adverse consequences for our funding capacity or access to the capital markets, may also affect our ability, and the cost, to enter into normal course derivative or hedging transactions and may require us to post additional collateral under certain contracts. However, we estimate, based on periodic reviews of ratings triggers embedded in our existing businesses and of our funding capacity sensitivity, that a minor downgrade would not significantly influence our liability composition, funding access, collateral usage and associated costs. The following table presents the additional collateral obligations required at the reporting date in the event of a one-, two- or three-notch downgrade to our credit ratings. These additional collateral obligations are incremental requirements for each successive downgrade and do not represent the cumulative impact. The amounts reported change periodically as a result of several factors including the transfer of trading activity to centrally cleared financial market infrastructures and exchanges, the expiration of transactions with downgrade triggers, the imposition of internal limitations on new agreements to exclude downgrade triggers, as well as normal course mark to market of positions with collateralized counterparties moving from a negative to a positive position. There is no outstanding senior debt issued in the market that contains rating triggers which would lead to early prepayment of principal.
Additional contractual obligations for rating downgrades
|
|
Table 62
|
|
| 2013 | 2012 | |||||||||||||||||||||||
| (Millions of Canadian dollars) | One-notch downgrade | Two-notch downgrade | Three-notch downgrade | One-notch downgrade | Two-notch downgrade | Three-notch downgrade | ||||||||||||||||||
Contractual derivatives funding or margin requirements | $ | 616 | $ | 171 | $ | 762 | $ | 1,582 | $ | 256 | $ | 248 | ||||||||||||
Other contractual funding or margin requirements (1) | 490 | 187 | 95 | 678 | 170 | – | ||||||||||||||||||
| (1) | Includes GICs issued by our municipal markets business out of New York and London. |
|
Insurance risk refers to the potential financial loss that may arise where the amount, timing and/or frequency of benefit payments under insurance or reinsurance contracts are different than expected. Insurance risk does not include other risks covered by other parts of our risk management framework (e.g., credit, market and operational risk).
We have put in place an Insurance Risk Framework designed to identify, manage, and report on the insurance risks that face the organization. Insurance risk is managed through our infrastructure, systems, controls, and monitoring. Specific risk management policies, methodologies, and programs have been developed to support the management of risk including: delegated risk approval authorities, a product development and pricing process, and experience study analysis.
|
Regulatory compliance risk is the risk of potential non-conformance with laws, rules, regulations, prescribed practices, or ethical standards in any jurisdiction in which we operate. Issues regarding compliance with laws and regulations can arise in a number of areas in a large complex financial institution such as RBC, and are often the result of inadequate or failed internal processes, people or systems.
Laws and regulations are in place to protect the financial and other interests of our clients, investors and the public. Changes to laws, including tax laws, regulations or regulatory policies, as well as the changes in how they are interpreted, implemented or enforced, could adversely affect us, for example by lowering barriers to entry in the businesses in which we operate or increasing our costs of compliance. Further, there is no assurance that we always will be or will be deemed to be in compliance with laws, regulations or regulatory policies. Accordingly, it is possible that we could receive a judicial or regulatory judgment or decision that results in fines, damages, and other costs or injunctions or loss of licenses or registrations that would damage our reputation and negatively impact our earnings. In addition, we are subject to litigation arising in the ordinary course of our business and the adverse resolution of any litigation could have a material adverse effect on our results or could give rise to significant reputational damage, which in turn could impact our future business prospects.
Global compliance has developed a Regulatory Compliance Management Framework consistent with regulatory expectations from OSFI and other regulators. The framework is designed to manage and mitigate the risks associated with failing to comply with, or adapt to, current and changing laws and regulations in the jurisdictions in which we operate. Within the framework there are five elements that form a cycle by which all regulatory compliance risk management programs are developed, implemented and maintained. The first element is intended to ensure our regulatory compliance programs evolve alongside our business activities and operations. The second element is intended to ensure regulatory compliance risks are identified and assessed appropriately so regulatory compliance programs are designed in a manner to most effectively
Management’s Discussion and Analysis Royal Bank of Canada: Annual Report 2013 73
Table of Contents
meet regulatory requirements. The third element relates to the design and implementation of specific controls. The fourth element is intended to ensure appropriate monitoring and oversight of the effectiveness of the controls. Lastly, the fifth element is intended to ensure the timely escalation and resolution of issues, and clear and transparent reporting. This is a critical step in enabling senior management and the Board of Directors to effectively perform their management and oversight responsibilities.
|
Operational risk is the risk of loss or harm resulting from inadequate or failed internal processes, people and systems or from external events.
Operational risk is embedded in all our activities, including the practices and controls used to manage other risks. Failure to manage operational risk can result in direct or indirect financial loss, reputational impact, regulatory censure, or failure in the management of other risks such as credit or market risk.
We have put in place an Operational Risk Framework which is founded on the principles of our Enterprise Risk Management Framework and sets out the elements that support these principles with respect to the management of operational risk. This framework is dynamic, articulating our strategy regarding management, measurement and reporting of operational risk. Its foundation is the Three Lines of Defence risk governance model as responsibility for risk management is shared across the organization. This model encompasses the practices, requirements, roles and responsibilities for a fully comprehensive, coordinated enterprise-wide approach for the management of operational risk.
Operational risk is difficult to measure in a complete and precise manner, given that exposure to operational risk is often implicit, bundled with other risks, or otherwise not taken on intentionally. In the financial services industry, measurement tools and methodologies continue to evolve. The two options available to us under Basel II are the Advanced Measurement Approach (AMA) and the Standardized Approach. Currently, we employ the Standardized Approach for measuring operational risk and we have made significant progress to meet requirements to achieve Advanced Measurement Approach status.
Operational risk is managed through our infrastructure, controls, systems and people, complemented by central groups focusing on enterprise-wide management and oversight of specific operational risks such as fraud, privacy, outsourcing, and business disruption, as well as people and systems risks.
Specific programs, policies, standards and methodologies have been developed to support the management of operational risk. These programs are (i) Risk and Control Assessment and monitoring of business environment and control factors with Key Risk indicators, (ii) Operational Risk Event data collection and analysis, (iii) External Event – Industry loss analysis, and (iv) Scenario Analysis.
|
Strategic risk is the risk that the enterprise or particular business areas will make inappropriate strategic choices, or will be unable to successfully implement selected strategies or related plans and decisions.
Responsibility for selecting and successfully implementing business strategies is mandated to the individual heads of the businesses. Oversight of strategic risk is the responsibility of the heads of the business segments, the Enterprise Strategy Office, GE, and the Board of Directors. Management of strategic risk is supported by the Enterprise Strategy Group through the use of an Enterprise Strategy Framework.
|
Reputation risk is the risk that an activity undertaken by an organization or its representatives will impair its image in the community or lower public confidence in it, resulting in the loss of business, legal action or increased regulatory oversight.
Reputation risk can arise from a number of events and primarily occurs in connection with credit risk, regulatory, legal and operational risks. Operational failures and non-compliance with laws and regulations can have a significant reputational impact on us.
We have put in place a Reputation Risk Framework which provides an overview of our approach to the management of this risk. It focuses on our organizational responsibilities, and controls in place to mitigate reputation risks.
The following principles guide our management of reputation risk:
| • | We must operate with integrity at all times in order to sustain a strong and positive reputation; |
| • | Protecting our reputation is the responsibility of all our employees, including senior management and extends to all members of the Board of Directors. |
|
The competition for clients among financial services companies in the markets in which we operate is intense. Client loyalty and retention can be influenced by a number of factors, including new technology used or services offered by our competitors, relative service levels, relative prices, product and service attributes, our reputation and actions taken by our competitors. Other companies, such as insurance companies and non-financial companies, are increasingly offering services traditionally provided by banks. This competition could also reduce net interest income, fee revenue and adversely affect our results.
|
In addition to the risks described in the Risk management section, there are other risk factors, described below, which may adversely affect our businesses and financial results. The following discussion is not exhaustive as other factors could also adversely affect our results.
Business and economic conditions
Our earnings are significantly affected by the general business and economic conditions in the geographic regions in which we operate. These conditions include consumer saving and spending habits as well as consumer borrowing and repayment patterns, business investment, government spending, the level of activity and volatility of the capital markets and inflation. For example, an economic downturn may result in high unemployment and lower family income, corporate earnings, business investment and consumer spending, and could adversely affect the demand for our loan and other products and result in higher provisions for credit losses. Given the importance of our Canadian operations, an economic downturn in Canada or in the U.S. impacting Canada would largely affect our personal and business lending activities in our Canadian Banking businesses, including cards, and could significantly impact our results of operations.
74 Royal Bank of Canada: Annual Report 2013 Management’s Discussion and Analysis
Table of Contents
Economic conditions in the Eurozone continue to show moderate signs of improvement as the risks of a sovereign default and exit from the currency union have lessened, although there continues to be risks to the growth outlook. We continue to follow market events very closely, and manage our exposure accordingly. Overall, we continue to transact business in a prudent manner and remain comfortable with our exposures in Europe, which are with well-rated counterparties mainly located in core European countries. For further details, refer to the Credit risk section.
In addition to our net exposure to Europe mentioned above, we are also subject to indirect exposure. We have implemented processes to monitor and mitigate indirect credit risk including specific controls related to the management of derivative and repo-style transaction exposures. Indirect market risk related to increased volatility resulting from European sovereign debt concerns are monitored through regular market risk stress testing and hypothetical scenario analysis. From an operational risk perspective, we have implemented contingency planning in the event of a crisis in the Eurozone economy.
Our analysis indicates that further deterioration in the Eurozone economies will result in adverse effects which are within our ability to manage as established through our stress testing, balance sheet analysis and operational assessments.
Our earnings are also sensitive to changes in interest rates. A continuing low interest rate environment in Canada, the U.S. and globally would result in net interest income being unfavourably impacted by spread compression largely in Personal & Commercial Banking and Wealth Management. While an increase in interest rates would benefit our businesses that are currently impacted by spread compression, a significant increase in interest rates could also adversely impact household balance sheets. This could result in credit deterioration which might negatively impact our financial results, particularly in some of our Personal & Commercial Banking and Wealth Management businesses.
Capital Markets and Investor & Treasury Services would be negatively impacted if global capital markets deteriorate resulting in lower average fee-based client assets and transaction volumes and trading volatility. In Wealth Management, weaker market conditions would lead to lower average fee-based client assets and transaction volumes. Worsening of financial and credit market conditions may adversely affect our ability to access capital markets on favourable terms and could negatively affect our liquidity, resulting in increased funding costs and lower transaction volumes in Capital Markets and Investor & Treasury Services. For further details on economic and market factors which may impact our financial performance, refer to the Wealth Management, Investor & Treasury Services and Capital Markets sections.
Government fiscal, monetary and other policies
Our businesses and earnings are affected by the fiscal, monetary or other policies that are adopted by the Bank of Canada and various other Canadian regulatory authorities, the Board of Governors of the Federal Reserve System in the U.S. and other U.S. government authorities, as well as those adopted by international regulatory authorities and agencies in jurisdictions in which we operate. Such policies can also adversely affect our clients and counterparties in Canada, the U.S. and internationally, which may increase the risk of default by such clients and counterparties.
Ability to attract and to retain employees
Competition for qualified employees is intense within the financial services industry and from non-financial industries looking to recruit. Although our goal is to retain and attract qualified employees, there is no assurance that we will be able to do so.
Accuracy and completeness of information on clients and counterparties
When deciding to extend credit or enter into other transactions with clients and counterparties, we may rely on information provided by or on behalf of clients and counterparties, including audited financial statements and other financial information. We may also rely on representations of clients and counterparties as to the completeness and accuracy of that information. Our financial results could be adversely impacted if the financial statements and other financial information relating to clients and counterparties on whom we rely do not comply with GAAP or are materially misleading.
Development and integration of our distribution networks
We regularly explore opportunities to expand our distribution networks, either through acquisitions or organically by adding, for example, new bank branches, insurance offices, online savings accounts and ATMs in high-growth, receptive markets. However, if we are not able to develop or integrate these distribution networks effectively, our results of operations and financial condition may be negatively affected.
Model risk
The use of models plays an important role in many of our business activities. We use a variety of models for many purposes, including the valuation of financial products, risk measurement and management of different types of risk. Model risk is the risk of error in the design, development, implementation or subsequent use of models. We have established an enterprise-wide Model Risk Management Framework, including principles, policies and procedures, roles and responsibilities to manage model risk. One of the key factors in the framework to mitigate model risk is independent validation.
Information technology risk
We use information technology for business operations and the enablement of strategic business goals and objectives. Information technology risk is the risk to our business associated with the use, ownership, operation, involvement, influence and adoption of information technology within the enterprise. It consists of information technology related events that could potentially have an adverse impact on our business. Such events could result in business interruption, service disruptions, theft of intellectual property and confidential information, additional regulatory scrutiny, litigation and reputational damage. To manage our information technology risk, we have established an enterprise-wide Information Technology Risk Management Framework.
Social media risk
The scale and profile of social media has grown to present a number of risks. These risks include brand and reputational damage, information leaks, non-compliance with regulatory requirements and governance risk. To manage the risks associated with social media, we have implemented an enterprise-wide policy as well as business unit policies on the usage of external social media, which sets out the requirements for the business and corporate use of social media and is part of our larger Social Media Governance Framework.
Environmental risk
Environmental risk is the risk of loss to financial, operational or reputational value resulting from the impact of environmental issues. It arises from our business activities and our operations. For example, the environmental issues associated with our clients’ purchase and sale of contaminated property or development of large-scale projects may give rise to credit and reputation risk. Operational and legal risks may arise from environmental issues at our branches, offices or data processing centres.
Management’s Discussion and Analysis Royal Bank of Canada: Annual Report 2013 75
Table of Contents
Corporate Environmental Affairs (CEA) sets enterprise-wide policy requirements for the identification, assessment, control, monitoring and reporting of environmental risk. Oversight is provided by GE and the Corporate Governance and Public Policy Committee (CG&PPC) of the Board of Directors. Business segments and corporate functions are responsible for incorporating environmental risk management requirements and controls within their operations. The CEA Group also provides advisory services and support to business segments on the management of specific environmental risks in business transactions.
Periodically, we verify that our environmental risk management policies and processes are operating as intended. On an annual basis, and more frequently as required, environmental risk management activities, issues, and trends are reported to GE and to the CG&PPC of the Board of Directors. Failure to adequately manage environmental risk could adversely impact our results and/or significantly impact our reputation.
For more information on RBC and environmental risk management, visit our website at rbc.com/community-sustainability/environment/responsible-financing.html.
Other factors
Other factors that may affect actual results include changes in government trade policy, changes in accounting standards, including their effect on our accounting policies, estimates and judgements, the timely and successful development of new products and services, our ability to cross-sell more products to customers, technological changes and our reliance on third parties to provide components of our business infrastructure, the failure of third parties to comply with their obligations to us and our affiliates as such obligations relate to the handling of personal information, fraud by internal or external parties, the possible impact on our business from disease or illness that affects local, national or global economies, disruptions to public infrastructure, including transportation, communication, power and water, international conflicts and other political developments including those relating to the war on terrorism, and our success in anticipating and managing the associated risks.
We caution that the foregoing discussion of risk factors, many of which are beyond our control, is not exhaustive and other factors could also affect our results.
For further details on our contingencies, including litigation, refer to Note 26 of our 2013 Annual Consolidated Financial Statements.
|
We actively manage our capital to maintain strong capital ratios and high ratings while providing strong returns to our shareholders. In addition to the regulatory requirements, we consider the expectations of rating agencies, depositors and shareholders, as well as our business plans, stress tests, peer comparisons and our internal capital ratio targets. Our goal is to optimize our capital usage and structure, and provide support for our business segments and clients and better returns for our shareholders, while protecting depositors and senior creditors.
Capital management framework
Our capital management framework provides the policies and processes for defining, measuring, raising and investing all types of capital in a coordinated and consistent manner. It includes the overall approach of capital management, including guiding principles as well as roles and responsibilities relating to capital adequacy and transactions, dividends, solo capital and management of risk-weighted assets and gross-adjusted assets or total exposures. We manage and monitor capital from several perspectives, including regulatory capital, economic capital and subsidiary capital.
Our capital planning is a dynamic process which involves various teams including Finance, Corporate Treasury, GRM and Economics, and covers internal capital ratio targets, potential capital transactions as well as projected dividend payouts and share repurchases. The integral parts of our capital planning comprise business operating plan, Enterprise-wide stress testing, Internal Capital Adequacy Assessment Process (ICAAP), along with the considerations of regulatory capital requirements and accounting changes, internal capital requirements, rating agency metrics and solo capital.
Our capital plan is established on an annual basis and is aligned with the management actions included in the annual business operating plan, which includes forecast growth in assets and earnings taking into account our business strategies, projected market and economic environment and peer positioning. This includes incorporating potential capital transactions based on our projected internal capital generation, business forecasts, market conditions and other developments, such as accounting and regulatory changes that may impact capital requirements. All of the components in the capital plan are monitored throughout the year and are revised as appropriate.
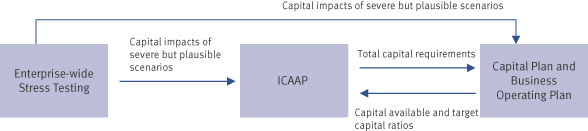
Our Enterprise-wide stress testing and ICAAP provide key inputs for capital planning including setting the appropriate internal capital ratio targets. The stress scenarios are evaluated across the organization, and results are integrated to develop an enterprise-wide view of financial impacts and capital requirements, which in turn facilitate the planning of mitigating actions to absorb exceptional adverse events. ICAAP is an OSFI mandated annual process to assess capital adequacy and requirements to cover all material risks, with a cushion to cover severe but plausible contingencies. In accordance with the OSFI guideline, the major components of our ICAAP process include comprehensive risk assessment, stress testing, capital assessment and planning (both economic and regulatory capital), board and senior management oversight, monitoring and reporting and internal control review.
Our internal capital targets are established to maintain robust capital positions in excess of OSFI’s Basel III “all-in” regulatory targets, which include minimum capital requirements plus a capital conservation buffer that can absorb losses during periods of stress. The “all-in” methodology includes all regulatory adjustments that will be required by 2019, while retaining the phase-out rules for non-qualifying capital instruments, as per OSFI’s Basel III Capital Adequacy Requirements (CAR) guideline published in December 2012. The stress test results of our Enterprise-wide stress testing and ICAAP are incorporated into the OSFI capital conservation buffer, with a view to ensuring the bank has adequate capital to underpin risks and absorb losses under all plausible stress scenarios given our risk profile and appetite. In addition, we include a discretionary cushion on top of the OSFI regulatory targets to maintain capital strength for forthcoming regulatory and accounting changes, peer comparatives, rating agencies sensitivities and solo capital level.
76 Royal Bank of Canada: Annual Report 2013 Management’s Discussion and Analysis
Table of Contents
The Board of Directors is responsible for the ultimate oversight of capital management, including the annual review and approval of capital plan. ALCO and GE share management oversight responsibility for capital management and receive regular reports detailing our compliance with established limits and guidelines. The Risk Committee is responsible for the governance of our capital management framework. The Audit and Risk Committees approve the capital plan which includes the approval of the ICAAP process. The Audit Committee is also responsible for the ongoing review of internal controls over capital management.
Basel III
Effective the first quarter of 2013, our regulatory capital requirements are determined on a Basel III “all-in” basis as per OSFI guidelines. Prior to the first quarter of 2013, our regulatory capital requirements were under the Basel II framework.
The top corporate entity to which Basel III applies at the consolidated level is Royal Bank of Canada.
Under Basel III, banks select from among alternative approaches to calculate their minimum regulatory capital required to underpin credit, market and operational risks.
We adopted the Basel III IRB approach to calculate credit risk capital for consolidated regulatory reporting purposes. While the majority of our credit risk exposures are reported under the Basel III IRB approach for regulatory capital purposes, certain portfolios considered non-material from a consolidated perspective continue to use the Basel III Standardized approach for credit risk (for example, our Caribbean banking operations). For consolidated regulatory reporting of operational risk capital, we continue to use the Standardized approach. For consolidated regulatory reporting of market risk capital, we use both Internal Models-based and Standardized approaches.
In December 2010, the BCBS issued “Basel III: A global regulatory framework for more resilient banks and banking systems”, which outlines the capital and liquidity requirements for global banks, with the objective of promoting financial stability and is intended to ensure sustainable economic growth. The BCBS sets out the Basel III transitional requirements for Common Equity Tier 1 (CET1), Tier 1 and Total capital ratios at 3.5%, 4.5% and 8%, respectively for 2013, which will be fully phased-in to 7%, 8.5% and 10.5%, respectively (including minimums plus capital conservation buffer of 2.5%) by January 1, 2019. The BCBS also released the Non-Viability Contingent Capital (NVCC) requirements in January 2011 with an effort to ensure the loss absorbency of regulatory capital instruments at the point of non-viability. In August 2011, OSFI issued an advisory outlining the NVCC principles and requirements, including a full and permanent conversion of non-common capital instruments into common shares upon a trigger event, effective the first quarter of 2013.
Effective the first quarter of 2013, OSFI expected Canadian banks to meet the “all-in” targets (minimum ratios plus the capital conservation buffer – January 1, 2019 BCBS requirements) for CET1 ratio, and Tier 1 and Total capital ratios by the first quarter of 2014. The final OSFI Basel III CAR guideline issued in 2013 also delayed the implementation of the CVA capital charge rules until January 1, 2014. In August 2013, OSFI published the advisory related to the phase-in options for the CVA capital charge over a period of five years, beginning in 2014.
In June 2013, BCBS published a consultative paper on “Revised Basel III leverage ratio framework and disclosure requirements” requiring public disclosure starting January 1, 2015. BCBS will continue to test the minimum requirement of 3% for the leverage ratio, and make any adjustments to the definition and calibration of the leverage ratio by 2017, with a view to migrating to Pillar 1 treatment on January 1, 2018 based on appropriate review and calibration. Starting January 1, 2013, Canadian banks are required to report the Basel III leverage ratio and its components to OSFI. The proposed leverage ratio is intended to act as a supplementary measure to risk-based capital requirements, and is currently defined as Basel III Tier 1 capital divided by Total exposures which include both on- and off-balance sheet exposures.
OSFI released the list of six Canadian banks, including RBC, which are designated as domestic systemically important banks (D-SIBs) in March 2013, for which an additional 1% risk weighted capital surcharge will be required commencing January 1, 2016. In July 2013, BCBS published a revised document on “Global systemically important banks (G-SIB): updated assessment methodology and the higher loss absorbency requirement”. BCBS requires all banks with a Basel III leverage ratio total exposure exceeding EUR 200 billion as well as those designated as G-SIBs in the prior year to make publicly available the 12 indicators used in the assessment methodology by 2014, with the goal of enhancing the transparency of the relative scale of banks’ potential global systemic importance and data quality. As indicated by OSFI in October 2013, Canadian banks, including RBC, that meet the BCBS size threshold and are not designated as G-SIBs in the previous year will be required to disclose in the report to shareholders the 12 indicators only (not the full template) for financial year ends 2013 and 2014 no later than the first quarter of 2015. For subsequent year ends, disclosure should be made as part of a bank’s annual report to shareholders.
The following table provides a summary of OSFI regulatory target ratios under Basel III:
Basel III – OSFI regulatory target
|
|
|
Table 63
|
| ||||||||||||||||||||||||||||||
Basel III Capital Ratios | OSFI regulatory target requirementsfor large banks under Basel III | RBC pro | RBC capital ratios as at October 31, 2013 | Meet or exceed OSFI target ratios | OSFI target as of(1) | |||||||||||||||||||||||||||||
| Minimum | Capital Buffer | Minimum including Capital Conservation Buffer | D-SIBs Surcharge (1) | Minimum including Capital Conservation Buffer and D-SIBs surcharge(1) | ||||||||||||||||||||||||||||||
Common Equity Tier 1 (%) | > 4.5% | 2.5% | > 7.0% | 1.0% | > 8.0% | 8.9% | 9.6% | ü | 2013/2016 | |||||||||||||||||||||||||
Tier 1 capital (%) | > 6.0% | 2.5% | > 8.5% | 1.0% | > 9.5% | 11.3% | 11.7% | ü | 2014/2016 | |||||||||||||||||||||||||
Total capital (%) | > 8.0% | 2.5% | > 10.5% | 1.0% | > 11.5% | 13.9% | 14.0% | ü | 2014/2016 | |||||||||||||||||||||||||
| (1) | The D-SIBs surcharge will be applicable to risk weighted capital commencing January 1, 2016. |
| (2) | The 2012 Basel III pro forma capital ratios have been restated to reflect the delayed regulatory implementation of a CVA capital charge requirement. |
Management’s Discussion and Analysis Royal Bank of Canada: Annual Report 2013 77
Table of Contents
The following table provides details on our regulatory capital, RWA and capital ratios. Our capital position remained strong during the year and our capital ratios remain well above OSFI regulatory targets:
Regulatory capital, RWA and capital ratios
Regulatory capital, risk-weighted assets (RWA) and capital ratios
|
|
|
Table 64
|
| ||||||||
| Basel III (1) | Basel III Pro forma (2) | Basel II | ||||||||||
| As at October 31 (Millions of Canadian dollars, except percentage and multiple amounts) | 2013 | 2012 | 2012 | |||||||||
Capital | ||||||||||||
CET1 | $ | 30,541 | $ | 27,447 | n.a. | (1) | ||||||
Tier 1 capital | 37,196 | 34,843 | 36,807 | |||||||||
Total capital | 44,716 | 42,575 | 42,347 | |||||||||
RWA | ||||||||||||
Credit risk | $ | 232,641 | $ | 231,197 | $ | 209,559 | ||||||
Market risk | 42,184 | 35,049 | 30,109 | |||||||||
Operational risk | 44,156 | 40,941 | 40,941 | |||||||||
RWA | $ | 318,981 | $ | 307,187 | $ | 280,609 | ||||||
Capital ratios and multiples(3) | ||||||||||||
CET1 ratio (1) | 9.6 % | 8.9 % | n.a. | (1) | ||||||||
Tier 1 capital ratio | 11.7 % | 11.3 % | 13.1 % | |||||||||
Total capital ratio | 14.0 % | 13.9 % | 15.1 % | |||||||||
Assets-to-capital multiple (4) | 16.6 X | 16.0 X | 16.7 X | |||||||||
GAA (billions) (4) | $ | 807.0 | $ | 742.7 | $ | 740.8 | ||||||
| (1) | Effective the first quarter of 2013, we calculate capital ratios and Assets-to-capital multiple using the Basel III framework. The capital ratios are calculated on the “all-in” basis. The prior periods’ capital ratios and Assets-to-capital multiple were calculated using the Basel II framework. Basel III and Basel II are not directly comparable. The CET1 ratio is a new regulatory measure under the Basel III framework. The CET1 capital and ratio are not applicable (n.a.) for prior periods as Basel III was adopted prospectively, effective the first quarter of 2013. |
| (2) | The 2012 Basel III pro forma capital, RWA, capital ratios and multiples have been restated to reflect the delayed regulatory implementation of the CVA capital charge requirement. |
| (3) | To enhance comparability among other global financial institutions, the following are our transitional capital ratios. The transitional CET1, Tier 1 and Total capital ratios as at October 31, 2013 were 11.9%, 11.9% and 13.9% respectively. Transitional is defined as capital calculated according to the current year’s phase-in of regulatory adjustments and phase-out of non-qualifying capital instruments. |
| (4) | Effective the first quarter of 2013, Assets-to-capital multiple and GAA are calculated on a transitional basis as per OSFI CAR Guideline. |
Basel III regulatory capital and capital ratios
Under Basel III, regulatory capital includes CET1, Tier 1 and Tier 2 capital.
CET1 capital comprises the highest quality of capital. Regulatory adjustments under Basel III are expanded to include full deductions of certain items and additional capital components that are subject to threshold deductions.
Tier 1 capital comprises predominantly CET1 and additional Tier 1 items. Tier 2 capital includes subordinated debentures that meet certain criteria, certain loan loss allowances and non-controlling interests in subsidiaries’ Tier 2 instruments. Total capital is defined as the sum of Tier 1 and Tier 2 capital.
Regulatory capital ratios are calculated by dividing CET1, Tier 1 and Total capital by RWA. Pending the BCBS’s review of the final Basel III leverage ratio framework, OSFI requires Canadian banks to maintain an Assets-to-capital multiple (which is calculated by dividing Gross-Adjusted Assets (GAA) by Total capital calculated on a Basel III transitional basis) at or below a maximum level prescribed by OSFI on a continuous basis. All items that are deducted from capital are excluded from total assets.
78 Royal Bank of Canada: Annual Report 2013 Management’s Discussion and Analysis
Table of Contents
The following chart provides a summary of the major components of CET1, Tier 1, Tier 2 and Total capital:

| (1) | First level: The amount by which each of the items exceeds a 10% threshold of CET1 capital (after all deductions but before threshold deductions) will be deducted from CET1 capital. Second level: The aggregate amount of the three items not deducted from the first level above and in excess of 15% of CET1 capital after regulatory adjustments will be deducted from capital, and the remaining balance not deducted will be risk-weighted at 250%. |
Regulatory capital
|
|
|
Table 65
|
| ||||
Basel III All-in basis | Basel II | |||||||
| (Millions of Canadian dollars, except percentage and otherwise noted) | 2013 | 2012 | ||||||
Common Equity Tier 1 capital: instruments and reserves and regulatory adjustments | ||||||||
Directly issued qualifying common share capital (and equivalent fornon-joint stock companies) | $ | 14,607 | $ | 14,354 | ||||
Retained earnings | 28,124 | 24,714 | ||||||
Other components of equity (and other reserves) | 1,207 | 195 | ||||||
Common share capital issued by subsidiaries and held by third parties (amount allowed in group CET1) | 11 | – | ||||||
Regulatory adjustments applied to Common Equity Tier 1 under Basel 3 | (13,408 | ) | – | |||||
Common Equity Tier 1 capital (CET1)(1) | 30,541 | |||||||
Additional Tier 1 capital: instruments and regulatory adjustments | ||||||||
Directly issued qualifying Additional Tier 1 instruments plus related stock surplus | – | 7,394 | ||||||
Directly issued capital instruments to phase out from Additional Tier 1 | 6,652 | – | ||||||
Additional Tier 1 instruments issued by subsidiaries and held by third parties (amount allowed in group AT1) | 3 | 34 | ||||||
Regulatory adjustments applied to Additional Tier 1 under Basel 3 | – | (9,884 | ) | |||||
Additional Tier 1 capital (AT1) | 6,655 | |||||||
Tier 1 capital (T1 = CET1 + AT1) | $ | 37,196 | $ | 36,807 | ||||
Tier 2 capital: instruments and provisions and regulatory adjustments | ||||||||
Directly issued qualifying Tier 2 instruments plus related stock surplus | – | 7,495 | ||||||
Directly issued capital instruments subject to phase out from Tier 2 | 7,234 | – | ||||||
Tier 2 instruments issued by subsidiaries and held by third parties (amount allowed in group Tier 2) | 24 | – | ||||||
Collective allowance | 262 | 191 | ||||||
Other | – | 221 | ||||||
Regulatory adjustments applied to Tier 2 under Basel 3 | – | (2,367 | ) | |||||
Tier 2 capital (T2) | $ | 7,520 | $ | 5,540 | ||||
Total capital (TC = T1 + T2) | $ | 44,716 | $ | 42,347 | ||||
| (1) | CET1 capital is a new regulatory measure under the Basel III framework. CET1 capital is not applicable for the prior period as Basel III was adopted prospectively, effective the first quarter of 2013. |
Management’s Discussion and Analysis Royal Bank of Canada: Annual Report 2013 79
Table of Contents
2013 (Basel III) vs. 2012 (Pro forma Basel III)
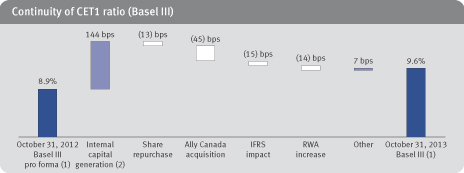
| (1) | Represents rounded figures. |
| (2) | Internal capital generation of $4.4 billion represents Net income available to shareholders less common and preferred shares dividends. |
Our Basel III CET 1 ratio was 9.6% as at October 31, 2013 as compared to our pro forma CET1 ratio of 8.9% as at October 31, 2012, up 70 bps mainly reflecting internal capital generation, partially offset by the acquisition of Ally Canada, the phase-in impact of IFRS and an increase in RWA. Common share repurchases reduced the CET1 ratio by approximately 13 bps.
We estimated that our Basel III CET 1 ratio as at October 31, 2013 would be reduced by the following two adjustments: (i) approximately 30 bps based on a 57% CET1 phase-in as per OSFI advisory, if the 2014 CVA capital charge was currently in effect; and (ii) approximately 10 bps, if the future accounting changes related to IAS 19 amendments were currently in effect. For further details, refer to Accounting and control matters section and Note 2 of our 2013 Annual Consolidated Financial Statements.
Our Basel III Tier 1 capital ratio of 11.7%, increased 40 bps from our pro forma Basel III Tier 1 capital ratio of 11.3% as at October 31, 2012 largely due to the factors noted in relation to the CET1 capital ratio above. The phase-out of non-qualifying Additional Tier 1 capital as well as the redemption of preferred shares series AH reduced Tier 1 capital ratio by approximately 19 bps and 7 bps respectively.
Our Total capital ratio of 14.0%, increased 10 bps from our pro forma Basel III Total capital ratio of 13.9% as at October 31, 2012, largely due to the factors noted in relation to the Tier 1 capital ratio above.
As at October 31, 2013, our Assets-to-capital multiple was 16.6 times compared to our pro forma Assets-to-capital multiple as at October 31, 2012 of 16.0 times a year ago largely due to higher GAA including the acquisition of Ally Canada, share repurchases and the IFRS transition impact, partially offset by internal capital generation.
80 Royal Bank of Canada: Annual Report 2013 Management’s Discussion and Analysis
Table of Contents
Basel III RWA
Under Basel III, the RWA requirement is more stringent than Basel II, largely reflecting the 250% risk-weighted threshold items not deducted from CET1 capital, increased and new capital charges for credit risk related to asset value correlation for financial institutions and exposures cleared through central counterparties, as well as the conversion of certain Basel II capital deductions to RWA.
OSFI requires banks to meet minimum risk-based capital requirements for exposures to credit risk, operational risk, and, where they have significant trading activity, market risk. RWA is calculated for each of these risk types and added together to determine total RWA. In addition, OSFI requires the minimum risk-based capital to be no less than 90% of the capital requirements as calculated under the Basel I standards. If the capital requirement is less than 90%, a transitional adjustment to RWA must be applied as prescribed by OSFI CAR guidelines.
RWA
|
|
|
Table 66
|
| ||||||||||||||||||||||||||||
| Basel III | Basel II | |||||||||||||||||||||||||||||||
| 2013 | 2012 | |||||||||||||||||||||||||||||||
| As at October 31 (Millions of Canadian dollars, except percentage amount) | Exposure (1) | Average of risk | Risk-weighted assets | |||||||||||||||||||||||||||||
| Standardized approach | Advanced approach | Other | Total | Total | ||||||||||||||||||||||||||||
Credit risk | ||||||||||||||||||||||||||||||||
Lending-related and other | ||||||||||||||||||||||||||||||||
Residential mortgages | $ | 183,461 | 5% | $ | 908 | $ | 7,582 | $ | – | $ | 8,490 | $ | 8,713 | |||||||||||||||||||
Other retail | 219,150 | 22% | 6,198 | 42,220 | – | 48,418 | 38,633 | |||||||||||||||||||||||||
Business | 199,344 | 51% | 15,331 | 86,449 | – | 101,780 | 100,357 | |||||||||||||||||||||||||
Sovereign | 46,302 | 8% | 1,687 | 2,223 | – | 3,910 | 3,266 | |||||||||||||||||||||||||
Bank | 73,492 | 7% | 2,168 | 3,241 | – | 5,409 | 4,801 | |||||||||||||||||||||||||
Total lending-related and other | $ | 721,749 | 23% | $ | 26,292 | $ | 141,715 | $ | – | $ | 168,007 | $ | 155,770 | |||||||||||||||||||
Trading-related | ||||||||||||||||||||||||||||||||
Repo-style transactions | $ | 251,648 | 1% | $ | 57 | $ | 2,578 | $ | 27 | $ | 2,662 | $ | 2,235 | |||||||||||||||||||
Derivatives | 67,055 | 25% | 3,005 | 13,095 | 389 | 16,489 | 11,908 | |||||||||||||||||||||||||
Total trading-related | $ | 318,703 | 6% | $ | 3,062 | $ | 15,673 | $ | 416 | $ | 19,151 | $ | 14,143 | |||||||||||||||||||
Total lending-related and other andtrading-related | $ | 1,040,452 | 18% | $ | 29,354 | $ | 157,388 | $ | 416 | $ | 187,158 | $ | 169,913 | |||||||||||||||||||
Bank book equities | 1,723 | 99% | – | 1,712 | – | 1,712 | 1,206 | |||||||||||||||||||||||||
Securitization exposures | 40,460 | 17% | 280 | 6,509 | – | 6,789 | 6,584 | |||||||||||||||||||||||||
Regulatory scaling factor | n.a. | n.a. | n.a. | 9,813 | – | 9,813 | 9,187 | |||||||||||||||||||||||||
Other assets | 35,234 | 77% | n.a. | n.a. | 27,169 | 27,169 | 22,669 | |||||||||||||||||||||||||
Total credit risk | $ | 1,117,869 | 21% | $ | 29,634 | $ | 175,422 | $ | 27,585 | $ | 232,641 | $ | 209,559 | |||||||||||||||||||
Market risk | ||||||||||||||||||||||||||||||||
Interest rate | $ | 2,509 | $ | 852 | $ | – | $ | 3,361 | $ | 6,547 | ||||||||||||||||||||||
Equity | 322 | 3,008 | – | 3,330 | 1,916 | |||||||||||||||||||||||||||
Foreign exchange | 1,551 | 110 | – | 1,661 | 1,704 | |||||||||||||||||||||||||||
Commodities | 971 | 19 | – | 990 | 844 | |||||||||||||||||||||||||||
Specific risk | 16,169 | 5,779 | – | 21,948 | 9,695 | |||||||||||||||||||||||||||
Incremental risk charge | – | 10,894 | – | 10,894 | 9,403 | |||||||||||||||||||||||||||
Total market risk | $ | 21,522 | $ | 20,662 | $ | – | $ | 42,184 | $ | 30,109 | ||||||||||||||||||||||
Operational risk | $ | 44,156 | n.a. | n.a. | $ | 44,156 | $ | 40,941 | ||||||||||||||||||||||||
Total risk-weighted assets | $ | 1,117,869 | $ | 95,312 | $ | 196,084 | $ | 27,585 | $ | 318,981 | $ | 280,609 | ||||||||||||||||||||
| (1) | Total exposure represents exposure at default which is the expected gross exposure upon the default of an obligor. This amount is before any allowance against impaired loans or partial write-offs and does not reflect the impact of credit risk mitigation and collateral held. |
| (2) | Represents the average of counterparty risk weights within a particular category. |
2013 (Basel III) vs. 2012 (Pro forma Basel III)
During the year, RWA was $319 billion, up $12 billion, as compared to our pro forma Basel III RWA of $307 billion for 2012, mainly due to higher market risk RWA due to an increase in trading exposures, the impact of foreign exchange in credit risk and the acquisition of Ally Canada. These factors were partially offset by the impact of an update of our risk parameters and our ongoing risk management and balance sheet optimization activities.
Management’s Discussion and Analysis Royal Bank of Canada: Annual Report 2013 81
Table of Contents
Selected capital management activity
The following table provides our selected capital management activity for the year ended October 31, 2013:
Selected capital management activity
|
|
Table 67
|
| |||||||
| 2013 | ||||||||||
| As at October 31 (Millions of Canadian dollars, except number of shares) | Issuance or redemption date | Number of shares (000s) | Amount | |||||||
Tier 1 | ||||||||||
Common shares issued | ||||||||||
Stock options exercised (1) | 2,528 | $ | 121 | |||||||
Purchased for cancellation | (6,775 | ) | (67 | ) | ||||||
Preferred shares | ||||||||||
Redemption of preferred shares AH series | July 2, 2013 | (8,500 | ) | (213 | ) | |||||
Tier 2 | ||||||||||
Issuance of December 6, 2024 subordinated debentures (2) | December 6, 2012 | 2,000 | ||||||||
Redemption of March 11, 2018 subordinated debentures (2) | March 13, 2013 | (1,000 | ) | |||||||
Redemption of June 6, 2018 subordinated debentures (2) | June 6, 2013 | (1,000 | ) | |||||||
| (1) | Amounts include cash received for stock options exercised during the period and the fair value adjustments to stock options. |
| (2) | For further details, refer to Note 19 of our 2013 Annual Consolidated Financial Statements. |
Dividends
Our common share dividend policy reflects our earnings outlook, payout ratio objective and the need to maintain adequate levels of capital to fund business opportunities. In 2013, our dividend payout ratio was 45%, which met our dividend payout ratio target of 40% to 50%. Common share dividends paid during the year were $3.7 billion.
Selected share data(1)
|
|
|
Table 68
|
| ||||||||||||||||||||||||||||||||||||
| 2013 | 2012 | 2011 | ||||||||||||||||||||||||||||||||||||||
| (Millions of Canadian dollars, except number of shares) | Number of (000s) | Amount | Dividends declared per share | Number of (000s) | Amount | Dividends declared per share | Number of (000s) | Amount | Dividends declared per share | |||||||||||||||||||||||||||||||
Common shares outstanding | 1,441,056 | $ | 14,377 | $ | 2.53 | 1,445,303 | $ | 14,323 | $ | 2.28 | 1,438,376 | $ | 14,010 | $ | 2.08 | |||||||||||||||||||||||||
First preferred shares outstanding | ||||||||||||||||||||||||||||||||||||||||
Non-cumulative Series W (2) | 12,000 | 300 | 1.23 | 12,000 | 300 | 1.23 | 12,000 | 300 | 1.23 | |||||||||||||||||||||||||||||||
Non-cumulative Series AA | 12,000 | 300 | 1.11 | 12,000 | 300 | 1.11 | 12,000 | 300 | 1.11 | |||||||||||||||||||||||||||||||
Non-cumulative Series AB | 12,000 | 300 | 1.18 | 12,000 | 300 | 1.18 | 12,000 | 300 | 1.18 | |||||||||||||||||||||||||||||||
Non-cumulative Series AC | 8,000 | 200 | 1.15 | 8,000 | 200 | 1.15 | 8,000 | 200 | 1.15 | |||||||||||||||||||||||||||||||
Non-cumulative Series AD | 10,000 | 250 | 1.13 | 10,000 | 250 | 1.13 | 10,000 | 250 | 1.13 | |||||||||||||||||||||||||||||||
Non-cumulative Series AE | 10,000 | 250 | 1.13 | 10,000 | 250 | 1.13 | 10,000 | 250 | 1.13 | |||||||||||||||||||||||||||||||
Non-cumulative Series AF | 8,000 | 200 | 1.11 | 8,000 | 200 | 1.11 | 8,000 | 200 | 1.11 | |||||||||||||||||||||||||||||||
Non-cumulative Series AG | 10,000 | 250 | 1.13 | 10,000 | 250 | 1.13 | 10,000 | 250 | 1.13 | |||||||||||||||||||||||||||||||
Non-cumulative Series AH | – | – | 0.86 | 8,500 | 213 | 1.41 | 8,500 | 213 | 1.41 | |||||||||||||||||||||||||||||||
Non-cumulative Series AJ (3) | 16,000 | 400 | 1.25 | 16,000 | 400 | 1.25 | 16,000 | 400 | 1.25 | |||||||||||||||||||||||||||||||
Non-cumulative Series AL (3) | 12,000 | 300 | 1.40 | 12,000 | 300 | 1.40 | 12,000 | 300 | 1.40 | |||||||||||||||||||||||||||||||
Non-cumulative Series AN (3) | 9,000 | 225 | 1.56 | 9,000 | 225 | 1.56 | 9,000 | 225 | 1.56 | |||||||||||||||||||||||||||||||
Non-cumulative Series AP (3) | 11,000 | 275 | 1.56 | 11,000 | 275 | 1.56 | 11,000 | 275 | 1.56 | |||||||||||||||||||||||||||||||
Non-cumulative Series AR (3) | 14,000 | 350 | 1.56 | 14,000 | 350 | 1.56 | 14,000 | 350 | 1.56 | |||||||||||||||||||||||||||||||
Non-cumulative Series AT (3) | 11,000 | 275 | 1.56 | 11,000 | 275 | 1.56 | 11,000 | 275 | 1.56 | |||||||||||||||||||||||||||||||
Non-cumulative Series AV (3) | 16,000 | 400 | 1.56 | 16,000 | 400 | 1.56 | 16,000 | 400 | 1.56 | |||||||||||||||||||||||||||||||
Non-cumulative Series AX (3) | 13,000 | 325 | 1.53 | 13,000 | 325 | 1.53 | 13,000 | 325 | 1.53 | |||||||||||||||||||||||||||||||
Treasury shares – preferred | 47 | 1 | 42 | 1 | (6 | ) | – | |||||||||||||||||||||||||||||||||
Treasury shares – common | 666 | 41 | 543 | 30 | 146 | 8 | ||||||||||||||||||||||||||||||||||
Stock options | ||||||||||||||||||||||||||||||||||||||||
Outstanding | 10,604 | 12,304 | 14,413 | |||||||||||||||||||||||||||||||||||||
Exercisable | 5,711 | 6,544 | 8,688 | |||||||||||||||||||||||||||||||||||||
Dividends | ||||||||||||||||||||||||||||||||||||||||
Common | 3,651 | 3,291 | 2,979 | |||||||||||||||||||||||||||||||||||||
Preferred | 253 | 258 | 258 | |||||||||||||||||||||||||||||||||||||
| (1) | For further details about our capital management activity, refer to Note 21 of our Annual Consolidated Financial Statements. |
| (2) | Effective February 24, 2010, we have the right to convert into common shares at our option, subject to certain restrictions. |
| (3) | Dividend rate will reset every five years. |
On October 25, 2013, we announced our intention to redeem all outstanding $900 million Trust Capital Securities Series 2013 at par. The redemption is expected to be completed on December 31, 2013 and will be financed out of general corporate funds.
On October 28 2013, we announced that the Toronto Stock Exchange (TSE) approved our normal course issuer bid (NCIB) to purchase up to 30 million of our common shares, commencing on November 1, 2013 and which may continue until October 31, 2014. Purchases may be made through the TSE, the New York Stock Exchange and other designated exchanges and published markets in both Canada and the U.S. The price paid for any repurchased shares will be the prevailing market price at the time of acquisition. We determine the amount and timing of the purchases under the NCIB, subject to prior consultation with OSFI. As at December 4, 2013, we have not purchased any shares under the 2014 NCIB.
82 Royal Bank of Canada: Annual Report 2013 Management’s Discussion and Analysis
Table of Contents
Our previous NCIB commenced on November 1, 2012 and expired on October 31, 2013. Over the term of the previous bid, we purchased 6.8 million of our common shares. The total cost of the share repurchase was $408 million, comprised of a book value of $67 million, with an additional $341 million premium paid on repurchase.
On November 4, 2013, we redeemed all outstanding $1 billion subordinated debentures due November 4, 2018 at par plus accrued
interest. The redemption was financed out of general corporate funds.
As at November 29, 2013, the number of outstanding common shares and stock options was 1,441,058,114 and 10,601,928, respectively. As at November 29, 2013, the number of Treasury shares – preferred and Treasury shares – common was (48,463) and (950,654), respectively.
Attributed capital
Our methodology for allocating capital to our business segments is based on the higher of fully diversified economic capital and the Basel III regulatory capital requirements. The capital conversion rate is aligned with our target CET1 ratio set in our Capital Plan. Risk-based capital attribution provides a uniform base for performance measurement among business segments, which compares to our overall corporate return objective and facilitates management decisions in resource allocation in conjunction with other factors. Capital attribution to each business segment might vary due to the evolving changes in regulatory requirements such as the delay of the implementation of the CVA capital charge until January 1, 2014, and the D-SIBs surcharge implementation commencing January 1, 2016.
Attributed capital is calculated and attributed on a wider array of risks compared to Basel III regulatory capital requirements, which are calibrated predominantly to target credit, market (trading) and operational risk measures. Economic capital is our internal quantification of risks associated with business activities which is the capital required to remain solvent under extreme market conditions, reflecting our objective to maintain a debt rating of at least AA. Economic capital is calculated based on credit, market (trading and non-trading), operational, business and fixed asset, and insurance risks, along with capital attribution for goodwill and other intangibles. The common risks between the two frameworks are aligned to reflect increased regulatory requirements.
| • | Business risk is the risk of loss or harm due to variances in volumes, prices and costs caused by competitive forces, regulatory changes, reputation and strategic risks. |
| • | Fixed asset risk is defined as the risk that the value of fixed assets will be less than their book value at a future date. |
For further discussion on credit, market, operational and insurance risks, refer to the Risk management section.
Attributed capital is also used to assess the adequacy of our capital base. Our policy is to maintain a level of available capital, defined as common equity and other capital instruments with equity-like loss absorption features such as preferred shares that exceed Economic capital with a comfortable cushion.
The calculation and attribution of capital involves a number of assumptions and judgments by management which are monitored to ensure that the economic capital framework remains comprehensive and consistent. The models are benchmarked to leading industry practices via participation in surveys, reviews of methodologies and ongoing interaction with external risk management industry professionals.
The following provides a discussion of our attributed capital:
Attributed capital
|
|
Table 69
|
| |||||
| (Millions of Canadian dollars) | 2013 | 2012 | ||||||
Credit risk | $ | 11,800 | $ | 9,550 | ||||
Market risk (trading and non-trading) | 3,300 | 3,800 | ||||||
Operational risk | 4,050 | 3,750 | ||||||
Business and fixed asset risk | 2,650 | 2,750 | ||||||
Insurance risk | 500 | 450 | ||||||
Goodwill and intangibles | 10,750 | 9,800 | ||||||
Regulatory capital allocation | 3,400 | 4,100 | ||||||
Attributed capital | $ | 36,450 | $ | 34,200 | ||||
Under attribution of capital | 5,200 | 2,550 | ||||||
Average common equity from discontinued operations | – | 400 | ||||||
Average common equity | $ | 41,650 | $ | 37,150 | ||||
2013 vs. 2012
Attributed capital increased by $2.3 billion largely due to an increase in Credit risk reflecting business growth and rate changes, higher Goodwill and intangible risk reflecting the acquisition of Ally Canada, the recognition of intangibles in certain businesses, and foreign exchange gains. Increased Operational risk due to revenue growth also contributed to the increase. These factors were partly offset by a decrease in Market risk primarily due to the annual revisions to our methodologies and lower regulatory capital adjustment of $0.7 billion resulting from the exclusion of CVA derived by OSFI’s decision to delay implementation until 2014.
We remain well capitalized with current levels of available capital exceeding the attributed capital required to underpin all of our material risks. Unattributed capital increased from the prior year as we retained additional capital in anticipation of the additional capital requirements by OSFI for D-SIBs. For further details on the additional capital, refer to table 63 which provides a summary of OSFI regulatory target ratios.
Subsidiary capital
Our capital management framework includes the management of our subsidiary capital. We invest capital across the enterprise to meet local regulators’ capital adequacy requirements and maximize returns to our shareholders. We invest in our subsidiaries as appropriate during the year. We set guidelines for defining capital investments in our subsidiaries and manage the relationship between capital invested in subsidiaries and our consolidated capital base to ensure that we can access capital recognized in our consolidated regulatory capital measurements.
Each of our subsidiaries has responsibility for maintaining its compliance with local regulatory capital adequacy requirements, which may include restrictions on the transfer of assets in the form of cash, dividends, loans or advances. Concurrently, Corporate Treasury provides centralized oversight and consolidated capital management across all subsidiary entities.
Other considerations affecting capital
Capital treatment for equity investments in other entities is determined by a combination of accounting and regulatory guidelines based on the size or nature of the investment. Three broad approaches apply as follows:
| • | Consolidation: entities in which we have a controlling interest are fully consolidated on our Consolidated Balance Sheets, and joint ventures are consolidated on a pro rata basis. |
Management’s Discussion and Analysis Royal Bank of Canada: Annual Report 2013 83
Table of Contents
| • | Deduction: certain holdings are deducted in full from our regulatory capital. These include all unconsolidated “substantial investments,” as defined by theBank Act (Canada), as well as all investments in insurance subsidiaries. |
| • | Risk weighting: unconsolidated equity investments that are not deducted from capital are risk weighted at a prescribed rate for determination of capital charges. |
Regulatory capital approach for securitization exposures
For our securitization exposures, we use an internal assessment approach (IAA) for exposures related to our ABCP business, and for other securitization exposures we use a combination of approaches including a ratings-based approach and the standardized approach.
While our IAA rating methodologies are based in large part on criteria that are published by External Credit Assessment Institutions (ECAIs) such as S&P and therefore are similar to the methodologies used by these institutions, they are not identical. Our ratings process includes a comparison of the available credit enhancement in a securitization structure to a stressed level of projected losses. The stress level used is determined by the desired risk profile of the transaction. As a result, we stress the cash flows of a given transaction at a higher level in order to achieve a higher rating. Conversely, transactions that only pass lower stress levels achieve lower ratings.
Most of the other securitization exposures (non-ABCP) carry external ratings and we use the lower of our own rating or the lowest external rating for determining the proper capital allocation for these positions. We periodically compare our own ratings to ECAIs ratings to ensure that the ratings provided by ECAIs are reasonable.
GRM has responsibility for providing risk assessments for capital purposes in respect of all our banking book exposures. GRM is independent of the business originating the securitization exposures and performs its own analysis, sometimes in conjunction with but always independent of the applicable business. GRM has developed asset class specific criteria guidelines which provide the rating methodologies for each asset class. The guidelines are reviewed periodically and are subject to the ratings replication process mandated by Pillar I of the Basel rules.
Additional financial information
|
Exposures to selected financial instruments
|
Exposure to U.S. subprime and Alt-A through RMBS, CDOs and mortgages
|
|
|
Table 70
|
| ||||||||||||||||||||||||||||
| 2013 | 2012 | |||||||||||||||||||||||||||||||
| As at October 31 (Millions of Canadian dollars) | Subprime RMBS | Alt-A RMBS | CDOs that may contain subprime or Alt-A | Total | Subprime RMBS | Alt-A RMBS | CDOs that may contain subprime or Alt-A | Total | ||||||||||||||||||||||||
Fair value of securities | $ | 205 | $ | 221 | $ | 15 | $ | 441 | $ | 256 | $ | 207 | $ | 17 | $ | 480 | ||||||||||||||||
Fair value of securities by rating | ||||||||||||||||||||||||||||||||
AAA | $ | 8 | $ | 8 | $ | – | $ | 48 | $ | – | $ | – | ||||||||||||||||||||
AA | 36 | 19 | – | 52 | 26 | – | ||||||||||||||||||||||||||
A | 16 | 25 | – | 6 | 5 | – | ||||||||||||||||||||||||||
BBB | 51 | 11 | – | 15 | 1 | – | ||||||||||||||||||||||||||
Below BBB- | 94 | 158 | 15 | 135 | 175 | 17 | ||||||||||||||||||||||||||
Total | $ | 205 | $ | 221 | $ | 15 | $ | 441 | $ | 256 | $ | 207 | $ | 17 | $ | 480 | ||||||||||||||||
Fair value of securities by vintage | ||||||||||||||||||||||||||||||||
2003 (or before) | $ | 1 | $ | 25 | $ | – | $ | 8 | $ | 11 | $ | – | ||||||||||||||||||||
2004 | 4 | 43 | – | 10 | 22 | – | ||||||||||||||||||||||||||
2005 | 94 | 63 | 15 | 100 | 75 | 17 | ||||||||||||||||||||||||||
2006 | 38 | 64 | – | 88 | 65 | – | ||||||||||||||||||||||||||
2007 and greater | 68 | 26 | – | 50 | 34 | – | ||||||||||||||||||||||||||
Total | $ | 205 | $ | 221 | $ | 15 | $ | 441 | $ | 256 | $ | 207 | $ | 17 | $ | 480 | ||||||||||||||||
Amortized cost of subprime/Alt-A mortgages (whole loans) | $ | 7 | $ | 26 | $ | – | $ | 33 | $ | 7 | $ | 30 | $ | – | $ | 37 | ||||||||||||||||
Total subprime and Alt-A exposures | $ | 212 | $ | 247 | $ | 15 | $ | 474 | $ | 263 | $ | 237 | $ | 17 | $ | 517 | ||||||||||||||||
Sensitivities of fair value of securities to changes in assumptions |
| |||||||||||||||||||||||||||||||
(Millions of Canadian dollars): | ||||||||||||||||||||||||||||||||
100bps increase in credit spread | $ | (4 | ) | $ | (10 | ) | ||||||||||||||||||||||||||
100bps increase in interest rates | (2 | ) | (6 | ) | ||||||||||||||||||||||||||||
20% increase in default rates | (5 | ) | (4 | ) | ||||||||||||||||||||||||||||
25% decrease in prepayment rates | (1 | ) | – | |||||||||||||||||||||||||||||
Exposure to U.S. subprime and Alt-A residential Mortgage-backed securities (RMBS), and collateralized debt obligations (CDOs) and mortgages
Certain activities and transactions we enter into expose us to the risk of default of U.S. subprime and Alt-A residential mortgages. Our exposures to U.S. subprime and Alt-A residential mortgages of $474 million represented less than 0.1% of our total assets as at October 31, 2013, compared to $517 million or 0.1% in the prior year. The decrease of $43 million was primarily due to the sale of securities.
2013 vs. 2012
Our total holdings of RMBS noted in the table above may be exposed to U.S. subprime risk. As at October 31, 2013, our U.S. subprime RMBS exposure of $205 million decreased $51 million or 20% from the prior year, primarily due to the sale of certain securities. Of this exposure, $60 million or 29% of our related holdings were rated A and above, a decrease of $46 million from the prior year due to the sale of certain securities.
As at October 31, 2013, U.S. subprime RMBS holdings rated AAA comprised 4% of our total U.S. subprime RMBS holdings compared with 19% in the prior year due to the sale of securities. As at October 31, 2013, our exposure to U.S. subprime loans of $7 million was unchanged from the prior year.
84 Royal Bank of Canada: Annual Report 2013 Management’s Discussion and Analysis
Table of Contents
Of our total portfolio of RMBS, holdings with a fair value of $221 million may be exposed to U.S. Alt-A risk. U.S. Alt-A exposures, increased $14 million from the prior year. Approximately 41% of these RMBS were issued during 2006 and onwards, compared to 48% in the prior year. As at October 31, 2013, our exposure to U.S. Alt-A loans of $26 million decreased $4 million from the prior year.
Of our total portfolio of CDOs, holdings of $15 million may be exposed to U.S. subprime or Alt-A risk, relatively unchanged from the prior year. As at October 31, 2013, the fair value of our corporate CDOs, which were predominately comprised of $1.4 billion of corporate collateralized loan obligations decreased $700 million from the prior year mainly due to the redemption of certain securities.
Off-balance sheet arrangements
For our off-balance sheet arrangements including multi-seller conduits, structured investment vehicles and other variable interest entities as at October 31, 2013, refer to the Off-balance sheet arrangements section.
Leveraged finance
Leveraged finance comprises infrastructure finance, essential services and other types of finance. It excludes investment grade financing and non-investment grade financing where there is no private equity sponsor involvement. This definition is subject to refinement moving forward. As at October 31, 2013, our total commitments, combined funded and unfunded of $13.6 billion, increased $1.5 billion from the prior year, reflecting an increase in client volumes. As at October 31, 2013, our total commitments, combined funded and unfunded represented 1.6% of our total assets similar to the prior year.
Commercial mortgage-backed securities
The fair value of our total direct holdings of commercial mortgage-backed securities was $128 million as at October 31, 2013.
Assets and liabilities measured at fair value
There were significant transfers in or out of levels 1, 2 or 3 in the current year, as classified by the fair value hierarchy set out in IFRS 7,Financial Instruments – Disclosures.
For further details, refer to Note 3 of our 2013 Annual Consolidated Financial Statements.
Assets and liabilities measured at fair value
|
|
Table 71
|
| |||||||||||
| As at October 31, 2013 | ||||||||||||||||||||
| (Millions of Canadian dollars, except percentage amounts) | Fair value (1) | Level 1 (1) | Level 2 (1) | Level 3 (1) | Total | |||||||||||||||
Financial assets | ||||||||||||||||||||
Securities at FVTPL | $ | 144,023 | 43% | 56% | 1% | 100% | ||||||||||||||
Available-for-sale | 38,271 | 15% | 72% | 13% | 100% | |||||||||||||||
Loans – Wholesale | 1,578 | 0% | 74% | 26% | 100% | |||||||||||||||
Derivatives | 106,012 | 2% | 97% | 1% | 100% | |||||||||||||||
Other assets | 983 | 53% | 46% | 1% | 100% | |||||||||||||||
Financial liabilities | ||||||||||||||||||||
Deposits | $ | 67,038 | 0% | 93% | 7% | 100% | ||||||||||||||
Derivatives | 108,238 | 2% | 95% | 3% | 100% | |||||||||||||||
| (1) | Fair value of assets and liabilities as a percentage of total assets and liabilities measured at fair value on a recurring basis for categories presented in the table above and does not reflect the impact of netting. |
Accounting and control matters
|
Critical accounting policies and estimates
|
Application of critical accounting policies and estimates
Our significant accounting policies are described in Note 2 to our 2013 Annual Consolidated Financial Statements. Certain of these policies, as well as estimates made by management in applying such policies, are recognized as critical because they require us to make particularly subjective or complex judgments about matters that are inherently uncertain and because of the likelihood that significantly different amounts could be reported under different conditions or using different assumptions. Our critical accounting policies and estimates relate to the fair value of financial instruments, allowance for credit losses, goodwill and other intangible assets, employee benefits, special purpose entities, derecognition of financial assets, and income taxes. Our critical accounting policies and estimates have been reviewed and approved by our Audit Committee, in consultation with management, as part of their review and approval of our significant accounting policies, estimates and judgments.
Fair value of financial instruments
The fair value of a financial instrument is the amount at which the financial instrument could be exchanged in an arm’s-length transaction between knowledgeable and willing parties under no compulsion to act. We determine fair value by incorporating all factors that market participants would consider in setting a price and using accepted economic methodologies for pricing financial instruments. We have established policies on approved methodologies and procedures for determining fair value. Valuation techniques are approved for use within our model risk management framework. The framework addresses, among other things, model development standards, validation processes and procedures, and approval authorities. Valuation techniques also include using a documented third-party pricing source list. The third party pricing source list gives priority to those services and prices having the highest and most consistent accuracy. The level of accuracy is developed over time by comparing third-party price values to traders’ or system values, to other pricing service values and, when available, to actual trade data.
In determining fair value, a hierarchy is used which prioritizes the inputs to valuation techniques. The fair value hierarchy gives the highest priority to unadjusted quoted prices in active markets for identical assets or liabilities (Level 1) and the lowest priority to unobservable inputs (Level 3). The availability of inputs relevant to the asset or liability and the relative reliability of the inputs might affect the selection of appropriate valuation techniques.
Management’s Discussion and Analysis Royal Bank of Canada: Annual Report 2013 85
Table of Contents
Level 1 inputs are unadjusted quoted prices in active markets for identical assets or liabilities that we have the ability to access at the measurement date. Level 2 inputs are inputs other than quoted prices in Level 1 that are observable for the asset or liability, either directly or indirectly. Level 2 inputs include quoted prices for similar assets or liabilities in active markets or quoted prices for identical or similar assets or liabilities in markets that are not active, and inputs that are derived principally from observable market data. Level 3 inputs are unobservable inputs for the asset or liability. Unobservable inputs are used to measure fair value to the extent that observable inputs are not available at the measurement date.
Where observable prices or inputs are not available, management judgment is required to determine fair values by assessing other relevant sources of information such as historical data, proxy information from similar transactions, and through extrapolation and interpolation techniques. For instruments not traded in an active market, fair value is determined using a valuation technique that maximizes the use of observable market inputs to the extent available. For more complex or illiquid instruments, significant judgment is required in the determination of the model used, the selection of model inputs, and in some cases the application of valuation adjustments to the model value or quoted price for inactively traded financial instruments, as the selection of model inputs may be subjective and the inputs may be unobservable. Unobservable inputs are inherently uncertain as there is little or no market data available from which to determine the level at which an arm’s length transaction would occur under normal business circumstances. Appropriate parameter uncertainty and market risk valuation adjustments for such inputs and other model risk valuation adjustments are assessed in all such instances.
We record valuation adjustments to appropriately reflect counterparty credit quality and our own creditworthiness, differences between the overnight index swap (OIS) curve and London Interbank Offered Rates (LIBOR) for collateralized derivatives, unrealized gains or losses at inception of the transaction, bid-offer spreads and unobservable parameters. These adjustments may be subjective as they require significant judgment in the input selection, such as probability of default and recovery rate, and are intended to arrive at fair value that is determined based on assumptions that market participants would use in pricing the financial instrument. The realized price for a transaction may be different from its recorded value that is previously estimated using management judgment, and may therefore impact unrealized gains and losses recognized in Non-interest income – Trading revenue or Other.
Valuation adjustments are recorded for the credit risk of our derivative portfolios in order to arrive at their fair values. Credit Valuation Adjustments (CVA) take into account our creditworthiness and our counterparties’ creditworthiness, the current and potential future mark-to-market of the transactions, and the effects of credit mitigants such as master netting and collateral agreements. CVA amounts are derived from estimates of exposure at default, probability of default, recovery rates on a counterparty basis, and market and credit factor correlations. Exposure at default is the amounts of expected derivative related assets and liabilities at the time of default, estimated through modeling using underlying risk factors. Probability of default and recovery rate is generally implied from the market prices for credit protection and credit ratings of the counterparty. Correlation is the statistical measure of how credit and market factors may move in relation to one another, if any. Correlation is estimated using historical data and market data where available. CVA is calculated daily and changes are recorded in Non-interest income – Trading revenue.
In order to reflect recently observed market practice of pricing collateralized over-the-counter (OTC) derivatives using the OIS curve, our valuation approach accounts for the difference between certain OIS rates and LIBOR for derivatives valuation as valuation adjustments. Market practices continue to evolve concerning the use of and construction of OIS curves that best reflect the nature of the underlying collateral and as a result, additional valuation adjustments may be required in the future.
Where required, a valuation adjustment is made to reflect the unrealized gain or loss at inception of a financial instrument contract where the fair value of that financial instrument is not obtained from a quoted market price or cannot be evidenced by other observable market transactions based on a valuation technique incorporating observable market data.
A bid-offer valuation adjustment is required when a financial instrument is valued at the mid-market price, instead of the bid or offer price for asset or liability positions, respectively. The valuation adjustment takes into account the spread from the mid to either the bid or offer price.
Some valuation models require parameter calibration from such factors as market observed option prices. The calibration of parameters may be sensitive to factors such as the choice of instruments or optimization methodology. A valuation adjustment is also estimated to mitigate the uncertainties of parameter calibration.
IFRS requires us to classify our financial instruments measured at fair value into three levels based on the transparency of the inputs used to measure the fair values of the instruments. As at October 31, 2013, we have $296 billion of financial assets (79% of our total financial assets at fair value) (2012 – $302 billion and 80.9%) and $234 billion of financial liabilities (84.8% of our total financial liabilities at fair value) (2012 – $246 billion and 85.5%), which fair values are based on observable inputs (Level 2 instruments). We also have $8 billion of financial assets (2.1% of our total financial assets at fair value) (2012 – $10 billion and 2.7%) and $8 billion of financial liabilities (2.8% of our total financial liabilities at fair value) (2012 – $13 billion and 4.5%), which valuations include significant unobservable inputs (Level 3 instruments).
At each reporting date or more frequently when conditions warrant, we evaluate our AFS securities to determine whether there is any objective evidence of impairment, such as a significant or prolonged decline in the fair value of the security below its cost or when an adverse effect on future cash flows from the security can be reliably estimated. When assessing impairment for debt instruments we primarily considered counterparty ratings and security-specific factors, including collateral, external ratings, subordination and other market factors. For complex debt instruments including U.S. non-agency MBS, ABS and other structured products, we also use cash flow projection models which incorporate actual and projected cash flows for each security using a number of assumptions and inputs that are based on security specific factors. The inputs and assumptions used such as default, prepayment and recovery rates are based on updated market data. For U.S. non-agency MBS, recovery rates are largely dependent upon forecasted property prices which were assessed at the municipal level, provided by a third-party vendor. In addition, we also consider the transaction structure and credit enhancement for the structured securities. If the result indicates that we will not be able to recover the entire principal and interest amount, we do a further review of the security in order to assess whether a loss would ultimately be realized. As equity securities do not have contractual cash flows, they are assessed differently than debt securities. In assessing whether there is any objective evidence that suggests that the security is impaired we consider factors which include the length of time and extent the fair value has been below the cost and the financial condition and near term prospects of the issuer. We also consider the estimated recoverable value and the period of recovery. We conduct further analysis for securities where the fair value had been below cost for greater than twelve months. If an AFS security is impaired, the cumulative unrealized losses previously recognized in Other components of equity are recognized directly in income under Non-interest income. As at October 31, 2013, our gross unrealized losses on AFS securities were $293 million (2012 – $359 million). Refer to Note 4 to our 2013 Annual Consolidated Financial Statements for more information.
Allowance for credit losses
We maintain allowance for credit losses relating to on-balance sheet exposures, such as loans and acceptances, and off-balance sheet items such as letters of credit, guarantees and unfunded commitments, at levels that management considers appropriate to cover credit related losses incurred as at the balance sheet date.
Allowances are determined individually for loans that are individually significant, and collectively for loans that are not individually significant and loans which are significant but for which there is no objective evidence of impairment, using current and historical credit
86 Royal Bank of Canada: Annual Report 2013 Management’s Discussion and Analysis
Table of Contents
information in both quantitative and qualitative assessments. For further information on allowance for credit losses, refer to Note 5 to our 2013 Annual Consolidated Financial Statements.
Individually assessed loans
Loans which are individually significant are assessed individually for objective indicators of impairment. A loan is considered impaired when management determines that it will not be able to collect all amounts due according to the original contractual terms or the equivalent value.
Credit exposures of individually significant loans are evaluated based on factors including the borrower’s overall financial condition, resources and payment record, and where applicable, the realizable value of any collateral. If there is evidence of impairment leading to an impairment loss, then the amount of the loss is recognized in income and is determined as the difference between the carrying amount of the loan, including accrued interest, and the estimated recoverable amount. The estimated recoverable amount is measured as the present value of expected future cash flows discounted at the loan’s original effective interest rate, including cash flows that may result from the realization of collateral less costs to sell.
Collectively assessed loans
Loans which are not individually significant, or which are individually assessed and not determined to be impaired, are collectively assessed for impairment. For the purposes of a collective evaluation of impairment, loans are grouped on the basis of similar risk characteristics, taking into account loan type, industry, geographic location, collateral type, past due status and other relevant factors.
The collective impairment allowance is determined by reviewing factors including: (i) historical loss experience, which takes into consideration historical probabilities of default, loss given default and exposure at default, in portfolios of similar credit risk characteristics, and (ii) management’s judgment on the level of impairment losses based on historical experience relative to the actual level as reported at the balance sheet date, taking into consideration the current portfolio credit quality trends, business and economic and credit conditions, the impact of policy and process changes, and other supporting factors. Future cash flows for a group of loans are collectively evaluated for impairment on the basis of the contractual cash flows of the loans in the group and historical loss experience for loans with credit risk characteristics similar to those in the group. Historical loss experience is adjusted based on current observable data to reflect the effects of current conditions that did not affect the period on which the historical loss experience is based and to remove the effects of conditions in the historical period that do not currently exist. The methodology and assumptions used for estimating future cash flows are reviewed regularly to reduce any differences between loss estimates and actual loss experience.
Write-off of loans
Loans and the related impairment allowance for credit losses are written off, either partially or in full, when there is no realistic prospect of recovery. Where loans are secured, they are generally written off after receipt of any proceeds from the realization of the collateral. In circumstances where the net realizable value of any collateral has been determined and there is no reasonable expectation of further recovery, write off may be earlier. For credit cards, the balances and related allowance for credit losses are written off when payment is 180 days in arrears. Personal loans are generally written off at 150 days past due.
Total allowance for credit losses
Based on the procedures discussed above, management believes that the total allowance for credit losses of $2,050 million is adequate to absorb estimated credit losses incurred in the lending portfolio as at October 31, 2013 (2012 – $2,088 million). This amount includes $91 million (2012 – $91 million) classified in Provisions under Other Liabilities on our Consolidated Balance Sheets, which relates to letters of credit and guarantees and unfunded commitments.
Goodwill and other intangible assets
We allocate goodwill to groups of cash-generating units (CGU). Goodwill is not amortized and is tested for impairment on an annual basis, or more frequently if there are objective indications of impairment. We test for impairment by comparing the recoverable amount of a CGU with its carrying amount. A CGU’s recoverable amount is the higher of its fair value less cost to sell and its value in use. The carrying amount of a CGU comprises the carrying amount of assets, liabilities, and goodwill allocated to the CGU. When the carrying value of a CGU exceeds its recoverable amount, the impairment loss is allocated first to reduce the carrying amount of any goodwill allocated to the CGU and then to the other assets of the CGU proportionally based on the carrying amount of each asset. Any impairment charge is recognized in income in the period it is identified. Subsequent reversals of goodwill impairment are prohibited.
We estimate the value in use and fair value less costs to sell of our CGUs primarily using a discounted cash flow approach which incorporates each CGU’s internal forecasts of revenues and expenses. Significant management judgment is applied in the determination of expected future cash flows (uncertainty in timing and amount), discount rates (based on CGU-specific risks) and terminal growth rates. CGU-specific risks include country risk, business/operational risk, geographic risk (including political risk, devaluation risk and government regulation), currency risk and price risk (including product pricing risk and inflation). If the forecast earnings and other assumptions in future periods deviate significantly from the current amounts used in our impairment testing, the value of our goodwill could become impaired.
Other intangible assets with a finite life are amortized on a straight-line basis over their estimated useful lives as follows: computer software – 3 to 10 years and customer relationships – 10 to 20 years. They are tested for impairment when there is an indication that an asset may be impaired. An impairment test is performed by comparing the carrying amount of the intangible asset to its recoverable amount. Where it is not possible to estimate the recoverable amount of an individual asset, we estimate the recoverable amount of the CGU to which the asset belongs. If the recoverable amount of the asset (or CGU) is less than its carrying amount, the carrying amount of the intangible asset is written down to its recoverable amount as an impairment loss. An impairment loss recognized previously is reversed if there is a change in the estimates used to determine the recoverable amount of the asset (or CGU) since the last impairment loss recognized. Significant judgment is applied in estimating the useful lives and recoverable amounts of our intangible assets and assessing whether certain events or circumstances constitute objective evidence of impairment. We do not have any intangible assets with indefinite lives.
As at October 31, 2013, we had $8.4 billion of goodwill (2012 – $7.5 billion) and $2.8 billion of other intangible assets (2012 – $2.7 billion). For further details, refer to Notes 2 and 10 to our 2013 Annual Consolidated Financial Statements.
Employee benefits
We sponsor a number of benefit programs to eligible employees, including registered pension plans, supplemental pension plans, health, dental, disability and life insurance plans.
The calculation of defined benefit expenses and obligations depends on various assumptions such as discount rates, expected rates of return on assets, healthcare cost trend rates, projected salary increases, retirement age, and mortality and termination rates. The discount rate
Management’s Discussion and Analysis Royal Bank of Canada: Annual Report 2013 87
Table of Contents
assumption is determined using spot rates from a derived Aa corporate bond yield curve for our Canadian pension and other post-employment plans, and spot rates from an Aa corporate bond yield curve for our U.S. pension and other post-employment plans. All other assumptions are determined by management, applying significant judgment, and are reviewed by the actuaries. Actual experience that differs from the actuarial assumptions will affect the amounts of benefit obligations and expenses that we recognize. As at October 31, 2013, the unrecognized net actuarial losses of our pension and other post-employment plans were $1,033 million and $127 million, respectively (2012 – $1,345 million and $134 million, respectively). The weighted average assumptions used and the sensitivity of key assumptions are presented in Note 17 to our 2013 Annual Consolidated Financial Statements.
Special Purpose Entities
A special purpose entity is an entity created to accomplish a narrow and well-defined objective with limited decision-making powers and pre-established or limited activities. We are required to consolidate an SPE if an assessment of the relevant factors indicates that we control the SPE. Relevant factors include: (i) whether the activities of the SPE are conducted on our behalf according to our specific business needs so that we obtain benefits from the SPE’s operation; (ii) whether we have the decision-making powers to obtain a majority of the benefits; (iii) whether we will obtain the majority of the benefits of the activities of the SPE; and (iv) whether we retain the majority of the residual ownership risks related to the assets or SPE in order to obtain the benefits from its activities.
We consider a number of factors in determining whether an entity is an SPE and, if required, analyzing whether we control the SPE. Our approach is generally focused on identifying the significant activities that impact the financial results of the SPE, and determining which party has substantive rights to control the decision making over those activities, and is also exposed to a majority of the SPE’s risks and rewards. In certain instances, conditions considered in isolation may indicate control or lack of control over an SPE, but when considered together require a significant degree of judgment to reach a conclusion. For further information on our involvement with SPEs, refer to the Off-balance sheet arrangements section and Note 7 to our 2013 Annual Consolidated Financial Statements.
Derecognition of financial assets
We periodically enter into transactions in which we transfer financial assets such as loans or packaged mortgage-backed securities (MBS) to special purpose entities (SPEs) or trusts that issue securities to investors. We derecognized the assets when our contractual rights to the cash flows from the assets have expired, when we retain the rights to receive the cash flows but assume an obligation to pay those cash flows to a third party subject to certain pass-through requirements, or when we transfer our contractual rights to receive the cash flows and substantially all of the risks and rewards of the assets have been transferred. When we retain substantially all of the risks and rewards of the transferred assets, the transferred assets are not derecognized from our Consolidated Balance Sheets and are accounted for as secured financing transactions. When we neither retain nor transfer substantially all risks and rewards of ownership of the assets, we derecognize the assets if control over the assets is relinquished. If we retain control over the transferred assets, we continue to recognize the transferred assets to the extent of our continuing involvement. Management’s judgment is applied in determining whether we have transferred or retained substantially all risk and rewards of ownership of the transferred financial asset.
The majority of assets transferred under repurchase agreements, securities lending agreements, and in our Canadian residential mortgage securitization transactions do not qualify for derecognition; as a result, we continue to record the associated transferred assets on our Consolidated Balance Sheets and no gains or losses are recognized for these securitization activities. Otherwise, a gain or loss is recognized on securitization by comparing the carrying amount of the transferred asset with its fair value at the date of the transfer. As at October 31, 2013, the carrying and fair values of the transferred assets that fail derecognition were $104 billion and $103 billion, respectively (2012 – $110 billion and $110 billion), and the carrying and fair values of the associated liabilities totalled $103 billion and $104 billion, respectively (2012 – $110 billion and $111 billion). For further information on derecognition of financial assets, refer to Note 6 to our 2013 Annual Consolidated Financial Statements.
Income taxes
We are subject to income tax laws in various jurisdictions where we operate, and the complex tax laws are potentially subject to different interpretations by us and the relevant taxation authority. Management’s judgment is applied in the interpretation of the relevant tax laws and in the estimation of the provision for current and deferred income taxes, including the expected timing and amount of the realization. A deferred tax asset or liability is determined for each temporary difference based on the tax rates that are expected to be in effect in the period that the asset is realized or the liability is settled. Where the temporary differences will not reverse in the foreseeable future, no deferred tax amount is recognized.
On a quarterly basis, we review whether it is probable that the benefits associated with our deferred tax assets will be realized, using both positive and negative evidence. Refer to Note 24 to our 2013 Annual Consolidated Financial Statements for further information.
Future changes in accounting policies and disclosure
|
IFRS 10Consolidated Financial Statements (IFRS 10)
In May 2011, the IASB issued IFRS 10, which replaces the consolidation requirements in IAS 27Consolidated and Separate Financial Statements (IAS 27) and SIC-12Consolidation – Special Purpose Entities (SIC-12) and provides a single consolidation model applicable to all types of entities. Under IFRS 10, consolidation is based on control. Three conditions must be satisfied to have control over an investee: (i) decision making power over the relevant activities, (ii) exposure to variable returns, and (iii) a link between power and returns. The determination of control is based on the current facts and circumstances and is continuously assessed. IFRS 10 contains a substantial amount of application guidance that expands on new and existing principles related to the determination of control. IFRS 10 is effective for us on November 1, 2013 with modified retrospective application based on entities in place as at the effective date.
Currently, we consolidate SPEs that we control based on an overall assessment of the purpose and design of the entity, our decision making rights, and our exposure to the majority of the risks and rewards of ownership. IFRS 10 places a greater emphasis on decision making power, which is a required condition for control. It removes the bright lines for assessing exposure to risks and rewards, and introduces new considerations related to our role as a principal or an agent in entities over which we have decision making power.
On adoption of IFRS 10, we expect the consolidation status of certain entities to change. We will deconsolidate RBC Capital Trust II as our involvement does not expose us to variable returns. This will result in the reclassification of $900 million from Trust capital securities to Deposits. See Note 20 for further details on our innovative capital instruments. Additionally, certain mutual funds will be consolidated where our exposure to variability indicates that our power as fund manager is in a principal capacity. The effects of these changes are not expected to have a material impact on our consolidated financial statements.
88 Royal Bank of Canada: Annual Report 2013 Management’s Discussion and Analysis
Table of Contents
IFRS 11Joint Arrangements (IFRS 11)
In May 2011, the IASB issued IFRS 11 which requires a party to a joint arrangement to determine the type of joint arrangement in which it is involved by assessing its rights and obligations arising from the arrangement. IFRS 11 requires a joint operator to recognize and measure the assets and liabilities in relation to its interest in the arrangement, and a joint venturer to apply equity method of accounting. IFRS 11 is effective for us on November 1, 2013. The adoption of this standard is not expected to have a material impact on our consolidated financial statements.
IFRS 12Disclosure of Interest in Other Entities (IFRS 12)
In May 2011, the IASB issued IFRS 12,Disclosure of Interests in Other Entities(IFRS 12), which provides enhanced guidance on the annual disclosure requirements of a reporting entity’s interests in other entities. The standard requires an entity to disclose information that helps users to evaluate the nature of, and risks associated with a reporting entity’s interests in subsidiaries, consolidated entities, associates, joint arrangements and, in particular, unconsolidated structured entities (off-balance sheet structures), and the effect of those interests on the entity’s financial position, financial performance and cash flows.
IFRS 12 is effective for us on November 1, 2013 with disclosure, including comparative periods, to be presented in our 2014 consolidated financial statements.
IAS 27Separate Financial Statements (IAS 27) and IAS 28Investments in Associates and Joint Ventures (IAS 28)
As a consequence of the new IFRS standards IFRS 10, IFRS 11 and IFRS 12, in May 2012, the IASB issued amended and retitled IAS 27,Separate Financial Statements andIAS 28Investments in Associates and Joint Ventures.These new requirements are effective for us on November 1, 2013. The adoption of these standards is not expected to have a material impact on our consolidated financial statements.
IFRS 13Fair Value Measurement (IFRS 13)
In May 2011, the IASB issued IFRS 13Fair Value Measurement which provides a revised definition of fair value and sets out a framework for measuring fair value in a single standard. IFRS 13 also requires more comprehensive disclosure requirements on fair value measurement. The measurement and disclosure requirements of IFRS 13 apply when another standard requires or permits the item to be measured at fair value with limited exceptions. IFRS 13 is effective for us on November 1, 2013 and is required to be applied prospectively from the adoption date. The adoption of this standard is not expected to have a material impact on our consolidated financial statements.
IAS 19Employee Benefits (IAS 19)
In June 2011, the IASB issued amendments to IAS 19 regarding the accounting for pensions and other post-employment benefits. The new requirements are effective for us on November 1, 2013 and will require a restatement of comparative figures. The amendments will alter the accounting for actuarial gains and losses, past service costs, interest expense and return on plan assets. The amended standard eliminates the deferral and amortization of actuarial gains and losses in net income, instead requiring the immediate recognition of actuarial gains and losses in Other comprehensive income (OCI). Past service costs will also be immediately recognized in the period in which a plan amendment occurs. Net interest, calculated by applying the discount rate to the Net defined benefit liability or asset, will replace the Interest cost and Expected return on plan assets components of Defined benefit pension expense. The amendments also introduce a number of enhanced disclosure requirements for defined benefit plans.
The amended standard is expected to impact our Consolidated Balance Sheets, Consolidated Statements of Income and Consolidated Statements of Comprehensive Income for the years ended October 31, 2013 and 2012 by the following amounts:
Impact of IAS 19 amendments
|
|
|
Table 72
|
| ||||
| As at or for the year ended | ||||||||
| (Millions of Canadian dollars) | October 31 2013 | October 31 2012 | ||||||
Consolidated Balance Sheets | ||||||||
(Decrease) in Prepaid pension benefit cost | $ | (923 | ) | $ | (920 | ) | ||
Increase in Accrued pension and other post-employment benefit expense | 268 | 589 | ||||||
Increase in Other assets – Deferred income tax asset | 316 | 400 | ||||||
(Decrease) in Retained earnings (opening) | (1,108 | ) | (297 | ) | ||||
(Decrease) in Retained earnings (closing) | (876 | ) | (1,108 | ) | ||||
Consolidated Statements of Income and Comprehensive Income | ||||||||
(Decrease) in Net income | (87 | ) | (32 | ) | ||||
Increase (Decrease) in Total other comprehensive income, net of taxes | 319 | (779 | ) | |||||
IFRS 7Disclosure – Offsetting Financial Assets and Financial Liabilities (IFRS 7)
In December 2011, the IASB issued amendments to IFRS 7, requiring extended disclosures to enable users to assess the effect of offsetting arrangements on an entity’s financial position. The amendments require entities to disclose both gross and net amounts associated with master netting agreements and similar arrangements, including the effects of financial collateral, whether or not they are presented net on the balance sheet. The amendments are effective for us on November 1, 2013 and we are required to adopt these disclosures in our 2014 consolidated financial statements.
Management’s Discussion and Analysis Royal Bank of Canada: Annual Report 2013 89
Table of Contents
Controls and procedures
|
Disclosure controls and procedures
Our disclosure controls and procedures are designed to provide reasonable assurance that information required to be disclosed by us in reports filed or submitted under Canadian and U.S. securities laws is recorded, processed, summarized and reported within the time periods specified under those laws and include controls and procedures that are designed to ensure that information is accumulated and communicated to management, including the President and Chief Executive Officer, and the Chief Administrative Officer and Chief Financial Officer, to allow timely decisions regarding required disclosure.
As of October 31, 2013, management evaluated, under the supervision of and with the participation of the President and Chief Executive Officer and the Chief Administrative Officer and Chief Financial Officer, the effectiveness of our disclosure controls and procedures as defined under rules adopted by the United States Securities and Exchange Commission. Based on that evaluation, the President and Chief Executive Officer and the Chief Administrative Officer and Chief Financial Officer concluded that our disclosure controls and procedures were effective as of October 31, 2013.
Internal control over financial reporting
Management is responsible for establishing and maintaining adequate internal control over financial reporting. Internal control over financial reporting is designed to provide reasonable assurance regarding the reliability of financial reporting and the preparation of financial statements for external purposes in accordance with GAAP. However, because of its inherent limitations, internal control over financial reporting may not prevent or detect misstatements on a timely basis. See Management’s Report on Internal Control over Financial Reporting and the Report of Independent Registered Chartered Accountants.
No changes were made in our internal control over financial reporting during the year ended October 31, 2013, that have materially affected, or are reasonably likely to materially affect, our internal control over financial reporting.
|
In the ordinary course of business, we provide normal banking services, operational services, and enter into other transactions with associated and other related corporations, including our joint venture entities, on terms similar to those offered to non-related parties. We grant loans to directors, officers and other employees at rates normally accorded to preferred clients. In addition, we offer deferred share and other plans to non-employee directors, executives and certain other key employees. For further information, refer to Notes 12 and 28 of our 2013 Annual Consolidated Financial Statements.
90 Royal Bank of Canada: Annual Report 2013 Management’s Discussion and Analysis
Table of Contents
|
Net interest income on average assets and liabilities
|
|
|
Table 73
|
| ||||||||||||||||||||||||||||||||||||
| Average balances | Interest | Average rate | ||||||||||||||||||||||||||||||||||||||
| (Millions of Canadian dollars, except for percentage amounts) | 2013 | 2012 (1) | 2011 (1) | 2013 | 2012 (1) | 2011 (1) | 2013 | 2012 (1) | 2011 (1) | |||||||||||||||||||||||||||||||
Assets | ||||||||||||||||||||||||||||||||||||||||
Deposits with other banks (2) | ||||||||||||||||||||||||||||||||||||||||
Canada | $ | 1,355 | $ | 193 | $ | 1,437 | $ | 56 | $ | 30 | $ | 21 | 4.13% | 15.54% | 1.46 % | |||||||||||||||||||||||||
U.S. | 426 | 899 | 305 | 4 | 8 | 8 | 0.94 | 0.90 | 2.62 | |||||||||||||||||||||||||||||||
Other International | 7,386 | 7,081 | 4,786 | 13 | 23 | 62 | 0.18 | 0.32 | 1.30 | |||||||||||||||||||||||||||||||
| 9,167 | 8,173 | 6,528 | 73 | 61 | 91 | 0.80% | 0.75% | 1.39 % | ||||||||||||||||||||||||||||||||
Securities | ||||||||||||||||||||||||||||||||||||||||
Trading | 137,053 | 122,606 | 148,307 | 3,113 | 3,028 | 3,910 | 2.27 | 2.47 | 2.64 | |||||||||||||||||||||||||||||||
Available-for-sale | 37,818 | 39,638 | 41,551 | 666 | 846 | 840 | 1.76 | 2.13 | 2.02 | |||||||||||||||||||||||||||||||
| 174,871 | 162,244 | 189,858 | 3,779 | 3,874 | 4,750 | 2.16 | 2.39 | 2.50 | ||||||||||||||||||||||||||||||||
Asset purchased under reverse repurchase agreements and securities borrowed | ||||||||||||||||||||||||||||||||||||||||
Loans (2), (3) | 123,766 | 104,465 | 82,353 | 941 | 945 | 736 | 0.76 | 0.90 | 0.89 | |||||||||||||||||||||||||||||||
Canada | ||||||||||||||||||||||||||||||||||||||||
Retail | 302,849 | 292,899 | 272,999 | 12,077 | 11,681 | 11,672 | 3.99 | 3.99 | 4.28 | |||||||||||||||||||||||||||||||
Wholesale | 49,228 | 37,778 | 30,583 | 2,486 | 2,468 | 1,548 | 5.05 | 6.53 | 5.06 | |||||||||||||||||||||||||||||||
| 352,077 | 330,677 | 303,582 | 14,563 | 14,149 | 13,220 | 4.14 | 4.28 | 4.35 | ||||||||||||||||||||||||||||||||
U.S. | 22,691 | 18,802 | 13,329 | 776 | 702 | 895 | 3.42 | 3.73 | 6.71 | |||||||||||||||||||||||||||||||
Other International | 21,135 | 14,251 | 13,337 | 1,018 | 1,121 | 1,121 | 4.82 | 7.87 | 8.41 | |||||||||||||||||||||||||||||||
| 395,903 | 363,730 | 330,248 | 16,357 | 15,972 | 15,236 | 4.13 | 4.39 | 4.61 | ||||||||||||||||||||||||||||||||
Total interest-earning assets | 703,707 | 638,612 | 608,987 | 21,150 | 20,852 | 20,813 | 3.01 | 3.27 | 3.42 | |||||||||||||||||||||||||||||||
Non-interest-bearing deposits with other banks | 11,716 | 9,520 | 6,665 | – | – | – | – | – | – | |||||||||||||||||||||||||||||||
Customers’ liability under acceptances | 9,663 | 8,617 | 7,547 | – | – | – | – | – | – | |||||||||||||||||||||||||||||||
Other assets(2) | 128,114 | 153,851 | 155,701 | – | – | – | – | – | – | |||||||||||||||||||||||||||||||
Total assets | $ | 853,200 | $ | 810,600 | $ | 778,900 | $ | 21,150 | $ | 20,852 | $ | 20,813 | 2.48% | 2.57% | 2.67 % | |||||||||||||||||||||||||
Liabilities and shareholders’ equity | ||||||||||||||||||||||||||||||||||||||||
Deposits(2), (4) | ||||||||||||||||||||||||||||||||||||||||
Canada | 374,962 | 350,099 | 306,754 | 5,190 | 5,318 | 5,318 | 1.38% | 1.52 % | 1.73 % | |||||||||||||||||||||||||||||||
U.S. | 40,006 | 36,430 | 41,638 | 169 | 210 | 232 | 0.42 | 0.58 | 0.56 | |||||||||||||||||||||||||||||||
Other International | 48,937 | 45,139 | 52,942 | 283 | 489 | 784 | 0.58 | 1.08 | 1.48 | |||||||||||||||||||||||||||||||
| 463,905 | 431,668 | 401,334 | 5,642 | 6,017 | 6,334 | 1.22 | 1.39 | 1.58 | ||||||||||||||||||||||||||||||||
Obligations related to securities sold short | 48,980 | 43,080 | 56,603 | 1,579 | 1,584 | 2,168 | 3.22 | 3.68 | 3.83 | |||||||||||||||||||||||||||||||
Obligations related to assets sold under repurchase agreements and securities loaned | 70,881 | 55,369 | 49,724 | 279 | 330 | 473 | 0.39 | 0.60 | 0.95 | |||||||||||||||||||||||||||||||
Subordinated debentures | 8,216 | 8,156 | 8,821 | 336 | 360 | 399 | 4.09 | 4.41 | 4.52 | |||||||||||||||||||||||||||||||
Other interest-bearing liabilities | 1,372 | 1,327 | 2,089 | 63 | 63 | 82 | 4.59 | 4.75 | 3.93 | |||||||||||||||||||||||||||||||
Total interest-bearing liabilities | 593,354 | 539,600 | 518,571 | 7,899 | 8,354 | 9,456 | 1.33 | 1.55 | 1.82 | |||||||||||||||||||||||||||||||
Non-interest-bearing deposits | 69,819 | 64,512 | 63,983 | – | – | – | – | – | – | |||||||||||||||||||||||||||||||
Acceptances | 9,663 | 8,617 | 7,547 | – | – | – | – | – | – | |||||||||||||||||||||||||||||||
Other liabilities(2) | 132,362 | 156,339 | 150,727 | – | – | – | – | – | – | |||||||||||||||||||||||||||||||
Total liabilities | $ | 805,198 | $ | 769,068 | $ | 740,828 | $ | 7,899 | $ | 8,354 | $ | 9,456 | 0.98% | 1.09% | 1.28 % | |||||||||||||||||||||||||
Equity | 48,002 | 41,532 | 38,072 | n.a. | n.a. | n.a. | n.a. | n.a. | n.a. | |||||||||||||||||||||||||||||||
Total liabilities and shareholders’ equity | $ | 853,200 | $ | 810,600 | $ | 778,900 | $ | 7,899 | $ | 8,354 | $ | 9,456 | 0.93% | 1.03% | 1.21 % | |||||||||||||||||||||||||
Net interest income and margin | $ | 853,200 | $ | 810,600 | $ | 778,900 | $ | 13,251 | $ | 12,498 | $ | 11,357 | 1.55% | 1.54% | 1.46 % | |||||||||||||||||||||||||
Net interest income and margin (average earning assets) | ||||||||||||||||||||||||||||||||||||||||
Canada | $ | 471,378 | $ | 442,585 | $ | 416,817 | $ | 10,960 | $ | 10,952 | $ | 9,693 | 2.33% | 2.47% | 2.33 % | |||||||||||||||||||||||||
U.S. | 116,016 | 87,845 | 73,404 | 1,602 | 957 | 1,093 | 1.38 | 1.09 | 1.49 | |||||||||||||||||||||||||||||||
Other International | 116,313 | 108,182 | 118,766 | 689 | 589 | 571 | 0.59 | 0.54 | 0.48 | |||||||||||||||||||||||||||||||
Total | $ | 703,707 | $ | 638,612 | $ | 608,987 | $ | 13,251 | $ | 12,498 | $ | 11,357 | 1.88% | 1.96 % | 1.86 % | |||||||||||||||||||||||||
| (1) | On a continuing operations basis. |
| (2) | In 2012, we reclassified cash collateral for 2012 and 2011 paid from Interest bearing deposits with banks and Loans-wholesale to Other assets and cash collateral received from Deposits to Other liabilities. |
| (3) | Interest income includes loan fees of $512 million (2012 – $467 million; 2011 – $434 million). |
| (4) | Deposits include savings deposits with average balances of $123 billion (2012 – $109 billion; 2011 – $97 billion), interest expense of $.7 billion (2012 – $.6 billion; 2011 – $.6 billion) and average rates of .6% (2012 – .6%; 2011 – .6%). Deposits also include term deposits with average balances of $269 billion (2012 – $264 billion; 2011 – $245 billion), interest expense of $4.2 billion (2012 – $4.6 billion; 2011 – $3.4 billion) and average rates of 1.58% (2012 – 1.74%; 2011 – 1.40%). |
Management’s Discussion and Analysis Royal Bank of Canada: Annual Report 2013 91
Table of Contents
Change in net interest income
|
Table 74
|
| 2013 vs. 2012 (1) | 2012 vs. 2011 (1) | |||||||||||||||||||||||||
| Increase (decrease) due to changes in | Increase (decrease) due to changes in | |||||||||||||||||||||||||
| (Millions of Canadian dollars) | Average volume(3) | Average rate(3) | Net change | Average volume (3) | Average rate (3) | Net change | ||||||||||||||||||||
Assets | ||||||||||||||||||||||||||
Deposits with other banks (4) | ||||||||||||||||||||||||||
Canada (2) | $ | 181 | $ | (155 | ) | $ | 26 | $ | (18 | ) | $ | 27 | $ | 9 | ||||||||||||
U.S. (2) | (4 | ) | – | (4 | ) | 16 | (16 | ) | – | |||||||||||||||||
Other international (2) | 1 | (11 | ) | (10 | ) | 30 | (69 | ) | (39 | ) | ||||||||||||||||
Securities | ||||||||||||||||||||||||||
Trading | 357 | (272 | ) | 85 | (678 | ) | (204 | ) | (882 | ) | ||||||||||||||||
Available-for-sale | (39 | ) | (141 | ) | (180 | ) | (39 | ) | 45 | 6 | ||||||||||||||||
Asset purchased under reverse repurchase | 175 | (179 | ) | (4 | ) | 198 | 11 | 209 | ||||||||||||||||||
Loans (4) | ||||||||||||||||||||||||||
Canada | ||||||||||||||||||||||||||
Retail | 397 | (1 | ) | 396 | 851 | (842 | ) | 9 | ||||||||||||||||||
Wholesale | 748 | (730 | ) | 18 | 364 | 556 | 920 | |||||||||||||||||||
U.S. | 145 | (71 | ) | 74 | 367 | (560 | ) | (193 | ) | |||||||||||||||||
Other international | 542 | (645 | ) | (103 | ) | 77 | (77 | ) | – | |||||||||||||||||
Total interest income | $ | 2,503 | $ | (2,205 | ) | $ | 298 | $ | 1,168 | $ | (1,129 | ) | $ | 39 | ||||||||||||
Liabilities | ||||||||||||||||||||||||||
Deposits(4) | ||||||||||||||||||||||||||
Canada | 378 | (506 | ) | (128 | ) | 751 | (751 | ) | – | |||||||||||||||||
U.S. | 21 | (62 | ) | (41 | ) | (29 | ) | 7 | (22 | ) | ||||||||||||||||
Other international | 41 | (247 | ) | (206 | ) | (116 | ) | (179 | ) | (295 | ) | |||||||||||||||
Obligations related to securities sold short | 217 | (222 | ) | (5 | ) | (518 | ) | (66 | ) | (584 | ) | |||||||||||||||
Obligations related to assets sold under repurchase agreements and securities loaned | 92 | (143 | ) | (51 | ) | 54 | (197 | ) | (143 | ) | ||||||||||||||||
Subordinated debentures | 3 | (27 | ) | (24 | ) | (30 | ) | (9 | ) | (39 | ) | |||||||||||||||
Other interest-bearing liabilities | 2 | (2 | ) | – | (30 | ) | 11 | (19 | ) | |||||||||||||||||
Total interest expense | $ | 754 | $ | (1,209 | ) | $ | (455 | ) | $ | 82 | $ | (1,184 | ) | $ | (1,102 | ) | ||||||||||
Net interest income | $ | 1,749 | $ | (996 | ) | $ | 753 | $ | 1,086 | $ | 55 | $ | 1,141 | |||||||||||||
| (1) | On a continuing operations basis. |
| (2) | Geographic classification for selected assets and liabilities is based on the domicile of the booking point of the subject assets and liabilities. |
| (3) | Volume/rate variance is allocated on the percentage relationship of changes in balances and changes in rates to the total net change in net interest income. |
| (4) | In 2012, we reclassified cash collateral for 2012 and 2011 paid from Interest bearing deposits with banks and Loans-wholesale to Other assets and cash collateral received from Deposits to Other liabilities. |
92 Royal Bank of Canada: Annual Report 2013 Management’s Discussion and Analysis
Table of Contents
Loans and acceptances by geography
|
Table 75
|
| IFRS | Canadian GAAP | |||||||||||||||||||||
| As at October 31 (Millions of Canadian dollars) | 2013 | 2012 (1) | 2011 (1) | 2010 (1) | 2009 (1) | |||||||||||||||||
Canada | ||||||||||||||||||||||
Residential mortgages | $ | 206,134 | $ | 195,552 | $ | 185,620 | $ | 124,064 | $ | 117,292 | ||||||||||||
Personal | 87,153 | 80,897 | 75,668 | 69,291 | 60,493 | |||||||||||||||||
Credit cards | 13,902 | 13,422 | 12,723 | 9,704 | 8,285 | |||||||||||||||||
Small business | 3,987 | 2,503 | 2,481 | 2,712 | 2,851 | |||||||||||||||||
Retail | 311,176 | 292,374 | 276,492 | 205,771 | 188,921 | |||||||||||||||||
Business | 57,724 | 50,319 | 45,186 | 45,217 | 47,110 | |||||||||||||||||
Sovereign | 3,807 | 3,751 | 3,304 | 2,785 | 1,394 | |||||||||||||||||
Bank | 823 | 390 | 747 | 808 | 1,096 | |||||||||||||||||
Wholesale | $ | 62,354 | $ | 54,460 | $ | 49,237 | $ | 48,810 | $ | 49,600 | ||||||||||||
| $ | 373,530 | $ | 346,834 | $ | 325,729 | $ | 254,581 | $ | 238,521 | |||||||||||||
U.S. | ||||||||||||||||||||||
Retail | 3,734 | 3,138 | 3,101 | 4,230 | 4,163 | |||||||||||||||||
Wholesale | 19,443 | 17,081 | 11,094 | 7,584 | 9,310 | |||||||||||||||||
| 23,177 | 20,219 | 14,195 | 11,814 | 13,473 | ||||||||||||||||||
Other International | ||||||||||||||||||||||
Retail | 6,768 | 5,673 | 5,152 | 4,936 | 4,625 | |||||||||||||||||
Wholesale | 17,103 | 16,900 | 12,110 | 11,084 | 12,964 | |||||||||||||||||
| 23,871 | 22,573 | 17,262 | 16,020 | 17,589 | ||||||||||||||||||
Total loans and acceptances | $ | 420,578 | $ | 389,626 | $ | 357,186 | $ | 282,415 | $ | 269,583 | ||||||||||||
Total allowance for loan losses | (1,959 | ) | (1,997 | ) | (1,967 | ) | (2,038 | ) | (2,164 | ) | ||||||||||||
Total loans and acceptances, net of allowance for loan losses | $ | 418,619 | $ | 387,629 | $ | 355,219 | $ | 280,377 | $ | 267,419 | ||||||||||||
Loans and acceptances by portfolio and sector
|
|
Table 76
|
|
| IFRS | Canadian GAAP | |||||||||||||||||||||
| As at October 31 (Millions of Canadian dollars) | 2013 | 2012 (1) | 2011 (1) | 2010 (1) | 2009 (1) | |||||||||||||||||
Residential mortgages | $ | 209,238 | $ | 198,324 | $ | 188,406 | $ | 126,790 | $ | 119,945 | ||||||||||||
Personal | 94,311 | 86,697 | 80,921 | 75,519 | 66,405 | |||||||||||||||||
Credit cards | 14,142 | 13,661 | 12,937 | 9,916 | 8,508 | |||||||||||||||||
Small business | 3,987 | 2,503 | 2,481 | 2,712 | 2,851 | |||||||||||||||||
Retail | $ | 321,678 | $ | 301,185 | $ | 284,745 | $ | 214,937 | $ | 197,709 | ||||||||||||
Business | ||||||||||||||||||||||
Agriculture | 5,441 | 5,202 | 4,880 | 4,705 | 4,967 | |||||||||||||||||
Automotive | 6,167 | 3,585 | 3,025 | 3,228 | 3,282 | |||||||||||||||||
Consumer goods | 6,230 | 5,432 | 5,341 | 5,202 | 5,323 | |||||||||||||||||
Energy | 8,906 | 8,802 | 6,394 | 5,869 | 6,984 | |||||||||||||||||
Non-bank financial services | 4,903 | 3,895 | 2,007 | 4,593 | 3,345 | |||||||||||||||||
Forest products | 893 | 811 | 698 | 726 | 761 | |||||||||||||||||
Industrial products | 4,038 | 3,938 | 3,381 | 3,143 | 3,331 | |||||||||||||||||
Mining & metals | 1,074 | 965 | 1,122 | 587 | 1,746 | |||||||||||||||||
Real estate & related | 24,413 | 20,650 | 15,569 | 12,651 | 13,308 | |||||||||||||||||
Technology & media | 4,006 | 4,203 | 2,712 | 2,257 | 2,307 | |||||||||||||||||
Transportation & environment | 5,593 | 5,221 | 4,927 | 3,546 | 4,184 | |||||||||||||||||
Other (2) | 21,520 | 20,554 | 17,011 | 15,290 | 17,041 | |||||||||||||||||
Sovereign | 4,396 | 4,193 | 4,050 | 3,765 | 2,779 | |||||||||||||||||
Bank | 1,320 | 990 | 1,324 | 1,916 | 2,516 | |||||||||||||||||
Wholesale | $ | 98,900 | $ | 88,441 | $ | 72,441 | $ | 67,478 | $ | 71,874 | ||||||||||||
Total loans and acceptances | $ | 420,578 | $ | 389,626 | $ | 357,186 | $ | 282,415 | $ | 269,583 | ||||||||||||
Total allowance for loan losses | (1,959) | (1,997 | ) | (1,967 | ) | (2,038 | ) | (2,164 | ) | |||||||||||||
Total loans and acceptances, net of allowance for loan losses | $ | 418,619 | $ | 387,629 | $ | 355,219 | $ | 280,377 | $ | 267,419 | ||||||||||||
| (1) | On a continuing operations basis. |
| (2) | Other in 2013 related to other services, $8.1 billion; financing products, $3.1 billion; holding and investments, $5.0 billion; health, $3.8 billion; and other, $1.5 billion. |
Management’s Discussion and Analysis Royal Bank of Canada: Annual Report 2013 93
Table of Contents
Impaired loans by portfolio and geography
|
|
Table 77
|
|
| IFRS | Canadian GAAP | |||||||||||||||||||||
| As at October 31 (Millions of Canadian dollars, except for percentage amounts) | 2013 | 2012 (1) | 2011 (1) | 2010 (1) | 2009 (1) | |||||||||||||||||
Residential mortgages | $ | 691 | $ | 674 | $ | 719 | $ | 691 | $ | 533 | ||||||||||||
Personal | 363 | 273 | 289 | 278 | 290 | |||||||||||||||||
Small business | 37 | 33 | 40 | 49 | 59 | |||||||||||||||||
Retail | 1,091 | 980 | 1,048 | 1,018 | 882 | |||||||||||||||||
| Business | ||||||||||||||||||||||
Agriculture | $ | 43 | $ | 52 | $ | 75 | $ | 74 | $ | 79 | ||||||||||||
Automotive | 12 | 17 | 38 | 97 | 36 | |||||||||||||||||
Consumer goods | 101 | 83 | 91 | 91 | 111 | |||||||||||||||||
Energy | 14 | 2 | 33 | 104 | 100 | |||||||||||||||||
Non-bank financial services | 1 | 5 | 13 | 28 | 197 | |||||||||||||||||
Forest products | 26 | 30 | 27 | 49 | 47 | |||||||||||||||||
Industrial products | 54 | 88 | 38 | 102 | 143 | |||||||||||||||||
Mining & metals | 2 | 2 | 4 | 8 | 18 | |||||||||||||||||
Real estate & related | 367 | 353 | 464 | 560 | 422 | |||||||||||||||||
Technology & media | 117 | 251 | 47 | 68 | 114 | |||||||||||||||||
Transportation & environment | 98 | 73 | 105 | 52 | 20 | |||||||||||||||||
Other (2) | 272 | 312 | 311 | 385 | 514 | |||||||||||||||||
Sovereign | – | – | – | 9 | 10 | |||||||||||||||||
Bank | 3 | 2 | 33 | 34 | 62 | |||||||||||||||||
Wholesale | 1,110 | 1,270 | 1,279 | 1,661 | 1,873 | |||||||||||||||||
Total impaired loans(3) | $ | 2,201 | $ | 2,250 | $ | 2,327 | $ | 2,679 | $ | 2,755 | ||||||||||||
Canada | ||||||||||||||||||||||
Residential mortgages | $ | 464 | $ | 475 | $ | 567 | $ | 544 | $ | 441 | ||||||||||||
Personal | 229 | 206 | 188 | 174 | 173 | |||||||||||||||||
Small business | 36 | 34 | 40 | 49 | 59 | |||||||||||||||||
Retail | 729 | 715 | 795 | 767 | 673 | |||||||||||||||||
Business | ||||||||||||||||||||||
Agriculture | 38 | 44 | 62 | 71 | 77 | |||||||||||||||||
Automotive | 9 | 11 | 30 | 87 | 27 | |||||||||||||||||
Consumer goods | 58 | 34 | 48 | 53 | 53 | |||||||||||||||||
Energy | 14 | – | 25 | 65 | 5 | |||||||||||||||||
Non-bank financial services | 1 | 3 | 1 | 1 | 1 | |||||||||||||||||
Forest products | 8 | 12 | 7 | 11 | 20 | |||||||||||||||||
Industrial products | 40 | 34 | 26 | 99 | 140 | |||||||||||||||||
Mining & metals | 2 | 2 | 2 | 4 | 6 | |||||||||||||||||
Real estate & related | 169 | 153 | 164 | 177 | 232 | |||||||||||||||||
Technology & media | 86 | 238 | 43 | 55 | 88 | |||||||||||||||||
Transportation & environment | 21 | 22 | 12 | 42 | 17 | |||||||||||||||||
Other | 80 | 88 | 93 | 106 | 173 | |||||||||||||||||
Sovereign | – | – | – | – | – | |||||||||||||||||
Bank | – | – | – | – | – | |||||||||||||||||
Wholesale | 526 | 641 | 513 | 771 | 839 | |||||||||||||||||
Total | $ | 1,255 | $ | 1,356 | $ | 1,308 | $ | 1,538 | $ | 1,512 | ||||||||||||
U.S. | ||||||||||||||||||||||
Retail | $ | 14 | $ | 7 | $ | 6 | $ | – | $ | – | ||||||||||||
Wholesale | 98 | 162 | 116 | 364 | 719 | |||||||||||||||||
Total | $ | 112 | $ | 169 | $ | 122 | $ | 364 | $ | 719 | ||||||||||||
Other International | ||||||||||||||||||||||
Retail | $ | 348 | $ | 258 | $ | 247 | $ | 251 | $ | 209 | ||||||||||||
Wholesale | 486 | 467 | 650 | 526 | 315 | |||||||||||||||||
Total | $ | 834 | $ | 725 | $ | 897 | $ | 777 | $ | 524 | ||||||||||||
Total impaired loans | $ | 2,201 | $ | 2,250 | $ | 2,327 | $ | 2,679 | $ | 2,755 | ||||||||||||
Allowance against impaired loans | (599 | ) | (637 | ) | (605 | ) | (721 | ) | (863 | ) | ||||||||||||
Net impaired loans | $ | 1,602 | $ | 1,613 | $ | 1,722 | $ | 1,958 | $ | 1,892 | ||||||||||||
Gross impaired loans as a % of loans and acceptances | ||||||||||||||||||||||
Residential mortgages | 0.33% | 0.34% | 0.38% | 0.54% | 0.44% | |||||||||||||||||
Personal | 0.39% | 0.31% | 0.36% | 0.37% | 0.44% | |||||||||||||||||
Small business | 0.92% | 1.32% | 1.61% | 1.81% | 2.07% | |||||||||||||||||
Retail | 0.34% | 0.33% | 0.37% | 0.47% | 0.45% | |||||||||||||||||
Wholesale | 1.12% | 1.44% | 1.77% | 2.46% | 2.61% | |||||||||||||||||
Total | 0.52% | 0.58% | 0.65% | 0.95% | 1.02% | |||||||||||||||||
Allowance against impaired loans as a % of gross impaired loans | 27.22% | 28.33% | 26.00% | 26.91% | 31.32% | |||||||||||||||||
| (1) | On a continuing operations basis. |
| (2) | Other in 2013 is related to other, $69 million; financing products, $38 million; other services, $101 million; holding and investments, $39 million; and health, $25 million. |
| (3) | Past due loans greater than 90 days not included in impaired loans were $346 million in 2013 (2012 – $393 million; 2011 – $525 million; 2010 – $180 million; 2009 – $312 million). |
94 Royal Bank of Canada: Annual Report 2013 Management’s Discussion and Analysis
Table of Contents
Provision for credit losses by portfolio and geography
|
|
Table 78
|
|
| IFRS | Canadian GAAP | |||||||||||||||||||||||||||
| (Millions of Canadian dollars, except for percentage amounts) | 2013 | 2012 (1) | 2011 (1) | 2010 (1) | 2009 (1) | |||||||||||||||||||||||
Residential mortgages | $ | 41 | $ | 67 | $ | 42 | $ | 25 | $ | 22 | ||||||||||||||||||
Personal | 458 | 445 | 438 | 457 | 494 | |||||||||||||||||||||||
Credit cards | 354 | 394 | 448 | 399 | 393 | |||||||||||||||||||||||
Small business | 32 | 43 | 35 | 45 | 55 | |||||||||||||||||||||||
Retail | $ | 885 | $ | 949 | $ | 963 | $ | 926 | $ | 964 | ||||||||||||||||||
Business | ||||||||||||||||||||||||||||
Agriculture | $ | 4 | $ | 8 | $ | 7 | $ | 18 | $ | 18 | ||||||||||||||||||
Automotive | 3 | (2 | ) | (4 | ) | 15 | 21 | |||||||||||||||||||||
Consumer goods | 17 | 27 | 14 | 29 | 38 | |||||||||||||||||||||||
Energy | (6 | ) | (11 | ) | (20 | ) | (6 | ) | 13 | |||||||||||||||||||
Non-bank financial services | 10 | 1 | (11 | ) | (34 | ) | 264 | |||||||||||||||||||||
Forest products | 4 | 5 | 5 | 3 | 11 | |||||||||||||||||||||||
Industrial products | 21 | 32 | 3 | (6 | ) | 38 | ||||||||||||||||||||||
Mining & metals | 1 | – | – | (1 | ) | 7 | ||||||||||||||||||||||
Real estate & related | 62 | 82 | 66 | 184 | 124 | |||||||||||||||||||||||
Technology & media | 157 | 102 | (3 | ) | 5 | 94 | ||||||||||||||||||||||
Transportation & environment | 35 | 47 | 29 | 10 | 8 | |||||||||||||||||||||||
Other (2) | 46 | 63 | 82 | 76 | 296 | |||||||||||||||||||||||
Sovereign | – | – | – | – | – | |||||||||||||||||||||||
Bank | – | – | – | 15 | 20 | |||||||||||||||||||||||
Wholesale | $ | 354 | $ | 354 | $ | 168 | $ | 308 | �� | $ | 952 | |||||||||||||||||
Total provision for credit losses on impaired loans | $ | 1,239 | $ | 1,303 | $ | 1,131 | $ | 1,234 | $ | 1,916 | ||||||||||||||||||
Canada | ||||||||||||||||||||||||||||
Residential mortgages | $ | 27 | $ | 34 | $ | 25 | $ | 7 | $ | 18 | ||||||||||||||||||
Personal | 391 | 413 | 408 | 444 | 467 | |||||||||||||||||||||||
Credit cards | 346 | 391 | 448 | 399 | 393 | |||||||||||||||||||||||
Small business | 32 | 43 | 35 | 45 | 55 | |||||||||||||||||||||||
Retail | $ | 796 | $ | 881 | $ | 916 | $ | 895 | $ | 933 | ||||||||||||||||||
Business | ||||||||||||||||||||||||||||
Agriculture | 4 | 8 | 7 | 18 | 18 | |||||||||||||||||||||||
Automotive | 3 | (2 | ) | (3 | ) | 15 | 17 | |||||||||||||||||||||
Consumer goods | 16 | 13 | 13 | 17 | 26 | |||||||||||||||||||||||
Energy | (6 | ) | (11 | ) | (9 | ) | 3 | (4 | ) | |||||||||||||||||||
Non-bank financial services | – | 1 | – | (1 | ) | 36 | ||||||||||||||||||||||
Forest products | 3 | 5 | 4 | 3 | 9 | |||||||||||||||||||||||
Industrial products | 14 | 12 | 3 | (4 | ) | 36 | ||||||||||||||||||||||
Mining & metals | 1 | – | 1 | 2 | 2 | |||||||||||||||||||||||
Real estate & related | 37 | 43 | 31 | 35 | 52 | |||||||||||||||||||||||
Technology & media | 50 | 98 | 6 | (6 | ) | 33 | ||||||||||||||||||||||
Transportation & environment | 2 | 10 | 5 | 10 | 7 | |||||||||||||||||||||||
Other | 27 | 32 | 44 | 30 | 204 | |||||||||||||||||||||||
Sovereign | – | – | – | – | – | |||||||||||||||||||||||
Bank | – | – | – | – | – | |||||||||||||||||||||||
Wholesale | $ | 151 | $ | 209 | $ | 102 | $ | 122 | $ | 436 | ||||||||||||||||||
Total | $ | 947 | $ | 1,090 | $ | 1,018 | $ | 1,017 | $ | 1,369 | ||||||||||||||||||
U.S. | ||||||||||||||||||||||||||||
Retail | 3 | 4 | 4 | – | – | |||||||||||||||||||||||
Wholesale | 32 | 29 | (19 | ) | 62 | 455 | ||||||||||||||||||||||
| $ | 35 | $ | 33 | $ | (15 | ) | $ | 62 | $ | 455 | ||||||||||||||||||
Other International | ||||||||||||||||||||||||||||
Retail | 86 | 64 | 43 | 31 | 31 | |||||||||||||||||||||||
Wholesale | 171 | 116 | 85 | 124 | 61 | |||||||||||||||||||||||
| $ | 257 | $ | 180 | $ | 128 | $ | 155 | $ | 92 | |||||||||||||||||||
Total provision for credit losses on impaired loans | $ | 1,239 | $ | 1,303 | $ | 1,131 | $ | 1,234 | $ | 1,916 | ||||||||||||||||||
Total provision for credit losses on non-impaired loans | – | (2 | ) | 2 | 6 | 251 | ||||||||||||||||||||||
Total provision for credit losses | 1,239 | 1,301 | 1,133 | 1,240 | 2,167 | |||||||||||||||||||||||
Provision for credit losses as a % of average | 0.31% | 0.35% | 0.33% | 0.40% | 0.72% | |||||||||||||||||||||||
| (1) | On a continuing operations basis. |
| (2) | Other in 2013 is related to financing products, $0.4 million; other services, $3.7 million; holdings and investments, $2.0 million; and other, $12.8 million. |
Management’s Discussion and Analysis Royal Bank of Canada: Annual Report 2013 95
Table of Contents
Allowance for credit losses by portfolio and geography
|
|
Table 79
|
|
| IFRS | Canadian GAAP | |||||||||||||||||||||||||||
| (Millions of Canadian dollars, except percentage amounts) | 2013 | 2012 (1) | 2011 (1) | 2010 (1) | 2009 (2) | |||||||||||||||||||||||
Allowance at beginning of year | $ | 2,088 | $ | 2,058 | $ | 2,966 | $ | 2,264 | $ | 1,734 | ||||||||||||||||||
Allowance at beginning of year – discontinued operations | – | – | (854 | ) | – | – | ||||||||||||||||||||||
Provision for credit losses | 1,239 | 1,301 | 1,133 | 1,240 | 2,167 | |||||||||||||||||||||||
Write-offs by portfolio | ||||||||||||||||||||||||||||
Residential mortgages | (24 | ) | (31 | ) | (16 | ) | (11 | ) | (9 | ) | ||||||||||||||||||
Personal | (498 | ) | (499 | ) | (515 | ) | (538 | ) | (535 | ) | ||||||||||||||||||
Credit cards | (466 | ) | (497 | ) | (545 | ) | (463 | ) | (445 | ) | ||||||||||||||||||
Small business | (35 | ) | (50 | ) | (45 | ) | (56 | ) | (54 | ) | ||||||||||||||||||
Retail | $ | (1,023 | ) | $ | (1,077 | ) | $ | (1,121 | ) | $ | (1,068 | ) | $ | (1,043 | ) | |||||||||||||
Business | $ | (450 | ) | $ | (291 | ) | $ | (226 | ) | $ | (478 | ) | $ | (805 | ) | |||||||||||||
Sovereign | – | – | (9 | ) | – | – | ||||||||||||||||||||||
Bank | – | (32 | ) | – | – | – | ||||||||||||||||||||||
Wholesale | $ | (450 | ) | $ | (323 | ) | $ | (235 | ) | $ | (478 | ) | $ | (805 | ) | |||||||||||||
Total write-offs by portfolio | $ | (1,473 | ) | $ | (1,400 | ) | $ | (1,356 | ) | $ | (1,546 | ) | $ | (1,848 | ) | |||||||||||||
Recoveries by portfolio | ||||||||||||||||||||||||||||
Residential mortgages | $ | 2 | $ | 1 | $ | 1 | $ | 1 | $ | 1 | ||||||||||||||||||
Personal | 96 | 83 | 79 | 79 | 65 | |||||||||||||||||||||||
Credit cards | 112 | 102 | 97 | 63 | 52 | |||||||||||||||||||||||
Small business | 9 | 8 | 7 | 7 | 5 | |||||||||||||||||||||||
Retail | $ | 219 | $ | 194 | $ | 184 | $ | 150 | $ | 123 | ||||||||||||||||||
Business | $ | 51 | $ | 39 | $ | 60 | $ | 51 | $ | 126 | ||||||||||||||||||
Sovereign | – | – | – | – | – | |||||||||||||||||||||||
Bank | – | – | – | – | – | |||||||||||||||||||||||
Wholesale | $ | 51 | $ | 39 | $ | 60 | $ | 51 | $ | 126 | ||||||||||||||||||
Total recoveries by portfolio | $ | 270 | $ | 233 | $ | 244 | $ | 201 | $ | 249 | ||||||||||||||||||
Net write-offs | $ | (1,203 | ) | $ | (1,167 | ) | $ | (1,112 | ) | $ | (1,345 | ) | $ | (1,599 | ) | |||||||||||||
Adjustments (3) | (74 | ) | (104 | ) | (75 | ) | (33 | ) | (38 | ) | ||||||||||||||||||
Total allowance for credit losses at end of year | $ | 2,050 | $ | 2,088 | $ | 2,058 | $ | 2,126 | $ | 2,264 | ||||||||||||||||||
Allowance against impaired loans | ||||||||||||||||||||||||||||
Canada | ||||||||||||||||||||||||||||
Residential mortgages | $ | 36 | $ | 41 | $ | 47 | $ | 47 | $ | 39 | ||||||||||||||||||
Personal | 97 | 89 | 88 | 88 | 94 | |||||||||||||||||||||||
Small business | 16 | 12 | 15 | 18 | 22 | |||||||||||||||||||||||
Retail | $ | 149 | $ | 142 | $ | 150 | $ | 153 | $ | 155 | ||||||||||||||||||
Business | ||||||||||||||||||||||||||||
Agriculture | $ | 6 | $ | 9 | $ | 13 | $ | 14 | $ | 10 | ||||||||||||||||||
Automotive | 4 | 7 | 15 | 27 | 6 | |||||||||||||||||||||||
Consumer goods | 15 | 14 | 17 | 20 | 18 | |||||||||||||||||||||||
Energy | 1 | 1 | 3 | 10 | 1 | |||||||||||||||||||||||
Non-bank financial services | – | – | – | 1 | – | |||||||||||||||||||||||
Forest products | 4 | 6 | 3 | 4 | 8 | |||||||||||||||||||||||
Industrial products | 15 | 10 | 12 | 36 | 63 | |||||||||||||||||||||||
Mining & metals | 1 | 1 | 1 | 1 | 1 | |||||||||||||||||||||||
Real estate & related | 42 | 45 | 47 | 36 | 44 | |||||||||||||||||||||||
Technology & media | 46 | 107 | 20 | 12 | 32 | |||||||||||||||||||||||
Transportation & environment | 6 | 8 | 5 | 6 | 7 | |||||||||||||||||||||||
Other | 30 | 31 | 43 | 40 | 72 | |||||||||||||||||||||||
Sovereign | – | – | – | – | – | |||||||||||||||||||||||
Bank | – | – | – | – | – | |||||||||||||||||||||||
Wholesale | $ | 170 | $ | 239 | $ | 179 | $ | 207 | $ | 262 | ||||||||||||||||||
| $ | 319 | $ | 381 | $ | 329 | $ | 360 | $ | 417 | |||||||||||||||||||
U.S. | ||||||||||||||||||||||||||||
Retail | $ | 2 | $ | 1 | $ | 1 | $ | – | $ | – | ||||||||||||||||||
Wholesale | 19 | 38 | 25 | 85 | 251 | |||||||||||||||||||||||
| $ | 21 | $ | 39 | $ | 26 | $ | 85 | $ | 251 | |||||||||||||||||||
Other International | ||||||||||||||||||||||||||||
Retail | $ | 146 | $ | 96 | $ | 80 | $ | 83 | $ | 74 | ||||||||||||||||||
Wholesale | 113 | 121 | 170 | 193 | 121 | |||||||||||||||||||||||
| $ | 259 | $ | 217 | $ | 250 | $ | 276 | $ | 195 | |||||||||||||||||||
Total allowance against impaired loans | $ | 599 | $ | 637 | $ | 605 | $ | 721 | $ | 863 | ||||||||||||||||||
Allowance against non-impaired loans | ||||||||||||||||||||||||||||
Residential mortgages | $ | 48 | $ | 48 | $ | 41 | $ | 26 | $ | 24 | ||||||||||||||||||
Personal | 405 | 392 | 412 | 480 | 449 | |||||||||||||||||||||||
Credit cards | 385 | 403 | 415 | 365 | 313 | |||||||||||||||||||||||
Small business | 45 | 60 | 60 | 60 | 47 | |||||||||||||||||||||||
Retail | $ | 883 | $ | 903 | $ | 928 | $ | 931 | $ | 833 | ||||||||||||||||||
Wholesale | $ | 477 | $ | 457 | $ | 434 | $ | 386 | $ | 468 | ||||||||||||||||||
Off-balance sheet and other items | $ | 91 | $ | 91 | $ | 91 | $ | 88 | $ | 100 | ||||||||||||||||||
Total allowance against non-impaired loans | $ | 1,451 | $ | 1,451 | $ | 1,453 | $ | 1,405 | $ | 1,401 | ||||||||||||||||||
Total allowance for credit losses | $ | 2,050 | $ | 2,088 | $ | 2,058 | $ | 2,126 | $ | 2,264 | ||||||||||||||||||
Key ratios | ||||||||||||||||||||||||||||
Allowance for credit losses as a % of loans and acceptances | 0.49% | 0.54% | 0.57% | 0.75% | 0.84% | |||||||||||||||||||||||
Net write-offs as a % of average net loans and acceptances | 0.30% | 0.28% | 0.33% | 0.49% | 0.60% | |||||||||||||||||||||||
| (1) | On a continuing operations basis. |
| (2) | Opening allowance for credit losses as at November 1, 2008 has been restated due to the implementation of amendments to CICA section 3855. |
| (3) | Under IFRS, other adjustments include $86 million of unwind of discount and $(12) million of changes in exchange rate (2012 – $110 million and $(6) million; 2011 – $78 million and $3 million). For further details, refer to Note 5 of our 2013 Annual Consolidated Financial Statements. |
96 Royal Bank of Canada: Annual Report 2013 Management’s Discussion and Analysis
Table of Contents
Credit quality information by Canadian province
|
|
Table 80
|
| |||||||||||||||||||||||||
| IFRS | Canadian GAAP | |||||||||||||||||||||||||||
| (Millions of Canadian dollars) | 2013 | 2012 (1) | 2011 (1) | 2010 (1) | 2009 (1) | |||||||||||||||||||||||
Loans and acceptances (2) | ||||||||||||||||||||||||||||
Atlantic provinces (3) | $ | 21,263 | $ | 19,953 | $ | 18,481 | $ | 14,558 | $ | 13,147 | ||||||||||||||||||
Quebec | 48,060 | 42,920 | 38,776 | 33,093 | 29,994 | |||||||||||||||||||||||
Ontario | 152,074 | 141,570 | 141,230 | 103,179 | 100,282 | |||||||||||||||||||||||
Prairie provinces (4) | 84,015 | 77,187 | 68,468 | 54,843 | 49,964 | |||||||||||||||||||||||
B.C. and territories (5) | 68,118 | 65,204 | 58,774 | 48,908 | 45,134 | |||||||||||||||||||||||
Total loans and acceptances in Canada | $ | 373,530 | $ | 346,834 | $ | 325,729 | $ | 254,581 | $ | 238,521 | ||||||||||||||||||
Gross impaired loans | ||||||||||||||||||||||||||||
Atlantic provinces (3) | $ | 83 | $ | 67 | $ | 66 | $ | 72 | $ | 57 | ||||||||||||||||||
Quebec | 177 | 180 | 135 | 162 | 190 | |||||||||||||||||||||||
Ontario | 424 | 502 | 398 | 598 | 647 | |||||||||||||||||||||||
Prairie provinces (4) | 330 | 338 | 404 | 429 | 300 | |||||||||||||||||||||||
B.C. and territories (5) | 241 | 269 | 305 | 277 | 318 | |||||||||||||||||||||||
Total gross impaired loans in Canada | $ | 1,255 | $ | 1,356 | $ | 1,308 | $ | 1,538 | $ | 1,512 | ||||||||||||||||||
Provision for credit losses on impaired loans | ||||||||||||||||||||||||||||
Atlantic provinces (3) | $ | 50 | $ | 62 | $ | 54 | $ | 50 | $ | 56 | ||||||||||||||||||
Quebec | 78 | 96 | 63 | 85 | 90 | |||||||||||||||||||||||
Ontario | 607 | 706 | 686 | 659 | 942 | |||||||||||||||||||||||
Prairie provinces (4) | 113 | 120 | 107 | 146 | 138 | |||||||||||||||||||||||
B.C. and territories (5) | 99 | 106 | 108 | 77 | 143 | |||||||||||||||||||||||
Total provision for credit losses on impaired loans in Canada | $ | 947 | $ | 1,090 | $ | 1,018 | $ | 1,017 | $ | 1,369 | ||||||||||||||||||
| (1) | On a continuing operations basis. |
| (2) | Comparative figures have been revised from those previously presented. |
| (3) | Comprises Newfoundland and Labrador, Prince Edward Island, Nova Scotia and New Brunswick. |
| (4) | Comprises Manitoba, Saskatchewan and Alberta. |
| (5) | Comprises British Columbia, Nunavut, Northwest Territories and Yukon. |
Small business loans and acceptances in Canada by sector
|
|
|
Table 81
|
| ||||||||||||||||||||||||
| IFRS | Canadian GAAP | |||||||||||||||||||||||||||
| As at October 31 (Millions of Canadian dollars) | 2013 | 2012 (1) | 2011 (1) | 2010 (1) | 2009 (1) | |||||||||||||||||||||||
Agriculture | $ | 371 | $ | 334 | $ | 302 | $ | 332 | $ | 304 | ||||||||||||||||||
Automotive | 676 | 662 | 684 | 643 | 666 | |||||||||||||||||||||||
Consumer goods | 2,479 | 2,415 | 2,448 | 2,367 | 2,261 | |||||||||||||||||||||||
Energy | 522 | 525 | 465 | 393 | 367 | |||||||||||||||||||||||
Non-bank financial services | 87 | 77 | 71 | 73 | 66 | |||||||||||||||||||||||
Forest products | 328 | 309 | 300 | 305 | 316 | |||||||||||||||||||||||
Industrial products | 1,779 | 1,849 | 1,830 | 1,712 | 1,696 | |||||||||||||||||||||||
Mining & metals | 127 | 125 | 140 | 113 | 102 | |||||||||||||||||||||||
Real estate & related | 3,916 | 3,569 | 3,439 | 3,205 | 3,053 | |||||||||||||||||||||||
Technology & media | 443 | 344 | 304 | 318 | 318 | |||||||||||||||||||||||
Transportation & environment | 1,106 | 1,137 | 1,039 | 941 | 961 | |||||||||||||||||||||||
Other (2) | 7,214 | 6,083 | 5,674 | 5,360 | 5,013 | |||||||||||||||||||||||
Total small business loans | $ | 19,048 | $ | 17,429 | $ | 16,696 | $ | 15,762 | $ | 15,123 | ||||||||||||||||||
| (1) | On a continuing operations basis. |
| (2) | Other sector in 2013 related primarily to other services, $3.6 billion; health, $2.2 billion; holding and investment, $282 million; financing products, $75 million; and not elsewhere classified, $1.1 billion. |
Management’s Discussion and Analysis Royal Bank of Canada: Annual Report 2013 97
Table of Contents
REPORTS AND CONSOLIDATED FINANCIAL STATEMENTS
|
Consolidated Financial Statements Royal Bank of Canada: Annual Report 2013 99
Table of Contents
Management’s responsibility for financial reporting
|
The accompanying consolidated financial statements of Royal Bank of Canada were prepared by management, which is responsible for the integrity and fairness of the information presented, including the many amounts that must of necessity be based on estimates and judgments. These consolidated financial statements were prepared in accordance with theBank Act (Canada) and International Financial Reporting Standards as issued by the International Accounting Standards Board. Financial information appearing throughout our Management’s Discussion and Analysis is consistent with these consolidated financial statements.
Our internal controls are designed to provide reasonable assurance that transactions are authorized, assets are safeguarded and proper records are maintained. These controls include quality standards in hiring and training of employees, policies and procedures manuals, a corporate code of conduct and accountability for performance within appropriate and well-defined areas of responsibility.
The system of internal controls is further supported by a compliance function, which is designed to ensure that we and our employees comply with securities legislation and conflict of interest rules, and by an internal audit staff, which conducts periodic audits of all aspects of our operations.
The Board of Directors oversees management’s responsibilities for financial reporting through an Audit Committee, which is composed entirely of independent directors. This Committee reviews our consolidated financial statements and recommends them to the Board for approval. Other key responsibilities of the Audit Committee include reviewing our existing internal control procedures and planned revisions to those procedures, and advising the directors on auditing matters and financial reporting issues. Our Chief Compliance Officer and Chief Internal Auditor have full and unrestricted access to the Audit Committee.
The Office of the Superintendent of Financial Institutions Canada (OSFI) examines and inquires into our business and affairs as deemed necessary to determine whether the provisions of theBank Actare being complied with, and that we are in sound financial condition. In carrying out its mandate, OSFI strives to protect the rights and interests of our depositors and creditors.
Deloitte LLP, Independent Registered Chartered Accountants appointed by our shareholders upon the recommendation of the Audit Committee and Board, have performed an independent audit of the consolidated financial statements and their report follows. The auditors have full and unrestricted access to the Audit Committee to discuss their audit and related findings.
Gordon M. Nixon
President and Chief Executive Officer
Janice R. Fukakusa
Chief Administrative Officer and Chief Financial Officer
Toronto, December 4, 2013
Report of Independent Registered Chartered Accountants
|
To the Shareholders of Royal Bank of Canada
We have audited the accompanying consolidated financial statements of Royal Bank of Canada and subsidiaries (the “Bank”), which comprise the consolidated balance sheets as at October 31, 2013 and October 31, 2012, and the consolidated statements of income, statements of comprehensive income, statements of changes in equity, and statements of cash flows for each of the years in the three-year period ended October 31, 2013, and a summary of significant accounting policies and other explanatory information.
Management’s Responsibility for the Consolidated Financial Statements
Management is responsible for the preparation and fair presentation of these consolidated financial statements in accordance with International Financial Reporting Standards as issued by the International Accounting Standards Board, and for such internal control as management determines is necessary to enable the preparation of consolidated financial statements that are free from material misstatement, whether due to fraud or error.
Auditor’s Responsibility
Our responsibility is to express an opinion on these consolidated financial statements based on our audits. We conducted our audits in accordance with Canadian generally accepted auditing standards and the standards of the Public Company Accounting Oversight Board (United States). Those standards require that we comply with ethical requirements and plan and perform the audit to obtain reasonable assurance about whether the consolidated financial statements are free from material misstatement.
An audit involves performing procedures to obtain audit evidence about the amounts and disclosures in the consolidated financial statements. The procedures selected depend on the auditor’s judgment, including the assessment of the risks of material misstatement of the consolidated financial statements, whether due to fraud or error. In making those risk assessments, the auditor considers internal control relevant to the entity’s preparation and fair presentation of the consolidated financial statements in order to design audit procedures that are appropriate in the circumstances. An audit also includes evaluating the appropriateness of accounting policies used and the reasonableness of accounting estimates made by management, as well as evaluating the overall presentation of the consolidated financial statements.
We believe that the audit evidence we have obtained in our audits is sufficient and appropriate to provide a basis for our audit opinion.
Opinion
In our opinion, the consolidated financial statements present fairly, in all material respects, the balance sheets of Royal Bank of Canada and subsidiaries as at October 31, 2013 and October 31, 2012, and their financial performance and cash flows for each of the years in the three-year period ended October 31, 2013 in accordance with International Financial Reporting Standards as issued by the International Accounting Standards Board.
100 Royal Bank of Canada: Annual Report 2013 Consolidated Financial Statements
Table of Contents
Other Matter
We have also audited, in accordance with the standards of the Public Company Accounting Oversight Board (United States), the Bank’s internal control over financial reporting as of October 31, 2013 based on the criteria established inInternal Control—Integrated Framework (1992) issued by the Committee of Sponsoring Organizations of the Treadway Commission and our report dated December 4, 2013 expressed an unqualified opinion on the Bank’s internal control over financial reporting.
Deloitte LLP
Independent Registered Chartered Accountants
Licensed Public Accountants
Toronto, Canada
December 4, 2013
Management’s Report on Internal Control over Financial Reporting
|
Management of Royal Bank of Canada is responsible for establishing and maintaining adequate internal control over financial reporting. Internal control over financial reporting is a process designed by, or under the supervision of, the President and Chief Executive Officer and the Chief Administrative Officer and Chief Financial Officer and effected by the Board of Directors, management and other personnel to provide reasonable assurance regarding the reliability of financial reporting and the preparation of financial statements for external purposes in accordance with generally accepted accounting principles. It includes those policies and procedures that:
| • | Pertain to the maintenance of records that, in reasonable detail, accurately and fairly reflect the transactions related to and dispositions of our assets |
| • | Provide reasonable assurance that transactions are recorded as necessary to permit preparation of financial statements in accordance with generally accepted accounting principles, and our receipts and expenditures are made only in accordance with authorizations of our management and directors |
| • | Provide reasonable assurance regarding prevention or timely detection of unauthorized acquisition, use, or disposition of our assets that could have a material effect on our financial statements. |
Due to its inherent limitations, internal control over financial reporting may not prevent or detect misstatements on a timely basis. Also, projections of any evaluation of the effectiveness of internal control over financial reporting to future periods are subject to the risk that the controls may become inadequate because of changes in conditions, or that the degree of compliance with the policies or procedures may deteriorate.
Management evaluated, under the supervision of and with the participation of the President and Chief Executive Officer and the Chief Administrative Officer and Chief Financial Officer, the effectiveness of our internal control over financial reporting as of October 31, 2013, based on the criteria set forth inInternal Control – Integrated Framework issued by the Committee of Sponsoring Organizations of the Treadway Commission. Based on that evaluation, management concluded that, as of October 31, 2013, internal control over financial reporting was effective based on the criteria established in theInternal Control – Integrated Framework. Also, based on the results of our evaluation, management concluded that there were no material weaknesses that have been identified in internal control over financial reporting as of October 31, 2013.
Our internal control over financial reporting as of October 31, 2013 has been audited by Deloitte LLP, Independent Registered Chartered Accountants, who also audited our Consolidated Financial Statements for the year ended October 31, 2013, as stated in the Report of Independent Registered Chartered Accountants, which report expressed an unqualified opinion on the effectiveness of our internal control over financial reporting.
Gordon M. Nixon
President and Chief Executive Officer
Janice R. Fukakusa
Chief Administrative Officer and Chief Financial Officer
Toronto, December 4, 2013
Consolidated Financial Statements Royal Bank of Canada: Annual Report 2013 101
Table of Contents
Report of Independent Registered Chartered Accountants
|
To the Shareholders of Royal Bank of Canada
We have audited the internal control over financial reporting of Royal Bank of Canada and subsidiaries (the “Bank”) as of October 31, 2013, based on the criteria established in Internal Control – Integrated Framework (1992) issued by the Committee of Sponsoring Organizations of the Treadway Commission. The Bank’s management is responsible for maintaining effective internal control over financial reporting and for its assessment of the effectiveness of internal control over financial reporting, included in the accompanying Management’s Report on Internal Control over Financial Reporting. Our responsibility is to express an opinion on the Bank’s internal control over financial reporting based on our audit.
We conducted our audit in accordance with the standards of the Public Company Accounting Oversight Board (United States). Those standards require that we plan and perform the audit to obtain reasonable assurance about whether effective internal control over financial reporting was maintained in all material respects. Our audit included obtaining an understanding of internal control over financial reporting, assessing the risk that a material weakness exists, testing and evaluating the design and operating effectiveness of internal control based on the assessed risk, and performing such other procedures as we considered necessary in the circumstances. We believe that our audit provides a reasonable basis for our opinion.
A company’s internal control over financial reporting is a process designed by, or under the supervision of, the company’s principal executive and principal financial officers, or persons performing similar functions, and effected by the company’s board of directors, management, and other personnel to provide reasonable assurance regarding the reliability of financial reporting and the preparation of financial statements for external purposes in accordance with generally accepted accounting principles. A company’s internal control over financial reporting includes those policies and procedures that (1) pertain to the maintenance of records that, in reasonable detail, accurately and fairly reflect the transactions and dispositions of the assets of the company; (2) provide reasonable assurance that transactions are recorded as necessary to permit preparation of financial statements in accordance with generally accepted accounting principles, and that receipts and expenditures of the company are being made only in accordance with authorizations of management and directors of the company; and (3) provide reasonable assurance regarding prevention or timely detection of unauthorized acquisition, use, or disposition of the company’s assets that could have a material effect on the financial statements.
Because of the inherent limitations of internal control over financial reporting, including the possibility of collusion or improper management override of controls, material misstatements due to error or fraud may not be prevented or detected on a timely basis. Also, projections of any evaluation of the effectiveness of the internal control over financial reporting to future periods are subject to the risk that the controls may become inadequate because of changes in conditions, or that the degree of compliance with the policies or procedures may deteriorate.
In our opinion, the Bank maintained, in all material respects, effective internal control over financial reporting as of October 31, 2013, based on the criteria established inInternal Control – Integrated Framework (1992) issued by the Committee of Sponsoring Organizations of the Treadway Commission.
We have also audited, in accordance with Canadian generally accepted auditing standards and the standards of the Public Company Accounting Oversight Board (United States), the consolidated financial statements as of and for the year ended October 31, 2013 of the Bank and our report dated December 4, 2013 expressed an unqualified opinion on those consolidated financial statements.
Deloitte LLP
Independent Registered Chartered Accountants
Licensed Public Accountants
Toronto, Canada
December 4, 2013
102 Royal Bank of Canada: Annual Report 2013 Consolidated Financial Statements
Table of Contents
|
| As at | ||||||||
| (Millions of Canadian dollars) | October 31 2013 | October 31 2012 | ||||||
Assets | ||||||||
Cash and due from banks | $ | 15,870 | $ | 12,617 | ||||
Interest-bearing deposits with banks | 9,061 | 10,255 | ||||||
| Securities(Note 4) | ||||||||
Trading | 144,023 | 120,783 | ||||||
Available-for-sale | 38,695 | 40,828 | ||||||
| 182,718 | 161,611 | |||||||
Assets purchased under reverse repurchase agreements and securities borrowed | 117,517 | 112,257 | ||||||
Loans(Note 5) | ||||||||
Retail | 321,678 | 301,185 | ||||||
Wholesale | 88,947 | 79,056 | ||||||
| 410,625 | 380,241 | |||||||
Allowance for loan losses (Note 5) | (1,959 | ) | (1,997 | ) | ||||
| 408,666 | 378,244 | |||||||
Investments for account of segregated fund holders(Note 16) | 513 | 383 | ||||||
| Other | ||||||||
Customers’ liability under acceptances | 9,953 | 9,385 | ||||||
Derivatives (Note 8) | 74,822 | 91,293 | ||||||
Premises and equipment, net (Note 9) | 2,659 | 2,691 | ||||||
Goodwill (Note 10) | 8,361 | 7,485 | ||||||
Other intangibles (Note 10) | 2,796 | 2,686 | ||||||
Investments in associates (Note 12) | 112 | 125 | ||||||
Prepaid pension benefit cost (Note 17) | 1,084 | 1,049 | ||||||
Other assets (Note 13) | 26,687 | 35,019 | ||||||
| 126,474 | 149,733 | |||||||
Total assets | $ | 860,819 | $ | 825,100 | ||||
| Liabilities and equity | ||||||||
Deposits(Note 14) | ||||||||
Personal | $ | 194,297 | $ | 179,502 | ||||
Business and government | 350,640 | 312,882 | ||||||
Bank | 13,543 | 15,835 | ||||||
| 558,480 | 508,219 | |||||||
Insurance and investment contracts for account of segregated fund holders(Note 16) | 513 | 383 | ||||||
Other | ||||||||
Acceptances | 9,953 | 9,385 | ||||||
Obligations related to securities sold short | 47,128 | 40,756 | ||||||
Obligations related to assets sold under repurchase agreements and securities loaned | 60,416 | 64,032 | ||||||
Derivatives (Note 8) | 76,745 | 96,761 | ||||||
Insurance claims and policy benefit liabilities (Note 15) | 8,034 | 7,921 | ||||||
Accrued pension and other post-employment benefit expense (Note 17) | 1,759 | 1,729 | ||||||
Other liabilities (Note 18) | 39,113 | 41,371 | ||||||
| 243,148 | 261,955 | |||||||
Subordinated debentures(Note 19) | 7,443 | 7,615 | ||||||
Trust capital securities(Note 20) | 900 | 900 | ||||||
Total liabilities | 810,484 | 779,072 | ||||||
Equity attributable to shareholders(Note 21) | ||||||||
Preferred shares | 4,600 | 4,813 | ||||||
Common shares (shares issued — 1,441,055,616 and 1,445,302,600) | 14,377 | 14,323 | ||||||
Treasury shares – preferred (shares held – (46,641) and (41,632)) | 1 | 1 | ||||||
– common (shares held – (666,366) and (543,276)) | 41 | 30 | ||||||
Retained earnings | 28,314 | 24,270 | ||||||
Other components of equity | 1,207 | 830 | ||||||
| 48,540 | 44,267 | |||||||
Non-controlling interests(Note 21) | 1,795 | 1,761 | ||||||
Total equity | 50,335 | 46,028 | ||||||
Total liabilities and equity | $ | 860,819 | $ | 825,100 | ||||
The accompanying notes are an integral part of these Consolidated Financial Statements.
Gordon M. Nixon | Victor L. Young | |||
President and Chief Executive Officer | Director |
Consolidated Financial Statements Royal Bank of Canada: Annual Report 2013 103
Table of Contents
Consolidated Statements of Income
|
| For the year ended | ||||||||||||
| (Millions of Canadian dollars, except per share amounts) | October 31 2013 | October 31 2012 | October 31 2011 | |||||||||
Interest income | ||||||||||||
Loans | $ | 16,357 | $ | 15,972 | $ | 15,236 | ||||||
Securities | 3,779 | 3,874 | 4,750 | |||||||||
Assets purchased under reverse repurchase agreements and securities borrowed | 941 | 945 | 736 | |||||||||
Deposits | 73 | 61 | 91 | |||||||||
| 21,150 | 20,852 | 20,813 | ||||||||||
Interest expense | ||||||||||||
Deposits | 5,642 | 6,017 | 6,334 | |||||||||
Other liabilities | 1,921 | 1,977 | 2,723 | |||||||||
Subordinated debentures | 336 | 360 | 399 | |||||||||
| 7,899 | 8,354 | 9,456 | ||||||||||
Net interest income | 13,251 | 12,498 | 11,357 | |||||||||
Non-interest income | ||||||||||||
Insurance premiums, investment and fee income (Note 15) | 3,911 | 4,897 | 4,474 | |||||||||
Trading revenue | 867 | 1,298 | 655 | |||||||||
Investment management and custodial fees | 2,514 | 2,074 | 1,999 | |||||||||
Mutual fund revenue | 2,557 | 2,088 | 1,975 | |||||||||
Securities brokerage commissions | 1,337 | 1,213 | 1,331 | |||||||||
Service charges | 1,437 | 1,376 | 1,323 | |||||||||
Underwriting and other advisory fees | 1,569 | 1,434 | 1,485 | |||||||||
Foreign exchange revenue, other than trading | 748 | 655 | 684 | |||||||||
Card service revenue | 967 | 920 | 882 | |||||||||
Credit fees | 1,092 | 848 | 707 | |||||||||
Net gain on available-for-sale securities (Note 4) | 188 | 120 | 104 | |||||||||
Share of (loss) profit in associates | 6 | 24 | (7 | ) | ||||||||
Other | 423 | 327 | 669 | |||||||||
Non-interest income | 17,616 | 17,274 | 16,281 | |||||||||
Total revenue | 30,867 | 29,772 | 27,638 | |||||||||
Provision for credit losses(Note 5) | 1,239 | 1,301 | 1,133 | |||||||||
Insurance policyholder benefits, claims and acquisition expense(Note 15) | 2,784 | 3,621 | 3,358 | |||||||||
Non-interest expense | ||||||||||||
Human resources (Note 17 and 22) | 10,190 | 9,287 | 8,661 | |||||||||
Equipment | 1,135 | 1,020 | 960 | |||||||||
Occupancy | 1,246 | 1,170 | 1,076 | |||||||||
Communications | 742 | 764 | 746 | |||||||||
Professional fees | 753 | 695 | 692 | |||||||||
Outsourced item processing | 250 | 254 | 266 | |||||||||
Amortization of other intangibles (Note 10) | 566 | 528 | 481 | |||||||||
Impairment of goodwill and other intangibles (Note 10 and 11) | 10 | 168 | – | |||||||||
Other | 1,335 | 1,274 | 1,285 | |||||||||
| 16,227 | 15,160 | 14,167 | ||||||||||
Income before income taxes from continuing operations | 10,617 | 9,690 | 8,980 | |||||||||
Income taxes (Note 24) | 2,188 | 2,100 | 2,010 | |||||||||
Net income from continuing operations | 8,429 | 7,590 | 6,970 | |||||||||
Net loss from discontinued operations (Note 11) | – | (51 | ) | (526 | ) | |||||||
Net income | $ | 8,429 | $ | 7,539 | $ | 6,444 | ||||||
Net income attributable to: | ||||||||||||
Shareholders | $ | 8,331 | $ | 7,442 | $ | 6,343 | ||||||
Non-controlling interests | 98 | 97 | 101 | |||||||||
| $ | 8,429 | $ | 7,539 | $ | 6,444 | |||||||
Basic earnings per share(in dollars) (Note 25) | $ | 5.60 | $ | 4.98 | $ | 4.25 | ||||||
Basic earnings per share from continuing operations(in dollars) | 5.60 | 5.01 | 4.62 | |||||||||
Basic loss per share from discontinued operations(in dollars) | – | (0.03 | ) | (0.37 | ) | |||||||
Diluted earnings per share(in dollars) (Note 25) | 5.54 | 4.93 | 4.19 | |||||||||
Diluted earnings per share from continuing operations(in dollars) | 5.54 | 4.96 | 4.55 | |||||||||
Diluted loss per share from discontinued operations(in dollars) | – | (0.03 | ) | (0.36 | ) | |||||||
Dividends per common share(in dollars) | 2.53 | 2.28 | 2.08 | |||||||||
The accompanying notes are an integral part of these Consolidated Financial Statements.
104 Royal Bank of Canada: Annual Report 2013 Consolidated Financial Statements
Table of Contents
Consolidated Statements of Comprehensive Income
|
| For the year ended | ||||||||||||
| (Millions of Canadian dollars) | October 31 2013 | October 31 2012 | October 31 2011 | |||||||||
Net income | $ | 8,429 | $ | 7,539 | $ | 6,444 | ||||||
Other comprehensive income (loss), net of taxes(Note 24) | ||||||||||||
Items that will be reclassified subsequently to income: | ||||||||||||
Net change in unrealized (losses) gains on available-for-sale securities | ||||||||||||
Net unrealized gains (losses) on available-for-sale securities | 15 | 193 | (30 | ) | ||||||||
Reclassification of net (gains) losses on available-for-sale securities to income | (87 | ) | (33 | ) | 13 | |||||||
| (72 | ) | 160 | (17 | ) | ||||||||
Foreign currency translation adjustments | ||||||||||||
Unrealized foreign currency translation gains (losses) | 1,402 | 113 | (625 | ) | ||||||||
Net foreign currency translation (losses) gains from hedging activities | (912 | ) | – | 717 | ||||||||
Reclassification of losses (gains) on net investment hedging activities to income | – | 11 | (1 | ) | ||||||||
| 490 | 124 | 91 | ||||||||||
Net change in cash flow hedges | ||||||||||||
Net (losses) gains on derivatives designated as cash flow hedges | (11 | ) | 32 | 298 | ||||||||
Reclassification of (gains) losses on derivatives designated as cash flow hedges to income | (30 | ) | 25 | 132 | ||||||||
| (41 | ) | 57 | 430 | |||||||||
Total other comprehensive income, net of taxes | 377 | 341 | 504 | |||||||||
Total comprehensive income | $ | 8,806 | $ | 7,880 | $ | 6,948 | ||||||
Total comprehensive income attributable to: | ||||||||||||
Shareholders | $ | 8,708 | $ | 7,782 | $ | 6,847 | ||||||
Non-controlling interests | 98 | 98 | 101 | |||||||||
| $ | 8,806 | $ | 7,880 | $ | 6,948 | |||||||
The accompanying notes are an integral part of these Consolidated Financial Statements.
Consolidated Financial Statements Royal Bank of Canada: Annual Report 2013 105
Table of Contents
Consolidated Statements of Changes in Equity
|
| Other components of equity | ||||||||||||||||||||||||||||||||||||||||||||||||
| (Millions of Canadian dollars) | Preferred shares | Common shares | Treasury shares – preferred | Treasury shares – common | Retained earnings | Available-for-sale securities | Foreign currency translation | Cash flow hedges | Total other components of equity | Equity attributable to shareholders | Non-controlling interests | Total equity | ||||||||||||||||||||||||||||||||||||
Balance at November 1, 2010 | $ | 4,813 | $ | 13,378 | $ | (2 | ) | $ | (81 | ) | $ | 17,287 | $ | 277 | $ | (20 | ) | $ | (271 | ) | $ | (14 | ) | $ | 35,381 | $ | 2,094 | $ | 37,475 | |||||||||||||||||||
Changes in equity | ||||||||||||||||||||||||||||||||||||||||||||||||
Issues of share capital | – | 632 | – | – | – | – | – | – | – | 632 | – | 632 | ||||||||||||||||||||||||||||||||||||
Sales of treasury shares | – | – | 97 | 6,074 | – | – | – | – | – | 6,171 | – | 6,171 | ||||||||||||||||||||||||||||||||||||
Purchases of treasury shares | – | – | (95 | ) | (5,985 | ) | – | – | – | – | – | (6,080 | ) | (324 | ) | (6,404 | ) | |||||||||||||||||||||||||||||||
Share-based compensation awards | – | – | – | – | (33 | ) | – | – | – | – | (33 | ) | – | (33 | ) | |||||||||||||||||||||||||||||||||
Dividends on common shares | – | – | – | – | (2,979 | ) | – | – | – | – | (2,979 | ) | – | (2,979 | ) | |||||||||||||||||||||||||||||||||
Dividends on preferred shares and other | – | – | – | – | (258 | ) | – | – | – | – | (258 | ) | (93 | ) | (351 | ) | ||||||||||||||||||||||||||||||||
Other | – | – | – | – | 21 | – | – | – | – | 21 | (14 | ) | 7 | |||||||||||||||||||||||||||||||||||
Net income | – | – | – | – | 6,343 | – | – | – | – | 6,343 | 101 | 6,444 | ||||||||||||||||||||||||||||||||||||
Total other comprehensive income | – | – | – | – | – | (18 | ) | 91 | 431 | 504 | 504 | (3 | ) | 501 | ||||||||||||||||||||||||||||||||||
Balance at October 31, 2011 | $ | 4,813 | $ | 14,010 | $ | – | $ | 8 | $ | 20,381 | $ | 259 | $ | 71 | $ | 160 | $ | 490 | $ | 39,702 | $ | 1,761 | $ | 41,463 | ||||||||||||||||||||||||
Changes in equity | ||||||||||||||||||||||||||||||||||||||||||||||||
Issues of share capital | – | 313 | – | – | – | – | – | – | – | 313 | – | 313 | ||||||||||||||||||||||||||||||||||||
Sales of treasury shares | – | – | 98 | 5,186 | – | – | – | – | – | 5,284 | – | 5,284 | ||||||||||||||||||||||||||||||||||||
Purchases of treasury shares | – | – | (97 | ) | (5,164 | ) | – | – | – | – | – | (5,261 | ) | – | (5,261 | ) | ||||||||||||||||||||||||||||||||
Share-based compensation awards | – | – | – | – | (9 | ) | – | – | – | – | (9 | ) | – | (9 | ) | |||||||||||||||||||||||||||||||||
Dividends on common shares | – | – | – | – | (3,291 | ) | – | – | – | – | (3,291 | ) | – | (3,291 | ) | |||||||||||||||||||||||||||||||||
Dividends on preferred shares and other | – | – | – | – | (258 | ) | – | – | – | – | (258 | ) | 92 | (350 | ) | |||||||||||||||||||||||||||||||||
Other | – | – | – | – | 5 | – | – | – | – | 5 | (6 | ) | (1 | ) | ||||||||||||||||||||||||||||||||||
Net income | – | – | – | – | 7,442 | – | – | – | – | 7,442 | 97 | 7,539 | ||||||||||||||||||||||||||||||||||||
Total other comprehensive income | – | – | – | – | – | 160 | 124 | 56 | 340 | 340 | 1 | 341 | ||||||||||||||||||||||||||||||||||||
Balance at October 31, 2012 | $ | 4,813 | $ | 14,323 | $ | 1 | $ | 30 | $ | 24,270 | $ | 419 | $ | 195 | $ | 216 | $ | 830 | $ | 44,267 | $ | 1,761 | $ | 46,028 | ||||||||||||||||||||||||
Changes in equity | ||||||||||||||||||||||||||||||||||||||||||||||||
Issues of share capital | – | 121 | – | – | – | – | – | – | – | 121 | – | 121 | ||||||||||||||||||||||||||||||||||||
Common shares purchased for cancellation | – | (67 | ) | – | – | (341 | ) | – | – | – | – | (408 | ) | – | (408 | ) | ||||||||||||||||||||||||||||||||
Preferred shares redeemed | (213 | ) | – | – | – | (9 | ) | – | – | – | – | (222 | ) | – | (222 | ) | ||||||||||||||||||||||||||||||||
Sales of treasury shares | – | – | 127 | 4,453 | – | – | – | – | – | 4,580 | – | 4,580 | ||||||||||||||||||||||||||||||||||||
Purchases of treasury shares | – | – | (127 | ) | (4,442 | ) | – | – | – | – | – | (4,569 | ) | – | (4,569 | ) | ||||||||||||||||||||||||||||||||
Share-based compensation awards | – | – | – | – | (7 | ) | – | – | – | – | (7 | ) | – | (7 | ) | |||||||||||||||||||||||||||||||||
Dividends on common shares | – | – | – | – | (3,651 | ) | – | – | – | – | (3,651 | ) | – | (3,651 | ) | |||||||||||||||||||||||||||||||||
Dividends on preferred shares and other | – | – | – | – | (253 | ) | – | – | – | – | (253 | ) | (94 | ) | (347 | ) | ||||||||||||||||||||||||||||||||
Other | – | – | – | – | (26 | ) | – | – | – | – | (26 | ) | 30 | 4 | ||||||||||||||||||||||||||||||||||
Net income | – | – | – | – | 8,331 | – | – | – | – | 8,331 | 98 | 8,429 | ||||||||||||||||||||||||||||||||||||
Total other comprehensive income | – | – | – | – | – | (72 | ) | 490 | (41 | ) | 377 | 377 | – | 377 | ||||||||||||||||||||||||||||||||||
Balance at October 31, 2013 | $ | 4,600 | $ | 14,377 | $ | 1 | $ | 41 | $ | 28,314 | $ | 347 | $ | 685 | $ | 175 | $ | 1,207 | $ | 48,540 | $ | 1,795 | $ | 50,335 | ||||||||||||||||||||||||
The accompanying notes are an integral part of these Consolidated Financial Statements.
106 Royal Bank of Canada: Annual Report 2013 Consolidated Financial Statements
Table of Contents
Consolidated Statements of Cash Flows
|
| For the year ended | ||||||||||||
| (Millions of Canadian dollars) | October 31 2013 | October 31 2012 | October 31 2011 | |||||||||
Cash flows from operating activities | ||||||||||||
Net income | $ | 8,429 | $ | 7,539 | $ | 6,444 | ||||||
Adjustments for non-cash items and others | ||||||||||||
Provision for credit losses | 1,239 | 1,418 | 1,459 | |||||||||
Depreciation | 464 | 437 | 412 | |||||||||
Deferred income taxes | (155 | ) | 123 | (124 | ) | |||||||
Impairment and amortization of goodwill and other intangibles | 576 | 716 | 546 | |||||||||
(Gain) loss on sale of premises and equipment | (24 | ) | 25 | 106 | ||||||||
Gain on available-for-sale securities | (217 | ) | (194 | ) | (278 | ) | ||||||
Gain on disposition of business | (17 | ) | – | – | ||||||||
Impairment of available-for-sale securities | 26 | 55 | 247 | |||||||||
Share of (loss) profit in associates | (6 | ) | (23 | ) | 8 | |||||||
Adjustments for net changes in operating assets and liabilities | ||||||||||||
Insurance claims and policy benefit liabilities | 113 | 802 | (139 | ) | ||||||||
Net change in accrued interest receivable and payable | (468 | ) | (161 | ) | (115 | ) | ||||||
Current income taxes | 361 | (826 | ) | 807 | ||||||||
Derivative assets | 16,475 | 8,462 | 6,373 | |||||||||
Derivative liabilities | (20,017 | ) | (3,884 | ) | (7,551 | ) | ||||||
Trading securities | (23,038 | ) | 6,818 | (905 | ) | |||||||
Change in loans, net of securitizations | (19,987 | ) | (29,208 | ) | (27,285 | ) | ||||||
Change in assets purchased under reverse repurchase agreements and securities borrowed | (5,260 | ) | (25,060 | ) | (12,249 | ) | ||||||
Change in deposits | 41,283 | 15,850 | 29,059 | |||||||||
Change in obligations related to assets sold under repurchase agreements and securities loaned | (3,616 | ) | 20,914 | 7,166 | ||||||||
Change in obligations related to securities sold short | 6,372 | (3,528 | ) | (2,313 | ) | |||||||
Net change in brokers and dealers receivable and payable | 536 | 537 | 22 | |||||||||
Other | 4,173 | (2,886 | ) | 2,789 | ||||||||
Net cash from (used in) operating activities | 7,242 | (2,074 | ) | 4,479 | ||||||||
Cash flows from investing activities | ||||||||||||
Change in interest-bearing deposits with banks | 1,194 | 457 | 781 | |||||||||
Proceeds from sale of available-for-sale securities | 6,476 | 10,915 | 14,549 | |||||||||
Proceeds from maturity of available-for-sale securities | 37,100 | 47,420 | 37,882 | |||||||||
Purchases of available-for-sale securities | (41,057 | ) | (55,448 | ) | (45,942 | ) | ||||||
Proceeds from maturity of held-to-maturity securities | 401 | 190 | 1,179 | |||||||||
Purchases of held-to-maturity securities | (284 | ) | (242 | ) | (935 | ) | ||||||
Net acquisitions of premises and equipment and other intangibles | (946 | ) | (1,351 | ) | (1,452 | ) | ||||||
Proceeds from dispositions | 17 | 2,677 | 440 | |||||||||
Cash used in acquisitions | (2,537 | ) | (853 | ) | (1,300 | ) | ||||||
Net cash from investing activities | 364 | 3,765 | 5,202 | |||||||||
Cash flows from financing activities | ||||||||||||
Redemption of RBC Trust Capital Securities | – | – | (750 | ) | ||||||||
Issue of subordinated debentures | 2,046 | – | 1,500 | |||||||||
Repayment of subordinated debentures | (2,000 | ) | (1,006 | ) | (404 | ) | ||||||
Issue of common shares | 121 | 126 | 152 | |||||||||
Common shares purchased for cancellation | (408 | ) | – | – | ||||||||
Preferred shares redeemed | (222 | ) | – | – | ||||||||
Sales of treasury shares | 4,580 | 5,284 | 6,171 | |||||||||
Purchase of treasury shares | (4,569 | ) | (5,261 | ) | (6,080 | ) | ||||||
Dividends paid | (3,810 | ) | (3,272 | ) | (3,032 | ) | ||||||
Dividends/distributions paid to non-controlling interests | (94 | ) | (92 | ) | (93 | ) | ||||||
Change in short-term borrowings of subsidiaries | (93 | ) | 21 | (615 | ) | |||||||
Net cash used in financing activities | (4,449 | ) | (4,200 | ) | (3,151 | ) | ||||||
Effect of exchange rate changes on cash and due from banks | 96 | (18 | ) | 76 | ||||||||
Net change in cash resources | 3,253 | (2,527 | ) | 6,606 | ||||||||
Cash resources at beginning of period (1) | 12,617 | 15,144 | 8,538 | |||||||||
Cash resources at end of period(1) | $ | 15,870 | $ | 12,617 | $ | 15,144 | ||||||
Cash and due from banks | $ | 15,870 | $ | 12,617 | $ | 12,428 | ||||||
Cash and due from banks included in assets of discontinued operations | – | | – | | 2,716 | |||||||
Cash resources at end of period(1) | $ | 15,870 | $ | 12,617 | $ | 15,144 | ||||||
Cash flows from operating activities include: | ||||||||||||
Amount of interest paid | $ | 7,223 | $ | 7,872 | $ | 9,234 | ||||||
Amount of interest received | 19,349 | 19,674 | 20,471 | |||||||||
Amount of dividend received | 1,479 | 1,316 | 1,350 | |||||||||
Amount of income taxes paid | 1,524 | 2,926 | 1,512 | |||||||||
| (1) | We are required to maintain balances with central banks and other regulatory authorities. The total balances were $2.6 billion as at October 31, 2013 (October 31, 2012 – $2.1 billion; October 31, 2011 – $2.0 billion; November 1, 2010 – $1.8 billion). |
The accompanying notes are an integral part of these Consolidated Financial Statements.
Consolidated Financial Statements Royal Bank of Canada: Annual Report 2013 107
Table of Contents
|
Royal Bank of Canada and its subsidiaries provide diversified financial services including personal and commercial banking, wealth management, insurance, investor services and capital markets products and services on a global basis. Refer to Note 29 for further details on our business segments.
The parent bank, Royal Bank of Canada, is a Schedule I Bank under theBank Act (Canada) incorporated and domiciled in Canada. Our corporate headquarters are located at Royal Bank Plaza, 200 Bay Street, Toronto, Ontario, Canada and our head office is located at 1 Place Ville-Marie, Montreal, Quebec, Canada. Our common shares are listed on the Toronto Stock Exchange and New York Stock Exchange with the ticker symbol RY.
Our Consolidated Financial Statements are prepared in compliance with International Financial Reporting Standards (IFRS) as issued by the International Accounting Standards Board (IASB). The Consolidated Financial Statements are stated in Canadian dollars and have been prepared in accordance with all IFRS issued and in effect as at October 31, 2013. Tabular information is stated in millions of dollars, except per share amounts and percentages. These Consolidated Financial Statements also comply with Subsection 308 of theBank Act (Canada), which states that, except as otherwise specified by the Office of the Superintendent of Financial Institutions (OSFI), our Consolidated Financial Statements are to be prepared in accordance with IFRS. The accounting policies outlined in Note 2 have been consistently applied to all periods presented.
On December 4, 2013, the Board of Directors authorized the Consolidated Financial Statements for issue.
Note 2 Summary of significant accounting policies, estimates and judgments
|
The significant accounting policies used in the preparation of these Consolidated Financial Statements, including the accounting requirements prescribed by OSFI, are summarized below. These accounting policies conform, in all material respects, to IFRS.
General
Use of estimates and assumptions
In preparing our Consolidated Financial Statements, management is required to make subjective estimates and assumptions that affect the reported amount of assets, liabilities, net income and related disclosures. Estimates made by management are based on historical experience and other assumptions that are believed to be reasonable. Key sources of estimation uncertainty include: consolidation of special purpose entities (SPEs), securities impairment, determination of fair value of financial instruments, the allowance for credit losses, derecognition of financial assets, insurance claims and policy benefit liabilities, pensions and other post-employment benefits, income taxes, carrying value of goodwill and other intangible assets, litigation provisions, and deferred revenue under the credit card customer loyalty reward program. Accordingly, actual results may differ from these and other estimates thereby impacting our future Consolidated Financial Statements. Refer to the relevant accounting policies in this Note for details on our use of estimates and assumptions.
Significant judgments
In preparation of these Consolidated Financial Statements, management is required to make significant judgments that affect the carrying amounts of certain assets and liabilities, and the reported amounts of revenues and expenses recorded during the period. Significant judgments have been made in the following areas and discussed as noted in the Consolidated Financial Statements:
| Special purpose entities | Note 2 – page 109 Note 7 – page 136 | |
| Fair value of financial instruments | Note 2 – page 110 Note 3 – page 121 | |
| Allowance for credit losses | Note 2 – page 114 Note 5 – page 132 | |
| Employee benefits | Note 2 – page 116 Note 17 – page 154 | |
| Goodwill and other intangibles | Note 2 – page 117 Note 10 – page 146 Note 11 – page 148 | |
| Securities impairment | Note 2 – page 109 Note 4 – page 129 | |
| Application of the effective interest method | Note 2 – page 112 | |
| Derecognition of financial assets | Note 2 – page 115 Note 6 – page 135 | |
| Income taxes | Note 2 – page 116 Note 24 – page 165 | |
| Provisions | Note 2 – page 118 Note 26 – page 167 | |
Basis of consolidation
Our Consolidated Financial Statements include the assets and liabilities and results of operations of the parent company, Royal Bank of Canada, and its subsidiaries including certain SPEs, after elimination of intercompany transactions, balances, revenues and expenses.
Continuing operations
As described in Note 11, during the second quarter in 2011, we completed the sale of Liberty Life Insurance Company (Liberty Life), our U.S. life insurance business. During the third quarter in 2011, we announced the sale of substantially all of our U.S. regional retail banking operations and completed this sale in the second quarter of 2012.
The sale of Liberty Life and our U.S. regional retail banking operations are reflected as discontinued operations on our Consolidated Financial Statements for all periods presented.
Non-current assets held for sale and discontinued operations
Non-current assets (and disposal groups) are classified as held for sale if their carrying amounts will be recovered principally through a sale transaction rather than through continuing use. This condition is satisfied when the asset is available for immediate sale in its present condition, management is committed to the sale, and it is highly probable to occur within one year. Non-current assets (and disposal groups) classified as held for sale are measured at the lower of their previous carrying amount and fair value less costs to sell and are presented separately from other assets on our Consolidated Balance Sheets.
A disposal group is classified as a discontinued operation if it meets the following conditions: (i) it is a component that can be distinguished operationally and financially from the rest of our operations, and (ii) it represents either a separate major line of business or is part of a single co-ordinated plan to dispose of a separate major line of business or geographical area of operations. Disposal groups classified as discontinued operations are presented separately from our continuing operations in our Consolidated Statements of Income.
108 Royal Bank of Canada: Annual Report 2013 Consolidated Financial Statements
Table of Contents
Subsidiaries and SPEs
Subsidiaries are those entities over which we have control, where control is defined as the power to govern the financial and operating policies so as to obtain benefits from the entity’s activities. We consolidate our subsidiaries from the date control is transferred to us, and cease consolidation when they are no longer controlled by us.
SPEs are entities created to accomplish a narrow and well-defined objective with limited decision-making powers and pre-established or limited activities. These include SPEs that are sponsored for various reasons, including those which were formed to allow clients to invest in alternative assets, for asset securitization transactions, and for buying and selling credit protection.
We consolidate SPEs when an assessment of the relevant factors indicates that we control the SPE. In some circumstances, different factors and conditions may indicate that various parties may control an SPE depending on whether the factors and conditions are assessed in isolation or in totality. Significant judgment is applied by management in assessing these factors and any related conditions in totality when determining whether we control a SPE. Relevant factors include: (i) whether the activities of the SPE are conducted according to our specific business needs so that we obtain the benefits from the SPE’s operations, (ii) whether we have the decision-making powers to obtain the majority of the benefits, (iii) whether we will obtain the majority of the benefits of the activities of the SPE, and (iv) whether we retain the majority of the residual ownership risks related to the assets or SPE in order to obtain the benefits from its activities. Our approach generally focuses on identifying the significant activities that impact the financial results of the SPE. We then determine, in light of all relevant facts and circumstances, which party has substantive rights to control the decision making authority over those activities and who is exposed to the majority of risks and rewards resulting from those decisions. Our consolidation conclusions affect the classification and amount of assets, liabilities, revenue and expenses reported in our Consolidated Financial Statements.
Non-controlling interests in subsidiaries and SPEs that we consolidate are shown on our Consolidated Balance Sheets as a separate component of equity which is distinct from our shareholders’ equity. The net income attributable to non-controlling interests is separately disclosed in our Consolidated Statements of Income.
Investments in associates
The equity method is used to account for investments in associated corporations and limited partnerships over which we have significant influence. Under the equity method of accounting, investments are initially recorded at cost, and the carrying amount is increased or decreased to recognize our share of the investee’s net profit or loss (including net profit or loss recognized directly in equity) subsequent to the date of acquisition.
Interests in joint ventures
The proportionate consolidation method is used to account for our interests in jointly controlled entities, whereby our pro rata share of assets, liabilities, income and expenses is consolidated.
Changes in accounting policies
Amendments to International Accounting Standards (IAS) 1 Presentation of Financial Statements
On November 1, 2012, we adoptedIAS 1 Presentation of Financial Statements (amendments to IAS 1), issued by the IASB in June 2011. The amendments require items presented in the statement of other comprehensive income to be categorized according to whether the items will or will not be reclassified to income at a future date. The adoption did not impact our financial results.
Amendments to IAS 12Income Taxes
On November 1, 2012, we adoptedIAS 12 Income taxes: Deferred Taxes, Recovery of Underlying Assets (amendments to IAS 12),issued by the IASB in December 2010. The amendments provided guidance for deferred tax associated with investment property measured using the fair value model and non-depreciable assets measured using the revaluation model. The adoption did not impact our financial results.
Financial instruments – Recognition and measurement
Securities
Securities are classified at inception, based on management’s intention, as at fair value through profit or loss (FVTPL), available-for-sale (AFS) or held-to-maturity. Certain debt securities with fixed or determinable payments and which are not quoted in an active market may be classified as loans and receivables.
Trading securities include securities purchased for sale in the near term which are classified as at FVTPL by nature and securities designated as at FVTPL under the fair value option. Obligations to deliver trading securities sold but not yet purchased are recorded as liabilities and carried at fair value. Realized and unrealized gains and losses on these securities are recorded as Trading revenue in Non-interest income. Dividends and interest income accruing on Trading securities are recorded in Interest income. Interest and dividends accrued on interest-bearing and equity securities sold short are recorded in Interest expense.
AFS securities include: (i) securities which may be sold to meet liquidity needs, in response to or in anticipation of changes in interest rates and resulting prepayment risk, changes in foreign currency risk, changes in funding sources or terms, and (ii) loan substitute securities which are client financings that have been structured as after-tax investments rather than conventional loans in order to provide the clients with a borrowing rate advantage. AFS securities are measured at fair value. Unrealized gains and losses arising from changes in fair value are included in Other components of equity. Changes in foreign exchange rates for AFS equity securities are recognized in Other components of equity, while changes in foreign exchange rates for AFS debt securities are recognized in Foreign exchange revenue, other than trading in Non-interest income. When the security is sold, the cumulative gain or loss recorded in Other components of equity is included as Net gain (loss) on AFS securities in Non-interest income. Purchase premiums or discounts on AFS debt securities are amortized over the life of the security using the effective interest method and are recognized in Net interest income.
At each reporting date, and more frequently when conditions warrant, we evaluate our AFS securities to determine whether there is any objective evidence of impairment. Such evidence includes: for debt instruments, when an adverse effect on future cash flows from the asset or group of assets can be reliably estimated; for equity securities, when there is a significant or prolonged decline in the fair value of the investment below its cost.
When assessing impairment for debt instruments we primarily consider counterparty ratings and security-specific factors, including subordination, external ratings, and the value of any collateral held, for which there may not be a readily accessible market. Significant judgment is required in assessing impairment as management is required to consider all available evidence in determining whether objective evidence of impairment exists and whether the principal and interest on the AFS debt security can be fully recovered. For complex debt instruments we use cash flow projection models which incorporate actual and projected cash flows for each security based on security specific factors using a number of assumptions and inputs that involve management judgment, such as default, prepayment and recovery rates. Due to the subjective nature of choosing these inputs and assumptions, the actual amount of the future cash flows and their timing may differ from the estimates used by management and consequently may cause a different conclusion as to the recognition of impairment or measurement of impairment loss.
Consolidated Financial Statements Royal Bank of Canada: Annual Report 2013 109
Table of Contents
Note 2 Summary of significant accounting policies, estimates and judgments(continued)
|
In assessing whether there is any objective evidence that suggests that equity securities are impaired, we consider factors which include the length of time and extent the fair value has been below cost, along with management’s assessment of the financial condition, business and other risks of the issuer. Management weighs all these factors to determine the impairment but to the extent that management judgment may differ from the actual experience of the timing and amount of the recovery of the fair value, the estimate for impairment could change from period to period based upon future events that may or may not occur, the conclusion for the impairment of the equity securities may differ.
If an AFS security is impaired, the cumulative unrealized loss previously recognized in Other components of equity is removed from equity and recognized in Net gain (loss) on AFS securities under Non-interest income. This amount is determined as the difference between the cost/amortized cost and current fair value of the security less any impairment loss previously recognized. Subsequent to impairment, further declines in fair value are recorded in Non-interest income, while increases in fair value are recognized in Other components of equity until sold. For AFS debt securities, reversal of previously recognized impairment losses is recognized in our Consolidated Statements of Income if the recovery is objectively related to a specific event occurring after recognition of the impairment loss.
Held-to-maturity securities are debt securities where we have the intention and the ability to hold the investment until its maturity date. These securities are initially recorded at fair value and are subsequently measured at amortized cost using the effective interest method, less any impairment losses which we assess using the same impairment model as for loans. Interest income and amortization of premiums and discounts on debt securities are recorded in Net interest income. We hold a nominal amount of held-to-maturity securities. All held-to-maturity securities have been included with AFS securities on our Consolidated Balance Sheets.
We account for all of our securities using settlement date accounting and changes in fair value between the trade date and settlement date are reflected in income for securities classified or designated as at FVTPL, and changes in the fair value of AFS securities between the trade and settlement dates are recorded in Other comprehensive income (OCI) except for changes in foreign exchange rates on debt securities, which are recorded in Non-interest income.
Fair value option
A financial instrument can be designated as at FVTPL (the fair value option) on its initial recognition even if the financial instrument was not acquired or incurred principally for the purpose of selling or repurchasing it in the near term. An instrument that is designated as at FVTPL by way of this fair value option must have a reliably measurable fair value and satisfy one of the following criteria: (i) it eliminates or significantly reduces a measurement or recognition inconsistency that would otherwise arise from measuring assets or liabilities, or recognizing gains and losses on them on a different basis; (ii) it belongs to a group of financial assets or financial liabilities or both that are managed, evaluated, and reported to key management personnel on a fair value basis in accordance with our risk management strategy, and we can demonstrate that significant financial risks are eliminated or significantly reduced or (iii) there is an embedded derivative in the financial or non-financial host contract and the derivative is not closely related to the host contract.
Financial instruments designated as at FVTPL are recorded at fair value and any unrealized gain or loss arising due to changes in fair value is included in Trading revenue or Other. These instruments cannot be reclassified out of the FVTPL category while they are held or issued.
To determine the fair value adjustments on our debt designated as at FVTPL, we calculate the present value of the instruments based on the contractual cash flows over the term of the arrangement by using our effective funding rate at the beginning and end of the period with the change in present value recorded in Trading revenue or Other in Non-interest income.
Determination of fair value
The fair value of a financial instrument is the amount at which the financial instrument could be exchanged in an arm’s-length transaction between knowledgeable and willing parties under no compulsion to act. We determine fair value by incorporating all factors that market participants would consider in setting a price and using accepted economic methodologies for pricing financial instruments. We have established policies on approved methodologies and procedures for determining fair value. Valuation techniques are approved for use within our model risk management framework. The framework addresses, among other things, model development standards, validation processes and procedures, and approval authorities. Valuation techniques also include using a documented third-party pricing source list. The third party pricing source list gives priority to those services and prices having the highest and most consistent accuracy. The level of accuracy is developed over time by comparing third-party price values to traders’ or system values, to other pricing service values and, when available, to actual trade data.
In determining fair value, a hierarchy is used which prioritizes the inputs to valuation techniques. The fair value hierarchy gives the highest priority to unadjusted quoted prices in active markets for identical assets or liabilities (Level 1) and the lowest priority to unobservable inputs (Level 3). The availability of inputs relevant to the asset or liability and the relative reliability of the inputs could affect the selection of appropriate valuation techniques.
Level 1 inputs are unadjusted quoted prices in active markets for identical assets or liabilities that we have the ability to access at the measurement date. Level 2 inputs are inputs other than quoted prices in Level 1 that are observable for the asset or liability, either directly or indirectly. Level 2 inputs include quoted prices for similar assets or liabilities in active markets or quoted prices for identical or similar assets or liabilities in markets that are not active, and inputs that are derived principally from observable market data. Level 3 inputs are unobservable inputs for the asset or liability. Unobservable inputs are used to measure fair value to the extent that observable inputs are not available at the measurement date.
Where observable prices or inputs are not available, management judgment is required to determine fair values by assessing other relevant sources of information such as historical data, proxy information from similar transactions, and through extrapolation and interpolation techniques. For instruments not traded in an active market, fair value is determined using a valuation technique that maximizes the use of observable market inputs to the extent available. For more complex or illiquid instruments, significant judgment is required in the determination of the model used, the selection of model inputs, and in some cases the application of valuation adjustments to the model value or quoted price for inactively traded financial instruments, as the selection of model inputs may be subjective and the inputs may be unobservable. Unobservable inputs are inherently uncertain as there is little or no market data available from which to determine the level at which an arm’s length transaction would occur under normal business circumstances. Appropriate parameter uncertainty and market risk valuation adjustments for such inputs and other model risk valuation adjustments are assessed in all such instances.
We record valuation adjustments to appropriately reflect counterparty credit quality and our own creditworthiness, differences between the overnight index swap (OIS) curve and London Interbank Offered Rates (LIBOR) for collateralized derivatives, unrealized gains or losses at inception of the transaction, bid-offer spreads and unobservable parameters. These adjustments may be subjective as they require significant judgment in the input selection, such as probability of default and recovery rate, and are intended to arrive at fair value that is determined based on assumptions that market participants would use in pricing the financial instrument. The realized price for a transaction may be different from its recorded value that is previously estimated using management judgment, and may therefore impact unrealized gains and losses recognized in Non-interest income – Trading revenue or Other.
110 Royal Bank of Canada: Annual Report 2013 Consolidated Financial Statements
Table of Contents
Valuation adjustments are recorded for the credit risk of our derivative portfolios in order to arrive at their fair values. Credit Valuation Adjustments (CVA) take into account our creditworthiness and our counterparties’ creditworthiness, the current and potential future mark-to-market of the transactions, and the effects of credit mitigants such as master netting and collateral agreements. CVA amounts are derived from estimates of exposure at default, probability of default, recovery rates on a counterparty basis, and market and credit factor correlations. Exposure at default is the amounts of expected derivative related assets and liabilities at the time of default, estimated through modeling using underlying risk factors. Probability of default and recovery rate is generally implied from the market prices for credit protection and credit ratings of the counterparty. Correlation is the statistical measure of how credit and market factors may move in relation to one another, if any. Correlation is estimated using historical data and market data where available. CVA is calculated daily and changes are recorded in Non-interest income – Trading revenue.
In order to reflect recently observed market practice of pricing collateralized over-the-counter (OTC) derivatives using the OIS curve, our valuation approach accounts for the difference between certain OIS rates and LIBOR for derivatives valuation as valuation adjustments. Market practices continue to evolve concerning the use of and construction of OIS curves that best reflect the nature of the underlying collateral and as a result, additional valuation adjustments may be required in the future.
Where required, a valuation adjustment is made to reflect the unrealized gain or loss at inception of a financial instrument contract where the fair value of that financial instrument is not obtained from a quoted market price or cannot be evidenced by other observable market transactions based on a valuation technique incorporating observable market data.
A bid-offer valuation adjustment is required when a financial instrument is valued at the mid-market price, instead of the bid or offer price for asset or liability positions, respectively. The valuation adjustment takes into account the spread from the mid to either the bid or offer price.
Some valuation models require parameter calibration from such factors as market observed option prices. The calibration of parameters may be sensitive to factors such as the choice of instruments or optimization methodology. A valuation adjustment is also estimated to mitigate the uncertainties of parameter calibration.
A breakdown of fair values of financial instruments based on the fair value hierarchy (Level 1, 2 and 3) is provided in Note 3. A discussion of the aspects of valuation that require the most significant judgments, including changes in our fair value hierarchy, developing our reasonably possible alternative assumptions, and unrealized gains and losses on AFS securities, is included in Note 3 and Note 4.
The following describes how fair values are determined, what inputs are used and where they are classified in the fair value hierarchy table in Note 3, for our significant assets and liabilities that are measured at fair value on a recurring basis:
Government bonds (Canadian, U.S. and other OECD governments)
Government bonds are included in Canadian government debt, U.S. state, municipal and agencies debt, Other OECD government debt and Obligations related to securities sold short in the fair value hierarchy table. The fair values of government issued or guaranteed debt securities in active markets are determined by reference to recent transaction prices, broker quotes, or third-party vendor prices and is classified as Level 1 in the fair value hierarchy. The fair values of securities that are not traded in active markets are based on either security prices, or valuation techniques using implied yields and risk spreads derived from prices of actively traded and similar government securities. Securities with observable prices or rate inputs as compared to transaction prices, dealer quotes or vendor prices are classified as Level 2 in the hierarchy. Securities where inputs are unobservable are classified as Level 3 in the hierarchy.
Corporate and U.S. municipal bonds
The fair values of corporate and U.S. municipal bonds, which are in Corporate debt and other debt, U.S. state, municipal and agencies debt and Obligations related to securities sold short in the fair value hierarchy table, are determined using either recently executed transaction prices, broker quotes, pricing services, or in certain instances discounted cash flow valuation models using rate inputs such as benchmark yields (Canadian Dealer Offered Rate, LIBOR and other similar reference rates) and risk spreads of comparable securities. Securities with observable prices or rate inputs as compared to transaction prices, dealer quotes or vendor prices are classified as Level 2 in the hierarchy. Securities where inputs are unobservable are classified as Level 3 in the hierarchy.
Asset-backed Securities (ABS) and Mortgage-backed Securities (MBS)
ABS and MBS are in Asset-backed securities, Mortgage-backed securities, Canadian government debt, U.S. state, municipal and agencies debt, and Obligations related to securities sold short in the fair value hierarchy table. ABS are primarily Collateralized Debt Obligations (CDO). Inputs for valuation of MBS and CDO are, when available, traded prices, dealer or lead manager quotes, broker quotes and vendor prices. ABS and MBS are classified as Level 2 or 3 in the hierarchy dependent on the level of pricing transparency. ABS and MBS with observable inputs that are calibrated to transaction prices, dealer quotes or vendor prices are classified as Level 2 in the hierarchy. ABS and MBS where security prices are unobservable are classified as Level 3 in the hierarchy.
Auction Rate Securities (ARS)
ARS are included in U.S. state, municipal and agencies debt, and Asset-backed securities in the fair value hierarchy table. The valuation of ARS involves discounting forecasted cash flows from the underlying student loan collateral and incorporating multiple inputs such as default, repayment, deferment and redemption rates, and credit spreads. These inputs are unobservable, and therefore, ARS are classified as Level 3 in the hierarchy. All relevant data must be assessed and significant judgment is required to determine the appropriate valuation inputs.
Equities
Equities and Obligations related to securities sold short in the fair value hierarchy table consist of listed and unlisted common shares, private equities and hedge funds with certain redemption restrictions. The fair values of common shares are based on quoted prices in active markets, where available, and are classified as Level 1 in the hierarchy. Where quoted prices in active markets are not readily available, fair value is determined based on quoted market prices for similar securities or through valuation techniques, including multiples of earnings and discounted cash flow analysis with forecasted cash flows and discount rate as inputs. Private equities are classified as Level 3 in the hierarchy as their inputs are not observable. Hedge funds are valued using Net Asset Values (NAV). If we can redeem a hedge fund at NAV prior to the next quarter end, the fund is classified as Level 2 in the hierarchy. Otherwise, it is classified as Level 3 in the hierarchy.
Derivatives
The fair values of exchange-traded derivatives, such as interest rate and equity options and futures, are based on quoted market prices and are classified as Level 1 in the fair value hierarchy. OTC derivatives primarily consist of interest rate and cross currency swaps, interest rate options, foreign exchange forward contracts and options, and commodity options and swaps. The exchange-traded or OTC interest-rate, foreign exchange and equity derivatives are included in Interest rate contracts, Foreign exchange contracts and Other contracts in the fair value hierarchy table.
Consolidated Financial Statements Royal Bank of Canada: Annual Report 2013 111
Table of Contents
Note 2 Summary of significant accounting policies, estimates and judgments(continued)
|
The fair values of OTC derivatives are determined using valuation models when quoted market prices or third-party consensus pricing information are not available. The valuation models, such as discounted cash flows or Black-Scholes option model, incorporate observable or unobservable inputs for interest and foreign exchange rates, equity and commodity prices (including indices), credit spreads, corresponding market volatility levels, and other market-based pricing factors. As previously discussed, other adjustments to fair value include bid-offer, CVA, OIS, parameter and model uncertainties, and unrealized gain or loss at inception of a transaction. A derivative instrument is classified as Level 2 in the hierarchy if observable market inputs are available or the unobservable inputs are not significant to the fair value. Otherwise, it is classified as Level 3 in the hierarchy.
Securities borrowed or purchased under resale agreements and securities lent or sold under repurchase agreements
In the fair value hierarchy table, these instruments are included in Assets purchased under reverse repurchase agreements and securities borrowed, and Obligations related to assets sold under repurchase agreements and securities loaned. Fair value for these contracts is calculated using valuation techniques such as discounted cash flow models using interest rate curves as inputs. They are classified as Level 2 instruments in the hierarchy as the inputs are observable.
Deposits
A majority of our deposits are measured at amortized cost but we designated certain deposits as at FVTPL. These FVTPL deposits are composed of deposits taken, the issuance of certificate of deposits and promissory notes, interest rate and equity linked notes, and are included in Deposits in the fair value hierarchy table. The fair value for these instruments is determined using discounted cash flow and derivative option valuation models. The inputs to the valuation models include benchmark yield curves, credit spreads, interest rates, interest rate and equity volatility, dividends and correlation, where applicable. They are classified as Level 2 or 3 instruments in the hierarchy, depending on the significance of the unobservable credit spreads, volatility, dividend and correlation rates.
Fair values of financial assets and liabilities carried at amortized cost are disclosed in Carrying value and fair value of selected financial instruments table of Note 3 and are determined using the following valuation techniques and inputs:
Retail loans
Retail loans include residential mortgages, personal and small business loans and credit cards. For residential mortgages, and personal and small business loans, we segregate the portfolio based on certain attributes such as product type, contractual interest rate, term to maturity and credit scores, if applicable. Fair values of these loans are determined by the discounted cash flow valuation technique using prevailing interest rates as inputs. The carrying values of short-term or revolving loans, such as credit card receivables, appropriate their fair values.
Wholesale loans
Wholesale loans include Business, Bank and Sovereign loans. Where market prices are available, loans are valued based on market loan prices. Otherwise, fair value is determined by the discounted cash flow valuation technique using (i) market interest rates and market based spreads of assets with similar ratings; (ii) if available, expected default frequency implied from credit default swap prices; and (iii) relevant pricing information such as contractual rate, origination and maturity dates, redemption price, coupon payment frequency and date convention, as inputs.
Deposits
Deposits are composed of demand, notice, and term deposits which include senior deposit notes we have issued to provide long-term funding. Fair values of term deposits are determined by one of several valuation techniques: (i) for guaranteed investment certificates and similar instruments, we use an approach similar to that of the above residential mortgages and personal loans; and (ii) for senior deposit notes, we use actual traded prices, vendor prices or the discounted cash flow valuation technique using a market interest rate curve and our credit spreads as inputs. The carrying values of short-term and revolving demand and notice deposits approximate their fair values.
Subordinated debentures and Trust capital securities
Fair values of Subordinated debentures and Trust capital securities are based on recent transaction prices.
Interest
Interest is recognized in Interest income and Interest expense in the Consolidated Statements of Income for all interest bearing financial instruments using the effective interest method. The effective interest rate is the rate that discounts estimated future cash flows through the expected life of the financial asset or liability to the net carrying amount upon initial recognition.
Transaction costs
Transaction costs are expensed as incurred for financial instruments classified or designated as at FVTPL. For other financial instruments, transaction costs are capitalized on initial recognition. For financial assets and financial liabilities measured at amortized cost, capitalized transaction costs are amortized through Net income over the estimated life of the instrument using the effective interest method. For AFS financial assets measured at fair value that do not have fixed or determinable payments and no fixed maturity, capitalized transaction costs are recognized in Net income when the asset is derecognized or becomes impaired.
Assets purchased under reverse repurchase agreements and sold under repurchase agreements
We purchase securities under agreements to resell (reverse repurchase agreement) and take possession of these securities. Reverse repurchase agreements are treated as collateralized lending transactions whereby we monitor the market value of the securities purchased and additional collateral is obtained when appropriate. We have the right to liquidate the collateral held in the event of counterparty default. We also sell securities under agreements to repurchase (repurchase agreements), which are treated as collateralized borrowing transactions. The securities received under reverse repurchase agreements and securities delivered under repurchase agreements are not recognized on, or derecognized from, our Consolidated Balance Sheets, respectively, unless the risks and rewards of ownership are obtained or relinquished.
Reverse repurchase agreements and repurchase agreements are carried on our Consolidated Balance Sheets at the amounts at which the securities were initially acquired or sold, except when they are designated as at FVTPL and are recorded at fair value. Interest earned on reverse repurchase agreements is included in Interest income, and interest incurred on repurchase agreements is included in Interest expense in our Consolidated Statements of Income. Changes in fair value for reverse repurchase agreements and repurchase agreements designated as at FVTPL are included in Trading revenue or Other in Non-interest income.
112 Royal Bank of Canada: Annual Report 2013 Consolidated Financial Statements
Table of Contents
Acceptances
Acceptances are short-term negotiable instruments issued by our clients to third parties which we guarantee. The potential liability under acceptances is reported in Other – Acceptances on our Consolidated Balance Sheets. The recourse against our clients in the case of a call on these commitments is reported as a corresponding asset of the same amount in Other – Customers’ liability under acceptances. Fees earned are reported in Non-interest income – Credit Fees.
Derivatives
Derivatives are primarily used in sales and trading activities. Derivatives are also used to manage our exposure to interest, currency, credit and other market risks. The most frequently used derivative products are interest rate swaps, interest rate futures, forward rate agreements, interest rate options, foreign exchange forward contracts, cross currency swaps, foreign currency futures, foreign currency options, equity swaps and credit derivatives. All derivative instruments are recorded on our Consolidated Balance Sheets at fair value, including those derivatives that are embedded in financial or non-financial contracts and are not closely related to the host contracts.
When derivatives are embedded in other financial instruments or host contracts, such combinations are known as hybrid instruments with the effect that some of the cash flows of a hybrid instrument vary in a way similar to a stand-alone derivative. If the host contract is not carried at fair value with changes in fair value reported in our Consolidated Statements of Income, the embedded derivative is generally required to be separated from the host contract and accounted for separately as at FVTPL if the economic characteristics and risks of the embedded derivative are not closely related to those of the host contract. All embedded derivatives are presented on a combined basis with the host contracts although they are separated for measurement purposes when conditions requiring separation are met.
When derivatives are used in sales and trading activities, the realized and unrealized gains and losses on these derivatives are recognized in Trading revenue in Non-interest income. Derivatives with a positive fair value are reported as Derivative assets and derivatives with a negative fair value are reported as Derivative liabilities. In accordance with our policy for offsetting financial assets and financial liabilities, as outlined below, the net fair value of certain derivative assets and liabilities are reported as an asset or liability, as appropriate. Market and credit valuation adjustments, and premiums paid are also included in Derivative assets, while premiums received are shown in Derivative liabilities.
When derivatives are used to manage our own exposures, we determine for each derivative whether hedge accounting can be applied, as discussed in the Hedge accounting section below.
Hedge accounting
We use derivatives and non-derivatives in our hedging strategies to manage our exposure to interest rate, currency, credit and other market risks. Where hedge accounting can be applied, a hedge relationship is designated and documented at inception to detail the particular risk management objective and the strategy for undertaking the hedge transaction. The documentation identifies the specific asset, liability or anticipated cash flows being hedged, the risk that is being hedged, the type of hedging instrument used and how effectiveness will be assessed. We assess, both at the inception of the hedge and on an ongoing basis, whether the hedging instruments have been ‘highly effective’ in offsetting changes in the fair value or cash flows of the hedged items. A hedge is regarded as highly effective only if the following criteria are met: (i) at inception of the hedge and throughout its life, the hedge is expected to be highly effective in achieving offsetting changes in fair value or cash flows attributable to the hedged risk, and (ii) actual results of the hedge are within a pre-determined range. In the case of hedging a forecast transaction, the transaction must have a high probability of occurring and must present an exposure to variations in cash flows that could ultimately affect the reported net profit or loss. Hedge accounting is discontinued when it is determined that the hedging instrument is no longer effective as a hedge, the hedging instrument is terminated or sold, upon the sale or early termination of the hedged item, or when the forecast transaction is no longer deemed highly probable. Refer to Note 8 for the fair value of derivatives and non-derivative instruments categorized by their hedging relationships, as well as derivatives that are not designated in hedging relationships.
Fair value hedges
In a fair value hedging relationship, the carrying value of the hedged item is adjusted for changes in fair value attributable to the hedged risk and recognized in Non-interest income. Changes in fair value of the hedged item, to the extent that the hedging relationship is effective, are offset by changes in the fair value of the hedging derivative, which are also recognized in Non-interest income. When hedge accounting is discontinued, the carrying value of the hedged item is no longer adjusted and the cumulative fair value adjustments to the carrying value of the hedged items are amortized to Net income over the remaining life of the hedged items.
We predominantly use interest rate swaps to hedge our exposure to the changes in a fixed interest rate instrument’s fair value caused by changes in interest rates.
Cash flow hedges
In a cash flow hedging relationship, the effective portion of the change in the fair value of the hedging derivative, net of taxes, is recognized in OCI while the ineffective portion is recognized in Non-interest income. When hedge accounting is discontinued, the cumulative amounts previously recognized in Other components of equity are reclassified to Net interest income during the periods when the variability in the cash flows of the hedged item affects Net interest income. Unrealized gains and losses on derivatives are reclassified immediately to Net income when the hedged item is sold or terminated early, or when the forecast transaction is no longer expected to occur.
We predominantly use interest rate swaps to hedge the variability in cash flows related to a variable-rate asset or liability.
Net investment hedges
In hedging a foreign currency exposure of a net investment in a foreign operation, the effective portion of foreign exchange gains and losses on the hedging instruments, net of applicable taxes, is recognized in OCI and the ineffective portion is recognized in Non-interest income. The amounts, or a portion thereof, previously recognized in Other components of equity are recognized in Net income on the disposal, or partial disposal, of the foreign operation.
We use foreign exchange contracts and foreign currency-denominated liabilities to manage our foreign currency exposures to net investments in foreign operations having a functional currency other than the Canadian dollar.
Loans
Loans are non-derivative financial assets with fixed or determinable payments that are not quoted in an active market and which are not classified as AFS. Loans are initially recognized at fair value. When loans are issued at a market rate, fair value is represented by the cash advanced to the borrowers plus direct and incremental costs. Loans are subsequently measured at amortized cost using the effective interest method less impairment, unless we intend to sell them in the near future upon origination or they have been designated as at FVTPL, in which case they are carried at fair value.
Consolidated Financial Statements Royal Bank of Canada: Annual Report 2013 113
Table of Contents
Note 2 Summary of significant accounting policies, estimates and judgments(continued)
|
We assess at each balance sheet date whether there is objective evidence that the loans are impaired. Evidence of impairment may include indications that the borrower is experiencing significant financial difficulty, probability of bankruptcy or other financial reorganization, as well as a measurable decrease in the estimated future cash flows evidenced by the adverse changes in the payments status of the borrower or economic conditions that correlate with defaults. Whenever a payment is 90 days past due, loans other than credit card balances and loans guaranteed or insured by a Canadian government (Federal or Provincial) or a Canadian government agency (collectively, Canadian government) are classified as impaired unless they are fully secured and collection efforts are reasonably expected to result in repayment of debt within 180 days of the loans becoming past due. Loans guaranteed by a Canadian government are classified as impaired when the loan is contractually 365 days in arrears. Credit card balances are written off when a payment is 180 days in arrears.
Assets acquired to satisfy loan commitments are recorded at their fair value less costs to sell. Fair value is determined based on either current market value where available or discounted cash flows. Any excess of the carrying value of the loan over the fair value of the assets acquired is recognized by a charge to Provision for credit losses.
Interest on loans is recognized in Interest income – Loans using the effective interest method. The estimated future cash flows used in this calculation include those determined by the contractual term of the asset or liability, all fees that are considered to be integral to the effective interest rate, transaction costs and all other premium or discounts. Fees that relate to activities such as originating, restructuring or renegotiating loans are deferred and recognized as Interest income over the expected term of such loans using the effective interest method. Where there is a reasonable expectation that a loan will result, commitment and standby fees are also recognized as interest income over the expected term of the resulting loans using the effective interest method. Otherwise, such fees are recorded as other liabilities and amortized into Non-interest income over the commitment or standby period. Prepayment fees on mortgage loans are not included as part of the effective interest rate at origination as the amounts are not reliably measurable. If prepayment fees are received on a renewal of a mortgage loan, the fee is included as part of the effective interest rate, and if not renewed, the prepayment fee is recognized in interest income at the prepayment date.
Allowance for credit losses
An allowance for credit losses is established if there is objective evidence that we will be unable to collect all amounts due on our loans portfolio according to the original contractual terms or the equivalent value. This portfolio includes on-balance sheet exposures, such as loans and acceptances, and off-balance sheet items such as letters of credit, guarantees and unfunded commitments.
The allowance for credit losses is increased by the impairment losses recognized and decreased by the amount of write-offs, net of recoveries. The allowance for credit losses for on-balance sheet items is included as a reduction to assets, and the allowance for credit losses relating to off-balance sheet items is included in Provisions under Other Liabilities.
We assess whether objective evidence of impairment exists individually for loans that are individually significant and collectively for loans that are not individually significant. If we determine that no objective evidence of impairment exists for an individually assessed loan, whether significant or not, the loan is included in a group of loans with similar credit risk characteristics and collectively assessed for impairment. Loans that are individually assessed for impairment and for which an impairment loss is recognized are not included in a collective assessment of impairment.
Allowance for credit losses represent management’s best estimates of losses incurred in our loan portfolio at the balance sheet date. Management’s judgment is required in making assumptions and estimations when calculating allowances on both individually and collectively assessed loans. The underlying assumptions and estimates used for both individually and collectively assessed loans can change from period to period and may significantly affect our results of operations.
Individually assessed loans
Loans which are individually significant are assessed individually for objective indicators of impairment. A loan is considered impaired when management determines that it will not be able to collect all amounts due according to the original contractual terms or the equivalent value.
Credit exposures of individually significant loans are evaluated based on factors including the borrower’s overall financial condition, resources and payment record, and where applicable, the realizable value of any collateral. If there is evidence of impairment leading to an impairment loss, then the amount of the loss is determined as the difference between the carrying amount of the loan, including accrued interest, and the estimated recoverable amount. The estimated recoverable amount is measured as the present value of expected future cash flows discounted at the loan’s original effective interest rate, including cash flows that may result from the realization of collateral less costs to sell. Individually-assessed impairment losses reduce the carrying amount of the loan through the use of an allowance account and the amount of the loss is recognized in Provision for credit losses in our Consolidated Statements of Income. Following impairment, interest income is recognized on the unwinding of the discount from the initial recognition of impairment.
Significant judgment is required in assessing evidence of impairment and estimation of the amount and timing of future cash flows when determining the impairment loss. When assessing objective evidence of impairment we primarily consider specific factors such as the financial condition of the borrower, borrower’s default or delinquency in interest or principal payments, local economic conditions and other observable data. In determining the estimated recoverable amount we consider discounted expected future cash flows at the effective interest rate using a number of assumptions and inputs. Management judgment is involved when choosing these inputs and assumptions used such as the expected amount of the loan that will not be recovered and the cost of time delays in collecting principal and/or interest, and when estimating the value of any collateral held for which there may not be a readily accessible market. Changes in the amount expected to be recovered would have a direct impact on the Provision for credit losses and may result in a change in the Allowance for credit losses
Collectively assessed loans
Loans which are not individually significant, or which are individually assessed and not determined to be impaired, are collectively assessed for impairment. For the purposes of a collective evaluation of impairment, loans are grouped on the basis of similar risk characteristics, taking into account loan type, industry, geographic location, collateral type, past due status and other relevant factors.
The collective impairment allowance is determined by reviewing factors including: (i) historical loss experience, which takes into consideration historical probabilities of default, loss given default and exposure at default, in portfolios of similar credit risk characteristics, and (ii) management’s judgment on the level of impairment losses based on historical experience relative to the actual level as reported at the balance sheet date, taking into consideration the current portfolio credit quality trends, business and economic and credit conditions, the impact of policy and process changes, and other supporting factors. Future cash flows for a group of loans are collectively evaluated for impairment on the basis of the contractual cash flows of the loans in the group and historical loss experience for loans with credit risk characteristics similar to those in the group. Historical loss experience is adjusted based on current observable data to reflect the effects of current conditions that did not
114 Royal Bank of Canada: Annual Report 2013 Consolidated Financial Statements
Table of Contents
affect the period on which the historical loss experience is based and to remove the effects of conditions in the historical period that do not currently exist. The methodology and assumptions used for estimating future cash flows are reviewed regularly to reduce any differences between loss estimates and actual loss experience. Collectively-assessed impairment losses reduce the carrying amount of the aggregated loan position through an allowance account and the amount of the loss is recognized in Provision for credit losses. Following impairment, interest income is recognized on the unwinding of the discount from the initial recognition of impairment.
The methodology and assumptions used to calculate collective impairment allowances are subject to uncertainty, in part because it is not practicable to identify losses on an individual loan basis due to the large number of individually insignificant loans in the portfolio. Significant judgment is required in assessing historical loss experience, the loss identification period and its relationship to current portfolios including delinquency, and loan balances; and current business, economic and credit conditions including industry specific performance, unemployment and country risks. Changes in these assumptions would have a direct impact on the Provision for credit losses and may result in changes in the related Allowance for credit losses.
Write-off of loans
Loans and the related impairment allowance for credit losses are written off, either partially or in full, when there is no realistic prospect of recovery. Where loans are secured, they are generally written off after receipt of any proceeds from the realization of the collateral. In circumstances where the net realizable value of any collateral has been determined and there is no reasonable expectation of further recovery, write off may be earlier. For credit cards, the balances and related allowance for credit losses are written off when payment is 180 days in arrears. Personal loans are generally written off at 150 days past due.
Derecognition of financial assets
Our various securitization activities generally consist of the transfer of financial assets such as loans or packaged mortgage-backed securities (MBS) to independent SPEs or trusts that issue securities to investors.
Financial assets are derecognized from our Consolidated Balance Sheets when our contractual rights to the cash flows from the assets have expired, when we retain the rights to receive the cash flows of the assets but assume an obligation to pay those cash flows to a third party subject to certain pass-through requirements or when we transfer our contractual rights to receive the cash flows and substantially all of the risk and rewards of the assets have been transferred. When we retain substantially all of the risks and rewards of the transferred assets, the transferred assets are not derecognized from our Consolidated Balance Sheets and are accounted for as secured financing transactions. When we neither retain nor transfer substantially all risks and rewards of ownership of the assets, we derecognize the assets if control over the assets is relinquished. If we retain control over the transferred assets, we continue to recognize the transferred assets to the extent of our continuing involvement.
Management’s judgment is applied in determining whether the contractual rights to the cash flows from the transferred assets have expired or whether we retain the rights to receive cash flows on the assets but assume an obligation to pay for those cash flows. We derecognize transferred financial assets if we transfer substantially all the risk and rewards of the ownership in the assets. When assessing whether we have transferred substantially all of the risk and rewards of the transferred assets, management considers the entity exposure before and after the transfer with the variability in the amount and timing of the net cash flows of the transferred assets. In transfers that we retain the servicing rights, management has applied judgment in assessing the benefits of servicing against market expectations. When the benefits of servicing are greater than fair market value, a servicing asset is recognized in Other assets in our Consolidated Balance Sheets. When the benefits of servicing are less than fair market value, a servicing liability is recognized in Other liabilities in our Consolidated Balance Sheets.
Derecognition of financial liabilities
We derecognize a financial liability from our Consolidated Balance Sheets when our obligation specified in the contract expires, or is discharged or cancelled. We recognize the difference between the carrying amount of a financial liability transferred and the consideration paid in our Consolidated Statements of Income.
Guarantees
Financial guarantee contracts are contracts that contingently require us to make specified payments (in cash, other assets, our own shares or provision of services) to reimburse the holder for a loss it incurs because a specified debtor fails to make payment when due in accordance with the original or modified terms of a debt instrument. Liabilities are recognized on our Consolidated Balance Sheets at the inception of a guarantee for the fair value of the obligation undertaken in issuing the guarantee. Financial guarantees are subsequently remeasured at the higher of (i) the amount initially recognized and (ii) our best estimate of the present value of the expenditure required to settle the present obligation at the end of the reporting period.
If the financial guarantee contract meets the definition of a derivative, it is measured at fair value at each balance sheet date and reported under Derivatives on our Consolidated Balance Sheets.
Offsetting financial assets and financial liabilities
Financial assets and financial liabilities are presented net when we have a legally enforceable right to set off the recognized amounts and intend to either settle on a net basis or to realize the asset and settle the liability simultaneously.
Insurance and segregated funds
Premiums from long-duration contracts, primarily life insurance, are recognized when due in Non-interest income – Insurance premiums, investment and fee income. Premiums from short-duration contracts, primarily property and casualty, and fees for administrative services are recognized in Insurance premiums, investment and fee income over the related contract period. Unearned premiums of the short-duration contracts, representing the unexpired portion of premiums, are reported in Other liabilities. Investments made by our insurance operations are classified as AFS or loans and receivables, except for investments supporting the policy benefit liabilities on life and health insurance contracts and a portion of property and casualty contracts. These are designated as at FVTPL with changes in fair value reported in Insurance premiums, investment and fee income.
Insurance claims and policy benefit liabilities represent current claims and estimates for future insurance policy benefits. Liabilities for life insurance contracts are determined using the Canadian Asset Liability Method (CALM), which incorporates assumptions for mortality, morbidity, policy lapses and surrenders, investment yields, policy dividends, operating and policy maintenance expenses, and provisions for adverse deviation. These assumptions are reviewed at least annually and updated in response to actual experience and market conditions. Liabilities for property and casualty insurance represent estimated provisions for reported and unreported claims. Liabilities for life and property and casualty insurance are included in Insurance claims and policy benefit liabilities. Changes in Insurance claims and policy benefit liabilities are included in the Insurance policyholder benefits, claims and acquisition expense in our Consolidated Statements of Income in the period in which the estimates change.
Consolidated Financial Statements Royal Bank of Canada: Annual Report 2013 115
Table of Contents
Note 2 Summary of significant accounting policies, estimates and judgments(continued)
|
Premiums ceded for reinsurance and reinsurance recoveries on policyholder benefits and claims incurred are reported in income and expense as appropriate. Reinsurance recoverables, which relate to paid benefits and unpaid claims, are included in Other assets.
Acquisition costs for new insurance business consist of commissions, premium taxes, certain underwriting costs and other costs that vary with the acquisition of new business. Deferred acquisition costs for life insurance products are implicitly recognized in insurance claims and policy benefit liabilities by CALM. For property and casualty insurance, these costs are classified as Other assets and amortized over the policy term.
Segregated funds are lines of business in which we issue an insurance contract where the benefit amount is directly linked to the market value of the investments held in the underlying fund. The contractual arrangement is such that the underlying segregated fund assets are registered in our name but the segregated fund policyholders bear the risks and rewards of the funds’ investment performance. Liabilities for these contracts are calculated based on contractual obligations using actuarial assumptions and are at least equivalent to the surrender or transfer value calculated by reference to the value of the relevant underlying funds or indices. Segregated funds’ assets and liabilities are separately presented on our Consolidated Balance Sheets. Fee income from segregated funds includes management fees, mortality, policy, administration and surrender charges. We provide minimum death benefit and maturity value guarantees on segregated funds. The liability associated with these minimum guarantees is recorded in Insurance claims and policy benefit liabilities.
Liability adequacy tests are performed for all insurance contract portfolios at each balance sheet date to ensure the adequacy of insurance contract liabilities. Current best estimates of future contractual cash flows, claims handling and administration costs, and investment returns from the assets backing the liabilities are taken into account in the tests. When the test results indicate that there is a deficiency in liabilities, the deficiency is charged immediately to our Consolidated Statements of Income by writing down the deferred acquisition costs in Other assets and/or increasing Insurance claims and policy benefit liabilities.
Employee benefits – Pensions and other post-employment benefits
We offer a number of benefit programs which provide pension and other benefits to eligible employees. These plans include registered defined benefit pension plans, supplemental pension plans, defined contribution plans, health, dental, disability and life insurance plans.
Investments held by the pension funds primarily comprise equity and fixed income securities and are valued at fair value. Defined benefit pension costs and the present value of accrued pension and other post-employment benefit obligations are calculated by the plans’ actuaries using the Projected Unit Credit Method. Our defined benefit pension expense, which is included in Non-interest expense – Human resources, consists of the cost of employee pension benefits for the current year’s service, interest cost on the liability, and expected return on plan assets. Actuarial gains and losses are recognized in profit or loss using the deferral (corridor) approach. Past service costs are charged immediately to income to the extent that the benefits have vested, and are otherwise recognized on a straight-line basis over the average period until the benefits vest. Gains and losses on curtailment or settlement of defined benefit plans are recognized in income when the curtailment or settlement occurs.
For each defined benefit plan, we recognize the present value of our defined benefit obligations less the fair value of the plan assets, together with adjustments for any unrecognized actuarial gains and losses and unrecognized past service costs, as a defined benefit liability reported in Accrued pension and other post-employment benefits on our Consolidated Balance Sheets. For plans where there is a net defined benefit asset, the amount is reported as an asset in Prepaid pension benefit cost. The measurement of the asset is limited to the lower of (i) the defined benefit asset and (ii) the sum of actuarial losses and past service costs not yet recognized, and the present value of any refunds from the plan or reductions in the future contributions to the plan.
The calculation of defined benefit expenses and obligations requires significant judgment as the recognition is dependent on discount rates, expected rates of return on assets, and various actuarial assumptions such as healthcare cost trend rates, projected salary increases, retirement age, and mortality and termination rates. Due to the long-term nature of these plans, such estimates and assumptions are subject to inherent risks and uncertainties. For our pension and other post-employment plans, the discount rate is determined by reference to market yields on high quality corporate bonds. Since the discount rate is based on currently available yields, and involves management’s assessment of market liquidity, it is only a proxy for future yields. Management judgment is also required in estimating the expected rate of return on assets, because of possible changes to our asset allocation and the inherent risks in predicting future investment returns. The expected rate of return on assets is a weighted average of expected long-term asset return by asset class and is selected from a range of possible future asset returns. Actuarial assumptions, set in accordance with current practices in the respective countries of our plans, may differ from actual experience as country specific statistics is only an estimate for future employee behaviour. These assumptions are determined by management and are reviewed by actuaries at least annually. Changes to any of the above assumptions may affect the amounts of benefits obligations and expenses that we recognize.
Our contributions to defined contribution plans are expensed when employees have rendered services in exchange for such contributions, generally in the year of contribution. Defined contribution plan expense is included in Non-interest expense – Human resources.
Share-based compensation
We offer share-based compensation plans to certain key employees and to our non-employee directors.
To account for stock options granted to employees, compensation expense is recognized over the applicable vesting period with a corresponding increase in equity. Fair value is determined by using option valuation models, which take into account the exercise price of the option, the current share price, the risk free interest rate, the expected volatility of the share price over the life of the option and other relevant factors. When the options are exercised, the exercise price proceeds together with the amount initially recorded in equity are credited to common shares. Our other compensation plans include performance deferred share plans and deferred share unit plans for key employees (the Plans). The obligations for the Plans are accrued over their vesting periods. The Plans are settled in cash.
For cash-settled awards, our accrued obligations are adjusted to their fair value at each balance sheet date. For share-settled awards, our accrued obligations are based on the fair value of our common shares at the date of grant. Changes in our obligations, net of related hedges, are recorded as Non-interest expense – Human resources in our Consolidated Statements of Income with a corresponding increase in Other liabilities for cash settled awards and in Retained earnings for share-settled awards.
The compensation cost attributable to options and awards granted to employees who are eligible to retire or will become eligible to retire during the vesting period, is recognized immediately if the employee is eligible to retire on the grant date or over the period between the grant date and the date the employee becomes eligible to retire.
Our contributions to the employee savings and share ownership plans are expensed as incurred.
Income taxes
Income tax comprises current tax and deferred tax and is recognized in our Consolidated Statements of Income except to the extent that it relates to items recognized directly in equity, in which case it is recognized in equity.
116 Royal Bank of Canada: Annual Report 2013 Consolidated Financial Statements
Table of Contents
Current income tax payable on profits is recognized as an expense based on the applicable tax laws in each jurisdiction in the period in which profits arise, calculated using tax rates enacted or substantively enacted by the balance sheet date. Deferred tax is recognized on temporary differences between the carrying amounts of assets and liabilities for accounting purposes compared with tax purposes. A deferred income tax asset or liability is determined for each temporary difference, except for earnings related to our subsidiaries, branches, associates and interests in joint ventures where the temporary differences will not reverse in the foreseeable future and we have the ability to control the timing of reversal. Deferred tax assets and liabilities are determined based on the tax rates that are expected to be in effect in the period that the asset is realized or the liability is settled, based on tax rates and tax laws that have been enacted or substantively enacted at the balance sheet date. Current tax assets and liabilities are offset when they are levied by the same taxation authority on either the same taxable entity or different taxable entities within the same tax reporting group (which intends to settle on a net basis), and when there is a legal right to offset. Deferred tax assets and liabilities are offset when the same conditions are satisfied. Our Consolidated Statements of Income include items that are non-taxable or non-deductible for income tax purposes and, accordingly, this causes the income tax provision to be different from what it would be if based on statutory rates.
Deferred income taxes accumulated as a result of temporary differences and tax loss carryfowards are included in Other assets and Other liabilities. On a quarterly basis, we review our deferred income tax assets to determine whether it is probable that the benefits associated with these assets will be realized; this review involves evaluating both positive and negative evidence.
We are subject to income tax laws in various jurisdictions where we operate, and the complex tax laws are potentially subject to different interpretations by us and the relevant taxation authorities. Significant judgment is required in the interpretation of the relevant tax laws, and the determination of our tax provision which includes our best estimate of tax positions that are under audit or appeal by relevant taxation authorities. We perform a review on a quarterly basis to incorporate our best assessment based on information available, but additional liability and income tax expense could result based on decisions made by the relevant tax authorities.
The determination of our deferred tax asset or liability also requires significant management judgment as the recognition is dependant on our projection of future taxable profits and tax rates that are expected to be in effect in the period the asset is realized or the liability is settled. Any changes in our projection will result in changes in deferred tax assets or liabilities on our Consolidated Balance Sheets, and also deferred tax expense on our Consolidated Statements of Income.
Business combinations, goodwill and other intangibles
All business combinations are accounted for using the acquisition method. Identifiable intangible assets are recognized separately from goodwill and included in Other intangibles. Goodwill represents the excess of the price paid for the business acquired over the fair value of the net identifiable assets acquired on the date of acquisition.
Goodwill
Goodwill is allocated to cash-generating units or groups of cash-generating units (CGU) for the purpose of impairment testing, which is undertaken at the lowest level at which goodwill is monitored for internal management purposes. Impairment testing is performed annually as at August 1, or more frequently if there are objective indicators of impairment, by comparing the recoverable amount of a CGU with its carrying amount. The recoverable amount of a CGU is the higher of its value in use and its fair value less costs to sell. Value in use is the present value of the expected future cash flows from a CGU. Fair value less costs to sell is the amount obtainable from the sale of a CGU in an arm’s length transaction between knowledgeable, willing parties, less costs of disposal. The fair value of a CGU is estimated using valuation techniques such as a discounted cash flow approach, adjusted to reflect the considerations of a prospective third-party buyer. External evidence such as binding sale agreements or recent transactions for similar businesses within the same industry is considered to the extent that it is available.
Significant judgment is involved in estimating the model inputs used to determine the recoverable amount of our CGU, in particular future cash flows, discount rates and terminal growth rates, due to the uncertainty in the timing and amount of cash flows and the forward-looking nature of these inputs. Future cash flows are based on financial plans agreed by management which are estimated based on forecast results, business initiatives, planned capital investments and returns to shareholders. Discount rates are based on the bank-wide cost of capital, adjusted for CGU-specific risks and currency exposure as reflected by differences in expected inflation. CGU-specific risks include country risk, business/operational risk, geographic risk (including political risk, devaluation risk, and government regulation), currency risk, and price risk (including product pricing risk and inflation). Terminal growth rates reflect the expected long-term gross domestic product growth and inflation for the countries within which the CGU operates. Changes in these assumptions may impact the amount of impairment loss recognized in Non-interest expense.
The carrying amount of a CGU includes the carrying amount of assets, liabilities and goodwill allocated to the CGU. If the recoverable amount is less than the carrying value, the impairment loss is allocated first to reduce the carrying amount of any goodwill allocated to the CGU and then to the other non-financial assets of the CGU proportionately based on the carrying amount of each asset. Any impairment loss is charged to income in the period in which the impairment is identified. Goodwill is stated at cost less accumulated impairment losses. Subsequent reversals of goodwill impairment are prohibited.
Upon disposal of a portion of a CGU, the carrying amount of goodwill relating to the portion of the CGU sold is included in the determination of gains or losses on disposal. The carrying amount is determined based on the relative fair value of the disposed portion to the total CGU.
Other intangibles
Intangible assets represent identifiable non-monetary assets and are acquired either separately or through a business combination, or generated internally. Intangible assets acquired through a business combination are recognized separately from goodwill when they are separable or arise from contractual or other legal rights, and their fair value can be measured reliably. The cost of a separately acquired intangible asset includes its purchase price and directly attributable costs of preparing the asset for its intended use. In respect of internally generated intangible assets, cost includes all directly attributable costs necessary to create, produce, and prepare the asset to be capable of operating in the manner intended by management. Research and development costs that are not eligible for capitalization are expensed. After initial recognition, an intangible asset is carried at its cost less any accumulated amortization and accumulated impairment losses, if any. Intangible assets with a finite-life are amortized on a straight-line basis over their estimated useful lives as follows: computer software – 3 to 10 years; and customer relationships – 10 to 20 years. We do not have any intangible assets with indefinite lives.
Intangible assets are assessed for indicators of impairment at each reporting period. If there is an indication that a finite-life intangible asset may be impaired, an impairment test is performed by comparing the carrying amount of the intangible asset to its recoverable amount. Where it is not possible to estimate the recoverable amount of an individual asset, we estimate the recoverable amount of the CGU to which the asset belongs. If the recoverable amount of the asset (or CGU) is less than its carrying amount, the carrying amount of the intangible asset is written down to its recoverable amount as an impairment loss.
An impairment loss recognized previously is reversed if there is a change in the estimates used to determine the recoverable amount of the asset (or CGU) since the last impairment loss was recognized. If an impairment loss is subsequently reversed, the carrying amount of the asset (or CGU) is revised to the lower of its recoverable amount and the carrying amount that would have been determined (net of amortization) had there been no prior impairment.
Due to the subjective nature of these estimates, significant judgment is required in determining the useful lives
Consolidated Financial Statements Royal Bank of Canada: Annual Report 2013 117
Table of Contents
Note 2 Summary of significant accounting policies, estimates and judgments(continued)
|
and recoverable amounts of our intangible assets, and assessing whether certain events or circumstances constitute objective evidence of impairment. Estimates of the recoverable amounts of our intangible assets rely on certain key inputs, including future cash flows and discount rates. Future cash flows are based on sales projections and allocated costs which are estimated based on forecast results and business initiatives. Discount rates are based on the bank-wide cost of capital, adjusted for asset-specific risks. Changes in these assumptions may impact the amount of impairment loss recognized in Non-interest expense.
Other
Translation of foreign currencies
Monetary assets and liabilities denominated in foreign currencies are translated into Canadian dollars at rates prevailing at the balance sheet date. Foreign exchange gains and losses resulting from the translation and settlement of these items are recognized in Non-interest income in the Consolidated Statements of Income.
Non-monetary assets and liabilities that are measured at historical cost are translated into Canadian dollars at historical rates. Non-monetary financial assets classified as AFS securities, such as equity instruments, that are measured at fair value are translated into Canadian dollars at rates prevailing at the balance sheet date, and the resulting foreign exchange gains and losses are recorded in Other components of equity until the asset is sold or becomes impaired.
Assets and liabilities of our foreign operations with functional currencies other than Canadian dollars are translated into Canadian dollars at rates prevailing at the balance sheet date, and income and expenses of these foreign operations are translated at average rates of exchange for the reporting period.
Unrealized gains or losses arising as a result of the translation of our foreign operations along with the effective portion of related hedges are reported in Other components of equity on an after-tax basis. Upon disposal or partial disposal of a foreign operation, an appropriate portion of the accumulated net translation gains or losses is included in Non-interest income.
Premises and equipment
Premises and equipment includes land, buildings, leasehold improvements, computer equipment, furniture, fixtures and other equipment, and are stated at cost less accumulated depreciation and accumulated impairment losses. Cost comprises the purchase price, any costs directly attributable to bringing the asset to the location and condition necessary for its intended use, and the initial estimate of any disposal costs. Depreciation is recorded principally on a straight-line basis over the estimated useful lives of the assets, which are 25 to 50 years for buildings, 3 to 10 years for computer equipment, and 7 to 10 years for furniture, fixtures and other equipment. The amortization period for leasehold improvements is the lesser of the useful life of the leasehold improvements or the lease term plus the first renewal period, if reasonably assured of renewal, up to a maximum of 10 years. Land is not depreciated. Gains and losses on disposal are recorded in Non-interest income.
Premises and equipment are assessed for indicators of impairment at each reporting period. If there is an indication that an asset may be impaired, an impairment test is performed by comparing the asset’s carrying amount to its recoverable amount. Where it is not possible to estimate the recoverable amount of an individual asset, we estimate the recoverable amount of the CGU to which the asset belongs and test for impairment at the CGU level. An impairment charge is recorded to the extent the recoverable amount of an asset (or CGU), which is the higher of value in use and fair value less costs to sell, is less than its carrying amount. Value in use is the present value of the future cash flows expected to be derived from the asset (or CGU).
After the recognition of impairment, the depreciation charge is adjusted in future periods to reflect the asset’s revised carrying amount. If an impairment is later reversed, the carrying amount of the asset is revised to the lower of the asset’s recoverable amount and the carrying amount that would have been determined (net of depreciation) had there been no prior impairment loss. The depreciation charge in future periods is adjusted to reflect the revised carrying amount.
Provisions
Provisions are liabilities of uncertain timing or amount and are recognized when we have a present legal or constructive obligation as a result of a past event, it is probable that an outflow of resources will be required to settle the obligation, and a reliable estimate can be made of the amount of the obligation. Provisions are measured as the best estimate of the consideration required to settle the present obligation at the reporting date. Significant judgment is required in determining whether a present obligation exists and in estimating the probability, timing and amount of any outflows. We record provisions related to litigation, asset retirement obligations, and the allowance for off-balance sheet and other items. Provisions are recorded under Other liabilities on our Consolidated Balance Sheets.
We are required to estimate the results of ongoing legal proceedings, expenses to be incurred to dispose of capital assets, and credit losses on undrawn commitments and guarantees. The forward-looking nature of these estimates requires us to use a significant amount of judgment in projecting the timing and amount of future cash flows. We record our provisions on the basis of all available information at the end of the reporting period and make adjustments on a quarterly basis to reflect current expectations. Should actual results differ from our expectations, we may incur expenses in excess of the provisions recognized.
When some or all of the economic benefits required to settle a provision are expected to be recovered from a third party, such as an insurer, a separate asset is recognized if it is virtually certain that reimbursement will be received.
Commissions and fees
Portfolio management and other management advisory and service fees are recognized based on the applicable service contracts. Fees related to provision of services including asset management, wealth management, financial planning and custody services that cover a specified service period, are recognized over the period in which the service is provided. Fees such as underwriting fees and brokerage fees that are related to the provision of specific transaction type services are recognized when the service has been completed.
Dividend income
Dividend income is recognized when the right to receive payment is established. This is the ex-dividend date for listed equity securities, and usually the date when shareholders have approved the dividend for unlisted equity securities.
Leasing
A lease is an agreement whereby the lessor conveys to the lessee the right to use an asset for an agreed upon period of time in return for a payment or series of payments. A finance lease is a lease that transfers substantially all the risks and rewards incidental to ownership of the leased asset to the lessee, where title may or may not eventually be transferred. An operating lease is a lease other than a finance lease.
118 Royal Bank of Canada: Annual Report 2013 Consolidated Financial Statements
Table of Contents
Operating leases
When we are the lessee in an operating lease, we record rental payments on a straight-line basis over the lease term in Non-interest expense.
Finance leases
When we are the lessee in a finance lease, we initially record both the leased asset and the related lease obligation in Premises and equipment, Other intangibles and Other liabilities on our Consolidated Balance Sheets at an amount equal to the fair value of the leased asset or, if lower, the present value of the minimum lease payments, each determined at the date of inception of the lease. Initial direct costs directly attributed to the lease are recognized as an asset under the finance lease.
Earnings per share
Earnings per share is computed by dividing Net income available to common shareholders by the weighted average number of common shares outstanding for the period. Net income available to common shareholders is determined after deducting dividend entitlements of preferred shareholders, any gain (loss) on redemption of preferred shares net of related income taxes and the net income attributable to non-controlling interests.
Diluted earnings per share reflects the potential dilution that could occur if additional common shares are assumed to be issued under securities or contracts that entitle their holders to obtain common shares in the future, to the extent such entitlement is not subject to unresolved contingencies. For contracts that may be settled in cash or in common shares at our option, diluted earnings per share is calculated based on the assumption that such contracts will be settled in shares. Income and expenses associated with these types of contracts are excluded from the Net income available to common shareholders, and the additional number of shares that would be issued is included in the diluted earnings per share calculation. These contracts include our convertible Preferred Shares and Trust Capital Securities. For stock options whose exercise price is less than the average market price of our common shares, they are assumed to be exercised and the proceeds are used to repurchase common shares at the average market price for the period. The incremental number of common shares issued under stock options and repurchased from proceeds is included in the calculation of diluted earnings per share.
Share capital
We classify a financial instrument that we issue as a financial asset, financial liability or an equity instrument in accordance with the substance of the contractual arrangement.
Our common shares held by us are classified as treasury shares in equity and accounted for at weighted average cost. Upon the sale of treasury shares, the difference between the sale proceeds and the cost of the shares is recognized in Retained earnings. Financial instruments issued by us are classified as equity instruments when there is no contractual obligation to transfer cash or other financial assets. Incremental costs directly attributable to the issue of equity instruments are included in equity as a deduction from the proceeds, net of tax. Financial instruments that will be settled by a variable number of our common shares upon their conversion by the holders as well as the related accrued distributions are classified as liabilities on our Consolidated Balance Sheets. Dividends and yield distributions on these instruments are classified as Interest expense in our Consolidated Statements of Income.
Future changes in accounting policy and disclosure
We are currently assessing the impact of adopting the following standards on our consolidated financial statements:
IFRS 10Consolidated Financial Statements (IFRS 10)
In May 2011, the IASB issued IFRS 10, which replaces the consolidation requirements in IAS 27Consolidated and Separate Financial Statements (IAS 27) and SIC-12Consolidation – Special Purpose Entities (SIC-12) and provides a single consolidation model applicable to all types of entities. Under IFRS 10, consolidation is based on control. Three conditions must be satisfied to have control over an investee: (i) decision making power over the relevant activities, (ii) exposure to variable returns, and (iii) a link between power and returns. The determination of control is based on the current facts and circumstances and is continuously assessed. IFRS 10 contains a substantial amount of application guidance that expands on new and existing principles related to the determination of control. IFRS 10 is effective for us on November 1, 2013 with modified retrospective application based on entities in place as at the effective date.
Currently, we consolidate SPEs that we control based on an overall assessment of the purpose and design of the entity, our decision making rights, and our exposure to the majority of the risks and rewards of ownership. IFRS 10 places a greater emphasis on decision making power, which is a required condition for control. It removes the bright lines for assessing exposure to risks and rewards, and introduces new considerations related to our role as a principal or an agent in entities over which we have decision making power.
On adoption of IFRS 10, we expect the consolidation status of certain entities to change. We will deconsolidate RBC Capital Trust II as our involvement does not expose us to variable returns. This will result in the reclassification of $900 million from Trust capital securities to Deposits. See Note 20 for further details on our innovative capital instruments. Additionally, certain mutual funds will be consolidated where our exposure to variability indicates that our power as fund manager is in a principal capacity. The effects of these changes are not expected to have a material impact on our consolidated financial statements.
IFRS 11Joint Arrangements (IFRS 11)
In May 2011, the IASB issued IFRS 11 which requires a party to a joint arrangement to determine the type of joint arrangement in which it is involved by assessing its rights and obligations arising from the arrangement. IFRS 11 requires a joint operator to recognize and measure the assets and liabilities in relation to its interest in the arrangement, and a joint venturer to apply equity method of accounting. IFRS 11 is effective for us on November 1, 2013. The adoption of this standard is not expected to have a material impact on our consolidated financial statements.
IFRS 12Disclosure of Interest in Other Entities (IFRS 12)
In May 2011, the IASB issued IFRS 12,Disclosure of Interests in Other Entities(IFRS 12), which provides enhanced guidance on the annual disclosure requirements of a reporting entity’s interests in other entities. The standard requires an entity to disclose information that helps users to evaluate the nature of, and risks associated with a reporting entity’s interests in subsidiaries, consolidated entities, associates, joint arrangements and, in particular, unconsolidated structured entities (off-balance sheet structures), and the effect of those interests on the entity’s financial position, financial performance and cash flows.
IFRS 12 is effective for us on November 1, 2013 with disclosure, including comparative periods, required to be presented in our 2014 consolidated financial statements.
IAS 27Separate Financial Statements (IAS 27) and IAS 28Investments in Associates and Joint Ventures (IAS 28)
As a consequence of the new IFRS standards IFRS 10, IFRS 11 and IFRS 12, in May 2012, the IASB issued amended and retitled IAS 27,Separate Financial StatementsandIAS 28,Investments in Associates and Joint Ventures.These new requirements are effective for us on November 1, 2013. The adoption of these standards is not expected to have a material impact on our consolidated financial statements.
Consolidated Financial Statements Royal Bank of Canada: Annual Report 2013 119
Table of Contents
Note 2 Summary of significant accounting policies, estimates and judgments(continued)
|
IFRS 13Fair Value Measurement (IFRS 13)
In May 2011, the IASB issued IFRS 13Fair Value Measurement which provides a revised definition of fair value and sets out a framework for measuring fair value in a single standard. IFRS 13 also requires more comprehensive disclosure requirements on fair value measurement. The measurement and disclosure requirements of IFRS 13 apply when another standard requires or permits the item to be measured at fair value with limited exceptions. IFRS 13 is effective for us on November 1, 2013 and is required to be applied prospectively from the adoption date. The adoption of this standard is not expected to have a material impact on our consolidated financial statements.
IAS 19Employee Benefits (IAS 19)
In June 2011, the IASB issued amendments to IAS 19 regarding the accounting for pensions and other post-employment benefits. The new requirements are effective for us on November 1, 2013 and will require a restatement of comparative figures. The amendments will alter the accounting for actuarial gains and losses, past service costs, interest expense and return on plan assets. The amended standard eliminates the deferral and amortization of actuarial gains and losses in net income, instead requiring the immediate recognition of actuarial gains and losses in OCI. Past service costs will also be immediately recognized in the period in which a plan amendment occurs. Net interest, calculated by applying the discount rate to the Net defined benefit liability or asset, will replace the Interest cost and Expected return on plan assets components of Defined benefit pension expense. The amendments also introduce a number of enhanced disclosure requirements for defined benefit plans.
The amended standard is expected to impact our Consolidated Balance Sheets, Consolidated Statements of Income and Consolidated Statements of Comprehensive Income for the years ended October 31, 2013 and 2012 by the following amounts:
| As at or for the year ended | ||||||||
| (Millions of Canadian dollars) | October 31 2013 | October 31 2012 | ||||||
Consolidated Balance Sheets | ||||||||
(Decrease) in Prepaid pension benefit cost | $ | (923 | ) | $ | (920 | ) | ||
Increase in Accrued pension and other post-employment benefit expense | 268 | 589 | ||||||
Increase in Other assets – Deferred income tax asset | 316 | 400 | ||||||
(Decrease) in Retained earnings (opening) | (1,108 | ) | (297 | ) | ||||
(Decrease) in Retained earnings (closing) | (876 | ) | (1,108 | ) | ||||
Consolidated Statements of Income and Comprehensive Income | ||||||||
(Decrease) in Net income | (87 | ) | (32 | ) | ||||
Increase (Decrease) in Total other comprehensive income, net of taxes | 319 | (779 | ) | |||||
IFRS 7Disclosure – Offsetting Financial Assets and Financial Liabilities (IFRS 7)
In December 2011, the IASB issued amendments to IFRS 7, requiring extended disclosures to enable users to assess the effect of offsetting arrangements on an entity’s financial position. The amendments require entities to disclose both gross and net amounts associated with master netting agreements and similar arrangements, including the effects of financial collateral, whether or not they are presented net on the balance sheet. The amendments are effective for us on November 1, 2013 and we are required to adopt these disclosures in our 2014 consolidated financial statements.
IAS 32Financial Instruments: Presentation (IAS 32)
In December 2011, the IASB issued amendments to IAS 32 which clarify the existing requirements for offsetting financial assets and financial liabilities. The amendments will be effective for us on November 1, 2014.
IFRSInterpretations Committee Interpretation 21Levies (IFRIC 21)
In May 2013, the IASB issued IFRIC 21 which provides guidance on when to recognize a liability to pay a levy that is accounted for in accordance with IAS 37Provisions, Contingent Liabilities and Contingent Assets. It also addresses the accounting for a liability to pay a levy whose timing and amount is uncertain. IFRIC 21 will be effective for us on November 1, 2014.
IFRS 9Financial Instruments (IFRS 9)
In November 2009, the IASB issued IFRS 9 as part of its plan to replace IAS 39, Financial Instruments: Recognition and Measurement(IAS 39). IFRS 9 requires financial assets, including hybrid contracts, to be measured at either fair value or amortized cost.
In October 2010, the IASB added to IFRS 9 the requirements for classification and measurement of financial liabilities previously included in IAS 39. In November 2013, the IASB introduced a new hedge accounting model, and allowed early adoption of the own credit provisions of IFRS 9. It also removed the mandatory effective date of January 1, 2015 and has not proposed a future effective date.
120 Royal Bank of Canada: Annual Report 2013 Consolidated Financial Statements
Table of Contents
Note 3 Fair value of financial instruments
|
Carrying value and fair value of selected financial instruments
The following tables provide a comparison of the carrying and fair values for each classification of financial instruments.
| As at October 31, 2013 | ||||||||||||||||||||||||||||||||||||
| Carrying value and fair value | Carrying value | Fair value | ||||||||||||||||||||||||||||||||||
| (Millions of Canadian dollars) | Financial instruments classified as at FVTPL | Financial instruments designated as at FVTPL | Available- for-sale instruments measured at fair value | Loans and receivables and non-trading liabilities at amortized cost | Loans and receivables and non-trading liabilities | Held-to-maturity investments measured at amortized cost | Total carrying amount | Total fair value | ||||||||||||||||||||||||||||
Financial assets | ||||||||||||||||||||||||||||||||||||
Securities | ||||||||||||||||||||||||||||||||||||
Trading | $ | 135,346 | $ | 8,677 | $ | – | $ | – | $ | – | $ | – | $ | 144,023 | $ | 144,023 | ||||||||||||||||||||
Available-for-sale | – | – | 38,294 | – | – | 401 | 38,695 | 38,695 | ||||||||||||||||||||||||||||
Total securities | 135,346 | 8,677 | 38,294 | – | – | 401 | 182,718 | 182,718 | ||||||||||||||||||||||||||||
Assets purchased under reverse repurchase agreements and securities borrowed | – | 82,023 | – | 35,494 | 35,494 | – | 117,517 | 117,517 | ||||||||||||||||||||||||||||
Loans | ||||||||||||||||||||||||||||||||||||
Retail | – | – | – | 320,498 | 317,613 | – | 320,498 | 317,613 | ||||||||||||||||||||||||||||
Wholesale | 614 | 964 | – | 86,590 | 85,929 | – | 88,168 | 87,507 | ||||||||||||||||||||||||||||
Total loans | 614 | 964 | – | 407,088 | 403,542 | – | 408,666 | 405,120 | ||||||||||||||||||||||||||||
Other | ||||||||||||||||||||||||||||||||||||
Derivatives | 74,822 | – | – | – | – | 74,822 | 74,822 | |||||||||||||||||||||||||||||
Other assets | – | 983 | – | 29,147 | 29,147 | – | 30,130 | 30,130 | ||||||||||||||||||||||||||||
Financial liabilities | ||||||||||||||||||||||||||||||||||||
Deposits | ||||||||||||||||||||||||||||||||||||
Personal | $ | – | $ | 9,069 | $ | 185,228 | $ | 185,412 | $ | 194,297 | $ | 194,481 | ||||||||||||||||||||||||
Business and government (1) | – | 56,037 | 294,603 | 294,424 | 350,640 | 350,461 | ||||||||||||||||||||||||||||||
Bank (2) | – | 1,932 | 11,611 | 11,611 | 13,543 | 13,543 | ||||||||||||||||||||||||||||||
Total deposits | – | 67,038 | 491,442 | 491,447 | 558,480 | 558,485 | ||||||||||||||||||||||||||||||
Other | ||||||||||||||||||||||||||||||||||||
Obligations related to securities sold short | 47,128 | – | – | – | 47,128 | 47,128 | ||||||||||||||||||||||||||||||
Obligations related to assets sold under repurchase agreements and securities loaned | – | 53,948 | 6,468 | 6,468 | 60,416 | 60,416 | ||||||||||||||||||||||||||||||
Derivatives | 76,745 | – | – | – | 76,745 | 76,745 | ||||||||||||||||||||||||||||||
Other liabilities | (2 | ) | 42 | 38,402 | 38,402 | 38,442 | 38,442 | |||||||||||||||||||||||||||||
Subordinated debentures | – | 109 | 7,334 | 7,285 | 7,443 | 7,394 | ||||||||||||||||||||||||||||||
Trust capital securities | – | – | 900 | 906 | 900 | 906 | ||||||||||||||||||||||||||||||
Consolidated Financial Statements Royal Bank of Canada: Annual Report 2013 121
Table of Contents
Note 3 Fair value of financial instruments(continued)
|
| As at October 31, 2012 | ||||||||||||||||||||||||||||||||||||
| Carrying value and fair value | Carrying value | Fair value | ||||||||||||||||||||||||||||||||||
| (Millions of Canadian dollars) | Financial instruments classified as at FVTPL | Financial instruments designated as at FVTPL | Available- for-sale instruments measured at fair value | Loans and and non-trading | Loans and receivables and non-trading liabilities | Held-to-maturity investments measured at amortized cost | Total carrying amount | Total fair value | ||||||||||||||||||||||||||||
Financial assets | ||||||||||||||||||||||||||||||||||||
Securities | ||||||||||||||||||||||||||||||||||||
Trading | $ | 111,114 | $ | 9,669 | $ | – | $ | – | $ | – | $ | – | $ | 120,783 | $ | 120,783 | ||||||||||||||||||||
Available-for-sale | – | – | 40,320 | – | – | 508 | 40,828 | 40,828 | ||||||||||||||||||||||||||||
Total securities | 111,114 | 9,669 | 40,320 | – | – | 508 | 161,611 | 161,611 | ||||||||||||||||||||||||||||
Assets purchased under reverse repurchase agreements and securities borrowed | – | 86,918 | – | 25,339 | 25,339 | – | 112,257 | 112,257 | ||||||||||||||||||||||||||||
Loans | ||||||||||||||||||||||||||||||||||||
Retail | – | – | – | 300,043 | 297,490 | – | 300,043 | 297,490 | ||||||||||||||||||||||||||||
Wholesale | – | 1,232 | – | 76,969 | 76,506 | – | 78,201 | 77,738 | ||||||||||||||||||||||||||||
Total loans | – | 1,232 | – | 377,012 | 373,996 | – | 378,244 | 375,228 | ||||||||||||||||||||||||||||
Other | ||||||||||||||||||||||||||||||||||||
Derivatives | 91,293 | – | – | – | – | – | 91,293 | 91,293 | ||||||||||||||||||||||||||||
Other assets | – | 705 | – | 36,487 | 36,487 | – | 37,192 | 37,192 | ||||||||||||||||||||||||||||
Financial liabilities | ||||||||||||||||||||||||||||||||||||
Deposits | ||||||||||||||||||||||||||||||||||||
Personal | $ | – | $ | 7,167 | $ | 172,335 | $ | 172,625 | $ | 179,502 | $ | 179,792 | ||||||||||||||||||||||||
Business and government (1) | – | 49,336 | 263,546 | 263,909 | 312,882 | 313,245 | ||||||||||||||||||||||||||||||
Bank (2) | – | 2,524 | 13,311 | 13,311 | 15,835 | 15,835 | ||||||||||||||||||||||||||||||
Total deposits | – | 59,027 | 449,192 | 449,845 | 508,219 | 508,872 | ||||||||||||||||||||||||||||||
Other | ||||||||||||||||||||||||||||||||||||
Obligations related to securities sold short | 40,756 | – | – | – | 40,756 | 40,756 | ||||||||||||||||||||||||||||||
Obligations related to assets sold under repurchase agreements and securities loaned | – | 58,709 | 5,323 | 5,323 | 64,032 | 64,032 | ||||||||||||||||||||||||||||||
Derivatives | 96,761 | – | – | – | 96,761 | 96,761 | ||||||||||||||||||||||||||||||
Other liabilities | 101 | 29 | 41,352 | 41,352 | 41,482 | 41,482 | ||||||||||||||||||||||||||||||
Subordinated debentures | – | 122 | 7,493 | 7,405 | 7,615 | 7,527 | ||||||||||||||||||||||||||||||
Trust capital securities | – | – | 900 | 941 | 900 | 941 | ||||||||||||||||||||||||||||||
| (1) | Business and government includes deposits from regulated deposit-taking institutions other than regulated banks. |
| (2) | Bank refers to regulated banks. |
The following tables present information on loans and receivables designated as at FVTPL, the maximum exposure to credit risk, the extent to which the risk is mitigated by credit derivatives and similar instruments, and changes in the fair value of these assets. We measure the change in the fair value of loans and receivables designated as at FVTPL due to changes in credit risk as the difference between the total change in the fair value of the instrument during the period and the change in fair value calculated using the appropriate risk-free yield curves.
| Loans and receivables designated as at fair value through profit or loss | ||||||||||||||||||||||||||||
| As at October 31, 2013 | ||||||||||||||||||||||||||||
| (Millions of Canadian dollars) | Carrying amount of loans and receivables designated as at FVTPL | Maximum exposure to credit risk | Extent to which credit derivatives or similar instruments mitigate credit risk | Change in fair value for the year attributable to changes in credit risk | Cumulative change in fair value since initial recognition attributable to changes in credit risk(1) | Change in of credit | Cumulative in fair value of credit or similar | |||||||||||||||||||||
Interest-bearing deposits with banks | $ | 2,424 | $ | 2,424 | $ | – | $ | – | $ | – | $ | – | $ | – | ||||||||||||||
Assets purchased under reverse repurchase agreements and securities borrowed | 82,023 | 82,023 | – | – | – | – | – | |||||||||||||||||||||
Loans – Wholesale | 964 | 964 | 224 | 3 | 1 | – | – | |||||||||||||||||||||
Other Assets | 463 | 463 | – | – | – | – | – | |||||||||||||||||||||
Total | $ | 85,874 | $ | 85,874 | $ | 224 | $ | 3 | $ | 1 | $ | – | $ | – | ||||||||||||||
122 Royal Bank of Canada: Annual Report 2013 Consolidated Financial Statements
Table of Contents
| As at October 31, 2012 | ||||||||||||||||||||||||||||
| (Millions of Canadian dollars) | Carrying amount of loans and receivables designated as at FVTPL | Maximum exposure to credit risk | Extent to which credit derivatives or similar instruments mitigate credit risk | Change in fair value for the year attributable to changes in credit risk | Cumulative change in fair value since initial recognition attributable to changes in credit risk (1) | Change in fair value of credit derivatives or similar instruments for the year | Cumulative change in fair value of credit derivatives or similar instruments (1) | |||||||||||||||||||||
Interest-bearing deposits with banks | $ | 120 | $ | 120 | $ | – | $ | – | $ | – | $ | – | $ | – | ||||||||||||||
Assets purchased under reverse repurchase agreements and securities borrowed | 86,918 | 86,918 | – | – | – | – | – | |||||||||||||||||||||
Loans – Wholesale | 1,232 | 1,232 | 284 | 3 | (12 | ) | (2 | ) | 1 | |||||||||||||||||||
Other assets | 311 | 311 | – | – | – | – | – | |||||||||||||||||||||
Total | $ | 88,581 | $ | 88,581 | $ | 284 | $ | 3 | $ | (12 | ) | $ | (2 | ) | $ | 1 | ||||||||||||
| (1) | The cumulative change is measured from the later of November 1, 2010, or the initial recognition of the credit derivative or similar instruments. |
The following tables present the changes in the fair value of our financial liabilities designated as at FVTPL as well as their contractual maturity and carrying amounts.
| Liabilities designated as at fair value through profit or loss | ||||||||||||||||||||
| As at October 31, 2013 | ||||||||||||||||||||
| (Millions of Canadian dollars) | Contractual maturity amount | Carrying value | Difference between carrying value and contractual maturity amount | Changes in fair year attributable | Cumulative change in fair value attributable to changes in RBC credit spread(1) | |||||||||||||||
Term deposits | ||||||||||||||||||||
Personal | $ | 8,963 | $ | 9,069 | $ | 106 | $ | (20 | ) | $ | (33 | ) | ||||||||
Business and government (2) | 56,216 | 56,037 | (179 | ) | 36 | 24 | ||||||||||||||
Bank (3) | 1,932 | 1,932 | – | – | – | |||||||||||||||
Total term deposits | 67,111 | 67,038 | (73 | ) | 16 | (9 | ) | |||||||||||||
Obligations related to assets sold under repurchase agreements and securities loaned | 53,952 | 53,948 | (4 | ) | – | – | ||||||||||||||
Other liabilities | 42 | 42 | – | – | – | |||||||||||||||
Subordinated debentures | 106 | 109 | 3 | 6 | 3 | |||||||||||||||
Total | $ | 121,211 | $ | 121,137 | $ | (74 | ) | $ | 22 | $ | (6 | ) | ||||||||
| As at October 31, 2012 | ||||||||||||||||||||
| (Millions of Canadian dollars) | Contractual maturity amount | Carrying value | Difference between carrying value and contractual maturity amount | Changes in fair value for the | Cumulative change in fair value attributable to changes in RBC credit spread (1) | |||||||||||||||
Term deposits | ||||||||||||||||||||
Personal | $ | 7,152 | $ | 7,167 | $ | 15 | $ | 1 | $ | (13 | ) | |||||||||
Business and government (2) | 49,264 | 49,336 | 72 | 33 | (12 | ) | ||||||||||||||
Bank (3) | 2,524 | 2,524 | – | – | – | |||||||||||||||
Total term deposits | 58,940 | 59,027 | 87 | 34 | (25 | ) | ||||||||||||||
Obligations related to assets sold under repurchase agreements and securities loaned | 58,710 | 58,709 | (1 | ) | – | – | ||||||||||||||
Other liabilities | 29 | 29 | – | – | – | |||||||||||||||
Subordinated debentures | 125 | 122 | (3 | ) | 4 | (3 | ) | |||||||||||||
Total | $ | 117,804 | $ | 117,887 | $ | 83 | $ | 38 | $ | (28 | ) | |||||||||
| (1) | The cumulative change is measured from the later of November 1, 2010, or the initial recognition of the liabilities designated as at FVTPL. |
| (2) | Business and government includes deposits from regulated deposit-taking institutions other than regulated banks. |
| (3) | Bank refers to regulated banks. |
Fair value of assets and liabilities classified using the fair value hierarchy
The following tables present the financial instruments measured at fair value classified by the fair value hierarchy set out in IFRS 7 Financial Instruments: Disclosures(IFRS 7). IFRS 7 requires that all financial instruments measured at fair value be categorized into one of three hierarchy levels, as described below, for disclosure purposes. Each level is based on the transparency of the inputs used to measure the fair values of assets and liabilities:
| • | Level 1 – inputs are unadjusted quoted prices of identical instruments in active markets. |
| • | Level 2 – inputs other than quoted prices included in Level 1 that are observable for the asset or liability, either directly or indirectly. |
| • | Level 3 – one or more significant inputs used in a valuation technique are unobservable in determining fair values of the instruments. |
Consolidated Financial Statements Royal Bank of Canada: Annual Report 2013 123
Table of Contents
Note 3 Fair value of financial instruments(continued)
|
Determination of fair value and the resulting hierarchy requires the use of observable market data whenever available. The classification of a financial instrument in the hierarchy is based upon the lowest level of input that is significant to the measurement of fair value.
| As at | ||||||||||||||||||||||||||||||||||||||||||||||||||
| October 31, 2013 | October 31, 2012 | |||||||||||||||||||||||||||||||||||||||||||||||||
Fair value measurements using(1) | Total value | Netting adjustments | Assets/ at fair | Fair value measurements using (1) | Total value | Netting adjustments | Assets/ at fair | |||||||||||||||||||||||||||||||||||||||||||
(Millions of Canadian dollars) | Level 1 | Level 2 | Level 3 | Level 1 | Level 2 | Level 3 | ||||||||||||||||||||||||||||||||||||||||||||
Financial assets | ||||||||||||||||||||||||||||||||||||||||||||||||||
Interest bearing deposits with banks | $ | – | $ | 2,424 | $ | – | $ | 2,424 | $ | $ | 2,424 | $ | – | $ | 120 | $ | – | $ | 120 | $ | $ | 120 | ||||||||||||||||||||||||||||
Securities | ||||||||||||||||||||||||||||||||||||||||||||||||||
Trading | ||||||||||||||||||||||||||||||||||||||||||||||||||
Canadian government debt (2) | ||||||||||||||||||||||||||||||||||||||||||||||||||
Federal | 11,978 | 6,663 | – | 18,641 | 18,641 | 8,158 | 7,234 | – | 15,392 | 15,392 | ||||||||||||||||||||||||||||||||||||||||
Provincial and municipal | – | 12,108 | – | 12,108 | 12,108 | – | 8,465 | – | 8,465 | 8,465 | ||||||||||||||||||||||||||||||||||||||||
U.S. state, municipal and agencies debt (2) | 5,480 | 23,980 | 22 | 29,482 | 29,482 | 2,287 | 18,364 | 99 | 20,750 | 20,750 | ||||||||||||||||||||||||||||||||||||||||
Other OECD government debt | 2,815 | 6,671 | 370 | 9,856 | 9,856 | 3,781 | 7,754 | 375 | 11,910 | 11,910 | ||||||||||||||||||||||||||||||||||||||||
Mortgage-backed securities (2) | – | 802 | 28 | 830 | 830 | – | 693 | 55 | 748 | 748 | ||||||||||||||||||||||||||||||||||||||||
Asset-backed securities | – | |||||||||||||||||||||||||||||||||||||||||||||||||
CDOs (4) | – | – | 31 | 31 | 31 | – | – | 59 | 59 | 59 | ||||||||||||||||||||||||||||||||||||||||
Non-CDO securities | – | 1,084 | 260 | 1,344 | 1,344 | – | 700 | 23 | 723 | 723 | ||||||||||||||||||||||||||||||||||||||||
Corporate debt and other debt | – | 26,127 | 415 | 26,542 | 26,542 | �� | 62 | 21,972 | 397 | 22,431 | 22,431 | |||||||||||||||||||||||||||||||||||||||
Equities | 41,874 | 3,132 | 183 | 45,189 | 45,189 | 37,924 | 2,079 | 302 | 40,305 | 40,305 | ||||||||||||||||||||||||||||||||||||||||
| 62,147 | 80,567 | 1,309 | 144,023 | 144,023 | 52,212 | 67,261 | 1,310 | 120,783 | 120,783 | |||||||||||||||||||||||||||||||||||||||||
Available-for-sale(5) | ||||||||||||||||||||||||||||||||||||||||||||||||||
Canadian government debt (2) | ||||||||||||||||||||||||||||||||||||||||||||||||||
Federal | 153 | 9,669 | – | 9,822 | 9,822 | 367 | 10,914 | – | 11,281 | 11,281 | ||||||||||||||||||||||||||||||||||||||||
Provincial and municipal | – | 667 | – | 667 | 667 | – | 1,785 | – | 1,785 | 1,785 | ||||||||||||||||||||||||||||||||||||||||
U.S. state, municipal and agencies debt (2) | 26 | 4,238 | 2,014 | 6,278 | 6,278 | 23 | 3,856 | 1,906 | 5,785 | 5,785 | ||||||||||||||||||||||||||||||||||||||||
Other OECD government debt (3) | 5,463 | 5,319 | – | 10,782 | 10,782 | 6,081 | 3,744 | – | 9,825 | 9,825 | ||||||||||||||||||||||||||||||||||||||||
Mortgage-backed securities (2) | – | 139 | – | 139 | 139 | – | 263 | – | 263 | 263 | ||||||||||||||||||||||||||||||||||||||||
Asset-backed securities | ||||||||||||||||||||||||||||||||||||||||||||||||||
CDOs | – | 1,294 | 103 | 1,397 | 1,397 | – | – | 1,996 | 1,996 | 1,996 | ||||||||||||||||||||||||||||||||||||||||
Non-CDO securities | – | 283 | 180 | 463 | 463 | – | 180 | 645 | 825 | 825 | ||||||||||||||||||||||||||||||||||||||||
Corporate debt and other debt | – | 5,232 | 1,673 | 6,905 | 6,905 | – | 5,062 | 1,446 | 6,508 | 6,508 | ||||||||||||||||||||||||||||||||||||||||
Equities | 137 | 585 | 969 | 1,691 | 1,691 | 266 | 603 | 948 | 1,817 | 1,817 | ||||||||||||||||||||||||||||||||||||||||
Loan substitute securities | 103 | 24 | – | 127 | 127 | 192 | 25 | – | 217 | 217 | ||||||||||||||||||||||||||||||||||||||||
| 5,882 | 27,450 | 4,939 | 38,271 | 38,271 | 6,929 | 26,432 | 6,941 | 40,302 | 40,302 | |||||||||||||||||||||||||||||||||||||||||
Asset purchased under reverse repurchase agreements and securities borrowed | – | 82,023 | – | 82,023 | 82,023 | – | 86,918 | – | 86,918 | 86,918 | ||||||||||||||||||||||||||||||||||||||||
Loans | – | 1,164 | 414 | 1,578 | 1,578 | – | 829 | 403 | 1,232 | 1,232 | ||||||||||||||||||||||||||||||||||||||||
Other | ||||||||||||||||||||||||||||||||||||||||||||||||||
Derivatives | ||||||||||||||||||||||||||||||||||||||||||||||||||
Interest rate contracts | 22 | 78,517 | 333 | 78,872 | 78,872 | 5 | 99,062 | 842 | 99,909 | 99,909 | ||||||||||||||||||||||||||||||||||||||||
Foreign exchange contracts | – | 20,709 | 76 | 20,785 | 20,785 | – | 19,126 | 118 | 19,244 | 19,244 | ||||||||||||||||||||||||||||||||||||||||
Credit derivatives | – | 193 | 32 | 225 | 225 | – | 167 | 125 | 292 | 292 | ||||||||||||||||||||||||||||||||||||||||
Other contracts | 2,558 | 3,219 | 858 | 6,635 | 6,635 | 1,699 | 2,296 | 448 | 4,443 | 4,443 | ||||||||||||||||||||||||||||||||||||||||
Valuation adjustments determined on a pooled basis | (2 | ) | (398 | ) | (105 | ) | (505 | ) | (505 | ) | (23 | ) | (321 | ) | (282 | ) | (626 | ) | (626 | ) | ||||||||||||||||||||||||||||||
Total gross derivatives | 2,578 | 102,240 | 1,194 | 106,012 | 106,012 | 1,681 | 120,330 | 1,251 | 123,262 | 123,262 | ||||||||||||||||||||||||||||||||||||||||
Netting adjustments | (31,190 | ) | (31,190 | ) | (31,969 | ) | (31,969 | ) | ||||||||||||||||||||||||||||||||||||||||||
Total derivatives | 74,822 | 91,293 | ||||||||||||||||||||||||||||||||||||||||||||||||
Other assets | 520 | 452 | 11 | 983 | 983 | 394 | 297 | 14 | 705 | 705 | ||||||||||||||||||||||||||||||||||||||||
| $ | 71,127 | $ | 296,320 | $ | 7,867 | $ | 375,314 | $ | (31,190 | ) | $ | 344,124 | $ | 61,216 | $ | 302,187 | $ | 9,919 | $ | 373,322 | $ | (31,969 | ) | $ | 341,353 | |||||||||||||||||||||||||
Financial Liabilities | ||||||||||||||||||||||||||||||||||||||||||||||||||
Deposits | ||||||||||||||||||||||||||||||||||||||||||||||||||
Personal | $ | – | $ | 8,033 | $ | 1,036 | $ | 9,069 | $ | $ | 9,069 | $ | – | $ | 327 | $ | 6,840 | $ | 7,167 | $ | $ | 7,167 | ||||||||||||||||||||||||||||
Business and government | – | 52,104 | 3,933 | 56,037 | 56,037 | – | 46,817 | 2,519 | 49,336 | 49,336 | ||||||||||||||||||||||||||||||||||||||||
Bank | – | 1,932 | – | 1,932 | 1,932 | – | 2,524 | – | 2,524 | 2,524 | ||||||||||||||||||||||||||||||||||||||||
Other | ||||||||||||||||||||||||||||||||||||||||||||||||||
Obligations related to securities sold short | 31,832 | 15,280 | 16 | 47,128 | 47,128 | 27,365 | 13,383 | 8 | 40,756 | 40,756 | ||||||||||||||||||||||||||||||||||||||||
Obligations related to assets sold under repurchase agreements and securities loaned | – | 53,948 | – | 53,948 | 53,948 | – | 58,709 | – | 58,709 | 58,709 | ||||||||||||||||||||||||||||||||||||||||
Derivatives | ||||||||||||||||||||||||||||||||||||||||||||||||||
Interest rate contracts | 9 | 74,113 | 791 | 74,913 | 74,913 | 2 | 91,180 | 1,329 | 92,511 | 92,511 | ||||||||||||||||||||||||||||||||||||||||
Foreign exchange contracts | – | 22,715 | 193 | 22,908 | 22,908 | – | 28,016 | 316 | 28,332 | 28,332 | ||||||||||||||||||||||||||||||||||||||||
Credit derivatives | – | 295 | 37 | 332 | 332 | – | 188 | 147 | 335 | 335 | ||||||||||||||||||||||||||||||||||||||||
Other contracts | 2,379 | 5,979 | 1,727 | 10,085 | 10,085 | 1,370 | 4,501 | 1,500 | 7,371 | 7,371 | ||||||||||||||||||||||||||||||||||||||||
Total gross derivatives | 2,388 | 103,102 | 2,748 | 108,238 | 108,238 | 1,372 | 123,885 | 3,292 | 128,549 | 128,549 | ||||||||||||||||||||||||||||||||||||||||
Netting adjustments | (31,493 | ) | (31,493 | ) | (31,788 | ) | (31,788 | ) | ||||||||||||||||||||||||||||||||||||||||||
Total derivatives | 76,745 | 96,761 | ||||||||||||||||||||||||||||||||||||||||||||||||
Other liabilities | – | 37 | 3 | 40 | 40 | – | 29 | 101 | 130 | 130 | ||||||||||||||||||||||||||||||||||||||||
Subordinated debentures | – | – | 109 | 109 | 109 | – | – | 122 | 122 | 122 | ||||||||||||||||||||||||||||||||||||||||
| $ | 34,220 | $ | 234,436 | $ | 7,845 | $ | 276,501 | $ | (31,493 | ) | $ | 245,008 | $ | 28,737 | $ | 245,674 | $ | 12,882 | $ | 287,293 | $ | (31,788 | ) | $ | 255,505 | |||||||||||||||||||||||||
| (1) | Transfer between Level 1 and Level 2 is dependent on whether fair value is obtained on the basis of quoted market prices in active markets and is assumed to occur at the end of the period. During the year ended October 31, 2013, $1,105 million of certain government bonds reported in Trading U.S. state, municipal and agencies debt, and $1,308 million included in Obligations related to securities sold short were transferred from Level 1 to the corresponding Level 2 balances, and certain government bonds of $122 million reported in Trading Canadian government debt – Federal were transferred from Level 2 to the corresponding Level 1 balances. During the year ended October 31, 2012, certain government bonds of $496 million reported in Trading and AFS Canadian government debt – Federal and U.S. state, municipal and agencies debt, and $1,654 million included in Obligations related to securities sold short were transferred from Level 2 to the corresponding Level 1 balances. In addition, certain government bonds of $1,545 million reported in Trading and AFS Canadian government debt – Federal and U.S. state, municipal and agencies debt, and $253 million included in Obligations related to securities sold short were transferred from Level 1 to the corresponding Level 2 balances. |
| (2) | As at October 31, 2013, residential and commercial mortgage-backed securities (MBS) included in Trading securities were $4,934 million and $93 million (October 31, 2012 – $7,761 million and $78 million), respectively, and in AFS securities, $3,512 million and $35 million (October 31, 2012 – $3,523 and $42 million), respectively. |
| (3) | OECD stands for Organisation for Economic Co-operation and Development. |
| (4) | CDOs stand for Collateralized Debt Obligations. |
| (5) | Excludes $23 million and $401 million of AFS and held-to-maturity securities (October 31, 2012 – $18 million and $508 million), respectively, that are carried at cost. |
124 Royal Bank of Canada: Annual Report 2013 Consolidated Financial Statements
Table of Contents
Changes in fair value measurement for instruments categorized in Level 3
The following tables present the changes in fair value measurements for instruments included in Level 3 of the fair value hierarchy. In the tables below, transfers in and out of Level 3 are assumed to occur at the end of the period. For an asset or a liability that transfers into Level 3 during the period, the entire change in fair value for the period is excluded from the Total realized/unrealized gains (losses) included in earnings column of the reconciliation, whereas for transfers out of Level 3 during the period, the entire change in fair value for the period is included in the same column of the reconciliation.
| For the year ended October 31, 2013 | ||||||||||||||||||||||||||||||||||||
| (Millions of Canadian dollars) | Fair value November 1, 2012 | Total realized/ unrealized gains (losses) included in earnings | Total unrealized gains (losses) included in other comprehensive income(1) | Purchases of assets/ issuances of liabilities | Sales of other(2) | Transfers into Level 3 | Transfers out of Level 3 | Fair value October 31, 2013 | Changes in still held | |||||||||||||||||||||||||||
Assets | ||||||||||||||||||||||||||||||||||||
Securities | ||||||||||||||||||||||||||||||||||||
Trading | ||||||||||||||||||||||||||||||||||||
Canadian government debt | ||||||||||||||||||||||||||||||||||||
Provincial and municipal | $ | – | $ | – | $ | – | $ | – | $ | – | $ | – | $ | – | $ | – | $ | – | ||||||||||||||||||
U.S. state, municipal and agencies debt | 99 | 2 | 2 | 414 | (525 | ) | 34 | (4 | ) | 22 | – | |||||||||||||||||||||||||
Other OECD government debt | 375 | (1 | ) | 6 | 633 | (237 | ) | – | (406 | ) | 370 | – | ||||||||||||||||||||||||
Mortgage-backed securities | 55 | 7 | 2 | 50 | (64 | ) | 21 | (43 | ) | 28 | 1 | |||||||||||||||||||||||||
Asset-backed securities | ||||||||||||||||||||||||||||||||||||
CDOs | 59 | 10 | 1 | 16 | (48 | ) | – | (7 | ) | 31 | 8 | |||||||||||||||||||||||||
Non-CDO securities | 23 | (2 | ) | 7 | 4,608 | (4,376 | ) | 70 | (70 | ) | 260 | (2 | ) | |||||||||||||||||||||||
Corporate debt and other debt | 397 | 19 | 10 | 634 | (655 | ) | 96 | (86 | ) | 415 | 1 | |||||||||||||||||||||||||
Equities | 302 | (16 | ) | 8 | 107 | (224 | ) | 7 | (1 | ) | 183 | (29 | ) | |||||||||||||||||||||||
| 1,310 | 19 | 36 | 6,462 | (6,129 | ) | 228 | (617 | ) | 1,309 | (21 | ) | |||||||||||||||||||||||||
Available-for-sale | ||||||||||||||||||||||||||||||||||||
U.S. state, municipal and agencies debt | 1,906 | – | 88 | 417 | (406 | ) | 9 | – | 2,014 | n.a. | ||||||||||||||||||||||||||
Asset-backed securities | ||||||||||||||||||||||||||||||||||||
CDOs | 1,996 | – | 67 | – | (542 | ) | 12 | (1,430 | ) | 103 | n.a. | |||||||||||||||||||||||||
Non-CDO securities | 645 | 4 | 36 | – | (505 | ) | – | – | 180 | n.a. | ||||||||||||||||||||||||||
Corporate debt and other debt | 1,446 | (12 | ) | 80 | 1,281 | (1,172 | ) | 50 | – | 1,673 | n.a. | |||||||||||||||||||||||||
Equities | 948 | 65 | 51 | 27 | (122 | ) | – | – | 969 | n.a. | ||||||||||||||||||||||||||
| 6,941 | 57 | 322 | 1,725 | (2,747 | ) | 71 | (1,430 | ) | 4,939 | n.a. | ||||||||||||||||||||||||||
Loans – Wholesale | 403 | 8 | 22 | 288 | (307 | ) | – | – | 414 | – | ||||||||||||||||||||||||||
Other | ||||||||||||||||||||||||||||||||||||
Derivatives, net of derivative related liabilities (3) | (2,041 | ) | 62 | (15 | ) | 198 | 86 | (72 | ) | 228 | (1,554 | ) | 280 | |||||||||||||||||||||||
Other assets | 14 | (3 | ) | – | – | – | – | – | 11 | 1 | ||||||||||||||||||||||||||
| $ | 6,627 | $ | 143 | $ | 365 | $ | 8,673 | $ | (9,097 | ) | $ | 227 | $ | (1,819 | ) | $ | 5,119 | $ | 260 | |||||||||||||||||
Liabilities | ||||||||||||||||||||||||||||||||||||
Deposits | ||||||||||||||||||||||||||||||||||||
Personal | $ | (6,840 | ) | $ | (737 | ) | $ | (102 | ) | $ | (6,131 | ) | $ | 7,213 | $ | (64 | ) | $ | 5,625 | $ | (1,036 | ) | $ | (30 | ) | |||||||||||
Business and government | (2,519 | ) | (11 | ) | (95 | ) | (1,738 | ) | 165 | – | 265 | (3,933 | ) | (120 | ) | |||||||||||||||||||||
Other | ||||||||||||||||||||||||||||||||||||
Obligations related to securities sold short | (8 | ) | 10 | – | (96 | ) | 79 | (8 | ) | 7 | (16 | ) | – | |||||||||||||||||||||||
Other liabilities | (101 | ) | 98 | (3 | ) | – | 3 | – | – | (3 | ) | 98 | ||||||||||||||||||||||||
Subordinated debentures | (122 | ) | (6 | ) | 19 | – | – | – | – | (109 | ) | (6 | ) | |||||||||||||||||||||||
| $ | (9,590 | ) | $ | (646 | ) | $ | (181 | ) | $ | (7,965 | ) | $ | 7,460 | $ | (72 | ) | $ | 5,897 | $ | (5,097 | ) | $ | (58 | ) | ||||||||||||
Consolidated Financial Statements Royal Bank of Canada: Annual Report 2013 125
Table of Contents
Note 3 Fair value of financial instruments(continued)
|
| For the year ended October 31, 2012 | ||||||||||||||||||||||||||||||||||||
| (Millions of Canadian dollars) | Fair value November 1, 2011 | Total earnings | Total unrealized gains (losses) included in other comprehensive income (1) | Purchases liabilities | Sales of other (2) | Transfers into Level 3 | Transfers out of Level 3 | Fair value October 31, 2012 | Changes in (losses) included in earnings for assets and liabilities for the year ended October 31, | |||||||||||||||||||||||||||
Assets | ||||||||||||||||||||||||||||||||||||
Securities | ||||||||||||||||||||||||||||||||||||
Trading | ||||||||||||||||||||||||||||||||||||
Canadian government debt | ||||||||||||||||||||||||||||||||||||
Provincial and municipal | $ | 4 | $ | – | $ | – | $ | 1 | $ | (3 | ) | $ | 1 | $ | (3 | ) | $ | – | $ | – | ||||||||||||||||
U.S. state, municipal and agencies debt | 86 | (6 | ) | – | 140 | (150 | ) | 84 | (55 | ) | 99 | – | ||||||||||||||||||||||||
Other OECD government debt | 47 | – | – | 85 | 290 | – | (47 | ) | 375 | – | ||||||||||||||||||||||||||
Mortgage-backed securities | 45 | – | (1 | ) | 38 | (27 | ) | – | – | 55 | – | |||||||||||||||||||||||||
Asset-backed securities | ||||||||||||||||||||||||||||||||||||
CDOs | 371 | 5 | 1 | – | (318 | ) | – | – | 59 | 3 | ||||||||||||||||||||||||||
Non-CDO securities | 138 | – | – | 2,421 | (2,553 | ) | 46 | (29 | ) | 23 | (2 | ) | ||||||||||||||||||||||||
Corporate debt and other debt | 720 | 34 | – | 704 | (1,069 | ) | 99 | (91 | ) | 397 | 10 | |||||||||||||||||||||||||
Equities | 352 | (30 | ) | (2 | ) | 47 | (106 | ) | 53 | (12 | ) | 302 | 8 | |||||||||||||||||||||||
| 1,763 | 3 | (2 | ) | 3,436 | (3,936 | ) | 283 | (237 | ) | 1,310 | 19 | |||||||||||||||||||||||||
Available-for-sale | ||||||||||||||||||||||||||||||||||||
U.S. state, municipal and agencies debt | 2,691 | 4 | 10 | 497 | (940 | ) | – | (356 | ) | 1,906 | n.a. | |||||||||||||||||||||||||
Mortgage-backed securities | 184 | (1 | ) | 11 | – | (38 | ) | – | (156 | ) | – | n.a. | ||||||||||||||||||||||||
Asset-backed securities | – | – | ||||||||||||||||||||||||||||||||||
CDOs | 1,932 | 6 | 66 | – | (8 | ) | – | – | 1,996 | n.a. | ||||||||||||||||||||||||||
Non-CDO securities | 673 | (4 | ) | 21 | 23 | (68 | ) | – | – | 645 | n.a. | |||||||||||||||||||||||||
Corporate debt and other debt | 1,478 | – | – | 633 | (665 | ) | – | – | 1,446 | n.a. | ||||||||||||||||||||||||||
Equities | 863 | 10 | 73 | 97 | (118 | ) | 69 | (46 | ) | 948 | n.a. | |||||||||||||||||||||||||
| 7,821 | 15 | 181 | 1,250 | (1,837 | ) | 69 | (558 | ) | 6,941 | n.a. | ||||||||||||||||||||||||||
Loans – Wholesale | 563 | (34 | ) | – | 271 | (397 | ) | – | – | 403 | 6 | |||||||||||||||||||||||||
Other | ||||||||||||||||||||||||||||||||||||
Derivatives, net of derivative related liabilities (3) | (1,936 | ) | (258 | ) | (15 | ) | (33 | ) | 164 | (4 | ) | 41 | (2,041 | ) | (513 | ) | ||||||||||||||||||||
Other assets | – | 2 | – | – | 12 | – | – | 14 | 11 | |||||||||||||||||||||||||||
| $ | 8,211 | $ | (272 | ) | $ | 164 | $ | 4,924 | $ | (5,994 | ) | $ | 348 | $ | (754 | ) | $ | 6,627 | $ | (477 | ) | |||||||||||||||
Liabilities | ||||||||||||||||||||||||||||||||||||
Deposits | ||||||||||||||||||||||||||||||||||||
Personal | $ | (3,615 | ) | $ | (258 | ) | $ | 81 | $ | (6,265 | ) | $ | 3,164 | $ | (6 | ) | $ | 59 | $ | (6,840 | ) | $ | (97 | ) | ||||||||||||
Business and government | (3,435 | ) | (62 | ) | 63 | (754 | ) | 1,003 | (443 | ) | 1,109 | (2,519 | ) | (57 | ) | |||||||||||||||||||||
Other | ||||||||||||||||||||||||||||||||||||
Obligations related to securities sold short | – | – | – | (2 | ) | 2 | (8 | ) | – | (8 | ) | – | ||||||||||||||||||||||||
Other liabilities | (68 | ) | (35 | ) | 1 | – | 1 | – | – | (101 | ) | (33 | ) | |||||||||||||||||||||||
Subordinated debentures | (111 | ) | (13 | ) | 2 | – | – | – | – | (122 | ) | (12 | ) | |||||||||||||||||||||||
| $ | (7,229 | ) | $ | (368 | ) | $ | 147 | $ | (7,021 | ) | $ | 4,170 | $ | (457 | ) | $ | 1,168 | $ | (9,590 | ) | $ | (199 | ) | |||||||||||||
| (1) | These amounts include the foreign currency translation gains or losses arising on consolidation of foreign subsidiaries relating to the Level 3 instruments, where applicable. The unrealized gains on AFS securities were $79 million for the year ended October 31, 2013 (October 31, 2012 – gains of $162 million), excluding the translation gains or losses arising on consolidation. |
| (2) | Other includes amortization of premiums or discounts recognized in net income. |
| (3) | Net derivatives as at October 31, 2013 included derivative assets of $1,194 million (October 31, 2012 – $1,251 million) and derivative liabilities of $2,748 million (October 31, 2012 – $3,292 million). |
During the year ended October 31, 2013, significant transfers included: (i) $5,535 million of certain equity-linked notes in Personal deposits, $113 million and $163 million of assets and liabilities, respectively, relating to equity derivatives in Derivatives, net of derivatives related liabilities, transferred out of Level 3 in the fourth quarter, as the unobservable inputs did not significantly affect fair value measurement of these instruments; (ii) $1,437 million of CDOs transferred out of Level 3 in the third quarter, as a result of increased price transparency evidenced by trade data, dealer data or multiple vendor quotes; (iii) $251 million of Other OECD government debt transferred out of Level 3 in the second quarter, as there was an increase in price transparency due to more issuances in the market; (iv) $155 million in Other OECD government debt transferred out of Level 3 in the first quarter due to increased market activity; (v) certain derivative assets and liabilities were also transferred out of Level 3 in the first quarter, with a majority of the transfers related to derivatives for which pricing became observable as maturity dates became shorter due to the passage of time; (vi) certain equity derivatives with assets and liabilities of $462 million and $485 million, respectively, in Derivatives, net of derivatives related liabilities, were transferred into Level 3 in the fourth quarter, as the unobservable inputs are significant to their fair values; and (vii) $67 million of Non-CDO ABS and $55 million of Corporate debt and other debt transferred into Level 3 in the second quarter, for which pricing inputs are no longer observable.
During the year ended October 31, 2012, there were significant transfers of AFS securities from Level 3 to Level 2, mainly due to increase in price transparency of certain U.S. state, municipal and agencies debt. During the year, certain Business and government deposits were transferred out of Level 3 because their spreads became observable. Certain derivative assets and derivative liabilities were also transferred out of Level 3 in the same period. A majority of the transfers were related to derivatives for which maturity dates became shorter due to passage of time; hence pricing became observable.
126 Royal Bank of Canada: Annual Report 2013 Consolidated Financial Statements
Table of Contents
Positive and negative fair value movement of Level 3 financial instruments from using reasonably possible alternative assumptions
A financial instrument is classified as Level 3 in the fair value hierarchy if one or more of its unobservable inputs may significantly affect the measurement of its fair value. In preparing the financial statements, appropriate levels for these unobservable input parameters are chosen so that they are consistent with prevailing market evidence or management judgment. Due to the unobservable nature of the prices or rates, there may be uncertainty about valuation of these Level 3 financial instruments.
The following table summarizes the impact to fair values of Level 3 financial instruments using reasonably possible alternative assumptions. This sensitivity disclosure is intended to illustrate the potential impact of the relative uncertainty in the fair value of Level 3 financial instruments. In reporting the sensitivities below, we have considered offsetting balances in instances when: (i) the move in valuation factor caused an offsetting positive and negative fair value movement, (ii) both offsetting instruments are in Level 3, and (iii) when exposures are managed and reported on a net basis. With respect to overall sensitivity, it is unlikely in practice that all reasonably possible alternative assumptions would be simultaneously realized.
| As at | ||||||||||||||||||||||||||
| October 31, 2013 | October 31, 2012 | |||||||||||||||||||||||||
| (Millions of Canadian dollars) | Level 3 fair value | Positive fair value movement from using reasonably possible alternatives | Negative fair value movement from using reasonably possible alternatives | Level 3 fair value | Positive fair value movement from using reasonably possible alternatives | Negative fair value movement from using reasonably possible alternatives | ||||||||||||||||||||
Securities | ||||||||||||||||||||||||||
Trading | ||||||||||||||||||||||||||
U.S. state, municipal and agencies debt | $ | 22 | $ | – | $ | (1 | ) | $ | 99 | $ | – | $ | – | |||||||||||||
Other OECD government debt | 370 | – | – | 375 | – | – | ||||||||||||||||||||
Mortgage-backed securities | 28 | 1 | (2 | ) | 55 | 1 | (1 | ) | ||||||||||||||||||
Asset-backed securities | 291 | 3 | (3 | ) | 82 | 3 | (3 | ) | ||||||||||||||||||
Corporate debt and other debt | 415 | 42 | (32 | ) | 397 | 40 | (32 | ) | ||||||||||||||||||
Equities | 183 | – | – | 302 | 2 | (2 | ) | |||||||||||||||||||
Available-for-sale | ||||||||||||||||||||||||||
U.S. state, municipal and agencies debt | 2,014 | 20 | (64 | ) | 1,906 | 25 | (48 | ) | ||||||||||||||||||
Asset-backed securities | 283 | 9 | (16 | ) | 2,641 | 29 | (37 | ) | ||||||||||||||||||
Corporate debt and other debt | 1,673 | 9 | (10 | ) | 1,446 | 13 | (12 | ) | ||||||||||||||||||
Equities | 969 | 24 | (20 | ) | 948 | 20 | (24 | ) | ||||||||||||||||||
Loans | 414 | 3 | (3 | ) | 403 | 3 | (3 | ) | ||||||||||||||||||
Derivatives | 1,194 | 84 | (85 | ) | 1,251 | 106 | (117 | ) | ||||||||||||||||||
Other assets | 11 | – | – | 14 | 1 | (1 | ) | |||||||||||||||||||
Total | $ | 7,867 | $ | 195 | $ | (236 | ) | $ | 9,919 | $ | 243 | $ | (280 | ) | ||||||||||||
Deposits | (4,969 | ) | 60 | (39 | ) | (9,359 | ) | 84 | (84 | ) | ||||||||||||||||
Derivatives | (2,748 | ) | 77 | (100 | ) | (3,292 | ) | 41 | (60 | ) | ||||||||||||||||
Other, securities sold short, other liabilities and subordinated debentures | (128 | ) | 1 | – | (231 | ) | 8 | (8 | ) | |||||||||||||||||
Total | $ | (7,845 | ) | $ | 138 | $ | (139 | ) | $ | (12,882 | ) | $ | 133 | $ | (152 | ) | ||||||||||
Sensitivity results
As at October 31, 2013, the effects of applying other reasonably possible alternative assumptions to the Level 3 asset positions would be an increase of $195 million and a reduction of $236 million in fair value, of which $62 million and $110 million would be recorded in Other components of equity. The effects of applying these assumptions to the Level 3 liability positions would result in a decrease of $138 million and an increase of $139 million in fair value.
Level 3 valuation inputs and approaches to developing reasonably possible alternative assumptions
As at October 31, 2013, Level 3 financial instruments primarily include ABS including CDOs, ARS, municipal bonds, Other OECD government debt, non-OECD government and corporate debt with long-dated maturities and significant unobservable spreads, hedge fund investments with certain redemption restrictions, certain structured debt securities, private equities, equity-linked structured notes, OTC equity options, commodity derivatives, interest rate and hedge fund swaps, bank-owned life insurance (BOLI), and deposit notes with long-dated maturities and significant unobservable spreads. In the prior year, the Level 3 instruments also included interest-rate-linked structured notes.
The following is a summary of the unobservable inputs of the Level 3 instruments and our approach to develop reasonably possible alternative assumptions used to determine sensitivity.
The fair value of CDOs, corporate bonds and loans, floating-rate notes, non-OECD countries’ government debt and municipal bonds are determined using prices from pricing services and/or brokers. These securities are classified as Level 3 due to a lack of market observable pricing. The positive and negative sensitivities are determined based on plus or minus one standard deviation of the bid-offer spreads or input prices if a sufficient number of prices is received, or using high and low vendor prices as reasonably possible alternative assumptions.
The fair value of certain municipal and student loan ARS is determined by discounted cash flow valuation technique. Cash flows of the underlying ARS assets are forecasted based on unobservable parameters such as defaults, prepayments and delinquencies, and are discounted using a market observable interest rate and an unobservable discount margin. In calculating the sensitivity of these ARS, we decreased the discount margin between .2% and 1.2% and increased the discount margin between .5% and 2.0%, depending on the specific reasonable range of fair value uncertainty for each particular financial instrument’s market.
Trading Equities primarily consist of hedge fund units with certain redemption restrictions. The NAVs of the funds and the corresponding equity derivatives in the Derivatives (Liability) referenced to NAVs are not considered observable because we cannot redeem certain of these hedge funds at NAV prior to the next quarter end. The NAVs of the AFS private equities are also unobservable due to the few recent market transactions to support their values. We have not applied another reasonably possible alternative assumption to these private equity positions as the NAVs are provided by the fund managers. This approach also applies to our hedge fund and related equity derivatives.
Derivative assets and liabilities mainly consist of commodity derivatives, equity derivatives including hedge fund swaps or options, interest-rate swaps and BOLI. The derivative values are adjusted for derivative CVAs. Commodity derivatives inputs are contract prices and prices for certain long-term contracts in which prices are not observable. For our commodity derivatives sensitivity, we apply one standard deviation to the commodity prices. Interest rate swaps are classified as Level 3 if the interest rates are unobservable for longer terms. The unobservable inputs for
Consolidated Financial Statements Royal Bank of Canada: Annual Report 2013 127
Table of Contents
Note 3 Fair value of financial instruments(continued)
|
interest rate and cross currency swaps include interest rates and the sensitivity is derived using plus or minus one standard deviation of these inputs and an amount based on model and parameter uncertainty, where applicable. The unobservable inputs for equity derivatives are volatility, dividends, and correlation between stocks or indices. The sensitivity is derived by shifting the unobservable inputs by plus or minus one standard deviation. For BOLI, the unobservable inputs include default rates, prepayment rates, probability of surrender, and loss severity rates. For sensitivity, the range of values is determined by adjusting a combination of one or more of the following: default rates, prepayment rates, probability of surrender, and loss severity rates by up to 20%. For derivative CVAs, the unobservable inputs include certain counterparty and our credit spreads and credit correlation. The sensitivity for the derivative CVA is calculated using a combination of increasing the relative credit spread by 11%, and an amount for model uncertainty.
Interest-rate-linked and equity-linked structured notes, as well as promissory notes with significant unobservable spreads and limited market activities are included in Deposits. For interest-rate-linked structured notes, model inputs include interest rate parameters, correlation and funding curve. For equity-linked structured notes, model inputs include equity volatility, equity correlation and dividends. The sensitivities for interest-rate-linked and equity-linked structured notes are derived by adjusting inputs by plus or minus one standard deviation, and for other deposits, by shifting the funding curve by plus or minus certain basis points.
128 Royal Bank of Canada: Annual Report 2013 Consolidated Financial Statements
Table of Contents
|
Carrying value of securities
The following table presents the financial instruments that we held at the end of the period, measured at carrying value:
| As at October 31, 2013 | ||||||||||||||||||||||||||||
| Term to maturity(1) | ||||||||||||||||||||||||||||
(Millions of Canadian dollars) | | Within 3 months | | | 3 months to 1 year | | | 1 to 5 years | | | 5 years to 10 years | | | Over 10 years | | | With no specific maturity | | Total | |||||||||
Trading account (2) | ||||||||||||||||||||||||||||
Canadian government debt | $ | 3,341 | $ | 8,871 | $ | 7,932 | $ | 4,204 | $ | 6,401 | $ | – | $ | 30,749 | ||||||||||||||
U.S. government debt | 2,415 | 9,852 | 8,655 | 3,376 | 5,184 | – | 29,482 | |||||||||||||||||||||
Other OECD government debt | 1,181 | 1,915 | 5,044 | 709 | 1,007 | – | 9,856 | |||||||||||||||||||||
Mortgage-backed securities (3) | 2 | 6 | 46 | 136 | 640 | – | 830 | |||||||||||||||||||||
Asset-backed securities (3) | 90 | 38 | 351 | 206 | 690 | – | 1,375 | |||||||||||||||||||||
Corporate debt and other debt (3) | ||||||||||||||||||||||||||||
Bankers’ acceptances | 678 | – | – | – | – | – | 678 | |||||||||||||||||||||
Certificates of deposit | 22 | 493 | 1,042 | 19 | 12 | – | 1,588 | |||||||||||||||||||||
Other (4) | 1,319 | 2,241 | 13,839 | 3,115 | 3,762 | – | 24,276 | |||||||||||||||||||||
Equities | – | – | – | – | – | 45,189 | 45,189 | |||||||||||||||||||||
| 9,048 | 23,416 | 36,909 | 11,765 | 17,696 | 45,189 | 144,023 | ||||||||||||||||||||||
Available-for-sale securities (2) | ||||||||||||||||||||||||||||
Canadian government debt | ||||||||||||||||||||||||||||
Federal | ||||||||||||||||||||||||||||
Amortized cost | 852 | 512 | 4,927 | 3,189 | 4 | – | 9,484 | |||||||||||||||||||||
Fair value | 853 | 519 | 5,007 | 3,439 | 4 | – | 9,822 | |||||||||||||||||||||
Yield (5) | 2.6% | 2.6% | 2.1% | 3.6% | 4.8% | – | 2.7% | |||||||||||||||||||||
Provincial and municipal | ||||||||||||||||||||||||||||
Amortized cost | 250 | 175 | 181 | 39 | 19 | – | 664 | |||||||||||||||||||||
Fair value | 250 | 175 | 182 | 40 | 20 | – | 667 | |||||||||||||||||||||
Yield (5) | 1.4% | 1.4% | 2.5% | 4.3% | 4.9% | – | 2.0% | |||||||||||||||||||||
U.S. state, municipal and agencies debt | ||||||||||||||||||||||||||||
Amortized cost | 158 | 68 | 521 | 534 | 5,142 | – | 6,423 | |||||||||||||||||||||
Fair value | 157 | 68 | 522 | 533 | 4,998 | – | 6,278 | |||||||||||||||||||||
Yield (5) | 0.4% | 0.1% | 2.5% | 0.4% | 0.7% | – | 0.8% | |||||||||||||||||||||
Other OECD government debt | ||||||||||||||||||||||||||||
Amortized cost | 5,263 | 1,273 | 2,835 | 1,403 | – | – | 10,774 | |||||||||||||||||||||
Fair value | 5,262 | 1,277 | 2,838 | 1,405 | – | – | 10,782 | |||||||||||||||||||||
Yield (5) | 0.1% | 0.6% | 0.7% | 0.4% | – | – | 0.3% | |||||||||||||||||||||
Mortgage-backed securities | ||||||||||||||||||||||||||||
Amortized cost | – | – | – | 25 | 105 | – | 130 | |||||||||||||||||||||
Fair value | – | – | – | 26 | 113 | – | 139 | |||||||||||||||||||||
Yield (5) | – | – | – | 3.5% | 2.5% | – | 2.7% | |||||||||||||||||||||
Asset-backed securities | ||||||||||||||||||||||||||||
Amortized cost | 8 | – | 279 | 1,194 | 409 | – | 1,890 | |||||||||||||||||||||
Fair value | 5 | – | 291 | 1,237 | 327 | – | 1,860 | |||||||||||||||||||||
Yield (5) | 2.6% | – | 1.0% | 0.5% | 1.1% | – | 0.7% | |||||||||||||||||||||
Corporate debt and other debt | ||||||||||||||||||||||||||||
Amortized cost | 1,387 | 993 | 3,551 | 617 | 333 | – | 6,881 | |||||||||||||||||||||
Fair value | 1,394 | 1,000 | 3,557 | 621 | 333 | – | 6,905 | |||||||||||||||||||||
Yield (5) | 1.3% | 1.9% | 1.7% | 2.8% | 4.5% | – | 1.9% | |||||||||||||||||||||
Equities | ||||||||||||||||||||||||||||
Cost | – | – | – | – | – | 1,415 | 1,415 | |||||||||||||||||||||
Fair value | – | – | – | – | – | 1,714 | 1,714 | |||||||||||||||||||||
Loan substitute | ||||||||||||||||||||||||||||
Cost | – | – | – | – | – | 125 | 125 | |||||||||||||||||||||
Fair value | – | – | – | – | – | 127 | 127 | |||||||||||||||||||||
Yield (5) | – | – | – | – | – | 4.0% | 4.0% | |||||||||||||||||||||
Amortized cost | 7,918 | 3,021 | 12,294 | 7,001 | 6,012 | 1,540 | 37,786 | |||||||||||||||||||||
Fair value | 7,921 | 3,039 | 12,397 | 7,301 | 5,795 | 1,841 | 38,294 | |||||||||||||||||||||
Held-to-maturity securities (2) | ||||||||||||||||||||||||||||
Amortized cost | 140 | 141 | 76 | 44 | – | – | 401 | |||||||||||||||||||||
Fair value | 140 | 141 | 76 | 44 | – | – | 401 | |||||||||||||||||||||
Total carrying value of securities (2) | $ | 17,109 | $ | 26,596 | $ | 49,382 | $ | 19,110 | $ | 23,491 | $ | 47,030 | $ | 182,718 | ||||||||||||||
Consolidated Financial Statements Royal Bank of Canada: Annual Report 2013 129
Table of Contents
Note 4 Securities(continued)
|
| As at October 31, 2012 | ||||||||||||||||||||||||||||
| Term to maturity (1) | ||||||||||||||||||||||||||||
(Millions of Canadian dollars) | | Within 3 months | | | 3 months to 1 year | | | 1 to 5 years | | | 5 years to 10 years | | | Over 10 years | | | With no specific maturity | | Total | |||||||||
Trading account(2) | ||||||||||||||||||||||||||||
Canadian government debt | $ | 3,696 | $ | 6,085 | $ | 6,351 | $ | 1,674 | $ | 6,051 | $ | – | $ | 23,857 | ||||||||||||||
U.S. government debt | 1,580 | 4,461 | 5,537 | 1,649 | 7,523 | – | 20,750 | |||||||||||||||||||||
Other OECD government debt | 1,400 | 2,116 | 4,696 | 2,150 | 1,548 | – | 11,910 | |||||||||||||||||||||
Mortgage-backed securities (3) | – | 7 | 37 | 114 | 590 | – | 748 | |||||||||||||||||||||
Asset-backed securities (3) | 29 | 68 | 312 | 166 | 207 | – | 782 | |||||||||||||||||||||
Corporate debt and other debt (3) | ||||||||||||||||||||||||||||
Bankers’ acceptances | 925 | 14 | – | – | – | – | 939 | |||||||||||||||||||||
Certificates of deposit | 377 | 559 | 611 | 9 | 9 | – | 1,565 | |||||||||||||||||||||
Other (4) | 2,524 | 2,697 | 9,207 | 2,254 | 3,245 | – | 19,927 | |||||||||||||||||||||
Equities | – | – | – | – | – | 40,305 | 40,305 | |||||||||||||||||||||
| 10,531 | 16,007 | 26,751 | 8,016 | 19,173 | 40,305 | 120,783 | ||||||||||||||||||||||
Available-for-sale securities(2) | ||||||||||||||||||||||||||||
Canadian government debt | ||||||||||||||||||||||||||||
Federal | ||||||||||||||||||||||||||||
Amortized cost | 310 | 851 | 6,234 | 3,348 | 25 | – | 10,768 | |||||||||||||||||||||
Fair value | 312 | 858 | 6,358 | 3,725 | 28 | – | 11,281 | |||||||||||||||||||||
Yield (5) | 0.8% | 3.1% | 2.2% | 3.5% | 4.0% | – | 2.7% | |||||||||||||||||||||
Provincial and municipal | ||||||||||||||||||||||||||||
Amortized cost | 43 | 804 | 895 | 12 | 20 | – | 1,774 | |||||||||||||||||||||
Fair value | 43 | 810 | 897 | 13 | 22 | – | 1,785 | |||||||||||||||||||||
Yield (5) | 0.8% | 3.1% | 1.6% | 5.4% | 4.8% | – | 2.3% | |||||||||||||||||||||
U.S. state, municipal and agencies debt | ||||||||||||||||||||||||||||
Amortized cost | 46 | 50 | 285 | 418 | 5,130 | – | 5,929 | |||||||||||||||||||||
Fair value | 46 | 50 | 286 | 417 | 4,986 | – | 5,785 | |||||||||||||||||||||
Yield (5) | 0.4% | 0.1% | 0.3% | 0.9% | 0.8% | – | 0.8% | |||||||||||||||||||||
Other OECD government debt | ||||||||||||||||||||||||||||
Amortized cost | 6,218 | 1,605 | 1,598 | 385 | – | – | 9,806 | |||||||||||||||||||||
Fair value | 6,217 | 1,610 | 1,607 | 391 | – | – | 9,825 | |||||||||||||||||||||
Yield (5) | 0.2% | 0.6% | 1.1% | 2.4% | – | – | 0.5% | |||||||||||||||||||||
Mortgage-backed securities | ||||||||||||||||||||||||||||
Amortized cost | – | – | – | 21 | 232 | – | 253 | |||||||||||||||||||||
Fair value | – | – | – | 22 | 241 | – | 263 | |||||||||||||||||||||
Yield (5) | – | – | – | 4.5% | 2.3% | – | 2.4% | |||||||||||||||||||||
Asset-backed securities | ||||||||||||||||||||||||||||
Amortized cost | 69 | 95 | 217 | 1,621 | 873 | – | 2,875 | |||||||||||||||||||||
Fair value | 68 | 97 | 225 | 1,665 | 766 | – | 2,821 | |||||||||||||||||||||
Yield (5) | 0.7% | 0.7% | 1.0% | 0.7% | 1.1% | – | 0.8% | |||||||||||||||||||||
Corporate debt and other debt | ||||||||||||||||||||||||||||
Amortized cost | 3,611 | 917 | 1,319 | 294 | 366 | – | 6,507 | |||||||||||||||||||||
Fair value | 3,630 | 919 | 1,316 | 296 | 347 | – | 6,508 | |||||||||||||||||||||
Yield (5) | 1.0% | 1.2% | 2.5% | 4.9% | 4.9% | – | 1.7% | |||||||||||||||||||||
Equities | ||||||||||||||||||||||||||||
Cost | – | – | – | – | – | 1,584 | 1,584 | |||||||||||||||||||||
Fair value | – | – | – | – | – | 1,835 | 1,835 | |||||||||||||||||||||
Loan substitute | ||||||||||||||||||||||||||||
Cost | – | – | – | – | – | 209 | 209 | |||||||||||||||||||||
Fair value | – | – | – | – | – | 217 | 217 | |||||||||||||||||||||
Yield (5) | – | – | – | – | – | 3.6% | 3.6% | |||||||||||||||||||||
Amortized cost | 10,297 | 4,322 | 10,548 | 6,099 | 6,646 | 1,793 | 39,705 | |||||||||||||||||||||
Fair value | 10,316 | 4,344 | 10,689 | 6,529 | 6,390 | 2,052 | 40,320 | |||||||||||||||||||||
Held-to-maturity securities(2) | ||||||||||||||||||||||||||||
Amortized cost | 131 | 186 | 112 | 78 | 1 | – | 508 | |||||||||||||||||||||
Fair value | 131 | 186 | 112 | 78 | 1 | – | 508 | |||||||||||||||||||||
Total carrying value of securities(2) | $ | 20,978 | $ | 20,537 | $ | 37,552 | $ | 14,623 | $ | 25,564 | $ | 42,357 | $ | 161,611 | ||||||||||||||
| (1) | Actual maturities may differ from contractual maturities shown above since borrowers may have the right to prepay obligations with or without prepayment penalties. |
| (2) | Trading securities and AFS securities are recorded at fair value. Held-to-maturity securities are recorded at amortized cost. |
| (3) | Includes CDOs which are presented as Asset-backed securities – CDOs in the table entitled Fair value of assets and liabilities classified using the fair value hierarchy in Note 3. |
| (4) | Primarily composed of corporate debt, supra-national debt, and commercial paper. |
| (5) | The weighted average yield is derived using the contractual interest rate and the carrying value at the end of the year for the respective securities. |
130 Royal Bank of Canada: Annual Report 2013 Consolidated Financial Statements
Table of Contents
Unrealized gains and losses on available-for-sale securities(1), (2)
| As at | ||||||||||||||||||||||||||||||||||
| October 31, 2013 | October 31, 2012 | |||||||||||||||||||||||||||||||||
| (Millions of Canadian dollars) | | Cost/ Amortized cost | | | Gross unrealized gains | | | Gross unrealized losses | | | Fair value | | | Cost/ Amortized cost | | | Gross unrealized gains | | | Gross unrealized losses | | | Fair value | | ||||||||||
Canadian government debt | ||||||||||||||||||||||||||||||||||
Federal | $ | 9,551 | $ | 340 | $ | (2 | ) | $ | 9,889 | $ | 10,927 | $ | 513 | $ | – | $ | 11,440 | |||||||||||||||||
Provincial and municipal | 665 | 3 | (1 | ) | 667 | 1,774 | 11 | – | 1,785 | |||||||||||||||||||||||||
U.S. state, municipal and | 6,422 | 9 | (153 | ) | 6,278 | 5,929 | 13 | (157 | ) | 5,785 | ||||||||||||||||||||||||
Other OECD government debt | 10,826 | 12 | (4 | ) | 10,834 | 9,856 | 25 | (6 | ) | 9,875 | ||||||||||||||||||||||||
Mortgage-backed securities | 130 | 10 | (1 | ) | 139 | 253 | 13 | (3 | ) | 263 | ||||||||||||||||||||||||
Asset-backed securities | ||||||||||||||||||||||||||||||||||
CDOs | 1,343 | 58 | (4 | ) | 1,397 | 1,943 | 61 | (8 | ) | 1,996 | ||||||||||||||||||||||||
Non-CDO securities | 545 | 3 | (85 | ) | 463 | 932 | 12 | (119 | ) | 825 | ||||||||||||||||||||||||
Corporate debt and other debt | 7,165 | 51 | (29 | ) | 7,187 | 6,806 | 49 | (48 | ) | 6,807 | ||||||||||||||||||||||||
Equities | 1,415 | 312 | (13 | ) | 1,714 | 1,584 | 269 | (18 | ) | 1,835 | ||||||||||||||||||||||||
Loan substitute securities | 125 | 3 | (1 | ) | 127 | 209 | 8 | – | 217 | |||||||||||||||||||||||||
| $ | 38,187 | $ | 801 | $ | (293 | ) | $ | 38,695 | $ | 40,213 | $ | 974 | $ | (359 | ) | $ | 40,828 | |||||||||||||||||
| (1) | Includes $401 million held-to-maturity securities as at October 31, 2013 (October 31, 2012 – $508 million). |
| (2) | The majority of the MBS are residential. Cost/Amortized cost, gross unrealized gains, gross unrealized losses and fair value related to commercial MBS are $34 million, $1 million, a nominal amount, and $35 million, respectively as at October 31, 2013 (October 31, 2012 – $41 million, $1 million, $nil, and $42 million). |
| (3) | Includes securities issued by U.S. non-agencies backed by government insured assets, and MBS and ABS issued by U.S. government agencies. |
Net gain and loss on available-for-sale securities(1)
| For the year ended | ||||||||||||
| (Millions of Canadian dollars) | October 31 2013 | October 31 2012 | October 31 2011 | |||||||||
Realized gains | $ | 231 | $ | 242 | $ | 283 | ||||||
Realized losses | (17 | ) | (74 | ) | (63 | ) | ||||||
Impairment losses | (26 | ) | (48 | ) | (116 | ) | ||||||
Net gain (loss) on available-for-sale securities | $ | 188 | $ | 120 | $ | 104 | ||||||
| (1) | The following related to our insurance operations are excluded from Net gain (loss) on AFS securities and included in Insurance premiums, investment and fee income on the Consolidated Statement of Income: Realized gains for the year ended October 31, 2013 were $3 million (October 31, 2012 – $9 million; October 31, 2011 – $25 million). There were no realized losses or impairment losses related to our insurance operations for the years ended October 31, 2013 and October 31, 2012 (October 31, 2011 – $1 million and $14 million of realized losses and impairment losses, respectively). |
AFS securities are assessed for objective evidence of impairment at each reporting date and more frequently when conditions warrant. Our impairment review is primarily based on the factors described in Note 2. Depending on the nature of the securities under review, we apply specific methodologies to assess whether the cost/amortized cost of the security would be recovered. As at October 31, 2013, our gross unrealized losses on AFS securities were $293 million (October 31, 2012 – $359 million).
The total cost/amortized cost of the AFS portfolio, as at October 31, 2013, decreased by $2 billion or 5% compared to October 31, 2012. The decrease is largely due to net sales and maturities of Canadian government debt and redemptions and restructurings of certain Asset-backed securities, partially offset by an increase in Other OECD government debt.
Gross unrealized gains of $801 million, as of October 31, 2013, decreased by $173 million or 18% compared to October 31, 2012. This decrease mainly reflects the fair value declines due to increasing interest rates on Canadian government debt, partially offset by fair value improvements on certain Equities.
Gross unrealized losses of $293 million, as of October 31, 2013, decreased by $66 million or 18% compared to October 31, 2012. This decrease mainly reflects redemptions and restructurings of Asset-backed securities that were in a loss position and fair value improvements on Corporate debt and other debt from tightening credit spreads.
Management believes that there is no objective evidence of impairment on the above-mentioned securities that are in an unrealized loss position as at October 31, 2013.
Held-to-maturity securities
Held-to-maturity securities stated at amortized cost are subject to periodic impairment review and are classified as impaired when, in management’s opinion, there is no longer reasonable assurance of the timely collection of the full amount of principal and interest. The impairment review of held-to-maturity securities is primarily based on the impairment model for loans. Management believes that there is no objective evidence of impairment on our held-to-maturity securities as at October 31, 2013.
Net gain (loss) on available-for-sale securities
During the year ended October 31, 2013, $188 million of net gains were recognized in Non-interest income as compared to $120 million in the prior year. The current year reflects net realized gain on sales of $214 million mainly comprised of distributions from and gains on sale of certain Equities, sale of Canadian government debt, and redemption and restructurings of certain Asset-backed securities. Partially offsetting the net realized gains are $26 million of impairment losses primarily on certain Equities. This compares to net realized gains for the year ended October 31, 2012 of $168 million which was partially offset by $48 million of impairment losses.
Consolidated Financial Statements Royal Bank of Canada: Annual Report 2013 131
Table of Contents
Note 4 Securities(continued)
|
Reclassification of financial Instruments
The following table provides information regarding certain securities that we reclassified in prior reporting periods:
| Financial instruments reclassified in prior periods | ||||||||||
| As at | ||||||||||
October 31 2013 (1) | October 31 2012 (1) | |||||||||
| (Millions of Canadian dollars) | Total carrying value and fair value | Total carrying value and fair value | ||||||||
Financial assets – FVTPL reclassified to available-for-sale | ||||||||||
CDOs | $ | 1,154 | $ | 1,801 | ||||||
Mortgage-backed securities | 59 | 75 | ||||||||
| $ | 1,213 | $ | 1,876 | |||||||
| For the year ended | ||||||||||||||||||||||||||||
| October 31, 2013 | October 31, 2012 | October 31, 2011 | ||||||||||||||||||||||||||
| (Millions of Canadian dollars) | Change in fair value during the period(2) | Interest income/gains the period | Change in fair value during the period (2) | Interest income/gains the period | Change in fair value during the period (2) | Interest income gains the period | ||||||||||||||||||||||
FVTPL reclassified to available-for-sale | ||||||||||||||||||||||||||||
CDOs | $ | (5 | ) | $ | 59 | $ | 60 | $ | 76 | $ | (4 | ) | $ | 5 | ||||||||||||||
Mortgage-backed securities | – | 8 | 2 | 8 | – | – | ||||||||||||||||||||||
| $ | (5 | ) | $ | 67 | $ | 62 | $ | 84 | $ | (4 | ) | $ | 5 | |||||||||||||||
| (1) | On October 1, 2011 and November 1, 2011 we reclassified $1,872 million and $255 million, respectively, of certain CDOs and U.S. non-agency MBS from classified as at FVTPL to AFS. |
| (2) | This change represents the fair value gain or loss that would have been recognized in profit or loss had the assets not been reclassified. |
|
| As at | ||||||||||||||||||||||||||||||||||
| October 31, 2013 | October 31, 2012 | |||||||||||||||||||||||||||||||||
| (Millions of Canadian dollars) | Canada | United States | Other International | Total | Canada | United States | Other International | Total | ||||||||||||||||||||||||||
Retail(1) | ||||||||||||||||||||||||||||||||||
Residential mortgages | $ | 206,134 | $ | 378 | $ | 2,726 | $ | 209,238 | $ | 195,552 | $ | 275 | $ | 2,497 | $ | 198,324 | ||||||||||||||||||
Personal | 87,153 | 3,306 | 3,852 | 94,311 | 80,897 | 2,825 | 2,975 | 86,697 | ||||||||||||||||||||||||||
Credit cards | 13,902 | 50 | 190 | 14,142 | 13,422 | 38 | 201 | 13,661 | ||||||||||||||||||||||||||
Small business (2) | 3,987 | – | – | 3,987 | 2,503 | – | – | 2,503 | ||||||||||||||||||||||||||
| $ | 311,176 | $ | 3,734 | $ | 6,768 | $ | 321,678 | $ | 292,374 | $ | 3,138 | $ | 5,673 | $ | 301,185 | |||||||||||||||||||
Wholesale(1) | ||||||||||||||||||||||||||||||||||
Business (3) | 49,887 | 19,395 | 16,009 | 85,291 | 42,894 | 16,755 | 16,121 | 75,770 | ||||||||||||||||||||||||||
Bank (4) | 823 | 28 | 469 | 1,320 | 390 | 304 | 296 | 990 | ||||||||||||||||||||||||||
Sovereign (5) | 1,747 | – | 589 | 2,336 | 1,854 | – | 442 | 2,296 | ||||||||||||||||||||||||||
| $ | 52,457 | $ | 19,423 | $ | 17,067 | $ | 88,947 | $ | 45,138 | $ | 17,059 | $ | 16,859 | $ | 79,056 | |||||||||||||||||||
Total loans | $ | 363,633 | $ | 23,157 | $ | 23,835 | $ | 410,625 | $ | 337,512 | $ | 20,197 | $ | 22,532 | $ | 380,241 | ||||||||||||||||||
Allowance for loan losses | (1,482 | ) | (105 | ) | (372 | ) | (1,959 | ) | (1,542 | ) | (125 | ) | (330 | ) | (1,997 | ) | ||||||||||||||||||
Total loans net of allowance for loan losses | $ | 362,151 | $ | 23,052 | $ | 23,463 | $ | 408,666 | $ | 335,970 | $ | 20,072 | $ | 22,202 | $ | 378,244 | ||||||||||||||||||
| (1) | Geographic information is based on residence of borrower. |
| (2) | Includes small business exposure managed on a pooled basis. |
| (3) | Includes small business exposure managed on an individual client basis. |
| (4) | Bank refers primarily to regulated deposit-taking institutions and securities firms. |
| (5) | Sovereign refers to all central governments and agencies, central banks, as well as other qualifying public sector entities and multilateral development banks. |
Loans maturity and rate sensitivity
| As at October 31, 2013 | ||||||||||||||||||||||||||||||||
| Maturity term(1) | Rate sensitivity | |||||||||||||||||||||||||||||||
| (Millions of Canadian dollars) | Under 1 year (2) | 1 to 5 years | Over 5 years | Total | Floating | Fixed Rate | Non-rate- sensitive | Total | ||||||||||||||||||||||||
Retail | $ | 176,437 | $ | 133,754 | $ | 11,487 | $ | 321,678 | $ | 126,442 | $ | 190,073 | $ | 5,163 | $ | 321,678 | ||||||||||||||||
Wholesale | 72,164 | 11,695 | 5,088 | 88,947 | 46,455 | 40,982 | 1,510 | 88,947 | ||||||||||||||||||||||||
Total loans | $ | 248,601 | $ | 145,449 | $ | 16,575 | $ | 410,625 | $ | 172,897 | $ | 231,055 | $ | 6,673 | $ | 410,625 | ||||||||||||||||
Allowance for loan losses | (1,959 | ) | (1,959 | ) | ||||||||||||||||||||||||||||
Total loans net of allowance for loan losses | $ | 408,666 | $ | 408,666 | ||||||||||||||||||||||||||||
132 Royal Bank of Canada: Annual Report 2013 Consolidated Financial Statements
Table of Contents
| As at October 31, 2012 | ||||||||||||||||||||||||||||||||
| Maturity term (1) | Rate sensitivity | |||||||||||||||||||||||||||||||
| (Millions of Canadian dollars) | Under 1 year (2) | 1 to 5 years | Over 5 years | Total | Floating | Fixed Rate | Non-rate- sensitive | Total | ||||||||||||||||||||||||
Retail | $ | 172,309 | $ | 114,597 | $ | 14,279 | $ | 301,185 | $ | 153,531 | $ | 144,177 | $ | 3,477 | $ | 301,185 | ||||||||||||||||
Wholesale | 60,583 | 12,149 | 6,324 | 79,056 | 37,572 | 40,214 | 1,270 | 79,056 | ||||||||||||||||||||||||
Total loans | $ | 232,892 | $ | 126,746 | $ | 20,603 | $ | 380,241 | $ | 191,103 | $ | 184,391 | $ | 4,747 | $ | 380,241 | ||||||||||||||||
Allowance for loan losses | (1,997 | ) | (1,997 | ) | ||||||||||||||||||||||||||||
Total loans net of allowance for loan losses | $ | 378,244 | $ | 378,244 | ||||||||||||||||||||||||||||
| (1) | Generally, based on the earlier of contractual repricing or maturity date. |
| (2) | Includes variable rate loans that can be repriced at the clients’ discretion without penalty. |
Allowance for credit losses
| For the year ended October 31, 2013 | ||||||||||||||||||||||||||||
| (Millions of Canadian dollars) | Balance at beginning of period | Provision for credit losses | Write-offs | Recoveries | Unwind of discount | Exchange rate changes/ other | Balance at end of period | |||||||||||||||||||||
Retail | ||||||||||||||||||||||||||||
Residential mortgages | $ | 124 | $ | 41 | $ | (24 | ) | $ | 2 | $ | (24 | ) | $ | 32 | $ | 151 | ||||||||||||
Personal | 543 | 455 | (498 | ) | 96 | (17 | ) | 4 | 583 | |||||||||||||||||||
Credit cards | 403 | 354 | (466 | ) | 112 | – | (18 | ) | 385 | |||||||||||||||||||
Small business | 72 | 32 | (35 | ) | 9 | (2 | ) | (15 | ) | 61 | ||||||||||||||||||
| 1,142 | 882 | (1,023 | ) | 219 | (43 | ) | 3 | 1,180 | ||||||||||||||||||||
Wholesale | ||||||||||||||||||||||||||||
Business | 853 | 357 | (450 | ) | 51 | (43 | ) | 9 | 777 | |||||||||||||||||||
Bank (1) | 2 | – | – | – | – | – | 2 | |||||||||||||||||||||
| 855 | 357 | (450 | ) | 51 | (43 | ) | 9 | 779 | ||||||||||||||||||||
Total allowance for loan losses | 1,997 | 1,239 | (1,473 | ) | 270 | (86 | ) | 12 | 1,959 | |||||||||||||||||||
Allowance for off-balance sheet and other items (2) | 91 | – | – | – | – | – | 91 | |||||||||||||||||||||
Total allowance for credit losses | $ | 2,088 | $ | 1,239 | $ | (1,473 | ) | $ | 270 | $ | (86 | ) | $ | 12 | $ | 2,050 | ||||||||||||
Individually assessed | 298 | 287 | (346 | ) | 31 | (28 | ) | (2 | ) | 240 | ||||||||||||||||||
Collectively assessed | 1,790 | 952 | (1,127 | ) | 239 | (58 | ) | 14 | 1,810 | |||||||||||||||||||
Total allowance for credit losses | $ | 2,088 | $ | 1,239 | $ | (1,473 | ) | $ | 270 | $ | (86 | ) | $ | 12 | $ | 2,050 | ||||||||||||
| For the year ended October 31, 2012 | ||||||||||||||||||||||||||||
| (Millions of Canadian dollars) | Balance at beginning of period | Provision for credit losses | Write-offs | Recoveries | Unwind of discount | Exchange rate changes/ other | Balance at end of period | |||||||||||||||||||||
Retail | ||||||||||||||||||||||||||||
Residential mortgages | $ | 112 | $ | 64 | $ | (32 | ) | $ | 1 | $ | (34 | ) | $ | 13 | $ | 124 | ||||||||||||
Personal | 557 | 437 | (499 | ) | 83 | (23 | ) | (12 | ) | 543 | ||||||||||||||||||
Credit cards | 415 | 403 | (496 | ) | 102 | – | (21 | ) | 403 | |||||||||||||||||||
Small business | 75 | 43 | (50 | ) | 8 | (2 | ) | (2 | ) | 72 | ||||||||||||||||||
| 1,159 | 947 | (1,077 | ) | 194 | (59 | ) | (22 | ) | 1,142 | |||||||||||||||||||
Wholesale | ||||||||||||||||||||||||||||
Business | 775 | 354 | (291 | ) | 39 | (51 | ) | 27 | 853 | |||||||||||||||||||
Bank (1) | 33 | – | (32 | ) | – | – | 1 | 2 | ||||||||||||||||||||
| 808 | 354 | (323 | ) | 39 | (51 | ) | 28 | 855 | ||||||||||||||||||||
Total allowance for loan losses | 1,967 | 1,301 | (1,400 | ) | 233 | (110 | ) | 6 | 1,997 | |||||||||||||||||||
Allowance for off-balance sheet and | 91 | – | – | – | – | – | 91 | |||||||||||||||||||||
Total allowance for credit losses | $ | 2,058 | $ | 1,301 | $ | (1,400 | ) | $ | 233 | $ | (110 | ) | $ | 6 | $ | 2,088 | ||||||||||||
Individually assessed | 252 | 244 | (202 | ) | 19 | (26 | ) | 11 | 298 | |||||||||||||||||||
Collectively assessed | 1,806 | 1,057 | (1,198 | ) | 214 | (84 | ) | (5 | ) | 1,790 | ||||||||||||||||||
Total allowance for credit losses | $ | 2,058 | $ | 1,301 | $ | (1,400 | ) | $ | 233 | $ | (110 | ) | $ | 6 | $ | 2,088 | ||||||||||||
Consolidated Financial Statements Royal Bank of Canada: Annual Report 2013 133
Table of Contents
Note 5 Loans(continued)
|
| For the year ended October 31, 2011 | ||||||||||||||||||||||||||||||||
| (Millions of Canadian dollars) | Balance at beginning of period | Less allowances related to discontinued operations | Provision for credit losses | Write-offs | Recoveries | Unwind of discount | Exchange rate changes/ other | Balance at end of period | ||||||||||||||||||||||||
Retail | ||||||||||||||||||||||||||||||||
Residential mortgages | $ | 154 | $ | (63 | ) | $ | 43 | $ | (16 | ) | $ | 1 | $ | (30 | ) | $ | 23 | $ | 112 | |||||||||||||
Personal | 891 | (258 | ) | 440 | (515 | ) | 79 | (11 | ) | (69 | ) | 557 | ||||||||||||||||||||
Credit cards | 434 | (19 | ) | 447 | (545 | ) | 97 | – | 1 | 415 | ||||||||||||||||||||||
Small business | 78 | – | 35 | (45 | ) | 7 | (1 | ) | 1 | 75 | ||||||||||||||||||||||
| 1,557 | (340 | ) | 965 | (1,121 | ) | 184 | (42 | ) | (44 | ) | 1,159 | |||||||||||||||||||||
Wholesale | ||||||||||||||||||||||||||||||||
Business | 1,267 | (503 | ) | 168 | (226 | ) | 60 | (36 | ) | 45 | 775 | |||||||||||||||||||||
Sovereign (3) | 9 | – | – | (9 | ) | – | – | – | – | |||||||||||||||||||||||
Bank (1) | 34 | – | – | – | – | – | (1 | ) | 33 | |||||||||||||||||||||||
| 1,310 | (503 | ) | 168 | (235 | ) | 60 | (36 | ) | 44 | 808 | ||||||||||||||||||||||
Total allowance for loan losses | 2,867 | (843 | ) | 1,133 | (1,356 | ) | 244 | (78 | ) | – | 1,967 | |||||||||||||||||||||
Allowance for off-balance sheet and other items (2) | 99 | (11 | ) | – | – | – | – | 3 | 91 | |||||||||||||||||||||||
Total allowance for credit losses | $ | 2,966 | $ | (854 | ) | $ | 1,133 | $ | (1,356 | ) | $ | 244 | $ | (78 | ) | $ | 3 | $ | 2,058 | |||||||||||||
Individually assessed | 415 | (130 | ) | 61 | (129 | ) | 43 | (10 | ) | 2 | 252 | |||||||||||||||||||||
Collectively assessed | 2,551 | (724 | ) | 1,072 | (1,227 | ) | 201 | (68 | ) | 1 | 1,806 | |||||||||||||||||||||
Total allowance for credit losses | $ | 2,966 | $ | (854 | ) | $ | 1,133 | $ | (1,356 | ) | $ | 244 | $ | (78 | ) | $ | 3 | $ | 2,058 | |||||||||||||
| (1) | Bank refers primarily to regulated deposit-taking institutions and securities firms. |
| (2) | The allowance for off-balance sheet and other items is reported separately in Other liabilities – Provisions. |
| (3) | Sovereign refers to all central governments and agencies, central banks, as well as other qualifying public sector entities and multilateral development banks. |
Net interest income after provision for credit losses
| For the year ended | ||||||||||||
| October 31 2013 | October 31 2012 | October 31 2011 | ||||||||||
Net interest income | $ | 13,251 | $ | 12,498 | $ | 11,357 | ||||||
Provision for credit losses | 1,239 | 1,301 | 1,133 | |||||||||
Net interest income after provision for credit losses | $ | 12,012 | $ | 11,197 | $ | 10,224 | ||||||
Loans past due but not impaired
| As at | ||||||||||||||||||||||||||||||||||
| October 31, 2013 | October 31, 2012 | |||||||||||||||||||||||||||||||||
| (Millions of Canadian dollars) | 1 to 29 days | 30 to 89 days | 90 days and greater | Total | 1 to 29 days | 30 to 89 days | 90 days and greater | Total | ||||||||||||||||||||||||||
Retail | $ | 2,953 | $ | 1,358 | $ | 329 | $ | 4,640 | $ | 2,954 | $ | 1,350 | $ | 393 | $ | 4,697 | ||||||||||||||||||
Wholesale | 624 | 303 | 17 | 944 | 416 | 221 | – | 637 | ||||||||||||||||||||||||||
Total | $ | 3,577 | $ | 1,661 | $ | 346 | $ | 5,584 | $ | 3,370 | $ | 1,571 | $ | 393 | $ | 5,334 | ||||||||||||||||||
| Gross carrying value of loans individually determined to be impaired(1) | ||||||||
| As at | ||||||||
| (Millions of Canadian dollars) | October 31 2013 | October 31 2012 | ||||||
Retail | $ | 71 | $ | – | ||||
Wholesale | ||||||||
Business | 815 | 981 | ||||||
Sovereign (2) | – | – | ||||||
Bank (3) | 3 | 2 | ||||||
Total | $ | 889 | $ | 983 | ||||
| (1) | Average balance of gross individually assessed impaired loans for the year ended October 31, 2013 was $887 million (October 31, 2012 – $929 million). |
| (2) | Sovereign refers to all central governments and agencies, central banks, as well as other qualifying public sector entities and multilateral development banks. |
| (3) | Bank refers primarily to regulated deposit-taking institutions and securities firms. |
134 Royal Bank of Canada: Annual Report 2013 Consolidated Financial Statements
Table of Contents
Note 6 Derecognition of financial assets
|
We enter into transactions in which we transfer financial assets such as loans or securities to SPE’s or non-SPE third parties. The transferred financial assets are derecognized from our Consolidated Balance Sheets when we transfer substantially all of the risks and rewards of ownership of the financial assets. When we are exposed to substantially all of the risks and rewards of the assets, or when we have neither transferred nor retained substantially all of the risks and rewards but retain control of the financial assets, we continue to recognize the financial assets on our Consolidated Balance Sheets and a liability is recognized for the cash proceeds received.
The majority of assets transferred under repurchase agreements, securities lending agreements, and in our Canadian residential mortgage securitization transactions do not qualify for derecognition.
Transferred financial assets not derecognized
Securitization of Canadian residential mortgage loans
We securitize insured Canadian residential mortgage loans through the creation of MBS pools under the National Housing Act MBS (NHA MBS) program. All loans securitized under the NHA MBS program are required to be insured by the Canadian Mortgage Housing Corporation (CMHC) or a third-party insurer. We require the borrower to pay the insurance for mortgages in which the loan amount is greater than 80% of the original appraised value of the property (loan-to-value ratio (LTV)). For residential mortgage loans with an LTV ratio less than 80% and securitized under this program we are required to insure the mortgages at our own expense. Under the NHA-MBS program, we are responsible for making all payments due on our issued MBS, regardless of whether we collect the necessary funds from the mortgagor or the insurer. When the borrower defaults on the mortgage payment, we submit a claim to the insurer if the amount recovered from the collection or foreclosure process is lower than the sum of the principal balance, accrued interest and collection costs on the outstanding loan. The insurance claim process is managed by the insurance provider in accordance with the insurer’s policies and covers the entire unpaid loan balance plus generally up to 12 months of interest, selling costs and other eligible expenses. If an insurance claim is denied, a loss is recognized in Provision for credit losses in our Consolidated Statements of Income. The amount recorded as a loss is not significant to our Consolidated Financial Statements and no significant losses were incurred due to legal action arising from a mortgage default during 2013 and 2012.
We sell the NHA MBS pools primarily to a government-sponsored SPE under the Canada Mortgage Bond (CMB) program. The SPE periodically issues CMB, which are guaranteed by the government, and sells them to third-party investors. Proceeds of the CMB issuances are used by the SPE to purchase the NHA MBS pools from eligible NHA MBS issuers who participate in the issuance of a particular CMB series. Our continuing involvement includes servicing, either ourselves or through a third party servicer, the underlying residential mortgage loans we have securitized. We also act as counterparty in interest rate swap agreements where we pay the SPE the interest due to CMB investors and receive the interest on the underlying MBS and reinvested assets. As part of the swap, we are also required to maintain a principal reinvestment account for principal payments received on the underlying mortgage loans to meet the repayment obligation upon maturity of the CMB. We reinvest the collected principal payments in permitted investments as outlined in the swap agreement.
We have determined that all of the NHA MBS program loans transferred to the SPE do not qualify for derecognition as we have not transferred substantially all of the risks and rewards of ownership. As a result, these transferred MBS continue to be classified as residential mortgage loans and recognized on our Consolidated Balance Sheets. The cash received for these transferred MBS is treated as a secured borrowing and a corresponding liability recorded in Deposits – Business and government on our Consolidated Balance Sheets.
Securities sold under repurchase agreements and securities loaned
We also enter into transactions such as repurchase agreements and securities lending agreements where we transfer assets under agreements to repurchase them on a future day and retain substantially all of the credit, interest rate and foreign exchange risks and rewards associated with the assets. These transferred assets remain on our Consolidated Balance Sheets and are accounted for as collateralized borrowing transactions.
The following table provides information on the carrying amount and fair value of the transferred assets that did not qualify for derecognition, and their associated liabilities.
| As at | ||||||||||||||||||||||||||||||||||
| October 31, 2013 | October 31, 2012 | |||||||||||||||||||||||||||||||||
| (Millions of Canadian dollars) | Canadian residential mortgage loans(1) (2) | Securities sold under repurchase agreements (3) | Securities loaned(3) | Total | Canadian residential mortgage loans (1) (2) | Securities sold under repurchase agreements (3) | Securities loaned (3) | Total | ||||||||||||||||||||||||||
Carrying amount of transferred assets that fail derecognition | $ | 43,092 | $ | 55,715 | $ | 4,701 | $ | 103,508 | $ | 45,973 | $ | 59,332 | $ | 4,700 | $ | 110,005 | ||||||||||||||||||
Carrying amount of associated liabilities | 43,019 | 55,715 | 4,701 | 103,435 | 45,878 | 59,332 | 4,700 | 109,910 | ||||||||||||||||||||||||||
Fair value of transferred assets | $ | 42,921 | $ | 55,715 | $ | 4,701 | $ | 103,337 | $ | 45,994 | $ | 59,332 | $ | 4,700 | $ | 110,026 | ||||||||||||||||||
Fair value of associated liabilities | 43,418 | 55,715 | 4,701 | 103,834 | 47,014 | 59,332 | 4,700 | 111,046 | ||||||||||||||||||||||||||
Fair value of net position | $ | (497 | ) | $ | – | $ | – | $ | (497 | ) | $ | (1,020 | ) | $ | – | $ | – | $ | (1,020 | ) | ||||||||||||||
| (1) | Includes Canadian residential mortgages loans transferred primarily to Canada Housing Trust at the initial securitization and other permitted investments used for funding requirements after the initial securitization. |
| (2) | CMB investors have legal recourse only to the transferred assets, and do not have recourse to our general assets. |
| (3) | Does not include over-collateralization of assets pledged. |
Consolidated Financial Statements Royal Bank of Canada: Annual Report 2013 135
Table of Contents
Note 7 Special purpose entities
|
Consolidated special purpose entities
The following table presents the assets and liabilities of consolidated special purpose entities recorded on our Consolidated Balance Sheets.
| As at October 31, 2013 | ||||||||||||||||||||
| (Millions of Canadian dollars) | Securitization and funding vehicles(1) | Structured finance | Investment funds | Other | Total | |||||||||||||||
Consolidated assets (2), (3) | ||||||||||||||||||||
Cash and due from banks and interest bearing deposits with banks | $ | – | $ | 15 | $ | 3 | $ | 5 | $ | 23 | ||||||||||
Securities | 3 | 4,396 | 375 | 317 | 5,091 | |||||||||||||||
Other assets | – | 29 | – | 16 | 45 | |||||||||||||||
| $ | 3 | $ | 4,440 | $ | 378 | $ | 338 | $ | 5,159 | |||||||||||
Consolidated liabilities | ||||||||||||||||||||
Deposit | $ | 11,874 | $ | 741 | $ | – | $ | 9 | $ | 12,624 | ||||||||||
Other liabilities (4) | 876 | 3,736 | – | 98 | 4,710 | |||||||||||||||
Non-controlling interests | 1,731 | – | – | – | 1,731 | |||||||||||||||
| $ | 14,481 | $ | 4,477 | $ | – | $ | 107 | $ | 19,065 | |||||||||||
| As at October 31, 2012 | ||||||||||||||||||||
| (Millions of Canadian dollars) | Securitization and funding vehicles (1) | Structured finance | Investment funds | Other | Total | |||||||||||||||
Consolidated assets(2), (3) | ||||||||||||||||||||
Cash and due from banks and interest bearing deposits with banks | $ | – | $ | 24 | $ | 8 | $ | 4 | $ | 36 | ||||||||||
Securities | – | 3,878 | 371 | 79 | 4,328 | |||||||||||||||
Other assets | 15 | 37 | – | 18 | 70 | |||||||||||||||
| $ | 15 | $ | 3,939 | $ | 379 | $ | 101 | $ | 4,434 | |||||||||||
Consolidated liabilities | ||||||||||||||||||||
Deposit | $ | 7,046 | $ | 816 | $ | – | $ | 20 | $ | 7,882 | ||||||||||
Other liabilities (4) | 850 | 3,146 | – | 84 | 4,080 | |||||||||||||||
Non-controlling interests | 1,711 | – | – | – | 1,711 | |||||||||||||||
| $ | 9,607 | $ | 3,962 | $ | – | $ | 104 | $ | 13,673 | |||||||||||
| (1) | We transferred credit card and auto loan receivables to securitization vehicles and mortgages to RBC Capital Trust and RBC Covered Bond Guarantor Limited Partnership (Guarantor LP). These transferred assets were not derecognized from our Consolidated Balance Sheets and the consideration received was recorded as liabilities to the SPEs, as we retain control over substantially all of the risks and rewards of the transferred assets. Upon consolidation of the SPEs, only the notes and the innovative capital instruments issued to the third-party investors are reported in the above table. |
| (2) | As at October 31, 2013, our consolidated compensation vehicles held none of our common shares (October 31, 2012 – $15 million), which are reported as Treasury shares and this amount represents the total assets of these vehicles. The obligation to provide our common shares to employees is recorded as an increase to Retained earnings as the expense for the corresponding share-based compensation plan is recognized. |
| (3) | Investors generally have recourse only to the assets of the related consolidated SPEs and do not have recourse to our general assets unless we breach our contractual obligations to those SPEs. In the ordinary course of business, the assets of each consolidated SPE can generally only be used to settle the obligations of the SPE. We may also provide liquidity facilities or credit enhancement facilities to, or enter into derivative transactions with, the SPEs. |
| (4) | Other liabilities generally represent notes issued by the SPEs. |
Unconsolidated special purpose entities
We also hold significant interests in certain SPEs that we do not consolidate but in respect of which we have recorded on our Consolidated Balance Sheets assets and liabilities arising from our transactions and involvement with these SPEs. In addition, we may be a sponsor of certain SPEs in which we have interests. In determining whether we are a sponsor of an SPE, we consider both qualitative and quantitative factors, including the purpose and nature of the SPE, our continuing involvement in the SPE and whether we hold subordinated interests in the SPE.
136 Royal Bank of Canada: Annual Report 2013 Consolidated Financial Statements
Table of Contents
The following table presents assets and liabilities recorded on our Consolidated Balance Sheets related to unconsolidated SPEs that we sponsor or in which we hold a significant interest. It also presents the total assets of these SPEs and our maximum exposure to loss from our involvement with these SPEs.
| As at October 31, 2013 | ||||||||||||||||||||||||
| (Millions of Canadian dollars) | Multi-seller conduits(1) | Structured finance | Investment funds | Third-party securitization vehicles | Other (2) | Total | ||||||||||||||||||
On-balance sheet assets | ||||||||||||||||||||||||
Securities | $ | 14 | $ | – | $ | 808 | $ | 322 | $ | 51 | $ | 1,195 | ||||||||||||
Loans | 896 | – | – | 774 | – | 1,670 | ||||||||||||||||||
Derivatives | – | 20 | – | – | – | 20 | ||||||||||||||||||
Other assets | – | 680 | 1 | – | 195 | 876 | ||||||||||||||||||
| $ | 910 | $ | 700 | $ | 809 | $ | 1,096 | $ | 246 | $ | 3,761 | |||||||||||||
On-balance sheet liabilities | ||||||||||||||||||||||||
Derivatives | 6 | – | – | 2 | – | 8 | ||||||||||||||||||
Other liabilities | 236 | – | 1 | – | – | 237 | ||||||||||||||||||
| $ | 242 | $ | – | $ | 1 | $ | 2 | $ | – | $ | 245 | |||||||||||||
Total assets of unconsolidated special purpose entities | $ | 31,075 | $ | 3,895 | $ | 1,621 | $ | 8,098 | $ | 173,279 | $ | 217,968 | ||||||||||||
Maximum exposure to loss (3) | $ | 31,556 | $ | 1,272 | $ | 1,461 | $ | 992 | $ | 125 | $ | 35,406 | ||||||||||||
| As at October 31, 2012 | ||||||||||||||||||||||||
| (Millions of Canadian dollars) | Multi-seller conduits (1) | Structured finance | Investment funds | Third-party securitization vehicles | Other (2) | Total | ||||||||||||||||||
On-balance sheet assets | ||||||||||||||||||||||||
Securities | $ | 26 | $ | – | $ | 1,077 | $ | 118 | $ | 76 | $ | 1,297 | ||||||||||||
Loans | 1,391 | – | – | 1,074 | – | 2,465 | ||||||||||||||||||
Derivatives | 2 | 97 | – | – | – | 99 | ||||||||||||||||||
Other assets | – | 1,111 | 1 | – | 169 | 1,281 | ||||||||||||||||||
| $ | 1,419 | $ | 1,208 | $ | 1,078 | $ | 1,192 | $ | 245 | $ | 5,142 | |||||||||||||
On-balance sheet liabilities | ||||||||||||||||||||||||
Derivatives | 11 | – | – | – | – | 11 | ||||||||||||||||||
Other liabilities | 247 | – | 43 | – | – | 290 | ||||||||||||||||||
| $ | 258 | $ | – | $ | 43 | $ | – | $ | – | $ | 301 | |||||||||||||
Total assets of unconsolidated special purpose entities | $ | 29,582 | $ | 5,039 | $ | 1,584 | $ | 6,811 | $ | 153,007 | $ | 196,023 | ||||||||||||
Maximum exposure to loss (3) | $ | 30,029 | $ | 1,760 | $ | 1,082 | $ | 1,266 | $ | 314 | $ | 34,451 | ||||||||||||
| (1) | Total assets of unconsolidated SPEs represent maximum assets that may have to be purchased by the conduits under purchase commitments outstanding. Actual assets held by these conduits as at October 31, 2013, were $18.8 billion (October 31, 2012 – $17.1 billion). |
| (2) | Includes tax credit funds and mutual funds that we sponsor which are described in our Other significant vehicles discussion. |
| (3) | The maximum exposure to loss resulting from our significant interests in these SPEs consists mostly of investments, loans, fair value of derivatives, liquidity and credit enhancement facilities. The maximum exposure to loss of the multi-seller conduits is higher than the on-balance sheet assets primarily by the notional amounts of the backstop liquidity and credit enhancement facilities. Refer to Note 26. |
Securitization and funding vehicles
Credit card securitization vehicle
We securitize a portion of our credit card receivables through an SPE on a revolving basis. The SPE is financed through the issuance of senior and subordinated notes collateralized by the underlying credit card receivables. The senior notes are issued to third-party investors and the subordinated notes are owned by us. The third-party investors have recourse only to the transferred assets.
We continue to service the credit card receivables sold to the SPE and perform an administrative role for the SPE. We also provide first-loss protection to the SPE through our ownership of all the subordinated notes issued by the SPE and our interest in the excess spread (residual net interest income after all trust expenses) which is subordinated to the SPE’s obligations to the senior noteholders.
Additionally, we may own some senior notes as investments or for market-making activities; we retain a cash reserve account of the SPE from time to time; we provide subordinated loans to the SPE to pay upfront expenses; and we act as counterparty to interest rate and cross currency swap agreements which hedge the SPE’s interest rate and currency risk exposure.
We consolidate the SPE because the significant activities of the SPE were predetermined by us at inception and we control the timing and size of new issuances, obtain significant funding benefits from the SPE and are exposed to the majority of the residual ownership risks through the credit support provided.
Auto loan securitization vehicles
We obtained control of certain auto loan securitization vehicles as a result of the acquisition of the Canadian auto finance and deposit business of Ally Financial Inc. completed in 2013. See Note 11 for further details. The SPEs issued senior and subordinated notes collateralized by auto loan receivables originated and transferred to the SPEs by Ally Financial Inc. We continue to provide credit enhancement to the outstanding notes through overcollateralization, cash reserve accounts and our interest in the excess spread, which is subordinated to the noteholders. We also act as swap counterparty for one of the SPE’s interest rate swap agreements which hedge its interest rate risk exposure. The third-party investors have recourse only to the transferred assets.
We consolidate these SPEs because we have the decision making powers to obtain the majority of the benefits of the SPEs and are exposed to the majority of the residual ownership risks. As at October 31, 2013, there were $943 million of deposits outstanding related to these structures.
Consolidated Financial Statements Royal Bank of Canada: Annual Report 2013 137
Table of Contents
Note 7 Special purpose entities(continued)
|
Collateralized commercial paper vehicle
During the year, we established a funding vehicle that provides loans to us and finances those loans by issuing commercial paper to third party investors. The SPE’s commercial paper carries an equivalent credit rating to RBC because we are obligated to advance funds to the SPE in the event there are insufficient funds from other sources to settle maturing commercial paper. We pledge collateral to secure the loans and are exposed to the market and credits risks of the pledged securities. We administer the SPE and earn an administration fee for providing these services. We consolidate the SPE because we have decision making power to obtain the majority of the benefits of the SPE, are the sole borrower from the structure, and are exposed to majority of the residual ownership risks through the credit support provided.
Funding vehicles
RBC Capital Trust (Trust), RBC Capital Trust II (Trust II) and Guarantor LP were created to issue innovative capital instruments, or guarantees of covered bonds. With the proceeds, we issued senior deposit notes to Trust II and transferred our mortgages to the Trust and Guarantor LP. These mortgages are not derecognized from our Consolidated Balance Sheets and the transfers are accounted for as secured financing transactions as we retain control over substantially all of the risks and rewards of the transferred assets. The covered bonds issued by Guarantor LP are direct, unsecured and unconditional obligations of RBC; therefore, investors may have recourse to our general assets if the mortgage assets in Guarantor LP are insufficient to satisfy its liabilities.
We consolidate the trusts and Guarantor LP as, through our roles as trustee, administrative agent and equity investor, we have the decision making power to retain the majority of the benefits of the trusts and Guarantor LP. Upon consolidation of the SPEs, all the intercompany balances are eliminated except for the innovative capital instruments issued to the third-party investors.
Structured finance
U.S. ARS Trusts
We purchased U.S. ARS from certain trusts (U.S. ARS Trusts) which fund their long-term investments in student loans by issuing short-term senior and subordinated notes. We are subject to losses on these U.S. ARS Trusts if defaults are experienced on the underlying student loans; however, in the majority of these structures, the principal and accrued interest on the student loans is guaranteed by U.S. government agencies. We act as auction agent for some of these entities but have no legal obligation to purchase the notes issued by these entities in the auction process.
We do not consolidate these U.S. ARS Trusts as we do not have decision making rights over the investing and financing activities of the Trusts and are not exposed to the majority of residual ownership risks. We have significant interests in certain of these entities through our note holdings.
ARS TOB programs
We also sold ARS into Tender Option Bond (TOB) programs, where each program consists of a credit enhancement (CE) trust and a TOB trust. Each ARS sold to the TOB program is supported by a letter of credit and liquidity facility issued by us, which requires us to extend funding if there are any losses on the ARS. The CE trust certificate is deposited into a TOB trust which provides the financing of the purchase of the underlying security through the issuance of floating-rate certificates to short-term investors and a residual certificate to a single third-party investor. Both the CE and the TOB trusts are SPEs. We are the remarketing agent for the floating-rate certificates and we provide liquidity facilities to each of the ARS TOB programs to purchase any floating-rate certificates that have been tendered but not successfully remarketed. We receive market-based fees for acting as the remarketing agent and providing the letters of credit and liquidity facilities.
We consolidate these ARS TOB programs as we control the CE trust and are exposed to the majority of the residual ownership risks of the underlying ARS through our provision of the credit enhancement and the liquidity facility.
Municipal bond TOB programs
We utilize the TOB funding vehicle to finance other taxable and tax-exempt municipal bond assets within our Capital Markets segment. The structure of municipal bond TOB programs that we are involved with is similar to the structure of the ARS TOB programs described above. However, in certain municipal bond TOB programs, we also purchase residual certificates issued by these TOB vehicles which expose us to credit risk of the underlying bonds as well as interest rate risk of the structure. Where we own the residual certificate, the assets transferred into the TOB vehicle continue to be recorded on our Consolidated Balance Sheets as we have not transferred substantially all of the risks and rewards of ownership. We consolidate programs in which we are the holder of the residual certificate as we have decision making power over the selection of the underlying municipal bonds and the ability to terminate the structure, and are exposed to the majority of the residual ownership risks.
In certain other municipal bond TOB programs, the residual certificates are held by third-parties and we do not provide credit enhancement of the underlying assets but only provide liquidity facilities on the floating-rate certificates; therefore, we do not consolidate these programs. The assets transferred into these programs are derecognized from our Consolidated Balance Sheets.
Investment funds
We enter into fee-based equity derivative transactions with third parties including mutual funds, unit investment trusts and other investment funds. These transactions provide their investors with the desired exposure to a reference fund, and we economically hedge our exposure to these derivatives by investing in those reference funds. We also act as custodian or administrator for several funds. We do not consolidate those reference funds that are managed by third parties as we do not have power to direct their investing activities.
We also enter into certain fee-based equity derivative transactions similar to those described above except that our investments in the reference funds are held by an intermediate limited partnership entity (intermediate entity) in which we hold a substantial majority of the SPE’s equity interests. We consolidate the intermediate entity because we have the decision making power to direct all the activities of the entity and are exposed to a majority of the risks and rewards through our equity investments.
Starting in 2013, we provide liquidity facilities to certain third-party investment funds. The funds issued unsecured variable-rate preferred shares and invest in portfolios of tax-exempt municipal bonds. Undrawn liquidity commitments expose us to liquidity risk of the preferred shares and drawn commitments expose us to the credit risk of the underlying municipal bonds. We do not consolidate these third-party managed funds as we do not have power to direct their investing activities.
Multi-seller conduits
We administer five multi-seller asset-backed commercial paper (ABCP) conduit programs (multi-seller conduits) – two in Canada and three in the U.S. These conduits primarily purchase financial assets from clients and finance those purchases by issuing ABCP.
138 Royal Bank of Canada: Annual Report 2013 Consolidated Financial Statements
Table of Contents
We do not maintain any ownership or retained interests in the multi-seller conduits that we administer and have no rights to, or control of, their assets. As the administrative agent, we earn a residual fee for providing services such as coordinating funding activities, transaction structuring, documentation, execution and monitoring of transactions. The ABCP issued by each multi-seller conduit is in the conduit’s own name with recourse to the financial assets owned by each multi-seller conduit, and is non-recourse to us except through our participation in liquidity and/or credit enhancement facilities. We may purchase ABCP issued by our multi-seller conduits from time to time in our capacity as placement agent in order to facilitate the overall program liquidity.
We provide transaction-specific and program-wide liquidity facilities to the multi-seller conduits. In addition, we provide program-wide credit enhancement to the multi-seller conduits which obligate us to purchase assets or advance funds in the event the multi-seller conduit does not otherwise have funds from other sources, such as from the liquidity facilities, to settle maturing ABCP. In some cases, we or another third party may provide transaction-specific credit enhancement which can take various forms. We receive market-based fees for providing these liquidity and credit facilities.
Each transaction is structured with transaction-specific first loss protection provided by the third-party seller. This enhancement can take various forms, including but not limited to overcollateralization, excess spread, subordinated classes of financial assets, guarantees or letters of credit. The amount of this enhancement varies but is generally sized to cover a multiple of loss experience.
An unrelated third party (expected loss investor) absorbs credit losses, up to a maximum contractual amount, that may occur in the future on the assets in the multi-seller conduits before the multi-seller conduits’ debt holders and us. In return for assuming this multi-seller conduit first-loss position, each multi-seller conduit pays the expected loss investor a return commensurate with its risk position. The expected loss investor has substantive power to direct the majority of the activities which significantly impact the conduit’s economic performance, including initial selection and approval of the asset purchase commitments and liquidity facilities, approval of renewal and amendment of these transactions and facilities, sale or transfer of assets, ongoing monitoring of asset performance, mitigation of credit losses, and management of the ABCP liabilities.
We do not consolidate these multi-seller conduits as we do not have the decision-making power to direct the significant activities noted above in order to obtain the majority of the benefits of the SPE.
Third-party securitization vehicles
We hold significant interests in certain third-party securitization vehicles which are SPEs. We, as well as other financial institutions, are obligated to provide funding up to our maximum commitment level and are exposed to credit losses on the underlying assets after various credit enhancements. Enhancement can take various forms, including but not limited to overcollateralization, excess spread, subordinated classes of financial assets, guarantees or letters of credit. The amount of this enhancement varies but is generally sized to cover a multiple of loss experience. We do not consolidate these entities as we do not have decision making rights over the investing and financing activities of the SPEs and are not exposed to a majority of the residual ownership risks.
We also invest in the securities issued by unconsolidated third-party SPEs, including government-sponsored SPEs, as part of our trading activities. These investments do not carry a funding commitment; therefore our maximum exposure to loss is limited to our investment. We do not consolidate these entities as we do not have any decision making rights over the activities of the SPEs and are not exposed to a majority of the residual ownership risks.
Other
Credit investment products
We use SPEs to generally transform credit derivatives into cash instruments, to distribute credit risk and to create customized credit products to meet investors’ specific requirements. We enter into derivative contracts, including credit derivatives, to purchase protection from these SPEs (credit protection) and convert various risk factors such as yield, currency or credit risk of underlying assets to meet the needs of the investors. We act as sole arranger and swap provider for certain SPEs and, in some cases, fulfil other administrative functions for the SPEs.
We do not consolidate these credit investment product SPEs as we do not have decision making power over the significant activities, which include selection of the collateral and reference portfolio, and are not exposed to a majority of the benefits or risks of the SPE.
Tax credit funds
We created certain funds to pass through tax credits received from underlying low-income housing or historic rehabilitation real estate projects to third parties (tax credit funds). We are sponsors of the tax credit funds as a result of our responsibility to manage the funds, arrange the financing, and perform the administrative duties of these tax credit funds. We do not consolidate the tax credit funds as the investors in these funds have the decision making power to select the underlying investments and are exposed to the majority of the residual ownership and tax risks of the funds.
Mutual and pooled funds
We are also sponsors of our mutual and pooled funds as a result of our ability to influence the investment decisions of the mutual funds and our continuing involvement in the administration of these funds. We consolidate certain mutual and pooled funds in which we have direct investment or seed capital representing greater than 50% of the fund units as we have both decision making power over the fund’s investment activities and exposure to the majority of the benefits and residual ownership risks of the fund due to our direct investment or seed capital.
Compensation trusts
We use compensation trusts, which primarily hold our own common shares, to economically hedge our obligation to certain employees under some of our share-based compensation programs. We consolidate these trusts because we have the decision making power over the activities of the trusts, obtain the majority of the benefits of the trusts to hedge our share-based compensation programs, and are exposed to the majority of the residual ownership risks.
Note 8 Derivative financial instruments and hedging activities
|
Derivative instruments are categorized as either financial or non-financial derivatives. Financial derivatives are financial contracts whose value is derived from an underlying interest rate, foreign exchange rate, credit risk, and equity or equity index. Non-financial derivatives are contracts whose value is derived from a precious metal, commodity instrument or index. Notional amount of derivatives represents the contract amount used as a reference point to calculate payments. Notional amounts are generally not exchanged by counterparties, and do not reflect our exposure at default.
Consolidated Financial Statements Royal Bank of Canada: Annual Report 2013 139
Table of Contents
Note 8 Derivative financial instruments and hedging activities(continued)
|
Financial derivatives
Forwards and futures
Forward contracts are effectively non-standardized agreements that are transacted between counterparties in the over-the-counter market, whereas futures are standardized contracts with respect to amounts and settlement dates, and are traded on regular futures exchanges. Examples of forwards and futures are described below:
Interest rate forwards (forward rate agreements) and futures are contractual obligations to buy or sell an interest-rate sensitive financial instrument on a predetermined future date at a specified price.
Foreign exchange forwards and futures are contractual obligations to exchange one currency for another at a specified price for settlement at a predetermined future date.
Equity forwards and futures are contractual obligations to buy or sell at a fixed value (the specified price) of an equity index, a basket of stocks or a single stock at a predetermined future date.
Swaps
Swaps are over-the-counter contracts in which two counterparties exchange a series of cash flows based on agreed upon rates to a notional amount. Examples of swap agreements are described below.
Interest rate swaps are agreements where two counterparties exchange a series of payments based on different interest rates applied to a notional amount in a single currency. Cross currency swaps involve the exchange of fixed payments in one currency for the receipt of fixed payments in another currency. Cross currency interest rate swaps involve the exchange of both interest and notional amounts in two different currencies.
Equity swaps are contracts in which one counterparty agrees to pay or receive from the other cash flows based on changes in the value of an equity index, a basket of stocks or a single stock.
Options
Options are contractual agreements under which the seller (writer) grants the purchaser the right, but not the obligation, either to buy (call option) or sell (put option), a security, exchange rate, interest rate, or other financial instrument or commodity at a predetermined price, at or by a specified future date. The seller (writer) of an option can also settle the contract by paying the cash settlement value of the purchaser’s right. The seller (writer) receives a premium from the purchaser for this right. The various option agreements that we enter into include but are not limited to interest rate options, foreign currency options, equity options and index options.
Credit derivatives
Credit derivatives are over-the-counter contracts that transfer credit risk related to an underlying financial instrument (referenced asset) from one counterparty to another. Examples of credit derivatives are described below.
Credit default swaps provide protection against the decline in value of the referenced asset as a result of specified credit events such as default or bankruptcy. They are similar in structure to an option, whereby the purchaser pays a premium to the seller of the credit default swap in return for payment contingent on a credit event affecting the referenced asset.
Credit default baskets are similar to credit default swaps except that the underlying referenced financial instrument is a group of assets instead of a single asset.
Total return swaps are contracts where one counterparty agrees to pay or receive from the other cash flows based on changes in the value of the referenced asset.
Other derivative products
Certain warrants and loan commitments that meet the definition of derivative are also included as derivative instruments.
Non-financial derivatives
We also transact in non-financial derivative products including precious metal and commodity derivative contracts in both the over-the-counter and exchange markets.
Derivatives issued for trading purposes
Most of our derivative transactions relate to sales and trading activities. Sales activities include the structuring and marketing of derivative products to clients to enable them to transfer, modify or reduce current or expected risks. Trading involves market-making, positioning and arbitrage activities. Market-making involves quoting bid and offer prices to other market participants with the intention of generating revenue based on spread and volume. Positioning involves managing market risk positions with the expectation of profiting from favourable movements in prices, rates or indices. Arbitrage activities involve identifying and profiting from price differentials between markets and products.
Derivatives issued for other-than-trading purposes
We also use derivatives for purposes other than trading, primarily for hedging, in conjunction with the management of interest rate, credit, equity and foreign exchange risk related to our funding, lending, investment activities and asset/liability management.
Interest rate swaps are used to manage our exposure to interest rate risk by modifying the repricing or maturity characteristics of existing and/or forecasted assets and liabilities, including funding and investment activities. Purchased options are used to hedge redeemable deposits and other options embedded in consumer products. We manage our exposure to foreign currency risk with cross currency swaps and foreign exchange forward contracts. We predominantly use credit derivatives to manage our credit exposures. We mitigate industry sector concentrations and single-name exposures related to our credit portfolio by purchasing credit derivatives to transfer credit risk to third parties.
Certain derivatives and cash instruments are specifically designated and qualify for hedge accounting. We apply hedge accounting to minimize volatility in earnings and capital caused by changes in interest rates or foreign exchange rates. Interest rate and currency fluctuations will either cause assets and liabilities to appreciate or depreciate in market value or cause variability in forecasted cash flows. When a hedging relationship is effective, gains, losses, revenue and expenses of the hedging instrument will offset the gains, losses, revenue and expenses of the hedged item. We largely assess and measure the effectiveness of a hedging relationship based on the change in fair value of the derivative hedging instrument relative to the change in fair value of the hedged item. When cash instruments are designated as hedges of currency risks, only changes in their value due to currency risk are included in the assessment and measurement of hedge effectiveness.
From time to time, we also enter into derivative transactions to economically hedge certain exposures that do not otherwise qualify for hedge accounting, or where hedge accounting is not considered economically feasible to implement. In such circumstances, changes in fair value are reflected in Non-interest income.
After-tax unrealized gains relating to de-designated hedges of $46 million (before-tax unrealized gains of $62 million) included in Other components of equity as at October 31, 2013, are expected to be reclassified to Net interest income within the next 12 months.
140 Royal Bank of Canada: Annual Report 2013 Consolidated Financial Statements
Table of Contents
The following table presents the fair values of the derivative and non-derivative instruments categorized by their hedging relationships, as well as derivatives that are not designated in hedging relationships.
Derivatives and non-derivative instruments
| As at | ||||||||||||||||||||||||||||||||||
| October 31, 2013 | October 31, 2012 | |||||||||||||||||||||||||||||||||
Designated as hedging instruments in hedging relationships | Designated as hedging hedging relationships | |||||||||||||||||||||||||||||||||
| (Millions of Canadian dollars) | Cash flow hedges | Fair value | Net investment hedges | Not designated in a hedging relationship | Cash flow hedges | Fair value | Net investment hedges | Not designated in a hedging relationship | ||||||||||||||||||||||||||
Assets | ||||||||||||||||||||||||||||||||||
Derivative instruments | $ | 555 | $ | 1,461 | $ | 32 | $ | 72,774 | $ | 837 | $ | 1,894 | $ | 5 | $ | 88,557 | ||||||||||||||||||
Liabilities | ||||||||||||||||||||||||||||||||||
Derivative instruments | $ | 460 | $ | 376 | $ | 95 | $ | 75,814 | $ | 680 | $ | 284 | $ | 144 | $ | 95,653 | ||||||||||||||||||
Non-derivative instruments | – | – | 17,499 | – | – | – | 16,777 | – | ||||||||||||||||||||||||||
Results of hedge activities recorded in Net income and Other comprehensive income
| For the year ended | ||||||||||||||||||||||||||||||||||||||||
| October 31, 2013 | October 31, 2012 | October 31, 2011 | ||||||||||||||||||||||||||||||||||||||
| (Millions of Canadian dollars) | Net gains (losses) included in Non-interest income | Net gains (losses) included in Net interest income | After-tax unrealized gains (losses) included in OCI | Net gains (losses) included in Non-interest income | Net gains (losses) included in Net interest income | After-tax unrealized gains (losses) included in OCI | Net gains (losses) included in Non-interest income | Net gains (losses) included in Net interest income | After-tax unrealized gains (losses) included in OCI | |||||||||||||||||||||||||||||||
Fair value hedges | ||||||||||||||||||||||||||||||||||||||||
(Losses) gains on hedging instruments | $ | (551 | ) | $ | n.a. | $ | n.a. | $ | (66 | ) | $ | n.a. | $ | n.a. | $ | 148 | $ | n.a. | $ | n.a. | ||||||||||||||||||||
Gains (losses) on hedged items attributable to the hedged risk | 459 | n.a. | n.a. | (15 | ) | n.a. | n.a. | (134 | ) | n.a. | n.a. | |||||||||||||||||||||||||||||
Ineffective portion | (92 | ) | n.a. | n.a. | (81 | ) | n.a. | n.a. | 14 | n.a. | n.a. | |||||||||||||||||||||||||||||
Cash flow hedges | ||||||||||||||||||||||||||||||||||||||||
Ineffective portion | (13 | ) | n.a. | n.a. | (4 | ) | n.a. | n.a. | 14 | n.a. | n.a. | |||||||||||||||||||||||||||||
Effective portion | n.a. | n.a. | (11 | ) | n.a. | n.a. | 32 | n.a. | n.a. | 298 | ||||||||||||||||||||||||||||||
Reclassified to income during the period (1) | n.a. | 40 | n.a. | n.a. | (35 | ) | n.a. | n.a. | (161 | ) | n.a. | |||||||||||||||||||||||||||||
Net investment hedges | ||||||||||||||||||||||||||||||||||||||||
Ineffective portion | 1 | n.a. | n.a. | 1 | n.a. | n.a. | 4 | n.a. | n.a. | |||||||||||||||||||||||||||||||
Foreign currency Gains (losses) | n.a. | n.a. | 1,402 | n.a. | n.a. | 113 | n.a. | n.a. | (625 | ) | ||||||||||||||||||||||||||||||
(Losses) gains from hedges | n.a. | n.a. | (912 | ) | n.a. | n.a. | – | n.a. | n.a. | 717 | ||||||||||||||||||||||||||||||
| $ | (104 | ) | $ | 40 | $ | 479 | $ | (84 | ) | $ | (35 | ) | $ | 145 | $ | 32 | $ | (161 | ) | $ | 390 | |||||||||||||||||||
| (1) | After-tax gains of $30 million were reclassified from Other components of equity to income during the year ended October 31, 2013 (October 31, 2012 – losses of $25 million; October 31, 2011 – losses of $132 million). |
| n.a. | not applicable |
Notional amount of derivatives by term to maturity (absolute amounts)
| As at October 31, 2013 | ||||||||||||||||||||||||
| Term to maturity | ||||||||||||||||||||||||
| (Millions of Canadian dollars) | Within 1 year | 1 to 5 years | Over 5 years(1) | Total | Trading | Other than Trading | ||||||||||||||||||
Over-the-counter contracts | ||||||||||||||||||||||||
Interest rate contracts | ||||||||||||||||||||||||
Forward rate agreements | $ | 364,918 | $ | 93,570 | $ | – | $ | 458,488 | $ | 458,488 | $ | – | ||||||||||||
Swaps | 1,218,382 | 2,718,313 | 1,369,003 | 5,305,698 | 5,095,519 | 210,179 | ||||||||||||||||||
Options purchased | 59,272 | 83,085 | 27,178 | 169,535 | 169,337 | 198 | ||||||||||||||||||
Options written | 59,921 | 81,222 | 33,000 | 174,143 | 174,112 | 31 | ||||||||||||||||||
Foreign exchange contracts | ||||||||||||||||||||||||
Forward contracts | 887,156 | 30,991 | 1,079 | 919,226 | 858,547 | 60,679 | ||||||||||||||||||
Cross currency swaps | 6,054 | 14,420 | 13,796 | 34,270 | 34,270 | – | ||||||||||||||||||
Cross currency interest rate swaps | 131,805 | 308,927 | 144,779 | 585,511 | 555,841 | 29,670 | ||||||||||||||||||
Options purchased | 19,217 | 10,917 | 4,732 | 34,866 | 34,866 | – | ||||||||||||||||||
Options written | 19,737 | 11,729 | 4,682 | 36,148 | 36,148 | – | ||||||||||||||||||
Credit derivatives (2) | 1,650 | 11,498 | 8,961 | 22,109 | 20,704 | 1,405 | ||||||||||||||||||
Other contracts (3) | 57,593 | 42,101 | 20,647 | 120,341 | 120,336 | 5 | ||||||||||||||||||
Exchange–traded contracts | ||||||||||||||||||||||||
Interest rate contracts | ||||||||||||||||||||||||
Futures – long positions | 10,332 | 6,809 | – | 17,141 | 17,103 | 38 | ||||||||||||||||||
Futures – short positions | 20,727 | 13,952 | – | 34,679 | 34,604 | 75 | ||||||||||||||||||
Options purchased | 13,831 | 3,557 | – | 17,388 | 17,388 | – | ||||||||||||||||||
Options written | 11,371 | 1,277 | – | 12,648 | 12,648 | – | ||||||||||||||||||
Foreign exchange contracts | ||||||||||||||||||||||||
Futures – long positions | 6,092 | 9,646 | 102 | 15,840 | 15,840 | – | ||||||||||||||||||
Futures – short positions | 11,381 | 12,617 | – | 23,998 | 23,998 | – | ||||||||||||||||||
Other contracts (3) | 140,471 | 29,786 | 387 | 170,644 | 170,641 | 3 | ||||||||||||||||||
| $ | 3,039,910 | $ | 3,484,417 | $ | 1,628,346 | $ | 8,152,673 | $ | 7,850,390 | $ | 302,283 | |||||||||||||
Consolidated Financial Statements Royal Bank of Canada: Annual Report 2013 141
Table of Contents
Note 8 Derivative financial instruments and hedging activities(continued)
|
| As at October 31, 2012 | ||||||||||||||||||||||||
| Term to maturity | ||||||||||||||||||||||||
| (Millions of Canadian dollars) | Within 1 year | 1 to 5 years | Over 5 years (1) | Total | Trading | Other than Trading | ||||||||||||||||||
Over-the-counter contracts | ||||||||||||||||||||||||
Interest rate contracts | ||||||||||||||||||||||||
Forward rate agreements | $ | 366,587 | $ | 133,964 | $ | – | $ | 500,551 | $ | 500,551 | $ | – | ||||||||||||
Swaps | 1,301,121 | 2,052,851 | 1,042,643 | 4,396,615 | 4,228,985 | 167,630 | ||||||||||||||||||
Options purchased | 35,703 | 46,715 | 23,264 | 105,682 | 105,682 | – | ||||||||||||||||||
Options written | 35,768 | 72,150 | 31,162 | 139,080 | 139,080 | – | ||||||||||||||||||
Foreign exchange contracts | ||||||||||||||||||||||||
Forward contracts | 862,743 | 32,382 | 656 | 895,781 | 849,800 | 45,981 | ||||||||||||||||||
Cross currency swaps | 5,339 | 13,850 | 10,236 | 29,425 | 29,027 | 398 | ||||||||||||||||||
Cross currency interest rate swaps | 125,668 | 279,675 | 129,317 | 534,660 | 512,654 | 22,006 | ||||||||||||||||||
Options purchased | 18,781 | 7,678 | 3,643 | 30,102 | 30,099 | 3 | ||||||||||||||||||
Options written | 17,839 | 7,976 | 3,411 | 29,226 | 29,220 | 6 | ||||||||||||||||||
Credit derivatives (2) | 2,139 | 6,572 | 8,360 | 17,071 | 15,477 | 1,594 | ||||||||||||||||||
Other contracts (3) | 58,635 | 33,471 | 26,883 | 118,989 | 117,868 | 1,121 | ||||||||||||||||||
Exchange-traded contracts | ||||||||||||||||||||||||
Interest rate contracts | ||||||||||||||||||||||||
Futures – long positions | 8,248 | 10,002 | 47,269 | 65,519 | 65,519 | – | ||||||||||||||||||
Futures – short positions | 41,530 | 13,187 | 66,388 | 121,105 | 121,105 | – | ||||||||||||||||||
Options purchased | 8,367 | 252 | 15,678 | 24,297 | 24,297 | – | ||||||||||||||||||
Options written | 3,679 | 247 | 1 | 3,927 | 3,927 | – | ||||||||||||||||||
Foreign exchange contracts | ||||||||||||||||||||||||
Futures – long positions | 172 | – | – | 172 | 172 | – | ||||||||||||||||||
Futures – short positions | 299 | – | – | 299 | 299 | – | ||||||||||||||||||
Other contracts (3) | 106,205 | 37,883 | 7,262 | 151,350 | 151,350 | – | ||||||||||||||||||
| $ | 2,998,823 | $ | 2,748,855 | $ | 1,416,173 | $ | 7,163,851 | $ | 6,925,112 | $ | 238,739 | |||||||||||||
| (1) | Includes contracts maturing in over 10 years with a notional value of $501 billion (October 31, 2012 – $402 billion). The related gross positive replacement cost is $25 billion (October 31, 2012 –$32.3 billion). |
| (2) | Credit derivatives include credit default swaps, total return swaps and credit default baskets, including credit derivatives given guarantee treatment for OSFI regulatory reporting purposes. Credit derivatives with a notional value of $1.4 billion (October 31, 2012 – $1.6 billion) are economic hedges. Trading credit derivatives comprise protection purchased of $11.0 billion (October 31, 2012 – $8.7 billion) and protection sold of $9.7 billion (October 31, 2012 – $6.8 billion). |
| (3) | Other contracts include precious metal, commodity, stable value and equity derivative contracts. |
The following tables indicate the periods when the cash flows are expected to occur and when they are expected to affect profit or loss for cash flow hedges:
| As at October 31, 2013 | ||||||||||||||||||||||||
| (Millions of Canadian dollars) | Within 1 year | 1 to 2 years | 2 to 3 years | 3 to 5 years | Over 5 years | Total | ||||||||||||||||||
Cash inflows from assets | $ | 267 | $ | 232 | $ | 218 | $ | 314 | $ | 321 | $ | 1,352 | ||||||||||||
Cash outflows from liabilities | (533 | ) | (531 | ) | (495 | ) | (602 | ) | (122 | ) | (2,283 | ) | ||||||||||||
Net cash flows | $ | (266 | ) | $ | (299 | ) | $ | (277 | ) | $ | (288 | ) | $ | 199 | $ | (931 | ) | |||||||
| As at October 31, 2012 | ||||||||||||||||||||||||
| (Millions of Canadian dollars) | Within 1 year | 1 to 2 years | 2 to 3 years | 3 to 5 years | Over 5 years | Total | ||||||||||||||||||
Cash inflows from assets | $ | 329 | $ | 314 | $ | 314 | $ | 274 | $ | 85 | $ | 1,316 | ||||||||||||
Cash outflows from liabilities | (370 | ) | (250 | ) | (211 | ) | (261 | ) | (272 | ) | (1,364 | ) | ||||||||||||
Net cash flows | $ | (41 | ) | $ | 64 | $ | 103 | $ | 13 | $ | (187 | ) | $ | (48 | ) | |||||||||
142 Royal Bank of Canada: Annual Report 2013 Consolidated Financial Statements
Table of Contents
Fair value of derivative instruments
| As at | ||||||||||||||||||||||||||||||||||
| October 31, 2013 | October 31, 2012 | |||||||||||||||||||||||||||||||||
| Average fair value for year ended(1) | Year end fair value | Average fair value for year ended (1) | Year end fair value | |||||||||||||||||||||||||||||||
| (Millions of Canadian dollars) | Positive | Negative | Positive | Negative | Positive | Negative | Positive | Negative | ||||||||||||||||||||||||||
Held or issued for trading purposes | ||||||||||||||||||||||||||||||||||
Interest rate contracts | ||||||||||||||||||||||||||||||||||
Forward rate agreements | $ | 505 | $ | 347 | $ | 348 | $ | 262 | $ | 729 | $ | 544 | $ | 690 | $ | 429 | ||||||||||||||||||
Swaps | 80,490 | 78,156 | 73,164 | 69,897 | 89,881 | 84,214 | 93,908 | 87,908 | ||||||||||||||||||||||||||
Options purchased | 2,792 | – | 3,253 | – | 2,527 | – | 2,516 | – | ||||||||||||||||||||||||||
Options written | – | 3,619 | – | 3,966 | – | 3,519 | – | 3,408 | ||||||||||||||||||||||||||
| 83,787 | 82,122 | 76,765 | 74,125 | 93,137 | 88,277 | 97,114 | 91,745 | |||||||||||||||||||||||||||
Foreign exchange contracts | ||||||||||||||||||||||||||||||||||
Forward contracts | 9,229 | 9,381 | 6,774 | 7,629 | 8,622 | 8,314 | 6,288 | 6,251 | ||||||||||||||||||||||||||
Cross currency swaps | 1,505 | 1,053 | 1,432 | 944 | 1,665 | 1,371 | 1,665 | 1,267 | ||||||||||||||||||||||||||
Cross currency interest rate swaps | 9,692 | 16,333 | 9,308 | 12,058 | 10,361 | 19,219 | 8,637 | 18,841 | ||||||||||||||||||||||||||
Options purchased | 1,900 | – | 2,234 | – | 1,632 | – | 1,557 | – | ||||||||||||||||||||||||||
Options written | – | 1,704 | – | 1,744 | – | 1,420 | – | 1,373 | ||||||||||||||||||||||||||
| 22,326 | 28,471 | 19,748 | 22,375 | 22,280 | 30,324 | 18,147 | 27,732 | |||||||||||||||||||||||||||
Credit derivatives (2) | 229 | 254 | 225 | 276 | 459 | 484 | 287 | 306 | ||||||||||||||||||||||||||
Other contracts (3) | 5,203 | 8,275 | 6,635 | 10,085 | 5,331 | 7,991 | 4,351 | 7,369 | ||||||||||||||||||||||||||
| 111,545 | 119,122 | 103,373 | 106,861 | 121,207 | 127,076 | 119,899 | 127,152 | |||||||||||||||||||||||||||
Held or issued for other than trading purposes | ||||||||||||||||||||||||||||||||||
Interest rate contracts | ||||||||||||||||||||||||||||||||||
Swaps | 2,106 | 787 | 2,795 | 766 | ||||||||||||||||||||||||||||||
Options purchased | 1 | – | – | – | ||||||||||||||||||||||||||||||
Options written | – | 1 | – | – | ||||||||||||||||||||||||||||||
| 2,107 | 788 | 2,795 | 766 | |||||||||||||||||||||||||||||||
Foreign exchange contracts | ||||||||||||||||||||||||||||||||||
Forward contracts | 194 | 194 | 232 | 142 | ||||||||||||||||||||||||||||||
Cross currency swaps | – | – | 4 | 19 | ||||||||||||||||||||||||||||||
Cross currency interest rate swaps | 843 | 339 | 861 | 439 | ||||||||||||||||||||||||||||||
Options purchased | – | – | – | – | ||||||||||||||||||||||||||||||
Options written | – | – | – | – | ||||||||||||||||||||||||||||||
| 1,037 | 533 | 1,097 | 600 | |||||||||||||||||||||||||||||||
Credit derivatives (2) | – | 56 | 5 | 29 | ||||||||||||||||||||||||||||||
Other contracts (3) | – | – | 92 | 2 | ||||||||||||||||||||||||||||||
| 3,144 | 1,377 | 3,989 | 1,397 | |||||||||||||||||||||||||||||||
Total gross fair values before netting(4) | 106,517 | 108,238 | 123,888 | 128,549 | ||||||||||||||||||||||||||||||
Valuation adjustments determined on a pooled basis | (505 | ) | (626 | ) | ||||||||||||||||||||||||||||||
Impact of netting agreements that qualify for balance sheet offset | (31,190 | ) | (31,493 | ) | (31,969 | ) | (31,788 | ) | ||||||||||||||||||||||||||
| 74,822 | 76,745 | 91,293 | 96,761 | |||||||||||||||||||||||||||||||
Impact of netting agreements that do not qualify for balance sheet offset (5) | (51,653 | ) | (51,653 | ) | (67,849 | ) | (67,849 | ) | ||||||||||||||||||||||||||
Total | $ | 23,169 | $ | 25,092 | $ | 23,444 | $ | 28,912 | ||||||||||||||||||||||||||
| (1) | Average fair value amounts are calculated based on monthly balances. |
| (2) | Credit derivatives include credit default swaps, total return swaps and credit default baskets, including credit derivatives given guarantee treatment for OSFI regulatory reporting purposes. |
| (3) | Other contracts include precious metal, commodity, stable value and equity derivative contracts. |
| (4) | Total gross fair values before netting include market and credit valuation adjustments that are determined on an instrument-specific basis. |
| (5) | Additional impact of offsetting credit exposures on contracts that do not qualify for balance sheet offset. |
Fair value of derivative instruments by term to maturity
| As at | ||||||||||||||||||||||||||||||||||
| October 31, 2013 | October 31, 2012 | |||||||||||||||||||||||||||||||||
| (Millions of Canadian dollars) | Less than 1 year | 1 to 5 years | Over 5 years | Total | Less than 1 year | 1 to 5 years | Over 5 years | Total | ||||||||||||||||||||||||||
Derivative assets | $ | 13,695 | $ | 27,340 | $ | 33,787 | $ | 74,822 | $ | 12,958 | $ | 29,957 | $ | 48,378 | $ | 91,293 | ||||||||||||||||||
Derivative liabilities | 15,672 | 29,104 | 31,969 | 76,745 | 14,429 | 35,362 | 46,970 | 96,761 | ||||||||||||||||||||||||||
Derivative-related credit risk
Credit risk from derivative transactions is generated by the potential for the counterparty to default on its contractual obligations when one or more transactions have a positive market value to us. Therefore, derivative-related credit risk is represented by the positive fair value of the instrument and is normally a small fraction of the contract’s notional amount.
We subject our derivative-related credit risk to the same credit approval, limit and monitoring standards that we use for managing other transactions that create credit exposure. This includes evaluating the creditworthiness of counterparties, and managing the size, diversification and maturity structure of the portfolio. Credit utilization for all products is compared with established limits on a continual basis and is subject to a standard exception reporting process. We utilize a single internal rating system for all credit risk exposure. In most cases, these internal ratings approximate the external risk ratings of public rating agencies.
Consolidated Financial Statements Royal Bank of Canada: Annual Report 2013 143
Table of Contents
Note 8 Derivative financial instruments and hedging activities(continued)
|
Netting is a technique that can reduce credit exposure from derivatives and is generally facilitated through the use of master netting agreements. A master netting agreement provides for a single net settlement of all financial instruments covered by the agreement in the event of default. However, credit risk is reduced only to the extent that our financial obligations to the same counterparty can be set off against obligations of the counterparty to us. We maximize the use of master netting agreements to reduce derivative-related credit exposure. Our overall exposure to credit risk that is reduced through master netting agreements may change substantially following the reporting date as the exposure is affected by each transaction subject to the agreement as well as by changes in underlying market rates. Measurement of our credit exposure arising out of derivative transactions is reduced to reflect the effects of netting in cases where the enforceability of that netting is supported by appropriate legal analysis as documented in our trading credit risk policies.
The use of collateral is another significant credit mitigation technique for managing derivative-related counterparty credit risk. Mark-to-market provisions in our agreements with some counterparties, typically in the form of a Credit Support Annex, provide us with the right to request that the counterparty pay down or collateralize the current market value of its derivatives positions when the value passes a specified threshold amount.
Replacement cost represents the total fair value of all outstanding contracts in a gain position after factoring in the master netting agreements. The credit equivalent amount is defined as the sum of the replacement cost plus an add-on amount for potential future credit exposure as defined by OSFI. The risk-weighted amount is determined by applying the standard OSFI-defined measures of counterparty risk to the credit equivalent amount.
Derivative-related credit risk
| As at | ||||||||||||||||||||||||||
| October 31, 2013(1) | October 31, 2012 (1) | |||||||||||||||||||||||||
| (Millions of Canadian dollars) | Replacement cost | Credit equivalent amount (2) | Risk-weighted equivalent (3) | Replacement cost | Credit equivalent amount (2) | Risk-weighted equivalent (3) | ||||||||||||||||||||
Over-the-counter contracts | ||||||||||||||||||||||||||
Interest rate contracts | ||||||||||||||||||||||||||
Forward rate agreements | $ | 94 | $ | 278 | $ | 48 | $ | 81 | $ | 273 | $ | 116 | ||||||||||||||
Swaps | 13,133 | 20,914 | 5,465 | 15,722 | 13,114 | 5,798 | ||||||||||||||||||||
Options purchased | 399 | 634 | 363 | 211 | 396 | 153 | ||||||||||||||||||||
Foreign exchange contracts | ||||||||||||||||||||||||||
Forward contracts | 2,463 | 6,891 | 2,232 | 2,859 | 7,778 | 2,143 | ||||||||||||||||||||
Swaps | 2,500 | 6,262 | 1,946 | 1,748 | 6,664 | 1,529 | ||||||||||||||||||||
Options purchased | 259 | 444 | 221 | 224 | 634 | 283 | ||||||||||||||||||||
Credit derivatives (4) | 106 | 1,480 | 719 | 121 | 588 | 244 | ||||||||||||||||||||
Other contracts (5) | 1,864 | 6,838 | 3,519 | 981 | 3,958 | 1,642 | ||||||||||||||||||||
Exchange traded contracts(6) | 2,867 | 11,186 | 224 | — | — | — | ||||||||||||||||||||
Total | $ | 23,685 | $ | 54,927 | $ | 14,737 | $ | 21,947 | $ | 33,405 | $ | 11,908 | ||||||||||||||
| (1) | The amounts presented as at October 31, 2013 and 2012 are net of master netting agreements in accordance with Basel III and Basel II, respectively. |
| (2) | The total credit equivalent amount includes collateral applied of $9.6 billion (October 31, 2012 – $10.7 billion). |
| (3) | The risk-weighted balances as at October 31, 2013 and 2012 were calculated in accordance with Basel III and Basel II, respectively. |
| (4) | Credit derivatives include credit default swaps, total return swaps and credit default baskets. The above excludes credit derivatives issued for other-than-trading purposes related to bought protection with a replacement cost of $nil (October 31, 2012 – $5 million). |
| (5) | Other contracts include precious metal, commodity, stable value, and equity derivatives contracts. |
| (6) | In accordance with Basel III, exchange-traded instruments were included in the calculation of credit risk as at October 31, 2013. Under Basel II, exchange-traded instruments were deemed to have no credit risk because of daily margin requirements; therefore, exchange-traded instruments with a replacement cost of $2.1 billion were excluded from the calculation of credit risk as at October 31, 2012. |
Replacement cost of derivative instruments by risk rating and by counterparty type
| As at October 31, 2013 | ||||||||||||||||||||||||||||||||||||
| Risk rating(1) | Counterparty type(2) | |||||||||||||||||||||||||||||||||||
| (Millions of Canadian dollars) | AAA, AA | A | BBB | BB or lower | Total | Banks | OECD governments | Other | Total | |||||||||||||||||||||||||||
Gross positive replacement cost | $ | 20,610 | $ | 68,471 | $ | 11,604 | $ | 5,844 | $ | 106,529 | $ | 48,730 | $ | 10,634 | $ | 47,165 | $ | 106,529 | ||||||||||||||||||
Impact of master netting agreements | 14,345 | 60,780 | 6,829 | 890 | 82,844 | 37,070 | 6,734 | 39,040 | 82,844 | |||||||||||||||||||||||||||
Replacement cost (after netting agreements) (3) | $ | 6,265 | $ | 7,691 | $ | 4,775 | $ | 4,954 | $ | 23,685 | $ | 11,660 | $ | 3,900 | $ | 8,125 | $ | 23,685 | ||||||||||||||||||
144 Royal Bank of Canada: Annual Report 2013 Consolidated Financial Statements
Table of Contents
| As at October 31, 2012 | ||||||||||||||||||||||||||||||||||||
| Risk rating (1) | Counterparty type (2) | |||||||||||||||||||||||||||||||||||
| (Millions of Canadian dollars) | AAA, AA | A | BBB | BB or lower | Total | Banks | OECD governments | Other | Total | |||||||||||||||||||||||||||
Gross positive replacement cost | $ | 24,404 | $ | 77,490 | $ | 15,006 | $ | 4,873 | $ | 121,773 | $ | 59,859 | $ | 13,074 | $ | 48,840 | $ | 121,773 | ||||||||||||||||||
Impact of master netting agreements | 19,332 | 70,193 | 9,113 | 1,183 | 99,821 | 49,353 | 10,485 | 39,983 | 99,821 | |||||||||||||||||||||||||||
Replacement cost (after netting agreements) (3) | $ | 5,072 | $ | 7,297 | $ | 5,893 | $ | 3,690 | $ | 21,952 | �� | $ | 10,506 | $ | 2,589 | $ | 8,857 | $ | 21,952 | |||||||||||||||||
| (1) | Our internal risk ratings for major counterparty types approximate those of public ratings agencies. Ratings of AAA, AA, A and BBB represent investment grade ratings and ratings of BB or lower represent non-investment grade ratings. |
| (2) | Counterparty type is defined in accordance with the capital adequacy requirements of OSFI. |
| (3) | Includes credit derivatives issued for other-than-trading purposes with a total replacement cost of $nil (October 31, 2012 – $5 million). |
|
| (Millions of Canadian dollars) | Land | Buildings | Computer equipment | Furniture, fixtures and other equipment | Leasehold improvements | Work in process | Total | |||||||||||||||||||||
Cost | ||||||||||||||||||||||||||||
Balance at October 31, 2012 | $ | 128 | $ | 1,275 | $ | 1,494 | $ | 1,392 | $ | 1,871 | $ | 199 | $ | 6,359 | ||||||||||||||
Additions (1) | 3 | 12 | 120 | 43 | 40 | 234 | 452 | |||||||||||||||||||||
Acquisitions through business combinations | – | – | 1 | 21 | – | – | 22 | |||||||||||||||||||||
Transfers from work in process | 2 | 44 | 31 | 52 | 155 | (284 | ) | – | ||||||||||||||||||||
Disposals | (1 | ) | (3 | ) | (78 | ) | (57 | ) | (6 | ) | (3 | ) | (148 | ) | ||||||||||||||
Foreign exchange translation | 2 | 6 | 13 | 7 | 16 | 2 | 46 | |||||||||||||||||||||
Other | – | 25 | 1 | – | (29 | ) | (35 | ) | (38 | ) | ||||||||||||||||||
Balance at October 31, 2013 | $ | 134 | $ | 1,359 | $ | 1,582 | $ | 1,458 | $ | 2,047 | $ | 113 | $ | 6,693 | ||||||||||||||
Accumulated depreciation | ||||||||||||||||||||||||||||
Balance at October 31, 2012 | $ | – | $ | 456 | $ | 1,092 | $ | 968 | $ | 1,152 | $ | – | $ | 3,668 | ||||||||||||||
Depreciation | – | 42 | 190 | 92 | 140 | – | 464 | |||||||||||||||||||||
Impairment loss (reversal) | – | – | – | – | – | – | – | |||||||||||||||||||||
Disposals | – | (2 | ) | (71 | ) | (49 | ) | (5 | ) | – | (127 | ) | ||||||||||||||||
Foreign exchange translation | – | 2 | 9 | 4 | 8 | – | 23 | |||||||||||||||||||||
Other | – | 2 | (15 | ) | 19 | – | – | 6 | ||||||||||||||||||||
Balance at October 31, 2013 | $ | – | $ | 500 | $ | 1,205 | $ | 1,034 | $ | 1,295 | $ | – | $ | 4,034 | ||||||||||||||
Net carrying amount at October 31, 2013 | $ | 134 | $ | 859 | $ | 377 | $ | 424 | $ | 752 | $ | 113 | $ | 2,659 | ||||||||||||||
| (Millions of Canadian dollars) | Land | Buildings | Computer equipment | Furniture, fixtures and other equipment | Leasehold improvements | Work in process | Total | |||||||||||||||||||||
Cost | ||||||||||||||||||||||||||||
Balance at October 31, 2011 | $ | 116 | $ | 801 | $ | 1,815 | $ | 1,353 | $ | 1,684 | $ | 532 | $ | 6,301 | ||||||||||||||
Additions (1) | 13 | 20 | 203 | 67 | 50 | 380 | 733 | |||||||||||||||||||||
Acquisitions through business combinations | – | – | 1 | 9 | 1 | – | 11 | |||||||||||||||||||||
Transfers from work in process | – | 448 | 46 | 42 | 98 | (634 | ) | – | ||||||||||||||||||||
Disposals | (1 | ) | (17 | ) | (423 | ) | (36 | ) | (29 | ) | (3 | ) | (509 | ) | ||||||||||||||
Foreign exchange translation | – | (1 | ) | (10 | ) | – | 1 | (1 | ) | (11 | ) | |||||||||||||||||
Other | – | 24 | (138 | ) | (43 | ) | 66 | (75 | ) | (166 | ) | |||||||||||||||||
Balance at October 31, 2012 | $ | 128 | $ | 1,275 | $ | 1,494 | $ | 1,392 | $ | 1,871 | $ | 199 | $ | 6,359 | ||||||||||||||
Accumulated depreciation | ||||||||||||||||||||||||||||
Balance at October 31, 2011 | $ | – | $ | 427 | $ | 1,432 | $ | 907 | $ | 1,045 | $ | – | $ | 3,811 | ||||||||||||||
Depreciation | – | 21 | 182 | 86 | 139 | – | 428 | |||||||||||||||||||||
Impairment loss (reversal) | – | – | – | – | – | – | – | |||||||||||||||||||||
Disposals | – | (5 | ) | (422 | ) | (34 | ) | (25 | ) | – | (486 | ) | ||||||||||||||||
Foreign exchange translation | – | (2 | ) | (8 | ) | – | 3 | – | (7 | ) | ||||||||||||||||||
Other | – | 15 | (92 | ) | 9 | (10 | ) | – | (78 | ) | ||||||||||||||||||
Balance at October 31, 2012 | $ | – | $ | 456 | $ | 1,092 | $ | 968 | $ | 1,152 | $ | – | $ | 3,668 | ||||||||||||||
Net carrying amount at October 31, 2012 | $ | 128 | $ | 819 | $ | 402 | $ | 424 | $ | 719 | $ | 199 | $ | 2,691 | ||||||||||||||
| (1) | At October 31, 2013, we had total contractual commitments of $41 million to acquire premises and equipment (October 31, 2012 – $96 million; October 31, 2011 – $154 million). |
Consolidated Financial Statements Royal Bank of Canada: Annual Report 2013 145
Table of Contents
Note 10 Goodwill andother intangible assets
|
Goodwill
The following table presents changes in the carrying amount of goodwill by CGU for the year ended October 31, 2013 and 2012.
| (Millions of Canadian dollars) | Canadian Banking | Caribbean Banking | Canadian Wealth Management | Global Asset Management | U.S. Wealth Management | International Wealth Management | Insurance | Investor Services | Investor & Treasury Services (1) | Capital Markets | Total | |||||||||||||||||||||||||||||||||
At October 31, 2011 | $ | 1,953 | $ | 1,451 | $ | 542 | $ | 1,881 | $ | 516 | $ | 118 | $ | 118 | $ | 144 | $ | – | $ | 887 | $ | 7,610 | ||||||||||||||||||||||
Acquisitions | – | – | – | – | – | 8 | – | – | – | – | 8 | |||||||||||||||||||||||||||||||||
Transfers | – | – | – | – | – | – | – | – | 52 | (52 | ) | – | ||||||||||||||||||||||||||||||||
Impairment losses | – | – | – | – | – | – | – | (142 | ) | – | – | (142 | ) | |||||||||||||||||||||||||||||||
Currency translations | – | – | – | 8 | 1 | – | – | (2 | ) | – | 2 | 9 | ||||||||||||||||||||||||||||||||
Other changes | (2 | ) | – | 1 | – | – | 1 | – | – | – | – | – | ||||||||||||||||||||||||||||||||
At October 31, 2012 | $ | 1,951 | $ | 1,451 | $ | 543 | $ | 1,889 | $ | 517 | $ | 127 | $ | 118 | $ | – | $ | 52 | $ | 837 | $ | 7,485 | ||||||||||||||||||||||
Acquisitions | 598 | – | – | – | – | – | – | – | 96 | 11 | 705 | |||||||||||||||||||||||||||||||||
Transfers | – | – | – | – | – | – | – | – | – | – | – | |||||||||||||||||||||||||||||||||
Impairment losses | – | – | – | – | – | – | – | – | – | – | – | |||||||||||||||||||||||||||||||||
Currency translations | 1 | 59 | 5 | 48 | 22 | 5 | – | – | 1 | 30 | 171 | |||||||||||||||||||||||||||||||||
Other changes | – | – | – | – | – | – | – | – | – | – | – | |||||||||||||||||||||||||||||||||
At October 31, 2013 | $ | 2,550 | $ | 1,510 | $ | 548 | $ | 1,937 | $ | 539 | $ | 132 | $ | 118 | $ | – | $ | 149 | $ | 878 | $ | 8,361 | ||||||||||||||||||||||
| (1) | Effective October 31, 2012, Investor & Treasury Services is a newly created CGU that includes our former Investor Services CGU and certain related businesses that were part of our Capital Markets CGU. The transfer of goodwill was based on the relative fair value of the transferred businesses. See Note 29 for further details on our business segments. |
Key inputs and assumptions
We perform our annual impairment test by comparing the carrying amount of each CGU to its recoverable amount. The recoverable amount of a CGU is represented by its value in use, except in circumstances where the carrying amount of a CGU exceeds its value in use. In such cases, we determine the CGU’s fair value less costs to sell and its recoverable amount is the greater of its value in use and fair value less costs to sell.
In our annual impairment tests performed as at August 1, 2013 and August 1, 2012, the recoverable amounts of our CGUs were based on value in use, except for our Caribbean Banking CGU, whose recoverable amount was based on fair value less costs to sell.
We calculate value in use using a five-year discounted cash flow (DCF) method. Future cash flows are based on financial plans agreed by management for a five-year period, estimated based on forecast results, business initiatives, planned capital investments and returns to shareholders. Key drivers of future cash flows include net interest margins and average interest-earning assets. The values assigned to these drivers over the forecast period are based on past experience, external and internal economic forecasts, and management’s expectations of the impact of economic conditions on our financial results. Beyond the initial five-year period, cash flows are assumed to increase at a constant rate using a nominal long-term growth rate (terminal growth rate). Terminal growth rates are based on the current market assessment of gross domestic product and inflation for the countries within which the CGU operates. The discount rates used to determine the present value of each CGU’s projected future cash flows are based on the bank-wide cost of capital, adjusted for the risks to which each CGU is exposed. CGU-specific risks include: country risk, business/operational risk, geographic risk (including political risk, devaluation risk, and government regulation), currency risk, and price risk (including product pricing risk and inflation).
The estimation of value in use involves significant judgment in the determination of inputs to the DCF model and is the most sensitive to changes in future cash flows, discount rates and terminal growth rates applied to cash flows beyond the forecast period. These key inputs and assumptions used to determine the recoverable amount of each CGU using value in use were tested for sensitivity by applying a reasonably possible change to those assumptions. The post-tax discount rates were increased by 1%, terminal growth rates were decreased by 0.5%, and future cash flows were reduced by 10%. As at August 1, 2013, no change in an individual key input or assumption, as described, would result in a CGU’s carrying amount exceeding its recoverable amount based on value in use.
For our Caribbean Banking CGU, we calculated fair value less costs to sell using a DCF method that projects future cash flows over a 10-year period, which represents the duration of the economic cycle to which the CGU is sensitive. The10-year DCF method aims to approximate the considerations of a prospective third-party buyer in assessing the profitability of the CGU and its ability to create value over time, independent from current macroeconomic conditions. Cash flows beyond the initial10-year period are assumed to increase at a constant rate using a nominal long-term growth rate. Future cash flows, terminal growth rates, and discount rates are based on the same factors noted above.
The estimation of fair value less costs to sell also involves significant judgment and due to the longer time period used for our cash flow projections, the ultimate outcome of the cash flow projections has greater uncertainty than those used in our value in use model. Variability in timing and amount of future cash flows, discount rates and terminal growth rates applied to cash flows beyond the forecast period are therefore more likely. For our Caribbean Banking CGU, the recoverable amount, based on fair value less costs to sell, was 110% of its carrying amount. If projected cash flows decreased by 9.1% or thepre-tax discount rate increased to 13.7%, holding other individual factors constant, the recoverable amount based on fair value less costs to sell would be equal to the carrying amount.
146 Royal Bank of Canada: Annual Report 2013 Consolidated Financial Statements
Table of Contents
The terminal growth rates and pre-tax discount rates used in our annual impairment tests are summarized below.
| As at | ||||||||||||||||||
| August 1, 2013 | August 1, 2012 | |||||||||||||||||
| Discount rate(1) | Terminal growth | Discount rate (1) | Terminal growth rate | |||||||||||||||
Group of Cash Generating Units | ||||||||||||||||||
Canadian Banking | 10.6 | % | 3.0 | % | 9.9 | % | 3.0 | % | ||||||||||
Caribbean Banking | 12.9 | 4.2 | 12.4 | 4.1 | ||||||||||||||
Canadian Wealth Management | 11.9 | 3.0 | 11.2 | 3.0 | ||||||||||||||
Global Asset Management | 11.8 | 3.0 | 10.5 | 3.0 | ||||||||||||||
U.S. Wealth Management | 15.9 | 3.0 | 14.9 | 3.0 | ||||||||||||||
International Wealth Management | 11.8 | 3.0 | 10.5 | 3.0 | ||||||||||||||
Insurance | 10.2 | 3.0 | 9.5 | 3.0 | ||||||||||||||
Investor & Treasury Services | 12.5 | 3.0 | n.a. | n.a. | ||||||||||||||
Capital Markets | 15.6 | 3.0 | 14.4 | 3.0 | ||||||||||||||
| (1) | Pre-tax discount rates are determined implicitly based on post-tax discount rates. |
| n.a. | The Investor & Treasury Services CGU was created after August 1, 2012 |
Other intangible assets
The following table presents the carrying amount of our other intangible assets:
| As at October 31, 2013 | ||||||||||||||||||||||||
| (Millions of Canadian dollars) | Internally generated software | Other software | Core deposit intangibles | Customer list and relationships | In process software | Total | ||||||||||||||||||
Gross carrying amount | ||||||||||||||||||||||||
Balance at October 31, 2012 | $ | 2,258 | $ | 986 | $ | 150 | $ | 1,370 | $ | 650 | $ | 5,414 | ||||||||||||
Additions | 34 | 67 | – | 126 | 581 | 808 | ||||||||||||||||||
Transfers | 400 | 122 | – | – | (522 | ) | – | |||||||||||||||||
Dispositions | (2 | ) | (2 | ) | – | – | – | (4 | ) | |||||||||||||||
Impairment | (7 | ) | (4 | ) | – | – | (2 | ) | (13 | ) | ||||||||||||||
Currency translations | 15 | 9 | 7 | 25 | 2 | 58 | ||||||||||||||||||
Other changes | (92 | ) | (36 | ) | – | 12 | 2 | (114 | ) | |||||||||||||||
Balance at October 31, 2013 | $ | 2,606 | $ | 1,142 | $ | 157 | $ | 1,533 | $ | 711 | $ | 6,149 | ||||||||||||
Accumulated amortization | ||||||||||||||||||||||||
Balance at October 31, 2012 | $ | (1,485 | ) | $ | (740 | ) | $ | (90 | ) | $ | (413 | ) | $ | – | $ | (2,728 | ) | |||||||
Amortization charge for the year | (361 | ) | (66 | ) | (22 | ) | (117 | ) | – | (566 | ) | |||||||||||||
Dispositions | 1 | 1 | – | – | – | 2 | ||||||||||||||||||
Impairment losses | 3 | – | – | – | – | 3 | ||||||||||||||||||
Currency translations | (9 | ) | (7 | ) | (5 | ) | (11 | ) | – | (32 | ) | |||||||||||||
Other changes | (10 | ) | (10 | ) | – | (12 | ) | – | (32 | ) | ||||||||||||||
Balance at October 31, 2013 | $ | (1,861 | ) | $ | (822 | ) | $ | (117 | ) | $ | (553 | ) | $ | – | $ | (3,353 | ) | |||||||
Net balance, at October 31, 2013 | $ | 745 | $ | 320 | $ | 40 | $ | 980 | $ | 711 | $ | 2,796 | ||||||||||||
| As at October 31, 2012 | ||||||||||||||||||||||||
| (Millions of Canadian dollars) | Internally generated software | Other software | Core deposit intangibles | Customer list and relationships (1) | In process software | Total | ||||||||||||||||||
Gross carrying amount | ||||||||||||||||||||||||
Balance at October 31, 2011 | $ | 1,926 | $ | 855 | $ | 150 | $ | 1,356 | $ | 306 | $ | 4,593 | ||||||||||||
Additions | 15 | 41 | – | 337 | 587 | 980 | ||||||||||||||||||
Transfers | 233 | 42 | – | – | (275 | ) | – | |||||||||||||||||
Dispositions | (21 | ) | (27 | ) | – | (175 | ) | (1 | ) | (224 | ) | |||||||||||||
Currency translations | 1 | 1 | – | 10 | 2 | 14 | ||||||||||||||||||
Other changes | 104 | 74 | – | (158 | ) | 31 | 51 | |||||||||||||||||
Balance at October 31, 2012 | $ | 2,258 | $ | 986 | $ | 150 | $ | 1,370 | $ | 650 | $ | 5,414 | ||||||||||||
Accumulated amortization | ||||||||||||||||||||||||
Balance at October 31, 2011 | $ | (1,182 | ) | $ | (690 | ) | $ | (68 | ) | $ | (538 | ) | $ | – | $ | (2,478 | ) | |||||||
Amortization charge for the year | (306 | ) | (86 | ) | (22 | ) | (114 | ) | – | (528 | ) | |||||||||||||
Dispositions | 18 | 25 | – | 155 | – | 198 | ||||||||||||||||||
Impairment losses | – | – | – | (26 | ) | – | (26 | ) | ||||||||||||||||
Currency translations | – | (6 | ) | – | (6 | ) | – | (12 | ) | |||||||||||||||
Other changes | (15 | ) | 17 | – | 116 | – | 118 | |||||||||||||||||
Balance at October 31, 2012 | $ | (1,485 | ) | $ | (740 | ) | $ | (90 | ) | $ | (413 | ) | $ | – | $ | (2,728 | ) | |||||||
Net balance, at October 31, 2012 | $ | 773 | $ | 246 | $ | 60 | $ | 957 | $ | 650 | $ | 2,686 | ||||||||||||
| (1) | The impairment loss in our customer list and relationships intangibles in 2012 related to our acquisition of the remaining 50% interest in RBC Dexia. |
Consolidated Financial Statements Royal Bank of Canada: Annual Report 2013 147
Table of Contents
Note 11 Significant acquisitions and dispositions
|
Acquisitions
Personal & Commercial Banking
On February 1, 2013, we completed the acquisition of the Canadian auto finance and deposit business of Ally Financial Inc. (Ally Canada) for cash consideration of $3.7 billion. Ally Canada’s operations represent a developed and scalable auto finance business.
Our purchase price allocation assigns $12.2 billion to assets, including $115 million of customer relationship intangible assets, and $9.1 billion to liabilities on the acquisition date. Goodwill of $598 million reflects the expected synergies from the combined operations which will allow us to grow our existing automotive financing business and effectively service the banking needs of automotive dealerships. Goodwill is not expected to be deductible for tax purposes. The following table presents the fair value of the assets acquired and liabilities assumed as at the date of the acquisition.
| (Millions of Canadian dollars, except percentage) | ||||
Percentage of shares acquired | 100% | |||
Purchase consideration | $ | 3,717 | ||
Fair value of identifiable assets acquired | ||||
Cash and deposits with banks | $ | 1,136 | ||
Securities | 417 | |||
Loans (1) (2) | 10,293 | |||
Other assets (3) | 345 | |||
Fair value of liabilities assumed | ||||
Deposits (4) | (9,033 | ) | ||
Other liabilities | (39 | ) | ||
Fair value of identifiable net assets acquired | $ | 3,119 | ||
Goodwill | 598 | |||
Total purchase consideration | $ | 3,717 | ||
| (1) | The fair value for loans reflects the expected credit losses at the acquisition date. Gross contractual receivables amount to $10.5 billion. |
| (2) | Subsequent to the acquisition, we sold loans with a carrying amount of $197 million resulting in a loss of $0.7 million. |
| (3) | Other assets include $115 million of customer lists and relationships which are amortized on a straight-line basis over an estimated useful life of 10 years. |
| (4) | Deposits include $5.1 billion related to consolidated securitization vehicles, of which $3.5 billion have been redeemed following the acquisition. |
Since the acquisition date, Ally Canada increased our consolidated revenue and net income by $222 million and $65 million, respectively. Had the business combination been effective on November 1, 2012, the additional three months of ownership of Ally Canada would have added consolidated revenue and net income of approximately $70 million and $18 million, respectively, to our results for the year ended October 31, 2013.
All results of operations are included in our Personal & Commercial Banking segment and goodwill is allocated to our Canadian Banking CGU.
Investor & Treasury Services
On July 27, 2012, we completed the acquisition of the 50% interest that we did not already own in RBC Dexia Investor Services Limited (RBC Dexia). During the second quarter of 2013, we revised our preliminary purchase price allocation. Consequently, we decreased the fair value of the software intangibles by $118 million, partially offset by an increase to deferred tax and other assets of $22 million. The changes result in the recognition of goodwill of $96 million which reflects the strategic value in owning 100% of RBC Dexia and its complementary businesses. Goodwill is not expected to be deductible for tax purposes.
All results of operations are included in our Investor & Treasury Services segment and goodwill is allocated to our Investor & Treasury Services CGU. Adjustments have been applied on a prospective basis.
Dispositions
Personal & Commercial Banking
On March 2, 2012, we completed the sale of our U.S. regional retail banking operations to the PNC Financial Services Group, Inc. (PNC) announced on June 20, 2011. An estimated loss on sale of $304 million after-tax was recorded in Net loss from discontinued operations in our 2011 Consolidated Statement of Income. A reduction to loss on sale of $7 million after-tax was recorded in the first quarter of 2012. Upon closing of the sale, we revised our loss on sale to $294 million after tax. The difference of $3 million was recorded as a reduction to Net loss from discontinued operations in the second quarter of 2012.
We also had previously classified certain of our U.S. regional banking assets as discontinued operations when announced on June 20, 2011, because we committed to selling them within a year. Certain of these assets which were not sold within the year were reclassified in the third quarter of 2012 to continuing operations in our Corporate Support segment. The assets were not material to our Personal & Commercial Banking or Corporate Support segments.
The results of the operations sold to PNC and certain of our U.S. regional banking assets have been presented in our Consolidated Financial Statements as discontinued operations for all periods presented. Select financial information is set out in the tables below.
Insurance
On April 29, 2011, we completed the sale of Liberty Life, our U.S. life insurance business, to Athene Holding Ltd, as announced on October 22, 2010. The loss on sale after-tax was $104 million. The results of operations of Liberty Life sold to Athene Holding Ltd. have been presented in our Consolidated Financial Statements as discontinued operations for all periods presented. Select financial information is set out in the tables below.
148 Royal Bank of Canada: Annual Report 2013 Consolidated Financial Statements
Table of Contents
Total discontinued operations – Statements of Income
| ||||||||||||
| For the year ended | ||||||||||||
| (Millions of Canadian dollars) | October 31 2013 | October 31 2012 | October 31 2011 | |||||||||
Net interest income | $ | – | $ | 200 | $ | 683 | ||||||
Non-interest income | – | 68 | 328 | |||||||||
Total Revenue | – | 268 | 1,011 | |||||||||
Provision for credit losses | – | 117 | 326 | |||||||||
Insurance policyholder benefits, claims and actuarial expenses | – | – | 240 | |||||||||
Non-interest expense | – | 258 | 834 | |||||||||
Net (loss) income before income taxes | – | (107 | ) | (389 | ) | |||||||
Net (loss) income | – | (61 | ) | (234 | ) | |||||||
Gain (loss) on sale | – | 10 | (292 | ) | ||||||||
Net (loss) gain from discontinued operations | ||||||||||||
U.S. regional retail banking operations sold to PNC | – | (36 | ) | (479 | ) | |||||||
Other U.S. regional banking assets | – | (15 | ) | (77 | ) | |||||||
Liberty Life sold to Athene Holding Ltd. | – | – | 30 | |||||||||
Total | $ | – | $ | (51 | ) | $ | (526 | ) | ||||
Total discontinued operations – Statements of Cash Flows
| For the year ended | ||||||||||||
| (Millions of Canadian dollars) | October 31 2013 | October 31 2012 | October 31 2011 | |||||||||
Net cash (used in) from operating activities | $ | – | $ | (6,727 | ) | $ | 1,179 | |||||
Net cash from investing activities | – | 4,054 | 586 | |||||||||
Net cash (used in) from financing activities | – | (24 | ) | 64 | ||||||||
Effect of exchange rate changes on cash and due from banks | – | (19 | ) | (3 | ) | |||||||
Net change in cash and due from banks (1) | – | (2,716 | ) | 1,826 | ||||||||
Cash and due from banks at beginning of year | – | 2,716 | 890 | |||||||||
Cash and due from banks at end of year | $ | – | $ | – | $ | 2,716 | ||||||
| (1) | Net change in cash and due from banks of Liberty Life for the year ended October 31, 2013 were $nil (October 31, 2012 – $nil, October 31, 2011 – $(2) million). |
Note 12 Joint ventures and associated companies
|
Joint ventures
As at October 31, 2013, our principal joint venture is a 50% interest in Moneris Solutions, which provides payment processing services to merchants across North America.
Previously, our principal joint ventures included a 50% interest in RBC Dexia. In the third quarter of 2012, we completed the acquisition of RBC Dexia and as a result, RBC Dexia is no longer a joint venture.
The following table summarizes the assets, liabilities, income and expense recognized in our Consolidated Balance Sheets and Consolidated Income Statements related to our interests in joint ventures.
| RBC Dexia (1) | Other | Total | ||||||||||||||||||||||||||||||||||
| As at or for the year ended | ||||||||||||||||||||||||||||||||||||
| (Millions of Canadian dollars) | October 31 2013 | October 31 2012 | October 31 2011 | October 31 2013 | October 31 2012 | October 31 2011 | October 31 2013 | October 31 2012 | October 31 2011 | |||||||||||||||||||||||||||
Consolidated Balance Sheets | ||||||||||||||||||||||||||||||||||||
Assets | $ | n.a. | $ | – | $ | 11,949 | $ | 764 | $ | 1,044 | $ | 770 | $ | 764 | $ | 1,044 | $ | 12,719 | ||||||||||||||||||
Liabilities | n.a. | – | 11,998 | 765 | 1,050 | 788 | 765 | 1,050 | 12,786 | |||||||||||||||||||||||||||
Consolidated Income Statements | ||||||||||||||||||||||||||||||||||||
Total revenue | n.a. | 428 | 680 | 337 | 336 | 333 | 337 | 764 | 1,013 | |||||||||||||||||||||||||||
Net income | n.a. | 7 | 96 | 133 | 131 | 125 | 133 | 138 | 221 | |||||||||||||||||||||||||||
| (1) | Revenues and income for the year ended October 31, 2012 reflect our share of the revenues and income of RBC Dexia up to July 27, 2012, the date we completed our acquisition of the remaining 50% interest that we did not already own. |
Consolidated Financial Statements Royal Bank of Canada: Annual Report 2013 149
Table of Contents
Note 12 Joint ventures and associated companies(continued)
|
Associated companies
The following tables summarize the carrying value of our investments in associated companies and present selected aggregate financial information about our associated companies.
| As at | ||||||||
| (Millions of Canadian dollars) | October 31 2013 | October 31 2012 | ||||||
Carrying amount at the beginning of the year | $ | 125 | $ | 142 | ||||
Additions (disposals) | 15 | 4 | ||||||
Our share of investees’ net income (loss) (1) | 6 | 24 | ||||||
Dividends/distributions | (15 | ) | (36 | ) | ||||
Foreign currency translation | 2 | – | ||||||
Other | (21 | ) | (9 | ) | ||||
Carrying amount at the end of the year | $ | 112 | $ | 125 | ||||
| (1) | The aggregate financial information of our significant investees reflects balances that are based on accounts made up to October 31. While the year end dates of our significant investees are different from ours, financial information is obtained as at October 31 in order to report on a consistent basis with our year-end date. |
| As at or for the year ended | ||||||||||||
| (Millions of Canadian dollars) | October 31 2013 | October 31 2012 (1) | October 31 2011 (1) | |||||||||
Total assets | $ | 700 | $ | 681 | $ | 755 | ||||||
Total liabilities | 338 | 314 | 373 | |||||||||
Total revenue | 746 | 705 | 679 | |||||||||
Total profit for the year | 61 | 59 | (21 | ) | ||||||||
| (1) | Certain amounts have been revised from results previously reported. |
|
| As at | ||||||||
| (Millions of Canadian dollars) | October 31 2013 | October 31 2012 | ||||||
Cash collateral and margin deposits | $ | 11,689 | $ | 18,323 | ||||
Accounts receivable and prepaids | 3,862 | 4,289 | ||||||
Receivable from brokers, dealers and clients | 1,474 | 1,939 | ||||||
Insurance-related assets | 2,182 | 2,003 | ||||||
Deferred income tax asset | 1,852 | 1,707 | ||||||
Accrued interest receivable | 1,789 | 1,467 | ||||||
Taxes receivable | 1,252 | 1,450 | ||||||
Precious metals | 173 | 996 | ||||||
Other | 2,414 | 2,845 | ||||||
| $ | 26,687 | $ | 35,019 | |||||
|
The following table details our deposit liabilities:
| As at | ||||||||||||||||||||||||||||||||||
| October 31, 2013 | October 31, 2012 | |||||||||||||||||||||||||||||||||
| (Millions of Canadian dollars) | Demand (1) | Notice (2) | Term (3) | Total | Demand (1) | Notice (2) | Term (3) | Total | ||||||||||||||||||||||||||
Personal | $ | 110,920 | $ | 15,732 | $ | 67,645 | $ | 194,297 | $ | 104,079 | $ | 13,893 | $ | 61,530 | $ | 179,502 | ||||||||||||||||||
Business and government | 147,631 | 1,209 | 201,800 | 350,640 | 128,943 | 1,393 | 182,546 | 312,882 | ||||||||||||||||||||||||||
Bank | 5,734 | 11 | 7,798 | 13,543 | 4,621 | 18 | 11,196 | 15,835 | ||||||||||||||||||||||||||
| $ | 264,285 | $ | 16,952 | $ | 277,243 | $ | 558,480 | $ | 237,643 | $ | 15,304 | $ | 255,272 | $ | 508,219 | |||||||||||||||||||
Non-interest-bearing (4) | ||||||||||||||||||||||||||||||||||
Canada | $ | 60,201 | $ | 3,282 | $ | – | $ | 63,483 | $ | 55,133 | $ | 2,836 | $ | – | $ | 57,969 | ||||||||||||||||||
United States | 1,444 | 7 | – | 1,451 | 1,188 | 6 | – | 1,194 | ||||||||||||||||||||||||||
Europe (5) | 3,810 | 1 | – | 3,811 | 3,935 | 1 | – | 3,936 | ||||||||||||||||||||||||||
Other International | 4,684 | 315 | – | 4,999 | 3,332 | 439 | – | 3,771 | ||||||||||||||||||||||||||
Interest-bearing (4) | ||||||||||||||||||||||||||||||||||
Canada | 158,743 | 9,604 | 222,506 | 390,853 | 138,276 | 8,270 | 204,507 | 351,053 | ||||||||||||||||||||||||||
United States | 3,488 | 202 | 39,134 | 42,824 | 3,410 | 584 | 33,303 | 37,297 | ||||||||||||||||||||||||||
Europe (5) | 28,985 | 45 | 7,992 | 37,022 | 29,143 | 50 | 10,072 | 39,265 | ||||||||||||||||||||||||||
Other International | 2,930 | 3,496 | 7,611 | 14,037 | 3,226 | 3,118 | 7,390 | 13,734 | ||||||||||||||||||||||||||
| $ | 264,285 | $ | 16,952 | $ | 277,243 | $ | 558,480 | $ | 237,643 | $ | 15,304 | $ | 255,272 | $ | 508,219 | |||||||||||||||||||
| (1) | Deposits payable on demand include all deposits for which we do not have the right to notice of withdrawal. These deposits include both savings and chequing accounts. |
| (2) | Deposits payable after notice include all deposits for which we can legally require notice of withdrawal. These deposits are primarily savings accounts. |
| (3) | Term deposits include deposits payable on a fixed date. These deposits include term deposits, guaranteed investment certificates and similar instruments. As at October 31, 2013, the balance of term deposits also include senior deposit notes we have issued to provide long-term funding of $134 billion (October 31, 2012 – $114 billion). |
| (4) | The geographical splits of the deposits are based on the point of origin of the deposits and where the revenue is recognized. |
| (5) | Europe includes the United Kingdom, Switzerland and the Channel Islands. |
150 Royal Bank of Canada: Annual Report 2013 Consolidated Financial Statements
Table of Contents
The following table presents the contractual maturities of our term deposit liabilities.
| As at | ||||||||
| (Millions of Canadian dollars) | October 31 2013 | October 31 2012 | ||||||
Within 1 year: | ||||||||
less than 3 months | $ | 42,556 | $ | 55,274 | ||||
3 to 6 months | 36,314 | 22,493 | ||||||
6 to 12 months | 33,149 | 43,286 | ||||||
1 to 2 years | 54,665 | 49,920 | ||||||
2 to 3 years | 34,784 | 24,011 | ||||||
3 to 4 years | 21,763 | 21,134 | ||||||
4 to 5 years | 25,596 | 18,568 | ||||||
Over 5 years | 28,416 | 20,586 | ||||||
| $ | 277,243 | $ | 255,272 | |||||
Aggregate amount of term deposits in denominations of $100,000 or more | $ | 244,000 | $ | 223,000 | ||||
The following table presents the average deposit balances and average rates of interest during 2013, 2012 and 2011.
| For the year ended | ||||||||||||||||||||||||||||
| October 31, 2013 | October 31, 2012 | October 31, 2011 | ||||||||||||||||||||||||||
| (Millions of Canadian dollars, except for percentage amounts) | Average balances | Average rates | Average balances | Average rates | Average balances | Average rates | ||||||||||||||||||||||
Canada | $ | 434,938 | 1.19% | $ | 404,656 | 1.31% | $ | 358,094 | 1.49% | |||||||||||||||||||
United States | 41,442 | 0.41 | 38,792 | 0.54 | 42,766 | 0.54 | ||||||||||||||||||||||
Europe (1) | 38,746 | 0.27 | 33,394 | 0.63 | 45,740 | 1.00 | ||||||||||||||||||||||
Other International | 18,598 | 0.96 | 19,338 | 1.44 | 18,717 | 1.75 | ||||||||||||||||||||||
| $ | 533,724 | 1.06% | $ | 496,180 | 1.21% | $ | 465,317 | 1.36% | ||||||||||||||||||||
| (1) | Europe includes the United Kingdom, Switzerland and the Channel Islands. |
|
Insurance assets
| As at | ||||||||
| (Millions of Canadian dollars) | October 31 2013 | October 31 2012 | ||||||
Collateral loans | $ | 1,273 | $ | 1,176 | ||||
Policy loans | 132 | 120 | ||||||
Reinsurance assets | 422 | 336 | ||||||
Other | 355 | 371 | ||||||
Total | $ | 2,182 | $ | 2,003 | ||||
Reinsurance
In the ordinary course of business, our insurance operations reinsure risks to other insurance and reinsurance companies in order to lower our risk profile, limit loss exposure to large risks, and provide additional capacity for future growth. These ceding reinsurance arrangements do not relieve our insurance subsidiaries from their direct obligations to the insureds. We evaluate the financial condition of the reinsurers and monitor our concentrations of credit risks to minimize our exposure to losses from reinsurer insolvency. Reinsurance amounts (ceded premiums) included in Non-interest income are shown in the table below.
Net premiums and claims
| For the year ended | ||||||||||||||
| (Millions of Canadian dollars) | October 31 2013 | October 31 2012 | October 31 2011 | |||||||||||
Gross premiums | $ | 4,785 | $ | 4,739 | $ | 4,552 | ||||||||
Premiums ceded to reinsurers | (1,111 | ) | (1,034 | ) | (1,019 | ) | ||||||||
Net premiums | $ | 3,674 | $ | 3,705 | $ | 3,533 | ||||||||
Gross claims and benefits | $ | 2,768 | $ | 3,472 | $ | 3,155 | ||||||||
Reinsurers’ share of claims and benefits | (442 | ) | (417 | ) | (398 | ) | ||||||||
Net claims | $ | 2,326 | $ | 3,055 | $ | 2,757 | ||||||||
Risk Management
Insurance risk is the risk of fluctuations in the timing, frequency or severity of insured events, relative to our expectations at the time of underwriting. Due to our geographic diversity and business mix, we have a well diversified portfolio of insurance risks resulting in reduced concentration risk. We manage underwriting and pricing risk through the use of underwriting guidelines which detail the class, nature and type of business that may be accepted, pricing policies by product line and centralized control of policy wordings. The risk that claims are handled or paid inappropriately is mitigated using a range of IT system controls and manual processes conducted by experienced staff. These, together with a range of detailed policies and procedures, ensure that all claims are handled in a timely, appropriate and accurate manner.
Consolidated Financial Statements Royal Bank of Canada: Annual Report 2013 151
Table of Contents
Note 15 Insurance(continued)
|
Insurance claims and policy benefit liabilities
All actuarial assumptions are set in conjunction with Canadian Institute of Actuaries Standards of Practice and OSFI requirements. The assumptions that have the greatest effect on the measurement of insurance liabilities, the processes used to determine them and the assumptions used as at October 31, 2013 are as follows:
Life insurance
Mortality and morbidity – Mortality estimates are based on standard industry and national mortality tables, adjusted where appropriate to reflect our own experience. Morbidity assumptions are made with respect to the rates of claim incidence and claim termination for health insurance policies and are based on a combination of industry and our own experience.
Future investment yield – Assumptions are based on the current yield rate, a reinvestment assumption and an allowance for future credit losses for each line of business, and are developed using interest rate scenario testing, including prescribed scenarios for determination of minimum liabilities as set out in the actuarial standards.
Policyholder behaviour – Under certain policies, the policyholder has a contractual right to change benefits and premiums, as well as convert policies to permanent forms of insurance. All policyholders have the right to terminate their policies through lapse. Lapses represent the termination of policies due to non-payment of premiums. Lapse assumptions are primarily based on our recent experience adjusted for emerging industry experience where applicable.
Non-life insurance
Assumptions related to unpaid claims concern the patterns of development of claims from inception to ultimate settlement. The reserving assumptions, based on historical paid/incurred development patterns adjusted for changes in products, claims processes and legislative trends, result in a collective loss ratio when compared with earned premium.
The portfolio assumptions that have the greatest effect on the net liabilities included in our Consolidated Balance Sheets are listed below:
| As at | ||||||||
| October 31 2013 | October 31 2012 | |||||||
Life Insurance | ||||||||
Canadian Insurance | ||||||||
Mortality rates (1) | 0.12 | % | 0.12 | % | ||||
Morbidity rates (2) | 1.99 | 1.90 | ||||||
Reinvestment yield (3) | 3.15 | 3.15 | ||||||
Lapse rates (4) | 0.50 | 0.50 | ||||||
International Insurance | ||||||||
Mortality rates (1) | 0.46 | 0.43 | ||||||
Reinvestment yield (3) | 2.29 | 2.49 | ||||||
Non-life Insurance | ||||||||
| Expected loss ratio (5) | 79.5 | 74.0 | ||||||
| (1) | Average annual death rate for the largest portfolio of insured policies |
| (2) | Average net settlement rate for the individual and group disability insurance portfolio |
| (3) | Ultimate reinvestment rate of the insurance operations |
| (4) | Ultimate policy termination rate (lapse rate) for the largest permanent life insurance portfolio that relies on higher termination rate to maintain its profitability (lapse-supported policies) |
| (5) | Ratio of incurred claim losses and claim expenses to Net premiums of the property and casualty business, measuring the profitability or loss experience on our total book of business |
The following table summarizes our gross and reinsurers’ share of insurance liabilities at the end of the year.
Insurance claims and policy benefit liabilities
| As at | ||||||||||||||||||||||||||||
| October 31, 2013 | October 31, 2012 | |||||||||||||||||||||||||||
| (Millions of Canadian dollars) | Gross | Ceded | Net | Gross | Ceded | Net | ||||||||||||||||||||||
Life insurance policyholder liabilities | ||||||||||||||||||||||||||||
Life, health and annuity | $ | 7,029 | $ | 300 | $ | 6,729 | $ | 6,988 | $ | 206 | $ | 6,782 | ||||||||||||||||
Investment contracts (1) | 1 | – | 1 | 1 | – | 1 | ||||||||||||||||||||||
| $ | 7,030 | $ | 300 | $ | 6,730 | $ | 6,989 | $ | 206 | $ | 6,783 | |||||||||||||||||
Non-life insurance policyholder liabilities | ||||||||||||||||||||||||||||
Unearned premium provision (1) | $ | 410 | $ | – | $ | 410 | $ | 421 | $ | – | $ | 421 | ||||||||||||||||
Unpaid claims provision | 1,005 | 21 | 984 | 933 | 27 | 906 | ||||||||||||||||||||||
| $ | 1,415 | $ | 21 | $ | 1,394 | $ | 1,354 | $ | 27 | $ | 1,327 | |||||||||||||||||
Total | $ | 8,445 | $ | 321 | $ | 8,124 | $ | 8,343 | $ | 233 | $ | 8,110 | ||||||||||||||||
| (1) | Insurance claims and policy benefit liabilities include Investment contracts and Unearned premium provision, both of which are reported in Other liabilities on the Consolidated Balance Sheets. |
152 Royal Bank of Canada: Annual Report 2013 Consolidated Financial Statements
Table of Contents
Reconciliation of life insurance policyholder liabilities
| October 31, 2013 | October 31, 2012 | |||||||||||||||||||||||||
| (Millions of Canadian dollars) | Gross | Ceded | Net | Gross | Ceded | Net | ||||||||||||||||||||
Balances, beginning of the year | $ | 6,989 | $ | 206 | $ | 6,783 | $ | 6,291 | $ | 252 | $ | 6,039 | ||||||||||||||
New and in-force policies | (67 | ) | 94 | (161 | ) | 697 | (46 | ) | 743 | |||||||||||||||||
Changes in assumption and methodology | 108 | – | 108 | 3 | – | 3 | ||||||||||||||||||||
Net change in investment contracts | – | – | – | (2 | ) | – | (2 | ) | ||||||||||||||||||
Balances, end of the year | $ | 7,030 | $ | 300 | $ | 6,730 | $ | 6,989 | $ | 206 | $ | 6,783 | ||||||||||||||
Reconciliation of non-life insurance policyholder liabilities
| October 31, 2013 | October 31, 2012 | |||||||||||||||||||||||||
| (Millions of Canadian dollars) | Gross | Ceded | Net | Gross | Ceded | Net | ||||||||||||||||||||
Balances, beginning of the year | $ | 1,354 | $ | 27 | $ | 1,327 | $ | 1,248 | $ | 10 | $ | 1,238 | ||||||||||||||
Changes in unearned premiums provision | ||||||||||||||||||||||||||
Written Premiums | 980 | 32 | 948 | 1,006 | 13 | 993 | ||||||||||||||||||||
Less: Net premiums earned | (990 | ) | (32 | ) | (958 | ) | (1,001 | ) | (13 | ) | (988 | ) | ||||||||||||||
Changes in unpaid claims provision and adjustment expenses | ||||||||||||||||||||||||||
Incurred claims | 652 | 33 | 619 | 619 | 14 | 605 | ||||||||||||||||||||
Less: Claims paid | (581 | ) | (39 | ) | (542 | ) | (518 | ) | 3 | (521 | ) | |||||||||||||||
Balances, end of the year | $ | 1,415 | $ | 21 | $ | 1,394 | $ | 1,354 | $ | 27 | $ | 1,327 | ||||||||||||||
The net increase in Insurance claims and policy benefit liabilities over the prior year consists of the net increase in life and health, reinsurance and property and casualty liabilities attributable to business growth, partially offset by the decrease due to market movements on assets backing life and health insurance liabilities. During the year, we reviewed all key actuarial methods and assumptions which are used in determining the policy benefit liabilities. This review resulted in a net increase in life and health insurance liabilities of $108 million which includes: (i) an increase of $160 million as a result of proposed legislation in Canada impacting policyholders’ tax treatment of certain individual life insurance policies; (ii) a reduction of $29 million for assumption updates due to interest rate and market conditions; and (iii) a decrease of $23 million largely relating to mortality, morbidity, maintenance and expense assumption changes. The increase in our liability due to the change in legislation discussed above is largely dependent upon transition decisions of our policyholders. The change to the liability due to this transition may differ from actual results. A 10% reduction in the transition assumption used to determine the charge is estimated to result in a further increase to policy benefit liabilities of $34 million.
Sensitivity analysis
The following table presents the sensitivity of the level of insurance policyholder liabilities disclosed in this note to reasonably possible changes in the actuarial assumptions used to calculate them. The percentage change in variable is applied to a range of existing actuarial modelling assumptions to derive the possible impact on net profit after tax. The disclosure is not intended to explain the impact of a percentage change in the insurance assets and liabilities disclosed above. The analyses are performed where a single assumption is changed while holding other assumptions constant, which is unlikely to occur in practice.
Sensitivity
| Net income after-tax impact for year ended | ||||||||||||
| (Millions of Canadian dollars, except for percentage amounts) | Change in variable | October 31 2013 | October 31 2012 | |||||||||
Increase in market interest rates (1) | 1% | $ | 27 | $ | 8 | |||||||
Decrease in market interest rates (1) | 1 | (35 | ) | (17 | ) | |||||||
Increase in equity market values | 10 | 8 | 17 | |||||||||
Decrease in equity market values | 10 | (2 | ) | (17 | ) | |||||||
Increase in maintenance expenses | 5 | (30 | ) | (31 | ) | |||||||
Life Insurance | ||||||||||||
Adverse change in annuitant mortality rates | 2 | (53 | ) | (49 | ) | |||||||
Adverse change in assurance mortality rates | 2 | (46 | ) | (45 | ) | |||||||
Adverse change in morbidity rates | 5 | (191 | ) | (198 | ) | |||||||
Adverse change in lapse | 10 | (170 | ) | (180 | ) | |||||||
Non-life Insurance | ||||||||||||
Increase in expected loss ratio | 5 | (11 | ) | (12 | ) | |||||||
| (1) | Sensitivities for market interest rates have been calculated by increasing or decreasing 100 basis points at all points on the yield curve, with changes persisting for one year, along with a corresponding impact of 15 basis points on the ultimate reinvestment rate. |
|
We offer certain individual variable insurance contracts that allow policyholders to invest in segregated funds. The investment returns on these funds are passed directly to the policyholders. Amounts invested are at the policyholders’ risk, except where the policyholders have selected options providing maturity and death benefit guarantees. A liability for the guarantees is recorded in Insurance claims and policy benefit liabilities.
Segregated funds net assets are recorded at fair value. All of our segregated funds net assets are categorized as Level 1 in the fair value hierarchy. The fair value of the segregated funds liabilities is equal to the fair value of the segregated funds net assets. Segregated funds net assets and segregated funds liabilities are presented on separate lines on the Consolidated Balance Sheets. The following tables present the composition of net assets and the change in net assets for the year.
Consolidated Financial Statements Royal Bank of Canada: Annual Report 2013 153
Table of Contents
Note 16 Segregated Funds(continued)
|
Segregated funds net assets
| As at | ||||||||
| (Millions of Canadian dollars) | October 31 2013 | October 31 2012 | ||||||
Cash | $ | 6 | $ | 5 | ||||
Investment in mutual funds | 509 | 379 | ||||||
Other liabilities, net | (2 | ) | (1 | ) | ||||
| $ | 513 | $ | 383 | |||||
Change in net assets
| For the year ended | ||||||||
| (Millions of Canadian dollars) | October 31 2013 | October 31 2012 | ||||||
Net assets, beginning of year | $ | 383 | $ | 320 | ||||
Additions (deductions): | ||||||||
Deposits from policyholders | 188 | 128 | ||||||
Net realized and unrealized gains (losses) | 45 | 16 | ||||||
Interest and dividend | 13 | 9 | ||||||
Payment to policyholders | (105 | ) | (81 | ) | ||||
Management administrative fees | (11 | ) | (9 | ) | ||||
Net assets, end of year | $ | 513 | $ | 383 | ||||
Note 17 Pension and other post-employment benefits
|
We sponsor a number of programs, which provide pension and post-employment benefits to eligible employees.
Our defined benefit pension plans provide benefits based on years of service, contributions and average earnings at retirement. The majority of the plans’ beneficiaries are located in Canada, the United States and the United Kingdom. We measure our benefit obligations and pension assets as at October 31 each year. All plans are valued using the projected unit-credit method. The actual return on plan assets for the year ended October 31, 2013 was $996 million (October 31, 2012 – $665 million).
We fund our registered defined benefit pension plans in accordance with actuarially determined amounts required to satisfy employee benefit obligations under current pension regulations. For our principal pension plan, the most recent funding actuarial valuation was completed on January 1, 2013, and the next valuation will be completed on January 1, 2014.
Our primary other post-employment benefit plans provide health, dental, disability and life insurance coverage and cover a number of current and retired employees who are mainly located in Canada and the United States. The majority of these plans are unfunded.
For 2013, total company contributions to our pension plans (defined benefit and defined contribution plans) and other post-employment plans were $389 million and $55 million (2012 – $952 million and $55 million), respectively. For 2014, total contributions to pension plans and other post-employment benefit plans are expected to be approximately $449 million and $68 million, respectively.
154 Royal Bank of Canada: Annual Report 2013 Consolidated Financial Statements
Table of Contents
The following table presents financial information related to all of our material pension and other post-employment plans worldwide, including executive retirement arrangements.
| As at or for the year ended | ||||||||||||||||||||
| October 31, 2013 | October 31, 2012 | |||||||||||||||||||
| (Millions of Canadian dollars) | Defined benefit pension plans (1) | Other post- employment plans | Defined benefit pension plans (1) | Other post- employment plans | ||||||||||||||||
Change in fair value of plan assets | ||||||||||||||||||||
Opening fair value of plan assets | $ | 9,348 | $ | 1 | $ | 8,092 | $ | 1 | ||||||||||||
Expected return on plan assets | 569 | – | 517 | – | ||||||||||||||||
Actuarial gain (loss) | 427 | – | 148 | – | ||||||||||||||||
Company contributions | 272 | 55 | 861 | 55 | ||||||||||||||||
Plan participant contributions | 52 | 12 | 46 | 10 | ||||||||||||||||
Benefits paid | (430 | ) | (65 | ) | (406 | ) | (65 | ) | ||||||||||||
Acquisition (2) | – | – | 88 | – | ||||||||||||||||
Change in foreign currency exchange rate | 33 | – | 2 | – | ||||||||||||||||
Other | (5 | ) | – | – | – | |||||||||||||||
Closing fair value of plan assets | $ | 10,266 | $ | 3 | $ | 9,348 | $ | 1 | ||||||||||||
Change in benefit obligation | ||||||||||||||||||||
Opening benefit obligation | $ | 9,857 | $ | 1,651 | $ | 8,337 | $ | 1,461 | ||||||||||||
Current service cost | 300 | 28 | 222 | 25 | ||||||||||||||||
Interest cost | 437 | 73 | 444 | 78 | ||||||||||||||||
Plan participant contributions | 52 | 12 | 46 | 10 | ||||||||||||||||
Actuarial (gain) loss | 166 | (9 | ) | 1,165 | 126 | |||||||||||||||
Benefits paid | (430 | ) | (65 | ) | (406 | ) | (65 | ) | ||||||||||||
Acquisition (2) | – | – | 99 | 23 | ||||||||||||||||
Disposal (3) | – | – | (52 | ) | – | |||||||||||||||
Prior service cost | (1 | ) | – | – | (1 | ) | ||||||||||||||
Curtailment | (1 | ) | (3 | ) | – | (4 | ) | |||||||||||||
Change in foreign currency exchange rate | 38 | 4 | 2 | – | ||||||||||||||||
Other | (5 | ) | – | – | (2 | ) | ||||||||||||||
Closing benefit obligation | $ | 10,413 | $ | 1,691 | $ | 9,857 | $ | 1,651 | ||||||||||||
Unfunded obligation | $ | 27 | $ | 1,553 | $ | 29 | $ | 1,503 | ||||||||||||
Wholly or partly funded obligation | 10,386 | 138 | 9,828 | 148 | ||||||||||||||||
Total benefit obligation | $ | 10,413 | $ | 1,691 | $ | 9,857 | $ | 1,651 | ||||||||||||
Reconciliation of funded status | ||||||||||||||||||||
Net (deficit) surplus | $ | (147 | ) | $ | (1,688 | ) | $ | (509 | ) | $ | (1,650 | ) | ||||||||
Unrecognized net actuarial loss (gain) | 1,033 | 127 | 1,345 | 134 | ||||||||||||||||
Net amount recognized | $ | 886 | $ | (1,561 | ) | $ | 836 | $ | (1,516 | ) | ||||||||||
Amounts recognized in our Consolidated Balance Sheets | ||||||||||||||||||||
Prepaid pension benefit cost | $ | 1,084 | $ | – | $ | 1,049 | $ | – | ||||||||||||
Accrued pension and other post-employment benefit expense | (198 | ) | (1,561 | ) | (213 | ) | (1,516 | ) | ||||||||||||
Net amount recognized | $ | 886 | $ | (1,561 | ) | $ | 836 | $ | (1,516 | ) | ||||||||||
| (1) | For pension plans with funding deficits, the benefit obligations and fair value of plan assets as at October 31, 2013 were $8,996 million and $8,688 million, respectively (October 31, 2012 – $8,573 million and $7,935 million, respectively). |
| (2) | Acquisition for 2012 reflects the additional amounts relating to the acquisition of the remaining 50% interest in our previous joint venture RBC Dexia. |
| (3) | Disposal for 2012 is related to the transfer of our U.S. non-qualified pension and other post-employment plans obligations to PNC on the sale of our U.S. regional retail banking operations. See Note 11. |
The following table presents the history of the funded status of our material pension and post-employment benefits plans and the history of experience gains (losses) on our benefit obligation and plan assets:
| Defined benefit pension plans | Other post-employment plans | |||||||||||||||||||||||
| As at or for the year ended (1) | ||||||||||||||||||||||||
| (Millions of Canadian dollars) | October 31 2013 | October 31 2012 | October 31 2011 | October 31 2013 | October 31 2012 | October 31 2011 | ||||||||||||||||||
Defined benefit obligation | $ | 10,413 | $ | 9,857 | $ | 8,337 | $ | 1,691 | $ | 1,651 | $ | 1,461 | ||||||||||||
Fair value of plan assets | 10,266 | 9,348 | 8,092 | 3 | 1 | 1 | ||||||||||||||||||
(Deficit) Surplus | $ | (147 | ) | $ | (509 | ) | $ | (245 | ) | $ | (1,688 | ) | $ | (1,650 | ) | $ | (1,460 | ) | ||||||
Experience (gain) loss adjustments on defined benefit obligation | $ | 48 | $ | 7 | $ | 43 | $ | 4 | $ | – | $ | 50 | ||||||||||||
Experience gain (loss) adjustment on assets | 427 | 148 | (258 | ) | – | – | 40 | |||||||||||||||||
| (1) | Historical data will be built up over time to give a five year history. |
Consolidated Financial Statements Royal Bank of Canada: Annual Report 2013 155
Table of Contents
Note 17 Pension and other post-employment benefits(continued)
|
Pension and other post-employment benefit expense
The following table presents the composition of our pension and other post-employment benefit expense.
| Pension plans | Other post-employment plans | |||||||||||||||||||||||
| For the year ended | ||||||||||||||||||||||||
| (Millions of Canadian dollars) | October 31 2013 | October 31 2012 | October 31 2011 | October 31 2013 | October 31 2012 | October 31 2011 | ||||||||||||||||||
Service cost | $ | 300 | $ | 222 | $ | 203 | $ | 28 | $ | 25 | $ | 23 | ||||||||||||
Interest cost | 437 | 444 | 425 | 73 | 78 | 75 | ||||||||||||||||||
Expected return on plan assets | (569 | ) | (517 | ) | (498 | ) | – | – | (1 | ) | ||||||||||||||
Recognition of past service cost | – | 1 | (1 | ) | – | – | – | |||||||||||||||||
Amortization of net (gain) loss | 51 | 10 | – | (3 | ) | 2 | (1 | ) | ||||||||||||||||
Curtailment (gain) loss | (1 | ) | – | – | (3 | ) | (5 | ) | (1 | ) | ||||||||||||||
Defined benefit pension expense | $ | 218 | $ | 160 | $ | 129 | $ | 95 | $ | 100 | $ | 95 | ||||||||||||
Defined contribution pension expense | 117 | 91 | 87 | – | – | – | ||||||||||||||||||
Total benefit expense recognized | $ | 335 | $ | 251 | $ | 216 | $ | 95 | $ | 100 | $ | 95 | ||||||||||||
Investment policy and strategies
Defined benefit pension plan assets are invested prudently in order to meet our longer term pension obligations at a reasonable cost. The asset mix policy was developed within an asset/liability framework. Factors taken into consideration in developing our asset allocation include but are not limited to the following:
| (i) | the nature of the underlying benefit obligations, including the duration and term profile of the liabilities; |
| (ii) | the member demographics, including normal retirements, terminations, and deaths; |
| (iii) | the financial position of the pension plans; |
| (iv) | the diversification benefits obtained by the inclusion of multiple asset classes; and |
| (v) | expected asset returns, including assets and liability volatility and correlations. |
To implement our asset allocation policy, we may invest in equities, fixed income securities, alternative investments and derivative instruments. Our holdings in certain investments, including common shares, emerging market equities, fixed income securities rated lower than BBB and residential and commercial mortgages, cannot exceed a defined percentage of the market value of our defined benefit pension plans assets. We may use derivative instruments as either a synthetic investment to more efficiently replicate the performance of an underlying security, or as a hedge against financial risks associated with the underlying portfolio. To manage our credit risk exposure, counterparties of our derivative instruments are required to meet minimum credit ratings and enter into collateral agreements, and counterparty exposures are monitored and reported to management on an ongoing basis.
Composition of defined benefit pension plan assets
The defined benefit pension plan assets are primarily composed of equity and fixed income securities. As at October 31, 2013, the assets include 1 million (October 31, 2012 – 1 million) of our common shares having a fair value of $84 million (October 31, 2012 – $57 million) and $13 million (October 31, 2012 – $6 million) of our debt securities. For the year ended October 31, 2013, dividends received on our common shares held in the plan assets were $3 million (October 31, 2012 – $2 million). The following table presents the allocation of the plan assets by securities category, and the allocation is determined based on the fair value of the total plan assets:
Asset allocation of defined benefit pension plans
| As at | ||||||||
| October 31 2013 | October 31 2012 | |||||||
Equity securities | 42 | % | 39 | % | ||||
Debt securities | 41 | 46 | ||||||
Other | 17 | 15 | ||||||
| 100 | % | 100 | % | |||||
Significant assumptions
Our methodologies to determine significant assumptions used in calculating the defined benefit pension and other post-employment expense are as follows:
Overall expected long-term rate of return on assets
The assumed expected rate of return on assets is determined by considering long-term returns on fixed income securities combined with an estimated equity risk premium. The expected long-term return for each asset class is then weighted based on the target asset allocation to develop the expected long-term rate of return on assets assumption for the portfolio.
Discount rate
For the Canadian pension and other post-employment plans, all future expected benefit payments at each measurement date are discounted at spot rates from a derived Aa corporate bond yield curve. The derived curve is based on observed rates for Aa corporate bonds with maturities less than six years and a projected Aa corporate curve based on spreads between observed Aa corporate bonds and Aa provincial bonds for periods greater than six years. For the U.S. pension and other post-employment plans, all future expected benefit payments at each measurement date are discounted at spot rates from an Aa corporate bond yield curve. Spot rates beyond 30 years are set to equal the 30-year spot rate. The discount rate is the equivalent single rate that produces the same discounted value as that determined using the entire discount curve. This methodology does not rely on assumptions regarding reinvestment returns.
156 Royal Bank of Canada: Annual Report 2013 Consolidated Financial Statements
Table of Contents
Summary of significant assumptions
| As at | ||||||||||||||||||||||||||
| Defined benefit pension plans | Other post-employment plans | |||||||||||||||||||||||||
| October 31 2013 | October 31 2012 | October 31 2011 | October 31 2013 | October 31 2012 | October 31 2011 | |||||||||||||||||||||
Weighted average assumptions to determine benefit obligation | ||||||||||||||||||||||||||
Discount rate | 4.60% | 4.40% | 5.30% | 4.70% | 4.50% | 5.50% | ||||||||||||||||||||
Rate of increase in future compensation | 3.30% | 3.30% | 3.30% | n.a. | n.a. | n.a. | ||||||||||||||||||||
Healthcare cost trend rates | ||||||||||||||||||||||||||
– Medical (1) | n.a. | n.a. | n.a. | 3.80% | 3.90% | 4.50% | ||||||||||||||||||||
– Dental | n.a. | n.a. | n.a. | 4.00% | 4.00% | 4.00% | ||||||||||||||||||||
Weighted average assumptions to determine benefit expense | ||||||||||||||||||||||||||
Discount rate | 4.40% | 5.30% | 5.40% | 4.50% | 5.50% | 5.50% | ||||||||||||||||||||
Assumed long-term rate of return on plan assets | 6.25% | 6.25% | 6.50% | 0.00% | 0.00% | 6.50% | ||||||||||||||||||||
Rate of increase in future compensation | 3.30% | 3.30% | 3.30% | n.a. | n.a. | n.a. | ||||||||||||||||||||
Healthcare cost trend rates | ||||||||||||||||||||||||||
– Medical | n.a. | n.a. | n.a. | 3.90% | 4.50% | 4.50% | ||||||||||||||||||||
– Dental | n.a. | n.a. | n.a. | 4.00% | 4.00% | 4.00% | ||||||||||||||||||||
| (1) | For our other post-employment plans, the assumed medical healthcare cost trend rates used to measure the expected cost of benefits were 3.8% for the next year decreasing to an ultimate rate of 2.6% in 2029. |
| n.a. | not applicable |
Mortality assumptions
Mortality assumptions are significant in measuring our obligations under the defined benefit plans. These assumptions have been set based on country specific statistics. Future longevity improvements have been considered and included where appropriate. The following table summarizes the mortality assumptions used for major plans.
| October 31, 2013 | October 31, 2012 | |||||||||||||||||||||||||||||||||||||||
| Life expectancy at 65 for a member currently at | Life expectancy at 65 for a member currently at | |||||||||||||||||||||||||||||||||||||||
| Age 65 | Age 45 | Age 65 | Age 45 | |||||||||||||||||||||||||||||||||||||
| (In years) | Male | Female | Male | Female | Male | Female | Male | Female | ||||||||||||||||||||||||||||||||
Country | ||||||||||||||||||||||||||||||||||||||||
Canada | 22.4 | 23.2 | 23.5 | 24.1 | 20.3 | 22.1 | 21.8 | 22.9 | ||||||||||||||||||||||||||||||||
United States | 20.5 | 22.8 | 21.0 | 23.3 | 20.3 | 22.1 | 21.8 | 22.9 | ||||||||||||||||||||||||||||||||
United Kingdom | 23.8 | 25.1 | 26.0 | 27.5 | 23.6 | 25.0 | 25.9 | 27.3 | ||||||||||||||||||||||||||||||||
Sensitivity analysis
Assumptions adopted can have a significant effect on the obligations and expense for defined benefit pension and post-employment benefit plans. The following table presents the sensitivity analysis of key assumptions for 2013:
| (Millions of Canadian dollars) | Increase (decrease) in obligation | Increase (decrease) in expense | ||||||
Defined benefit pension plans | ||||||||
Impact of .25% decrease in discount rate | $ | 354 | $ | 46 | ||||
Impact of .25% increase in rate of increase in future compensation | 28 | 6 | ||||||
Impact of .25% decrease in the long-term rate of return on plan assets | – | 24 | ||||||
Other post-employment plans | ||||||||
Impact of .25% decrease in discount rate | $ | 60 | $ | – | ||||
Impact of .25% increase in rate of increase in future compensation | 4 | – | ||||||
Impact of 1% increase in health care cost trend rate | 123 | 7 | ||||||
Impact of 1% decrease in health care cost trend rate | (102 | ) | (6 | ) | ||||
Consolidated Financial Statements Royal Bank of Canada: Annual Report 2013 157
Table of Contents
|
| As at | ||||||||
| (Millions of Canadian dollars) | October 31 2013 | October 31 2012 | ||||||
Cash collateral | $ | 8,855 | $ | 10,843 | ||||
Accounts payable and accrued expenses | 6,996 | 6,214 | ||||||
Payroll and related compensation | 5,911 | 5,002 | ||||||
Negotiable instruments | 2,172 | 2,282 | ||||||
Payable to brokers, dealers and clients | 1,821 | 1,750 | ||||||
Accrued interest payable | 1,795 | 1,878 | ||||||
Deferred income | 1,783 | 1,580 | ||||||
Taxes payable | 1,482 | 1,312 | ||||||
Dividends payable | 1,027 | 932 | ||||||
Precious metals certificates | 677 | 967 | ||||||
Insurance related liabilities | 566 | 559 | ||||||
Provisions | 271 | 235 | ||||||
Deferred income taxes | 195 | 176 | ||||||
Other | 5,562 | 7,641 | ||||||
| $ | 39,113 | $ | 41,371 | |||||
Note 19 Subordinated debentures
|
The debentures are unsecured obligations and are subordinated in right of payment to the claims of depositors and certain other creditors. All redemptions, cancellations and exchanges of subordinated debentures are subject to the consent and approval of OSFI. All subordinated debentures are redeemable at our option. The amounts presented below include the impact of fair value hedging for interest rate risk and are net of our holdings in these securities which have not been cancelled and are still outstanding.
| (Millions of Canadian dollars, except percentage and foreign currency) | Interest rate | Denominated in foreign currency (millions) | As at | |||||||||||||||||
| Maturity | Earliest par value redemption date | October 31 2013 | October 31 2012 | |||||||||||||||||
November 14, 2014 | 10.00% | $ | 217 | $ | 233 | |||||||||||||||
March 11, 2018 | March 11, 2013 | (1) | 4.84% | (2) | – | 1,005 | ||||||||||||||
June 6, 2018 | June 6, 2013 | (3) | 5.00% | (4) | – | 1,004 | ||||||||||||||
November 4, 2018 | November 4, 2013 | (5) | 5.45% | (6) | 1,000 | 1,033 | ||||||||||||||
June 15, 2020 | June 15, 2015 | 4.35% | (7) | 1,508 | 1,556 | |||||||||||||||
November 2, 2020 | November 2, 2015 | 3.18% | (8) | 1,488 | 1,524 | |||||||||||||||
June 8, 2023 | 9.30% | 110 | 110 | |||||||||||||||||
December 6, 2024 | December 6, 2019 | 2.99% | (9) | 1,947 | – | |||||||||||||||
November 1, 2027 | November 1, 2022 | 4.75% | TT$300 | 49 | – | |||||||||||||||
June 26, 2037 | June 26, 2017 | 2.86% | JPY 10,000 | 109 | 122 | |||||||||||||||
October 1, 2083 | Any interest payment date | (10) | 224 | 224 | ||||||||||||||||
June 29, 2085 | Any interest payment date | (11) | US$174 | 181 | 173 | |||||||||||||||
June 18, 2103 | June 18, 2009 | (12) | 5.95% | (13) | 615 | 636 | ||||||||||||||
| $ | 7,448 | $ | 7,620 | |||||||||||||||||
Deferred financing costs |
| (5 | ) | (5 | ) | |||||||||||||||
| $ | 7,443 | $ | 7,615 | |||||||||||||||||
The terms and conditions of the debentures are as follows:
| (1) | All $1 billion outstanding subordinated debentures were redeemed on March 13, 2013 for 100% of their principal amount plus accrued interest to the redemption date. |
| (2) | Interest at stated interest rate until earliest par value redemption date, and thereafter at a rate of 2.00% above the 90-day Bankers’ Acceptance rate. |
| (3) | All $1 billion outstanding subordinated debentures were redeemed on June 6, 2013 for 100% of their principal amount plus accrued interest to the redemption date. |
| (4) | Interest at stated interest rate until earliest par value redemption date, and thereafter at a rate 2.15% above the 90-day Bankers’ Acceptance rate. |
| (5) | All $1 billion outstanding subordinated debentures were redeemed on November 4, 2013 for 100% of their principal amount plus accrued interest to the redemption date. |
| (6) | Interest at stated interest rate until earliest par value redemption date, and thereafter at a rate of 1.00% above the 90-day Bankers’ Acceptance rate. |
| (7) | Interest at stated interest rate until earliest par value redemption date, and thereafter at a rate of 1.41% above the 90-day Bankers’ Acceptance rate. |
| (8) | Interest at stated interest rate until earliest par value redemption date, and thereafter at a rate of 1.21% above the 90-day Bankers’ Acceptance rate. |
| (9) | Interest at stated interest rate until earliest par value redemption date, and thereafter at a rate of 1.10% above the 90-day Bankers’ Acceptance rate. |
| (10) | Interest at a rate of 40 basis points above the 30-day Bankers’ Acceptance rate. |
| (11) | Interest at a rate of 25 basis points above the U.S. dollar 3-month LIMEAN. In the event of a reduction of the annual dividend we declare on our common shares, the interest payable on the debentures is reduced pro rata to the dividend reduction and the interest reduction is payable with the proceeds from the sale of newly issued common shares. |
| (12) | Redeemable on June 18, 2009, or every fifth anniversary of such date at par value. Redeemable on any other date at the greater of par and the yield on a non-callable Government of Canada bond plus 21 basis points if redeemed prior to June 18, 2014, or 43 basis points if redeemed at any time after June 18, 2014. |
| (13) | Interest at a rate of 5.95% until earliest par value redemption date and every 5 years thereafter at a rate of 1.72% above the 5-year Government of Canada yield. |
158 Royal Bank of Canada: Annual Report 2013 Consolidated Financial Statements
Table of Contents
Maturity schedule
The aggregate maturities of subordinated debentures, based on the maturity dates under the terms of issue, are as follows:
| (Millions of Canadian dollars) | October 31 2013 | |||
Within 1 year | $ | – | ||
1 to 5 years | 217 | |||
5 to 10 years | 4,105 | |||
Thereafter | 3,126 | |||
| $ | 7,448 | |||
Note 20 Trust capital securities
|
We issued innovative capital instruments, RBC Trust Capital Securities (RBC TruCS) and RBC Trust Subordinated Notes (RBC TSNs), through three SPEs: RBC Capital Trust (Trust), RBC Capital Trust II (Trust II) and RBC Subordinated Notes Trust (Trust III). Trust III was wound up in 2013 after the redemption of the RBC TSNs.
Trust has issued non-voting RBC Trust Capital Securities Series 2010, 2011, 2015 and 2008-1 (RBC TruCS 2010, 2011, 2015 and 2008-1). RBC TruCS 2010 and 2011 were redeemed in 2010 and 2011, respectively.
The holders of RBC TruCS 2015 and 2008-1 do not have any conversion rights or any other redemption rights. As a result, upon consolidation of the Trust, RBC TruCS 2015 and 2008-1 are classified as Non-controlling interests. Holders of RBC TruCS 2015 and 2008-1 are eligible to receive semi-annual non-cumulative fixed cash distributions until December 31, 2015 and June 30, 2018, respectively, and a floating-rate cash distribution thereafter.
Trust II, an open-end trust, has issued non-voting RBC TruCS 2013, the proceeds of which were used to purchase a senior deposit note from us. Upon consolidation of Trust II, the senior deposit note and all of our financial interests in the SPE are eliminated, and RBC TruCS 2013 is classified as Trust capital securities. Holders of RBC TruCS 2013 are eligible to receive semi-annual non-cumulative fixed cash distributions. On October 25, 2013, we announced that Trust II will redeem all of its issued and outstanding $900 million principal amount RBC TruCS 2013 for cash at a redemption price of $1,000 per unit on December 31, 2013.
No cash distributions will be payable by the trusts on RBC TruCS if we fail to declare regular dividends (i) on our preferred shares, or (ii) on our common shares if no preferred shares are then outstanding. In this case, the net distributable funds of the trusts will be distributed to us as holders of residual interest in the trusts. Should the trusts fail to pay the semi-annual distributions in full, we will not declare dividends of any kind on any of our preferred or common shares for a specified period of time.
The table below presents the significant terms and conditions of RBC TruCS.
Significant terms and conditions of RBC Trust Capital Securities
| As at | ||||||||||||||||||||||||||||
| Earliest redemption date | Conversion date | October 31 2013 Principal | October 31 2012 Principal | |||||||||||||||||||||||||
| (Millions of Canadian dollars, except for percentage amounts) | Issuance date | Distribution dates | Annual yield | At the option of the issuer | At the option of the holder | |||||||||||||||||||||||
RBC Capital Trust(1),(2),(3),(4),(5),(6),(7) | ||||||||||||||||||||||||||||
Included in Non-controlling interests | ||||||||||||||||||||||||||||
1,200,000 Trust Capital Securities | October 28, 2005 | June 30, December 31 | 4.87% | (8) | December 31, 2010 | n.a. | $ | 1,200 | $ | 1,200 | ||||||||||||||||||
500,000 Trust Capital Securities | April 28, 2008 | June 30, December 31 | 6.82% | (8) | June 30, 2013 | n.a. | 500 | 500 | ||||||||||||||||||||
RBC Capital Trust II(2),(3),(4),(6),(7),(9) | ||||||||||||||||||||||||||||
Included in Trust capital securities | ||||||||||||||||||||||||||||
900,000 Trust Capital Securities | July 23, 2003 | June 30, December 31 | 5.812% | December 31, 2008 | Any time | $ | 900 | $ | 900 | |||||||||||||||||||
The significant terms and conditions of the RBC TruCS are as follows:
| (1) | Subject to the approval of OSFI, Trust may, on the Earliest redemption date specified above, and on any Distribution date thereafter, redeem in whole (but not in part) the RBC TruCS 2008-1 and 2015, without the consent of the holders. |
| (2) | Subject to the approval of OSFI, upon occurrence of a special event as defined, prior to the Earliest redemption date specified above, the trusts may redeem in whole (but not in part) the RBC TruCS 2008-1, 2013 or 2015 without the consent of the holders. |
| (3) | Issuer Redemption Price: The RBC TruCS 2008-1 may be redeemed for cash equivalent to (i) the Early Redemption Price if the redemption occurs prior to June 30, 2018 or (ii) the Redemption Price if the redemption occurs on or after June 30, 2018. The RBC TruCS 2013 and 2015 may be redeemed for cash equivalent to (i) the Early Redemption Price if the redemption occurs prior to December 31, 2013 and 2015, respectively, or (ii) the Redemption Price if the redemption occurs on or after December 31, 2013 and 2015, respectively. Redemption Price refers to an amount equal to $1,000 plus the unpaid distributions to the Redemption date. Early Redemption Price refers to an amount equal to the greater of (i) the Redemption Price and (ii) the price calculated to provide an annual yield, equal to the yield on a Government of Canada bond issued on the Redemption date with a maturity date of June 30, 2018, plus 77 basis points, for RBC TruCS 2008-1, and a maturity date of December 31, 2013 and 2015, plus 23 basis points and 19.5 basis points, for RBC TruCS 2013 and 2015, respectively. |
| (4) | Automatic Exchange Event: Without the consent of the holders, each RBC TruCS 2008-1, 2013 and 2015 will be exchanged automatically for 40 of our non-cumulative redeemable First Preferred Shares Series Al, T and Z, respectively, upon occurrence of any one of the following events: (i) proceedings are commenced for our winding-up; (ii) OSFI takes control of us; (iii) we have Tier 1 capital ratio of less than 5% or Total capital ratio of less than 8%; or (iv) OSFI has directed us to increase our capital or provide additional liquidity and we elect such automatic exchange or we fail to comply with such direction. The First Preferred Shares Series AI, T and Z pay semi-annual non-cumulative cash dividends and Series T is convertible at the option of the holder into a variable number of common shares. |
| (5) | From time to time, we purchase some of the innovative capital instruments and hold them temporarily. As at October 31, 2012, we held $20 million of RBC TruCS 2015 as treasury holdings which were deducted from regulatory capital. |
| (6) | Regulatory capital: In accordance with OSFI Capital Adequacy Requirements, effective January 2013, RBC TruCS no longer qualify as additional tier 1 capital due to their lack of non-viability contingent capital terms and conditions. As such, outstanding RBC TruCS are being phased out of regulatory capital in accordance with OSFI guidelines. As at October 31, 2012, $2,580 million represents Tier 1 Capital, none for Tier 2B capital, and $20 million of our treasury holdings of innovative capital was deducted for regulatory capital purposes. |
| (7) | Holder Exchange Right: Holders of RBC TruCS 2013 may, at any time, exchange all or part of their holdings for 40 non-cumulative redeemable First Preferred Shares Series U, for each RBC TruCS 2013 held. The First Preferred Shares Series U pay semi-annual non-cumulative cash dividends as and when declared by our Board of Directors and are convertible at the option of the holder into a variable number of common shares. Holders of RBC TruCS 2008-1 and RBC TruCS 2015 do not have similar exchange rights. |
| (8) | The non-cumulative cash distribution on the RBC TruCS 2015 will be 4.87% paid semi-annually until December 31, 2015, and at one half of the sum of 180-day Bankers’ Acceptance rate plus 1.5%, thereafter. The non-cumulative cash distribution on the RBC TruCS 2008-1 will be 6.821% paid semi-annually until June 30, 2018, and at one half of the sum of 180-day Bankers’ Acceptance rate plus 3.5% thereafter. |
| (9) | Subject to the approval of OSFI, Trust II may, in whole or in part, on the Earliest redemption date specified above, and on any distribution date thereafter, redeem any outstanding RBC TruCS 2013 without the consent of the holders. |
| n.a. | not applicable |
Consolidated Financial Statements Royal Bank of Canada: Annual Report 2013 159
Table of Contents
|
Share capital
Authorized share capital
Preferred – An unlimited number of First Preferred Shares and Second Preferred Shares without nominal or par value, issuable in series; the aggregate consideration for which all the First Preferred Shares and all the Second Preferred Shares that may be issued may not exceed $20 billion and $5 billion, respectively.
Common – An unlimited number of shares without nominal or par value may be issued.
Outstanding share capital
The following table details our common and preferred shares outstanding.
| As at | ||||||||||||||||||||||||||
| October 31, 2013 | October 31, 2012 | |||||||||||||||||||||||||
(Millions of Canadian dollars, except the number of shares and dividends per share) | Number of shares (thousands) | Amount | Dividends declared per share | Number of shares (thousands) | Amount | Dividends declared per share | ||||||||||||||||||||
Preferred shares | ||||||||||||||||||||||||||
First preferred(1) | ||||||||||||||||||||||||||
Non-cumulative Series W | 12,000 | $ | 300 | $ | 1.23 | 12,000 | $ | 300 | $ | 1.23 | ||||||||||||||||
Non-cumulative Series AA | 12,000 | 300 | 1.11 | 12,000 | 300 | 1.11 | ||||||||||||||||||||
Non-cumulative Series AB | 12,000 | 300 | 1.18 | 12,000 | 300 | 1.18 | ||||||||||||||||||||
Non-cumulative Series AC | 8,000 | 200 | 1.15 | 8,000 | 200 | 1.15 | ||||||||||||||||||||
Non-cumulative Series AD | 10,000 | 250 | 1.13 | 10,000 | 250 | 1.13 | ||||||||||||||||||||
Non-cumulative Series AE | 10,000 | 250 | 1.13 | 10,000 | 250 | 1.13 | ||||||||||||||||||||
Non-cumulative Series AF | 8,000 | 200 | 1.11 | 8,000 | 200 | 1.11 | ||||||||||||||||||||
Non-cumulative Series AG | 10,000 | 250 | 1.13 | 10,000 | 250 | 1.13 | ||||||||||||||||||||
Non-cumulative Series AH (2) | – | – | 0.86 | 8,500 | 213 | 1.41 | ||||||||||||||||||||
Non-cumulative, 5-Year Rate Reset Series AJ | 16,000 | 400 | 1.25 | 16,000 | 400 | 1.25 | ||||||||||||||||||||
Non-cumulative, 5-Year Rate Reset Series AL | 12,000 | 300 | 1.40 | 12,000 | 300 | 1.40 | ||||||||||||||||||||
Non-cumulative, 5-Year Rate Reset Series AN | 9,000 | 225 | 1.56 | 9,000 | 225 | 1.56 | ||||||||||||||||||||
Non-cumulative, 5-Year Rate Reset Series AP | 11,000 | 275 | 1.56 | 11,000 | 275 | 1.56 | ||||||||||||||||||||
Non-cumulative, 5-Year Rate Reset Series AR | 14,000 | 350 | 1.56 | 14,000 | 350 | 1.56 | ||||||||||||||||||||
Non-cumulative, 5-Year Rate Reset Series AT | 11,000 | 275 | 1.56 | 11,000 | 275 | 1.56 | ||||||||||||||||||||
Non-cumulative, 5-Year Rate Reset Series AV | 16,000 | 400 | 1.56 | 16,000 | 400 | 1.56 | ||||||||||||||||||||
Non-cumulative, 5-Year Rate Reset Series AX | 13,000 | 325 | 1.53 | 13,000 | 325 | 1.53 | ||||||||||||||||||||
| $ | 4,600 | $ | 4,813 | |||||||||||||||||||||||
Common shares | ||||||||||||||||||||||||||
Balance at beginning of year | 1,445,303 | $ | 14,323 | 1,438,376 | $ | 14,010 | ||||||||||||||||||||
Issued under dividend reinvestment plan (3) | – | – | 3,752 | 187 | ||||||||||||||||||||||
Issued under the stock option plan (4) | 2,528 | 121 | 3,175 | 126 | ||||||||||||||||||||||
Purchased for cancellation (5) | (6,775 | ) | (67 | ) | – | – | ||||||||||||||||||||
Balance at end of year | 1,441,056 | $ | 14,377 | $ | 2.53 | 1,445,303 | $ | 14,323 | $ | 2.28 | ||||||||||||||||
Treasury shares – Preferred shares | ||||||||||||||||||||||||||
Balance at beginning of year | 42 | $ | 1 | (6 | ) | $ | – | |||||||||||||||||||
Sales | 4,892 | 127 | 3,706 | 98 | ||||||||||||||||||||||
Purchases | (4,887 | ) | (127 | ) | (3,658 | ) | (97 | ) | ||||||||||||||||||
Balance at end of year | 47 | $ | 1 | 42 | $ | 1 | ||||||||||||||||||||
Treasury shares – Common shares | ||||||||||||||||||||||||||
Balance at beginning of year | 543 | $ | 30 | 146 | $ | 8 | ||||||||||||||||||||
Sales | 71,361 | 4,453 | 99,008 | 5,186 | ||||||||||||||||||||||
Purchases | (71,238 | ) | (4,442 | ) | (98,611 | ) | (5,164 | ) | ||||||||||||||||||
Balance at end of year | 666 | $ | 41 | 543 | $ | 30 | ||||||||||||||||||||
| (1) | First Preferred Shares Series were issued at $25 per share. |
| (2) | On July 2, 2013, we redeemed all 8.5 million of issued and outstanding Non-Cumulative First Preferred Shares Series AH for cash at a redemption price of $26 per share plus declared dividends. This amount is comprised of the $25 per share original issue price plus a $1 per share redemption premium. |
| (3) | During 2013, the requirements of our dividend reinvestment plan (DRIP) were satisfied through open market share purchases. During 2012, the requirements of our DRIP were satisfied through open market share purchases and treasury share issuances. |
| (4) | Includes fair value adjustments to stock options of $14 million (2012 – $17 million). |
| (5) | During the year end October 31, 2013, we purchased for cancellation 7 million common shares at an average cost of $60.34 per share and a book value of $9.94 per share. |
160 Royal Bank of Canada: Annual Report 2013 Consolidated Financial Statements
Table of Contents
| Dividend per share (1) | Initial Period | Dividend Reset | Earliest redemption date (3) | Issue Date | Redemption price (3), (4) | Conversion date (6) | ||||||||||||||||||||||||||
| At the option of the bank (3), (5) | At the option of the holder | |||||||||||||||||||||||||||||||
Preferred shares | ||||||||||||||||||||||||||||||||
First preferred | ||||||||||||||||||||||||||||||||
Non-cumulative Series W | $ | .306250 | 4.90% | February 24, 2010 | January 31, 2005 | $ | 25.25 | February 24, 2010 | Not convertible | |||||||||||||||||||||||
Non-cumulative Series AA | .278125 | 4.45% | May 24, 2011 | April 4, 2006 | 25.50 | Not convertible | Not convertible | |||||||||||||||||||||||||
Non-cumulative Series AB | .293750 | 4.70% | August 24, 2011 | July 20, 2006 | 25.50 | Not convertible | Not convertible | |||||||||||||||||||||||||
Non-cumulative Series AC | .287500 | 4.60% | November 24, 2011 | November 1, 2006 | 25.50 | Not convertible | Not convertible | |||||||||||||||||||||||||
Non-cumulative Series AD | .281250 | 4.50% | February 24, 2012 | December 13, 2006 | 25.75 | Not convertible | Not convertible | |||||||||||||||||||||||||
Non-cumulative Series AE | .281250 | 4.50% | February 24, 2012 | January 19, 2007 | 25.75 | Not convertible | Not convertible | |||||||||||||||||||||||||
Non-cumulative Series AF | .278125 | 4.45% | May 24, 2012 | March 14, 2007 | 25.75 | Not convertible | Not convertible | |||||||||||||||||||||||||
Non-cumulative Series AG | .281250 | 4.50% | May 24, 2012 | April 26, 2007 | 25.75 | Not convertible | Not convertible | |||||||||||||||||||||||||
Non-cumulative, 5-Year Rate Reset Series AJ | .312500 | 5.00% | 1.93% | February 24, 2014 | September 16, 2008 | 25.00 | Not convertible | Not convertible | ||||||||||||||||||||||||
Non-cumulative, 5-Year Rate Reset Series AL | .350000 | 5.60% | 2.67% | February 24, 2014 | November 3, 2008 | 25.00 | Not convertible | Not convertible | ||||||||||||||||||||||||
Non-cumulative, 5-Year Rate Reset Series AN | .390625 | 6.25% | 3.50% | February 24, 2014 | December 8, 2008 | 25.00 | Not convertible | Not convertible | ||||||||||||||||||||||||
Non-cumulative, 5-Year Rate Reset Series AP | .390625 | 6.25% | 4.19% | February 24, 2014 | January 14, 2009 | 25.00 | Not convertible | Not convertible | ||||||||||||||||||||||||
Non-cumulative, 5-Year Rate Reset Series AR | .390625 | 6.25% | 4.50% | February 24, 2014 | January 29, 2009 | 25.00 | Not convertible | Not convertible | ||||||||||||||||||||||||
Non-cumulative, 5-Year Rate Reset Series AT | .390625 | 6.25% | 4.06% | August 24, 2014 | March 9, 2009 | 25.00 | Not convertible | Not convertible | ||||||||||||||||||||||||
Non-cumulative, 5-Year Rate Reset Series AV | .390625 | 6.25% | 4.42% | August 24, 2014 | April 1, 2009 | 25.00 | Not convertible | Not convertible | ||||||||||||||||||||||||
Non-cumulative, 5-Year Rate Reset Series AX | .381250 | 6.10% | 4.13% | November 24, 2014 | April 29, 2009 | 25.00 | Not convertible | Not convertible | ||||||||||||||||||||||||
| (1) | Non-cumulative preferential dividends of each Series are payable quarterly, as and when declared by the Board of Directors, on or about the 24th day of February, May, August and November. |
| (2) | The dividend rate will reset on the earliest redemption date and every fifth year thereafter at a rate equal to the 5-year Government of Canada bond yield plus the premium indicated. The holders have the option to convert their shares into non-cumulative floating rate First Preferred Shares subject to certain conditions on the earliest redemption date and every fifth year thereafter at a rate equal to the three-month Government of Canada Treasury Bill rate plus the premium indicated. |
| (3) | The redemption price represents the price as at October 31, 2013 or the contractual redemption price, whichever is applicable. Subject to the consent of OSFI and the requirements of theBank Act (Canada), we may, on or after the dates specified above, redeem First Preferred Shares. In the case of Series W, AA, AB, AC, AD, AE, AF and AG, these may be redeemed for cash at a price per share of $26 if redeemed during the 12 months commencing on the earliest redemption date and decreasing by $0.25 each 12-month period thereafter to a price per share of $25 if redeemed four years from the earliest redemption date or thereafter. In the case of Series AJ, AL, AN, AP, AR, AT, AV and AX, these may be redeemed for cash at a price per share of $25 if redeemed on the earliest redemption date and on the same date every fifth year thereafter. |
| (4) | Subject to the consent of OSFI and the requirements of theBankAct (Canada), we may purchase the First Preferred Shares of each Series for cancellation at the lowest price or prices at which, in the opinion of the Board of Directors, such shares are obtainable. |
| (5) | Subject to the approval of the Toronto Stock Exchange, we may, on or after the dates specified above, convert First Preferred Shares Series W into our common shares. First Preferred Shares may be converted into that number of common shares determined by dividing the then-applicable redemption price by the greater of $2.50 and 95% of the weighted average trading price of common shares at such time. |
| (6) | The conversion date refers to the date of conversion to common shares. |
Restrictions on the payment of dividends
We are prohibited by theBank Act (Canada) from declaring any dividends on our preferred or common shares when we are, or would be placed as a result of the declaration, in contravention of the capital adequacy and liquidity regulations or any regulatory directives issued under the Act. We may not pay dividends on our common shares at any time unless all dividends to which preferred shareholders are then entitled have been declared and paid or set apart for payment. We have agreed that if Trust or Trust II fail to pay any required distribution on the trust capital securities in full, we will not declare dividends of any kind on any of our preferred or common shares. Refer to Note 20. Currently, these limitations do not restrict the payment of dividends on our preferred or common shares.
We have also agreed that if, on any day we report financial results for a quarter, (i) we report a cumulative consolidated net loss for the immediately preceding four quarters; and (ii) during the immediately preceding quarter we fail to declare any cash dividends on all of our outstanding preferred and common shares, we may defer payments of interest on the Series 2014-1 Reset Subordinated Notes (matures on June 18, 2103). During any period while interest is being deferred, (i) interest will accrue on these notes but will not compound; (ii) we may not declare or pay dividends (except by way of stock dividend) on, or redeem or repurchase, any of our preferred or common shares; and (iii) we may not make any payment of interest, principal or premium on any debt securities or indebtedness for borrowed money issued or incurred by us that rank subordinate to these notes.
Dividend reinvestment plan
Our DRIP provides registered common shareholders with a means to receive additional common shares rather than cash dividends. The plan is only open to registered shareholders residing in Canada or the United States. The requirements of our DRIP are satisfied through either open market share purchases or shares issued from treasury.
Consolidated Financial Statements Royal Bank of Canada: Annual Report 2013 161
Table of Contents
Note 21 Equity(continued)
|
Shares available for future issuances
As at October 31, 2013, 46 million common shares are available for future issue relating to our DRIP and potential exercise of stock options outstanding. In addition, we may issue up to 39 million common shares from treasury under the RBC Umbrella Savings and Securities Purchase Plan that was approved by shareholders on February 26, 2009.
Non-controlling interests
| As at | ||||||||
| (Millions of Canadian dollars) | October 31 2013 | October 31 2012 | ||||||
RBC Trust Capital Securities (1) | ||||||||
Series 2015 | $ | 1,220 | $ | 1,200 | ||||
Series 2008-1 | 511 | 511 | ||||||
Others | 64 | 50 | ||||||
| $ | 1,795 | $ | 1,761 | |||||
| (1) | As at October 31, 2013, RBC TruCS Series 2015 includes $20 million of accrued interest (October 31, 2012 – $20 million), net of $nil of treasury holdings (October 31, 2012 – $20 million). Series 2008-1 includes $11 million of accrued interest (October 31, 2012 – $11 million), net of $nil of treasury holdings (October 31, 2012 – $nil). |
Note 22 Share-based compensation
|
We offer share-based compensation to certain key employees and to our non-employee directors. We use derivatives and compensation trusts to manage our exposure to volatility in the price of our common shares under many of these plans. The share-based compensation amounts recorded in Non-interest expense – Human resources in our Consolidated Statements of Income are net of the impact of these derivatives.
Stock option plans
We have stock option plans for certain key employees. Under the plans, options are periodically granted to purchase common shares. The exercise price for each grant is determined as the higher of the volume-weighted average of the trading prices per board lot (100 shares) of our common shares on the Toronto Stock Exchange (i) on the day preceding the day of grant; and (ii) the five consecutive trading days immediately preceding the day of grant. The options vest over a four-year period for employees and are exercisable for a period not exceeding 10 years from the grant date.
The compensation expense recorded for the year ended October 31, 2013, in respect of the stock option plans was $7 million (October 31, 2012 – $7 million; October 31, 2011 – $13 million). The compensation expense related to non-vested awards was $5 million at October 31, 2013 (October 31, 2012 – $7 million; October 31, 2011 – $9 million), to be recognized over the weighted average period of 1.1 years (October 31, 2012 – 1.5 years; October 31, 2011 – 1.8 years).
Analysis of the movement in the number and weighted average exercise price of options is set out below:
A summary of our stock option activity and related information
| October 31, 2013 | October 31, 2012 | October 31, 2011 | ||||||||||||||||||||||||||
| (Canadian dollars per share except share amounts) | Number of options (thousands) | Weighted average exercise price | Number of options (thousands) | Weighted average exercise price | Number of options (thousands) | Weighted average exercise price | ||||||||||||||||||||||
Outstanding at beginning of year | 12,304 | $ | 48.12 | 14,413 | $ | 45.06 | 15,659 | $ | 40.90 | |||||||||||||||||||
Granted | 906 | 58.65 | 1,161 | 48.93 | 1,815 | 52.60 | ||||||||||||||||||||||
Exercised (1), (2) | (2,528 | ) | 42.22 | (3,174 | ) | 34.36 | (2,954 | ) | 27.76 | |||||||||||||||||||
Forfeited in the year | (78 | ) | 53.27 | (96 | ) | 52.37 | (100 | ) | 44.04 | |||||||||||||||||||
Expired in the year | – | – | – | – | (7 | ) | 24.64 | |||||||||||||||||||||
Outstanding at end of year | 10,604 | $ | 50.39 | 12,304 | $ | 48.12 | 14,413 | $ | 45.06 | |||||||||||||||||||
Exercisable at end of year | 5,711 | $ | 47.80 | 6,544 | $ | 45.43 | 8,688 | $ | 41.64 | |||||||||||||||||||
Available for grant | 12,140 | 12,968 | 14,033 | |||||||||||||||||||||||||
| (1) | Cash received for options exercised during the year was $107 million (October 31, 2012 – $109 million; October 31, 2011 – $82 million) and the weighted average share price at the date of exercise was $63.17 (October 31, 2012 – $54.48; October 31, 2011 – $55.61). |
| (2) | New shares were issued for all stock options exercised in 2013, 2012 and 2011. See Note 21. |
Options outstanding as at October 31, 2013 by range of exercise price
| Options outstanding | Options exercisable | |||||||||||||||||||||
| (Canadian dollars per share except share amounts) | Number outstanding (thousands) | Weighted average exercise price (1) | Weighted average remaining contractual life | Number exercisable (thousands) | Weighted average exercise price (1) | |||||||||||||||||
$29.68 – $35.37 | 1,607 | $ | 34.75 | 4.59 | 1,607 | $ | 34.75 | |||||||||||||||
$44.13 – $48.93 | 1,701 | 47.32 | 6.07 | 571 | 44.13 | |||||||||||||||||
$50.55 – $52.94 | 2,895 | 52.69 | 5.88 | 1,153 | 52.82 | |||||||||||||||||
$54.99 – $58.65 | 4,401 | 55.78 | 5.81 | 2,380 | 55.06 | |||||||||||||||||
| 10,604 | $ | 50.39 | 5.68 | 5,711 | $ | 47.80 | ||||||||||||||||
| (1) | The weighted average exercise prices have been revised to reflect the conversion of foreign currency-denominated options at the exchange rate as at our Consolidated Balance Sheet date. |
162 Royal Bank of Canada: Annual Report 2013 Consolidated Financial Statements
Table of Contents
The weighted average fair value of options granted during 2013 was estimated at $5.33 (2012 – $4.42; 2011 – $7.30). This was determined by applying the Black-Scholes model on the date of grant, taking into account the specific terms and conditions under which the options are granted, such as the vesting period and expected share price volatility estimated by considering both historic average share price volatility and implied volatility derived from traded options over our common shares of similar maturity to those of the employee options. The following assumptions were used to determine the fair value of options granted:
Weighted average assumptions
| For the year ended | ||||||||||||
| (Canadian dollars per share except percentages) | October 31 2013 | October 31 2012 | October 31 2011 | |||||||||
Weighted average assumptions | ||||||||||||
Share price at grant date | $ | 58.65 | $ | 48.19 | $ | 52.60 | ||||||
Risk-free interest rate | 1.38% | 1.38% | 2.72% | |||||||||
Expected dividend yield | 4.19% | 3.93% | 3.62% | |||||||||
Expected share price volatility | 18% | 18% | 20% | |||||||||
Expected life of option | 6 years | 6 years | 6 years | |||||||||
Employee savings and share ownership plans
We offer many employees an opportunity to own our common shares through savings and share ownership plans. Under these plans, the employees can generally contribute between 1% and 10% of their annual salary or benefit base for commissioned based employees. For each contribution between 1% and 6%, we will match 50% of the employee contributions in our common shares. For the RBC Dominion Securities Savings Plan, our maximum annual contribution is $4,500 per employee. For the RBC U.K. Share Incentive Plan, our maximum annual contribution is £1,500 per employee. In 2013, we contributed $77 million (2012 – $75 million; 2011 – $72 million), under the terms of these plans, towards the purchase of our common shares. As at October 31, 2013, an aggregate of 38 million common shares were held under these plans (October 31, 2012 – 37 million common shares; October 31, 2011 – 36 million common shares).
Deferred share and other plans
We offer deferred share unit plans to executives, non-employee directors and to certain key employees. Under these plans, the executives or directors may choose to receive all or a percentage of their annual variable short-term incentive bonus or directors’ fee in the form of deferred share units (DSUs). The executives or directors must elect to participate in the plan prior to the beginning of the year. DSUs earn dividend equivalents in the form of additional DSUs at the same rate as dividends on common shares. The participant is not allowed to convert the DSUs until retirement, permanent disability or termination of employment/directorship. The cash value of the DSUs is equivalent to the market value of common shares when conversion takes place.
We have a deferred bonus plan for certain key employees within Capital Markets. Under this plan, a percentage of each employee’s annual incentive bonus is deferred and accumulates dividend equivalents at the same rate as dividends on common shares. The employee will receive the deferred bonus amounts within 90 days of the three following year end dates. The value of the deferred bonus paid will be equivalent to the original deferred bonus adjusted for dividends and changes in the market value of common shares at the time the bonus is paid.
We offer performance deferred share award plans to certain key employees, all of which vest at the end of three years. Upon vesting, the award is paid in cash and is based on the original number of RBC share units granted plus accumulated dividends valued using the average closing price of RBC common shares during the five days immediately preceding the vesting date. A portion of the award under certain plans can be increased or decreased up to 25%, depending on our total shareholder return compared to a defined peer group of global financial institutions. We previously offered deferred compensation to certain employees in the form of common shares that were held in trust and accumulated dividends during the three year vesting period. We held a nominal number of common shares in trust as at October 31, 2013 (October 31, 2012 – 0.3 million; October 31, 2011 – 0.7 million).
We maintain a non-qualified deferred compensation plan for key employees in the United States under an arrangement called the RBC U.S. Wealth Accumulation Plan. This plan allows eligible employees to defer a portion of their annual income and allocate the deferrals among various fund choices, which include a share unit fund that tracks the value of our common shares. Certain deferrals may also be eligible for matching contributions, all of which are allocated to the RBC share unit fund.
For other stock-based plans, the number of our common shares held under these plans was nil as at October 31, 2013 (October 31, 2012 – 0.1 million; October 31, 2011 – 0.1 million).
Our liabilities for the awards granted under the deferred share and other plans are measured at fair value, determined based on the quoted market price of our common shares. The following tables present our obligations under the deferred share and other plans, and the related compensation expenses (recoveries) recognized for the year.
| Obligation under deferred share and other plans | ||||||||||||||||||||||||||||||||||||||||||||||
| October 31, 2013 | October 31, 2012 | October 31, 2011 | ||||||||||||||||||||||||||||||||||||||||||||
Units granted during the year | Units outstanding at the end of the year | Units granted during the year | Units Outstanding at the end of the year | Units granted during the year | Units outstanding at the end of the year | |||||||||||||||||||||||||||||||||||||||||
| (Millions of Canadian dollars except units and per unit amounts) | Number granted (thousands) | Weighted average fair value | Carrying amount | Number granted (thousands) | Weighted average fair value | Carrying amount | Number granted (thousands) | Weighted average fair value | Carrying amount | |||||||||||||||||||||||||||||||||||||
Deferred share unit plans | 265 | $ | 60.83 | $ | 307 | 302 | $ | 59.60 | $ | 229 | 228 | $ | 64.74 | $ | 187 | |||||||||||||||||||||||||||||||
Deferred bonus plan | 5,215 | 69.45 | 1,517 | 8,917 | 56.72 | 1,494 | 7,314 | 49.50 | 1,116 | |||||||||||||||||||||||||||||||||||||
Performance deferred share award plans | 2,337 | 58.62 | 393 | 2,570 | 49.03 | 307 | 2,360 | 52.60 | 299 | |||||||||||||||||||||||||||||||||||||
RBC U.S. Wealth Accumulation Plan | 374 | 62.84 | 355 | 458 | 51.61 | 305 | 390 | 59.45 | 263 | |||||||||||||||||||||||||||||||||||||
Other share-based plans | 809 | 60.47 | 76 | 437 | 51.34 | 45 | 401 | 53.70 | 26 | |||||||||||||||||||||||||||||||||||||
| 9,000 | $ | 65.30 | $ | 2,648 | 12,684 | $ | 54.86 | $ | 2,380 | 10,693 | $ | 51.03 | $ | 1,891 | ||||||||||||||||||||||||||||||||
Consolidated Financial Statements Royal Bank of Canada: Annual Report 2013 163
Table of Contents
Note 22 Share-based compensation(continued)
|
| Compensation expenses (recoveries) recognized under deferred share and other plans | ||||||||||||
| For the year ended | ||||||||||||
| (Millions of Canadian dollars) | October 31 2013 | October 31 2012 | October 31 2011 | |||||||||
Deferred share unit plans | $ | 53 | $ | 29 | $ | (8 | ) | |||||
Deferred bonus plan | 284 | 185 | (60 | ) | ||||||||
Performance deferred share award plans | 249 | 151 | 147 | |||||||||
RBC U.S. Wealth Accumulation Plan | 211 | 136 | 33 | |||||||||
Other share-based plans | 46 | 29 | 11 | |||||||||
| $ | 843 | $ | 530 | $ | 123 | |||||||
Note 23 Income and expenses from selected financial instruments
|
Gains and losses arising from financial instruments held at FVTPL, except for those supporting our insurance operations, are reported in Non-interest income. Related interest and dividend income are reported in Net interest income.
| Net gains(losses) from financial instruments held at fair value through profit or loss(1) | ||||||||||||
| For the year ended | ||||||||||||
| (Millions of Canadian dollars) | October 31 2013 | October 31 2012 (3) | October 31 2011 (3) | |||||||||
Net gains (losses) | ||||||||||||
Classified as at fair value through profit or loss (2) | $ | 875 | $ | 1,210 | $ | 10 | ||||||
Designated as at fair value through profit or loss | (30 | ) | (54 | ) | 599 | |||||||
| $ | 845 | $ | 1,156 | $ | 609 | |||||||
By product line | ||||||||||||
Interest rate and credit | $ | 593 | $ | 796 | $ | 321 | ||||||
Equities | (55 | ) | (8 | ) | (38 | ) | ||||||
Foreign exchange and commodities | 307 | 368 | 326 | |||||||||
| $ | 845 | $ | 1,156 | $ | 609 | |||||||
| (1) | The following related to our insurance operations are excluded from Non-interest income and included in Insurance premiums, investment and fee income on the Consolidated Statements of Income: Net gains(losses) from financial instruments designated as at FVTPL were $(496) million (2012 – $439 million; 2011 – $213 million). |
| (2) | Excludes derivatives designated in a hedging relationship. See Note 8 for net gains (losses) on these derivatives. |
| (3) | Amounts have been revised from those previously presented. |
| Net interest income from financial instruments(1) | ||||||||||||
| For the year ended | ||||||||||||
| (Millions of Canadian dollars) | October 31 2013 | October 31 2012 | October 31 2011 | |||||||||
Interest income | ||||||||||||
Financial instruments held as at fair value through profit or loss | $ | 3,959 | $ | 4,957 | $ | 5,250 | ||||||
Other categories of financial instruments (2) | 17,191 | 15,895 | 15,563 | |||||||||
| 21,150 | 20,852 | 20,813 | ||||||||||
Interest expense | ||||||||||||
Financial instruments held as at fair value through profit or loss | $ | 2,260 | $ | 3,029 | $ | 3,827 | ||||||
Other categories of financial instruments | 5,639 | 5,325 | 5,629 | |||||||||
| 7,899 | 8,354 | 9,456 | ||||||||||
Net interest income | $ | 13,251 | $ | 12,498 | $ | 11,357 | ||||||
| (1) | The following related to our insurance operations are excluded from Net-interest income and included in Insurance premiums, investment and fee income on the Consolidated Statements of Income: Interest income of $470 million (2012 – $466 million; 2011 – $456 million). |
| (2) | See Note 5 for interest income accrued on impaired financial assets. |
Income from other categories of financial instruments(1), (2)
| For the year ended | ||||||||||||
| (Millions of Canadian dollars) | October 31 2013 | October 31 2012 | October 31 2011 | |||||||||
Net gains (losses) arising from financial instruments measured at amortized cost (3) | $ | – | $ | (4 | ) | $ | (1 | ) | ||||
Net fee income which does not form an integral part of the effective interest rate of financial assets and liabilities | 4,204 | 3,784 | 3,528 | |||||||||
Net fee income arising from trust and other fiduciary activities | 7,990 | 6,855 | 6,812 | |||||||||
| (1) | See Note 4 for net gains (losses) on AFS securities. |
| (2) | See Note 4 for impairment losses on AFS and held-to-maturity securities, and Note 5 for impairment losses on loans. |
| (3) | Financial instruments measured at amortized cost include held-to-maturity securities, loans and financial liabilities measured at amortized cost. |
164 Royal Bank of Canada: Annual Report 2013 Consolidated Financial Statements
Table of Contents
|
The components of tax expense are as follows:
| For the year ended | ||||||||||||
| (Millions of Canadian dollars) | October 31 2013 | October 31 2012 | October 31 2011 | |||||||||
Income taxes (recoveries) in Consolidated Statements of Income | ||||||||||||
Current tax | ||||||||||||
Tax expense (recoveries) for current year | $ | 2,566 | $ | 2,217 | $ | 2,074 | ||||||
Adjustments for prior years | (289 | ) | (184 | ) | (8 | ) | ||||||
(Recoveries) arising from previously unrecognized tax loss, tax credit or temporary difference of a prior period | (2 | ) | – | – | ||||||||
| 2,275 | 2,033 | 2,066 | ||||||||||
Deferred tax | ||||||||||||
Origination and reversal of temporary difference | (67 | ) | (86 | ) | (66 | ) | ||||||
Effects of changes in tax rates | (1 | ) | 2 | 36 | ||||||||
Adjustments for prior years | (5 | ) | 167 | (26 | ) | |||||||
(Recoveries) arising from previously unrecognized tax loss, tax credit or temporary difference of a prior period | (46 | ) | (16 | ) | – | |||||||
Write-down, or (reversal of a previous write-down) | 32 | – | – | |||||||||
| (87 | ) | 67 | (56 | ) | ||||||||
| 2,188 | 2,100 | 2,010 | ||||||||||
Income taxes in Consolidated Statements of Comprehensive Income and Changes in Equity | ||||||||||||
Other comprehensive income | ||||||||||||
Net unrealized gains (losses) on available-for-sale securities | 3 | 72 | (56 | ) | ||||||||
Reclassification of (gains) losses on available-for-sale securities to income | (20 | ) | (2 | ) | 45 | |||||||
Unrealized foreign currency translation gains (losses) | 2 | 1 | – | |||||||||
Foreign currency translation (losses) gains from hedging activities | (322 | ) | 39 | 279 | ||||||||
Reclassification of gains on net investment hedging activities | – | (59 | ) | – | ||||||||
Net unrealized (losses) gains on derivatives designated as cash flow hedges | (4 | ) | 11 | 137 | ||||||||
Reclassification of (gains) losses on derivatives designated as cash flow hedges to income | (11 | ) | 10 | 29 | ||||||||
| (352 | ) | 72 | 434 | |||||||||
Total income taxes | $ | 1,836 | $ | 2,172 | $ | 2,444 | ||||||
Our effective tax rate changed from 21.7% for 2012 to 20.6% for 2013, principally due to a decrease of 0.2% in our Canadian statutory rate and the differences itemized in the table below.
The following is an analysis of the differences between the income tax expense reflected in the Consolidated Statements of Income and the amounts calculated at the Canadian statutory rate:
Reconciliation to statutory tax rate
| For the year ended | ||||||||||||||||||||||||
| (Millions of Canadian dollars, except for percentage amounts) | October 31, 2013 | October 31, 2012 | October 31, 2011 | |||||||||||||||||||||
Income taxes at Canadian statutory tax rate | $ | 2,782 | 26.2 | % | $ | 2,558 | 26.4 | % | $ | 2,523 | 28.1 | % | ||||||||||||
(Decrease) increase in income taxes resulting from | ||||||||||||||||||||||||
Lower average tax rate applicable to subsidiaries | (186 | ) | (1.8 | ) | (289 | ) | (3.0 | ) | (271 | ) | (3.0 | ) | ||||||||||||
Goodwill Impairment | – | – | 37 | 0.4 | – | – | ||||||||||||||||||
Tax-exempt income from securities | (294 | ) | (2.8 | ) | (330 | ) | (3.4 | ) | (355 | ) | (4.0 | ) | ||||||||||||
Tax rate change | (1 | ) | – | 2 | – | 36 | 0.4 | |||||||||||||||||
Effect of previously unrecognized tax loss, tax credit or temporary differences | (48 | ) | (0.4 | ) | (16 | ) | (0.1 | ) | – | – | ||||||||||||||
Other | (65 | ) | (0.6 | ) | 138 | 1.4 | 77 | 0.9 | ||||||||||||||||
Income taxes reported in Consolidated Statements of Income / effective tax rate | $ | 2,188 | 20.6 | % | $ | 2,100 | 21.7 | % | $ | 2,010 | 22.4 | % | ||||||||||||
Deferred tax assets and liabilities result from tax loss carry-forwards and temporary differences between the tax basis of assets and liabilities and their carrying amounts on our Consolidated Balance Sheets.
Consolidated Financial Statements Royal Bank of Canada: Annual Report 2013 165
Table of Contents
Note 24 Income taxes(continued)
|
Significant components of deferred tax assets and liabilities
| As at October 31, 2013 | ||||||||||||||||||||||||||||
| (Millions of Canadian dollars) | Net Asset November 1, 2012 | Change through equity | Change through profit or loss | Exchange rate differences | Acquisitions/ disposals | Other | Net Asset October 31, 2013 | |||||||||||||||||||||
Net deferred tax asset/(liability) | ||||||||||||||||||||||||||||
Allowance for credit losses | $ | 418 | $ | – | $ | (55 | ) | $ | (1 | ) | $ | 58 | $ | (7 | ) | $ | 413 | |||||||||||
Deferred compensation | 989 | – | 270 | 33 | – | (1 | ) | 1,291 | ||||||||||||||||||||
Business realignment charges | 39 | – | (33 | ) | – | – | – | 6 | ||||||||||||||||||||
Tax loss carryforwards | 72 | 1 | (13 | ) | – | – | 2 | 62 | ||||||||||||||||||||
Deferred income | 97 | – | 2 | – | (57 | ) | – | 42 | ||||||||||||||||||||
Available-for-sale securities | 140 | (1 | ) | (39 | ) | 2 | – | – | 102 | |||||||||||||||||||
Derivatives designated as cash flow hedges | – | – | – | – | – | – | – | |||||||||||||||||||||
Premises and equipment | (151 | ) | – | (82 | ) | 1 | – | 5 | (227 | ) | ||||||||||||||||||
Deferred expense | (81 | ) | – | 1 | – | – | – | (80 | ) | |||||||||||||||||||
Pension and post-employement related | 155 | – | 21 | – | – | – | 176 | |||||||||||||||||||||
Intangibles | (227 | ) | – | (17 | ) | (7 | ) | (31 | ) | 4 | (278 | ) | ||||||||||||||||
Other | 80 | 1 | 32 | 1 | 31 | 5 | 150 | |||||||||||||||||||||
| $ | 1,531 | $ | 1 | $ | 87 | $ | 29 | $ | 1 | $ | 8 | $ | 1,657 | |||||||||||||||
Comprising | ||||||||||||||||||||||||||||
Deferred tax assets | $ | 1,707 | $ | 1,852 | ||||||||||||||||||||||||
Deferred tax liabilities | (176 | ) | (195 | ) | ||||||||||||||||||||||||
| $ | 1,531 | $ | 1,657 | |||||||||||||||||||||||||
| As at October 31, 2012 | ||||||||||||||||||||||||||||
| (Millions of Canadian dollars) | Net Asset November 1, 2011 | Change through equity | Change through profit or loss | Exchange rate differences | Acquisitions/ disposals | Other | Net Asset October 31, 2012 | |||||||||||||||||||||
Net deferred tax asset/(liability) | ||||||||||||||||||||||||||||
Allowance for credit losses | $ | 374 | $ | – | $ | 5 | $ | – | $ | – | $ | 39 | $ | 418 | ||||||||||||||
Deferred compensation | 878 | – | 106 | 5 | – | – | 989 | |||||||||||||||||||||
Business realignment charges | 26 | – | 13 | – | – | – | 39 | |||||||||||||||||||||
Tax loss carryforwards | 34 | – | 30 | (2 | ) | 10 | – | 72 | ||||||||||||||||||||
Deferred income | 251 | (11 | ) | (143 | ) | – | – | – | 97 | |||||||||||||||||||
Available-for-sale securities | 173 | (21 | ) | (3 | ) | 2 | – | (11 | ) | 140 | ||||||||||||||||||
Derivatives designated as cash flow hedges | (3 | ) | – | 3 | – | – | – | – | ||||||||||||||||||||
Premises and equipment | (193 | ) | – | 42 | – | – | – | (151 | ) | |||||||||||||||||||
Deferred expense | (65 | ) | – | (16 | ) | – | – | – | (81 | ) | ||||||||||||||||||
Pension and post-employement related | 316 | – | (172 | ) | – | 11 | – | 155 | ||||||||||||||||||||
Intangibles | (180 | ) | – | 8 | (1 | ) | (54 | ) | – | (227 | ) | |||||||||||||||||
Other | 17 | – | 60 | 1 | 3 | (1 | ) | 80 | ||||||||||||||||||||
| $ | 1,628 | $ | (32 | ) | $ | (67 | ) | $ | 5 | $ | (30 | ) | $ | 27 | $ | 1,531 | ||||||||||||
Comprising | ||||||||||||||||||||||||||||
Deferred tax assets | $ | 1,894 | $ | 1,707 | ||||||||||||||||||||||||
Deferred tax liabilities | (266 | ) | (176 | ) | ||||||||||||||||||||||||
| $ | 1,628 | $ | 1,531 | |||||||||||||||||||||||||
The tax loss carry-forwards amount of deferred tax assets was related to losses in our Trinidad and Tobago, Luxembourg, U.S., U.K. and Japanese operations. Deferred tax assets of $62 million (October 31, 2012 – $72 million) were recognized at October 31, 2013 in respect of tax losses incurred in current or preceding years which recognition is dependent on the projection of future taxable profits. Management’s forecasts support the assumption that it is probable that the results of future operations will generate sufficient taxable income to utilize the deferred tax assets. The forecasts rely on continued liquidity and capital support to our business operations, including tax planning strategies implemented in relation to such support.
As at October 31, 2013, unused tax losses and tax credits of $514 million and $183 million (October 31, 2012 – $359 million and $393 million) available to be offset against potential tax adjustments or future taxable income were not recognized as deferred tax assets. This amount includes unused tax losses of $168 million (October 31, 2012 – $11 million) which expire in two to four years, and $346 million (October 31, 2012 – $348 million) which expire after four years. There are $183 million of tax credits (October 31, 2012 – $393 million) that will expire after four years.
The amount of temporary differences associated with investments in subsidiaries, branches and associates and interests in joint ventures for which deferred tax liabilities have not been recognized in parent bank is $7.7 billion as at October 31, 2013 (October 31, 2012 – $7 billion).
166 Royal Bank of Canada: Annual Report 2013 Consolidated Financial Statements
Table of Contents
|
| For the year ended | ||||||||||||
| (Millions of Canadian dollars, except share and per share amounts) | October 31 2013 | October 31 2012 | October 31 2011 | |||||||||
Basic earnings per share | ||||||||||||
Net Income | $ | 8,429 | $ | 7,539 | $ | 6,444 | ||||||
Net loss from discontinued operations | – | (51 | ) | (526 | ) | |||||||
Net income from continuing operations | 8,429 | 7,590 | 6,970 | |||||||||
Preferred share dividends | (253 | ) | (258 | ) | (258 | ) | ||||||
Net income attributable to non-controlling interest | (98 | ) | (97 | ) | (101 | ) | ||||||
Net income available to common shareholders from continuing operations | 8,078 | 7,235 | 6,611 | |||||||||
Weighted average number of common shares (in thousands) | 1,443,735 | 1,442,167 | 1,430,722 | |||||||||
Basic earnings (loss) per share | ||||||||||||
Continuing operations (in dollars) | $ | 5.60 | $ | 5.01 | $ | 4.62 | ||||||
Discontinued operations (in dollars) | – | (0.03 | ) | (0.37 | ) | |||||||
Total | $ | 5.60 | $ | 4.98 | $ | 4.25 | ||||||
Diluted earnings per share | ||||||||||||
Net income available to common shareholders from continuing operations | $ | 8,078 | $ | 7,235 | $ | 6,611 | ||||||
Dilutive impact of exchangeable shares | 53 | 53 | 78 | |||||||||
Net income from continuing operations available to common shareholders including dilutive impact of exchangeable shares | 8,131 | 7,288 | 6,689 | |||||||||
Net loss from discontinued operations available to common shareholders | – | (51 | ) | (526 | ) | |||||||
Weighted average number of common shares (in thousands) | 1,443,735 | 1,442,167 | 1,430,722 | |||||||||
Stock options (1) | 2,320 | 1,626 | 2,941 | |||||||||
Issuable under other share-based compensation plans | 74 | 433 | 1,043 | |||||||||
Exchangeable shares (2) | 20,400 | 24,061 | 36,787 | |||||||||
Average number of diluted common shares (in thousands) | 1,466,529 | 1,468,287 | 1,471,493 | |||||||||
Diluted earnings (loss) per share | ||||||||||||
Continuing operations (in dollars) | $ | 5.54 | $ | 4.96 | $ | 4.55 | ||||||
Discontinued operations (in dollars) | – | (0.03 | ) | (0.36 | ) | |||||||
Total | $ | 5.54 | $ | 4.93 | $ | 4.19 | ||||||
| (1) | The dilutive effect of stock options was calculated using the treasury stock method. When the exercise price of options outstanding is greater than the average market price of our common shares, the options are excluded from the calculation of diluted earnings per share. The following amounts were excluded from the calculation of diluted earnings per share: for 2013 – no outstanding options were excluded from the calculation of diluted earnings per share; for 2012 – an average of 3,992,229 outstanding options with an exercise price of $55.05; for 2011 – an average of 4,052,267 outstanding options with an average exercise price of $55.05. |
| (2) | Includes exchangeable preferred shares and trust capital securities. |
Note 26 Guarantees, commitments, pledged assets and contingencies
|
Guarantees and commitments
We utilize guarantees and other off-balance sheet credit instruments to meet the financing needs of our clients.
The table below summarizes our maximum exposure to credit losses related to our guarantees and commitments provided to third parties. The maximum exposure to credit risk relating to a guarantee is the maximum risk of loss if there was a total default by the guaranteed parties, without consideration of possible recoveries under recourse provisions, insurance policies or from collateral held or pledged. The maximum exposure to credit risk relating to a loan commitment is the full amount of the commitment. In both cases, the maximum risk exposure is significantly greater than the amount recognized as a liability in our Consolidated Balance Sheets.
| Maximum exposure to credit losses | ||||||||
| As at | ||||||||
| (Millions of Canadian dollars) | October 31 2013 | October 31 2012 | ||||||
Financial guarantees | ||||||||
Financial standby letters of credit | $ | 15,592 | $ | 14,683 | ||||
Commitments to extend credit | ||||||||
Backstop liquidity facilities | 32,142 | 30,317 | ||||||
Credit enhancements | 3,181 | 3,708 | ||||||
Documentary and commercial letters of credit | 139 | 186 | ||||||
Other commitments to extend credit | 117,704 | 94,198 | ||||||
Other commitments | ||||||||
Securities lending indemnifications | 57,749 | 56,141 | ||||||
Performance guarantees | 5,221 | 5,396 | ||||||
Our credit review process, our policy for requiring collateral security, and the types of collateral security held are generally the same for guarantees and commitments as for loans. Our clients generally have the right to request settlement of, or draw on, our guarantees and commitments within one year. However, certain guarantees can only be drawn if specified conditions are met. These conditions, along with collateral requirements, are described below. We believe that it is highly unlikely that all or substantially all of the guarantees and commitments will be drawn or settled within one year, and contracts may expire without being drawn or settled.
Consolidated Financial Statements Royal Bank of Canada: Annual Report 2013 167
Table of Contents
Note 26 Guarantees, commitments, pledged assets and contingencies(continued)
|
Financial guarantees
Financial standby letters of credit
Financial standby letters of credit represent irrevocable assurances that we will make payments in the event that a client cannot meet its obligations to the third party. For certain guarantees, the guaranteed party can request payment from us even though the client has
not defaulted on its obligations. The term of these guarantees can range up to eight years. Our policy for requiring collateral security with respect to these instruments and the types of collateral security held is generally the same as for loans.
When collateral security is taken, it is determined on an account-by-account basis according to the risk of the borrower and the specifics of the transaction. Collateral security may include cash, securities and other assets pledged.
Commitments to extend credit
Backstop liquidity facilities
Backstop liquidity facilities are provided to asset-backed commercial paper conduit programs administered by us and third parties, as an alternative source of financing in the event that such programs are unable to access commercial paper markets, or in limited circumstances, when predetermined performance measures of the financial assets owned by these programs are not met. The average term of these liquidity facilities is approximately three years.
Backstop liquidity facilities are also provided to non-asset backed programs such as variable rate demand notes issued by third parties. These standby facilities provide liquidity support to the issuer to buy the notes if the issuer is unable to remarket the notes, as long as the instrument and/or the issuer maintain the investment grade rating.
The terms of the backstop liquidity facilities do not require us to advance money to these programs in the event of bankruptcy or insolvency events and generally do not require us to purchase non-performing or defaulted assets.
Credit enhancements
We provide partial credit enhancement to multi-seller programs administered by us to protect commercial paper investors in the event that the collection on the underlying assets, the transaction-specific credit enhancement or the liquidity proves to be insufficient to pay for maturing commercial paper. Each of the asset pools is structured to achieve a high investment-grade credit profile through credit enhancements from us and other third parties related to each transaction. The average term of these credit facilities is approximately three years.
Documentary and commercial letters of credit
Documentary and commercial letters of credit, which are written undertakings by us on behalf of a client authorizing a third party to draw drafts on us up to a stipulated amount under specific terms and conditions, are collateralized by the underlying shipment of goods to which they relate.
Other commitments to extend credit
Commitments to extend credit represent unused portions of authorizations to extend credit in the form of loans, bankers’ acceptances or letters of credit.
Other commitments
Securities lending indemnifications
In securities lending transactions, we act as an agent for the owner of a security, who agrees to lend the security to a borrower for a fee, under the terms of a pre-arranged contract. The borrower must fully collateralize the security loaned at all times. As part of this custodial business, an indemnification may be provided to securities lending customers to ensure that the fair value of securities loaned will be returned in the event that the borrower fails to return the borrowed securities and the collateral held is insufficient to cover the fair value of those securities. These indemnifications normally terminate without being drawn upon. The term of these indemnifications varies, as the securities loaned are recallable on demand. Collateral held for our securities lending transactions typically includes cash or securities that are issued or guaranteed by the Canadian government, U.S. government or other OECD countries.
Prior to the third quarter of 2012, securities lending transactions were generally transacted through our former joint venture, RBC Dexia. RBC Dexia, renamed RBC Investor Services, is now a wholly-owned subsidiary.
Performance guarantees
Performance guarantees represent irrevocable assurances that we will make payments to third-party beneficiaries in the event that a client fails to perform under a specified non-financial contractual obligation. Such obligations typically include works and service contracts, performance bonds, and warranties related to international trade. The term of these guarantees can range up to eight years. Our policy for requiring collateral security with respect to these instruments and the types of collateral security held is generally the same as for loans.
When collateral security is taken, it is determined on an account-by-account basis according to the risk of the borrower and the specifics of the transaction. Collateral security may include cash, securities and other assets pledged.
Indemnifications
In the normal course of our operations, we provide indemnifications which are often standard contractual terms to counterparties in transactions such as purchase and sale contracts, fiduciary, agency, licensing and service agreements, director/officer contracts and leasing transactions. These indemnification agreements may require us to compensate the counterparties for costs incurred as a result of changes in laws and regulations (including tax legislation) or as a result of litigation claims or statutory sanctions that may be suffered by the counterparty as a consequence of the transaction. The terms of these indemnification agreements will vary based on the contract. The nature of the indemnification agreements prevents us from making a reasonable estimate of the maximum potential amount we could be required to pay to counterparties. Historically, we have not made any significant payments under such indemnifications.
Uncommitted amounts
Uncommitted amounts represent undrawn credit facilities for which we have the ability to unilaterally withdraw the credit extended to the borrower. These include both retail and commercial commitments. As at October 31, 2013, the total balance of uncommitted amounts was $183 billion (October 31, 2012 – $172 billion).
168 Royal Bank of Canada: Annual Report 2013 Consolidated Financial Statements
Table of Contents
Pledged assets and collateral
In the ordinary course of business, we pledge assets and enter in collateral agreements with terms and conditions that are usual and customary to our regular lending, borrowing and trading activities recorded on our Consolidated Balance Sheets. The following are examples of our general terms and conditions on pledged assets and collateral:
| • | The risks and rewards of the pledged assets reside with the pledgor. |
| • | The pledged asset is returned to the pledgor when the necessary conditions have been satisfied. |
| • | The right of the pledgee to sell or re-pledge the asset is dependent on the specific agreement under which the collateral is pledged. |
| • | If there is no default, the pledgee must return the comparable asset to the pledgor upon satisfaction of the obligation. |
We are also required to provide intraday pledges to the Bank of Canada when we use the Large Value Transfer System (LVTS), which is a real-time electronic wire transfer system that continuously processes all Canadian dollar large-value or time-critical payments throughout the day. The pledged assets earmarked for LVTS activities are normally released back to us at the end of the settlement cycle each day. Therefore, the pledged assets amount is not included in the table below. For the year ended October 31, 2013, we had on average $3.0 billion of assets pledged intraday to the Bank of Canada on a daily basis (October 31, 2012 – $3.2 billion). There are infrequent occasions where we are required to take an overnight advance from the Bank of Canada to cover a settlement requirement, in which case an equivalent value of the pledged assets would be used to secure the advance. There were no overnight advances taken on October 31, 2013 and October 31, 2012.
Details of assets pledged against liabilities and collateral assets held or re-pledged are shown in the following tables:
| As at | ||||||||
| (Millions of Canadian dollars) | October 31 2013 | October 31 2012 (1) | ||||||
Sources of pledged assets and collateral | ||||||||
Bank assets | ||||||||
Cash and due from banks | $ | 204 | $ | 94 | ||||
Interest-bearing deposits with banks | 83 | 424 | ||||||
Cash collateral for securities borrowed | 4,701 | 4,818 | ||||||
Loans | 74,138 | 65,077 | ||||||
Securities | 42,918 | 38,438 | ||||||
Other assets | 11,678 | 19,411 | ||||||
| $ | 133,722 | $ | 128,262 | |||||
Client assets | ||||||||
Collateral received and available for sale or re-pledging | 175,050 | 166,642 | ||||||
Less: not sold or re-pledged | (64,121 | ) | (53,217 | ) | ||||
| 110,929 | 113,425 | |||||||
| 244,651 | 241,687 | |||||||
Uses of pledged assets and collateral | ||||||||
Securities lent | $ | 19,535 | $ | 17,775 | ||||
Securities borrowed | 28,796 | 30,011 | ||||||
Obligations related to securities sold short | 47,128 | 40,756 | ||||||
Obligations related to securities lent or sold under repurchase agreements | 56,580 | 58,943 | ||||||
Securitization | 49,899 | 51,959 | ||||||
Covered bonds | 22,750 | 13,276 | ||||||
Derivative transactions | 14,363 | 22,124 | ||||||
Foreign governments and central banks | 1,928 | 2,608 | ||||||
Clearing systems, payment systems and depositories | 3,672 | 4,235 | ||||||
| $ | 244,651 | $ | 241,687 | |||||
| (1) | Certain amounts have been revised from results previously reported. |
Lease commitments
Finance lease commitments
We lease computer equipment from third parties under finance lease arrangements. The leases have various terms, escalation and renewal rights. The future minimum lease payments under the finance leases are as follows:
| As at | ||||||||||||||||||||||||||
| October 31, 2013 | October 31, 2012 | |||||||||||||||||||||||||
| (Millions of Canadian dollars) | Total future | Future interest charges | Present value of | Total future minimum lease payments | Future interest charges | Present value of | ||||||||||||||||||||
Future minimum lease payments | ||||||||||||||||||||||||||
No later than one year | $ | 69 | $ | (8 | ) | $ | 61 | $ | 62 | $ | (6 | ) | $ | 56 | ||||||||||||
Later than one year and no later than five years | 86 | (10 | ) | 76 | 108 | (12 | ) | 96 | ||||||||||||||||||
Later than five years | – | – | – | – | – | – | ||||||||||||||||||||
| $ | 155 | $ | (18 | ) | $ | 137 | $ | 170 | $ | (18 | ) | $ | 152 | |||||||||||||
Consolidated Financial Statements Royal Bank of Canada: Annual Report 2013 169
Table of Contents
Note 26 Guarantees, commitments, pledged assets and contingencies(continued)
|
The net carrying amount of computer equipment held under finance lease as at October 31, 2013 was $153 million (October 31, 2012 – $156 million).
Operating lease commitments
We are obligated under a number of non-cancellable operating leases for premises and equipment. These leases have various terms, escalation and renewal rights. The minimum future lease payments under non-cancellable operating leases are as follows.
| As at | ||||||||||||||||||
| October 31, 2013 | October 31, 2012 | |||||||||||||||||
| (Millions of Canadian dollars) | Land and buildings | Equipment | Land and buildings | Equipment | ||||||||||||||
Future minimum lease payments | ||||||||||||||||||
No later than one year | $ | 586 | $ | 138 | $ | 566 | $ | 131 | ||||||||||
Later than one year and no later than five years | 1,752 | 314 | 1,663 | 449 | ||||||||||||||
Later than five years | 1,349 | – | 1,256 | 4 | ||||||||||||||
| 3,687 | 452 | 3,485 | 584 | |||||||||||||||
Less: Future minimum sublease payments to be received | (25 | ) | – | (20 | ) | (1 | ) | |||||||||||
Net future minimum lease payments | $ | 3,662 | $ | 452 | $ | 3,465 | $ | 583 | ||||||||||
Litigation
We are a large global institution that is subject to many different complex legal and regulatory requirements. As a result, Royal Bank of Canada and its subsidiaries are and have been subject to a variety of claims and investigations in various jurisdictions. Management reviews the status of all proceedings on an ongoing basis and will exercise its judgment in resolving them in such manner as management believes to be in the Bank’s best interest. The following is a description of our significant legal proceedings. We are vigorously defending ourselves in each of these matters.
LIBOR inquiries and litigation
Various regulators and competition and enforcement authorities around the world, including in Canada, the UK, and the U.S., are conducting investigations related to certain past submissions made by panel banks in connection with the setting of the U.S. dollar London interbank offered rate (LIBOR). As Royal Bank of Canada is a member of certain LIBOR panels, including the U.S. dollar LIBOR panel, we have been the subject of regulatory demands for information and are cooperating with those investigations. In addition, Royal Bank of Canada and other U.S. dollar panel banks have been named as defendants in private lawsuits filed in the U.S. with respect to the setting of LIBOR, including a number of class action lawsuits which have been consolidated before the U.S. District Court for the Southern District of New York (the Court). The complaints in those actions assert claims against us and other panel banks under various U.S. laws including U.S. antitrust laws, the U.S. Commodity Exchange Act (CEA), and state law. In March 2013, the Court dismissed the federal antitrust and racketeering claims of certain U.S. dollar LIBOR plaintiffs and a portion of their claims brought under the CEA. The Court declined to dismiss certain other CEA claims and declined to exercise jurisdiction over certain state and common law claims. Plaintiffs will have the opportunity to replead certain claims that have been dismissed. Based on the facts currently known, it is not possible at this time for us to predict the resolution of these regulatory investigations or private lawsuits, including the timing and potential impact on Royal Bank of Canada.
CFTC litigation
Royal Bank of Canada is a defendant in a civil lawsuit brought by the Commodity Futures Trading Commission (CFTC) in the U.S. The lawsuit alleges that certain inter-affiliate transactions were improper wash trades and effected in a non competitive manner. Further, the complaint alleges that we wilfully made false, fictitious or fraudulent statements to the Chicago Mercantile Exchange about the manner in which we intended to, and did, structure these transactions. It is not possible to predict the outcome of these proceedings, nor the timing of their resolution; however, we strongly deny these allegations. At this time, management does not believe that the ultimate resolution of this matter will have a material adverse effect on our consolidated financial position or results of operations.
Wisconsin school districts litigation
Royal Bank of Canada is a defendant in a lawsuit relating to our role in transactions involving investments made by a number of Wisconsin school districts in certain collateralized debt obligations. These transactions were also the subject of a regulatory investigation. Despite reaching a settlement with the Securities and Exchange Commission in September 2011, which was paid to the school districts through a Fair Fund, the lawsuit is continuing. It is not possible to predict the ultimate outcome of these proceedings or the timing of their resolution; however, management believes the ultimate resolution of these proceedings will not have a material adverse effect on our consolidated financial position or results of operations.
Other matters
We are a defendant in a number of other actions alleging that certain of our practices and actions were improper. The lawsuits involve a variety of complex issues and the timing of their resolution is varied and uncertain. Management believes that we will ultimately be successful in resolving these lawsuits, to the extent that we are able to assess them, without material financial impact to the Bank. This is, however, an area of significant judgment and the potential liability resulting from these lawsuits could be material to our results of operations in any particular period.
Various other legal proceedings are pending that challenge certain of our other practices or actions. We consider that the aggregate liability, to the extent that we are able to assess it, resulting from these other proceedings will not be material to our consolidated financial position or results of operations.
170 Royal Bank of Canada: Annual Report 2013 Consolidated Financial Statements
Table of Contents
Note 27 Contractual repricing and maturity schedule
|
The following table details our exposure to interest rate risk. The carrying amounts of financial assets and financial liabilities are reported below based on the earlier of their contractual repricing date or maturity date.
The following table does not incorporate management’s expectation of future events where expected repricing or maturity dates differ significantly from the contractual dates. We incorporate these assumptions in the management of interest rate risk exposure. These assumptions include expected repricing of trading instruments and certain loans and deposits. Taking into account these assumptions on the consolidated contractual repricing and maturity schedule at October 31, 2013, would result in a change in the under-one-year gap from $15.5 billion to $72 billion.
| As at October 31, 2013 | ||||||||||||||||||||||||||||||||
| (Millions of Canadian dollars) | Immediately interest rate-sensitive | Under 3 months | 3 to 6 months | 6 to 12 months | 1 to 5 years | Over 5 years | Non-rate- sensitive | Total | ||||||||||||||||||||||||
Assets | ||||||||||||||||||||||||||||||||
Cash and deposits with banks | $ | 14,048 | $ | 4,239 | $ | – | $ | – | $ | – | $ | – | $ | 6,644 | $ | 24,931 | ||||||||||||||||
Securities | ||||||||||||||||||||||||||||||||
Trading | 6,122 | 20,729 | 8,745 | 10,697 | 26,190 | 26,328 | 45,212 | 144,023 | ||||||||||||||||||||||||
Available-for-sale | – | 23,514 | 1,234 | 1,298 | 6,338 | 4,470 | 1,841 | 38,695 | ||||||||||||||||||||||||
Assets purchased under reverse repurchase agreements and securities borrowed | 1,178 | 96,639 | 13,476 | 2,929 | 369 | – | 2,926 | 117,517 | ||||||||||||||||||||||||
Loans (net of allowance for loan losses) | 172,898 | 42,149 | 11,131 | 22,423 | 145,449 | 9,902 | 4,714 | 408,666 | ||||||||||||||||||||||||
Derivatives | 74,822 | – | – | – | – | – | – | 74,822 | ||||||||||||||||||||||||
Investments for account of segregated fund holders | – | – | – | – | – | – | 513 | 513 | ||||||||||||||||||||||||
Other assets | 7,051 | 1,585 | – | – | – | 132 | 42,884 | 51,652 | ||||||||||||||||||||||||
| $ | 276,119 | $ | 188,855 | $ | 34,586 | $ | 37,347 | $ | 178,346 | $ | 40,832 | $ | 104,734 | $ | 860,819 | |||||||||||||||||
Liabilities | ||||||||||||||||||||||||||||||||
Deposits | $ | 223,411 | $ | 94,253 | $ | 20,729 | $ | 33,169 | $ | 93,931 | $ | 19,243 | $ | 73,744 | $ | 558,480 | ||||||||||||||||
Obligations related to assets sold under repurchase agreements and securities loaned | 700 | 56,878 | 1,308 | 1,167 | – | – | 363 | 60,416 | ||||||||||||||||||||||||
Obligations related to securities sold short | – | 759 | 1,117 | 1,219 | 10,403 | 12,671 | 20,959 | 47,128 | ||||||||||||||||||||||||
Derivatives | 76,745 | – | – | – | – | – | – | 76,745 | ||||||||||||||||||||||||
Insurance and investment contracts for account of segregated fund holders | – | – | – | – | – | – | 513 | 513 | ||||||||||||||||||||||||
Other liabilities | 2,652 | 465 | 100 | 145 | 1,229 | 6,470 | 47,798 | 58,859 | ||||||||||||||||||||||||
Subordinated debentures | – | 1,410 | – | 603 | 3,156 | 2,274 | – | 7,443 | ||||||||||||||||||||||||
Trust capital securities | – | 900 | – | – | – | – | – | 900 | ||||||||||||||||||||||||
Non-controlling interests | – | – | – | – | 1,731 | – | 64 | 1,795 | ||||||||||||||||||||||||
Shareholders’ equity | – | 200 | 2,350 | 1,125 | 926 | – | 43,939 | 48,540 | ||||||||||||||||||||||||
| $ | 303,508 | $ | 154,865 | $ | 25,604 | $ | 37,428 | $ | 111,376 | $ | 40,658 | $ | 187,380 | $ | 860,819 | |||||||||||||||||
Total gap | $ | (27,389 | ) | $ | 33,990 | $ | 8,982 | $ | (81 | ) | $ | 66,970 | $ | 174 | $ | (82,646 | ) | $ | – | |||||||||||||
Canadian dollar | $ | (11,033 | ) | $ | (8,390 | ) | $ | (2,235 | ) | $ | (1,054 | ) | $ | 85,687 | $ | (1,552 | ) | $ | (61,375 | ) | $ | 48 | ||||||||||
Foreign currency | (16,356 | ) | 42,380 | 11,217 | 973 | (18,717 | ) | 1,726 | (21,271 | ) | (48 | ) | ||||||||||||||||||||
Total gap | $ | (27,389 | ) | $ | 33,990 | $ | 8,982 | $ | (81 | ) | $ | 66,970 | $ | 174 | $ | (82,646 | ) | $ | – | |||||||||||||
Consolidated Financial Statements Royal Bank of Canada: Annual Report 2013 171
Table of Contents
Note 28 Related party transactions
|
Related parties
Related parties include associated companies, post-employment benefit plans for the benefit of our employees, key management personnel, the Board of Directors (Directors), close family members of key management personnel and Directors, and entities which are, directly or indirectly, controlled by, jointly controlled by or significantly influenced by key management personnel, Directors or their close family members.
Key management personnel and Directors
Key management personnel are defined as those persons having authority and responsibility for planning, directing and controlling our activities, directly or indirectly. They include the senior members of our organization called the Group Executive. The Group Executive is comprised of the Chief Executive Officer and individuals that report directly to him, including the Chief Administrative Officer and Chief Financial Officer, Chief Human Resource Officer, Chief Risk Officer, and heads of our business units. The Directors do not plan, direct, or control the activities of the entity; they oversee the management of the business and provide stewardship.
Compensation of key management personnel and Directors
The following tables present the compensation paid, shareholdings and options held by key management personnel and Directors.
| For the year ended | ||||||||||||
| (Millions of Canadian dollars) | October 31 2013 | October 31 2012 | October 31 2011 | |||||||||
Salaries and other short-term employee benefits (1) | $ | 23 | $ | 21 | $ | 23 | ||||||
Post-employment benefits | 3 | 2 | 2 | |||||||||
Share-based payments | 30 | 25 | 24 | |||||||||
| $ | 56 | $ | 48 | $ | 49 | |||||||
| (1) | Includes the portion of the annual variable short-term incentive bonus that certain executives elected to receive in the form of DSUs. Refer to Note 22 for further details. |
Shareholdings and options held by key management personnel, Directors and their close family members
| As at | ||||||||||||||||
| October 31, 2013 | October 31, 2012 | |||||||||||||||
| (Millions of Canadian dollars, except number of shares) | No. of units held | Value | No. of units held | Value | ||||||||||||
Stock options | 4,566,316 | $ | 84 | 5,402,931 | $ | 40 | ||||||||||
Other non-option stock based awards (1) | 2,467,532 | 173 | 2,516,276 | 143 | ||||||||||||
RBC common shares | 1,485,843 | 104 | 1,593,328 | 91 | ||||||||||||
| 8,519,691 | $ | 361 | 9,512,535 | $ | 274 | |||||||||||
| (1) | 2012 number of units held has been revised from those previously presented. |
Transactions, arrangements and agreements involving key management personnel, Directors and their close family members
In the normal course of business, we provide certain banking services to key management personnel, Directors, and their close family members. These transactions were made on substantially the same terms, including interest rates and security, as for comparable transactions with persons of a similar standing and did not involve more than the normal risk of repayment or present other unfavourable features.
As at October 31, 2013, total loans to key management personnel, Directors and their close family members are $6 million (October 31, 2012 – $6 million). No guarantees, pledges or commitments have been given to key management personnel, Directors or their close family members.
Subsidiaries, associates and joint ventures
In the normal course of business, we provide certain banking and financial services to subsidiaries, associates and joint ventures, including loans, interest and non-interest bearing deposits. These transactions meet the definition of related party transactions and were made on substantially the same terms as for comparable transactions with third-party counterparties.
As at October 31, 2013, loans and deposits from joint ventures and associates were $48 million and $12 million, respectively (October 31, 2012 – $48 million and $12 million, respectively).
Other transactions, arrangements or agreements involving joint ventures or associates
| As at or for the year ended | ||||||||||||
| (Millions of Canadian dollars) | October 31 2013 | October 31 2012 (1) | October 31 2011 (1) | |||||||||
Guarantees provided | $ | – | $ | – | $ | 483 | ||||||
Commitments and other contingencies | 240 | 349 | 294 | |||||||||
Other fees received for services rendered | 47 | 84 | 93 | |||||||||
Other fees paid for services received | 191 | 245 | 266 | |||||||||
| (1) | Amounts have been revised from those previously presented. |
Restricted net assets
Certain of our subsidiaries and joint ventures are subject to regulatory requirements of the jurisdictions in which they operate. When these subsidiaries and joint ventures are subject to such requirements, they may be restricted from transferring to us, our share of their assets in the form of cash dividends, loans or advances. At October 31, 2013, restricted net assets of these subsidiaries and joint ventures were $16.2 billion (October 31, 2012 – $13.6 billion).
172 Royal Bank of Canada: Annual Report 2013 Consolidated Financial Statements
Table of Contents
Note 29 Results by business segment
|
Composition of business segments
For management purposes, based on the products and services offered, we are organized into five business segments: Personal & Commercial Banking, Wealth Management, Insurance, Investor & Treasury Services and Capital Markets.
Personal & Commercial Banking comprises our personal and business banking operations as well as certain retail investment businesses and is operated through four business lines: Personal Financial Services, Business Financial Services and Cards and Payment Solutions (Canadian Banking), and Caribbean & U.S. Banking. In Canada we provide a broad suite of financial products and services to our individual and business clients through our extensive branch, automated teller machines, online and telephone banking networks, as well as through a large number of proprietary sales professionals. In the Caribbean we offer a broad range of financial products and services to individuals, business clients and public institutions in their respective markets. In the United States, we serve the cross-border banking needs of Canadian clients within the United States, as well as the banking needs of our U.S. wealth management clients.
Wealth Management comprises Canadian Wealth Management, U.S. & International Wealth Management and Global Asset Management. We serve affluent, high net worth and ultra-high net worth clients in Canada, the United States, the United Kingdom, Europe, Asia, and emerging markets with a comprehensive suite of investment, trust, banking, credit and other wealth management solutions. We also provide asset management products and services directly to institutional and individual clients as well as through RBC distribution channels and third-party distributors.
Insurance comprises our insurance operations in Canada and globally and operates under two business lines: Canadian Insurance and International Insurance. In Canada, we offer our products and services through our proprietary distribution channels, comprised of the field sales force which includes retail insurance branches, our field sales representatives, call centers and online network, as well as through independent insurance advisors and affinity relationships. Outside North America, we operate in reinsurance markets globally.
Investor & Treasury Services offers global custody, fund and pension administration, as well as an integrated suite of products to institutional investors worldwide. We also provide cash management, correspondent banking and trade finance services to financial institutions globally and funding and liquidity management for RBC as well as other select institutions.
Capital Markets comprises a majority of our global wholesale banking businesses providing public and private companies, institutional investors, governments and central banks with a wide range of products and services across our two main business lines, Global Markets and Corporate and Investment Banking. In North America, we offer a full suite of products and services which include corporate and investment banking, equity and debt origination and distribution, and structuring and trading. Outside North America, we have a select presence in the U.K., Europe, and Asia Pacific, where we offer a diversified set of capabilities in our key sectors of expertise such as energy, mining and infrastructure.
All other enterprise level activities that are not allocated to these five business segments, such as enterprise funding, securitizations, net charges associated with unattributed capital, and consolidation adjustments, including the elimination of the Taxable equivalent basis (Teb) gross-up amounts, are included in Corporate Support. Teb adjustments gross up Net interest income from certain tax-advantaged sources (Canadian taxable corporate dividends) to their effective tax equivalent value with the corresponding offset recorded in the provision for income taxes. Management believes that these adjustments are necessary for Capital Markets to reflect how it is managed. The use of the Teb adjustments enhances the comparability of revenue across our taxable and tax-advantaged sources. Our use of Teb adjustments may not be comparable to similarly adjusted amounts at other financial institutions. The Teb adjustment for the year ended October 31, 2013 was $380 million (October 31, 2012 – $431 million, October 31, 2011 – $459 million).
Geographic segments
For geographic reporting, our segments are grouped into Canada, United States and Other International. Transactions are primarily recorded in the location that best reflects the risk due to negative changes in economic conditions and prospects for growth due to positive economic changes. This location frequently corresponds with the location of the legal entity through which the business is conducted and the location of our clients. Transactions are recorded in the local currency and are subject to foreign exchange rate fluctuations with respect to the movement in the Canadian dollar.
Management reporting framework
Our management reporting framework is intended to measure the performance of each business segment as if it were a stand–alone business and reflects the way our business segments are managed. This approach is intended to ensure that our business segments’ results reflect all relevant revenue and expenses associated with the conduct of their businesses. Management regularly monitors these segments’ results for the purpose of making decisions about resource allocation and performance assessment. These items do not impact our consolidated results.
The expenses in each business segment may include costs or services directly incurred or provided on their behalf at the enterprise level. For other costs not directly attributable to one of our business segments, we use a management reporting framework that uses assumptions, estimates and methodologies for allocating overhead costs and indirect expenses to our business segments and that assists in the attribution of capital and the transfer pricing of funds to our business segments in a manner that fairly and consistently measures and aligns the economic costs with the underlying benefits and risks of that specific business segment. Activities and business conducted between our business segments are generally at market rates. All other enterprise level activities that are not allocated to our five business segments are reported under Corporate Support.
Consolidated Financial Statements Royal Bank of Canada: Annual Report 2013 173
Table of Contents
Note 29 Results by business segment(continued)
|
Our assumptions and methodologies used in our management reporting framework are periodically reviewed by management to ensure that they remain valid. The capital attribution methodologies involve a number of assumptions and estimates that are revised periodically.
| For the year ended October 31, 2013 | ||||||||||||||||||||||||||||||||||||||||
| (Millions of Canadian dollars) | Personal & Commercial Banking | Wealth Management | Insurance | Investor & Treasury Services (4) | Capital Markets (3) | Corporate Support (3) | Total | Canada | United States | Other International | ||||||||||||||||||||||||||||||
Net interest income (1), (2) | $ | 9,435 | $ | 396 | $ | – | $ | 671 | $ | 2,872 | $ | (123 | ) | $ | 13,251 | $ | 10,960 | $ | 1,602 | $ | 689 | |||||||||||||||||||
Non-interest income | 3,788 | 5,091 | 3,928 | 1,133 | 3,708 | (32 | ) | 17,616 | 8,855 | 3,834 | 4,927 | |||||||||||||||||||||||||||||
Total revenue | 13,223 | 5,487 | 3,928 | 1,804 | 6,580 | (155 | ) | 30,867 | 19,815 | 5,436 | 5,616 | |||||||||||||||||||||||||||||
Provision for credit losses | 997 | 51 | – | – | 188 | 3 | 1,239 | 898 | 77 | 264 | ||||||||||||||||||||||||||||||
Insurance policyholder benefits, claims and acquisition expense | – | – | 2,784 | – | – | – | 2,784 | 1,425 | 10 | 1,349 | ||||||||||||||||||||||||||||||
Non-interest expense | 6,240 | 4,201 | 549 | 1,343 | 3,844 | 50 | 16,227 | 9,345 | 3,677 | 3,205 | ||||||||||||||||||||||||||||||
Net income (loss) before income taxes | 5,986 | 1,235 | 595 | 461 | 2,548 | (208 | ) | 10,617 | 8,147 | 1,672 | 798 | |||||||||||||||||||||||||||||
Income taxes (recoveries) | 1,548 | 336 | (2 | ) | 118 | 838 | (650 | ) | 2,188 | 1,754 | 402 | 32 | ||||||||||||||||||||||||||||
Net income from continuing operations | 4,438 | 899 | 597 | 343 | 1,710 | 442 | 8,429 | 6,393 | 1,270 | 766 | ||||||||||||||||||||||||||||||
Net income from discontinued operations | – | – | – | – | – | – | – | – | – | – | ||||||||||||||||||||||||||||||
Net income | $ | 4,438 | $ | 899 | $ | 597 | $ | 343 | $ | 1,710 | $ | 442 | $ | 8,429 | $ | 6,393 | $ | 1,270 | $ | 766 | ||||||||||||||||||||
Non-interest expense includes: | ||||||||||||||||||||||||||||||||||||||||
Depreciation and amortization | $ | 300 | $ | 135 | $ | 13 | $ | 56 | $ | 24 | $ | 502 | $ | 1,030 | $ | 857 | $ | 36 | $ | 137 | ||||||||||||||||||||
Impairment of goodwill and other intangibles | 1 | – | – | 5 | – | 4 | 10 | 10 | – | – | ||||||||||||||||||||||||||||||
Restructuring provisions | 21 | – | – | 44 | – | – | 65 | 9 | – | 56 | ||||||||||||||||||||||||||||||
Total assets from continuing operations | $ | 364,300 | $ | 23,400 | $ | 12,300 | $ | 90,600 | $ | 358,100 | $ | 12,100 | $ | 860,800 | $ | 495,200 | $ | 181,800 | $ | 183,800 | ||||||||||||||||||||
Total assets from operations that are now discontinued | – | – | – | – | – | |||||||||||||||||||||||||||||||||||
Total assets | $ | 860,800 | $ | 495,200 | $ | 181,800 | $ | 183,800 | ||||||||||||||||||||||||||||||||
Total assets include: | ||||||||||||||||||||||||||||||||||||||||
Additions to property, plant, equipment and intangibles | $ | 498 | $ | 90 | $ | 13 | $ | 35 | $ | 107 | $ | 517 | $ | 1,260 | $ | 996 | $ | 132 | $ | 132 | ||||||||||||||||||||
Total liabilities from continuing operations | $ | 363,300 | $ | 23,300 | $ | 12,300 | $ | 90,800 | $ | 357,900 | $ | (37,100 | ) | $ | 810,500 | $ | 444,800 | $ | 181,900 | $ | 183,800 | |||||||||||||||||||
Total liabilities from operations that are now discontinued | – | – | – | – | ||||||||||||||||||||||||||||||||||||
Total liabilities | $ | 810,500 | $ | 444,800 | $ | 181,900 | $ | 183,800 | ||||||||||||||||||||||||||||||||
174 Royal Bank of Canada: Annual Report 2013 Consolidated Financial Statements
Table of Contents
| For the year ended October 31, 2012 | ||||||||||||||||||||||||||||||||||||||||
| (Millions of Canadian dollars) | Personal & Commercial Banking | Wealth Management | Insurance | Investor & Treasury Services | Capital Markets (3) | Corporate Support (3) | Total | Canada | United States | Other International | ||||||||||||||||||||||||||||||
Net interest income (1), (2) | $ | 9,061 | $ | 393 | $ | – | $ | 668 | $ | 2,559 | $ | (183 | ) | $ | 12,498 | $ | 10,413 | $ | 1,308 | $ | 777 | |||||||||||||||||||
Non-interest income | 3,582 | 4,442 | 4,897 | 657 | 3,629 | 67 | 17,274 | 9,378 | 3,564 | 4,332 | ||||||||||||||||||||||||||||||
Total revenue | 12,643 | 4,835 | 4,897 | 1,325 | 6,188 | (116 | ) | 29,772 | 19,791 | 4,872 | 5,109 | |||||||||||||||||||||||||||||
Provision for credit losses | 1,167 | (1 | ) | – | – | 135 | – | 1,301 | 1,021 | 90 | 190 | |||||||||||||||||||||||||||||
Insurance policyholder benefits, claims and acquisition expense | – | – | 3,621 | – | – | – | 3,621 | 2,320 | 16 | 1,285 | ||||||||||||||||||||||||||||||
Non-interest expense | 5,932 | 3,796 | 515 | 1,134 | 3,746 | 37 | 15,160 | 8,809 | 3,404 | 2,947 | ||||||||||||||||||||||||||||||
Net income (loss) before income taxes | 5,544 | 1,040 | 761 | 191 | 2,307 | (153 | ) | 9,690 | 7,641 | 1,362 | 687 | |||||||||||||||||||||||||||||
Income taxes (recoveries) | 1,456 | 277 | 47 | 106 | 726 | (512 | ) | 2,100 | 1,600 | 519 | (19 | ) | ||||||||||||||||||||||||||||
Net income from continuing operations | 4,088 | 763 | 714 | 85 | 1,581 | 359 | 7,590 | 6,041 | 843 | 706 | ||||||||||||||||||||||||||||||
Net income from discontinued operations | – | – | – | – | – | – | (51 | ) | – | (51 | ) | – | ||||||||||||||||||||||||||||
Net income | $ | 4,088 | $ | 763 | $ | 714 | $ | 85 | $ | 1,581 | $ | 359 | $ | 7,539 | $ | 6,041 | $ | 792 | $ | 706 | ||||||||||||||||||||
Non-interest expense includes: | ||||||||||||||||||||||||||||||||||||||||
Depreciation and amortization | $ | 273 | $ | 136 | $ | 14 | $ | 54 | $ | 27 | $ | 452 | $ | 956 | $ | 782 | $ | 38 | $ | 136 | ||||||||||||||||||||
Impairment of goodwill and other intangibles | – | – | – | 168 | – | – | 168 | 100 | – | 68 | ||||||||||||||||||||||||||||||
Restructuring provisions | – | – | – | – | – | – | – | – | – | – | ||||||||||||||||||||||||||||||
Total assets from continuing operations | $ | 343,100 | $ | 22,000 | $ | 12,300 | $ | 77,300 | $ | 355,200 | $ | 15,200 | $ | 825,100 | $ | 459,700 | $ | 173,200 | $ | 192,200 | ||||||||||||||||||||
Total assets from operations that are now discontinued | – | – | – | – | – | |||||||||||||||||||||||||||||||||||
Total assets | $ | 825,100 | $ | 459,700 | $ | 173,200 | $ | 192,200 | ||||||||||||||||||||||||||||||||
Total assets include: | ||||||||||||||||||||||||||||||||||||||||
Additions to property, plant, equipment and intangibles | $ | 256 | $ | 133 | $ | 11 | $ | 308 | $ | 128 | $ | 877 | $ | 1,713 | $ | 1,089 | $ | 145 | $ | 479 | ||||||||||||||||||||
Total liabilities from continuing operations | $ | 342,000 | $ | 22,000 | $ | 12,400 | $ | 77,300 | $ | 355,000 | $ | (29,600) | $ | 779,100 | $ | 413,700 | $ | 173,300 | $ | 192,100 | ||||||||||||||||||||
Total liabilities from operations that are now discontinued | – | – | – | – | ||||||||||||||||||||||||||||||||||||
Total liabilities | $ | 779,100 | $ | 413,700 | $ | 173,300 | $ | 192,100 | ||||||||||||||||||||||||||||||||
| For the year ended October 31, 2011 | ||||||||||||||||||||||||||||||||||||||||
| (Millions of Canadian dollars) | Personal & Commercial Banking | Wealth Management | Insurance | Investor & Treasury Services | Capital Markets (3) | Corporate Support (3) | Total | Canada | United States | Other International | ||||||||||||||||||||||||||||||
Net interest income (1), (2) | $ | 8,515 | $ | 365 | $ | – | $ | 573 | $ | 2,197 | $ | (293 | ) | $ | 11,357 | $ | 9,641 | $ | 1,091 | $ | 625 | |||||||||||||||||||
Non-interest income | 3,510 | 4,343 | 4,475 | 569 | 3,127 | 257 | 16,281 | 9,270 | 2,815 | 4,196 | ||||||||||||||||||||||||||||||
Total revenue | 12,025 | 4,708 | 4,475 | 1,142 | 5,324 | (36 | ) | 27,638 | 18,911 | 3,906 | 4,821 | |||||||||||||||||||||||||||||
Provision for credit losses | 1,142 | – | – | – | (14 | ) | 5 | 1,133 | 1,016 | (12 | ) | 129 | ||||||||||||||||||||||||||||
Insurance policyholder benefits, claims and acquisition expense | – | – | 3,358 | – | – | – | 3,358 | 2,124 | 21 | 1,213 | ||||||||||||||||||||||||||||||
Non-interest expense | 5,682 | 3,586 | 498 | 821 | 3,487 | 93 | 14,167 | 8,376 | 3,159 | 2,632 | ||||||||||||||||||||||||||||||
Net income (loss) before income taxes | 5,201 | 1,122 | 619 | 321 | 1,851 | (134 | ) | 8,980 | 7,395 | 738 | 847 | |||||||||||||||||||||||||||||
Income taxes (recoveries) | 1,461 | 311 | 19 | 91 | 559 | (431 | ) | 2,010 | 1,728 | 259 | 23 | |||||||||||||||||||||||||||||
Net income from continuing operations | 3,740 | 811 | 600 | 230 | 1,292 | 297 | 6,970 | 5,667 | 479 | 824 | ||||||||||||||||||||||||||||||
Net income from discontinued operations | – | – | – | – | – | – | (526 | ) | – | (526 | ) | – | ||||||||||||||||||||||||||||
Net income | $ | 3,740 | $ | 811 | $ | 600 | $ | 230 | $ | 1,292 | $ | 297 | $ | 6,444 | $ | 5,667 | $ | (47 | ) | $ | 824 | |||||||||||||||||||
Non-interest expense includes: | ||||||||||||||||||||||||||||||||||||||||
Depreciation and amortization | $ | 260 | $ | 138 | $ | 20 | $ | 48 | $ | 24 | $ | 378 | $ | 868 | $ | 705 | $ | 37 | $ | 126 | ||||||||||||||||||||
Impairment of goodwill and other intangibles | – | – | – | – | – | – | – | – | – | – | ||||||||||||||||||||||||||||||
Restructuring provisions | – | – | – | – | – | – | – | – | – | – | ||||||||||||||||||||||||||||||
Total assets from continuing operations | $ | 321,100 | $ | 23,700 | $ | 11,100 | $ | 75,200 | $ | 320,900 | $ | 14,600 | $ | 766,600 | $ | 452,200 | $ | 134,400 | $ | 180,000 | ||||||||||||||||||||
Total assets from operations that are now discontinued | – | 27,200 | – | 27,200 | – | |||||||||||||||||||||||||||||||||||
Total assets | $ | 793,800 | $ | 452,200 | $ | 161,600 | $ | 180,000 | ||||||||||||||||||||||||||||||||
Total assets include: | ||||||||||||||||||||||||||||||||||||||||
Additions to property, plant, equipment and intangibles | $ | 325 | $ | 347 | $ | 9 | $ | 26 | $ | 133 | $ | 963 | $ | 1,803 | $ | 1,152 | $ | 164 | $ | 487 | ||||||||||||||||||||
Total liabilities from continuing operations | $ | 319,800 | $ | 23,800 | $ | 11,100 | $ | 75,200 | $ | 321,300 | $ | (18,900 | ) | $ | 732,300 | $ | 409,200 | $ | 142,900 | $ | 180,200 | |||||||||||||||||||
Total liabilities from operations that are now discontinued | 20,100 | – | 20,100 | – | ||||||||||||||||||||||||||||||||||||
Total liabilities | $ | 752,400 | $ | 409,200 | $ | 163,000 | $ | 180,200 | ||||||||||||||||||||||||||||||||
| (1) | Inter-segment revenue and share of profits in associates are not material. |
| (2) | Interest revenue is reported net of interest expense as management relies primarily on net interest income as a performance measure. |
| (3) | Taxable equivalent basis (Teb). |
| (4) | During the second quarter of 2013, Investor Services incurred a restructuring provision of $44 million. The majority of the provision was incurred for severance related to our European operations. |
Consolidated Financial Statements Royal Bank of Canada: Annual Report 2013 175
Table of Contents
Note 29 Results by business segment(continued)
|
| Revenue by business line | ||||||||||||
| For the year ended | ||||||||||||
| (Millions of Canadian dollars) | October 31 2013 | October 31 2012 | October 31 2011 | |||||||||
Personal Financial Services | $ | 6,948 | $ | 6,591 | $ | 6,192 | ||||||
Business Financial Services | 2,990 | 2,894 | 2,750 | |||||||||
Cards and Payment Solutions | 2,484 | 2,330 | 2,257 | |||||||||
Caribbean & U.S. Banking | 801 | 828 | 826 | |||||||||
Canadian Wealth Management | 1,889 | 1,741 | 1,724 | |||||||||
U.S. & International Wealth Management | 2,225 | 1,977 | 1,948 | |||||||||
Global Asset Management | 1,373 | 1,117 | 1,036 | |||||||||
Insurance | 3,928 | 4,897 | 4,475 | |||||||||
Investor & Treasury services | 1,804 | 1,325 | 1,142 | |||||||||
Global Markets | 3,492 | 3,635 | 3,143 | |||||||||
Corporate and Investment Banking | 3,014 | 2,533 | 2,371 | |||||||||
Other Capital Markets | 74 | 20 | (190 | ) | ||||||||
Corporate Support | (155 | ) | (116 | ) | (36 | ) | ||||||
| $ | 30,867 | $ | 29,772 | $ | 27,638 | |||||||
Note 30 Nature and extent of risks arising from financial instruments
|
We are exposed to credit, market and liquidity and funding risks as a result of holding financial instruments. Our risk measurement and objectives, policies and methodologies for managing these risks are disclosed in the shaded text along with those tables specifically marked with an asterisk (*) on pages 49 to 74 of the Management Discussion and Analysis. These shaded text and tables are an integral part of these Consolidated Financial Statements.
Concentrations of credit risk exist if a number of our clients are engaged in similar activities, are located in the same geographic region or have comparable economic characteristics such that their ability to meet contractual obligations would be similarly affected by changes in economic, political or other conditions.
Concentrations of credit risk indicate the relative sensitivity of our performance to developments affecting a particular industry or geographic location. The amounts of credit exposure associated with our on- and off-balance sheet financial instruments are summarized in the following table.
| As at October 31, 2013 | ||||||||||||||||||||||||||||||||||||
| (Millions of Canadian dollars, except percentage amounts) | Canada | % | United States | % | Europe | % | Other International | % | Total | |||||||||||||||||||||||||||
On-balance sheet assets other than derivatives (1) | $ | 401,022 | 74% | $ | 62,739 | 12% | $ | 42,935 | 8% | $ | 31,399 | 6% | $ | 538,095 | ||||||||||||||||||||||
Derivatives before master netting | 10,842 | 10 | 18,249 | 17 | 71,085 | 67 | 6,353 | 6 | 106,529 | |||||||||||||||||||||||||||
| $ | 411,864 | 64% | $ | 80,988 | 12% | $ | 114,020 | 18% | $ | 37,752 | 6% | $ | 644,624 | |||||||||||||||||||||||
Off-balance sheet credit instruments(4) | ||||||||||||||||||||||||||||||||||||
Committed and uncommitted (5) | $ | 213,602 | 64% | $ | 86,834 | 26% | $ | 24,020 | 7% | $ | 8,242 | 3% | $ | 332,698 | ||||||||||||||||||||||
Other | 43,173 | 55 | 20,840 | 27 | 11,361 | 14 | 3,188 | 4 | 78,562 | |||||||||||||||||||||||||||
| $ | 256,775 | 62% | $ | 107,674 | 26% | $ | 35,381 | 9% | $ | 11,430 | 3% | $ | 411,260 | |||||||||||||||||||||||
| As at October 31, 2012 (6) | ||||||||||||||||||||||||||||||||||||
| (Millions of Canadian dollars, except percentage amounts) | Canada | % | United States | % | Europe | % | Other International | % | Total | |||||||||||||||||||||||||||
On-balance sheet assets other than derivatives (1) | $ | 372,021 | 74% | $ | 63,474 | 13% | $ | 36,845 | 7% | $ | 29,543 | 6% | $ | 501,883 | ||||||||||||||||||||||
Derivatives before master netting | 14,549 | 12 | 20,617 | 17 | 79,810 | 66 | 6,761 | 5 | 121,737 | |||||||||||||||||||||||||||
| $ | 386,570 | 62% | $ | 84,091 | 13% | $ | 116,655 | 19% | $ | 36,304 | 6% | $ | 623,620 | |||||||||||||||||||||||
Off-balance sheet credit instruments (4) | ||||||||||||||||||||||||||||||||||||
Committed and uncommitted (5) | $ | 192,841 | 65% | $ | 76,269 | 26% | $ | 18,260 | 6% | $ | 9,379 | 3% | $ | 296,749 | ||||||||||||||||||||||
Other | 43,038 | 57 | 15,315 | 20 | 13,943 | 18 | 3,924 | 5 | 76,220 | |||||||||||||||||||||||||||
| $ | 235,879 | 63% | $ | 91,584 | 24% | $ | 32,203 | 9% | $ | 13,303 | 4% | $ | 372,969 | |||||||||||||||||||||||
| (1) | Includes assets purchased under reverse repurchase agreements and securities borrowed, loans and customers’ liability under acceptances. The largest concentrations in Canada are Ontario at 45% (October 31, 2012 – 45%), the Prairies at 21% (October 31, 2012 – 21%), British Columbia and the territories at 17% (October 31, 2012 – 17%) and Quebec at 12% (October 31, 2012 – 12%). No industry accounts for more than 31% (October 31, 2012 – 29%) of total on-balance sheet credit instruments. |
| (2) | The largest concentration of credit exposure by counterparty type is banks at 46% (October 31, 2012 – 49%). |
| (3) | Excludes credit derivatives classified as other than trading with a replacement cost of $nil (October 31, 2012 – $5 million). |
| (4) | Represents financial instruments with contractual amounts representing credit risk. |
| (5) | Retail and wholesale commitments comprise 39% (October 31, 2012 – 40%) and 61% (October 31, 2012 – 60%), respectively, of our total commitments. The largest sector concentrations in the wholesale portfolio relate to Energy at 18% (October 31, 2012 – 17%), Financing products at 16% (October 31, 2012 – 17%), Non-bank financial services at 10% (October 31, 2012 – 9%), Sovereign at 7% (October 31, 2012 – 9%), and Real estate and related at 9% (October 31, 2012 – 8%). |
| (6) | Certain amounts have been revised from results previously reported. |
176 Royal Bank of Canada: Annual Report 2013 Consolidated Financial Statements
Table of Contents
|
Regulatory capital and capital ratios
Effective the first quarter of 2013, we are required to calculate our capital ratios and Assets-to-capital multiple using the Basel III framework. Under Basel III, regulatory capital includes Common Equity Tier 1 (CET1), Tier 1 and Tier 2 capital. CET1 capital mainly consists of common shares, retained earnings and other components of equity. Regulatory adjustments under Basel III include full deductions of intangibles (excluding mortgage servicing rights), certain deferred tax assets, defined benefit pension fund assets and liabilities, and non-significant investments in banking, financial and insurance entities. Tier 1 capital comprises predominantly CET1, with additional items that consist of capital instruments such as certain preferred shares, and certain non-controlling interests in subsidiaries. Tier 2 capital includes subordinated debentures that meet certain criteria and certain loan loss allowances. Total Capital is the sum of CET1, additional Tier 1 capital and Tier 2 capital. Regulatory capital ratios are calculated by dividing CET1, Tier 1 and Total capital by risk-weighted assets.
OSFI formally establishes risk-based capital targets for deposit-taking institutions in Canada. These targets are currently a CET1 ratio of greater than or equal to 7%, a Tier 1 capital ratio of greater than or equal to 6% and a Total capital ratio of greater than or equal to 8%. In addition, Canadian banks are required to ensure that their Assets-to-capital multiple, which is calculated by dividing gross adjusted assets by Total capital, does not exceed a maximum level prescribed by OSFI. During 2013 and 2012, we have complied with all capital requirements imposed by OSFI.
| Basel III | Basel II | |||||||||
| As at | ||||||||||
| (Millions of Canadian dollars, except percentage and multiple amounts) | October 31 2013 | October 31 2012 | ||||||||
Capital | ||||||||||
Common equity Tier 1 capital | $ | 30,541 | $ | n.a. | ||||||
Tier 1 capital | 37,196 | 36,807 | ||||||||
Total capital | 44,716 | 42,347 | ||||||||
Risk-weighted assets | ||||||||||
Credit risk | $ | 232,641 | $ | 209,559 | ||||||
Market risk | 42,184 | 30,109 | ||||||||
Operational risk | 44,156 | 40,941 | ||||||||
Total risk-weighted assets | $ | 318,981 | $ | 280,609 | ||||||
Capital ratios and multiples | ||||||||||
Common Equity Tier 1 ratio | 9.6% | n.a. | ||||||||
Tier 1 capital ratio | 11.7% | 13.1% | ||||||||
Total capital ratio | 14.0% | 15.1% | ||||||||
Assets-to-capital multiple (1) | 16.6X | 16.7X | ||||||||
| (1) | Effective the first quarter of 2013, Assets-to-capital multiple is calculated on a transitional basis as per OSFI guidelines. The transitional methodology is defined as capital calculated according to the current year’s phase-in of regulatory adjustments and phase-out of non-qualifying capital instruments. |
| n.a. | not applicable |
Consolidated Financial Statements Royal Bank of Canada: Annual Report 2013 177
Table of Contents
Note 32 Recovery and settlement of on-balance sheet assets and liabilities
|
The table below presents an analysis of assets and liabilities recorded on our Consolidated Balance Sheets by amounts to be recovered or settled within one year and after one year, as at the balance sheet date, based on contractual maturities and certain other assumptions outlined in the footnotes below. As warranted, we manage the liquidity risk of various products based on historical behavioural patterns that are often not aligned with contractual maturities. Amounts to be recovered or settled within one year, as presented below, may not be reflective of management’s long-term view of the liquidity profile of certain balance sheet categories.
| As at | ||||||||||||||||||||||||||
| October 31, 2013 | October 31, 2012 | |||||||||||||||||||||||||
| (Millions of Canadian dollars) | Within one year | After one year | Total | Within one year | After one year | Total | ||||||||||||||||||||
Assets | ||||||||||||||||||||||||||
Cash and due from banks (1) | $ | 13,930 | $ | 1,940 | $ | 15,870 | $ | 11,020 | $ | 1,597 | $ | 12,617 | ||||||||||||||
Interest-bearing deposits with banks (1) | 9,061 | – | 9,061 | 10,255 | – | 10,255 | ||||||||||||||||||||
Securities | ||||||||||||||||||||||||||
Trading (2) | 135,484 | 8,539 | 144,023 | 112,406 | 8,377 | 120,783 | ||||||||||||||||||||
Available-for-sale | 11,388 | 27,307 | 38,695 | 15,305 | 25,523 | 40,828 | ||||||||||||||||||||
Assets purchased under reverse repurchase agreements and securities borrowed | 116,366 | 1,151 | 117,517 | 110,052 | 2,205 | 112,257 | ||||||||||||||||||||
Loans | ||||||||||||||||||||||||||
Retail | 43,932 | 277,746 | 321,678 | 47,193 | 253,992 | 301,185 | ||||||||||||||||||||
Wholesale | 39,202 | 49,745 | 88,947 | 30,555 | 48,501 | 79,056 | ||||||||||||||||||||
Allowance for loan losses | (1,959 | ) | (1,997 | ) | ||||||||||||||||||||||
Investments for account of segregated fund holders | – | 513 | 513 | – | 383 | 383 | ||||||||||||||||||||
Other | ||||||||||||||||||||||||||
Customers’ liability under acceptances | 5,626 | 4,327 | 9,953 | 5,198 | 4,187 | 9,385 | ||||||||||||||||||||
Derivatives (2) | 13,695 | 61,127 | 74,822 | 12,958 | 78,335 | 91,293 | ||||||||||||||||||||
Premises and equipment, net | 3 | 2,656 | 2,659 | – | 2,691 | 2,691 | ||||||||||||||||||||
Goodwill | – | 8,361 | 8,361 | – | 7,485 | 7,485 | ||||||||||||||||||||
Other intangibles | – | 2,796 | 2,796 | – | 2,686 | 2,686 | ||||||||||||||||||||
Assets of discontinued operations | – | – | – | – | – | – | ||||||||||||||||||||
Investments in associates | – | 112 | 112 | – | 125 | 125 | ||||||||||||||||||||
Prepaid pension benefit cost | – | 1,084 | 1,084 | – | 1,049 | 1,049 | ||||||||||||||||||||
Other assets | 23,266 | 3,421 | 26,687 | 32,010 | 3,009 | 35,019 | ||||||||||||||||||||
| $ | 411,953 | $ | 450,825 | $ | 860,819 | $ | 386,952 | $ | 440,145 | $ | 825,100 | |||||||||||||||
Liabilities | ||||||||||||||||||||||||||
Deposits (3) | $ | 393,256 | $ | 165,224 | $ | 558,480 | $ | 374,000 | $ | 134,219 | $ | 508,219 | ||||||||||||||
Insurance and investment contracts for account of segregated fund holders | – | 513 | 513 | – | 383 | 383 | ||||||||||||||||||||
Other | ||||||||||||||||||||||||||
Acceptances | 5,626 | 4,327 | 9,953 | 5,198 | 4,187 | 9,385 | ||||||||||||||||||||
Obligations related to securities sold short | 44,231 | 2,897 | 47,128 | 38,751 | 2,005 | 40,756 | ||||||||||||||||||||
Obligations related to assets sold under repurchase agreements and securities loaned | 58,916 | 1,500 | 60,416 | 64,032 | – | 64,032 | ||||||||||||||||||||
Derivatives (2) | 15,671 | 61,074 | 76,745 | 14,429 | 82,332 | 96,761 | ||||||||||||||||||||
Insurance claims and policy benefit liabilities | 338 | 7,696 | 8,034 | 232 | 7,689 | 7,921 | ||||||||||||||||||||
Liabilities of discontinued operations | – | – | – | – | – | – | ||||||||||||||||||||
Accrued pension and other post-employment benefit expense | – | 1,759 | 1,759 | – | 1,729 | 1,729 | ||||||||||||||||||||
Other liabilities | 32,594 | 6,519 | 39,113 | 33,994 | 7,377 | 41,371 | ||||||||||||||||||||
Subordinated debentures | – | 7,443 | 7,443 | 2,007 | 5,608 | 7,615 | ||||||||||||||||||||
Trust capital securities | 900 | – | 900 | – | 900 | 900 | ||||||||||||||||||||
| $ | 551,532 | $ | 258,952 | $ | 810,484 | $ | 532,643 | $ | 246,429 | $ | 779,072 | |||||||||||||||
| (1) | Cash and due from banks and Interest bearing deposits with banks are assumed to be recovered within one year, except for cash balances not available for use by the bank. |
| (2) | Trading securities classified as at FVTPL and trading derivatives not designated in hedging relationships are presented as within one year as this best represents in most instances the short-term nature of our trading activities. Non-trading derivatives designated in hedging relationships are presented according to the recovery or settlement of the related hedged item. |
| (3) | Demand deposits of $264 billion (October 31, 2012 – $237 billion) are presented as within one year due to their being repayable on demand or at short notice on a contractual basis. In practice, these deposits relate to a broad range of individuals and customer-types which form a stable base for our operations and liquidity needs. |
178 Royal Bank of Canada: Annual Report 2013 Consolidated Financial Statements
Table of Contents
Note 33 Parent company information
|
The following table presents information regarding the legal entity of Royal Bank of Canada with its subsidiaries presented on an equity accounted basis.
Condensed Balance Sheets
| As at | ||||||||
| (Millions of Canadian dollars) | October 31 2013 | October 31 2012 | ||||||
Assets | ||||||||
Cash and due from banks | $ | 3,561 | $ | 3,126 | ||||
Interest-bearing deposits with banks | 2,707 | 1,160 | ||||||
Securities | 100,574 | 83,704 | ||||||
Investments in bank subsidiaries and associated corporations | 24,327 | 24,668 | ||||||
Investments in other subsidiaries and associated corporations | 42,383 | 37,973 | ||||||
Assets purchased under reverse repurchase agreements | 14,578 | 10,909 | ||||||
Loans, net of allowances for loan losses | 384,906 | 356,079 | ||||||
Other assets | 105,750 | 129,879 | ||||||
| $ | 678,786 | $ | 647,498 | |||||
Liabilities and shareholders’ equity | ||||||||
Deposits | $ | 455,621 | $ 422,893 | |||||
Net balances due to bank subsidiaries | 4,892 | 2,719 | ||||||
Net balances due from other subsidiaries | 35,921 | 18,062 | ||||||
Other liabilities | 126,418 | 151,942 | ||||||
| 622,852 | 595,616 | |||||||
Subordinated debentures | 7,394 | 7,615 | ||||||
Shareholders’ equity | 48,540 | 44,267 | ||||||
| $ | 678,786 | $ | 647,498 | |||||
Condensed Statements of Income
| . | For the year ended | |||||||||||
| (Millions of Canadian dollars) | October 31 2013 | October 31 2012 | October 31 2011 | |||||||||
Interest income (1) | $ | 18,520 | $ | 18,788 | $ | 17,681 | ||||||
Interest expense | 5,742 | 6,860 | 7,357 | |||||||||
Net interest income | 12,778 | 11,928 | 10,324 | |||||||||
Non-interest income (2) | 4,625 | 1,733 | 3,685 | |||||||||
Total revenue | 17,403 | 13,661 | 14,009 | |||||||||
Provision for credit losses | 1,147 | 1,139 | 1,009 | |||||||||
Insurance policyholder benefits and acquisition expense | – | – | 2 | |||||||||
Non-interest expense | 7,205 | 6,904 | 6,760 | |||||||||
Income before income taxes | 9,051 | 5,618 | 6,238 | |||||||||
Income taxes | 1,563 | 1,440 | 1,394 | |||||||||
Net income before equity in undistributed income of subsidiaries | 7,488 | 4,178 | 4,844 | |||||||||
Equity in undistributed income of subsidiaries | 941 | 3,361 | 1,600 | |||||||||
Net income | $ | 8,429 | $ | 7,539 | $ | 6,444 | ||||||
| (1) | Includes dividend income from investments in subsidiaries and associated corporations of $1,313 million (2012 – $1,292 million; 2011 – $1,314 million). |
| (2) | Includes loss from associated corporations of $9 million (2012 – gain of $2 million; 2011 – loss of $6 million). |
Consolidated Financial Statements Royal Bank of Canada: Annual Report 2013 179
Table of Contents
Note 33 Parent company information(continued)
|
Condensed Statements of Cash Flows
| As at | ||||||||||||
| (Millions of Canadian dollars) | October 31 2013 | October 31 2012 | October 31 2011 | |||||||||
Cash flows from operating activities | ||||||||||||
Net income | $ | 8,429 | $ | 7,539 | $ | 6,444 | ||||||
Adjustments to determine net cash from operating activities: | ||||||||||||
Change in undistributed earnings of subsidiaries | (941 | ) | (3,361 | ) | (1,600 | ) | ||||||
Change in deposits | 31,183 | 9,772 | 28,762 | |||||||||
Change in loans, net of loan securitizations | (18,927 | ) | (29,324 | ) | (26,884 | ) | ||||||
Proceeds from loan securitizations | – | 20 | 207 | |||||||||
Change in trading securities | (19,048 | ) | 9,440 | (7,611 | ) | |||||||
Change in obligations related to assets sold under repurchase agreements and securities loaned | 1,730 | (229 | ) | (1,690 | ) | |||||||
Change in assets purchased under reverse repurchase agreements and securities borrowed | (3,668 | ) | (2,164 | ) | (2,378 | ) | ||||||
Change in obligations related to securities sold short | 388 | (2,713 | ) | 3,864 | ||||||||
Other operating activities, net | (8,282 | ) | (2,640 | ) | (9,046 | ) | ||||||
Net cash used in operating activities | (9,136 | ) | (13,660 | ) | (9,932 | ) | ||||||
Cash flows from investing activities | ||||||||||||
Change in interest-bearing deposits with banks | (1,548 | ) | 400 | (287 | ) | |||||||
Proceeds from sale of available-for-sale securities | 1,641 | 3,991 | 8,401 | |||||||||
Proceeds from maturity of available-for-sale securities | 28,056 | 28,994 | 22,898 | |||||||||
Purchases of available-for-sale securities | (26,392 | ) | (29,307 | ) | (18,054 | ) | ||||||
Net acquisitions of premises and equipment and other intangibles | (754 | ) | (867 | ) | (691 | ) | ||||||
Change in cash invested in subsidiaries | (7,323 | ) | 163 | (8,393 | ) | |||||||
Change in net funding provided to subsidiaries | 20,164 | 10,158 | 11,458 | |||||||||
Net cash from investing activities | 13,844 | 13,532 | 15,332 | |||||||||
Cash flows from financing activities | ||||||||||||
Issue of subordinated debentures | 2,046 | – | 1,500 | |||||||||
Repayment of subordinated debentures | (2,000 | ) | (1,006 | ) | (404 | ) | ||||||
Redemption of preferred shares for cancellation | (222 | ) | – | – | ||||||||
Issue of common shares | 121 | 126 | 152 | |||||||||
Redemption of common shares for cancellation | (408 | ) | – | – | ||||||||
Dividends paid | (3,810 | ) | (3,272 | ) | (3,032 | ) | ||||||
Net cash used in financing activities | (4,273 | ) | (4,152 | ) | (1,784 | ) | ||||||
Net change in cash and due from banks | 435 | (4,280 | ) | 3,616 | ||||||||
Cash and due from banks at beginning of year | 3,126 | 7,406 | 3,790 | |||||||||
Cash and due from banks at end of year | $ | 3,561 | $ | 3,126 | $ | 7,406 | ||||||
Supplemental disclosure of cash flow information | ||||||||||||
Amount of interest paid in year | $ | 5,943 | $ | 7,372 | $ | 6,752 | ||||||
Amount of interest received in year | 17,281 | 17,502 | 16,758 | |||||||||
Amount of dividends received in year | 1,313 | 1,302 | 1,277 | |||||||||
Amount of income taxes (recovered) paid in year | 265 | 1,951 | 1,012 | |||||||||
|
On November 4, 2013, we redeemed all $1 billion outstanding 5.45% subordinated debentures due on November 4, 2018 for 100% of their principal amount plus accrued interest to the redemption date.
On October 25, 2013, we announced our intention to redeem all issued and outstanding $900 million principal amount of RBC TruCS 2013 for cash at a redemption price of $1,000 per unit. The redemption is expected to be completed on December 31, 2013.
180 Royal Bank of Canada: Annual Report 2013 Consolidated Financial Statements
Table of Contents
Glossary
|
Acceptances
A bill of exchange or negotiable instrument drawn by the borrower for payment at maturity and accepted by a bank. The acceptance constitutes a guarantee of payment by the bank and can be traded in the money market. The bank earns a “stamping fee” for providing this guarantee.
Allowance for credit losses
The amount deemed adequate by management to absorb identified credit losses as well as losses that have been incurred but are not yet identifiable as at the balance sheet date. This allowance is established to cover the lending portfolio including loans, acceptances, guarantees, letters of credit, and unfunded commitments. The allowance is increased by the provision for credit losses, which is charged to income and decreased by the amount of write-offs, net of recoveries in the period.
Alt-A assets
A term used in the U.S. to describe assets (mainly mortgages) with a borrower risk profile between the prime and subprime categorizations. Categorization of assets as Alt-A (as opposed to prime) varies, such as limited verification or documentation of borrowers’ income or a limited credit history.
Asset-backed securities (ABS)
Securities created through the securitization of a pool of assets, for example auto loans or credit card loans.
Assets-to-capital multiple
Total assets plus specified off-balance sheet items, as defined by OSFI, divided by total regulatory capital.
Assets under administration (AUA)
Assets administered by us, which are beneficially owned by clients, as at October 31, unless otherwise noted. Services provided in respect of assets under administration are of an administrative nature, including safekeeping, collecting investment income, settling purchase and sale transactions, and record keeping.
Assets under management (AUM)
Assets managed by us, which are beneficially owned by clients, as at October 31, unless otherwise noted. Services provided in respect of assets under management include the selection of investments and the provision of investment advice. We have assets under management that are also administered by us and included in assets under administration.
Auction rate securities (ARS)
Securities issued through special purpose entities that hold long-term assets funded with long-term debt. In the U.S., these securities are issued by sponsors such as municipalities, student loan authorities or other sponsors through bank-managed auctions.
Bank-owned life insurance contracts (BOLI)
Our legacy portfolio includes BOLI where we provided banks with BOLI stable value agreements (“wraps”), which insure the life insurance policy’s cash surrender value from market fluctuations on the underlying investments, thereby allowing us to guarantee a minimum tax-exempt return to the counterparty. These wraps allow us to account for the underlying assets on an accrual basis instead of a mark-to-market basis.
Basis point (bp)
One one-hundredth of a percentage point (.01%).
Capital adequacy
The level of capital that is sufficient to underpin risk and accommodate potential unexpected increases in risk within specified regulatory targets while maintaining our business plans. This includes risks for which minimum regulatory capital requirements may not be specified.
Collateral
Assets pledged as security for a loan or other obligation. Collateral can take many forms, such as cash, highly rated securities, property, inventory, equipment and receivables.
Collateralized debt obligation (CDO)
Securities with multiple tranches that are issued by special purpose entities and collateralized by debt obligations including bonds and loans. Each tranche offers a varying degree of risk and return so as to meet investor demand.
Collateralized loan obligation (CLO)
Securities that are backed by a pool of commercial or personal loans, structured so that there are several classes of bonds with varying maturities, called tranches.
Commercial mortgage-backed securities (CMBS)
Securities created through the securitization of commercial mortgages.
Commitments to extend credit
Unutilized amount of credit facilities available to clients either in the form of loans, bankers’ acceptances and other on-balance sheet financing, or through off-balance sheet products such as guarantees and letters of credit.
Common Equity Tier 1 (CET1) capital
The sum of common shares issued that meet regulatory criteria, share premium from the issuances and other contributed surplus, retained earnings, accumulated other comprehensive income and other disclosed reserves, and common shares issued by consolidated subsidiaries held by third parties; less dividends removed from CET1 in accordance with applicable accounting standards.
Common Equity Tier 1 capital ratio
CET1 capital less regulatory adjustments or deductions divided by risk-weighted assets.
Covered bonds
Full recourse on-balance sheet obligations issued by banks and credit institutions that are also fully collateralized by assets over which investors enjoy a priority claim in the event of an issuer’s insolvency.
Credit default swaps (CDS)
A derivative contract that provides the purchaser with a one-time payment should the referenced entity/entities default (or a similar triggering event occur).
Derivative
A contract between two parties, which requires little or no initial investment and where payments between the parties are dependent upon the movements in price of an underlying instrument, index or financial rate. Examples of derivatives include swaps, options, forward rate agreements and futures. The notional amount of the derivative is the contract amount used as a reference point to calculate the payments to be exchanged between the two parties, and the notional amount itself is generally not exchanged by the parties.
Dividend payout ratio
Common dividends as a percentage of net income after preferred share dividends.
Earnings per share (EPS), basic
Calculated as net income less preferred share dividends divided by the average number of shares outstanding.
Earnings per share (EPS), diluted
Calculated as net income less preferred share dividends divided by the average number of shares outstanding adjusted for the dilutive effects of stock options and other convertible securities.
Economic capital
An estimate of the amount of equity capital required to underpin risks. It is calculated by estimating the level of capital that is necessary to support our various businesses, given their risks, consistent with our desired solvency standard and credit ratings. The identified risks for which we calculate Economic Capital are credit, market (trading and non-trading), operational, business, fixed asset, and insurance. Additionally, Economic Capital includes goodwill and intangibles, and allows for diversification benefits across risks and business segments.
Fair value
The amount of consideration that would be agreed upon in an arm’s length transaction between knowledgeable, willing parties who are under no compulsion to act.
Glossary Royal Bank of Canada: Annual Report 2013 183
Table of Contents
Gross-adjusted assets (GAA)
GAA are used in the calculation of the Assets-to-capital multiple. They represent our total assets including specified off-balance sheet items and net of prescribed deductions. Off balance sheet items for this calculation are direct credit substitutes, including letters of credit and guarantees, transaction-related contingencies, trade-related contingencies and sale and repurchase agreements.
Guarantees and standby letters of credit
These primarily represent irrevocable assurances that a bank will make payments in the event that its client cannot meet its financial obligations to third parties. Certain other guarantees, such as bid and performance bonds, represent non-financial undertakings.
Hedge
A risk management technique used to mitigate exposure from market, interest rate or foreign currency exchange risk arising from normal banking operations. The elimination or reduction of such exposure is accomplished by establishing offsetting positions. For example, assets denominated in foreign currencies can be offset with liabilities in the same currencies or through the use of foreign exchange hedging instruments such as futures, options or foreign exchange contracts.
Hedge funds
A type of investment fund, marketed to accredited high net worth investors, that is subject to limited regulation and restrictions on its investments compared to retail mutual funds, and that often utilize aggressive strategies such as selling short, leverage, program trading, swaps, arbitrage and derivatives.
Home equity products
This is comprised of residential mortgages and secured personal loans whereby the borrower pledges real estate as collateral.
International Financial Reporting Standards (IFRS)
IFRS are principles-based standards, interpretations and the framework adopted by the International Accounting Standards Board.
Impaired loans
Loans are classified as impaired when there has been a deterioration of credit quality to the extent that management no longer has reasonable assurance of timely collection of the full amount of principal and interest in accordance with the contractual terms of the loan agreement. Credit card balances are not classified as impaired as they are directly written off after payments are 180 days past due.
Innovative capital instruments
Innovative capital instruments are capital instruments issued by Special Purpose Entities (SPEs), whose primary purpose is to raise capital. We previously issued innovative capital instruments, RBC Trust Capital Securities (RBC TruCS) and RBC Trust Subordinated Notes (RBC TSNs), through three SPEs: RBC Capital Trust, RBC Capital Trust II and RBC Subordinated Notes Trust. As per OSFI Basel III guidelines, non-qualifying innovative capital instruments treated as additional Tier 1 capital are subject to phase out over a ten year period beginning on January 1, 2013.
Loan-to-value (LTV) ratio
Calculated based on the total facility amount for the residential mortgage and homeline product divided by the value of the related residential property.
Master netting agreement
An agreement between us and a counterparty designed to reduce the credit risk of multiple derivative transactions through the creation of a legal right of offset of exposure in the event of a default.
Net interest income
The difference between what is earned on assets such as loans and securities and what is paid on liabilities such as deposits and subordinated debentures.
Net interest margin (average assets)
Net interest income as a percentage of total average assets.
Normal course issuer bid (NCIB)
A program for the repurchase of our own shares for cancellation through a stock exchange that is subject to the various rules of the relevant stock exchange and securities commission.
Notional amount
The contract amount used as a reference point to calculate payments for derivatives.
Off-balance sheet financial instruments
A variety of arrangements offered to clients, which include credit derivatives, written put options, backstop liquidity facilities, stable value products, financial standby letters of credit, performance guarantees, credit enhancements, mortgage loans sold with recourse, commitments to extend credit, securities lending, documentary and commercial letters of credit, note issuances and revolving underwriting facilities, securities lending indemnifications and indemnifications.
Office of the Superintendent of Financial Institutions Canada (OSFI)
The primary regulator of federally chartered financial institutions and federally administered pension plans in Canada. OSFI’s mission is to safeguard policyholders, depositors and pension plan members from undue loss.
Operating leverage
The difference between our revenue growth rate and non-interest expense growth rate.
Options
A contract or a provision of a contract that gives one party (the option holder) the right, but not the obligation, to perform a specified transaction with another party (the option issuer or option writer) according to specified terms.
Primary dealer
A formal designation provided to a bank or securities broker-dealer permitted to trade directly with a country’s central bank. Primary dealers participate in open market operations, act as market-makers of government debt and provide market information and analysis to assist with monetary policy.
Provision for credit losses (PCL)
The amount charged to income necessary to bring the allowance for credit losses to a level determined appropriate by management. This includes both specific and general provisions.
Repurchase agreements
These involve the sale of securities for cash and the simultaneous repurchase of the securities for value at a later date. These transactions normally do not constitute economic sales and therefore are treated as collateralized financing transactions.
Residential mortgage-backed securities (RMBS)
Securities created through the securitization of residential mortgage loans.
Return on common equity (ROE)
Net income less preferred share dividends, expressed as a percentage of average common equity.
Reverse repurchase agreements
These involve the purchase of securities for cash and the simultaneous sale of the securities for value at a later date. These transactions normally do not constitute economic sales and therefore are treated as collateralized financing transactions.
Risk-weighted assets (RWA)
Assets adjusted by a regulatory risk-weight factor to reflect the riskiness of on and off-balance sheet exposures. Certain assets are not risk-weighted, but deducted from capital. The calculation is defined by guidelines issued by OSFI based on Basel III, effective the first quarter of 2013. For more details, refer to the Capital management section.
Securities lending
Transactions in which the owner of a security agrees to lend it under the terms of a prearranged contract to a borrower for a fee. The borrower must collateralize the security loan at all times. An intermediary such as a bank often acts as agent for the owner of the security. There are two types of securities lending arrangements: lending with and without credit or market risk indemnification. In securities lending without indemnification, the bank bears no risk of loss. For transactions in which the bank provides an indemnification, it bears the risk of loss if the borrower defaults and the value of the collateral declines concurrently.
Securities sold short
A transaction in which the seller sells securities and then borrows the securities in order to deliver them to the purchaser upon settlement. At a later date, the seller buys identical securities in the market to replace the borrowed securities.
Securitization
The process by which various financial assets are packaged into newly issued securities backed by these assets.
184 Royal Bank of Canada: Annual Report 2013 Glossary
Table of Contents
Special purpose entities (SPEs)
Special purpose entities, which may take the form of a corporation, trust, partnership or unincorporated entity, typically are created to accomplish a narrow and well-defined objective with legal arrangements that impose strict limits on the decision-making powers of their governing board, trustee or management over its operations. Frequently these provisions specify that the policy guiding the ongoing activities of the SPEs cannot be modified, other than perhaps by its creator or sponsor.
Standardized Approach
Risk weights prescribed by OSFI are used to calculate risk-weighted assets for the credit risk exposures. Credit assessments by OSFI-recognized external credit rating agencies of S&P, Moody’s, Fitch and DBRS are used to risk-weight our Sovereign and Bank exposures based on the standards and guidelines issued by OSFI. For our Business and Retail exposures, we use the standard risk weights prescribed by OSFI.
Structured investment vehicles
Managed investment vehicle that holds mainly highly rated asset-backed securities and funds itself using the short-term commercial paper market as well as the medium-term note (MTN) market.
Subprime loans
Subprime lending is the practice of making loans to borrowers who do not qualify for the best market interest rates because of their deficient credit history. Subprime lending carries more risk for lenders due to the combination of higher interest rates for the borrowers, poorer credit histories, and adverse financial situations usually associated with subprime applicants.
Taxable equivalent basis (teb)
Income from certain specified tax advantaged sources is increased to a level that would make it comparable to income from taxable sources. There is an offsetting adjustment in the tax provision, thereby generating the same after-tax net income.
Tier 1 capital
Tier 1 capital comprises predominantly CET1, with additional Tier 1 items such as preferred shares and non-controlling interests in subsidiaries Tier 1 instruments.
Tier 2 capital
Tier 2 capital consists mainly of subordinated debentures that meet certain criteria, certain loan loss allowances and non-controlling interests in subsidiaries’ Tier 2 instruments.
Total capital and total capital ratio
Total capital is defined as the total of Tier 1 and Tier 2 capital. The total capital ratio is calculated by dividing total capital by risk-weighted assets.
Tranche
A security class created whereby the risks and returns associated with a pool of assets are packaged into several classes of securities offering different risk and return profiles from those of the underlying asset pool. Tranches are typically rated by ratings agencies, and reflect both the credit quality of underlying collateral as well as the level of protection based on the tranches’ relative subordination.
Trust Capital Securities (RBC TruCS)
Transferable trust units issued by special purpose entities RBC Capital Trust or RBC Capital Trust II for the purpose of raising innovative Tier 1 capital.
Trust Subordinated Notes (RBC TSNs)
Transferable trust units issued by RBC Subordinated Notes Trust for the purpose of raising innovative Tier 2 capital.
Value-at-Risk (VaR)
A generally accepted risk-measurement concept that uses statistical models based on historical information to estimate within a given level of confidence the maximum loss in market value we would experience in our trading portfolio from an adverse one-day movement in market rates and prices.
Glossary Royal Bank of Canada: Annual Report 2013 185