Table of Contents
Exhibit 99.2

Royal Bank of Canada first quarter 2020 results
|
All amounts are in Canadian dollars and are based on financial statements prepared in compliance with International Accounting Standard 34Interim Financial Reporting, unless otherwise noted.
Net Income $3.5 Billion Record earnings | Diluted EPS(1) $2.40 Strong 12% growth YoY
| ROE(2) 17.6% Balanced capital deployment | CET1 Ratio 12.0% Robust capital levels |
TORONTO, February 21, 2020— Royal Bank of Canada (RY on TSX and NYSE) today reported net income of $3,509 million for the quarter ended January 31, 2020, up $337 million or 11% from the prior year, with strong diluted EPS growth of 12%. Results were driven by record earnings in Capital Markets, as well as by strong earnings growth in Personal & Commercial Banking reflecting continued robust volume growth in our Canadian Banking franchise. Solid earnings growth in Wealth Management and Insurance also contributed to the increase. These factors were partially offset by lower results in Investor & Treasury Services.
Compared to last quarter, net income was up $303 million with higher results in Capital Markets, Investor & Treasury Services, Personal & Commercial Banking, and Corporate Support. These factors were partially offset by lower earnings in Wealth Management and Insurance. Q4 2019 results included a gain on the sale of the private debt business of BlueBay ($134 million after-tax) in Wealth Management, which was largely offset by higher severance and related costs ($83 million after-tax) associated with the repositioning of our Investor & Treasury Services business, as well as by an unfavourable accounting adjustment ($41 million after-tax) in Corporate Support.
Results this quarter also reflect lower provisions for credit losses (PCL), with a total PCL on loans ratio of 26 basis points (bps). PCL on impaired loans ratio of 21 bps improved 6 bps from last quarter, due to lower provisions on impaired loans in Personal & Commercial Banking and Wealth Management. Our capital position remained robust, with a Common Equity Tier 1 (CET1) ratio of 12.0%. In addition, today we announced an increase to our quarterly dividend of $0.03 or 3% to $1.08 per share.
“We had a strong start to the year with earnings growth of 11% year-over-year. These results reflect the underlying strength of our diversified business mix, our focused strategy, and our colleagues’ unwavering commitment to creating more value for clients as we position the bank for the future. In addition to delivering record earnings this quarter, we are pleased to increase our quarterly dividend by three per cent. Against the uncertain macroeconomic backdrop, we remain focused on prudently managing our risks, leveraging our scale and competitive position, and balancing our investments in technology and talent for long-term, sustainable growth.”
– Dave McKay, RBC President and Chief Executive Officer
| ||
Q1 2020 Compared to Q1 2019
|
• Net income of $3,509 million • Diluted EPS(1) of $2.40 • ROE(2)of 17.6% • CET1 ratio of 12.0%
|
h 11% h 12% h 90 bps h 60 bps | ||||
Q1 2020 Compared to Q4 2019
| • Net income of $3,509 million • Diluted EPS(1) of $2.40 • ROE(2)of 17.6% • CET1 ratio of 12.0%
| h 9% h 10% h 140 bps ¯ 10 bps | ||||
| (1) | Earnings per share (EPS). |
| (2) | Return on Equity (ROE). This measure does not have a standardized meaning under GAAP. For further information, refer to the Key performance andnon-GAAP measures section of this Q1 2020Report to Shareholders. |
| 1 | First quarter highlights |
| 2 | Management’s Discussion and Analysis |
| 2 | Caution regarding forward-looking statements |
| 2 | Overview and outlook |
| 2 |
| 3 |
| 4 |
| 5 | Financial performance |
| 5 |
| 9 | Business segment results |
| 9 |
| 9 |
| 10 |
| 11 |
| 13 |
| 14 |
| 15 |
| 16 |
| 16 | Quarterly results and trend analysis |
| 18 | Financial condition |
| 18 |
| 18 |
| 19 | Risk management |
| 19 |
| 26 |
| 30 |
| 37 | Capital management |
| 42 |
| 42 |
| 42 |
| 42 |
| 42 |
| 43 |
| 44 | Interim Condensed Consolidated Financial Statements(unaudited) |
| 49 | Notes to the Interim Condensed Consolidated Financial Statements(unaudited) |
| 67 |
Table of Contents
2 Royal Bank of Canada First Quarter 2020
Management’s Discussion and Analysis
|
Management’s Discussion and Analysis (MD&A) is provided to enable a reader to assess our results of operations and financial condition for the three month period ended or as at January 31, 2020, compared to the corresponding period in the prior fiscal year and the three month period ended October 31, 2019. This MD&A should be read in conjunction with our unaudited Interim Condensed Consolidated Financial Statements for the quarter ended January 31, 2020 (Condensed Financial Statements) and related notes and our 2019 Annual Report. This MD&A is dated February 20, 2020. All amounts are in Canadian dollars, unless otherwise specified, and are based on financial statements prepared in accordance with International Financial Reporting Standards (IFRS) as issued by the International Accounting Standards Board (IASB), unless otherwise noted.
Additional information about us, including our 2019Annual Information Form, is available free of charge on our website at rbc.com/investorrelations, on the Canadian Securities Administrators’ website at sedar.com and on the EDGAR section of the United States (U.S.) Securities and Exchange Commission’s (SEC) website at sec.gov.
Information contained in or otherwise accessible through the websites mentioned herein does not form part of this report. All references in this report to websites are inactive textual references and are for your information only.
Caution regarding forward-looking statements
|
From time to time, we make written or oral forward-looking statements within the meaning of certain securities laws, including the “safe harbour” provisions of theUnited StatesPrivate Securities Litigation Reform Act of 1995 and any applicable Canadian securities legislation. We may make forward-looking statements in this Q1 2020 Report to Shareholders, in other filings with Canadian regulators or the SEC, in other reports to shareholders, and in other communications. Forward-looking statements in this document include, but are not limited to, statements relating to our financial performance objectives, vision and strategic goals, the Economic, market, and regulatory review and outlook for Canadian, U.S., European and global economies, the regulatory environment in which we operate, and the risk environment including our liquidity and funding risk, and includes our President and Chief Executive Officer’s statements. The forward-looking information contained in this document is presented for the purpose of assisting the holders of our securities and financial analysts in understanding our financial position and results of operations as at and for the periods ended on the dates presented, as well as our financial performance objectives, vision and strategic goals, and may not be appropriate for other purposes. Forward-looking statements are typically identified by words such as “believe”, “expect”, “foresee”, “forecast”, “anticipate”, “intend”, “estimate”, “goal”, “plan” and “project” and similar expressions of future or conditional verbs such as “will”, “may”, “should”, “could” or “would”.
By their very nature, forward-looking statements require us to make assumptions and are subject to inherent risks and uncertainties, which give rise to the possibility that our predictions, forecasts, projections, expectations or conclusions will not prove to be accurate, that our assumptions may not be correct and that our financial performance objectives, vision and strategic goals will not be achieved. We caution readers not to place undue reliance on these statements as a number of risk factors could cause our actual results to differ materially from the expectations expressed in such forward-looking statements. These factors – many of which are beyond our control and the effects of which can be difficult to predict – include: credit, market, liquidity and funding, insurance, operational, regulatory compliance, strategic, reputation, legal and regulatory environment, competitive and systemic risks and other risks discussed in the risk sections of our 2019 Annual Report and the Risk management section of this Q1 2020 Report to Shareholders; including information technology and cyber risk, privacy, data and third party related risks, geopolitical uncertainty, Canadian housing and household indebtedness, regulatory changes, digital disruption and innovation, climate change, the business and economic conditions in the geographic regions in which we operate, the effects of changes in government fiscal, monetary and other policies, tax risk and transparency, and environmental and social risk.
We caution that the foregoing list of risk factors is not exhaustive and other factors could also adversely affect our results. When relying on our forward-looking statements to make decisions with respect to us, investors and others should carefully consider the foregoing factors and other uncertainties and potential events. Material economic assumptions underlying the forward-looking statements contained in this Q1 2020 Report to Shareholders are set out in the Economic, market and regulatory review and outlook section and for each business segment under the Strategic priorities and Outlook headings in our 2019 Annual Report, as updated by the Economic, market and regulatory review and outlook section of this Q1 2020 Report to Shareholders. Except as required by law, we do not undertake to update any forward-looking statement, whether written or oral, that may be made from time to time by us or on our behalf.
Additional information about these and other factors can be found in the risk sections of our 2019 Annual Report and the Risk management section of this Q1 2020 Report to Shareholders.
|
|
Royal Bank of Canada is a global financial institution with a purpose-driven,principles-led approach to delivering leading performance. Our success comes from the 85,000+ employees who bring our vision, values and strategy to life so we can help our clients thrive and communities prosper. As Canada’s biggest bank, and one of the largest in the world based on market capitalization, we have a diversified business model with a focus on innovation and providing exceptional experiences to our 17 million clients in Canada, the U.S. and 34 other countries. Learn more at rbc.com.
Table of Contents
Royal Bank of Canada First Quarter 2020 3
Selected financial and other highlights
|
| As at or for the three months ended | For the three months ended | |||||||||||||||||||||
(Millions of Canadian dollars, except per share, number of and percentage amounts) (1) | January 31 2020 | October 31 2019 | January 31 2019 | Q1 2020 vs. Q4 2019 | Q1 2020 vs. Q1 2019 | |||||||||||||||||
Total revenue | $ | 12,836 | $ | 11,370 | $ | 11,589 | $ | 1,466 | $ | 1,247 | ||||||||||||
Provision for credit losses (PCL) | 419 | 499 | 514 | (80 | ) | (95 | ) | |||||||||||||||
Insurance policyholder benefits, claims and acquisition expense (PBCAE) | 1,614 | 654 | 1,225 | 960 | 389 | |||||||||||||||||
Non-interest expense | 6,378 | 6,319 | 5,912 | 59 | 466 | |||||||||||||||||
Income before income taxes | 4,425 | 3,898 | 3,938 | 527 | 487 | |||||||||||||||||
Net income | $ | 3,509 | $ | 3,206 | $ | 3,172 | $ | 303 | $ | 337 | ||||||||||||
Segments – net income | ||||||||||||||||||||||
Personal & Commercial Banking | $ | 1,686 | $ | 1,618 | $ | 1,571 | $ | 68 | $ | 115 | ||||||||||||
Wealth Management | 623 | 729 | 597 | (106 | ) | 26 | ||||||||||||||||
Insurance | 181 | 282 | 166 | (101 | ) | 15 | ||||||||||||||||
Investor & Treasury Services | 143 | 45 | 161 | 98 | (18 | ) | ||||||||||||||||
Capital Markets | 882 | 584 | 653 | 298 | 229 | |||||||||||||||||
Corporate Support | (6 | ) | (52 | ) | 24 | 46 | (30 | ) | ||||||||||||||
Net income | $ | 3,509 | $ | 3,206 | $ | 3,172 | $ | 303 | $ | 337 | ||||||||||||
Selected information | ||||||||||||||||||||||
Earnings per share (EPS) – basic | $ | 2.41 | $ | 2.19 | $ | 2.15 | $ | 0.22 | $ | 0.26 | ||||||||||||
– diluted | 2.40 | 2.18 | 2.15 | 0.22 | 0.25 | |||||||||||||||||
Return on common equity (ROE)(2) (3) | 17.6% | 16.2% | 16.7% | 140 bps | 90 bps | |||||||||||||||||
Average common equity(2) | $ | 77,850 | $ | 76,600 | $ | 73,550 | $ | 1,250 | $ | 4,300 | ||||||||||||
Net interest margin (NIM) – on average earning assets (4) | 1.59% | 1.60% | 1.60% | (1) bps | (1) bps | |||||||||||||||||
PCL on loans as a % of average net loans and acceptances | 0.26% | 0.32% | 0.34% | (6) bps | (8) bps | |||||||||||||||||
PCL on performing loans as a % of average net loans and acceptances | 0.05% | 0.05% | 0.06% | - bps | (1) bps | |||||||||||||||||
PCL on impaired loans as a % of average net loans and acceptances | 0.21% | 0.27% | 0.28% | (6) bps | (7) bps | |||||||||||||||||
Gross impaired loans (GIL) as a % of loans and acceptances | 0.45% | 0.46% | 0.46% | (1) bps | (1) bps | |||||||||||||||||
Liquidity coverage ratio (LCR)(5) | 129% | 127% | 128% | 200 bps | 100 bps | |||||||||||||||||
Capital ratios and Leverage ratio | ||||||||||||||||||||||
Common Equity Tier 1 (CET1) ratio | 12.0% | 12.1% | 11.4% | (10) bps | 60 bps | |||||||||||||||||
Tier 1 capital ratio | 13.1% | 13.2% | 12.7% | (10) bps | 40 bps | |||||||||||||||||
Total capital ratio | 14.9% | 15.2% | 14.5% | (30) bps | 40 bps | |||||||||||||||||
Leverage ratio | 4.2% | 4.3% | 4.3% | (10) bps | (10) bps | |||||||||||||||||
Selected balance sheet and other information(6) | ||||||||||||||||||||||
Total assets(7) | $ | 1,476,304 | $ | 1,428,935 | $ | 1,366,216 | $ | 47,369 | $ | 110,088 | ||||||||||||
Securities, net of applicable allowance | 266,667 | 249,004 | 235,832 | 17,663 | 30,835 | |||||||||||||||||
Loans, net of allowance for loan losses | 629,940 | 618,856 | 589,820 | 11,084 | 40,120 | |||||||||||||||||
Derivative related assets | 93,982 | 101,560 | 84,816 | (7,578 | ) | 9,166 | ||||||||||||||||
Deposits(4) | 902,284 | 886,005 | 851,679 | 16,279 | 50,605 | |||||||||||||||||
Common equity(7) | 78,256 | 77,816 | 74,123 | 440 | 4,133 | |||||||||||||||||
Total capital risk-weighted assets | 523,725 | 512,856 | 508,512 | 10,869 | 15,213 | |||||||||||||||||
Assets under management (AUM) | 799,900 | 762,300 | 688,000 | 37,600 | 111,900 | |||||||||||||||||
Assets under administration (AUA)(8) | 5,723,700 | 5,678,000 | 5,363,900 | 45,700 | 359,800 | |||||||||||||||||
Common share information | ||||||||||||||||||||||
Shares outstanding (000s) – average basic | 1,427,599 | 1,432,685 | 1,437,074 | (5,086) | (9,475 | ) | ||||||||||||||||
– average diluted | 1,433,060 | 1,438,257 | 1,443,195 | (5,197) | (10,135 | ) | ||||||||||||||||
– end of period | 1,423,212 | 1,430,096 | 1,435,073 | (6,884) | (11,861 | ) | ||||||||||||||||
Dividends declared per common share | $ | 1.05 | $ | 1.05 | $ | 0.98 | $ | – | $ | 0.07 | ||||||||||||
Dividend yield(9) | 4.0% | 4.0% | 4.1% | – bps | (10) bps | |||||||||||||||||
Dividend payout ratio | 44% | 48% | 45% | (400) bps | (100) bps | |||||||||||||||||
Common share price (RY on TSX)(10) | $ | 104.58 | $ | 106.24 | $ | 100.02 | $ | (1.66 | ) | $ | 4.56 | |||||||||||
Market capitalization (TSX)(10) | 148,840 | 151,933 | 143,536 | (3,093 | ) | 5,304 | ||||||||||||||||
Business information (number of) | ||||||||||||||||||||||
Employees (full-time equivalent) (FTE) | 82,491 | 82,801 | 82,108 | (310 | ) | 383 | ||||||||||||||||
Bank branches | 1,330 | 1,327 | 1,334 | 3 | (4 | ) | ||||||||||||||||
Automated teller machines (ATMs) | 4,619 | 4,600 | 4,568 | 19 | 51 | |||||||||||||||||
Period average US$ equivalent of C$1.00(11) | $ | 0.760 | $ | 0.755 | $ | 0.749 | $ | 0.005 | $ | 0.011 | ||||||||||||
Period-end US$ equivalent of C$1.00 | $ | 0.756 | $ | 0.759 | $ | 0.761 | $ | (0.003 | ) | $ | (0.005 | ) | ||||||||||
| (1) | Effective November 1, 2019, we adopted IFRS 16Leases. Results from periods prior to November 1, 2019 are reported in accordance with IAS 17Leases in this Q1 2020 Report to Shareholders. For further details on the impacts of the adoption of IFRS 16 including the description of accounting policies selected, refer to Note 2 of our Condensed Financial Statements. |
| (2) | Average amounts are calculated using methods intended to approximate the average of the daily balances for the period. This includes Average common equity used in the calculation of ROE. For further details, refer to the Key performance andnon-GAAP measures section. |
| (3) | These measures may not have a standardized meaning under generally accepted accounting principles (GAAP) and may not be comparable to similar measures disclosed by other financial institutions. For further details, refer to the Key performance andnon-GAAP measures section. |
| (4) | Commencing Q4 2019, the interest component and the accrued interest payable recorded on certain deposits carried at Fair Value Through Profit and Loss (FVTPL) previously presented in trading revenue and deposits, respectively, are presented in net interest income and other liabilities, respectively. Comparative amounts have been reclassified to conform with this presentation. |
| (5) | LCR is the average for the three months ended for each respective period and is calculated in accordance with the Office of the Superintendent of Financial Institutions’ (OSFI) Liquidity Adequacy Requirements (LAR) guideline. For further details, refer to the Liquidity and funding risk section. |
| (6) | Representsperiod-end spot balances. |
| (7) | Effective Q4 2019, the transition adjustment related to the adoption of IFRS 15Revenue from Contracts with Customers was revised. The comparative amounts have been revised from those previously presented. |
| (8) | AUA includes $15.4 billion and $7.8 billion (October 31, 2019 – $15.5 billion and $8.1 billion; January 31, 2019 – $16.6 billion and $8.5 billion) of securitized residential mortgages and credit card loans, respectively. |
| (9) | Defined as dividends per common share divided by the average of the high and low share price in the relevant period. |
| (10) | Based on TSX closing market price atperiod-end. |
| (11) | Average amounts are calculated usingmonth-end spot rates for the period. |
Table of Contents
4 Royal Bank of Canada First Quarter 2020
Economic, market and regulatory review and outlook – data as at February 20, 2020
|
The predictions and forecasts in this section are based on information and assumptions from sources we consider reliable. If this information or these assumptions are not accurate, actual economic outcomes may differ materially from the outlook presented in this section.
Economic and market review and outlook
Canada
The Canadian economy is expected to have grown by a modest 0.3%1 in the final calendar quarter of 2019, down from an already below-trend pace of 1.3%1 in the prior calendar quarter. The slowdown partially reflects transitory factors, including labour and transportation disruptions. However, the underlying pace of growth also appears to have slowed somewhat and job growth was less robust in the last calendar quarter of 2019. While recent indicators suggest global growth has stabilized albeit at a slower pace alongside easing trade tensions, Canada’s manufacturing sector continues to soften and business investment is likely to remain modest. Additional transitory factors in the first calendar quarter of 2020, such as reduced rail transportation services, will offset some of the rebound from the previous calendar quarter’s transitory factors. Lower mortgage rates and relatively strong population growth continue to support housing, however, elevated household debt levels continue to restrain consumer spending. We expect only a moderate rebound in GDP growth in the first calendar quarter of 2020. The Bank of Canada (BoC) has held its overnight rate steady at 1.75% for fifteen consecutive months but indicated the possibility of a rate cut if growth remains slow.
U.S.
The U.S. economy grew at a healthy 2.1%1 in the final calendar quarter of 2019, matching the prior calendar quarter’s increase. Labour markets and consumer spending remain solid, and housing activity has picked up amid lower interest rates. Although business investment and industrial production have been soft, recent easing in trade tensions, including the phase one trade agreement between the U.S. and China, pending ratification of the Canada-United States-Mexico Agreement (CUSMA), as well as modest improvement in business sentiment, suggest scope for improvement in the coming quarters. We expect U.S. GDP will grow at a trend-like pace in the first calendar quarter of 2020. After cutting its benchmark interest rate three times in calendar 2019, the Federal Reserve (Fed) is expected to hold rates steady throughout calendar 2020.
Europe
Euro area GDP growth slowed to 0.1% in the final calendar quarter of 2019 following a 0.3% increase in the previous calendar quarter. Both the French and Italian economies contracted at the end of calendar 2019 and survey data show some improvement in the manufacturing sector and stabilization in the services industries. GDP growth is expected to return closer to its longer-term trend in calendar 2020, supported by accommodative monetary policy from the European Central Bank that is expected to remain in place throughout the year. The U.K. left the European Union (EU) on January 31, 2020 but will maintain full access to the single market during a transition period that is set to continue until the end of calendar 2020. Less near-term concern about a no-deal Brexit has boosted business sentiment, though U.K. GDP growth remained soft in the final calendar quarter of 2019. The Bank of England held interest rates steady in January, with the expectation that GDP growth will pick up in early 2020.
Financial markets
Concerns about the economic impact of the COVID-19 outbreak have pushed government bond yields lower, weighed on equity markets in Asia and commodity prices have also declined amid demand concerns. Government bond yields are expected to increase when COVID-19 fears fade, but geopolitical risks, ongoing trade tensions and indications that monetary policy will remain stimulative will likely prevent a more substantial increase in yields. The increase in oil prices in early-calendar 2020 due to U.S.-Iran tensions was not sustained.
Regulatory environment
We continue to monitor and prepare for regulatory developments and changes in a manner that seeks to ensure compliance with new requirements while mitigating any adverse business or financial impacts. Such impacts could result from new or amended laws and regulations and the expectations of those who enforce them. A high level summary of the key regulatory changes that have the potential to increase or decrease our costs and the complexity of our operations is included in the Legal and regulatory environment risk section of our 2019 Annual Report, as updated below.
Global uncertainty
Despite easing of trade tensions, trade policy and geopolitical tensions continue to pose risks to the global economic outlook. In January 2020, the International Monetary Fund further lowered its 2020 and 2021 global growth projections amid threats related to global trade and tensions in the Middle East. On January 31, 2020, the U.K. withdrew from the EU and entered into a transition period during which time the two parties will be negotiating their trade and security agreement before the December 31, 2020 deadline. Both the U.S. and Mexico have ratified CUSMA. After its ratification by Canada, CUSMA will help reduce lingering uncertainty about trade within North America. In January 2020, the U.S. and China agreed to a phase one deal which, among other provisions will provide relief on some tariffs; however, remaining tariffs may continue to pressure trade activity and the broader U.S.-China relationship. Concerns about the impact of the COVID-19 outbreak on the global economy amid disruptions in world-wide trades and supply chains has weighed on global markets. The global financial markets are also
| 1 | Annualized rate |
Table of Contents
Royal Bank of Canada First Quarter 2020 5
vulnerable to rising tensions between the U.S. and the Middle East and could result in increased market volatility and/or higher commodity prices. Our diversified business model, as well as our product and geographic diversification, continue to help mitigate the risk of global uncertainty.
Canadian benchmark rate for qualifying insured mortgages
On February 18, 2020, the Department of Finance Canada announced changes to the minimum qualifying rate for insured mortgages. As a result of a review conducted by the federal financial agencies, it was concluded that the minimum qualifying benchmark rate should be more responsive to changes in market conditions. Effective April 6, 2020, the new benchmark rate will be the weekly median 5-year fixed insured mortgage rate plus 2%, compared to the current benchmark rate of thefive-year fixed rate posted by the Domestic Systemically Important Banks (D-SIBs). We are currently assessing the impacts and we will continue to monitor for any further developments, including any future changes to the benchmark rate for uninsured mortgages.
Client focused reforms
The Canadian Securities Administrators (CSA) published amendments to National Instrument 31-103 to implement the Client Focused Reforms (Reforms), which are intended to increase the standard of conduct required for Canadian securities registrants. The Reforms enhance core requirements relating to conflicts of interest, suitability, know-your-product and know-your-client requirements, and also introduce new requirements relating to relationship disclosure, training and recordkeeping. The changes come into effect in two phases: the first phase relating to conflicts of interest and the related disclosure requirements comes into effect on December 31, 2020, and the second phase relating to the remaining requirements, on December 31, 2021. The requirements will primarily impact our Personal & Commercial Banking and Wealth Management platforms. We do not anticipate any significant challenges in meeting these requirements by the effective dates.
United States regulatory initiatives
Policymakers continue to evaluate and implement reforms to various U.S. financial regulations, which could result in either expansion of or reductions to U.S. regulatory requirements and associated changes in compliance costs. In January 2020, the Fed finalized theControl and Divestiture Proceedings rule which is intended to clarify its process for determining when an entity is under control of a bank holding company and is effective on April 1, 2020. The rule is intended to simplify and provide greater transparency for determining control of a banking organization by establishing a comprehensive framework to determine when a company controls a bank or a bank controls a company. We are currently assessing the impacts of the rule and we do not anticipate any significant challenges in meeting these rules by the effective date.
U.K. and European regulatory reform
In addition to the implications from the U.K.’s withdrawal from the EU, other forthcoming regulatory initiatives include the EU’s published regulations on Sustainability-Related Disclosures which will require financial services firms to disclose their approaches to considering environmental, social and governance factors as part of their advice and investment decision process. These requirements are effective on March 10, 2021 and we are currently assessing the impact on adoption.
For a discussion on risk factors, including our framework and activities to manage these risks and other regulatory developments which may affect our business and financial results, refer to the Risk management – Top and emerging risks and Legal and regulatory environment risk sections of our 2019 Annual Report and the Risk and Capital management sections of this Q1 2020 Report to Shareholders.
|
|
Q1 2020 vs. Q1 2019
Net income of $3,509 million was up $337 million or 11% from a year ago. Diluted earnings per share (EPS) of $2.40 was up $0.25 or 12% and return on common equity (ROE) of 17.6% was up 90 bps from 16.7% last year. Our Common Equity Tier 1 (CET1) ratio of 12.0% was up 60 bps from a year ago.
Our results reflected strong earnings growth in Capital Markets and Personal & Commercial Banking, and solid earnings in Wealth Management and Insurance, partially offset by lower results in Investor & Treasury Services.
Capital Markets results increased primarily due to higher revenue in Global Markets and Corporate and Investment Banking, as well as lower PCL. These factors were partially offset by higher compensation on improved results and a higher effective tax rate, largely reflecting changes in earnings mix.
Personal & Commercial Banking earnings were up mainly due to average volume growth of 8% in Canadian Banking and higher balances driving higher mutual fund distribution fees, partially offset by lower spreads and an increase in technology and related costs. The prior year also included a write-down of deferred tax assets resulting from a change in the corporate tax rate in Barbados.
Wealth Management results were up primarily due to an increase in average fee-based client assets and higher transaction volumes. These factors were partially offset by higher variable compensation commensurate with revenue growth, as well as higher technology and staff-related costs. The prior year was also impacted by a favourable accounting adjustment related to Canadian Wealth Management.
Insurance results increased mainly due to new longevity reinsurance contracts, partially offset by the lower impact from reinsurance contract renegotiations.
Table of Contents
6 Royal Bank of Canada First Quarter 2020
Investor & Treasury Services earnings decreased primarily due to lower client deposit margins and lower revenue from our asset services business.
For further details on our business segment results and CET1 ratio, refer to the Business segment results and Capital management sections, respectively.
Q1 2020 vs. Q4 2019
Net income of $3,509 million was up $303 million or 9% from the prior quarter. Diluted EPS of $2.40 was up $0.22 or 10% and ROE of 17.6% was up 140 bps. Our CET1 ratio of 12.0% was down 10 bps.
Our results reflected strong earnings growth in Capital Markets, and higher results in Investor & Treasury Services, Personal & Commercial Banking and Corporate Support, partially offset by lower earnings in Wealth Management and Insurance.
Capital Markets earnings increased primarily due to higher revenue in Global Markets and Corporate and Investment Banking. These factors were partially offset by higher compensation on improved results and a higher effective tax rate, largely reflecting changes in earnings mix.
Investor & Treasury Services earnings increased primarily due to severance and related costs associated with the repositioning of the business in the prior quarter.
Personal & Commercial Banking results were up mainly due to lower PCL and higher card service revenue.
Wealth Management earnings decreased mainly due to the gain on sale of the private debt business of BlueBay in the prior quarter.
Insurance earnings were down primarily due to the impact of lower favourable investment-related experience, new longevity reinsurance contracts and reinsurance contract renegotiations.
Corporate Support net income was $6 million in the current quarter, largely reflecting residual unallocated costs and net unfavourable tax adjustments, partially offset by asset/liability management activities. Net loss was $52 million in the prior quarter largely due to the impact of an unfavourable accounting adjustment.
Impact of foreign currency translation
The following table reflects the estimated impact of foreign currency translation on key income statement items:
| For the three months ended | ||||||||
| (Millions of Canadian dollars, except per share amounts) | Q1 2020 vs. Q1 2019 | Q1 2020 vs. Q4 2019 | ||||||
Increase (decrease): | ||||||||
Total revenue | $ | (65 | ) | $ | 5 | |||
PCL | (1 | ) | 1 | |||||
PBCAE | – | – | ||||||
Non-interest expense | (44 | ) | 7 | |||||
Income taxes | (2 | ) | – | |||||
Net income | (18 | ) | (3 | ) | ||||
Impact on EPS | ||||||||
Basic | $ | (0.01 | ) | $ | – | |||
Diluted | (0.01 | ) | – | |||||
The relevant average exchange rates that impact our business are shown in the following table:
| (Average foreign currency equivalent of C$1.00) (1) | For the three months ended | |||||||||||
January 31 2020 | October 31 2019 | January 31 2019 | ||||||||||
U.S. dollar | 0.760 | 0.755 | 0.749 | |||||||||
British pound | 0.579 | 0.605 | 0.582 | |||||||||
Euro | 0.684 | 0.686 | 0.656 | |||||||||
| (1) | Average amounts are calculated usingmonth-end spot rates for the period. |
Table of Contents
Royal Bank of Canada First Quarter 2020 7
Total revenue
| (Millions of Canadian dollars) | For the three months ended | |||||||||||
January 31 2020 | October 31 2019 | January 31 2019 | ||||||||||
Interest income | $ | 10,238 | $ | 10,442 | $ | 10,149 | ||||||
Interest expense(1) | 5,017 | 5,331 | 5,302 | |||||||||
Net interest income | $ | 5,221 | $ | 5,111 | $ | 4,847 | ||||||
NIM(1) | 1.59% | 1.60% | 1.60% | |||||||||
Insurance premiums, investment and fee income | $ | 1,994 | $ | 1,153 | $ | 1,579 | ||||||
Trading revenue(1) | 458 | 116 | 395 | |||||||||
Investment management and custodial fees | 1,535 | 1,477 | 1,450 | |||||||||
Mutual fund revenue | 946 | 932 | 873 | |||||||||
Securities brokerage commissions | 318 | 323 | 342 | |||||||||
Service charges | 488 | 493 | 468 | |||||||||
Underwriting and other advisory fees | 627 | 428 | 345 | |||||||||
Foreign exchange revenue, other than trading | 253 | 242 | 249 | |||||||||
Card service revenue | 287 | 252 | 282 | |||||||||
Credit fees | 360 | 344 | 315 | |||||||||
Net gains on investment securities | 11 | 16 | 46 | |||||||||
Share of profit in joint ventures and associates | 22 | 26 | 15 | |||||||||
Other | 316 | 457 | 383 | |||||||||
Non-interest income | $ | 7,615 | $ | 6,259 | $ | 6,742 | ||||||
Total revenue | $ | 12,836 | $ | 11,370 | $ | 11,589 | ||||||
Additional information | ||||||||||||
Total trading revenue | ||||||||||||
Net interest income(1) | $ | 700 | $ | 604 | $ | 564 | ||||||
Non-interest income(1) | 458 | 116 | 395 | |||||||||
Total trading revenue | $ | 1,158 | $ | 720 | $ | 959 | ||||||
| (1) | Commencing Q4 2019, the interest component of the valuation of certain deposits carried at FVTPL previously presented in trading revenue is presented in net interest income. Comparative amounts have been reclassified to conform with this presentation. |
Q1 2020 vs. Q1 2019
Total revenue increased $1,247 million or 11% from last year, mainly due to an increase in insurance premiums, investment and fee income (insurance revenue) and higher net interest income. Higher underwriting and other advisory fees, as well as investment management and custodial fees also contributed to the increase. These factors were partially offset by the impact of foreign exchange translation which decreased total revenue by $65 million.
Net interest income increased $374 million or 8%, largely due to volume growth in Canadian Banking and Wealth Management and higher trading revenue in Capital Markets, as well as higher revenue from our Investor & Treasury Services business, partially offset by lower spreads in Wealth Management and Canadian Banking. The impact associated with higher revenue from our Investor & Treasury Services business was more than offset by lower related gains on non-trading derivatives in Other revenue.
NIM was down 1 bp compared to last year, mainly due to changes in average earning asset mix with volume growth primarily in reverse repos, partially offset by higher revenue from our Investor & Treasury Services business. The impact associated with higher revenue from our Investor & Treasury Services business was more than offset by lower related gains on non-trading derivatives in Other revenue.
Insurance revenue increased $415 million or 26%, mainly reflecting the change in fair value of investments backing our policyholder liabilities and higher group annuity sales, both of which are largely offset in PBCAE. Business growth in International Insurance also contributed to the increase. These factors were partially offset by the lower impact from reinsurance contract renegotiations.
Investment management and custodial fees increased $85 million or 6%, primarily due to higher average fee-based client assets reflecting market appreciation and net sales, partially offset by a favourable accounting adjustment in Wealth Management in the prior year.
Underwriting and other advisory fees increased $282 million or 82%, largely due to higher M&A activity primarily in North America and higher debt origination largely in the U.S. Higher equity origination across all regions also contributed to the increase.
Q1 2020 vs. Q4 2019
Total revenue increased $1,466 million or 13% from the prior quarter, primarily due to an increase in insurance revenue, trading revenue, and underwriting and other advisory fees. Higher net interest income also contributed to the increase. These factors were partially offset by lower other revenue.
Net interest income was up $110 million or 2%, largely due to higher trading revenue in Capital Markets, and volume growth, partially offset by lower spreads in Canadian Banking and Wealth Management.
Insurance revenue increased $841 million or 73%, mainly due to the change in fair value of investments backing our policyholder liabilities, higher group annuity sales and business growth, all of which are largely offset in PBCAE. These factors were partially offset by realized investment gains in the prior quarter and lower favourable reinsurance contract renegotiations.
Table of Contents
8 Royal Bank of Canada First Quarter 2020
Trading revenue increased $342 million or 295%, primarily driven by higher fixed income and equity trading revenue in Capital Markets across most regions.
Underwriting and other advisory fees increased $199 million or 46%, largely due to higher M&A activity primarily in North America.
Other revenue decreased $141 million or 31%, mainly driven by the gain on sale of the private debt business of BlueBay in the prior quarter and lower net gains in our non-trading investment portfolios, partially offset by the change in the fair value of the hedges related to our U.S. share-based compensation plans, which was largely offset in Non-interest expense.
Provision for credit losses
Q1 2020 vs. Q1 2019
Total PCL in Q1 2020 was $419 million.
PCL on loans of $421 million decreased $95 million, or 18% from the prior year, primarily due to lower provisions in Capital Markets and Wealth Management. The PCL on loans ratio of 26 bps improved 8 bps.
Q1 2020 vs. Q4 2019
Total PCL decreased $80 million from the prior quarter.
PCL on loans of $421 million decreased $84 million, or 17% from the prior quarter, due to lower provisions in Personal & Commercial Banking and Wealth Management. The PCL on loans ratio improved 6 bps.
For further details on PCL, refer to Credit quality performance in the Credit risk section.
Insurance policyholder benefits, claims and acquisition expense (PBCAE)
Q1 2020 vs. Q1 2019
PBCAE increased $389 million or 32% from a year ago, mainly due to the change in fair value of investments backing our policyholder liabilities, higher group annuity sales, and business growth, primarily in International Insurance, all of which are largely offset in revenue. These factors were partially offset by the favourable impact of new longevity reinsurance contracts.
Q1 2020 vs. Q4 2019
PBCAE increased $960 million from the prior quarter, mainly due to the change in fair value of investments backing our policyholder liabilities, higher group annuity sales and business growth, all of which are largely offset in revenue. The impact of longevity reinsurance contracts also contributed to the increase. These factors were partially offset by lower favourable investment-related experience.
Non-interest expense
| For the three months ended | ||||||||||||
| (Millions of Canadian dollars, except percentage amounts) | January 31 2020 | October 31 2019 | January 31 2019 | |||||||||
Salaries | $ | 1,652 | $ | 1,738 | $ | 1,608 | ||||||
Variable compensation | 1,646 | 1,475 | 1,388 | |||||||||
Benefits and retention compensation | 541 | 445 | 492 | |||||||||
Share-based compensation | 221 | 62 | 155 | |||||||||
Human resources | $ | 4,060 | $ | 3,720 | $ | 3,643 | ||||||
Equipment | 462 | 452 | 431 | |||||||||
Occupancy | 397 | 424 | 397 | |||||||||
Communications | 250 | 296 | 240 | |||||||||
Professional fees | 284 | 382 | 305 | |||||||||
Amortization of other intangibles | 303 | 309 | 290 | |||||||||
Other | 622 | 736 | 606 | |||||||||
Non-interest expense | $ | 6,378 | $ | 6,319 | $ | 5,912 | ||||||
Efficiency ratio(1) | 49.7% | 55.6% | 51.0% | |||||||||
Efficiency ratio adjusted(2) | 51.6% | 55.4% | 52.1% | |||||||||
| (1) | Efficiency ratio is calculated asNon-interest expense divided by Total revenue. |
| (2) | Measures have been adjusted by excluding the change in fair value of investments backing our policyholder liabilities. These arenon-GAAP measures. For further details, refer to the Key performance andnon-GAAP measures section. |
Q1 2020 vs. Q1 2019
Non-interest expense increased $466 million or 8%, largely due to higher variable compensation commensurate with revenue growth and an increase in technology and related costs, including digital initiatives. The change in the fair value of our U.S. share-based compensation plans, which was largely offset in other revenue, and higher staff-related costs also contributed to the increase. These factors were partially offset by the impact of foreign exchange translation.
Our efficiency ratio of 49.7% decreased 130 bps from 51.0% last year. Excluding the change in fair value of investments backing our policyholder liabilities, our efficiency ratio of 51.6% decreased 50 bps from 52.1% last year.
Q1 2020 vs. Q4 2019
Non-interest expense increased $59 million or 1%, mainly due to higher variable compensation on improved results and an increase in staff-related costs. The change in the fair value of our U.S. share-based compensation plans, which was largely offset in revenue, also contributed to the increase. These factors were partially offset by severance and related costs associated with the repositioning of our Investor & Treasury Services business in the prior quarter, the impact of an unfavourable accounting adjustment in Corporate Support in the prior quarter and the timing of professional fees.
Table of Contents
Royal Bank of Canada First Quarter 2020 9
Our efficiency ratio of 49.7% decreased 590 bps from 55.6% last quarter. Excluding the change in fair value of investments backing our policyholder liabilities, our efficiency ratio of 51.6% decreased 380 bps from 55.4% last quarter.
Efficiency ratio excluding the change in fair value of investments backing our policyholder liabilities is anon-GAAP measure. For further details, including a reconciliation, refer to the Key performance andnon-GAAP measures section.
Income taxes
| For the three months ended | ||||||||||||
| (Millions of Canadian dollars, except percentage amounts) | January 31 2020 | October 31 2019 | January 31 2019 | |||||||||
Income taxes | $ | 916 | $ | 692 | $ | 766 | ||||||
Income before income taxes | $ | 4,425 | $ | 3,898 | $ | 3,938 | ||||||
Effective income tax rate | 20.7% | 17.8% | 19.5% | |||||||||
Q1 2020 vs. Q1 2019
Income tax expense increased $150 million or 20% from last year, primarily due to higher income before income taxes.
The effective income tax rate of 20.7% increased 120 bps, mainly due to a decrease in income from lower tax rate jurisdictions in the current quarter and favourable tax adjustments in the prior year. These factors were partially offset by a write-down of deferred tax assets resulting from a change in the corporate tax rate in Barbados in the prior year.
Q1 2020 vs. Q4 2019
Income tax expense increased $224 million or 32% from last quarter, primarily due to higher income before income taxes in the current quarter and higher favourable tax adjustments in the prior quarter.
The effective income tax rate of 20.7% increased 290 bps, primarily due to higher favourable tax adjustments in the prior quarter and a decrease in income from lower tax rate jurisdictions in the current quarter.
|
How we measure and report our business segments
|
The key methodologies and assumptions used in our management reporting framework are periodically reviewed by management to ensure they remain valid. They remain unchanged from October 31, 2019.
For further details on our key methodologies and assumptions used in our management reporting framework, refer to the How we measure and report our business segments section of our 2019 Annual Report.
Key performance andnon-GAAP measures
|
Performance measures
Return on common equity
We measure and evaluate the performance of our consolidated operations and each business segment using a number of financial metrics, such as net income and ROE. We use ROE, at both the consolidated and business segment levels, as a measure of return on total capital invested in our business. Management views the business segment ROE measure as a useful measure for supporting investment and resource allocation decisions because it adjusts for certain items that may affect comparability between business segments and certain competitors. ROE does not have a standardized meaning under GAAP and may not be comparable to similar measures disclosed by other financial institutions. For further details, refer to the Key performance andnon-GAAP measures section of our 2019 Annual Report.
The following table provides a summary of our ROE calculations:
| For the three months ended | ||||||||||||||||||||||||||||||||||||||||
January 31 2020 | October 31 2019 | January 31 2019 | ||||||||||||||||||||||||||||||||||||||
(Millions of Canadian dollars, except percentage amounts) | Personal & Commercial Banking | Wealth Management | Insurance | Investor & Treasury Services | Capital Markets | Corporate Support | Total | Total | Total | |||||||||||||||||||||||||||||||
Net income available to common shareholders | $ | 1,663 | $ | 610 | $ | 179 | $ | 140 | $ | 863 | $ | (16 | ) | $ | 3,439 | $ | 3,137 | $ | 3,096 | |||||||||||||||||||||
Total average common equity(1) (2) | 23,350 | 15,350 | 2,200 | 3,100 | 22,750 | 11,100 | 77,850 | 76,600 | 73,550 | |||||||||||||||||||||||||||||||
ROE(3) | 28.3% | 15.8% | 32.5% | 18.0% | 15.1% | n.m. | 17.6% | 16.2% | 16.7% | |||||||||||||||||||||||||||||||
| (1) | Total average common equity represents rounded figures. |
| (2) | The amounts for the segments are referred to as attributed capital. |
| (3) | ROE is based on actual balances of average common equity before rounding. |
| n.m. | not meaningful |
Non-GAAP measures
We believe that certainnon-GAAP measures described below are more reflective of our ongoing operating results and provide readers with a better understanding of management’s perspective on our performance. These measures enhance the
Table of Contents
10 Royal Bank of Canada First Quarter 2020
comparability of our financial performance for the three months ended January 31, 2020 with the corresponding period in the prior year and the three months ended October 31, 2019.Non-GAAP measures do not have a standardized meaning under GAAP and may not be comparable to similar measures disclosed by other financial institutions.
The following discussion describes the non-GAAP measures we use in evaluating our operating results.
Efficiency ratio excluding the change in fair value of investments in Insurance
Our efficiency ratio is impacted by the change in fair value of investments backing our policyholder liabilities, which is reported in revenue and largely offset in PBCAE.
The following table provides calculations of our consolidated efficiency ratio excluding the change in fair value of investments backing our policyholder liabilities:
| For the three months ended | ||||||||||||||||||||||||||||||||||||||||
January 31 2020 | October 31 2019 | January 31 2019 | ||||||||||||||||||||||||||||||||||||||
| Item excluded | Item excluded | Item excluded | ||||||||||||||||||||||||||||||||||||||
| (Millions of Canadian dollars, except percentage amounts) | As reported | Change in fair value of investments backing policyholder liabilities | Adjusted | As reported | Change in fair value of investments backing policyholder liabilities | Adjusted | As reported | Change in fair value of investments backing policyholder liabilities | Adjusted | |||||||||||||||||||||||||||||||
Total revenue | $ | 12,836 | $ | (468) | $ | 12,368 | $ | 11,370 | $ | 28 | $ | 11,398 | $ | 11,589 | $ | (247 | ) | $ | 11,342 | |||||||||||||||||||||
Non-interest expense | 6,378 | – | 6,378 | 6,319 | – | 6,319 | 5,912 | – | 5,912 | |||||||||||||||||||||||||||||||
Efficiency ratio | 49.7% | 51.6% | 55.6% | 55.4% | 51.0% | 52.1% | ||||||||||||||||||||||||||||||||||
| As at or for the three months ended | ||||||||||||
| (Millions of Canadian dollars, except percentage amounts and as otherwise noted) | January 31 2020 | October 31 2019 | January 31 2019 | |||||||||
Net interest income | $ | 3,226 | $ | 3,238 | $ | 3,134 | ||||||
Non-interest income | 1,384 | 1,330 | 1,284 | |||||||||
Total revenue | 4,610 | 4,568 | 4,418 | |||||||||
PCL on performing assets | 66 | 50 | 35 | |||||||||
PCL on impaired assets | 276 | 337 | 313 | |||||||||
PCL | 342 | 387 | 348 | |||||||||
Non-interest expense | 1,984 | 2,007 | 1,915 | |||||||||
Income before income taxes | 2,284 | 2,174 | 2,155 | |||||||||
Net income | $ | 1,686 | $ | 1,618 | $ | 1,571 | ||||||
Revenue by business | ||||||||||||
Canadian Banking | $ | 4,368 | $ | 4,321 | $ | 4,170 | ||||||
Caribbean & U.S. Banking | 242 | 247 | 248 | |||||||||
Selected balance sheet and other information | ||||||||||||
ROE | 28.3% | 27.0% | 26.6% | |||||||||
NIM | 2.77% | 2.82% | 2.84% | |||||||||
Efficiency ratio | 43.0% | 43.9% | 43.3% | |||||||||
Operating leverage | 0.7% | 3.7% | (0.2)% | |||||||||
Average total earning assets, net | $ | 463,400 | $ | 456,100 | $ | 437,100 | ||||||
Average loans and acceptances, net | 466,800 | 458,900 | 438,100 | |||||||||
Average deposits | 413,700 | 405,200 | 382,200 | |||||||||
AUA(1) | 294,200 | 283,800 | 268,500 | |||||||||
Average AUA | 290,600 | 281,800 | 264,000 | |||||||||
PCL on impaired loans as a % of average net loans and acceptances | 0.24% | 0.29% | 0.28% | |||||||||
Other selected information – Canadian Banking | ||||||||||||
Net income | $ | 1,624 | $ | 1,555 | $ | 1,544 | ||||||
NIM | 2.72% | 2.76% | 2.79% | |||||||||
Efficiency ratio | 41.3% | 42.0% | 41.6% | |||||||||
Operating leverage | 0.7% | 4.3% | (0.2)% | |||||||||
| (1) | AUA representsperiod-end spot balances and includes securitized residential mortgages and credit card loans as at January 31, 2020 of $15.4 billion and $7.8 billion, respectively (October 31, 2019 – $15.5 billion and $8.1 billion; January 31, 2019 – $16.6 billion and $8.5 billion). |
Financial performance
Q1 2020 vs. Q1 2019
Net income increased $115 million or 7% from last year, mainly due to average volume growth of 8% in Canadian Banking and higher mutual fund distribution fees, partially offset by lower spreads and an increase in technology and related costs. The prior year also included a write-down of deferred tax assets resulting from a change in the corporate tax rate in Barbados.
Total revenue increased $192 million or 4%.
Canadian Banking revenue increased $198 million or 5% compared to last year, largely reflecting average volume growth of 7% in loans and 9% in deposits, higher balances driving higher mutual fund distribution fees and higher service charges. These factors were partially offset by lower spreads.
Table of Contents
Royal Bank of Canada First Quarter 2020 11
Caribbean & U.S. Banking revenue decreased $6 million or 2% compared to last year.
Net interest margin was down 7 bps, mainly due to the impact of competitive pricing pressures and changes in product mix.
PCL decreased $6 million or 2%, largely due to lower PCL on impaired assets, resulting in a decrease of 4 bps in the impaired loans ratio. This was partially offset by higher PCL on performing assets. For further details, refer to Credit quality performance in the Credit risk section.
Non-interest expense increased $69 million or 4%, primarily attributable to an increase in technology and related costs, including digital initiatives, higher staff-related costs and higher marketing costs.
Q1 2020 vs. Q4 2019
Net income increased $68 million or 4% from last quarter, mainly due to lower PCL and higher card service revenue.
Total revenue increased $42 million or 1% from last quarter, mainly driven by average volume growth of 2% in Canadian Banking and higher card service revenue, partially offset by lower spreads.
Net interest margin was down 5 bps, largely due to the impact of competitive pricing pressures.
PCL decreased $45 million or 12%, largely due to lower PCL on impaired assets, resulting in a decrease of 5 bps in the impaired loans ratio. This was partially offset by higher PCL on performing assets. For further details, refer to Credit quality performance in the Credit risk section.
Non-interest expense decreased $23 million or 1%, largely reflecting the timing of professional fees and lower marketing costs, partially offset by higher staff-related costs.
|
| As at or for the three months ended | ||||||||||||
| (Millions of Canadian dollars, except number of, percentage amounts and as otherwise noted) | January 31 2020 | October 31 2019 | January 31 2019 | |||||||||
Net interest income | $ | 738 | $ | 745 | $ | 744 | ||||||
Non-interest income | ||||||||||||
Fee-based revenue | 1,847 | 1,786 | 1,714 | |||||||||
Transaction and other revenue | 581 | 656 | 490 | |||||||||
Total revenue | 3,166 | 3,187 | 2,948 | |||||||||
PCL on performing assets | (1 | ) | (1 | ) | 15 | |||||||
PCL on impaired assets | (1 | ) | 35 | 11 | ||||||||
PCL | (2 | ) | 34 | 26 | ||||||||
Non-interest expense | 2,370 | 2,262 | 2,164 | |||||||||
Income before income taxes | 798 | 891 | 758 | |||||||||
Net income | $ | 623 | $ | 729 | $ | 597 | ||||||
Revenue by business | ||||||||||||
Canadian Wealth Management | $ | 843 | $ | 823 | $ | 842 | ||||||
U.S. Wealth Management (including City National) | 1,624 | 1,556 | 1,471 | |||||||||
U.S. Wealth Management (including City National) (US$ millions) | 1,234 | 1,175 | 1,103 | |||||||||
Global Asset Management | 594 | 713 | 543 | |||||||||
International Wealth Management | 105 | 95 | 92 | |||||||||
Selected balance sheet and other information | ||||||||||||
ROE | 15.8% | 19.5% | 16.4% | |||||||||
NIM | 3.17% | 3.30% | 3.67% | |||||||||
Pre-tax margin(1) | 25.2% | 28.0% | 25.7% | |||||||||
Number of advisors(2) | 5,299 | 5,296 | 5,119 | |||||||||
Average total earning assets, net | $ | 92,500 | $ | 89,500 | $ | 80,500 | ||||||
Average loans and acceptances, net | 69,600 | 66,700 | 61,200 | |||||||||
Average deposits | 105,600 | 100,700 | 94,300 | |||||||||
AUA(3) | 1,106,900 | 1,062,200 | 981,400 | |||||||||
U.S. Wealth Management (including City National)(3) | 578,600 | 543,300 | 496,500 | |||||||||
U.S. Wealth Management (including City National) (US$ millions)(3) | 437,300 | 412,600 | 378,000 | |||||||||
AUM(3) | 792,900 | 755,700 | 682,000 | |||||||||
Average AUA | 1,097,100 | 1,055,700 | 986,800 | |||||||||
Average AUM | 780,200 | 753,300 | 675,100 | |||||||||
PCL on impaired loans as a % of average net loans and acceptances | (0.01)% | 0.21% | 0.07% | |||||||||
Estimated impact of U.S. dollar, British pound and Euro translation on (Millions of Canadian dollars, except percentage amounts and as otherwise noted) | For the three months ended | |||||||
| Q1 2020 vs. Q1 2019 | Q1 2020 vs. Q4 2019 | |||||||
Increase (decrease): | ||||||||
Total revenue | $ | (27 | ) | $ | (2 | ) | ||
PCL | – | – | ||||||
Non-interest expense | (21 | ) | (3 | ) | ||||
Net income | (4 | ) | - | |||||
Percentage change in average U.S. dollar equivalent of C$1.00 | 1% | 1% | ||||||
Percentage change in average British pound equivalent of C$1.00 | (1)% | (4)% | ||||||
Percentage change in average Euro equivalent of C$1.00 | 4% | –% | ||||||
| (1) | Pre-tax margin is defined as Income before income taxes divided by Total revenue. |
| (2) | Represents client-facing advisors across all our Wealth Management businesses. |
| (3) | Representsperiod-end spot balances. |
Table of Contents
12 Royal Bank of Canada First Quarter 2020
Financial performance
Q1 2020 vs. Q1 2019
Net income increased $26 million or 4%, primarily due to an increase in average fee-based client assets and higher transaction volumes. These factors were partially offset by higher variable compensation commensurate with revenue growth, as well as higher technology and staff-related costs. The prior year was also impacted by a favourable accounting adjustment related to Canadian Wealth Management.
Total revenue increased $218 million or 7%.
Canadian Wealth Management revenue increased $1 million, primarily due to higher average fee-based client assets reflecting market appreciation and net sales, largely offset by a favourable accounting adjustment in the prior year.
U.S. Wealth Management (including City National) revenue increased $153 million or 10%. In U.S. dollars, revenue increased $131 million or 12%, primarily due to higher average fee-based client assets reflecting market appreciation and net sales, the change in the fair value of the hedges related to our U.S. share-based compensation plans, which was largely offset in non-interest expense and higher transaction volumes. Higher net interest income driven by average loan growth of 17%, largely offset by lower spreads, also contributed to the increase.
Global Asset Management revenue increased $51 million or 9%, largely due to higher average fee-based assets reflecting market appreciation and net sales.
International Wealth Management revenue increased $13 million or 14%, largely due to higher transaction volumes and increase in net interest income driven by higher spreads.
PCL decreased $28 million primarily in U.S. Wealth Management (including City National), reflecting lower PCL on performing assets due to unfavourable macroeconomic factors in the prior year. Lower PCL on impaired assets also contributed to the decrease, resulting in an improvement of 8 bps in the impaired loans ratio. For further details, refer to Credit quality performance in the Credit risk section.
Non-interest expense increased $206 million or 10%, primarily due to higher variable compensation commensurate with revenue growth. The change in the fair value of our U.S. share-based compensation plans, which was largely offset in revenue, higher staff-related costs in support of business growth and higher technology and related costs also contributed to the increase. These factors were partially offset by the impact of foreign exchange translation.
Q1 2020 vs. Q4 2019
Net income decreased $106 million or 15%, mainly due to the gain on sale of the private debt business of BlueBay in the prior quarter.
Total revenue decreased $21 million or 1%, as the change in the fair value of the hedges related to our U.S. share-based compensation plans, which was largely offset in non-interest expense, higher average fee-based client assets reflecting market appreciation and net sales, and an increase in transaction volumes were more than offset by the gain on sale of the private debt business of BlueBay in the prior quarter.
PCL decreased $36 million, reflecting lower provisions on impaired assets in U.S. Wealth Management (including City National) driving a decrease of 22 bps in the impaired loans ratio. For further details, refer to Credit quality performance in the Credit risk section.
Non-interest expense increased $108 million or 5%, primarily due to higher staff-related costs, and the change in the fair value of our U.S. share-based compensation plans, which was largely offset in revenue.
Table of Contents
Royal Bank of Canada First Quarter 2020 13
|
| As at or for the three months ended | ||||||||||||
| (Millions of Canadian dollars, except percentage amounts and as otherwise noted) | January 31 2020 | October 31 2019 | January 31 2019 | |||||||||
Non-interest income | ||||||||||||
Net earned premiums | $ | 1,350 | $ | 944 | $ | 1,162 | ||||||
Investment income(1) | 609 | 168 | 381 | |||||||||
Fee income | 35 | 41 | 36 | |||||||||
Total revenue | 1,994 | 1,153 | 1,579 | |||||||||
Insurance policyholder benefits and claims(1) | 1,535 | 572 | 1,129 | |||||||||
Insurance policyholder acquisition expense | 79 | 82 | 96 | |||||||||
Non-interest expense | 153 | 153 | 154 | |||||||||
Income before income taxes | 227 | 346 | 200 | |||||||||
Net income | $ | 181 | $ | 282 | $ | 166 | ||||||
Revenue by business | ||||||||||||
Canadian Insurance | $ | 1,383 | $ | 609 | $ | 1,039 | ||||||
International Insurance | 611 | 544 | 540 | |||||||||
Selected balances and other information | ||||||||||||
ROE | 32.5% | 50.3% | 34.7% | |||||||||
Premiums and deposits(2) | $ | 1,542 | $ | 1,105 | $ | 1,314 | ||||||
Fair value changes on investments backing policyholder liabilities(1) | 468 | (28 | ) | 247 | ||||||||
| (1) | Investment income can experience volatility arising from fluctuation of assets designated as FVTPL. The investments which support actuarial liabilities are predominantly fixed income assets designated as FVTPL. Consequently, changes in the fair values of these assets are recorded in the Consolidated Statements of Income and are largely offset by changes in the fair value of the actuarial liabilities, the impact of which is reflected in Insurance policyholder benefits, claims and acquisition expense. |
| (2) | Premiums and deposits include premiums on risk-based insurance and annuity products, and individual and group segregated fund deposits, consistent with insurance industry practices. |
Financial performance
Q1 2020 vs. Q1 2019
Net income increased $15 million or 9% from a year ago, mainly due to new longevity reinsurance contracts, partially offset by the lower impact from reinsurance contract renegotiations.
Total revenue increased $415 million or 26%.
Canadian Insurance revenue increased $344 million or 33%, primarily due to the change in fair value of investments backing our policyholder liabilities and higher group annuity sales, both of which are largely offset in PBCAE as indicated below.
International Insurance revenue increased $71 million or 13%, mainly due to business growth, primarily in longevity reinsurance, which is largely offset in PBCAE as indicated below. This factor was, partially offset by the lower impact from reinsurance contract renegotiations.
PBCAE increased $389 million or 32%, mainly due to the change in fair value of investments backing our policyholder liabilities, higher group annuity sales, and business growth, primarily in International Insurance, partially offset by the favourable impact of new longevity reinsurance contracts.
Non-interest expense decreased $1 million or 1%.
Q1 2020 vs. Q4 2019
Net income decreased $101 million or 36%, primarily due to the impact of lower favourable investment-related experience, new longevity reinsurance contracts and reinsurance contract renegotiations.
Total revenue increased $841 million or 73%, mainly due to the change in fair value of investments backing our policyholder liabilities, higher group annuity sales and business growth, all of which are largely offset in PBCAE as indicated below. These factors were partially offset by realized investment gains in the prior quarter and lower favourable reinsurance contract renegotiations.
PBCAE increased $960 million, mainly due to the change in fair value of investments backing our policyholder liabilities and higher group annuity sales. Business growth and the impact of new longevity reinsurance contracts also contributed to the increase. These factors were partially offset by lower favourable investment-related experience.
Non-interest expense remained consistent with prior quarter.
Table of Contents
14 Royal Bank of Canada First Quarter 2020
|
| (Millions of Canadian dollars, except percentage amounts and as otherwise noted) | As at or for the three months ended | |||||||||||
January 31 2020 | October 31 2019 | January 31 2019 | ||||||||||
Net interest income | $ | 58 | $ | 37 | $ | (31 | ) | |||||
Non-interest income | 539 | 529 | 662 | |||||||||
Total revenue | 597 | 566 | 631 | |||||||||
PCL | – | (1 | ) | – | ||||||||
Non-interest expense | 402 | 508 | 418 | |||||||||
Net income before income taxes | 195 | 59 | 213 | |||||||||
Net income | $ | 143 | $ | 45 | $ | 161 | ||||||
Selected balance sheet and other information | ||||||||||||
ROE | 18.0% | 4.8% | 17.3% | |||||||||
Average deposits | $ | 174,500 | $ | 175,200 | $ | 171,900 | ||||||
Average client deposits | 57,900 | 57,600 | 59,200 | |||||||||
Average wholesale funding deposits | 116,600 | 117,600 | 112,700 | |||||||||
AUA(1) | 4,308,200 | 4,318,100 | 4,100,900 | |||||||||
Average AUA | 4,286,200 | 4,296,300 | 4,191,300 | |||||||||
| Estimated impact of U.S. dollar, British pound and Euro translation on key income statement items (Millions of Canadian dollars, except percentage amounts) | For the three months ended | |||||||
Q1 2020 vs. Q1 2019 | Q1 2020 vs. Q4 2019 | |||||||
Increase (decrease): | ||||||||
Total revenue | $ | (8 | ) | $ | 3 | |||
Non-interest expense | (7 | ) | 3 | |||||
Net income | – | – | ||||||
Percentage change in average U.S. dollar equivalent of C$1.00 | 1% | 1% | ||||||
Percentage change in average British pound equivalent of C$1.00 | (1)% | (4)% | ||||||
Percentage change in average Euro equivalent of C$1.00 | 4% | –% | ||||||
| (1) | Representsperiod-end spot balances. |
Financial performance
Q1 2020 vs. Q1 2019
Net income decreased $18 million or 11%, primarily due to lower client deposit margins and lower revenue from our asset services business.
Total revenue decreased $34 million or 5%, mainly due to lower client deposit revenue largely driven by margin compression reflecting spread tightening and the impact of foreign exchange translation. Lower revenue from our asset services business due to reduced client activity also contributed to the decrease.
Non-interest expense decreased $16 million or 4%, primarily driven by the impact of foreign exchange translation and lower staff related costs largely benefitting from investment in technology initiatives.
Q1 2020 vs. Q4 2019
Net income increased $98 million, primarily due to severance and related costs associated with the repositioning of the business in the prior quarter.
Total revenue increased $31 million or 5%, mainly due to higher funding and liquidity revenue driven by money market opportunities in the current quarter.
Non-interest expense decreased $106 million or 21%, largely driven by severance and related costs associated with the repositioning of the business in the prior quarter, partially offset by annual regulatory costs in the current quarter.
Table of Contents
Royal Bank of Canada First Quarter 2020 15
|
| As at or for the three months ended | ||||||||||||
| (Millions of Canadian dollars, except percentage amounts and as otherwise noted) | January 31 2020 | October 31 2019 | January 31 2019 | |||||||||
Net interest income(1) (2) | $ | 1,161 | $ | 1,063 | $ | 969 | ||||||
Non-interest income(1) (2) | 1,387 | 924 | 1,129 | |||||||||
Total revenue(1) | 2,548 | 1,987 | 2,098 | |||||||||
PCL on performing assets | 18 | 18 | 38 | |||||||||
PCL on impaired assets | 61 | 60 | 102 | |||||||||
PCL | 79 | 78 | 140 | |||||||||
Non-interest expense | 1,435 | 1,308 | 1,230 | |||||||||
Net income before income taxes | 1,034 | 601 | 728 | |||||||||
Net income | $ | 882 | $ | 584 | $ | 653 | ||||||
Revenue by business | ||||||||||||
Corporate and Investment Banking | $ | 1,141 | $ | 934 | $ | 927 | ||||||
Global Markets | 1,450 | 1,095 | 1,227 | |||||||||
Other | (43 | ) | (42 | ) | (56 | ) | ||||||
Selected balance sheet and other information | ||||||||||||
ROE | 15.1% | 10.0% | 10.8% | |||||||||
Average total assets | $ | 716,000 | $ | 696,100 | $ | 643,700 | ||||||
Average trading securities | 115,700 | 103,800 | 102,100 | |||||||||
Average loans and acceptances, net | 99,300 | 98,100 | 98,400 | |||||||||
Average deposits(2) | 76,500 | 76,800 | 78,100 | |||||||||
PCL on impaired loans as a % of average net loans and acceptances | 0.24% | 0.24% | 0.41% | |||||||||
| (1) | The taxable equivalent basis (teb) adjustment for the three months ended January 31, 2020 was $128 million (October 31, 2019 – $112 million; January 31, 2019 – $107 million). For further discussion, refer to the How we measure and report our business segments section of our 2019 Annual Report. |
| (2) | Commencing Q4 2019, the interest component and the accrued interest payable recorded on certain deposits carried at FVTPL previously presented in trading revenue and deposits, respectively, are presented in net interest income and other liabilities, respectively. Comparative amounts have been reclassified to conform with this presentation. |
Financial performance
Q1 2020 vs. Q1 2019
Net income increased $229 million or 35%, primarily due to higher revenue in Global Markets and Corporate and Investment Banking, as well as lower PCL. These factors were partially offset by higher compensation on improved results and a higher effective tax rate, largely reflecting changes in earnings mix.
Total revenue increased $450 million or 21%.
Corporate and Investment Banking revenue increased $214 million or 23%, mainly due to higher M&A activity primarily in North America and higher debt origination largely in the U.S. as the prior year was impacted by challenging market conditions.
Global Markets revenue increased $223 million or 18%, mainly driven by higher fixed income trading revenue across all regions due to more favourable market conditions in the current quarter and increased client activity, partially offset by lower equity trading revenue primarily in the U.S.
Other revenue increased $13 million largely reflecting lower residual funding costs.
PCL decreased $61 million or 44%, largely due to lower PCL on impaired assets. The PCL on impaired loans ratio decreased 17 bps, mainly due to lower provisions taken in the current year. Lower PCL on performing assets also contributed to the decrease. For further details, refer to Credit quality performance in the Credit risk section.
Non-interest expense increased $205 million or 17%, mainly due to higher compensation on improved results.
Q1 2020 vs. Q4 2019
Net income increased $298 million or 51%, primarily due to higher revenue in Global Markets and Corporate and Investment Banking. These factors were partially offset by higher compensation on improved results and a higher effective tax rate, largely reflecting changes in earnings mix.
Total revenue increased $561 million or 28%, mainly due to higher fixed income trading revenue across most regions and higher M&A activity primarily in North America. Higher equity trading revenue across most regions also contributed to the increase.
PCL increased $1 million and the PCL on impaired loans ratio remained flat.
Non-interest expense increased $127 million or 10%, mainly due to higher compensation on improved results.
Table of Contents
16 Royal Bank of Canada First Quarter 2020
|
| For the three months ended | ||||||||||||
| (Millions of Canadian dollars) | January 31 2020 | October 31 2019 | January 31 2019 | |||||||||
Net interest income (loss)(1) | $ | 38 | $ | 28 | $ | 31 | ||||||
Non-interest income (loss)(1) | (117 | ) | (119 | ) | (116 | ) | ||||||
Total revenue(1) | (79 | ) | (91 | ) | (85 | ) | ||||||
PCL | – | 1 | – | |||||||||
Non-interest expense | 34 | 81 | 31 | |||||||||
Net income (loss) before income taxes(1) | (113 | ) | (173 | ) | (116 | ) | ||||||
Income taxes (recoveries)(1) | (107 | ) | (121 | ) | (140 | ) | ||||||
Net income (loss) | $ | (6 | ) | $ | (52 | ) | $ | 24 | ||||
| (1) | Teb adjusted. |
Due to the nature of activities and consolidation adjustments reported in this segment, we believe that a comparative period analysis is not relevant. The following identifies material items affecting the reported results in each period.
Total revenue and income taxes (recoveries) in each period in Corporate Support include the deduction of the teb adjustments related to thegross-up of income from Canadian taxable corporate dividends and the U.S. tax credit investment business recorded in Capital Markets. The amount deducted from revenue was offset by an equivalent increase in income taxes (recoveries).
The teb amount for the three months ended January 31, 2020 was $128 million, as compared to $112 million in the prior quarter and $107 million last year.
The following identifies the material items, other than the teb impacts noted previously, affecting the reported results in each period.
Q1 2020
Net loss was $6 million, largely reflecting residual unallocated costs and net unfavourable tax adjustments, partially offset by asset/liability management activities.
Q4 2019
Net loss was $52 million, largely due to the impact of an unfavourable accounting adjustment.
Q1 2019
Net income was $24 million, largely reflecting net favourable tax adjustments.
Quarterly results and trend analysis
|
Our quarterly results are impacted by a number of trends and recurring factors, which include seasonality of certain businesses, general economic and market conditions, and fluctuations in the Canadian dollar relative to other currencies. The following table summarizes our results for the last eight quarters (the period):
Quarterly results(1)
| . | 2020 | 2019 | 2018 | |||||||||||||||||||||||||||||||||
(Millions of Canadian dollars, except per share and percentage amounts) | Q1 | Q4 | Q3 | Q2 | Q1 | Q4 | Q3 | Q2 | ||||||||||||||||||||||||||||
Personal & Commercial Banking | $ | 4,610 | $ | 4,568 | $ | 4,546 | $ | 4,333 | $ | 4,418 | $ | 4,364 | $ | 4,284 | $ | 4,103 | ||||||||||||||||||||
Wealth Management | 3,166 | 3,187 | 3,029 | 2,979 | 2,948 | 2,740 | 2,798 | 2,605 | ||||||||||||||||||||||||||||
Insurance | 1,994 | 1,153 | 1,463 | 1,515 | 1,579 | 1,039 | 1,290 | 806 | ||||||||||||||||||||||||||||
Investor & Treasury Services | 597 | 566 | 561 | 587 | 631 | 624 | 620 | 671 | ||||||||||||||||||||||||||||
Capital Markets(2) | 2,548 | 1,987 | 2,034 | 2,169 | 2,098 | 2,056 | 2,157 | 2,010 | ||||||||||||||||||||||||||||
Corporate Support(2) | (79 | ) | (91 | ) | (89 | ) | (84 | ) | (85 | ) | (154 | ) | (124 | ) | (141 | ) | ||||||||||||||||||||
Total revenue | $ | 12,836 | $ | 11,370 | $ | 11,544 | $ | 11,499 | $ | 11,589 | $ | 10,669 | $ | 11,025 | $ | 10,054 | ||||||||||||||||||||
PCL | 419 | 499 | 425 | 426 | 514 | 353 | 346 | 274 | ||||||||||||||||||||||||||||
PBCAE | 1,614 | 654 | 1,046 | 1,160 | 1,225 | 494 | 925 | 421 | ||||||||||||||||||||||||||||
Non-interest expense | 6,378 | 6,319 | 5,992 | 5,916 | 5,912 | 5,882 | 5,858 | 5,482 | ||||||||||||||||||||||||||||
Income before income taxes | $ | 4,425 | $ | 3,898 | $ | 4,081 | $ | 3,997 | $ | 3,938 | $ | 3,940 | $ | 3,896 | $ | 3,877 | ||||||||||||||||||||
Income taxes | 916 | 692 | 818 | 767 | 766 | 690 | 787 | 817 | ||||||||||||||||||||||||||||
Net income | $ | 3,509 | $ | 3,206 | $ | 3,263 | $ | 3,230 | $ | 3,172 | $ | 3,250 | $ | 3,109 | $ | 3,060 | ||||||||||||||||||||
EPS – basic | $ | 2.41 | $ | 2.19 | $ | 2.23 | $ | 2.20 | $ | 2.15 | $ | 2.21 | $ | 2.10 | $ | 2.06 | ||||||||||||||||||||
– diluted | 2.40 | 2.18 | 2.22 | 2.20 | 2.15 | 2.20 | 2.10 | 2.06 | ||||||||||||||||||||||||||||
Effective income tax rate | 20.7% | 17.8% | 20.0% | 19.2% | 19.5% | 17.5% | 20.2% | 21.1% | ||||||||||||||||||||||||||||
Period average US$ equivalent of C$1.00 | $ | 0.760 | $ | 0.755 | $ | 0.754 | $ | 0.751 | $ | 0.749 | $ | 0.767 | $ | 0.767 | $ | 0.778 | ||||||||||||||||||||
| (1) | Fluctuations in the Canadian dollar relative to other foreign currencies have affected our consolidated results over the period. |
| (2) | Teb adjusted. For further discussion, refer to the How we measure and report our business segments section our 2019 Annual Report. |
Table of Contents
Royal Bank of Canada First Quarter 2020 17
Seasonality
Seasonal factors may impact our results in certain quarters. The first quarter has historically been stronger for our Capital Markets businesses. The second quarter has fewer days than the other quarters, which generally results in a decrease in net interest income and certain expense items. The third and fourth quarters include the summer months which results in lower client activity and may negatively impact the results of our Capital Markets brokerage business.
Trend analysis
Earnings have generally trended upward over the period. However, results in the first quarter of 2019 were impacted by challenging market conditions throughout the earlier part of the quarter. Quarterly earnings are also affected by the impact of foreign exchange translation.
Personal & Commercial Banking revenue has benefitted from solid volume growth since the beginning of the period. Higher spreads throughout 2018 and the early half of 2019 reflecting higher interest rates have been partially offset by the ongoing impact of competitive pricing pressures. Overall, however, market interest rates have moderated in the latter part of the period.
Wealth Management revenue has generally trended upwards primarily due to growth in averagefee-based client assets which benefitted from market appreciation and net sales. Net interest income has also increased throughout the majority of the period largely driven by volume growth across the period and the impact of higher interest rates throughout the earlier part of the period. The impact of the U.S. Fed rate cuts resulted in lower spreads throughout the latter part of the period. A gain on the sale of the private debt business of BlueBay contributed to the increase in the fourth quarter of 2019. The change in the fair value of the hedges related to our U.S. share-based compensation plans, which is largely offset inNon-interest expense, also contributed to fluctuations in revenue over the period.
Insurance revenue fluctuated over the period, primarily due to the impact of changes in the fair value of investments backing our policyholder liabilities. Revenue has benefitted from business growth in Canadian and International Insurance over the majority of the period, with the exception of lower group annuity sales impacting the fourth quarter of 2019.
Investor & Treasury Services revenue has been impacted by fluctuations in market conditions and client activity across the period. The second quarter of 2018 trended higher due to generally higher market volatility, increased client activity and higher client deposit margins. Revenue from our funding and liquidity business was impacted by reduced money market opportunities in the first quarter of 2019. During the first half of 2019 our asset services business was impacted by challenging market conditions. The latter half of the period was impacted by lower client activity and lower client deposit margins.
Capital Markets revenue is influenced, to a large extent, by market conditions that impact client activity in our Corporate and Investment Banking and Global Markets businesses, with the first quarter results generally stronger than the remaining quarters. The second quarter of 2018 experienced lower equity originations driven by lower market activity, decreased fixed income trading across all regions, and lower equity trading revenue in the U.S. The decline experienced in the fourth quarter of 2018 largely resulted from lower fixed income trading revenue. Client activity in 2019 was impacted by challenging market conditions resulting in lower investment banking fee revenues experienced across the industry. The impact of challenging market conditions also resulted in lower equity trading revenue in the second half of 2019. The first quarter of 2020 saw more favourable market conditions and increased client activity resulting in higher fixed income trading revenue and M&A activity.
PCL on performing assets has fluctuated over the period as it is impacted by volume growth, changes in credit quality, model changes and macroeconomic conditions. PCL on impaired assets saw lower provisions and higher recoveries across a few sectors for the majority of 2018, although the fourth quarter was impacted by the restructuring of portfolios in Barbados. After relatively benign credit conditions in 2018, we returned to a more normalized level of credit losses towards the end of 2019, though the first quarter of 2020 saw lower provisions on impaired loans in Personal & Commercial Banking and Wealth Management.
PBCAE has fluctuated quarterly as it includes the changes to the fair value of investments backing our policyholder liabilities and business growth, including the impact of group annuity sales, both of which are largely offset in Revenue. PBCAE has also fluctuated due to investment-related experience and claims costs over the period. Since late 2018, PBCAE has been positively impacted by favourable reinsurance contract renegotiations. Actuarial adjustments, which generally occur in the fourth quarter of each year, also impact PBCAE results.
While we continue to focus on efficiency management activities,Non-interest expense trended upwards over the period. Growth mainly reflects higher costs in support of business growth and our ongoing investments in technology and related costs, including digital initiatives, and higher staff-related costs, including variable compensation. The increase in the fourth quarter of 2019 reflected severance and related costs associated with repositioning of our Investor & Treasury Services business.
Our effective income tax rate has fluctuated over the period, mostly due to various levels of tax adjustments and changes in earnings mix. The first quarter of 2019 included a write-down of deferred tax assets resulting from a change in the corporate tax rate in Barbados.
Table of Contents
18 Royal Bank of Canada First Quarter 2020
|
|
| As at | ||||||||
| (Millions of Canadian dollars) | January 31 2020 | October 31 2019 | ||||||
Assets | ||||||||
Cash and due from banks | $ | 34,120 | $ | 26,310 | ||||
Interest-bearing deposits with banks | 31,331 | 38,345 | ||||||
Securities, net of applicable allowance(1) | 266,667 | 249,004 | ||||||
Assets purchased under reverse repurchase agreements and securities borrowed | 324,187 | 306,961 | ||||||
Loans | ||||||||
Retail | 430,841 | 426,086 | ||||||
Wholesale | 202,238 | 195,870 | ||||||
Allowance for loan losses | (3,139 | ) | (3,100 | ) | ||||
Other – Derivatives | 93,982 | 101,560 | ||||||
– Other(2) | 96,077 | 87,899 | ||||||
Total assets | $ | 1,476,304 | $ | 1,428,935 | ||||
Liabilities | ||||||||
Deposits | $ | 902,284 | $ | 886,005 | ||||
Other – Derivatives | 94,611 | 98,543 | ||||||
– Other(2) | 386,079 | 350,947 | ||||||
Subordinated debentures | 9,269 | 9,815 | ||||||
Total liabilities | 1,392,243 | 1,345,310 | ||||||
Equity attributable to shareholders | 83,955 | 83,523 | ||||||
Non-controlling interests | 106 | 102 | ||||||
Total equity | 84,061 | 83,625 | ||||||
Total liabilities and equity | $ | 1,476,304 | $ | 1,428,935 | ||||
| (1) | Securities are comprised of Trading and Investment securities. |
| (2) | Other – Other assets and liabilities include Segregated fund net assets and liabilities, respectively. |
Q1 2020 vs. Q4 2019
Total assets increased $47 billion or 3% from last quarter. Foreign exchange translation increased total assets by $6 billion.
Cash and due from banks was up $8 billion or 30%, primarily due to higher deposits with central banks, reflecting our short-term cash and liquidity management activities.
Interest-bearing deposits with banks decreased $7 billion or 18%, due to lower deposits with central banks, reflecting our cash management and liquidity activities.
Securities, net of applicable allowance, were up $18 billion or 7%, largely due to higher government debt and corporate debt securities, primarily driven by our liquidity management activities. Higher equity trading securities, reflecting favourable market conditions, also contributed to the increase.
Assets purchased under reverse repurchase agreements (reverse repos) and securities borrowed increased $17 billion or 6%, mainly attributable to increased client activities and lower financial netting, partially offset by our liquidity management activities.
Loans (net of Allowance for loan losses) were up $11 billion or 2%, primarily due to volume growth, driven by higher residential mortgages and wholesale loans.
Derivative assets were down $8 billion or 7%, mainly attributable to lower fair values on foreign exchange contracts partially offset by the impact of foreign exchange translation.
Other assets were up $8 billion or 9%, largely due to an increase in premises and equipment as a result of adopting IFRS 16. Higher customers’ liability under acceptances, driven by client demand, also contributed to the increase.
Total liabilities increased $47 billion or 3%. Foreign exchange translation increased total liabilities by $6 billion.
Deposits increased $16 billion or 2%, due to an increase in retail deposits, driven by client activities. Higher issuances of fixed term notes driven by funding requirements also contributed to the increase.
Derivative liabilities were down $4 billion or 4%, primarily attributable to lower fair values on foreign exchange contracts, partially offset by the impact of foreign exchange translation and higher fair values on commodity derivative contracts.
Other liabilities increased $35 billion or 10%, mainly due to higher obligations related to repurchase agreements due to increased client activity and lower financial netting. Higher lease liabilities as a result of adopting IFRS 16 also contributed to the increase.
Off-balance sheet arrangements
|
In the normal course of business, we engage in a variety of financial transactions that, for accounting purposes, are not recorded on our Consolidated Balance Sheets.Off-balance sheet transactions are generally undertaken for risk, capital and funding management purposes which benefit us and our clients. These include transactions with structured entities and may also include the issuance of guarantees. These transactions give rise to, among other risks, varying degrees of market, credit,
Table of Contents
Royal Bank of Canada First Quarter 2020 19
and liquidity and funding risk, which are discussed in the Risk management section of this Q1 2020 Report to Shareholders. Our significantoff-balance sheet transactions include those described on pages 45 to 47 of our 2019 Annual Report.
|
|
Credit risk is the risk of loss associated with an obligor’s potential inability or unwillingness to fulfill its contractual obligations on a timely basis. Credit risk may arise directly from the risk of default of a primary obligor, indirectly from a secondary obligor, through off-balance sheet exposures, contingent credit risk and/or transactional risk.
Our Credit Risk Framework (CRF) and supporting credit policies are designed to clearly define roles and responsibilities, acceptable practices, limits and key controls. There have been no material changes to our CRF as described in our 2019 Annual Report.
Credit risk exposure by portfolio, sector and geography
The following table presents our credit risk exposures under the Basel regulatory defined classes and reflects exposures at default (EAD). The classification of our sectors aligns with our view of credit risk by industry.
| As at | ||||||||||||||||||||||||||||||||
January 31 2020 | October 31 2019 | |||||||||||||||||||||||||||||||
| Credit risk(1) | Counterparty credit risk(2) | |||||||||||||||||||||||||||||||
| On-balance sheet amount | Off-balance sheet amount (3) | Repo-style transactions | Derivatives | Total exposure | Total exposure | |||||||||||||||||||||||||||
| (Millions of Canadian dollars) | Undrawn | Other(4) | ||||||||||||||||||||||||||||||
Retail | ||||||||||||||||||||||||||||||||
Residential secured(5) | $ | 319,702 | $ | 83,450 | $ | – | $ | – | $ | – | $ | 403,152 | $ | 380,872 | ||||||||||||||||||
Qualifying revolving(6) | 26,763 | 64,893 | – | – | – | 91,656 | 100,364 | |||||||||||||||||||||||||
Other retail | 62,431 | 12,853 | 69 | – | – | 75,353 | 75,094 | |||||||||||||||||||||||||
Total retail | $ | 408,896 | $ | 161,196 | $ | 69 | $ | – | $ | – | $ | 570,161 | $ | 556,330 | ||||||||||||||||||
Wholesale | ||||||||||||||||||||||||||||||||
Agriculture | $ | 9,309 | $ | 1,755 | $ | 49 | $ | – | $ | 85 | $ | 11,198 | $ | 10,953 | ||||||||||||||||||
Automotive | 9,948 | 6,742 | 288 | – | 971 | 17,949 | 18,215 | |||||||||||||||||||||||||
Banking | 36,104 | 1,963 | 586 | 46,870 | 20,707 | 106,230 | 112,425 | |||||||||||||||||||||||||
Consumer discretionary | 15,243 | 8,815 | 566 | – | 563 | 25,187 | 25,912 | |||||||||||||||||||||||||
Consumer staples | 5,509 | 6,992 | 516 | – | 1,110 | 14,127 | 15,523 | |||||||||||||||||||||||||
Oil & gas | 7,701 | 10,522 | 1,422 | – | 1,516 | 21,161 | 21,767 | |||||||||||||||||||||||||
Financial services | 28,729 | 20,529 | 2,861 | 121,807 | 19,355 | 193,281 | 188,893 | |||||||||||||||||||||||||
Financing products | 2,886 | 845 | 518 | 165 | 715 | 5,129 | 3,258 | |||||||||||||||||||||||||
Forest products | 1,592 | 677 | 107 | – | 35 | 2,411 | 2,280 | |||||||||||||||||||||||||
Governments | 140,065 | 5,614 | 1,390 | 9,768 | 6,216 | 163,053 | 130,005 | |||||||||||||||||||||||||
Industrial products | 7,778 | 7,751 | 621 | – | 634 | 16,784 | 17,239 | |||||||||||||||||||||||||
Information technology | 6,609 | 5,462 | 244 | 22 | 1,966 | 14,303 | 12,901 | |||||||||||||||||||||||||
Investments | 17,032 | 2,785 | 406 | 11 | 287 | 20,521 | 19,945 | |||||||||||||||||||||||||
Mining & metals | 1,871 | 3,809 | 859 | – | 294 | 6,833 | 7,012 | |||||||||||||||||||||||||
Public works & infrastructure | 1,581 | 1,904 | 367 | – | 211 | 4,063 | 4,096 | |||||||||||||||||||||||||
Real estate & related | 64,739 | 13,048 | 1,329 | – | 970 | 80,086 | 75,652 | |||||||||||||||||||||||||
Other services | 25,501 | 11,814 | 988 | 8 | 1,592 | 39,903 | 40,167 | |||||||||||||||||||||||||
Telecommunication & media | 5,071 | 9,060 | 95 | – | 2,250 | 16,476 | 16,481 | |||||||||||||||||||||||||
Transportation | 5,878 | 5,652 | 1,991 | – | 1,919 | 15,440 | 15,932 | |||||||||||||||||||||||||
Utilities | 8,696 | 16,840 | 4,128 | – | 4,064 | 33,728 | 36,035 | |||||||||||||||||||||||||
Other sectors | 1,506 | 317 | 2 | 27 | 19,927 | 21,779 | 21,973 | |||||||||||||||||||||||||
Total wholesale | $ | 403,348 | $ | 142,896 | $ | 19,333 | $ | 178,678 | $ | 85,387 | $ | 829,642 | $ | 796,664 | ||||||||||||||||||
Total exposure(7) | $ | 812,244 | $ | 304,092 | $ | 19,402 | $ | 178,678 | $ | 85,387 | $ | 1,399,803 | $ | 1,352,994 | ||||||||||||||||||
By geography(8) | ||||||||||||||||||||||||||||||||
Canada | $ | 559,439 | $ | 232,987 | $ | 10,027 | $ | 67,920 | $ | 41,801 | $ | 912,174 | $ | 888,839 | ||||||||||||||||||
U.S. | 165,668 | 52,967 | 8,099 | 53,249 | 17,428 | 297,411 | 289,330 | |||||||||||||||||||||||||
Europe | 49,760 | 15,496 | 1,140 | 45,730 | 21,250 | 133,376 | 123,891 | |||||||||||||||||||||||||
Other International | 37,377 | 2,642 | 136 | 11,779 | 4,908 | 56,842 | 50,934 | |||||||||||||||||||||||||
Total exposure(7) | $ | 812,244 | $ | 304,092 | $ | 19,402 | $ | 178,678 | $ | 85,387 | $ | 1,399,803 | $ | 1,352,994 | ||||||||||||||||||
| (1) | EAD for standardized exposures are reported net of allowance for impaired assets and EAD for internal ratings based exposures are reported gross of all allowance for credit losses and partial write-offs as per regulatory definitions. |
| (2) | Counterparty credit risk EAD reflects exposure amounts after netting. Collateral is included in EAD for repo-style transactions to the extent allowed by regulatory guidelines. |
| (3) | EAD for undrawn credit commitments and otheroff-balance sheet amounts are reported after the application of credit conversion factors. |
| (4) | Includes otheroff-balance sheet exposures such as letters of credit and guarantees. |
| (5) | Includes residential mortgages and home equity lines of credit. |
| (6) | Includes credit cards, unsecured lines of credit and overdraft protection products. |
| (7) | Excludes securitization, banking book equities and other assets not subject to the standardized or internal ratings based approach. |
| (8) | Geographic profile is based on the country of residence of the borrower. |
Table of Contents
20 Royal Bank of Canada First Quarter 2020
Q1 2020 vs. Q4 2019
Total credit risk exposure increased $47 billion or 3% from the prior quarter, largely due to an increase in securities and volume growth in loans and acceptances.
Retail exposure increased $14 billion or 2%, driven by volume growth in the residential secured portfolio, partially offset by a decrease in the qualifying revolving portfolio.
Wholesale exposure increased $33 billion or 4%, primarily due to an increase in securities, higher repo-style transactions and derivatives.
The geographic mix of our credit risk exposure remained largely consistent to the prior quarter. Our exposure in Canada, the U.S., Europe and Other International was 65%, 21%, 10% and 4%, respectively (October 31, 2019 – 66%, 21%, 9% and 4%, respectively).
Net European exposure by country, asset type and client type(1), (2)
|
| |||||||||||||||||||||||||||||||||||||||||
| As at | ||||||||||||||||||||||||||||||||||||||||||
January 31 2020 | October 31 2019 | |||||||||||||||||||||||||||||||||||||||||
| Asset type | Client type | |||||||||||||||||||||||||||||||||||||||||
| (Millions of Canadian dollars) | Loans Outstanding | Securities (3) | Repo-style transactions | Derivatives | Financials | Sovereign | Corporate | Total | Total | |||||||||||||||||||||||||||||||||
U.K. | $ | 9,183 | $ | 15,131 | $ | 402 | $ | 4,313 | $ | 13,181 | $ | 6,830 | $ | 9,018 | $ | 29,029 | $ | 23,487 | ||||||||||||||||||||||||
Germany | 2,273 | 5,967 | 3 | 349 | 4,491 | 1,338 | 2,763 | 8,592 | 7,227 | |||||||||||||||||||||||||||||||||
France | 1,097 | 9,225 | 33 | 204 | 1,400 | 8,340 | 819 | 10,559 | 9,211 | |||||||||||||||||||||||||||||||||
Total U.K., Germany, France | $ | 12,553 | $ | 30,323 | $ | 438 | $ | 4,866 | $ | 19,072 | $ | 16,508 | $ | 12,600 | $ | 48,180 | $ | 39,925 | ||||||||||||||||||||||||
Ireland | $ | 775 | $ | 50 | $ | 492 | $ | 51 | $ | 759 | $ | 1 | $ | 608 | $ | 1,368 | $ | 1,467 | ||||||||||||||||||||||||
Italy | 106 | 384 | – | 7 | 68 | 353 | 76 | 497 | 821 | |||||||||||||||||||||||||||||||||
Portugal | – | 13 | 35 | – | 48 | – | – | 48 | 67 | |||||||||||||||||||||||||||||||||
Spain | 305 | 174 | 1 | 45 | 156 | – | 369 | 525 | 520 | |||||||||||||||||||||||||||||||||
Total peripheral | $ | 1,186 | $ | 621 | $ | 528 | $ | 103 | $ | 1,031 | $ | 354 | $ | 1,053 | $ | 2,438 | $ | 2,875 | ||||||||||||||||||||||||
Luxembourg | $ | 2,702 | $ | 8,004 | $ | 94 | $ | 44 | $ | 1,703 | $ | 7,520 | $ | 1,621 | $ | 10,844 | $ | 11,723 | ||||||||||||||||||||||||
Netherlands | 1,191 | 1,010 | 49 | 400 | 981 | – | 1,669 | 2,650 | 2,250 | |||||||||||||||||||||||||||||||||
Norway | 133 | 1,985 | 27 | 40 | 1,872 | 119 | 194 | 2,185 | 2,553 | |||||||||||||||||||||||||||||||||
Sweden | 281 | 2,714 | 17 | 36 | 1,593 | 1,100 | 355 | 3,048 | 2,225 | |||||||||||||||||||||||||||||||||
Switzerland | 990 | 3,083 | 123 | 185 | 719 | 2,701 | 961 | 4,381 | 5,308 | |||||||||||||||||||||||||||||||||
Other | 1,809 | 2,331 | 196 | 162 | 1,567 | 1,312 | 1,619 | 4,498 | 4,818 | |||||||||||||||||||||||||||||||||
Total other Europe | $ | 7,106 | $ | 19,127 | $ | 506 | $ | 867 | $ | 8,435 | $ | 12,752 | $ | 6,419 | $ | 27,606 | $ | 28,877 | ||||||||||||||||||||||||
Net exposure to Europe(4), (5) | $ | 20,845 | $ | 50,071 | $ | 1,472 | $ | 5,836 | $ | 28,538 | $ | 29,614 | $ | 20,072 | $ | 78,224 | $ | 71,677 | ||||||||||||||||||||||||
| (1) | Geographic profile is based on country of risk, which reflects our assessment of the geographic risk associated with a given exposure. Typically, this is the residence of the borrower. |
| (2) | Exposures are calculated on a fair value basis and net of collateral, which includes $157.6 billion against repo-style transactions (October 31, 2019 – $120.5 billion) and $10.2 billion against derivatives (October 31, 2019 – $11.4 billion). |
| (3) | Securities include $8.7 billion of trading securities (October 31, 2019 – $9.4 billion), $27.6 billion of deposits (October 31, 2019 – $22.5 billion), and $13.7 billion of debt securities carried at fair value through other comprehensive income (FVOCI) (October 31, 2019 – $12.9 billion). |
| (4) | Excludes $2.5 billion (October 31, 2019 – $1.5 billion) of exposures to supranational agencies, predominantly in Luxembourg. |
| (5) | Reflects $2.6 billion of mitigation through credit default swaps, which are largely used to hedge single name exposures and market risk (October 31, 2019 – $1.0 billion). |
Q1 2020 vs. Q4 2019
Net credit risk exposure to Europe increased $6.5 billion from last quarter, mainly driven by higher deposits with central banks, largely in the United Kingdom and France.
Our European corporate loan book is managed on a global basis with underwriting standards reflecting the same approach to the use of our balance sheet as we have applied in both Canada and the U.S. PCL on loans during the quarter was $23 million. The gross impaired loans ratio of this loan book was 61 bps, up 17 bps from last quarter, mainly in the oil & gas sector.
Table of Contents
Royal Bank of Canada First Quarter 2020 21
Residential mortgages and home equity lines of credit (insured vs. uninsured)
Residential mortgages and home equity lines of credit are secured by residential properties. The following table presents a breakdown by geographic region.
| As at January 31, 2020 | ||||||||||||||||||||||||||||||
(Millions of Canadian dollars, except percentage amounts) | Residential mortgages | Home equity lines of credit | ||||||||||||||||||||||||||||
| Insured (1) | Uninsured | Total | Total | |||||||||||||||||||||||||||
Region(2) | ||||||||||||||||||||||||||||||
Canada | ||||||||||||||||||||||||||||||
Atlantic provinces | $ | 7,658 | 51 | % | $ | 7,352 | 49 | % | $ | 15,010 | $ | 1,795 | ||||||||||||||||||
Quebec | 12,120 | 35 | 22,894 | 65 | 35,014 | 3,387 | ||||||||||||||||||||||||
Ontario | 35,339 | 27 | 97,354 | 73 | 132,693 | 16,173 | ||||||||||||||||||||||||
Alberta | 20,474 | 53 | 18,452 | 47 | 38,926 | 6,152 | ||||||||||||||||||||||||
Saskatchewan and Manitoba | 8,842 | 49 | 9,335 | 51 | 18,177 | 2,286 | ||||||||||||||||||||||||
B.C. and territories | 14,370 | 27 | 38,972 | 73 | 53,342 | 8,018 | ||||||||||||||||||||||||
Total Canada(3) | $ | 98,803 | 34 | % | $ | 194,359 | 66 | % | $ | 293,162 | $ | 37,811 | ||||||||||||||||||
U.S.(4) | – | – | 18,098 | 100 | 18,098 | 1,644 | ||||||||||||||||||||||||
Other International(4) | 6 | – | 2,938 | 100 | 2,944 | 1,366 | ||||||||||||||||||||||||
Total International | $ | 6 | – | % | $ | 21,036 | 100 | % | $ | 21,042 | $ | 3,010 | ||||||||||||||||||
Total | $ | 98,809 | 31 | % | $ | 215,395 | 69 | % | $ | 314,204 | $ | 40,821 | ||||||||||||||||||
| As at October 31, 2019 | ||||||||||||||||||||||||||||||
(Millions of Canadian dollars, except percentage amounts) | Residential mortgages | Home equity lines of credit | ||||||||||||||||||||||||||||
| Insured (1) | Uninsured | Total | Total | |||||||||||||||||||||||||||
Region(2) | ||||||||||||||||||||||||||||||
Canada | ||||||||||||||||||||||||||||||
Atlantic provinces | $ | 7,715 | 52 | % | $ | 7,169 | 48 | % | $ | 14,884 | $ | 1,838 | ||||||||||||||||||
Quebec | 12,385 | 36 | 22,091 | 64 | 34,476 | 3,512 | ||||||||||||||||||||||||
Ontario | 36,195 | 28 | 92,947 | 72 | 129,142 | 16,585 | ||||||||||||||||||||||||
Alberta | 20,688 | 53 | 18,143 | 47 | 38,831 | 6,324 | ||||||||||||||||||||||||
Saskatchewan and Manitoba | 8,951 | 49 | 9,238 | 51 | 18,189 | 2,363 | ||||||||||||||||||||||||
B.C. and territories | 14,711 | 28 | 37,534 | 72 | 52,245 | 8,267 | ||||||||||||||||||||||||
Total Canada(3) | $ | 100,645 | 35 | % | $ | 187,122 | 65 | % | $ | 287,767 | �� | $ | 38,889 | |||||||||||||||||
U.S.(4) | 1 | – | 17,011 | 100 | 17,012 | 1,652 | ||||||||||||||||||||||||
Other International(4) | 5 | – | 3,307 | 100 | 3,312 | 1,373 | ||||||||||||||||||||||||
Total International | $ | 6 | – | % | $ | 20,318 | 100 | % | $ | 20,324 | $ | 3,025 | ||||||||||||||||||
Total | $ | 100,651 | 33 | % | $ | 207,440 | 67 | % | $ | 308,091 | $ | 41,914 | ||||||||||||||||||
| (1) | Insured residential mortgages are mortgages whereby our exposure to default is mitigated by insurance through the Canada Mortgage and Housing Corporation (CMHC) or other private mortgage default insurers. |
| (2) | Region is based upon address of the property mortgaged. The Atlantic provinces are comprised of Newfoundland and Labrador, Prince Edward Island, Nova Scotia and New Brunswick, and B.C. and territories are comprised of British Columbia, Nunavut, Northwest Territories and Yukon. |
| (3) | Total consolidated residential mortgages in Canada of $293 billion (October 31, 2019 – $288 billion) was largely comprised of $268 billion (October 31, 2019 – $263 billion) of residential mortgages and $7 billion (October 31, 2019 – $7 billion) of mortgages with commercial clients, of which $4 billion (October 31, 2019 – $4 billion) are insured mortgages, both in Canadian Banking, and $18 billion (October 31, 2019 – $18 billion) of residential mortgages in Capital Markets held for securitization purposes. |
| (4) | Home equity lines of credit include term loans collateralized by residential mortgages. |
Home equity lines of credit are uninsured and reported within the personal loan category. As at January 31, 2020, home equity lines of credit in Canadian Banking were $38 billion (October 31, 2019 – $39 billion).
Table of Contents
22 Royal Bank of Canada First Quarter 2020
Residential mortgages portfolio by amortization period
The following table provides a summary of the percentage of residential mortgages that fall within the remaining amortization periods based upon current customer payment amounts, which incorporate payments larger than the minimum contractual amount and/or higher frequency of payments.
| As at | ||||||||||||||||||||||||||
January 31 2020 | October 31 2019 | |||||||||||||||||||||||||
| Canada | U.S. and other International | Total | Canada | U.S. and other International | Total | |||||||||||||||||||||
Amortization period | ||||||||||||||||||||||||||
£ 25 years | 72 | % | 36 | % | 69 | % | 72 | % | 38 | % | 70 | % | ||||||||||||||
> 25 years£ 30 years | 24 | 64 | 27 | 24 | 62 | 26 | ||||||||||||||||||||
> 30 years£ 35 years | 3 | – | 3 | 3 | – | 3 | ||||||||||||||||||||
> 35 years | 1 | – | 1 | 1 | – | 1 | ||||||||||||||||||||
Total | 100 | % | 100 | % | 100 | % | 100 | % | 100 | % | 100 | % | ||||||||||||||
Averageloan-to-value (LTV) ratios
The following table provides a summary of our average LTV ratio for newly originated and acquired uninsured residential mortgages and Homeline products by geographic region.
| For the three months ended | ||||||||||||||||||
January 31 2020 | October 31 2019 | |||||||||||||||||
| Uninsured | Uninsured | |||||||||||||||||
| Residential mortgages (1) | Homeline products (2) | Residential mortgages (1) | Homeline products (2) | |||||||||||||||
Region(3) | ||||||||||||||||||
Atlantic provinces | 74 | % | 74 | % | 74 | % | 74 | % | ||||||||||
Quebec | 72 | 73 | 72 | 73 | ||||||||||||||
Ontario | 71 | 67 | 71 | 68 | ||||||||||||||
Alberta | 72 | 71 | 73 | 72 | ||||||||||||||
Saskatchewan and Manitoba | 74 | 75 | 74 | 75 | ||||||||||||||
B.C. and territories | 68 | 65 | 69 | 65 | ||||||||||||||
U.S. | 73 | n.m. | 74 | n.m. | ||||||||||||||
Other International | 71 | n.m. | 71 | n.m. | ||||||||||||||
Average of newly originated and acquired for the period(4) (5) | 71 | % | 68 | % | 71 | % | 69 | % | ||||||||||
Total Canadian Banking residential mortgages portfolio (6) | 58 | % | 50 | % | 57 | % | 50 | % | ||||||||||
| (1) | Residential mortgages exclude residential mortgages within the Homeline products. |
| (2) | Homeline products are comprised of both residential mortgages and home equity lines of credit. |
| (3) | Region is based upon address of the property mortgaged. The Atlantic provinces are comprised of Newfoundland and Labrador, Prince Edward Island, Nova Scotia and New Brunswick, and B.C. and territories are comprised of British Columbia, Nunavut, Northwest Territories and Yukon. |
| (4) | The average LTV ratio for newly originated and acquired uninsured residential mortgages and Homeline products is calculated on a weighted basis by mortgage amounts at origination. |
| (5) | For newly originated mortgages and Homeline products, LTV is calculated based on the total facility amount for the residential mortgage and Homeline product divided by the value of the related residential property. |
| (6) | Weighted by mortgage balances and adjusted for property values based on the Teranet – National Bank National Composite House Price Index. |
| n.m. | not meaningful |
Table of Contents
Royal Bank of Canada First Quarter 2020 23
Credit quality performance
The following credit quality performance tables and analysis provide information on loans, which represents loans, acceptances and commitments, and other financial assets.
Provision for credit losses
| For the three months ended | ||||||||||||
| (Millions of Canadian dollars, except percentage amounts) | January 31 2020 | October 31 2019 | January 31 2019 | |||||||||
Personal & Commercial Banking | $ | 343 | $ | 393 | $ | 347 | ||||||
Wealth Management | (2 | ) | 34 | 26 | ||||||||
Capital Markets | 80 | 78 | 143 | |||||||||
Corporate Support and other | – | – | – | |||||||||
PCL – Loans | $ | 421 | $ | 505 | $ | 516 | ||||||
PCL – Other financial assets | (2 | ) | (6 | ) | (2 | ) | ||||||
Total PCL | $ | 419 | $ | 499 | $ | 514 | ||||||
PCL on loans is comprised of: | ||||||||||||
Retail | $ | 34 | $ | 47 | $ | 33 | ||||||
Wholesale | 49 | 24 | 60 | |||||||||
PCL on performing loans | $ | 83 | $ | 71 | $ | 93 | ||||||
Retail | $ | 271 | $ | 290 | $ | 269 | ||||||
Wholesale | 67 | 144 | 154 | |||||||||
PCL on impaired loans | $ | 338 | $ | 434 | $ | 423 | ||||||
PCL – Loans | $ | 421 | $ | 505 | $ | 516 | ||||||
PCL on loans as a % of average net loans and acceptances | 0.26% | 0.32% | 0.34% | |||||||||
PCL on impaired loans as a % of average net loans and acceptances | 0.21% | 0.27% | 0.28% | |||||||||
Additional information by geography(1) | ||||||||||||
Canada | ||||||||||||
Residential mortgages | $ | 10 | $ | 9 | $ | 10 | ||||||
Personal | 129 | 133 | 121 | |||||||||
Credit cards | 137 | 139 | 116 | |||||||||
Small business | 12 | 11 | 5 | |||||||||
Retail | 288 | 292 | 252 | |||||||||
Wholesale | 6 | 76 | 41 | |||||||||
PCL on impaired loans | $ | 294 | $ | 368 | $ | 293 | ||||||
U.S. | ||||||||||||
Retail | $ | (2 | ) | $ | 5 | $ | 2 | |||||
Wholesale | 55 | 49 | 110 | |||||||||
PCL on impaired loans | $ | 53 | $ | 54 | $ | 112 | ||||||
Other International | ||||||||||||
Retail | $ | (15 | ) | $ | (7 | ) | $ | 15 | ||||
Wholesale | 6 | 19 | 3 | |||||||||
PCL on impaired loans | $ | (9 | ) | $ | 12 | $ | 18 | |||||
PCL on impaired loans | $ | 338 | $ | 434 | $ | 423 | ||||||
| (1) | Geographic information is based on residence of borrower. |
Q1 2020 vs. Q1 2019
Total PCL was $419 million. PCL on loans of $421 million decreased $95 million, or 18% from the prior year, primarily due to lower provisions in Capital Markets and Wealth Management. The PCL on loans ratio of 26 bps decreased 8 bps.
PCL on performing loans of $83 million decreased $10 million, reflecting lower provisions in Capital Markets and Wealth Management, largely offset by higher provisions in Personal & Commercial Banking.
PCL on impaired loans of $338 million decreased $85 million, due to lower provisions in Capital Markets, Personal & Commercial Banking and Wealth Management.
PCL on loans in Personal & Commercial Banking decreased $4 million or 1%, reflecting lower provisions on impaired loans in our Caribbean Banking and Canadian Banking commercial portfolios, partially offset by higher provisions on impaired loans in our Canadian Banking retail portfolios. This was mainly offset by higher provisions on performing loans, largely due to unfavourable changes in credit quality, mainly in our Canadian Banking portfolios.
PCL on loans in Wealth Management decreased $28 million, primarily in U.S. Wealth Management (including City National), reflecting lower provisions on performing loans due to unfavourable macroeconomic factors in the prior year. Lower provisions on impaired loans also contributed to the decrease, mainly due to a provision taken in the consumer discretionary sector in the prior year and higher recoveries in the current quarter.
PCL on loans in Capital Markets decreased $63 million or 44%, largely driven by lower provisions on impaired loans mainly due to a provision taken in the utilities sector in the prior year, partially offset by provisions on impaired loans taken in
Table of Contents
24 Royal Bank of Canada First Quarter 2020
the current year, mainly in the oil & gas sector. Lower provisions on performing loans also contributed to the decrease, as the current year reflected a lower impact from unfavourable macroeconomic factors compared to the prior year.
Q1 2020 vs. Q4 2019
PCL on loans of $421 million decreased $84 million, or 17% from the prior quarter, due to lower provisions in Personal & Commercial Banking and Wealth Management. The PCL on loans ratio decreased 6 bps.
PCL on performing loans of $83 million increased $12 million, reflecting higher provisions in Personal & Commercial Banking.
PCL on impaired loans of $338 million decreased $96 million, reflecting lower provisions in Personal & Commercial Banking and Wealth Management.
PCL on loans in Personal & Commercial Banking decreased $50 million or 13%, largely reflecting lower provisions on impaired loans in our Canadian Banking commercial and Caribbean Banking portfolios, partially offset by higher provisions on performing loans in Canadian Banking. The increase in provisions on performing loans in Canadian Banking was driven by unfavourable changes in macroeconomic factors and the impact of a favourable model update in the prior quarter, partially offset by lower unfavourable changes in credit quality.
PCL on loans in Wealth Management decreased $36 million, reflecting lower provisions on impaired loans in U.S. Wealth Management (including City National), mainly due to provisions taken in the consumer discretionary sector in the prior quarter and higher recoveries in the current quarter.
Gross impaired loans
| As at | ||||||||||||
(Millions of Canadian dollars, except percentage amounts) | January 31 2020 | October 31 2019 | January 31 2019 | |||||||||
Personal & Commercial Banking | $ | 1,689 | $ | 1,712 | $ | 1,653 | ||||||
Wealth Management | 344 | 266 | 223 | |||||||||
Capital Markets | 903 | 998 | 906 | |||||||||
Corporate Support and other | – | – | – | |||||||||
Total GIL | $ | 2,936 | $ | 2,976 | $ | 2,782 | ||||||
Canada(1) | ||||||||||||
Retail | $ | 816 | $ | 788 | $ | 749 | ||||||
Wholesale | 709 | 678 | 407 | |||||||||
GIL | 1,525 | 1,466 | 1,156 | |||||||||
U.S.(1) | ||||||||||||
Retail | $ | 31 | $ | 36 | $ | 30 | ||||||
Wholesale | 793 | 869 | 949 | |||||||||
GIL | 824 | 905 | 979 | |||||||||
Other International(1) | ||||||||||||
Retail | $ | 235 | $ | 272 | $ | 331 | ||||||
Wholesale | 352 | 333 | 316 | |||||||||
GIL | 587 | 605 | 647 | |||||||||
Total GIL | $ | 2,936 | $ | 2,976 | $ | 2,782 | ||||||
Impaired loans, beginning balance | $ | 2,976 | $ | 2,990 | $ | 2,183 | ||||||
Classified as impaired during the period (new impaired)(2) | 713 | 768 | 1,133 | |||||||||
Net repayments(2) | (304 | ) | (206 | ) | (99 | ) | ||||||
Amounts written off | (399 | ) | (461 | ) | (377 | ) | ||||||
Other(2) (3) | (50 | ) | (115 | ) | (58 | ) | ||||||
Impaired loans, balance at end of period | $ | 2,936 | $ | 2,976 | $ | 2,782 | ||||||
GIL as a % of related loans and acceptances | ||||||||||||
Total GIL as a % of related loans and acceptances | 0.45% | 0.46% | 0.46% | |||||||||
Personal & Commercial Banking | 0.36% | 0.37% | 0.37% | |||||||||
Canadian Banking | 0.29% | 0.29% | 0.26% | |||||||||
Caribbean Banking | 4.46% | 5.05% | 6.54% | |||||||||
Wealth Management | 0.48% | 0.39% | 0.37% | |||||||||
Capital Markets | 0.89% | 1.02% | 0.90% | |||||||||
| (1) | Geographic information is based on residence of the borrower. |
| (2) | Certain GIL movements for Canadian Banking retail and wholesale portfolios are generally allocated to new impaired, as return to performing status, Net repayments, sold, and foreign exchange translation and other movements amounts are not reasonably determinable. Certain GIL movements for Caribbean Banking retail and wholesale portfolios are generally allocated to Net repayments and new impaired, as return to performing status, sold, and foreign exchange translation and other movements amounts are not reasonably determinable. |
| (3) | Includes return to performing status during the period, recoveries of loans and advances previously written off, sold, and foreign exchange translation and other movements. |
Q1 2020 vs. Q1 2019
Total GIL of $2,936 million increased $154 million or 6% from the prior year, reflecting higher impaired loans in Wealth Management and Personal & Commercial Banking. The total GIL ratio of 45 bps improved 1 bp.
GIL in Personal & Commercial Banking increased $36 million or 2%, due to higher impaired loans in our Canadian Banking commercial and retail portfolios, partially offset by lower impaired loans in our Caribbean Banking portfolios.
GIL in Wealth Management increased $121 million or 54%, primarily reflecting higher impaired loans in U.S. Wealth Management (including City National), mainly in the consumer staples and consumer discretionary sectors.
Table of Contents
Royal Bank of Canada First Quarter 2020 25
Q1 2020 vs. Q4 2019
Total GIL of $2,936 million decreased $40 million or 1% from the prior quarter, and the total GIL ratio of 45 bps improved 1 bp, reflecting lower impaired loans in Capital Markets and Personal & Commercial Banking, partially offset by higher impaired loans in Wealth Management.
GIL in Personal & Commercial Banking decreased $23 million or 1%, due to lower impaired loans in Caribbean Banking, partially offset by higher impaired loans in our Canadian Banking portfolios.
GIL in Wealth Management increased $78 million or 29%, primarily reflecting higher impaired loans in U.S. Wealth Management (including City National), mainly in the consumer staples and consumer discretionary sectors.
GIL in Capital Markets decreased $95 million or 10%, mainly due to repayments, largely in the oil and gas sector, partially offset by new impaired loans, across a few sectors.
Allowance for credit losses (ACL)
| As at | ||||||||||||
(Millions of Canadian dollars) | January 31 2020 | October 31 2019 | January 31 2019 | |||||||||
Personal & Commercial Banking | $ | 2,714 | $ | 2,710 | $ | 2,604 | ||||||
Wealth Management | 254 | 252 | 202 | |||||||||
Capital Markets | 501 | 455 | 464 | |||||||||
Corporate Support and other | 2 | 2 | 3 | |||||||||
ACL on loans | $ | 3,471 | $ | 3,419 | $ | 3,273 | ||||||
ACL on other financial assets | 43 | 45 | 69 | |||||||||
Total ACL | $ | 3,514 | $ | 3,464 | $ | 3,342 | ||||||
ACL on loans is comprised of: | ||||||||||||
Retail | $ | 1,910 | $ | 1,886 | $ | 1,785 | ||||||
Wholesale | 746 | 701 | 693 | |||||||||
ACL on performing loans | $ | 2,656 | $ | 2,587 | $ | 2,478 | ||||||
ACL on impaired loans | 815 | 832 | 795 | |||||||||
Additional information by geography(1) | ||||||||||||
Canada | ||||||||||||
Retail | $ | 200 | $ | 187 | $ | 176 | ||||||
Wholesale | 153 | 172 | 111 | |||||||||
ACL on impaired loans | $ | 353 | $ | 359 | $ | 287 | ||||||
U.S. | ||||||||||||
Retail | $ | 2 | $ | 1 | $ | 2 | ||||||
Wholesale | 159 | 141 | 226 | |||||||||
ACL on impaired loans | $ | 161 | $ | 142 | $ | 228 | ||||||
Other International | ||||||||||||
Retail | $ | 129 | $ | 156 | $ | 169 | ||||||
Wholesale | 172 | 175 | 111 | |||||||||
ACL on impaired loans | $ | 301 | $ | 331 | $ | 280 | ||||||
ACL on impaired loans | $ | 815 | $ | 832 | $ | 795 | ||||||
| (1) | Geographic information is based on residence of the borrower. |
Q1 2020 vs. Q1 2019
Total ACL of $3,514 million increased $172 million or 5% from the prior year, largely reflecting an increase of $198 million in ACL on loans.
ACL on performing loans of $2,656 million increased $178 million from the prior year, largely reflecting higher ACL in Personal & Commercial Banking and Wealth Management, mainly driven by volume growth and unfavourable changes in credit quality, partially offset by favourable changes in macroeconomic factors.
ACL on impaired loans of $815 million increased $20 million from the prior year, due to higher ACL in Wealth Management and Capital Markets, partially offset by lower ACL in Personal and Commercial Banking.
Q1 2020 vs. Q4 2019
Total ACL of $3,514 million increased $50 million or 1% from the prior quarter, reflecting an increase of $52 million in ACL on loans.
ACL on performing loans of $2,656 million increased $69 million from the prior quarter, reflecting higher ACL in Personal & Commercial Banking and Capital Markets, mainly driven by volume growth and unfavourable changes in macroeconomic factors.
ACL on impaired loans of $815 million decreased $17 million from the prior quarter, primarily due to lower ACL in Personal & Commercial Banking, partially offset by higher ACL in Capital Markets.
For further details, refer to Note 5 of our Condensed Financial Statements.
Table of Contents
26 Royal Bank of Canada First Quarter 2020
|
Market risk is defined to be the impact of market prices upon our financial condition. This includes potential gains or losses due to changes in market determined variables such as interest rates, credit spreads, equity prices, commodity prices, foreign exchange rates and implied volatilities. There have been no material changes to our Market Risk Framework from the framework described in our 2019 Annual Report. We continue to manage the controls and governance procedures that ensure that our market risk exposure is consistent with risk appetite constraints set by the Board of Directors. These controls include limits on probabilistic measures of potential loss in trading positions, such asValue-at-Risk (VaR) and StressedValue-at-Risk (SVaR).
Market risk controls are also in place to manage structural interest rate risk (SIRR) arising from traditional banking products. Factors contributing to SIRR include the mismatch between future asset and liability repricing dates, relative changes in asset and liability rates, and product features that could affect the expected timing of cash flows, such as options topre-pay loans or redeem term deposits prior to contractual maturity. To monitor and control SIRR, we assess two primary financial metrics, Net Interest Income (NII) risk and Economic Value of Equity (EVE) risk, under a range of market shocks and scenarios. For further details of our approach to the management of market risk, refer to the Market risk section of our 2019 Annual Report. There has been no material change to the SIRR measurement methodology, controls, or limits from those described in our 2019 Annual Report.
Market risk measures – FVTPL positions
VaR and SVaR
The following table presents our Market risk VaR and Market risk SVaR figures.
| January 31, 2020 | October 31, 2019 | January 31, 2019 | ||||||||||||||||||||||||||||||||||
As at | For the three months ended | As at | For the three months ended | As at | For the three months ended | |||||||||||||||||||||||||||||||
| (Millions of Canadian dollars) | Average | High | Low | Average | Average | |||||||||||||||||||||||||||||||
Equity | $ | 22 | $ | 20 | $ | 33 | $ | 14 | $ | 22 | $ | 21 | $ | 20 | $ | 22 | ||||||||||||||||||||
Foreign exchange | 3 | 2 | 4 | 1 | 3 | 3 | 4 | 6 | ||||||||||||||||||||||||||||
Commodities | 1 | 2 | 3 | 1 | 2 | 2 | 2 | 3 | ||||||||||||||||||||||||||||
Interest rate(1) | 13 | 13 | 19 | 11 | 13 | 15 | 14 | 16 | ||||||||||||||||||||||||||||
Credit specific(2) | 6 | 5 | 6 | 4 | 5 | 5 | 5 | 5 | ||||||||||||||||||||||||||||
Diversification(3) | (18 | ) | (17 | ) | n.m. | n.m. | (17 | ) | (17 | ) | (15 | ) | (18 | ) | ||||||||||||||||||||||
Market risk VaR | $ | 27 | $ | 25 | $ | 35 | $ | 18 | $ | 28 | $ | 29 | $ | 30 | $ | 34 | ||||||||||||||||||||
Market risk Stressed VaR | $ | 95 | $ | 84 | $ | 105 | $ | 72 | $ | 85 | $ | 100 | $ | 113 | $ | 123 | ||||||||||||||||||||
| (1) | General credit spread risk and funding spread risk associated with uncollateralized derivatives are included under interest rate VaR. |
| (2) | Credit specific risk captures issuer-specific credit spread volatility. |
| (3) | Market risk VaR is less than the sum of the individual risk factor VaR results due to portfolio diversification. |
| n.m. | not meaningful |
Q1 2020 vs. Q1 2019
Average market risk VaR of $25 million decreased $9 million and average SVaR of $84 million decreased $39 million from the prior year, mainly due to the impact of lower overall market volatility and a reduction in average inventory levels in our fixed income portfolios in the current quarter.
Q1 2020 vs. Q4 2019
Average market risk VaR of $25 million decreased $4 million and average SVaR of $84 million decreased $16 million from the prior quarter, mainly driven by lower overall market volatility and lower average inventory levels in our fixed income portfolios in the current quarter.
Table of Contents
Royal Bank of Canada First Quarter 2020 27
The following chart displays a bar graph of our daily trading profit and loss and a line graph of our daily market risk VaR. We incurred no net trading losses in the three months ended January 31, 2020 and 1 day of losses totaling $0.4 million in the three months ended October 31, 2019, which did not exceed VaR on that day.
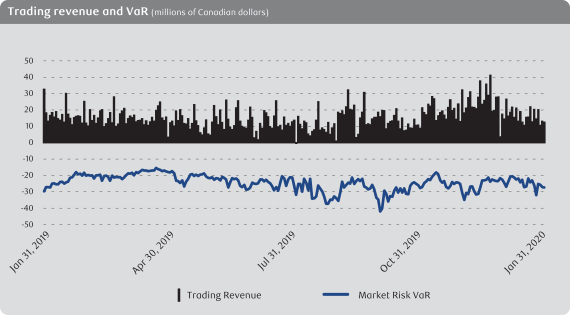
Market risk measures for assets and liabilities of RBC Insurance®
We offer a range of insurance products to clients and hold investments to meet the future obligations to policyholders. The investments which support actuarial liabilities are predominantly fixed income assets designated as FVTPL. Consequently, changes in the fair values of these assets are recorded in the Consolidated Statements of Income and are largely offset by changes in the fair value of the actuarial liabilities, the impact of which is reflected in Insurance policyholder benefits, claims and acquisition expense. As at January 31, 2020, we held assets in support of $12.3 billion liabilities with respect to insurance obligations (October 31, 2019 – $11.4 billion).
Market risk measures – Structural Interest Rate Sensitivities
The following table shows the potentialbefore-tax impact of an immediate and sustained 100 bps increase or decrease
in interest rates on projected12-month NII and EVE for our structural balance sheet, assuming no subsequent hedging. Rate
floors are applied within the declining rates scenarios, with floor levels set based on rate changes experienced globally. Interest rate risk measures are based upon interest rate exposures at a specific time and continuously change as a result of business activities and management actions.
January 31 2020 | October 31 2019 | January 31 2019 | ||||||||||||||||||||||||||||||||||||||||||||
| EVE risk | NII risk(1) | |||||||||||||||||||||||||||||||||||||||||||||
| (Millions of Canadian dollars) | Canadian dollar impact | U.S. dollar impact (2) | Total | Canadian dollar impact | U.S. dollar impact (2) | Total | EVE risk | NII risk (1) | EVE risk | NII risk (1) | ||||||||||||||||||||||||||||||||||||
Before-tax impact of: | ||||||||||||||||||||||||||||||||||||||||||||||
100 bps increase in rates | $ | (1,334 | ) | $ | (230 | ) | $ | (1,564 | ) | $ | 377 | $ | 91 | $ | 468 | $ | (1,356 | ) | $ | 479 | $ | (1,019 | ) | $ | 487 | |||||||||||||||||||||
100 bps decrease in rates | 1,243 | (100 | ) | 1,143 | (508 | ) | (119 | ) | (627 | ) | 920 | (637 | ) | 549 | (617 | ) | ||||||||||||||||||||||||||||||
| (1) | Represents the12-month NII exposure to an instantaneous and sustained shift in interest rates. |
| (2) | Represents the impact on the SIRR portfolios held in our City National and U.S. banking operations. |
As at January 31, 2020, an immediate and sustained-100 bps shock would have had a negative impact to our NII of $627 million, down from $637 million last quarter. An immediate and sustained +100 bps shock at the end of January 31, 2020 would have had a negative impact to the bank’s EVE of $1,564 million, up from $1,356 million reported last quarter. The quarter-over-quarter change in NII sensitivity was stable, while the quarter-over-quarter change in EVE sensitivity is mainly attributed to growth in the structural balance sheet. During the first quarter of 2020, SIRR NII and EVE risks remained well within approved limits.
Market risk measures for other materialnon-trading portfolios
Investment securities carried at FVOCI
We held $77.5 billion of investment securities carried at FVOCI as at January 31, 2020, compared to $57.7 billion in the prior quarter. We hold debt securities carried at FVOCI primarily as investments, as well as to manage liquidity risk and hedge interest rate risk in ournon-trading banking balance sheet. As at January 31, 2020, our portfolio of investment securities carried at FVOCI is interest rate sensitive and would impact OCI by apre-tax change in value of $8 million as measured by the change in the value of the securities for a one basis point parallel increase in yields. The portfolio also exposes us to credit spread risk of apre-tax change in value of $22 million, as measured by the change in value for a one basis point widening of
Table of Contents
28 Royal Bank of Canada First Quarter 2020
credit spreads. The value of the investment securities carried at FVOCI included in our SIRR measure as at January 31, 2020 was $11.5 billion. Our investment securities carried at FVOCI also include equity exposures of $0.5 billion as at January 31, 2020, compared to $0.4 billion in the prior quarter.
Non-trading foreign exchange rate risk
Foreign exchange rate risk is the potential adverse impact on earnings and economic value due to changes in foreign currency rates. Our revenue, expenses and income denominated in currencies other than the Canadian dollar are subject to fluctuations as a result of changes in the value of the average Canadian dollar relative to the average value of those currencies. Our most significant exposure is to the U.S. dollar, due to our operations in the U.S. and other activities conducted in U.S. dollars. Other significant exposures are to the British pound and the Euro, due to our activities conducted internationally in these currencies. A strengthening or weakening of the Canadian dollar compared to the U.S. dollar, British pound and the Euro could reduce or increase, as applicable, the translated value of our foreign currency denominated revenue, expenses and earnings and could have a significant effect on the results of our operations. We are also exposed to foreign exchange rate risk arising from our investments in foreign operations. For unhedged equity investments, when the Canadian dollar appreciates against other currencies, the unrealized translation losses on net foreign investments decreases our shareholders’ equity through the other components of equity and decreases the translated value of the Risk-weighted Assets (RWA) of the foreign currency-denominated asset. The reverse is true when the Canadian dollar depreciates against other currencies. Consequently, we consider these impacts in selecting an appropriate level of our investments in foreign operations to be hedged.
Derivatives related tonon-trading activity
Derivatives are also used to hedge market risk exposure unrelated to our trading activity. Hedge accounting is elected where applicable. These derivatives are included in our SIRR measure and other internalnon-trading market risk measures. We use interest rate swaps to manage our SIRR, funding and investment activities. Interest rate swaps are also used to hedge changes in the fair value of certain fixed-rate instruments. We also use foreign exchange derivatives to manage our exposure to equity investments in subsidiaries that are denominated in foreign currencies, particularly the U.S. dollar, British Pound, and Euro.
For further details on the application of hedge accounting and the use of derivatives for hedging activities, refer to Notes 2 and 8 of our 2019 Annual Consolidated Financial Statements.
Table of Contents
Royal Bank of Canada First Quarter 2020 29
Linkage of market risk to selected balance sheet items
The following table provides the linkages between selected balance sheet items with positions included in our trading market risk andnon-trading market risk disclosures, which illustrates how we manage market risk for our assets and liabilities through different risk measures:
| As at January 31, 2020 | ||||||||||||||||
| Market risk measure | ||||||||||||||||
| (Millions of Canadian dollars) | Balance sheet amount | Traded risk (1) | Non-traded risk (2) | Non-traded risk primary risk sensitivity | ||||||||||||
Assets subject to market risk | ||||||||||||||||
Cash and due from banks | $ | 34,120 | $ | – | $ | 34,120 | Interest rate | |||||||||
Interest-bearing deposits with banks | 31,331 | 19,166 | 12,165 | Interest rate | ||||||||||||
Securities | ||||||||||||||||
Trading | 145,015 | 134,046 | 10,969 | Interest rate, credit spread | ||||||||||||
Investment, net of applicable allowance | 121,652 | – | 121,652 | Interest rate, credit spread, equity | ||||||||||||
Assets purchased under reverse repurchase | 324,187 | 261,216 | 62,971 | Interest rate | ||||||||||||
Loans | ||||||||||||||||
Retail | 430,841 | 7,285 | 423,556 | Interest rate | ||||||||||||
Wholesale | 202,238 | 8,901 | 193,337 | Interest rate | ||||||||||||
Allowance for loan losses | (3,139 | ) | – | (3,139 | ) | Interest rate | ||||||||||
Segregated fund net assets | 1,788 | – | 1,788 | Interest rate | ||||||||||||
Other | ||||||||||||||||
Derivatives | 93,982 | 91,622 | 2,360 | Interest rate, foreign exchange | ||||||||||||
Other assets | 82,679 | 5,315 | 77,364 | Interest rate | ||||||||||||
Assets not subject to market risk(3) | 11,610 | |||||||||||||||
Total assets | $ | 1,476,304 | $ | 527,551 | $ | 937,143 | ||||||||||
Liabilities subject to market risk | ||||||||||||||||
Deposits | $ | 902,284 | $ | 95,918 | $ | 806,366 | Interest rate | |||||||||
Segregated fund liabilities | 1,788 | – | 1,788 | Interest rate | ||||||||||||
Other | ||||||||||||||||
Obligations related to securities sold short | 35,624 | 35,624 | – | |||||||||||||
Obligations related to assets sold | 254,391 | 247,170 | 7,221 | Interest rate | ||||||||||||
Derivatives | 94,611 | 92,527 | 2,084 | Interest rate, foreign exchange | ||||||||||||
Other liabilities | 81,258 | 9,107 | 72,151 | Interest rate | ||||||||||||
Subordinated debentures | 9,269 | – | 9,269 | Interest rate | ||||||||||||
Liabilities not subject to market risk(4) | 13,018 | |||||||||||||||
Total liabilities | $ | 1,392,243 | $ | 480,346 | $ | 898,879 | ||||||||||
Total equity | $ | 84,061 | ||||||||||||||
Total liabilities and equity | $ | 1,476,304 | ||||||||||||||
| (1) | Traded risk includes positions that are classified or designated as FVTPL and positions whose revaluation gains and losses are reported in revenue. Market risk measures of VaR and SVaR and stress testing are used as risk controls for traded risk. |
| (2) | Non-traded risk includes positions used in the management of the SIRR and othernon-trading portfolios. Other materialnon-trading portfolios include positions from RBC Insurance® and investment securities, net of applicable allowance, not included in SIRR. |
| (3) | Assets not subject to market risk include $11,610 million of physical and other assets. |
| (4) | Liabilities not subject to market risk include $13,018 million of payroll related and other liabilities. |
Table of Contents
30 Royal Bank of Canada First Quarter 2020
| As at October 31, 2019 | ||||||||||||||
| Market risk measure | ||||||||||||||
| (Millions of Canadian dollars) | Balance sheet amount | Traded risk (1) | Non-traded risk (2) | Non-traded risk primary risk sensitivity | ||||||||||
Assets subject to market risk | ||||||||||||||
Cash and due from banks | $ | 26,310 | $ | – | $ | 26,310 | Interest rate | |||||||
Interest-bearing deposits with banks | 38,345 | 22,287 | 16,058 | Interest rate | ||||||||||
Securities | ||||||||||||||
Trading | 146,534 | 136,609 | 9,925 | Interest rate, credit spread | ||||||||||
Investment, net of applicable allowance | 102,470 | – | 102,470 | Interest rate, credit spread, equity | ||||||||||
Assets purchased under reverse repurchase | 306,961 | 246,068 | 60,893 | Interest rate | ||||||||||
Loans | ||||||||||||||
Retail | 426,086 | 10,876 | 415,210 | Interest rate | ||||||||||
Wholesale | 195,870 | 7,111 | 188,759 | Interest rate | ||||||||||
Allowance for loan losses | (3,100 | ) | – | (3,100 | ) | Interest rate | ||||||||
Segregated fund net assets | 1,663 | – | 1,663 | Interest rate | ||||||||||
Other | ||||||||||||||
Derivatives | 101,560 | 99,318 | 2,242 | Interest rate, foreign exchange | ||||||||||
Other assets | 79,802 | 4,648 | 75,154 | Interest rate | ||||||||||
Assets not subject to market risk(3) | 6,434 | |||||||||||||
Total assets | $ | 1,428,935 | $ | 526,917 | $ | 895,584 | ||||||||
Liabilities subject to market risk | ||||||||||||||
Deposits | $ | 886,005 | $ | 99,137 | $ | 786,868 | Interest rate | |||||||
Segregated fund liabilities | 1,663 | – | 1,663 | Interest rate | ||||||||||
Other | ||||||||||||||
Obligations related to securities sold short | 35,069 | 35,069 | – | |||||||||||
Obligations related to assets sold | 226,586 | 218,612 | 7,974 | Interest rate | ||||||||||
Derivatives | 98,543 | 96,512 | 2,031 | Interest rate, foreign exchange | ||||||||||
Other liabilities | 79,040 | 8,918 | 70,122 | Interest rate | ||||||||||
Subordinated debentures | 9,815 | – | 9,815 | Interest rate | ||||||||||
Liabilities not subject to market risk(4) | 8,589 | |||||||||||||
Total liabilities | $ | 1,345,310 | $ | 458,248 | $ | 878,473 | ||||||||
Total equity | $ | 83,625 | ||||||||||||
Total liabilities and equity | $ | 1,428,935 | ||||||||||||
| (1) | Traded risk includes positions that are classified or designated as FVTPL and positions whose revaluation gains and losses are reported in revenue. Market risk measures of VaR and SVaR and stress testing are used as risk controls for traded risk. |
| (2) | Non-traded risk includes positions used in the management of the SIRR and othernon-trading portfolios. Other materialnon-trading portfolios include positions from RBC Insurance® and investment securities, net of applicable allowance, not included in SIRR. |
| (3) | Assets not subject to market risk include $6,434 million of physical and other assets. |
| (4) | Liabilities not subject to market risk include $8,589 million of payroll related and other liabilities. |
|
Liquidity and funding risk (liquidity risk) is the risk that we may be unable to generate sufficient cash or its equivalents in a timely and cost-effective manner to meet our commitments as they come due. Liquidity risk arises from mismatches in the timing and value ofon-balance sheet andoff-balance sheet cash flows.
Our Liquidity Risk Management Framework (LRMF) is designed to ensure that we have sufficient liquidity to satisfy current and prospective commitments in both normal and stressed conditions. There have been no material changes to our LRMF as described in our 2019 Annual Report.
We continue to maintain liquidity and funding that is appropriate for the execution of our strategy. Liquidity risk remains well within our risk appetite.
On January 1, 2020, the OSFI regulatory minimum for the Net Stable Funding Ratio (NSFR) of 100% became effective, in accordance with the revised LAR guidelines. The NSFR is determined based on the liquidity characteristics and maturity profile of our assets, liabilities and off-balance sheet exposures and is intended to reduce structural funding risk by requiring banks to maintain a surplus of available stable funding over the required stable funding. We do not anticipate any challenges in meeting this requirement. The requirement to disclose consolidated NSFR and its major components will become effective for Canadian D-SIBs on January 31, 2021.
Liquidity reserve
Our liquidity reserve consists of available unencumbered liquid assets as well as uncommitted and undrawn central bank borrowing facilities that could be accessed under extraordinary circumstances subject to satisfying certain preconditions as set by various Central Banks (e.g., BoC, the Fed, Bank of England, and Bank of France).
To varying degrees, unencumbered liquid assets represent a ready source of funding. Unencumbered assets are the difference between total and encumbered assets from bothon- andoff-balance sheet sources. Encumbered assets, in turn, are not considered a source of liquidity in measures of liquidity risk.
Table of Contents
Royal Bank of Canada First Quarter 2020 31
Although unused wholesale funding capacity, which is regularly assessed, could be another potential source of liquidity to mitigate stressed conditions, it is excluded in the determination of the liquidity reserve.
| As at January 31, 2020 | ||||||||||||||||||||||||
| (Millions of Canadian dollars) | Bank-owned liquid assets | Securities received as collateral from securities financing and derivative transactions | Total liquid assets | Encumbered liquid assets | Unencumbered liquid assets | |||||||||||||||||||
Cash and due from banks | $ | 34,120 | $ | – | $ | 34,120 | $ | 2,899 | $ | 31,221 | ||||||||||||||
Interest-bearing deposits with banks | 31,331 | – | 31,331 | 331 | 31,000 | |||||||||||||||||||
Securities issued or guaranteed by sovereigns, central banks or multilateral development banks(1) | 221,047 | 327,977 | 549,024 | 381,064 | 167,960 | |||||||||||||||||||
Other securities | 97,168 | 116,376 | 213,544 | 93,188 | 120,356 | |||||||||||||||||||
Undrawn credit lines granted by central banks(2) | 7,679 | – | 7,679 | – | 7,679 | |||||||||||||||||||
Other assets eligible as collateral for discount(3) | 107,727 | – | 107,727 | – | 107,727 | |||||||||||||||||||
Other liquid assets(4) | 21,955 | – | 21,955 | 20,993 | 962 | |||||||||||||||||||
Total liquid assets | $ | 521,027 | $ | 444,353 | $ | 965,380 | $ | 498,475 | $ | 466,905 | ||||||||||||||
| As at October 31, 2019 | ||||||||||||||||||||||||
| (Millions of Canadian dollars) | Bank-owned liquid assets | Securities received as collateral from securities financing and derivative transactions | Total liquid assets | Encumbered liquid assets | Unencumbered liquid assets | |||||||||||||||||||
Cash and due from banks | $ | 26,310 | $ | – | $ | 26,310 | $ | 2,860 | $ | 23,450 | ||||||||||||||
Interest-bearing deposits with banks | 38,345 | – | 38,345 | 329 | 38,016 | |||||||||||||||||||
Securities issued or guaranteed by sovereigns, central banks or multilateral development banks(1) | 206,960 | 311,019 | 517,979 | 345,753 | 172,226 | |||||||||||||||||||
Other securities | 90,026 | 115,261 | 205,287 | 96,184 | 109,103 | |||||||||||||||||||
Undrawn credit lines granted by central banks(2) | 9,534 | – | 9,534 | – | 9,534 | |||||||||||||||||||
Other assets eligible as collateral for discount(3) | 109,327 | – | 109,327 | – | 109,327 | |||||||||||||||||||
Other liquid assets(4) | 21,732 | – | 21,732 | 21,316 | 416 | |||||||||||||||||||
Total liquid assets | $ | 502,234 | $ | 426,280 | $ | 928,514 | $ | 466,442 | $ | 462,072 | ||||||||||||||
| As at | ||||||||||||||||||||||||
| (Millions of Canadian dollars) | January 31 2020 | October 31 2019 | ||||||||||||||||||||||
Royal Bank of Canada | $ | 232,799 | $ | 224,063 | ||||||||||||||||||||
Foreign branches | 64,856 | 71,062 | ||||||||||||||||||||||
Subsidiaries | 169,250 | 166,947 | ||||||||||||||||||||||
Total unencumbered liquid assets | $ | 466,905 | $ | 462,072 | ||||||||||||||||||||
| (1) | Includes liquid securities issued by provincial governments and U.S. government-sponsored entities working under U.S. Federal government’s conservatorship (e.g., Federal National Mortgage Association and Federal Home Loan Mortgage Corporation). |
| (2) | Includes loans that qualify as eligible collateral for the discount window facility available to us at the Federal Reserve Bank of New York (FRBNY). Amounts are face value and would be subject to collateral margin requirements applied by the FRBNY to determine collateral value/borrowing capacity. Access to the discount window borrowing program is conditional on meeting requirements set by the FRBNY and borrowings are typically expected to be infrequent and due to uncommon occurrences requiring temporary accommodation. |
| (3) | Represents our unencumbered Canadian dollarnon-mortgage loan book (at face value) that could, subject to satisfying conditions precedent to borrowing and application of prescribed collateral margin requirements, be pledged to the BoC for advances under its Emergency Lending Assistance (ELA) program. ELA is not considered a source of available liquidity in our normal liquidity risk profile but could in extraordinary circumstances, where normal market liquidity is seriously impaired, allow us and other banks to monetize assets eligible as collateral to meet requirements and mitigate further market liquidity disruption. The balance also includes our unencumbered mortgage loans that qualify as eligible collateral at Federal Home Loan Bank (FHLB). |
| (4) | Encumbered liquid assets amount represents cash collateral and margin deposit amounts pledged related toover-the-counter (OTC) and exchange-traded derivative transactions. |
The liquidity reserve is typically most affected by routine flows of client banking activity where liquid asset portfolios adjust to the change in cash balances, and additionally from capital markets activities where business strategies and client flows may also affect the addition or subtraction of liquid assets in the overall calculation of the liquidity reserve. Corporate Treasury also affects liquidity reserves through the management of funding issuances where reserves absorb timing mismatches between debt issuances and deployment into business activities.
Q1 2020 vs. Q4 2019
Total liquid assets increased $37 billion or 4%, primarily due to increase in on-balance sheet securities and securities received as collateral under reverse repurchase agreements and collateral swap transactions. However, the increase in collateral received was offset with a corresponding increase in collateral pledged under encumbered liquid assets due to repurchase transactions and collateral swap transactions.
Table of Contents
32 Royal Bank of Canada First Quarter 2020
Asset encumbrance
The table below provides a summary of our on- and off-balance sheet amounts for cash, securities and other assets, distinguishing between those that are encumbered or available for sale or use as collateral in secured funding transactions. Other assets, such as mortgages and credit card receivables, can also be monetized, albeit over longer timeframes than those required for marketable securities. As at January 31, 2020, our unencumbered assets available as collateral comprised 28% of total assets (October 31, 2019 – 29%).
Asset encumbrance
| As at | ||||||||||||||||||||||||||||||||||||||||||||||||
January 31 2020 | October 31 2019 | |||||||||||||||||||||||||||||||||||||||||||||||
| Encumbered | Unencumbered | Encumbered | Unencumbered | |||||||||||||||||||||||||||||||||||||||||||||
| (Millions of Canadian dollars) | Pledged as collateral | Other (1) | Available as collateral (2) | Other (3) | Total | Pledged as collateral | Other (1) | Available as collateral (2) | Other (3) | Total | ||||||||||||||||||||||||||||||||||||||
Cash and due from banks | $ | – | $ | 2,899 | $ | 31,221 | $ | – | $ | 34,120 | $ | – | $ | 2,860 | $ | 23,450 | $ | – | $ | 26,310 | ||||||||||||||||||||||||||||
Interest-bearing deposits | – | 331 | 31,000 | – | 31,331 | – | 329 | 38,016 | – | 38,345 | ||||||||||||||||||||||||||||||||||||||
Securities | ||||||||||||||||||||||||||||||||||||||||||||||||
Trading | 44,278 | – | 98,240 | 2,497 | 145,015 | 44,431 | – | 99,420 | 2,683 | 146,534 | ||||||||||||||||||||||||||||||||||||||
Investment, net of | 16,481 | – | 105,122 | 49 | 121,652 | 16,376 | – | 86,045 | 49 | 102,470 | ||||||||||||||||||||||||||||||||||||||
Assets purchased under reverse repurchase agreements and securities borrowed(4) | 432,249 | 23,468 | 34,221 | 5,578 | 495,516 | 399,013 | 22,793 | 49,325 | 5,214 | 476,345 | ||||||||||||||||||||||||||||||||||||||
Loans | ||||||||||||||||||||||||||||||||||||||||||||||||
Retail | ||||||||||||||||||||||||||||||||||||||||||||||||
Mortgage securities | 30,834 | – | 41,281 | – | 72,115 | 31,345 | �� | 40,401 | – | 71,746 | ||||||||||||||||||||||||||||||||||||||
Mortgage loans | 49,997 | – | 21,210 | 170,882 | 242,089 | 42,103 | – | 22,598 | 171,644 | 236,345 | ||||||||||||||||||||||||||||||||||||||
Non-mortgage loans | 7,129 | – | 59,583 | 49,925 | 116,637 | 7,094 | – | 62,204 | 48,697 | 117,995 | ||||||||||||||||||||||||||||||||||||||
Wholesale | – | – | 35,226 | 167,012 | 202,238 | – | – | 34,882 | 160,988 | 195,870 | ||||||||||||||||||||||||||||||||||||||
Allowance for loan losses | – | – | – | (3,139 | ) | (3,139 | ) | – | – | – | (3,100 | ) | (3,100 | ) | ||||||||||||||||||||||||||||||||||
Segregated fund net assets | – | – | – | 1,788 | 1,788 | – | – | – | 1,663 | 1,663 | ||||||||||||||||||||||||||||||||||||||
Other | ||||||||||||||||||||||||||||||||||||||||||||||||
Derivatives | – | – | – | 93,982 | 93,982 | – | – | – | 101,560 | 101,560 | ||||||||||||||||||||||||||||||||||||||
Others(5) | 20,993 | – | 962 | 72,334 | 94,289 | 21,316 | – | 416 | 64,504 | 86,236 | ||||||||||||||||||||||||||||||||||||||
Total assets | $ | 601,961 | $ | 26,698 | $ | 458,066 | $ | 560,908 | $ | 1,647,633 | $ | 561,678 | $ | 25,982 | $ | 456,757 | $ | 553,902 | $ | 1,598,319 | ||||||||||||||||||||||||||||
| (1) | Includes assets restricted from use to generate secured funding due to legal or other constraints. |
| (2) | Includes loans that could be used to collateralize central bank advances. Our unencumbered Canadian dollarnon-mortgage loan book (at face value) could, subject to satisfying conditions for borrowing and application of prescribed collateral margin requirements, be pledged to the BoC for advances under its ELA program. It also includes our unencumbered mortgage loans that qualify as eligible collateral at FHLB. We also lodge loans that qualify as eligible collateral for the discount window facility available to us at the FRBNY. ELA and other central bank facilities are not considered sources of available liquidity in our normal liquidity risk profile. However, banks could monetize assets meeting collateral criteria during periods of extraordinary and severe disruption to market-wide liquidity. |
| (3) | Other unencumbered assets are not subject to any restrictions on their use to secure funding or as collateral but would not be considered readily available since they may not be acceptable at central banks or for other lending programs. |
| (4) | Includes bank-owned liquid assets and securities received as collateral fromoff-balance sheet securities financing, derivative transactions, and margin lending. Includes $23.5 billion (October 31, 2019 – $22.8 billion) of collateral received through reverse repurchase transactions that cannot be rehypothecated in its current legal form. |
| (5) | The Pledged as collateral amount represents cash collateral and margin deposit amounts pledged related to OTC and exchange-traded derivative transactions. |
Funding
Funding strategy
Core funding, comprising capital, longer-term wholesale liabilities and a diversified pool of personal and, to a lesser extent, commercial and institutional deposits, is the foundation of our structural liquidity position.
Deposit and funding profile
As at January 31, 2020, relationship-based deposits, which are the primary source of funding for retail loans and mortgages, were $601 billion or 50% of our total funding (October 31, 2019 – $594 billion or 51%). The remaining portion is comprised of short- and long-term wholesale funding.
Funding for highly liquid assets consists primarily of short-term wholesale funding that reflects the monetization period of those assets. Long-term wholesale funding is used mostly to fund less liquid wholesale assets and to support liquidity asset buffers.
On April 18, 2018, the Department of Finance publishedbail-in regulations under the Canada Deposit Insurance Corporation (CDIC) Act and the Bank Act, which became effective September 23, 2018. Senior long-term debt issued by the bank on or after September 23, 2018, that has an original term greater than 400 days and is marketable, subject to certain exceptions, is subject to the Canadian Bank Recapitalization(Bail-in) regime. Under theBail-in regime, in circumstances when the Superintendent of Financial Institutions has determined that a bank may no longer be viable, the Governor in Council may, upon a recommendation of the Minister of Finance that he or she is of the opinion that it is in the public interest to do so, grant an order directing the CDIC to convert all or a portion of certain shares and liabilities of that bank into common shares. As at January 31, 2020, the notional value of issued and outstanding long-term debt subject to conversion under theBail-in regime was $26,684 million (October 31, 2019 – $20,320 million).
For further details on our wholesale funding, refer to the Composition of wholesale funding tables below.
Long-term debt issuance
Our wholesale funding activities are well-diversified by geography, investor segment, instrument, currency, structure and maturity. We maintain an ongoing presence in different funding markets, which allows us to continuously monitor market developments and trends, identify opportunities and risks, and take appropriate and timely actions. We operate long-term debt issuance registered programs. The following table summarizes these programs with their authorized limits by geography.
Table of Contents
Royal Bank of Canada First Quarter 2020 33
| Programs by geography
|
| Canada | U.S. | Europe/Asia | ||
• Canadian Shelf Program – $25 billion | • U.S. Shelf Program – US$40 billion | • European Debt Issuance Program – US$40 billion | ||
• Global Covered Bond Program –€32 billion | ||||
• Japanese Issuance Programs – ¥1 trillion | ||||
We also raise long-term funding using Canadian Senior Notes, Canadian National Housing Act MBS, Canada Mortgage Bonds, credit card receivable-backed securities, Kangaroo Bonds (issued in the Australian domestic market by foreign firms) and Yankee Certificates of Deposit (issued in the U.S. domestic market by foreign firms). We continuously evaluate opportunities to expand into new markets and untapped investor segments since diversification expands our wholesale funding flexibility, minimizes funding concentration and dependency, and generally reduces financing costs. As presented in the following charts, our current long-term debt profile is well-diversified by both currency and product. Maintaining competitive credit ratings is also critical to cost-effective funding.
|
| |
(1) Based on original term to maturity greater than 1 year |
(1) Based on original term to maturity greater than 1 year | |
(2) Mortgage-backed securities and Canada Mortgage Bonds |

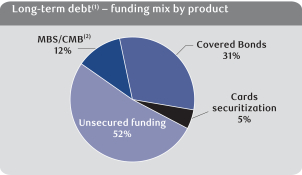
The following table provides our composition of wholesale funding based on remaining term to maturity:
Composition of wholesale funding(1)
| As at January 31, 2020 | ||||||||||||||||||||||||||||||||
| (Millions of Canadian dollars) | Less than 1 month | 1 to 3 months | 3 to 6 months | 6 to 12 months | Less than 1 year sub-total | 1 year to 2 years | 2 years and greater | Total | ||||||||||||||||||||||||
Deposits from banks(2) | $ | 5,476 | $ | 44 | $ | – | $ | 33 | $ | 5,553 | $ | – | $ | – | $ | 5,553 | ||||||||||||||||
Certificates of deposit and commercial paper | 3,331 | 17,696 | 17,345 | 16,815 | 55,187 | 544 | – | 55,731 | ||||||||||||||||||||||||
Asset-backed commercial paper(3) | 5,120 | 4,846 | 3,719 | 3,169 | 16,854 | – | – | 16,854 | ||||||||||||||||||||||||
Senior unsecured medium-term notes(4) | 1,626 | 5,323 | 4,982 | 13,682 | 25,613 | 14,993 | 37,389 | 77,995 | ||||||||||||||||||||||||
Senior unsecured structured notes(5) | 34 | 140 | 598 | 1,179 | 1,951 | 2,077 | 5,065 | 9,093 | ||||||||||||||||||||||||
Mortgage securitization | – | 1,795 | 371 | 1,517 | 3,683 | 2,720 | 11,162 | 17,565 | ||||||||||||||||||||||||
Covered bonds/asset-backed securities(6) | 2,647 | 3,656 | – | 8,822 | 15,125 | 11,731 | 24,497 | 51,353 | ||||||||||||||||||||||||
Subordinated liabilities | – | – | 935 | 1,476 | 2,411 | 1,000 | 5,780 | 9,191 | ||||||||||||||||||||||||
Other(7) | 8,973 | 2,431 | 3,133 | 375 | 14,912 | – | 10,400 | 25,312 | ||||||||||||||||||||||||
Total | $ | 27,207 | $ | 35,931 | $ | 31,083 | $ | 47,068 | $ | 141,289 | $ | 33,065 | $ | 94,293 | $ | 268,647 | ||||||||||||||||
Of which: | ||||||||||||||||||||||||||||||||
– Secured | $ | 15,438 | $ | 11,838 | $ | 5,546 | $ | 13,508 | $ | 46,330 | $ | 14,451 | $ | 35,659 | $ | 96,440 | ||||||||||||||||
– Unsecured | 11,769 | 24,093 | 25,537 | 33,560 | 94,959 | 18,614 | 58,634 | 172,207 | ||||||||||||||||||||||||
| As at October 31, 2019 | ||||||||||||||||||||||||||||||||
| (Millions of Canadian dollars) | Less than 1 month | 1 to 3 months | 3 to 6 months | 6 to 12 months | Less than 1 year sub-total | 1 year to 2 years | 2 years and greater | Total | ||||||||||||||||||||||||
Deposits from banks(2) | $ | 4,087 | $ | – | $ | 388 | $ | 33 | $ | 4,508 | $ | – | $ | – | $ | 4,508 | ||||||||||||||||
Certificates of deposit and commercial paper | 2,917 | 12,037 | 17,390 | 22,038 | 54,382 | 132 | – | 54,514 | ||||||||||||||||||||||||
Asset-backed commercial paper(3) | 2,542 | 3,188 | 6,543 | 3,905 | 16,178 | – | – | 16,178 | ||||||||||||||||||||||||
Senior unsecured medium-term notes(4) | 11 | 2,293 | 9,183 | 14,188 | 25,675 | 18,856 | 29,756 | 74,287 | ||||||||||||||||||||||||
Senior unsecured structured notes(5) | 847 | 676 | 171 | 1,342 | 3,036 | 1,810 | 5,047 | 9,893 | ||||||||||||||||||||||||
Mortgage securitization | – | 524 | 1,796 | 727 | 3,047 | 3,523 | 11,015 | 17,585 | ||||||||||||||||||||||||
Covered bonds/asset-backed securities(6) | – | – | 6,282 | 2,305 | 8,587 | 14,337 | 23,426 | 46,350 | ||||||||||||||||||||||||
Subordinated liabilities | – | 2,000 | – | 998 | 2,998 | 2,500 | 4,290 | 9,788 | ||||||||||||||||||||||||
Other(7) | 9,489 | 1,224 | 157 | 1,663 | 12,533 | 141 | 9,976 | 22,650 | ||||||||||||||||||||||||
Total | $ | 19,893 | $ | 21,942 | $ | 41,910 | $ | 47,199 | $ | 130,944 | $ | 41,299 | $ | 83,510 | $ | 255,753 | ||||||||||||||||
Of which: | ||||||||||||||||||||||||||||||||
– Secured | $ | 10,339 | $ | 3,929 | $ | 14,621 | $ | 6,937 | $ | 35,826 | $ | 17,860 | $ | 34,441 | $ | 88,127 | ||||||||||||||||
– Unsecured | 9,554 | 18,013 | 27,289 | 40,262 | 95,118 | 23,439 | 49,069 | 167,626 | ||||||||||||||||||||||||
| (1) | Excludes bankers’ acceptances and repos. |
| (2) | Excludes deposits associated with services we provide to banks (e.g., custody, cash management). |
| (3) | Only includes consolidated liabilities, including our collateralized commercial paper program. |
| (4) | Includes deposit notes. |
| (5) | Includes notes where the payout is tied to movements in foreign exchange, commodities and equities. |
| (6) | Includes credit card and mortgage loans. |
| (7) | Includes tender option bonds (secured) of $7,889 million (October 31, 2019 – $8,014 million), bearer deposit notes (unsecured) of $4,399 million (October 31, 2019 – $4,813 million), other long-term structured deposits (unsecured) of $10,245 million (October 31, 2019 – $9,823 million), and FHLB advances (secured) of $2,779 million (October 31, 2019 - $nil). |
Table of Contents
34 Royal Bank of Canada First Quarter 2020
Credit ratings
Our ability to access unsecured funding markets and to engage in certain collateralized business activities on a cost-effective basis are primarily dependent upon maintaining competitive credit ratings. Credit ratings and outlooks provided by rating agencies reflect their views and methodologies. Ratings are subject to change, based on a number of factors including, but not limited to, our financial strength, competitive position, liquidity and other factors not completely within our control.
Other than as noted below, there have been no changes to our major credit ratings as disclosed in our 2019 Annual Report.
Credit ratings(1)
| As at February 20, 2020 | ||||||||||||||||
| Short-term debt | Legacy senior long-term debt (2) | Senior long- term debt (3) | Outlook | |||||||||||||
Moody’s(4) | P-1 | Aa2 | A2 | stable | ||||||||||||
Standard & Poor’s(5) | A-1+ | AA- | A | stable | ||||||||||||
Fitch Ratings(6) | F1+ | AA | AA | stable | ||||||||||||
DBRS(7) | R-1(high) | AA (high) | AA | stable | ||||||||||||
| (1) | Credit ratings are not recommendations to purchase, sell or hold a financial obligation inasmuch as they do not comment on market price or suitability for a particular investor. Ratings are determined by the rating agencies based on criteria established from time to time by them, and are subject to revision or withdrawal at any time by the rating organization. |
| (2) | Includes senior long-term debt issued prior to September 23, 2018 and senior long-term debt issued on or after September 23, 2018 which is excluded from theBail-in regime. |
| (3) | Includes senior long-term debt issued on or after September 23, 2018 which is subject to conversion under theBail-in regime. |
| (4) | On August 1, 2019, Moody’s affirmed our ratings with a stable outlook. |
| (5) | On June 24, 2019, Standard & Poor’s affirmed our ratings with a stable outlook. |
| (6) | On January 17, 2020, Fitch Ratings affirmed our ratings with a stable outlook. |
| (7) | On June 18, 2019, DBRS revised our outlook to stable from positive, upgraded our legacy senior long-term debt rating to AA (high) from AA and upgraded our senior long-term debt rating to AA from AA (low). |
Additional contractual obligations for rating downgrades
We are required to deliver collateral to certain counterparties in the event of a downgrade to our current credit rating. The following table provides the additional collateral obligations required at the reporting date in the event of aone-,two- or three-notch downgrade to our credit ratings. These additional collateral obligations are incremental requirements for each successive downgrade and do not represent the cumulative impact of multiple downgrades. The amounts reported change periodically as a result of several factors, including the transfer of trading activity to centrally cleared financial market infrastructures and exchanges, the expiration of transactions with downgrade triggers, the imposition of internal limitations on new agreements to exclude downgrade triggers, as well as normal coursemark-to-market. There is no outstanding senior debt issued in the market that contains rating triggers that would lead to early prepayment of principal.
Additional contractual obligations for rating downgrades
| As at | ||||||||||||||||||||||||||
January 31 2020 | October 31 2019 | |||||||||||||||||||||||||
| (Millions of Canadian dollars) | One-notch downgrade | Two-notch downgrade | Three-notch downgrade | One-notch downgrade | Two-notch downgrade | Three-notch downgrade | ||||||||||||||||||||
Contractual derivatives funding or margin requirements | $ | 194 | $ | 65 | $ | 135 | $ | 165 | $ | 64 | $ | 124 | ||||||||||||||
Other contractual funding or margin requirements(1) | 205 | 45 | 9 | 180 | 176 | – | ||||||||||||||||||||
| (1) | Includes Guaranteed Investment Certificates (GICs) issued by our municipal markets business out of New York. |
Liquidity Coverage Ratio (LCR)
The LCR is a Basel III metric that measures the sufficiency of high-quality liquid assets (HQLA) available to meet liquidity needs over a30-day period in an acute stress scenario. The Basel Committee on Banking Supervision (BCBS) and OSFI regulatory minimum coverage level for LCR is currently 100%.
OSFI requires Canadian banks to disclose the LCR using the standard Basel disclosure template and calculated using the average of daily LCR positions during the quarter.
Table of Contents
Royal Bank of Canada First Quarter 2020 35
Liquidity coverage ratio common disclosure template(1)
| For the three months ended | ||||||||||||||||||
January 31 2020 | October 31 2019 | |||||||||||||||||
| (Millions of Canadian dollars, except percentage amounts) | Total unweighted value (average) (2) | Total weighted value (average) | Total unweighted value (average) (2) | Total weighted value (average) | ||||||||||||||
High-quality liquid assets | ||||||||||||||||||
Total high-quality liquid assets (HQLA) | n.a. | $ | 249,762 | n.a. | $ | 234,605 | ||||||||||||
Cash outflows | ||||||||||||||||||
Retail deposits and deposits from small business customers, of which: | $ | 271,090 | 21,973 | $ | 266,868 | 20,417 | ||||||||||||
Stable deposits(3) | 96,833 | 2,905 | 89,565 | 2,687 | ||||||||||||||
Less stable deposits | 174,257 | 19,068 | 177,303 | 17,730 | ||||||||||||||
Unsecured wholesale funding, of which: | 308,718 | 142,391 | 303,129 | 137,946 | ||||||||||||||
Operational deposits (all counterparties) and deposits in networks of cooperative banks(4) | 135,265 | 32,379 | 133,484 | 31,907 | ||||||||||||||
Non-operational deposits | 144,506 | 81,065 | 145,888 | 82,282 | ||||||||||||||
Unsecured debt | 28,947 | 28,947 | 23,757 | 23,757 | ||||||||||||||
Secured wholesale funding | n.a. | 30,074 | n.a. | 33,904 | ||||||||||||||
Additional requirements, of which: | 239,573 | 52,559 | 265,287 | 72,268 | ||||||||||||||
Outflows related to derivative exposures and other collateral requirements | 34,796 | 15,092 | 57,869 | 33,108 | ||||||||||||||
Outflows related to loss of funding on debt products | 7,633 | 7,633 | 7,761 | 7,761 | ||||||||||||||
Credit and liquidity facilities | 197,144 | 29,834 | 199,657 | 31,399 | ||||||||||||||
Other contractual funding obligations(5) | 20,196 | 20,196 | 19,108 | 19,108 | ||||||||||||||
Other contingent funding obligations(6) | 460,167 | 8,091 | 441,413 | 7,999 | ||||||||||||||
Total cash outflows | n.a. | $ | 275,284 | n.a. | $ | 291,642 | ||||||||||||
Cash inflows | ||||||||||||||||||
Secured lending (e.g., reverse repos) | $ | 281,430 | $ | 46,792 | $ | 313,698 | $ | 52,469 | ||||||||||
Inflows from fully performing exposures | 14,151 | 9,708 | 15,692 | 11,154 | ||||||||||||||
Other cash inflows | 25,039 | 25,039 | 43,442 | 43,442 | ||||||||||||||
Total cash inflows | n.a. | $ | 81,539 | n.a. | $ | 107,065 | ||||||||||||
| Total adjusted value | Total adjusted value | |||||||||||||||||
Total HQLA | $ | 249,762 | $ | 234,605 | ||||||||||||||
Total net cash outflows | 193,745 | 184,577 | ||||||||||||||||
Liquidity coverage ratio | 129% | 127% | ||||||||||||||||
| (1) | The LCR is calculated in accordance with OSFI’s LAR guideline, which, in turn, reflects liquidity-related requirements issued by the BCBS. The LCR for the quarter ended January 31, 2020 is calculated as an average of 62 daily positions. |
| (2) | With the exception of other contingent funding obligations, unweighted inflow and outflow amounts are items maturing or callable in 30 days or less. Other contingent funding obligations also include debt securities with remaining maturity greater than 30 days. |
| (3) | As defined by the BCBS, stable deposits from retail and small business customers are deposits that are insured and are either held in transactional accounts or the bank has an established relationship with the client making the withdrawal unlikely. |
| (4) | Operational deposits from customers other than retail and small andmedium-sized enterprises (SMEs), are deposits which clients need to keep with the bank in order to facilitate their access and ability to use payment and settlement systems primarily for clearing, custody and cash management activities. |
| (5) | Other contractual funding obligations primarily include outflows from unsettled securities trades and outflows from obligations related to securities sold short. |
| (6) | Other contingent funding obligations include outflows related to otheroff-balance sheet facilities that carry low LCR runoff factors (0% – 5%). |
| n.a. | not applicable |
We manage our LCR position within a target range that reflects our liquidity risk tolerance and takes into account business mix, asset composition and funding capabilities. The range is subject to periodic review in light of changes to internal requirements and external developments.
We maintain HQLAs in major currencies with dependable market depth and breadth. Our treasury management practices ensure that the levels of HQLA are actively managed to meet target LCR objectives. Our Level 1 assets, as calculated according to OSFI LAR and the BCBS LCR requirements, represent 81% of total HQLA. These assets consist of cash, placements with central banks and highly rated securities issued or guaranteed by governments, central banks and supranational entities.
LCR captures cash flows fromon- andoff-balance sheet activities that are either expected or could potentially occur within 30 days in an acute stress scenario. Cash outflows result from the application of withdrawal andnon-renewal factors to demand and term deposits, differentiated by client type (wholesale, retail and small- andmedium-sized enterprises). Cash outflows also arise from business activities that create contingent funding and collateral requirements, such as repo funding, derivatives, short sales of securities and the extension of credit and liquidity commitments to clients. Cash inflows arise primarily from maturing secured loans, interbank loans andnon-HQLA securities.
LCR does not reflect any market funding capacity that we believe would be available in a stress situation. All maturing wholesale debt is assigned 100% outflow in the LCR calculation.
Q1 2020 vs. Q4 2019
The average LCR for the quarter ended January 31, 2020 was 129%, which translates into a surplus of approximately $56 billion, compared to 127% in the prior quarter. The increase in the LCR surplus from the previous quarter is primarily due to a change in funding and business mix.
Table of Contents
36 Royal Bank of Canada First Quarter 2020
Contractual maturities of financial assets, financial liabilities andoff-balance sheet items
The following tables provide remaining contractual maturity profiles of all our assets, liabilities, andoff-balance sheet items at their carrying value (e.g., amortized cost or fair value) at the balance sheet date.Off-balance sheet items are allocated based on the expiry date of the contract.
Details of contractual maturities and commitments to extend funds are a source of information for the management of liquidity risk. Among other purposes, these details form a basis for modelling a behavioural balance sheet with effective maturities to calculate liquidity risk measures. For further details, refer to the Risk measurement section within the Liquidity and funding risk section of our 2019 Annual Report.
| As at January 31, 2020 | ||||||||||||||||||||||||||||||||||||||||
| (Millions of Canadian dollars) | Less than 1 month | 1 to 3 months | 3 to 6 months | 6 to 9 months | 9 to 12 months | 1 year to 2 years | 2 years to 5 years | 5 years and greater | With no specific maturity | Total | ||||||||||||||||||||||||||||||
Assets | ||||||||||||||||||||||||||||||||||||||||
Cash and deposits with banks | $ | 62,994 | $ | 1 | $ | – | $ | – | $ | – | $ | – | $ | – | $ | – | $ | 2,456 | $ | 65,451 | ||||||||||||||||||||
Securities | ||||||||||||||||||||||||||||||||||||||||
Trading(1) | 90,235 | 22 | 69 | 21 | 19 | 96 | 108 | 9,557 | 44,888 | 145,015 | ||||||||||||||||||||||||||||||
Investment, net of applicable allowance | 2,080 | 9,158 | 4,099 | 3,377 | 4,767 | 27,704 | 22,850 | 47,118 | 499 | 121,652 | ||||||||||||||||||||||||||||||
Assets purchased under reverse repurchase agreements and securities borrowed | 177,395 | 80,269 | 25,806 | 13,439 | 14,467 | 127 | – | – | 12,684 | 324,187 | ||||||||||||||||||||||||||||||
Loans, net of applicable allowance | 23,953 | 18,689 | 28,999 | 26,978 | 28,199 | 118,544 | 243,370 | 52,401 | 88,807 | 629,940 | ||||||||||||||||||||||||||||||
Other | ||||||||||||||||||||||||||||||||||||||||
Customers’ liability under acceptances | 13,112 | 5,595 | 129 | – | 4 | – | – | – | (39 | ) | 18,801 | |||||||||||||||||||||||||||||
Derivatives | 4,718 | 6,115 | 4,012 | 3,510 | 3,731 | 8,555 | 16,171 | 47,169 | 1 | 93,982 | ||||||||||||||||||||||||||||||
Other financial assets | 27,883 | 1,633 | 1,833 | 127 | 109 | 208 | 303 | 1,922 | 2,333 | 36,351 | ||||||||||||||||||||||||||||||
Total financial assets | $ | 402,370 | $ | 121,482 | $ | 64,947 | $ | 47,452 | $ | 51,296 | $ | 155,234 | $ | 282,802 | $ | 158,167 | $ | 151,629 | $ | 1,435,379 | ||||||||||||||||||||
Othernon-financial assets | 3,974 | 2,189 | 120 | 191 | 415 | 1,320 | 1,812 | 6,416 | 24,488 | 40,925 | ||||||||||||||||||||||||||||||
Total assets | $ | 406,344 | $ | 123,671 | $ | 65,067 | $ | 47,643 | $ | 51,711 | $ | 156,554 | $ | 284,614 | $ | 164,583 | $ | 176,117 | $ | 1,476,304 | ||||||||||||||||||||
Liabilities and equity | ||||||||||||||||||||||||||||||||||||||||
Deposits(2) | ||||||||||||||||||||||||||||||||||||||||
Unsecured borrowing | $ | 52,623 | $ | 47,214 | $ | 43,686 | $ | 45,994 | $ | 29,521 | $ | 24,937 | $ | 58,240 | $ | 17,557 | $ | 477,175 | $ | 796,947 | ||||||||||||||||||||
Secured borrowing | 2,671 | 9,551 | 6,087 | 3,868 | 5,363 | 7,476 | 19,525 | 5,897 | – | 60,438 | ||||||||||||||||||||||||||||||
Covered bonds | 2,646 | 2,199 | – | 5,261 | 1,848 | 9,909 | 12,501 | 10,535 | – | 44,899 | ||||||||||||||||||||||||||||||
Other | ||||||||||||||||||||||||||||||||||||||||
Acceptances | 13,116 | 5,594 | 129 | – | 4 | – | – | – | 1 | 18,844 | ||||||||||||||||||||||||||||||
Obligations related to securities sold short | 35,624 | – | – | – | – | – | – | – | – | 35,624 | ||||||||||||||||||||||||||||||
Obligations related to assets sold under repurchase agreements and securities loaned | 214,377 | 30,867 | 2,064 | 354 | 5 | – | – | – | 6,724 | 254,391 | ||||||||||||||||||||||||||||||
Derivatives | 5,416 | 5,933 | 4,336 | 3,708 | 4,033 | 8,038 | 16,185 | 46,919 | 43 | 94,611 | ||||||||||||||||||||||||||||||
Other financial liabilities | 25,633 | 2,724 | 3,518 | 543 | 760 | 796 | 2,177 | 11,478 | 499 | 48,128 | ||||||||||||||||||||||||||||||
Subordinated debentures | – | – | – | – | – | – | 316 | 8,953 | – | 9,269 | ||||||||||||||||||||||||||||||
Total financial liabilities | $ | 352,106 | $ | 104,082 | $ | 59,820 | $ | 59,728 | $ | 41,534 | $ | 51,156 | $ | 108,944 | $ | 101,339 | $ | 484,442 | $ | 1,363,151 | ||||||||||||||||||||
Othernon-financial liabilities | 1,417 | 946 | 225 | 975 | 2,079 | 835 | 757 | 11,999 | 9,859 | 29,092 | ||||||||||||||||||||||||||||||
Equity | – | – | – | – | – | – | – | – | 84,061 | 84,061 | ||||||||||||||||||||||||||||||
Total liabilities and equity | $ | 353,523 | $ | 105,028 | $ | 60,045 | $ | 60,703 | $ | 43,613 | $ | 51,991 | $ | 109,701 | $ | 113,338 | $ | 578,362 | $ | 1,476,304 | ||||||||||||||||||||
Off-balance sheet items | ||||||||||||||||||||||||||||||||||||||||
Financial guarantees | $ | 666 | $ | 1,775 | $ | 2,854 | $ | 2,452 | $ | 2,498 | $ | 844 | $ | 5,207 | $ | 48 | $ | 51 | $ | 16,395 | ||||||||||||||||||||
Commitments to extend credit | 2,385 | 6,563 | 9,146 | 7,772 | 12,032 | 40,296 | 165,908 | 16,415 | 1,343 | 261,860 | ||||||||||||||||||||||||||||||
Other credit-related commitments | 729 | 1,069 | 1,915 | 1,388 | 1,317 | 239 | 524 | 8 | 90,838 | 98,027 | ||||||||||||||||||||||||||||||
Other commitments | 83 | 12 | 18 | 18 | 18 | 97 | 224 | 395 | 491 | 1,356 | ||||||||||||||||||||||||||||||
Totaloff-balance sheet items | $ | 3,863 | $ | 9,419 | $ | 13,933 | $ | 11,630 | $ | 15,865 | $ | 41,476 | $ | 171,863 | $ | 16,866 | $ | 92,723 | $ | 377,638 | ||||||||||||||||||||
| (1) | Trading debt securities classified as FVTPL have been included in the less than 1 month category as there is no expectation to hold these assets to their contractual maturity. |
| (2) | A major portion of relationship-based deposits are repayable on demand or at short notice on a contractual basis while, in practice, these customer balances form a core base for our operations and liquidity needs, as explained in the preceding Deposit and funding profile section. |
Table of Contents
Royal Bank of Canada First Quarter 2020 37
| As at October 31, 2019 | ||||||||||||||||||||||||||||||||||||||||
| (Millions of Canadian dollars) | Less than 1 month | 1 to 3 months | 3 to 6 months | 6 to 9 months | 9 to 12 months | 1 year to 2 years | 2 years to 5 years | 5 years and greater | With no specific maturity | Total | ||||||||||||||||||||||||||||||
Assets | ||||||||||||||||||||||||||||||||||||||||
Cash and deposits with banks | $ | 62,095 | $ | 3 | $ | – | $ | – | $ | – | $ | – | $ | – | $ | – | $ | 2,557 | $ | 64,655 | ||||||||||||||||||||
Securities | ||||||||||||||||||||||||||||||||||||||||
Trading(1) | 96,229 | 14 | 45 | 10 | 21 | 64 | 97 | 8,601 | 41,453 | 146,534 | ||||||||||||||||||||||||||||||
Investment, net of applicable allowance | 3,069 | 3,960 | 3,857 | 2,886 | 3,511 | 16,203 | 24,638 | 43,907 | 439 | 102,470 | ||||||||||||||||||||||||||||||
Assets purchased under reverse repurchase agreements and securities borrowed | 164,870 | 62,971 | 41,569 | 10,985 | 14,993 | 133 | – | – | 11,440 | 306,961 | ||||||||||||||||||||||||||||||
Loans, net of applicable allowance | 23,097 | 17,145 | 25,854 | 28,796 | 29,533 | 120,524 | 232,364 | 51,049 | 90,494 | 618,856 | ||||||||||||||||||||||||||||||
Other | ||||||||||||||||||||||||||||||||||||||||
Customers’ liability under acceptances | 12,940 | 5,119 | 27 | – | – | – | – | – | (24 | ) | 18,062 | |||||||||||||||||||||||||||||
Derivatives | 5,668 | 8,635 | 4,265 | 3,227 | 3,547 | 9,815 | 18,753 | 47,649 | 1 | 101,560 | ||||||||||||||||||||||||||||||
Other financial assets | 28,296 | 1,400 | 1,193 | 48 | 61 | 169 | 277 | 1,861 | 2,164 | 35,469 | ||||||||||||||||||||||||||||||
Total financial assets | $ | 396,264 | $ | 99,247 | $ | 76,810 | $ | 45,952 | $ | 51,666 | $ | 146,908 | $ | 276,129 | $ | 153,067 | $ | 148,524 | $ | 1,394,567 | ||||||||||||||||||||
Othernon-financial assets | 2,907 | 1,475 | 108 | 865 | 109 | 1,373 | 1,507 | 1,696 | 24,328 | 34,368 | ||||||||||||||||||||||||||||||
Total assets | $ | 399,171 | $ | 100,722 | $ | 76,918 | $ | 46,817 | $ | 51,775 | $ | 148,281 | $ | 277,636 | $ | 154,763 | $ | 172,852 | $ | 1,428,935 | ||||||||||||||||||||
Liabilities and equity | ||||||||||||||||||||||||||||||||||||||||
Deposits(2) | ||||||||||||||||||||||||||||||||||||||||
Unsecured borrowing | $ | 50,872 | $ | 36,251 | $ | 47,307 | $ | 38,376 | $ | 42,885 | $ | 28,886 | $ | 51,557 | $ | 20,230 | $ | 470,027 | $ | 786,391 | ||||||||||||||||||||
Secured borrowing | 2,588 | 4,874 | 10,679 | 3,596 | 2,395 | 10,351 | 19,535 | 5,755 | – | 59,773 | ||||||||||||||||||||||||||||||
Covered bonds | – | – | 4,828 | – | 5,255 | 10,818 | 13,263 | 5,677 | – | 39,841 | ||||||||||||||||||||||||||||||
Other | ||||||||||||||||||||||||||||||||||||||||
Acceptances | 12,944 | 5,119 | 27 | – | – | – | – | – | 1 | 18,091 | ||||||||||||||||||||||||||||||
Obligations related to securities sold short | 35,069 | – | – | – | – | – | – | – | – | 35,069 | ||||||||||||||||||||||||||||||
Obligations related to assets sold under repurchase agreements and securities loaned | 192,855 | 14,281 | 13,462 | 6 | – | 4 | – | – | 5,978 | 226,586 | ||||||||||||||||||||||||||||||
Derivatives | 6,325 | 7,779 | 4,519 | 3,430 | 3,442 | 9,155 | 17,348 | 46,515 | 30 | 98,543 | ||||||||||||||||||||||||||||||
Other financial liabilities | 29,008 | 1,066 | 849 | 290 | 443 | 272 | 701 | 8,510 | 691 | 41,830 | ||||||||||||||||||||||||||||||
Subordinated debentures | – | – | – | – | – | – | 316 | 9,499 | – | 9,815 | ||||||||||||||||||||||||||||||
Total financial liabilities | $ | 329,661 | $ | 69,370 | $ | 81,671 | $ | 45,698 | $ | 54,420 | $ | 59,486 | $ | 102,720 | $ | 96,186 | $ | 476,727 | $ | 1,315,939 | ||||||||||||||||||||
Othernon-financial liabilities | 1,314 | 5,288 | 276 | 154 | 142 | 898 | 903 | 11,179 | 9,217 | 29,371 | ||||||||||||||||||||||||||||||
Equity | – | – | – | – | – | – | – | – | 83,625 | 83,625 | ||||||||||||||||||||||||||||||
Total liabilities and equity | $ | 330,975 | $ | 74,658 | $ | 81,947 | $ | 45,852 | $ | 54,562 | $ | 60,384 | $ | 103,623 | $ | 107,365 | $ | 569,569 | $ | 1,428,935 | ||||||||||||||||||||
Off-balance sheet items | ||||||||||||||||||||||||||||||||||||||||
Financial guarantees | $ | 427 | $ | 2,409 | $ | 2,088 | $ | 2,829 | $ | 2,382 | $ | 986 | $ | 5,394 | $ | 45 | $ | 48 | $ | 16,608 | ||||||||||||||||||||
Lease commitments | 69 | 137 | 204 | 197 | 198 | 719 | 1,619 | 3,032 | – | 6,175 | ||||||||||||||||||||||||||||||
Commitments to extend credit | 2,996 | 6,367 | 8,821 | 10,655 | 11,638 | 41,740 | 150,267 | 27,827 | 3,865 | 264,176 | ||||||||||||||||||||||||||||||
Other credit-related commitments | 469 | 934 | 1,615 | 1,863 | 1,365 | 191 | 634 | 10 | 92,392 | 99,473 | ||||||||||||||||||||||||||||||
Other commitments | 35 | – | – | – | – | – | – | – | 484 | 519 | ||||||||||||||||||||||||||||||
Totaloff-balance sheet items | $ | 3,996 | $ | 9,847 | $ | 12,728 | $ | 15,544 | $ | 15,583 | $ | 43,636 | $ | 157,914 | $ | 30,914 | $ | 96,789 | $ | 386,951 | ||||||||||||||||||||
| (1) | Trading debt securities classified as FVTPL have been included in the less than 1 month category as there is no expectation to hold these assets to their contractual maturity. |
| (2) | A major portion of relationship-based deposits are repayable on demand or at short notice on a contractual basis while, in practice, these customer balances form a core base for our operations and liquidity needs, as explained in the preceding Deposit and funding profile section. |
|
We continue to manage our capital in accordance with our Capital Management Framework as described in our 2019 Annual Report. In addition, we continue to monitor and prepare for new regulatory capital developments, including the BCBS Basel III reforms, in order to ensure timely and accurate compliance with these requirements as disclosed in the Capital management and Capital, liquidity and other regulatory developments in our 2019 Annual Report, as updated below.
OSFI expects Canadian banks to meet the Basel III targets for CET1, Tier 1 and Total capital ratios. Under Basel III, banks select from two main approaches, the Standardized Approach or the Internal ratings-based (IRB) approach, to calculate their minimum regulatory capital required to support credit, market and operational risks. Effective November 1, 2019, we adopted the Standardized Approach for consolidated regulatory reporting of operational risk as the use of the Advanced Measurement Approach was discontinued by OSFI.
The Financial Stability Board (FSB) has re-designated us as a Global Systemically Important Bank (G-SIB). This designation requires us to maintain a higher loss absorbency requirement (common equity as a percentage of risk-weighted assets) of 1%. As the Domestic Systemically Important Bank(D-SIB) requirement is equivalent to theG-SIB requirement of 1% of RWA, theG-SIB re-designation had no further impact to the loss absorbency requirements on our CET1 ratio.
Table of Contents
38 Royal Bank of Canada First Quarter 2020
The following table provides a summary of OSFI’s current regulatory target ratios under Basel III and Pillar 2 requirements. We are in compliance with all current capital and leverage requirements imposed by OSFI:
Basel III capital and leverage ratios | OSFI regulatory target requirements for large banks under Basel III | RBC capital and leverage ratios as at January 31, 2020 | Domestic Stability Buffer (3) | Minimum including Capital Buffers, D-SIB/G-SIB surcharge and Domestic Stability Buffer | ||||||||||||||||||||||||||||||
| Minimum | Capital Buffers (1) | Minimum including Capital Buffers | D-SIB/G-SIB Surcharge (2) | Minimum including Capital Buffers andD-SIB/G-SIB surcharge (2) | ||||||||||||||||||||||||||||||
| Common Equity Tier 1 | 4.5% | 2.5% | 7.0% | 1.0% | 8.0% | 12.0% | 2.0% | 10.0% | ||||||||||||||||||||||||||
| Tier 1 capital | 6.0% | 2.5% | 8.5% | 1.0% | 9.5% | 13.1% | 2.0% | 11.5% | ||||||||||||||||||||||||||
| Total capital | 8.0% | 2.5% | 10.5% | 1.0% | 11.5% | 14.9% | 2.0% | 13.5% | ||||||||||||||||||||||||||
| Leverage ratio | 3.0% | n.a. | 3.0% | n.a. | 3.0% | 4.2% | n.a. | 3.0% | ||||||||||||||||||||||||||
| (1) | The capital buffers include the capital conservation buffer and the countercyclical capital buffer as prescribed by OSFI. |
| (2) | A capital surcharge, equal to the higher of ourD-SIB surcharge and the BCBS’sG-SIB surcharge, is applicable to risk-weighted capital. |
| (3) | Effective April 30, 2020, OSFI has raised the level for the Domestic Stability Buffer (DSB) to 2.25% of RWA from 2.0%. |
| n.a. | not applicable. |
The following table provides details on our regulatory capital, RWA, and capital and leverage ratios. Our capital position remains strong and our capital and leverage ratios remain well above OSFI regulatory targets.
| As at | ||||||||||||
| (Millions of Canadian dollars, except percentage amounts and as otherwise noted) | January 31 2020 | October 31 2019 | January 31 2019 | |||||||||
Capital(1) | ||||||||||||
CET1 capital | $ | 63,054 | $ | 62,184 | $ | 57,963 | ||||||
Tier 1 capital | 68,709 | 67,861 | 64,341 | |||||||||
Total capital | 78,220 | 77,888 | 73,758 | |||||||||
Risk-weighted Assets (RWA) used in calculation of capital ratios(1) | ||||||||||||
Credit risk | $ | 428,067 | $ | 417,835 | $ | 410,003 | ||||||
Market risk | 28,415 | 28,917 | 34,862 | |||||||||
Operational risk | 67,243 | 66,104 | 63,647 | |||||||||
Total RWA | $ | 523,725 | $ | 512,856 | $ | 508,512 | ||||||
Capital ratios and Leverage ratio(1) | ||||||||||||
CET1 ratio | 12.0% | 12.1% | 11.4% | |||||||||
Tier 1 capital ratio | 13.1% | 13.2% | 12.7% | |||||||||
Total capital ratio | 14.9% | 15.2% | 14.5% | |||||||||
Leverage ratio | 4.2% | 4.3% | 4.3% | |||||||||
Leverage ratio exposure (billions) | $ | 1,630 | $ | 1,570 | $ | 1,502 | ||||||
| (1) | Capital, RWA, and capital ratios are calculated using OSFI’s (Capital Adequacy Requirements) guideline based on the Basel III framework. The Leverage ratio is calculated using OSFI Leverage Requirements Guideline based on the Basel III framework. |
Q1 2020 vs. Q4 2019
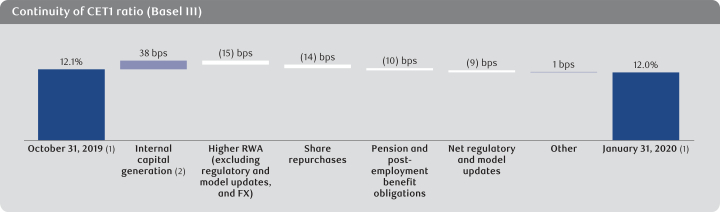
| (1) | Represents rounded figures. |
| (2) | Internal capital generation of $1.9 billion which represents Net income available to shareholders, less common and preferred shares dividends. |
Table of Contents
Royal Bank of Canada First Quarter 2020 39
Our CET1 ratio was 12.0%, down 10 bps from last quarter, mainly reflecting higher RWA, share repurchases, the impact of lower discount rates in determining our pension and other post-employment benefit obligations, and the impact of regulatory changes, including the impact of IFRS 16, net of normal course model updates. These factors were partially offset by internal capital generation.
Our Tier 1 capital ratio of 13.1% was down 10 bps, reflecting the factors noted above under the CET1 ratio.
Our Total capital ratio of 14.9% was down 30 bps, reflecting the factors noted above under the Tier 1 ratio. Total capital ratio was also negatively impacted by the net redemption of subordinated debentures.
RWA increased by $11 billion, mainly driven by business growth in wholesale and personal lending and the net impact of regulatory and model updates. The regulatory and model updates reflect the unfavourable impact of the adoption of IFRS 16, and removal of allowed grandfathering and transitioning treatment for certain securitization and counterparty credit risk exposures, partially offset by the favorable impact of normal course risk parameters changes.
Our Leverage ratio of 4.2% was down 10 bps from last quarter, mainly reflecting share repurchases, the impact of lower discount rates in determining our pension and other post-employment benefit obligations, and the impact of the adoption of IFRS 16. Higher leverage exposures were largely offset by internal capital generation. The increase in leverage exposures was primarily attributable to growth in securities, repo-style transactions, retail and wholesale lending, and derivatives.
Selected capital management activity
The following table provides our selected capital management activity:
| For the three months ended January 31, 2020 | ||||||||||||
| (Millions of Canadian dollars, except number of shares) | Issuance or redemption date | Number of shares (000s) | Amount | |||||||||
Tier 1 capital | ||||||||||||
Common shares activity | ||||||||||||
Issued in connection with share-based compensation plans(1) | 233 | $ | 18 | |||||||||
Purchased for cancellation | (6,993 | ) | (86 | ) | ||||||||
Tier 2 capital | ||||||||||||
Redemption of December 6, 2024 subordinated debentures(2) | December 6, 2019 | $ | (2,000 | ) | ||||||||
Issuance of December 23, 2029 subordinated debentures(2) (3) | December 23, 2019 | 1,500 | ||||||||||
Other | ||||||||||||
Purchase and cancellation of preferred shares Series C-2(2) | December 17, 2019 | (5 | ) | $ | (8 | ) | ||||||
| (1) | Amounts include cash received for stock options exercised during the period and includes fair value adjustments to stock options. |
| (2) | For further details, refer to Note 8 of our Condensed Financial Statements. |
| (3) | Non-Viable Contingent Capital (NVCC) instruments. |
On February 27, 2019, we announced a normal course issuer bid (NCIB) to purchase up to 20 million of our common shares, commencing on March 1, 2019 and continuing until February 29, 2020, or such earlier date as we complete the repurchase of all shares permitted under the bid.
For the three-months ended January 31, 2020, the total number of common shares repurchased and cancelled under our NCIB program was approximately 7.0 million. The total cost of the shares repurchased was $727 million.
Since the inception of the current NCIB, the total number of common shares repurchased and cancelled was approximately 13.6 million, at a cost of approximately $1,409 million.
We determine the amount and timing of the purchases under the NCIB, subject to prior consultation with OSFI. Purchases may be made through the TSX, the NYSE and other designated exchanges and alternative Canadian trading systems. The price paid for repurchased shares is at the prevailing market price at the time of acquisition.
On December 6, 2019, we redeemed all $2,000 million of our outstanding 2.99% subordinated debentures due on December 6, 2024 for 100% of their principal amount plus interest accrued to, but excluding, the redemption date.
On December 17, 2019, we purchased for cash 200,000 depositary shares, each representing a one-fortieth interest in a share of our Fixed Rate/Floating Rate Non-Cumulative First Preferred Shares, Series C-2 (C-2 Preferred Shares), for aggregate total consideration, including accrued dividends, of US$6 million. The purchased depositary and underlying C-2 Preferred Shares were subsequently cancelled. The C-2 Preferred Shares do not qualify as Tier 1 regulatory capital.
On December 23, 2019, we issued $1,500 million of NVCC subordinated debentures. The notes bear interest at a fixed rate of 2.88% per annum until December 23, 2024, and at the three-month Canadian Dollar Offered Rate (CDOR) plus 0.89% thereafter until their maturity on December 23, 2029.
Table of Contents
40 Royal Bank of Canada First Quarter 2020
Selected share data(1)
| As at January 31, 2020 | ||||||||||||
(Millions of Canadian dollars, except number of shares and as otherwise noted) | Number of shares (000s) | Amount | Dividends declared per share | |||||||||
Common shares issued | 1,423,918 | $ | 17,577 | $ 1.05 | ||||||||
Treasury shares – common shares | (706 | ) | (72 | ) | ||||||||
Common shares outstanding | 1,423,212 | $ | 17,505 | |||||||||
Stock options and awards | ||||||||||||
Outstanding | 8,545 | |||||||||||
Exercisable | 4,104 | |||||||||||
First preferred shares issued | ||||||||||||
Non-cumulative Series W(2) | 12,000 | $ | 300 | $ 0.31 | ||||||||
Non-cumulative Series AA | 12,000 | 300 | 0.28 | |||||||||
Non-cumulative Series AC | 8,000 | 200 | 0.29 | |||||||||
Non-cumulative Series AE | 10,000 | 250 | 0.28 | |||||||||
Non-cumulative Series AF | 8,000 | 200 | 0.28 | |||||||||
Non-cumulative Series AG | 10,000 | 250 | 0.28 | |||||||||
Non-cumulative Series AZ(3) (4) | 20,000 | 500 | 0.23 | |||||||||
Non-cumulative Series BB(3) (4) | 20,000 | 500 | 0.23 | |||||||||
Non-cumulative Series BD(3) (4) | 24,000 | 600 | 0.23 | |||||||||
Non-cumulative Series BF(3) (4) | 12,000 | 300 | 0.23 | |||||||||
Non-cumulative Series BH(4) | 6,000 | 150 | 0.31 | |||||||||
Non-cumulative Series BI(4) | 6,000 | 150 | 0.31 | |||||||||
Non-cumulative Series BJ(4) | 6,000 | 150 | 0.33 | |||||||||
Non-cumulative Series BK(3) (4) | 29,000 | 725 | 0.34 | |||||||||
Non-cumulative Series BM(3) (4) | 30,000 | 750 | 0.34 | |||||||||
Non-cumulative Series BO(3) (4) | 14,000 | 350 | 0.30 | |||||||||
Non-cumulative SeriesC-2(5) | 15 | 23 | US$ 16.88 | |||||||||
Preferred shares issued | 227,015 | $ | 5,698 | |||||||||
Treasury shares – preferred shares(6) | 11 | 1 | ||||||||||
Preferred shares outstanding | 227,026 | $ | 5,699 | |||||||||
Dividends | ||||||||||||
Common | $ | 1,496 | ||||||||||
Preferred(7) | 65 | |||||||||||
| (1) | For further details about our capital management activity, refer to Note 8 of our Condensed Financial Statements. |
| (2) | Effective February 24, 2010, we have the right to convert these shares into common shares at our option, subject to certain restrictions. |
| (3) | Dividend rate will reset every five years. |
| (4) | NVCC instruments. |
| (5) | Represents 615,400 depositary shares relating to preferred shares SeriesC-2. Each depositary share representsone-fortieth interest in a share of SeriesC-2. |
| (6) | Positive amounts represent a short position in treasury shares. |
| (7) | Dividends on preferred shares excludes distributions tonon-controlling interests. |
As at February 14, 2020, the number of outstanding common shares was 1,422,707,786, net of treasury shares held of 1,236,482, and the number of stock options and awards was 8,519,006.
NVCC provisions require the conversion of the capital instrument into a variable number of common shares in the event that OSFI deems a bank to benon-viable or a federal or provincial government in Canada publicly announces that a bank has accepted or agreed to accept a capital injection. If a NVCC trigger event were to occur, our NVCC capital instruments, which are the preferred shares Series AZ, BB, BD, BF, BH, BI, BJ, BK, BM, BO, and subordinated debentures due on September 29, 2026, June 4, 2025, January 20, 2026, January 27, 2026, July 25, 2029 and December 23, 2029, would be converted into RBC common shares pursuant to an automatic conversion formula with a conversion price based on the greater of: (i) a contractual floor price of $5.00, and (ii) the current market price of our common shares at the time of the trigger event(10-day weighted average). Based on a floor price of $5.00 and including an estimate for accrued dividends and interest, these NVCC capital instruments would convert into a maximum of 3,433 million RBC common shares, in aggregate, which would represent a dilution impact of 70.69% based on the number of RBC common shares outstanding as at January 31, 2020.
40 Royal Bank of Canada First Quarter 2020
Table of Contents
Royal Bank of Canada First Quarter 2020 41
Global systemically important banks(G-SIBs) 12 assessment indicators(1)
The BCBS and FSB use 12 indicators in the assessment methodology for determining the systemic importance of large global banks. As noted previously, we are designated as aG-SIB. The following table provides the 12 indicators used in theG-SIB assessment:
| As at | ||||||||
| (Millions of Canadian dollars) | October 31 2019 | October 31 2018 | ||||||
Cross-jurisdictional activity(2) | ||||||||
Cross-jurisdictional claims | $ | 701,483 | $ | 612,292 | ||||
Cross-jurisdictional liabilities | 501,986 | 441,686 | ||||||
Size(3) | ||||||||
Total exposures as defined for use in the Basel III leverage ratio | 1,586,125 | 1,467,438 | ||||||
Interconnectedness(4) | ||||||||
Intra-financial system assets | 124,110 | 126,112 | ||||||
Intra-financial system liabilities | 130,236 | 140,979 | ||||||
Securities outstanding | 375,392 | 353,591 | ||||||
Substitutability/financial institution infrastructure(5) | ||||||||
Payment activity | 45,107,658 | 42,917,581 | ||||||
Assets under custody | 4,387,931 | 4,262,294 | ||||||
Underwritten transactions in debt and equity markets | 293,438 | 245,992 | ||||||
Complexity(6) | ||||||||
Notional amount ofover-the-counter derivatives(7) | 19,489,915 | 17,467,923 | ||||||
Trading and investment securities | 63,309 | 55,855 | ||||||
Level 3 assets | 2,568 | 2,549 | ||||||
| (1) | TheG-SIBs indicators are prepared based on the methodology prescribed in BCBS guidelines published in July 2013 and instructions provided by BCBS in January 2020. The indicators are based on regulatory scope of consolidation, which excludes RBC Insurance® subsidiaries. For our 2019 standaloneG-SIB disclosure, please refer to our Regulatory Disclosures at rbc.com/investorrelations/. |
| (2) | Represents a bank’s level of interaction outside its domestic jurisdiction. |
| (3) | Represents the totalon- andoff- balance sheet exposures of the bank determined as per OSFI’s Basel III leverage ratio rules before regulatory adjustments. |
| (4) | Represents transactions with other financial institutions. |
| (5) | Represents the extent to which the bank’s services could be substituted by other institutions. |
| (6) | Includes the level of complexity and volume of a bank’s trading activities represented through derivatives, trading securities, investment securities and level 3 assets. |
| (7) | On November 1, 2018, we prospectively implemented the standardized approach for measuring counterparty credit risk (SA-CCR) in accordance with the CAR guidelines in determining our derivative notional amounts. |
Q4 2019 vs. Q4 2018
During 2019, notional amounts ofover-the-counter derivatives increased mainly due to higher trading activity in interest rate swaps and foreign exchange contracts. Total exposures as defined for use in the Basel III leverage ratio increased due to client activity in our assets purchased under reverse repurchase agreements and securities borrowed, and volume growth in loans (net of allowance for loan losses). Other movements from the prior year primarily reflect normal changes in business activity.
Total loss absorbing capacity (TLAC)
On April 18, 2018, OSFI released its final guideline on Total Loss Absorbing Capacity (TLAC), which applies to Canadian D-SIBs as part of the Federal Government’s Bail-in regime. The guideline is consistent with the TLAC standard released on November 9, 2015 by the FSB for institutions designated as G-SIBs, but tailored to the Canadian context. The TLAC requirement is intended to address the sufficiency of a systemically important bank’s loss absorbing capacity in supporting its recapitalization in the event of its failure. TLAC is defined as the aggregate of Tier 1 capital, Tier 2 capital, and other TLAC instruments, which allow conversion in whole or in part into common shares under the CDIC Act and meet all of the eligibility criteria under the guideline.
TLAC requirements established two minimum standards, which are required to be met effective November 1, 2021: the risk-based TLAC ratio, which builds on the risk-based capital ratios described in the CAR guideline, and the TLAC leverage ratio, which builds on the leverage ratio described in OSFI’s Leverage Requirements guideline. OSFI notified systemically important banks of the requirement to maintain a minimum TLAC ratio of 23.75%, which includes the revised DSB of 2.25%, effective April 30, 2020, and a TLAC leverage ratio of 6.75%. We began issuing bail-in eligible debt in the fourth quarter of 2018 and this has contributed to increasing our TLAC ratio. We expect our TLAC ratio to increase through normal course refinancing of maturing unsecured term debt.
Regulatory developments
Domestic stability buffer
On December 10, 2019, OSFI announced that the DSB will be increased from 2.0% to 2.25% of total RWA, effective April 30, 2020. This change arose from OSFI’s semi-annual review of the DSB, based on its ongoing monitoring of federally regulated financial institutions as well as OSFI’s view that key vulnerabilities to D-SIBs remain elevated. We do not anticipate any challenges in meeting this requirement by the effective date.
Table of Contents
42 Royal Bank of Canada First Quarter 2020
Basel III reforms – operational risk
Effective November 1, 2019, institutions are required to use the current Basel III Standardized Approach (TSA) as the use of the Advanced Measurement Approach is no longer allowed and there was no impact to our capital ratios resulting from this change. Under the Basel III reforms, OSFI revised its capital requirement for operational risk applicable to deposit taking institutions and a new Standardized Approach (SA) will be required. On January 20, 2020 OSFI extended the effective implementation date to Q1 2022 from the previous effective date of Q1 2021. We are currently assessing the expected impact on adoption.
Accounting and control matters
|
Summary of accounting policies and estimates
|
Our Condensed Financial Statements are presented in compliance with International Accounting Standard (IAS) 34Interim Financial Reporting. Our significant accounting policies are described in Note 2 of our audited 2019 Annual Consolidated Financial Statements and our Q1 2020 Condensed Financial Statements.
Changes in accounting policies and disclosures
|
Changes in accounting policies
During the first quarter, we adopted IFRS 16Leases (IFRS 16).As permitted by the transition provisions of IFRS 16, we elected not to restate comparative period results; accordingly, all comparative period information prior to the current quarter is presented in accordance with our previous accounting policies, as described in our 2019 Annual Report. As a result of the adoption of IFRS 16, we recognizedright-of-use assets, lease liabilities and an adjustment to opening retained earnings as at November 1, 2019. Refer to Note 2 of our Condensed Financial Statements for details of these changes.
During the first quarter, we early adopted amendments to IFRS 9Financial Instruments, IAS 39Financial Instruments: Recognition and Measurement and IFRS 7Financial Instruments: Disclosures (Amendments). Refer to Note 2 of our Condensed Financial Statements for details of these changes.
Future changes in accounting policies and disclosures
Future changes in accounting policies and disclosures that are not yet effective for us are described in Note 2 of our audited 2019 Annual Consolidated Financial Statements.
|
Disclosure controls and procedures
As of January 31, 2020, management evaluated, under the supervision of and with the participation of the President and Chief Executive Officer and the Chief Financial Officer, the effectiveness of our disclosure controls and procedures as defined under rules adopted by the U.S. SEC. Based on that evaluation, the President and Chief Executive Officer and the Chief Financial Officer concluded that our disclosure controls and procedures were effective as of January 31, 2020.
Internal control over financial reporting
No changes were made in our internal control over financial reporting during the quarter ended January 31, 2020 that have materially affected, or are reasonably likely to materially affect, our internal control over financial reporting.
|
In the ordinary course of business, we provide normal banking services and operational services, and enter into other transactions with associated and other related corporations, including our joint venture entities, on terms similar to those offered tonon-related parties. We grant loans to directors, officers and other employees at rates normally accorded to preferred clients. In addition, we offer deferred share and other plans tonon-employee directors, executives and certain other key employees. For further information, refer to Notes 12 and 27 of our audited 2019 Annual Consolidated Financial Statements.
Table of Contents
Royal Bank of Canada First Quarter 2020 43
|
We aim to present transparent, high-quality risk disclosures by providing disclosures in our 2019 Annual Report, Q1 2020 Report to Shareholders (RTS), Supplementary Financial Information package (SFI), and Pillar 3 Report, in accordance with recommendations from the Financial Stability Board’s (FSB) Enhanced Disclosure Task Force (EDTF). Information within the SFI and Pillar 3 Report is not and should not be considered incorporated by reference into our Q1 2020 Report to Shareholders.
The following index summarizes our disclosure by EDTF recommendation:
| Location of disclosure | ||||||||||
| Type of Risk | Recommendation | Disclosure | RTS page | Annual Report page | SFI page | |||||
| General | 1 | Table of contents for EDTF risk disclosure | 43 | 110 | 1 | |||||
| 2 | Define risk terminology and measures | 49-54, 213-214 | – | |||||||
| 3 | Top and emerging risks | 47-48 | – | |||||||
| 4 | New regulatory ratios | 37-38 | 90-94 | – | ||||||
| Risk governance, risk management and business model | 5 | Risk management organization | 49-54 | – | ||||||
| 6 | Risk culture | 50-54 | – | |||||||
| 7 | Risk in the context of our business activities | 97 | – | |||||||
| 8 | Stress testing | 51-52, 66 | – | |||||||
| Capital adequacy and risk-weighted assets (RWA) | 9 | Minimum Basel III capital ratios and Domestic systemically important bank surcharge | 38 | 90-94 | – | |||||
| 10 | Composition of capital and reconciliation of the accounting balance sheet to the regulatory balance sheet | – | 20-23 | |||||||
| 11 | Flow statement of the movements in regulatory capital | – | 24 | |||||||
| 12 | Capital strategic planning | 90-94 | – | |||||||
| 13 | RWA by business segments | – | 25 | |||||||
| 14 | Analysis of capital requirement, and related measurement model information | 55-58 | * | |||||||
| 15 | RWA credit risk and related risk measurements | – | * | |||||||
| 16 | Movement of risk-weighted assets by risk type | – | 25 | |||||||
| 17 | Basel back-testing | 51, 55 | 37 | |||||||
| Liquidity | 18 | Quantitative and qualitative analysis of our liquidity reserve | 30-31 | 72-74, 78-79 | – | |||||
| Funding | 19 | Encumbered and unencumbered assets by balance sheet category, and contractual obligations for rating downgrades | 32, 34 | 74, 77 | – | |||||
| 20 | Maturity analysis of consolidated total assets, liabilities andoff-balance sheet commitments analyzed by remaining contractual maturity at the balance sheet date | 36-37 | 79-80 | – | ||||||
| 21 | Sources of funding and funding strategy | 32-33 | 74-76 | – | ||||||
| Market risk | 22 | Relationship between the market risk measures for trading andnon-trading portfolios and the balance sheet | 29-30 | 70-71 | – | |||||
| 23 | Decomposition of market risk factors | 26-28 | 66-69 | – | ||||||
| 24 | Market risk validation and back-testing | 66 | – | |||||||
| 25 | Primary risk management techniques beyond reported risk measures and parameters | 66-69 | – | |||||||
| Credit risk | 26 | Bank’s credit risk profile | 19-25 | 54-65, 156-163 | 26-37,* | |||||
Quantitative summary of aggregate credit risk exposures that reconciles to the balance sheet | 59-62 | 104-109 | * | |||||||
| 27 | Policies for identifying impaired loans | 56-58, 99-100, 129-132 | – | |||||||
| 28 | Reconciliation of the opening and closing balances of impaired loans and impairment allowances during the year | – | 28, 33 | |||||||
| 29 | Quantification of gross notional exposure for OTC derivatives or exchange-traded derivatives | 59 | 39 | |||||||
| 30 | Credit risk mitigation, including collateral held for all sources of credit risk | 57-58 | 36 | |||||||
| Other | 31 | Other risk types | 82-89 | – | ||||||
| 32 | Publicly known risk events | 85-86, 201-202 | – | |||||||
| * | These disclosure requirements are satisfied or partially satisfied by disclosures provided in our Pillar 3 Report for the quarter ended January 31, 2020 and for the year ended October 31, 2019. |
Table of Contents
44 Royal Bank of Canada First Quarter 2020
Interim Condensed Consolidated Financial Statements(unaudited)
|
Interim Condensed Consolidated Balance Sheets(unaudited)
|
| As at | ||||||||
| (Millions of Canadian dollars) | January 31 2020 | October 31 2019 | ||||||
Assets | ||||||||
Cash and due from banks | $ | 34,120 | $ | 26,310 | ||||
Interest-bearing deposits with banks | 31,331 | 38,345 | ||||||
Securities | ||||||||
Trading | 145,015 | 146,534 | ||||||
Investment, net of applicable allowance(Note 4) | 121,652 | 102,470 | ||||||
| 266,667 | 249,004 | |||||||
Assets purchased under reverse repurchase agreements and securities borrowed | 324,187 | 306,961 | ||||||
Loans(Note 5) | ||||||||
Retail | 430,841 | 426,086 | ||||||
Wholesale | 202,238 | 195,870 | ||||||
| 633,079 | 621,956 | |||||||
Allowance for loan losses(Note 5) | (3,139 | ) | (3,100 | ) | ||||
| 629,940 | 618,856 | |||||||
Segregated fund net assets | 1,788 | 1,663 | ||||||
Other | ||||||||
Customers’ liability under acceptances | 18,801 | 18,062 | ||||||
Derivatives | 93,982 | 101,560 | ||||||
Premises and equipment | 8,257 | 3,191 | ||||||
Goodwill | 11,288 | 11,236 | ||||||
Other intangibles | 4,641 | 4,674 | ||||||
Other assets | 51,302 | 49,073 | ||||||
| 188,271 | 187,796 | |||||||
Total assets | $ | 1,476,304 | $ | 1,428,935 | ||||
Liabilities and equity | ||||||||
Deposits(Note 6) | ||||||||
Personal | $ | 302,002 | $ | 294,732 | ||||
Business and government | 569,236 | 565,482 | ||||||
Bank | 31,046 | 25,791 | ||||||
| 902,284 | 886,005 | |||||||
Segregated fund net liabilities | 1,788 | 1,663 | ||||||
Other | ||||||||
Acceptances | 18,844 | 18,091 | ||||||
Obligations related to securities sold short | 35,624 | 35,069 | ||||||
Obligations related to assets sold under repurchase agreements and securities loaned | 254,391 | 226,586 | ||||||
Derivatives | 94,611 | 98,543 | ||||||
Insurance claims and policy benefit liabilities | 12,259 | 11,401 | ||||||
Other liabilities | 63,173 | 58,137 | ||||||
| 478,902 | 447,827 | |||||||
Subordinated debentures(Note 8) | 9,269 | 9,815 | ||||||
Total liabilities | 1,392,243 | 1,345,310 | ||||||
Equity attributable to shareholders | ||||||||
Preferred shares(Note 8) | 5,699 | 5,707 | ||||||
Common shares(Note 8) | 17,505 | 17,587 | ||||||
Retained earnings | 56,279 | 55,981 | ||||||
Other components of equity | 4,472 | 4,248 | ||||||
| 83,955 | 83,523 | |||||||
Non-controlling interests | 106 | 102 | ||||||
Total equity | 84,061 | 83,625 | ||||||
Total liabilities and equity | $ | 1,476,304 | $ | 1,428,935 | ||||
The accompanying notes are an integral part of these Interim Condensed Consolidated Financial Statements.
Table of Contents
Royal Bank of Canada First Quarter 2020 45
Interim Condensed Consolidated Statements of Income(unaudited)
|
| For the three months ended | ||||||||
| January 31 | January 31 | |||||||
| (Millions of Canadian dollars, except per share amounts) | 2020 | 2019 | ||||||
Interest and dividend income(Note 3) | ||||||||
Loans | $ | 6,358 | $ | 6,160 | ||||
Securities | 1,742 | 1,696 | ||||||
Assets purchased under reverse repurchase agreements and securities borrowed | 2,009 | 2,148 | ||||||
Deposits and other | 129 | 145 | ||||||
| 10,238 | 10,149 | |||||||
Interest expense(Note 3) | ||||||||
Deposits and other | 3,020 | 3,262 | ||||||
Other liabilities | 1,914 | 1,948 | ||||||
Subordinated debentures | 83 | 92 | ||||||
| 5,017 | 5,302 | |||||||
Net interest income | 5,221 | 4,847 | ||||||
Non-interest income | ||||||||
Insurance premiums, investment and fee income | 1,994 | 1,579 | ||||||
Trading revenue | 458 | 395 | ||||||
Investment management and custodial fees | 1,535 | 1,450 | ||||||
Mutual fund revenue | 946 | 873 | ||||||
Securities brokerage commissions | 318 | 342 | ||||||
Service charges | 488 | 468 | ||||||
Underwriting and other advisory fees | 627 | 345 | ||||||
Foreign exchange revenue, other than trading | 253 | 249 | ||||||
Card service revenue | 287 | 282 | ||||||
Credit fees | 360 | 315 | ||||||
Net gains on investment securities | 11 | 46 | ||||||
Share of profit in joint ventures and associates | 22 | 15 | ||||||
Other | 316 | 383 | ||||||
| 7,615 | 6,742 | |||||||
Total revenue | 12,836 | 11,589 | ||||||
Provision for credit losses(Notes 4 and 5) | 419 | 514 | ||||||
Insurance policyholder benefits, claims and acquisition expense | 1,614 | 1,225 | ||||||
Non-interest expense | ||||||||
Human resources(Note 7) | 4,060 | 3,643 | ||||||
Equipment | 462 | 431 | ||||||
Occupancy | 397 | 397 | ||||||
Communications | 250 | 240 | ||||||
Professional fees | 284 | 305 | ||||||
Amortization of other intangibles | 303 | 290 | ||||||
Other | 622 | 606 | ||||||
| 6,378 | 5,912 | |||||||
Income before income taxes | 4,425 | 3,938 | ||||||
Income taxes | 916 | 766 | ||||||
Net income | $ | 3,509 | $ | 3,172 | ||||
Net income attributable to: | ||||||||
Shareholders | $ | 3,504 | $ | 3,170 | ||||
Non-controlling interests | 5 | 2 | ||||||
| $ | 3,509 | $ | 3,172 | |||||
Basic earnings per share(in dollars) (Note 9) | $ | 2.41 | $ | 2.15 | ||||
Diluted earnings per share(in dollars) (Note 9) | 2.40 | 2.15 | ||||||
Dividends per common share(in dollars) | 1.05 | 0.98 | ||||||
The accompanying notes are an integral part of these Interim Condensed Consolidated Financial Statements.
Table of Contents
46 Royal Bank of Canada First Quarter 2020
Interim Condensed Consolidated Statements of Comprehensive Income(unaudited)
|
| For the three months ended | ||||||||
| (Millions of Canadian dollars) | January 31 2020 | January 31 2019 | ||||||
Net income | $ | 3,509 | $ | 3,172 | ||||
Other comprehensive income (loss), net of taxes | ||||||||
Items that will be reclassified subsequently to income: | ||||||||
Net change in unrealized gains (losses) on debt securities and loans at fair value through other comprehensive income | ||||||||
Net unrealized gains (losses) on debt securities and loans at fair value through other comprehensive income | 183 | (1 | ) | |||||
Provision for credit losses recognized in income | (1 | ) | (1 | ) | ||||
Reclassification of net losses (gains) on debt securities and loans at fair value through other comprehensive income to income | (9 | ) | (29 | ) | ||||
| 173 | (31 | ) | ||||||
Foreign currency translation adjustments | ||||||||
Unrealized foreign currency translation gains (losses) | 411 | 35 | ||||||
Net foreign currency translation gains (losses) from hedging activities | (178 | ) | (66 | ) | ||||
Reclassification of losses (gains) on foreign currency translation to income | – | 2 | ||||||
Reclassification of losses (gains) on net investment hedging activities to income | – | 2 | ||||||
| 233 | (27 | ) | ||||||
Net change in cash flow hedges | ||||||||
Net gains (losses) on derivatives designated as cash flow hedges | (174 | ) | (316 | ) | ||||
Reclassification of losses (gains) on derivatives designated as cash flow hedges to income | (8 | ) | (74 | ) | ||||
| (182 | ) | (390 | ) | |||||
Items that will not be reclassified subsequently to income: | ||||||||
Remeasurements of employee benefit plans(Note 7) | (469 | ) | (394 | ) | ||||
Net fair value change due to credit risk on financial liabilities designated as fair value through profit or loss | (109 | ) | 163 | |||||
Net gains (losses) on equity securities designated at fair value through other comprehensive income | 1 | 7 | ||||||
| (577 | ) | (224 | ) | |||||
Total other comprehensive income (loss), net of taxes | (353 | ) | (672 | ) | ||||
Total comprehensive income (loss) | $ | 3,156 | $ | 2,500 | ||||
Total comprehensive income attributable to: | ||||||||
Shareholders | $ | 3,151 | $ | 2,497 | ||||
Non-controlling interests | 5 | 3 | ||||||
| $ | 3,156 | $ | 2,500 | |||||
The income tax effect on the Interim Condensed Consolidated Statements of Comprehensive Income is shown in the table below.
| For the three months ended | ||||||||
| (Millions of Canadian dollars) | January 31 2020 | January 31 2019 | ||||||
Income taxes on other comprehensive income | ||||||||
Net unrealized gains (losses) on debt securities and loans at fair value through other comprehensive income | $ | 55 | $ | (4 | ) | |||
Provision for credit losses recognized in income | – | – | ||||||
Reclassification of net losses (gains) on debt securities and loans at fair value through other comprehensive income to income | (3 | ) | (17 | ) | ||||
Unrealized foreign currency translation gains (losses) | – | 1 | ||||||
Net foreign currency translation gains (losses) from hedging activities | (62 | ) | (24 | ) | ||||
Reclassification of losses (gains) on net investment hedging activities to income | – | 1 | ||||||
Net gains (losses) on derivatives designated as cash flow hedges | (63 | ) | (113 | ) | ||||
Reclassification of losses (gains) on derivatives designated as cash flow hedges to income | (3 | ) | (27 | ) | ||||
Remeasurements of employee benefit plans | (167 | ) | (125 | ) | ||||
Net fair value change due to credit risk on financial liabilities designated as fair value through profit or loss | (39 | ) | 59 | |||||
Net gains (losses) on equity securities designated at fair value through other comprehensive income | (2 | ) | (1 | ) | ||||
Total income tax expenses (recoveries) | $ | (284 | ) | $ | (250 | ) | ||
The accompanying notes are an integral part of these Interim Condensed Consolidated Financial Statements.
Table of Contents
Royal Bank of Canada First Quarter 2020 47
Interim Condensed Consolidated Statements of Changes in Equity(unaudited)
|
| For the three months ended January 31, 2020 | ||||||||||||||||||||||||||||||||||||||||||||||||
| Other components of equity | �� | |||||||||||||||||||||||||||||||||||||||||||||||
| (Millions of Canadian dollars) | Preferred shares | Common shares | Treasury shares – preferred | Treasury shares – common | Retained earnings | FVOCI securities and loans | Foreign currency translation | Cash flow hedges | Total other components of equity | Equity attributable to shareholders | Non-controlling interests | Total equity | ||||||||||||||||||||||||||||||||||||
Balance at beginning of period | $ | 5,706 | $ | 17,645 | $ | 1 | $ | (58 | ) | $ | 55,981 | $ | 33 | $ | 4,221 | $ | (6 | ) | $ | 4,248 | $ | 83,523 | $ | 102 | $ | 83,625 | ||||||||||||||||||||||
Transition adjustment(Note 2) | – | – | – | – | (107 | ) | – | – | – | – | (107 | ) | – | (107 | ) | |||||||||||||||||||||||||||||||||
Adjusted balance at beginning of period | $ | 5,706 | $ | 17,645 | $ | 1 | $ | (58 | ) | $ | 55,874 | $ | 33 | $ | 4,221 | $ | (6 | ) | $ | 4,248 | $ | 83,416 | $ | 102 | $ | 83,518 | ||||||||||||||||||||||
Changes in equity | ||||||||||||||||||||||||||||||||||||||||||||||||
Issues of share capital | – | 18 | – | – | – | – | – | – | – | 18 | – | 18 | ||||||||||||||||||||||||||||||||||||
Common shares purchased for cancellation | – | (86 | ) | – | – | (641 | ) | – | – | – | – | (727 | ) | – | (727 | ) | ||||||||||||||||||||||||||||||||
Redemption of preferred shares | (8 | ) | – | – | – | – | – | – | – | – | (8 | ) | – | (8 | ) | |||||||||||||||||||||||||||||||||
Sales of treasury shares | – | – | 33 | 1,566 | – | – | – | – | – | 1,599 | – | 1,599 | ||||||||||||||||||||||||||||||||||||
Purchases of treasury shares | – | – | (33 | ) | (1,580 | ) | – | – | – | – | – | (1,613 | ) | – | (1,613 | ) | ||||||||||||||||||||||||||||||||
Share-based compensation awards | – | – | – | – | 2 | – | – | – | – | 2 | – | 2 | ||||||||||||||||||||||||||||||||||||
Dividends on common shares | – | – | – | – | (1,496 | ) | – | – | – | – | (1,496 | ) | – | (1,496 | ) | |||||||||||||||||||||||||||||||||
Dividends on preferred shares and other | – | – | – | – | (65 | ) | – | – | – | – | (65 | ) | (1 | ) | (66 | ) | ||||||||||||||||||||||||||||||||
Other | – | – | – | – | (322 | ) | – | – | – | – | (322 | ) | – | (322 | ) | |||||||||||||||||||||||||||||||||
Net income | – | – | – | – | 3,504 | – | – | – | – | 3,504 | 5 | 3,509 | ||||||||||||||||||||||||||||||||||||
Total other comprehensive income (loss), | – | – | – | – | (577 | ) | 173 | 233 | (182 | ) | 224 | (353 | ) | – | (353 | ) | ||||||||||||||||||||||||||||||||
Balance at end of period | $ | 5,698 | $ | 17,577 | $ | 1 | $ | (72 | ) | $ | 56,279 | $ | 206 | $ | 4,454 | $ | (188 | ) | $ | 4,472 | $ | 83,955 | $ | 106 | $ | 84,061 | ||||||||||||||||||||||
| For the three months ended January 31, 2019 | ||||||||||||||||||||||||||||||||||||||||||||||||
| Other components of equity | ||||||||||||||||||||||||||||||||||||||||||||||||
| (Millions of Canadian dollars) | Preferred shares | Common shares | Treasury shares – preferred | Treasury shares – common | Retained earnings | FVOCI securities and loans | Foreign currency translation | Cash flow hedges | Total other components of equity | Equity attributable to shareholders | Non-controlling interests | Total equity | ||||||||||||||||||||||||||||||||||||
Balance at beginning of period(Note 2) | $ | 6,306 | $ | 17,635 | $ | 3 | $ | (18 | ) | $ | 51,018 | $ | (12 | ) | $ | 4,147 | $ | 688 | $ | 4,823 | $ | 79,767 | $ | 94 | $ | 79,861 | ||||||||||||||||||||||
Changes in equity | ||||||||||||||||||||||||||||||||||||||||||||||||
Issues of share capital | 350 | 11 | – | – | – | – | – | – | – | 361 | – | 361 | ||||||||||||||||||||||||||||||||||||
Common shares purchased for cancellation | – | (45 | ) | – | – | (303 | ) | – | – | – | – | (348 | ) | – | (348 | ) | ||||||||||||||||||||||||||||||||
Redemption of preferred shares | (250 | ) | – | – | – | – | – | – | – | – | (250 | ) | – | (250 | ) | |||||||||||||||||||||||||||||||||
Sales of treasury shares | – | – | 82 | 1,529 | – | – | – | – | – | 1,611 | – | 1,611 | ||||||||||||||||||||||||||||||||||||
Purchases of treasury shares | – | – | (85 | ) | (1,547 | ) | – | – | – | – | – | (1,632 | ) | – | (1,632 | ) | ||||||||||||||||||||||||||||||||
Share-based compensation awards | – | – | – | – | 2 | – | – | – | – | 2 | – | 2 | ||||||||||||||||||||||||||||||||||||
Dividends on common shares | – | – | – | – | (1,407 | ) | – | – | – | – | (1,407 | ) | – | (1,407 | ) | |||||||||||||||||||||||||||||||||
Dividends on preferred shares and other | – | – | – | – | (74 | ) | – | – | – | – | (74 | ) | – | (74 | ) | |||||||||||||||||||||||||||||||||
Other | – | – | – | – | 2 | – | – | – | – | 2 | – | 2 | ||||||||||||||||||||||||||||||||||||
Net income | – | – | – | – | 3,170 | – | – | – | – | 3,170 | 2 | 3,172 | ||||||||||||||||||||||||||||||||||||
Total other comprehensive income (loss), | – | – | – | – | (224 | ) | (31 | ) | (28 | ) | (390 | ) | (449 | ) | (673 | ) | 1 | (672 | ) | |||||||||||||||||||||||||||||
Balance at end of period | $ | 6,406 | $ | 17,601 | $ | – | $ | (36 | ) | $ | 52,184 | $ | (43 | ) | $ | 4,119 | $ | 298 | $ | 4,374 | $ | 80,529 | $ | 97 | $ | 80,626 | ||||||||||||||||||||||
The accompanying notes are an integral part of these Interim Condensed Consolidated Financial Statements.
Table of Contents
48 Royal Bank of Canada First Quarter 2020
Interim Condensed Consolidated Statements of Cash Flows(unaudited)
|
| For the three months ended | ||||||||
| (Millions of Canadian dollars) | January 31 2020 | January 31 2019 | ||||||
Cash flows from operating activities | ||||||||
Net income | $ | 3,509 | $ | 3,172 | ||||
Adjustments fornon-cash items and others | ||||||||
Provision for credit losses | 419 | 514 | ||||||
Depreciation | 333 | 150 | ||||||
Deferred income taxes | 14 | (171 | ) | |||||
Amortization and impairment of other intangibles | 311 | 293 | ||||||
Net changes in investments in joint ventures and associates | (22 | ) | (15 | ) | ||||
Losses (Gains) on investment securities | (12 | ) | (49 | ) | ||||
Losses (Gains) on disposition of businesses | 8 | – | ||||||
Adjustments for net changes in operating assets and liabilities | ||||||||
Insurance claims and policy benefit liabilities | 858 | 512 | ||||||
Net change in accrued interest receivable and payable | (98 | ) | 122 | |||||
Current income taxes | (255 | ) | (159 | ) | ||||
Derivative assets | 7,578 | 9,223 | ||||||
Derivative liabilities | (3,932 | ) | (8,472 | ) | ||||
Trading securities | 1,504 | (9,915 | ) | |||||
Loans, net of securitizations | (11,635 | ) | (13,151 | ) | ||||
Assets purchased under reverse repurchase agreements and securities borrowed | (17,226 | ) | (3,058 | ) | ||||
Obligations related to assets sold under repurchase agreements and securities loaned | 27,805 | 17,715 | ||||||
Obligations related to securities sold short | 555 | 995 | ||||||
Deposits, net of securitizations | 17,236 | 15,482 | ||||||
Brokers and dealers receivable and payable | (644 | ) | (478 | ) | ||||
Other | (6,362 | ) | (1,483 | ) | ||||
Net cash from (used in) operating activities | 19,944 | 11,227 | ||||||
Cash flows from investing activities | ||||||||
Change in interest-bearing deposits with banks | 7,016 | (2,182 | ) | |||||
Proceeds from sales and maturities of investment securities | 16,804 | 18,304 | ||||||
Purchases of investment securities | (35,200 | ) | (20,668 | ) | ||||
Net acquisitions of premises and equipment and other intangibles | (745 | ) | (561 | ) | ||||
Net cash from (used in) investing activities | (12,125 | ) | (5,107 | ) | ||||
Cash flows from financing activities | ||||||||
Issuance of subordinated debentures | 1,500 | – | ||||||
Repayment of subordinated debentures | (2,000 | ) | – | |||||
Issue of common shares, net of issuance costs | 16 | 9 | ||||||
Common shares purchased for cancellation | (727 | ) | (348 | ) | ||||
Issue of preferred shares, net of issuance costs | – | 350 | ||||||
Redemption of preferred shares | (8 | ) | (250 | ) | ||||
Sales of treasury shares | 1,599 | 1,611 | ||||||
Purchases of treasury shares | (1,613 | ) | (1,632 | ) | ||||
Dividends paid | (1,567 | ) | (1,483 | ) | ||||
Dividends/distributions paid tonon-controlling interests | (1 | ) | – | |||||
Change in short-term borrowings of subsidiaries | 2,779 | 4,860 | ||||||
Repayment of lease liabilities | (141 | ) | ||||||
Net cash from (used in) financing activities | (163 | ) | 3,117 | |||||
Effect of exchange rate changes on cash and due from banks | 154 | 587 | ||||||
Net change in cash and due from banks | 7,810 | 9,824 | ||||||
Cash and due from banks at beginning of period(1) | 26,310 | 30,209 | ||||||
Cash and due from banks at end of period(1) | $ | 34,120 | $ | 40,033 | ||||
Cash flows from operating activities include: | ||||||||
Amount of interest paid(1) | $ | 4,757 | $ | 4,748 | ||||
Amount of interest received | 9,751 | 9,660 | ||||||
Amount of dividends received | 658 | 493 | ||||||
Amount of income taxes paid | 875 | 791 | ||||||
| (1) | We are required to maintain balances with central banks and other regulatory authorities. The total balances were $2.5 billion as at January 31, 2020 (October 31, 2019 – $2.6 billion; January 31, 2019 – $2.3 billion; October 31, 2018 – $2.4 billion). |
The accompanying notes are an integral part of these Interim Condensed Consolidated Financial Statements.
Table of Contents
Royal Bank of Canada First Quarter 2020 49
|
Our unaudited Interim Condensed Consolidated Financial Statements (Condensed Financial Statements) are presented in compliance with International Accounting Standard (IAS) 34Interim Financial Reporting. The Condensed Financial Statements do not include all the information and disclosures required in the annual financial statements and should be read in conjunction with our audited 2019 Annual Consolidated Financial Statements and the accompanying notes included on pages 111 to 211 in our 2019 Annual Report. Tabular information is stated in millions of Canadian dollars, except per share amounts and percentages. On February 20, 2020, the Board of Directors authorized the Condensed Financial Statements for issue.
Note 2 Summary of significant accounting policies, estimates and judgments
|
Except as indicated below, the Condensed Financial Statements have been prepared using the same accounting policies and methods used in preparation of our audited 2019 Annual Consolidated Financial Statements. Our significant accounting policies and future changes in accounting policies and disclosures that are not yet effective for us are described in Note 2 of our audited 2019 Annual Consolidated Financial Statements.
Changes in accounting policies
Leases
During the first quarter, we adopted IFRS 16Leases (IFRS 16), which sets out principles for the recognition, measurement, presentation and disclosure of leases, replacing the previous accounting standard for leases, IAS 17Leases (IAS 17). As a result of the application of IFRS 16, we changed our accounting policy for leasing as outlined below, applicable from November 1, 2019. As permitted by the transition provisions of IFRS 16, we elected not to restate comparative period results; accordingly, all comparative information is presented in accordance with our previous accounting policies, as described in our 2019 Annual Report.
As a result of the adoption of IFRS 16, we increased total assets by $5,084 million and total liabilities by $5,191 million, primarily representing leases of premises and equipment previously classified as operating leases, and reduced retained earnings by $107 million, net of taxes. The adoption of IFRS 16 reduced our CET1 capital ratio by 14 bps.
Leasing
At inception of a contract, we assess whether a contract is or contains a lease. A contract is, or contains, a lease if the contract conveys the right to obtain substantially all of the economic benefits from, and direct the use of, an identified asset for a period of time in return for consideration.
When we are the lessee in a lease arrangement, we initially record aright-of-use asset and corresponding lease liability, except for short-term leases and leases oflow-value assets. Short-term leases are leases with a lease term of 12 months or less.Low-value assets are unspecialized, common, technologically unsophisticated, widely available, and widely usednon-infrastructure assets. For short-term leases and leases oflow-value assets, we record the lease payments as an operating expense on a straight-line basis over the lease term.
Where we are reasonably certain to exercise extension and termination options, they are included in the lease term.
The lease liability is initially measured at the present value of the lease payments that are not paid at the commencement date, discounted at our incremental borrowing rate. The lease liability is subsequently measured at amortized cost using the effective interest method, recorded in Interest expense.
Theright-of-use asset is initially measured based on the initial amount of the lease liability, adjusted for lease payments made on or before the commencement date, initial direct costs incurred, and an estimate of costs to dismantle, remove, or restore the asset, less any lease incentives received.
Theright-of-use asset is depreciated to the earlier of the lease term and the useful life, unless ownership will transfer to RBC or we are reasonably certain to exercise a purchase option, in which case the useful life of theright-of-use asset is used. We apply IAS 36Impairment of assets to determine whether aright-of-use asset is impaired and account for any identified impairment loss as described in the premises and equipment accounting policies in our 2019 Annual Report.
Impact of adoption of IFRS 16 – Leases previously classified as operating leases
At transition, lease liabilities were measured at the present value of the remaining lease payments, discounted at our incremental borrowing rate as at November 1, 2019. We applied a weighted-average incremental borrowing rate of 2.3%.Right-of-use assets are generally measured at an amount equal to the lease liability, adjusted by any prepaid or accrued lease payments. For a select number of properties, theright-of-use assets were measured as if IFRS 16 had been applied since the commencement date of the lease, discounted using our incremental borrowing rate as at November 1, 2019. The following practical expedients were adopted when applying IFRS 16 to leases previously classified as operating leases under IAS 17:
| – | Election to not separate lease andnon-lease components, applied to our real estate leases; and |
| – | Exemption from recognition for short-term and low value leases. |
Table of Contents
50 Royal Bank of Canada First Quarter 2020
Note 2 Summary of significant accounting policies, estimates and judgments(continued) |
The following table reconciles our operating lease commitments at October 31, 2019, as previously disclosed in our 2019 Annual Consolidated Financial Statements, to the lease obligations recognized on initial application of IFRS 16 at November 1, 2019.
| (Millions of Canadian dollars) | ||||
Lease commitments disclosed as at October 31, 2019 | $ | 6,175 | ||
Less: commitments related tonon-recoverable tax | (360 | ) | ||
Less: commitments for contracts not yet commenced | (240 | ) | ||
Less: recognition exemption adopted for short-term and low-value leases | (83 | ) | ||
Plus: commitments for renewal options reasonably certain to be exercised | 977 | |||
Other | (26 | ) | ||
Adjusted operating lease commitments as at October 31, 2019 | 6,443 | |||
Discounted as at November 1, 2019 | 5,557 | |||
Finance lease liabilities recognized as at October 31, 2019 | 49 | |||
Lease liability recognized as at November 1, 2019 | $ | 5,606 | ||
Impact of adoption of IFRS 16 – Leases previously classified as finance leases
The carrying amount of theright-of-use asset and lease liability at November 1, 2019 for leases previously classified as finance leases under IAS 17 Leases was determined to be equal to the carrying amount of the lease asset and liability under IAS 17 immediately before the transition date.
Interest Rate Benchmark Reform
During the first quarter, we early adopted amendments to IFRS 9Financial Instruments, IAS 39Financial Instruments: Recognition and Measurement and IFRS 7Financial Instruments: Disclosures (Amendments), applicable from November 1, 2019. These amendments modify certain hedge accounting requirements to provide relief from the effect of uncertainty caused by interest rate benchmark reform (the Reform) prior to the transition to alternative interest rates. The adoption of the Amendments had no impact to our consolidated financial statements.
We will cease to apply these Amendments as interbank offered rate (IBOR) based cash flows transition to new risk free rates or when the hedging relationships to which the relief is applied are discontinued.
Hedge Accounting
Our accounting policies relating to hedge accounting are described in Note 2 and Note 8 of our 2019 Annual Report. We apply hedge accounting when designated hedging instruments are ‘highly effective’ in offsetting changes in the fair value or cash flows of the hedged items at inception and on an ongoing basis. We perform retrospective assessments to demonstrate that the relationship has been effective since designation of the hedge and prospective assessments to evaluate whether the hedge is expected to be effective over the remaining term of the hedge. While uncertainty due to IBOR reform exists, our prospective effectiveness testing is based on existing hedged cash flows or hedged risks. Any ineffectiveness arising from retrospective testing is recognized in net income.
In addition to potential sources of ineffectiveness outlined in Note 8 of our 2019 Annual Report, the Reform may result in ineffectiveness as the transition of hedged items and related hedging instruments from IBORs to new risk free rates may occur at different times. This may result in different impacts on the valuation or cash flow variability of hedged items and related hedging instruments.
Cash flow hedges
We apply hedge accounting for cash flow hedges when the cash flows giving rise to the risk being hedged have a high probability of occurring. While uncertainty due to IBOR reform exists, we apply the relief provided by the Amendments that the IBOR benchmarks, on which the highly probable hedged cash flows are based, are not altered as a result of the Reform. In addition, associated cash flow hedge reserves are not recycled into net income solely due to changes related to the transition from IBOR to new risk free rates.
Fair value hedges
We apply hedge accounting to IBOR rates which may not be contractually specified when that rate is separately identifiable and reliably measurable at inception of the hedge relationship.
Table of Contents
Royal Bank of Canada First Quarter 2020 51
Hedging relationships impacted by interest rate benchmark reform
The following table presents the notional amount of our hedging instruments which reference IBOR that will expire after 2021 and will be affected by the Reform. The notional amounts of our hedging instruments also approximates the extent of the risk exposure we manage through hedging relationships:
| As at November 1, 2019 | ||||
| (Millions of Canadian dollars) | Notional/Principal amounts (1) | |||
Interest rate contracts | ||||
USD LIBOR | $ | 26,709 | ||
EURO Interbank Offered Rate | 5,589 | |||
GBP LIBOR | 618 | |||
Non-derivative instruments | ||||
USD LIBOR | 888 | |||
GBP LIBOR | 682 | |||
| $ | 34,486 | |||
| (1) | Excludes interest rate contracts andnon-derivative instruments which reference rates in multi-rate jurisdictions, including the Canadian Dollar Offered Rate (CDOR) and Australian Bank Bill Swap Rate (BBSW). |
IFRS Interpretations Committee Interpretation 23Uncertainty over income tax treatments (IFRIC 23)
During the first quarter, we adopted IFRIC 23 which provides guidance on the recognition and measurement of tax assets and liabilities under IAS 12Income taxes when there is uncertainty over income tax treatments, replacing our application of IAS 37Provisions, contingent liabilities and contingent assets for uncertain tax positions. We are subject to income tax laws in various jurisdictions where we operate, and the complex tax laws are potentially subject to different interpretations by us and the relevant taxation authorities. Significant judgment is required in the interpretation of the relevant tax laws, and in assessing the probability of acceptance of our tax positions, which includes our best estimate of tax positions that are under audit or appeal by relevant taxation authorities. We perform a review on a quarterly basis to incorporate our best assessment based on information available, but additional liability and income tax expense could result based on the acceptance of our positions by the relevant tax authorities. The adoption of IFRIC 23 had no impact to our consolidated financial statements.
IFRS 15 Revenue from Contracts with Customers (IFRS 15)
On November 1, 2018, we adopted IFRS 15 and reduced our opening retained earnings. In the fourth quarter of 2019, we amended our opening reduction to retained earnings to $94 million on an after-tax basis. Comparative amounts have been revised from those previously presented.
Table of Contents
52 Royal Bank of Canada First Quarter 2020
Note 3 Fair value of financial instruments
|
Carrying value and fair value of financial instruments
The following tables provide a comparison of the carrying and fair values for each classification of financial instruments. Embedded derivatives are presented on a combined basis with the host contracts. Refer to Note 2 and Note 3 of our audited 2019 Annual Consolidated Financial Statements for a description of the valuation techniques and inputs used in the fair value measurement of our financial instruments. There have been no significant changes to our determination of fair value during the quarter.
| As at January 31, 2020 | ||||||||||||||||||||||||||||||||||||
| Carrying value and fair value | Carrying value | Fair value | ||||||||||||||||||||||||||||||||||
| (Millions of Canadian dollars) | Financial instruments classified as FVTPL | Financial instruments designated as FVTPL | Financial instruments classified as FVOCI | Financial instruments designated as FVOCI | Financial instruments measured at amortized cost | Financial instruments measured at amortized cost | Total carrying amount | Total fair value | ||||||||||||||||||||||||||||
Financial assets | ||||||||||||||||||||||||||||||||||||
Interest-bearing deposits | $ | – | $ | 19,151 | $ | – | $ | – | $ | 12,180 | $ | 12,180 | $ | 31,331 | $ | 31,331 | ||||||||||||||||||||
Securities | ||||||||||||||||||||||||||||||||||||
Trading | 135,110 | 9,905 | – | – | – | – | 145,015 | 145,015 | ||||||||||||||||||||||||||||
Investment, net of applicable allowance | – | – | 76,942 | 522 | 44,188 | 44,623 | 121,652 | 122,087 | ||||||||||||||||||||||||||||
| 135,110 | 9,905 | 76,942 | 522 | 44,188 | 44,623 | 266,667 | 267,102 | |||||||||||||||||||||||||||||
Assets purchased under reverse repurchase agreements and securities borrowed | 261,216 | – | – | – | 62,971 | 62,972 | 324,187 | 324,188 | ||||||||||||||||||||||||||||
Loans, net of applicable allowance | ||||||||||||||||||||||||||||||||||||
Retail | 282 | 252 | 95 | – | 428,194 | 429,591 | 428,823 | 430,220 | ||||||||||||||||||||||||||||
Wholesale | 8,776 | 1,973 | 449 | – | 189,919 | 189,599 | 201,117 | 200,797 | ||||||||||||||||||||||||||||
| 9,058 | 2,225 | 544 | – | 618,113 | 619,190 | 629,940 | 631,017 | |||||||||||||||||||||||||||||
Other | ||||||||||||||||||||||||||||||||||||
Derivatives | 93,982 | – | – | – | – | – | 93,982 | 93,982 | ||||||||||||||||||||||||||||
Other assets(1) | 3,053 | – | – | – | 51,146 | 51,145 | 54,199 | 54,198 | ||||||||||||||||||||||||||||
Financial liabilities | ||||||||||||||||||||||||||||||||||||
Deposits | ||||||||||||||||||||||||||||||||||||
Personal | $ | 125 | $ | 17,109 | $ | 284,768 | $ | 284,896 | $ | 302,002 | $ | 302,130 | ||||||||||||||||||||||||
Business and government(2) | 260 | 117,572 | 451,404 | 452,781 | 569,236 | 570,613 | ||||||||||||||||||||||||||||||
Bank(3) | – | 3,450 | 27,596 | 27,614 | 31,046 | 31,064 | ||||||||||||||||||||||||||||||
| 385 | 138,131 | 763,768 | 765,291 | 902,284 | 903,807 | |||||||||||||||||||||||||||||||
Other | ||||||||||||||||||||||||||||||||||||
Obligations related to securities sold short | 35,624 | – | – | – | 35,624 | 35,624 | ||||||||||||||||||||||||||||||
Obligations related to assets sold under repurchase agreements and securities loaned | – | 247,170 | 7,221 | 7,221 | 254,391 | 254,391 | ||||||||||||||||||||||||||||||
Derivatives | 94,611 | – | – | – | 94,611 | 94,611 | ||||||||||||||||||||||||||||||
Other liabilities(4) | (1,484 | ) | 71 | 61,838 | 61,826 | 60,425 | 60,413 | |||||||||||||||||||||||||||||
Subordinated debentures | – | – | 9,269 | 9,401 | 9,269 | 9,401 | ||||||||||||||||||||||||||||||
Table of Contents
Royal Bank of Canada First Quarter 2020 53
| As at October 31, 2019 | ||||||||||||||||||||||||||||||||||||
| Carrying value and fair value | Carrying value | Fair value | ||||||||||||||||||||||||||||||||||
| (Millions of Canadian dollars) | Financial instruments classified as FVTPL | Financial instruments designated as FVTPL | Financial instruments classified as FVOCI | Financial instruments designated as FVOCI | Financial instruments measured at amortized cost | Financial instruments measured at amortized cost | Total carrying amount | Total fair value | ||||||||||||||||||||||||||||
Financial assets | ||||||||||||||||||||||||||||||||||||
Interest-bearing deposits with banks | $ | – | $ | 22,283 | $ | – | $ | – | $ | 16,062 | $ | 16,062 | $ | 38,345 | $ | 38,345 | ||||||||||||||||||||
Securities | ||||||||||||||||||||||||||||||||||||
Trading | 137,600 | 8,934 | – | – | – | – | 146,534 | 146,534 | ||||||||||||||||||||||||||||
Investment, net of applicable allowance | – | – | 57,223 | 463 | 44,784 | 45,104 | 102,470 | 102,790 | ||||||||||||||||||||||||||||
| 137,600 | 8,934 | 57,223 | 463 | 44,784 | 45,104 | 249,004 | 249,324 | |||||||||||||||||||||||||||||
Assets purchased under reverse repurchase agreements and securities borrowed | 246,068 | – | – | – | 60,893 | 60,894 | 306,961 | 306,962 | ||||||||||||||||||||||||||||
Loans, net of applicable allowance | ||||||||||||||||||||||||||||||||||||
Retail | 275 | 242 | 95 | – | 423,469 | 424,416 | 424,081 | 425,028 | ||||||||||||||||||||||||||||
Wholesale | 7,055 | 1,856 | 451 | – | 185,413 | 184,645 | 194,775 | 194,007 | ||||||||||||||||||||||||||||
| 7,330 | 2,098 | 546 | – | 608,882 | 609,061 | 618,856 | 619,035 | |||||||||||||||||||||||||||||
Other | ||||||||||||||||||||||||||||||||||||
Derivatives | 101,560 | – | – | – | – | – | 101,560 | 101,560 | ||||||||||||||||||||||||||||
Other assets(1) | 3,156 | – | – | – | 50,375 | 50,375 | 53,531 | 53,531 | ||||||||||||||||||||||||||||
Financial liabilities | ||||||||||||||||||||||||||||||||||||
Deposits | ||||||||||||||||||||||||||||||||||||
Personal | $ | 140 | $ | 17,394 | $ | 277,198 | $ | 277,353 | $ | 294,732 | $ | 294,887 | ||||||||||||||||||||||||
Business and government(2) | 151 | 111,389 | 453,942 | 452,536 | 565,482 | 564,076 | ||||||||||||||||||||||||||||||
Bank(3) | – | 3,032 | 22,759 | 22,773 | 25,791 | 25,805 | ||||||||||||||||||||||||||||||
| 291 | 131,815 | 753,899 | 752,662 | 886,005 | 884,768 | |||||||||||||||||||||||||||||||
Other | ||||||||||||||||||||||||||||||||||||
Obligations related to securities sold short | 35,069 | – | – | – | 35,069 | 35,069 | ||||||||||||||||||||||||||||||
Obligations related to assets | – | 218,612 | 7,974 | 7,974 | 226,586 | 226,586 | ||||||||||||||||||||||||||||||
Derivatives | 98,543 | – | – | – | 98,543 | 98,543 | ||||||||||||||||||||||||||||||
Other liabilities(4) | (1,209 | ) | 91 | 61,039 | 61,024 | 59,921 | 59,906 | |||||||||||||||||||||||||||||
Subordinated debentures | – | – | 9,815 | 9,930 | 9,815 | 9,930 | ||||||||||||||||||||||||||||||
| (1) | Includes Customers’ liability under acceptances and financial instruments recognized in Other assets. |
| (2) | Business and government deposits include deposits from regulated deposit-taking institutions other than banks. |
| (3) | Bank deposits refer to deposits from regulated banks and central banks. |
| (4) | Includes Acceptances and financial instruments recognized in Other liabilities. |
Table of Contents
54 Royal Bank of Canada First Quarter 2020
Note 3 Fair value of financial instruments(continued) |
Fair value of assets and liabilities measured at fair value on a recurring basis and classified using the fair value hierarchy
As at
| ||||||||||||||||||||||||||||||||||||||||||
| January 31, 2020 | October 31, 2019 | |||||||||||||||||||||||||||||||||||||||||
| Fair value measurements using | Netting adjustments | Fair value | Fair value measurements using | Netting adjustments | Fair value | |||||||||||||||||||||||||||||||||||||
| (Millions of Canadian dollars) | Level 1 | Level 2 | Level 3 | Level 1 | Level 2 | Level 3 | ||||||||||||||||||||||||||||||||||||
Financial assets | ||||||||||||||||||||||||||||||||||||||||||
Interest-bearing deposits with banks | $ | – | $ | 19,151 | $ | – | $ | $ | 19,151 | $ | – | $ | 22,283 | $ | – | $ | $ | 22,283 | ||||||||||||||||||||||||
Securities | ||||||||||||||||||||||||||||||||||||||||||
Trading | ||||||||||||||||||||||||||||||||||||||||||
Debt issued or guaranteed by: | ||||||||||||||||||||||||||||||||||||||||||
Canadian government(1) | ||||||||||||||||||||||||||||||||||||||||||
Federal | 13,923 | 6,361 | – | 20,284 | 14,655 | 5,474 | – | 20,129 | ||||||||||||||||||||||||||||||||||
Provincial and municipal | – | 13,445 | – | 13,445 | – | 11,282 | – | 11,282 | ||||||||||||||||||||||||||||||||||
U.S. state, municipal and agencies(1) | 774 | 31,557 | 55 | 32,386 | 2,050 | 39,584 | 58 | 41,692 | ||||||||||||||||||||||||||||||||||
Other OECD government(2) | 3,600 | 3,154 | – | 6,754 | 2,786 | 3,710 | – | 6,496 | ||||||||||||||||||||||||||||||||||
Mortgage-backed securities(1) | – | 498 | – | 498 | – | 482 | – | 482 | ||||||||||||||||||||||||||||||||||
Asset-backed securities | ||||||||||||||||||||||||||||||||||||||||||
Non-CDO securities(3) | – | 1,397 | 2 | 1,399 | – | 1,333 | 2 | 1,335 | ||||||||||||||||||||||||||||||||||
Corporate debt and other debt | – | 25,342 | 19 | 25,361 | 1 | 23,643 | 21 | 23,665 | ||||||||||||||||||||||||||||||||||
Equities | 41,576 | 2,076 | 1,236 | 44,888 | 38,309 | 1,925 | 1,219 | 41,453 | ||||||||||||||||||||||||||||||||||
| 59,873 | 83,830 | 1,312 | 145,015 | 57,801 | 87,433 | 1,300 | 146,534 | |||||||||||||||||||||||||||||||||||
Investment | ||||||||||||||||||||||||||||||||||||||||||
Debt issued or guaranteed by: | ||||||||||||||||||||||||||||||||||||||||||
Canadian government(1) | ||||||||||||||||||||||||||||||||||||||||||
Federal | – | 976 | – | 976 | – | 657 | – | 657 | ||||||||||||||||||||||||||||||||||
Provincial and municipal | – | 3,514 | – | 3,514 | – | 2,898 | – | 2,898 | ||||||||||||||||||||||||||||||||||
U.S. state, municipal and agencies(1) | 126 | 34,958 | – | 35,084 | 210 | 20,666 | – | 20,876 | ||||||||||||||||||||||||||||||||||
Other OECD government | – | 4,148 | – | 4,148 | – | 4,251 | – | 4,251 | ||||||||||||||||||||||||||||||||||
Mortgage-backed securities(1) | – | 2,866 | 27 | 2,893 | – | 2,675 | 27 | 2,702 | ||||||||||||||||||||||||||||||||||
Asset-backed securities | ||||||||||||||||||||||||||||||||||||||||||
CDO | – | 6,893 | – | 6,893 | – | 7,300 | – | 7,300 | ||||||||||||||||||||||||||||||||||
Non-CDO securities | – | 828 | – | 828 | – | 849 | – | 849 | ||||||||||||||||||||||||||||||||||
Corporate debt and other debt | – | 22,449 | 158 | 22,607 | – | 17,537 | 153 | 17,690 | ||||||||||||||||||||||||||||||||||
Equities | 43 | 185 | 293 | 521 | 42 | 127 | 294 | 463 | ||||||||||||||||||||||||||||||||||
| 169 | 76,817 | 478 | 77,464 | 252 | 56,960 | 474 | 57,686 | |||||||||||||||||||||||||||||||||||
Assets purchased under reverse repurchase agreements and securities borrowed | – | 261,216 | – | 261,216 | – | 246,068 | – | 246,068 | ||||||||||||||||||||||||||||||||||
Loans | – | 10,832 | 995 | 11,827 | – | 9,294 | 680 | 9,974 | ||||||||||||||||||||||||||||||||||
Other | ||||||||||||||||||||||||||||||||||||||||||
Derivatives | ||||||||||||||||||||||||||||||||||||||||||
Interest rate contracts | 1 | 46,500 | 422 | 46,923 | 1 | 46,095 | 349 | 46,445 | ||||||||||||||||||||||||||||||||||
Foreign exchange contracts | – | 32,273 | 68 | 32,341 | – | 40,768 | 48 | 40,816 | ||||||||||||||||||||||||||||||||||
Credit derivatives | – | 219 | – | 219 | – | 169 | – | 169 | ||||||||||||||||||||||||||||||||||
Other contracts | 2,556 | 13,154 | 36 | 15,746 | 2,852 | 12,674 | 11 | 15,537 | ||||||||||||||||||||||||||||||||||
Valuation adjustments | – | (708 | ) | 3 | (705 | ) | – | (712 | ) | 15 | (697 | ) | ||||||||||||||||||||||||||||||
Total gross derivatives | 2,557 | 91,438 | 529 | 94,524 | 2,853 | 98,994 | 423 | 102,270 | ||||||||||||||||||||||||||||||||||
Netting adjustments | (542 | ) | (542 | ) | (710 | ) | (710 | ) | ||||||||||||||||||||||||||||||||||
Total derivatives | 93,982 | 101,560 | ||||||||||||||||||||||||||||||||||||||||
Other assets | 1,339 | 1,634 | 80 | 3,053 | 1,119 | 1,960 | 77 | 3,156 | ||||||||||||||||||||||||||||||||||
| $ | 63,938 | $ | 544,918 | $ | 3,394 | $ (542 | ) | $ | 611,708 | $ | 62,025 | $ | 522,992 | $ | 2,954 | $ (710 | ) | $ | 587,261 | |||||||||||||||||||||||
Financial Liabilities | ||||||||||||||||||||||||||||||||||||||||||
Deposits | ||||||||||||||||||||||||||||||||||||||||||
Personal | $ | – | $ | 16,966 | $ | 268 | $ | $ | 17,234 | $ | – | $ | 17,378 | $ | 156 | $ | $ | 17,534 | ||||||||||||||||||||||||
Business and government | – | 117,832 | – | 117,832 | – | 111,540 | – | 111,540 | ||||||||||||||||||||||||||||||||||
Bank | – | 3,450 | – | 3,450 | – | 3,032 | – | 3,032 | ||||||||||||||||||||||||||||||||||
Other | ||||||||||||||||||||||||||||||||||||||||||
Obligations related to securities sold short | 17,544 | 18,080 | – | 35,624 | 20,512 | 14,557 | – | 35,069 | ||||||||||||||||||||||||||||||||||
Obligations related to assets sold under repurchase agreements and securities loaned | – | 247,170 | – | 247,170 | – | 218,612 | – | 218,612 | ||||||||||||||||||||||||||||||||||
Derivatives | ||||||||||||||||||||||||||||||||||||||||||
Interest rate contracts | – | 39,622 | 1,032 | 40,654 | – | 39,165 | 934 | 40,099 | ||||||||||||||||||||||||||||||||||
Foreign exchange contracts | – | 34,373 | 43 | 34,416 | – | 40,183 | 27 | 40,210 | ||||||||||||||||||||||||||||||||||
Credit derivatives | – | 393 | – | 393 | – | 282 | – | 282 | ||||||||||||||||||||||||||||||||||
Other contracts | 2,560 | 17,026 | 191 | 19,777 | 2,675 | 15,776 | 206 | 18,657 | ||||||||||||||||||||||||||||||||||
Valuation adjustments | – | (74 | ) | (13 | ) | (87 | ) | – | 12 | (7 | ) | 5 | ||||||||||||||||||||||||||||||
Total gross derivatives | 2,560 | 91,340 | 1,253 | 95,153 | 2,675 | 95,418 | 1,160 | 99,253 | ||||||||||||||||||||||||||||||||||
Netting adjustments | (542 | ) | (542 | ) | (710 | ) | (710 | ) | ||||||||||||||||||||||||||||||||||
Total derivatives | 94,611 | 98,543 | ||||||||||||||||||||||||||||||||||||||||
Other liabilities | 57 | (1,529 | ) | 59 | (1,413 | ) | 102 | (1,280 | ) | 60 | (1,118 | ) | ||||||||||||||||||||||||||||||
| $ | 20,161 | $ | 493,309 | $ | 1,580 | $ (542 | ) | $ | 514,508 | $ | 23,289 | $ | 459,257 | $ | 1,376 | $ (710 | ) | $ | 483,212 | |||||||||||||||||||||||
| (1) | As at January 31, 2020, residential and commercial mortgage-backed securities (MBS) included in all fair value levels of trading securities were $20,009 million and $nil (October 31, 2019 – $22,365 million and $nil), respectively, and in all fair value levels of Investment securities were $9,168 million and $2,099 million (October 31, 2019 – $6,474 million and $2,046 million), respectively. |
| (2) | OECD stands for Organisation for EconomicCo-operation and Development. |
| (3) | CDO stands for collateralized debt obligations. |
Table of Contents
Royal Bank of Canada First Quarter 2020 55
Fair value measurements using significant unobservable inputs (Level 3 Instruments)
A financial instrument is classified as Level 3 in the fair value hierarchy if one or more of its unobservable inputs may significantly affect the measurement of its fair value. In preparing the financial statements, appropriate levels for these unobservable input parameters are chosen so that they are consistent with prevailing market evidence or management judgment. Due to the unobservable nature of the prices or rates, there may be uncertainty about the valuation of these Level 3 financial instruments.
During the three months ended January 31, 2020, there were no significant changes made to the valuation techniques and ranges and weighted averages of unobservable inputs used in the determination of fair value of Level 3 financial instruments. As at January 31, 2020, the impacts of adjusting one or more of the unobservable inputs by reasonably possible alternative assumptions did not change significantly from the impacts disclosed in our 2019 Annual Consolidated Financial Statements.
Changes in fair value measurement for instruments measured on a recurring basis and categorized in Level 3
| For the three months ended January 31, 2020 | ||||||||||||||||||||||||||||||||||||
| (Millions of Canadian dollars) | Fair value at beginning of period | Gains (losses) included in earnings | Gains (losses) included in OCI(1) | Purchases (issuances) | Settlement (sales) and other(2) | Transfers into Level 3 | Transfers out of Level 3 | Fair value at end of period | Gains (losses) included in earnings for positions still held | |||||||||||||||||||||||||||
Assets | ||||||||||||||||||||||||||||||||||||
Securities | ||||||||||||||||||||||||||||||||||||
Trading | ||||||||||||||||||||||||||||||||||||
Debt issued or guaranteed by: | ||||||||||||||||||||||||||||||||||||
U.S. state, municipal and agencies | $ | 58 | $ | – | $ | – | $ | – | $ | (3 | ) | $ | – | $ | – | $ | 55 | $ | – | |||||||||||||||||
Asset-backed securities | ||||||||||||||||||||||||||||||||||||
Non-CDO securities | 2 | – | – | – | – | – | – | 2 | – | |||||||||||||||||||||||||||
Corporate debt and other debt | 21 | (1 | ) | – | – | (1 | ) | – | – | 19 | (1 | ) | ||||||||||||||||||||||||
Equities | 1,219 | (27 | ) | 4 | 71 | (28 | ) | – | (3 | ) | 1,236 | (9 | ) | |||||||||||||||||||||||
| 1,300 | (28 | ) | 4 | 71 | (32 | ) | – | (3 | ) | 1,312 | (10 | ) | ||||||||||||||||||||||||
Investment | ||||||||||||||||||||||||||||||||||||
Mortgage-backed securities | 27 | – | – | – | – | – | – | 27 | n.a. | |||||||||||||||||||||||||||
Corporate debt and other debt | 153 | – | 5 | – | – | – | – | 158 | n.a. | |||||||||||||||||||||||||||
Equities | 294 | – | – | – | (1 | ) | – | – | 293 | n.a. | ||||||||||||||||||||||||||
| 474 | – | 5 | – | (1 | ) | – | – | 478 | n.a. | |||||||||||||||||||||||||||
Loans | 680 | 26 | – | 318 | (9 | ) | 8 | (28 | ) | 995 | 28 | |||||||||||||||||||||||||
Other | ||||||||||||||||||||||||||||||||||||
Net derivative balances(3) | ||||||||||||||||||||||||||||||||||||
Interest rate contracts | (585 | ) | 4 | – | (36 | ) | 1 | – | 6 | (610 | ) | 4 | ||||||||||||||||||||||||
Foreign exchange contracts | 21 | 1 | – | 11 | – | (5 | ) | (3 | ) | 25 | (1 | ) | ||||||||||||||||||||||||
Other contracts | (195 | ) | (15 | ) | 1 | (2 | ) | 8 | (10 | ) | 58 | (155 | ) | (8 | ) | |||||||||||||||||||||
Valuation adjustments | 22 | – | – | – | (6 | ) | – | – | 16 | – | ||||||||||||||||||||||||||
Other assets | 77 | 7 | – | – | (4 | ) | – | – | 80 | 7 | ||||||||||||||||||||||||||
| $ | 1,794 | $ | (5 | ) | $ | 10 | $ | 362 | $ | (43 | ) | $ | (7 | ) | $ | 30 | $ | 2,141 | $ | 20 | ||||||||||||||||
Liabilities | ||||||||||||||||||||||||||||||||||||
Deposits | ||||||||||||||||||||||||||||||||||||
Personal | $ | (156 | ) | $ | (1 | ) | $ | – | $ | (174 | ) | $ | 10 | $ | (16 | ) | $ | 69 | $ | (268 | ) | $ | 3 | |||||||||||||
Business and government | – | – | – | – | – | – | – | – | – | |||||||||||||||||||||||||||
Other | ||||||||||||||||||||||||||||||||||||
Other liabilities | (60 | ) | (4 | ) | – | 3 | 2 | – | – | (59 | ) | (4 | ) | |||||||||||||||||||||||
| $ | (216 | ) | $ | (5 | ) | $ | – | $ | (171 | ) | $ | 12 | $ | (16 | ) | $ | 69 | $ | (327 | ) | $ | (1 | ) | |||||||||||||
Table of Contents
56 Royal Bank of Canada First Quarter 2020
Note 3 Fair value of financial instruments(continued) |
| For the three months ended January 31, 2019 | ||||||||||||||||||||||||||||||||||||
| (Millions of Canadian dollars) | Fair value at beginning of period | Gains (losses) included in earnings | Gains (losses) included in OCI (1) | Purchases (issuances) | Settlement (sales) and other (2) | Transfers into Level 3 | Transfers out of Level 3 | Fair value at end of period | Gains (losses) included | |||||||||||||||||||||||||||
Assets | ||||||||||||||||||||||||||||||||||||
Securities | ||||||||||||||||||||||||||||||||||||
Trading | ||||||||||||||||||||||||||||||||||||
Debt issued or guaranteed by: | ||||||||||||||||||||||||||||||||||||
U.S. state, municipal and agencies | $ | 66 | $ | (1 | ) | $ | – | $ | – | $ | – | $ | – | $ | – | $ | 65 | $ | — | |||||||||||||||||
Asset-backed securities | ||||||||||||||||||||||||||||||||||||
Non-CDO securities | 110 | 15 | – | – | (116 | ) | – | – | 9 | 1 | ||||||||||||||||||||||||||
Corporate debt and other debt | 21 | 1 | – | – | – | – | – | 22 | — | |||||||||||||||||||||||||||
Equities | 1,148 | (18 | ) | – | 80 | (143 | ) | 9 | – | 1,076 | (5 | ) | ||||||||||||||||||||||||
| 1,345 | (3 | ) | – | 80 | (259 | ) | 9 | – | 1,172 | (4 | ) | |||||||||||||||||||||||||
Investment | ||||||||||||||||||||||||||||||||||||
Mortgage-backed securities | – | – | – | 27 | – | – | – | 27 | n.a. | |||||||||||||||||||||||||||
Corporate debt and other debt | 192 | (3 | ) | 2 | – | (56 | ) | – | – | 135 | n.a. | |||||||||||||||||||||||||
Equities | 237 | – | 10 | – | – | – | – | 247 | n.a. | |||||||||||||||||||||||||||
| 429 | (3 | ) | 12 | 27 | (56 | ) | – | – | 409 | n.a. | ||||||||||||||||||||||||||
Loans | 551 | 17 | 1 | 264 | (2 | ) | – | (5 | ) | 826 | 16 | |||||||||||||||||||||||||
Other | ||||||||||||||||||||||||||||||||||||
Net derivative balances(3) | ||||||||||||||||||||||||||||||||||||
Interest rate contracts | (504 | ) | (68 | ) | – | – | 40 | 2 | (20 | ) | (550 | ) | (6 | ) | ||||||||||||||||||||||
Foreign exchange contracts | 21 | (7 | ) | 6 | 2 | – | (1 | ) | (9 | ) | 12 | (1 | ) | |||||||||||||||||||||||
Other contracts | (84 | ) | 45 | – | (9 | ) | (23 | ) | (17 | ) | (14 | ) | (102 | ) | 60 | |||||||||||||||||||||
Valuation adjustments | 1 | – | – | – | 12 | – | – | 13 | — | |||||||||||||||||||||||||||
Other assets | 65 | – | – | – | (4 | ) | – | – | 61 | — | ||||||||||||||||||||||||||
| $ | 1,824 | $ | (19 | ) | $ | 19 | $ | 364 | $ | (292 | ) | $ | (7 | ) | $ | (48 | ) | $ | 1,841 | $ | 65 | |||||||||||||||
Liabilities | ||||||||||||||||||||||||||||||||||||
Deposits | ||||||||||||||||||||||||||||||||||||
Personal | $ | (390 | ) | $ | (30 | ) | $ | (1 | ) | $ | (9 | ) | $ | 5 | $ | (18 | ) | $ | 352 | $ | (91 | ) | $ | 2 | ||||||||||||
Business and government | 5 | – | – | – | – | – | (5 | ) | – | — | ||||||||||||||||||||||||||
Other | ||||||||||||||||||||||||||||||||||||
Other liabilities | (68 | ) | – | – | – | 16 | – | – | (52 | ) | 1 | |||||||||||||||||||||||||
| $ | (453 | ) | $ | (30 | ) | $ | (1 | ) | $ | (9 | ) | $ | 21 | $ | (18 | ) | $ | 347 | $ | (143 | ) | $ | 3 | |||||||||||||
| (1) | These amounts include the foreign currency translation gains or losses arising on consolidation of foreign subsidiaries relating to the Level 3 instruments, where applicable. The unrealized gains on Investment securities recognized in OCI were $4 million for the three months ended January 31, 2020 (January 31, 2019 – gains of $11 million), excluding the translation gains or losses arising on consolidation. |
| (2) | Other includes amortization of premiums or discounts recognized in net income. |
| (3) | Net derivatives as at January 31, 2020 included derivative assets of $529 million (January 31, 2019 – $420 million) and derivative liabilities of $1,253 million (January 31, 2019 –$1,047 million). |
| n.a. | not applicable |
Transfers between fair value hierarchy levels for instruments carried at fair value on a recurring basis
Transfers between Level 1 and Level 2, and transfers into and out of Level 3 are assumed to occur at the end of the period. For an asset or a liability that transfers into Level 3 during the period, the entire change in fair value for the period is excluded from the Gains (losses) included in earnings for positions still held column of the above reconciliation, whereas for transfers out of Level 3 during the period, the entire change in fair value for the period is included in the same column of the above reconciliation.
Transfers between Level 1 and 2 are dependent on whether fair value is obtained on the basis of quoted market prices in active markets (Level 1).
During the three months ended January 31, 2020, transfers out of Level 1 to Level 2 included Trading U.S. state, municipal and agencies debt and Obligations related to securities sold short of $722 million and $233 million, respectively.
During the three months ended January 31, 2020 there were no significant transfers out of Level 2 to Level 1.
Transfers between Level 2 and Level 3 are primarily due to either a change in the market observability for an input, or a change in an unobservable input’s significance to a financial instrument’s fair value.
During the three months ended January 31, 2020 there were no significant transfers in or out of Level 2 and Level 3.
Table of Contents
Royal Bank of Canada First Quarter 2020 57
Net interest income from financial instruments
Interest and dividend income arising from financial assets and financial liabilities and the associated costs of funding are reported in Net interest income.
| For the three months ended | ||||||||
| (Millions of Canadian dollars) | January 31 2020 | January 31 2019(1) | ||||||
Interest and dividend income(2), (3) | ||||||||
Financial instruments measured at fair value through profit or loss(4) | $ | 2,985 | $ | 2,887 | ||||
Financial instruments measured at fair value through other comprehensive income | 309 | 272 | ||||||
Financial instruments measured at amortized cost | 6,944 | 6,990 | ||||||
| 10,238 | 10,149 | |||||||
Interest expense(2) | ||||||||
Financial instruments measured at fair value through profit or loss | $ | 2,360 | $ | 2,555 | ||||
Financial instruments measured at amortized cost(5) | 2,657 | 2,747 | ||||||
| 5,017 | 5,302 | |||||||
Net interest income | $ | 5,221 | $ | 4,847 | ||||
| (1) | Amounts have been revised from those previously presented. |
| (2) | Excludes the following amounts related to our insurance operations and included in Insurance premiums, investment and fee income in the Condensed Consolidated Statements of Income: Interest income of $132 million (January 31, 2019 – $129 million), and Interest expense of $2 million (January 31, 2019 – $1 million). |
| (3) | Includes dividend income for the three months ended January 31, 2020 of $608 million (January 31, 2019 – $437 million), which is presented in Interest and dividend income in the Condensed Consolidated Statements of Income. |
| (4) | Commencing Q4 2019, the interest component of the valuation of certain deposits carried at fair value through profit or loss (FVTPL) previously presented in trading revenue is presented in net interest income. Comparative amounts have been reclassified to conform with this presentation. |
| (5) | Includes interest expense on lease liabilities for the three months ended January 31, 2020 of $31 million, due to the adoption of IFRS 16. |
Note 4 Securities
|
Unrealized gains and losses on securities at FVOCI(1), (2)
| As at | ||||||||||||||||||||||||||||||||||
| January 31, 2020 | October 31, 2019 | |||||||||||||||||||||||||||||||||
| (Millions of Canadian dollars) | Cost/ Amortized cost | Gross unrealized gains | Gross unrealized losses | Fair value | Cost/ Amortized cost | Gross unrealized gains | Gross unrealized losses | Fair value | ||||||||||||||||||||||||||
Debt issued or guaranteed by: | ||||||||||||||||||||||||||||||||||
Canadian government | ||||||||||||||||||||||||||||||||||
Federal (3) | $ | 972 | $ | 4 | $ | – | $ | 976 | $ | 655 | $ | 3 | $ | (1 | ) | $ | 657 | |||||||||||||||||
Provincial and municipal | 3,410 | 104 | – | 3,514 | 2,878 | 43 | (23 | ) | 2,898 | |||||||||||||||||||||||||
U.S. state, municipal and agencies(3) | 34,941 | 302 | (159 | ) | 35,084 | 20,787 | 215 | (126 | ) | 20,876 | ||||||||||||||||||||||||
Other OECD government | 4,147 | 3 | (2 | ) | 4,148 | 4,254 | 2 | (5 | ) | 4,251 | ||||||||||||||||||||||||
Mortgage-backed securities(3) | 2,900 | 1 | (8 | ) | 2,893 | 2,709 | 1 | (8 | ) | 2,702 | ||||||||||||||||||||||||
Asset-backed securities | ||||||||||||||||||||||||||||||||||
CDO | 6,897 | 2 | (6 | ) | 6,893 | 7,334 | 1 | (35 | ) | 7,300 | ||||||||||||||||||||||||
Non-CDO securities | 828 | 3 | (3 | ) | 828 | 847 | 4 | (2 | ) | 849 | ||||||||||||||||||||||||
Corporate debt and other debt | 22,550 | 62 | (5 | ) | 22,607 | 17,655 | 45 | (10 | ) | 17,690 | ||||||||||||||||||||||||
Equities | 306 | 218 | (3 | ) | 521 | 248 | 218 | (3 | ) | 463 | ||||||||||||||||||||||||
| $ | 76,951 | $ | 699 | $ | (186 | ) | $ | 77,464 | $ | 57,367 | $ | 532 | $ | (213 | ) | $ | 57,686 | |||||||||||||||||
| (1) | Excludes $44,188 million ofheld-to-collect securities as at January 31, 2020 that are carried at amortized cost, net of allowance for credit losses (October 31, 2019 – $44,784 million). |
| (2) | Gross unrealized gains and losses includes $(3) million of allowance for credit losses on debt securities at FVOCI as at January 31, 2020 (October 31, 2019 – $(3) million) recognized in income and Other components of equity. |
| (3) | The majority of the MBS are residential. Cost/Amortized cost, Gross unrealized gains, Gross unrealized losses and Fair value related to commercial MBS are $2,105 million, $1 million, $7 million and $2,099 million, respectively as at January 31, 2020 (October 31, 2019 – $2,051 million, $1 million, $6 million and $2,046 million, respectively). |
Allowance for credit losses on investment securities
The following tables reconcile the opening and closing allowance for debt securities at FVOCI and amortized cost by stage. Reconciling items include the following:
| • | Transfers between stages, which are presumed to occur before any corresponding remeasurement of the allowance. |
| • | Purchases, which reflect the allowance related to assets newly recognized during the period, including those assets that were derecognized following a modification of terms. |
| • | Sales and maturities, which reflect the allowance related to assets derecognized during the period without a credit loss being incurred, including those assets that were derecognized following a modification of terms. |
| • | Changes in risk, parameters and exposures, which comprise the impact of changes in model inputs or assumptions, including changes in forward-looking macroeconomic conditions; partial repayments; changes in the measurement following a transfer between stages; and unwinding of the time value discount due to the passage of time. |
Table of Contents
58 Royal Bank of Canada First Quarter 2020
Note 4 Securities(continued) |
Allowance for credit losses – securities at FVOCI(1)
| For the three months ended | ||||||||||||||||||||||||||||||||||||||
| January 31, 2020 | January 31, 2019 | |||||||||||||||||||||||||||||||||||||
| Performing | Impaired | Performing | Impaired | |||||||||||||||||||||||||||||||||||
| (Millions of Canadian dollars) | Stage 1 | Stage 2 | Stage 3 (2) | Total | Stage 1 | Stage 2 | Stage 3 (2) | Total | ||||||||||||||||||||||||||||||
Balance at beginning of period | $ | 4 | $ | – | $ | (7 | ) | $ | (3 | ) | $ | 4 | $ | 7 | $ | – | $ | 11 | ||||||||||||||||||||
Provision for credit losses | ||||||||||||||||||||||||||||||||||||||
Transfers to stage 1 | – | – | – | – | – | – | – | – | ||||||||||||||||||||||||||||||
Transfers to stage 2 | – | – | – | – | – | – | – | – | ||||||||||||||||||||||||||||||
Transfers to stage 3 | – | – | – | – | – | – | – | – | ||||||||||||||||||||||||||||||
Purchases | 2 | – | – | 2 | 2 | – | – | 2 | ||||||||||||||||||||||||||||||
Sales and maturities | – | – | – | – | (1 | ) | (7 | ) | – | (8 | ) | |||||||||||||||||||||||||||
Changes in risk, parameters and exposures | – | – | (2 | ) | (2 | ) | 1 | – | 3 | 4 | ||||||||||||||||||||||||||||
Exchange rate and other | – | – | – | – | – | – | – | – | ||||||||||||||||||||||||||||||
Balance at end of period | $ | 6 | $ | – | $ | (9 | ) | $ | (3 | ) | $ | 6 | $ | – | $ | 3 | $ | 9 | ||||||||||||||||||||
| (1) | Expected credit losses on debt securities at FVOCI are not separately recognized on the balance sheet as the related securities are recorded at fair value. The cumulative amount of credit losses recognized in income is presented in Other components of equity. |
| (2) | Reflects changes in the allowance for purchased credit impaired securities. |
Allowance for credit losses – securities at amortized cost
| For the three months ended | ||||||||||||||||||||||||||||||||||||||
| January 31, 2020 | January 31, 2019 | |||||||||||||||||||||||||||||||||||||
| Performing | Impaired | Performing | Impaired | |||||||||||||||||||||||||||||||||||
| (Millions of Canadian dollars) | Stage 1 | Stage 2 | Stage 3 | Total | Stage 1 | Stage 2 | Stage 3 | Total | ||||||||||||||||||||||||||||||
Balance at beginning of period | $ | 5 | $ | 19 | $ | – | $ | 24 | $ | 6 | $ | 32 | $ | – | $ | 38 | ||||||||||||||||||||||
Provision for credit losses | ||||||||||||||||||||||||||||||||||||||
Transfers to stage 1 | – | – | – | – | – | – | – | – | ||||||||||||||||||||||||||||||
Transfers to stage 2 | – | – | – | – | – | – | – | – | ||||||||||||||||||||||||||||||
Transfers to stage 3 | – | – | – | – | – | – | – | – | ||||||||||||||||||||||||||||||
Purchases | 2 | – | – | 2 | 1 | – | – | 1 | ||||||||||||||||||||||||||||||
Sales and maturities | – | – | – | – | – | – | – | – | ||||||||||||||||||||||||||||||
Changes in risk, parameters and exposures | (2 | ) | (1 | ) | – | (3 | ) | (1 | ) | (2 | ) | – | (3 | ) | ||||||||||||||||||||||||
Exchange rate and other | – | (1 | ) | – | (1 | ) | – | – | – | – | ||||||||||||||||||||||||||||
Balance at end of period | $ | 5 | $ | 17 | $ | – | $ | 22 | $ | 6 | $ | 30 | $ | – | $ | 36 | ||||||||||||||||||||||
Credit risk exposure by internal risk rating
The following table presents the fair value of debt securities at FVOCI and gross carrying amount of securities at amortized cost. Risk ratings are based on internal ratings used in the measurement of expected credit losses, as at the reporting date, as outlined in the internal ratings maps in the Credit risk section of our 2019 Annual Report.
| As at | ||||||||||||||||||||||||||||||||||||||
| January 31, 2020 | October 31, 2019 | |||||||||||||||||||||||||||||||||||||
| Performing | Impaired | Performing | Impaired | |||||||||||||||||||||||||||||||||||
| (Millions of Canadian dollars) | Stage 1 | Stage 2 | Stage 3 (1) | Total | Stage 1 | Stage 2 | Stage 3 (1) | Total | ||||||||||||||||||||||||||||||
Investment securities | ||||||||||||||||||||||||||||||||||||||
Securities at FVOCI | ||||||||||||||||||||||||||||||||||||||
Investment grade | $ | 76,356 | $ | 1 | $ | – | $ | 76,357 | $ | 56,671 | $ | 1 | $ | – | $ | 56,672 | ||||||||||||||||||||||
Non-investment grade | 429 | 1 | – | 430 | 400 | 1 | – | 401 | ||||||||||||||||||||||||||||||
Impaired | – | – | 155 | 155 | – | – | 150 | 150 | ||||||||||||||||||||||||||||||
| $ | 76,785 | $ | 2 | $ | 155 | $ | 76,942 | $ | 57,071 | $ | 2 | $ | 150 | $ | 57,223 | |||||||||||||||||||||||
Items not subject to impairment (2) | 522 | 463 | ||||||||||||||||||||||||||||||||||||
| $ | 77,464 | $ | 57,686 | |||||||||||||||||||||||||||||||||||
Securities at amortized cost | ||||||||||||||||||||||||||||||||||||||
Investment grade | $ | 43,063 | $ | 53 | $ | – | $ | 43,116 | $ | 43,681 | $ | 46 | $ | – | $ | 43,727 | ||||||||||||||||||||||
Non-investment grade | 704 | 390 | – | 1,094 | 695 | 386 | – | 1,081 | ||||||||||||||||||||||||||||||
Impaired | – | – | – | – | – | – | – | – | ||||||||||||||||||||||||||||||
| $ | 43,767 | $ | 443 | $ | – | $ | 44,210 | $ | 44,376 | $ | 432 | $ | – | $ | 44,808 | |||||||||||||||||||||||
Allowance for credit losses | 5 | 17 | – | 22 | 5 | 19 | – | 24 | ||||||||||||||||||||||||||||||
Amortized cost | $ | 43,762 | $ | 426 | $ | – | $ | 44,188 | $ | 44,371 | $ | 413 | $ | – | $ | 44,784 | ||||||||||||||||||||||
| (1) | Includes $155 million of purchased credit impaired securities (October 31, 2019 – $150 million). |
| (2) | Investment securities at FVOCI not subject to impairment represent equity securities designated as FVOCI. |
Table of Contents
Royal Bank of Canada First Quarter 2020 59
Note 5 Loans and allowance for credit losses
|
Allowance for credit losses
| For the three months ended | ||||||||||||||||||||||||||||||||||||||||||
| January 31, 2020 | January 31, 2019 | |||||||||||||||||||||||||||||||||||||||||
| (Millions of Canadian dollars) | Balance at beginning of period | Provision for credit losses | Net write-offs | Exchange rate and other | Balance at end of period | Balance at beginning of period | Provision for credit losses | Net write-offs | Exchange rate and other | Balance at end of period | ||||||||||||||||||||||||||||||||
Retail | ||||||||||||||||||||||||||||||||||||||||||
Residential mortgages | $ | 402 | $ | (7 | ) | $ | (8 | ) | $ | (20 | ) | $ | 367 | $ | 382 | $ | 33 | $ | (4 | ) | $ | (2 | ) | $ | 409 | |||||||||||||||||
Personal | 935 | 121 | (111 | ) | (5 | ) | 940 | 895 | 123 | (113 | ) | (13 | ) | 892 | ||||||||||||||||||||||||||||
Credit cards | 832 | 177 | (139 | ) | (2 | ) | 868 | 760 | 140 | (120 | ) | – | 780 | |||||||||||||||||||||||||||||
Small business | 61 | 14 | (8 | ) | (1 | ) | 66 | 51 | 6 | (5 | ) | (1 | ) | 51 | ||||||||||||||||||||||||||||
Wholesale | 1,165 | 102 | (41 | ) | (35 | ) | 1,191 | 979 | 204 | (61 | ) | (12 | ) | 1,110 | ||||||||||||||||||||||||||||
Customers’ liability under acceptances | 24 | 14 | – | 1 | 39 | 21 | 10 | – | – | 31 | ||||||||||||||||||||||||||||||||
| $ | 3,419 | $ | 421 | $ | (307 | ) | $ | (62 | ) | $ | 3,471 | $ | 3,088 | $ | 516 | $ | (303 | ) | $ | (28 | ) | $ | 3,273 | |||||||||||||||||||
Presented as: | ||||||||||||||||||||||||||||||||||||||||||
Allowance for loan losses | $ | 3,100 | $ | 3,139 | $ | 2,912 | $ | 3,061 | ||||||||||||||||||||||||||||||||||
Other liabilities – Provisions | 295 | 292 | 154 | 180 | ||||||||||||||||||||||||||||||||||||||
Customers’ liability under acceptances | 24 | 39 | 21 | 31 | ||||||||||||||||||||||||||||||||||||||
Other components of equity | – | 1 | 1 | 1 | ||||||||||||||||||||||||||||||||||||||
The following table reconciles the opening and closing allowance for loans and commitments, by stage, for each major product category.
Reconciling items include the following:
| • | Transfers between stages, which are presumed to occur before any corresponding remeasurements of the allowance. |
| • | Originations, which reflect the allowance related to assets newly recognized during the period, including those assets that were derecognized following a modification of terms. |
| • | Maturities, which reflect the allowance related to assets derecognized during the period without a credit loss being incurred, including those assets that were derecognized following a modification of terms. |
| • | Changes in risk, parameters and exposures, which comprise the impact of changes in model inputs or assumptions, including changes in forward-looking macroeconomic conditions; partial repayments and additional draws on existing facilities; changes in the measurement following a transfer between stages; and unwinding of the time value discount due to the passage of time in stage 1 and stage 2. |
Table of Contents
60 Royal Bank of Canada First Quarter 2020
Note 5 Loans and allowance for credit losses(continued) |
Allowance for credit losses – Retail and wholesale loans
| For the three months ended | ||||||||||||||||||||||||||||||||||||||
| January 31, 2020 | January 31, 2019 | |||||||||||||||||||||||||||||||||||||
| Performing | Impaired | Performing | Impaired | |||||||||||||||||||||||||||||||||||
| (Millions of Canadian dollars) | Stage 1 | Stage 2 | Stage 3 | Total | Stage 1 | Stage 2 | Stage 3 | Total | ||||||||||||||||||||||||||||||
Residential mortgages | ||||||||||||||||||||||||||||||||||||||
Balance at beginning of period | $ | 146 | $ | 77 | $ | 179 | $ | 402 | $ | 142 | $ | 64 | $ | 176 | $ | 382 | ||||||||||||||||||||||
Provision for credit losses | ||||||||||||||||||||||||||||||||||||||
Transfers to stage 1 | 27 | (18 | ) | (9 | ) | – | 8 | (8 | ) | – | – | |||||||||||||||||||||||||||
Transfers to stage 2 | (4 | ) | 6 | (2 | ) | – | (3 | ) | 4 | (1 | ) | – | ||||||||||||||||||||||||||
Transfers to stage 3 | (1 | ) | (8 | ) | 9 | – | (1 | ) | (8 | ) | 9 | – | ||||||||||||||||||||||||||
Originations | 16 | – | – | 16 | 13 | – | – | 13 | ||||||||||||||||||||||||||||||
Maturities | (4 | ) | (3 | ) | – | (7 | ) | (3 | ) | (2 | ) | – | (5 | ) | ||||||||||||||||||||||||
Changes in risk, parameters and exposures | (45 | ) | 29 | – | (16 | ) | (18 | ) | 30 | 13 | 25 | |||||||||||||||||||||||||||
Write-offs | – | – | (12 | ) | (12 | ) | – | – | (5 | ) | (5 | ) | ||||||||||||||||||||||||||
Recoveries | – | – | 4 | 4 | – | – | 1 | 1 | ||||||||||||||||||||||||||||||
Exchange rate and other | (3 | ) | (3 | ) | (14 | ) | (20 | ) | – | (1 | ) | (1 | ) | (2 | ) | |||||||||||||||||||||||
Balance at end of period | $ | 132 | $ | 80 | $ | 155 | $ | 367 | $ | 138 | $ | 79 | $ | 192 | $ | 409 | ||||||||||||||||||||||
Personal | ||||||||||||||||||||||||||||||||||||||
Balance at beginning of period | $ | 272 | $ | 520 | $ | 143 | $ | 935 | $ | 242 | $ | 512 | $ | 141 | $ | 895 | ||||||||||||||||||||||
Provision for credit losses | ||||||||||||||||||||||||||||||||||||||
Transfers to stage 1 | 119 | (119 | ) | – | – | 132 | (132 | ) | – | – | ||||||||||||||||||||||||||||
Transfers to stage 2 | (19 | ) | 19 | – | – | (23 | ) | 23 | – | – | ||||||||||||||||||||||||||||
Transfers to stage 3 | (1 | ) | (20 | ) | 21 | – | – | (44 | ) | 44 | – | |||||||||||||||||||||||||||
Originations | 25 | – | – | 25 | 23 | – | – | 23 | ||||||||||||||||||||||||||||||
Maturities | (12 | ) | (23 | ) | – | (35 | ) | (7 | ) | (30 | ) | – | (37 | ) | ||||||||||||||||||||||||
Changes in risk, parameters and exposures | (111 | ) | 141 | 101 | 131 | (132 | ) | 190 | 79 | 137 | ||||||||||||||||||||||||||||
Write-offs | – | – | (149 | ) | (149 | ) | – | – | (144 | ) | (144 | ) | ||||||||||||||||||||||||||
Recoveries | – | – | 38 | 38 | – | – | 31 | 31 | ||||||||||||||||||||||||||||||
Exchange rate and other | – | (1 | ) | (4 | ) | (5 | ) | – | – | (13 | ) | (13 | ) | |||||||||||||||||||||||||
Balance at end of period | $ | 273 | $ | 517 | $ | 150 | $ | 940 | $ | 235 | $ | 519 | $ | 138 | $ | 892 | ||||||||||||||||||||||
Credit cards | ||||||||||||||||||||||||||||||||||||||
Balance at beginning of period | $ | 173 | $ | 659 | $ | – | $ | 832 | $ | 161 | $ | 599 | $ | – | $ | 760 | ||||||||||||||||||||||
Provision for credit losses | ||||||||||||||||||||||||||||||||||||||
Transfers to stage 1 | 118 | (118 | ) | – | – | 110 | (110 | ) | – | – | ||||||||||||||||||||||||||||
Transfers to stage 2 | (22 | ) | 22 | – | – | (19 | ) | 19 | – | – | ||||||||||||||||||||||||||||
Transfers to stage 3 | – | (88 | ) | 88 | – | – | (80 | ) | 80 | – | ||||||||||||||||||||||||||||
Originations | 2 | – | – | 2 | 1 | – | – | 1 | ||||||||||||||||||||||||||||||
Maturities | (1 | ) | (8 | ) | – | (9 | ) | (1 | ) | (6 | ) | – | (7 | ) | ||||||||||||||||||||||||
Changes in risk, parameters and exposures | (94 | ) | 227 | 51 | 184 | (84 | ) | 190 | 40 | 146 | ||||||||||||||||||||||||||||
Write-offs | – | – | (174 | ) | (174 | ) | – | – | (153 | ) | (153 | ) | ||||||||||||||||||||||||||
Recoveries | – | – | 35 | 35 | – | – | 33 | 33 | ||||||||||||||||||||||||||||||
Exchange rate and other | (2 | ) | – | – | (2 | ) | – | – | – | – | ||||||||||||||||||||||||||||
Balance at end of period | $ | 174 | $ | 694 | $ | – | $ | 868 | $ | 168 | $ | 612 | $ | – | $ | 780 | ||||||||||||||||||||||
Small business | ||||||||||||||||||||||||||||||||||||||
Balance at beginning of period | $ | 29 | $ | 10 | $ | 22 | $ | 61 | $ | 17 | $ | 16 | $ | 18 | $ | 51 | ||||||||||||||||||||||
Provision for credit losses | ||||||||||||||||||||||||||||||||||||||
Transfers to stage 1 | 1 | (1 | ) | – | – | 5 | (5 | ) | – | – | ||||||||||||||||||||||||||||
Transfers to stage 2 | (1 | ) | 1 | – | – | (1 | ) | 1 | – | – | ||||||||||||||||||||||||||||
Transfers to stage 3 | – | (1 | ) | 1 | – | – | (3 | ) | 3 | – | ||||||||||||||||||||||||||||
Originations | 3 | – | – | 3 | 3 | – | – | 3 | ||||||||||||||||||||||||||||||
Maturities | (1 | ) | (1 | ) | – | (2 | ) | (1 | ) | (2 | ) | – | (3 | ) | ||||||||||||||||||||||||
Changes in risk, parameters and exposures | (2 | ) | 4 | 11 | 13 | (7 | ) | 11 | 2 | 6 | ||||||||||||||||||||||||||||
Write-offs | – | – | (10 | ) | (10 | ) | – | – | (7 | ) | (7 | ) | ||||||||||||||||||||||||||
Recoveries | – | – | 2 | 2 | – | – | 2 | 2 | ||||||||||||||||||||||||||||||
Exchange rate and other | – | (1 | ) | – | (1 | ) | – | – | (1 | ) | (1 | ) | ||||||||||||||||||||||||||
Balance at end of period | $ | 29 | $ | 11 | $ | 26 | $ | 66 | $ | 16 | $ | 18 | $ | 17 | $ | 51 | ||||||||||||||||||||||
Wholesale | ||||||||||||||||||||||||||||||||||||||
Balance at beginning of period | $ | 281 | $ | 396 | $ | 488 | $ | 1,165 | $ | 274 | $ | 340 | $ | 365 | $ | 979 | ||||||||||||||||||||||
Provision for credit losses | ||||||||||||||||||||||||||||||||||||||
Transfers to stage 1 | 27 | (26 | ) | (1 | ) | – | 24 | (24 | ) | – | – | |||||||||||||||||||||||||||
Transfers to stage 2 | (8 | ) | 9 | (1 | ) | – | (9 | ) | 11 | (2 | ) | – | ||||||||||||||||||||||||||
Transfers to stage 3 | (1 | ) | (18 | ) | 19 | – | (1 | ) | (16 | ) | 17 | – | ||||||||||||||||||||||||||
Originations | 66 | – | – | 66 | 68 | 10 | – | 78 | ||||||||||||||||||||||||||||||
Maturities | (43 | ) | (53 | ) | – | (96 | ) | (43 | ) | (43 | ) | – | (86 | ) | ||||||||||||||||||||||||
Changes in risk, parameters and exposures | (17 | ) | 99 | 50 | 132 | (11 | ) | 84 | 139 | 212 | ||||||||||||||||||||||||||||
Write-offs | – | – | (54 | ) | (54 | ) | – | – | (68 | ) | (68 | ) | ||||||||||||||||||||||||||
Recoveries | – | – | 13 | 13 | – | – | 7 | 7 | ||||||||||||||||||||||||||||||
Exchange rate and other | (5 | ) | – | (30 | ) | (35 | ) | (1 | ) | (1 | ) | (10 | ) | (12 | ) | |||||||||||||||||||||||
Balance at end of period | $ | 300 | $ | 407 | $ | 484 | $ | 1,191 | $ | 301 | $ | 361 | $ | 448 | $ | 1,110 | ||||||||||||||||||||||
Table of Contents
Royal Bank of Canada First Quarter 2020 61
Credit risk exposure by internal risk rating
The following table presents the gross carrying amount of loans measured at amortized cost, and the full contractual amount of undrawn loan commitments subject to the impairment requirements of IFRS 9. Risk ratings are based on internal ratings used in the measurement of expected credit losses as at the reporting date, as outlined in the internal ratings maps for Wholesale and Retail facilities in the Credit risk section of our 2019 Annual Report.
| As at | ||||||||||||||||||||||||||||||||||
| January 31, 2020 | October 31, 2019 | |||||||||||||||||||||||||||||||||
| (Millions of Canadian dollars) | Stage 1 | Stage 2 | Stage 3 | Total | Stage 1 | Stage 2 | Stage 3 | Total | ||||||||||||||||||||||||||
Retail | ||||||||||||||||||||||||||||||||||
Loans outstanding – Residential mortgages | ||||||||||||||||||||||||||||||||||
Low risk | $ | 244,103 | $ | 6,411 | $ | – | $ | 250,514 | $ | 238,377 | $ | 6,764 | $ | – | $ | 245,141 | ||||||||||||||||||
Medium risk | 13,903 | 1,251 | – | 15,154 | 14,033 | 1,347 | – | 15,380 | ||||||||||||||||||||||||||
High risk | 3,023 | 2,675 | – | 5,698 | 2,843 | 2,722 | – | 5,565 | ||||||||||||||||||||||||||
Not rated(1) | 40,873 | 731 | – | 41,604 | 40,030 | 726 | – | 40,756 | ||||||||||||||||||||||||||
Impaired | – | – | 700 | 700 | – | – | 732 | 732 | ||||||||||||||||||||||||||
| 301,902 | 11,068 | 700 | 313,670 | 295,283 | 11,559 | 732 | 307,574 | |||||||||||||||||||||||||||
Items not subject to impairment(2) | 534 | 517 | ||||||||||||||||||||||||||||||||
Total | 314,204 | 308,091 | ||||||||||||||||||||||||||||||||
Loans outstanding – Personal | ||||||||||||||||||||||||||||||||||
Low risk | $ | 71,001 | $ | 1,756 | $ | – | $ | 72,757 | $ | 71,619 | $ | 1,944 | $ | – | $ | 73,563 | ||||||||||||||||||
Medium risk | 5,213 | 2,863 | – | 8,076 | 5,254 | 3,011 | – | 8,265 | ||||||||||||||||||||||||||
High risk | 876 | 1,814 | – | 2,690 | 843 | 1,874 | – | 2,717 | ||||||||||||||||||||||||||
Not rated(1) | 7,187 | 93 | – | 7,280 | 7,293 | 105 | – | 7,398 | ||||||||||||||||||||||||||
Impaired | – | – | 320 | 320 | – | – | 307 | 307 | ||||||||||||||||||||||||||
Total | 84,277 | 6,526 | 320 | 91,123 | 85,009 | 6,934 | 307 | 92,250 | ||||||||||||||||||||||||||
Loans outstanding – Credit cards | ||||||||||||||||||||||||||||||||||
Low risk | $ | 13,668 | $ | 103 | $ | – | $ | 13,771 | $ | 13,840 | $ | 103 | $ | – | $ | 13,943 | ||||||||||||||||||
Medium risk | 2,126 | 1,778 | – | 3,904 | 2,250 | 1,827 | – | 4,077 | ||||||||||||||||||||||||||
High risk | 125 | 1,428 | – | 1,553 | 137 | 1,432 | – | 1,569 | ||||||||||||||||||||||||||
Not rated(1) | 694 | 50 | – | 744 | 677 | 45 | – | 722 | ||||||||||||||||||||||||||
Total | 16,613 | 3,359 | – | 19,972 | 16,904 | 3,407 | – | 20,311 | ||||||||||||||||||||||||||
Loans outstanding – Small business | ||||||||||||||||||||||||||||||||||
Low risk | $ | 2,257 | $ | 115 | $ | – | $ | 2,372 | $ | 2,200 | $ | 107 | $ | – | $ | 2,307 | ||||||||||||||||||
Medium risk | 2,136 | 611 | – | 2,747 | 2,163 | 563 | – | 2,726 | ||||||||||||||||||||||||||
High risk | 131 | 223 | – | 354 | 138 | 196 | – | 334 | ||||||||||||||||||||||||||
Not rated(1) | 7 | – | – | 7 | 10 | – | – | 10 | ||||||||||||||||||||||||||
Impaired | – | – | 62 | 62 | – | – | 57 | 57 | ||||||||||||||||||||||||||
Total | 4,531 | 949 | 62 | 5,542 | 4,511 | 866 | 57 | 5,434 | ||||||||||||||||||||||||||
Undrawn loan commitments – Retail | ||||||||||||||||||||||||||||||||||
Low risk | $ | 203,094 | $ | 1,936 | $ | – | $ | 205,030 | $ | 196,743 | $ | 1,894 | $ | – | $ | 198,637 | ||||||||||||||||||
Medium risk | 8,806 | 245 | – | 9,051 | 8,251 | 246 | – | 8,497 | ||||||||||||||||||||||||||
High risk | 925 | 193 | – | 1,118 | 851 | 208 | – | 1,059 | ||||||||||||||||||||||||||
Not rated(1) | 5,650 | 126 | – | 5,776 | 5,861 | 146 | – | 6,007 | ||||||||||||||||||||||||||
Total | 218,475 | 2,500 | – | 220,975 | 211,706 | 2,494 | – | 214,200 | ||||||||||||||||||||||||||
Wholesale – Loans outstanding | ||||||||||||||||||||||||||||||||||
Investment grade | $ | 49,268 | $ | 67 | $ | – | $ | 49,335 | $ | 47,133 | $ | 97 | $ | – | $ | 47,230 | ||||||||||||||||||
Non-investment grade | 122,070 | 12,163 | – | 134,233 | 119,778 | 11,940 | – | 131,718 | ||||||||||||||||||||||||||
Not rated(1) | 5,801 | 318 | – | 6,119 | 5,862 | 320 | – | 6,182 | ||||||||||||||||||||||||||
Impaired | – | – | 1,802 | 1,802 | – | – | 1,829 | 1,829 | ||||||||||||||||||||||||||
| 177,139 | 12,548 | 1,802 | 191,489 | 172,773 | 12,357 | 1,829 | 186,959 | |||||||||||||||||||||||||||
Items not subject to impairment(2) | 10,749 | 8,911 | ||||||||||||||||||||||||||||||||
Total | 202,238 | 195,870 | ||||||||||||||||||||||||||||||||
Undrawn loan commitments – Wholesale | ||||||||||||||||||||||||||||||||||
Investment grade | $ | 223,333 | $ | 2 | $ | – | $ | 223,335 | $ | 222,819 | $ | 18 | $ | – | $ | 222,837 | ||||||||||||||||||
Non-investment grade | 98,452 | 9,300 | – | 107,752 | 96,191 | 9,007 | – | 105,198 | ||||||||||||||||||||||||||
Not rated(1) | 3,269 | 1 | – | 3,270 | 3,986 | – | – | 3,986 | ||||||||||||||||||||||||||
Total | 325,054 | 9,303 | – | 334,357 | 322,996 | 9,025 | – | 332,021 | ||||||||||||||||||||||||||
| (1) | In certain cases where an internal risk rating is not assigned, we use other approved credit risk assessment or rating methodologies, policies and tools to manage our credit risk. |
| (2) | Items not subject to impairment are loans held at FVTPL. |
Table of Contents
62 Royal Bank of Canada First Quarter 2020
Note 5 Loans and allowance for credit losses(continued) |
Loans past due but not impaired(1)
| As at | ||||||||||||||||||||||||||||||||||
| January 31, 2020 | October 31, 2019 | |||||||||||||||||||||||||||||||||
| (Millions of Canadian dollars) | 1 to 29 days | 30 to 89 days | 90 days and greater | Total | 1 to 29 days | 30 to 89 days | 90 days and greater | Total | ||||||||||||||||||||||||||
Retail | $ | 3,749 | $ | 1,423 | $ | 202 | $ | 5,374 | $ | 3,173 | $ | 1,369 | $ | 186 | $ | 4,728 | ||||||||||||||||||
Wholesale | 2,521 | 516 | 5 | 3,042 | 1,543 | 460 | 3 | 2,006 | ||||||||||||||||||||||||||
| $ | 6,270 | $ | 1,939 | $ | 207 | $ | 8,416 | $ | 4,716 | $ | 1,829 | $ | 189 | $ | 6,734 | |||||||||||||||||||
| (1) | Amounts presented may include loans past due as a result of administrative processes, such as mortgage loans on which payments are restrained pending payout due to sale or refinancing. Past due loans arising from administrative processes are not representative of the borrowers’ ability to meet their payment obligations. |
Note 6 Deposits
|
| As at | ||||||||||||||||||||||||||||||||||
| January 31, 2020 | October 31, 2019 | |||||||||||||||||||||||||||||||||
| (Millions of Canadian dollars) | Demand(1) | Notice(2) | Term(3) | Total | Demand (1) | Notice (2) | Term (3) | Total | ||||||||||||||||||||||||||
Personal | $ | 149,105 | $ | 51,253 | $ | 101,644 | $ | 302,002 | $ | 143,958 | $ | 49,806 | $ | 100,968 | $ | 294,732 | ||||||||||||||||||
Business and government | 253,815 | 11,855 | 303,566 | 569,236 | 253,113 | 13,867 | 298,502 | 565,482 | ||||||||||||||||||||||||||
Bank | 10,277 | 870 | 19,899 | 31,046 | 8,363 | 920 | 16,508 | 25,791 | ||||||||||||||||||||||||||
| $ | 413,197 | $ | 63,978 | $ | 425,109 | $ | 902,284 | $ | 405,434 | $ | 64,593 | $ | 415,978 | $ | 886,005 | |||||||||||||||||||
Non-interest-bearing(4) | ||||||||||||||||||||||||||||||||||
Canada | $ | 94,688 | $ | 5,884 | $ | 248 | $ | 100,820 | $ | 93,163 | $ | 5,692 | $ | 137 | $ | 98,992 | ||||||||||||||||||
United States | 32,782 | – | – | 32,782 | 34,632 | – | – | 34,632 | ||||||||||||||||||||||||||
Europe(5) | 871 | – | – | 871 | 760 | – | – | 760 | ||||||||||||||||||||||||||
Other International | 5,620 | 5 | – | 5,625 | 5,225 | 5 | – | 5,230 | ||||||||||||||||||||||||||
Interest-bearing(4) | ||||||||||||||||||||||||||||||||||
Canada | 235,619 | 15,861 | 336,966 | 588,446 | 228,386 | 15,306 | 333,118 | 576,810 | ||||||||||||||||||||||||||
United States | 5,610 | 38,336 | 46,350 | 90,296 | 4,704 | 39,626 | 41,776 | 86,106 | ||||||||||||||||||||||||||
Europe(5) | 32,998 | 880 | 30,668 | 64,546 | 33,073 | 825 | 30,090 | 63,988 | ||||||||||||||||||||||||||
Other International | 5,009 | 3,012 | 10,877 | 18,898 | 5,491 | 3,139 | 10,857 | 19,487 | ||||||||||||||||||||||||||
| $ | 413,197 | $ | 63,978 | $ | 425,109 | $ | 902,284 | $ | 405,434 | $ | 64,593 | $ | 415,978 | $ | 886,005 | |||||||||||||||||||
| (1) | Demand deposits are deposits for which we do not have the right to require notice of withdrawal, which includes both savings and chequing accounts. |
| (2) | Notice deposits are deposits for which we can legally require notice of withdrawal. These deposits are primarily savings accounts. |
| (3) | Term deposits are deposits payable on a fixed date, and include term deposits, guaranteed investment certificates and similar instruments. |
| (4) | The geographical splits of the deposits are based on the point of origin of the deposits and where the revenue is recognized. As at January 31, 2020, deposits denominated in U.S. dollars, British pounds, Euro and other foreign currencies were $325 billion, $27 billion, $47 billion and $31 billion, respectively (October 31, 2019 – $321 billion, $23 billion, $45 billion and $31 billion, respectively). |
| (5) | Europe includes the United Kingdom, Luxembourg, the Channel Islands, France and Italy. |
Contractual maturities of term deposits
| As at | ||||||||
| (Millions of Canadian dollars) | January 31 2020 | October 31 2019 | ||||||
Within 1 year: | ||||||||
less than 3 months | $ | 116,904 | $ | 94,585 | ||||
3 to 6 months | 49,773 | 62,814 | ||||||
6 to 12 months | 91,855 | 92,507 | ||||||
1 to 2 years | 42,322 | 50,055 | ||||||
2 to 3 years | 36,091 | 31,852 | ||||||
3 to 4 years | 32,132 | 31,373 | ||||||
4 to 5 years | 22,043 | 21,130 | ||||||
Over 5 years | 33,989 | 31,662 | ||||||
| $ | 425,109 | $ | 415,978 | |||||
Aggregate amount of term deposits in denominations of one hundred thousand dollars or more | $ | 388,000 | $ | 379,000 | ||||
Table of Contents
Royal Bank of Canada First Quarter 2020 63
Note 7 Employee benefits – Pension and other post-employment benefits
|
We offer a number of defined benefit and defined contribution plans which provide pension and post-employment benefits to eligible employees. The following tables present the composition of our pension and other post-employment benefit expense and the effects of remeasurements recorded in other comprehensive income.
Pension and other post-employment benefit expense
| For the three months ended | ||||||||||||||||||
| Pension plans | Other post-employment benefit plans | |||||||||||||||||
| (Millions of Canadian dollars) | January 31 2020 | January 31 2019 | January 31 2020 | January 31 2019 | ||||||||||||||
Current service costs | $ | 92 | $ | 74 | $ | 11 | $ | 10 | ||||||||||
Net interest expense (income) | 5 | (5 | ) | 15 | 16 | |||||||||||||
Remeasurements of other long term benefits | – | – | 4 | 2 | ||||||||||||||
Administrative expense | 4 | 4 | – | – | ||||||||||||||
Defined benefit pension expense | $ | 101 | $ | 73 | $ | 30 | $ | 28 | ||||||||||
Defined contribution pension expense | 63 | 61 | – | – | ||||||||||||||
| $ | 164 | $ | 134 | $ | 30 | $ | 28 | |||||||||||
Pension and other post-employment benefit remeasurements(1)
| For the three months ended | ||||||||||||||||||||
| Defined benefit pension plans | Other post-employment benefit plans | |||||||||||||||||||
| (Millions of Canadian dollars) | January 31 2020 | January 31 2019 | January 31 2020 | January 31 2019 | ||||||||||||||||
Actuarial (gains) losses: | ||||||||||||||||||||
Changes in financial assumptions(2) | $ | 1,047 | $ | 607 | $ | 96 | $ | 57 | ||||||||||||
Experience adjustments | – | – | – | (1 | ) | |||||||||||||||
Return on plan assets (excluding interest based on discount rate) | (507 | ) | (144 | ) | – | – | ||||||||||||||
| $ | 540 | $ | 463 | $ | 96 | $ | 56 | |||||||||||||
| (1) | Market based assumptions, including Changes in financial assumptions and Return on plan assets, are reviewed on a quarterly basis. All other assumptions are updated during our annual review of plan assumptions. |
| (2) | Changes in financial assumptions in our defined benefit pension plans primarily relate to changes in discount rates. |
Note 8 Significant capital and funding transactions
|
Preferred Shares
On December 17, 2019, we purchased for cash 200,000 depositary shares, each representing a one-fortieth interest in a share of our Fixed Rate/Floating Rate Non-Cumulative First Preferred Shares, Series C-2 (C-2 Preferred Shares), for aggregate total consideration, including accrued dividends, of US$6 million. The purchased depositary and underlying C-2 Preferred Shares were subsequently cancelled. The C-2 Preferred Shares do not qualify as Tier 1 regulatory capital.
Subordinated debentures
On December 6, 2019, we redeemed all $2,000 million of our outstanding 2.99% subordinated debentures due on December 6, 2024 for 100% of their principal amount plus interest accrued to, but excluding, the redemption date.
On December 23, 2019, we issued $1,500 million of NVCC subordinated debentures. The notes bear interest at a fixed rate of 2.88% per annum until December 23, 2024, and at the three-month Canadian Dollar Offered Rate plus 0.89% thereafter until their maturity on December 23, 2029.
Common shares issued(1)
| For the three months ended | ||||||||||||||||||||
| January 31, 2020 | January 31, 2019 | |||||||||||||||||||
| (Millions of Canadian dollars, except number of shares) | Number of shares (thousands) | Amount | Number of shares (thousands) | Amount | ||||||||||||||||
Issued in connection with share-based compensation plans(2) | 233 | $ | 18 | 159 | $ | 11 | ||||||||||||||
Purchased for cancellation(3) | (6,993 | ) | (86 | ) | (3,684 | ) | (45 | ) | ||||||||||||
| (6,760 | ) | $ | (68 | ) | (3,525 | ) | $ | (34 | ) | |||||||||||
| (1) | The requirements of our dividend reinvestment plan (DRIP) are satisfied through either open market share purchases or shares issued from treasury. During the three months ended January 31, 2020 and January 31, 2019, our DRIP’s requirements were satisfied through open market share purchases. |
| (2) | Amounts include cash received for stock options exercised during the period and the fair value adjustment to stock options. |
| (3) | During the three months ended January 31, 2020, we purchased for cancellation common shares at a total fair value of $727 million (average cost of $104.02 per share), with a book value of $86 million (book value of $12.34 per share). During the three months ended January 31, 2019, we purchased for cancellation common shares at a total fair value of $348 million (average cost of $94.40 per share), with a book value of $45 million (book value of $12.25 per share). |
Table of Contents
64 Royal Bank of Canada First Quarter 2020
Note 9 Earnings per share
|
| For the three months ended | ||||||||
| (Millions of Canadian dollars, except share and per share amounts) | January 31 2020 | January 31 2019 | ||||||
Basic earnings per share | ||||||||
Net income | $ | 3,509 | $ | 3,172 | ||||
Preferred share dividends | (65 | ) | (74 | ) | ||||
Net income attributable tonon-controlling interests | (5 | ) | (2 | ) | ||||
Net income available to common shareholders | 3,439 | 3,096 | ||||||
Weighted average number of common shares (in thousands) | 1,427,599 | 1,437,074 | ||||||
Basic earnings per share (in dollars) | $ | 2.41 | $ | 2.15 | ||||
Diluted earnings per share | ||||||||
Net income available to common shareholders | $ | 3,439 | $ | 3,096 | ||||
Dilutive impact of exchangeable shares | 4 | 4 | ||||||
Net income available to common shareholders including dilutive impact of exchangeable shares | 3,443 | 3,100 | ||||||
Weighted average number of common shares (in thousands) | 1,427,599 | 1,437,074 | ||||||
Stock options(1) | 1,698 | 2,033 | ||||||
Issuable under other share-based compensation plans | 750 | 737 | ||||||
Exchangeable shares(2) | 3,013 | 3,351 | ||||||
Average number of diluted common shares (in thousands) | 1,433,060 | 1,443,195 | ||||||
Diluted earnings per share (in dollars) | $ | 2.40 | $ | 2.15 | ||||
| (1) | The dilutive effect of stock options was calculated using the treasury stock method. When the exercise price of options outstanding is greater than the average market price of our common shares, the options are excluded from the calculation of diluted earnings per share. For the three months ended January 31, 2020, no outstanding options were excluded from the calculation of diluted earnings per share. For the three months ended January 31, 2019, 1,364,706 outstanding options with an average price of $99.73 were excluded from the calculation of diluted earnings per share. |
| (2) | Includes exchangeable preferred shares. |
Note 10 Legal and regulatory matters
|
We are a large global institution that is subject to many different complex legal and regulatory requirements that continue to evolve. We are and have been subject to a variety of legal proceedings, including civil claims and lawsuits, regulatory examinations, investigations, audits and requests for information by various governmental regulatory agencies and law enforcement authorities in various jurisdictions. Some of these matters may involve novel legal theories and interpretations and may be advanced under criminal as well as civil statutes, and some proceedings could result in the imposition of civil, regulatory enforcement or criminal penalties. We review the status of all proceedings on an ongoing basis and will exercise judgment in resolving them in such manner as we believe to be in our best interest. This is an area of significant judgment and uncertainty and the extent of our financial and other exposure to these proceedings after taking into account current accruals could be material to our results of operations in any particular period.
Our significant legal proceeding and regulatory matters are described in Note 26 of our 2019 Annual Consolidated Financial Statements.
Table of Contents
Royal Bank of Canada First Quarter 2020 65
Note 11 Results by business segment
|
| For the three months ended January 31, 2020 | ||||||||||||||||||||||||||||
| (Millions of Canadian dollars) | Personal & Commercial Banking | Wealth Management | Insurance | Investor & Treasury Services | Capital Markets(1) | Corporate Support (1) | Total | |||||||||||||||||||||
Net interest income(2) | $ | 3,226 | $ | 738 | $ | – | $ | 58 | $ | 1,161 | $ | 38 | $ | 5,221 | ||||||||||||||
Non-interest income | 1,384 | 2,428 | 1,994 | 539 | 1,387 | (117 | ) | 7,615 | ||||||||||||||||||||
Total revenue | 4,610 | 3,166 | 1,994 | 597 | 2,548 | (79 | ) | 12,836 | ||||||||||||||||||||
Provision for credit losses | 342 | (2 | ) | – | – | 79 | – | 419 | ||||||||||||||||||||
Insurance policyholder benefits, claims and acquisition expense | – | – | 1,614 | – | – | – | 1,614 | |||||||||||||||||||||
Non-interest expense | 1,984 | 2,370 | 153 | 402 | 1,435 | 34 | 6,378 | |||||||||||||||||||||
Net income (loss) before income taxes | 2,284 | 798 | 227 | 195 | 1,034 | (113 | ) | 4,425 | ||||||||||||||||||||
Income taxes (recoveries) | 598 | 175 | 46 | 52 | 152 | (107 | ) | 916 | ||||||||||||||||||||
Net income | $ | 1,686 | $ | 623 | $ | 181 | $ | 143 | $ | 882 | $ | (6 | ) | $ | 3,509 | |||||||||||||
Non-interest expense includes: | ||||||||||||||||||||||||||||
Depreciation and amortization | $ | 234 | $ | 210 | $ | 15 | $ | 50 | $ | 127 | $ | – | $ | 636 | ||||||||||||||
| For the three months ended January 31, 2019 | ||||||||||||||||||||||||||||
| (Millions of Canadian dollars) | Personal & Commercial Banking | Wealth Management | Insurance | Investor & Treasury Services | Capital Markets (1) | Corporate Support (1) | Total | |||||||||||||||||||||
Net interest income(2), (3) | $ | 3,134 | $ | 744 | $ | – | $ | (31 | ) | $ | 969 | $ | 31 | $ | 4,847 | |||||||||||||
Non-interest income(3) | 1,284 | 2,204 | 1,579 | 662 | 1,129 | (116 | ) | 6,742 | ||||||||||||||||||||
Total revenue | 4,418 | 2,948 | 1,579 | 631 | 2,098 | (85 | ) | 11,589 | ||||||||||||||||||||
Provision for credit losses | 348 | 26 | – | – | 140 | – | 514 | |||||||||||||||||||||
Insurance policyholder benefits, claims and acquisition expense | – | – | 1,225 | – | – | – | 1,225 | |||||||||||||||||||||
Non-interest expense | 1,915 | 2,164 | 154 | 418 | 1,230 | 31 | 5,912 | |||||||||||||||||||||
Net income (loss) before income taxes | 2,155 | 758 | 200 | 213 | 728 | (116 | ) | 3,938 | ||||||||||||||||||||
Income taxes (recoveries) | 584 | 161 | 34 | 52 | 75 | (140 | ) | 766 | ||||||||||||||||||||
Net income | $ | 1,571 | $ | 597 | $ | 166 | $ | 161 | $ | 653 | $ | 24 | $ | 3,172 | ||||||||||||||
Non-interest expense includes: | ||||||||||||||||||||||||||||
Depreciation and amortization | $ | 153 | $ | 147 | $ | 11 | $ | 34 | $ | 95 | $ | – | $ | 440 | ||||||||||||||
| (1) | Taxable equivalent basis. |
| (2) | Interest revenue is reported net of interest expense as we rely primarily on net interest income as a performance measure. |
| (3) | Commencing Q4 2019, the interest component of the valuation of certain deposits carried at FVTPL previously presented in trading revenue is presented in net interest income. Comparative amounts have been reclassified to conform with this presentation. |
Total assets and total liabilities by business segment
| As at January 31, 2020 | ||||||||||||||||||||||||||||
| (Millions of Canadian dollars) | Personal & Commercial Banking | Wealth Management | Insurance | Investor & Treasury Services | Capital Markets | Corporate Support | Total | |||||||||||||||||||||
Total assets | $ | 489,522 | $ | 109,969 | $ | 20,293 | $ | 144,707 | $ | 666,824 | $ | 44,989 | $ | 1,476,304 | ||||||||||||||
Total liabilities | $ | 489,545 | $ | 109,963 | $ | 20,270 | $ | 144,664 | $ | 666,785 | $ | (38,984 | ) | $ | 1,392,243 | |||||||||||||
| As at October 31, 2019 | ||||||||||||||||||||||||||||
| (Millions of Canadian dollars) | Personal & Commercial Banking | Wealth Management | Insurance | Investor & Treasury Services | Capital Markets | Corporate Support | Total | |||||||||||||||||||||
Total assets | $ | 481,720 | $ | 106,579 | $ | 19,012 | $ | 144,406 | $ | 634,313 | $ | 42,905 | $ | 1,428,935 | ||||||||||||||
Total liabilities | $ | 481,745 | $ | 106,770 | $ | 19,038 | $ | 144,378 | $ | 634,126 | $ | (40,747 | ) | $ | 1,345,310 | |||||||||||||
Table of Contents
66 Royal Bank of Canada First Quarter 2020
Note 12 Capital management
|
Regulatory capital and capital ratios
OSFI formally establishes risk-based capital and leverage targets for deposit-taking institutions in Canada. During the firstquarter of 2020, we complied with all capital and leverage requirements, including the domestic stability buffer, imposed by OSFI.
| As at | ||||||||
| (Millions of Canadian dollars, except percentage amounts and as otherwise noted) | January 31 2020 | October 31 2019 | ||||||
Capital(1) | ||||||||
CET1 capital | $ | 63,054 | $ | 62,184 | ||||
Tier 1 capital | 68,709 | 67,861 | ||||||
Total capital | 78,220 | 77,888 | ||||||
Risk-weighted Assets (RWA) used in calculation of capital ratios(1) | ||||||||
Credit risk | $ | 428,067 | $ | 417,835 | ||||
Market risk | 28,415 | 28,917 | ||||||
Operational risk | 67,243 | 66,104 | ||||||
Total RWA | $ | 523,725 | $ | 512,856 | ||||
Capital ratios and Leverage ratio(1) | ||||||||
CET1 ratio | 12.0% | 12.1% | ||||||
Tier 1 capital ratio | 13.1% | 13.2% | ||||||
Total capital ratio | 14.9% | 15.2% | ||||||
Leverage ratio | 4.2% | 4.3% | ||||||
Leverage ratio exposure (billions) | $ | 1,630 | $ | 1,570 | ||||
| (1) | Capital, RWA, and capital ratios are calculated using OSFI Capital Adequacy Requirements based on the Basel III framework. The leverage ratio is calculated using OSFI Leverage Requirements Guideline based on the Basel III framework. |
Table of Contents
Royal Bank of Canada First Quarter 2020 67
|
Corporate headquarters Street address: Royal Bank of Canada 200 Bay Street Toronto, Ontario M5J 2J5 Canada Tel:1-888-212-5533
Mailing address: P.O. Box 1 Royal Bank Plaza Toronto, Ontario M5J 2J5 Canada website: rbc.com
Transfer Agent and Registrar Main Agent: Computershare Trust Company of Canada 1500 Robert-Bourassa Blvd. Suite 700 Montreal, Quebec H3A 3S8 Canada Tel:1-866-586-7635 (Canada and the U.S.) or514-982-7555 (International) Fax:514-982-7580 website: computershare.com/rbc
Co-Transfer Agent (U.S.): Computershare Trust Company, N.A. 250 Royall Street Canton, Massachusetts 02021 U.S.A.
Co-Transfer Agent (U.K.): Computershare Investor Services PLC Securities Services – Registrars P.O. Box 82, The Pavilions, Bridgwater Road, Bristol BS99 6ZZ U.K.
Stock exchange listings (Symbol: RY)
Common shares are listed on: Canada – Toronto Stock Exchange (TSX) U.S. – New York Stock Exchange (NYSE) Switzerland – Swiss Exchange (SIX)
All preferred shares are listed on the TSX with the exception of the seriesC-2. The related depository shares of the seriesC-2 preferred shares are listed on the NYSE. | Valuation day price For Canadian income tax purposes, Royal Bank of Canada’s common stock was quoted at $29.52 per share on the Valuation Day (December 22, 1971). This is equivalent to $7.38 per share after adjusting for thetwo-for-one stock split of March 1981 and thetwo-for-one stock split of February 1990. The one-for-one stock dividends in October 2000 and April 2006 did not affect the Valuation Day amount for our common shares.
Shareholder contacts For dividend information, change in share registration or address, lost stock certificates, tax forms, estate transfers or dividend reinvestment, please contact: Computershare Trust Company of Canada 100 University Avenue, 8th Floor Toronto, Ontario M5J 2Y1 Canada
Tel:1-866-586-7635 (Canada and the U.S.) or514-982-7555 (International) Fax:1-888-453-0330 (Canada and the U.S.) or416-263-9394 (International) email: service@computershare.com
For other shareholder inquiries, please contact: Shareholder Relations Royal Bank of Canada 200 Bay Street South Tower Toronto, Ontario M5J 2J5 Canada Tel:416-955-7806
Financial analysts, portfolio managers, institutional investors For financial information inquiries, please contact: Investor Relations Royal Bank of Canada 200 Bay Street South Tower Toronto, Ontario M5J 2J5 Canada Tel:416-955-7802
or visit our website at rbc.com/investorrelations | Direct deposit service Shareholders in Canada and the U.S. may have their RY common share dividends deposited directly to their bank account by electronic funds transfer. To arrange for this service, please contact our Transfer Agent and Registrar, Computershare Trust Company of Canada.
Eligible dividend designation For purposes of theIncome Tax Act (Canada) and any corresponding provincial and territorial tax legislation, all dividends (and deemed dividends) paid by RBC to Canadian residents on both its common and preferred shares, are designated as “eligible dividends”, unless stated otherwise.
Common share repurchases We are engaged in a Normal Course Issuer Bid (NCIB) which allows us to repurchase for cancellation, up to 20 million common shares during the period spanning from March 1, 2019 to February 29, 2020, when the bid expires, or such earlier date as we may complete the purchases pursuant to our Notice of Intention filed with the Toronto Stock Exchange. | We determine the amount and timing of the purchases under the NCIB, subject to prior consultation with the Office of the Superintendent of Financial Institutions Canada.
A copy of our Notice of Intention to file a NCIB may be obtained, without charge, by contacting our Corporate Secretary at our Toronto mailing address.
2020 Quarterly earnings release dates First quarter February 21 Second quarter May 27 Third quarter August 26 Fourth quarter December 2
2020 Annual Meeting The Annual Meeting of Common Shareholders will be held on Wednesday, April 8, 2020, at 9:30 a.m. (Eastern Time) at the Metro Toronto Convention Centre, North Building, John Bassett Theatre 255 Front Street West, Toronto, Ontario, Canada | |||||||||||
Dividend dates for 2020 Subject to approval by the Board of Directors
| ||||||||||||||
Record dates
| Payment dates
| |||||||||||||
Common and preferred shares series W, AA, AC, AE, AF, AG, AZ, BB, BD, BF, BH, BI, BJ, BK, BM and BO
| January 27 April 23 July 27 October 26
| February 24 May 22 August 24 November 24
| ||||||||||||
Preferred shares seriesC-2 (US$) | January 28 April 27 July 28 October 27
| February 7 May 7 August 7 November 6
| ||||||||||||
Governance Summaries of the significant ways in which corporate governance practices followed by RBC differ from corporate governance practices required to be followed by U.S. domestic companies under the NYSE listing standards are available on our website at rbc.com/governance.
| ||||||||||||||
Information contained in or otherwise accessible through the websites mentioned in this report to shareholders does not form a part of this report. All references to websites are inactive textual references and are for your information only.
Trademarks used in this report include the LION & GLOBE Symbol, ROYAL BANK OF CANADA, RBC, and RBC HOMELINE PLAN which are trademarks of Royal Bank of Canada used by Royal Bank of Canada and/or by its subsidiaries under license.All other trademarks mentioned in this report which are not the property of Royal Bank of Canada, are owned by their respective holders.