Exhibit 99.2

Royal Bank of Canada second quarter 2022 results |
All amounts are in Canadian dollars and are based on financial statements presented in compliance with International Accounting Standard 34, unless otherwise noted.
Interim Financial Reporting
Net Income $4.3 Billion Up 6% YoY | Diluted EPS (1) $2.96 Up 7% YoY | PCL (1) $(342) Million PCL on loans ratio (1) down 23 bps (1) QoQ | ROE (2) 18.4% Down 100 bps YoY | CET1 Ratio (1) 13.2% Robust capital levels, up 40 bps YoY |
TORONTO, May
26, 2022
Pre-provision, pre-tax earnings
3
of $5.0 billion were down $124 million or 2% from a year ago, mainly reflecting lower Capital Markets revenue compared to elevated levels last year, lower spreads, and higher salaries, technology investments and discretionary costs to support strong client-driven growth. Changes in the fair value of hedges related to our U.S. share-based compensation plans also impacted revenue. These factors were partially offset by strong growth in volumes and fee-based client assets, and lower variable and share-based compensation.Compared to last quarter, net income was up $158 million or 4% with higher results in Personal & Commercial Banking, Corporate Support, Insurance and Investor & Treasury Services, partially offset by lower results in Capital Markets and Wealth Management.
The PCL on loans ratio of (18) bps was down 23 bps from last quarter, primarily due to releases of provisions in Personal & Commercial Banking in the current quarter as compared to provisions taken in the prior quarter. The PCL on impaired loans ratio of 9 bps was unchanged from last quarter.
Our capital position remained robust, with a Common Equity Tier 1 (CET1) ratio of 13.2% while supporting strong client-driven organic growth. In addition, this quarter we returned $3.6 billion to our shareholders through common share buybacks and dividends. And today, we declared a quarterly dividend of $1.28 per share reflecting an increase of $0.08 or 7%. We also had a strong average Liquidity Coverage Ratio (LCR) of 121%.
“The resilience of our diversified business model, prudent risk and capital management, and strategic investments in talent and technology continued to define our performance in the second quarter. We remain well-positioned for future growth, and to deliver differentiated long-term value for our clients, employees and shareholders. At a time when geopolitical tensions, inflationary pressures and global supply chain issues are creating an uncertain macroeconomic backdrop, I’m proud of how RBC employees continue to drive positive change in our communities and deliver trusted advice and insights for those we serve. We will continue to leverage our scale and financial strength, and the powerful combination of our people and culture, to play a leading role in shaping a thoughtful transition to net zero and an inclusive post-pandemic future.” – Dave McKay, RBC President and Chief Executive Officer | ||
Q2 2022 Compared to Q2 2021 | • Net income of $4,253 million • Diluted EPS of $2.96 • ROE of 18.4% • CET1 ratio of 13.2% | h h ¯ h | ||||
Q2 2022 Compared to Q1 2022 | • Net income of $4,253 million • Diluted EPS of $2.96 • ROE of 18.4% • CET1 ratio of 13.2% | h h h ¯ | ||||
YTD 2022 Compared to YTD 2021 | • Net income of $8,348 million • Diluted EPS of $5.80 • ROEof 17.9% | h h ¯ | ||||
| (1) | See Glossary section of this Q2 2022 Report to Shareholders for composition of this measure. |
| (2) | Return on equity (ROE). This measure does not have a standardized meaning under generally accepted accounting principles (GAAP). For further information, refer to the Key performance and non-GAAP measures section of this Q2 2022Report to Shareholders. |
| (3) | Pre-provision, pre-tax (PPPT) earnings is calculated as income (April 30, 2022: $4,253 million; April 30, 2021: $4,015 million) before income taxes (April 30, 2022: $1,055 million; April 30, 2021: $1,171 million) and PCL (April 30, 2022: $(342) million; April 30, 2021: $(96) million). This is anon-GAAP measure. PPPT earnings do not have a standardized meaning under GAAP and may not be comparable to similar measures disclosed by other financial institutions. We use PPPT earnings to assess our ability to generate sustained earnings growth outside of credit losses, which are impacted by the cyclical nature of a credit cycle. We believe that certainnon-GAAP measures are more reflective of our ongoing operating results and provide readers with a better understanding of management’s perspective on our performance. |
Table of contents
1 | ||||
2 | ||||
2 | ||||
2 | ||||
| 2 | About Royal Bank of Canada | |||
| 3 | Selected financial and other highlights | |||
| 4 | Economic, market and regulatory review and outlook | |||
5 | ||||
6 | ||||
| 6 | Overview | |||
11 | ||||
| 11 | How we measure and report our business segments | |||
41 | ||||
45 | ||||
| 45 | Summary of accounting policies and estimates | |||
| 45 | Controls and procedures | |||
45 | ||||
46 | ||||
48 | ||||
49 | (unaudited) | |||
55 | (unaudited) | |||
79 | ||||
2 Second Quarter 2022
Royal Bank of Canada
Management’s Discussion and Analysis |
Management’s Discussion and Analysis (MD&A) is provided to enable a reader to assess our results of operations and financial condition for the three and six months periods ended or as at April 30, 2022, compared to the corresponding periods in the prior fiscal year and the three month period ended January 31, 2022. This MD&A should be read in conjunction with our unaudited Interim Condensed Consolidated Financial Statements for the quarter ended April 30, 2022 (Condensed Financial Statements) and related notes and our 2021 Annual Report. This MD&A is dated May 25, 2022. All amounts are in Canadian dollars, unless otherwise specified, and are based on financial statements presented in accordance with International Financial Reporting Standards (IFRS) as issued by the International Accounting Standards Board (IASB), unless otherwise noted.
Additional information about us, including our 2021 Annual Information Form, is available free of charge on our website at rbc.com/investorrelations, on the Canadian Securities Administrators’ website at sedar.com and on the EDGAR section of the United States (U.S.) Securities and Exchange Commission’s (SEC) website at sec.gov.
Information contained in or otherwise accessible through the websites mentioned herein does not form part of this report. All references in this report to websites are inactive textual references and are for your information only.
Caution regarding forward-looking statements |
From time to time, we make written or oral forward-looking statements within the meaning of certain securities laws, including the “safe harbour” provisions of theand any applicable Canadian securities legislation. We may make forward-looking statements in this Q2 2022 Report to Shareholders, in other filings with Canadian regulators or the SEC, in other reports to shareholders, and in other communications. Forward-looking statements in this document include, but are not limited to, statements relating to our financial performance objectives, vision and strategic goals, the Economic, market, and regulatory review and outlook for Canadian, U.S., European and global economies, the regulatory environment in which we operate, and the risk environment including our credit risk, market risk, liquidity and funding risk, and the potential continued impacts of the coronavirus
United States Private Securities Litigation Reform Act of 1995
(COVID-19)
pandemic on our business operations, financial results, condition and objectives and on the global economy and financial market conditions and includes our President and Chief Executive Officer’s statements. The forward-looking information contained in this document is presented for the purpose of assisting the holders of our securities and financial analysts in understanding our financial position and results of operations as at and for the periods ended on the dates presented, as well as our financial performance objectives, vision and strategic goals, and may not be appropriate for other purposes. Forward-looking statements are typically identified by words such as “believe”, “expect”, “foresee”, “forecast”, “anticipate”, “intend”, “estimate”, “goal”, “plan” and “project” and similar expressions of future or conditional verbs such as “will”, “may”, “should”, “could” or “would”.By their very nature, forward-looking statements require us to make assumptions and are subject to inherent risks and uncertainties, which give rise to the possibility that our predictions, forecasts, projections, expectations or conclusions will not prove to be accurate, that our assumptions may not be correct and that our financial performance objectives, vision and strategic goals will not be achieved. We caution readers not to place undue reliance on these statements as a number of risk factors could cause our actual results to differ materially from the expectations expressed in such forward-looking statements. These factors – many of which are beyond our control and the effects of which can be difficult to predict – include: credit, market, liquidity and funding, insurance, operational, regulatory compliance (which could lead to us being subject to various legal and regulatory proceedings, the potential outcome of which could include regulatory restrictions, penalties and fines), strategic, reputation, competitive, legal and regulatory environment, and systemic risks and other risks discussed in the risk sections and Impact of
COVID-19
pandemic section of our 2021 Annual Report and the Risk management section of this Q2 2022 Report to Shareholders; including business and economic conditions in the geographic regions in which we operate, information technology and cyber risks, environmental and social risk (including climate change), digital disruption and innovation, Canadian housing and household indebtedness, geopolitical uncertainty, privacy, data and third-party related risks, regulatory changes, culture and conduct, the effects of changes in government fiscal, monetary and other policies, tax risk and transparency, and the emergence of widespread health emergencies or public health crises such as pandemics and epidemics, including theCOVID-19
pandemic and its impact on the global economy, financial market conditions and our business operations, and financial results, condition and objectives. In addition, as we work to advance our climate goals, external factors outside of RBC’s reasonable control may act as constraints on their achievement, including varying decarbonization efforts across economies, the need for thoughtful climate policies around the world, more and better data, reasonably supported methodologies, technological advancements, the evolution of consumer behaviour, the challenges of balancing interim emissions goals with an orderly and just transition, and other significant considerations such as legal and regulatory obligations.We caution that the foregoing list of risk factors is not exhaustive and other factors could also adversely affect our results. When relying on our forward-looking statements to make decisions with respect to us, investors and others should carefully consider the foregoing factors and other uncertainties and potential events. Material economic assumptions underlying the forward-looking statements contained in this Q2 2022 Report to Shareholders are set out in the Economic, market and regulatory review and outlook section and for each business segment under the Strategic priorities and Outlook sections in our 2021 Annual Report, as updated by the Economic, market and regulatory review and outlook section of this Q2 2022 Report to Shareholders. Except as required by law, we do not undertake to update any forward-looking statement, whether written or oral, that may be made from time to time by us or on our behalf.
Additional information about these and other factors can be found in the risk sections and Impact of
COVID-19
pandemic section of our 2021 Annual Report and the Risk management section of this Q2 2022 Report to Shareholders.Overview and outlook |
About Royal Bank of Canada |
Royal Bank of Canada is a global financial institution with a purpose-driven,
principles-led
approach to delivering leading performance. Our success comes from the 89,000+ employees who leverage their imaginations and insights to bring our vision, values and strategy to life so we can help our clients thrive and communities prosper. As Canada’s biggest bank and one of the largest in the world, based on market capitalization, we have a diversified business model with a focus on innovation and providing exceptional experiences to our 17 million clients in Canada, the U.S. and 27 other countries. Learn more at rbc.com.Royal Bank of Canada
Selected financial and other highlights |
| As at or for the three months ended | As at or for the six months ended | |||||||||||||||||||||
| (Millions of Canadian dollars, except per share, number of and percentage amounts) | April 30 2022 | January 31 2022 | April 30 2021 | April 30 2022 | April 30 2021 | |||||||||||||||||
Total revenue | $ | 11,220 | $ | 13,066 | $ | 11,618 | $ | 24,286 | $ | 24,561 | ||||||||||||
Provision for credit losses (PCL) | (342 | ) | 105 | (96 | ) | (237 | ) | 14 | ||||||||||||||
Insurance policyholder benefits, claims and acquisition expense (PBCAE) | (180 | ) | 997 | 149 | 817 | 1,555 | ||||||||||||||||
Non-interest expense | 6,434 | 6,580 | 6,379 | 13,014 | 12,921 | |||||||||||||||||
Income before income taxes | 5,308 | 5,384 | 5,186 | 10,692 | 10,071 | |||||||||||||||||
Net income | $ | 4,253 | $ | 4,095 | $ | 4,015 | $ | 8,348 | $ | 7,862 | ||||||||||||
Segments – net income | ||||||||||||||||||||||
Personal & Commercial Banking | $ | 2,234 | $ | 1,974 | $ | 1,908 | $ | 4,208 | $ | 3,701 | ||||||||||||
Wealth Management (1) | 750 | 795 | 683 | 1,545 | 1,324 | |||||||||||||||||
Insurance | 206 | 197 | 187 | 403 | 388 | |||||||||||||||||
Investor & Treasury Services | 121 | 118 | 120 | 239 | 243 | |||||||||||||||||
Capital Markets | 795 | 1,030 | 1,071 | 1,825 | 2,138 | |||||||||||||||||
Corporate Support (1) | 147 | (19 | ) | 46 | 128 | 68 | ||||||||||||||||
Net income | $ | 4,253 | $ | 4,095 | $ | 4,015 | $ | 8,348 | $ | 7,862 | ||||||||||||
Selected information | ||||||||||||||||||||||
Earnings per share (EPS) – basic | $ | 2.97 | $ | 2.84 | $ | 2.76 | $ | 5.81 | $ | 5.42 | ||||||||||||
– diluted | 2.96 | 2.84 | 2.76 | 5.80 | 5.42 | |||||||||||||||||
Return on common equity (ROE) (2) | 18.4% | 17.3% | 19.4% | 17.9% | 19.0% | |||||||||||||||||
Average common equity (2) | $ | 93,300 | $ | 92,450 | $ | 83,450 | $ | 92,850 | $ | 82,050 | ||||||||||||
Net interest margin (NIM) – on average earning assets, net (3) | 1.45% | 1.39% | 1.50% | 1.42% | 1.50% | |||||||||||||||||
PCL on loans as a % of average net loans and acceptances | (0.18)% | 0.05% | (0.05)% | (0.06)% | 0.01% | |||||||||||||||||
PCL on performing loans as a % of average net loans and acceptances | (0.27)% | (0.04)% | (0.16)% | (0.15)% | (0.11)% | |||||||||||||||||
PCL on impaired loans as a % of average net loans and acceptances | 0.09% | 0.09% | 0.11% | 0.09% | 0.12% | |||||||||||||||||
Gross impaired loans (GIL) as a % of loans and acceptances | 0.27% | 0.28% | 0.40% | 0.27% | 0.40% | |||||||||||||||||
Liquidity coverage ratio (LCR) (4) | 121% | 124% | 133% | 121% | 133% | |||||||||||||||||
Net stable funding ratio (NSFR) (4) | 113% | 113% | 118% | 113% | 118% | |||||||||||||||||
Capital, Leverage and Total loss absorbing capacity (TLAC) ratios (5) | ||||||||||||||||||||||
Common Equity Tier 1 (CET1) ratio | 13.2% | 13.5% | 12.8% | 13.2% | 12.8% | |||||||||||||||||
Tier 1 capital ratio | 14.4% | 14.8% | 14.1% | 14.4% | 14.1% | |||||||||||||||||
Total capital ratio | 16.0% | 16.6% | 15.8% | 16.0% | 15.8% | |||||||||||||||||
Leverage ratio | 4.7% | 4.8% | 5.0% | 4.7% | 5.0% | |||||||||||||||||
TLAC ratio (6) | 27.0% | 26.4% | n.a. | 27.0% | n.a. | |||||||||||||||||
TLAC leverage ratio (6) | 8.7% | 8.5% | n.a. | 8.7% | n.a. | |||||||||||||||||
Selected balance sheet and other information (7) | ||||||||||||||||||||||
Total assets | $ | 1,848,572 | $ | 1,752,469 | $ | 1,615,316 | $ | 1,848,572 | $ | 1,615,316 | ||||||||||||
Securities, net of applicable allowance | 298,315 | 303,095 | 255,152 | 298,315 | 255,152 | |||||||||||||||||
Loans, net of allowance for loan losses | 774,464 | 740,031 | 673,511 | 774,464 | 673,511 | |||||||||||||||||
Derivative related assets | 156,204 | 92,319 | 97,236 | 156,204 | 97,236 | |||||||||||||||||
Deposits | 1,151,597 | 1,142,842 | 1,033,323 | 1,151,597 | 1,033,323 | |||||||||||||||||
Common equity | 97,006 | 94,469 | 85,544 | 97,006 | 85,544 | |||||||||||||||||
Total risk-weighted assets (RWA) | 585,839 | 569,285 | 555,607 | 585,839 | 555,607 | |||||||||||||||||
Assets under management (AUM) (3) | 958,200 | 1,021,500 | 929,800 | 958,200 | 929,800 | |||||||||||||||||
Assets under administration (AUA) (3), (8) | 6,118,900 | 6,445,900 | 6,111,000 | 6,118,900 | 6,111,000 | |||||||||||||||||
Common share information | ||||||||||||||||||||||
Shares outstanding (000s) – average basic | 1,409,702 | 1,421,807 | 1,424,889 | 1,415,855 | 1,424,107 | |||||||||||||||||
– average diluted | 1,412,552 | 1,424,602 | 1,427,107 | 1,418,676 | 1,426,183 | |||||||||||||||||
– end of period | 1,401,800 | 1,416,020 | 1,424,727 | 1,401,800 | 1,424,727 | |||||||||||||||||
Dividends declared per common share | $ | 1.20 | $ | 1.20 | $ | 1.08 | $ | 2.40 | $ | 2.16 | ||||||||||||
Dividend yield (3) | 3.5% | 3.5% | 3.9% | 3.5% | 4.1% | |||||||||||||||||
Dividend payout ratio (3) | 40% | 42% | 39% | 41% | 40% | |||||||||||||||||
Common share price (RY on TSX) (9) | $ | 129.75 | $ | 144.93 | $ | 117.31 | $ | 129.75 | $ | 117.31 | ||||||||||||
Market capitalization (TSX) (9) | 181,884 | 205,224 | 167,135 | 181,884 | 167,135 | |||||||||||||||||
Business information | ||||||||||||||||||||||
Employees (full-time equivalent) (FTE) | 86,007 | 85,211 | 83,709 | 86,007 | 83,709 | |||||||||||||||||
Bank branches | 1,290 | 1,287 | 1,307 | 1,290 | 1,307 | |||||||||||||||||
Automated teller machines (ATMs) | 4,377 | 4,368 | 4,469 | 4,377 | 4,469 | |||||||||||||||||
Period average US$ equivalent of C$1.00 (10) | 0.789 | 0.787 | 0.798 | 0.788 | 0.789 | |||||||||||||||||
Period-end US$ equivalent of C$1.00 | 0.778 | 0.787 | 0.813 | 0.778 | 0.813 | |||||||||||||||||
| (1) | Effective Q4 2021, gains (losses) on economic hedges of our U.S. share-based compensation plans, which are reflected in revenue, and related variability in share-based compensation expense driven by changes in the fair value of liabilities relating to our U.S. share-based compensation plans have been reclassified from our Wealth Management segment to Corporate Support. Comparative amounts have been reclassified to conform with this presentation. |
| (2) | Average amounts are calculated using methods intended to approximate the average of the daily balances for the period. This includes average common equity used in the calculation of ROE. For further details, refer to the Key performance and non-GAAP measures section. |
| (3) | See Glossary for composition of this measure. |
| (4) | The LCR and NSFR are calculated in accordance with the Office of the Superintendent of Financial Institutions’ (OSFI) Liquidity Adequacy Requirements (LAR) guideline. LCR is the average for the three months ended for each respective period. For further details, refer to the Liquidity and funding risk section. |
| (5) | Capital ratios are calculated using OSFI’s Capital Adequacy Requirements (CAR) guideline and the Leverage ratio is calculated using OSFI’s Leverage Requirements (LR) guideline. |
| (6) | Effective Q1 2022, OSFI requires Canadian Domestic Systemically Important Banks (D-SIBs) to meet minimum risk-based TLAC ratio and TLAC leverage ratio requirements which are calculated using OSFI’s TLAC guideline. For further details, refer to the Capital management section. |
| (7) | Represents period-end spot balances. |
| (8) | AUA includes $14 billion and $4 billion (January 31, 2022 – $15 billion and $3 billion; April 30, 2021 – $15 billion and $3 billion) of securitized residential mortgages and credit card loans, respectively. |
| (9) | Based on TSX closing market price at period-end. |
| (10) | Average amounts are calculated using month-end spot rates for the period. |
| n.a. | not applicable |
4 Second Quarter 2022
Royal Bank of Canada
Economic, market and regulatory review and outlook – data as at May 25, 2022 |
The predictions and forecasts in this section are based on information and assumptions from sources we consider reliable. If this information or these assumptions are not accurate, actual economic outcomes may differ materially from the outlook presented in this section.
Economic and market review and outlook
Inflation has surged higher and unemployment rates have continued to fall, prompting central banks in Canada, the U.S. and the United Kingdom (U.K.) to increase interest rates and to reduce asset holdings. The conflict between Russia and Ukraine has exacerbated global supply chain challenges and pushed key commodity prices higher, intensifying inflationary pressures. The economic impact from the COVID-19 pandemic has eased in most regions with recoveries in travel and hospitality sectors contributing to near-term growth momentum. However, the COVID-19 pandemic continues to impact goods manufacturing and supply, including economic disruptions in China resulting from stringent efforts to control virus spread. Low unemployment and strong demand for workers are driving wages higher. Central banks are expected to continue raising interest rates at the most aggressive pace in decades, which is expected to slow GDP growth later this year and into calendar 2023.
Canada
Canadian GDP is expected to have risen 4.5%
1
in the first calendar quarter of 2022, despite Omicron-related disruptions, following an increase of 6.7%1
in the final calendar quarter of 2021. Growth is expected to remain strong in the near-term driven by a rebound in spending in the travel and hospitality sectors. Inflation has surged higher, with year-over-year Canadian consumer price index (CPI) growth rising to 6.8% in April 2022 from 4.8% in December 2021, in part reflecting higher global commodity prices due to the conflict between Russia and Ukraine. Pricing pressures are also broadening over a wider array of goods and services as demand outpaces supply. The labour market has continued to improve with the unemployment rate falling to a multi-decade low of 5.2% in April 2022, and intensifying labour shortages have shown signs of strengthening wage growth. High inflation and strong labour markets are pushing the Bank of Canada (BoC) to raise interest rates more quickly than previously expected. The BoC has increased the overnight interest rate by 75 bps over March 2022 and April 2022 and has begun to reduce asset holdings. We expect the BoC to continue raising interest rates through to the end of calendar 2022. High levels of household savings are expected to support spending in the near-term, but elevated inflation and rising interest rates are expected to continue to slow down housing markets and dampen GDP growth later this year and into calendar 2023.U.S.
U.S. GDP contracted 1.4%
1
in the first calendar quarter of 2022 following a 6.9%1
increase in the final calendar quarter of 2021. While the economic impact of the COVID-19 pandemic has eased, global supply chain disruptions and growing labour shortages are expected to continue moderating GDP growth in calendar 2022. The unemployment rate fell to 3.6% in March and April 2022 and strong demand for workers has pushed wage growth higher. Inflation has continued to accelerate, with year-over-year U.S. CPI growth surging above 8% in March and April 2022, driven by broadening pressures across a widening array of goods and services as well as higher gasoline and vehicle prices. Low unemployment levels, rising wages and increasing inflation pressures have led the Federal Reserve (Fed) to raise interest rates by 75 bps since March 2022. We expect the Fed to continue increasing interest rates through to the end of calendar 2022 and in calendar 2023.Europe
Euro area GDP grew 0.3% in the first calendar quarter of 2022 following an increase of 0.3% in the final calendar quarter of 2021, with growth limited by the rapid spread of the Omicron variant and the impact of containment measures in some regions. The conflict between Russia and Ukraine is expected to weigh on GDP growth as a result of more direct trade linkages in comparison to North America. Rising inflation is expected to negatively impact consumer purchasing power and both the manufacturing and service sectors are seeing rising input prices. With inflation accelerating and unemployment low, the European Central Bank (ECB) is expected to increase interest rates beginning in the second half of calendar 2022. U.K. GDP increased 0.8% in the first calendar quarter of 2022 following a 1.3% increase in the final calendar quarter of 2021. Labour market shortages and inflation pressures are expected to persist. The Bank of England increased interest rates by 90 bps starting in December 2021 and we expect further increases this year and into calendar 2023.
Financial markets
Government bond yields remain low by historical standards, but have increased substantially as the global economic recovery has continued and inflation rates have risen. Equity markets have declined from the beginning of calendar 2022, with rising interest rates and inflation adding concerns to the growth outlook. Prices for some raw materials, including crude oil, remain well above pre-pandemic levels reflecting limited supply and rising demand and the impact of the conflict between Russia and Ukraine.
Regulatory environment
We continue to monitor and prepare for regulatory developments and changes in a manner that seeks to ensure compliance with new requirements while mitigating adverse business or financial impacts. Such impacts could result from new or amended laws or regulations and the expectations of those who enforce them. A high level summary of the key regulatory changes that have the potential to increase or decrease our costs and the complexity of our operations is included in the Legal and regulatory environment risk section of our 2021 Annual Report and updates are listed below. A summary of the
| 1 | Annualized rate |
Royal Bank of Canada
additional regulatory changes and relief instituted by governments globally and by OSFI in response to the
COVID-19
pandemic is included in the Impact ofCOVID-19
pandemic and Capital management sections of our 2021 Annual Report, with updates provided in the Capital management section of this Q2 2022 Report to Shareholders.Global uncertainty
The uncertainty around the COVID-19 pandemic has generally eased in most of our operating regions, in part due to the lifting of containment measures, greater availability of vaccines, strong labour markets and GDP growth. However, there remains some level of uncertainty, particularly around supply chain disruptions from recent COVID-19 related lockdowns in many large cities in China. Supply chain disruptions have been further exacerbated by geopolitical tensions, in particular the conflict between Russia and Ukraine, as have inflationary and trade policy pressures, which all pose risks to the global economic outlook. In April 2022, the International Monetary Fund (IMF) projected global growth of 3.6% in calendar 2022, down 0.8% from its January forecast, reflecting downward revisions to the forecast due to the economic effects caused by the conflict between Russia and Ukraine. While tensions between Russia and Ukraine remain elevated and the outcome of the conflict remains uncertain, our exposure to Russia and Ukraine is extremely limited, as we do not have operations in these countries, consistent with our strategy and risk appetite. Our diversified business model, as well as our product and geographic diversification, continue to help mitigate the risks posed by global uncertainty.
Interest Rate Benchmark Reform
On May 16, 2022, Refinitiv Benchmark Services (UK) Limited (RBSL), the administrator of the Canadian Dollar Offered Rate (CDOR), announced that the calculation and publication of all remaining tenors of CDOR will permanently cease after June 28, 2024. Concurrently, OSFI published their expectation that Federally Regulated Financial Institutions transition all new derivatives and securities to an alternative benchmark rate by June 30, 2023, with no new CDOR exposure after that date, with limited exceptions for risk management requirements. Furthermore, OSFI also expects all loan agreements referencing CDOR to be transitioned by June 28, 2024. The cessation of CDOR will be managed within our enterprise-wide interest rate benchmark reform program.
Government of Canada Budget 2022
On April 7, 2022, the Government of Canada presented its 2022 Budget, which included measures focused on ensuring banking and life insurers’ groups help pay a portion of the costs of the Canadian federal government’s
COVID-19
pandemic response. These proposed measures include a Canada Recovery Dividend (CRD), aone-time
15% tax for 2022 determined based on 2021 taxable income above $1 billion and payable in equal installments over five years, as well as a permanent increase in the corporate income tax rate of 1.5% on taxable income above $100 million that would apply to taxation years that end after April 7, 2022.Legislation relating to these proposed measures has yet to be issued and timing of enactment remains uncertain. While the ultimate impact will depend on the final legislation, the CRD is expected to reduce our net income when substantively enacted. The CRD is also expected to reduce our CET1 ratio.
Climate-related regulatory activity
Climate change regulations, frameworks, and guidance that apply to banks, insurers and asset managers are rapidly evolving. We continue to monitor the development of applicable laws in this area and the evolution of disclosure requirements for public issuers, including the Government of Canada’s recent announcement requiring banks and insurance companies to provide disclosures on their climate-related risks and exposures beginning in 2024, the proposed National Instrument 51-107 – Disclosure of Climate-related Matters issued by the Canadian Securities Administrators intended to introduce climate-related disclosure requirements for reporting issuers in Canada, the SEC’s proposed rule changes that would require many registrants to include certain climate-related disclosures in their regulatory filings, including the financial statements, and the International Sustainability Standards Board’s proposed standards for climate-related disclosures and general sustainability-related disclosures.
For a discussion on risk factors, including our framework and activities to manage these risks and other regulatory developments which may affect our business and financial results, refer to the Impact of
COVID-19
pandemic section, including the Impact of pandemic risk factor, and the Risk management – Top and emerging risks and Legal and regulatory environment risk sections of our 2021 Annual Report and the Risk and Capital management sections of this Q2 2022 Report to Shareholders.Key corporate events of 2022 |
Brewin Dolphin Holdings PLC
On March 31, 2022, we announced our intention via our subsidiary, RBC Wealth Management (Jersey) Holdings Limited, to acquire Brewin Dolphin Holdings PLC (Brewin Dolphin) by way of a recommended cash offer of 515 pence per share for the entire issued and to be issued share capital of Brewin Dolphin, which values Brewin Dolphin at approximately £1.6 billion ($2.6 billion) on a fully diluted basis as at March 30, 2022. Brewin Dolphin provides discretionary wealth management services in the U.K. and Ireland. The transaction is expected to close by the end of the third calendar quarter of 2022, subject to regulatory approvals and other customary closing conditions. For further details, refer to Note 6 of our Condensed Financial Statements.
6 Second Quarter 2022
Royal Bank of Canada
Financial performance |
Overview |
Q2 2022 vs. Q2 2021
Net income of $4,253 million was up $238 million or 6% from a year ago. Diluted EPS of $2.96 was up $0.20 or 7% and ROE of 18.4% was down from 19.4% last year. Our CET1 ratio of 13.2% was up 40 bps from a year ago.
Our earnings reflect higher results in Personal & Commercial Banking, Corporate Support, Wealth Management, Insurance and Investor & Treasury Services, partially offset by lower results in Capital Markets.
Q2 2022 vs. Q1 2022
Net income of $4,253 million was up $158 million or 4% from last quarter. Diluted EPS of $2.96 was up $0.12 or 4% and ROE of 18.4% was up from 17.3% in the prior quarter. Our CET1 ratio of 13.2% was down 30 bps from last quarter.
Our earnings reflect higher results in Personal & Commercial Banking, Corporate Support, Insurance and Investor & Treasury Services, partially offset by lower results in Capital Markets and Wealth Management.
Q2 2022 vs. Q2 2021 (Six months ended)
Net income of $8,348 million was up $486 million or 6% from the same period last year. Diluted EPS of $5.80 was up $0.38 or 7% and ROE of 17.9% was down from 19.0% in the prior year.
Our earnings reflect higher results in Personal & Commercial Banking, Wealth Management, Corporate Support and Insurance, partially offset by lower results in Capital Markets and Investor & Treasury Services.
For further details on our business segment results and CET1 ratio, refer to the Business segment results and Capital management sections, respectively.
Impact of foreign currency translation
The following table reflects the estimated impact of foreign currency translation on key income statement items:
| For the three months ended | For the six months ended | |||||||||||||
| (Millions of Canadian dollars, except per share amounts) | Q2 2022 vs. Q2 2021 | Q2 2022 vs. Q1 2022 | Q2 2022 vs. Q2 2021 | |||||||||||
Increase (decrease): | ||||||||||||||
Total revenue | $ | (16 | ) | $ | (43 | ) | $ | (82 | ) | |||||
PCL | (4 | ) | (1 | ) | (3 | ) | ||||||||
Non-interest expense | (18 | ) | (34 | ) | (70 | ) | ||||||||
Income taxes | 2 | (1 | ) | (2 | ) | |||||||||
Net income | 4 | (7 | ) | (7 | ) | |||||||||
Impact on EPS | ||||||||||||||
Basic | $ | – | $ | (0.01 | ) | $ | (0.01 | ) | ||||||
Diluted | – | (0.01 | ) | (0.01 | ) | |||||||||
The relevant average exchange rates that impact our business are shown in the following table:
| (Average foreign currency equivalent of C$1.00) (1) | For the three months ended | For the six months ended | ||||||||||||||||||||
April 30 2022 | January 31 2022 | April 30 2021 | April 30 2022 | April 30 2021 | ||||||||||||||||||
U.S. dollar | 0.789 | 0.787 | 0.798 | 0.788 | 0.789 | |||||||||||||||||
British pound | 0.605 | 0.586 | 0.577 | 0.595 | 0.575 | |||||||||||||||||
Euro | 0.721 | 0.695 | 0.669 | 0.708 | 0.656 | |||||||||||||||||
| (1) | Average amounts are calculated using month-end spot rates for the period. |
Royal Bank of Canada
Total revenue
| For the three months ended | For the six months ended | |||||||||||||||||||||||
| (Millions of Canadian dollars, except percentage amounts) | April 30 2022 | January 31 2022 | April 30 2021 | April 30 2022 | April 30 2021 | |||||||||||||||||||
Interest and dividend income | $ | 7,758 | $ | 7,378 | $ | 6,898 | $ | 15,136 | $ | 14,134 | ||||||||||||||
Interest expense | 2,484 | 2,107 | 2,044 | 4,591 | 4,245 | |||||||||||||||||||
Net interest income | $ | 5,274 | $ | 5,271 | $ | 4,854 | $ | 10,545 | $ | 9,889 | ||||||||||||||
NIM | 1.45% | 1.39% | 1.50% | 1.42% | 1.50% | |||||||||||||||||||
Insurance premiums, investment and fee income | $ | 234 | $ | 1,399 | $ | 536 | $ | 1,633 | $ | 2,345 | ||||||||||||||
Trading revenue | 289 | 314 | 377 | 603 | 901 | |||||||||||||||||||
Investment management and custodial fees | 1,892 | 1,961 | 1,711 | 3,853 | 3,414 | |||||||||||||||||||
Mutual fund revenue | 1,086 | 1,165 | 1,014 | 2,251 | 2,014 | |||||||||||||||||||
Securities brokerage commissions | 389 | 399 | 431 | 788 | 832 | |||||||||||||||||||
Service charges | 480 | 485 | 460 | 965 | 918 | |||||||||||||||||||
Underwriting and other advisory fees | 507 | 701 | 747 | 1,208 | 1,337 | |||||||||||||||||||
Foreign exchange revenue, other than trading | 251 | 271 | 292 | 522 | 581 | |||||||||||||||||||
Card service revenue | 288 | 291 | 281 | 579 | 553 | |||||||||||||||||||
Credit fees | 398 | 476 | 368 | 874 | 700 | |||||||||||||||||||
Net gains on investment securities | 23 | 15 | 82 | 38 | 117 | |||||||||||||||||||
Share of profit in joint ventures and associates | 24 | 29 | 24 | 53 | 49 | |||||||||||||||||||
Other | 85 | 289 | 441 | 374 | 911 | |||||||||||||||||||
Non-interest income | 5,946 | 7,795 | 6,764 | 13,741 | 14,672 | |||||||||||||||||||
Total revenue | $ | 11,220 | $ | 13,066 | $ | 11,618 | $ | 24,286 | $ | 24,561 | ||||||||||||||
Additional trading information | ||||||||||||||||||||||||
Net interest income (1) | $ | 642 | $ | 720 | $ | 642 | $ | 1,362 | $ | 1,382 | ||||||||||||||
Non-interest income | 289 | 314 | 377 | 603 | 901 | |||||||||||||||||||
Total trading revenue | $ | 931 | $ | 1,034 | $ | 1,019 | $ | 1,965 | $ | 2,283 | ||||||||||||||
| (1) | Reflects net interest income arising from trading-related positions, including assets and liabilities that are classified or designated at fair value through profit or loss (FVTPL). |
Q2 2022 vs. Q2 2021
Total revenue decreased $398 million or 3% from a year ago, mainly due to lower other revenue and insurance premiums, investment and fee income (Insurance revenue). Lower underwriting and other advisory fees also contributed to the decrease. These factors were partially offset by higher net interest income as well as higher investment management and custodial fees.
Net interest income increased $420 million or 9%, largely due to volume growth that more than offset the impact of lower spreads in Canadian Banking and U.S. Wealth Management (including City National). Higher lending revenue in Capital Markets also contributed to the increase.
NIM was down 5 bps compared to last year, mainly due to spread compression primarily in repo and secured financing products.
Insurance revenue decreased $302 million or 56%, mainly due to the change in fair value of investments backing policyholder liabilities, which is largely offset in PBCAE. This was partially offset by higher group annuity sales and business growth across most products.
Investment management and custodial fees increased $181 million or 11%, primarily due to higher average fee-based client assets reflecting net sales and market appreciation.
Underwriting and other advisory fees decreased $240 million or 32%, largely driven by lower equity and debt origination primarily in the U.S.
Other revenue decreased $356 million or 81%, mainly attributable to changes in the fair value of the hedges related to our U.S. share-based compensation plans, which was largely offset in Non-interest expense.
Q2 2022 vs. Q1 2022
Total revenue decreased $1,846 million or 14% from last quarter, mainly due to lower insurance revenue. Lower other revenue as well as underwriting and other advisory fees also contributed to the decrease.
Net interest income remained relatively flat. Higher spreads offset the impact of three less days in the current quarter in Canadian Banking and U.S. Wealth Management (including City National).
Insurance revenue decreased $1,165 million or 83%, primarily reflecting the change in fair value of investments backing policyholder liabilities and lower group annuity sales, both of which are largely offset in PBCAE.
Underwriting and other advisory fees decreased $194 million or 28%, mainly attributable to lower equity and debt origination across most regions, and lower M&A activity in the U.S.
Other revenue decreased $204 million or 71%, largely due to gains in our non-trading portfolios in the prior quarter, and changes in the fair value of the hedges related to our U.S. share-based compensation plans, which was largely offset in Non-interest expense. The prior quarter also included realized gains from commercial mortgage securitization activities. These factors were partially offset by gains on the sale of certain non-core affiliates.
8 Second Quarter 2022
Royal Bank of Canada
Q2 2022 vs. Q2 2021 (Six months ended)
Total revenue decreased $275 million or 1% from the same period last year, primarily driven by lower insurance and other revenue. Lower trading revenue also contributed to the decrease. These factors were partially offset by higher net interest income, investment management and custodial fees as well as mutual fund revenue.
Net interest income increased $656 million or 7%, largely due to volume growth that more than offset lower spreads in Canadian Banking and Wealth Management. Higher lending revenue in Capital Markets also contributed to the increase.
Insurance revenue decreased $712 million or 30%, mainly due to the change in fair value of investments backing policyholder liabilities, which is largely offset in PBCAE. This was partially offset by higher group annuity sales and business growth across most products.
Trading revenue decreased $298 million or 33%, mainly due to lower fixed income trading in the U.S. and Europe as the prior period benefitted from stronger client activity.
Investment management and custodial fees increased $439 million or 13%, largely driven by higher average fee-based client assets reflecting net sales and market appreciation.
Mutual fund revenue increased $237 million or 12%, primarily due to higher average fee-based client assets reflecting net sales and market appreciation in Wealth Management, and higher average mutual fund balances driving higher distribution fees in Canadian Banking.
Other revenue decreased $537 million or 59%, primarily attributable to changes in the fair value of the hedges related to our U.S. share-based compensation plans, which was largely offset in Non-interest expense.
Provision for credit losses
(1)
| For the three months ended | For the six months ended | |||||||||||||||||||||||
| (Millions of Canadian dollars, except percentage amounts) | April 30 2022 | January 31 2022 | April 30 2021 | April 30 2022 | April 30 2021 | |||||||||||||||||||
Personal & Commercial Banking | $ | (419 | ) | $ | (63 | ) | $ | (164 | ) | $ | (482 | ) | $ | (223 | ) | |||||||||
Wealth Management | (30 | ) | (13 | ) | (5 | ) | (43 | ) | (6 | ) | ||||||||||||||
Capital Markets | (56 | ) | (4 | ) | (87 | ) | (60 | ) | (124 | ) | ||||||||||||||
Corporate Support and other (2) | 1 | – | (4 | ) | 1 | (4 | ) | |||||||||||||||||
PCL on performing loans | (504 | ) | (80 | ) | (260 | ) | (584 | ) | (357 | ) | ||||||||||||||
Personal & Commercial Banking | $ | 147 | $ | 191 | $ | 203 | $ | 338 | $ | 430 | ||||||||||||||
Wealth Management | – | 1 | 3 | 1 | (24 | ) | ||||||||||||||||||
Capital Markets | 27 | (12 | ) | (29 | ) | 15 | (11 | ) | ||||||||||||||||
PCL on impaired loans | 174 | 180 | 177 | 354 | 395 | |||||||||||||||||||
PCL – Loans | (330 | ) | 100 | (83 | ) | (230 | ) | 38 | ||||||||||||||||
PCL – Other financial assets (3) | (12 | ) | 5 | (13 | ) | (7 | ) | (24 | ) | |||||||||||||||
Total PCL | $ | (342 | ) | $ | 105 | $ | (96 | ) | $ | (237 | ) | $ | 14 | |||||||||||
| PCL on loans is comprised of: | ||||||||||||||||||||||||
Retail | $ | (188 | ) | $ | (58 | ) | $ | (104 | ) | $ | (246 | ) | $ | (167 | ) | |||||||||
Wholesale | (316 | ) | (22 | ) | (156 | ) | (338 | ) | (190 | ) | ||||||||||||||
PCL on performing loans | (504 | ) | (80 | ) | (260 | ) | (584 | ) | (357 | ) | ||||||||||||||
Retail | 146 | 138 | 166 | 284 | 346 | |||||||||||||||||||
Wholesale | 28 | 42 | 11 | 70 | 49 | |||||||||||||||||||
PCL on impaired loans | 174 | 180 | 177 | 354 | 395 | |||||||||||||||||||
PCL – Loans | $ | (330 | ) | $ | 100 | $ | (83 | ) | $ | (230 | ) | $ | 38 | |||||||||||
PCL on loans as a % of average net loans and acceptances | (0.18)% | 0.05% | (0.05)% | (0.06)% | 0.01% | |||||||||||||||||||
PCL on impaired loans as a % of average net loans and acceptances | 0.09% | 0.09% | 0.11% | 0.09% | 0.12% | |||||||||||||||||||
| (1) | Information on loans represents loans, acceptance and commitments. |
| (2) | Includes PCL recorded in Corporate Support, Insurance and Investor & Treasury Services. |
| (3) | PCL on other financial assets mainly represents provisions on debt securities measured at fair value through other comprehensive income (FVOCI) and amortized cost, accounts receivable and financial guarantees. |
Q2 2022 vs. Q2 2021
Total PCL of $(342) million decreased $246 million from a year ago. PCL on loans of $(330) million decreased $247 million, largely due to releases of provisions in Personal & Commercial Banking in the current quarter as compared to provisions taken in the prior year. This was partially offset by lower releases of provisions in Capital Markets. The PCL on loans ratio of (18) bps decreased 13 bps.
PCL on performing loans of $(504) million decreased $244 million, primarily due to higher releases of provisions in Personal & Commercial Banking, in our Canadian Banking and Caribbean Banking portfolios. Reduced uncertainty relating to the COVID-19 pandemic drove a higher release, partially tempered by increased downside risks including rising inflation and interest rates. This was partially offset by lower releases of provisions in Capital Markets.
PCL on impaired loans of $174 million decreased $3 million or 2%. Lower provisions in Personal & Commercial Banking, primarily in our Canadian Banking portfolios, were offset by provisions in the current year as compared to recoveries in the prior year in Capital Markets, mainly in the oil and gas sector.
Royal Bank of Canada
Q2 2022 vs. Q1 2022
Total PCL decreased $447 million from last quarter. PCL on loans was $(330) million, compared to $100 million last quarter, primarily due to releases of provisions in Personal & Commercial Banking in the current quarter as compared to provisions taken in the prior quarter. The PCL on loans ratio decreased 23 bps.
PCL on performing loans decreased $424 million, primarily reflecting higher releases of provisions in the current quarter in Personal & Commercial Banking, mainly in our Canadian Banking portfolios. Reduced uncertainty relating to the COVID-19 pandemic drove a higher release, partially tempered by increased downside risks including rising inflation and interest rates.
PCL on impaired loans decreased $6 million or 3%, mainly due to lower provisions in Personal & Commercial Banking, primarily in our Canadian Banking commercial portfolios. This was largely offset by provisions taken in the current quarter in Capital Markets, mainly in the consumer staples sector, as compared to recoveries in the prior quarter.
Q2 2022 vs. Q2 2021 (Six months ended)
Total PCL of $(237) million decreased $251 million from the same period last year. PCL on loans was $(230) million, compared to $38 million in the same period last year, largely due to releases of provisions in Personal & Commercial Banking in the current period as compared to provisions taken in the same period last year. This was partially offset by lower releases of provisions in Capital Markets. The PCL on loans ratio of (6) bps decreased 7 bps.
PCL on performing loans of $(584) million decreased $227 million or 64%, primarily due to higher releases of provisions in Personal & Commercial Banking, in our Canadian Banking and Caribbean Banking portfolios. Reduced uncertainty relating to the COVID-19 pandemic drove a higher release, partially tempered by increased downside risks including rising inflation and interest rates. This was partially offset by lower releases of provisions in Capital Markets as downside risks and portfolio growth tempered our releases in the current period as compared to the same period last year.
PCL on impaired loans of $354 million decreased $41 million or 10%, largely due to lower provisions in Personal & Commercial Banking, mainly in our Canadian Banking portfolios. This was partially offset by provisions taken in the current period as compared to recoveries in the same period last year in Capital Markets and Wealth Management.
Insurance policyholder benefits, claims and acquisition expense (PBCAE)
Q2 2022 vs. Q2 2021
PBCAE decreased $329 million from a year ago, primarily reflecting the change in fair value of investments backing policyholder liabilities, which is largely offset in revenue. Higher favourable investment-related experience also contributed to the decrease. These factors were partially offset by higher group annuity sales and business growth.
Q2 2022 vs. Q1 2022
PBCAE decreased $1,177 million from last quarter, primarily reflecting the change in fair value of investments backing policyholder liabilities and lower group annuity sales, both of which are largely offset in revenue. Investment-related experience and improved claims experience also contributed to the decrease. These factors were partially offset by the impact of changes in new business mix, including lower new longevity reinsurance contracts.
Q2 2022 vs. Q2 2021 (Six months ended)
PBCAE decreased $738 million or 47% from the same period last year, mainly reflecting the change in fair value of investments backing policyholder liabilities, which is largely offset in revenue. Higher favourable investment-related experience also contributed to the decrease. These factors were partially offset by higher group annuity sales, business growth, higher claims costs, as well as the impact of lower new longevity reinsurance contracts.
Non-interest
expense| For the three months ended | For the six months ended | |||||||||||||||||||||||
| (Millions of Canadian dollars, except percentage amounts) | April 30 2022 | January 31 2022 | April 30 2021 | April 30 2022 | April 30 2021 | |||||||||||||||||||
Salaries | $ | 1,748 | $ | 1,748 | $ | 1,641 | $ | 3,496 | $ | 3,296 | ||||||||||||||
Variable compensation | 1,754 | 1,941 | 1,874 | 3,695 | 3,678 | |||||||||||||||||||
Benefits and retention compensation | 483 | 549 | 503 | 1,032 | 1,046 | |||||||||||||||||||
Share-based compensation | 17 | 47 | 134 | 64 | 420 | |||||||||||||||||||
Human resources | 4,002 | 4,285 | 4,152 | 8,287 | 8,440 | |||||||||||||||||||
Equipment | 513 | 501 | 487 | 1,014 | 980 | |||||||||||||||||||
Occupancy | 386 | 386 | 400 | 772 | 804 | |||||||||||||||||||
Communications | 258 | 228 | 212 | 486 | 425 | |||||||||||||||||||
Professional fees | 347 | 319 | 314 | 666 | 605 | |||||||||||||||||||
Amortization of other intangibles | 336 | 337 | 318 | 673 | 637 | |||||||||||||||||||
Other | 592 | 524 | 496 | 1,116 | 1,030 | |||||||||||||||||||
Non-interest expense | $ | 6,434 | $ | 6,580 | $ | 6,379 | $ | 13,014 | $ | 12,921 | ||||||||||||||
Efficiency ratio (1) | 57.3% | 50.4% | 54.9% | 53.6% | 52.6% | |||||||||||||||||||
Efficiency ratio adjusted (2) | 52.1% | 48.8% | 52.3% | 50.3% | 52.1% | |||||||||||||||||||
| (1) | Efficiency ratio is calculated as Non-interest expense divided by Total revenue. |
| (2) | This is a non-GAAP ratio. This measure has been adjusted by excluding the change in fair value of investments backing policyholder liabilities from total revenue. For further details, refer to the Key performance andnon-GAAP measures section. |
10 Second Quarter 2022
Royal Bank of Canada
Q2 2022 vs. Q2 2021
Non-interest
expense increased $55 million or 1% from a year ago, mainly attributable to higher staff and technology related costs. Higher marketing and other discretionary spend also contributed to the increase. These factors were partially offset by the change in the fair value of our U.S. share-based compensation plans, which was largely offset in Other revenue.Our efficiency ratio of 57.3% increased 240 bps from 54.9% last year. Excluding the change in fair value of investments backing policyholder liabilities, our efficiency ratio of 52.1% decreased 20 bps from 52.3% last year.
Q2 2022 vs. Q1 2022
Non-interest
expense decreased $146 million or 2% from last quarter, primarily due to lower variable compensation on decreased revenue and the change in the fair value of our U.S. share-based compensation plans, which was largely offset in Other revenue. The impact of foreign exchange translation also contributed to the decrease. Partly offsetting these factors was the partial release in the prior quarter of a legal provision taken in U.S. Wealth Management (including City National).Our efficiency ratio of 57.3% increased 690 bps from 50.4% last quarter. Excluding the change in fair value of investments backing policyholder liabilities, our efficiency ratio of 52.1% increased 330 bps from 48.8% last quarter.
Q2 2022 vs. Q2 2021 (Six months ended)
Non-interest expense increased $93 million or 1% from the same period last year, mainly attributable to higher variable compensation commensurate with increased results, as well as higher staff and technology related costs. These factors were partially offset by the change in the fair value of our U.S. share-based compensation plans, which was largely offset in Other revenue.
Our efficiency ratio of 53.6% increased 100 bps from 52.6% last year. Excluding the change in fair value of investments backing policyholder liabilities, our efficiency ratio of 50.3% decreased 180 bps from 52.1% last year.
Efficiency ratio excluding the change in fair value of investments backing policyholder liabilities is a
non-GAAP
ratio. For further details, including a reconciliation, refer to the Key performance andnon-GAAP
measures section.Income taxes
| For the three months ended | For the six months ended | |||||||||||||||||||||||
| (Millions of Canadian dollars, except percentage amounts) | April 30 2022 | January 31 2022 | April 30 2021 | April 30 2022 | April 30 2021 | |||||||||||||||||||
Income taxes | $ | 1,055 | $ | 1,289 | $ | 1,171 | $ | 2,344 | $ | 2,209 | ||||||||||||||
Income before income taxes | 5,308 | 5,384 | 5,186 | 10,692 | 10,071 | |||||||||||||||||||
Effective income tax rate | 19.9% | 23.9% | 22.6% | 21.9% | 21.9% | |||||||||||||||||||
Q2 2022 vs. Q2 2021
Income tax expense decreased $116 million or 10% from a year ago, primarily due to net favourable tax adjustments in the current quarter.
The effective income tax rate of 19.9% decreased 270 bps, primarily due to the impact of the tax adjustments noted above.
Q2 2022 vs. Q1 2022
Income tax expense decreased $234 million or 18% from last quarter, primarily due to the net impact of tax adjustments.
The effective income tax rate of 19.9% decreased 400 bps, primarily due to the impact of the tax adjustments noted above.
Q2 2022 vs. Q2 2021 (Six months ended)
Income tax expense increased $135 million or 6% from the same period last year, primarily due to higher income before income taxes, partially offset by the net impact of tax adjustments.
The effective income tax rate of 21.9% was unchanged from the same period last year.
Royal Bank of Canada
Business segment results |
How we measure and report our business segments |
The key methodologies and assumptions used in our management reporting framework are periodically reviewed by management to ensure they remain valid. They remain unchanged from October 31, 2021. For further details on our key methodologies and assumptions used in our management reporting framework, refer to the How we measure and report our business segments section of our 2021 Annual Report.
Key performance and non-GAAP measures |
Performance measures
We measure and evaluate the performance of our consolidated operations and each business segment using a number of financial metrics, such as net income and ROE. Certain financial metrics, including ROE, do not have a standardized meaning under generally accepted accounting principles (GAAP) and may not be comparable to similar measures disclosed by other financial institutions.
Return on common equity
We use ROE, at both the consolidated and business segment levels, as a measure of return on total capital invested in our business. Management views the business segment ROE measure as a useful measure for supporting investment and resource allocation decisions because it adjusts for certain items that may affect comparability between business segments and certain competitors.
Our consolidated ROE calculation is based on net income available to common shareholders divided by total average common equity for the period. Business segment ROE calculations are based on net income available to common shareholders divided by average attributed capital for the period. For each segment, average attributed capital includes the capital required to underpin various risks as described in the Capital management section and amounts invested in goodwill and intangibles.
The attribution of capital involves the use of assumptions, judgments and methodologies that are regularly reviewed and revised by management as deemed necessary. Changes to such assumptions, judgments and methodologies can have a material effect on the business segment ROE information that we report. Other companies that disclose information on similar attributions and related return measures may use different assumptions, judgments and methodologies.
The following table provides a summary of our ROE calculations:
| For the three months ended | ||||||||||||||||||||||||||||||||||||||||
April 30 2022 | January 31 2022 | April 30 2021 | ||||||||||||||||||||||||||||||||||||||
(Millions of Canadian dollars, except percentage amounts) | Personal & Commercial Banking | Wealth Management | Insurance | Investor & Treasury Services | Capital Markets | Corporate Support | Total | Total | Total | |||||||||||||||||||||||||||||||
Net income available to common shareholders | $ | 2,211 | $ | 737 | $ | 204 | $ | 119 | $ | 778 | $ | 133 | $ | 4,182 | $ | 4,039 | $ | 3,938 | ||||||||||||||||||||||
Total average common equity (1), (2) | 26,400 | 18,100 | 2,400 | 3,000 | 25,000 | 18,400 | 93,300 | 92,450 | 83,450 | |||||||||||||||||||||||||||||||
ROE (3) | 34.4% | 16.7% | 34.6% | 16.1% | 12.8% | n.m. | 18.4% | 17.3% | 19.4% | |||||||||||||||||||||||||||||||
| For the six months ended | ||||||||||||||||||||||||||||||||||||||||
April 30 2022 | April 30 2021 | |||||||||||||||||||||||||||||||||||||||
(Millions of Canadian dollars, except percentage amounts) | Personal & Commercial Banking | Wealth Management | Insurance | Investor & Treasury Services | Capital Markets | Corporate Support | Total | Total | ||||||||||||||||||||||||||||||||
Net income available to common shareholders | $ | 4,168 | $ | 1,522 | $ | 400 | $ | 235 | $ | 1,793 | $ | 103 | $ | 8,221 | $ | 7,725 | ||||||||||||||||||||||||
Total average common equity (1), (2) | 26,250 | 17,850 | 2,400 | 3,000 | 24,750 | 18,600 | 92,850 | 82,050 | ||||||||||||||||||||||||||||||||
ROE (3) | 32.0% | 17.2% | 33.5% | 15.9% | 14.6% | n.m. | 17.9% | 19.0% | ||||||||||||||||||||||||||||||||
| (1) | Total average common equity represents rounded figures. |
| (2) | The amounts for the segments are referred to as attributed capital. |
| (3) | ROE is based on actual balances of average common equity before rounding. |
| n.m. | not meaningful |
12 Second Quarter 2022
Royal Bank of Canada
Non-GAAP
measuresWe believe that certain
non-GAAP
measures described below are more reflective of our ongoing operating results and provide readers with a better understanding of management’s perspective on our performance. These measures enhance the comparability of our financial performance for the three and six months ended April 30, 2022 with the corresponding periods in the prior year and the three months ended January 31, 2022.Non-GAAP
measures (includingnon-GAAP
ratios) do not have a standardized meaning under GAAP and may not be comparable to similar measures disclosed by other financial institutions.The following discussion describes the
non-GAAP
measures we use in evaluating our operating results.Adjusted efficiency ratio
Our efficiency ratio is impacted by the change in fair value of investments backing policyholder liabilities, which is reported in revenue and largely offset in PBCAE. The adjusted efficiency ratio is a
non-GAAP
ratio and is calculated using adjusted total revenue, which is anon-GAAP
measure as it excludes the impact from the change in fair value of investments backing policyholder liabilities. We believe the adjusted efficiency ratio is a useful measure as changes in the fair value of investments backing policyholder liabilities can lead to volatility in total revenue that could obscure trends in underlying business performance and reduce comparability with prior periods.The following table provides calculations of our consolidated efficiency ratio excluding the change in fair value of investments backing policyholder liabilities:
| For the three months ended | ||||||||||||||||||||||||||||||||||||||||
April 30 2022 | January 31 2022 | April 30 2021 | ||||||||||||||||||||||||||||||||||||||
Item excluded | Item excluded | Item excluded | ||||||||||||||||||||||||||||||||||||||
| (Millions of Canadian dollars, except percentage amounts) | As reported | Change in fair value of investments backing policyholder liabilities | Adjusted | As reported | Change in fair value of investments backing policyholder liabilities | Adjusted | As reported | Change in fair value of investments backing policyholder liabilities | Adjusted | |||||||||||||||||||||||||||||||
Total revenue | $ | 11,220 | $ | 1,133 | $ | 12,353 | $ | 13,066 | $ | 430 | $ | 13,496 | $ | 11,618 | $ | 568 | $ | 12,186 | ||||||||||||||||||||||
Non-interest expense | 6,434 | – | 6,434 | 6,580 | – | 6,580 | 6,379 | – | 6,379 | |||||||||||||||||||||||||||||||
Efficiency ratio | 57.3% | 52.1% | 50.4% | 48.8% | 54.9% | 52.3% | ||||||||||||||||||||||||||||||||||
| For the six months ended | ||||||||||||||||||||||||||||||||||||||||
April 30 2022 | April 30 2021 | |||||||||||||||||||||||||||||||||||||||
Item excluded | Item excluded | |||||||||||||||||||||||||||||||||||||||
| (Millions of Canadian dollars, except percentage amounts) | As reported | Change in fair value of investments backing policyholder liabilities | Adjusted | As reported | Change in fair value of investments backing policyholder liabilities | Adjusted | ||||||||||||||||||||||||||||||||||
Total revenue | $ | 24,286 | $ | 1,563 | $ | 25,849 | $ | 24,561 | $ | 222 | $ | 24,783 | ||||||||||||||||||||||||||||
Non-interest expense | 13,014 | – | 13,014 | 12,921 | – | 12,921 | ||||||||||||||||||||||||||||||||||
Efficiency ratio | 53.6% | 50.3% | 52.6% | 52.1% | ||||||||||||||||||||||||||||||||||||
Royal Bank of Canada
Personal & Commercial Banking |
| As at or for the three months ended | As at or for the six months ended | |||||||||||||||||||||
(Millions of Canadian dollars, except percentage amounts and as otherwise noted) | April 30 2022 | January 31 2022 | April 30 2021 | April 30 2022 | April 30 2021 | |||||||||||||||||
Net interest income | $ | 3,234 | $ | 3,229 | $ | 3,085 | $ | 6,463 | $ | 6,246 | ||||||||||||
Non-interest income | 1,505 | 1,574 | 1,442 | 3,079 | 2,844 | |||||||||||||||||
Total revenue | 4,739 | 4,803 | 4,527 | 9,542 | 9,090 | |||||||||||||||||
PCL on performing assets | (420 | ) | (60 | ) | (166 | ) | (480 | ) | (226 | ) | ||||||||||||
PCL on impaired assets | 144 | 189 | 201 | 333 | 426 | |||||||||||||||||
PCL | (276 | ) | 129 | 35 | (147 | ) | 200 | |||||||||||||||
Non-interest expense | 2,015 | 2,022 | 1,915 | 4,037 | 3,893 | |||||||||||||||||
Income before income taxes | 3,000 | 2,652 | 2,577 | 5,652 | 4,997 | |||||||||||||||||
Net income | $ | 2,234 | $ | 1,974 | $ | 1,908 | $ | 4,208 | $ | 3,701 | ||||||||||||
Revenue by business | ||||||||||||||||||||||
Canadian Banking | $ | 4,531 | $ | 4,598 | $ | 4,341 | $ | 9,129 | $ | 8,693 | ||||||||||||
Caribbean & U.S. Banking | 208 | 205 | 186 | 413 | 397 | |||||||||||||||||
Selected balance sheet and other information | ||||||||||||||||||||||
ROE | 34.4% | 29.8% | 31.8% | 32.0% | 31.0% | |||||||||||||||||
NIM | 2.46% | 2.41% | 2.56% | 2.43% | 2.56% | |||||||||||||||||
Efficiency ratio | 42.5% | 42.1% | 42.3% | 42.3% | 42.8% | |||||||||||||||||
Operating leverage (1) | (0.5)% | 3.1% | 4.5% | 1.3% | 1.9% | |||||||||||||||||
Average total earning assets, net | $ | 540,100 | $ | 530,800 | $ | 493,400 | $ | 535,400 | $ | 491,600 | ||||||||||||
Average loans and acceptances, net | 544,000 | 534,400 | 497,400 | 539,200 | 495,400 | |||||||||||||||||
Average deposits | 543,400 | 539,300 | 495,000 | 541,300 | 492,500 | |||||||||||||||||
AUA (2) | 355,800 | 371,100 | 339,000 | 355,800 | 339,000 | |||||||||||||||||
Average AUA | 368,400 | 372,600 | 334,400 | 370,600 | 325,000 | |||||||||||||||||
PCL on impaired loans as a % of average net loans and acceptances | 0.11% | 0.14% | 0.17% | 0.13% | 0.18% | |||||||||||||||||
Other selected information – Canadian Banking | ||||||||||||||||||||||
Net income | $ | 2,140 | $ | 1,914 | $ | 1,872 | $ | 4,054 | $ | 3,626 | ||||||||||||
NIM | 2.45% | 2.41% | 2.55% | 2.43% | 2.55% | |||||||||||||||||
Efficiency ratio | 41.2% | 40.8% | 40.8% | 41.0% | 41.3% | |||||||||||||||||
Operating leverage | (1.2)% | 2.8% | 4.7% | 0.8% | 1.5% | |||||||||||||||||
| (1) | See Glossary for composition of this measure. |
| (2) | AUA represents period-end spot balances and includes securitized residential mortgages and credit card loans as at April 30, 2022 of $14 billion and $4 billion, respectively (January 31, 2022 – $15 billion and $3 billion; April 30, 2021 – $15 billion and $3 billion). |
Financial performance
Q2 2022 vs. Q2 2021
Net income increased $326 million or 17% from a year ago, primarily attributable to lower PCL and higher net interest income reflecting average volume growth of 9% in Canadian Banking that more than offset the impact of lower spreads.
Total revenue increased $212 million or 5%.
Canadian Banking revenue increased $190 million or 4%, primarily due to higher net interest income reflecting average volume growth of 10% in deposits and 9% in loans that more than offset the impact of lower spreads. Higher average mutual fund balances driving higher distribution fees also contributed to the increase. These factors were partially offset by lower securities brokerage commissions as the prior year benefitted from increased client activity.
Caribbean & U.S. Banking revenue increased $22 million or 12% mainly due to higher net interest income reflecting average volume growth as well as gains related to a sale and leaseback transaction in the current quarter. Higher card service and foreign exchange revenue also contributed to the increase.
NIM was down 10 bps, mainly due to competitive pricing pressures and lower prepayment revenue in our mortgage portfolios, partially offset by the impact of the rising interest rate environment.
PCL decreased $311 million, primarily reflecting higher releases of provisions on performing loans in our Canadian Banking and Caribbean Banking portfolios. Reduced uncertainty relating to the COVID-19 pandemic drove a higher release compared to last year, partially tempered by increased downside risks including rising inflation and interest rates. Lower provisions on impaired loans, largely in our Canadian Banking portfolios, also contributed to the decrease, resulting in a decrease of 6 bps in the PCL on impaired loans ratio.
Non-interest
expense increased $100 million or 5%, mainly attributable to higher technology-related costs, including digital initiatives, as well as higher staff-related and marketing costs.14 Second Quarter 2022
Royal Bank of Canada
Q2 2022 vs. Q1 2022
Net income increased $260 million or 13% from last quarter, primarily attributable to lower PCL, largely driven by higher releases of provisions on performing loans in the current quarter reflecting reduced uncertainty relating to the COVID-19 pandemic, partially tempered by increased downside risks. Lower staff-related costs also contributed to the increase. Net interest income remained relatively flat as higher spreads and average volume growth of 1% more than offset the impact of three less days in the current quarter. These factors were partially offset by the impact of realized gains from commercial mortgage securitization activities in the prior quarter and lower average mutual fund balances driving lower distribution fees.
NIM was up 5 bps, mainly due to the impact of interest rate increases in the current quarter.
Q2 2022 vs. Q2 2021 (Six months ended)
Net income increased $507 million or 14% from the same period last year, primarily attributable to lower PCL, higher non-interest income and higher net interest income reflecting average volume growth of 9% in Canadian Banking that more than offset the impact of lower spreads. These factors were partially offset by higher staff and technology-related costs, including digital initiatives.
Total revenue increased $452 million or 5%, largely due to higher net interest income reflecting average volume growth in Canadian Banking of 10% in deposits and 9% in loans that more than offset the impact of lower spreads. Higher average mutual fund balances driving higher distribution fees, higher service charges and foreign exchange revenue reflecting increased client activity, as well as realized gains from commercial mortgage securitization activities also contributed to the increase. These factors were partially offset by lower securities brokerage commissions as the prior year benefitted from increased client activity.
PCL decreased $347 million, largely reflecting higher releases of provisions on performing loans in our Canadian Banking and Caribbean Banking portfolios. Reduced uncertainty relating to the COVID-19 pandemic drove a higher release compared to the same period last year, partially tempered by increased downside risks including rising inflation and interest rates. Lower provisions on impaired loans, largely in our Canadian Banking portfolios, also contributed to the decrease, resulting in a decrease of 5 bps in the PCL on impaired loans ratio.
Non-interest
expense increased $144 million or 4%, mainly attributable to higher staff and technology-related costs, including digital initiatives, as well as increased marketing costs.Royal Bank of Canada
Wealth Management |
| As at or for the three months ended | As at or for the six months ended | |||||||||||||||||||||
(Millions of Canadian dollars, except number of, percentage amounts and as otherwise noted) | April 30 2022 | January 31 2022 | April 30 2021 | April 30 2022 | April 30 2021 | |||||||||||||||||
Net interest income | $ | 780 | $ | 745 | $ | 666 | $ | 1,525 | $ | 1,332 | ||||||||||||
Non-interest income(1) | 2,825 | 2,868 | 2,594 | 5,693 | 5,147 | |||||||||||||||||
Total revenue (1) | 3,605 | 3,613 | 3,260 | 7,218 | 6,479 | |||||||||||||||||
PCL on performing assets | (30 | ) | (13 | ) | (5 | ) | (43 | ) | (7 | ) | ||||||||||||
PCL on impaired assets | – | 1 | 3 | 1 | (24 | ) | ||||||||||||||||
PCL | (30 | ) | (12 | ) | (2 | ) | (42 | ) | (31 | ) | ||||||||||||
Non-interest expense(1) | 2,644 | 2,581 | 2,371 | 5,225 | 4,777 | |||||||||||||||||
Income before income taxes (1) | 991 | 1,044 | 891 | 2,035 | 1,733 | |||||||||||||||||
Net income (1) | $ | 750 | $ | 795 | $ | 683 | $ | 1,545 | $ | 1,324 | ||||||||||||
Revenue by business | ||||||||||||||||||||||
Canadian Wealth Management | $ | 1,071 | $ | 1,072 | $ | 964 | $ | 2,143 | $ | 1,864 | ||||||||||||
U.S. Wealth Management (including City National) (1) | 1,775 | 1,727 | 1,566 | 3,502 | 3,100 | |||||||||||||||||
U.S. Wealth Management (including City National) (US$ millions) (1) | 1,399 | 1,359 | 1,250 | 2,758 | 2,446 | |||||||||||||||||
Global Asset Management | 678 | 736 | 628 | 1,414 | 1,323 | |||||||||||||||||
International Wealth Management | 81 | 78 | 102 | 159 | 192 | |||||||||||||||||
Selected balance sheet and other information | ||||||||||||||||||||||
ROE | 16.7% | 17.7% | 17.0% | 17.2% | 16.2% | |||||||||||||||||
NIM | 2.32% | 2.11% | 2.38% | 2.21% | 2.36% | |||||||||||||||||
Pre-tax margin(1), (2) | 27.5% | 28.9% | 27.3% | 28.2% | 26.7% | |||||||||||||||||
Number of advisors (3) | 5,623 | 5,564 | 5,459 | 5,623 | 5,459 | |||||||||||||||||
Average total earning assets, net | $ | 137,900 | $ | 139,900 | $ | 114,800 | $ | 138,900 | $ | 113,800 | ||||||||||||
Average loans and acceptances, net | 95,700 | 92,900 | 83,100 | 94,300 | 82,500 | |||||||||||||||||
Average deposits | 158,800 | 161,500 | 139,700 | 160,200 | 138,800 | |||||||||||||||||
AUA (4) | 1,301,900 | 1,341,100 | 1,227,000 | 1,301,900 | 1,227,000 | |||||||||||||||||
U.S. Wealth Management (including City National) (4) | 681,600 | 712,700 | 651,300 | 681,600 | 651,300 | |||||||||||||||||
U.S. Wealth Management (including City National) (US$ millions) (4) | 530,400 | 560,800 | 529,800 | 530,400 | 529,800 | |||||||||||||||||
AUM (4) | 949,800 | 1,013,100 | 922,300 | 949,800 | 922,300 | |||||||||||||||||
Average AUA | 1,326,100 | 1,351,300 | 1,218,200 | 1,338,900 | 1,194,400 | |||||||||||||||||
Average AUM | 980,300 | 1,021,200 | 910,400 | 1,001,100 | 896,800 | |||||||||||||||||
PCL on impaired loans as a % of average net loans and acceptances | 0.00% | 0.00% | 0.02% | 0.00% | (0.06)% | |||||||||||||||||
Estimated impact of U.S. dollar, British pound and Euro translation on key income statement items (Millions of Canadian dollars, except percentage amounts) | For the three months ended | For the six months ended | ||||||||||||||||||
Q2 2022 vs. Q2 2021 | Q2 2022 vs. Q1 2022 | Q2 2022 vs. Q2 2021 | ||||||||||||||||||
Increase (decrease): | ||||||||||||||||||||
Total revenue | $ | 12 | $ | (12 | ) | $ | (12 | ) | ||||||||||||
PCL | (1 | ) | – | (1 | ) | |||||||||||||||
Non-interest expense | 8 | (10 | ) | (11 | ) | |||||||||||||||
Net income | 3 | (2 | ) | (1 | ) | |||||||||||||||
Percentage change in average U.S. dollar equivalent of C$1.00 | (1)% | –% | –% | |||||||||||||||||
Percentage change in average British pound equivalent of C$1.00 | 5% | 3% | 3% | |||||||||||||||||
Percentage change in average Euro equivalent of C$1.00 | 8% | 4% | 8% | |||||||||||||||||
| (1) | Effective Q4 2021, gains (losses) on economic hedges of our U.S. share-based compensation plans, which are reflected in revenue, and related variability in share-based compensation expense driven by changes in the fair value of liabilities relating to our U.S. share-based compensation plans have been reclassified from our Wealth Management segment to Corporate Support. Comparative amounts have been reclassified to conform with this presentation. |
| (2) | Pre-tax margin is defined as Income before income taxes divided by Total revenue. |
| (3) | Represents client-facing advisors across all of our Wealth Management businesses. |
| (4) | Represents period-end spot balances. |
Financial performance
Q2 2022 vs. Q2 2021
Net income increased $67 million or 10% from a year ago, primarily due to higher average fee-based client assets. Higher net interest income driven by average volume growth also contributed to the increase. These factors were partially offset by higher variable compensation, higher staff-related costs, as well as lower transactional revenue.
Total revenue increased $345 million or 11%.
Canadian Wealth Management revenue increased $107 million or 11%, primarily due to higher average fee-based client assets reflecting net sales and market appreciation.
U.S. Wealth Management (including City National) revenue increased $209 million or 13%. In U.S. dollars, revenue increased $149 million or 12%, mainly due to higher average fee-based client assets reflecting net sales and market appreciation and gains on the sale of certain non-core affiliates. Higher net interest income also contributed to the increase, reflecting average volume growth of 12% in loans and 13% in deposits that more than offset the impact of lower spreads. These factors were partially offset by lower transactional revenue, mainly driven by client activity.
16 Second Quarter 2022
Royal Bank of Canada
Global Asset Management revenue increased $50 million or 8%, primarily due to higher average fee-based client assets reflecting net sales and market appreciation.
International Wealth Management revenue decreased $21 million.
PCL decreased $28 million in U.S. Wealth Management (including City National), primarily reflecting higher releases of provisions on performing loans. Reduced uncertainty relating to the COVID-19 pandemic drove a higher release compared to last year, partially tempered by increased downside risks.
Non-interest
expense increased $273 million or 12%, mainly due to higher variable compensation commensurate with increased results. Higher staff and technology related costs also contributed to the increase.Q2 2022 vs. Q1 2022
Net income decreased $45 million or 6% from last quarter, mainly reflecting the impact of a partial release of a legal provision in U.S. Wealth Management (including City National) in the prior quarter. Lower average
fee-based
client assets largely reflecting unfavourable market conditions, as well as a decline in transactional revenue also contributed to the decrease. These factors were partially offset by gains on the sale of certain non-core affiliates, as well as higher net interest income reflecting the rising interest rate environment.Q2 2022 vs. Q2 2021 (Six months ended)
Net income increased $221 million or 17% from the same period last year, primarily due to higher average fee-based client assets and higher net interest income driven by average volume growth that more than offset lower spreads. These factors were partially offset by higher variable compensation and higher staff-related costs.
Total revenue increased $739 million or 11%, primarily due to higher average fee-based client assets reflecting net sales and market appreciation, as well as higher net interest income driven by average volume growth of 14% in loans and 15% in deposits that more than offset the impact of lower spreads. These factors were partially offset by lower transactional revenue, mainly driven by client activity.
PCL decreased $11 million or 35%, mainly reflecting higher releases of provisions on performing loans. Reduced uncertainty relating to the COVID-19 pandemic drove a higher release compared to the same period last year, partially tempered by increased downside risks. This was partially offset by higher provisions and lower recoveries on impaired loans in the current period as compared to the same period last year, resulting in an increase of 6 bps in the PCL on impaired loans ratio.
Non-interest expense increased $448 million or 9%, primarily due to higher variable compensation commensurate with increased results. Higher staff and technology related costs also contributed to the increase. Partly offsetting these factors was the partial release of a legal provision taken in U.S. Wealth Management (including City National) in the prior year.
Insurance |
| As at or for the three months ended | As at or for the six months ended | |||||||||||||||||||||
(Millions of Canadian dollars, except percentage amounts and as otherwise noted) | April 30 2022 | January 31 2022 | April 30 2021 | April 30 2022 | April 30 2021 | |||||||||||||||||
Non-interest income | ||||||||||||||||||||||
Net earned premiums | $ | 1,210 | $ | 1,599 | $ | 929 | $ | 2,809 | $ | 2,177 | ||||||||||||
Investment income, gains/(losses) on assets supporting insurance policyholder liabilities (1) | (1,022 | ) | (252 | ) | (432 | ) | (1,274 | ) | 92 | |||||||||||||
Fee income | 46 | 52 | 39 | 98 | 76 | |||||||||||||||||
Total revenue | 234 | 1,399 | 536 | 1,633 | 2,345 | |||||||||||||||||
Insurance policyholder benefits and claims (1) | (261 | ) | 914 | 59 | 653 | 1,390 | ||||||||||||||||
Insurance policyholder acquisition expense | 81 | 83 | 90 | 164 | 165 | |||||||||||||||||
Non-interest expense | 145 | 147 | 140 | 292 | 289 | |||||||||||||||||
Income before income taxes | 269 | 255 | 247 | 524 | 501 | |||||||||||||||||
Net income | $ | 206 | $ | 197 | $ | 187 | $ | 403 | $ | 388 | ||||||||||||
Revenue by business | ||||||||||||||||||||||
Canadian Insurance | $ | (507 | ) | $ | 693 | $ | (172 | ) | $ | 186 | $ | 985 | ||||||||||
International Insurance | 741 | 706 | 708 | 1,447 | 1,360 | |||||||||||||||||
Selected balances and other information | ||||||||||||||||||||||
ROE | 34.6% | 32.4% | 32.1% | 33.5% | 33.3% | |||||||||||||||||
Premiums and deposits (2) | $ | 1,458 | $ | 1,814 | $ | 1,161 | $ | 3,272 | $ | 2,605 | ||||||||||||
Fair value changes on investments backing policyholder liabilities (1) | (1,133 | ) | (430 | ) | (568 | ) | (1,563 | ) | (222 | ) | ||||||||||||
| (1) | Includes unrealized gains and losses on investments backing policyholder liabilities attributable to fluctuation of assets designated as FVTPL. The investments which support actuarial liabilities are predominantly fixed income assets designated as FVTPL. Consequently, changes in the fair values of these assets are recorded in Insurance premiums, investment and fee income in the Consolidated Statements of Income and are largely offset by changes in the fair value of the actuarial liabilities, the impact of which is reflected in PBCAE. |
| (2) | Premiums and deposits include premiums on risk-based insurance and annuity products, and individual and group segregated fund deposits, consistent with insurance industry practices. |
Royal Bank of Canada
Financial performance
Q2 2022 vs. Q2 2021
Net income increased $19 million or 10% from a year ago, primarily due to higher favourable investment-related experience.
Total revenue decreased $302 million or 56%.
Canadian Insurance revenue decreased $335 million, mainly due to the change in fair value of investments backing policyholder liabilities, which is largely offset in PBCAE as indicated below. This was partially offset by higher group annuity sales and business growth across most products.
International Insurance revenue increased $33 million or 5%, primarily due to business growth in longevity reinsurance.
PBCAE decreased $329 million, primarily reflecting the change in fair value of investments backing policyholder liabilities, which is largely offset in revenue. Higher favourable investment-related experience also contributed to the decrease. These factors were partially offset by higher group annuity sales and business growth.
Non-interest
expense increased $5 million or 4%.Q2 2022 vs. Q1 2022
Net income increased $9 million or 5% from last quarter, primarily due to improved claims experience. This was partially offset by the impact of changes in new business mix, including lower new longevity reinsurance contracts.
Q2 2022 vs. Q2 2021 (Six months ended)
Net income increased $15 million or 4% from the same period last year, largely due to higher favourable investment-related experience, and business growth. These factors were partially offset by the impact of lower new longevity reinsurance contracts, as well as higher claims costs.
Total revenue decreased $712 million or 30%, mainly due to the change in fair value of investments backing policyholder liabilities, which is largely offset in PBCAE as indicated below. This was partially offset by higher group annuity sales and business growth across most products.
PBCAE decreased $738 million or 47%, mainly reflecting the change in fair value of investments backing policyholder liabilities, which is largely offset in revenue. Higher favourable investment-related experience also contributed to the decrease. These factors were partially offset by higher group annuity sales, business growth, higher claims costs, as well as the impact of lower new longevity reinsurance contracts.
Non-interest
expense increased $3 million or 1%.Investor & Treasury Services |
| As at or for the three months ended | As at or for the six months ended | |||||||||||||||||||||
(Millions of Canadian dollars, except percentage amounts and as otherwise noted) | April 30 2022 | January 31 2022 | April 30 2021 | April 30 2022 | April 30 2021 | |||||||||||||||||
Net interest income | $ | 148 | $ | 163 | $ | 87 | $ | 311 | $ | 178 | ||||||||||||
Non-interest income | 403 | 424 | 447 | 827 | 921 | |||||||||||||||||
Total revenue | 551 | 587 | 534 | 1,138 | 1,099 | |||||||||||||||||
PCL on performing assets | – | – | (2 | ) | – | (4 | ) | |||||||||||||||
PCL on impaired assets | – | – | – | – | – | |||||||||||||||||
PCL | – | – | (2 | ) | – | (4 | ) | |||||||||||||||
Non-interest expense | 398 | 420 | 375 | 818 | 776 | |||||||||||||||||
Income before income taxes | 153 | 167 | 161 | 320 | 327 | |||||||||||||||||
Net income | $ | 121 | $ | 118 | $ | 120 | $ | 239 | $ | 243 | ||||||||||||
Selected balance sheet and other information | ||||||||||||||||||||||
ROE | 16.1% | 15.7% | 14.3% | 15.9% | 14.8% | |||||||||||||||||
Average deposits | $ | 239,100 | $ | 244,000 | $ | 220,400 | $ | 241,600 | $ | 212,200 | ||||||||||||
Average client deposits | 61,400 | 66,300 | 64,000 | 63,900 | 63,600 | |||||||||||||||||
Average wholesale funding deposits | 177,700 | 177,700 | 156,400 | 177,700 | 148,600 | |||||||||||||||||
AUA (1) | 4,443,800 | 4,716,500 | 4,530,100 | 4,443,800 | 4,530,100 | |||||||||||||||||
Average AUA | 4,515,400 | 4,659,100 | 4,579,400 | 4,588,400 | 4,604,500 | |||||||||||||||||
Estimated impact of U.S. dollar, British pound and Euro translation on key income statement items (Millions of Canadian dollars, except percentage amounts) | For the three months ended | For the six months ended | ||||||||||||||||||
Q2 2022 vs. Q2 2021 | Q2 2022 vs. Q1 2022 | Q2 2022 vs. Q2 2021 | ||||||||||||||||||
Increase (decrease): | ||||||||||||||||||||
Total revenue | $ | (16 | ) | $ | (9 | ) | $ | (32 | ) | |||||||||||
PCL | – | – | – | |||||||||||||||||
Non-interest expense | (15 | ) | (8 | ) | (31 | ) | ||||||||||||||
Net income | (1 | ) | (1 | ) | (1 | ) | ||||||||||||||
Percentage change in average U.S. dollar equivalent of C$1.00 | (1)% | –% | –% | |||||||||||||||||
Percentage change in average British pound equivalent of C$1.00 | 5% | 3% | 3% | |||||||||||||||||
Percentage change in average Euro equivalent of C$1.00 | 8% | 4% | 8% | |||||||||||||||||
| (1) | Represents period-end spot balances |
18 Second Quarter 2022
Royal Bank of Canada
Financial performance
Q2 2022 vs. Q2 2021
Net income remained relatively flat as higher client deposit revenue was offset by higher technology-related costs, a favourable sales tax adjustment in the prior year and higher legal costs.
Total revenue increased $17 million or 3%, mainly due to higher client deposit revenue largely reflecting improved client deposit margins, partially offset by the impact of foreign exchange translation.
Non-interest
expense increased $23 million or 6%, largely driven by higher technology-related costs. A favourable sales tax adjustment in the prior year and higher legal costs also contributed to the increase. These factors were partially offset by the impact of foreign exchange translation.Q2 2022 vs. Q1 2022
Net income increased $3 million or 3% from last quarter, mainly driven by higher client deposit revenue reflecting improved client deposit margins. The impact of annual regulatory costs in the prior quarter and lower taxes also contributed to the increase. These factors were largely offset by lower funding and liquidity revenue reflecting a benefit from money market opportunities in the prior quarter.
Q2 2022 vs. Q2 2021 (Six months ended)
Net income decreased $4 million or 2% from the same period last year as higher revenue from client deposits, funding and liquidity and our asset services business was more than offset by higher non-interest expenses mainly driven by higher technology-related costs.
Total revenue increased $39 million or 4%, primarily due to higher client deposit revenue mainly reflecting improved client deposit margins. Higher funding and liquidity revenue reflecting a heightened impact from elevated enterprise liquidity in the prior period and increased market opportunities, partially offset by lower gains from the disposition of investment securities, and higher revenue from increased client activity in our asset services business, also contributed to the increase. These factors were partially offset by the impact of foreign exchange translation.
Non-interest
expense increased $42 million or 5%, largely attributable to higher technology-related costs. A favourable sales tax adjustment in the prior period, higher legal costs, and changes in the fair value of our share-based compensation plans also contributed to the increase. These factors were partially offset by the impact of foreign exchange translation.Capital Markets |
| As at or for the three months ended | As at or for the six months ended | |||||||||||||||||||||
(Millions of Canadian dollars, except percentage amounts and as otherwise noted) | April 30 2022 | January 31 2022 | April 30 2021 | April 30 2022 | April 30 2021 | |||||||||||||||||
Net interest income (1) | $ | 1,181 | $ | 1,241 | $ | 1,121 | $ | 2,422 | $ | 2,320 | ||||||||||||
Non-interest income(1) | 1,167 | 1,569 | 1,597 | 2,736 | 3,106 | |||||||||||||||||
Total revenue (1) | 2,348 | 2,810 | 2,718 | 5,158 | 5,426 | |||||||||||||||||
PCL on performing assets | (66 | ) | (6 | ) | (98 | ) | (72 | ) | (139 | ) | ||||||||||||
PCL on impaired assets | 29 | (6 | ) | (29 | ) | 23 | (11 | ) | ||||||||||||||
PCL | (37 | ) | (12 | ) | (127 | ) | (49 | ) | (150 | ) | ||||||||||||
Non-interest expense | 1,350 | 1,472 | 1,468 | 2,822 | 2,909 | |||||||||||||||||
Income before income taxes | 1,035 | 1,350 | 1,377 | 2,385 | 2,667 | |||||||||||||||||
Net income | $ | 795 | $ | 1,030 | $ | 1,071 | $ | 1,825 | $ | 2,138 | ||||||||||||
Revenue by business | ||||||||||||||||||||||
Corporate and Investment Banking | $ | 1,123 | $ | 1,393 | $ | 1,197 | $ | 2,516 | $ | 2,309 | ||||||||||||
Global Markets | 1,350 | 1,498 | 1,562 | 2,848 | 3,188 | |||||||||||||||||
Other | (125 | ) | (81 | ) | (41 | ) | (206 | ) | (71 | ) | ||||||||||||
Selected balance sheet and other information | ||||||||||||||||||||||
ROE | 12.8% | 16.4% | 18.9% | 14.6% | 18.7% | |||||||||||||||||
Average total assets | $ | 794,600 | $ | 806,600 | $ | 694,600 | $ | 800,700 | $ | 719,200 | ||||||||||||
Average trading securities | 137,300 | 139,600 | 120,900 | 138,500 | 123,100 | |||||||||||||||||
Average loans and acceptances, net | 118,800 | 111,100 | 97,300 | 114,900 | 97,800 | |||||||||||||||||
Average deposits | 83,200 | 75,900 | 72,600 | 79,500 | 73,100 | |||||||||||||||||
PCL on impaired loans as a % of average net loans and acceptances | 0.09% | (0.04)% | (0.13)% | 0.03% | (0.02)% | |||||||||||||||||
| (1) | The taxable equivalent basis (teb) adjustment for the three months ended April 30, 2022 was $145 million (January 31, 2022 – $142 million; April 30, 2021 – $135 million) and for the six months ended April 30, 2022 was $287 million (April 30, 2021 – $263 million). For further discussion, refer to the How we measure and report our business segments section of our 2021 Annual Report. |
Royal Bank of Canada
Financial performance
Q2 2022 vs. Q2 2021
Net income decreased $276 million or 26% from a year ago, mainly due to lower revenue in Global Markets. Higher PCL and lower revenue in Corporate and Investment Banking also contributed to the decrease. These factors were partially offset by lower compensation.
Total revenue decreased $370 million or 14%.
Corporate and Investment Banking revenue decreased $74 million or 6%, largely driven by lower equity and debt origination as well as the impact from
unrealized
loan underwriting markdowns, all primarily in the U.S. These factors were partially offset by higher M&A activity across most regions, higher loan syndication activity in the U.S. and Europe, and higher lending revenue largely in the U.S.
Global Markets revenue decreased $212 million or 14%, mainly due to lower fixed income and equity trading revenue primarily in the U.S. as the prior year benefitted from stronger client activity. Lower equity origination across all regions, lower gains from the disposition of certain investment securities and lower debt origination across most regions also contributed to the decrease. These factors were partially offset by higher commodities trading revenue in Canada.
Other revenue decreased $84 million, mainly reflecting higher residual funding costs.
PCL increased $90 million or 71%, mainly reflecting provisions taken on impaired loans in the current quarter as compared to recoveries in the prior year, both largely in the oil and gas sector, resulting in an increase of 22 bps in the PCL on impaired loans ratio. Lower releases of provisions on performing loans also contributed to the increase as downside risks and portfolio growth tempered our releases in the current quarter as compared to last year.
Non-interest
expense decreased $118 million or 8%, mainly due to lower compensation on decreased results.Q2 2022 vs. Q1 2022
Net income decreased $235 million or 23% from last quarter, mainly due to lower fixed income and equity trading revenue across most regions as the prior quarter benefitted from stronger client activity. Lower equity and debt origination across most regions as well as lower M&A and loan syndication activity largely in the U.S. also contributed to the decrease. These factors were partially offset by lower compensation on decreased results.
Q2 2022 vs. Q2 2021 (Six months ended)
Net income decreased $313 million or 15% from the same period last year, largely driven by lower revenue in Global Markets. Higher taxes reflecting favourable tax adjustments in the prior period and higher PCL also contributed to the decrease. These factors were partially offset by higher revenue in Corporate & Investment Banking.
Total revenue decreased $268 million or 5%, mainly due to lower fixed income trading revenue in the U.S. and Europe as the prior period benefitted from stronger client activity, as well as lower equity and debt origination primarily in the U.S. These factors were partially offset by higher loan syndication activity in the U.S. and Europe, higher M&A activity across most regions and higher lending revenue in the U.S. and Europe.
PCL increased $101 million or 67%, mainly reflecting lower releases of provisions on performing loans as downside risks and portfolio growth tempered our releases in the current period as compared to the same period last year. Provisions on impaired loans in the current period as compared to recoveries in the same period last year also contributed to the increase, resulting in an increase of 5 bps in the PCL on impaired loans ratio.
Non-interest
expense decreased $87 million or 3%, primarily driven by lower compensation on decreased results.20 Second Quarter 2022
Royal Bank of Canada
Corporate Support |
| For the three months ended | For the six months ended | |||||||||||||||||||||
| (Millions of Canadian dollars) | April 30 2022 | January 31 2022 | April 30 2021 | April 30 2022 | April 30 2021 | |||||||||||||||||
Net interest income (loss) (1) | $ | (69 | ) | $ | (107 | ) | $ | (105 | ) | $ | (176 | ) | $ | (187 | ) | |||||||
Non-interest income (loss)(1), (2) | (188 | ) | (39 | ) | 148 | (227 | ) | 309 | ||||||||||||||
Total revenue (1), (2) | (257 | ) | (146 | ) | 43 | (403 | ) | 122 | ||||||||||||||
PCL | 1 | – | – | 1 | (1 | ) | ||||||||||||||||
Non-interest expense(2) | (118 | ) | (62 | ) | 110 | (180 | ) | 277 | ||||||||||||||
Income (loss) before income taxes (1), (2) | (140 | ) | (84 | ) | (67 | ) | (224 | ) | (154 | ) | ||||||||||||
Income taxes (recoveries) (1), (2) | (287 | ) | (65 | ) | (113 | ) | (352 | ) | (222 | ) | ||||||||||||
Net income (loss) (2) | $ | 147 | $ | (19 | ) | $ | 46 | $ | 128 | $ | 68 | |||||||||||
| (1) | Teb adjusted. |
| (2) | Effective Q4 2021, gains (losses) on economic hedges of our U.S. share-based compensation plans, which are reflected in revenue, and related variability in share-based compensation expense driven by changes in the fair value of liabilities relating to our U.S. share-based compensation plans have been reclassified from our Wealth Management segment to Corporate Support. Comparative amounts have been reclassified to conform with this presentation. |
Due to the nature of activities and consolidation adjustments reported in this segment, we believe that a comparative period analysis is not relevant. The following identifies material items affecting the reported results in each period.
Total revenue and Income taxes (recoveries) in each period in Corporate Support include the deduction of the teb adjustments related to the
gross-up
of income from Canadian taxable corporate dividends and the U.S. tax credit investment business recorded in Capital Markets. The amount deducted from revenue was offset by an equivalent increase in Income taxes (recoveries).The teb amount for the three months ended April 30, 2022 was $145 million, compared to $142 million in the prior quarter and $135 million in the same quarter last year. The teb amount for the six months ended April 30, 2022 was $287 million, compared to $263 million in the same period last year. For the three months ended April 30, 2022, revenue included losses of $154 million (January 31, 2022 and April 30, 2021 – losses of $89 million and gains of $134 million, respectively) on economic hedges of our U.S. Wealth Management (including City National) share-based compensation plans, and
non-interest
expense included $(122) million (January 31, 2022 and April 30, 2021 – $(71) million and $124 million, respectively) of share-based compensation expense driven by changes in the fair value of liabilities relating to our U.S. Wealth Management (including City National) share-based compensation plans.The following identifies the material items, other than the teb impacts noted previously, affecting the reported results in each period.
Q2 2022
Net income was $147 million, primarily due to net favourable tax adjustments.
Q1 2022
Net loss was $19 million, primarily due to unfavourable tax adjustments, partially offset by residual unallocated items.
Q2 2021
Net income was $46 million, primarily due to asset/liability management activities.
Q2 2022 (Six months ended)
Net income was $128 million, mainly due to net favourable tax adjustments.
Q2 2021 (Six months ended)
Net income was $68 million, mainly due to asset/liability management activities.
Royal Bank of Canada
Quarterly results and trend analysis |
Our quarterly results are impacted by a number of trends and recurring factors, which include seasonality of certain businesses, general economic and market conditions, and fluctuations in the Canadian dollar relative to other currencies. The following table summarizes our results for the last eight quarters (the period):
Quarterly results
(1)
2022 | 2021 | 2020 | ||||||||||||||||||||||||||||||||||||||
(Millions of Canadian dollars, except per share and percentage amounts) | Q2 | Q1 | Q4 | Q3 | Q2 | Q1 | Q4 | Q3 | ||||||||||||||||||||||||||||||||
Personal & Commercial Banking | $ | 4,739 | $ | 4,803 | $ | 4,605 | $ | 4,651 | $ | 4,527 | $ | 4,563 | $ | 4,373 | $ | 4,348 | ||||||||||||||||||||||||
Wealth Management (2) | 3,605 | 3,613 | 3,444 | 3,373 | 3,260 | 3,219 | 3,061 | 3,008 | ||||||||||||||||||||||||||||||||
Insurance | 234 | 1,399 | 1,501 | 1,754 | 536 | 1,809 | 958 | 2,212 | ||||||||||||||||||||||||||||||||
Investor & Treasury Services | 551 | 587 | 548 | 517 | 534 | 565 | 521 | 484 | ||||||||||||||||||||||||||||||||
Capital Markets (3) | 2,348 | 2,810 | 2,298 | 2,463 | 2,718 | 2,708 | 2,275 | 2,748 | ||||||||||||||||||||||||||||||||
Corporate Support (2), (3) | (257 | ) | (146 | ) | (20 | ) | (2 | ) | 43 | 79 | (96 | ) | 120 | |||||||||||||||||||||||||||
Total revenue | 11,220 | 13,066 | 12,376 | 12,756 | 11,618 | 12,943 | 11,092 | 12,920 | ||||||||||||||||||||||||||||||||
PCL | (342 | ) | 105 | (227 | ) | (540 | ) | (96 | ) | 110 | 427 | 675 | ||||||||||||||||||||||||||||
PBCAE | (180 | ) | 997 | 1,032 | 1,304 | 149 | 1,406 | 461 | 1,785 | |||||||||||||||||||||||||||||||
Non-interest expense | 6,434 | 6,580 | 6,583 | 6,420 | 6,379 | 6,542 | 6,058 | 6,380 | ||||||||||||||||||||||||||||||||
Income before income taxes | 5,308 | 5,384 | 4,988 | 5,572 | 5,186 | 4,885 | 4,146 | 4,080 | ||||||||||||||||||||||||||||||||
Income taxes | 1,055 | 1,289 | 1,096 | 1,276 | 1,171 | 1,038 | 900 | 879 | ||||||||||||||||||||||||||||||||
Net income | $ | 4,253 | $ | 4,095 | $ | 3,892 | $ | 4,296 | $ | 4,015 | $ | 3,847 | $ | 3,246 | $ | 3,201 | ||||||||||||||||||||||||
EPS – basic | $ | 2.97 | $ | 2.84 | $ | 2.68 | $ | 2.97 | $ | 2.76 | $ | 2.66 | $ | 2.23 | $ | 2.20 | ||||||||||||||||||||||||
– diluted | 2.96 | 2.84 | 2.68 | 2.97 | 2.76 | 2.66 | 2.23 | 2.20 | ||||||||||||||||||||||||||||||||
Effective income tax rate | 19.9% | 23.9% | 22.0% | 22.9% | 22.6% | 21.2% | 21.7% | 21.5% | ||||||||||||||||||||||||||||||||
Period average US$ equivalent of C$1.00 | $ | 0.789 | $ | 0.787 | $ | 0.796 | $ | 0.812 | $ | 0.798 | $ | 0.779 | $ | 0.756 | $ | 0.737 | ||||||||||||||||||||||||
| (1) | Fluctuations in the Canadian dollar relative to other foreign currencies have affected our consolidated results over the period. |
| (2) | Effective Q4 2021, gains (losses) on economic hedges of our U.S. share-based compensation plans, which are reflected in revenue, and related variability in share-based compensation expense driven by changes in the fair value of liabilities relating to our U.S. share-based compensation plans have been reclassified from our Wealth Management segment to Corporate Support. Comparative amounts have been reclassified to conform with this presentation. |
| (3) | Teb adjusted. For further discussion, refer to the How we measure and report our business segments section of our 2021 Annual Report. |
Seasonality
Seasonal factors may impact our results in certain quarters. The first quarter has historically been stronger for our Capital Markets businesses. The second quarter has fewer days than the other quarters, which generally results in a decrease in net interest income and certain expense items. The third and fourth quarters include the summer months which generally results in lower client activity and may negatively impact the results of our Capital Markets trading business.
Trend analysis
Earnings have generally trended upward over the period and have been impacted by the factors noted below. Quarterly earnings are affected by the impact of foreign exchange translation.
Personal & Commercial Banking revenue has benefitted from solid volume growth over the period. NIM has been negatively impacted by margin compression over the period from the lower interest rate environment, however the end of the period saw increasing interest rates.
Wealth Management revenue has benefitted from growth in average fee-based client assets and volume growth over the period. The low interest rate environment has negatively impacted revenue over the majority of the period, however the end of the period saw increasing interest rates.
Insurance revenue has fluctuated over the period, primarily due to the impact of changes in the fair value of investments backing policyholder liabilities as well as the timing of group annuity sales, both of which are largely offset in PBCAE. Group annuity sales are generally higher in the first and fourth quarters.
Investor & Treasury Services revenue has been impacted by interest rate movements, market volatility and client activity over the period, including heightened fluctuations in the third quarter of 2020.
Capital Markets revenue is influenced, to a large extent, by market conditions that impact client activity, with first quarter results generally stronger than those in the remaining quarters. Trading revenue across the first half of the period benefitted from increased client activity. During the latter half of the period, trading results began to be impacted by market normalization, albeit remaining above pre-pandemic levels. The period starting from the first quarter of 2021 generally saw strong results from M&A and loan syndication activity.
PCL is comprised of provisions taken on performing assets and provisions taken on impaired assets. PCL on performing assets has fluctuated over the period as it is impacted by macroeconomic conditions, changes in exposures and credit quality. Provisions on performing assets in the second half of 2020 continued to reflect the impact of the
COVID-19
pandemic. Throughout 2021 and the first half of 2022, we saw improvements in our macroeconomic and credit quality outlook resulting in releases of provisions on performing assets. PCL on impaired assets trended lower over the period. The recovery that has been underway since the sharp drop of economic activity in calendar 2020 as well as the impact of theCOVID-19
related government support and calendar 2020 payment deferral programs resulted in lower provisions on impaired loans, largely in our Canadian Banking retail portfolios, beginning in the second half of 2020. Provisions on impaired loans in Capital Markets trended lower since the second half of 2020, largely due to recoveries.PBCAE has fluctuated over the period reflecting changes in the fair value of investments backing policyholder liabilities, which is impacted by changes in market conditions, as well as group annuity sales, both of which are largely offset in revenue. PBCAE has also fluctuated due to the impact of investment-related experience and claims costs over the period. Actuarial adjustments, which generally occur in the fourth quarter of each year, also impact PBCAE.
22 Second Quarter 2022
Royal Bank of Canada
Non-interest
expense has been impacted by fluctuations in variable compensation over the period, commensurate with fluctuations in revenue and earnings. Changes in the fair value of our U.S. share-based compensation plans, which are largely offset in revenue, have also contributed to fluctuations over the period and are impacted by market conditions. While we continue to focus on efficiency management activities, expenses over the period also include investments in staff and technology. The fourth quarter of 2021 included a legal provision in U.S. Wealth Management (including City National) that was partially released in the first quarter of 2022.Our effective income tax rate has fluctuated over the period, mostly due to varying levels of tax adjustments and changes in earnings mix. The second quarter of 2022 reflected the impact of net favourable tax adjustments.
Financial condition |
Condensed balance sheets |
| As at | ||||||||
| (Millions of Canadian dollars) | April 30 2022 | October 31 2021 | ||||||
Assets | ||||||||
Cash and due from banks | $ | 115,929 | $ | 113,846 | ||||
Interest-bearing deposits with banks | 68,829 | 79,638 | ||||||
Securities, net of applicable allowance (1) | 298,315 | 284,724 | ||||||
Assets purchased under reverse repurchase agreements and securities borrowed | 316,698 | 307,903 | ||||||
Loans | ||||||||
Retail | 525,183 | 503,598 | ||||||
Wholesale | 252,847 | 218,066 | ||||||
Allowance for loan losses | (3,566 | ) | (4,089 | ) | ||||
Other – Derivatives | 156,204 | 95,541 | ||||||
– Other (2) | 118,133 | 107,096 | ||||||
Total assets | $ | 1,848,572 | $ | 1,706,323 | ||||
Liabilities | ||||||||
Deposits | $ | 1,151,597 | $ | 1,100,831 | ||||
Other – Derivatives | 151,541 | 91,439 | ||||||
– Other (2) | 430,753 | 405,698 | ||||||
Subordinated debentures | 10,276 | 9,593 | ||||||
Total liabilities | 1,744,167 | 1,607,561 | ||||||
Equity attributable to shareholders | 104,304 | 98,667 | ||||||
Non-controlling interests | 101 | 95 | ||||||
Total equity | 104,405 | 98,762 | ||||||
Total liabilities and equity | $ | 1,848,572 | $ | 1,706,323 | ||||
| (1) | Securities are comprised of trading and investment securities. |
| (2) | Other – Other assets and liabilities include Segregated fund net assets and liabilities, respectively. |
Q2 2022 vs. Q4 2021
Total assets increased $142 billion or 8% from October 31, 2021. Foreign exchange translation increased total assets by $53 billion.
Cash and due from banks was up $2 billion or 2%, primarily due to higher deposits with central banks, reflecting our short-term cash and liquidity management activities.
Interest-bearing deposits with banks decreased $11 billion or 14%, primarily due to lower deposits with central banks, reflecting our cash and liquidity management activities.
Securities, net of applicable allowance, were up $14 billion or 5%, mainly due to higher government and corporate debt securities reflecting short-term market opportunities and the impact of foreign exchange translation. These factors were partially offset by lower equity trading securities.
Assets purchased under reverse repurchase agreements (reverse repos) and securities borrowed increased $9 billion or 3%, largely due to the impact of foreign exchange translation and increased client demand.
Loans (net of Allowance for loan losses) were up $57 billion or 8%, primarily due to volume growth in wholesale loans and residential mortgages.
Derivative assets were up $61 billion or 63%, mainly attributable to the impact of foreign exchange translation and higher fair values on foreign exchange contracts.
Other assets were up $11 billion or 10%, largely reflecting higher cash collateral.
Royal Bank of Canada
Total liabilities increased $137 billion or 8%. Foreign exchange translation increased total liabilities by $53 billion.
Deposits increased $51 billion or 5%, largely due to higher retail deposits as a result of increased client activity and issuances of fixed term notes due to funding requirements. The impact of foreign exchange translation also contributed to the increase.
Derivative liabilities were up $60 billion or 66%, mainly attributable to the impact of foreign exchange translation and higher fair values on foreign exchange contracts.
Other liabilities were up $25 billion or 6%, mainly attributable to higher obligations related to repurchase agreements (repos) largely reflecting increased client activity, as well as higher cash collateral and the impact of foreign exchange translation.
Total equity increased $6 billion or 6%, mainly reflecting earnings, net of dividends, and other comprehensive income (OCI), including foreign currency translation adjustments. These factors were partially offset by share repurchases.
Off-balance sheet arrangements |
In the normal course of business, we engage in a variety of financial transactions that, for accounting purposes, are not recorded on our Consolidated Balance Sheets.
Off-balance
sheet transactions are generally undertaken for risk, capital and funding management purposes which benefit us and our clients. These include transactions with structured entities and may also include the issuance of guarantees. These transactions give rise to, among other risks, varying degrees of market, credit, and liquidity and funding risk, which are discussed in the Risk management section of this Q2 2022 Report to Shareholders.The following provides an update to our significant
off-balance
sheet transactions, which are described on pages 50 to 52 of our 2021 Annual Report.Involvement with unconsolidated structured entities
RBC-administered multi-seller conduits
We administer multi-seller conduits which are used primarily for the securitization of our clients’ financial assets. Our maximum exposure to loss under these transactions primarily relates to backstop liquidity and partial credit enhancement facilities extended to the conduits. As at April 30, 2022, the total assets of the multi-seller conduits were $43 billion (October 31, 2021 – $40 billion) and our maximum exposure to loss was $43 billion (October 31, 2021 – $41 billion). The increase reflects the impact of foreign exchange translation, as well as higher securitization activities since October 31, 2021, primarily in the Consumer loans and Credit cards asset classes.
As at April 30, 2022, the total asset-backed commercial paper (ABCP) issued by the conduits amounted to $28 billion (October 31, 2021 – $25 billion). The rating agencies that rate the ABCP rated 100% (October 31, 2021 – 100%) of the total amount issued within the top ratings category.
Risk management |
Credit risk |
Credit risk is the risk of loss associated with an obligor’s potential inability or unwillingness to fulfill its contractual obligations on a timely basis and may arise directly from the risk of default of a primary obligor (e.g., issuer, debtor, counterparty, borrower or policyholder), indirectly from a secondary obligor (e.g., guarantor or reinsurer), through
off-balance
sheet exposures, contingent credit risk, associated credit risk and/or transactional risk. Credit risk includes counterparty credit risk arising from both trading andnon-trading
activities.Our Enterprise Credit Risk Management Framework (ECRMF) and supporting credit policies are designed to clearly define roles and responsibilities, acceptable practices, limits and key controls. There have been no material changes to our ECRMF as described in our 2021 Annual Report.
24 Second Quarter 2022
Royal Bank of Canada
Residential mortgages and home equity lines of credit (insured vs. uninsured)
(1)
Residential mortgages and home equity lines of credit are secured by residential properties. The following table presents a breakdown by geographic region.
As at April 30, 2022 | ||||||||||||||||||||||||||||||
(Millions of Canadian dollars, except percentage amounts) | Residential mortgages | Home equity lines of credit | ||||||||||||||||||||||||||||
Insured | Uninsured | Total | Total | |||||||||||||||||||||||||||
Region (4) | ||||||||||||||||||||||||||||||
Canada | ||||||||||||||||||||||||||||||
Atlantic provinces | $ | 8,324 | 47 | % | $ | 9,458 | 53 | % | $ | 17,782 | $ | 1,610 | ||||||||||||||||||
Quebec | 12,539 | 30 | 29,177 | 70 | 41,716 | 3,175 | ||||||||||||||||||||||||
Ontario | 32,174 | 18 | 146,554 | 82 | 178,728 | 16,473 | ||||||||||||||||||||||||
Alberta | 20,083 | 48 | 21,394 | 52 | 41,477 | 5,159 | ||||||||||||||||||||||||
Saskatchewan and Manitoba | 8,962 | 45 | 10,913 | 55 | 19,875 | 1,939 | ||||||||||||||||||||||||
B.C. and territories | 12,694 | 18 | 56,011 | 82 | 68,705 | 7,490 | ||||||||||||||||||||||||
Total Canada (5) | 94,776 | 26 | 273,507 | 74 | 368,283 | 35,846 | ||||||||||||||||||||||||
U.S. | – | – | 27,245 | 100 | 27,245 | 1,437 | ||||||||||||||||||||||||
Other International | – | – | 2,842 | 100 | 2,842 | 1,558 | ||||||||||||||||||||||||
Total International | – | – | 30,087 | 100 | 30,087 | 2,995 | ||||||||||||||||||||||||
Total | $ | 94,776 | 24 | % | $ | 303,594 | 76 | % | $ | 398,370 | $ | 38,841 | ||||||||||||||||||
| As at January 31, 2022 | ||||||||||||||||||||||||||||||
(Millions of Canadian dollars, except percentage amounts) | Residential mortgages | Home equity lines of credit (3) | ||||||||||||||||||||||||||||
| Insured (2) | Uninsured | Total | Total | |||||||||||||||||||||||||||
Region (4) | ||||||||||||||||||||||||||||||
Canada | ||||||||||||||||||||||||||||||
Atlantic provinces | $ | 8,392 | 48 | % | $ | 9,195 | 52 | % | $ | 17,587 | $ | 1,603 | ||||||||||||||||||
Quebec | 12,618 | 31 | 28,397 | 69 | 41,015 | 3,142 | ||||||||||||||||||||||||
Ontario | 33,305 | 19 | 141,413 | 81 | 174,718 | 16,014 | ||||||||||||||||||||||||
Alberta | 20,458 | 49 | 21,144 | 51 | 41,602 | 5,249 | ||||||||||||||||||||||||
Saskatchewan and Manitoba | 9,133 | 46 | 10,820 | 54 | 19,953 | 1,959 | ||||||||||||||||||||||||
B.C. and territories | 13,035 | 19 | 54,071 | 81 | 67,106 | 7,359 | ||||||||||||||||||||||||
Total Canada (5) | 96,941 | 27 | 265,040 | 73 | 361,981 | 35,326 | ||||||||||||||||||||||||
U.S. | – | – | 25,309 | 100 | 25,309 | 1,434 | ||||||||||||||||||||||||
Other International | – | – | 2,811 | 100 | 2,811 | 1,624 | ||||||||||||||||||||||||
Total International | – | – | 28,120 | 100 | 28,120 | 3,058 | ||||||||||||||||||||||||
Total | $ | 96,941 | 25 | % | $ | 293,160 | 75 | % | $ | 390,101 | $ | 38,384 | ||||||||||||||||||
| (1) | Disclosure is provided in accordance with the requirements of OSFI’s Guideline B-20 (Residential Mortgage Underwriting Practices and Procedures). |
| (2) | Insured residential mortgages are mortgages whereby our exposure to default is mitigated by insurance through the Canadian Mortgage and Housing Corporation or other private mortgage default insurers. |
| (3) | Includes $38,815 million and $26 million of uninsured and insured home equity lines of credit, respectively (January 31, 2022 – $38,357 million and $27 million, respectively), reported within the personal loan category. The amounts in the U.S. and Other International include term loans collateralized by residential mortgages. |
| (4) | Region is based upon the address of the property mortgaged. The Atlantic provinces are comprised of Newfoundland and Labrador, Prince Edward Island, Nova Scotia and New Brunswick; B.C. and territories are comprised of British Columbia, Nunavut, Northwest Territories and Yukon. |
| (5) | Total consolidated residential mortgages in Canada of $368 billion (January 31, 2022 – $362 billion) includes $11 billion (January 31, 2022 – $11 billion) of mortgages with commercial clients in Canadian Banking, of which $8 billion (January 31, 2022 – $8 billion) are insured, and $17 billion (January 31, 2022 – $18 billion) of residential mortgages held for securitization purposes in Capital Markets. All of the residential mortgages held for securitization purposes are insured (January 31, 2022 – all insured). |
Residential mortgages portfolio by amortization period
(1)
The following table provides a summary of the percentage of residential mortgages that fall within the remaining amortization periods based upon current customer payment amounts, which incorporate payments larger than the minimum contractual amount and/or higher frequency of payments.
| As at | ||||||||||||||||||||||||||
April 30 2022 | January 31 2022 | |||||||||||||||||||||||||
Canada | U.S. and other International | Total | Canada | U.S. and other International | Total | |||||||||||||||||||||
Amortization period | ||||||||||||||||||||||||||
≤ 25 years | 66 | % | 26 | % | 63 | % | 74 | % | 26 | % | 71 | % | ||||||||||||||
> 25 years ≤ 30 years | 22 | 74 | 26 | 26 | 74 | 29 | ||||||||||||||||||||
> 30 years ≤ 35 years | 12 | – | 11 | – | – | – | ||||||||||||||||||||
Total | 100 | % | 100 | % | 100 | % | 100 | % | 100 | % | 100 | % | ||||||||||||||
| (1) | Disclosure is provided in accordance with the requirements of OSFI’s Guideline B-20 (Residential Mortgage Underwriting Practices and Procedures). |
Royal Bank of Canada
Average(LTV) ratios
loan-to-value
(1)
The following table provides a summary of our average LTV ratios for newly originated and acquired uninsured residential mortgages and RBC Homeline Plan
®
products by geographic region, as well as the respective LTV ratios for our total Canadian Banking residential mortgage portfolio outstanding.| For the three months ended | For the six months ended | |||||||||||||||||||||||||||
April 30 2022 | January 31 2022 | April 30 2022 | ||||||||||||||||||||||||||
Uninsured | Uninsured | Uninsured | ||||||||||||||||||||||||||
Residential mortgages | RBC Homeline Plan ® products | Residential mortgages (2) | RBC Homeline Plan ® products (3) | Residential mortgages | RBC Homeline Plan ® products | |||||||||||||||||||||||
Average of newly originated and acquired for the period, by region (4) | ||||||||||||||||||||||||||||
Atlantic provinces | 73 | % | 74 | % | 73 | % | 74 | % | 73 | % | 74 | % | ||||||||||||||||
Quebec | 72 | 72 | 72 | 73 | 72 | 73 | ||||||||||||||||||||||
Ontario | 70 | 66 | 71 | 67 | 70 | 67 | ||||||||||||||||||||||
Alberta | 73 | 73 | 73 | 72 | 73 | 73 | ||||||||||||||||||||||
Saskatchewan and Manitoba | 74 | 75 | 74 | 75 | 74 | 75 | ||||||||||||||||||||||
B.C. and territories | 68 | 66 | 68 | 66 | 68 | 66 | ||||||||||||||||||||||
U.S. | 73 | n.m. | 76 | n.m. | 75 | n.m. | ||||||||||||||||||||||
Other International | 73 | n.m. | 72 | n.m. | 72 | n.m. | ||||||||||||||||||||||
Average of newly originated and acquired for the period (5), (6) | 71 | % | 68 | % | 71 | % | 68 | % | 71 | % | 68 | % | ||||||||||||||||
Total Canadian Banking residential mortgages portfolio (7) | 50 | % | 45 | % | 52 | % | 46 | % | 50 | % | 45 | % | ||||||||||||||||
| (1) | Disclosure is provided in accordance with the requirements of OSFI’s Guideline B-20 (Residential Mortgage Underwriting Practices and Procedures). |
| (2) | Residential mortgages exclude residential mortgages within the RBC Homeline Plan ® products. |
| (3) | RBC Homeline Plan ® products are comprised of both residential mortgages and home equity lines of credit. |
| (4) | Region is based upon the address of the property mortgaged. The Atlantic provinces are comprised of Newfoundland and Labrador, Prince Edward Island, Nova Scotia and New Brunswick; B.C. and territories are comprised of British Columbia, Nunavut, Northwest Territories and Yukon. |
| (5) | The average LTV ratios for newly originated and acquired uninsured residential mortgages and RBC Homeline Plan ® products are calculated on a weighted basis by mortgage amounts at origination. |
| (6) | For newly originated mortgages and RBC Homeline Plan ® products, LTV is calculated based on the total facility amount for the residential mortgage and RBC Homeline Plan® product divided by the value of the related residential property. |
| (7) | Weighted by mortgage balances and adjusted for property values based on the Teranet – National Bank National Composite House Price Index. |
| n.m. | not meaningful |
Net International wholesale exposure by region, asset type and client type
(1), (2)
The following table provides a breakdown of our credit risk exposure by region, asset type and client type.
| As at | ||||||||||||||||||||||||||||||||||||||||||
April 30 2022 | January 31 2022 | |||||||||||||||||||||||||||||||||||||||||
Asset type | Client type | |||||||||||||||||||||||||||||||||||||||||
| (Millions of Canadian dollars) | Loans Outstanding | Securities | Repo-style transactions | Derivatives | Financials | Sovereign | Corporate | Total | Total | |||||||||||||||||||||||||||||||||
Europe (excluding U.K.) | $ | 16,399 | $ | 34,289 | $ | 1,220 | $ | 2,737 | $ | 20,306 | $ | 20,771 | $ | 13,568 | $ | 54,645 | $ | 51,773 | ||||||||||||||||||||||||
U.K. | 9,562 | 27,157 | 837 | 3,552 | 14,439 | 16,920 | 9,749 | 41,108 | 45,815 | |||||||||||||||||||||||||||||||||
Latin America and the Caribbean | 8,315 | 11,789 | 325 | 70 | 7,466 | 5,112 | 7,921 | 20,499 | 20,161 | |||||||||||||||||||||||||||||||||
Asia-Pacific | 6,315 | 34,400 | 866 | 1,134 | 9,474 | 28,432 | 4,809 | 42,715 | 38,680 | |||||||||||||||||||||||||||||||||
Other (4) | 164 | 96 | 391 | 22 | 457 | 12 | 204 | 673 | 573 | |||||||||||||||||||||||||||||||||
Net International exposure (5), (6) | $ | 40,755 | $ | 107,731 | $ | 3,639 | $ | 7,515 | $ | 52,142 | $ | 71,247 | $ | 36,251 | $ | 159,640 | $ | 157,002 | ||||||||||||||||||||||||
| (1) | Geographic profile is based on country of risk, which reflects our assessment of the geographic risk associated with a given exposure. Typically, this is the residence of the borrower. |
| (2) | Exposures are calculated on a fair value basis and net of collateral, which includes $376 billion against repo-style transactions (January 31, 2022 – $351 billion) and $13 billion against derivatives (January 31, 2022 – $9 billion). |
| (3) | Securities include $16 billion of trading securities (January 31, 2022 – $20 billion), $57 billion of deposits (January 31, 2022 – $57 billion), and $35 billion of investment securities (January 31, 2022 – $33 billion). |
| (4) | Includes exposures in the Middle East and Africa. |
| (5) | Excludes $3,685 million (January 31, 2022 – $3,160 million) of exposures to supranational agencies. |
| (6) | Reflects $2,137 million of mitigation through credit default swaps, which are largely used to hedge single name exposures and market risk (January 31, 2022 – $1,801 million). |
26 Second Quarter 2022
Royal Bank of Canada
Credit quality performance
The following credit quality performance tables and analysis provide information on loans, which represents loans, acceptances and commitments, and other financial assets.
Gross impaired loans
| As at and for the three months ended | ||||||||||||
| (Millions of Canadian dollars, except percentage amounts) | April 30 2022 | January 31 2022 | October 31 2021 | |||||||||
Personal & Commercial Banking | $ | 1,449 | $ | 1,524 | $ | 1,590 | ||||||
Wealth Management | 226 | 199 | 233 | |||||||||
Capital Markets | 462 | 418 | 485 | |||||||||
Total GIL | $ | 2,137 | $ | 2,141 | $ | 2,308 | ||||||
Impaired loans, beginning balance | $ | 2,141 | $ | 2,308 | $ | 2,561 | ||||||
Classified as impaired during the period (new impaired) (1) | 398 | 263 | 298 | |||||||||
Net repayments (1) | (103 | ) | (125 | ) | (106 | ) | ||||||
Amounts written off | (260 | ) | (237 | ) | (286 | ) | ||||||
Other (2) | (39 | ) | (68 | ) | (159 | ) | ||||||
Impaired loans, balance at end of period | $ | 2,137 | $ | 2,141 | $ | 2,308 | ||||||
GIL as a % of related loans and acceptances | ||||||||||||
Total GIL as a % of related loans and acceptances | 0.27% | 0.28% | 0.31% | |||||||||
Personal & Commercial Banking | 0.26% | 0.28% | 0.30% | |||||||||
Canadian Banking | 0.20% | 0.22% | 0.24% | |||||||||
Caribbean Banking | 4.43% | 4.54% | 4.65% | |||||||||
Wealth Management | 0.22% | 0.21% | 0.26% | |||||||||
Capital Markets | 0.37% | 0.37% | 0.45% | |||||||||
| (1) | Certain GIL movements for Canadian Banking retail and wholesale portfolios are generally allocated to new impaired, as Net repayments and certain Other movements are not reasonably determinable. Certain GIL movements for Caribbean Banking retail and wholesale portfolios are generally allocated to Net repayments and new impaired, as Net repayments and certain Other movements are not reasonably determinable. |
| (2) | Includes return to performing status during the period, recoveries of loans and advances previously written off, sold, and foreign exchange translation and other movements. |
Q2 2022 vs. Q1 2022
Total GIL decreased $4 million from last quarter, and the total GIL ratio of 27 bps decreased 1 bp, due to lower impaired loans in Personal & Commercial Banking, largely offset by higher impaired loans in Capital Markets and Wealth Management.
GIL in Personal & Commercial Banking decreased $75 million or 5%, largely due to lower impaired loans in our Canadian Banking commercial portfolios, mainly in the real estate and related and other services sectors. Lower impaired loans in our Canadian Banking retail portfolios also contributed to the decrease.
GIL in Wealth Management increased $27 million or 14%, primarily reflecting higher impaired loans in U.S Wealth Management (including City National), mainly in the consumer discretionary sector.
GIL in Capital Markets increased $44 million or 11%, due to higher impaired loans in the consumer staples and other services sectors, partially offset by lower impaired loans in the oil and gas sector.
Allowance for credit losses (ACL)
| As at | ||||||||||||
| (Millions of Canadian dollars) | April 30 2022 | January 31 2022 | October 31 2021 | |||||||||
Personal & Commercial Banking | $ | 3,029 | $ | 3,462 | $ | 3,478 | ||||||
Wealth Management | 299 | 324 | 320 | |||||||||
Capital Markets | 557 | 602 | 620 | |||||||||
Corporate Support and other (1) | 2 | 1 | 1 | |||||||||
ACL on loans | 3,887 | 4,389 | 4,419 | |||||||||
ACL on other financial assets (2) | 39 | 53 | 52 | |||||||||
Total ACL | $ | 3,926 | $ | 4,442 | $ | 4,471 | ||||||
ACL on loans is comprised of: | ||||||||||||
Retail | $ | 2,053 | $ | 2,236 | $ | 2,287 | ||||||
Wholesale | 1,114 | 1,428 | 1,435 | |||||||||
ACL on performing loans | $ | 3,167 | $ | 3,664 | $ | 3,722 | ||||||
ACL on impaired loans | 720 | 725 | 697 | |||||||||
| (1) | Includes PCL recorded in Corporate Support, Insurance and Investor & Treasury Services. |
| (2) | ACL on other financial assets mainly represents allowances on debt securities measured at FVOCI and amortized cost, accounts receivable and financial guarantees. |
Royal Bank of Canada
Q2 2022 vs. Q1 2022
Total ACL of $3,926 million decreased $516 million or 12% from last quarter, primarily reflecting a decrease of $502 million in ACL on loans.
ACL on performing loans of $3,167 million decreased $497 million or 14%, primarily due to lower ACL in Personal & Commercial Banking. Reduced uncertainty relating to the COVID-19 pandemic drove releases in the current quarter, partially tempered by increased downside risks including rising inflation and interest rates.
ACL on impaired loans of $720 million decreased $5 million or 1%, primarily due to lower ACL in Personal & Commercial Banking, partially offset by higher ACL in Capital Markets.
For further details, refer to Note 5 of our Condensed Financial Statements.
Market risk |
Market risk is defined to be the impact of market prices upon our financial condition. This includes potential gains or losses due to changes in market-determined variables such as interest rates, credit spreads, equity prices, commodity prices, foreign exchange rates and implied volatilities. There have been no material changes to our Market Risk Management Framework from the framework described in our 2021 Annual Report. Using that framework, we continuously seek to ensure that our market risk exposure is consistent with risk appetite constraints set by the Board of Directors.
Market risk controls include limits on probabilistic measures of potential loss in trading positions, such as(VaR), Stressed(SVaR), stress testing and Incremental Risk Charge (IRC). Market risk controls are also in place to manage Interest Rate Risk in the Banking Book (IRRBB). To monitor and control IRRBB, we assess two primary metrics, Net Interest Income (NII) risk and Economic Value of Equity (EVE) risk, under a range of market shocks, scenarios, and time horizons. There has been no material change to the IRRBB measurement methodology, controls, or limits from those described in our 2021 Annual Report. For further details of our approach to the management of market risk, refer to the Market risk section of our 2021 Annual Report.
Value-at-Risk
Value-at-Risk
Market risk measures – FVTPL positions
VaR and SVaR
The following table presents our Market risk VaR and Market risk SVaR figures.
April 30, 2022 | January 31, 2022 | April 30, 2021 | ||||||||||||||||||||||||||||||||||
For the three months ended | For the three months ended | For the three months ended | ||||||||||||||||||||||||||||||||||
| (Millions of Canadian dollars) | As at | Average | High | Low | As at | Average | As at | Average | ||||||||||||||||||||||||||||
Equity | $ | 46 | $ | 33 | $ | 46 | $ | 21 | $ | 39 | $ | 34 | $ | 20 | $ | 18 | ||||||||||||||||||||
Foreign exchange | 3 | 4 | 6 | 3 | 4 | 5 | 5 | 4 | ||||||||||||||||||||||||||||
Commodities | 4 | 4 | 5 | 4 | 4 | 4 | 2 | 2 | ||||||||||||||||||||||||||||
Interest rate (1) | 22 | 22 | 42 | 17 | 29 | 39 | 48 | 44 | ||||||||||||||||||||||||||||
Credit specific (2) | 7 | 8 | 9 | 7 | 8 | 9 | 9 | 8 | ||||||||||||||||||||||||||||
Diversification (3) | (27 | ) | (25 | ) | n.m. | n.m. | (33 | ) | (35 | ) | (30 | ) | (34 | ) | ||||||||||||||||||||||
Market risk VaR | $ | 55 | $ | 46 | $ | 57 | $ | 37 | $ | 51 | $ | 56 | $ | 54 | $ | 42 | ||||||||||||||||||||
Market risk Stressed VaR | $ | 101 | $ | 80 | $ | 130 | $ | 47 | $ | 65 | $ | 71 | $ | 58 | $ | 53 | ||||||||||||||||||||
April 30, 2022 | April 30, 2021 | |||||||||||||||||||||||||||||||||||
For the six months ended | For the six months ended | |||||||||||||||||||||||||||||||||||
| (Millions of Canadian dollars) | As at | Average | High | Low | As at | Average | ||||||||||||||||||||||||||||||
Equity | $ | 46 | $ | 33 | $ | 48 | $ | 21 | $ | 20 | $ | 17 | ||||||||||||||||||||||||
Foreign exchange | 3 | 4 | 7 | 3 | 5 | 4 | ||||||||||||||||||||||||||||||
Commodities | 4 | 4 | 5 | 3 | 2 | 2 | ||||||||||||||||||||||||||||||
Interest rate (1) | 22 | 31 | 62 | 17 | 48 | 42 | ||||||||||||||||||||||||||||||
Credit specific (2) | 7 | 8 | 10 | 7 | 9 | 8 | ||||||||||||||||||||||||||||||
Diversification (3) | (27 | ) | (29 | ) | n.m. | n.m. | (30 | ) | (33 | ) | ||||||||||||||||||||||||||
Market risk VaR | $ | 55 | $ | 51 | $ | 87 | $ | 34 | $ | 54 | $ | 40 | ||||||||||||||||||||||||
Market risk Stressed VaR | $ | 101 | $ | 75 | $ | 130 | $ | 47 | $ | 58 | $ | 54 | ||||||||||||||||||||||||
| (1) | General credit spread risk and funding spread risk associated with uncollateralized derivatives are included under interest rate VaR. |
| (2) | Credit specific risk captures issuer-specific credit spread volatility. |
| (3) | Market risk VaR is less than the sum of the individual risk factor VaR results due to risk factor diversification. |
| n.m. | not meaningful |
Q2 2022 vs. Q2 2021
Average market risk VaR of $46 million increased $4 million from a year ago. This was driven by the impact of heightened market volatility in the current quarter on our equity derivatives portfolio and a reduced impact from diversification, partially offset by the impact of the Q2 2020 period of significant market volatility no longer being reflected in our two-year historical VaR period.
Average SVaR of $80 million increased $27 million, mainly driven by increased exposures in our fixed income and interest rate derivative portfolios from client-driven activities, and unfavourable market conditions in the current quarter which impacted loan underwriting commitments.
28 Second Quarter 2022
Royal Bank of Canada
Q2 2022 vs. Q1 2022
Average market risk VaR of $46 million decreased $10 million from last quarter, mainly due to the impact of the Q2 2020 period of significant market volatility no longer being reflected in our two-year historical VaR period, partially offset by a reduced impact from diversification.
Average SVaR of $80 million increased $9 million, mainly driven by unfavourable market conditions in the current quarter which impacted loan underwriting commitments.
Q2 2022 vs. Q2 2021 (Six months ended)
Average market risk VaR of $51 million increased $11 million from the same period last year, largely driven by increased exposures in our fixed income and interest rate derivative portfolios from client-driven activities, and the impact of heightened market volatility in the current period on our equity derivatives portfolio, partially offset by the impact of the Q2 2020 period of significant market volatility no longer being reflected in our two-year historical VaR period.
Average SVaR of $75 million increased $21 million, largely driven by increased exposures in our fixed income and interest rate derivative portfolios from client-driven activities, and the impact of heightened market volatility in the current period on our equity derivatives portfolio.
The following chart displays a bar graph of our daily trading profit and loss and a line graph of our daily market risk VaR. We incurred no net trading losses in the three months ended April 30, 2022 and January 31, 2022.

| (1) | Includes loan underwriting commitments. |
Market risk measures for assets and liabilities of RBC Insurance
®
We offer a range of insurance products to clients and hold investments to meet the future obligations to policyholders. The investments which support actuarial liabilities are predominantly fixed income assets designated as FVTPL. Consequently, changes in the fair values of these assets are recorded in the Consolidated Statements of Income and are largely offset by changes in the fair value of the actuarial liabilities, the impact of which is reflected in Insurance policyholder benefits, claims and acquisition expense. As at April 30, 2022, we held assets in support of $12 billion of liabilities with respect to insurance obligations (January 31, 2022 – $13 billion).
Market risk measures – IRRBB sensitivities
The following table shows the potential
before-tax
impact of an immediate and sustained 100 bps increase or decrease in interest rates on projected12-month
NII and EVE, assuming no subsequent hedging. Rate floors are applied within the declining rates scenarios which prevent EVE valuation and NII simulation rate levels from falling below a minimum average level of negative 25 bps across major currencies. Interest rate risk measures are based on current on andoff-balance
sheet positions which can change over time in response to business activity and management actions.April 30 2022 | January 31 2022 | April 30 2021 | ||||||||||||||||||||||||||||||||||||||||||||
EVE risk | NII risk | |||||||||||||||||||||||||||||||||||||||||||||
| (Millions of Canadian dollars) | Canadian dollar impact | U.S. dollar impact | Total | Canadian dollar impact | U.S. dollar impact | Total | EVE risk | NII risk (1) | EVE risk | NII risk (1) | ||||||||||||||||||||||||||||||||||||
Before-tax impact of: | ||||||||||||||||||||||||||||||||||||||||||||||
100 bps increase in rates | $ | (1,460 | ) | $ | (594 | ) | $ | (2,054 | ) | $ | 712 | $ | 375 | $ | 1,087 | $ | (2,162 | ) | $ | 853 | $ | (2,064 | ) | $ | 858 | |||||||||||||||||||||
100 bps decrease in rates | 1,386 | 342 | 1,728 | (850 | ) | (364 | ) | (1,214 | ) | 1,519 | (964 | ) | 1,771 | (858 | ) | |||||||||||||||||||||||||||||||
| (1) | Represents the 12-month NII exposure to an instantaneous and sustained shift in interest rates. |
Royal Bank of Canada
As at April 30, 2022, an immediate and sustained
-100
bps shock would have had a negative impact to our NII of $1,214 million, up from $964 million last quarter and an immediate and sustained +100bps shock would have had a positive impact to our NII of $1,087 million, up from $853 million last quarter. An immediate and sustained +100 bps shock as at April 30, 2022 would have had a negative impact to the bank’s EVE of $2,054 million, down from $2,162 million last quarter. The quarter-over-quarter NII sensitivity increased as a higher proportion of our floating rate assets were funded by low cost deposits in the current quarter, while the quarter-over-quarter EVE sensitivity decreased reflecting higher NII sensitivity. During the second quarter of 2022, NII and EVE risks remained within approved limits.Linkage of market risk to selected balance sheet items
The following tables provide the linkages between selected balance sheet items with positions included in our trading market risk and
non-trading
market risk disclosures, which illustrates how we manage market risk for our assets and liabilities through different risk measures:As at April 30, 2022 | ||||||||||||||||
Market risk measure | ||||||||||||||||
| (Millions of Canadian dollars) | Balance sheet amount | Traded risk | Non-traded risk | Non-traded riskprimary risk sensitivity | ||||||||||||
Assets subject to market risk | ||||||||||||||||
Cash and due from banks | $ | 115,929 | $ | – | $ | 115,929 | Interest rate | |||||||||
Interest-bearing deposits with banks | 68,829 | 58,319 | 10,510 | Interest rate | ||||||||||||
Securities | ||||||||||||||||
Trading | 143,766 | 132,464 | 11,302 | Interest rate, credit spread | ||||||||||||
Investment, net of applicable allowance | 154,549 | – | 154,549 | Interest rate, credit spread, equity | ||||||||||||
Assets purchased under reverse repurchase agreements and securities borrowed | 316,698 | 271,184 | 45,514 | Interest rate | ||||||||||||
Loans | ||||||||||||||||
Retail | 525,183 | 5,382 | 519,801 | Interest rate | ||||||||||||
Wholesale | 252,847 | 9,839 | 243,008 | Interest rate | ||||||||||||
Allowance for loan losses | (3,566 | ) | – | (3,566 | ) | Interest rate | ||||||||||
Segregated fund net assets | 2,659 | – | 2,659 | Interest rate | ||||||||||||
Other | ||||||||||||||||
Derivatives | 156,204 | 152,811 | 3,393 | Interest rate, foreign exchange | ||||||||||||
Other assets | 101,282 | 9,076 | 92,206 | Interest rate | ||||||||||||
Assets not subject to market risk (3) | 14,192 | |||||||||||||||
Total assets | $ | 1,848,572 | $ | 639,075 | $ | 1,195,305 | ||||||||||
Liabilities subject to market risk | ||||||||||||||||
Deposits | $ | 1,151,597 | $ | 132,342 | $ | 1,019,255 | Interest rate | |||||||||
Segregated fund liabilities | 2,659 | – | 2,659 | Interest rate | ||||||||||||
Other | ||||||||||||||||
Obligations related to securities sold short | 39,464 | 39,464 | – | |||||||||||||
Obligations related to assets sold under repurchase agreements and securities loaned | 279,338 | 252,307 | 27,031 | Interest rate | ||||||||||||
Derivatives | 151,541 | 143,679 | 7,862 | Interest rate, foreign exchange | ||||||||||||
Other liabilities | 91,069 | 10,424 | 80,645 | Interest rate | ||||||||||||
Subordinated debentures | 10,276 | – | 10,276 | Interest rate | ||||||||||||
Liabilities not subject to market risk (4) | 18,223 | |||||||||||||||
Total liabilities | $ | 1,744,167 | $ | 578,216 | $ | 1,147,728 | ||||||||||
Total equity | 104,405 | |||||||||||||||
Total liabilities and equity | $ | 1,848,572 | ||||||||||||||
| (1) | Traded risk includes positions that are classified or designated as FVTPL and positions whose revaluation gains and losses are reported in revenue. Market risk measures of VaR, SVaR, IRC and stress testing are used as risk controls for traded risk. |
| (2) | Non-traded risk includes positions used in the management of IRRBB and othernon-trading portfolios. Other materialnon-trading portfolios include positions from RBC Insurance® and investment securities, net of applicable allowance, not included in IRRBB. |
| (3) | Assets not subject to market risk include physical and other assets. |
| (4) | Liabilities not subject to market risk include payroll related and other liabilities. |
30 Second Quarter 2022
Royal Bank of Canada
| As at January 31, 2022 | ||||||||||||||
| Market risk measure | ||||||||||||||
| (Millions of Canadian dollars) | Balance sheet amount | Traded risk (1) | Non-traded risk (2) | Non-traded riskprimary risk sensitivity | ||||||||||
Assets subject to market risk | ||||||||||||||
Cash and due from banks | $ | 131,163 | $ | – | $ | 131,163 | Interest rate | |||||||
Interest-bearing deposits with banks | 63,420 | 50,222 | 13,198 | Interest rate | ||||||||||
Securities | ||||||||||||||
Trading | 149,525 | 137,203 | 12,322 | Interest rate, credit spread | ||||||||||
Investment, net of applicable allowance | 153,570 | – | 153,570 | Interest rate, credit spread, equity | ||||||||||
Assets purchased under reverse repurchase agreements and securities borrowed | 312,126 | 270,142 | 41,984 | Interest rate | ||||||||||
Loans | ||||||||||||||
Retail | 513,970 | 4,538 | 509,432 | Interest rate | ||||||||||
Wholesale | 230,108 | 11,348 | 218,760 | Interest rate | ||||||||||
Allowance for loan losses | (4,047 | ) | – | (4,047 | ) | Interest rate | ||||||||
Segregated fund net assets | 2,730 | – | 2,730 | Interest rate | ||||||||||
Other | ||||||||||||||
Derivatives | 92,319 | 90,252 | 2,067 | Interest rate, foreign exchange | ||||||||||
Other assets | 95,890 | 9,101 | 86,789 | Interest rate | ||||||||||
Assets not subject to market risk (3) | 11,695 | |||||||||||||
Total assets | $ | 1,752,469 | $ | 572,806 | $ | 1,167,968 | ||||||||
Liabilities subject to market risk | ||||||||||||||
Deposits | $ | 1,142,842 | $ | 140,180 | $ | 1,002,662 | Interest rate | |||||||
Segregated fund liabilities | 2,730 | – | 2,730 | Interest rate | ||||||||||
Other | ||||||||||||||
Obligations related to securities sold short | 41,544 | 41,544 | – | |||||||||||
Obligations related to assets sold under repurchase agreements and securities loaned | 265,009 | 238,833 | 26,176 | Interest rate | ||||||||||
Derivatives | 88,102 | 85,474 | 2,628 | Interest rate, foreign exchange | ||||||||||
Other liabilities | 81,297 | 9,620 | 71,677 | Interest rate | ||||||||||
Subordinated debentures | 10,561 | – | 10,561 | Interest rate | ||||||||||
Liabilities not subject to market risk (4) | 18,376 | |||||||||||||
Total liabilities | $ | 1,650,461 | $ | 515,651 | $ | 1,116,434 | ||||||||
Total equity | 102,008 | |||||||||||||
Total liabilities and equity | $ | 1,752,469 | ||||||||||||
| (1) | Traded risk includes positions that are classified or designated as FVTPL and positions whose revaluation gains and losses are reported in revenue. Market risk measures of VaR, SVaR, IRC and stress testing are used as risk controls for traded risk. |
| (2) | Non-traded risk includes positions used in the management of IRRBB and othernon-trading portfolios. Other materialnon-trading portfolios include positions from RBC Insurance® and investment securities, net of applicable allowance, not included in IRRBB. |
| (3) | Assets not subject to market risk include physical and other assets. |
| (4) | Liabilities not subject to market risk include payroll related and other liabilities. |
Royal Bank of Canada
Liquidity and funding risk |
Liquidity and funding risk (liquidity risk) is the risk that we may be unable to generate sufficient cash or its equivalents in a timely and cost-effective manner to meet our commitments. Liquidity risk arises from mismatches in the timing and value of
on-balance
sheet andoff-balance
sheet cash flows.Our Liquidity Risk Management Framework (LRMF) is designed to ensure that we have sufficient liquidity to satisfy current and prospective commitments in both normal and stressed conditions. There have been no material changes to our LRMF as described in our 2021 Annual Report.
We continue to maintain liquidity and funding that we believe is appropriate for the execution of our strategy. Liquidity risk remains well within our risk appetite.
Liquidity reserve
Our liquidity reserve consists of available unencumbered liquid assets. Although unused wholesale funding capacity, which is regularly assessed, could be another potential source of liquidity to mitigate stressed conditions, it is excluded in the determination of the liquidity reserve. Similarly, uncommitted and undrawn central bank borrowing facilities that could be accessed subject to satisfying certain preconditions as set by various central banks (e.g., BoC, the Fed, Bank of England, and Bank of France), as well as amounts that qualify as eligible collateral at the Federal Reserve Bank of New York (FRBNY) and Federal Home Loan Bank (FHLB) are also excluded from the determination of the liquidity reserve.
As at April 30, 2022 | ||||||||||||||||||||||||
| (Millions of Canadian dollars) | Bank-owned liquid assets | Securities received as collateral from securities financing and derivative transactions | Total liquid assets | Encumbered liquid assets | Unencumbered liquid assets | |||||||||||||||||||
Cash and due from banks | $ | 115,929 | $ | – | $ | 115,929 | $ | 3,612 | $ | 112,317 | ||||||||||||||
Interest-bearing deposits with banks | 68,829 | – | 68,829 | – | 68,829 | |||||||||||||||||||
Securities issued or guaranteed by sovereigns, central banks or multilateral development banks (1) | 224,391 | 329,058 | 553,449 | 376,291 | 177,158 | |||||||||||||||||||
Other securities | 117,767 | 124,085 | 241,852 | 141,199 | 100,653 | |||||||||||||||||||
Other liquid assets (2) | 37,950 | – | 37,950 | 35,338 | 2,612 | |||||||||||||||||||
Total liquid assets | $ | 564,866 | $ | 453,143 | $ | 1,018,009 | $ | 556,440 | $ | 461,569 | ||||||||||||||
| As at January 31, 2022 | ||||||||||||||||||||||||
| (Millions of Canadian dollars) | Bank-owned liquid assets | Securities received as collateral from securities financing and derivative transactions | Total liquid assets | Encumbered liquid assets | Unencumbered liquid assets | |||||||||||||||||||
Cash and due from banks | $ | 131,163 | $ | – | $ | 131,163 | $ | 3,438 | $ | 127,725 | ||||||||||||||
Interest-bearing deposits with banks | 63,420 | – | 63,420 | – | 63,420 | |||||||||||||||||||
Securities issued or guaranteed by sovereigns, central banks or multilateral development banks (1) | 222,651 | 323,397 | 546,048 | 363,498 | 182,550 | |||||||||||||||||||
Other securities | 126,888 | 124,251 | 251,139 | 143,135 | 108,004 | |||||||||||||||||||
Other liquid assets (2) | 29,604 | – | 29,604 | 27,529 | 2,075 | |||||||||||||||||||
Total liquid assets | $ | 573,726 | $ | 447,648 | $ | 1,021,374 | $ | 537,600 | $ | 483,774 | ||||||||||||||
| As at | ||||||||||||||||||||||||
| (Millions of Canadian dollars) | April 30 2022 | January 31 2022 | ||||||||||||||||||||||
Royal Bank of Canada | $ | 204,567 | $ | 234,654 | ||||||||||||||||||||
Foreign branches | 85,933 | 82,729 | ||||||||||||||||||||||
Subsidiaries | 171,069 | 166,391 | ||||||||||||||||||||||
Total unencumbered liquid assets | $ | 461,569 | $ | 483,774 | ||||||||||||||||||||
| (1) | Includes liquid securities issued by provincial governments and U.S. government-sponsored entities working under U.S. Federal government’s conservatorship (e.g., Federal National Mortgage Association and Federal Home Loan Mortgage Corporation). |
| (2) | Encumbered liquid assets amount represents cash collateral and margin deposit amounts pledged related to over-the-counter |
The liquidity reserve is typically most affected by routine flows of client banking activity where liquid asset portfolios reflect changes in deposit and loan balances, as well as by activities in Capital Markets and Investor & Treasury Services, where business strategies and client flows may also affect liquidity reserve balances. Corporate Treasury also affects liquidity reserves through the management of funding issuances where reserves absorb timing mismatches between debt issuances and deployment into business activities.
32 Second Quarter 2022
Royal Bank of Canada
Q2 2022 vs. Q1 2022
Total unencumbered liquid assets decreased $22 billion or 5% from last quarter, mainly due to a reduction in cash and due from banks, reflecting a decrease in deposits with central banks, which was largely driven by changes in our balance sheet composition, primarily strong loan growth. A reduction in unencumbered securities, including the impact from collateral pledged under repurchase agreements, also contributed to the decrease.
Asset encumbrance
The table below provides a summary of our
on-
andoff-balance
sheet amounts for cash, securities and other assets, distinguishing between those that are encumbered and those that are available for sale or use as collateral in secured funding transactions. Other assets, such as mortgages and credit card receivables, can also be monetized, albeit over longer timeframes than those required for marketable securities. As at April 30, 2022, our unencumbered assets available as collateral comprised 24% of total assets (January 31, 2022 – 26%).| As at | ||||||||||||||||||||||||||||||||||||||||||||||||
April 30 2022 | January 31 2022 | |||||||||||||||||||||||||||||||||||||||||||||||
Encumbered | Unencumbered | Encumbered | Unencumbered | |||||||||||||||||||||||||||||||||||||||||||||
| (Millions of Canadian dollars) | Pledged as collateral | Other | Available as collateral | Other | Total | Pledged as collateral | Other (1) | Available as collateral (2) | Other (3) | Total | ||||||||||||||||||||||||||||||||||||||
Cash and due from banks | $ | – | $ | 3,612 | $ | 112,317 | $ | – | $ | 115,929 | $ | – | $ | 3,438 | $ | 127,725 | $ | – | $ | 131,163 | ||||||||||||||||||||||||||||
Interest-bearing deposits with banks | – | – | 68,829 | – | 68,829 | – | – | 63,420 | – | 63,420 | ||||||||||||||||||||||||||||||||||||||
Securities | ||||||||||||||||||||||||||||||||||||||||||||||||
Trading | 63,774 | – | 85,663 | 3,156 | 152,593 | 63,438 | – | 92,821 | 3,384 | 159,643 | ||||||||||||||||||||||||||||||||||||||
Investment, net of applicable allowance | 11,305 | – | 143,244 | – | 154,549 | 12,020 | – | 141,550 | – | 153,570 | ||||||||||||||||||||||||||||||||||||||
Assets purchased under reverse repurchase agreements and securities borrowed (4) | 462,771 | 22,688 | 4,506 | 3,873 | 493,838 | 447,021 | 22,711 | 13,448 | 3,616 | 486,796 | ||||||||||||||||||||||||||||||||||||||
Loans | ||||||||||||||||||||||||||||||||||||||||||||||||
Retail | �� | |||||||||||||||||||||||||||||||||||||||||||||||
Mortgage securities | 28,484 | – | 28,702 | – | 57,186 | 29,786 | – | 29,921 | – | 59,707 | ||||||||||||||||||||||||||||||||||||||
Mortgage loans | 52,261 | – | 32,863 | 256,060 | 341,184 | 49,007 | – | 31,211 | 250,176 | 330,394 | ||||||||||||||||||||||||||||||||||||||
Non-mortgage loans | 4,082 | – | 8,483 | 114,248 | 126,813 | 3,297 | – | 7,290 | 113,282 | 123,869 | ||||||||||||||||||||||||||||||||||||||
Wholesale | – | – | – | 252,847 | 252,847 | – | – | – | 230,108 | 230,108 | ||||||||||||||||||||||||||||||||||||||
Allowance for loan losses | – | – | – | (3,566 | ) | (3,566 | ) | – | – | – | (4,047 | ) | (4,047 | ) | ||||||||||||||||||||||||||||||||||
Segregated fund net assets | – | – | – | 2,659 | 2,659 | – | – | – | 2,730 | 2,730 | ||||||||||||||||||||||||||||||||||||||
Other | ||||||||||||||||||||||||||||||||||||||||||||||||
Derivatives | – | – | – | 156,204 | 156,204 | – | – | – | 92,319 | 92,319 | ||||||||||||||||||||||||||||||||||||||
Others (5) | 35,338 | – | 2,612 | 77,524 | 115,474 | 27,529 | – | 2,075 | 77,981 | 107,585 | ||||||||||||||||||||||||||||||||||||||
Total assets | $ | 658,015 | $ | 26,300 | $ | 487,219 | $ | 863,005 | $ | 2,034,539 | $ | 632,098 | $ | 26,149 | $ | 509,461 | $ | 769,549 | $ | 1,937,257 | ||||||||||||||||||||||||||||
| (1) | Includes assets restricted from use to generate secured funding due to legal or other constraints. |
| (2) | Represents assets that are readily available for use as collateral, including NHA MBS, our unencumbered mortgage loans that qualify as eligible collateral at FHLB, as well as loans that qualify as eligible collateral for the discount window facility available to us and lodged at the FRBNY. |
| (3) | Other unencumbered assets are not subject to any restrictions on their use to secure funding or as collateral but would not be considered readily available. |
| (4) | Includes bank-owned liquid assets and securities received as collateral from off-balance sheet securities financing, derivative transactions, and margin lending. Includes $23 billion (January 31, 2022 – $23 billion) of collateral received through reverse repurchase transactions that cannot be rehypothecated in its current legal form. |
| (5) | The Pledged as collateral amount represents cash collateral and margin deposit amounts pledged related to OTC and exchange-traded derivative transactions. |
Funding
Funding strategy
Core funding, comprising capital, longer-term wholesale liabilities and a diversified pool of personal and, to a lesser extent, commercial and institutional deposits, is the foundation of our structural liquidity position.
Deposit and funding profile
As at April 30, 2022, relationship-based deposits, which are the primary source of funding for retail loans and mortgages, were $793 billion or 54% of our total funding (January 31, 2022 – $786 billion or 54%). The remaining portion is comprised of short- and long-term wholesale funding.
Funding for highly liquid assets consists primarily of short-term wholesale funding that reflects the monetization period of those assets. Long-term wholesale funding is used mostly to fund less liquid wholesale assets and to support liquid asset buffers.
Senior long-term debt issued by the bank on or after September 23, 2018, that has an original term greater than 400 days and is marketable, subject to certain exceptions, is subject to the Canadian Bank Recapitalization
(Bail-in)
regime. Under theBail-in
regime, in circumstances when the Superintendent of Financial Institutions has determined that a bank may no longer be viable, the Governor in Council may, upon a recommendation of the Minister of Finance that he or she is of the opinion that it is in the public interest to do so, grant an order directing the Canada Deposit Insurance Corporation (CDIC) to convert all or a portion of certain shares and liabilities of that bank into common shares. As at April 30, 2022, the notional value of issued and outstanding long-term debt subject to conversion under theBail-in
regime was $68 billion (January 31, 2022 – $60 billion).For further details on our wholesale funding, refer to the Composition of wholesale funding tables below.
Royal Bank of Canada
Long-term debt issuance
Our wholesale funding activities are well-diversified by geography, investor segment, instrument, currency, structure and maturity. We maintain an ongoing presence in different funding markets, which allows us to continuously monitor market developments and trends, identify opportunities and risks, and take appropriate and timely actions. We operate long-term debt issuance registered programs. The following table summarizes these programs with their authorized limits by geography.
Programs by geography |
Canada | U.S. | Europe/Asia | ||
• Canadian Shelf Program – $25 billion | • U.S. Shelf Program – US$50 billion | • European Debt Issuance Program – US$40 billion | ||
• Global Covered Bond Program – € 60 billion | ||||
• Japanese Issuance Programs – ¥1 trillion | ||||
We also raise long-term funding using Canadian Senior Notes, Canadian National Housing Act MBS, Canada Mortgage Bonds, credit card receivable-backed securities, Kangaroo Bonds (issued in the Australian domestic market by foreign firms) and Yankee Certificates of Deposit (issued in the U.S. domestic market by foreign firms). We continuously evaluate opportunities to expand into new markets and untapped investor segments since diversification expands our wholesale funding flexibility, minimizes funding concentration and dependency, and generally reduces financing costs. As presented in the following charts, our current long-term debt profile is well-diversified by both currency and product. Maintaining competitive credit ratings is also critical to cost-effective funding.
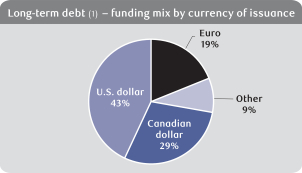 | 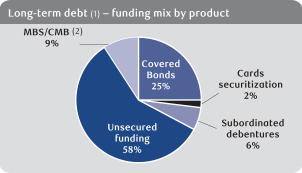 | |
(1) Includes unsecured and secured long-term funding and subordinated debentures with an original term to maturity greater than 1 year | (1) Includes unsecured and secured long-term funding and subordinated debentures with an original term to maturity greater than 1 year | |
(2) Mortgage-backed securities and Canada Mortgage Bonds |
34 Second Quarter 2022
Royal Bank of Canada
The following table provides our composition of wholesale funding based on remaining term to maturity:
Composition of wholesale funding
(1)
As at April 30, 2022 | ||||||||||||||||||||||||||||||||
| (Millions of Canadian dollars) | Less than 1 month | 1 to 3 months | 3 to 6 months | 6 to 12 months | Less than 1 year sub-total | 1 year to 2 years | 2 years and greater | Total | ||||||||||||||||||||||||
Deposits from banks (2) | $ | 5,923 | $ | 8 | $ | 90 | $ | 344 | $ | 6,365 | $ | – | $ | – | $ | 6,365 | ||||||||||||||||
Certificates of deposit and commercial paper | 7,321 | 19,306 | 29,054 | 24,362 | 80,043 | 771 | – | 80,814 | ||||||||||||||||||||||||
Asset-backed commercial paper (3) | 3,167 | 3,400 | 4,422 | 1,152 | 12,141 | – | – | 12,141 | ||||||||||||||||||||||||
Senior unsecured medium-term notes (4) | 38 | 68 | 2,465 | 8,510 | 11,081 | 15,483 | 46,795 | 73,359 | ||||||||||||||||||||||||
Senior unsecured structured notes (5) | 165 | 396 | 319 | 1,617 | 2,497 | 2,781 | 8,035 | 13,313 | ||||||||||||||||||||||||
Mortgage securitization | – | 482 | 432 | 1,662 | 2,576 | 3,516 | 9,935 | 16,027 | ||||||||||||||||||||||||
Covered bonds/asset-backed securities (6) | – | 3,280 | 1,928 | 3,093 | 8,301 | 5,796 | 32,679 | 46,776 | ||||||||||||||||||||||||
Subordinated liabilities | – | 194 | – | 57 | 251 | 110 | 10,333 | 10,694 | ||||||||||||||||||||||||
Other (7) | 6,416 | 1,295 | 617 | 3,093 | 11,421 | 10,353 | 436 | 22,210 | ||||||||||||||||||||||||
Total | $ | 23,030 | $ | 28,429 | $ | 39,327 | $ | 43,890 | $ | 134,676 | $ | 38,810 | $ | 108,213 | $ | 281,699 | ||||||||||||||||
Of which: | ||||||||||||||||||||||||||||||||
– Secured | $ | 9,047 | $ | 7,409 | $ | 7,008 | $ | 5,907 | $ | 29,371 | $ | 9,312 | $ | 43,030 | $ | 81,713 | ||||||||||||||||
– Unsecured | 13,983 | 21,020 | 32,319 | 37,983 | 105,305 | 29,498 | 65,183 | 199,986 | ||||||||||||||||||||||||
| As at January 31, 2022 | ||||||||||||||||||||||||||||||||
| (Millions of Canadian dollars) | Less than 1 month | 1 to 3 months | 3 to 6 months | 6 to 12 months | Less than 1 year sub-total | 1 year to 2 years | 2 years and greater | Total | ||||||||||||||||||||||||
Deposits from banks (2) | $ | 7,487 | $ | 69 | $ | – | $ | 51 | $ | 7,607 | $ | – | $ | – | $ | 7,607 | ||||||||||||||||
Certificates of deposit and commercial paper | 12,238 | 15,408 | 22,873 | 26,854 | 77,373 | – | – | 77,373 | ||||||||||||||||||||||||
Asset-backed commercial paper (3) | 3,114 | 2,909 | 3,930 | 2,616 | 12,569 | – | – | 12,569 | ||||||||||||||||||||||||
Senior unsecured medium-term notes (4) | 2,297 | 6,777 | 83 | 8,123 | 17,280 | 17,088 | 38,172 | 72,540 | ||||||||||||||||||||||||
Senior unsecured structured notes (5) | 622 | 327 | 369 | 613 | 1,931 | 3,189 | 7,224 | 12,344 | ||||||||||||||||||||||||
Mortgage securitization | – | 1,300 | 482 | 1,673 | 3,455 | 3,538 | 9,842 | 16,835 | ||||||||||||||||||||||||
Covered bonds/asset-backed securities (6) | – | 508 | 3,345 | 3,018 | 6,871 | 7,426 | 28,029 | 42,326 | ||||||||||||||||||||||||
Subordinated liabilities | – | – | 192 | 56 | 248 | 110 | 10,292 | 10,650 | ||||||||||||||||||||||||
Other (7) | 7,580 | 1,032 | 1,052 | 1,353 | 11,017 | 8,977 | 491 | 20,485 | ||||||||||||||||||||||||
Total | $ | 33,338 | $ | 28,330 | $ | 32,326 | $ | 44,357 | $ | 138,351 | $ | 40,328 | $ | 94,050 | $ | 272,729 | ||||||||||||||||
Of which: | ||||||||||||||||||||||||||||||||
– Secured | $ | 9,553 | $ | 4,901 | $ | 8,083 | $ | 7,307 | $ | 29,844 | $ | 10,964 | $ | 38,342 | $ | 79,150 | ||||||||||||||||
– Unsecured | 23,785 | 23,429 | 24,243 | 37,050 | 108,507 | 29,364 | 55,708 | 193,579 | ||||||||||||||||||||||||
| (1) | Excludes bankers’ acceptances and repos. |
| (2) | Excludes deposits associated with services we provide to banks (e.g., custody, cash management). |
| (3) | Only includes consolidated liabilities, including our collateralized commercial paper program. |
| (4) | Includes deposit notes. |
| (5) | Includes notes where the payout is tied to movements in foreign exchange, commodities and equities. |
| (6) | Includes credit card and mortgage loans. |
| (7) | Includes tender option bonds (secured) of $6,771 million (January 31, 2022 – $7,419 million), bearer deposit notes (unsecured) of $4,174 million (January 31, 2022 – $3,235 million), other long-term structured deposits (unsecured) of $11,265 million (January 31, 2022 – $9,831 million). |
Royal Bank of Canada
Credit ratings
Our ability to access unsecured funding markets and to engage in certain collateralized business activities on a cost-effective basis are primarily dependent upon maintaining competitive credit ratings. Credit ratings and outlooks provided by rating agencies reflect their views and methodologies. Ratings are subject to change, based on a number of factors including, but not limited to, our financial strength, competitive position, liquidity and other factors not completely within our control.
Other than as noted below, there have been no changes to our major credit ratings as disclosed in our 2021 Annual Report.
Credit ratings
(1)
As at May 25, 2022 | ||||||||||||||||
Short-term debt | Legacy senior long-term debt | Senior long- term debt | Outlook | |||||||||||||
Moody’s (4) | P-1 | Aa1 | A1 | stable | ||||||||||||
Standard & Poor’s (5) | A-1+ | AA- | A | stable | ||||||||||||
Fitch Ratings (6) | F1+ | AA | AA- | stable | ||||||||||||
DBRS (7) | R-1 (high) | AA (high) | AA | stable | ||||||||||||
| (1) | Credit ratings are not recommendations to purchase, sell or hold a financial obligation inasmuch as they do not comment on market price or suitability for a particular investor. Ratings are determined by the rating agencies based on criteria established from time to time by them, and are subject to revision or withdrawal at any time by the rating organization. |
| (2) | Includes senior long-term debt issued prior to September 23, 2018 and senior long-term debt issued on or after September 23, 2018 which is excluded from the Bail-in regime. |
| (3) | Includes senior long-term debt issued on or after September 23, 2018 which is subject to conversion under the Bail-in regime. |
| (4) | On January 27, 2022, Moody’s upgraded our long-term debt ratings and assessments, as well as affirmed our short-term debt ratings. Following this rating action, our outlook is stable. This rating action concludes the review for upgrade initiated by Moody’s on October 7, 2021. |
| (5) | On May 13, 2022, Standard & Poor’s affirmed our ratings with a stable outlook. |
| (6) | On July 15, 2021, Fitch Ratings downgraded our legacy senior long-term debt rating to AA from AA+ and our senior long-term debt rating to AA- from AA and revised our ratings outlook to stable from negative. |
| (7) | On May 13, 2022, DBRS affirmed our ratings with a stable outlook. |
Additional contractual obligations for rating downgrades
We are required to deliver collateral to certain counterparties in the event of a downgrade to our current credit rating. The following table provides the additional collateral obligations required at the reporting date in the event of aThere is no outstanding senior debt issued in the market that contains rating triggers that would lead to early prepayment of principal.
one-,
two-
or three-notch downgrade to our credit ratings. These additional collateral obligations are incremental requirements for each successive downgrade and do not represent the cumulative impact of multiple downgrades. The amounts reported change periodically as a result of several factors, including the transfer of trading activity to centrally cleared financial market infrastructures and exchanges, the expiration of transactions with downgrade triggers, the imposition of internal limitations on new agreements to exclude downgrade triggers, as well as normal coursemark-to-market.
| As at | ||||||||||||||||||||||||||
April 30 2022 | January 31 2022 | |||||||||||||||||||||||||
| (Millions of Canadian dollars) | One-notch downgrade | Two-notch downgrade | Three-notch downgrade | One-notch downgrade | Two-notch downgrade | Three-notch downgrade | ||||||||||||||||||||
Contractual derivatives funding or margin requirements | $ | 101 | $ | 148 | $ | 181 | $ | 158 | $ | 76 | $ | 136 | ||||||||||||||
Other contractual funding or margin requirements (1) | 164 | 14 | 23 | 169 | 17 | 14 | ||||||||||||||||||||
| (1) | Includes Guaranteed Investment Certificates (GICs) issued by our municipal markets business out of New York. |
36 Second Quarter 2022
Royal Bank of Canada
Liquidity Coverage Ratio (LCR)
The LCR is a Basel III metric that measures the sufficiency of high-quality liquid assets available to meet liquidity needs over a
30-day
period in an acute stress scenario. The Basel Committee on Banking Supervision (BCBS) and OSFI regulatory minimum coverage level for LCR is 100%.OSFI requires Canadian banks to disclose the LCR using the standard Basel disclosure template and calculated using the average of daily LCR positions during the quarter.
Liquidity coverage ratio common disclosure template
(1)
| For the three months ended | ||||||||
April 30 2022 | ||||||||
| (Millions of Canadian dollars, except percentage amounts) | Total unweighted value (average) | Total weighted value (average) | ||||||
High-quality liquid assets | ||||||||
Total high-quality liquid assets (HQLA) | $ | 362,827 | ||||||
Cash outflows | ||||||||
Retail deposits and deposits from small business customers, of which: | $ | 382,297 | $ | 35,946 | ||||
Stable deposits (3) | 131,261 | 3,938 | ||||||
Less stable deposits | 251,036 | 32,008 | ||||||
Unsecured wholesale funding, of which: | 449,829 | 214,638 | ||||||
Operational deposits (all counterparties) and deposits in networks of cooperative banks (4) | 190,938 | 45,356 | ||||||
Non-operational deposits | 227,014 | 137,405 | ||||||
Unsecured debt | 31,877 | 31,877 | ||||||
Secured wholesale funding | 31,497 | |||||||
Additional requirements, of which: | 293,324 | 69,847 | ||||||
Outflows related to derivative exposures and other collateral requirements | 55,689 | 19,468 | ||||||
Outflows related to loss of funding on debt products | 9,284 | 9,284 | ||||||
Credit and liquidity facilities | 228,351 | 41,095 | ||||||
Other contractual funding obligations (5) | 27,352 | 27,352 | ||||||
Other contingent funding obligations (6) | 671,446 | 10,832 | ||||||
Total cash outflows | $ | 390,112 | ||||||
Cash inflows | ||||||||
Secured lending (e.g., reverse repos) | $ | 289,024 | $ | 47,749 | ||||
Inflows from fully performing exposures | 15,913 | 10,000 | ||||||
Other cash inflows | 33,233 | 33,233 | ||||||
Total cash inflows | $ | 90,982 | ||||||
Total adjusted value | ||||||||
Total HQLA | $ | 362,827 | ||||||
Total net cash outflows | 299,130 | |||||||
Liquidity coverage ratio | 121% | |||||||
January 31 2022 | ||||||||
| (Millions of Canadian dollars, except percentage amounts) | Total adjusted value | |||||||
Total HQLA | $ | 366,789 | ||||||
Total net cash outflows | 296,383 | |||||||
Liquidity coverage ratio | 124% | |||||||
| (1) | The LCR is calculated in accordance with OSFI’s LAR guideline, which, in turn, reflects liquidity-related requirements issued by the BCBS. The LCR for the quarter ended April 30, 2022 is calculated as an average of 62 daily positions. |
| (2) | With the exception of other contingent funding obligations, unweighted inflow and outflow amounts are items maturing or callable in 30 days or less. Other contingent funding obligations also include debt securities with remaining maturity greater than 30 days. |
| (3) | As defined by the BCBS, stable deposits from retail and small business customers are deposits that are insured and are either held in transactional accounts or the bank has an established relationship with the client making the withdrawal unlikely. |
| (4) | Operational deposits from customers other than retail and small and medium-sized enterprises, are deposits which clients need to keep with the bank in order to facilitate their access and ability to use payment and settlement systems primarily for clearing, custody and cash management activities. |
| (5) | Other contractual funding obligations primarily include outflows from unsettled securities trades and outflows from obligations related to securities sold short. |
| (6) | Other contingent funding obligations include outflows related to other off-balance sheet facilities that carry low LCR runoff factors (0% – 5%). |
Royal Bank of Canada
We manage our LCR position within a target range that reflects our liquidity risk tolerance and takes into account business mix, asset composition and funding capabilities. The range is subject to periodic review in light of changes to internal requirements and external developments.
We maintain HQLAs in major currencies with dependable market depth and breadth. Our treasury management practices ensure that the levels of HQLA are actively managed to meet target LCR objectives. Our Level 1 assets, as calculated according to OSFI LAR and the BCBS LCR requirements, represent 88% of total HQLA. These assets consist of cash, placements with central banks and highly rated securities issued or guaranteed by governments, central banks and supranational entities.
LCR captures cash flows from
on-
andoff-balance
sheet activities that are either expected or could potentially occur within 30 days in an acute stress scenario. Cash outflows result from the application of withdrawal andnon-renewal
factors to demand and term deposits, differentiated by client type (wholesale, retail and small- andmedium-sized
enterprises). Cash outflows also arise from business activities that create contingent funding and collateral requirements, such as repo funding, derivatives, short sales of securities and the extension of credit and liquidity commitments to clients. Cash inflows arise primarily from maturing secured loans, interbank loans andnon-HQLA
securities.LCR does not reflect any market funding capacity that we believe would be available in a stress situation. All maturing wholesale debt is assigned 100% outflow in the LCR calculation.
Q2 2022 vs. Q1 2022
The average LCR for the quarter ended April 30, 2022 was 121%, which translates into a surplus of approximately $64 billion, compared to 124% and a surplus of approximately $70 billion in the prior quarter. LCR has moderately declined compared to the prior quarter mainly reflecting growth in retail and wholesale loans that was largely offset by increases in client deposits and issuance of term funding.
Net Stable Funding Ratio (NSFR)
NSFR is a Basel III metric that measures the sufficiency of available stable funding relative to the amount of required stable funding. The BCBS and OSFI regulatory minimum coverage level for NSFR is 100%.
Available stable funding is defined as the portion of capital and liabilities expected to be reliable over the time horizon considered by the NSFR, which extends to one year. Required stable funding is a function of the liquidity characteristics and residual maturities of the various assets held by the bank as well as those of its
off-balance
sheet exposures.OSFI requires Canadian
D-SIBs
to disclose the NSFR using the standard Basel disclosure template. Amounts presented in this disclosure template are determined in accordance with the requirements of OSFI’s LAR guideline and are not necessarily aligned with the classification requirements prescribed under IFRS.38 Second Quarter 2022
Royal Bank of Canada
Net Stable Funding Ratio common disclosure template
(1)
As at April 30, 2022 | ||||||||||||||||||||
Unweighted value by residual maturity | ||||||||||||||||||||
| (Millions of Canadian dollars, except percentage amounts) | No maturity | < 6 months | 6 months to < 1 year | ≥ 1 year | Weighted value | |||||||||||||||
Available Stable Funding (ASF) Item | ||||||||||||||||||||
Capital: | $ | 104,293 | $ | – | $ | – | $ | 9,526 | $ | 113,819 | ||||||||||
Regulatory Capital | 104,293 | – | – | 9,526 | 113,819 | |||||||||||||||
Other Capital Instruments | – | – | – | – | – | |||||||||||||||
Retail deposits and deposits from small business customers: | 352,267 | 58,827 | 22,276 | 22,933 | 421,221 | |||||||||||||||
Stable deposits (3) | 112,511 | 29,821 | 12,598 | 10,280 | 157,463 | |||||||||||||||
Less stable deposits | 239,756 | 29,006 | 9,678 | 12,653 | 263,758 | |||||||||||||||
Wholesale funding: | 319,734 | 428,139 | 44,749 | 112,909 | 317,608 | |||||||||||||||
Operational deposits (4) | 195,531 | – | – | – | 97,766 | |||||||||||||||
Other wholesale funding | 124,203 | 428,139 | 44,749 | 112,909 | 219,842 | |||||||||||||||
Liabilities with matching interdependent assets (5) | – | 1,811 | 3,322 | 24,181 | – | |||||||||||||||
Other liabilities: | 42,178 | 229,626 | 13,437 | |||||||||||||||||
NSFR derivative liabilities | 26,339 | |||||||||||||||||||
All other liabilities and equity not included in the above categories | 42,178 | 189,684 | 332 | 13,271 | 13,437 | |||||||||||||||
Total ASF | $ | 866,085 | ||||||||||||||||||
Required Stable Funding (RSF) Item | ||||||||||||||||||||
Total NSFR high-quality liquid assets (HQLA) | $ | 38,359 | ||||||||||||||||||
Deposits held at other financial institutions for operational purposes | – | 1,531 | – | – | 766 | |||||||||||||||
Performing loans and securities: | 188,789 | 285,502 | 98,260 | 472,324 | 621,246 | |||||||||||||||
Performing loans to financial institutions secured by Level 1 HQLA | – | 119,825 | 17,455 | 412 | 15,981 | |||||||||||||||
Performing loans to financial institutions secured by non-Level 1 HQLA and unsecured performing loans tofinancial institutions | 4,446 | 77,950 | 29,310 | 23,487 | 51,285 | |||||||||||||||
Performing loans to non-financial corporate clients, loans to retail and small business customers, and loans to sovereigns, central banks and PSEs, of which: | 115,760 | 66,259 | 31,112 | 138,577 | 262,895 | |||||||||||||||
With a risk weight of less than or equal to 35% under the Basel II standardized approach for credit risk | – | 997 | 624 | 2,767 | 2,609 | |||||||||||||||
Performing residential mortgages, of which: | 37,885 | 20,957 | 19,830 | 287,190 | 245,207 | |||||||||||||||
With a risk weight of less than or equal to 35% under the Basel II standardized approach for credit risk | 37,885 | 20,929 | 19,803 | 286,122 | 244,271 | |||||||||||||||
Securities that are not in default and do not qualify as HQLA, including exchange-traded equities | 30,698 | 511 | 553 | 22,658 | 45,878 | |||||||||||||||
Assets with matching interdependent liabilities (5) | – | 1,811 | 3,322 | 24,181 | – | |||||||||||||||
Other assets: | 2,612 | 313,878 | 83,403 | |||||||||||||||||
Physical traded commodities, including gold | 2,612 | 2,220 | ||||||||||||||||||
Assets posted as initial margin for derivative contracts and contributions to default funds of CCPs | 23,492 | 19,968 | ||||||||||||||||||
NSFR derivative assets | 29,013 | 2,674 | ||||||||||||||||||
NSFR derivative liabilities before deduction of variation margin posted | 56,323 | 2,816 | ||||||||||||||||||
All other assets not included in the above categories | – | 151,533 | 252 | 53,265 | 55,725 | |||||||||||||||
Off-balance sheet items | 673,181 | 24,836 | ||||||||||||||||||
Total RSF | $ | 768,610 | ||||||||||||||||||
Net Stable Funding Ratio (%) | 113% | |||||||||||||||||||
| As at January 31, 2022 | ||||||||||||||||||||
| (Millions of Canadian dollars, except percentage amounts) | Weighted value | |||||||||||||||||||
Total ASF | $ | 846,859 | ||||||||||||||||||
Total RSF | 749,310 | |||||||||||||||||||
Net Stable Funding Ratio (%) | 113% | |||||||||||||||||||
| (1) | The NSFR is calculated in accordance with OSFI’s LAR guideline, which, in turn, reflects liquidity-related requirements issued by the BCBS. |
| (2) | Totals for the following rows encompass the residual maturity categories of less than 6 months, 6 months to less than 1 year, and greater than or equal to 1 year in accordance with the requirements of the common disclosure template prescribed by OSFI: Other liabilities, NSFR derivative liabilities, Other assets, Assets posted as initial margin for derivative contracts and contributions to default funds of central counterparties (CCPs), NSFR derivative assets, NSFR derivative liabilities before deduction of variation margin posted, and Off-balance sheet items. |
| (3) | As defined by the BCBS, stable deposits from retail and small business customers are deposits that are insured and are either held in transactional accounts or the bank has an established relationship with the client making the withdrawal unlikely. |
| (4) | Operational deposits from customers other than retail and small and medium-sized enterprises, are deposits which clients need to keep with the bank in order to facilitate their access and ability to use payment and settlement systems primarily for clearing, custody and cash management activities. |
| (5) | Interdependent assets and liabilities represent National Housing Act Mortgage-Backed Securities (NHA MBS) liabilities, including liabilities arising from transactions involving the Canada Mortgage Bond program and their corresponding encumbered mortgages. |
Royal Bank of Canada
Available stable funding is comprised primarily of a diversified pool of personal and commercial deposits, capital, as well as long-term wholesale liabilities. Required stable funding is driven mainly by the bank’s mortgage and loan portfolio, secured loans to financial institutions and to a lesser extent by other less liquid assets. NSFR does not reflect any unused market funding capacity that we believe is available to the bank.
Volume and composition of available stable funding is actively managed to optimize our structural funding position and meet NSFR objectives. Our NSFR is managed in accordance with our comprehensive LRMF.
Q2 2022 vs. Q1 2022
The NSFR as at April 30, 2022 was 113%, which translates into a surplus of approximately $97 billion, compared to 113% and a surplus of approximately $98 billion in the prior quarter. NSFR remained flat compared to the prior quarter as growth in retail and wholesale loans was offset by increases in client deposits, issuance of term funding as well as changes in the composition of our securities portfolios.
Contractual maturities of financial assets, financial liabilities and
off-balance
sheet itemsThe following tables provide remaining contractual maturity profiles of all our assets, liabilities, and
off-balance
sheet items at their carrying value (e.g., amortized cost or fair value) at the balance sheet date.Off-balance
sheet items are allocated based on the expiry date of the contract.Details of contractual maturities and commitments to extend funds are a source of information for the management of liquidity risk. Among other purposes, these details form a basis for modelling a behavioural balance sheet with effective maturities to calculate liquidity risk measures. For further details, refer to the Risk measurement section within the Liquidity and funding risk section of our 2021 Annual Report.
As at April 30, 2022 | ||||||||||||||||||||||||||||||||||||||||
| (Millions of Canadian dollars) | Less than 1 month | 1 to 3 months | 3 to 6 months | 6 to 9 months | 9 to 12 months | 1 year to 2 years | 2 years to 5 years | 5 years and greater | With no specific maturity | Total | ||||||||||||||||||||||||||||||
Assets | ||||||||||||||||||||||||||||||||||||||||
Cash and deposits with banks | $ | 182,555 | $ | 1 | $ | – | $ | 10 | $ | – | $ | – | $ | – | $ | – | $ | 2,192 | $ | 184,758 | ||||||||||||||||||||
Securities | ||||||||||||||||||||||||||||||||||||||||
Trading (1) | 75,935 | 594 | 102 | 18 | 18 | 50 | 205 | 9,119 | 57,725 | 143,766 | ||||||||||||||||||||||||||||||
Investment, net of applicable allowance | 1,736 | 8,339 | 5,535 | 5,543 | 9,497 | 15,256 | 36,216 | 71,854 | 573 | 154,549 | ||||||||||||||||||||||||||||||
Assets purchased under reverse repurchase agreements and securities borrowed (2) | 143,064 | 78,531 | 43,186 | 15,378 | 16,937 | 935 | – | – | 18,667 | 316,698 | ||||||||||||||||||||||||||||||
Loans, net of applicable allowance | 31,177 | 21,822 | 26,059 | 28,668 | 29,276 | 145,911 | 338,180 | 67,381 | 85,990 | 774,464 | ||||||||||||||||||||||||||||||
Other | ||||||||||||||||||||||||||||||||||||||||
Customers’ liability under acceptances | 9,541 | 7,022 | – | 2 | 5 | – | – | – | (41 | ) | 16,529 | |||||||||||||||||||||||||||||
Derivatives | 17,191 | 16,374 | 8,931 | 11,857 | 6,573 | 17,265 | 33,768 | 44,235 | 10 | 156,204 | ||||||||||||||||||||||||||||||
Other financial assets | 44,463 | 1,986 | 1,172 | 197 | 482 | 222 | 204 | 2,113 | 3,204 | 54,043 | ||||||||||||||||||||||||||||||
Total financial assets | 505,662 | 134,669 | 84,985 | 61,673 | 62,788 | 179,639 | 408,573 | 194,702 | 168,320 | 1,801,011 | ||||||||||||||||||||||||||||||
Other non-financial assets | 6,929 | 1,601 | 402 | (183 | ) | 542 | 2,133 | 2,296 | 5,391 | 28,450 | 47,561 | |||||||||||||||||||||||||||||
Total assets | $ | 512,591 | $ | 136,270 | $ | 85,387 | $ | 61,490 | $ | 63,330 | $ | 181,772 | $ | 410,869 | $ | 200,093 | $ | 196,770 | $ | 1,848,572 | ||||||||||||||||||||
Liabilities and equity | ||||||||||||||||||||||||||||||||||||||||
Deposits (3) | ||||||||||||||||||||||||||||||||||||||||
Unsecured borrowing | $ | 89,041 | $ | 47,195 | $ | 51,344 | $ | 42,657 | $ | 52,637 | $ | 31,955 | $ | 54,428 | $ | 18,741 | $ | 670,475 | $ | 1,058,473 | ||||||||||||||||||||
Secured borrowing | 4,561 | 5,282 | 6,165 | 3,703 | 950 | 8,771 | 15,786 | 6,730 | – | 51,948 | ||||||||||||||||||||||||||||||
Covered bonds | – | 2,608 | 1,927 | 1,050 | 2,041 | 4,370 | 24,298 | 4,882 | – | 41,176 | ||||||||||||||||||||||||||||||
Other | ||||||||||||||||||||||||||||||||||||||||
Acceptances | 9,541 | 7,021 | – | 2 | 5 | – | – | – | 1 | 16,570 | ||||||||||||||||||||||||||||||
Obligations related to securities sold short | 39,464 | – | – | – | – | – | – | – | – | 39,464 | ||||||||||||||||||||||||||||||
Obligations related to assets sold under repurchase agreements and securities loaned (2) | 224,827 | 33,129 | 1,856 | 129 | 381 | 932 | – | – | 18,084 | 279,338 | ||||||||||||||||||||||||||||||
Derivatives | 16,413 | 18,114 | 8,439 | 9,674 | 6,231 | 17,192 | 32,923 | 42,555 | – | 151,541 | ||||||||||||||||||||||||||||||
Other financial liabilities | 44,766 | 1,042 | 1,708 | 425 | 602 | 857 | 2,385 | 11,913 | 1,033 | 64,731 | ||||||||||||||||||||||||||||||
Subordinated debentures | – | 194 | – | – | – | 110 | 1,847 | 8,125 | – | 10,276 | ||||||||||||||||||||||||||||||
Total financial liabilities | 428,613 | 114,585 | 71,439 | 57,640 | 62,847 | 64,187 | 131,667 | 92,946 | 689,593 | 1,713,517 | ||||||||||||||||||||||||||||||
Other non-financial liabilities | 1,075 | 1,042 | 185 | 4,071 | 264 | 1,010 | 923 | 12,610 | 9,470 | 30,650 | ||||||||||||||||||||||||||||||
Equity | – | – | – | – | – | – | – | – | 104,405 | 104,405 | ||||||||||||||||||||||||||||||
Total liabilities and equity | $ | 429,688 | $ | 115,627 | $ | 71,624 | $ | 61,711 | $ | 63,111 | $ | 65,197 | $ | 132,590 | $ | 105,556 | $ | 803,468 | $ | 1,848,572 | ||||||||||||||||||||
Off-balance sheet items | ||||||||||||||||||||||||||||||||||||||||
Financial guarantees | $ | 594 | $ | 2,250 | $ | 2,433 | $ | 2,864 | $ | 3,523 | $ | 1,778 | $ | 4,357 | $ | 879 | $ | 33 | $ | 18,711 | ||||||||||||||||||||
Commitments to extend credit | 5,454 | 8,622 | 8,922 | 14,748 | 19,057 | 48,839 | 175,832 | 18,664 | 3,930 | 304,068 | ||||||||||||||||||||||||||||||
Other credit-related commitments | 2,083 | 1,056 | 1,353 | 1,602 | 1,722 | 250 | 736 | 36 | 102,046 | 110,884 | ||||||||||||||||||||||||||||||
Other commitments | 32 | 15 | 17 | 26 | 17 | 71 | 148 | 214 | 658 | 1,198 | ||||||||||||||||||||||||||||||
Total off-balance sheet items | $ | 8,163 | $ | 11,943 | $ | 12,725 | $ | 19,240 | $ | 24,319 | $ | 50,938 | $ | 181,073 | $ | 19,793 | $ | 106,667 | $ | 434,861 | ||||||||||||||||||||
| (1) | Trading debt securities classified as FVTPL have been included in the less than 1 month category as there is no expectation to hold these assets to their contractual maturity. |
| (2) | Open reverse repo and repo contracts, which have no set maturity date and are typically short term, have been included in the with no specific maturity category. |
| (3) | A major portion of relationship-based deposits are repayable on demand or at short notice on a contractual basis while, in practice, these customer balances form a core base for our operations and liquidity needs, as explained in the preceding Deposit and funding profile section. |
40 Second Quarter 2022
Royal Bank of Canada
| As at January 31, 2022 | ||||||||||||||||||||||||||||||||||||||||
| (Millions of Canadian dollars) | Less than 1 month | 1 to 3 months | 3 to 6 months | 6 to 9 months | 9 to 12 months | 1 year to 2 years | 2 years to 5 years | 5 years and greater | With no specific maturity | Total | ||||||||||||||||||||||||||||||
Assets | ||||||||||||||||||||||||||||||||||||||||
Cash and deposits with banks | $ | 192,271 | $ | 2 | $ | – | $ | – | $ | 10 | $ | – | $ | – | $ | – | $ | 2,300 | $ | 194,583 | ||||||||||||||||||||
Securities | ||||||||||||||||||||||||||||||||||||||||
Trading (1) | 67,761 | 2,519 | 848 | 6 | 8 | 32 | 174 | 10,197 | 67,980 | 149,525 | ||||||||||||||||||||||||||||||
Investment, net of applicable allowance | 3,059 | 8,821 | 5,807 | 6,364 | 6,901 | 19,393 | 33,100 | 69,576 | 549 | 153,570 | ||||||||||||||||||||||||||||||
Assets purchased under reverse repurchase agreements and securities borrowed (2) | 122,904 | 92,846 | 29,606 | 27,554 | 12,936 | 776 | – | – | 25,504 | 312,126 | ||||||||||||||||||||||||||||||
Loans, net of applicable allowance | 33,606 | 19,223 | 29,413 | 27,831 | 29,737 | 140,174 | 312,950 | 64,557 | 82,540 | 740,031 | ||||||||||||||||||||||||||||||
Other | ||||||||||||||||||||||||||||||||||||||||
Customers’ liability under acceptances | 13,672 | 5,280 | – | – | 2 | 5 | – | – | (83 | ) | 18,876 | |||||||||||||||||||||||||||||
Derivatives | 6,098 | 7,379 | 5,099 | 3,262 | 6,205 | 8,813 | 17,098 | 38,353 | 12 | 92,319 | ||||||||||||||||||||||||||||||
Other financial assets | 35,028 | 1,704 | 959 | 171 | 129 | 266 | 279 | 2,103 | 3,447 | 44,086 | ||||||||||||||||||||||||||||||
Total financial assets | 474,399 | 137,774 | 71,732 | 65,188 | 55,928 | 169,459 | 363,601 | 184,786 | 182,249 | 1,705,116 | ||||||||||||||||||||||||||||||
Other non-financial assets | 6,821 | 1,612 | 267 | 256 | 552 | 2,380 | 2,314 | 5,865 | 27,286 | 47,353 | ||||||||||||||||||||||||||||||
Total assets | $ | 481,220 | $ | 139,386 | $ | 71,999 | $ | 65,444 | $ | 56,480 | $ | 171,839 | $ | 365,915 | $ | 190,651 | $ | 209,535 | $ | 1,752,469 | ||||||||||||||||||||
Liabilities and equity | ||||||||||||||||||||||||||||||||||||||||
Deposits (3) | ||||||||||||||||||||||||||||||||||||||||
Unsecured borrowing | $ | 100,325 | $ | 53,231 | $ | 43,700 | $ | 36,878 | $ | 45,970 | $ | 30,950 | $ | 49,037 | $ | 16,702 | $ | 674,323 | $ | 1,051,116 | ||||||||||||||||||||
Secured borrowing | 2,342 | 7,803 | 6,410 | 3,908 | 2,783 | 7,991 | 15,257 | 6,174 | – | 52,668 | ||||||||||||||||||||||||||||||
Covered bonds | – | – | 2,686 | 1,918 | 1,111 | 6,687 | 17,949 | 8,707 | – | 39,058 | ||||||||||||||||||||||||||||||
Other | ||||||||||||||||||||||||||||||||||||||||
Acceptances | 13,663 | 5,280 | – | – | 2 | 5 | – | – | 9 | 18,959 | ||||||||||||||||||||||||||||||
Obligations related to securities sold short | 41,544 | – | – | – | – | – | – | – | – | 41,544 | ||||||||||||||||||||||||||||||
Obligations related to assets sold under repurchase agreements and securities loaned (2) | 189,351 | 43,348 | 6,404 | 1,347 | 2 | 676 | – | – | 23,881 | 265,009 | ||||||||||||||||||||||||||||||
Derivatives | 6,120 | 7,296 | 5,071 | 3,206 | 4,949 | 8,897 | 17,347 | 35,216 | – | 88,102 | ||||||||||||||||||||||||||||||
Other financial liabilities | 32,915 | 1,592 | 915 | 328 | 479 | 830 | 2,272 | 11,272 | 841 | 51,444 | ||||||||||||||||||||||||||||||
Subordinated debentures | – | – | 191 | – | – | 110 | 1,924 | 8,336 | – | 10,561 | ||||||||||||||||||||||||||||||
Total financial liabilities | 386,260 | 118,550 | 65,377 | 47,585 | 55,296 | 56,146 | 103,786 | 86,407 | 699,054 | 1,618,461 | ||||||||||||||||||||||||||||||
Other non-financial liabilities | 1,308 | 1,080 | 222 | 172 | 3,530 | 1,053 | 965 | 13,561 | 10,109 | 32,000 | ||||||||||||||||||||||||||||||
Equity | – | – | – | – | – | – | – | – | 102,008 | 102,008 | ||||||||||||||||||||||||||||||
Total liabilities and equity | $ | 387,568 | $ | 119,630 | $ | 65,599 | $ | 47,757 | $ | 58,826 | $ | 57,199 | $ | 104,751 | $ | 99,968 | $ | 811,171 | $ | 1,752,469 | ||||||||||||||||||||
Off-balance sheet items | ||||||||||||||||||||||||||||||||||||||||
Financial guarantees | $ | 1,072 | $ | 1,863 | $ | 2,739 | $ | 2,561 | $ | 2,735 | $ | 1,312 | $ | 3,972 | $ | 1,121 | $ | 29 | $ | 17,404 | ||||||||||||||||||||
Commitments to extend credit | 2,081 | 9,097 | 13,303 | 9,424 | 16,780 | 52,011 | 172,026 | 16,153 | 3,833 | 294,708 | ||||||||||||||||||||||||||||||
Other credit-related commitments | 970 | 1,102 | 1,473 | 1,386 | 1,576 | 323 | 698 | 36 | 99,991 | 107,555 | ||||||||||||||||||||||||||||||
Other commitments | 27 | 11 | 17 | 17 | 20 | 70 | 164 | 303 | 605 | 1,234 | ||||||||||||||||||||||||||||||
Total off-balance sheet items | $ | 4,150 | $ | 12,073 | $ | 17,532 | $ | 13,388 | $ | 21,111 | $ | 53,716 | $ | 176,860 | $ | 17,613 | $ | 104,458 | $ | 420,901 | ||||||||||||||||||||
| (1) | Trading debt securities classified as FVTPL have been included in the less than 1 month category as there is no expectation to hold these assets to their contractual maturity. |
| (2) | Open reverse repo and repo contracts, which have no set maturity date and are typically short term, have been included in the with no specific maturity category. |
| (3) | A major portion of relationship-based deposits are repayable on demand or at short notice on a contractual basis while, in practice, these customer balances form a core base for our operations and liquidity needs, as explained in the preceding Deposit and funding profile section. |
Royal Bank of Canada
Capital management |
We continue to manage our capital in accordance with our Capital Management Framework as described in our 2021 Annual Report. In addition, we continue to monitor for new regulatory capital developments, including OSFI guidance relating to the BCBS Basel III reforms and guidance issued in response to the
COVID-19
pandemic, in order to ensure timely and accurate compliance with these requirements as disclosed in the Capital management section in our 2021 Annual Report, as updated below.OSFI expects Canadian banks to meet the Basel III targets for CET1, Tier 1, and Total capital ratios. Under Basel III, banks select from two main approaches, the Standardized Approach (SA) or the Internal Ratings Based (IRB) Approach, to calculate their minimum regulatory capital required to support credit, market and operational risks.
The Financial Stability Board (FSB) has
re-designated
us as a Global Systemically Important Bank(G-SIB).
This designation requires us to maintain a higher loss absorbency requirement (common equity as a percentage of RWA) of 1% consistent with theD-SIB
requirement.Effective November 1, 2021, OSFI’s Total Loss Absorbing Capacity (TLAC) guideline establishes two minimum standards: the risk-based TLAC ratio, which builds on the risk-based capital ratios described in the CAR guideline, and the TLAC leverage ratio, which builds on the leverage ratio described in OSFI’s LR guideline. The TLAC requirement is intended to address the sufficiency of a
D-SIB’s
loss absorbing capacity in supporting its recapitalization in the event of its failure. TLAC is defined as the aggregate of Tier 1 capital, Tier 2 capital, and other TLAC instruments, which allow conversion in whole or in part into common shares under the CDIC Act and meet all of the eligibility criteria under the guideline.In Q2 2020, OSFI announced a series of regulatory adjustments and guidance to support the financial and operational resilience of the banking sector in response to the ongoing
COVID-19
pandemic and subsequently continued, as needed, to release guidance implementing, clarifying, updating or unwinding certain aspects or requirements. While some measures and guidance issued in response to theCOVID-19
pandemic have been unwound, certain measures and guidance continue to remain in place, such as:| • | Modifications for increases in expected credit loss provisions on CET1 capital by applying a 25% after-tax exclusion rate for growth in Stage 1 and Stage 2 allowances between Q1 2020 and the respective quarters of fiscal 2022. The exclusion rate was reduced to the current 25% in fiscal 2022 from 50% in fiscal 2021, and will cease to apply beginning in fiscal 2023. These modifications are not available for a financial institution’s IRB portfolio in any quarter in which the financial institution has a shortfall in allowances. |
| • | Exclusion of central bank reserves that qualify as HQLA from leverage ratio exposure amounts. |
| • | Reduction in the current regulatory capital floor for financial institutions using the IRB approach to 70% of RWA under the SA. The reduced floor factor will remain in place until the adoption of the Basel III reforms in Q2 2023. |
| • | Clarification of the applicable capital and leverage ratio treatment of certain government relief programs. |
For further details, refer to the Capital management section of our 2021 Annual Report. OSFI has assessed and will continue to assess the need for these measures. We have incorporated the effective adjustments and guidance, as applicable, into our results and in our ongoing capital planning activities.
The following table provides a summary of OSFI’s current regulatory target ratios under Basel III and Pillar 2 requirements. We are in compliance with all current capital, leverage and TLAC requirements imposed by OSFI:
Basel III capital, leverage and TLAC ratios | OSFI regulatory target requirements for large banks under Basel III | RBC capital, leverage and TLAC ratios as at April 30, 2022 | Domestic Stability Buffer (3) | Minimum including Capital Buffers, D-SIB/G-SIB surcharge and Domestic Stability Buffer as at April 30, 2022 | ||||||||||||||||||||||||||||
Minimum | Capital Buffers (1) | Minimum including Capital Buffers | D-SIB/G-SIB surcharge (2) | Minimum including Capital Buffers and D-SIB/G-SIB surcharge (2) | ||||||||||||||||||||||||||||
| Common Equity Tier 1 | 4.5% | 2.5% | 7.0% | 1.0% | 8.0% | 13.2% | 2.5% | 10.5% | ||||||||||||||||||||||||
| Tier 1 capital | 6.0% | 2.5% | 8.5% | 1.0% | 9.5% | 14.4% | 2.5% | 12.0% | ||||||||||||||||||||||||
| Total capital | 8.0% | 2.5% | 10.5% | 1.0% | 11.5% | 16.0% | 2.5% | 14.0% | ||||||||||||||||||||||||
| Leverage ratio | 3.0% | n.a. | 3.0% | n.a. | 3.0% | 4.7% | n.a. | 3.0% | ||||||||||||||||||||||||
| TLAC ratio (4) | 21.5% | n.a. | 21.5% | n.a. | 21.5% | 27.0% | 2.5% | 24.0% | ||||||||||||||||||||||||
| TLAC leverage ratio (4) | 6.75% | n.a. | 6.75% | n.a. | 6.75% | 8.7% | n.a. | 6.75% | ||||||||||||||||||||||||
| (1) | The capital buffers include the capital conservation buffer and the countercyclical capital buffer as prescribed by OSFI. |
| (2) | A capital surcharge, equal to the higher of our D-SIB surcharge and the BCBS’sG-SIB surcharge, is applicable to risk-weighted capital. |
| (3) | The Domestic Stability Buffer can range from 0% to 2.5% of total RWA and is currently set at 2.5%, reaffirmed by OSFI on December 10, 2021. |
| (4) | Effective November 1, 2021, OSFI requires D-SIBs to meet minimum risk-based TLAC ratio and TLAC leverage ratio requirements which are calculated using OSFI’s TLAC guideline. |
| n.a. | not applicable |
42 Second Quarter 2022
Royal Bank of Canada
The following table provides details on our regulatory capital and RWA, and on ratios for capital, leverage and TLAC. Our capital position remains strong and our capital, leverage and TLAC ratios remain well above OSFI regulatory targets.
| As at | ||||||||||||
| (Millions of Canadian dollars, except percentage amounts and as otherwise noted) | April 30 2022 | January 31 2022 | October 31 2021 | |||||||||
Capital (1) | ||||||||||||
CET1 capital | $ | 77,069 | $ | 77,080 | $ | 75,583 | ||||||
Tier 1 capital | 84,345 | 84,493 | 82,246 | |||||||||
Total capital | 93,871 | 94,502 | 92,026 | |||||||||
RWA used in calculation of capital ratios (1) | ||||||||||||
Credit risk | $ | 472,516 | $ | 452,697 | $ | 444,142 | ||||||
Market risk | 37,851 | 41,812 | 34,806 | |||||||||
Operational risk | 75,472 | 74,776 | 73,593 | |||||||||
Total RWA | $ | 585,839 | $ | 569,285 | $ | 552,541 | ||||||
Capital ratios and Leverage ratio (1) | ||||||||||||
CET1 ratio | 13.2% | 13.5% | 13.7% | |||||||||
Tier 1 capital ratio | 14.4% | 14.8% | 14.9% | |||||||||
Total capital ratio | 16.0% | 16.6% | 16.7% | |||||||||
Leverage ratio | 4.7% | 4.8% | 4.9% | |||||||||
Leverage ratio exposure (billions) | $ | 1,812 | $ | 1,761 | $ | 1,662 | ||||||
TLAC available and ratios (2) , (3) | ||||||||||||
TLAC available | $ | 158,140 | $ | 150,136 | n.a. | |||||||
TLAC ratio | 27.0% | 26.4% | n.a. | |||||||||
TLAC leverage ratio | 8.7% | 8.5% | n.a. | |||||||||
| (1) | Capital, RWA, and capital ratios are calculated using OSFI’s CAR guideline and the Leverage ratio is calculated using OSFI’s LR guideline as updated in accordance with the regulatory guidance issued by OSFI in response to the COVID-19 pandemic. Both the CAR guideline and LR guideline are based on the Basel III framework. |
| (2) | Effective November 1, 2021, OSFI requires D-SIBs to meet minimum risk-based TLAC ratio and TLAC leverage ratio requirements which are calculated using OSFI’s TLAC guideline. |
| (3) | The TLAC standard is applied at the resolution entity level which for us is deemed to be Royal Bank of Canada and its subsidiaries. A resolution entity and its subsidiaries are collectively called a resolution group. Both the TLAC ratio and TLAC leverage ratio are calculated using the TLAC available as percentage of total RWA and leverage exposure, respectively. |
| n.a. | not applicable |
Q2 2022 vs. Q1 2022
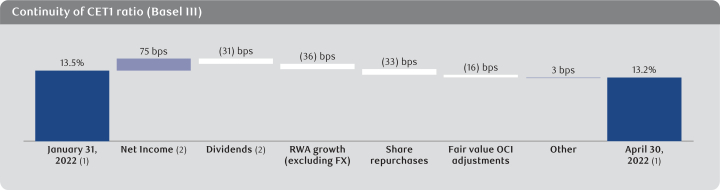
| (1) | Represents rounded figures. |
| (2) | Represents net internal capital generation of $2.5 billion or 44 bps consisting of Net income available to shareholders, less common and preferred share dividends and distributions on other equity instruments. |
Our CET1 ratio was 13.2%, down 30 bps from last quarter, mainly reflecting RWA growth (excluding FX), share repurchases and the unfavourable impact of fair value OCI adjustments, partially offset by net internal capital generation.
RWA increased by $17 billion, mainly reflecting business growth in wholesale lending, derivatives, residential mortgages, and market risk. These factors were partially offset by net model updates, mainly due to the impact of the Q2 2020 period of significant market volatility no longer being reflected in our two-year historical VaR period.
Our Tier 1 capital ratio of 14.4% was down 40 bps and our Total capital ratio of 16.0% was down 60 bps, mainly reflecting the factors noted above under the CET1 ratio.
Our Leverage ratio of 4.7% was down 10 bps, mainly due to business-driven growth in leverage exposures and share repurchases, partially offset by net internal capital generation.
Leverage exposures increased by $51 billion, mainly driven by business growth in wholesale loans and residential mortgages, undrawn commitments and derivatives.
Our TLAC ratio of 27.0% was up 60 bps, reflecting a favourable impact from the net issuance of other TLAC instruments, partially offset by the factors noted above under the Total capital ratio.
Our TLAC leverage ratio of 8.7% was up 20 bps, reflecting a favourable impact from the net issuance of other TLAC instruments, partially offset by the factors noted above under the Leverage ratio.
Other TLAC instruments include long-term debt subject to conversion under the Bail-in regime. For further details, refer to Deposit and funding profile in the Liquidity and funding risk section.
Royal Bank of Canada
Selected capital management activity
The following table provides our selected capital management activity:
For the three months ended April 30, 2022 | For the six months ended April 30, 2022 | |||||||||||||||||||
| (Millions of Canadian dollars, except number of shares) | Issuance or redemption date | Number of shares | Amount | Number of shares | Amount | |||||||||||||||
Tier 1 capital | ||||||||||||||||||||
Common shares activity | ||||||||||||||||||||
Issued in connection with share-based compensation plans (1) | 105 | $ | 8 | 512 | $ | 42 | ||||||||||||||
Purchased for cancellation (2) | (13,700 | ) | (171 | ) | (22,571 | ) | (282 | ) | ||||||||||||
Issuance of preferred shares, Series BT (2) ,(3) | November 5, 2021 | – | – | 750 | 750 | |||||||||||||||
Redemption of preferred shares, Series BJ (2) ,(3) | February 24, 2022 | (6,000 | ) | (150 | ) | (6,000 | ) | (150 | ) | |||||||||||
Tier 2 capital | ||||||||||||||||||||
Issuance of May 3, 2032 subordinated debentures (2) ,(3) | January 25, 2022 | $ | – | $ | 1,000 | |||||||||||||||
| (1) | Amounts include cash received for stock options exercised during the period and fair value adjustments to stock options. |
| (2) | For further details, refer to Note 10 of our Condensed Financial Statements. |
| (3) | Non-Viability Contingent Capital (NVCC) instruments. |
On December 6, 2021, we announced a normal course issuer bid (NCIB) to purchase up to 45 million of our common shares, commencing on December 8, 2021 and continuing until December 7, 2022, or such earlier date as we complete the repurchase of all shares permitted under the bid. For the three-months ended April 30, 2022, the total number of common shares repurchased and cancelled under our NCIB program was approximately 14 million. The total cost of the shares repurchased was $1,892 million. Since the inception of this NCIB, the total number of common shares repurchased and cancelled was approximately 23 million, at a cost of approximately $3,106 million.
We determine the amount and timing of purchases under the NCIB, subject to prior consultation with OSFI. Purchases may be made through the TSX, the NYSE and other designated exchanges and alternative Canadian trading systems. The price paid for repurchased shares is the prevailing market price at the time of acquisition.
On November 5, 2021, we issued 750 thousand of
Non-Cumulative
5-Year
Fixed Rate Reset First Preferred Shares Series BT to certain institutional investors at a price of $1,000 per share.On January 25, 2022, we issued $1,000 million of NVCC subordinated debentures. The notes bear interest at a fixed rate of 2.94% per annum until May 3, 2027, and at the three-month Canadian Dollar Offered Rate plus 0.76% thereafter until their maturity on May 3, 2032.
On February 24, 2022, we redeemed all 6 million of our issued and outstanding
Non-Cumulative
First Preferred Shares Series BJ at a price of $25.75 per share.44 Second Quarter 2022
Royal Bank of Canada
Selected share data
(1)
As at April 30, 2022 | ||||||||||||
(Millions of Canadian dollars, except number of shares and as otherwise noted) | Number of shares | Amount | Dividends declared per share | |||||||||
Common shares issued | 1,403,128 | $ | 17,488 | $ | 1.20 | |||||||
Treasury shares – common shares (2) | (1,328 | ) | (174 | ) | ||||||||
Common shares outstanding | 1,401,800 | $ | 17,314 | |||||||||
Stock options and awards | ||||||||||||
Outstanding | 8,310 | |||||||||||
Exercisable | 3,677 | |||||||||||
First preferred shares issued | ||||||||||||
Non-cumulative Series AZ(3) ,(4) | 20,000 | $ | 500 | $ | 0.23 | |||||||
Non-cumulative Series BB(3) ,(4) | 20,000 | 500 | 0.23 | |||||||||
Non-cumulative Series BD(3) ,(4) | 24,000 | 600 | 0.20 | |||||||||
Non-cumulative Series BF(3) ,(4) | 12,000 | 300 | 0.19 | |||||||||
Non-cumulative Series BH(4) | 6,000 | 150 | 0.31 | |||||||||
Non-cumulative Series BI(4) | 6,000 | 150 | 0.31 | |||||||||
Non-cumulative Series BO(3) ,(4) | 14,000 | 350 | 0.30 | |||||||||
Non-cumulative Series BT(3) ,(4) ,(5) | 750 | 750 | 4.20% | |||||||||
Non-cumulative SeriesC-2 (6) | 15 | 23 | US$ | 16.88 | ||||||||
Other equity instruments issued | ||||||||||||
Limited recourse capital notes Series 1 (3) ,(4) ,(7) ,(8) | 1,750 | 1,750 | 4.50% | |||||||||
Limited recourse capital notes Series 2 (3) ,(4) ,(7) ,(8) | 1,250 | 1,250 | 4.00% | |||||||||
Limited recourse capital notes Series 3 (3) ,(4) ,(7) ,(8) | 1,000 | 1,000 | 3.65% | |||||||||
Preferred shares and other equity instruments issued | 106,765 | 7,323 | ||||||||||
Treasury instruments – preferred shares and other equity instruments (2) | (38 | ) | (25 | ) | ||||||||
Preferred shares and other equity instruments outstanding | 106,727 | $ | 7,298 | |||||||||
Dividends on common shares | $ | 1,686 | ||||||||||
Dividends on preferred shares and distributions on other equity instruments (9) | 68 | |||||||||||
| (1) | For further details about our capital management activity, refer to Note 10 of our Condensed Financial Statements. |
| (2) | Positive amounts represent a short position and negative amounts represent a long position. |
| (3) | Dividend rate will reset every five years. |
| (4) | NVCC instruments. |
| (5) | The dividends declared per share represent per annum dividend rate applicable to the shares issued as at the reporting date. |
| (6) | Represents 615,400 depositary shares relating to preferred shares Series C-2. Each depositary share representsone-fortieth interest in a share of SeriesC-2. |
| (7) | For Limited Recourse Capital Notes (LRCN) Series, the number of shares represent the number of notes issued and the dividends declared per share represent the annual interest rate percentage applicable to the notes issued as at the reporting date. |
| (8) | In connection with the issuance of LRCN Series 1, on July 28, 2020, we issued $1,750 million of First Preferred Shares Series BQ (Series BQ); in connection with the issuance of LRCN Series 2, on November 2, 2020, we issued $1,250 million of First Preferred Shares Series BR (Series BR); and in connection with the issuance of LRCN Series 3, on June 8, 2021, we issued $1,000 million of First Preferred Shares Series BS (Series BS). The Series BQ, BR and BS preferred shares were issued at a price of $1,000 per share and were issued to a consolidated trust to be held as trust assets in connection with the LRCN structure. For further details, refer to Note 19 of our 2021 Annual Consolidated Financial Statements. |
| (9) | Excludes distributions to non-controlling interests. |
As at May 20, 2022, the number of outstanding common shares was 1,402,108,019, net of treasury shares held of 1,037,346, and the number of stock options and awards was 8,293,016.
NVCC provisions require the conversion of the capital instrument into a variable number of common shares in the event that OSFI deems a bank to be
non-viable
or a federal or provincial government in Canada publicly announces that a bank has accepted or agreed to accept a capital injection. If a NVCC trigger event were to occur, our NVCC capital instruments as at April 30, 2022, which were the preferred shares Series AZ, BB, BD, BF, BH, BI, BO, BT, LRCN Series 1, LRCN Series 2, LRCN Series 3 and subordinated debentures due on January 27, 2026, July 25, 2029, December 23, 2029, June 30, 2030, January 28, 2033, November 3, 2031, and May 3, 2032 would be converted into common shares pursuant to an automatic conversion formula with a conversion price based on the greater of: (i) a contractual floor price of $5.00, and (ii) the current market price of our common shares at the time of the trigger event(10-day
weighted average). Based on a floor price of $5.00 and including an estimate for accrued dividends and interest, these NVCC capital instruments would convert into a maximum of 4,505 million common shares, in aggregate, which would represent a dilution impact of 76.27% based on the number of common shares outstanding as at April 30, 2022.Royal Bank of Canada
Accounting and control matters |
Summary of accounting policies and estimates |
Our Condensed Financial Statements are presented in compliance with International Accounting Standard (IAS) 34. Our significant accounting policies are described in Note 2 of our audited 2021 Annual Consolidated Financial Statements.
Interim Financial Reporting
Application of critical accounting judgments, estimates and assumptions
While the impacts of the COVID-19 pandemic have eased in most regions, the economic outlook remains subject to ongoing uncertainty due to higher inflation, supply chain disruptions and heightened geopolitical risks, which could impact our financial results. We continue to monitor and assess the impacts of these factors on our critical accounting judgments, estimates and assumptions, which are described in Note 2 of our audited 2021 Annual Consolidated Financial Statements.
Future changes in accounting policies and disclosures
Future changes in accounting policies and disclosures that are not yet effective for us are described in Note 2 of our audited 2021 Annual Consolidated Financial Statements.
Controls and procedures |
Disclosure controls and procedures
As of April 30, 2022, management evaluated, under the supervision of and with the participation of the President and Chief Executive Officer and the Chief Financial Officer, the effectiveness of our disclosure controls and procedures as defined under rules adopted by the U.S. SEC. Based on that evaluation, the President and Chief Executive Officer and the Chief Financial Officer concluded that our disclosure controls and procedures were effective as of April 30, 2022.
Internal control over financial reporting
No changes were made in our internal control over financial reporting during the quarter ended April 30, 2022 that have materially affected, or are reasonably likely to materially affect, our internal control over financial reporting.
Related party transactions |
In the ordinary course of business, we provide normal banking services and operational services, and enter into other transactions with associated and other related corporations, including our joint venture entities, on terms similar to those offered to
non-related
parties. We grant loans to directors, officers and other employees at rates normally accorded to preferred clients. In addition, we offer deferred share and other plans tonon-employee
directors, executives and certain other key employees. For further information, refer to Notes 11 and 25 of our audited 2021 Annual Consolidated Financial Statements.46 Second Quarter 2022
Royal Bank of Canada
Glossary |
Acceptances
A bill of exchange or negotiable instrument drawn by the borrower for payment at maturity and accepted by a bank. The acceptance constitutes a guarantee of payment by the bank and can be traded in the money market. The bank earns a “stamping fee” for providing this guarantee.
Allowance for credit losses (ACL)
The amount deemed adequate by management to absorb expected credit losses as at the balance sheet date. The allowance is established for all financial assets subject to impairment assessment, including certain loans, debt securities, customers’ liability under acceptances, financial guarantees, and undrawn loan commitments. The allowance is changed by the amount of provision for credit losses recorded, which is charged to income, and decreased by the amount of write-offs net of recoveries in the period.
Asset-backed securities (ABS)
Securities created through the securitization of a pool of assets, for example auto loans or credit card loans.
Assets under administration (AUA)
Assets administered by us, which are beneficially owned by clients, as at October 31, unless otherwise noted. Services provided in respect of assets under administration are of an administrative nature, including safekeeping, collecting investment income, settling purchase and sale transactions, and record keeping.
Assets under management (AUM)
Assets managed by us, which are beneficially owned by clients, as at October 31, unless otherwise noted. Services provided in respect of assets under management include the selection of investments and the provision of investment advice. We have assets under management that are also administered by us and included in assets under administration.
Attributed capital
Attributed capital is based on the Basel III regulatory capital requirements and economic capital.
Auction rate securities (ARS)
Debt securities whose interest rates are regularly reset through an auction process.
Average earning assets, net
Average earning assets include interest-bearing deposits with other banks, securities, net of applicable allowance, assets purchased under reverse repurchase agreements and securities borrowed, loans, net of allowance, cash collateral and margin deposits. Insurance assets, and all other assets not specified are excluded. The averages are based on the daily balances for the period.
Basis point (bp)
One
one-hundredth
of a percentage point (.01%).Collateral
Assets pledged as security for a loan or other obligation. Collateral can take many forms, such as cash, highly rated securities, property, inventory, equipment and receivables.
Collateralized debt obligation (CDO)
Securities with multiple tranches that are issued by structured entities and collateralized by debt obligations including bonds and loans. Each tranche offers a varying degree of risk and return so as to meet investor demand.
Commercial mortgage-backed securities (CMBS)
Securities created through the securitization of commercial mortgages.
Commitments to extend credit
Unutilized amount of credit facilities available to clients either in the form of loans, bankers’ acceptances and other
on-balance
sheet financing, or throughoff-balance
sheet products such as guarantees and letters of credit.Common Equity Tier 1 (CET1) capital
A regulatory Basel III capital measure comprised mainly of common shareholders’ equity less regulatory deductions and adjustments for goodwill and intangibles, defined benefit pension fund assets, shortfall in allowances and other specified items.
Common Equity Tier 1 capital ratio
A risk-based capital measure calculated as CET1 capital divided by risk-weighted assets.
Covered bonds
Full recourse
on-balance
sheet obligations issued by banks and credit institutions that are fully collateralized by assets over which investors enjoy a priority claim in the event of an issuer’s insolvency.Credit default swaps (CDS)
A derivative contract that provides the purchaser with a
one-time
payment should the referenced entity/entities default (or a similar triggering event occur).Derivative
A contract between two parties, which requires little or no initial investment and where payments between the parties are dependent upon the movements in price of an underlying instrument, index or financial rate. Examples of derivatives include swaps, options, forward rate agreements and futures. The notional amount of the derivative is the contract amount used as a reference point to calculate the payments to be exchanged between the two parties, and the notional amount itself is generally not exchanged by the parties.
Dividend payout ratio
Common dividends as a percentage of net income available to common shareholders.
Dividend yield
Dividends per common share divided by the average of the high and low share price in the relevant period.
Earnings per share (EPS), basic
Calculated as net income available to common shareholders divided by the average number of shares outstanding.
Earnings per share (EPS), diluted
Calculated as net income available to common shareholders divided by the average number of shares outstanding adjusted for the dilutive effects of stock options and other convertible securities.
Expected credit losses
The difference between the contractual cash flows due to us in accordance with the relevant contractual terms and the cash flows that we expect to receive, discounted to the balance sheet date.
Fair value
Fair value of a financial instrument is the price that would be received to sell an asset or paid to
transfer a liability in an orderly transaction between market participants at the measurement date.
Funding Valuation Adjustment
Funding valuation adjustments are calculated to incorporate cost and benefit of funding in the valuation of uncollateralized and under-collateralized OTC derivatives. Future expected cash flows of these derivatives are discounted to reflect the cost and benefit of funding the derivatives by using a funding curve, implied volatilities and correlations as inputs.
Guarantees and standby letters of credit
These primarily represent irrevocable assurances that a bank will make payments in the event that its client cannot meet its financial obligations to third parties. Certain other guarantees, such as bid and performance bonds, represent
non-financial
undertakings.Hedge
A risk management technique used to mitigate exposure from market, interest rate or foreign currency exchange risk arising from normal banking operations. The elimination or reduction of such exposure is accomplished by establishing offsetting positions. For example, assets denominated in foreign currencies can be offset with liabilities in the same currencies or through the use of foreign exchange hedging instruments such as futures, options or foreign exchange contracts.
Hedge funds
A type of investment fund, marketed to accredited high net worth investors, that is subject to limited regulation and restrictions on its investments compared to retail mutual funds, and that often utilize aggressive strategies such as selling short, leverage, program trading, swaps, arbitrage and derivatives.
High-quality liquid assets (HQLA)
Assets are considered to be HQLA if they can be easily and immediately converted into cash at little or no loss of value during a time of stress.
Impaired loans
Loans are classified as impaired when there has been a deterioration of credit quality to the extent that management no longer has reasonable assurance of timely collection of the full amount of principal and interest in accordance with the contractual terms of the loan agreement. Credit card balances are not classified as impaired as they are directly written off after payments are 180 days past due.
International Financial Reporting Standards (IFRS)
IFRS are principles-based standards, interpretations and the framework adopted by the International Accounting Standards Board.
Leverage Ratio
A Basel III regulatory measure, the ratio divides Tier 1 capital by the sum of total assets plus specified
off-balance
sheet items.Liquidity Coverage Ratio (LCR)
The Liquidity Coverage Ratio is a Basel III metric that measures the sufficiency of HQLA available to meet net short-term financial obligations over a thirty day period in an acute stress scenario.
Loan-to-value
Calculated based on the total facility amount for the residential mortgage and RBC Homeline Plan
®
product divided by the value of the related residential property.Royal Bank of Canada
Master netting agreement
An agreement between us and a counterparty designed to reduce the credit risk of multiple derivative transactions through the creation of a legal right of offset of exposure in the event of a default.
Net interest income
The difference between what is earned on assets such as loans and securities and what is paid on liabilities such as deposits and subordinated debentures.
Net interest margin (on average earning assets, net)
Calculated as net interest income divided by average earning assets, net.
Net Stable Funding Ratio (NSFR)
The Net Stable Funding Ratio is a Basel III metric that measures the sufficiency of available stable funding to meet the minimum coverage level of required stable funding.
Normal course issuer bid (NCIB)
A program for the repurchase of our own shares for cancellation through a stock exchange that is subject to the various rules of the relevant stock exchange and securities commission.
Notional amount
The contract amount used as a reference point to calculate payments for derivatives.
Off-balance
sheet financial instrumentsA variety of arrangements offered to clients, which include credit derivatives, written put options, backstop liquidity facilities, stable value products, financial standby letters of credit, performance guarantees, credit enhancements, mortgage loans sold with recourse, commitments to extend credit, securities lending, documentary and commercial letters of credit, note issuances and revolving underwriting facilities, securities lending indemnifications and indemnifications.
Office of the Superintendent of Financial Institutions Canada (OSFI)
The primary regulator of federally chartered financial institutions and federally administered pension plans in Canada. OSFI’s mission is to safeguard policyholders, depositors and pension plan members from undue loss.
Operating leverage
The difference between our revenue growth rate and
non-interest
expense growth rate.Options
A contract or a provision of a contract that gives one party (the option holder) the right, but not the obligation, to perform a specified transaction with another party (the option issuer or option writer) according to specified terms.
Provision for credit losses (PCL)
The amount charged to income necessary to bring the allowance for credit losses to a level determined appropriate by management. This includes provisions on performing and impaired financial assets.
PCL on loans ratio
PCL on loans ratio is calculated using PCL on loans as a percentage of average net loans and acceptances.
RBC Homeline Plan
®
productsThis is comprised of residential mortgages and secured personal loans whereby the borrower pledges real estate as collateral.
Repurchase agreements
These involve the sale of securities for cash and the simultaneous repurchase of the securities for value at a later date. These transactions normally do not constitute economic sales and therefore are treated as collateralized financing transactions.
Return on common equity (ROE)
Net income available to common shareholders, expressed as a percentage of average common equity.
Reverse repurchase agreements
These involve the purchase of securities for cash and the simultaneous sale of the securities for value at a later date. These transactions normally do not constitute economic sales and therefore are treated as collateralized financing transactions.
Risk-weighted assets (RWA)
Assets adjusted by a regulatory risk-weight factor to reflect the riskiness of on and
off-balance
sheet exposures. Certain assets are not risk-weighted, but deducted from capital. The calculation is defined by guidelines issued by OSFI. For more details, refer to the Capital management section.Securities lending
Transactions in which the owner of securities agrees to lend it under the terms of a prearranged contract to a borrower for a fee. Collateral for the loan consists of either high quality securities or cash and collateral value must be at least equal to the market value of the loaned securities. Borrowers pay a negotiated fee for loans collateralized by securities, whereas for cash collateral lenders pay borrowers interest at a negotiated rate and reinvest the cash collateral to earn a return. An intermediary such as a bank often acts as agent lender for the owner of the security in return for a share of the revenue earned by the owner from lending securities. Most often, agent lenders indemnify the owner against the risk of the borrower’s failure to redeliver the loaned securities – counterparty credit risk if a borrower defaults and market risk if the value of the
non-cash
collateral declines. The agent lender does not indemnify against the investment risk ofre-investing
cash collateral which is borne by the owner.Securities sold short
A transaction in which the seller sells securities and then borrows the securities in order to deliver them to the purchaser upon settlement. At a later date, the seller buys identical securities in the market to replace the borrowed securities.
Securitization
The process by which various financial assets are packaged into newly issued securities backed by these assets.
Standardized Approach
Risk weights prescribed by OSFI are used to calculate risk-weighted assets for the credit risk exposures. Credit assessments by OSFI-recognized external credit rating agencies of Standard & Poor’s, Moody’s, Fitch, DBRS and Kroll Bond Rating Agency are used to risk-weight our Sovereign and Bank exposures based on the standards and guidelines issued by OSFI. For our Business and Retail exposures, we use the standard risk weights prescribed by OSFI.
Structured entities
A structured entity is an entity in which voting or similar rights are not the dominant factor in deciding who controls the entity, such as when
the activities that significantly affect the entity’s returns are directed by means of contractual arrangements. Structured entities often have restricted activities, narrow and well defined objectives, insufficient equity to finance their activities, and financing in the form of multiple contractually-linked instruments.
Taxable equivalent basis (teb)
Income from certain specified tax advantaged sources (eligible Canadian taxable corporate dividends) is increased to a level that would make it comparable to income from taxable sources. There is an offsetting adjustment in the tax provision, thereby generating the same
after-tax
net income.Tier 1 capital
Tier 1 capital comprises predominantly of CET1 capital, with additional Tier 1 items such as preferred shares, limited recourse capital notes and
non-controlling
interests in subsidiaries Tier 1 instruments.Tier 2 capital
Tier 2 capital consists mainly of subordinated debentures that meet certain criteria, certain loan loss allowances and
non-controlling
interests in subsidiaries’ Tier 2 instruments.Total capital and total capital ratio
Total capital is defined as the total of Tier 1 and Tier 2 capital. The total capital ratio is calculated by dividing total capital by risk-weighted assets.
Total Loss Absorbing Capacity (TLAC)
The aggregate of Tier 1 capital, Tier 2 capital, and other TLAC instruments, which allows conversion in whole or in part into common shares under the Canada Deposit Insurance Corporation Act and meets all of the eligibility criteria under the guideline.
TLAC ratio
The risk-based TLAC ratio is defined as TLAC divided by total risk-weighted assets.
TLAC leverage ratio
The TLAC leverage ratio is defined as TLAC divided by the Leverage ratio exposure.
Tranche
A security class created whereby the risks and returns associated with a pool of assets are packaged into several classes of securities offering different risk and return profiles from those of the underlying asset pool. Tranches are typically rated by ratings agencies, and reflect both the credit quality of underlying collateral as well as the level of protection based on the tranches’ relative subordination.
Unattributed capital
Unattributed capital represents common equity in excess of common equity attributed to our business segments and is reported in the Corporate Support segment.
Value-at-Risk
A generally accepted risk-measurement concept that uses statistical models based on historical information to estimate within a given level of confidence the maximum loss in market value we would experience in our trading portfolio from an adverse
one-day
movement in market rates and prices.48 Second Quarter 2022
Royal Bank of Canada
EDTF recommendations index |
We aim to present transparent, high-quality risk disclosures by providing disclosures in our 2021 Annual Report, Q2 2022 Report to Shareholders (RTS), Supplementary Financial Information package (SFI), and Pillar 3 Report, in accordance with recommendations from the Financial Stability Board’s (FSB) Enhanced Disclosure Task Force (EDTF). Information within the SFI and Pillar 3 Report is not and should not be considered incorporated by reference into our Q2 2022 Report to Shareholders.
The following index summarizes our disclosure by EDTF recommendation:
Location of disclosure | ||||||||||
Type of Risk | Recommendation | Disclosure | RTS page | Annual Report page | SFI page | |||||
General | 1 | Table of contents for EDTF risk disclosure | 48 | 123 | 1 | |||||
| 2 | Define risk terminology and measures | 55-60, 121-122 | – | |||||||
| 3 | Top and emerging risks | 52-54 | – | |||||||
| 4 | New regulatory ratios | 41-42 | 100-105 | – | ||||||
Risk governance, risk management and business model | 5 | Risk management organization | 55-60 | – | ||||||
| 6 | Risk culture | 56-60 | – | |||||||
| 7 | Risk in the context of our business activities | 108 | – | |||||||
| 8 | Stress testing | 57-58, 73 | – | |||||||
Capital adequacy and risk-weighted assets (RWA) | 9 | Minimum Basel III capital ratios and Domestic systemically important bank surcharge | 41 | 100-105 | – | |||||
| 10 | Composition of capital and reconciliation of the accounting balance sheet to the regulatory balance sheet | – | * | |||||||
| 11 | Flow statement of the movements in regulatory capital | – | 20 | |||||||
| 12 | Capital strategic planning | 100-105 | – | |||||||
| 13 | RWA by business segments | – | 21 | |||||||
| 14 | Analysis of capital requirement, and related measurement model information | 61-64 | * | |||||||
| 15 | RWA credit risk and related risk measurements | – | * | |||||||
| 16 | Movement of RWA by risk type | – | 21 | |||||||
| 17 | Basel back-testing | 57, 61 | 32 | |||||||
Liquidity | 18 | Quantitative and qualitative analysis of our liquidity reserve | 31-32 | 80-81, 85-86 | – | |||||
Funding | 19 | Encumbered and unencumbered assets by balance sheet category, and contractual obligations for rating downgrades | 32, 35 | 81, 84 | – | |||||
| 20 | Maturity analysis of consolidated total assets, liabilities and off-balance sheet commitments analyzed by remaining contractual maturity at the balance sheet date | 39-40 | 88-89 | – | ||||||
| 21 | Sources of funding and funding strategy | 32-34 | 81-83 | – | ||||||
Market risk | 22 | Relationship between the market risk measures for trading and non-trading portfolios and the balance sheet | 29-30 | 77-78 | – | |||||
| 23 | Decomposition of market risk factors | 27-29 | 72-76 | – | ||||||
| 24 | Market risk validation and back-testing | 73 | – | |||||||
| 25 | Primary risk management techniques beyond reported risk measures and parameters | 72-76 | – | |||||||
Credit risk | 26 | Bank’s credit risk profile | 23-27 | 60-72, 170-177 | 22-32,* | |||||
Quantitative summary of aggregate credit risk exposures that reconciles to the balance sheet | 66-72 | 115-120 | * | |||||||
| 27 | Policies for identifying impaired loans | 62-65, 110, 143-146 | – | |||||||
| 28 | Reconciliation of the opening and closing balances of impaired loans and impairment allowances during the year | – | 24, 29 | |||||||
| 29 | Quantification of gross notional exposure for over-the-counter derivatives or exchange-traded derivatives | 66 | 33 | |||||||
| 30 | Credit risk mitigation, including collateral held for all sources of credit risk | 64-65 | * | |||||||
Other | 31 | Other risk types | 91-99 | – | ||||||
| 32 | Publicly known risk events | 94-95, 215-216 | – | |||||||
| * | These disclosure requirements are satisfied or partially satisfied by disclosures provided in our Pillar 3 Report for the quarter ended April 30, 2022 and for the year ended October 31, 2021. |
Royal Bank of Canada
9
Interim Condensed Consolidated Financial Statements |
Interim Condensed Consolidated Balance Sheets |
| As at | ||||||||
(Millions of Canadian dollars) | April 30 2022 | October 31 2021 | ||||||
Assets | ||||||||
Cash and due from banks | $ | 115,929 | $ | 113,846 | ||||
Interest-bearing deposits with banks | 68,829 | | 79,638 | | ||||
Securities | ||||||||
Trading | 143,766 | 139,240 | ||||||
Investment, net of applicable allowance (Note 4) | 154,549 | 145,484 | ||||||
298,315 | 284,724 | |||||||
Assets purchased under reverse repurchase agreements and securities borrowed | 316,698 | 307,903 | ||||||
Loans (Note 5) | ||||||||
Retail | 525,183 | 503,598 | ||||||
Wholesale | 252,847 | 218,066 | ||||||
778,030 | 721,664 | |||||||
Allowance for loan losses (Note 5) | (3,566 | ) | (4,089 | ) | ||||
774,464 | 717,575 | |||||||
Segregated fund net assets | 2,659 | | 2,666 | | ||||
Other | ||||||||
Customers’ liability under acceptances | 16,529 | 19,798 | ||||||
Derivatives | 156,204 | 95,541 | ||||||
Premises and equipment | 7,225 | 7,424 | ||||||
Goodwill | 10,981 | 10,854 | ||||||
Other intangibles | 4,416 | 4,471 | ||||||
Other assets | 76,323 | 61,883 | ||||||
271,678 | 199,971 | |||||||
Total assets | $ | 1,848,572 | $ | 1,706,323 | ||||
Liabilities and equity | ||||||||
Deposits (Note 7) | ||||||||
Personal | $ | 382,881 | $ | 362,488 | ||||
Business and government | 724,978 | 696,353 | ||||||
Bank | 43,738 | 41,990 | ||||||
1,151,597 | 1,100,831 | |||||||
Segregated fund net liabilities | 2,659 | | 2,666 | | ||||
Other | ||||||||
Acceptances | 16,570 | 19,873 | ||||||
Obligations related to securities sold short | 39,464 | 37,841 | ||||||
Obligations related to assets sold under repurchase agreements and securities loaned | 279,338 | 262,201 | ||||||
Derivatives | 151,541 | 91,439 | ||||||
Insurance claims and policy benefit liabilities | 12,073 | 12,816 | ||||||
Other liabilities | 80,649 | 70,301 | ||||||
579,635 | 494,471 | |||||||
Subordinated debentures (Note 10) | 10,276 | | 9,593 | | ||||
Total liabilities | 1,744,167 | 1,607,561 | ||||||
Equity attributable to shareholders | ||||||||
Preferred shares and other equity instruments (Note 10) | 7,298 | 6,684 | ||||||
Common shares (Note 10) | 17,314 | 17,655 | ||||||
Retained earnings | 75,931 | 71,795 | ||||||
Other components of equity | 3,761 | 2,533 | ||||||
104,304 | 98,667 | |||||||
Non-controlling interests | 101 | 95 | ||||||
Total equity | 104,405 | 98,762 | ||||||
Total liabilities and equity | $ | 1,848,572 | $ | 1,706,323 | ||||
The accompanying notes are an integral part of these Interim Condensed Consolidated Financial Statements.
50
Royal Bank of Canada
Interim Condensed Consolidated Statements of Income |
| For the three months ended | For the six months ended | |||||||||||||||||
April 30 | April 30 | April 30 | April 30 | |||||||||||||||
(Millions of Canadian dollars, except per share amounts) | 2022 | 2021 | 2022 | 2021 | ||||||||||||||
Interest and dividend income (Note 3) | ||||||||||||||||||
Loans | $ | 5,707 | $ | 5,296 | $ | 11,264 | $ | 10,803 | ||||||||||
Securities | 1,396 | 1,217 | 2,775 | 2,493 | ||||||||||||||
Assets purchased under reverse repurchase agreements and securities borrowed | 556 | 322 | 905 | 711 | ||||||||||||||
Deposits and other | 99 | 63 | 192 | 127 | ||||||||||||||
7,758 | 6,898 | 15,136 | 14,134 | |||||||||||||||
Interest expense (Note 3) | ||||||||||||||||||
Deposits and other | 1,473 | 1,392 | 2,768 | 2,900 | ||||||||||||||
Other liabilities | 953 | 609 | 1,723 | 1,250 | ||||||||||||||
Subordinated debentures | 58 | 43 | 100 | 95 | ||||||||||||||
2,484 | 2,044 | 4,591 | 4,245 | |||||||||||||||
Net interest income | 5,274 | 4,854 | 10,545 | 9,889 | ||||||||||||||
Non-interest income | ||||||||||||||||||
Insurance premiums, investment and fee income | 234 | 536 | 1,633 | 2,345 | ||||||||||||||
Trading revenue | 289 | 377 | 603 | 901 | ||||||||||||||
Investment management and custodial fees | 1,892 | 1,711 | 3,853 | 3,414 | ||||||||||||||
Mutual fund revenue | 1,086 | 1,014 | 2,251 | 2,014 | ||||||||||||||
Securities brokerage commissions | 389 | 431 | 788 | 832 | ||||||||||||||
Service charges | 480 | 460 | 965 | 918 | ||||||||||||||
Underwriting and other advisory fees | 507 | 747 | 1,208 | 1,337 | ||||||||||||||
Foreign exchange revenue, other than trading | 251 | 292 | 522 | 581 | ||||||||||||||
Card service revenue | 288 | 281 | 579 | 553 | ||||||||||||||
Credit fees | 398 | 368 | 874 | 700 | ||||||||||||||
Net gains on investment securities | 23 | 82 | 38 | 117 | ||||||||||||||
Share of profit in joint ventures and associates | 24 | 24 | 53 | 49 | ||||||||||||||
Other | 85 | 441 | 374 | 911 | ||||||||||||||
5,946 | 6,764 | 13,741 | 14,672 | |||||||||||||||
Total revenue | 11,220 | 11,618 | 24,286 | 24,561 | ||||||||||||||
Provision for credit losses (Notes 4 and 5) | (342 | ) | (96 | ) | (237 | ) | 14 | |||||||||||
Insurance policyholder benefits, claims and acquisition expense | (180 | ) | 149 | 817 | 1,555 | |||||||||||||
Non-interest expense | ||||||||||||||||||
Human resources (Note 8) | 4,002 | 4,152 | 8,287 | 8,440 | ||||||||||||||
Equipment | 513 | 487 | 1,014 | 980 | ||||||||||||||
Occupancy | 386 | 400 | 772 | 804 | ||||||||||||||
Communications | 258 | 212 | 486 | 425 | ||||||||||||||
Professional fees | 347 | 314 | 666 | 605 | ||||||||||||||
Amortization of other intangibles | 336 | 318 | 673 | 637 | ||||||||||||||
Other | 592 | 496 | 1,116 | 1,030 | ||||||||||||||
6,434 | 6,379 | 13,014 | 12,921 | |||||||||||||||
Income before income taxes | 5,308 | 5,186 | 10,692 | 10,071 | ||||||||||||||
Income taxes | 1,055 | 1,171 | 2,344 | 2,209 | ||||||||||||||
Net income | $ | 4,253 | $ | 4,015 | $ | 8,348 | $ | 7,862 | ||||||||||
Net income attributable to: | ||||||||||||||||||
Shareholders | $ | 4,250 | $ | 4,014 | $ | 8,343 | $ | 7,859 | ||||||||||
Non-controlling interests | 3 | 1 | 5 | 3 | ||||||||||||||
$ | 4,253 | $ | 4,015 | $ | 8,348 | $ | 7,862 | |||||||||||
Basic earnings per share (in dollars) (Note 11) | $ | 2.97 | $ | 2.76 | $ | 5.81 | $ | 5.42 | ||||||||||
Diluted earnings per share (in dollars) (Note 11) | 2.96 | 2.76 | 5.80 | 5.42 | ||||||||||||||
Dividends per common share (in dollars) | 1.20 | 1.08 | 2.40 | 2.16 | ||||||||||||||
The accompanying notes are an integral part of these Interim Condensed Consolidated Financial Statements.
Royal Bank of Canada
51
Interim Condensed Consolidated Statements of Comprehensive Income |
| For the three months ended | For the six months ended | |||||||||||||||||
| (Millions of Canadian dollars) | April 30 2022 | April 30 2021 | April 30 2022 | April 30 2021 | ||||||||||||||
Net income | $ | 4,253 | $ | 4,015 | $ | 8,348 | $ | 7,862 | ||||||||||
Other comprehensive income (loss), net of taxes | ||||||||||||||||||
Items that will be reclassified subsequently to income: | ||||||||||||||||||
Net change in unrealized gains (losses) on debt securities and loans at fair value through other comprehensive income | ||||||||||||||||||
Net unrealized gains (losses) on debt securities and loans at fair value through other comprehensive income | (892 | ) | (79 | ) | (1,145 | ) | 290 | |||||||||||
Provision for credit losses recognized in income | (4 | ) | 15 | (11 | ) | 13 | ||||||||||||
Reclassification of net losses (gains) on debt securities and loans at fair value through other comprehensive income to income | (18 | ) | (66 | ) | (29 | ) | (102 | ) | ||||||||||
(914 | ) | (130 | ) | (1,185 | ) | 201 | ||||||||||||
Foreign currency translation adjustments | ||||||||||||||||||
Unrealized foreign currency translation gains (losses) | 198 | (2,466 | ) | 1,672 | (4,634 | ) | ||||||||||||
Net foreign currency translation gains (losses) from hedging activities | 137 | 1,035 | (370 | ) | 1,827 | |||||||||||||
Reclassification of losses (gains) on foreign currency translation to income | – | (7 | ) | (18 | ) | (7 | ) | |||||||||||
Reclassification of losses (gains) on net investment hedging activities to income | – | – | 17 | – | ||||||||||||||
335 | (1,438 | ) | 1,301 | (2,814 | ) | |||||||||||||
Net change in cash flow hedges | ||||||||||||||||||
Net gains (losses) on derivatives designated as cash flow hedges | 869 | 669 | 967 | 796 | ||||||||||||||
Reclassification of losses (gains) on derivatives designated as cash flow hedges to income | 117 | 33 | 148 | 78 | ||||||||||||||
986 | 702 | 1,115 | 874 | |||||||||||||||
Items that will not be reclassified subsequently to income: | ||||||||||||||||||
Remeasurements of employee benefit plans (Note 8) | 765 | 938 | 1,048 | 1,719 | ||||||||||||||
Net fair value change due to credit risk on financial liabilities designated at fair value through profit or loss | 853 | 88 | 1,033 | (36 | ) | |||||||||||||
Net gains (losses) on equity securities designated at fair value through other comprehensive income | 4 | (5 | ) | 43 | (1 | ) | ||||||||||||
1,622 | 1,021 | 2,124 | 1,682 | |||||||||||||||
Total other comprehensive income (loss), net of taxes | 2,029 | 155 | 3,355 | (57 | ) | |||||||||||||
Total comprehensive income (loss) | $ | 6,282 | $ | 4,170 | $ | 11,703 | $ | 7,805 | ||||||||||
Total comprehensive income attributable to: | ||||||||||||||||||
Shareholders | $ | 6,278 | $ | 4,173 | $ | 11,695 | $ | 7,810 | ||||||||||
Non-controlling interests | 4 | (3 | ) | 8 | (5 | ) | ||||||||||||
$ | 6,282 | $ | 4,170 | $ | 11,703 | $ | 7,805 | |||||||||||
The income tax effect on the Interim Condensed Consolidated Statements of Comprehensive Income is shown in the table below.
| For the three months ended | For the six months ended | |||||||||||||||||
| (Millions of Canadian dollars) | April 30 2022 | April 30 2021 | April 30 2022 | April 30 2021 | ||||||||||||||
Income taxes on other comprehensive income | ||||||||||||||||||
Net unrealized gains (losses) on debt securities and loans at fair value through other comprehensive income | $ | (291 | ) | $ | (49 | ) | $ | (368 | ) | $ | (2 | ) | ||||||
Provision for credit losses recognized in income | (1 | ) | 6 | (2 | ) | 6 | ||||||||||||
Reclassification of net losses (gains) on debt securities and loans at fair value through other comprehensive income to income | (3 | ) | (10 | ) | (4 | ) | (23 | ) | ||||||||||
Unrealized foreign currency translation gains (losses) | – | – | – | 2 | ||||||||||||||
Net foreign currency translation gains (losses) from hedging activities | 52 | 354 | (118 | ) | 620 | |||||||||||||
Reclassification of losses (gains) on net investment hedging activities to income | – | – | 6 | – | ||||||||||||||
Net gains (losses) on derivatives designated as cash flow hedges | 329 | 238 | 363 | 283 | ||||||||||||||
Reclassification of losses (gains) on derivatives designated as cash flow hedges to income | 42 | 12 | 53 | 28 | ||||||||||||||
Remeasurements of employ e e benefit plans | 267 | 331 | 367 | 608 | ||||||||||||||
Net fair value change due to credit risk on financial liabilities designated at fair value through profit or loss | 302 | 31 | 366 | (13 | ) | |||||||||||||
Net gains (losses) on equity securities designated at fair value through other comprehensive income | (5 | ) | (1 | ) | (1 | ) | (1 | ) | ||||||||||
Total income tax expenses (recoveries) | $ | 692 | $ | 912 | $ | 662 | $ | 1,508 | ||||||||||
The accompanying notes are an integral part of these Interim Condensed Consolidated Financial Statements.
5 Second Quarter 2022
2
Royal Bank of Canada
Interim Condensed Consolidated Statements of Changes in Equity |
For the three months ended April 30, 2022 | ||||||||||||||||||||||||||||||||||||||||||||||||
Other components of equity | ||||||||||||||||||||||||||||||||||||||||||||||||
| (Millions of Canadian dollars) | Preferred shares and other equity instruments | Common shares | Treasury – preferred shares and other equity instruments | Treasury – common shares | Retained earnings | FVOCI securities and loans | Foreign currency translation | Cash flow hedges | Total other components of equity | Equity attributable to shareholders | Non-controlling interests | Total equity | ||||||||||||||||||||||||||||||||||||
Balance at beginning of period | $ | 7,473 | $ | 17,651 | $ | (32 | ) | $ | (79 | ) | $ | 73,542 | $ | (359 | ) | $ | 3,019 | $ | 695 | $ | 3,355 | $ | 101,910 | $ | 98 | $ | 102,008 | |||||||||||||||||||||
Changes in equity | ||||||||||||||||||||||||||||||||||||||||||||||||
Issues of share capital and other equity instruments | – | 8 | – | – | – | – | – | – | – | 8 | – | 8 | ||||||||||||||||||||||||||||||||||||
Common shares purchased for cancellation | – | (171 | ) | – | – | (1,721 | ) | – | – | – | – | (1,892 | ) | – | (1,892 | ) | ||||||||||||||||||||||||||||||||
Redemption of preferred shares and other equity instruments | (150 | ) | – | – | – | (5 | ) | – | – | – | – | (155 | ) | – | (155 | ) | ||||||||||||||||||||||||||||||||
Sales of treasury shares and other equity instruments | – | – | 152 | 1,191 | – | – | – | – | – | 1,343 | – | 1,343 | ||||||||||||||||||||||||||||||||||||
Purchases of treasury shares and other equity instruments | – | – | (145 | ) | (1,286 | ) | – | – | – | – | – | (1,431 | ) | – | (1,431 | ) | ||||||||||||||||||||||||||||||||
Share-based compensation awards | – | – | – | – | – | – | – | – | – | – | – | – | ||||||||||||||||||||||||||||||||||||
Dividends on common shares | – | – | – | – | (1,686 | ) | – | – | – | – | (1,686 | ) | – | (1,686 | ) | |||||||||||||||||||||||||||||||||
Dividends on preferred shares and distributions on other equity instruments | – | – | – | – | (68 | ) | – | – | – | – | (68 | ) | (1 | ) | (69 | ) | ||||||||||||||||||||||||||||||||
Other | – | – | – | – | (3 | ) | – | – | – | – | (3 | ) | – | (3 | ) | |||||||||||||||||||||||||||||||||
Net income | – | – | – | – | 4,250 | – | – | – | – | 4,250 | 3 | 4,253 | ||||||||||||||||||||||||||||||||||||
Total other net of taxes | – | – | – | – | 1,622 | (914 | ) | 334 | 986 | 406 | 2,028 | 1 | 2,029 | |||||||||||||||||||||||||||||||||||
Balance at end of period | $ | 7,323 | $ | 17,488 | $ | (25 | ) | $ | (174 | ) | $ | 75,931 | $ | (1,273 | ) | $ | 3,353 | $ | 1,681 | $ | 3,761 | $ | 104,304 | $ | 101 | $ | 104,405 | |||||||||||||||||||||
| For the three months ended April 30, 2021 | ||||||||||||||||||||||||||||||||||||||||||||||||
| Other components of equity | ||||||||||||||||||||||||||||||||||||||||||||||||
| (Millions of Canadian dollars) | Preferred shares and other equity instruments | Common shares | Treasury – preferred shares and other equity instruments | Treasury – common shares | Retained earnings | FVOCI securities and loans | Foreign currency translation | Cash flow hedges | Total other components of equity | Equity attributable to shareholders | Non-controlling interests | Total equity | ||||||||||||||||||||||||||||||||||||
Balance at beginning of period | $ | 7,198 | $ | 17,664 | $ | 17 | $ | (26 | ) | $ | 62,751 | $ | 192 | $ | 3,260 | $ | (907 | ) | $ | 2,545 | $ | 90,149 | $ | 100 | $ | 90,249 | ||||||||||||||||||||||
Changes in equity | ||||||||||||||||||||||||||||||||||||||||||||||||
Issues of share capital and other equity instruments | – | 25 | – | – | – | – | – | – | – | 25 | – | 25 | ||||||||||||||||||||||||||||||||||||
Common shares purchased for cancellation | – | – | – | – | – | – | – | – | – | – | – | – | ||||||||||||||||||||||||||||||||||||
Redemption of preferred shares and other equity instruments | – | – | – | – | – | – | – | – | – | – | – | – | ||||||||||||||||||||||||||||||||||||
Sales of treasury shares and other equity instruments | – | – | 153 | 1,039 | – | – | – | – | – | 1,192 | – | 1,192 | ||||||||||||||||||||||||||||||||||||
Purchases of treasury shares and other equity instruments | – | – | (177 | ) | (1,004 | ) | – | – | – | – | – | (1,181 | ) | – | (1,181 | ) | ||||||||||||||||||||||||||||||||
Share-based compensation awards | – | – | – | – | (2 | ) | – | – | – | – | (2 | ) | – | (2 | ) | |||||||||||||||||||||||||||||||||
Dividends on common shares | – | – | – | – | (1,540 | ) | – | – | – | – | (1,540 | ) | – | (1,540 | ) | |||||||||||||||||||||||||||||||||
Dividends on preferred shares and distributions on other equity instruments | – | – | – | – | (76 | ) | – | – | – | – | (76 | ) | (1 | ) | (77 | ) | ||||||||||||||||||||||||||||||||
Other | – | – | – | – | (5 | ) | – | – | – | – | (5 | ) | (9 | ) | (14 | ) | ||||||||||||||||||||||||||||||||
Net income | – | – | – | – | 4,014 | – | – | – | – | 4,014 | 1 | 4,015 | ||||||||||||||||||||||||||||||||||||
Total other comprehensive income net of taxes | – | – | – | – | 1,021 | (130 | ) | (1,434 | ) | 702 | (862 | ) | 159 | (4 | ) | 155 | ||||||||||||||||||||||||||||||||
Balance at end of period | $ | 7,198 | $ | 17,689 | $ | (7 | ) | $ | 9 | $ | 66,163 | $ | 62 | $ | 1,826 | $ | (205 | ) | $ | 1,683 | $ | 92,735 | $ | 87 | $ | 92,822 | ||||||||||||||||||||||
Royal Bank of Canada
3
For the six months ended April 30, 2022 | ||||||||||||||||||||||||||||||||||||||||||||||||
Other components of equity | ||||||||||||||||||||||||||||||||||||||||||||||||
| (Millions of Canadian dollars) | Preferred shares and other equity instruments | Common shares | Treasury – preferred shares and other equity instruments | Treasury – common shares | Retained earnings | FVOCI securities and loans | Foreign currency translation | Cash flow hedges | Total other components of equity | Equity attributable to shareholders | Non-controlling interests | Total equity | ||||||||||||||||||||||||||||||||||||
Balance at beginning of period | $ | 6,723 | $ | 17,728 | $ | (39 | ) | $ | (73 | ) | $ | 71,795 | $ | (88 | ) | $ | 2,055 | $ | 566 | $ | 2,533 | $ | 98,667 | $ | 95 | $ | 98,762 | |||||||||||||||||||||
Changes in equity | ||||||||||||||||||||||||||||||||||||||||||||||||
Issues of share capital and other equity instruments | 750 | 42 | – | – | (1 | ) | – | – | – | – | 791 | – | 791 | |||||||||||||||||||||||||||||||||||
Common shares purchased for cancellation | – | (282 | ) | – | – | (2,824 | ) | – | – | – | – | (3,106 | ) | – | (3,106 | ) | ||||||||||||||||||||||||||||||||
Redemption of preferred shares and other equity instruments | (150 | ) | – | – | – | (5 | ) | – | – | – | – | (155 | ) | – | (155 | ) | ||||||||||||||||||||||||||||||||
Sales of treasury shares and other equity instruments | – | – | 308 | 2,707 | – | – | – | – | – | 3,015 | – | 3,015 | ||||||||||||||||||||||||||||||||||||
Purchases of treasury shares and other equity instruments | – | – | (294 | ) | (2,808 | ) | – | – | – | – | – | (3,102 | ) | – | (3,102 | ) | ||||||||||||||||||||||||||||||||
Share-based compensation awards | – | – | – | – | 2 | – | – | – | – | 2 | – | 2 | ||||||||||||||||||||||||||||||||||||
Dividends on common shares | – | – | – | – | (3,388 | ) | – | – | – | – | (3,388 | ) | – | (3,388 | ) | |||||||||||||||||||||||||||||||||
Dividends on preferred shares and distributions on other equity instruments | – | – | – | – | (122 | ) | – | – | – | – | (122 | ) | (2 | ) | (124 | ) | ||||||||||||||||||||||||||||||||
Other | – | – | – | – | 7 | – | – | – | – | 7 | – | 7 | ||||||||||||||||||||||||||||||||||||
Net income | – | – | – | – | 8,343 | – | – | – | – | 8,343 | 5 | 8,348 | ||||||||||||||||||||||||||||||||||||
Total other comprehensive income (loss), | – | – | – | – | 2,124 | (1,185 | ) | 1,298 | 1,115 | 1,228 | 3,352 | 3 | 3,355 | |||||||||||||||||||||||||||||||||||
Balance at end of period | $ | 7,323 | $ | 17,488 | $ | (25 | ) | $ | (174 | ) | $ | 75,931 | $ | (1,273 | ) | $ | 3,353 | $ | 1,681 | $ | 3,761 | $ | 104,304 | $ | 101 | $ | 104,405 | |||||||||||||||||||||
| For the six months ended April 30, 2021 | ||||||||||||||||||||||||||||||||||||||||||||||||
| Other components of equity | ||||||||||||||||||||||||||||||||||||||||||||||||
| (Millions of Canadian dollars) | Preferred shares and other equity instruments | Common shares | Treasury – preferred shares and other equity instruments | Treasury – common shares | Retained earnings | FVOCI securities and loans | Foreign currency translation | Cash flow hedges | Total other components of equity | Equity attributable to shareholders | Non-controlling interests | Total equity | ||||||||||||||||||||||||||||||||||||
Balance at beginning of period | $ | 5,948 | $ | 17,628 | $ | (3 | ) | $ | (129 | ) | $ | 59,806 | $ | (139 | ) | $ | 4,632 | $ | (1,079 | ) | $ | 3,414 | $ | 86,664 | $ | 103 | $ | 86,767 | ||||||||||||||||||||
Changes in equity | ||||||||||||||||||||||||||||||||||||||||||||||||
Issues of share capital and other equity instruments | 1,250 | 61 | – | – | (3 | ) | – | – | – | – | 1,308 | – | 1,308 | |||||||||||||||||||||||||||||||||||
Common shares purchased for cancellation | – | – | – | – | – | – | – | – | – | – | – | – | ||||||||||||||||||||||||||||||||||||
Redemption of preferred shares and other equity instruments | – | – | – | – | – | – | – | – | – | – | – | – | ||||||||||||||||||||||||||||||||||||
Sales of treasury shares and other equity instruments | – | – | 199 | 1,942 | – | – | – | – | – | 2,141 | – | 2,141 | ||||||||||||||||||||||||||||||||||||
Purchases of treasury shares and other equity instruments | – | – | (203 | ) | (1,804 | ) | – | – | – | – | – | (2,007 | ) | – | (2,007 | ) | ||||||||||||||||||||||||||||||||
Share-based compensation awards | – | – | – | – | (4 | ) | – | – | – | – | (4 | ) | – | (4 | ) | |||||||||||||||||||||||||||||||||
Dividends on common shares | – | – | – | – | (3,079 | ) | – | – | – | – | (3,079 | ) | – | (3,079 | ) | |||||||||||||||||||||||||||||||||
Dividends on preferred shares and distributions on other equity instruments | – | – | – | – | (134 | ) | – | – | – | – | (134 | ) | (2 | ) | (136 | ) | ||||||||||||||||||||||||||||||||
Other | – | – | – | – | 36 | – | – | – | – | 36 | (9 | ) | 27 | |||||||||||||||||||||||||||||||||||
Net income | – | – | – | – | 7,859 | – | – | – | – | 7,859 | 3 | 7,862 | ||||||||||||||||||||||||||||||||||||
Total other comprehensive income (loss), | – | – | – | – | 1,682 | 201 | (2,806 | ) | 874 | (1,731 | ) | (49 | ) | (8 | ) | (57 | ) | |||||||||||||||||||||||||||||||
Balance at end of period | $ | 7,198 | $ | 17,689 | $ | (7 | ) | $ | 9 | $ | 66,163 | $ | 62 | $ | 1,826 | $ | (205 | ) | $ | 1,683 | $ | 92,735 | $ | 87 | $ | 92,822 | ||||||||||||||||||||||
The accompanying notes are an integral part of these Interim Condensed Consolidated Financial Statements.
5 Second Quarter 2022
4
Royal Bank of Canada
Interim Condensed Consolidated Statements of Cash Flows |
| For the three months ended | For the six months ended | |||||||||||||||||
(Millions of Canadian dollars) | April 30 2022 | April 30 2021 | April 30 2022 | April 30 2021 | ||||||||||||||
Cash flows from operating activities | ||||||||||||||||||
Net income | $ | 4,253 | $ | 4,015 | $ | 8,348 | $ | 7,862 | ||||||||||
Adjustments for non-cash items and others | ||||||||||||||||||
Provision for credit losses | (342 | ) | (96 | ) | (237 | ) | 14 | |||||||||||
Depreciation | 314 | 318 | 627 | 632 | ||||||||||||||
Deferred income taxes | 418 | 454 | 645 | 786 | ||||||||||||||
Amortization and impairment of other intangibles | 340 | 319 | 679 | 639 | ||||||||||||||
Net changes in investments in joint ventures and associates | (24 | ) | (24 | ) | (52 | ) | (48 | ) | ||||||||||
Losses (Gains) on investment securities | (23 | ) | (82 | ) | (38 | ) | (123 | ) | ||||||||||
Losses (Gains) on disposition of businesses | (89 | ) | (26 | ) | (89 | ) | (26 | ) | ||||||||||
Adjustments for net changes in operating assets and liabilities | ||||||||||||||||||
Insurance claims and policy benefit liabilities | (900 | ) | (645 | ) | (743 | ) | (106 | ) | ||||||||||
Net change in accrued interest receivable and payable | (68 | ) | (138 | ) | (79 | ) | (359 | ) | ||||||||||
Current income taxes | (372 | ) | 394 | (3,090 | ) | 673 | ||||||||||||
Derivative assets | (63,885 | ) | 13,681 | (60,663 | ) | 16,252 | ||||||||||||
Derivative liabilities | 63,439 | (13,669 | ) | 60,102 | (17,525 | ) | ||||||||||||
Trading securities | 5,759 | 22,295 | (4,526 | ) | 10,343 | |||||||||||||
Loans, net of securitizations | (34,093 | ) | (605 | ) | (56,957 | ) | (11,980 | ) | ||||||||||
Assets purchased under reverse repurchase agreements and securities borrowed | (4,572 | ) | 3,002 | (8,795 | ) | 4,984 | ||||||||||||
Obligations related to assets sold under repurchase agreements and securities loaned | 14,329 | (17,858 | ) | 17,137 | (17,182 | ) | ||||||||||||
Obligations related to securities sold short | (2,080 | ) | (752 | ) | 1,623 | 2,532 | ||||||||||||
Deposits, net of securitizations | 9,358 | (21,296 | ) | 51,369 | 21,368 | |||||||||||||
Brokers and dealers receivable and payable | (914 | ) | 440 | 1,099 | (698 | ) | ||||||||||||
Other | 9,889 | 3,718 | 2,811 | 6,220 | ||||||||||||||
Net cash from (used in) operating activities | 737 | (6,555 | ) | 9,171 | 24,258 | |||||||||||||
Cash flows from investing activities | ||||||||||||||||||
Change in interest-bearing deposits with banks | (5,409 | ) | (29,700 | ) | 10,809 | (24,418 | ) | |||||||||||
Proceeds from sales and maturities of investment securities | 24,394 | 33,637 | 47,495 | 63,310 | ||||||||||||||
Purchases of investment securities | (27,559 | ) | (28,584 | ) | (56,223 | ) | (61,765 | ) | ||||||||||
Net acquisitions of premises and equipment and other intangibles | (553 | ) | (496 | ) | (1,143 | ) | (925 | ) | ||||||||||
Proceeds from dispositions | 95 | 78 | 95 | 78 | ||||||||||||||
Net cash from (used in) investing activities | (9,032 | ) | (25,065 | ) | 1,033 | (23,720 | ) | |||||||||||
Cash flows from financing activities | ||||||||||||||||||
Issuance of subordinated debentures | – | – | 1,000 | 1,000 | ||||||||||||||
Repayment of subordinated debentures | – | – | – | (1,500 | ) | |||||||||||||
Issue of common shares, net of issuance costs | 7 | 22 | 38 | 53 | ||||||||||||||
Common shares purchased for cancellation | (1,892 | ) | – | (3,106 | ) | – | ||||||||||||
Issue of preferred shares and other equity instruments, net of issuance costs | – | – | 749 | 1,247 | ||||||||||||||
Redemption of preferred shares and other equity instruments | (155 | ) | – | (155 | ) | – | ||||||||||||
Sales of treasury shares and other equity instruments | 1,343 | 1,192 | 3,015 | 2,141 | ||||||||||||||
Purchases of treasury shares and other equity instruments | (1,431 | ) | (1,181 | ) | (3,102 | ) | (2,007 | ) | ||||||||||
Dividends paid on shares and distributions paid on other equity instruments | (1,756 | ) | (1,597 | ) | (3,364 | ) | (3,210 | ) | ||||||||||
Dividends/distributions paid to non-controlling interests | (1 | ) | (1 | ) | (2 | ) | (2 | ) | ||||||||||
Change in short-term borrowings of subsidiaries | 1 | (1 | ) | 1 | (8 | ) | ||||||||||||
Repayment of lease liabilities | (154 | ) | (152 | ) | (317 | ) | (298 | ) | ||||||||||
Net cash from (used in) financing activities | (4,038 | ) | (1,718 | ) | (5,243 | ) | (2,584 | ) | ||||||||||
Effect of exchange rate changes on cash and due from banks | (2,901 | ) | (1,943 | ) | (2,878 | ) | (2,535 | ) | ||||||||||
Net change in cash and due from banks | (15,234 | ) | (35,281 | ) | 2,083 | (4,581 | ) | |||||||||||
Cash and due from banks at beginning of period (1) | 131,163 | 149,588 | 113,846 | 118,888 | ||||||||||||||
Cash and due from banks at end of period (1) | $ | 115,929 | $ | 114,307 | $ | 115,929 | $ | 114,307 | ||||||||||
Cash flows from operating activities include: | ||||||||||||||||||
Amount of interest paid | $ | 1,757 | $ | 2,161 | $ | 3,528 | $ | 4,295 | ||||||||||
Amount of interest received | 6,775 | 6,692 | 13,601 | 13,471 | ||||||||||||||
Amount of dividends received | 678 | 696 | 1,545 | 1,351 | ||||||||||||||
Amount of income taxes paid | 1,657 | 1,248 | 5,336 | 2,274 | ||||||||||||||
| (1) | We are required to maintain balances with central banks and other regulatory authorities. The total balances were $2 |
The accompanying notes are an integral part of these Interim Condensed Consolidated Financial Statements.
Royal Bank of Canada
5
Note 1 General information |
Our unaudited Interim Condensed Consolidated Financial Statements (Condensed Financial Statements) are presented in compliance with International Accounting Standard (IAS) 34 Interim Financial Reporting. The Condensed Financial Statements do not include all the information and disclosures required in the annual financial statements and should be read in conjunction with our audited 2021 Annual Consolidated Financial Statements and the accompanying notes included on pages 133 to 225 in our 2021 Annual Report. Unless otherwise stated, monetary amounts are stated in Canadian dollars. Tabular information is stated in millions of dollars, except as noted. On May 25, 2022, the Board of Directors authorized the Condensed Financial Statements for issue.
Note 2 Summary of significant accounting policies, estimates and judgments |
The Condensed Financial Statements have been prepared using the same accounting policies and methods used in the preparation of our audited 2021 Annual Consolidated Financial Statements. Our significant accounting policies and future changes in accounting policies and disclosures that are not yet effective for us are described in Note 2 of our audited 2021 Annual Consolidated Financial Statements.
Interest Rate Benchmark Reform
As part of the interest rate benchmark reform, the publication of all non-USD London Interbank Offered Rate (LIBOR) settings ceased on December 31, 2021. As at April 30, 2022 and consistent with our transition plan, our exposure to financial instruments referencing non-USD LIBOR interest rates is not material to our financial statements.
5 Second Quarter 2022
6
Royal Bank of Canada
Note 3 Fair value of financial instruments |
Carrying value and fair value of financial instruments
The following tables provide a comparison of the carrying values and fair values for financial instruments classified or designated as fair value through profit or loss (FVTPL) and fair value through other comprehensive income (FVOCI). Embedded derivatives are presented on a combined basis with the host contracts. Refer to Note 2 and Note 3 of our audited 2021 Annual Consolidated Financial Statements for a description of the valuation techniques and inputs used in the fair value measurement of our financial instruments. There have been no significant changes to our determination of fair value during the
quarter.
As at April 30, 2022 | ||||||||||||||||||||||||||||||||||||
Carrying value and fair value | Carrying value | Fair value | ||||||||||||||||||||||||||||||||||
| (Millions of Canadian dollars) | Financial instruments classified as FVTPL | Financial instruments designated as FVTPL | Financial instruments classified as FVOCI | Financial instruments designated as FVOCI | Financial instruments measured at amortized cost | Financial instruments measured at amortized cost | Total carrying amount | Total fair value | ||||||||||||||||||||||||||||
Financial assets | ||||||||||||||||||||||||||||||||||||
Interest-bearing deposits | $ | – | $ | 57,963 | $ | – | $ | – | $ | 10,866 | $ | 10,866 | $ | 68,829 | $ | 68,829 | ||||||||||||||||||||
Securities | ||||||||||||||||||||||||||||||||||||
Trading | 133,183 | 10,583 | – | – | – | – | 143,766 | 143,766 | ||||||||||||||||||||||||||||
Investment, net of applicable allowance | – | – | 80,208 | 573 | 73,768 | 69,784 | 154,549 | 150,565 | ||||||||||||||||||||||||||||
133,183 | 10,583 | 80,208 | 573 | 73,768 | 69,784 | 298,315 | 294,331 | |||||||||||||||||||||||||||||
Assets purchased under reverse repurchase agreements and securities borrowed | 271,184 | – | – | – | 45,514 | 45,514 | 316,698 | 316,698 | ||||||||||||||||||||||||||||
Loans, net of applicable allowance | ||||||||||||||||||||||||||||||||||||
Retail | 54 | �� | 244 | 189 | – | 522,562 | 509,443 | 523,049 | 509,930 | |||||||||||||||||||||||||||
Wholesale | 8,342 | 3,074 | 529 | – | 239,470 | 234,812 | 251,415 | 246,757 | ||||||||||||||||||||||||||||
8,396 | 3,318 | 718 | – | 762,032 | 744,255 | 774,464 | 756,687 | |||||||||||||||||||||||||||||
Other | ||||||||||||||||||||||||||||||||||||
Derivatives | 156,204 | – | – | – | – | – | 156,204 | 156,204 | ||||||||||||||||||||||||||||
Other assets (1) | 4,041 | – | – | – | 66,309 | 66,309 | 70,350 | 70,350 | ||||||||||||||||||||||||||||
Financial liabilities | ||||||||||||||||||||||||||||||||||||
Deposits | ||||||||||||||||||||||||||||||||||||
Personal | $ | 309 | $ | 18,267 | $ | 364,305 | $ | 363,185 | $ | 382,881 | $ | 381,761 | ||||||||||||||||||||||||
Business and government (2) | 591 | 143,147 | 581,240 | 580,134 | 724,978 | 723,872 | ||||||||||||||||||||||||||||||
Bank (3) | – | 10,647 | 33,091 | 33,080 | 43,738 | 43,727 | ||||||||||||||||||||||||||||||
900 | 172,061 | 978,636 | 976,399 | 1,151,597 | 1,149,360 | |||||||||||||||||||||||||||||||
Other | ||||||||||||||||||||||||||||||||||||
Obligations related to securities sold short | 39,464 | – | – | – | 39,464 | 39,464 | ||||||||||||||||||||||||||||||
Obligations related to assets sold under repurchase agreements and securities loaned | – | 252,308 | 27,030 | 27,030 | 279,338 | 279,338 | ||||||||||||||||||||||||||||||
Derivatives | 151,541 | – | – | – | 151,541 | 151,541 | ||||||||||||||||||||||||||||||
Other liabilities (4) | 294 | 82 | 75,315 | 75,224 | 75,691 | 75,600 | ||||||||||||||||||||||||||||||
Subordinated debentures | – | – | 10,276 | 10,119 | 10,276 | 10,119 | ||||||||||||||||||||||||||||||
Royal Bank of Canada
7
| As at October 31, 2021 | ||||||||||||||||||||||||||||||||||||
| Carrying value and fair value | Carrying value | Fair value | ||||||||||||||||||||||||||||||||||
| (Millions of Canadian dollars) | Financial instruments classified as FVTPL | Financial instruments designated as FVTPL | Financial instruments classified as FVOCI | Financial instruments designated as FVOCI | Financial instruments measured at amortized cost | Financial instruments measured at amortized cost | Total carrying amount | Total fair value | ||||||||||||||||||||||||||||
Financial assets | ||||||||||||||||||||||||||||||||||||
Interest-bearing deposits | $ | – | $ | 56,896 | $ | – | $ | – | $ | 22,742 | $ | 22,742 | $ | 79,638 | $ | 79,638 | ||||||||||||||||||||
Securities | ||||||||||||||||||||||||||||||||||||
Trading | 125,801 | 13,439 | – | – | – | – | 139,240 | 139,240 | ||||||||||||||||||||||||||||
Investment, net of applicable allowance | – | – | 77,802 | 533 | 67,149 | 66,823 | 145,484 | 145,158 | ||||||||||||||||||||||||||||
| 125,801 | 13,439 | 77,802 | 533 | 67,149 | 66,823 | 284,724 | 284,398 | |||||||||||||||||||||||||||||
Assets purchased under reverse repurchase agreements and securities borrowed | 265,011 | – | – | – | 42,892 | 42,892 | 307,903 | 307,903 | ||||||||||||||||||||||||||||
Loans, net of applicable allowance | ||||||||||||||||||||||||||||||||||||
Retail | – | 241 | 327 | – | 500,621 | 502,277 | 501,189 | 502,845 | ||||||||||||||||||||||||||||
Wholesale | 8,428 | 2,769 | 813 | – | 204,376 | 204,683 | 216,386 | 216,693 | ||||||||||||||||||||||||||||
| 8,428 | 3,010 | 1,140 | – | 704,997 | 706,960 | 717,575 | 719,538 | |||||||||||||||||||||||||||||
Other | ||||||||||||||||||||||||||||||||||||
Derivatives | 95,541 | – | – | – | – | – | 95,541 | 95,541 | ||||||||||||||||||||||||||||
Other assets (1) | 4,109 | – | – | – | 58,483 | 58,483 | 62,592 | 62,592 | ||||||||||||||||||||||||||||
Financial liabilities | ||||||||||||||||||||||||||||||||||||
Deposits | ||||||||||||||||||||||||||||||||||||
Personal | $ | 321 | $ | 18,328 | $ | 343,839 | $ | 344,040 | $ | 362,488 | $ | 362,689 | ||||||||||||||||||||||||
Business and government (2) | 739 | 131,630 | 563,984 | 565,106 | 696,353 | 697,475 | ||||||||||||||||||||||||||||||
Bank (3) | – | 17,251 | 24,739 | 24,743 | 41,990 | 41,994 | ||||||||||||||||||||||||||||||
| 1,060 | 167,209 | 932,562 | 933,889 | 1,100,831 | 1,102,158 | |||||||||||||||||||||||||||||||
Other | ||||||||||||||||||||||||||||||||||||
Obligations related to securities sold short | 37,841 | – | – | – | 37,841 | 37,841 | ||||||||||||||||||||||||||||||
Obligations related to assets sold under repurchase agreements and securities loaned | – | 236,147 | 26,054 | 26,054 | 262,201 | 262,201 | ||||||||||||||||||||||||||||||
Derivatives | 91,439 | – | – | – | 91,439 | 91,439 | ||||||||||||||||||||||||||||||
Other liabilities (4) | 654 | 171 | 64,746 | 64,749 | 65,571 | 65,574 | ||||||||||||||||||||||||||||||
Subordinated debentures | – | – | 9,593 | 9,601 | 9,593 | 9,601 | ||||||||||||||||||||||||||||||
| (1) | Includes Customers’ liability under acceptances and financial instruments recognized in Other assets. |
| (2) | Business and government deposits include deposits from regulated deposit-taking institutions other than banks. |
| (3) | Bank deposits refer to deposits from regulated banks and central banks. |
| (4) | Includes Acceptances and financial instruments recognized in Other liabilities. |
5 Second Quarter 2022
8
Royal Bank of Canada
Note 3 Fair value of financial instruments (continued) |
Fair value of assets and liabilities measured at fai
r
value on a recurring basis
and classified using the fair valuehierarchy
| As at | ||||||||||||||||||||||||||||||||||||||||||
April 30, 2022 | October 31, 2021 | |||||||||||||||||||||||||||||||||||||||||
Fair value measurements using | Netting adjustments | | Fair value measurements using | Netting adjustments | | |||||||||||||||||||||||||||||||||||||
| (Millions of Canadian dollars) | Level 1 | Level 2 | Level 3 | Fair value | Level 1 | Level 2 | Level 3 | Fair value | ||||||||||||||||||||||||||||||||||
Financial assets | ||||||||||||||||||||||||||||||||||||||||||
Interest-bearing deposits with banks | $ | – | $ | 57,963 | $ | – | $ | $ | 57,963 | $ | – | $ | 56,896 | $ | – | $ | $ | 56,896 | ||||||||||||||||||||||||
Securities | ||||||||||||||||||||||||||||||||||||||||||
Trading | ||||||||||||||||||||||||||||||||||||||||||
Debt issued or guaranteed by: | ||||||||||||||||||||||||||||||||||||||||||
Canadian government (1) | ||||||||||||||||||||||||||||||||||||||||||
Federal | 8,179 | 1,785 | – | 9,964 | 8,977 | 2,380 | – | 11,357 | ||||||||||||||||||||||||||||||||||
Provincial and municipal | – | 11,111 | – | 11,111 | – | 11,068 | – | 11,068 | ||||||||||||||||||||||||||||||||||
U.S. federal, state, municipal and agencies (1) | 960 | 32,284 | 16 | 33,260 | 215 | 22,738 | 25 | 22,978 | ||||||||||||||||||||||||||||||||||
Other OECD government (2) | 3,032 | 4,012 | – | 7,044 | 2,729 | 5,730 | – | 8,459 | ||||||||||||||||||||||||||||||||||
Mortgage-backed securities (1) | – | 8 | – | 8 | – | 4 | – | 4 | ||||||||||||||||||||||||||||||||||
Asset-backed securities | ||||||||||||||||||||||||||||||||||||||||||
Non-CDO securities (3) | – | 1,126 | 2 | 1,128 | – | 891 | 2 | 893 | ||||||||||||||||||||||||||||||||||
Corporate debt and other debt | – | 23,521 | 5 | 23,526 | – | 23,085 | 25 | 23,110 | ||||||||||||||||||||||||||||||||||
| Equities | 52,685 | 3,281 | 1,759 | 57,725 | 56,826 | 3,015 | 1,530 | 61,371 | ||||||||||||||||||||||||||||||||||
64,856 | 77,128 | 1,782 | 143,766 | 68,747 | 68,911 | 1,582 | 139,240 | |||||||||||||||||||||||||||||||||||
Investment | ||||||||||||||||||||||||||||||||||||||||||
Debt issued or guaranteed by: | ||||||||||||||||||||||||||||||||||||||||||
Canadian government (1) | ||||||||||||||||||||||||||||||||||||||||||
Federal | 1,960 | 1,969 | – | 3,929 | 1,973 | 1,730 | – | 3,703 | ||||||||||||||||||||||||||||||||||
Provincial and municipal | – | 2,980 | – | 2,980 | – | 3,132 | – | 3,132 | ||||||||||||||||||||||||||||||||||
U.S. federal, state, municipal and agencies (1) | 109 | 31,273 | – | 31,382 | 12 | 34,815 | – | 34,827 | ||||||||||||||||||||||||||||||||||
Other OECD government | – | 6,542 | – | 6,542 | – | 5,956 | – | 5,956 | ||||||||||||||||||||||||||||||||||
Mortgage-backed securities (1) | – | 2,844 | 21 | 2,865 | – | 2,727 | 20 | 2,747 | ||||||||||||||||||||||||||||||||||
Asset-backed securities | ||||||||||||||||||||||||||||||||||||||||||
CDO | – | 7,159 | – | 7,159 | – | 7,074 | – | 7,074 | ||||||||||||||||||||||||||||||||||
Non-CDO securities | – | 539 | – | 539 | – | 586 | – | 586 | ||||||||||||||||||||||||||||||||||
Corporate debt and other debt | – | 24,663 | 149 | 24,812 | – | 19,625 | 152 | 19,777 | ||||||||||||||||||||||||||||||||||
Equities | 42 | 182 | 349 | 573 | 46 | 153 | 334 | 533 | ||||||||||||||||||||||||||||||||||
2,111 | 78,151 | 519 | 80,781 | 2,031 | 75,798 | 506 | 78,335 | |||||||||||||||||||||||||||||||||||
Assets purchased under reverse repurchase agreements and securities borrowed | – | 271,184 | – | 271,184 | – | 265,011 | – | 265,011 | ||||||||||||||||||||||||||||||||||
Loans | – | 11,650 | 782 | 12,432 | – | 11,501 | 1,077 | 12,578 | ||||||||||||||||||||||||||||||||||
Other | ||||||||||||||||||||||||||||||||||||||||||
Derivatives | ||||||||||||||||||||||||||||||||||||||||||
Interest rate contracts | – | 33,883 | 381 | 34,264 | – | 33,857 | 320 | 34,177 | ||||||||||||||||||||||||||||||||||
Foreign exchange contracts | – | 102,847 | 42 | 102,889 | – | 41,224 | 74 | 41,298 | ||||||||||||||||||||||||||||||||||
Credit derivatives | – | 256 | – | 256 | – | 34 | – | 34 | ||||||||||||||||||||||||||||||||||
Other contracts | 3,979 | 18,994 | 108 | 23,081 | 3,175 | 17,955 | 26 | 21,156 | ||||||||||||||||||||||||||||||||||
Valuation adjustments | – | (1,523 | ) | 20 | (1,503 | ) | – | (819 | ) | 9 | (810 | ) | ||||||||||||||||||||||||||||||
Total gross derivatives | 3,979 | 154,457 | 551 | 158,987 | 3,175 | 92,251 | 429 | 95,855 | ||||||||||||||||||||||||||||||||||
Netting adjustments | (2,783 | ) | (2,783 | ) | (314 | ) | (314 | ) | ||||||||||||||||||||||||||||||||||
Total derivatives | 156,204 | 95,541 | ||||||||||||||||||||||||||||||||||||||||
Other assets | 1,414 | 2,612 | 15 | 4,041 | 1,474 | 2,635 | – | 4,109 | ||||||||||||||||||||||||||||||||||
$ | 72,360 | $ | 653,145 | $ | 3,649 | $ | (2,783 | ) | $ | 726,371 | $ | 75,427 | $ | 573,003 | $ | 3,594 | $ | (314 | ) | $ | 651,710 | |||||||||||||||||||||
Financial liabilities | ||||||||||||||||||||||||||||||||||||||||||
Deposits | ||||||||||||||||||||||||||||||||||||||||||
Personal | $ | – | $ | 18,419 | $ | 157 | $ | $ | 18,576 | $ | – | $ | 18,498 | $ | 151 | $ | $ | 18,649 | ||||||||||||||||||||||||
Business and government | – | 143,738 | – | 143,738 | – | 132,369 | – | 132,369 | ||||||||||||||||||||||||||||||||||
Bank | – | 10,647 | – | 10,647 | – | 17,251 | – | 17,251 | ||||||||||||||||||||||||||||||||||
Other | ||||||||||||||||||||||||||||||||||||||||||
Obligations related to securities sold short | 17,067 | 22,397 | – | 39,464 | 18,345 | 19,496 | – | 37,841 | ||||||||||||||||||||||||||||||||||
Obligations related to assets sold under repurchase agreements and securities loaned | – | 252,308 | – | 252,308 | – | 236,147 | – | 236,147 | ||||||||||||||||||||||||||||||||||
Derivatives | ||||||||||||||||||||||||||||||||||||||||||
Interest rate contracts | – | 31,039 | 1,044 | 32,083 | – | 28,566 | 955 | 29,521 | ||||||||||||||||||||||||||||||||||
Foreign exchange contracts | – | 99,539 | 18 | 99,557 | – | 40,484 | 27 | 40,511 | ||||||||||||||||||||||||||||||||||
Credit derivatives | – | 102 | – | 102 | – | 120 | – | 120 | ||||||||||||||||||||||||||||||||||
Other contracts | 7,019 | 15,544 | 544 | 23,107 | 3,699 | 17,456 | 419 | 21,574 | ||||||||||||||||||||||||||||||||||
Valuation adjustments | – | (517 | ) | (8 | ) | (525 | ) | – | 38 | (11 | ) | 27 | ||||||||||||||||||||||||||||||
Total gross derivatives | 7,019 | 145,707 | 1,598 | 154,324 | 3,699 | 86,664 | 1,390 | 91,753 | ||||||||||||||||||||||||||||||||||
Netting adjustments | (2,783 | ) | (2,783 | ) | (314 | ) | (314 | ) | ||||||||||||||||||||||||||||||||||
Total derivatives | 151,541 | 91,439 | ||||||||||||||||||||||||||||||||||||||||
Other liabilities | 387 | (14 | ) | 3 | 376 | 258 | 560 | 7 | 825 | |||||||||||||||||||||||||||||||||
$ | 24,473 | $ | 593,202 | $ | 1,758 | $ | (2,783 | ) | $ | 616,650 | $ | 22,302 | $ | 510,985 | $ | 1,548 | $ | (314 | ) | $ | 534,521 | |||||||||||||||||||||
| (1) | As at April 30, 2022, residential and commercial mortgage-backed securities (MBS) included in all fair value levels of trading securities were $12,651 million and $nil(October 31, 2021 – 13,124 million and $nil), respectively, and in all fair value levels of Investment securities were $13,103$ million and $2,916million (October 31, 2021 – $13,542 million and $2,592 million), respectively. |
| (2) | Organisation for Economic Co-operation and Development (OECD). |
| (3) | Collateralized debt obligations (CDO). |
Royal Bank of Canada
9
Fair value measurements using significant unobservable inputs (Level 3 Instruments)
A financial instrument is classified as Level 3 in the fair value hierarchy if one or more of its unobservable inputs may significantly affect the measurement of its fair value. In preparing the financial statements, appropriate levels for these unobservable input parameters are chosen so that they are consistent with prevailing market evidence or management judgment. Due to the unobservable nature of the prices or rates, there may be uncertainty about the valuation of these Level 3 financial instruments.
During the three months ended April 30, 2022, there were no significant changes made to the valuation techniques and ranges and weighted averages of unobservable inputs used in the determination of fair value of Level 3 financial instruments. As at April 30, 2022, the impacts of adjusting one or more of the unobservable inputs by reasonably possible alternative assumptions did not change significantly from the impacts disclosed in our audited 2021 Annual Consolidated Financial Statements.
Changes in fair value measurement for instruments measured on a recurring basis and categorized in Level 3
For the three months ended April 30, 2022 | ||||||||||||||||||||||||||||||||||||
| (Millions of Canadian dollars) | Fair value at beginning of period | Gains (losses) included in earnings | Gains (losses) included in OCI | Purchases (issuances) | Settlement (sales) and other | Transfers into Level 3 | Transfers out of Level 3 | Fair value at end of period | Gains (losses) included in earnings for positions still held | |||||||||||||||||||||||||||
Assets | ||||||||||||||||||||||||||||||||||||
Securities | ||||||||||||||||||||||||||||||||||||
Trading | ||||||||||||||||||||||||||||||||||||
Debt issued or guaranteed by: | ||||||||||||||||||||||||||||||||||||
U.S. state, municipal and agencies | $ | 22 | $ | – | $ | – | $ | – | $ | (6 | ) | $ | – | $ | – | $ | 16 | $ | – | |||||||||||||||||
Asset-backed securities | ||||||||||||||||||||||||||||||||||||
Non-CDO securities | 2 | – | – | – | – | – | – | 2 | – | |||||||||||||||||||||||||||
Corporate debt and other debt | 15 | (1 | ) | – | – | – | – | (9 | ) | 5 | – | |||||||||||||||||||||||||
Equities | 1,689 | 4 | 11 | 79 | (25 | ) | 1 | – | 1,759 | (4 | ) | |||||||||||||||||||||||||
1,728 | 3 | 11 | 79 | (31 | ) | 1 | (9 | ) | 1,782 | (4 | ) | |||||||||||||||||||||||||
Investment | ||||||||||||||||||||||||||||||||||||
Mortgage-backed securities | 20 | – | 1 | – | – | – | – | 21 | n.a. | |||||||||||||||||||||||||||
Corporate debt and other debt | 155 | – | (6 | ) | – | – | – | – | 149 | n.a. | ||||||||||||||||||||||||||
Equities | 349 | – | (2 | ) | 2 | – | – | – | 349 | n.a. | ||||||||||||||||||||||||||
524 | – | (7 | ) | 2 | – | – | – | 519 | n.a. | |||||||||||||||||||||||||||
Loans | 679 | (23 | ) | (24 | ) | 161 | (1 | ) | 9 | (19 | ) | 782 | 38 | |||||||||||||||||||||||
Other | ||||||||||||||||||||||||||||||||||||
Net derivative balances (3) | ||||||||||||||||||||||||||||||||||||
Interest rate contracts | (555 | ) | (146 | ) | (3 | ) | 99 | (16 | ) | – | (42 | ) | (663 | ) | (163 | ) | ||||||||||||||||||||
Foreign exchange contracts | 7 | (17 | ) | – | 21 | 16 | – | (3 | ) | 24 | (12 | ) | ||||||||||||||||||||||||
Other contracts | (448 | ) | 123 | (3 | ) | (12 | ) | 6 | (117 | ) | 15 | (436 | ) | 107 | ||||||||||||||||||||||
Valuation adjustments | 39 | – | – | – | (11 | ) | – | – | 28 | – | ||||||||||||||||||||||||||
Other assets | – | – | – | 15 | – | – | – | 15 | – | |||||||||||||||||||||||||||
$ | 1,974 | $ | (60 | ) | $ | (26 | ) | $ | 365 | $ | (37 | ) | $ | (107 | ) | $ | (58 | ) | $ | 2,051 | $ | (34 | ) | |||||||||||||
Liabilities | ||||||||||||||||||||||||||||||||||||
Deposits | $ | (122 | ) | $ | (3 | ) | $ | – | $ | (52 | ) | $ | 12 | $ | (16 | ) | $ | 24 | $ | (157 | ) | $ | 8 | |||||||||||||
Other | ||||||||||||||||||||||||||||||||||||
Other liabilities | (7 | ) | – | – | – | 4 | – | – | (3 | ) | – | |||||||||||||||||||||||||
$ | (129 | ) | $ | (3 | ) | $ | – | $ | (52 | ) | $ | 16 | $ | (16 | ) | $ | 24 | $ | (160 | ) | $ | 8 | ||||||||||||||
60
Ro
yal Bank of CanadaNote 3 Fair value of financial instruments (continued) |
| For the three months ended April 30, 2021 | ||||||||||||||||||||||||||||||||||||
| (Millions of Canadian dollars) | Fair value at beginning of period | Gains (losses) included in earnings | Gains (losses) included in OCI (1) | Purchases (issuances) | Settlement (sales) and other (2) | Transfers into Level 3 | Transfers out of Level 3 | Fair value at end of period | Gains (losses) included in earnings for positions still held | |||||||||||||||||||||||||||
Assets | ||||||||||||||||||||||||||||||||||||
Securities | ||||||||||||||||||||||||||||||||||||
Trading | ||||||||||||||||||||||||||||||||||||
Debt issued or guaranteed by: | ||||||||||||||||||||||||||||||||||||
U.S. state, municipal and agencies | $ | 39 | $ | – | $ | (2 | ) | $ | – | $ | (4 | ) | $ | – | $ | – | $ | 33 | $ | – | ||||||||||||||||
Asset-backed securities | ||||||||||||||||||||||||||||||||||||
Non-CDO securities | 2 | – | – | – | – | – | – | 2 | – | |||||||||||||||||||||||||||
Corporate debt and other debt | 36 | (1 | ) | – | – | (4 | ) | – | (13 | ) | 18 | (1 | ) | |||||||||||||||||||||||
Equities | 1,332 | 30 | (33 | ) | 55 | (43 | ) | 25 | – | 1,366 | 50 | |||||||||||||||||||||||||
| 1,409 | 29 | (35 | ) | 55 | (51 | ) | 25 | (13 | ) | 1,419 | 49 | |||||||||||||||||||||||||
Investment | ||||||||||||||||||||||||||||||||||||
Mortgage-backed securities | 21 | – | (1 | ) | – | – | – | – | 20 | n.a. | ||||||||||||||||||||||||||
Corporate debt and other debt | 154 | – | (9 | ) | – | 1 | – | – | 146 | n.a. | ||||||||||||||||||||||||||
Equities | 336 | – | (14 | ) | – | – | – | – | 322 | n.a. | ||||||||||||||||||||||||||
| 511 | – | (24 | ) | – | 1 | – | – | 488 | n.a. | |||||||||||||||||||||||||||
Loans | 1,113 | (18 | ) | (15 | ) | 51 | (4 | ) | 54 | (36 | ) | 1,145 | 18 | |||||||||||||||||||||||
Other | ||||||||||||||||||||||||||||||||||||
Net derivative balances (3) | ||||||||||||||||||||||||||||||||||||
Interest rate contracts | (643 | ) | (32 | ) | – | 15 | (2 | ) | (6 | ) | 2 | (666 | ) | (32 | ) | |||||||||||||||||||||
Foreign exchange contracts | 42 | 12 | (2 | ) | 10 | (8 | ) | 6 | (14 | ) | 46 | 12 | ||||||||||||||||||||||||
Other contracts | (100 | ) | 14 | 2 | (39 | ) | – | (232 | ) | 14 | (341 | ) | 6 | |||||||||||||||||||||||
Valuation adjustments | 36 | – | – | – | (15 | ) | – | – | 21 | – | ||||||||||||||||||||||||||
Other assets | 9 | – | – | – | (7 | ) | – | – | 2 | – | ||||||||||||||||||||||||||
| $ | 2,377 | $ | 5 | $ | (74 | ) | $ | 92 | $ | (86 | ) | $ | (153 | ) | $ | (47 | ) | $ | 2,114 | $ | 53 | |||||||||||||||
Liabilities | ||||||||||||||||||||||||||||||||||||
Deposits | $ | (169 | ) | $ | (26 | ) | $ | 2 | $ | (47 | ) | $ | 34 | $ | (5 | ) | $ | 141 | $ | (70 | )�� | $ | 9 | |||||||||||||
Other | ||||||||||||||||||||||||||||||||||||
Other liabilities | (13 | ) | – | – | – | 2 | – | – | (11 | ) | – | |||||||||||||||||||||||||
| $ | (182 | ) | $ | (26 | ) | $ | 2 | $ | (47 | ) | $ | 36 | $ | (5 | ) | $ | 141 | $ | (81 | ) | $ | 9 | ||||||||||||||
Royal Bank of Canada
61
For the six months ended April 30, 2022 | ||||||||||||||||||||||||||||||||||||
| (Millions of Canadian dollars) | Fair value at beginning of period | Gains (losses) included in earnings | Gains (losses) included in OCI | Purchases (issuances) | Settlement (sales) and other | Transfers into Level 3 | Transfers out of Level 3 | Fair value at end of period | Gains (losses) included in earnings for positions still held | |||||||||||||||||||||||||||
Assets | ||||||||||||||||||||||||||||||||||||
Securities | ||||||||||||||||||||||||||||||||||||
Trading | ||||||||||||||||||||||||||||||||||||
Debt issued or guaranteed by: | ||||||||||||||||||||||||||||||||||||
U.S. state, municipal and agencies | $ | 25 | $ | – | $ | 1 | $ | – | $ | (10 | ) | $ | – | $ | – | $ | 16 | $ | – | |||||||||||||||||
Asset-backed securities | ||||||||||||||||||||||||||||||||||||
Non-CDO securities | 2 | – | – | – | – | – | – | 2 | – | |||||||||||||||||||||||||||
Corporate debt and other debt | 25 | (2 | ) | – | – | (5 | ) | – | (13 | ) | 5 | – | ||||||||||||||||||||||||
Equities | 1,530 | 78 | 34 | 161 | (45 | ) | 1 | – | 1,759 | 93 | ||||||||||||||||||||||||||
1,582 | 76 | 35 | 161 | (60 | ) | 1 | (13 | ) | 1,782 | 93 | ||||||||||||||||||||||||||
Investment | ||||||||||||||||||||||||||||||||||||
Mortgage-backed securities | 20 | – | 1 | – | – | – | – | 21 | n.a. | |||||||||||||||||||||||||||
Corporate debt and other debt | 152 | – | (3 | ) | – | – | – | – | 149 | n.a. | ||||||||||||||||||||||||||
Equities | 334 | – | 43 | 8 | (1 | ) | – | (35 | ) | 349 | n.a. | |||||||||||||||||||||||||
506 | – | 41 | 8 | (1 | ) | – | (35 | ) | 519 | n.a. | ||||||||||||||||||||||||||
Loans | 1,077 | (13 | ) | (32 | ) | 217 | (462 | ) | �� | 16 | (21 | ) | 782 | (46 | ) | |||||||||||||||||||||
Other | ||||||||||||||||||||||||||||||||||||
Net derivative balances (3) | ||||||||||||||||||||||||||||||||||||
Interest rate contracts | (635 | ) | (157 | ) | (2 | ) | 100 | 66 | – | (35 | ) | (663 | ) | 108 | ||||||||||||||||||||||
Foreign exchange contracts | 47 | (47 | ) | 1 | 21 | 12 | – | (10 | ) | 24 | 53 | |||||||||||||||||||||||||
Other contracts | (393 | ) | 184 | (11 | ) | (115 | ) | 48 | (193 | ) | 44 | (436 | ) | 166 | ||||||||||||||||||||||
Valuation adjustments | 20 | – | – | – | (11 | ) | 19 | – | 28 | – | ||||||||||||||||||||||||||
Other assets | – | – | – | 15 | – | – | 15 | – | ||||||||||||||||||||||||||||
$ | 2,204 | $ | 43 | $ | 32 | $ | 407 | $ | (408 | ) | $ | (157 | ) | $ | (70 | ) | $ | 2,051 | $ | 374 | ||||||||||||||||
Liabilities | ||||||||||||||||||||||||||||||||||||
Deposits | $ | (151 | ) | $ | (9 | ) | $ | (1 | ) | $ | (79 | ) | $ | 17 | $ | (36 | ) | $ | 102 | $ | (157 | ) | $ | (9 | ) | |||||||||||
Other | ||||||||||||||||||||||||||||||||||||
Other liabilities | (7 | ) | – | – | – | 4 | – | – | (3 | ) | – | |||||||||||||||||||||||||
$ | (158 | ) | $ | (9 | ) | $ | (1 | ) | $ | (79 | ) | $ | 21 | $ | (36 | ) | $ | 102 | $ | (160 | ) | $ | (9 | ) | ||||||||||||
6
2
Royal Bank of Canada
Note 3 Fair value of financial instruments (continued) |
| For the six months ended April 30, 2021 | ||||||||||||||||||||||||||||||||||||
| (Millions of Canadian dollars) | Fair value at beginning of period | Gains (losses) included in earnings | Gains (losses) included in OCI (1) | Purchases (issuances) | Settlement (sales) and other (2) | Transfers into Level 3 | Transfers out of Level 3 | Fair value at end of period | Gains (losses) included in earnings for positions still held | |||||||||||||||||||||||||||
Assets | ||||||||||||||||||||||||||||||||||||
Securities | ||||||||||||||||||||||||||||||||||||
Trading | ||||||||||||||||||||||||||||||||||||
Debt issued or guaranteed by: | ||||||||||||||||||||||||||||||||||||
U.S. state, municipal and agencies | $ | 44 | $ | – | $ | (3 | ) | $ | – | $ | (8 | ) | $ | – | $ | – | $ | 33 | $ | – | ||||||||||||||||
Asset-backed securities | ||||||||||||||||||||||||||||||||||||
Non-CDO securities | 2 | – | – | – | – | – | – | 2 | – | |||||||||||||||||||||||||||
Corporate debt and other debt | 30 | (1 | ) | – | 3 | (4 | ) | 14 | (24 | ) | 18 | (1 | ) | |||||||||||||||||||||||
Equities | 1,261 | 48 | (66 | ) | 164 | (66 | ) | 25 | – | 1,366 | 89 | |||||||||||||||||||||||||
| 1,337 | 47 | (69 | ) | 167 | (78 | ) | 39 | (24 | ) | 1,419 | 88 | |||||||||||||||||||||||||
Investment | ||||||||||||||||||||||||||||||||||||
Mortgage-backed securities | 27 | – | (7 | ) | – | – | – | – | 20 | n.a. | ||||||||||||||||||||||||||
Corporate debt and other debt | 160 | – | (16 | ) | – | 2 | – | – | 146 | n.a. | ||||||||||||||||||||||||||
Equities | 335 | – | (15 | ) | – | 2 | – | – | 322 | n.a. | ||||||||||||||||||||||||||
| 522 | – | (38 | ) | – | 4 | – | – | 488 | n.a. | |||||||||||||||||||||||||||
Loans | 1,070 | (23 | ) | (9 | ) | 133 | – | 70 | (96 | ) | 1,145 | 38 | ||||||||||||||||||||||||
Other | ||||||||||||||||||||||||||||||||||||
Net derivative balances (3) | ||||||||||||||||||||||||||||||||||||
Interest rate contracts | (588 | ) | (31 | ) | (2 | ) | 12 | (40 | ) | (9 | ) | (8 | ) | (666 | ) | (23 | ) | |||||||||||||||||||
Foreign exchange contracts | 22 | 25 | 1 | 15 | (14 | ) | 7 | (10 | ) | 46 | 29 | |||||||||||||||||||||||||
Other contracts | (301 | ) | 3 | 13 | (56 | ) | 47 | (224 | ) | 177 | (341 | ) | 20 | |||||||||||||||||||||||
Valuation adjustments | 40 | – | – | – | (19 | ) | – | – | 21 | – | ||||||||||||||||||||||||||
Other assets | 53 | (39 | ) | (2 | ) | – | (10 | ) | – | – | 2 | (39 | ) | |||||||||||||||||||||||
| $ | 2,155 | $ | (18 | ) | $ | (106 | ) | $ | 271 | $ | (110 | ) | $ | (117 | ) | $ | 39 | $ | 2,114 | $ | 113 | |||||||||||||||
Liabilities | ||||||||||||||||||||||||||||||||||||
Deposits | $ | (139 | ) | $ | (55 | ) | $ | 5 | $ | (92 | ) | $ | 47 | $ | (77 | ) | $ | 241 | $ | (70 | ) | $ | 12 | |||||||||||||
Other | ||||||||||||||||||||||||||||||||||||
Other liabilities | (38 | ) | 22 | 1 | – | 4 | – | – | (11 | ) | 22 | |||||||||||||||||||||||||
| $ | (177 | ) | $ | (33 | ) | $ | 6 | $ | (92 | ) | $ | 51 | $ | (77 | ) | $ | 241 | $ | (81 | ) | $ | 34 | ||||||||||||||
| (1) | These amounts include the foreign currency translation gains or losses arising on consolidation of foreign subsidiaries relating to the Level 3 instruments, where applicable. The unrealized losses on Investment securities recognized in other comprehensive income (OCI) were $1million for the three months ended April 30, 2022 (April 30, 2021 – losses of $8 million) and gains of $44 million for the six months ended April 30, 2022 (April 30, 2021 – losses of $11 million), excluding the translation gains or losses arising on consolidation. |
| (2) | Other includes amortization of premiums or discounts recognized in net income. |
| (3) | Net derivatives as at April 30, 2022 included derivative assets of $551 million (April 30, 2021 – $378 million) and derivative liabilities of $1,598million (April 30, 2021 – $1,318 million). |
| n.a. | not applicable |
Transfers between fair value hierarchy levels for instruments carried at fair value on a recurring basis
Transfers between Level 1 and Level 2, and transfers into and out of Level 3 are assumed to occur at the end of the period. For an asset or a liability that transfers into Level 3 during the period, the entire change in fair value for the period is excluded from the Gains (losses) included in earnings for positions still held column of the above reconciliation, whereas for transfers out of Level 3 during the period, the entire change in fair value for the period is included in the same column of the above reconciliation.
Transfers between Level 1 and 2 are dependent on whether fair value is obtained on the basis of quoted market prices in active markets (Level 1).
During the three months ended April 30, 2022, there were no significant transfers out of Level 1 to Level 2 or out of Level 2 to Level 1.
Transfers between Level 2 and Level 3 are primarily due to either a change in the market observability for an input, or a change in an unobservable input’s significance to a financial instrument’s fair value.
During the three months ended April 30, 2022, significant transfers out of Level 2 to Level 3 included $117 million of OTC equity options in Other contracts comprised of $57 million of derivative related assets and $174 million of derivative related liabilities, due to changes in the market observability of inputs.
During the three months ended April 3
no0
, 2022, there weresignificant transfers out of Level 3 to Level 2.
Royal Bank of Canada
6
3
Net interest income from financial instruments
Interest and dividend income arising from financial assets and financial liabilities and the associated costs of funding are reported in Net interest income.
| For the three months ended | For the six months ended | |||||||||||||||||
| (Millions of Canadian dollars) | April 30 2022 | April 30 2021 | April 30 2022 | April 30 2021 | ||||||||||||||
Interest and dividend income (1), (2) | ||||||||||||||||||
Financial instruments measured at fair value through profit or loss | $ | 1,575 | $ | 1,080 | $ | 2,994 | $ | 2,252 | ||||||||||
Financial instruments measured at fair value through other comprehensive income | 124 | 92 | 201 | 194 | ||||||||||||||
Financial instruments measured at amortized cost | 6,059 | 5,726 | 11,941 | 11,688 | ||||||||||||||
7,758 | 6,898 | 15,136 | 14,134 | |||||||||||||||
Interest expense (1) | ||||||||||||||||||
Financial instruments measured at fair value through profit or loss | 1,085 | 702 | 1,946 | 1,439 | ||||||||||||||
Financial instruments measured at amortized cost | 1,399 | 1,342 | 2,645 | 2,806 | ||||||||||||||
2,484 | 2,044 | 4,591 | 4,245 | |||||||||||||||
Net interest income | $ | 5,274 | $ | 4,854 | $ | 10,545 | $ | 9,889 | ||||||||||
| (1) | Excludes the following amounts related to our insurance operations and included in Insurance premiums, investment and fee income in the Interim Consolidated Statements of Income: for the three months ended April 30, 2022, Interest income of $147 million (April 30, 2021 – $139 million), and Interest expense of $2 million (April 30, 2021 – $1 million); for the six months ended April 30, 2022, Interest income of $343 million (April 30, 2021 – $288 million), and Interest expense of $3 million (April 30, 2021 – $2 million). |
| (2) | Includes dividend income for the three months ended April 30, 2022 of $690 million (April 30, 2021 – $609 million) and for the six months ended April 30, 2022 of $1,440 million (April 30, 2021 – $1,217 million), which is presented in Interest and dividend income in the Interim Consolidated Statements of Income. |
Note 4 Securities |
Unrealized gains and losses on securities at FVOCI
(1), (2)
| As at | ||||||||||||||||||||||||||||||||||
April 30, 2022 | October 31, 2021 | |||||||||||||||||||||||||||||||||
| (Millions of Canadian dollars) | Cost/ Amortized cost | Gross unrealized gains | Gross unrealized losses | Fair value | Cost/ Amortized cost | Gross unrealized gains | Gross unrealized losses | Fair value | ||||||||||||||||||||||||||
Debt issued or guaranteed by: | ||||||||||||||||||||||||||||||||||
Canadian government | ||||||||||||||||||||||||||||||||||
Federal (3) | $ | 4,194 | $ | 2 | $ | (267 | ) | $ | 3,929 | $ | 3,841 | $ | 1 | $ | (139 | ) | $ | 3,703 | ||||||||||||||||
Provincial and municipal | 3,441 | 1 | (462 | ) | 2,980 | 3,328 | 3 | (199 | ) | 3,132 | ||||||||||||||||||||||||
U.S. federal, state, municipal and agencies (3) | 32,156 | 235 | (1,009 | ) | 31,382 | 34,678 | 353 | (204 | ) | 34,827 | ||||||||||||||||||||||||
Other OECD government | 6,547 | 3 | (8 | ) | 6,542 | 5,949 | 8 | (1 | ) | 5,956 | ||||||||||||||||||||||||
Mortgage-backed securities (3) | 2,902 | – | (37 | ) | 2,865 | 2,757 | 2 | (12 | ) | 2,747 | ||||||||||||||||||||||||
Asset-backed securities | ||||||||||||||||||||||||||||||||||
CDO | 7,213 | – | (54 | ) | 7,159 | 7,074 | 1 | (1 | ) | 7,074 | ||||||||||||||||||||||||
Non-CDO securities | 543 | 1 | (5 | ) | 539 | 580 | 6 | – | 586 | |||||||||||||||||||||||||
Corporate debt and other debt | 24,858 | 32 | (78 | ) | 24,812 | 19,731 | 57 | (11 | ) | 19,777 | ||||||||||||||||||||||||
Equities | 275 | 301 | (3 | ) | 573 | 242 | 292 | (1 | ) | 533 | ||||||||||||||||||||||||
$ | 82,129 | $ | 575 | $ | (1,923 | ) | $ | 80,781 | $ | 78,180 | $ | 723 | $ | (568 | ) | $ | 78,335 | |||||||||||||||||
| (1) | Excludes $73,768 million of held-to-collect securities as at April 30, 2022 that are carried at amortized cost, net of allowance for credit losses (October 31, 2021 – $67,149 million). |
| (2) | Gross unrealized gains and losses includes $(13) million of allowance for credit losses on debt securities at FVOCI as at April 30, 2022 (October 31, 2021 – $(9) million) recognized in income and Other components of equity. |
| (3) | The majority of the MBS are residential. Cost/Amortized cost, Gross unrealized gains, Gross unrealized losses and Fair value related to commercial MBS are $2,962 million, $nil, $46 million and $2,916 million, respectively as at April 30, 2022 (October 31, 2021 – $2,603 million, $1 million, $12 million and $2,592 million, respectively). |
Allowance for credit losses on investment securities
The following tables reconcile the opening and closing allowance for debt securities at FVOCI and amortized cost by stage. Reconciling items include the following:
| • | Transfers between stages, which are presumed to occur before any corresponding remeasurement of the allowance. |
| • | Purchases, which reflect the allowance related to assets newly recognized during the period, including those assets that were derecognized following a modification of terms. |
| • | Sales and maturities, which reflect the allowance related to assets derecognized during the period without a credit loss being incurred, including those assets that were derecognized following a modification of terms. |
| • | Changes in risk, parameters and exposures, which comprise the impact of changes in model inputs or assumptions, including changes in forward-looking macroeconomic conditions; partial repayments; changes in the measurement following a transfer between stages; and unwinding of the time value discount due to the passage of time. |
6
4
Royal Bank of Canada
Note 4 Securities (continued) |
Allowance for credit losses – securities at FVOCI
(1)
| For the three months ended | ||||||||||||||||||||||||||||||||||||||
April 30, 2022 | April 30, 2021 | |||||||||||||||||||||||||||||||||||||
Performing | Impaired | Performing | Impaired | |||||||||||||||||||||||||||||||||||
| (Millions of Canadian dollars) | Stage 1 | Stage 2 | Stage 3 | Total | Stage 1 | Stage 2 | Stage 3 (2) | Total | ||||||||||||||||||||||||||||||
Balance at beginning of period | $ | 2 | $ | 1 | $ | (14 | ) | $ | (11 | ) | $ | 7 | $ | 3 | $ | (5 | ) | $ | 5 | |||||||||||||||||||
Provision for credit losses | ||||||||||||||||||||||||||||||||||||||
Transfers to stage 1 | – | – | – | – | – | – | – | – | ||||||||||||||||||||||||||||||
Transfers to stage 2 | – | – | – | – | – | – | – | – | ||||||||||||||||||||||||||||||
Transfers to stage 3 | – | – | – | – | – | – | – | – | ||||||||||||||||||||||||||||||
Purchases | 1 | – | – | 1 | 3 | – | – | 3 | ||||||||||||||||||||||||||||||
Sales and maturities | (1 | ) | – | – | (1 | ) | (3 | ) | (1 | ) | – | (4 | ) | |||||||||||||||||||||||||
Changes in risk, parameters and exposures | 1 | – | (3 | ) | (2 | ) | – | – | (2 | ) | (2 | ) | ||||||||||||||||||||||||||
Exchange rate and other | (1 | ) | 1 | – | – | – | (1 | ) | – | (1 | ) | |||||||||||||||||||||||||||
Balance at end of period | $ | 2 | $ | 2 | $ | (17 | ) | $ | (13 | ) | $ | 7 | $ | 1 | $ | (7 | ) | $ | 1 | |||||||||||||||||||
| For the six months ended | ||||||||||||||||||||||||||||||||||||||
April 30, 2022 | April 30, 2021 | |||||||||||||||||||||||||||||||||||||
Performing | Impaired | Performing | Impaired | |||||||||||||||||||||||||||||||||||
| (Millions of Canadian dollars) | Stage 1 | Stage 2 | Stage 3 | Total | Stage 1 | Stage 2 | Stage 3 (2) | Total | ||||||||||||||||||||||||||||||
Balance at beginning of perio d | $ | 2 | $ | 1 | $ | (12 | ) | $ | (9 | ) | $ | 12 | $ | – | $ | (4 | ) | $ | 8 | |||||||||||||||||||
Provision for credit losses | ||||||||||||||||||||||||||||||||||||||
Transfers to stage 1 | – | – | – | – | – | – | – | – | ||||||||||||||||||||||||||||||
Transfers to stage 2 | – | – | – | – | – | – | – | – | ||||||||||||||||||||||||||||||
Transfers to stage 3 | – | – | – | – | – | – | – | – | ||||||||||||||||||||||||||||||
Purchases | 1 | – | – | 1 | 5 | – | – | 5 | ||||||||||||||||||||||||||||||
Sales and maturities | (1 | ) | – | – | (1 | ) | (7 | ) | (1 | ) | – | (8 | ) | |||||||||||||||||||||||||
Changes in risk, parameters and exposures | 1 | – | (5 | ) | (4 | ) | (2 | ) | 3 | (4 | ) | (3 | ) | |||||||||||||||||||||||||
Exchange rate and other | (1 | ) | 1 | – | – | (1 | ) | (1 | ) | 1 | (1 | ) | ||||||||||||||||||||||||||
Balance at end of period | $ | 2 | $ | 2 | $ | (17 | ) | $ | (13 | ) | $ | 7 | $ | 1 | $ | (7 | ) | $ | 1 | |||||||||||||||||||
| (1) | Expected credit losses on debt securities at FVOCI are not separately recognized on the balance sheet as the related securities are recorded at fair value. The cumulative amount of credit losses recognized in income is presented in Other components of equity. |
| (2) | Reflects changes in the allowance for purchased credit impaired securities. |
Allowance for credit losses – securities at amortized cost
| For the three months ended | ||||||||||||||||||||||||||||||||||||||
April 30, 2022 | April 30, 2021 | |||||||||||||||||||||||||||||||||||||
Performing | Impaired | Performing | Impaired | |||||||||||||||||||||||||||||||||||
| (Millions of Canadian dollars) | Stage 1 | Stage 2 | Stage 3 | Total | Stage 1 | Stage 2 | Stage 3 | Total | ||||||||||||||||||||||||||||||
Balance at beginning of period | $ | 9 | $ | 17 | $ | – | $ | 26 | $ | 8 | $ | 18 | $ | – | $ | 26 | ||||||||||||||||||||||
Provision for credit losses | ||||||||||||||||||||||||||||||||||||||
Transfers to stage 1 | – | – | – | – | – | – | – | – | ||||||||||||||||||||||||||||||
Transfers to stage 2 | – | – | – | – | – | – | – | – | ||||||||||||||||||||||||||||||
Transfers to stage 3 | – | – | – | – | – | – | – | – | ||||||||||||||||||||||||||||||
Purchases | 2 | – | – | 2 | 4 | – | – | 4 | ||||||||||||||||||||||||||||||
Sales and maturities | – | – | – | – | (1 | ) | – | – | (1 | ) | ||||||||||||||||||||||||||||
Changes in risk, parameters and exposures | (2 | ) | (1 | ) | – | (3 | ) | – | (1 | ) | – | (1 | ) | |||||||||||||||||||||||||
Exchange rate and other | – | – | – | – | – | – | – | – | ||||||||||||||||||||||||||||||
Balance at end of period | $ | 9 | $ | 16 | $ | – | $ | 25 | $ | 11 | $ | 17 | $ | – | $ | 28 | ||||||||||||||||||||||
| For the six months ended | ||||||||||||||||||||||||||||||||||||||
April 30, 2022 | April 30, 2021 | |||||||||||||||||||||||||||||||||||||
Performing | Impaired | Performing | Impaired | |||||||||||||||||||||||||||||||||||
| (Millions of Canadian dollars) | Stage 1 | Stage 2 | Stage 3 | Total | Stage 1 | Stage 2 | Stage 3 | Total | ||||||||||||||||||||||||||||||
Balance at beginning of period | $ | 5 | $ | 18 | $ | – | $ | 23 | $ | 10 | $ | 19 | $ | – | $ | 29 | ||||||||||||||||||||||
Provision for credit losses | ||||||||||||||||||||||||||||||||||||||
Transfers to stage 1 | – | – | – | – | – | – | – | – | ||||||||||||||||||||||||||||||
Transfers to stage 2 | – | – | – | – | – | – | – | – | ||||||||||||||||||||||||||||||
Transfers to stage 3 | – | – | – | – | – | – | – | – | ||||||||||||||||||||||||||||||
Purchases | 8 | – | – | 8 | 7 | – | – | 7 | ||||||||||||||||||||||||||||||
Sales and maturities | (1 | ) | – | – | (1 | ) | (1 | ) | – | – | (1 | ) | ||||||||||||||||||||||||||
Changes in risk, parameters and exposures | (3 | ) | (2 | ) | – | (5 | ) | (5 | ) | – | – | (5 | ) | |||||||||||||||||||||||||
Exchange rate and other | – | – | – | – | – | (2 | ) | – | (2 | ) | ||||||||||||||||||||||||||||
Balance at end of period | $ | 9 | $ | 16 | $ | – | $ | 25 | $ | 11 | $ | 17 | $ | – | $ | 28 | ||||||||||||||||||||||
Royal Bank of Canada
6
5
Credit risk exposure by internal risk rating
The following table presents the fair value of debt securities at FVOCI and gross carrying amount of securities at amortized cost. Risk ratings are based on internal ratings used in the measurement of expected credit losses as at the reporting date, as outlined in the internal ratings maps in the Credit risk section of our 2021 Annual Report.
| As at | ||||||||||||||||||||||||||||||||||||||
April 30, 2022 | October 31, 2021 | |||||||||||||||||||||||||||||||||||||
Performing | Impaired | Performing | Impaired | |||||||||||||||||||||||||||||||||||
| (Millions of Canadian dollars) | Stage 1 | Stage 2 | Stage 3 | Total | Stage 1 | Stage 2 | Stage 3 (1) | Total | ||||||||||||||||||||||||||||||
Investment securities | ||||||||||||||||||||||||||||||||||||||
Securities at FVOCI | ||||||||||||||||||||||||||||||||||||||
Investment grade | $ | 79,395 | $ | 36 | $ | – | $ | 79,431 | $ | 77,147 | $ | 82 | $ | – | $ | 77,229 | ||||||||||||||||||||||
Non-investment grade | 617 | 14 | – | 631 | 423 | – | – | 423 | ||||||||||||||||||||||||||||||
Impaired | – | – | 146 | 146 | – | – | 150 | 150 | ||||||||||||||||||||||||||||||
80,012 | 50 | 146 | 80,208 | 77,570 | 82 | 150 | 77,802 | |||||||||||||||||||||||||||||||
Items not subject to impairment (2) | 573 | 533 | ||||||||||||||||||||||||||||||||||||
$ | 80,781 | $ | 78,335 | |||||||||||||||||||||||||||||||||||
Securities at amortized cost | ||||||||||||||||||||||||||||||||||||||
Investment grade | $ | 72,764 | $ | – | $ | – | $ | 72,764 | $ | 66,033 | $ | – | $ | – | $ | 66,033 | ||||||||||||||||||||||
Non-investment grade | 813 | 216 | – | 1,029 | 928 | 211 | – | 1,139 | ||||||||||||||||||||||||||||||
Impaired | – | – | – | – | – | – | – | – | ||||||||||||||||||||||||||||||
73,577 | 216 | – | 73,793 | 66,961 | 211 | – | 67,172 | |||||||||||||||||||||||||||||||
Allowance for credit losses | 9 | 16 | – | 25 | 5 | 18 | – | 23 | ||||||||||||||||||||||||||||||
Amortized cost | $ | 73,568 | $ | 200 | $ | – | $ | 73,768 | $ | 66,956 | $ | 193 | $ | – | $ | 67,149 | ||||||||||||||||||||||
| (1) | Reflects $146 million of purchased credit impaired securities (October 31, 2021 – $150 million). |
| (2) | Investment securities at FVOCI not subject to impairment represent equity securities designated as FVOCI. |
6 Second Quarter 2022
6
Royal Bank of Canada
Note 5 Loans and allowance for credit losses |
Allowance for credit losses
| For the three months ended | ||||||||||||||||||||||||||||||||||||||||||
April 30, 2022 | April 30, 2021 | |||||||||||||||||||||||||||||||||||||||||
| (Millions of Canadian dollars) | Balance at beginning of period | Provision for credit losses | Net write-offs | Exchange rate and other | Balance at end of period | Balance at beginning of period | Provision for credit losses | Net write-offs | Exchange rate and other | Balance at end of period | ||||||||||||||||||||||||||||||||
Retail | ||||||||||||||||||||||||||||||||||||||||||
Residential mortgages | $ | 409 | $ | (16 | ) | $ | (7 | ) | $ | 2 | $ | 388 | $ | 512 | $ | 2 | $ | (7 | ) | $ | (12 | ) | $ | 495 | ||||||||||||||||||
Personal | 1,038 | (39 | ) | (56 | ) | – | 943 | 1,315 | 42 | (79 | ) | (3 | ) | 1,275 | ||||||||||||||||||||||||||||
Credit cards | 870 | 8 | (83 | ) | – | 795 | 1,201 | 17 | (81 | ) | (2 | ) | 1,135 | |||||||||||||||||||||||||||||
Small business | 178 | 5 | (6 | ) | 2 | 179 | 143 | 1 | (5 | ) | 50 | 189 | ||||||||||||||||||||||||||||||
Wholesale | 1,811 | (246 | ) | (15 | ) | (9 | ) | 1,541 | 2,622 | (143 | ) | (36 | ) | (132 | ) | 2,311 | ||||||||||||||||||||||||||
Customers’ liability under acceptances | 83 | (42 | ) | – | – | 41 | 121 | (2 | ) | – | 1 | 120 | ||||||||||||||||||||||||||||||
$ | 4,389 | $ | (330 | ) | $ | (167 | ) | $ | (5 | ) | $ | 3,887 | $ | 5,914 | $ | (83 | ) | $ | (208 | ) | $ | (98 | ) | $ | 5,525 | |||||||||||||||||
Presented as: | ||||||||||||||||||||||||||||||||||||||||||
Allowance for loan losses | $ | 4,047 | $ | 3,566 | $ | 5,478 | $ | 5,146 | ||||||||||||||||||||||||||||||||||
Other liabilities – Provisions | 251 | 275 | 309 | 227 | ||||||||||||||||||||||||||||||||||||||
Customers’ liability under acceptances | 83 | 41 | 121 | 120 | ||||||||||||||||||||||||||||||||||||||
Other components of equity | 8 | 5 | 6 | 32 | ||||||||||||||||||||||||||||||||||||||
| For the six months ended | ||||||||||||||||||||||||||||||||||||||||||
April 30, 2022 | April 30, 2021 | |||||||||||||||||||||||||||||||||||||||||
| (Millions of Canadian dollars) | Balance at beginning of period | Provision for credit losses | Net write-offs | Exchange rate and other | Balance at end of period | Balance at beginning of period | Provision for credit losses | Net write-offs | Exchange rate and other | Balance at end of period | ||||||||||||||||||||||||||||||||
Retail | ||||||||||||||||||||||||||||||||||||||||||
Residential mortgages | $ | 416 | $ | (22 | ) | $ | (12 | ) | $ | 6 | $ | 388 | $ | 518 | $ | 17 | $ | (14 | ) | $ | (26 | ) | $ | 495 | ||||||||||||||||||
Personal | 1,079 | (21 | ) | (112 | ) | (3 | ) | 943 | 1,309 | 111 | (138 | ) | (7 | ) | 1,275 | |||||||||||||||||||||||||||
Credit cards | 875 | 73 | (154 | ) | 1 | 795 | 1,246 | 42 | (150 | ) | (3 | ) | 1,135 | |||||||||||||||||||||||||||||
Small business | 177 | 8 | (10 | ) | 4 | 179 | 140 | 9 | (10 | ) | 50 | 189 | ||||||||||||||||||||||||||||||
Wholesale | 1,797 | (234 | ) | (21 | ) | (1 | ) | 1,541 | 2,795 | (154 | ) | (122 | ) | (208 | ) | 2,311 | ||||||||||||||||||||||||||
Customers’ liability under acceptances | 75 | (34 | ) | – | – | 41 | 107 | 13 | – | – | 120 | |||||||||||||||||||||||||||||||
$ | 4,419 | $ | (230 | ) | $ | (309 | ) | $ | 7 | $ | 3,887 | $ | 6,115 | $ | 38 | $ | (434 | ) | $ | (194 | ) | $ | 5,525 | |||||||||||||||||||
Presented as: | ||||||||||||||||||||||||||||||||||||||||||
Allowance for loan losses | $ | 4,089 | $ | 3,566 | $ | 5,639 | $ | 5,146 | ||||||||||||||||||||||||||||||||||
Other liabilities – Provisions | 241 | 275 | 363 | 227 | ||||||||||||||||||||||||||||||||||||||
Customers’ liability under acceptances | 75 | 41 | 107 | 120 | ||||||||||||||||||||||||||||||||||||||
Other components of equity | 14 | 5 | 6 | 32 | ||||||||||||||||||||||||||||||||||||||
The following table reconciles the opening and closing for each major product of loans and commitments as determined by our modelled, scenario-weighted allowance and the application of expert credit judgment as applicable. Reconciling items include the following:
| • | Transfers between stages, which are presumed to occur before any corresponding remeasurements of the allowance. |
| • | Originations, which reflect the allowance related to assets newly recognized during the period, including those assets that were derecognized following a modification of terms. |
| • | Maturities, which reflect the allowance related to assets derecognized during the period without a credit loss being incurred, including those assets that were derecognized following a modification of terms. |
| • | Changes in risk, parameters and exposures, which comprise the impact of changes in model inputs or assumptions, including changes in forward-looking macroeconomic conditions; partial repayments and additional draws on existing facilities; changes in the measurement following a transfer between stages; and unwinding of the time value discount due to the passage of time in stage 1 and stage 2. |
Royal Bank of Canada
7
Allowance for credit losses – Retail and wholesale loans
| For the three months ended | ||||||||||||||||||||||||||||||||||||||
April 30, 2022 | April 30, 2021 | |||||||||||||||||||||||||||||||||||||
Performing | Impaired | Performing | Impaired | |||||||||||||||||||||||||||||||||||
| (Millions of Canadian dollars) | Stage 1 | Stage 2 | Stage 3 | Total | Stage 1 | Stage 2 | Stage 3 | Total | ||||||||||||||||||||||||||||||
Residential mortgages | ||||||||||||||||||||||||||||||||||||||
Balance at beginning of period | $ | 187 | $ | 85 | $ | 137 | $ | 409 | $ | 192 | $ | 162 | $ | 158 | $ | 512 | ||||||||||||||||||||||
Provision for credit losses | ||||||||||||||||||||||||||||||||||||||
Transfers to stage 1 | 36 | (31 | ) | (5 | ) | – | 46 | (41 | ) | (5 | ) | – | ||||||||||||||||||||||||||
Transfers to stage 2 | (4 | ) | 5 | (1 | ) | – | (4 | ) | 4 | – | – | |||||||||||||||||||||||||||
Transfers to stage 3 | – | (8 | ) | 8 | – | (1 | ) | (14 | ) | 15 | – | |||||||||||||||||||||||||||
Originations | 29 | – | – | 29 | 23 | – | – | 23 | ||||||||||||||||||||||||||||||
Maturities | (5 | ) | (1 | ) | – | (6 | ) | (10 | ) | (14 | ) | – | (24 | ) | ||||||||||||||||||||||||
Changes in risk, parameters and exposures | (60 | ) | 20 | 1 | (39 | ) | (52 | ) | 55 | – | 3 | |||||||||||||||||||||||||||
Write-offs | – | – | (10 | ) | (10 | ) | – | – | (10 | ) | (10 | ) | ||||||||||||||||||||||||||
Recoveries | – | – | 3 | 3 | – | – | 3 | 3 | ||||||||||||||||||||||||||||||
Exchange rate and other | 1 | 1 | – | 2 | (2 | ) | (4 | ) | (6 | ) | (12 | ) | ||||||||||||||||||||||||||
Balance at end of period | $ | 184 | $ | 71 | $ | 133 | $ | 388 | $ | 192 | $ | 148 | $ | 155 | $ | 495 | ||||||||||||||||||||||
Personal | ||||||||||||||||||||||||||||||||||||||
Balance at beginning of period | $ | 404 | $ | 547 | $ | 87 | $ | 1,038 | $ | 476 | $ | 721 | $ | 118 | $ | 1,315 | ||||||||||||||||||||||
Provision for credit losses | ||||||||||||||||||||||||||||||||||||||
Transfers to stage 1 | 157 | (157 | ) | – | – | 145 | (144 | ) | (1 | ) | – | |||||||||||||||||||||||||||
Transfers to stage 2 | (39 | ) | 39 | – | – | (25 | ) | 25 | – | – | ||||||||||||||||||||||||||||
Transfers to stage 3 | – | (13 | ) | 13 | – | – | (18 | ) | 18 | – | ||||||||||||||||||||||||||||
Originations | 22 | – | – | 22 | 28 | – | – | 28 | ||||||||||||||||||||||||||||||
Maturities | (17 | ) | (25 | ) | – | (42 | ) | (25 | ) | (42 | ) | – | (67 | ) | ||||||||||||||||||||||||
Changes in risk, parameters and exposures | ( 216 | ) | 159 | 38 | (19 | ) | (108 | ) | 140 | 49 | 81 | |||||||||||||||||||||||||||
Write-offs | – | – | (89 | ) | (89 | ) | – | – | (112 | ) | (112 | ) | ||||||||||||||||||||||||||
Recoveries | – | – | 33 | 33 | – | – | 33 | 33 | ||||||||||||||||||||||||||||||
Exchange rate and other | (1 | ) | – | 1 | – | – | (2 | ) | (1 | ) | (3 | ) | ||||||||||||||||||||||||||
Balance at end of period | $ | 310 | $ | 550 | $ | 83 | $ | 943 | $ | 491 | $ | 680 | $ | 104 | $ | 1,275 | ||||||||||||||||||||||
Credit cards | ||||||||||||||||||||||||||||||||||||||
Balance at beginning of period | $ | 226 | $ | 644 | $ | – | $ | 870 | $ | 353 | $ | 848 | $ | – | $ | 1,201 | ||||||||||||||||||||||
Provision for credit losses | ||||||||||||||||||||||||||||||||||||||
Transfers to stage 1 | 129 | (129 | ) | – | – | 152 | (152 | ) | – | – | ||||||||||||||||||||||||||||
Transfers to stage 2 | (28 | ) | 28 | – | – | (28 | ) | 28 | – | – | ||||||||||||||||||||||||||||
Transfers to stage 3 | – | (81 | ) | 81 | – | – | (76 | ) | 76 | – | ||||||||||||||||||||||||||||
Originations | 2 | – | – | 2 | 1 | – | – | 1 | ||||||||||||||||||||||||||||||
Maturities | (2 | ) | (7 | ) | – | (9 | ) | (2 | ) | (7 | ) | – | (9 | ) | ||||||||||||||||||||||||
Changes in risk, parameters and exposures | (159 | ) | 172 | 2 | 15 | (149 | ) | 168 | 6 | 25 | ||||||||||||||||||||||||||||
Write-offs | – | – | (126 | ) | (126 | ) | – | – | (121 | ) | (121 | ) | ||||||||||||||||||||||||||
Recoveries | – | – | 43 | 43 | – | – | 40 | 40 | ||||||||||||||||||||||||||||||
Exchange rate and other | 1 | (1 | ) | – | – | (1 | ) | – | (1 | ) | (2 | ) | ||||||||||||||||||||||||||
Balance at end of period | $ | 169 | $ | 626 | $ | – | $ | 795 | $ | 326 | $ | 809 | $ | – | $ | 1,135 | ||||||||||||||||||||||
Small business | ||||||||||||||||||||||||||||||||||||||
Balance at beginning of period | $ | 87 | $ | 56 | $ | 35 | $ | 178 | $ | 74 | $ | 33 | $ | 36 | $ | 143 | ||||||||||||||||||||||
Provision for credit losses | ||||||||||||||||||||||||||||||||||||||
Transfers to st a ge 1 | 4 | (4 | ) | – | – | 26 | (26 | ) | – | – | ||||||||||||||||||||||||||||
Transfers to stage 2 | (6 | ) | 6 | – | – | (5 | ) | 5 | – | – | ||||||||||||||||||||||||||||
Transfers to stage 3 | – | (1 | ) | 1 | – | – | – | – | – | |||||||||||||||||||||||||||||
Originations | 8 | – | – | 8 | 8 | – | – | 8 | ||||||||||||||||||||||||||||||
Maturities | (6 | ) | (5 | ) | – | (11 | ) | (5 | ) | (3 | ) | – | (8 | ) | ||||||||||||||||||||||||
Changes in risk, parameters and exposures | (13 | ) | 13 | 8 | 8 | (39 | ) | 32 | 8 | 1 | ||||||||||||||||||||||||||||
Write-offs | – | – | (9 | ) | (9 | ) | – | – | (7 | ) | (7 | ) | ||||||||||||||||||||||||||
Recoveries | – | – | 3 | 3 | – | – | 2 | 2 | ||||||||||||||||||||||||||||||
Exchange rate and other | 3 | 1 | (2 | ) | 2 | 22 | 30 | (2 | ) | 50 | ||||||||||||||||||||||||||||
Balance at end of period | $ | 77 | $ | 66 | $ | 36 | $ | 179 | $ | 81 | $ | 71 | $ | 37 | $ | 189 | ||||||||||||||||||||||
Wholesale | ||||||||||||||||||||||||||||||||||||||
Balance at beginning of period | $ | 580 | $ | 765 | $ | 466 | $ | 1,811 | $ | 895 | $ | 1,145 | $ | 582 | $ | 2,622 | ||||||||||||||||||||||
Provision for credit losses | ||||||||||||||||||||||||||||||||||||||
Transfers to stage 1 | 160 | (158 | ) | (2 | ) | – | 126 | (123 | ) | (3 | ) | – | ||||||||||||||||||||||||||
Transfers to stage 2 | (23 | ) | 23 | – | – | (40 | ) | 52 | (12 | ) | – | |||||||||||||||||||||||||||
Transfers to stage 3 | (1 | ) | (23 | ) | 24 | – | (1 | ) | (22 | ) | 23 | – | ||||||||||||||||||||||||||
Originations | 127 | – | – | 127 | 153 | – | – | 153 | ||||||||||||||||||||||||||||||
Maturities | (92 | ) | (84 | ) | – | (176 | ) | (133 | ) | (135 | ) | – | (268 | ) | ||||||||||||||||||||||||
Changes in risk, parameters and exposures | (267 | ) | 64 | 6 | (197 | ) | (194 | ) | 163 | 3 | (28 | ) | ||||||||||||||||||||||||||
Write-offs | – | – | (26 | ) | (26 | ) | – | – | (51 | ) | (51 | ) | ||||||||||||||||||||||||||
Recoveries | – | – | 11 | 11 | – | – | 15 | 15 | ||||||||||||||||||||||||||||||
Exchange rate and other | (1 | ) | 3 | (11 | ) | (9 | ) | (42 | ) | (56 | ) | (34 | ) | (132 | ) | |||||||||||||||||||||||
Balance at end of period | $ | 483 | $ | 590 | $ | 468 | $ | 1,541 | $ | 764 | $ | 1,024 | $ | 523 | $ | 2,311 | ||||||||||||||||||||||
6
8
Royal Bank of Canada Second Quarter 2022Note 5 Loans and allowance for credit losses (continued) |
| For the six months ended | ||||||||||||||||||||||||||||||||||||||
April 30, 2022 | April 30, 2021 | |||||||||||||||||||||||||||||||||||||
Performing | Impaired | Performing | Impaired | |||||||||||||||||||||||||||||||||||
| (Millions of Canadian dollars) | Stage 1 | Stage 2 | Stage 3 | Total | Stage 1 | Stage 2 | Stage 3 | Total | ||||||||||||||||||||||||||||||
Residential mortgages | ||||||||||||||||||||||||||||||||||||||
Balance at beginning of period | $ | 186 | $ | 92 | $ | 138 | $ | 416 | $ | 206 | $ | 160 | $ | 152 | $ | 518 | ||||||||||||||||||||||
Provision for credit losses | ||||||||||||||||||||||||||||||||||||||
Transfers to stage 1 | 60 | (50 | ) | (10 | ) | – | 120 | (110 | ) | (10 | ) | – | ||||||||||||||||||||||||||
Transfers to stage 2 | (6 | ) | 7 | (1 | ) | – | (10 | ) | 12 | (2 | ) | – | ||||||||||||||||||||||||||
Transfers to stage 3 | (1 | ) | (15 | ) | 16 | – | (1 | ) | (27 | ) | 28 | – | ||||||||||||||||||||||||||
Originations | 59 | – | – | 59 | 53 | – | – | 53 | ||||||||||||||||||||||||||||||
Maturities | (12 | ) | (4 | ) | – | (16 | ) | (16 | ) | (18 | ) | – | (34 | ) | ||||||||||||||||||||||||
Changes in risk, parameters and exposures | (104 | ) | 39 | – | (65 | ) | (156 | ) | 141 | 13 | (2 | ) | ||||||||||||||||||||||||||
Write-offs | – | – | (20 | ) | (20 | ) | – | – | (19 | ) | (19 | ) | ||||||||||||||||||||||||||
Recoveries | – | – | 8 | 8 | – | – | 5 | 5 | ||||||||||||||||||||||||||||||
Exchange rate and other | 2 | 2 | 2 | 6 | (4 | ) | (10 | ) | (12 | ) | (26 | ) | ||||||||||||||||||||||||||
Balance at end of period | $ | 184 | $ | 71 | $ | 133 | $ | 388 | $ | 192 | $ | 148 | $ | 155 | $ | 495 | ||||||||||||||||||||||
Personal | ||||||||||||||||||||||||||||||||||||||
Balance at beginning of period | $ | 422 | $ | 569 | $ | 88 | $ | 1,079 | $ | 480 | $ | 733 | $ | 96 | $ | 1,309 | ||||||||||||||||||||||
Provision for credit losses | ||||||||||||||||||||||||||||||||||||||
Transfers to stage 1 | 327 | (326 | ) | (1 | ) | – | 342 | (340 | ) | (2 | ) | – | ||||||||||||||||||||||||||
Transfers to stage 2 | (61 | ) | 61 | – | – | (52 | ) | 52 | – | – | ||||||||||||||||||||||||||||
Transfers to stage 3 | (1 | ) | (25 | ) | 26 | – | (1 | ) | (32 | ) | 33 | – | ||||||||||||||||||||||||||
Originations | 48 | – | – | 48 | 61 | – | – | 61 | ||||||||||||||||||||||||||||||
Maturities | (38 | ) | (50 | ) | – | (88 | ) | (47 | ) | (69 | ) | – | (116 | ) | ||||||||||||||||||||||||
Changes in risk, parameters and exposures | (387 | ) | 321 | 85 | 19 | (290 | ) | 338 | 118 | 166 | ||||||||||||||||||||||||||||
Write-offs | – | – | (175 | ) | (175 | ) | – | – | (206 | ) | (206 | ) | ||||||||||||||||||||||||||
Recoveries | – | – | 63 | 63 | – | – | 68 | 68 | ||||||||||||||||||||||||||||||
Exchange rate and other | – | – | (3 | ) | (3 | ) | (2 | ) | (2 | ) | (3 | ) | (7 | ) | ||||||||||||||||||||||||
Balance at end of period | $ | 310 | $ | 550 | $ | 83 | $ | 943 | $ | 491 | $ | 680 | $ | 104 | $ | 1,275 | ||||||||||||||||||||||
Credit cards | ||||||||||||||||||||||||||||||||||||||
Balance at beginning of period | $ | 233 | $ | 642 | $ | – | $ | 875 | $ | 364 | $ | 882 | $ | – | $ | 1,246 | ||||||||||||||||||||||
Provision for credit losses | ||||||||||||||||||||||||||||||||||||||
Transfers to stage 1 | 275 | (275 | ) | – | – | 378 | (378 | ) | – | – | ||||||||||||||||||||||||||||
Transfers to stage 2 | (51 | ) | 51 | – | – | (58 | ) | 58 | – | – | ||||||||||||||||||||||||||||
Transfers to stage 3 | (1 | ) | (151 | ) | 152 | – | (2 | ) | (136 | ) | 138 | – | ||||||||||||||||||||||||||
Originations | 6 | – | – | 6 | 3 | – | – | 3 | ||||||||||||||||||||||||||||||
Maturities | (3 | ) | (14 | ) | – | (17 | ) | (4 | ) | (15 | ) | – | (19 | ) | ||||||||||||||||||||||||
Changes in risk, parameters and exposures | (291 | ) | 373 | 2 | 84 | (354 | ) | 399 | 13 | 58 | ||||||||||||||||||||||||||||
Write-offs | – | – | (238 | ) | (238 | ) | – | – | (227 | ) | (227 | ) | ||||||||||||||||||||||||||
Recoveries | – | – | 84 | 84 | – | – | 77 | 77 | ||||||||||||||||||||||||||||||
Exchange rate and other | 1 | – | – | 1 | (1 | ) | (1 | ) | (1 | ) | (3 | ) | ||||||||||||||||||||||||||
Balance at end of period | $ | 169 | $ | 626 | $ | – | $ | 795 | $ | 326 | $ | 809 | $ | – | $ | 1,135 | ||||||||||||||||||||||
Small business | ||||||||||||||||||||||||||||||||||||||
Balance at beginning of period | $ | 88 | $ | 55 | $ | 34 | $ | 177 | $ | 78 | $ | 29 | $ | 33 | $ | 140 | ||||||||||||||||||||||
Provision for credit losses | ||||||||||||||||||||||||||||||||||||||
Transfers to stage 1 | 9 | (9 | ) | – | – | 39 | (39 | ) | – | – | ||||||||||||||||||||||||||||
Transfers to stage 2 | (8 | ) | 8 | – | – | (6 | ) | 6 | – | – | ||||||||||||||||||||||||||||
Transfers to stage 3 | – | (2 | ) | 2 | – | – | (1 | ) | 1 | – | ||||||||||||||||||||||||||||
Originations | 17 | – | – | 17 | 17 | – | – | 17 | ||||||||||||||||||||||||||||||
Maturities | (11 | ) | (12 | ) | – | (23 | ) | (11 | ) | (6 | ) | – | (17 | ) | ||||||||||||||||||||||||
Changes in risk, parameters and exposures | (23 | ) | 24 | 13 | 14 | (59 | ) | 52 | 16 | 9 | ||||||||||||||||||||||||||||
Write-offs | – | – | (15 | ) | (15 | ) | – | – | (14 | ) | (14 | ) | ||||||||||||||||||||||||||
Recoveries | – | – | 5 | 5 | – | – | 4 | 4 | ||||||||||||||||||||||||||||||
Exchange rate and other | 5 | 2 | (3 | ) | 4 | 23 | 30 | (3 | ) | 50 | ||||||||||||||||||||||||||||
Balance at end of period | $ | 77 | $ | 66 | $ | 36 | $ | 179 | $ | 81 | $ | 71 | $ | 37 | $ | 189 | ||||||||||||||||||||||
Wholesale | ||||||||||||||||||||||||||||||||||||||
Balance at beginning of period | $ | 566 | $ | 794 | $ | 437 | $ | 1,797 | $ | 995 | $ | 1,132 | $ | 668 | $ | 2,795 | ||||||||||||||||||||||
Provision for credit losses | ||||||||||||||||||||||||||||||||||||||
Transfers to stage 1 | 268 | (265 | ) | (3 | ) | – | 255 | (252 | ) | (3 | ) | – | ||||||||||||||||||||||||||
Transfers to stage 2 | (41 | ) | 41 | – | – | (87 | ) | 113 | (26 | ) | – | |||||||||||||||||||||||||||
Transfers to stage 3 | (2 | ) | (27 | ) | 29 | – | (2 | ) | (37 | ) | 39 | – | ||||||||||||||||||||||||||
Originations | 283 | – | – | 283 | 360 | – | – | 360 | ||||||||||||||||||||||||||||||
Maturities | (198 | ) | (191 | ) | – | (389 | ) | (298 | ) | (274 | ) | – | (572 | ) | ||||||||||||||||||||||||
Changes in risk, parameters and exposures | (396 | ) | 224 | 44 | (128 | ) | (401 | ) | 420 | 39 | 58 | |||||||||||||||||||||||||||
Write-offs | – | – | (49 | ) | (49 | ) | – | – | (149 | ) | (149 | ) | ||||||||||||||||||||||||||
Recoveries | – | – | 28 | 28 | – | – | 27 | 27 | ||||||||||||||||||||||||||||||
Exchange rate and other | 3 | 14 | (18 | ) | (1 | ) | (58 | ) | (78 | ) | (72 | ) | (208 | ) | ||||||||||||||||||||||||
| Balance at end of period | $ | 483 | $ | 590 | $ | 468 | $ | 1,541 | $ | 764 | $ | 1,024 | $ | 523 | $ | 2,311 | ||||||||||||||||||||||
Royal Bank of Canada
9
Key inputs and assumptions
The following provides an update on the key inputs and assumptions used in the m
e
asurement of expected credit losses. For further details, refer to Note 2 and Note 5 of our audited 2021 Annual Consolidated Financial Statements.While the economic impact from the COVID-19 pandemic has eased in most regions with recoveries in travel and hospitality sectors contributing to near-term growth momentum, the COVID-19 pandemic continues to impact goods manufacturing and supply. Supply chain disruptions and rising commodity prices, further impacted by the conflict between Russia and Ukraine, are adding to inflationary pressures. Central banks are expected to continue raising interest rates at an aggressive pace in response to rising inflation and low unemployment rates. In light of the ongoing uncertainty of the impact of these factors on the economic outlook, our allowances continue to require the application of heightened judgment.
To reflect relevant risk factors not captured in our modelled results, we applied expert credit judgment in determining significant increases in credit risk since origination and our weighted allowance for credit losses. While the degree of uncertainty associated with the impact of the COVID-19 pandemic on our allowance estimates has reduced, the level of expert credit judgment applied in measurement of our allowances remains elevated as compared to pre-pandemic levels. We applied quantitative and qualitative adjustments for the impacts of the unprecedented macroeconomic environment, including the continued impact of government support programs in offsetting the effect of COVID-19 related unemployment on the economy and on mitigating the losses for the sectors most sensitive to the economic impact of the COVID-19 pandemic.
The easing economic impact from the COVID-19 pandemic, tempered by intensifying inflationary pressures, accelerated central bank interest rate increases, and heightened geopolitical risks, have been reflected through changes to our scenario design and weights.
Our base scenario reflects low unemployment rates, high inflation, supply chain pressures, and increased expectations for central banks to increase interest rates at an aggressive pace. Rising interest rates are expected to slow GDP growth later this year and into calendar 2023.
Downside scenarios, including two additional and more severe downside scenarios designed for the energy and real estate sectors, reflect the possibility of a macroeconomic shock beginning in calendar Q3 2022. Conditions are expected to deteriorate from Q2 2022 levels for up to 18 months, followed by a recovery for the remainder of the period. These scenarios assume monetary policy responses that return the economy to a long-run, sustainable growth rate within the forecast period. The possibility of a prolonged recovery period following the macroeconomic shock, including further monetary policy responses to elevated inflation rates which may increase credit risk as compared to our base scenario, is reflected in our general downside scenario.
The upside scenario reflects slightly stronger economic growth than the base scenario, without prompting a further offsetting monetary policy response as compared to our base scenario, followed by a return to a long-run sustainable growth rate within the forecast period.
70
Royal Bank of Canada
Note 5 Loans and allowance for credit losses (continued) |
The following provides additional detail about our forecasts for certain key macroeconomic variables used in the models to estimate ACL:
| • | Unemployment In our base forecast, calendar Q2 2022 unemployment rates are expected to decrease to 5.4%in Canada, and remain unchanged 3.8% from Q1 2022 atin the U.S. Both Canadian and U.S. unemployment rates have improved to below long run equilibrium and are expected to return to equilibrium by the end of calendar 2023 in Canada and end of calendar 2025 in the U.S. |
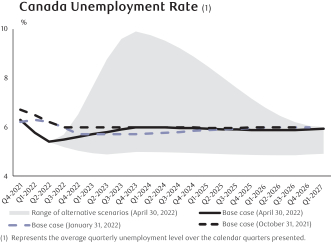 |  |
| • | Gross Domestic Product (GDP) |
 | 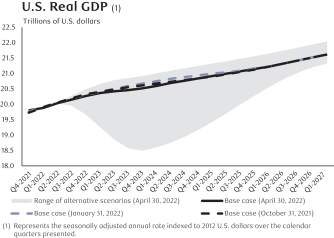 |
| • | Oil price (West Texas Intermediate in US$) |
| • | Canadian housing price index de crease by (3.6)% over the next 12 months, with a compound annual growth rate of 4.3% for the following 2 to 5 years. The range of annual housing price growth (contraction) in our alternative downside and upside scenarios is (30.0)% to 10.9% over the next 12 months and 4.2% to 9.5% for the following 2 to 5 years. As at January 31, 2022, our base case forecast included housing price growth of 0.5% for the next 12 months and 4.2% for the following 2 to 5 years. As at October 31, 2021, our base case forecast included housing price growth of 0.1% for the next 12 months and 4.1% for the following 2 to 5 years. |
Royal Bank of Canada
71
Credit risk exposure by internal risk rating
The following table presents the gross carrying amount of loans measured at amortized cost, and the full contractual amount of undrawn loan commitments subject to the impairment requirements of IFRS 9. Risk ratings are based on internal ratings used in the measurement of expected credit losses as at the reporting date, as o
u
tlined in the internal ratings maps for Wholesale and Retail facilities in the Credit risk section of our 2021 Annual Report.| As at | ||||||||||||||||||||||||||||||||||
April 30, 2022 | October 31, 2021 | |||||||||||||||||||||||||||||||||
| (Millions of Canadian dollars) | Stage 1 | Stage 2 | Stage 3 | Total | Stage 1 | Stage 2 | Stage 3 | Total | ||||||||||||||||||||||||||
Retail | ||||||||||||||||||||||||||||||||||
Loans outstanding – Residential mortgages | ||||||||||||||||||||||||||||||||||
Low risk | $ | 325,157 | $ | 3,295 | $ | – | $ | 328,452 | $ | 310,334 | $ | 1,507 | $ | – | $ | 311,841 | ||||||||||||||||||
Medium risk | 14,173 | 1,965 | – | 16,138 | 15,152 | 2,051 | – | 17,203 | ||||||||||||||||||||||||||
High risk | 1,090 | 2,711 | – | 3,801 | 3,343 | 634 | – | 3,977 | ||||||||||||||||||||||||||
Not rat e d(1) | 48,111 | 982 | – | 49,093 | 45,512 | 913 | – | 46,425 | ||||||||||||||||||||||||||
Impaired | – | – | 588 | 588 | – | – | 645 | 645 | ||||||||||||||||||||||||||
388,531 | 8,953 | 588 | 398,072 | 374,341 | 5,105 | 645 | 380,091 | |||||||||||||||||||||||||||
Items not subje c t to impairment(2) | 298 | 241 | ||||||||||||||||||||||||||||||||
Total | $ | 398,370 | $ | 380,332 | ||||||||||||||||||||||||||||||
Loans outstanding – Personal | ||||||||||||||||||||||||||||||||||
Low risk | $ | 73,935 | $ | 1,195 | $ | – | $ | 75,130 | $ | 72,267 | $ | 698 | $ | – | $ | 72,965 | ||||||||||||||||||
Medi u m risk | 5,265 | 4,025 | – | 9,290 | 4,974 | 4,551 | – | 9,525 | ||||||||||||||||||||||||||
High risk | 354 | 1,385 | – | 1,739 | 687 | 1,045 | – | 1,732 | ||||||||||||||||||||||||||
Not rated (1) | 9,610 | 96 | – | 9,706 | 8,934 | 88 | – | 9,022 | ||||||||||||||||||||||||||
Impaired | – | – | 203 | 203 | – | – | 197 | 197 | ||||||||||||||||||||||||||
Total | $ | 89,164 | $ | 6,701 | $ | 203 | $ | 96,068 | $ | 86,862 | $ | 6,382 | $ | 197 | $ | 93,441 | ||||||||||||||||||
Loans outstanding – Credit cards | ||||||||||||||||||||||||||||||||||
Low risk | $ | 13,639 | $ | 34 | $ | – | $ | 13,673 | $ | 12,864 | $ | 24 | $ | – | $ | 12,888 | ||||||||||||||||||
Medium risk | 1,648 | 1,524 | – | 3,172 | 1,646 | 1,645 | – | 3,291 | ||||||||||||||||||||||||||
High risk | 49 | 1,104 | – | 1,153 | 136 | 937 | – | 1,073 | ||||||||||||||||||||||||||
Not rated (1) | 597 | 73 | – | 670 | 527 | 43 | – | 570 | ||||||||||||||||||||||||||
Total | $ | 15,933 | $ | 2,735 | $ | – | $ | 18,668 | $ | 15,173 | $ | 2,649 | $ | – | $ | 17,822 | ||||||||||||||||||
Loans outstanding – Small business | ||||||||||||||||||||||||||||||||||
Low risk | $ | 8,657 | $ | 332 | $ | – | $ | 8,989 | $ | 8,609 | $ | 274 | $ | – | $ | 8,883 | ||||||||||||||||||
Medium risk | 1,486 | 1,040 | – | 2,526 | 1,583 | 979 | – | 2,562 | ||||||||||||||||||||||||||
High risk | 131 | 316 | – | 447 | 227 | 218 | – | 445 | ||||||||||||||||||||||||||
Not rated (1) | 5 | – | – | 5 | 4 | – | – | 4 | ||||||||||||||||||||||||||
Impaired | – | – | 110 | 110 | – | – | 109 | 109 | ||||||||||||||||||||||||||
Total | $ | 10,279 | $ | 1,688 | $ | 110 | $ | 12,077 | $ | 10,423 | $ | 1,471 | $ | 109 | $ | 12,003 | ||||||||||||||||||
Undrawn loan commitments – Retail | ||||||||||||||||||||||||||||||||||
Low risk | $ | 240,043 | $ | 1,151 | $ | – | $ | 241,194 | $ | 229,516 | $ | 574 | $ | – | $ | 230,090 | ||||||||||||||||||
Medium risk | 8,552 | – | 8,714 | 9,475 | 133 | – | 9,608 | |||||||||||||||||||||||||||
High risk | 942 | 306 | – | 1,248 | 1,205 | 97 | – | 1,302 | ||||||||||||||||||||||||||
Not rated (1) | 5,157 | 84 | – | 5,241 | 4,854 | 90 | – | 4,944 | ||||||||||||||||||||||||||
Total | $ | 254,694 | $ | 1,703 | $ | – | $ | 256,397 | $ | 245,050 | $ | 894 | $ | – | $ | 245,944 | ||||||||||||||||||
Wholesale – Loans outstanding | ||||||||||||||||||||||||||||||||||
Investment grade | $ | 77,597 | $ | 545 | $ | – | $ | 78,142 | $ | 62,975 | $ | 226 | $ | – | $ | 63,201 | ||||||||||||||||||
Non-investment grade | 137,064 | 13,761 | – | 150,825 | 117,396 | 15,146 | – | 132,542 | ||||||||||||||||||||||||||
Not rated (1) | 10,875 | 353 | – | 11,228 | 9,339 | 430 | – | 9,769 | ||||||||||||||||||||||||||
Impaired | – | – | 1,236 | 1,236 | – | – | 1,357 | 1,357 | ||||||||||||||||||||||||||
225,536 | 14,659 | 1,236 | 241,431 | 189,710 | 15,802 | 1,357 | 206,869 | |||||||||||||||||||||||||||
Items not subject to impairment (2) | 11,416 | 11,197 | ||||||||||||||||||||||||||||||||
Total | $ | 252,847 | $ | 218,066 | ||||||||||||||||||||||||||||||
Undrawn loan commitments – Wholesale | ||||||||||||||||||||||||||||||||||
Investment grade | $ | 260,284 | $ | 592 | $ | – | $ | 260,876 | $ | 246,539 | $ | 1,122 | $ | – | $ | 247,661 | ||||||||||||||||||
Non-investment grade | 114,890 | 10,687 | – | 125,577 | 108,063 | 12,377 | – | 120,440 | ||||||||||||||||||||||||||
Not rated (1) | 3,589 | – | – | 3,589 | 3,476 | 1 | – | 3,477 | ||||||||||||||||||||||||||
Total | $ | 378,763 | $ | 11,279 | $ | – | $ | 390,042 | $ | 358,078 | $ | 13,500 | $ | – | $ | 371,578 | ||||||||||||||||||
| (1) | In certain cases where an internal risk rating is not assigned, we use other approved credit risk assessment or rating methodologies, policies and tools to manage our credit risk. |
| (2) | Items not subject to impairment are loans held at FVTPL. |
7
2
Royal Bank of Canada
Note 5 Loans and allowance for credit losses (continued) |
Loans past due but not impaired
(1), (2)
| As at | ||||||||||||||||||||||||||
April 30, 2022 | October 31, 2021 | |||||||||||||||||||||||||
| (Millions of Canadian dollars) | 30 to 89 days | 90 days and greater | Total | 30 to 89 days | 90 days and greater | Total | ||||||||||||||||||||
Retail | $ | 929 | $ | 162 | $ | 1,091 | $ | 1,105 | $ | 137 | $ | 1,242 | ||||||||||||||
Wholesale | 1,489 | 18 | 1,507 | 1,230 | – | 1,230 | ||||||||||||||||||||
$ | 2,418 | $ | 180 | $ | 2,598 | $ | 2,335 | $ | 137 | $ | 2,472 | |||||||||||||||
| (1) | Excludes loans less than 30 days past due as they are not generally representative of the borrowers’ ability to meet their payment obligations. |
| (2) | Amounts presented may include loans past due as a result of administrative processes, such as mortgage loans on which payments are restrained pending payout due to sale or refinance, which can fluctuate based on business volumes. Past due loans arising from administrative processes are not representative of the borrowers’ ability to meet their payment obligations. |
Note 6 Significant acquisition |
Acquisition
Wealth Management
On March 31, 2022, we announced our intention via our subsidiary, RBC Wealth Management (Jersey) Holdings Limited
,
to acquire Brewin Dolphin Holdings PLC (Brewin Dolphin) by way of a recommended cash offer ofpence per share for the entire issued and to be issued share capital of Brewin Dolphin, which values Brewin Dolphin at approximately
£
1.6billion ($
2.6billion) on a fully diluted basis as at March 30, 2022. Brewin Dolphin provides discretionary wealth management services in the U.K. and Ireland.
The transaction is expected to close by the end of the third calendar quarter of 2022, subject to regulatory approvals and other customary closing conditions. The results of the acquired business will be consolidated from the date of close.
Note 7 Deposits |
| As at | ||||||||||||||||||||||||||||||||||
April 30, 2022 | October 31, 2021 | |||||||||||||||||||||||||||||||||
| (Millions of Canadian dollars) | Demand | Notice | Term | Total | Demand (1) | Notice (2) | Term (3) | Total | ||||||||||||||||||||||||||
Personal | $ | 215,310 | $ | 67,988 | $ | 99,583 | $ | 382,881 | $ | 207,493 | $ | 64,613 | $ | 90,382 | $ | 362,488 | ||||||||||||||||||
Business and government | 357,482 | 18,288 | 349,208 | 724,978 | 356,020 | 20,800 | 319,533 | 696,353 | ||||||||||||||||||||||||||
Bank | 11,185 | 222 | 32,331 | 43,738 | 12,549 | 449 | 28,992 | 41,990 | ||||||||||||||||||||||||||
$ | 583,977 | $ | 86,498 | $ | 481,122 | $ | 1,151,597 | $ | 576,062 | $ | 85,862 | $ | 438,907 | $ | 1,100,831 | |||||||||||||||||||
Non-interest-bearing (4) | ||||||||||||||||||||||||||||||||||
Canada | $ | 160,319 | $ | 8,338 | $ | 461 | $ | 169,118 | $ | 151,475 | $ | 8,051 | $ | 713 | $ | 160,239 | ||||||||||||||||||
United States | 56,437 | – | – | 56,437 | 54,021 | – | – | 54,021 | ||||||||||||||||||||||||||
Europe (5) | 424 | – | – | 424 | 632 | – | – | 632 | ||||||||||||||||||||||||||
Other International | 8,837 | – | – | 8,837 | 8,002 | – | – | 8,002 | ||||||||||||||||||||||||||
Interest-bearing (4) | ||||||||||||||||||||||||||||||||||
Canada | 315,156 | 20,362 | 336,744 | 672,262 | 315,464 | 19,857 | 312,987 | 648,308 | ||||||||||||||||||||||||||
United States | 7,396 | 57,277 | 87,043 | 151,716 | 6,978 | 57,260 | 77,597 | 141,835 | ||||||||||||||||||||||||||
Europe (5) | 30,127 | 521 | 43,604 | 74,252 | 34,278 | 693 | 36,788 | 71,759 | ||||||||||||||||||||||||||
Other International | 5,281 | – | 13,270 | 18,551 | 5,212 | 1 | 10,822 | 16,035 | ||||||||||||||||||||||||||
$ | 583,977 | $ | 86,498 | $ | 481,122 | $ | 1,151,597 | $ | 576,062 | $ | 85,862 | $ | 438,907 | $ | 1,100,831 | |||||||||||||||||||
| (1) | Demand deposits are deposits for which we do not have the right to require notice of withdrawal, which include both savings and chequing accounts. |
| (2) | Notice deposits are deposits for which we can legally require notice of withdrawal. These deposits are primarily savings accounts. |
| (3) | Term deposits are deposits payable on a fixed date, and include term deposits, guaranteed investment certificates and similar instruments. |
| (4) | The geographical splits of the deposits are based on the point of origin of the deposits and where the revenue is recognized. As at April 30, 2022, deposits denominated in U.S. dollars, British pounds, Euro and other foreign currencies were $433 billion, $32billion, $48billion and $27billion, respectively (October 31, 2021 – $399 billion, $35 billion, $43 billion and $27 billion, respectively). |
| (5) | Europe includes United Kingdom, Luxembourg, the Channel Islands, and France. |
Contractual maturities of term deposits
| As at | ||||||||
(Millions of Canadian dollars) | April 30 2022 | October 31 2021 | ||||||
Within 1 year: | ||||||||
less than 3 months | $ 148,687 | $ | 133,776 | |||||
3 to 6 months | 59,436 | 64,062 | ||||||
6 to 12 months | 103,038 | 83,871 | ||||||
1 to 2 years | 45,096 | 45,532 | ||||||
2 to 3 years | 38,498 | 29,204 | ||||||
3 to 4 years | 23,629 | 24,573 | ||||||
4 to 5 years | 32,385 | 25,329 | ||||||
Over 5 years | 30,353 | 32,560 | ||||||
$ | 481,122 | $ | 438,907 | |||||
Aggregate amount of term deposits in denominations of one hundred thousand dollars or more | $ | 451,000 | $ | 416,000 | ||||
Royal Bank of Canada
3
Note 8 Employee benefits – Pension and other post-employment benefits |
We offer a number of defined benefit and defined contribution plans which provide pension and post-employment benefits to eligible employees. The following tables present the composition of our pension and other post-employment benefit expense and the effects of remeasurements recorded in other comprehensive income.
Pension and other post-employment benefit expense
| For the three months ended | ||||||||||||||||||
| Pension plans | Other post-employment benefit plans | |||||||||||||||||
(Millions of Canadian dollars) | April 30 2022 | April 30 2021 | April 30 2022 | April 30 2021 | ||||||||||||||
Current service costs | $ | 78 | $ | 90 | $ | 7 | $ | 11 | ||||||||||
Past service costs | (1 | ) | – | – | – | |||||||||||||
Net interest expense (income) | (21 | ) | 2 | 15 | 14 | |||||||||||||
Remeasurements of other long-term benefits | – | – | (14 | ) | (11 | ) | ||||||||||||
Administrative expense | 4 | 3 | – | – | ||||||||||||||
Defined benefit pension expense | 60 | 95 | 8 | 14 | ||||||||||||||
Defined contribution pension expense | 56 | 57 | – | – | ||||||||||||||
$ | 116 | $ | 152 | $ | 8 | $ | 14 | |||||||||||
| For the six months ended | ||||||||||||||||||
| Pension plans | Other post-employment benefit plans | |||||||||||||||||
(Millions of Canadian dollars) | April 30 2022 | April 30 2021 | April 30 2022 | April 30 2021 | ||||||||||||||
Current service costs | $ | 155 | $ | 180 | $ | 17 | $ | 22 | ||||||||||
Past service costs | (1 | ) | – | 2 | – | |||||||||||||
Net interest expense (income) | (42 | ) | 4 | 31 | 28 | |||||||||||||
Remeasurements of other long-term benefits | – | – | (13 | ) | (10 | ) | ||||||||||||
Administrative expense | 7 | 6 | – | – | ||||||||||||||
Defined benefit pension expense | 119 | 190 | 37 | 40 | ||||||||||||||
Defined contribution pension expense | 130 | 123 | – | – | ||||||||||||||
$ | 249 | $ | 313 | $ | 37 | $ | 40 | |||||||||||
Pension and other post-employment benefit remeasurements
(1)
| For the three months ended | ||||||||||||||||||
| Defined benefit pension plans | Other post-employment benefit plans | |||||||||||||||||
(Millions of Canadian dollars) | April 30 2022 | April 30 2021 | April 30 2022 | April 30 2021 | ||||||||||||||
Actuarial (gains) losses: | ||||||||||||||||||
Changes in financial assumptions (2) | $ | (2,337 | ) | $ | (1,380 | ) | $ | (218 | ) | $ | (113 | ) | ||||||
Experience adjustments | 1 | – | (3 | ) | (3 | ) | ||||||||||||
Return on plan assets (excluding interest based on discount rate) | 1,525 | 227 | – | – | ||||||||||||||
$ | (811 | ) | $ | (1,153 | ) | $ | (221 | ) | $ | (116 | ) | |||||||
| For the six months ended | ||||||||||||||||||
| Defined benefit pension plans | Other post-employment benefit plans | |||||||||||||||||
(Millions of Canadian dollars) | April 30 2022 | April 30 2021 | April 30 2022 | April 30 2021 | ||||||||||||||
Actuarial (gains) losses: | ||||||||||||||||||
Changes in financial assumptions (2) | $ | (2,998 | ) | $ | (1,392 | ) | $ | (258 | ) | $ | (135 | ) | ||||||
Experience adjustments | 1 | – | (3 | ) | (3 | ) | ||||||||||||
Return on plan assets (excluding interest based on discount rate) | 1,843 | (797 | ) | – | – | |||||||||||||
$ | (1,154 | ) | $ | (2,189 | ) | $ | (261 | ) | $ | (138 | ) | |||||||
| (1) | Market based assumptions, including Changes in financial assumptions and Return on plan assets, are reviewed on a quarterly basis. All other assumptions are updated during our annual review of plan assumptions. |
| (2) | Changes in financial assumptions in our defined benefit pension plans primarily relate to changes in discount rates. |
7 Second Quarter 2022
4
Royal Bank of Canada
Note 9 Income taxes |
Government of Canada budget 2022
On April 7, 2022, the Government of Canada pres
e
nted its 2022 budget, which included proposals for a Canada Recovery Dividend (CRD), a one-time 15% tax for 2022 determined based on 2021 taxable income above $1 billion and payable in equal installments over five years, as well as a permanent increase in the corporate income tax rate of 1.5% on taxable income above $100 million that would apply to taxation years that end after April 7, 2022. For our tax year ending October 31, 2022, the additional 1.5% tax would be prorated based on thenumber
of days in the taxation year after April 7, 2022.Legislation
relating to these proposed measures has yet to be issued and timing of enactment remains uncertain. While the ultimate impact will depend on the final legislation, the CRD is expected to reduce our net income when substantively enacted.
Tax examinations and assessments
During the second quarter of 2022, we received proposal letters (the Proposals) from the Canada Revenue Agency (CRA), in respect of the 2017 taxation year, which suggest that Royal Bank of Canada owes additional taxes of approximately $237 million as they denied the deductibility of certain dividends. This amount represents the maximum additional taxes owing for that year. The Proposals are consistent with the previously received reassessments as described in Note 21 of our 2021 Annual Consolidated Financial Statements. It is possible that the CRA will reassess us for significant additional income taxes for subsequent years on the same basis.
In all cases, we are confident that our tax filing position was appropriate and intend to defend ourselves vigorously.
Note 10 Significant capital and funding transactions |
Preferred shares
On November 5, 2021, we issued 750 thousand Non-Cumulative 5-Year Fixed Rate Reset First Preferred Shares Series BT to certain institutional investors, at a price of $1,000 per share, for total gross proceeds of $750 million. For the initial five year period to the earliest redemption date of February 24, 2027, the shares pay semi-annual cash dividends, if declared, at a rate of 4.2% per annum. The dividend rate will reset on the earliest redemption date and every fifth year thereafter at a rate equal to the 5-year Government of Canada bond yield plus a premium of 2.71%. Subject to the
consent of the Office of the Superintendent of Financial Institutions (OSFI)
and the requirements of the
Bank Act
(Canada), we may redeem the Series BT Preferred Shares in whole or in part at a price per share of $
1,000on the earliest redemption date and every fifth year thereafter. The shares include non-viability contingency capital (NVCC) provisions necessary for them to qualify as Tier 1 regulatory capital under Basel III.
On February 24, 2022, we redeemed all 6 million Non-Cumulative First Preferred Shares Series BJ, at a price of $25.75 per share.
Subordinated debentures
On January 25, 2022, we issued $1,000 million of NVCC subordinated debentures. The notes bear interest at a fixed rate of 2.94% per annum until May 3, 2027, and at the three-month Canadian Dollar Offered Rate plus 0.76% thereafter until their maturity on May 3, 2032.
Common shares issued
(1)
| For the three months ended | ||||||||||||||||||
April 30, 2022 | April 30, 2021 | |||||||||||||||||
| (Millions of Canadian dollars, except number of shares) | Number of shares (thousands) | Amount | Number of shares (thousands) | Amount | ||||||||||||||
Issued in connection with share-based compensation plans (2) | 105 | $ | 8 | 324 | $ | 25 | ||||||||||||
Purchased for cancellation (3) | (13,700 | ) | (171 | ) | – | – | ||||||||||||
(13,595 | ) | $ | (163 | ) | 324 | $ | 25 | |||||||||||
| For the six months ended | ||||||||||||||||||
April 30, 2022 | April 30, 2021 | |||||||||||||||||
| (Millions of Canadian dollars, except number of shares) | Number of shares (thousands) | Amount | Number of shares (thousands) | Amount | ||||||||||||||
Issued in connection with share-based compensation plans (2) | 512 | $ | 42 | 820 | $ | 61 | ||||||||||||
Purchased for cancellati o n(3) | (22,571 | ) | (282 | ) | – | – | ||||||||||||
(22,059 | ) | $ | (240 | ) | 820 | $ | 61 | |||||||||||
| (1) | The requirements of our dividend reinvestment plan (DRIP) are satisfied through either open market share purchases or shares issued from treasury. During the three and six months ended April 30, 2022 and April 30, 2021, our DRIP’s requirements were satisfied through open market share purchases. |
| (2) | Amounts include cash received for stock options exercised during the period and the fair value adjustment to stock options. |
| (3) | During the three months ended April 30, 2022, we purchased for cancellation common shares at a total fair value of $1,892 million (average cost of $138.04 per share), with a book value of $171 million (book value of $12.46 per share). During the six months ended April 30, 2022, we purchased for cancellation common shares at a total fair value of $3,106 million (average cost of $137.57 per share), with a book value of $282 million (book value of $12.46 per share). During the three months and six months ended April 30, 2021, we did not purchase for cancellation any common shares. |
Royal Bank of Canada
5
Note 11 Earnings per share |
| For the three months ended | For the six months ended | ||||||||||||||||||||
| (Millions of Canadian dollars, except share and per share amounts) | April 30 2022 | April 30 2021 | April 30 2022 | April 30 2021 | |||||||||||||||||
Basic earnings per share | |||||||||||||||||||||
Net income | $ | 4,253 | $ | 4,015 | $ | 8,348 | $ | 7,862 | |||||||||||||
Dividends on preferred shares and distributions on other equity instruments | (68 | ) | (76 | ) | (122 | ) | (134 | ) | |||||||||||||
Net income attributable to non-controlling interests | (3 | ) | (1 | ) | (5 | ) | (3 | ) | |||||||||||||
Net income available to common shareholders | $ | 4,182 | $ | 3,938 | $ | 8,221 | $ | 7,725 | |||||||||||||
Weighted average number of common shares (in thousands) | 1,409,702 | 1,424,889 | 1,415,855 | 1,424,107 | |||||||||||||||||
Basic earnings per share (in dollars) | $ | 2.97 | $ | 2.76 | $ | 5.81 | $ | 5.42 | |||||||||||||
Diluted earnings per share | |||||||||||||||||||||
Net income available to common shareholders | $ | 4,182 | $ | 3,938 | $ | 8,221 | $ | 7,725 | |||||||||||||
Weighted average number of common shares (in thousands) | 1,409,702 | 1,424,889 | 1,415,855 | 1,424,107 | |||||||||||||||||
Stock options (1) | 2,247 | 1,533 | 2,219 | 1,362 | |||||||||||||||||
Issuable under other share-based compensation plans | 603 | 685 | 602 | 714 | |||||||||||||||||
Average number of diluted common shares (in thousands) | 1,412,552 | 1,427,107 | 1,418,676 | 1,426,183 | |||||||||||||||||
Diluted earnings per share (in dollars) | $ | 2.96 | $ | 2.76 | $ | 5.80 | $ | 5.42 | |||||||||||||
| (1) | The dilutive effect of stock options was calculated using the treasury stock method. When the exercise price of options outstanding is greater than the average market price of our common shares, the options are excluded from the calculation of diluted earnings per share. For the three and six months ended April 30, 2022, and April 30, 2021, no outstanding options were excluded from the calculation of diluted earnings per share. |
Note 12 Legal and regulatory matters |
We are a large global institution that is subject to many different complex legal and regulatory requirements that continue to evolve. We are and have been subject to a variety of legal proceedings, including civil claims and lawsuits, regulatory examinations, investigations, audits and requests for information by various governmental regulatory agencies and law enforcement authorities in various jurisdictions. Some of these matters may involve novel legal theories and interpretations and may be advanced under criminal as well as civil statutes, and some proceedings could result in the imposition of civil, regulatory enforcement or criminal penalties. We review the status of all proceedings on an ongoing basis and will exercise judgment in resolving them in such manner as we believe to be in our best interest. This is an area of significant judgment and uncertainty and the extent of our financial and other exposure to these proceedings after taking into account current accruals could be material to our results of operations in any particular period.
Our significant legal proceeding and regulatory matters are described in Note 24 of our audited 2021 Annual Consolidated Financial Statements and as updated below.
London Interbank Offered Rate litigation
In respect of the consolidated class action in New York, on December 30, 2021, the United States Court of Appeals for the Second Circuit issued an opinion affirming in part and reversing in part certain district court rulings that had dismissed a substantial portion of the consolidated class action on jurisdictional grounds and lack of standing. The Second Circuit remanded the matter to the district court for further proceedings consistent with its decision. Based on the facts currently known, it is not possible at this time for us to predict the ultimate outcome of these proceedings or the timing of their resolution.
In respect of the New York class action relating to the setting of LIBOR after its administration was taken over by the Intercontinental Exchange, following the withdrawal of the named plaintiffs and the substitution of the plaintiff in 2021, the United States Court of Appeals for the Second Circuit dismissed the plaintiff’s appeal on February 14, 2022 for lack of jurisdiction.
Interchange fees litigation
The courts in all five provinces have approved the global settlement of the Canadian banks, including RBC, and this resolves all pending Canadian class actions involving interchange fees.
Royal Bank of Canada Trust Company (Bahamas) Limited proceedings
The November 3, 2020 opinion issued by the Solicitor of Labor of the U.S. Department of Labor has been withdrawn. The October 28, 2016 exemption granted to Royal Bank of Canada and its current and future affiliates by the U.S. Department of Labor remains unaffected.
7
6
Royal Bank of Canada Second Quarter 2022Note 13 Results by business segment |
For the three months ended April 30, 2022 | ||||||||||||||||||||||||||||
| (Millions of Canadian dollars) | Personal & Commercial Banking | Wealth Management | Insurance | Investor & Treasury Services | Capital Markets | Corporate Support | Total | |||||||||||||||||||||
Net interest income (2) | $ | 3,234 | $ | 780 | $ | – | $ | 148 | $ | 1,181 | $ | (69 | ) | $ | 5,274 | |||||||||||||
Non-interest income | 1,505 | 2,825 | 234 | 403 | 1,167 | (188 | ) | 5,946 | ||||||||||||||||||||
Total revenue | 4,739 | 3,605 | 234 | 551 | 2,348 | (257 | ) | 11,220 | ||||||||||||||||||||
Provision for credit losses | (276 | ) | (30 | ) | – | – | (37 | ) | 1 | (342 | ) | |||||||||||||||||
Insurance policyholder benefits, claims and acquisition expense | – | – | (180 | ) | – | – | – | (180 | ) | |||||||||||||||||||
Non-interest expense | 2,015 | 2,644 | 145 | 398 | 1,350 | (118 | ) | 6,434 | ||||||||||||||||||||
Income (loss) before income taxes | 3,000 | 991 | 269 | 153 | 1,035 | (140 | ) | 5,308 | ||||||||||||||||||||
Income taxes (recoveries) | 766 | 241 | 63 | 32 | 240 | (287 | ) | 1,055 | ||||||||||||||||||||
Net income | $ | 2,234 | $ | 750 | $ | 206 | $ | 121 | $ | 795 | $ | 147 | $ | 4,253 | ||||||||||||||
Non-interest expense includes: | ||||||||||||||||||||||||||||
Depreciation and amortization | $ | 232 | $ | 228 | $ | 14 | $ | 50 | $ | 124 | $ | 2 | $ | 650 | ||||||||||||||
| For the three months ended April 30, 2021 | ||||||||||||||||||||||||||||
| (Millions of Canadian dollars) | Personal & Commercial Banking | Wealth Management (3) | Insurance | Investor & Treasury Services | Capital Markets (1) | Corporate Support (1), (3) | Total | |||||||||||||||||||||
Net interest income (2) | $ | 3,085 | $ | 666 | $ | – | $ | 87 | $ | 1,121 | $ | (105 | ) | $ | 4,854 | |||||||||||||
Non-interest income | 1,442 | 2,594 | 536 | 447 | 1,597 | 148 | 6,764 | |||||||||||||||||||||
Total revenue | 4,527 | 3,260 | 536 | 534 | 2,718 | 43 | 11,618 | |||||||||||||||||||||
Provision for credit losses | 35 | (2 | ) | – | (2 | ) | (127 | ) | – | (96 | ) | |||||||||||||||||
Insurance policyholder benefits, claims and acquisition expense | – | – | 149 | – | – | – | 149 | |||||||||||||||||||||
Non-interest expense | 1,915 | 2,371 | 140 | 375 | 1,468 | 110 | 6,379 | |||||||||||||||||||||
Income (loss) before income taxes | 2,577 | 891 | 247 | 161 | 1,377 | (67 | ) | 5,186 | ||||||||||||||||||||
Income taxes (recoveries) | 669 | 208 | 60 | 41 | 306 | (113 | ) | 1,171 | ||||||||||||||||||||
Net income | $ | 1,908 | $ | 683 | $ | 187 | $ | 120 | $ | 1,071 | $ | 46 | $ | 4,015 | ||||||||||||||
Non-interest expense includes: | ||||||||||||||||||||||||||||
Depreciation and amortization | $ | 229 | $ | 218 | $ | 15 | $ | 47 | $ | 126 | $ | 1 | $ | 636 | ||||||||||||||
For the six months ended April 30, 2022 | ||||||||||||||||||||||||||||
| (Millions of Canadian dollars) | Personal & Commercial Banking | Wealth Management | Insurance | Investor & Treasury Services | Capital Markets | Corporate Support | Total | |||||||||||||||||||||
Net interest income (2) | $ | 6,463 | $ | 1,525 | $ | – | $ | 311 | $ | 2,422 | $ | (176 | ) | $ | 10,545 | |||||||||||||
Non-interest income | 3,079 | 5,693 | 1,633 | 827 | 2,736 | (227 | ) | 13,741 | ||||||||||||||||||||
Total revenue | 9,542 | 7,218 | 1,633 | 1,138 | 5,158 | (403 | ) | 24,286 | ||||||||||||||||||||
Provision for credit losses | (147 | ) | (42 | ) | – | – | (49 | ) | 1 | (237 | ) | |||||||||||||||||
Insurance policyholder benefits, claims and acquisition expense | – | – | 817 | – | – | – | 817 | |||||||||||||||||||||
Non-interest expense | 4,037 | 5,225 | 292 | 818 | 2,822 | (180 | ) | 13,014 | ||||||||||||||||||||
Income (loss) before income taxes | 5,652 | 2,035 | 524 | 320 | 2,385 | (224 | ) | 10,692 | ||||||||||||||||||||
Income taxes (recoveries) | 1,444 | 490 | 121 | 81 | 560 | (352 | ) | 2,344 | ||||||||||||||||||||
Net income | $ | 4,208 | $ | 1,545 | $ | 403 | $ | 239 | $ | 1,825 | $ | 128 | $ | 8,348 | ||||||||||||||
Non-interest expense includes: | ||||||||||||||||||||||||||||
Depreciation and amortization | $ | 465 | $ | 456 | $ | 29 | $ | 99 | $ | 247 | $ | 4 | $ | 1,300 | ||||||||||||||
Royal Bank of Canada
7
| For the six months ended April 30, 2021 | ||||||||||||||||||||||||||||
| (Millions of Canadian dollars) | Personal & Commercial Banking | Wealth Management (3) | Insurance | Investor & Treasury Services | Capital Markets (1) | Corporate Support (1), (3) | Total | |||||||||||||||||||||
Net interest income (2) | $ | 6,246 | $ | 1,332 | $ | – | $ | 178 | $ | 2,320 | $ | (187 | ) | $ | 9,889 | |||||||||||||
Non-interest income | 2,844 | 5,147 | 2,345 | 921 | 3,106 | 309 | 14,672 | |||||||||||||||||||||
Total revenue | 9,090 | 6,479 | 2,345 | 1,099 | 5,426 | 122 | 24,561 | |||||||||||||||||||||
Provision for credit losses | 200 | (31 | ) | – | (4 | ) | (150 | ) | (1 | ) | 14 | |||||||||||||||||
Insurance policyholder benefits, claims and acquisition expense | – | – | 1,555 | – | – | – | 1,555 | |||||||||||||||||||||
Non-interest expense | 3,893 | 4,777 | 289 | 776 | 2,909 | 277 | 12,921 | |||||||||||||||||||||
Income (loss) before income taxes | 4,997 | 1,733 | 501 | 327 | 2,667 | (154 | ) | 10,071 | ||||||||||||||||||||
Income taxes (recoveries) | 1,296 | 409 | 113 | 84 | 529 | (222 | ) | 2,209 | ||||||||||||||||||||
Net income | $ | 3,701 | $ | 1,324 | $ | 388 | $ | 243 | $ | 2,138 | $ | 68 | $ | 7,862 | ||||||||||||||
Non-interest expense includes: | ||||||||||||||||||||||||||||
Depreciation and amortization | $ | 453 | $ | 438 | $ | 29 | $ | 96 | $ | 251 | $ | 2 | $ | 1,269 | ||||||||||||||
| (1) | Taxable equivalent basis. |
| (2) | Interest revenue is reported net of interest expense as we rely primarily on net interest income as a performance measure. |
| (3) | Effective Q4 2021, gains (losses) on economic hedges of our U.S. share-based compensation plans, which are reflected in revenue, and related variability in share-based compensation expense driven by changes in the fair value of liabilities relating to our U.S. share-based compensation plans have been reclassified from our Wealth Management segment to Corporate Support. Comparative amounts have been reclassified to conform with this presentation. |
Total assets and total liabilities by business segment
As at April 30, 2022 | ||||||||||||||||||||||||||||
| (Millions of Canadian dollars) | Personal & Commercial Banking | Wealth Management | Insurance | Investor & Treasury Services | Capital Markets | Corporate Support | Total | |||||||||||||||||||||
Total assets | $ | 574,412 | $ | 155,948 | $ | 21,932 | $ | 255,046 | $ | 783,628 | $ | 57,606 | $ | 1,848,572 | ||||||||||||||
Total liabilities | 574,328 | 156,198 | 22,466 | 254,929 | 782,934 | (46,688 | ) | 1,744,167 | ||||||||||||||||||||
| As at October 31, 2021 | ||||||||||||||||||||||||||||
| (Millions of Canadian dollars) | Personal & Commercial Banking | Wealth Management | Insurance | Investor & Treasury Services | Capital Markets | Corporate Support | Total | |||||||||||||||||||||
Total assets | $ | 549,702 | $ | 148,990 | $ | 22,724 | $ | 240,055 | $ | 692,278 | $ | 52,574 | $ | 1,706,323 | ||||||||||||||
Total liabilitie s | 549,619 | 149,096 | 22,966 | 239,960 | 691,767 | (45,847 | ) | 1,607,561 | ||||||||||||||||||||
7 Second Quarter 2022
8
Royal Bank of Canada
Note 14 Capital management |
Regulatory capital and capital ratios
OSFI formally establishes risk-based capital and leverage minimums and Total Loss Absorbing Capacity (TLAC) ratios for deposit-taking institutions in Canada. During the second quarter of 2022, we complied with all capital, leverage and TLAC requirements, including the Domestic Stability Buffer, imposed by OSFI.
| As at | ||||||||
| (Millions of Canadian dollars, except percentage amounts and as otherwise noted) | April 30 2022 | October 31 2021 | ||||||
Capital (1) | ||||||||
CET1 capital | $ | 77,069 | $ | 75,583 | ||||
Tier 1 capital | 84,345 | 82,246 | ||||||
Total capital | 93,871 | 92,026 | ||||||
Risk-weighted assets (RWA) used in calculation of capital ratios (1) | ||||||||
Credit risk | $ | 472,516 | $ | 444,142 | ||||
Market risk | 37,851 | 34,806 | ||||||
Operational risk | 75,472 | 73,593 | ||||||
Total RWA | $ | 585,839 | $ | 552,541 | ||||
Capital ratios and Leverage ratio (1) | ||||||||
CET1 ratio | 13.2% | 13.7% | ||||||
Tier 1 capital ratio | 14.4% | 14.9% | ||||||
Total capital ratio | 16.0% | 16.7% | ||||||
Leverage ratio | 4.7% | 4.9% | ||||||
Leverage ratio exposure (billions) | $ | 1,812 | $ | 1,662 | ||||
TLAC available and ratios (2), (3) | ||||||||
TLAC available | $ | 158,140 | n.a. | |||||
TLAC ratio | 27.0% | n.a. | ||||||
TLAC leverage ratio | 8.7% | n.a. | ||||||
| (1) | Capital, RWA, and capital ratios are calculated using OSFI’s Capital Adequacy Requirements (CAR) guideline and the Leverage ratio is calculated using OSFI’s Leverage Requirements (LR) guideline as updated in accordance with the regulatory guidance issued by OSFI in response to the COVID-19 pandemic. Both the CAR guideline and LR guideline are based on the Basel III framework. |
| (2) | Effective November 1, 2021, OSFI requires Canadian Domestic Systemically Important Banks to meet minimum risk-based TLAC ratio and TLAC leverage ratio requirements which are calculated using OSFI’s TLAC guideline. |
| (3) | The TLAC standard is applied at the resolution entity level which for us is deemed to be Royal Bank of Canada and its subsidiaries. A resolution entity and its subsidiaries are collectively called a resolution group. Both the TLAC ratio and TLAC leverage ratio are calculated using the TLAC available as percentage of total RWA and leverage exposure, respectively. |
| n.a. | not applicable |
Royal Bank of Canada
9
Shareholder Information |
Corporate headquarters Street address: Royal Bank of Canada 200 Bay Street Toronto, Ontario M5J 2J5 Canada Tel: 1-888-212-5533 Mailing address: P.O. Box 1 Royal Bank Plaza Toronto, Ontario M5J 2J5 Canada website: rbc.com Transfer Agent and Registrar Main Agent: Computershare Trust Company of Canada 1500 Robert-Bourassa Blvd. Suite 700 Montreal, Quebec H3A 3S8 Canada Tel: 1-866-586-7635 514-982-7555 (International) Fax: 514-982-7580 website: computershare.com/rbc Co-Transfer Agent (U.S.):Computershare Trust Company, N.A. 250 Royall Street Canton, Massachusetts 02021 U.S.A. Co-Transfer Agent (U.K.):Computershare Investor Services PLC Securities Services – Registrars P.O. Box 82, The Pavilions, Bridgwater Road, Bristol BS99 6ZZ U.K. Stock exchange listings (Symbol: RY) Common shares are listed on: Canada – Toronto Stock Exchange (TSX) U.S. – New York Stock Exchange (NYSE) Switzerland – Swiss Exchange (SIX) Preferred shares AZ, BB, BD, BF, BH, BI and BO are listed on the TSX. The related depository shares of the series C-2 preferred shares are listed on the NYSE. | Valuation day price For Canadian income tax purposes, Royal Bank of Canada’s common stock was quoted at $29.52 per share on the Valuation Day (December 22, 1971). This is equivalent to $7.38 per share after adjusting for the two-for-one two-for-one stock split of February 1990. Theone-for-one Shareholder contacts For dividend information, change in share registration or address, lost stock certificates, tax forms, estate transfers or dividend reinvestment, please contact: Computershare Trust Company of Canada 100 University Avenue, 8th Floor Toronto, Ontario M5J 2Y1 Canada Tel: 1-866-586-7635 the U.S.) or 514-982-7555 (International) Fax: 1-888-453-0330 416-263-9394 (International) email: service@computershare.com Financial analysts, portfolio managers, institutional investors For financial information inquiries, please contact: Investor Relations Royal Bank of Canada 200 Bay Street South Tower Toronto, Ontario M5J 2J5 Canada Tel: 416-955-7802 or visit our website at rbc.com/investorrelations Direct deposit service Shareholders in Canada and the U.S. may have their common share dividends deposited directly to their bank account by electronic funds transfer. To arrange for this service, please contact our Transfer Agent and Registrar, Computershare Trust Company of Canada. | Eligible dividend designation For purposes of the Income Tax Act Common share repurchases We are engaged in a normal course issuer bid (NCIB) which allows us to repurchase for cancellation up to 45 million common shares during the period spanning from December 8, 2021 to December 7, 2022, when the bid expires, or such earlier date as we may complete the purchases pursuant to our Notice of Intention filed with the Toronto Stock Exchange. | We determine the amount and timing of purchases under the NCIB, subject to prior consultation with the Office of the Superintendent of Financial Institutions Canada. For further details, refer to the Capital management section. A copy of our Notice of Intention to file a NCIB may be obtained, without charge, by contacting our Corporate Secretary at our Toronto mailing address. 2022 Quarterly earnings release dates First quarter February 24 Second quarter May 26 Third quarter August 24 Fourth quarter November 30 | |||||||||||
Dividend dates for 2022 Subject to approval by the Board of Directors | ||||||||||||||
Record dates | Payment dates | |||||||||||||
| Common and preferred shares series AZ, BB, BD, BF, BH, BI and BO | January 26 April 25 July 26 October 26 | February 24 May 24 August 24 November 23 | ||||||||||||
Preferred shares series C-2 (US$) | January 28 April 26 July 29 October 28 | February 7 May 6 August 8 November 7 | ||||||||||||
| Preferred shares series BT | February 16 August 17 | February 24 August 24 | ||||||||||||
Governance Summaries of the significant ways in which corporate governance practices followed by RBC differ from corporate governance practices required to be followed by U.S. domestic companies under the NYSE listing standards are available on our website at rbc.com/governance. | ||||||||||||||
Information contained in or otherwise accessible through the websites mentioned in this report to shareholders does not form a part of this report. All references to websites are inactive textual references and are for your information only.
Trademarks used in this report include the LION & GLOBE Symbol, ROYAL BANK OF CANADA, RBC, RBC INSURANCE and RBC HOMELINE PLAN which are trademarks of Royal Bank of Canada used by Royal Bank of Canada and/or by its subsidiaries under license. All other trademarks mentioned in this report, which are not the property of Royal Bank of Canada, are owned by their respective holders.