Exhibit 99.2

Royal Bank of Canada first quarter 2025 results |
All amounts are in Canadian dollars and are based on financial statements presented in compliance with International Accounting Standard 34, unless otherwise noted. Our Q1 2025 Report to Shareholders and Supplementary Financial Information are available at http://www.rbc.com/investorrelations and on https://www.sedarplus.com/.
Interim Financial Reporting
Net income $5.1 Billion Up 43% YoY | Diluted EPS 1 $3.54 Up 42% YoY | Total PCL 1 $1,050 Million PCL on loans ratio 1 up 7 bps 1 QoQ | ROE 1, 2 16.8% Up 370 bps YoY | CET1 ratio 1 13.2% Above regulatory requirements | ||||||||||||
Adjusted net income 3 $5.3 Billion Up 29% YoY | Adjusted diluted EPS 3 $3.62 Up 27% YoY | Total ACL 1 $6.9 Billion ACL on loans ratio 1 up 4 bpsQoQ | Adjusted ROE 3 17.2% Up 230 bps YoY | LCR 1 128% Unchanged from 128% last quarter |
TORONTO, February
27, 2025
4
(RY on TSX and NYSE) today reported record net income of $5.1 billion for the quarter ended January 31, 2025, up $1.5 billion or 43% from the prior year. Diluted EPS was $3.54, up 42% over the same period, reflecting growth across each of our business segments. The inclusion of HSBC Bank Canada (HSBC Canada) results5
increased net income by $214 million. Adjusted net income3
and adjusted diluted EPS3
of $5.3 billion and $3.62 were up 29% and 27%, respectively, from the prior year.Our consolidated results reflect an increase in total PCL of $237 million from a year ago, mainly reflecting higher provisions in Commercial Banking, Wealth Management and Personal Banking, partially offset by lower provisions in Capital Markets. The PCL on loans ratio of 42 bps increased 5 bps from the prior year.
Pre-provision,
pre-tax
earnings6
of $7.5 billion were up $2.3 billion or 45% from last year. The inclusion of HSBC Canada results increasedpre-provision,
pre-tax
earnings6
by $451 million. Excluding HSBC Canada results,pre-provision,
pre-tax
earnings6
increased 36% from last year, mainly due to higher fee-based revenue in Wealth Management reflecting market appreciation and net sales, and higher revenue in Capital Markets driven by strength across Corporate & Investment Banking and Global Markets. Both segments also benefitted from the impact of foreign exchange translation. Higher net interest income reflecting strong average volume growth in Personal Banking and Commercial Banking and higher spreads in Personal Banking, also contributed to the increase. These factors were partially offset by higher expenses driven by higher variable compensation on improved results and continued investments in technology and talent across our businesses.Compared to last quarter, net income was up 22% reflecting growth across each of our business segments. Adjusted net income
3
was up 18% over the same period.Pre-provision,
pre-tax
earnings6
were up 24% as higher revenues more than offset expense growth. The PCL on loans ratio of 42 bps increased 7 bps from the prior quarter, mainly reflecting higher provisions in Wealth Management and Capital Markets. The PCL on impaired loans ratio was 39 bps, up 13 bps from the prior quarter, including one account in the other services sector that migrated from performing to impaired during the quarter. The PCL on performing loans ratio was 3 bps, down 6 bps from the prior quarter.Our capital position remains robust, with a CET1 ratio of 13.2%, supporting solid volume growth, and $2.4 billion of capital returned to our shareholders through common share dividends and share buybacks.
“RBC’s first quarter exemplifies our commitment to staying ahead of our clients’ expectations in an increasingly complex world. In Q1, we delivered strong results and client-driven growth across our businesses, while prudently managing risk and making investments in technology and talent to position the bank for the future. At our upcoming Investor Day, we look forward to sharing more about how we will capitalize on our financial and strategic strength to elevate the value we create for our clients and shareholders.” – Dave McKay, President and Chief Executive Officer of Royal Bank of Canada | ||
Q1 2025 Compared to Q1 2024 | Reported: • Net income of $5,131 million • Diluted EPS of $3.54 • ROE of 16.8% • CET1 ratio of 13.2% | h h h i | Adjusted 3 :• Net income of $5,254 million • Diluted EPS of $3.62 • ROE of 17.2% | h h h | ||||||
Q1 2025 Compared to Q4 2024 | • Net income of $5,131 million • Diluted EPSof $3.54 • ROE of 16.8% • CET1 ratio of 13.2% | h h h g | • Net income of $5,254 million • Diluted EPSof $3.62 • ROE of 17.2% | h h h | ||||||
| (1) | See the Glossary section of this Q1 2025 Report to Shareholders for composition of these measures. |
| (2) | Return on equity (ROE). This measure does not have a standardized meaning under generally accepted accounting principles (GAAP). For further information, refer to the Key performance and non-GAAP measures section of this Q1 2025Report to Shareholders. |
| (3) | These are non-GAAP measures. For further information, including a reconciliation, refer to the Key performance andnon-GAAP measures section of this Q1 2025Report to Shareholders. |
| (4) | When we say “we”, “us”, “our”, “the bank” or “RBC”, we mean Royal Bank of Canada and its subsidiaries, as applicable. |
| (5) | On March 28, 2024, we completed the acquisition of HSBC Canada (HSBC Canada transaction). HSBC Canada results reflect revenue, PCL, non-interest expenses and income taxes associated with the acquired operations and clients, which include the acquired assets, assumed liabilities and employees with the exception of assets and liabilities relating to treasury and liquidity management activities. For further details, refer to the Key corporate events section of this Q1 2025 Report to Shareholders. |
| (6) | Pre-provision, pre-tax (PPPT) earnings is calculated as income (January 31, 2025: $5,131 million; October 31, 2024: $4,222 million; January 31, 2024: $3,582 million) before income taxes (January 31, 2025: $1,302 million; October 31, 2024: $993 million; January 31, 2024: $766 million) and PCL (January 31, 2025: $1,050 million; October 31, 2024: $840 million; January 31, 2024: $813 million). For the three months ended January 31, 2025, pre-provision, pre-tax earnings excluding HSBC Canada results of $7,032 million is calculated aspre-provision, pre-tax earnings of $7,483 million less net income of $214 million, income taxes of $82 million, and PCL of $155 million. This is anon-GAAP measure. PPPT earnings do not have a standardized meaning under GAAP and may not be comparable to similar measures disclosed by other financial institutions. We use PPPT earnings to assess our ability to generate sustained earnings growth outside of credit losses, which are impacted by the cyclical nature of a credit cycle. We believe that certainnon-GAAP measures are more reflective of our ongoing operating results and provide readers with a better understanding of management’s perspective on our performance. |
2 First Quarter 2025
Royal Bank of Canada
Table of contents
1 | ||||
2 | ||||
2 | ||||
3 | ||||
| 3 | About Royal Bank of Canada | |||
| 4 | Selected financial and other highlights | |||
| 5 | Economic, market and regulatory review and outlook | |||
6 | ||||
7 | ||||
| 7 | Overview | |||
11 | ||||
| 11 | How we measure and report our business segments | |||
43 | ||||
| 43 | Summary of accounting policies and estimates | |||
| 43 | Controls and procedures | |||
43 | ||||
44 | ||||
47 | ||||
48 | (unaudited) | |||
53 | (unaudited) | |||
70 | ||||
Management’s Discussion and Analysis |
Management’s Discussion and Analysis (MD&A) is provided to enable a reader to assess our results of operations and financial condition for the three month period ended or as at January 31, 2025, compared to the corresponding period in the prior fiscal year and the three month period ended October 31, 2024. This MD&A should be read in conjunction with our unaudited Interim Condensed Consolidated Financial Statements for the quarter ended January 31, 2025 (Condensed Financial Statements) and related notes and our 2024 Annual Report. This MD&A is dated February 26, 2025. All amounts are in Canadian dollars, unless otherwise specified, and are based on financial statements presented in accordance with International Financial Reporting Standards (IFRS) as issued by the International Accounting Standards Board (IASB), unless otherwise noted.
Additional information about us, including our 2024 Annual Information Form, is available free of charge on our website at rbc.com/investorrelations, on the Canadian Securities Administrators’ website, SEDAR+, at sedarplus.com and on the EDGAR section of the United States (U.S.) Securities and Exchange Commission’s (SEC) website at sec.gov.
Information contained in or otherwise accessible through the websites mentioned herein does not form part of this report. All references in this report to websites are inactive textual references and are for your information only.
Caution regarding forward-looking statements |
From time to time, we make written or oral forward-looking statements within the meaning of certain securities laws, including the “safe harbour” provisions of theand any applicable Canadian securities legislation. We may make forward-looking statements in this Q1 2025 Report to Shareholders, in other filings with Canadian regulators or the SEC, in other reports to shareholders, and in other communications. In addition, our representatives may communicate forward-looking statements orally to analysts, investors, the media and others. Forward-looking statements in this document include, but are not limited to, statements relating to our financial performance objectives, priorities, vision and strategic goals, the economic, market, and regulatory review and outlook for Canadian, U.S., United Kingdom (U.K.), European and global economies, the regulatory environment in which we operate and the risk environment including our credit risk, market risk, liquidity and funding risk and include statements made by our President and Chief Executive Officer. The forward-looking statements contained in this document represent the views of management and are presented for the purpose of assisting the holders of our securities and financial analysts in understanding our financial position and results of operations as at and for the periods ended on the dates presented, as well as our financial performance objectives, vision, strategic goals and priorities and anticipated financial performance, and may not be appropriate for other purposes. Forward-looking statements are typically identified by words such as “believe”, “expect”, “suggest”, “seek”, “foresee”, “forecast”, “schedule”, “anticipate”, “intend”, “estimate”, “goal”, “commit”, “target”, “objective”, “plan”, “outlook”, “timeline” and “project” and similar expressions of future or conditional verbs such as “will”, “may”, “might”, “should”, “could”, “can”, “would” or negative or grammatical variations thereof.
United States Private Securities Litigation Reform Act of 1995
By their very nature, forward-looking statements require us to make assumptions and are subject to inherent risks and uncertainties, both general and specific in nature, which give rise to the possibility that our predictions, forecasts, projections, expectations or conclusions will not prove to be accurate, that our assumptions may not be correct, that our financial performance, environmental & social or other objectives, vision and strategic goals will not be achieved, and that our actual results may differ materially from such predictions, forecasts, projections, expectations or conclusions.
Royal Bank of Canada
We caution readers not to place undue reliance on our forward-looking statements as a number of risk factors could cause our actual results to differ materially from the expectations expressed in such forward-looking statements. These factors – many of which are beyond our control and the effects of which can be difficult to predict – include, but are not limited to: credit, market, liquidity and funding, insurance, operational, compliance (which could lead to us being subject to various legal and regulatory proceedings, the potential outcome of which could include regulatory restrictions, penalties and fines), strategic, reputation, legal and regulatory environment, competitive and systemic risks, risks associated with escalating trade tensions, including protectionist trade policies such as the imposition of tariffs, and other risks discussed in the risk sections of our 2024 Annual Report and the Risk management section of this Q1 2025 Report to Shareholders, including business and economic conditions in the geographic regions in which we operate, Canadian housing and household indebtedness, information technology, cyber and third-party risks, geopolitical uncertainty, environmental and social risk, digital disruption and innovation, privacy and data related risks, regulatory changes, culture and conduct risks, the effects of changes in government fiscal, monetary and other policies, tax risk and transparency, and our ability to anticipate and successfully manage risks arising from all of the foregoing factors. Additional factors that could cause actual results to differ materially from the expectations in such forward-looking statements can be found in the risk sections of our 2024 Annual Report and the Risk management section of this Q1 2025 Report to Shareholders, as may be updated by subsequent quarterly reports.
We caution that the foregoing list of risk factors is not exhaustive and other factors could also adversely affect our results. When relying on our forward-looking statements to make decisions with respect to us, investors and others should carefully consider the foregoing factors and other uncertainties and potential events, as well as the inherent uncertainty of forward-looking statements. Material economic assumptions underlying the forward-looking statements contained in this document are set out in the Economic, market and regulatory review and outlook section and for each business segment under the Strategic priorities and Outlook headings in our 2024 Annual Report, as updated by the Economic, market and regulatory review and outlook section of this Q1 2025 Report to Shareholders. Such sections may be updated by subsequent quarterly reports. Any forward-looking statements contained in this document represent the views of management only as of the date hereof, and except as required by law, we do not undertake to update any forward-looking statement, whether written or oral, that may be made from time to time by us or on our behalf.
Additional information about these and other factors can be found in the risk sections of our 2024 Annual Report and the Risk management section of this Q1 2025 Report to Shareholders, as may be updated by subsequent quarterly reports.
Overview and outlook |
About Royal Bank of Canada |
Royal Bank of Canada is a global financial institution with a purpose-driven,
principles-led
approach to delivering leading performance. Our success comes from the 98,000+ employees who leverage their imaginations and insights to bring our vision, values and strategy to life so we can help our clients thrive and communities prosper. As Canada’s biggest bank and one of the largest in the world, based on market capitalization, we have a diversified business model with a focus on innovation and providing exceptional experiences to our more than 19 million clients in Canada, the U.S. and 27 other countries. Learn more at rbc.com.Effective the fourth quarter of 2024, the Personal & Commercial Banking segment became two standalone business segments: Personal Banking and Commercial Banking. With this change, RBC Direct Investing
®
moved from the previous Personal & Commercial Banking segment to the Wealth Management segment. Comparative results in this MD&A have been revised to conform to our new basis of segment presentation.4 First Quarter 2025
Royal Bank of Canada
Selected financial and other highlights |
| As at or for the three months ended | For the three months ended | |||||||||||||||||||||
| (Millions of Canadian dollars, except per share, number of and percentage amounts) | January 31 2025 (1) | October 31 2024 (1) | January 31 2024 | Q1 2025 vs. Q4 2024 | Q1 2025 vs. Q1 2024 | |||||||||||||||||
Total revenue | $ | 16,739 | $ | 15,074 | $ | 13,485 | $ | 1,665 | $ | 3,254 | ||||||||||||
Provision for credit losses (PCL) | 1,050 | 840 | 813 | 210 | 237 | |||||||||||||||||
Non-interest expense | 9,256 | 9,019 | 8,324 | 237 | 932 | |||||||||||||||||
Income before income taxes | 6,433 | 5,215 | 4,348 | 1,218 | 2,085 | |||||||||||||||||
Net income | $ | 5,131 | $ | 4,222 | $ | 3,582 | $ | 909 | $ | 1,549 | ||||||||||||
Net income – adjusted (2), (3) | $ | 5,254 | $ | 4,439 | $ | 4,066 | $ | 815 | $ | 1,188 | ||||||||||||
Segments – net income | ||||||||||||||||||||||
Personal Banking (4) | $ | 1,678 | $ | 1,579 | $ | 1,353 | $ | 99 | $ | 325 | ||||||||||||
Commercial Banking (4) | 777 | 774 | 650 | 3 | 127 | |||||||||||||||||
Wealth Management (4) | 980 | 969 | 664 | 11 | 316 | |||||||||||||||||
Insurance | 272 | 162 | 220 | 110 | 52 | |||||||||||||||||
Capital Markets | 1,432 | 985 | 1,154 | 447 | 278 | |||||||||||||||||
Corporate Support | (8 | ) | (247 | ) | (459 | ) | 239 | 451 | ||||||||||||||
Net income | $ | 5,131 | $ | 4,222 | $ | 3,582 | $ | 909 | $ | 1,549 | ||||||||||||
Selected information | ||||||||||||||||||||||
Earnings per share (EPS) – basic | $ | 3.54 | $ | 2.92 | $ | 2.50 | $ | 0.62 | $ | 1.04 | ||||||||||||
– diluted | 3.54 | 2.91 | 2.50 | 0.63 | 1.04 | |||||||||||||||||
– basic adjusted (2), (3) | 3.63 | 3.07 | 2.85 | 0.56 | 0.78 | |||||||||||||||||
– diluted adjusted (2), (3) | 3.62 | 3.07 | 2.85 | 0.55 | 0.77 | |||||||||||||||||
Return on common equity (ROE) (3) | 16.8% | 14.3% | 13.1% | 250 bps | 370 bps | |||||||||||||||||
ROE – adjusted (2), (3) | 17.2% | 15.1% | 14.9% | 210 bps | 230 bps | |||||||||||||||||
Average common equity (5) | $ | 118,550 | $ | 114,750 | $ | 107,100 | $ | 3,800 | $ | 11,450 | ||||||||||||
Net interest margin (NIM) – on average earning assets, net (3) | 1.60% | 1.68% | 1.41% | (8) bps | 19 bps | |||||||||||||||||
PCL on loans as a % of average net loans and acceptances | 0.42% | 0.35% | 0.37% | 7 bps | 5 bps | |||||||||||||||||
PCL on performing loans as a % of average net loans and acceptances | 0.03% | 0.09% | 0.06% | (6) bps | (3) bps | |||||||||||||||||
PCL on impaired loans as a % of average net loans and acceptances | 0.39% | 0.26% | 0.31% | 13 bps | 8 bps | |||||||||||||||||
Gross impaired loans (GIL) as a % of loans and acceptances | 0.78% | 0.59% | 0.48% | 19 bps | 30 bps | |||||||||||||||||
Liquidity coverage ratio (LCR) (3), (6) | 128% | 128% | 132% | – bps | (400) bps | |||||||||||||||||
Net stable funding ratio (NSFR) (3), (6) | 115% | 114% | 113% | 100 bps | 200 bps | |||||||||||||||||
Capital, Leverage and Total loss absorbing capacity (TLAC) ratios (3), (7) | ||||||||||||||||||||||
Common Equity Tier 1 (CET1) ratio | 13.2% | 13.2% | 14.9% | – bps | (170) bps | |||||||||||||||||
Tier 1 capital ratio | 14.6% | 14.6% | 16.3% | – bps | (170) bps | |||||||||||||||||
Total capital ratio | 16.4% | 16.4% | 18.1% | – bps | (170) bps | |||||||||||||||||
Leverage ratio | 4.4% | 4.2% | 4.4% | 20 bps | – bps | |||||||||||||||||
TLAC ratio | 29.8% | 29.3% | 31.4% | 50 bps | (160) bps | |||||||||||||||||
TLAC leverage ratio | 8.9% | 8.4% | 8.5% | 50 bps | 40 bps | |||||||||||||||||
Selected balance sheet and other information (8) | ||||||||||||||||||||||
Total assets | $ | 2,191,026 | $ | 2,171,582 | $ | 1,974,405 | $ | 19,444 | $ | 216,621 | ||||||||||||
Securities, net of applicable allowance | 488,025 | 439,918 | 405,813 | 48,107 | 82,212 | |||||||||||||||||
Loans, net of allowance for loan losses | 1,006,050 | 981,380 | 858,316 | 24,670 | 147,734 | |||||||||||||||||
Derivative related assets | 153,686 | 150,612 | 105,038 | 3,074 | 48,648 | |||||||||||||||||
Deposits | 1,441,940 | 1,409,531 | 1,241,168 | 32,409 | 200,772 | |||||||||||||||||
Common equity | 122,763 | 118,058 | 108,360 | 4,705 | 14,403 | |||||||||||||||||
Total risk-weighted assets (RWA) (3), (7) | 708,941 | 672,282 | 590,257 | 36,659 | 118,684 | |||||||||||||||||
Assets under management (AUM) (3) | 1,428,700 | 1,342,300 | 1,150,100 | 86,400 | 278,600 | |||||||||||||||||
Assets under administration (AUA) (3), (9) | 5,148,300 | 4,965,500 | 4,490,100 | 182,800 | 658,200 | |||||||||||||||||
Common share information | ||||||||||||||||||||||
Shares outstanding (000s) – average basic | 1,413,937 | 1,414,460 | 1,406,324 | (523 | ) | 7,613 | ||||||||||||||||
– average diluted | 1,416,502 | 1,416,829 | 1,407,641 | (327 | ) | 8,861 | ||||||||||||||||
– end of period | 1,412,878 | 1,414,504 | 1,408,257 | (1,626 | ) | 4,621 | ||||||||||||||||
Dividends declared per common share | $ | 1.48 | $ | 1.42 | $ | 1.38 | $ | 0.06 | $ | 0.10 | ||||||||||||
Dividend yield (3) | 3.4% | 3.5% | 4.5% | (10) bps | (110) bps | |||||||||||||||||
Dividend payout ratio (3) | 42% | 49% | 55% | (700) bps | (1,300) bps | |||||||||||||||||
Common share price (RY on TSX) (10) | $ | 177.18 | $ | 168.39 | $ | 131.21 | $ | 8.79 | $ | 45.97 | ||||||||||||
Market capitalization (TSX) (10) | 250,334 | 238,188 | 184,777 | 12,146 | 65,557 | |||||||||||||||||
Business information (number of) | ||||||||||||||||||||||
Employees (full-time equivalent) (FTE) | 94,624 | 94,838 | 90,166 | (214 | ) | 4,458 | ||||||||||||||||
Bank branches | 1,286 | 1,292 | 1,248 | (6 | ) | 38 | ||||||||||||||||
Automated teller machines (ATMs) | 4,358 | 4,367 | 4,341 | (9 | ) | 17 | ||||||||||||||||
Period average US$ equivalent of C$1.00 (11) | 0.699 | 0.733 | 0.745 | (0.034 | ) | (0.046 | ) | |||||||||||||||
Period-end US$ equivalent of C$1.00 | 0.687 | 0.718 | 0.744 | (0.031 | ) | (0.057 | ) | |||||||||||||||
| (1) | On March 28, 2024, we completed the HSBC Canada transaction. HSBC Canada results have been consolidated from the closing date, and are included in our Personal Banking, Commercial Banking, Wealth Management and Capital Markets segments. For further details, refer to the Key corporate events section. |
| (2) | These are non-GAAP measures. For further details, including a reconciliation, refer to the Key performance andnon-GAAP measures section. |
| (3) | See Glossary for composition of these measures. |
| (4) | Amounts have been revised from those previously presented to conform to our new basis of segment presentation. For further details, refer to the About Royal Bank of Canada section. |
| (5) | Average amounts are calculated using methods intended to approximate the average of the daily balances for the period. |
| (6) | The LCR and NSFR are calculated in accordance with the Office of the Superintendent of Financial Institutions’ (OSFI) Liquidity Adequacy Requirements (LAR) guideline. LCR is the average for the three months ended for each respective period. For further details, refer to the Liquidity and funding risk section. |
| (7) | Capital ratios and RWA are calculated using OSFI’s Capital Adequacy Requirements (CAR) guideline, the Leverage ratio is calculated using OSFI’s Leverage Requirements (LR) guideline, and both the TLAC and TLAC leverage ratios are calculated using OSFI’s TLAC guideline. Both the CAR guideline and LR guideline are based on the Basel III framework. For further details, refer to the Capital management section. |
| (8) | Represents period-end spot balances. |
| (9) | AUA includes $15 billion and $6 billion (October 31, 2024 – $15 billion and $6 billion; January 31, 2024 – $14 billion and $6 billion) of securitized residential mortgages and credit card loans, respectively. |
| (10) | Based on TSX closing market price at period-end. |
| (11) | Average amounts are calculated using month-end spot rates for the period. |
Royal Bank of Canada
Economic, market and regulatory review and outlook – data as at February 26, 2025 |
The predictions and forecasts in this section are based on information and assumptions from sources we consider reliable. If this information or these assumptions are not accurate, actual economic outcomes may differ materially from the outlook presented in this section.
Economic and market review and outlook
Central banks have continued to reduce interest rates from elevated levels as inflation slows. Unemployment rates remain low across most advanced economies, but have risen more substantially in Canada. The Canadian economy has continued to underperform other advanced economies. Business investment in Canada has remained low; however household spending has shown signs of strengthening. The U.S. economy has remained resilient with strong GDP growth and a low unemployment rate. The potential for further protectionist U.S. trade policy is adding to economic uncertainty globally. High levels of U.S. government spending are expected to prevent a significant softening in U.S. labour markets in calendar 2025 but will add to inflation pressures. We expect that the Bank of Canada (BoC) will continue to lower interest rates in calendar 2025 in response to underperforming economic growth and soft labour markets. We do not anticipate the U.S. Federal Reserve (Fed) to reduce interest rates in calendar 2025 with inflation in the U.S. slowing gradually. GDP growth is expected to continue to rise at a moderate pace in the Euro area and the U.K. with the European Central Bank (ECB) and the Bank of England (BOE) expected to continue reducing interest rates at a gradual pace.
Canada
Canadian GDP is expected to increase by 1.1%
1
and 1.2%1
in the first and second calendar quarters of 2025, respectively, after increasing slightly in the fourth calendar quarter of 2024. Population growth is expected to slow sharply in calendar 2025 as a result of reduced federal government plans for permanent and temporary resident arrivals. The unemployment rate is expected to increase slightly further into the second calendar quarter of 2025 from 6.6% in January 2025, before beginning to edge slightly lower in the second half of the calendar year. The BoC is expected to continue reducing interest rates to a 2.25% rate by the end of the third calendar quarter of 2025. While inflation has slowed to around the BoC’s 2% inflation target, an underperforming economy and elevated unemployment rate are expected to keep downward pressure on inflation in calendar 2025. Lower interest rates are expected to result in stronger GDP growth on aper-person
basis in calendar 2025, although the potential for protective U.S. international trade policy remains a downside risk to the Canadian economy. Our economic outlook assumes that blanket 25% U.S. tariffs on Canadian imports will be avoided, but the threat of significant targeted tariff increases on specific industries will remain a source of uncertainty for businesses.U.S.
U.S. GDP is expected to grow more slowly at a 1.5%
1
rate in the first and second calendar quarters of 2025, yet remain resilient relative to most other advanced economies. The U.S. unemployment rate has edged higher over the last calendar year but edged lower for a second consecutive month in January 2025 to 4.0%. Despite high interest rates, employment has continued to increase at a solid rate and consumer spending growth has remained strong. U.S. inflation remains above the Fed’s 2% target and has changed slightly from a year ago at 3.0% in January 2025. While a significant government budget deficit is expected to keep GDP growth positive and prevent a larger increase in the unemployment rate, it will also limit the decline in inflation and interest rates in calendar 2025. We do not expect the Fed to lower the target range for the federal funds rate in calendar 2025 after 100 basis points of reductions in the second half of calendar 2024. The potential for additional protectionist U.S. trade policy remains a downside risk for economic growth and labour markets.Europe
Euro area GDP is expected to grow at 0.2% and 0.3% over the first and second calendar quarters of 2025, respectively. Unemployment rates remain very low across most countries in the Euro area but GDP growth has been mixed with an underperforming German economy offset by stronger growth in other Euro area economies. Inflation in the Euro area has gradually slowed. We expect the ECB will continue to gradually reduce the deposit rate in calendar 2025 by another 50 basis points, adding to the 125 basis points of reductions since early June 2024. U.K. GDP is expected to rise 0.3% and 0.4% in the first and second calendar quarters of 2025, respectively, after strengthening in calendar 2024. U.K. unemployment remains low and inflation has gradually slowed. We expect the BoE will reduce the bank rate by another 75 basis points in calendar 2025 following 75 basis points of reductions since July 2024.
Financial markets
Bond yields in the U.S. rose in recent months on growing expectations that the Fed would cut interest rates by less than previously expected. Yields in the Euro area and the U.K. have changed little; while Canadian bond yields have declined, reflecting expectations that the BoC will continue to reduce interest rates to support an underperforming Canadian economy and risks associated with potential U.S. tariffs. Tariff uncertainties remain a significant source of volatility in financial markets globally and have contributed to a stronger U.S. dollar. Commodity prices remain historically high and equity markets remain near record highs early in calendar 2025.
| 1 | Annualized rate |
6 First Quarter 2025
Royal Bank of Canada
Regulatory environment
We continue to monitor and prepare for regulatory developments and changes in a manner that seeks to ensure compliance with new requirements while mitigating adverse business or financial impacts. Such impacts could result from new or amended laws or regulations and the expectations of those who enforce them. A high level summary of the key regulatory changes that have the potential to increase or decrease our costs and the complexity of our operations is included in the Legal and regulatory environment risk section of our 2024 Annual Report and updates are listed below.
Global uncertainty
In January 2025, the International Monetary Fund (IMF) projected global growth of 3.3% for calendar 2025, up 0.1% from its October forecast, with higher growth projections for the U.S. largely offset by downward revisions in other major economies. Though the IMF expects global inflation to decline, significant uncertainty continues to pose risks to the global economic outlook, driven by: challenges in monetary policy normalization, including policy changes interrupting the ongoing disinflation process; potential financial market instability or faster-than-anticipated deceleration in growth resulting from the persistence of inflation and elevated interest rates, along with their associated impact on consumer and business confidence; escalating trade tensions, including protectionist trade policies such as the imposition of tariffs, which could lower investment and disrupt supply chains; shifts in U.S. trade, foreign relations, defense and immigration policies, which could disrupt global alliances and heighten economic, market and other risks; deepening economic concerns, particularly in China’s real estate sector and Europe’s energy sector, that could have an impact on global growth; potential inflationary pressures and restrictive monetary policy in response to accelerated growth in U.S. debt levels; continuing geopolitical tensions, such as those between Russia and Ukraine, those in the Middle East, and those between China and Taiwan and the West; increased polarization and social unrest; extreme weather-related events; and cyclical imbalances in the global economy. Our diversified business model, as well as our product and geographic diversification, continue to help mitigate the risks posed by global uncertainty.
For a discussion on risk factors resulting from these and other developments which may affect our business and financial results, refer to the risk sections of our 2024 Annual Report. For further details on our framework and activities to manage risks, refer to the risk and Capital management sections of this Q1 2025 Report to Shareholders.
Key corporate events |
HSBC Bank Canada
On March 28, 2024, we completed the acquisition of HSBC Bank Canada (HSBC Canada). The following table provides details on the impact of the acquisition of HSBC Canada (the HSBC Canada transaction) on our Personal Banking segment, Commercial Banking segment and consolidated results, and reflects revenue, PCL,
non-interest
expenses and income taxes associated with the acquired operations and clients, which include the acquired assets, assumed liabilities and employees with the exception of assets and liabilities relating to treasury and liquidity management activities (HSBC Canada results).For the three months ended January 31, 2025 | ||||||||||||||||||||||||||||||||||||||||||||
Segment results – Personal Banking | Segment results – Commercial Banking | Consolidated results | ||||||||||||||||||||||||||||||||||||||||||
| (Millions of Canadian dollars) | Excluding HSBC Canada | HSBC Canada | Total | Excluding HSBC Canada | HSBC Canada | Total | Excluding HSBC Canada | HSBC Canada | Total | |||||||||||||||||||||||||||||||||||
Net interest income | $ | 3,274 | $ | 231 | $ | 3,505 | $ | 1,470 | $ | 326 | $ | 1,796 | $ | 7,359 | $ | 589 | $ | 7,948 | ||||||||||||||||||||||||||
Non-interest income | 1,276 | 30 | 1,306 | 299 | 32 | 331 | 8,664 | 127 | 8,791 | |||||||||||||||||||||||||||||||||||
Total revenue | 4,550 | 261 | 4,811 | 1,769 | 358 | 2,127 | 16,023 | 716 | 16,739 | |||||||||||||||||||||||||||||||||||
PCL | 483 | 5 | 488 | 188 | 151 | 339 | 895 | 155 | 1,050 | |||||||||||||||||||||||||||||||||||
Non-interest expense | 1,885 | 130 | 2,015 | 604 | 106 | 710 | 8,991 | 265 | 9,256 | |||||||||||||||||||||||||||||||||||
Income before income taxes | 2,182 | 126 | 2,308 | 977 | 101 | 1,078 | 6,137 | 296 | 6,433 | |||||||||||||||||||||||||||||||||||
Income taxes | 595 | 35 | 630 | 273 | 28 | 301 | 1,220 | 82 | 1,302 | |||||||||||||||||||||||||||||||||||
Net income | $ | 1,587 | $ | 91 | $ | 1,678 | $ | 704 | $ | 73 | $ | 777 | $ | 4,917 | $ | 214 | $ | 5,131 | ||||||||||||||||||||||||||
Royal Bank of Canada
Financial performance |
Overview |
Q1 2025 vs. Q1 2024
Net income of $5,131 million was up $1,549 million or 43% from a year ago. Diluted EPS of $3.54 was up $1.04 or 42% and ROE of 16.8% was up from 13.1% a year ago. Our CET1 ratio of 13.2% was down 170 bps from a year ago.
Adjusted net income of $5,254 million was up $1,188 million or 29% from a year ago. Adjusted diluted EPS of $3.62 was up $0.77 or 27% and adjusted ROE of 17.2% was up from 14.9% from a year ago.
Our earnings were up from a year ago, primarily driven by higher results across all of our business segments. Prior period results also reflect higher HSBC Canada transaction and integration costs and the impact of management of closing capital volatility related to the HSBC Canada transaction, both of which were treated as specified items and reported in Corporate Support. Our earnings also reflect an increase due to the impact of foreign exchange translation.
Q1 2025 vs. Q4 2024
Net income of $5,131 million was up $909 million or 22% from last quarter. Diluted EPS of $3.54 was up $0.63 or 22% and ROE of 16.8% was up from 14.3% in the prior quarter. Our CET1 ratio of 13.2% was unchanged from last quarter.
Adjusted net income of $5,254 million was up $815 million or 18% from last quarter. Adjusted diluted EPS of $3.62 was up $0.55 or 18% and adjusted ROE of 17.2% was up from 15.1% last quarter.
Our earnings reflect higher results across all of our business segments. Results in the current period also reflect a lower impact from HSBC Canada transaction and integration costs, which is treated as a specified item in Corporate Support. Our earnings also reflect an increase due to the impact of foreign exchange translation.
For further details on our business segment results and CET1 ratio, refer to the Business segment results and Capital management sections, respectively.
Adjusted results
Adjusted results exclude specified items and the
after-tax
impact of amortization of acquisition-related intangibles. Adjusted results arenon-GAAP
measures. For further details, including a reconciliation, refer to the Key performance andnon-GAAP
measures section.Impact of foreign currency translation
The following table reflects the estimated impact of foreign currency translation on key income statement items:
| For the three months ended | ||||||||
| (Millions of Canadian dollars, except per share amounts) | Q1 2025 vs. Q1 2024 | Q1 2025 vs. Q4 2024 | ||||||
Increase (decrease): | ||||||||
Total revenue | $ | 477 | $ | 315 | ||||
PCL | 13 | 7 | ||||||
Non-interest expense | 261 | 167 | ||||||
Income taxes | 22 | 16 | ||||||
Net income | 181 | 125 | ||||||
Impact on EPS | ||||||||
Basic | $ | 0.13 | $ | 0.09 | ||||
Diluted | 0.13 | 0.09 | ||||||
The relevant average exchange rates that impact our business are shown in the following table:
| For the three months ended | ||||||||||||
| (Average foreign currency equivalent of C$1.00) (1) | January 31 2025 | October 31 2024 | January 31 2024 | |||||||||
U.S. dollar | 0.699 | 0.733 | 0.745 | |||||||||
British pound | 0.556 | 0.558 | 0.588 | |||||||||
Euro | 0.669 | 0.665 | 0.683 | |||||||||
| (1) | Average amounts are calculated using month-end spot rates for the period. |
8 First Quarter 2025
Royal Bank of Canada
Total revenue
| For the three months ended | ||||||||||||
| (Millions of Canadian dollars, except percentage amounts) | January 31 2025 | October 31 2024 | January 31 2024 | |||||||||
Interest and dividend income | $ | 26,455 | $ | 26,498 | $ | 25,609 | ||||||
Interest expense | 18,507 | 18,827 | 19,277 | |||||||||
Net interest income | $ | 7,948 | $ | 7,671 | $ | 6,332 | ||||||
NIM | 1.60% | 1.68% | 1.41% | |||||||||
Insurance service result | $ | 286 | $ | 173 | $ | 187 | ||||||
Insurance investment result | 82 | 66 | 141 | |||||||||
Trading revenue | 1,195 | 383 | 804 | |||||||||
Investment management and custodial fees | 2,667 | 2,501 | 2,185 | |||||||||
Mutual fund revenue | 1,236 | 1,189 | 1,030 | |||||||||
Securities brokerage commissions | 471 | 428 | 388 | |||||||||
Service charges | 612 | 596 | 554 | |||||||||
Underwriting and other advisory fees | 674 | 656 | 606 | |||||||||
Foreign exchange revenue, other than trading | 318 | 301 | 262 | |||||||||
Card service revenue | 317 | 332 | 326 | |||||||||
Credit fees | 435 | 358 | 395 | |||||||||
Net gains on investment securities | 55 | 13 | 70 | |||||||||
Income (loss) from joint ventures and associates | 19 | 11 | 12 | |||||||||
Other | 424 | 396 | 193 | |||||||||
Non-interest income | 8,791 | 7,403 | 7,153 | |||||||||
Total revenue | $ | 16,739 | $ | 15,074 | $ | 13,485 | ||||||
Additional trading information | ||||||||||||
Net interest income (1) | $ | 364 | $ | 520 | $ | 344 | ||||||
Non-interest income | 1,195 | 383 | 804 | |||||||||
Total trading revenue | $ | 1,559 | $ | 903 | $ | 1,148 | ||||||
| (1) | Reflects net interest income arising from trading-related positions, including assets and liabilities that are classified or designated at fair value through profit or loss (FVTPL). |
Q1 2025 vs. Q1 2024
Total revenue increased $3,254 million or 24% from a year ago, mainly due to higher net interest income. Higher investment management and custodial fees, trading revenue, other revenue and mutual fund revenue also contributed to the increase. The impact of foreign exchange translation increased revenue by $477 million. The inclusion of HSBC Canada revenue contributed $716 million to total revenue.
Net interest income increased $1,616 million or 26%, of which $589 million reflects the inclusion of HSBC Canada net interest income. The remaining increase of $1,027 million or 16% was mainly due to average volume growth in Personal Banking and Commercial Banking, as well as higher spreads in Personal Banking. The impact of foreign exchange translation also contributed to the increase.
NIM was up 19 bps compared to last year, mainly due to the acquisition of HSBC Canada including the accretion of fair value adjustments, favourable product mix in Personal Banking, higher trading net interest margin in Capital Markets as well as the sustained impact of a higher rate environment across most of our business segments. These factors were partially offset by competitive pricing pressures in deposits in Personal Banking and Commercial Banking.
Trading revenue increased $391 million or 49%, primarily due to higher equity trading revenue across most regions.
Investment management and custodial fees increased $482 million or 22%, primarily due to higher fee-based client assets reflecting market appreciation and net sales.
Mutual fund revenue increased $206 million or 20%, primarily due to higher fee-based client assets reflecting market appreciation and net sales in Wealth Management, as well as higher average mutual fund balances driving higher distribution fees in Personal Banking.
Other revenue increased $231 million, largely attributable to the impact of management of closing capital volatility related to the HSBC Canada transaction in the same quarter last year, which is treated as a specified item. This was partially offset by changes in the fair value of the hedges related to our U.S. share-based compensation plans, which was largely offset in Non-interest expense.
Q1 2025 vs. Q4 2024
Total revenue increased $1,665 million or 11% from prior quarter, primarily due to higher trading revenue. Higher net interest income, investment management and custodial fees, as well as insurance service result also contributed to the increase. The impact of foreign exchange translation increased revenue by $315 million.
Net interest income increased $277 million or 4%, largely due to average volume growth in Personal Banking and Wealth Management, as well as higher spreads in Personal Banking. The impact of foreign exchange translation also contributed to the increase.
Insurance service result increased $113 million or 65%, primarily due to the impact of reinsurance contract recaptures, adjustments relating to deferred acquisition expenses in the prior period and improved claims experience.
Trading revenue increased $812 million, mainly due to higher equity and fixed income trading revenue across most regions.
Investment management and custodial fees increased $166 million or 7%, largely due to higher fee-based client assets reflecting market appreciation and net sales.
Royal Bank of Canada
Provision for credit losses
(1)
| For the three months ended | ||||||||||||
| (Millions of Canadian dollars, except percentage amounts) | January 31 2025 | October 31 2024 | January 31 2024 (2) | |||||||||
Personal Banking | $ | 63 | $ | 131 | $ | 133 | ||||||
Commercial Banking | 30 | 66 | 16 | |||||||||
Wealth Management | 36 | (57 | ) | (27 | ) | |||||||
Capital Markets | (61 | ) | 68 | 10 | ||||||||
Corporate Support and other (3) | – | – | 1 | |||||||||
PCL on performing loans | 68 | 208 | 133 | |||||||||
Personal Banking | $ | 427 | $ | 361 | $ | 332 | ||||||
Commercial Banking | 308 | 233 | 154 | |||||||||
Wealth Management | 45 | 32 | 38 | |||||||||
Capital Markets | 205 | 14 | 161 | |||||||||
PCL on impaired loans | 985 | 640 | 685 | |||||||||
PCL – Loans | 1,053 | 848 | 818 | |||||||||
PCL – Other (4) | (3 | ) | (8 | ) | (5 | ) | ||||||
Total PCL | $ | 1,050 | $ | 840 | $ | 813 | ||||||
| PCL on loans is comprised of: | ||||||||||||
Retail | $ | 104 | $ | 138 | $ | 137 | ||||||
Wholesale | (36 | ) | 70 | (4 | ) | |||||||
PCL on performing loans | 68 | 208 | 133 | |||||||||
Retail | 485 | 424 | 359 | |||||||||
Wholesale | 500 | 216 | 326 | |||||||||
PCL on impaired loans | 985 | 640 | 685 | |||||||||
PCL – Loans | $ | 1,053 | $ | 848 | $ | 818 | ||||||
PCL on loans as a % of average net loans and acceptances | 0.42% | 0.35% | 0.37% | |||||||||
PCL on impaired loans as a % of average net loans and acceptances | 0.39% | 0.26% | 0.31% | |||||||||
| (1) | Information on loans represents loans, acceptances and commitments. |
| (2) | Amounts have been revised from those previously presented to conform to our new basis of segment presentation. For further details, refer to the About Royal Bank of Canada section. |
| (3) | Includes PCL recorded in Corporate Support and Insurance. |
| (4) | PCL – Other includes amounts related to debt securities measured at fair value through other comprehensive income (FVOCI) and amortized cost, accounts receivable, and financial and purchased guarantees. |
Q1 2025 vs. Q1 2024
Total PCL increased $237 million or 29% from a year ago, due to higher provisions in Commercial Banking, Wealth Management and Personal Banking, partially offset by lower provisions in Capital Markets. The PCL on loans ratio increased 5 bps.
PCL on performing loans decreased $65 million or 49%, mainly due to migration to impaired in Capital Markets, partially offset by unfavourable changes to credit quality and portfolio growth.
PCL on impaired loans increased $300 million or 44%, primarily due to higher provisions in Commercial Banking, Personal Banking and Capital Markets.
Q1 2025 vs. Q4 2024
Total PCL increased $210 million or 25% from last quarter, mainly reflecting provisions taken in the current quarter in Wealth Management, as compared to releases of provisions last quarter and higher provisions in Capital Markets. The PCL on loans ratio increased 7 bps.
PCL on performing loans decreased $140 million or 67%, mainly due to lower unfavourable changes in credit quality and migration to impaired in Capital Markets, partially offset by lower favourable changes to our macroeconomic forecast and portfolio growth.
PCL on impaired loans increased $345 million or 54%, primarily due to higher provisions in Capital Markets, Commercial Banking and Personal Banking.
10 First Quarter 2025
Royal Bank of Canada
Non-interest
expense| For the three months ended | ||||||||||||
| (Millions of Canadian dollars, except percentage amounts) | January 31 2025 | October 31 2024 | January 31 2024 | |||||||||
Salaries | $ | 2,354 | $ | 2,345 | $ | 2,078 | ||||||
Variable compensation | 2,569 | 2,348 | 2,083 | |||||||||
Benefits and retention compensation | 686 | 582 | 605 | |||||||||
Share-based compensation | 378 | 148 | 397 | |||||||||
Human resources | 5,987 | 5,423 | 5,163 | |||||||||
Equipment | 681 | 674 | 619 | |||||||||
Occupancy | 429 | 514 | 407 | |||||||||
Communications | 327 | 348 | 321 | |||||||||
Professional fees | 502 | 657 | 624 | |||||||||
Amortization of other intangibles | 435 | 398 | 352 | |||||||||
Other | 895 | 1,005 | 838 | |||||||||
Non-interest expense | $ | 9,256 | $ | 9,019 | $ | 8,324 | ||||||
Efficiency ratio (1) | 55.3% | 59.8% | 61.7% | |||||||||
Efficiency ratio – adjusted (1), (2) | 54.3% | 57.9% | 57.9% | |||||||||
| (1) | See Glossary for composition of these measures. |
| (2) | This is a non-GAAP ratio. For further details, including a reconciliation, refer to the Key performance andnon-GAAP measures section. |
Q1 2025 vs. Q1 2024
Non-interest
expense increased $932 million or 11% from a year ago, of which $265 million reflects the inclusion of HSBC Canadanon-interest
expense. The remaining increase of $667 million or 8% was primarily due to higher variable compensation commensurate with increased results and higher staff costs, including severance. The impact of foreign exchange translation of $261 million and ongoing technology investments also contributed to the increase. These factors were partially offset by lower HSBC Canada transaction and integration costs, which is treated as a specified item, the cost of the Federal Deposit Insurance Corporation (FDIC) special assessment in the prior year, and the change in the fair value of our U.S. share-based compensation plans, which was largely offset in Other revenue.Our efficiency ratio of 55.3% decreased 640 bps from 61.7% last year. Our adjusted efficiency ratio of 54.3% decreased 360 bps from 57.9% last year.
Q1 2025 vs. Q4 2024
Non-interest
expense increased $237 million or 3% from last quarter, primarily due to higher variable compensation commensurate with increased results, higher staff costs, largely reflecting seasonally higher compensation and severance, as well as the impact of foreign exchange translation of $167 million. These factors were partially offset by lower HSBC Canada transaction and integration costs, which is treated as a specified item. The prior period also reflected higher professional fees and the impact of higher legal provisions in Capital Markets.Our efficiency ratio of 55.3% decreased 450 bps from 59.8% last quarter. Our adjusted efficiency ratio of 54.3% decreased 360 bps from 57.9% last quarter.
Adjusted efficiency ratio is a
non-GAAP
ratio. For further details, including a reconciliation, refer to the Key performance andnon-GAAP
measures section.Income taxes
| For the three months ended | ||||||||||||
| (Millions of Canadian dollars, except percentage amounts) | January 31 2025 | October 31 2024 | January 31 2024 | |||||||||
Income taxes | $ | 1,302 | $ | 993 | $ | 766 | ||||||
Income before income taxes | 6,433 | 5,215 | 4,348 | |||||||||
Effective income tax rate | 20.2% | 19.0% | 17.6% | |||||||||
Adjusted results (1), (2) | ||||||||||||
Income taxes – adjusted | $ | 1,344 | $ | 1,074 | $ | 913 | ||||||
Income before income taxes – adjusted | 6,598 | 5,513 | 4,979 | |||||||||
Effective income tax rate – adjusted | 20.4% | 19.5% | 18.3% | |||||||||
| (1) | These are non-GAAP measures. For further details, including a reconciliation, refer to the Key performance andnon-GAAP measures section. |
| (2) | See Glossary for composition of these measures. |
Q1 2025 vs. Q1 2024
Income tax expense increased $536 million or 70% from a year ago, primarily due to higher income before income taxes. Adjusted income tax expense increased $431 million or 47%.
The effective income tax rate of 20.2% increased 260 bps, primarily due to the impact of Pillar Two legislation, which became effective for us beginning November 1, 2024, and the impact of changes in earnings mix. The adjusted effective income tax rate of 20.4% increased 210 bps. For further details on Pillar Two legislation, refer to Note 9 of our Condensed Financial Statements.
Royal Bank of Canada
Q1 2025 vs. Q4 2024
Income tax expense increased $309 million or 31% from last quarter, primarily due to higher income before income taxes. Adjusted income tax expense increased $270 million or 25%.
The effective income tax rate of 20.2% increased 120 bps, primarily due to the impact of the Pillar Two legislation noted above. The adjusted effective income tax rate of 20.4% increased 90 bps.
For further details on specified items, including a reconciliation, refer to the Key performance and
non-GAAP
measures section.Business segment results |
How we measure and report our business segments |
The key methodologies and assumptions used in our management reporting framework are periodically reviewed by management to ensure they remain valid. Effective the first quarter of 2025, we increased our capital attribution rates to our business segments to better align with our internal targets, which reduced the amount of unattributed capital retained in Corporate Support. For Insurance, the allocation of capital remains unchanged and continues to be based on fully diversified economic capital.
For further details on the key methodologies and assumptions used in our management reporting framework, refer to the How we measure and report our business segments section of our 2024 Annual Report.
Key performance and non-GAAP measures |
Performance measures
We measure and evaluate the performance of our consolidated operations and each business segment using a number of financial metrics, such as net income and ROE. Certain financial metrics, including ROE, do not have a standardized meaning under generally accepted accounting principles (GAAP) and may not be comparable to similar measures disclosed by other financial institutions.
Return on common equity
We use ROE, at both the consolidated and business segment levels, as a measure of return on total capital invested in our business. Management views the business segment ROE measure as a useful measure for supporting investment and resource allocation decisions because it adjusts for certain items that may affect comparability between business segments and certain competitors.
Our consolidated ROE calculation is based on net income available to common shareholders divided by total average common equity for the period. Business segment ROE calculations are based on net income available to common shareholders divided by average attributed capital for the period. For each segment, with the exception of Insurance, average attributed capital includes the capital and leverage required to underpin various risks and amounts invested in goodwill and intangibles and other regulatory deductions. For Insurance, the allocation of capital is based on fully diversified economic capital.
The attribution of capital involves the use of assumptions, judgments and methodologies that are regularly reviewed and revised by management as deemed necessary. Changes to such assumptions, judgments and methodologies can have a material effect on the business segment ROE information that we report. Other companies that disclose information on similar attributions and related return measures may use different assumptions, judgments and methodologies.
The following table provides a summary of our ROE calculations:
| For the three months ended | ||||||||||||||||||||||||||||||||||||||||
January 31 2025 | October 31 2024 | January 31 2024 | ||||||||||||||||||||||||||||||||||||||
(Millions of Canadian dollars, except percentage amounts) | Personal Banking | Commercial Banking | Wealth Management | Insurance | Capital Markets | Corporate Support | Total | Total | Total | |||||||||||||||||||||||||||||||
Net income available to common shareholders | $ | 1,648 | $ | 758 | $ | 955 | $ | 270 | $ | 1,397 | $ | (17 | ) | $ | 5,011 | $ | 4,128 | $ | 3,522 | |||||||||||||||||||||
Total average common equity (1), (2) | 27,600 | 19,350 | 25,000 | 2,150 | 37,250 | 7,200 | 118,550 | 114,750 | 107,100 | |||||||||||||||||||||||||||||||
ROE | 23.7% | 15.5% | 15.2% | 49.9% | 14.9% | n.m. | 16.8% | 14.3% | 13.1% | |||||||||||||||||||||||||||||||
| (1) | Total average common equity represents rounded figures. |
| (2) | The amounts for the segments are referred to as attributed capital. |
| (3) | Effective the first quarter of 2025, we increased our capital attribution rates. For further details, refer to the How we measure and report our business segments section. |
| n.m. | not meaningful |
Non-GAAP
measuresWe believe that certain
non-GAAP
measures (includingnon-GAAP
ratios) are more reflective of our ongoing operating results and provide readers with a better understanding of management’s perspective on our performance. These measures enhance the comparability of our financial performance for the three months ended January 31, 2025 with the corresponding period in the prior year and the three months ended October 31, 2024.Non-GAAP
measures do not have a standardized meaning under GAAP and may not be comparable to similar measures disclosed by other financial institutions.12 First Quarter 2025
Royal Bank of Canada
The following discussion describes the
non-GAAP
measures we use in evaluating our operating results.Adjusted results
We believe that providing adjusted results as well as certain measures and ratios excluding the impact of the specified items discussed below and amortization of acquisition-related intangibles enhances comparability with prior periods and enables readers to better assess trends in the underlying businesses.
Our results for all reported periods were adjusted for the following specified item:
| • | HSBC Canada transaction and integration costs. |
Our results for the three months ended January 31, 2024 were adjusted for the following specified item:
| • | Management of closing capital volatility related to the HSBC Canada transaction. |
Consolidated results, reported and adjusted
The following table provides a reconciliation of our reported results to our adjusted results and illustrates the calculation of adjusted measures presented. The adjusted results and measures presented below are non-GAAP measures or ratios.
| As at or for the three months ended | ||||||||||||
| (Millions of Canadian dollars, except per share, number of and percentage amounts) | January 31 2025 | October 31 2024 | January 31 2024 | |||||||||
Total revenue | $ | 16,739 | $ | 15,074 | $ | 13,485 | ||||||
PCL | 1,050 | 840 | 813 | |||||||||
Non-interest expense | 9,256 | 9,019 | 8,324 | |||||||||
Income before income taxes | 6,433 | 5,215 | 4,348 | |||||||||
Income taxes | 1,302 | 993 | 766 | |||||||||
Net income | $ | 5,131 | $ | 4,222 | $ | 3,582 | ||||||
Net income available to common shareholders | $ | 5,011 | $ | 4,128 | $ | 3,522 | ||||||
Average number of common shares (thousands) | 1,413,937 | 1,414,460 | 1,406,324 | |||||||||
Basic earnings per share (in dollars) | $ | 3.54 | $ | 2.92 | $ | 2.50 | ||||||
Average number of diluted common shares (thousands) | 1,416,502 | 1,416,829 | 1,407,641 | |||||||||
Diluted earnings per share (in dollars) | $ | 3.54 | $ | 2.91 | $ | 2.50 | ||||||
ROE | 16.8% | 14.3% | 13.1% | |||||||||
Effective income tax rate | 20.2% | 19.0% | 17.6% | |||||||||
Total adjusting items impacting net income (before-tax) | $ | 165 | $ | 298 | $ | 631 | ||||||
Specified item: HSBC Canada transaction and integration costs (1), (2) | 12 | 177 | 265 | |||||||||
Specified item: Management of closing capital volatility related to the HSBC Canada transaction (1) | – | – | 286 | |||||||||
Amortization of acquisition-related intangibles (3) | 153 | 121 | 80 | |||||||||
Total income taxes for adjusting items impacting net income | $ | 42 | $ | 81 | $ | 147 | ||||||
Specified item: HSBC Canada transaction and integration costs (1) | 6 | 43 | 47 | |||||||||
Specified item: Management of closing capital volatility related to the HSBC Canada transaction (1) | – | – | 79 | |||||||||
Amortization of acquisition-related intangibles (3) | 36 | 38 | 21 | |||||||||
Adjusted results | ||||||||||||
Income before income taxes – adjusted | $ | 6,598 | $ | 5,513 | $ | 4,979 | ||||||
Income taxes – adjusted | 1,344 | 1,074 | 913 | |||||||||
Net income – adjusted | 5,254 | 4,439 | 4,066 | |||||||||
Net income available to common shareholders – adjusted (4) | 5,134 | 4,345 | 4,006 | |||||||||
Average number of common shares (thousands) | 1,413,937 | 1,414,460 | 1,406,324 | |||||||||
Basic earnings per share (in dollars) – adjusted | $ | 3.63 | $ | 3.07 | $ | 2.85 | ||||||
Average number of diluted common shares (thousands) | 1,416,502 | 1,416,829 | 1,407,641 | |||||||||
Diluted earnings per share (in dollars) – adjusted | $ | 3.62 | $ | 3.07 | $ | 2.85 | ||||||
ROE – adjusted | 17.2% | 15.1% | 14.9% | |||||||||
Effective income tax rate – adjusted | 20.4% | 19.5% | 18.3% | |||||||||
Adjusted efficiency ratio | ||||||||||||
Total revenue | $ | 16,739 | $ | 15,074 | $ | 13,485 | ||||||
Add specified item: Management of closing capital volatility related to the HSBC Canada transaction (before-tax) (1) | – | – | 286 | |||||||||
Total revenue – adjusted (4) | $ | 16,739 | $ | 15,074 | $ | 13,771 | ||||||
Non-interest expense | $ | 9,256 | $ | 9,019 | $ | 8,324 | ||||||
Less specified item: HSBC Canada transaction and integration costs (before-tax) (1) | 12 | 177 | 265 | |||||||||
Less: Amortization of acquisition-related intangibles (before-tax) (3) | 153 | 121 | 80 | |||||||||
Non-interest expense – adjusted (4) | $ | 9,091 | $ | 8,721 | $ | 7,979 | ||||||
Efficiency ratio | 55.3% | 59.8% | 61.7% | |||||||||
Efficiency ratio – adjusted | 54.3% | 57.9% | 57.9% | |||||||||
| (1) | These amounts have been recognized in Corporate Support. |
| (2) | As at January 31, 2025, the cumulative HSBC Canada transaction and integration costs (before-tax) incurred were $1.4 billion. |
| (3) | Represents the impact of amortization of acquisition-related intangibles (excluding amortization of software), and any goodwill impairment. |
| (4) | See Glossary for composition of these measures. |
Royal Bank of Canada
Personal Banking |
| As at or for the three months ended | ||||||||||||
| (Millions of Canadian dollars, except percentage amounts and as otherwise noted) | January 31 2025 (1) | October 31 2024 (1) | January 31 2024 (2) | |||||||||
Net interest income | $ | 3,505 | $ | 3,346 | $ | 2,854 | ||||||
Non-interest income | 1,306 | 1,312 | 1,177 | |||||||||
Total revenue | 4,811 | 4,658 | 4,031 | |||||||||
PCL on performing assets | 63 | 124 | 134 | |||||||||
PCL on impaired assets | 425 | 359 | 330 | |||||||||
PCL | 488 | 483 | 464 | |||||||||
Non-interest expense | 2,015 | 2,033 | 1,724 | |||||||||
Income before income taxes | 2,308 | 2,142 | 1,843 | |||||||||
Net income | $ | 1,678 | $ | 1,579 | $ | 1,353 | ||||||
Revenue by business | ||||||||||||
Personal Banking – Canada | $ | 4,499 | $ | 4,366 | $ | 3,753 | ||||||
Caribbean & U.S. Banking | 312 | 292 | 278 | |||||||||
Selected balance sheet and other information | ||||||||||||
ROE | 23.7% | 23.8% | 26.6% | |||||||||
NIM | 2.58% | 2.49% | 2.34% | |||||||||
Efficiency ratio | 41.9% | 43.6% | 42.8% | |||||||||
Operating leverage (3) | 2.5% | 2.1% | 0.0% | |||||||||
Average total earning assets, net | $ | 539,900 | $ | 534,500 | $ | 486,200 | ||||||
Average loans and acceptances, net | 530,100 | 525,000 | 476,600 | |||||||||
Average deposits | 437,200 | 431,000 | 369,700 | |||||||||
AUA (4) | 266,400 | 255,400 | 218,600 | |||||||||
Average AUA | 261,600 | 252,400 | 215,200 | |||||||||
PCL on impaired loans as a % of average net loans and acceptances | 0.32% | 0.27% | 0.28% | |||||||||
Other selected information – Personal Banking – Canada | ||||||||||||
Net income | $ | 1,583 | $ | 1,485 | $ | 1,259 | ||||||
NIM | 2.50% | 2.41% | 2.25% | |||||||||
Efficiency ratio | 40.5% | 41.8% | 41.2% | |||||||||
Operating leverage | 2.3% | 2.5% | (0.3)% | |||||||||
| (1) | On March 28, 2024, we completed the HSBC Canada transaction. HSBC Canada results have been consolidated from the closing date, which impacted results, balances and ratios for the periods ended January 31, 2025 and October 31, 2024. For further details, refer to the Key corporate events section. |
| (2) | Amounts have been revised from those previously presented to conform to our new basis of segment presentation. For further details, refer to the About Royal Bank of Canada section. |
| (3) | See Glossary for composition of this measure. |
| (4) | AUA represents period-end spot balances and includes securitized residential mortgages and credit card loans as at January 31, 2025 of $15 billion and $6 billion, respectively (October 31, 2024 – $15 billion and $6 billion; January 31, 2024 – $14 billion and $6 billion). |
Financial performance
Q1 2025 vs. Q1 2024
Net income increased $325 million or 24% from a year ago. The inclusion of HSBC Canada results increased net income by $91 million. Excluding HSBC Canada results, net income increased $234 million or 17%, primarily driven by higher net interest income reflecting higher spreads and average volume growth of 6% in Personal Banking – Canada. Higher non-interest income also contributed to the increase. These factors were partially offset by higher non-interest expenses.
Total revenue increased $780 million or 19%.
Personal Banking – Canada revenue increased $746 million or 20%, of which $261 million reflects the inclusion of HSBC Canada revenue. The remaining increase of $485 million or 13% was primarily due to higher net interest income reflecting higher spreads and average volume growth of 8% in deposits and 4% in loans. Higher average mutual fund balances driving higher distribution fees also contributed to the increase.
Caribbean & U.S. Banking revenue increased $34 million or 12%, mainly reflecting the impact of foreign exchange translation. Higher net interest income reflecting average volume growth in loans and deposits also contributed to the increase.
NIM was up 24 bps, mainly due to changes in product mix and the sustained impact of a higher rate environment. These factors were partially offset by competitive pricing pressures in deposits.
PCL increased $24 million or 5%, mainly due to higher provisions on impaired loans, largely in our Canadian personal and credit cards portfolios, resulting in an increase of 4 bps in the PCL on impaired loans ratio. This was partially offset by lower provisions on performing loans, largely driven by favourable changes to our macroeconomic forecast.
Non-interest expense increased $291 million or 17%, of which $130 million reflects the inclusion of HSBC Canada non-interest expense. The remaining increase of $161 million or 9% was primarily due to higher staff-related costs, including severance, higher professional fees and ongoing technology investments.
14 First Quarter 2025
Royal Bank of Canada
Q1 2025 vs. Q4 2024
Net income increased $99 million or 6% from last quarter, primarily driven by higher net interest income reflecting higher spreads and average volume growth of 1% in Personal Banking – Canada.
Total revenue increased $153 million or 3%, primarily due to higher net interest income reflecting higher spreads and average volume growth of 1% in deposits and 1% in loans in Personal Banking – Canada.
NIM was up 9 bps, mainly due to a favourable shift in product mix.
PCL increased $5 million or 1%, mainly due to higher provisions on impaired loans, largely in our Canadian residential mortgages portfolio, resulting in an increase of 5 bps in the PCL on impaired loans ratio. This was partially offset by lower provisions on performing loans, mainly driven by lower unfavourable changes in credit quality.
Non-interest expense decreased $18 million or 1%, as the prior period reflected higher marketing costs, lease exit costs and higher professional fees. These factors were partially offset by higher staff-related costs, primarily due to severance and seasonally higher compensation in the current quarter.
Commercial Banking |
| As at or for the three months ended | ||||||||||||
| (Millions of Canadian dollars, except percentage amounts and as otherwise noted) | January 31 2025 (1) | October 31 2024 (1) | January 31 2024 (2) | |||||||||
Net interest income | $ | 1,796 | $ | 1,763 | $ | 1,282 | ||||||
Non-interest income | 331 | 314 | 331 | |||||||||
Total revenue | 2,127 | 2,077 | 1,613 | |||||||||
PCL on performing assets | 31 | 66 | 16 | |||||||||
PCL on impaired assets | 308 | 233 | 154 | |||||||||
PCL | 339 | 299 | 170 | |||||||||
Non-interest expense | 710 | 713 | 542 | |||||||||
Income before income taxes | 1,078 | 1,065 | 901 | |||||||||
Net income | $ | 777 | $ | 774 | $ | 650 | ||||||
Selected balance sheet and other information | ||||||||||||
ROE | 15.5% | 16.7% | 23.0% | |||||||||
NIM | 3.89% | 3.89% | 4.33% | |||||||||
Efficiency ratio | 33.4% | 34.3% | 33.6% | |||||||||
Operating leverage | 0.9% | 5.8% | 1.3% | |||||||||
Average total earning assets, net | $ | 183,300 | $ | 180,200 | $ | 117,800 | ||||||
Average loans and acceptances, net | 183,200 | 180,600 | 136,000 | |||||||||
Average deposits | 304,900 | 301,900 | 256,300 | |||||||||
PCL on impaired loans as a % of average net loans and acceptances | 0.67% | 0.52% | 0.45% | |||||||||
| (1) | On March 28, 2024, we completed the HSBC Canada transaction. HSBC Canada results have been consolidated from the closing date, which impacted results, balances and ratios for the periods ended January 31, 2025 and October 31, 2024. For further details, refer to the Key corporate events section. |
| (2) | Amounts have been revised from those previously presented to conform to our new basis of segment presentation. For further details, refer to the About Royal Bank of Canada section. |
Financial performance
Q1 2025 vs. Q1 2024
Net income increased $127 million or 20% from a year ago. The inclusion of HSBC Canada results increased net income by $73 million. Excluding HSBC Canada results, net income increased $54 million or 8%, primarily driven by higher total revenue, partially offset by higher non-interest expenses.
Total revenue increased $514 million or 32%, of which $358 million reflects the inclusion of HSBC Canada revenue. The remaining increase of $156 million or 10% was primarily due to higher net interest income reflecting average volume growth of 10% in loans and acceptances. The increase also includes the impact of the cessation of Bankers’ Acceptance-based lending, which was largely offset in non-interest income, and average volume growth of 8% in deposits. These factors were partially offset by lower non-interest income, primarily in credit fees reflecting the impact of the cessation of Bankers’ Acceptance-based lending, which was largely offset in net interest income as noted above. Lower credit fees were also partially offset by higher service charges.
PCL increased $169 million or 99%, mainly due to higher provisions on impaired loans in the HSBC Canada portfolio in a few sectors, including the forest products, industrial products and consumer discretionary sectors, resulting in an increase of 22 bps in the PCL on impaired loans ratio.
Non-interest
expense increased $168 million or 31%, of which $106 million reflects the inclusion of HSBC Canadanon-interest
expense. The remaining increase of $62 million or 11% was primarily due to higher staff-related costs and higher professional fees.Q1 2025 vs. Q4 2024
Net income remained relatively flat from last quarter as higher total revenue was offset by higher PCL.
Total revenue increased $50 million or 2%, primarily due to higher net interest income reflecting average volume growth of 1% in loans and acceptances and 1% in deposits.
PCL increased $40 million or 13%, mainly due to higher provisions on impaired loans in a few sectors, including the consumer discretionary and forest products sectors, resulting in an increase of 15 bps in the PCL on impaired loans ratio. This was partially offset by lower provisions on performing loans, mainly driven by lower unfavourable changes in credit quality and favourable changes to our macroeconomic forecast.
Non-interest
expense remained relatively flat.Royal Bank of Canada
Wealth Management |
| As at or for the three months ended | ||||||||||||
| (Millions of Canadian dollars, except percentage amounts and as otherwise noted) | January 31 2025 (1) | October 31 2024 (1) | January 31 2024 (2) | |||||||||
Net interest income | $ | 1,394 | $ | 1,282 | $ | 1,230 | ||||||
Non-interest income | 4,174 | 3,904 | 3,457 | |||||||||
Total revenue | 5,568 | 5,186 | 4,687 | |||||||||
PCL on performing assets | 36 | (57 | ) | (27 | ) | |||||||
PCL on impaired assets | 45 | 32 | 38 | |||||||||
PCL | 81 | (25 | ) | 11 | ||||||||
Non-interest expense | 4,204 | 3,981 | 3,841 | |||||||||
Income before income taxes | 1,283 | 1,230 | 835 | |||||||||
Net income | $ | 980 | $ | 969 | $ | 664 | ||||||
Revenue by business | ||||||||||||
Canadian Wealth Management | $ | 1,693 | $ | 1,554 | $ | 1,327 | ||||||
U.S. Wealth Management (including City National) | 2,466 | 2,331 | 2,158 | |||||||||
U.S. Wealth Management (including City National) (US$ millions) | 1,722 | 1,709 | 1,609 | |||||||||
Global Asset Management | 867 | 768 | 725 | |||||||||
International Wealth Management | 344 | 350 | 317 | |||||||||
Investor Services | 198 | 183 | 160 | |||||||||
Selected balance sheet and other information | ||||||||||||
ROE | 15.2% | 16.0% | 11.5% | |||||||||
NIM | 3.34% | 3.31% | 3.25% | |||||||||
Pre-tax margin(3) | 23.0% | 23.7% | 17.8% | |||||||||
Number of advisors (4) | 6,180 | 6,116 | 6,125 | |||||||||
Average total earning assets, net | $ | 165,700 | $ | 153,900 | $ | 150,500 | ||||||
Average loans and acceptances, net | 122,100 | 115,100 | 113,400 | |||||||||
Average deposits | 183,700 | 167,600 | 160,000 | |||||||||
AUA (5) | 4,856,800 | 4,685,900 | 4,249,500 | |||||||||
AUM (5) | 1,419,200 | 1,332,500 | 1,141,200 | |||||||||
Average AUA | 4,778,100 | 4,621,700 | 4,204,100 | |||||||||
Average AUM | 1,361,700 | 1,289,500 | 1,122,100 | |||||||||
PCL on impaired loans as a % of average net loans and acceptances | 0.15% | 0.11% | 0.13% | |||||||||
Estimated impact of U.S. dollar, British pound and Euro translation on key income statement items (Millions of Canadian dollars, except percentage amounts) | For the three months ended | |||||||
Q1 2025 vs. Q1 2024 | Q1 2025 vs. Q4 2024 | |||||||
Increase (decrease): | ||||||||
Total revenue | $ | 200 | $ | 129 | ||||
PCL | 6 | 5 | ||||||
Non-interest expense | 158 | 102 | ||||||
Net income | 29 | 18 | ||||||
Percentage change in average U.S. dollar equivalent of C$1.00 | (6)% | (5)% | ||||||
Percentage change in average British pound equivalent of C$1.00 | (5)% | –% | ||||||
Percentage change in average Euro equivalent of C$1.00 | (2)% | 1% | ||||||
| (1) | On March 28, 2024, we completed the HSBC Canada transaction. HSBC Canada results have been consolidated from the closing date, which impacted results, balances and ratios for the periods ended January 31, 2025 and October 31, 2024. For further details, refer to the Key corporate events section. |
| (2) | Amounts have been revised from those previously presented to conform to our new basis of segment presentation. For further details, refer to the About Royal Bank of Canada section. |
| (3) | Pre-tax margin is defined as Income before income taxes divided by Total revenue. |
| (4) | Represents client-facing advisors across all of our Wealth Management businesses. |
| (5) | Represents period-end spot balances. |
Financial performance
Q1 2025 vs. Q1 2024
Net income increased $316 million or 48% from a year ago, mainly due to higher fee-based client assets reflecting market appreciation and net sales, which also drove higher variable compensation. The prior year also included the cost of the FDIC special assessment.
Total revenue increased $881 million or 19%.
Canadian Wealth Management revenue increased $366 million or 28%, mainly due to higher fee-based client assets reflecting market appreciation and net sales. Higher transactional revenue, primarily driven by client activity, and higher net interest income reflecting higher spreads and average volume growth in deposits also contributed to the increase.
U.S. Wealth Management (including City National) revenue increased $308 million or 14%. In U.S. dollars, revenue increased $113 million or 7%, primarily due to higher fee-based client assets reflecting market appreciation and net sales.
Global Asset Management revenue increased $142 million or 20%, primarily due to higher fee-based client assets reflecting market appreciation and net sales and higher performance fees. The inclusion of HSBC Canada revenue also contributed to the increase.
International Wealth Management revenue increased $27 million or 9%, primarily due to the impact of foreign exchange translation and higher fee-based client assets reflecting market appreciation.
16 First Quarter 2025
Royal Bank of Canada
Investor Services revenue increased $38 million or 24%, mainly due to higher net interest income reflecting higher spreads and average volume growth in deposits.
PCL increased $70 million, primarily due to provisions taken on performing loans in the current quarter in U.S. Wealth Management (including City National), mainly reflecting unfavourable changes in credit quality outlook, including provisions related to the California wildfires, as compared to releases of provisions last year.
Non-interest expense increased $363 million or 9%, largely due to higher variable compensation commensurate with increased results, the impact of foreign exchange translation and higher staff costs. These factors were partially offset by the cost of the FDIC special assessment in the prior year.
Q1 2025 vs. Q4 2024
Net income increased $11 million or 1% from last quarter, mainly reflecting revenue growth driven by higher fee-based client assets and net interest income. This was largely offset by higher expenses, primarily reflecting higher staff costs, including seasonally higher compensation, and higher PCL, which includes provisions related to the California wildfires.
Total revenue increased $382 million or 7%, mainly due to the impact of foreign exchange translation and higher fee-based client assets reflecting market appreciation and net sales. Higher net interest income reflecting higher average volume growth in deposits, higher performance fees, as well as higher transactional revenue, primarily driven by client activity, also contributed to the increase.
PCL was $81 million compared to $(25) million last quarter, primarily reflecting provisions taken on performing loans in the current quarter in U.S. Wealth Management (including City National), mainly driven by unfavourable changes in credit quality outlook, including provisions related to the California wildfires, as compared to releases of provisions last quarter.
Non-interest expense increased $223 million or 6%, primarily reflecting higher staff costs, including seasonally higher compensation, and the impact of foreign exchange translation.
Insurance |
| As at or for the three months ended | ||||||||||||
| (Millions of Canadian dollars, except percentage amounts and as otherwise noted) | January 31 2025 | October 31 2024 | January 31 2024 | |||||||||
Non-interest income | ||||||||||||
Insurance service result | $ | 286 | $ | 173 | $ | 187 | ||||||
Insurance investment result | 82 | 66 | 141 | |||||||||
Other income | 38 | 39 | 35 | |||||||||
Total revenue | 406 | 278 | 363 | |||||||||
PCL | – | – | 1 | |||||||||
Non-interest expense | 87 | 75 | 71 | |||||||||
Income before income taxes | 319 | 203 | 291 | |||||||||
Net income | $ | 272 | $ | 162 | $ | 220 | ||||||
Selected balances and other information | ||||||||||||
ROE | 49.9% | 31.7% | 40.5% | |||||||||
Premiums and deposits (1) | $ | 2,317 | $ | 1,502 | $ | 1,346 | ||||||
Contractual service margin (CSM) (2) | 2,008 | 2,137 | 1,977 | |||||||||
| (1) | Premiums and deposits include premiums on risk-based individual and group insurance and annuity products as well as segregated fund deposits, consistent with insurance industry practices. |
| (2) | Represents the CSM of insurance contract assets and liabilities net of reinsurance contract held assets and liabilities. For insurance contracts, the CSM represents the unearned profit (net inflows) for providing insurance coverage. For reinsurance contracts held, the CSM represents the net cost or net gain of purchasing reinsurance. The CSM is not applicable to contracts measured using the premium allocation approach. |
Financial performance
Q1 2025 vs. Q1 2024
Net income increased $52 million or 24% from a year ago, primarily due to higher insurance service result driven by the impact of reinsurance contract recaptures and improved claims experience across the majority of our products. Lower taxes reflecting changes in earnings mix also contributed to the increase. This was partially offset by lower insurance investment result, primarily reflecting higher favourable investment-related experience in the prior period on transition to IFRS 17.
Total revenue increased $43 million or 12%, primarily due to higher insurance service result, partially offset by lower insurance investment result, as noted above.
Non-interest
expense increased $16 million or 23%, primarily due to higher staff-related costs, including severance.Q1 2025 vs. Q4 2024
Net income increased $110 million or 68% from last quarter, primarily due to higher insurance service result driven by the impact of reinsurance contract recaptures, adjustments relating to deferred acquisition expenses in the prior period and improved claims experience.
Total revenue increased $128 million or 46%, primarily due to higher insurance service result, as noted above.
Non-interest
expense increased $12 million or 16%, primarily due to higher staff-related costs, including severance, and ongoing technology investments.Royal Bank of Canada
First Quarter 2025 17Capital Markets |
| As at or for the three months ended | ||||||||||||
| (Millions of Canadian dollars, except percentage amounts and as otherwise noted) | January 31 2025 (1) | October 31 2024 (1) | January 31 2024 | |||||||||
Net interest income (2) | $ | 918 | $ | 941 | $ | 661 | ||||||
Non-interest income (2) | 2,838 | 1,962 | 2,290 | |||||||||
Total revenue (2) | 3,756 | 2,903 | 2,951 | |||||||||
| PCL on performing assets | (63 | ) | 68 | 6 | ||||||||
| PCL on impaired assets | 205 | 14 | 161 | |||||||||
| PCL | 142 | 82 | 167 | |||||||||
| Non-interest expense | 2,041 | 1,897 | 1,642 | |||||||||
| Income before income taxes | 1,573 | 924 | 1,142 | |||||||||
| Net income | $ | 1,432 | $ | 985 | $ | 1,154 | ||||||
| Revenue by business | ||||||||||||
Corporate & Investment Banking (3), (4) | $ | 1,715 | $ | 1,537 | $ | 1,380 | ||||||
Global Markets (3) | 2,079 | 1,349 | 1,682 | |||||||||
Other (4) | (38 | ) | 17 | (111 | ) | |||||||
| Selected balance sheet and other information | ||||||||||||
| ROE | 14.9% | 11.8% | 14.6% | |||||||||
| Average total assets | $ | 1,326,700 | $ | 1,099,000 | $ | 1,194,900 | ||||||
| Average trading securities | 211,600 | 173,700 | 204,100 | |||||||||
| Average loans and acceptances, net | 159,700 | 148,700 | 142,100 | |||||||||
| Average deposits | 360,300 | 301,100 | 292,500 | |||||||||
| PCL on impaired loans as a % of average net loans and acceptances | 0.51% | 0.04% | 0.45% | |||||||||
Estimated impact of U.S. dollar, British pound and Euro translation on key income statement items (Millions of Canadian dollars, except percentage amounts) | For the three months ended | |||||||||||
| Q1 2025 vs. Q1 2024 | Q1 2025 vs. Q4 2024 | |||||||||||
Increase (decrease): | ||||||||||||
| Total revenue | $ | 226 | $ | 145 | ||||||||
| PCL | 7 | 2 | ||||||||||
| Non-interest expense | 89 | 54 | ||||||||||
| Net income | 113 | 77 | ||||||||||
| Percentage change in average U.S. dollar equivalent of C$1.00 | (6)% | (5)% | ||||||||||
| Percentage change in average British pound equivalent of C$1.00 | (5)% | –% | ||||||||||
| Percentage change in average Euro equivalent of C$1.00 | (2)% | 1% | ||||||||||
| (1) | On March 28, 2024, we completed the HSBC Canada transaction. HSBC Canada results have been consolidated from the closing date, which impacted results, balances and ratios for the periods ended January 31, 2025 and October 31, 2024. For further details, refer to the Key corporate events section. |
| (2) | The taxable equivalent basis (teb) adjustment for the three months ended January 31, 2025 was $26 million (October 31, 2024 – $13 million; January 31, 2024 – $54 million). For further discussion, refer to the How we measure and report our business segments section of our 2024 Annual Report. |
| (3) | Effective the third quarter of 2024, we moved the majority of our debt origination business from Global Markets to Corporate & Investment Banking. Comparative amounts for the three months ended January 31, 2024 have been revised from those previously presented. |
| (4) | Comparative amounts have been revised from those previously presented. |
Financial performance
Q1 2025 vs. Q1 2024
Net income increased $278 million or 24% from a year ago, primarily driven by higher revenue in Corporate & Investment Banking and Global Markets, as well as the impact of foreign exchange translation. These factors were partially offset by higher compensation on increased results and higher taxes including the impact of Pillar Two legislation and changes in earnings mix.
Total revenue increased $80
5 million or
27%.Corporate & Investment Banking revenue increased $335 million or 24%, mainly due to the impact of loan underwriting markdowns in the prior year, higher loan syndication activity in North America, higher lending revenue in Europe and Canada, as well as higher debt origination primarily in the U.S. The impact of foreign exchange translation also contributed to the increase.
Global Markets revenue increased $397 million or 24%, mainly due to the impact of foreign exchange translation, higher equity trading revenue across most regions and higher foreign exchange trading revenue primarily in Canada.
Other revenue improved $73 million or 66%, largely reflecting lower residual funding and capital costs.
PCL decreased $25 million or 15%, mainly due to lower provisions on impaired loans in the real estate and related sector. This was partially offset by a higher provision taken on one account in the other services sector tha
t mig
rated from performing to impaired during the current quarter and resulted in releases of provisions on performing loans and higher provisions taken on impaired loans. The PCL on impaired loans ratio increased 6 bps.Non-interest
expense increased $399 million or 24%, mainly driven by higher compensation on increased results, the impact of foreign exchange translation and ongoing technology investments.18 First Quarter 2025
Royal Bank of Canada
Q1 2025 vs. Q4 2024
Net income increased $447 million or 45% from last quarter, mainly due to higher revenue in Global Markets. Higher revenue in Corporate & Investment Banking also contributed to the increase. These factors were partially offset by higher compensation on increased results and higher taxes including the impact of Pillar Two legislation and cha
nges in earnin
gs mix.Total revenue increased $853 million or 29%, mainly due to higher fixed income, equity and foreign exchange trading revenue across most regions. The impact of foreign exchange translation also contributed to the increase.
PCL increased $60 million or 73%, primarily due to a higher provision taken on one account in the other services sector that migrated from performing to impaired during the current quarter and resulted in releases of provisions on performing loans and higher provisions taken on impaired loans.
Non-interest
expense increased $144 million or 8%, largely driven by higher compensation on increased results and the impact of foreign exchange translation. These factors were partially offset by the impact of higher legal provisions in the prior quarter.Corporate Support |
| For the three months ended | ||||||||||||
| (Millions of Canadian dollars) | January 31 2025 | October 31 2024 | January 31 2024 | |||||||||
Net interest income (loss) (1) | $ | 335 | $ | 339 | $ | 305 | ||||||
Non-interest income (loss)(1), (2) | (264 | ) | (367 | ) | (465 | ) | ||||||
Total revenue (1), (2) | 71 | (28 | ) | (160 | ) | |||||||
PCL | – | 1 | – | |||||||||
Non-interest expense(2) | 199 | 320 | 504 | |||||||||
Income (loss) before income taxes (1) | (128 | ) | (349 | ) | (664 | ) | ||||||
Income taxes (recoveries) (1) | (120 | ) | (102 | ) | (205 | ) | ||||||
Net income (loss) | $ | (8 | ) | $ | (247 | ) | $ | (459 | ) | |||
| (1) | Teb adjusted. |
| (2) | Revenue for the three months ended January 31, 2025 included gains of $112 million (October 31, 2024 and January 31, 2024 – gains of $47 million and gains of $222 million, respectively) on economic hedges of our U.S. Wealth Management (including City National) share-based compensation plans, and non-interest expense included $108 million (October 31, 2024 and January 31, 2024 – $50 million and $206 million, respectively) of share-based compensation expense driven by changes in the fair value of liabilities relating to our U.S. Wealth Management (including City National) share-based compensation plans. |
Due to the nature of activities and consolidation adjustments reported in this segment, we believe that a comparative period analysis is not relevant.
Total revenue and Income taxes (recoveries) in Corporate Support include the deduction of the teb adjustment related to
gross-up
of income from the U.S. tax credit investment business and income from Canadian taxable corporate dividends received on or before December 31, 2023 that are recorded in Capital Markets. For further details on the elimination of the availability of the dividend received deduction for Canadian taxable corporate dividends after December 31, 2023, refer to the Legal and regulatory environment risk section in our 2024 Annual Report.The teb amount for the three months ended January 31, 2025 was $26 million, compared to $13 million in the prior quarter and $54 million in the same quarter last year.
The following identifies the material items, other than the teb impacts noted previously, affecting the reported results in each period.
Q1 2025
Net loss was $8 million.
Q4 2024
Net loss was $247 million, primarily due to the
after-tax
impact of HSBC Canada transaction and integration costs of $134 million, which is treated as a specified item. Residual unallocated costs also contributed to the net loss.Q1 2024
Net loss was $459 million, primarily due to the
after-tax
impact of HSBC Canada transaction and integration costs of $218 million and theafter-tax
impact of management of closing capital volatility related to the HSBC Canada transaction of $207 million, both of which are treated as specified items.For further details on specified items, refer to the Key performance and
non-GAAP
measures section.Royal Bank of Canada
Quarterly results and trend analysis |
Our quarterly results are impacted by a number of trends and recurring factors, which include seasonality of certain businesses, general economic and market conditions, and fluctuations in the Canadian dollar relative to other currencies. The following table summarizes our results for the last eight quarters (the period):
Quarterly results
(1)
2025 | 2024 | 2023 | ||||||||||||||||||||||||||||||||||||||
| (Millions of Canadian dollars, except per share and percentage amounts) | Q1 (2) | Q4 (2) | Q3 (2) | Q2 (2) | Q1 | Q4 | Q3 | Q2 | ||||||||||||||||||||||||||||||||
Personal Banking | $ | 4,811 | $ | 4,658 | $ | 4,490 | $ | 4,163 | $ | 4,031 | $ | 4,009 | $ | 3,898 | $ | 3,711 | ||||||||||||||||||||||||
Commercial Banking | 2,127 | 2,077 | 2,036 | 1,656 | 1,613 | 1,565 | 1,511 | 1,433 | ||||||||||||||||||||||||||||||||
Wealth Management | 5,568 | 5,186 | 4,964 | 4,789 | 4,687 | 4,332 | 4,556 | 4,548 | ||||||||||||||||||||||||||||||||
Insurance | 406 | 278 | 285 | 298 | 363 | 248 | 336 | 272 | ||||||||||||||||||||||||||||||||
Capital Markets (3) | 3,756 | 2,903 | 3,004 | 3,154 | 2,951 | 2,564 | 2,679 | 2,662 | ||||||||||||||||||||||||||||||||
Corporate Support (3) | 71 | (28 | ) | (148 | ) | 94 | (160 | ) | (33 | ) | (3 | ) | (181 | ) | ||||||||||||||||||||||||||
Total revenue | 16,739 | 15,074 | 14,631 | 14,154 | 13,485 | 12,685 | 12,977 | 12,445 | ||||||||||||||||||||||||||||||||
PCL | 1,050 | 840 | 659 | 920 | 813 | 720 | 616 | 600 | ||||||||||||||||||||||||||||||||
Non-interest expense | 9,256 | 9,019 | 8,599 | 8,308 | 8,324 | 8,059 | 7,765 | 7,400 | ||||||||||||||||||||||||||||||||
Income before income taxes | 6,433 | 5,215 | 5,373 | 4,926 | 4,348 | 3,906 | 4,596 | 4,445 | ||||||||||||||||||||||||||||||||
Income taxes | 1,302 | 993 | 887 | 976 | 766 | (33 | ) | 736 | 765 | |||||||||||||||||||||||||||||||
Net income | $ | 5,131 | $ | 4,222 | $ | 4,486 | $ | 3,950 | $ | 3,582 | $ | 3,939 | $ | 3,860 | $ | 3,680 | ||||||||||||||||||||||||
EPS – basic | $ | 3.54 | $ | 2.92 | $ | 3.09 | $ | 2.75 | $ | 2.50 | $ | 2.77 | $ | 2.73 | $ | 2.60 | ||||||||||||||||||||||||
– diluted | 3.54 | 2.91 | 3.09 | 2.74 | 2.50 | 2.76 | 2.73 | 2.60 | ||||||||||||||||||||||||||||||||
Effective income tax rate | 20.2% | 19.0% | 16.5% | 19.8% | 17.6% | (0.8)% | 16.0% | 17.2% | ||||||||||||||||||||||||||||||||
Period average US$ equivalent of C$1.00 | $ | 0.699 | $ | 0.733 | $ | 0.730 | $ | 0.734 | $ | 0.745 | $ | 0.732 | $ | 0.750 | $ | 0.737 | ||||||||||||||||||||||||
| (1) | Fluctuations in the Canadian dollar relative to other foreign currencies have affected our consolidated results over the period. |
| (2) | On March 28, 2024, we completed the HSBC Canada transaction. HSBC Canada results have been consolidated from the closing date, and are included in our Personal Banking, Commercial Banking, Wealth Management and Capital Markets segments. For further details, refer to the Key corporate events section. |
| (3) | Teb adjusted. For further discussion, refer to the How we measure and report our business segments section of our 2024 Annual Report. |
Seasonality
Seasonal factors may impact our results in certain quarters. The first quarter has historically been stronger for our Capital Markets businesses. The second quarter has fewer days than the other quarters, which generally results in a decrease in net interest income and certain expense items. The third and fourth quarters include the summer months, which generally results in lower client activity and may negatively impact the results of our Capital Markets trading business.
Trend analysis
Earnings over the period have been impacted by the factors noted below.
Personal Banking revenue has benefitted from volume growth in loans and deposits over the period. NIM has been favourably impacted by changes in product mix and the higher interest rate environment, partially offset by competitive pricing pressures. HSBC Canada revenue has been included since the transaction closed on March 28, 2024.
Commercial Banking revenue has benefitted from volume growth in loans and deposits over the period. HSBC Canada revenue has been included since the transaction closed on March 28, 2024.
Wealth Management revenue has generally benefitted from growth in
fee-based
client assets, which is influenced by market conditions. On July 3, 2023, we completed the sale of the European asset servicing activities of RBC Investor Services®
and its associated Malaysian centre of excellence. The fourth quarter of 2023 reflected impairment losses on our interest in an associated company.Insurance revenue reflects fluctuations in market conditions and insurance experience. New business gains are deferred through CSM and new business losses are reflected through insurance service result. In the first quarter of 2025, insurance revenue also reflected the impact of reinsurance contract recaptures.
Capital Markets revenue is influenced, to a large extent, by market conditions that impact client activity. While investment banking fee pools were muted in 2023, we saw an increase in activity beginning the second quarter of 2024. Over the period, we have seen improving client activity across all major products. Sales & trading activity improved in 2023 and carried increasingly strong momentum into 2024 and 2025 as market conditions continued to be constructive.
PCL is comprised of provisions taken on performing assets and provisions taken on impaired assets. PCL on performing assets fluctuated over the period as it is impacted by changes in credit quality, macroeconomic conditions and exposures. Provisions on performing assets over the period have generally been reflective of unfavourable changes in credit quality. During the early part of the period, there were unfavourable changes in our macroeconomic forecast. Starting in 2024, we have seen improvements in our macroeconomic forecast. The second quarter of 2024 includes initial PCL on performing loans purchased in the HSBC Canada transaction. PCL on impaired assets has generally trended upwards over the period.
Non-interest
expense has been impacted by fluctuations in variable compensation over the period, commensurate with fluctuations in revenue and earnings. Changes in the fair value of our U.S. share-based compensation plans, which are largely offset in revenue, have also contributed to fluctuations over the period and are impacted by market conditions. While we continue to focus on efficiency management activities, expenses over the period also reflect investments in staff and technology. Beginning in fiscal 2023, expenses have also included HSBC Canada transaction and integration costs. HSBC Canadanon-interest
expenses have been included since the transaction closed on March 28, 2024.20 First Quarter 2025
Royal Bank of Canada
Our effective income tax rate has fluctuated over the period, mostly due to varying levels of tax adjustments and changes in earnings mix. The fourth quarter of 2023 reflects the recognition of deferred tax assets relating to realized losses in City National associated with the intercompany sale of certain debt securities. The first quarter of 2025 reflects the impact of Pillar Two legislation, which became effective for us beginning November 1, 2024.
Financial condition |
Condensed balance sheets |
| As at | ||||||||
| (Millions of Canadian dollars) | January 31 2025 | October 31 2024 | ||||||
Assets | ||||||||
Cash and due from banks | $ | 71,200 | $ | 56,723 | ||||
Interest-bearing deposits with banks | 47,924 | 66,020 | ||||||
Securities, net of applicable allowance (1) | 488,025 | 439,918 | ||||||
Assets purchased under reverse repurchase agreements and securities borrowed | 280,451 | 350,803 | ||||||
Loans | ||||||||
Retail | 633,400 | 626,978 | ||||||
Wholesale | 379,250 | 360,439 | ||||||
Allowance for loan losses | (6,600 | ) | (6,037 | ) | ||||
Other – Derivatives | 153,686 | 150,612 | ||||||
– Other | 143,690 | 126,126 | ||||||
Total assets | $ | 2,191,026 | $ | 2,171,582 | ||||
Liabilities | ||||||||
Deposits | $ | 1,441,940 | $ | 1,409,531 | ||||
Other – Derivatives | 161,590 | 163,763 | ||||||
– Other | 440,563 | 457,550 | ||||||
Subordinated debentures | 13,670 | 13,546 | ||||||
Total liabilities | 2,057,763 | 2,044,390 | ||||||
Equity attributable to shareholders | 133,167 | 127,089 | ||||||
Non-controlling interests | 96 | 103 | ||||||
Total equity | 133,263 | 127,192 | ||||||
Total liabilities and equity | $ | 2,191,026 | $ | 2,171,582 | ||||
| (1) | Securities are comprised of trading and investment securities. |
Q1 2025 vs. Q4 2024
Total assets increased $19 billion or 1% from October 31, 2024. Foreign exchange translation increased total assets by $129 billion.
Cash and due from banks increased $14 billion or 26%, primarily due to higher deposits with central banks reflecting short-term cash management activities.
Interest-bearing deposits with banks decreased $18 billion or 27%, mainly due to lower deposits with central banks reflecting cash management activities.
Securities, net of applicable allowance, increased $48 billion or 11%, primarily due to higher government debt securities reflecting liquidity management activities and favourable market opportunities. The impact of foreign exchange translation also contributed to the increase.
Assets purchased under reverse repurchase agreements (reverse repos) and securities borrowed decreased $70 billion or 20%, primarily reflecting decreased client financing activity.
Loans (net of Allowance for loan losses) increased $25 billion or 3%, primarily due to volume growth in wholesale loans and residential mortgages and the impact of foreign exchange translation.
Derivative assets increased $3 billion or 2%, mainly attributable to the impact of foreign exchange translation, largely offset by lower fair values on foreign exchange contracts.
Other assets increased $18 billion or 14%, largely due to higher cash collateral and higher commodity trading receivables reflecting market conditions and client activity. The impact of foreign exchange translation also contributed to the increase.
Total liabilities increased $13 billion or 1%. Foreign exchange translation increased total liabilities by $129 billion.
Deposits increased $32 billion or 2%, mainly attributable to the impact of foreign exchange translation, higher demand deposits driven by client activity and higher business and government term deposits driven by liquidity management activities, partially offset by lower bank term deposits reflecting decreased client activity.
Derivative liabilities decreased $2 billion or 1%, mainly attributable to lower fair values on foreign exchange contracts and lower equity contracts, largely offset by the impact of foreign exchange translation.
Other liabilities decreased $17 billion or 4%, mainly due to lower obligations related to repurchase agreements (repos) reflecting decreased client financing activity, partially offset by higher securities sold short and the impact of foreign exchange translation.
Total equity increased $6 billion or 5%, reflecting earnings, net of dividends, the impact of foreign currency translation and the issuance of limited recourse capital notes.
Royal Bank of Canada
Off-balance sheet arrangements |
In the normal course of business, we engage in a variety of financial transactions that, for accounting purposes, are not recorded on our Consolidated Balance Sheets.
Off-balance
sheet transactions are generally undertaken for risk, capital and funding management purposes which benefit us and our clients. These include transactions with structured entities and may also include the purchase or issuance of guarantees. These transactions give rise to, among other risks, varying degrees of market, credit, liquidity and funding risks, which are discussed in the Risk management section of this Q1 2025 Report to Shareholders.Our significant
off-balance
sheet transactions include those described on pages 64 to 66 of our 2024 Annual Report.Risk management |
Credit risk |
Credit risk is the risk of loss associated with an obligor’s potential inability or unwillingness to fulfill its contractual obligations on a timely basis and may arise directly from the risk of default of a primary obligor (e.g., issuer, debtor, counterparty, borrower or policyholder), indirectly from a secondary obligor (e.g., guarantor or reinsurer), through
off-balance
sheet exposures, contingent credit risk, associated credit risk and/or transactional risk. Credit risk includes counterparty credit risk arising from both trading andnon-trading
activities.Our Enterprise Credit Risk Management Framework (ECRMF) and supporting credit policies are designed to clearly define roles and responsibilities, acceptable practices, limits and key controls. There have been no material changes to our ECRMF as described in our 2024 Annual Report.
22 First Quarter 2025
Royal Bank of Canada
Residential mortgages and home equity lines of credit (insured vs. uninsured)
(1)
Residential mortgages and home equity lines of credit are secured by residential properties. The following table presents a breakdown by geographic region.
As at January 31, 2025 | ||||||||||||||||||||||||||||||
(Millions of Canadian dollars, except percentage amounts) | Residential mortgages | Home equity lines of credit | ||||||||||||||||||||||||||||
Insured | Uninsured | Total | Total | |||||||||||||||||||||||||||
Region (4) | ||||||||||||||||||||||||||||||
Canada | ||||||||||||||||||||||||||||||
Atlantic provinces | $ | 8,713 | 42 | % | $ | 11,921 | 58 | % | $ | 20,634 | $ | 1,683 | ||||||||||||||||||
Quebec | 11,639 | 25 | 35,405 | 75 | 47,044 | 3,332 | ||||||||||||||||||||||||
Ontario | 31,709 | 14 | 191,308 | 86 | 223,017 | 17,998 | ||||||||||||||||||||||||
Alberta | 18,584 | 43 | 24,818 | 57 | 43,402 | 4,410 | ||||||||||||||||||||||||
Saskatchewan and Manitoba | 8,437 | 41 | 12,313 | 59 | 20,750 | 1,674 | ||||||||||||||||||||||||
B.C. and territories | 12,432 | 14 | 75,981 | 86 | 88,413 | 8,081 | ||||||||||||||||||||||||
Total Canada (5) | 91,514 | 21 | 351,746 | 79 | 443,260 | 37,178 | ||||||||||||||||||||||||
U.S. | – | – | 35,235 | 100 | 35,235 | 2,320 | ||||||||||||||||||||||||
Other International | – | – | 3,427 | 100 | 3,427 | 1,411 | ||||||||||||||||||||||||
Total International | – | – | 38,662 | 100 | 38,662 | 3,731 | ||||||||||||||||||||||||
Total | $ | 91,514 | 19 | % | $ | 390,408 | 81 | % | $ | 481,922 | $ | 40,909 | ||||||||||||||||||
| As at October 31, 2024 | ||||||||||||||||||||||||||||||
(Millions of Canadian dollars, except percentage amounts) | Residential mortgages | Home equity lines of credit (2) | ||||||||||||||||||||||||||||
| Insured (3) | Uninsured | Total | Total | |||||||||||||||||||||||||||
Region (4) | ||||||||||||||||||||||||||||||
Canada | ||||||||||||||||||||||||||||||
Atlantic provinces | $ | 8,692 | 43 | % | $ | 11,688 | 57 | % | $ | 20,380 | $ | 1,704 | ||||||||||||||||||
Quebec | 11,781 | 25 | 35,129 | 75 | 46,910 | 3,346 | ||||||||||||||||||||||||
Ontario | 32,011 | 14 | 189,638 | 86 | 221,649 | 18,173 | ||||||||||||||||||||||||
Alberta | 18,804 | 43 | 24,459 | 57 | 43,263 | 4,448 | ||||||||||||||||||||||||
Saskatchewan and Manitoba | 8,549 | 41 | 12,258 | 59 | 20,807 | 1,718 | ||||||||||||||||||||||||
B.C. and territories | 12,607 | 14 | 75,575 | 86 | 88,182 | 8,061 | ||||||||||||||||||||||||
Total Canada (5) | 92,444 | 21 | 348,747 | 79 | 441,191 | 37,450 | ||||||||||||||||||||||||
U.S. | – | – | 33,092 | 100 | 33,092 | 2,144 | ||||||||||||||||||||||||
Other International | – | – | 3,261 | 100 | 3,261 | 1,421 | ||||||||||||||||||||||||
Total International | – | – | 36,353 | 100 | 36,353 | 3,565 | ||||||||||||||||||||||||
Total | $ | 92,444 | 19 | % | $ | 385,100 | 81 | % | $ | 477,544 | $ | 41,015 | ||||||||||||||||||
| (1) | Disclosure is provided in accordance with the requirements of OSFI’s Guideline B-20 (Residential Mortgage Underwriting Practices and Procedures). |
| (2) | Includes $40,892 million and $17 million of uninsured and insured home equity lines of credit, respectively (October 31, 2024 – $40,998 million and $17 million, respectively), reported within the personal loan category. The amounts in U.S. and Other International include term loans collateralized by residential properties. |
| (3) | Insured residential mortgages are mortgages whereby our exposure to default is mitigated by insurance through the Canadian Mortgage and Housing Corporation or other private mortgage default insurers. |
| (4) | Region is based upon the address of the property mortgaged. The Atlantic provinces are comprised of Newfoundland and Labrador, Prince Edward Island, Nova Scotia and New Brunswick; B.C. and territories are comprised of British Columbia, Nunavut, Northwest Territories and Yukon. |
| (5) | Total consolidated residential mortgages in Canada of $443 billion (October 31, 2024 – $441 billion) includes $12 billion (October 31, 2024 – $12 billion) of mortgages with commercial clients in Commercial Banking, of which $9 billion (October 31, 2024 – $9 billion) are insured, and $18 billion (October 31, 2024 – $18 billion) of residential mortgages in Capital Markets, of which $18 billion (October 31, 2024 – $18 billion) are held for securitization purposes. All of the residential mortgages held for securitization purposes are insured (October 31, 2024 – all insured). |
Residential mortgages portfolio by amortization period
(1)
The following table provides a summary of the percentage of residential mortgages that fall within the remaining amortization periods based upon current customer payment amounts, which incorporate payments larger than the minimum contractual amount and/or higher frequency of payments.
| As at | ||||||||||||||||||||||||||
January 31 2025 | October 31 2024 | |||||||||||||||||||||||||
Canada | U.S. and other International | Total | Canada (2) | U.S. and other International | Total | |||||||||||||||||||||
Amortization period | ||||||||||||||||||||||||||
≤ 25 years | 68 | % | 33 | % | 66 | % | 62 | % | 31 | % | 60 | % | ||||||||||||||
> 25 years ≤ 30 years | 32 | 67 | 34 | 28 | 69 | 30 | ||||||||||||||||||||
> 30 years ≤ 35 years | – | – | – | 10 | – | 10 | ||||||||||||||||||||
Total | 100 | % | 100 | % | 100 | % | 100 | % | 100 | % | 100 | % | ||||||||||||||
| (1) | Disclosure is provided in accordance with the requirements of OSFI’s Guideline B-20 (Residential Mortgage Underwriting Practices and Procedures). |
| (2) | Our policy is to originate mortgages with amortization periods of 30 years or less. Amortization periods greater than 30 years reflect the impact of increases in interest rates on our variable rate mortgage portfolios. For these loans, the amortization period resets to the original amortization schedule upon renewal. We do not originate mortgage products with a structure that would result in negative amortization, as payments on variable rate mortgages automatically increase to ensure accrued interest is covered. |
Royal Bank of Canada
Average(LTV) ratios
loan-to-value
(1)
The following table provides a summary of our average LTV ratios for newly originated and acquired uninsured residential mortgages and RBC Homeline Plan
®
products by geographic region, as well as the respective LTV ratios for our total Canadian Banking residential mortgage portfolio outstanding.| For the three months ended | ||||||||||||||||||
January 31 2025 | October 31 2024 | |||||||||||||||||
Uninsured | Uninsured | |||||||||||||||||
Residential mortgages | RBC Homeline Plan products | Residential mortgages (2) | RBC Homeline Plan products (3) | |||||||||||||||
Average of newly originated and acquired for the period, by region (4) | ||||||||||||||||||
Atlantic provinces | 70 | % | 70 | % | 70 | % | 69 | % | ||||||||||
Quebec | 70 | 70 | 71 | 70 | ||||||||||||||
Ontario | 70 | 64 | 70 | 64 | ||||||||||||||
Alberta | 71 | 69 | 72 | 69 | ||||||||||||||
Saskatchewan and Manitoba | 72 | 72 | 73 | 72 | ||||||||||||||
B.C. and territories | 67 | 63 | 67 | 61 | ||||||||||||||
U.S. | 71 | n.m. | 72 | n.m. | ||||||||||||||
Other International | 73 | n.m. | 66 | n.m. | ||||||||||||||
Average of newly originated and acquired for the period (5), (6) | 70 | % | 66 | % | 70 | % | 65 | % | ||||||||||
Total Canadian Banking residential mortgages portfolio (7) | 57 | % | 48 | % | 56 | % | 47 | % | ||||||||||
| (1) | Disclosure is provided in accordance with the requirements of OSFI’s Guideline B-20 (Residential Mortgage Underwriting Practices and Procedures). |
| (2) | Residential mortgages exclude residential mortgages within the RBC Homeline Plan products. |
| (3) | RBC Homeline Plan products are comprised of both residential mortgages and home equity lines of credit. |
| (4) | Region is based upon the address of the property mortgaged. The Atlantic provinces are comprised of Newfoundland and Labrador, Prince Edward Island, Nova Scotia and New Brunswick; B.C. and territories are comprised of British Columbia, Nunavut, Northwest Territories and Yukon. |
| (5) | The average LTV ratios for newly originated and acquired uninsured residential mortgages and RBC Homeline Plan products are calculated on a weighted basis by mortgage amounts at origination. |
| (6) | For newly originated mortgages and RBC Homeline Plan products, LTV is calculated based on the total facility amount for the residential mortgage and RBC Homeline Plan product divided by the value of the related residential property. |
| (7) | Weighted by mortgage balances and adjusted for property values based on the Teranet-National Bank House Price Index ‡ |
| n.m. | not meaningful |
Net International wholesale exposure by region, asset type and client type
(1), (2)
The following table provides a breakdown of our credit risk exposure by region, asset type and client type.
| As at | ||||||||||||||||||||||||||||||||||||||||||
January 31 2025 | October 31 2024 | |||||||||||||||||||||||||||||||||||||||||
Asset type | Client type | |||||||||||||||||||||||||||||||||||||||||
| (Millions of Canadian dollars) | Loans Outstanding | Securities (3) | Repo-style transactions | Derivatives | Financials | Sovereign | Corporate | Total | Total | |||||||||||||||||||||||||||||||||
Europe (excluding U.K.) | $ | 17,415 | $ | 33,383 | $ | 7,029 | $ | 4,468 | $ | 28,632 | $ | 15,641 | $ | 18,022 | $ | 62,295 | $ | 52,307 | ||||||||||||||||||||||||
U.K. | 13,743 | 23,203 | 4,148 | 2,361 | 16,867 | 14,922 | 11,666 | 43,455 | 36,311 | |||||||||||||||||||||||||||||||||
Caribbean | 6,850 | 12,323 | 2,895 | 1,027 | 9,891 | 4,528 | 8,676 | 23,095 | 22,612 | |||||||||||||||||||||||||||||||||
Asia-Pacific | 6,027 | 39,809 | 4,788 | 1,577 | 20,443 | 27,603 | 4,155 | 52,201 | 43,874 | |||||||||||||||||||||||||||||||||
Other (4) | 2,049 | 1,601 | 3,485 | 78 | 3,114 | 1,963 | 2,136 | 7,213 | 8,022 | |||||||||||||||||||||||||||||||||
Net International exposure (5), (6) | $ | 46,084 | $ | 110,319 | $ | 22,345 | $ | 9,511 | $ | 78,947 | $ | 64,657 | $ | 44,655 | $ | 188,259 | $ | 163,126 | ||||||||||||||||||||||||
| (1) | Geographic profile is based on country of risk, which reflects our assessment of the geographic risk associated with a given exposure. Typically, this is the residence of the borrower. |
| (2) | Exposures are calculated on a fair value basis and net of collateral, which includes $424 billion against repo-style transactions (October 31, 2024 – $459 billion) and $15 billion against derivatives (October 31, 2024 – $16 billion). |
| (3) | Securities include $20 billion of trading securities (October 31, 2024 – $14 billion), $37 billion of deposits (October 31, 2024 – $29 billion), and $53 billion of investment securities (October 31, 2024 – $44 billion). |
| (4) | Includes exposures in the Middle East, Africa and Latin America. |
| (5) | Excludes $7,387 million (October 31, 2024 – $6,950 million) of exposures to supranational agencies. |
| (6) | Reflects $5,912 million of mitigation through credit default swaps, which are largely used to hedge single name exposures and market risk (October 31, 2024 – $4,296 million). |
24 First Quarter 2025
Royal Bank of Canada
Credit quality performance
The following credit quality performance tables and analysis provide information on loans, which represents loans, acceptances and commitments, and other financial assets:
Gross impaired loans
| As at and for the three months ended | ||||||||
| (Millions of Canadian dollars, except percentage amounts) | January 31 2025 | October 31 2024 | ||||||
Personal Banking | $ | 1,822 | $ | 1,652 | ||||
Commercial Banking | 2,742 | 2,372 | ||||||
Wealth Management | 482 | 508 | ||||||
Capital Markets | 2,830 | 1,335 | ||||||
Total GIL | $ | 7,876 | $ | 5,867 | ||||
Impaired loans, beginning balance | $ | 5,867 | $ | 5,685 | ||||
Classified as impaired during the period (new impaired) (1) | 3,044 | 1,343 | ||||||
Net repayments (1) | (293 | ) | (354 | ) | ||||
Amounts written off | (581 | ) | (721 | ) | ||||
Other (2) | (161 | ) | (86 | ) | ||||
Impaired loans, balance at end of period | $ | 7,876 | $ | 5,867 | ||||
GIL as a % of related loans and acceptances | ||||||||
Total GIL as a % of related loans and acceptances | 0.78% | 0.59% | ||||||
Personal Banking | 0.34% | 0.31% | ||||||
Personal Banking – Canada | 0.29% | 0.26% | ||||||
Commercial Banking | 1.47% | 1.29% | ||||||
Wealth Management | 0.38% | 0.42% | ||||||
Capital Markets | 1.74% | 0.88% | ||||||
| (1) | Certain GIL movements for Personal Banking – Canada retail and wholesale portfolios are generally allocated to new impaired, as Net repayments and certain Other movements are not reasonably determinable. Certain GIL movements for Caribbean Banking retail and wholesale portfolios are generally allocated to Net repayments and new impaired, as Net repayments and certain Other movements are not reasonably determinable. |
| (2) | Includes return to performing status during the period, recoveries of loans and advances previously written off, sold, amounts related to foreclosed properties held as investment properties and interests in joint ventures for certain co-lending arrangements, foreign exchange translation and other movements. |
Q1 2025 vs. Q4 2024
Total GIL increased $2,009 million or 34% from last quarter and the total GIL ratio of 78 bps increased 19 bps, mainly due to higher impaired loans in Capital Markets and Commercial Banking.
GIL in Personal Banking increased $170 million or 10%, primarily due to higher impaired loans in our Canadian residential mortgages portfolio.
GIL in Commercial Banking increased $370 million or 16%, mainly due to higher impaired loans in a few sectors, including the real estate and related and transportation sectors.
GIL in Wealth Management decreased $26 million or 5%, mainly driven by lower impaired loans in a few sectors, including the investments and real estate and related sectors.
GIL in Capital Markets increased $1,495 million, mainly due to one account in the other services sector.
Allowance for credit losses (ACL)
| As at | ||||||||
| (Millions of Canadian dollars) | January 31 2025 | October 31 2024 | ||||||
Personal Banking | $ | 3,385 | $ | 3,273 | ||||
Commercial Banking | 1,882 | 1,626 | ||||||
Wealth Management | 521 | 466 | ||||||
Capital Markets | 1,144 | 986 | ||||||
Corporate Support and other | 1 | 1 | ||||||
ACL on loans | 6,933 | 6,352 | ||||||
ACL on other financial assets (1) | 12 | 12 | ||||||
Total ACL | $ | 6,945 | $ | 6,364 | ||||
ACL on loans is comprised of: | ||||||||
Retail | $ | 3,121 | $ | 3,011 | ||||
Wholesale | 1,827 | 1,825 | ||||||
ACL on performing loans | $ | 4,948 | $ | 4,836 | ||||
ACL on impaired loans | 1,985 | 1,516 | ||||||
| (1) | ACL on other financial assets mainly represents allowances on debt securities measured at FVOCI and amortized cost, accounts receivable and financial guarantees. |
Q1 2025 vs. Q4 2024
Total ACL increased $581 million or 9% from last quarter, reflecting an increase in ACL on loans.
ACL on performing loans increased $112 million or 2%, due to unfavourable changes in credit quality, the impact of foreign exchange translation and portfolio growth, partially offset by migration to impaired in Capital Markets and favourable changes to our macroeconomic forecast.
ACL on impaired loans increased $469 million or 31%, primarily in Commercial Banking and Capital Markets.
For further details, refer to Note 5 of our Condensed Financial Statements.
Royal Bank of Canada
Market risk |
Market risk is defined to be the impact of market factors and prices upon our financial condition. This includes potential financial gains or losses due to changes in market-determined variables such as interest rates, credit spreads, equity prices, commodity prices, foreign exchange rates and implied volatilities. There have been no material changes to our Market Risk Management Framework from the framework described in our 2024 Annual Report. Using that framework, we continuously seek to ensure that our market risk exposure is consistent with risk appetite constraints set by the Board of Directors.
Market risk controls include limits on probabilistic measures of potential loss in trading positions, such as(VaR) and stress testing. Market risk controls are also in place to manage Interest Rate Risk in the Banking Book (IRRBB). To monitor and control IRRBB, we assess two primary metrics, Net Interest Income (NII) risk and Economic Value of Equity (EVE) risk, under a range of market shocks, scenarios, and time horizons. There has been no material change to the VaR or IRRBB measurement methodology, controls, or limits from those described in our 2024 Annual Report. For further details on our approach to the management of market risk, refer to the Market risk section of our 2024 Annual Report.
Value-at-Risk
Market risk measures – FVTPL positions
VaR and Trading VaR
The following table presents our Market risk VaR and Trading VaR figures:
January 31, 2025 | October 31, 2024 | January 31, 2024 | ||||||||||||||||||||||||||||||||||
For the three months ended | For the three months ended | For the three months ended | ||||||||||||||||||||||||||||||||||
| (Millions of Canadian dollars) | As at | Average | High | Low | As at | Average | As at | Average | ||||||||||||||||||||||||||||
Equity | $ | 13 | $ | 15 | $ | 23 | $ | 12 | $ | 23 | $ | 21 | $ | 10 | $ | 9 | ||||||||||||||||||||
Foreign exchange | 6 | 4 | 7 | 2 | 6 | 6 | 3 | 4 | ||||||||||||||||||||||||||||
Commodities | 7 | 7 | 11 | 5 | 11 | 8 | 5 | 5 | ||||||||||||||||||||||||||||
Interest rate (1) | 22 | 23 | 28 | 19 | 23 | 30 | 30 | 34 | ||||||||||||||||||||||||||||
Credit specific (2) | 8 | 8 | 9 | 7 | 8 | 8 | 8 | 7 | ||||||||||||||||||||||||||||
Diversification (3) | (33 | ) | (32 | ) | n.m. | n.m. | (37 | ) | (44 | ) | (31 | ) | (29 | ) | ||||||||||||||||||||||
Trading VaR | $ | 23 | $ | 25 | $ | 35 | $ | 20 | $ | 34 | $ | 29 | $ | 25 | $ | 30 | ||||||||||||||||||||
Total VaR | $ | 26 | $ | 32 | $ | 40 | $ | 25 | $ | 34 | $ | 34 | $ | 123 | $ | 122 | ||||||||||||||||||||
| (1) | General credit spread risk and funding spread risk associated with uncollateralized derivatives are included under interest rate VaR. |
| (2) | Credit specific risk captures issuer-specific credit spread volatility. |
| (3) | Trading VaR is less than the sum of the individual risk factor VaR results due to risk factor diversification. |
| n.m. | not meaningful |
Q1 2025 vs. Q1 2024
Average Trading VaR of $25 million decreased $5 million from a year ago, primarily driven by exposure changes in our fixed income portfolio, partially offset by exposure changes in our equity derivatives portfolio.
Average total VaR of $32 million decreased $90 million from a year ago, primarily reflecting the impact of management of closing capital volatility related to the HSBC Canada transaction in the same quarter last year.
Q1 2025 vs. Q4 2024
Average Trading VaR of $25 million decreased $4 million from last quarter, primarily driven by exposure changes in our equity derivatives portfolio.
Average total VaR of $32 million remained relatively stable from last quarter.
26 First Quarter 2025
Royal Bank of Canada
The following chart displays a bar graph of our daily trading profit and loss and a line graph of our daily market risk VaR. We incurred no net trading losses in the three months ended January 31, 2025 and October 31, 2024.

| (1) | Trading revenue (teb) in the chart above excludes the impact of loan underwriting commitments. |
Market risk measures for assets and liabilities of RBC Insurance
®
We offer a range of insurance products to clients and hold investments to meet future obligations to policyholders. The investments which support actuarial liabilities are predominantly fixed income assets measured at FVTPL. Consequently, changes in the fair values of these assets are largely offset by changes in the discount rates used in the measurement of insurance and reinsurance contract assets and liabilities, and the impacts of both are reflected in Insurance investment result in the Consolidated Statements of Income. As at January 31, 2025, we held assets in support of $21 billion of insurance contract liabilities net of insurance contract assets and reinsurance contracts held balances (October 31, 2024 – $20 billion).
Market risk measures – IRRBB sensitivities
The following table shows the potential
before-tax
impact of an immediate and sustained 100 bps increase or decrease in interest rates on projected EVE and12-month
NII, assuming no subsequent hedging. Interest rate risk measures are based on currenton-
andoff-balance
sheet positions which can change over time in response to business activity and management actions.January 31 2025 | October 31 2024 | January 31 2024 | ||||||||||||||||||||||||||||||||||||||||||||
EVE risk | NII risk | |||||||||||||||||||||||||||||||||||||||||||||
| (Millions of Canadian dollars) | Canadian dollar impact | U.S. dollar impact | Total | Canadian dollar impact | U.S. dollar impact | Total | EVE risk | NII risk (1) | EVE risk | NII risk (1) | ||||||||||||||||||||||||||||||||||||
Before-tax impact of: | ||||||||||||||||||||||||||||||||||||||||||||||
100 bps increase in rates | $ | (1,829 | ) | $ | (278 | ) | $ | (2,107 | ) | $ | 377 | $ | 126 | $ | 503 | $ | (2,076 | ) | $ | 400 | $ | (1,649 | ) | $ | 535 | |||||||||||||||||||||
100 bps decrease in rates | 1,649 | (5 | ) | 1,644 | (469 | ) | (120 | ) | (589 | ) | 1,663 | (502 | ) | 1,309 | (622 | ) | ||||||||||||||||||||||||||||||
| (1) | Represents the 12-month NII exposure to an instantaneous and sustained shift in interest rates. |
As at January 31, 2025, an immediate and sustained
-100
bps shock would have had a negative impact to our NII of $589 million, up from $502 million last quarter. An immediate and sustained +100 bps shock as at January 31, 2025 would have had a negative impact to the bank’s EVE of $2,107 million, up from $2,076 million last quarter. The quarter-over-quarter change in NII sensitivity was largely attributable to growth in low cost deposits, while the quarter-over-quarter change in EVE sensitivity was primarily due to continued growth in the bank’s book capital. During the first quarter of 2025, NII and EVE risks remained within approved limits.Royal Bank of Canada
Linkage of market risk to selected balance sheet items
The following tables provide the linkages between selected balance sheet items with positions included in our trading market risk and
non-trading
market risk disclosures, which illustrates how we manage market risk for our assets and liabilities through different risk measures:As at January 31, 2025 | ||||||||||||||
Market risk measure | ||||||||||||||
| (Millions of Canadian dollars) | Balance sheet amount | Traded risk | Non-traded risk | Non-traded riskprimary risk sensitivity | ||||||||||
Assets subject to market risk | ||||||||||||||
Cash and due from banks | $ | 71,200 | $ | – | $ | 71,200 | Interest rate | |||||||
Interest-bearing deposits with banks | 47,924 | 1 | 47,923 | Interest rate | ||||||||||
Securities | ||||||||||||||
Trading | 189,416 | 161,798 | 27,618 | Interest rate, credit spread | ||||||||||
Investment, net of applicable allowance | 298,609 | – | 298,609 | Interest rate, credit spread, equity | ||||||||||
Assets purchased under reverse repurchase agreements and securities borrowed | 280,451 | 235,353 | 45,098 | Interest rate | ||||||||||
Loans | ||||||||||||||
Retail | 633,400 | – | 633,400 | Interest rate | ||||||||||
Wholesale | 379,250 | 2,825 | 376,425 | Interest rate | ||||||||||
Allowance for loan losses | (6,600 | ) | – | (6,600 | ) | Interest rate | ||||||||
Other | ||||||||||||||
Derivatives | 153,686 | 150,971 | 2,715 | Interest rate, foreign exchange | ||||||||||
Other assets | 136,246 | 58,937 | 77,309 | Interest rate | ||||||||||
Assets not subject to market risk (3) | 7,444 | |||||||||||||
Total assets | $ | 2,191,026 | $ | 609,885 | $ | 1,573,697 | ||||||||
Liabilities subject to market risk | ||||||||||||||
Deposits | $ | 1,441,940 | $ | 67,363 | $ | 1,374,577 | Interest rate | |||||||
Other | ||||||||||||||
Obligations related to securities sold short | 45,460 | 45,238 | 222 | Interest rate, equity | ||||||||||
Obligations related to assets sold under repurchase agreements and securities loaned | 274,592 | 243,755 | 30,837 | Interest rate | ||||||||||
Derivatives | 161,590 | 156,653 | 4,937 | Interest rate, foreign exchange | ||||||||||
Other liabilities | 96,886 | 41,346 | 55,540 | Interest rate | ||||||||||
Subordinated debentures | 13,670 | – | 13,670 | Interest rate | ||||||||||
Liabilities not subject to market risk (4) | 23,625 | |||||||||||||
Total liabilities | $ | 2,057,763 | $ | 554,355 | $ | 1,479,783 | ||||||||
Total equity | 133,263 | |||||||||||||
Total liabilities and equity | $ | 2,191,026 | ||||||||||||
| (1) | Traded risk includes positions that are classified or designated as FVTPL and positions whose revaluation gains and losses are reported in revenue within our trading portfolios. Market risk measures of VaR and stress tests are used as risk controls for traded risk. |
| (2) | Non-traded risk includes positions used in the management of IRRBB and othernon-trading portfolios. Other materialnon-trading portfolios include positions from RBC Insurance and investment securities, net of applicable allowance, not included in IRRBB. |
| (3) | Assets not subject to market risk include physical and other assets. |
| (4) | Liabilities not subject to market risk include payroll related and other liabilities. |
28 First Quarter 2025
Royal Bank of Canada
| As at October 31, 2024 | ||||||||||||||
| Market risk measure | ||||||||||||||
| (Millions of Canadian dollars) | Balance sheet amount | Traded risk (1) | Non-traded risk (2) | Non-traded riskprimary risk sensitivity | ||||||||||
Assets subject to market risk | ||||||||||||||
Cash and due from banks | $ | 56,723 | $ | – | $ | 56,723 | Interest rate | |||||||
Interest-bearing deposits with banks | 66,020 | 3 | 66,017 | Interest rate | ||||||||||
Securities | ||||||||||||||
Trading | 183,300 | 161,031 | 22,269 | Interest rate, credit spread | ||||||||||
Investment, net of applicable allowance | 256,618 | – | 256,618 | Interest rate, credit spread, equity | ||||||||||
Assets purchased under reverse repurchase agreements and securities borrowed | 350,803 | 299,032 | 51,771 | Interest rate | ||||||||||
Loans | ||||||||||||||
Retail | 626,978 | – | 626,978 | Interest rate | ||||||||||
Wholesale | 360,439 | 3,152 | 357,287 | Interest rate | ||||||||||
Allowance for loan losses | (6,037 | ) | – | (6,037 | ) | Interest rate | ||||||||
Other | ||||||||||||||
Derivatives | 150,612 | 147,017 | 3,595 | Interest rate, foreign exchange | ||||||||||
Other assets | 115,133 | 47,936 | 67,197 | Interest rate | ||||||||||
Assets not subject to market risk (3) | 10,993 | |||||||||||||
Total assets | $ | 2,171,582 | $ | 658,171 | $ | 1,502,418 | ||||||||
Liabilities subject to market risk | ||||||||||||||
Deposits | $ | 1,409,531 | $ | 63,706 | $ | 1,345,825 | Interest rate | |||||||
Other | ||||||||||||||
Obligations related to securities sold short | 35,286 | 34,985 | 301 | Interest rate, equity | ||||||||||
Obligations related to assets sold under repurchase agreements and securities loaned | 305,321 | 280,386 | 24,935 | Interest rate | ||||||||||
Derivatives | 163,763 | 157,587 | 6,176 | Interest rate, foreign exchange | ||||||||||
Other liabilities | 94,666 | 39,802 | 54,864 | Interest rate | ||||||||||
Subordinated debentures | 13,546 | – | 13,546 | Interest rate | ||||||||||
Liabilities not subject to market risk (4) | 22,277 | |||||||||||||
Total liabilities | $ | 2,044,390 | $ | 576,466 | $ | 1,445,647 | ||||||||
Total equity | 127,192 | |||||||||||||
Total liabilities and equity | $ | 2,171,582 | ||||||||||||
| (1) | Traded risk includes positions that are classified or designated as FVTPL and positions whose revaluation gains and losses are reported in revenue within our trading portfolios. Market risk measures of VaR and stress tests are used as risk controls for traded risk. |
| (2) | Non-traded risk includes positions used in the management of IRRBB and othernon-trading portfolios. Other materialnon-trading portfolios include positions from RBC Insurance and investment securities, net of applicable allowance, not included in IRRBB. |
| (3) | Assets not subject to market risk include physical and other assets. |
| (4) | Liabilities not subject to market risk include payroll related and other liabilities. |
Royal Bank of Canada
Liquidity and funding risk |
Liquidity and funding risk (liquidity risk) is the risk that we may be unable to generate sufficient cash or its equivalents in a timely and cost-effective manner to meet our commitments. Liquidity risk arises from mismatches in the timing and value of
on-balance
sheet andoff-balance
sheet cash flows.Our liquidity risk management activities are conducted in accordance with internal frameworks and policies, including the Enterprise Risk Management Framework (ERMF), the Enterprise Risk Appetite Framework (ERAF), the Enterprise Liquidity Risk Management Framework (LRMF), the Enterprise Liquidity Risk Policy, and the Enterprise Pledging Policy. Collectively, our frameworks and policies establish liquidity and funding management requirements that are appropriate for the execution of our strategy and ensuring liquidity risk remains within our risk appetite. There have been no material changes to our internal frameworks and policies from those described in our 2024 Annual Report.
Liquidity reserve
Our liquidity reserve consists only of available unencumbered liquid assets. Although unused wholesale funding capacity could be another potential source of liquidity, it is excluded in the determination of the liquidity reserve.
As at January 31, 2025 | ||||||||||||||||||||||||
| (Millions of Canadian dollars) | Bank-owned liquid assets | Securities received as collateral from securities financing and derivative transactions | Total liquid assets | Encumbered liquid assets | Unencumbered liquid assets | |||||||||||||||||||
Cash and deposits with banks | $ | 119,124 | $ | – | $ | 119,124 | $ | 3,393 | $ | 115,731 | ||||||||||||||
Securities issued or guaranteed by sovereigns, central banks or multilateral development banks (1) | 368,204 | 325,992 | 694,196 | 402,563 | 291,633 | |||||||||||||||||||
Other securities | 168,398 | 144,145 | 312,543 | 176,707 | 135,836 | |||||||||||||||||||
Other liquid assets (2) | 45,184 | – | 45,184 | 37,317 | 7,867 | |||||||||||||||||||
Total liquid assets | $ | 700,910 | $ | 470,137 | $ | 1,171,047 | $ | 619,980 | $ | 551,067 | ||||||||||||||
| As at October 31, 2024 | ||||||||||||||||||||||||
| (Millions of Canadian dollars) | Bank-owned liquid assets | Securities received as collateral from securities financing and derivative transactions | Total liquid assets | Encumbered liquid assets | Unencumbered liquid assets | |||||||||||||||||||
Cash and deposits with banks | $ | 122,743 | $ | – | $ | 122,743 | $ | 3,269 | $ | 119,474 | ||||||||||||||
Securities issued or guaranteed by sovereigns, central banks or multilateral development banks (1) | 323,826 | 385,479 | 709,305 | 426,552 | 282,753 | |||||||||||||||||||
Other securities | 165,875 | 126,205 | 292,080 | 163,635 | 128,445 | |||||||||||||||||||
Other liquid assets (2) | 37,601 | – | 37,601 | 31,583 | 6,018 | |||||||||||||||||||
Total liquid assets | $ | 650,045 | $ | 511,684 | $ | 1,161,729 | $ | 625,039 | $ | 536,690 | ||||||||||||||
| As at | ||||||||||||||||||||||||
| (Millions of Canadian dollars) | January 31 2025 | October 31 2024 | ||||||||||||||||||||||
Royal Bank of Canada | $ | 266,821 | $ | 243,915 | ||||||||||||||||||||
Foreign branches | 57,146 | 69,723 | ||||||||||||||||||||||
Subsidiaries | 227,100 | 223,052 | ||||||||||||||||||||||
Total unencumbered liquid assets | $ | 551,067 | $ | 536,690 | ||||||||||||||||||||
| (1) | Includes liquid securities issued by provincial governments and U.S. government-sponsored entities working under U.S. Federal government’s conservatorship (e.g., Federal National Mortgage Association and Federal Home Loan Mortgage Corporation). |
| (2) | Encumbered liquid assets amount represents cash collateral and margin deposit amounts pledged related to over-the-counter |
The liquidity reserve is typically most affected by routine flows of retail and commercial client banking activities, where liquid asset portfolios reflect changes in deposit and loan balances, as well as business strategies and client flows related to the activities in Capital Markets. Corporate Treasury also affects liquidity reserves through the management of funding issuances, which could result in timing differences between when debt is issued and funds are deployed into business activities.
Q1 2025 vs. Q4 2024
Total unencumbered liquid assets increased $14 billion or 3% from last quarter, primarily due to an increase in on-balance sheet securities, partially offset by a decrease in cash and deposits with banks.
30 First Quarter 2025
Royal Bank of Canada
Asset encumbrance
The table below provides a summary of our
on-
andoff-balance
sheet amounts for cash, securities and other assets, distinguishing between those that are encumbered, and those available for sale or use as collateral in secured funding transactions. Other assets, such as mortgages and credit card receivables, can also be monetized, albeit over longer timeframes than those required for marketable securities. As at January 31, 2025, our unencumbered assets available as collateral comprised 25% of total assets (October 31, 2024 – 25%).As at January 31, 2025 | ||||||||||||||||||||||||||||||||||||
Total Assets | Encumbered | Unencumbered | ||||||||||||||||||||||||||||||||||
| (Millions of Canadian dollars) | Bank-owned assets | Securities received as collateral from securities financing and derivative transactions | Total | Pledged as collateral | Other | Available as collateral | Other | |||||||||||||||||||||||||||||
Cash and deposits with banks | $ | 119,124 | $ | – | $ | 119,124 | $ | – | $ | 3,393 | $ | 115,731 | $ | – | ||||||||||||||||||||||
Securities (4) | 498,827 | 526,646 | 1,025,473 | 604,411 | 30,437 | 387,296 | 3,329 | |||||||||||||||||||||||||||||
Loans, net of allowance for loan losses (5) | ||||||||||||||||||||||||||||||||||||
Mortgage securities | 56,017 | – | 56,017 | 27,222 | – | 28,795 | – | |||||||||||||||||||||||||||||
Mortgage loans | 425,269 | – | 425,269 | 68,925 | – | 42,693 | 313,651 | |||||||||||||||||||||||||||||
Other loans | 524,764 | – | 524,764 | 6,630 | – | 25,786 | 492,348 | |||||||||||||||||||||||||||||
Derivatives | 153,686 | – | 153,686 | – | – | – | 153,686 | |||||||||||||||||||||||||||||
Others (6) | 143,690 | – | 143,690 | 37,317 | – | 7,867 | 98,506 | |||||||||||||||||||||||||||||
Total | $ | 1,921,377 | $ | 526,646 | $ | 2,448,023 | $ | 744,505 | $ | 33,830 | $ | 608,168 | $ | 1,061,520 | ||||||||||||||||||||||
| As at October 31,2024 | ||||||||||||||||||||||||||||||||||||
| Total Assets | Encumbered | Unencumbered | ||||||||||||||||||||||||||||||||||
| (Millions of Canadian dollars) | Bank-owned assets | Securities received as collateral from securities financing and derivative transactions | Total | Pledged as collateral | Other (1) | Available as collateral (2) | Other (3) | |||||||||||||||||||||||||||||
Cash and deposits with banks | $ | 122,743 | $ | – | $ | 122,743 | $ | – | $ | 3,269 | $ | 119,474 | $ | – | ||||||||||||||||||||||
Securities (4) | 450,719 | 571,869 | 1,022,588 | 614,654 | 31,156 | 373,206 | 3,572 | |||||||||||||||||||||||||||||
Loans, net of allowance for loan losses (5) | ||||||||||||||||||||||||||||||||||||
Mortgage securities | 57,450 | – | 57,450 | 27,927 | – | 29,523 | – | |||||||||||||||||||||||||||||
Mortgage loans | 419,522 | – | 419,522 | 71,307 | – | 40,851 | 307,364 | |||||||||||||||||||||||||||||
Other loans | 504,408 | – | 504,408 | 6,343 | – | 25,250 | 472,815 | |||||||||||||||||||||||||||||
Derivatives | 150,612 | – | 150,612 | – | – | – | 150,612 | |||||||||||||||||||||||||||||
Others (6) | 126,126 | – | 126,126 | 31,583 | – | 6,018 | 88,525 | |||||||||||||||||||||||||||||
Total | $ | 1,831,580 | $ | 571,869 | $ | 2,403,449 | $ | 751,814 | $ | 34,425 | $ | 594,322 | $ | 1,022,888 | ||||||||||||||||||||||
| (1) | Includes assets restricted from use to generate secured funding due to legal or other constraints. |
| (2) | Represents assets that are immediately available for use as collateral, including National Housing Act Mortgage-Backed Securities (NHA MBS), our unencumbered mortgage loans that qualify as eligible collateral at Federal Home Loan Banks (FHLB), as well as loans that qualify as eligible collateral for discount window facility available to us and lodged at the Federal Reserve Bank of New York (FRBNY). |
| (3) | Other unencumbered assets are not subject to any restrictions on their use to secure funding or as collateral but would not be considered immediately available. |
| (4) | Includes bank-owned liquid assets and securities received as collateral from off-balance sheet securities financing, derivative transactions, and margin lending. Includes $30 billion (October 31, 2024 – $31 billion) of collateral received through reverse repurchase transactions that cannot be rehypothecated in its current legal form. |
| (5) | Effective the first quarter of 2025, mortgage securities, mortgage loans and other loans are presented net of allowance for loan losses. Comparative amounts have been revised from those previously presented to conform to the presentation adopted in the current period. |
| (6) | The Pledged as collateral amount represents cash collateral and margin deposit amounts pledged related to OTC and exchange-traded derivative transactions. |
Q1 2025 vs. Q4 2024
Total unencumbered assets available as collateral increased $14 billion or 2% from last quarter, primarily due to an increase in on-balance sheet securities.
Funding
Funding strategy
Maintaining a diversified funding base is a key strategy for managing our liquidity risk profile.
Core funding, comprising capital, longer-term wholesale liabilities and a diversified pool of personal as well as the stable portion of our commercial and institutional deposits, is the foundation of our structural liquidity position.
Wholesale funding activities are well-diversified by geography, investor segment, instrument, currency, structure and maturity. We maintain an ongoing presence in different funding markets, which allows us to continuously monitor market developments and trends, identify opportunities and risks and take appropriate and timely actions.
We continuously evaluate opportunities to expand into new markets and untapped investor segments since diversification expands our wholesale funding flexibility, minimizes funding concentration and dependency and generally reduces financing costs.
We regularly assess our funding concentration and have implemented limits on certain funding sources to support diversification of our funding base.
Deposit and funding profile
As at January 31, 2025, relationship-based deposits, which are the primary source of funding for retail and commercial lending, were $999 billion or 56% of our total funding (October 31, 2024 – $977 billion or 55%). The remaining portion is comprised of short- and long-term wholesale funding.
Royal Bank of Canada
Funding for highly liquid assets consists primarily of short-term wholesale funding that reflects the monetization period of those assets. Long-term wholesale funding is used mostly to fund less liquid wholesale assets and to support liquid asset buffers.
Senior long-term debt issued by the bank on or after September 23, 2018, that has an original term greater than 400 days and is marketable, subject to certain exceptions, is subject to the Canadian Bank Recapitalization
(Bail-in)
regime. Under theBail-in
regime, in circumstances when the Superintendent of Financial Institutions has determined that a bank may no longer be viable, the Governor in Council may, upon a recommendation of the Minister of Finance that he or she is of the opinion that it is in the public interest to do so, grant an order directing the Canada Deposit Insurance Corporation (CDIC) to convert all or a portion of certain shares and liabilities of that bank into common shares. As at January 31, 2025, the notional value of issued and outstanding long-term debt subject to conversion under theBail-in
regime was $117 billion (October 31, 2024 – $111 billion).For further details on our wholesale funding, refer to the Composition of wholesale funding tables below.
Long-term debt issuance
We operate long-term debt issuance registered programs. Each long-term debt program allows issuances in multiple currencies. The following table summarizes our registered programs and their authorized limits by geography:
Programs by geography |
Canada | U.S. | Europe | ||
• Canadian Shelf Program – $25 billion | • U.S. Shelf Program – US$75 billion | • European Debt Issuance Program – US$75 billion | ||
• Global Covered Bond Program – € 75 billion | ||||
We also raise long-term funding using Canadian Senior Notes, Kangaroo Bonds (issued in the Australian domestic market by foreign firms) and Yankee Certificates of Deposit (issued in the U.S. domestic market by foreign firms).
As presented in the following charts, our current long-term debt profile is well-diversified by both currency and product.
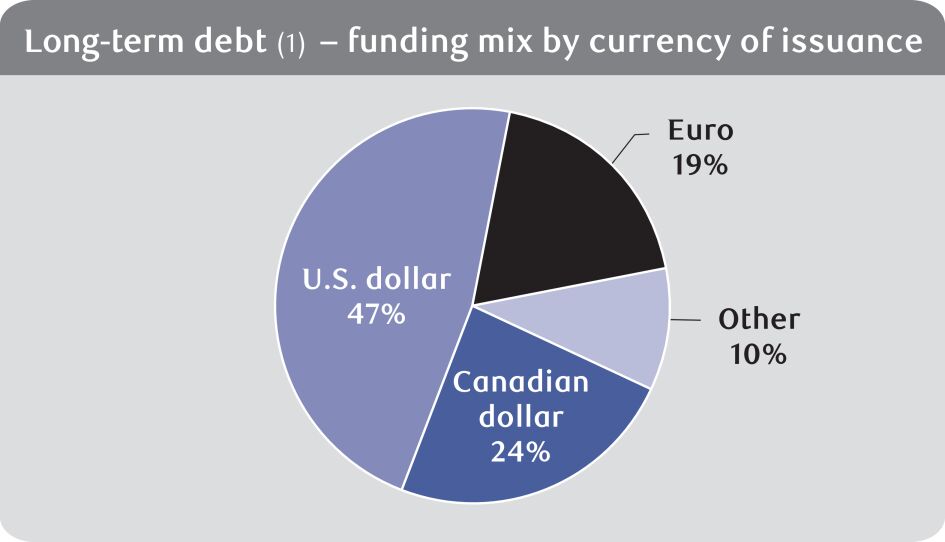 | 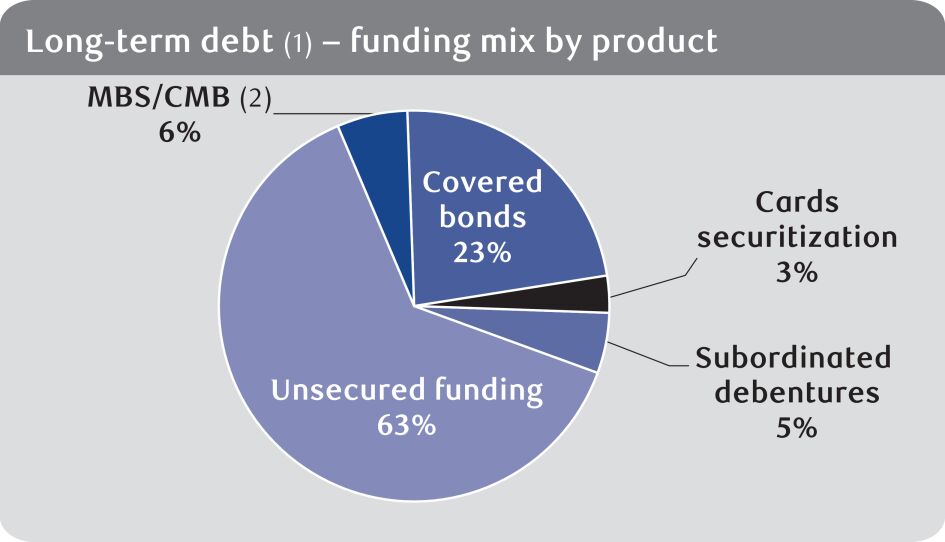 | |
(1) Includes unsecured and secured long-term funding and subordinated debentures with an original term to maturity greater than 1 year | (1) Includes unsecured and secured long-term funding and subordinated debentures with an original term to maturity greater than 1 year | |
(2) Mortgage-backed securities and Canada Mortgage Bonds |
The following table shows the composition of wholesale funding based on remaining term to maturity:
Composition of wholesale funding
(1)
As at January 31, 2025 | ||||||||||||||||||||||||||||||||
| (Millions of Canadian dollars) | Less than 1 month | 1 to 3 months | 3 to 6 months | 6 to 12 months | Less than 1 year sub-total | 1 year to 2 years | 2 years and greater | Total | ||||||||||||||||||||||||
Deposits from banks (2) | $ | 2,384 | $ | 143 | $ | 96 | $ | 1,287 | $ | 3,910 | $ | – | $ | – | $ | 3,910 | ||||||||||||||||
Certificates of deposit and commercial paper (3) | 10,240 | 12,324 | 28,781 | 40,621 | 91,966 | – | – | 91,966 | ||||||||||||||||||||||||
Asset-backed commercial paper (4) | 3,868 | 7,610 | 6,108 | 893 | 18,479 | – | – | 18,479 | ||||||||||||||||||||||||
Senior unsecured medium-term notes (5) | 52 | 7,432 | 8,554 | 11,689 | 27,727 | 30,221 | 57,639 | 115,587 | ||||||||||||||||||||||||
Senior unsecured structured notes (6) | 1,751 | 2,559 | 2,211 | 3,633 | 10,154 | 6,173 | 9,791 | 26,118 | ||||||||||||||||||||||||
Mortgage securitization | 23 | 1,015 | 727 | 757 | 2,522 | 2,341 | 11,809 | 16,672 | ||||||||||||||||||||||||
Covered bonds/asset-backed securities (7) | – | 1,508 | 4,122 | 6,748 | 12,378 | 23,947 | 28,589 | 64,914 | ||||||||||||||||||||||||
Subordinated liabilities | – | – | – | 2,182 | 2,182 | – | 11,556 | 13,738 | ||||||||||||||||||||||||
Other (8) | 5,079 | 994 | 1,327 | 530 | 7,930 | 20,138 | 189 | 28,257 | ||||||||||||||||||||||||
Total | $ | 23,397 | $ | 33,585 | $ | 51,926 | $ | 68,340 | $ | 177,248 | $ | 82,820 | $ | 119,573 | $ | 379,641 | ||||||||||||||||
Of which: | ||||||||||||||||||||||||||||||||
– Secured | $ | 8,848 | $ | 10,133 | $ | 10,957 | $ | 8,398 | $ | 38,336 | $ | 26,288 | $ | 40,398 | $ | 105,022 | ||||||||||||||||
– Unsecured | 14,549 | 23,452 | 40,969 | 59,942 | 138,912 | 56,532 | 79,175 | 274,619 | ||||||||||||||||||||||||
32 First Quarter 2025
Royal Bank of Canada
| As at October 31, 2024 | ||||||||||||||||||||||||||||||||
| (Millions of Canadian dollars) | Less than 1 month | 1 to 3 months | 3 to 6 months | 6 to 12 months | Less than 1 year sub-total | 1 year to 2 years | 2 years and greater | Total | ||||||||||||||||||||||||
Deposits from banks (2) | $ | 7,248 | $ | 118 | $ | 120 | $ | 1,025 | $ | 8,511 | $ | – | $ | – | $ | 8,511 | ||||||||||||||||
Certificates of deposit and commercial paper (3) | 8,377 | 10,413 | 16,882 | 37,702 | 73,374 | 139 | – | 73,513 | ||||||||||||||||||||||||
Asset-backed commercial paper (4) | 4,140 | 3,951 | 7,167 | 2,286 | 17,544 | – | – | 17,544 | ||||||||||||||||||||||||
Senior unsecured medium-term notes (5) | 5,436 | 7,786 | 7,253 | 12,750 | 33,225 | 20,453 | 57,351 | 111,029 | ||||||||||||||||||||||||
Senior unsecured structured notes (6), (9) | 1,354 | 1,698 | 3,638 | 3,404 | 10,094 | 4,414 | 13,125 | 27,633 | ||||||||||||||||||||||||
Mortgage securitization | 41 | 509 | 1,296 | 946 | 2,792 | 2,143 | 11,949 | 16,884 | ||||||||||||||||||||||||
Covered bonds/asset-backed securities (7) | – | 2,243 | 1,514 | 7,451 | 11,208 | 19,017 | 36,245 | 66,470 | ||||||||||||||||||||||||
Subordinated liabilities | – | – | – | – | – | 2,088 | 11,626 | 13,714 | ||||||||||||||||||||||||
Other (8) | 5,121 | 311 | 1,082 | 1,460 | 7,974 | 16,992 | 160 | 25,126 | ||||||||||||||||||||||||
Total | $ | 31,717 | $ | 27,029 | $ | 38,952 | $ | 67,024 | $ | 164,722 | $ | 65,246 | $ | 130,456 | $ | 360,424 | ||||||||||||||||
Of which: | ||||||||||||||||||||||||||||||||
– Secured | $ | 9,252 | $ | 6,788 | $ | 9,977 | $ | 10,683 | $ | 36,700 | $ | 21,160 | $ | 48,194 | $ | 106,054 | ||||||||||||||||
– Unsecured (9) | 22,465 | 20,241 | 28,975 | 56,341 | 128,022 | 44,086 | 82,262 | 254,370 | ||||||||||||||||||||||||
| (1) | Excludes bankers’ acceptances and repos. |
| (2) | Excludes deposits associated with services we provide to banks (e.g., custody, cash management). |
| (3) | Includes bearer deposit notes (unsecured). |
| (4) | Only includes consolidated liabilities, including our collateralized commercial paper program. |
| (5) | Includes deposit notes and floating rate notes (unsecured). |
| (6) | Includes notes where the payout is tied to movements in foreign exchange, commodities and equities. |
| (7) | Includes covered bonds collateralized with residential mortgages and securities backed by credit card receivables. |
| (8) | Includes tender option bonds (secured) of $4,957 million (October 31, 2024 – $5,157 million), other long-term structured deposits (unsecured) of $23,104 million (October 31, 2024 – $19,777 million) and wholesale guaranteed interest certificates of $196 million (October 31, 2024 – $192 million). |
| (9) | Effective the first quarter of 2025, we updated the scope of senior unsecured structured notes to better reflect the distribution channel used to issue these notes. Comparative amounts have been revised from those previously presented to align with the approach we adopted this quarter. |
Credit ratings
Our ability to access unsecured funding markets and to engage in certain collateralized business activities on a cost-effective basis are largely dependent on maintaining competitive credit ratings. Credit ratings and outlooks provided by rating agencies reflect their views and methodologies. Ratings are subject to change, based on a number of factors including, but not limited to, our financial strength, competitive position, liquidity and other factors not completely within our control.
The following table presents our major credit ratings:
Credit ratings
(1)
As at February 26, 2025 | ||||||||||||||||
Short-term debt | Legacy senior long-term debt | Senior long-term debt | Outlook | |||||||||||||
Moody’s ‡ (4) | P-1 | Aa1 | A1 | stable | ||||||||||||
Standard & Poor’s ‡ (5) | A-1+ | AA- | A | stable | ||||||||||||
Fitch Ratings ‡ (6) | F1+ | AA | AA- | stable | ||||||||||||
DBRS ‡ (7) | R-1 (high) | AA (high) | AA | stable | ||||||||||||
| (1) | Credit ratings are not recommendations to purchase, sell or hold a financial obligation in as much as they do not comment on market price or suitability for a particular investor. Ratings are determined by the rating agencies based on criteria established from time to time by them and are subject to revision or withdrawal at any time by the rating organization. |
| (2) | Includes senior long-term debt issued prior to September 23, 2018 and senior long-term debt issued on or after September 23, 2018 which is excluded from the Bail-in regime. |
| (3) | Includes senior long-term debt issued on or after September 23, 2018 which is subject to conversion under the Bail-in regime. |
| (4) | On October 8, 2024, Moody’s affirmed our ratings with stable outlook. |
| (5) | On June 25, 2024, Standard & Poor’s affirmed our ratings with a stable outlook. |
| (6) | On June 11, 2024, Fitch Ratings affirmed our ratings with a stable outlook. |
| (7) | On May 10, 2024, DBRS affirmed our ratings with a stable outlook. |
Additional contractual obligations for rating downgrades
We are required to deliver collateral to certain counterparties in the event of a downgrade from our current credit rating. The following table shows the additional collateral obligations required at the reporting date in the event of aThere is no outstanding senior debt issued in the market that contains rating triggers that would lead to early prepayment of principal.
one-,
two-
or three-notch downgrade. These additional collateral obligations are incremental requirements for each successive downgrade and do not represent the cumulative impact of multiple downgrades. The amounts reported change periodically due to several factors, including the transfer of trading activity to centrally cleared financial market infrastructures and exchanges, the expiration of transactions with downgrade triggers, the imposition of internal limitations on new agreements to exclude downgrade triggers, as well as normal coursemark-to-market.
| As at | ||||||||||||||||||||||||||
January 31 2025 | October 31 2024 | |||||||||||||||||||||||||
| (Millions of Canadian dollars) | One-notch downgrade | Two-notch downgrade | Three-notch downgrade | One-notch downgrade | Two-notch downgrade | Three-notch downgrade | ||||||||||||||||||||
Contractual derivatives funding or margin requirements | $ | 336 | $ | 135 | $ | 289 | $ | 232 | $ | 100 | $ | 199 | ||||||||||||||
Other contractual funding or margin requirements (1) | 50 | 42 | 97 | 41 | 63 | 16 | ||||||||||||||||||||
| (1) | Includes Guaranteed Investment Certificates (GICs) issued by our municipal markets business out of New York. |
Royal Bank of Canada
Liquidity Coverage Ratio (LCR)
The LCR is a Basel III metric that measures the sufficiency of high-quality liquid assets (HQLA) available to meet liquidity needs over a
30-day
period in an acute stress scenario. The Basel Committee on Banking Supervision (BCBS) and OSFI regulatory minimum coverage level for LCR is 100%.OSFI requires Canadian banks to disclose the LCR using the standard Basel disclosure template and calculated using the average of daily LCR positions during the quarter.
Liquidity coverage ratio common disclosure template
(1)
| For the three months ended | ||||||||
January 31 2025 | ||||||||
| (Millions of Canadian dollars, except percentage amounts) | Total unweighted value (average) | Total weighted value (average) | ||||||
High-quality liquid assets | ||||||||
Total high-quality liquid assets (HQLA) | $ | 419,334 | ||||||
Cash outflows | ||||||||
Retail deposits and deposits from small business customers, of which: | $ | 420,412 | $ | 42,986 | ||||
Stable deposits (3) | 131,221 | 3,937 | ||||||
Less stable deposits | 289,191 | 39,049 | ||||||
Unsecured wholesale funding, of which: | 477,086 | 225,033 | ||||||
Operational deposits (all counterparties) and deposits in networks of cooperative banks (4) | 173,949 | 40,998 | ||||||
Non-operational deposits | 284,418 | 165,316 | ||||||
Unsecured debt | 18,719 | 18,719 | ||||||
Secured wholesale funding | 43,687 | |||||||
Additional requirements, of which: | 415,628 | 86,947 | ||||||
Outflows related to derivative exposures and other collateral requirements | 78,967 | 22,162 | ||||||
Outflows related to loss of funding on debt products | 10,454 | 10,454 | ||||||
Credit and liquidity facilities | 326,207 | 54,331 | ||||||
Other contractual funding obligations (5) | 23,750 | 23,750 | ||||||
Other contingent funding obligations (6) | 859,482 | 15,025 | ||||||
Total cash outflows | $ | 437,428 | ||||||
Cash inflows | ||||||||
Secured lending (e.g., reverse repos) | $ | 335,387 | $ | 58,628 | ||||
Inflows from fully performing exposures | 20,671 | 12,406 | ||||||
Other cash inflows | 38,255 | 38,255 | ||||||
Total cash inflows | $ | 109,289 | ||||||
Total adjusted value | ||||||||
Total HQLA | $ | 419,334 | ||||||
Total net cash outflows | 328,139 | |||||||
Liquidity coverage ratio | 128% | |||||||
October 31 2024 | ||||||||
| (Millions of Canadian dollars, except percentage amounts) | Total adjusted value | |||||||
Total HQLA | $ | 399,835 | ||||||
Total net cash outflows | 313,441 | |||||||
Liquidity coverage ratio | 128% | |||||||
| (1) | The LCR is calculated in accordance with OSFI’s LAR guideline, which, in turn, reflects liquidity-related requirements issued by the BCBS. The LCR for the quarter ended January 31, 2025 is calculated as an average of 62 daily positions. |
| (2) | With the exception of other contingent funding obligations, unweighted inflow and outflow amounts are items maturing or callable in 30 days or less. Other contingent funding obligations also include debt securities with remaining maturity greater than 30 days. |
| (3) | As defined by the BCBS, stable deposits from retail and small business customers are deposits that are insured and are either held in transactional accounts or the bank has an established relationship with the client making the withdrawal unlikely. |
| (4) | Operational deposits from customers other than retail and small and medium-sized enterprises, are deposits which clients need to keep with the bank in order to facilitate their access and ability to use payment and settlement systems primarily for clearing, custody and cash management activities. |
| (5) | Other contractual funding obligations primarily include outflows from unsettled securities trades and outflows from obligations related to securities sold short. |
| (6) | Other contingent funding obligations include outflows related to other off-balance sheet facilities that carry low LCR runoff factors (0% – 5%). |
We manage our LCR position within a target range that reflects our liquidity risk tolerance, business mix, asset composition and funding capabilities. The range is subject to periodic review, considering changes to internal requirements and external developments.
We maintain HQLA in major currencies with dependable market depth and breadth. Our treasury management practices are designed to ensure that the levels of HQLA are actively managed to meet target LCR objectives. Our Level 1 assets, as calculated according to OSFI LAR and the BCBS LCR requirements, represent 86% of total HQLA. These assets consist of cash, placements with central banks and highly rated securities issued or guaranteed by governments, central banks and supranational entities.
34 First Quarter 2025
Royal Bank of Canada
LCR captures cash flows from
on-
andoff-balance
sheet activities that are either expected or could potentially occur within 30 days in an acute stress scenario. Cash outflows result from the application of withdrawal andnon-renewal
factors to demand and term deposits, differentiated by client type (wholesale, retail and small- andmedium-sized
enterprises). Cash outflows also arise from business activities that create contingent funding and collateral requirements, such as repo funding, derivatives, short sales of securities and the extension of credit and liquidity commitments to clients. Cash inflows arise primarily from maturing secured loans, interbank loans andnon-HQLA
securities.LCR does not reflect any market funding capacity that we believe would be available in a stress situation. All maturing wholesale debt is assigned 100% outflow in the LCR calculation.
Q1 2025 vs. Q4 2024
The average LCR for the quarter ended January 31, 2025 was 128%, which translates into a surplus of approximately $91 billion, compared to 128% and a surplus of approximately $86 billion in the prior quarter. Average LCR remained relatively stable from the prior quarter as growth in deposits and funding was largely offset by loan growth and securities and securities financing transactions.
Net Stable Funding Ratio (NSFR)
NSFR is a Basel III metric that measures the sufficiency of available stable funding relative to the amount of required stable funding. The BCBS and OSFI regulatory minimum coverage level for NSFR is 100%.
Available stable funding is defined as the portion of capital and liabilities expected to be reliable over the
one-year
time horizon considered by the NSFR. Required stable funding is a function of the liquidity characteristics and residual maturities of various bank assets andoff-balance
sheet exposures.OSFI requires Canadian Domestic Systemically Important Banks
(D-SIBs)
to disclose the NSFR using the standard Basel disclosure template. Amounts presented in this disclosure template are determined in accordance with the requirements of OSFI’s LAR guideline and are not necessarily aligned with the classification requirements prescribed under IFRS.Royal Bank of Canada
Net Stable Funding Ratio common disclosure template
(1)
As at January 31, 2025 | ||||||||||||||||||||
Unweighted value by residual maturity | Weighted value | |||||||||||||||||||
| (Millions of Canadian dollars, except percentage amounts) | No maturity | < 6 months | 6 months to < 1 year | ≥ 1 year | ||||||||||||||||
Available Stable Funding (ASF) Item | ||||||||||||||||||||
Capital: | $ | 134,649 | $ | – | $ | – | $ | 12,196 | $ | 146,845 | ||||||||||
Regulatory Capital | 134,649 | – | – | 12,196 | 146,845 | |||||||||||||||
Other Capital Instruments | – | – | – | – | – | |||||||||||||||
Retail deposits and deposits from small business customers: | 347,752 | 133,980 | 61,720 | 65,995 | 558,190 | |||||||||||||||
Stable deposits (3) | 101,352 | 56,510 | 31,302 | 27,814 | 207,520 | |||||||||||||||
Less stable deposits | 246,400 | 77,470 | 30,418 | 38,181 | 350,670 | |||||||||||||||
Wholesale funding: | 341,794 | 460,498 | 72,793 | 172,809 | 402,944 | |||||||||||||||
Operational deposits (4) | 185,822 | – | – | – | 92,911 | |||||||||||||||
Other wholesale funding | 155,972 | 460,498 | 72,793 | 172,809 | 310,033 | |||||||||||||||
Liabilities with matching interdependent assets (5) | – | 2,884 | 1,661 | 22,096 | – | |||||||||||||||
Other liabilities: | 61,810 | 249,364 | 18,109 | |||||||||||||||||
NSFR derivative liabilities | 42,390 | |||||||||||||||||||
All other liabilities and equity not included in the above categories | 61,810 | 188,601 | 529 | 17,844 | 18,109 | |||||||||||||||
Total ASF | $ | 1,126,088 | ||||||||||||||||||
Required Stable Funding (RSF) Item | ||||||||||||||||||||
Total NSFR high-quality liquid assets (HQLA) | $ | 44,951 | ||||||||||||||||||
Deposits held at other financial institutions for operational purposes | – | 2,077 | – | – | 1,039 | |||||||||||||||
Performing loans and securities: | 289,288 | 316,031 | 119,109 | 551,523 | 798,043 | |||||||||||||||
Performing loans to financial institutions secured by Level 1 HQLA | – | 87,167 | 9,556 | 23 | 9,446 | |||||||||||||||
Performing loans to financial institutions secured by non-Level 1 HQLA and unsecured performing loans to financial institutions | 8,008 | 117,063 | 23,923 | 17,415 | 50,102 | |||||||||||||||
Performing loans to non-financial corporate clients, loans to retail and small business customers, and loans to sovereigns, central banks and PSEs, of which: | 194,354 | 61,755 | 34,580 | 189,588 | 374,265 | |||||||||||||||
With a risk weight of less than or equal to 35% under the Basel II standardized approach for credit risk | – | 700 | 591 | 5,277 | 4,075 | |||||||||||||||
Performing residential mortgages, of which: | 39,778 | 46,883 | 49,880 | 317,954 | 299,713 | |||||||||||||||
With a risk weight of less than or equal to 35% under the Basel II standardized approach for credit risk | 39,778 | 46,845 | 49,849 | 316,819 | 298,714 | |||||||||||||||
Securities that are not in default and do not qualify as HQLA, including exchange-traded equities | 47,148 | 3,163 | 1,170 | 26,543 | 64,517 | |||||||||||||||
Assets with matching interdependent liabilities (5) | – | 2,884 | 1,661 | 22,096 | – | |||||||||||||||
Other assets: | 7,867 | 352,676 | 103,701 | |||||||||||||||||
Physical traded commodities, including gold | 7,867 | 6,687 | ||||||||||||||||||
Assets posted as initial margin for derivative contracts and contributions to default funds of CCPs | 21,616 | 18,373 | ||||||||||||||||||
NSFR derivative assets | 33,804 | – | ||||||||||||||||||
NSFR derivative liabilities before deduction of variation margin posted | 77,574 | 3,879 | ||||||||||||||||||
All other assets not included in the above categories | – | 152,906 | 20 | 66,756 | 74,762 | |||||||||||||||
Off-balance sheet items | 910,237 | 35,264 | ||||||||||||||||||
Total RSF | $ | 982,998 | ||||||||||||||||||
Net Stable Funding Ratio (%) | 115% | |||||||||||||||||||
| As at October 31, 2024 | ||||||||||||||||||||
| (Millions of Canadian dollars, except percentage amounts) | Weighted value | |||||||||||||||||||
Total ASF | $ | 1,103,220 | ||||||||||||||||||
Total RSF | 965,984 | |||||||||||||||||||
Net Stable Funding Ratio (%) | 114% | |||||||||||||||||||
| (1) | The NSFR is calculated in accordance with OSFI’s LAR guideline, which, in turn, reflects liquidity-related requirements issued by the BCBS. |
| (2) | Totals for the following rows encompass the residual maturity categories of less than 6 months, 6 months to less than 1 year, and greater than or equal to 1 year in accordance with the requirements of the common disclosure template prescribed by OSFI: Other liabilities, NSFR derivative liabilities, Other assets, Assets posted as initial margin for derivative contracts and contributions to default funds of central counterparties (CCPs), NSFR derivative assets, NSFR derivative liabilities before deduction of variation margin posted and Off-balance sheet items. |
| (3) | As defined by the BCBS, stable deposits from retail and small business customers are deposits that are insured and are either held in transactional accounts or the bank has an established relationship with the client making the withdrawal unlikely. |
| (4) | Operational deposits from customers other than retail and small- and medium-sized enterprises, are deposits which clients need to keep with the bank in order to facilitate their access and ability to use payment and settlement systems primarily for clearing, custody and cash management activities. |
| (5) | Interdependent assets and liabilities represent NHA MBS liabilities, including liabilities arising from transactions involving the Canada Mortgage Bond program and their corresponding encumbered mortgages. |
36 First Quarter 2025
Royal Bank of Canada
Available stable funding is comprised primarily of a diversified pool of personal and commercial deposits, capital and long-term wholesale liabilities. Required stable funding is driven mainly by the bank’s mortgage and loan portfolio, secured loans to financial institutions and to a lesser extent by other less liquid assets. NSFR does not reflect any unused market funding capacity that we believe would be available.
Volume and composition of available stable funding is actively managed to optimize our structural funding position and meet NSFR objectives. Our NSFR is managed in accordance with our comprehensive LRMF.
Q1 2025 vs. Q4 2024
The NSFR as at January 31, 2025 was 115%, which translates into a surplus of approximately $143 billion, compared to 114% and a surplus of approximately $137 billion in the prior quarter. NSFR increased compared to the previous quarter, primarily due to an increase in wholesale funding, lower funding requirements on securities and securities financing transactions, and growth in the bank’s book capital as well as in deposits, partially offset by loan growth.
Contractual maturities of financial assets, financial liabilities and
off-balance
sheet itemsThe following tables provide remaining contractual maturity profiles of all our assets, liabilities, and
off-balance
sheet items at their carrying value (e.g., amortized cost or fair value) and maturity profiles of assets and liabilities of insurance contracts and reinsurance contracts held at their carrying value based on the estimated timing of when the settlement of the amounts are expected to occur at the balance sheet date.Off-balance
sheet items are allocated based on the expiry date of the contract.Details of contractual maturities and commitments to extend funds are a source of information for the management of liquidity risk. Among other purposes, these details form a basis for modelling a behavioural balance sheet with effective maturities to calculate liquidity risk measures. For further details, refer to the Risk measurement and internal liquidity section within the Liquidity and funding risk section of our 2024 Annual Report.
As at January 31, 2025 | ||||||||||||||||||||||||||||||||||||||||
| (Millions of Canadian dollars) | Less than 1 month | 1 to 3 months | 3 to 6 months | 6 to 9 months | 9 to 12 months | 1 year to 2 years | 2 years to 5 years | 5 years and greater | With no specific maturity | Total | ||||||||||||||||||||||||||||||
Assets | ||||||||||||||||||||||||||||||||||||||||
Cash and deposits with banks | $ | 116,898 | $ | 6 | $ | – | $ | – | $ | – | $ | – | $ | – | $ | – | $ | 2,220 | $ | 119,124 | ||||||||||||||||||||
Securities | ||||||||||||||||||||||||||||||||||||||||
Trading (1) | 84,492 | 2,567 | 1,176 | 50 | 109 | 270 | 645 | 13,396 | 86,711 | 189,416 | ||||||||||||||||||||||||||||||
Investment, net of applicable allowance | 5,369 | 9,243 | 11,221 | 15,442 | 19,007 | 56,633 | 71,751 | 108,667 | 1,276 | 298,609 | ||||||||||||||||||||||||||||||
Assets purchased under reverse repurchase agreements and securities borrowed (2) | 126,591 | 69,178 | 33,461 | 12,144 | 19,051 | 162 | – | – | 19,864 | 280,451 | ||||||||||||||||||||||||||||||
Loans, net of applicable allowance | 40,691 | 37,876 | 51,468 | 49,970 | 51,052 | 289,717 | 297,582 | 84,739 | 102,955 | 1,006,050 | ||||||||||||||||||||||||||||||
Other | ||||||||||||||||||||||||||||||||||||||||
Customers’ liability under acceptances | 17 | – | 46 | – | – | – | 11 | – | – | 74 | ||||||||||||||||||||||||||||||
Derivatives | 12,639 | 16,664 | 9,414 | 7,621 | 9,214 | 17,075 | 32,008 | 49,051 | – | 153,686 | ||||||||||||||||||||||||||||||
Other financial assets | 54,094 | 4,086 | 2,597 | 382 | 834 | 208 | 761 | 1,739 | 4,434 | 69,135 | ||||||||||||||||||||||||||||||
Total financial assets | 440,791 | 139,620 | 109,383 | 85,609 | 99,267 | 364,065 | 402,758 | 257,592 | 217,460 | 2,116,545 | ||||||||||||||||||||||||||||||
Other non-financial assets | 15,771 | 2,295 | 942 | 342 | 341 | 3,128 | 3,331 | 9,384 | 38,947 | 74,481 | ||||||||||||||||||||||||||||||
Total assets | $ | 456,562 | $ | 141,915 | $ | 110,325 | $ | 85,951 | $ | 99,608 | $ | 367,193 | $ | 406,089 | $ | 266,976 | $ | 256,407 | $ | 2,191,026 | ||||||||||||||||||||
Liabilities and equity | ||||||||||||||||||||||||||||||||||||||||
Deposits (3) | ||||||||||||||||||||||||||||||||||||||||
Unsecured borrowing | $ | 103,083 | $ | 66,475 | $ | 96,968 | $ | 77,019 | $ | 87,804 | $ | 58,760 | $ | 83,739 | $ | 52,959 | $ | 699,794 | $ | 1,326,601 | ||||||||||||||||||||
Secured borrowing | 4,183 | 10,270 | 8,235 | 2,922 | 1,675 | 8,234 | 13,899 | 9,288 | – | 58,706 | ||||||||||||||||||||||||||||||
Covered bonds | – | 1,503 | 4,108 | 2,235 | 3,303 | 21,202 | 20,341 | 3,941 | – | 56,633 | ||||||||||||||||||||||||||||||
Other | ||||||||||||||||||||||||||||||||||||||||
Acceptances | 17 | 2 | 44 | – | – | – | 11 | – | – | 74 | ||||||||||||||||||||||||||||||
Obligations related to securities sold short | 36,356 | 1,509 | 3,996 | 2,303 | 1,157 | 139 | – | – | – | 45,460 | ||||||||||||||||||||||||||||||
Obligations related to assets sold under repurchase agreements and securities loaned (2) | 153,900 | 83,432 | 10,315 | 1,539 | 4 | 905 | – | – | 24,497 | 274,592 | ||||||||||||||||||||||||||||||
Derivatives | 13,251 | 18,207 | 11,320 | 8,261 | 10,163 | 19,180 | 33,807 | 47,401 | – | 161,590 | ||||||||||||||||||||||||||||||
Other financial liabilities | 43,739 | 3,165 | 2,823 | 1,896 | 1,818 | 1,107 | 2,544 | 18,915 | 1,140 | 77,147 | ||||||||||||||||||||||||||||||
Subordinated debentures | – | – | – | – | 2,128 | – | – | 11,542 | – | 13,670 | ||||||||||||||||||||||||||||||
Total financial liabilities | 354,529 | 184,563 | 137,809 | 96,175 | 108,052 | 109,527 | 154,341 | 144,046 | 725,431 | 2,014,473 | ||||||||||||||||||||||||||||||
Other non-financial liabilities | 1,567 | 1,333 | 300 | 199 | 2,417 | 1,640 | 1,576 | 22,728 | 11,530 | 43,290 | ||||||||||||||||||||||||||||||
Equity | – | – | – | – | – | – | – | – | 133,263 | 133,263 | ||||||||||||||||||||||||||||||
Total liabilities and equity | $ | 356,096 | $ | 185,896 | $ | 138,109 | $ | 96,374 | $ | 110,469 | $ | 111,167 | $ | 155,917 | $ | 166,774 | $ | 870,224 | $ | 2,191,026 | ||||||||||||||||||||
Off-balance sheet items | ||||||||||||||||||||||||||||||||||||||||
Financial guarantees | $ | 1,254 | $ | 3,146 | $ | 3,825 | $ | 4,456 | $ | 4,892 | $ | 1,856 | $ | 6,705 | $ | 2,133 | $ | 23 | $ | 28,290 | ||||||||||||||||||||
Commitments to extend credit | 4,891 | 12,314 | 16,347 | 15,419 | 19,427 | 69,184 | 224,882 | 23,762 | 4,585 | 390,811 | ||||||||||||||||||||||||||||||
Other credit-related commitments | 50,872 | 1,659 | 3,050 | 2,637 | 2,986 | 430 | 1,226 | 119 | 82,568 | 145,547 | ||||||||||||||||||||||||||||||
Other commitments | 6 | 11 | 18 | 17 | 18 | 62 | 156 | 241 | 1,018 | 1,547 | ||||||||||||||||||||||||||||||
Total off-balance sheet items | $ | 57,023 | $ | 17,130 | $ | 23,240 | $ | 22,529 | $ | 27,323 | $ | 71,532 | $ | 232,969 | $ | 26,255 | $ | 88,194 | $ | 566,195 | ||||||||||||||||||||
| (1) | With the exception of debt securities within the Insurance segment, trading debt securities classified as FVTPL have been included in the less than 1 month category as there is no expectation to hold these assets to their contractual maturity. |
| (2) | Open reverse repo and repo contracts, which have no set maturity date and are typically short-term, have been included in the with no specific maturity category. |
| (3) | A major portion of relationship-based deposits are repayable on demand or at short notice on a contractual basis while, in practice, these customer balances form a core base for our operations and liquidity needs, as explained in the preceding Deposit and funding profile section. |
Royal Bank of Canada
| As at October 31, 2024 | ||||||||||||||||||||||||||||||||||||||||
| (Millions of Canadian dollars) | Less than 1 month | 1 to 3 months | 3 to 6 months | 6 to 9 months | 9 to 12 months | 1 year to 2 years | 2 years to 5 years | 5 years and greater | With no specific maturity | Total | ||||||||||||||||||||||||||||||
Assets | ||||||||||||||||||||||||||||||||||||||||
Cash and deposits with banks | $ | 120,584 | $ | 6 | $ | – | $ | – | $ | – | $ | – | $ | – | $ | – | $ | 2,153 | $ | 122,743 | ||||||||||||||||||||
Securities | ||||||||||||||||||||||||||||||||||||||||
Trading (1) | 80,203 | 148 | 380 | 22 | 34 | 229 | 707 | 11,903 | 89,674 | 183,300 | ||||||||||||||||||||||||||||||
Investment, net of applicable allowance | 5,974 | 7,588 | 6,782 | 12,445 | 9,746 | 51,674 | 67,730 | 93,451 | 1,228 | 256,618 | ||||||||||||||||||||||||||||||
Assets purchased under reverse repurchase agreements and securities borrowed (2) | 170,052 | 65,837 | 57,921 | 15,720 | 20,727 | 181 | – | – | 20,365 | 350,803 | ||||||||||||||||||||||||||||||
Loans, net of applicable allowance | 40,647 | 32,131 | 45,916 | 52,365 | 50,309 | 287,726 | 288,217 | 79,694 | 104,375 | 981,380 | ||||||||||||||||||||||||||||||
Other | ||||||||||||||||||||||||||||||||||||||||
Customers’ liability under acceptances | 22 | 2 | – | – | – | – | 11 | – | – | 35 | ||||||||||||||||||||||||||||||
Derivatives | 13,657 | 19,365 | 9,293 | 6,548 | 5,797 | 17,376 | 31,389 | 47,187 | – | 150,612 | ||||||||||||||||||||||||||||||
Other financial assets | 42,579 | 4,573 | 2,168 | 423 | 671 | 175 | 732 | 1,829 | 4,229 | 57,379 | ||||||||||||||||||||||||||||||
Total financial assets | 473,718 | 129,650 | 122,460 | 87,523 | 87,284 | 357,361 | 388,786 | 234,064 | 222,024 | 2,102,870 | ||||||||||||||||||||||||||||||
Other non-financial assets | 11,393 | 2,158 | 1,450 | 259 | 233 | 1,941 | 3,122 | 9,501 | 38,655 | 68,712 | ||||||||||||||||||||||||||||||
Total assets | $ | 485,111 | $ | 131,808 | $ | 123,910 | $ | 87,782 | $ | 87,517 | $ | 359,302 | $ | 391,908 | $ | 243,565 | $ | 260,679 | $ | 2,171,582 | ||||||||||||||||||||
Liabilities and equity | ||||||||||||||||||||||||||||||||||||||||
Deposits (3) | ||||||||||||||||||||||||||||||||||||||||
Unsecured borrowing | $ | 122,083 | $ | 72,933 | $ | 83,574 | $ | 84,252 | $ | 77,207 | $ | 55,196 | $ | 85,458 | $ | 44,264 | $ | 668,975 | $ | 1,293,942 | ||||||||||||||||||||
Secured borrowing | 4,437 | 6,000 | 9,513 | 3,939 | 1,956 | 7,447 | 14,969 | 9,050 | – | 57,311 | ||||||||||||||||||||||||||||||
Covered bonds | – | 2,245 | 1,498 | 4,019 | 2,230 | 17,134 | 27,207 | 3,945 | – | 58,278 | ||||||||||||||||||||||||||||||
Other | ||||||||||||||||||||||||||||||||||||||||
Acceptances | 22 | 2 | – | – | – | – | 11 | – | – | 35 | ||||||||||||||||||||||||||||||
Obligations related to securities sold short | 35,286 | – | – | – | – | – | – | – | – | 35,286 | ||||||||||||||||||||||||||||||
Obligations related to assets sold under repurchase agreements and securities loaned (2) | 221,377 | 38,828 | 14,726 | 7,586 | 2 | 466 | – | – | 22,336 | 305,321 | ||||||||||||||||||||||||||||||
Derivatives | 13,153 | 23,372 | 12,176 | 11,160 | 8,025 | 18,305 | 32,865 | 44,707 | – | 163,763 | ||||||||||||||||||||||||||||||
Other financial liabilities | 40,922 | 3,332 | 2,917 | 2,060 | 2,024 | 1,073 | 2,393 | 16,788 | 1,293 | 72,802 | ||||||||||||||||||||||||||||||
Subordinated debentures | – | – | – | – | – | 2,025 | – | 11,521 | – | 13,546 | ||||||||||||||||||||||||||||||
Total financial liabilities | 437,280 | 146,712 | 124,404 | 113,016 | 91,444 | 101,646 | 162,903 | 130,275 | 692,604 | 2,000,284 | ||||||||||||||||||||||||||||||
Other non-financial liabilities | 1,501 | 5,769 | 452 | 231 | 198 | 1,664 | 1,821 | 21,425 | 11,045 | 44,106 | ||||||||||||||||||||||||||||||
Equity | – | – | – | – | – | – | – | – | 127,192 | 127,192 | ||||||||||||||||||||||||||||||
Total liabilities and equity | $ | 438,781 | $ | 152,481 | $ | 124,856 | $ | 113,247 | $ | 91,642 | $ | 103,310 | $ | 164,724 | $ | 151,700 | $ | 830,841 | $ | 2,171,582 | ||||||||||||||||||||
Off-balance sheet items | ||||||||||||||||||||||||||||||||||||||||
Financial guarantees | $ | 917 | $ | 2,929 | $ | 4,485 | $ | 3,818 | $ | 4,368 | $ | 1,563 | $ | 7,140 | $ | 1,977 | $ | 25 | $ | 27,222 | ||||||||||||||||||||
Commitments to extend credit | 7,317 | 9,060 | 15,891 | 17,305 | 20,109 | 63,200 | 217,555 | 25,580 | 2,950 | 378,967 | ||||||||||||||||||||||||||||||
Other credit-related commitments | 51,645 | 1,600 | 2,360 | 2,927 | 2,534 | 460 | 1,299 | 113 | 81,379 | 144,317 | ||||||||||||||||||||||||||||||
Other commitments | 7 | 12 | 19 | 20 | 19 | 70 | 179 | 260 | 926 | 1,512 | ||||||||||||||||||||||||||||||
Total off-balance sheet items | $ | 59,886 | $ | 13,601 | $ | 22,755 | $ | 24,070 | $ | 27,030 | $ | 65,293 | $ | 226,173 | $ | 27,930 | $ | 85,280 | $ | 552,018 | ||||||||||||||||||||
| (1) | With the exception of debt securities within the Insurance segment, trading debt securities classified as FVTPL have been included in the less than 1 month category as there is no expectation to hold these assets to their contractual maturity. |
| (2) | Open reverse repo and repo contracts, which have no set maturity date and are typically short-term, have been included in the with no specific maturity category. |
| (3) | A major portion of relationship-based deposits are repayable on demand or at short notice on a contractual basis while, in practice, these customer balances form a core base for our operations and liquidity needs, as explained in the preceding Deposit and funding profile section. |
38 First Quarter 2025
Royal Bank of Canada
Capital management |
We continue to manage our capital in accordance with our Capital Management Framework as described in our 2024 Annual Report. In addition, we continue to monitor for new regulatory capital developments, including OSFI guidance, in order to ensure compliance with these requirements as disclosed in the Capital management section in our 2024 Annual Report, and as updated below.
OSFI expects Canadian banks to meet the Basel III targets for CET1, Tier 1 and Total capital ratios as per CAR guidelines. Under Basel III, banks select from two main approaches, the Standardized Approach (SA) or the Internal Ratings Based (IRB) Approach, to calculate their minimum regulatory capital required to support credit, market and operational risks. We apply the IRB approach to credit risk to determine minimum regulatory capital requirements for the majority of our portfolios. Certain credit risk portfolios are subject to the SA, primarily in Wealth Management including our City National wholesale portfolio, our Caribbean Banking operations and certain
non-mortgage
retail portfolios acquired through the HSBC Canada transaction. For consolidated regulatory reporting of market risk capital and operational risk capital, we use the revised SA as noted in our 2024 Annual Report.The Financial Stability Board (FSB) has
re-designated
us as a Global Systemically Important Bank(G-SIB).
This designation requires us to maintain a higher loss absorbency requirement (common equity as a percentage of RWA) of 1% consistent with theD-SIB
requirement. In addition to the Basel III targets, OSFI established a Domestic Stability Buffer (DSB) applicable to all CanadianD-SIBs
to further ensure the financial stability of the Canadian financial system. The current OSFI requirement for the DSB is set at 3.5% of total RWA as reaffirmed by OSFI on December 17, 2024.Under OSFI’s Total Loss Absorbing Capacity (TLAC) guideline,
D-SIBs
are required to maintain a risk-based TLAC ratio which builds on the risk-based capital ratios described in the CAR guideline, and a TLAC leverage ratio which builds on the leverage ratio described in OSFI’s LR guideline. The TLAC requirement is intended to address the sufficiency of aD-SIB’s
loss absorbing capacity in supporting its recapitalization in the event of its failure. TLAC is defined as the aggregate of Tier 1 capital, Tier 2 capital and external TLAC instruments, which allow conversion in whole or in part into common shares under the CDIC Act and meet all of the eligibility criteria under the TLAC guideline.On July 5, 2024, OSFI announced a
one-year
delay to the increase in the capital floor factor prescribed in OSFI’s CAR guidelines, maintaining the current 67.5% of RWA (as calculated using only the SA for credit, market and operational risk) factor throughout 2024 and 2025, and delaying the 70% factor implementation from 2025 to 2026, and the 72.5% factor implementation from 2026 to 2027. On February 12, 2025, OSFI announced an indefinite delay in any further increases to the capital floor factor, and committed to providing at least two years notice to affected banks prior to resuming increases in the capital floor.Our methodology for allocating capital to our business segments is based on the Basel III regulatory capital requirements, with the exception of Insurance. Effective the first quarter of 2025, we increased our capital attribution rates to our business segments. For further details, refer to the How we measure and report our business segments section.
For further details, refer to the Capital management section of our 2024 Annual Report.
The following table provides a summary of OSFI’s current regulatory target ratios under Basel III and Pillar 2 requirements. We are in compliance with all current capital, leverage and TLAC requirements imposed by OSFI:
Basel III capital, leverage and TLAC ratios | OSFI regulatory target requirements for large banks under Basel III | Domestic Stability Buffer (3) | Minimum including Capital Buffers, D-SIB/G-SIB surcharge and Domestic Stability Buffer as at January 31, 2025 (4) | RBC capital, leverage and TLAC ratios as at January 31, 2025 | ||||||||||||||||||||||||||||
Minimum | Capital Buffers | Minimum including Capital Buffers | D-SIB/G-SIB surcharge (1) | Minimum including Capital Buffers and D-SIB/G-SIB surcharge (1), (2) | ||||||||||||||||||||||||||||
| Common Equity Tier 1 | 4.5% | 2.6% | 7.1% | 1.0% | 8.1% | 3.5% | 11.6% | 13.2% | ||||||||||||||||||||||||
| Tier 1 capital | 6.0% | 2.6% | 8.6% | 1.0% | 9.6% | 3.5% | 13.1% | 14.6% | ||||||||||||||||||||||||
| Total capital | 8.0% | 2.6% | 10.6% | 1.0% | 11.6% | 3.5% | 15.1% | 16.4% | ||||||||||||||||||||||||
| Leverage ratio | 3.0% | n.a. | 3.0% | 0.5% | 3.5% | n.a. | 3.5% | 4.4% | ||||||||||||||||||||||||
| TLAC ratio | 21.6% | n.a. | 21.6% | n.a. | 21.6% | 3.5% | 25.1% | 29.8% | ||||||||||||||||||||||||
| TLAC leverage ratio | 7.25% | n.a. | 7.25% | n.a. | 7.25% | n.a. | 7.25% | 8.9% | ||||||||||||||||||||||||
| (1) | A capital surcharge, equal to the higher of our D-SIB surcharge and the BCBS’sG-SIB surcharge, is applicable to risk-weighted capital. For leverage ratio, only 50% of ourD-SIB surcharge for capital is the required surcharge. |
| (2) | The capital buffers include the capital conservation buffer of 2.5% and the countercyclical capital buffer (CCyB) as prescribed by OSFI. The CCyB, calculated in accordance with OSFI’s CAR guidelines, was 0.09% as at January 31, 2025 (October 31, 2024 – 0.08%; January 31, 2024 – 0.06%). |
| (3) | The DSB can range from 0% to 4% of total RWA and is currently set at 3.5%. |
| (4) | Minimum target requirements reflect CCyB requirements as at January 31, 2025 which are subject to change based on exposures held at the reporting date. |
| n.a. | not applicable |
Royal Bank of Canada
The following table provides details on our regulatory capital, TLAC available, RWA, and on ratios for capital, leverage and TLAC. Our capital position remains strong and our capital, leverage and TLAC ratios remain well above OSFI regulatory targets.
| As at | ||||||||||||
| (Millions of Canadian dollars, except percentage amounts and as otherwise noted) | January 31 2025 | October 31 2024 | January 31 2024 | |||||||||
Capital (1) | ||||||||||||
CET1 capital | $ | 93,321 | $ | 88,936 | $ | 88,106 | ||||||
Tier 1 capital | 103,718 | 97,952 | 96,140 | |||||||||
Total capital | 115,914 | 110,487 | 106,865 | |||||||||
RWA used in calculation of capital ratios (1) | ||||||||||||
Credit risk | $ | 579,866 | $ | 548,809 | $ | 474,677 | ||||||
Market risk | 36,530 | 33,930 | 30,980 | |||||||||
Operational risk | 92,545 | 89,543 | 84,600 | |||||||||
Total RWA | $ | 708,941 | $ | 672,282 | $ | 590,257 | ||||||
Capital ratios and Leverage ratio (1) | ||||||||||||
CET1 ratio | 13.2% | 13.2% | 14.9% | |||||||||
Tier 1 capital ratio | 14.6% | 14.6% | 16.3% | |||||||||
Total capital ratio | 16.4% | 16.4% | 18.1% | |||||||||
Leverage ratio | 4.4% | 4.2% | 4.4% | |||||||||
Leverage ratio exposure | $ | 2,367,402 | $ | 2,344,228 | $ | 2,173,419 | ||||||
TLAC available and ratios (2) | ||||||||||||
TLAC available | $ | 211,585 | $ | 196,659 | $ | 185,556 | ||||||
TLAC ratio | 29.8% | 29.3% | 31.4% | |||||||||
TLAC leverage ratio | 8.9% | 8.4% | 8.5% | |||||||||
| (1) | Capital, RWA and capital ratios are calculated using OSFI’s CAR guideline and the Leverage ratio is calculated using OSFI’s LR guideline. Both the CAR guideline and LR guideline are based on the Basel III framework. |
| (2) | TLAC available and TLAC ratios are calculated using OSFI’s TLAC guideline. The TLAC standard is applied at the resolution entity level which for us is deemed to be Royal Bank of Canada and its subsidiaries. A resolution entity and its subsidiaries are collectively called a resolution group. The TLAC ratio and TLAC leverage ratio are calculated using the TLAC available as a percentage of total RWA and leverage exposure, respectively. |
40 First Quarter 2025
Royal Bank of Canada
Q1 2025 vs. Q4 2024
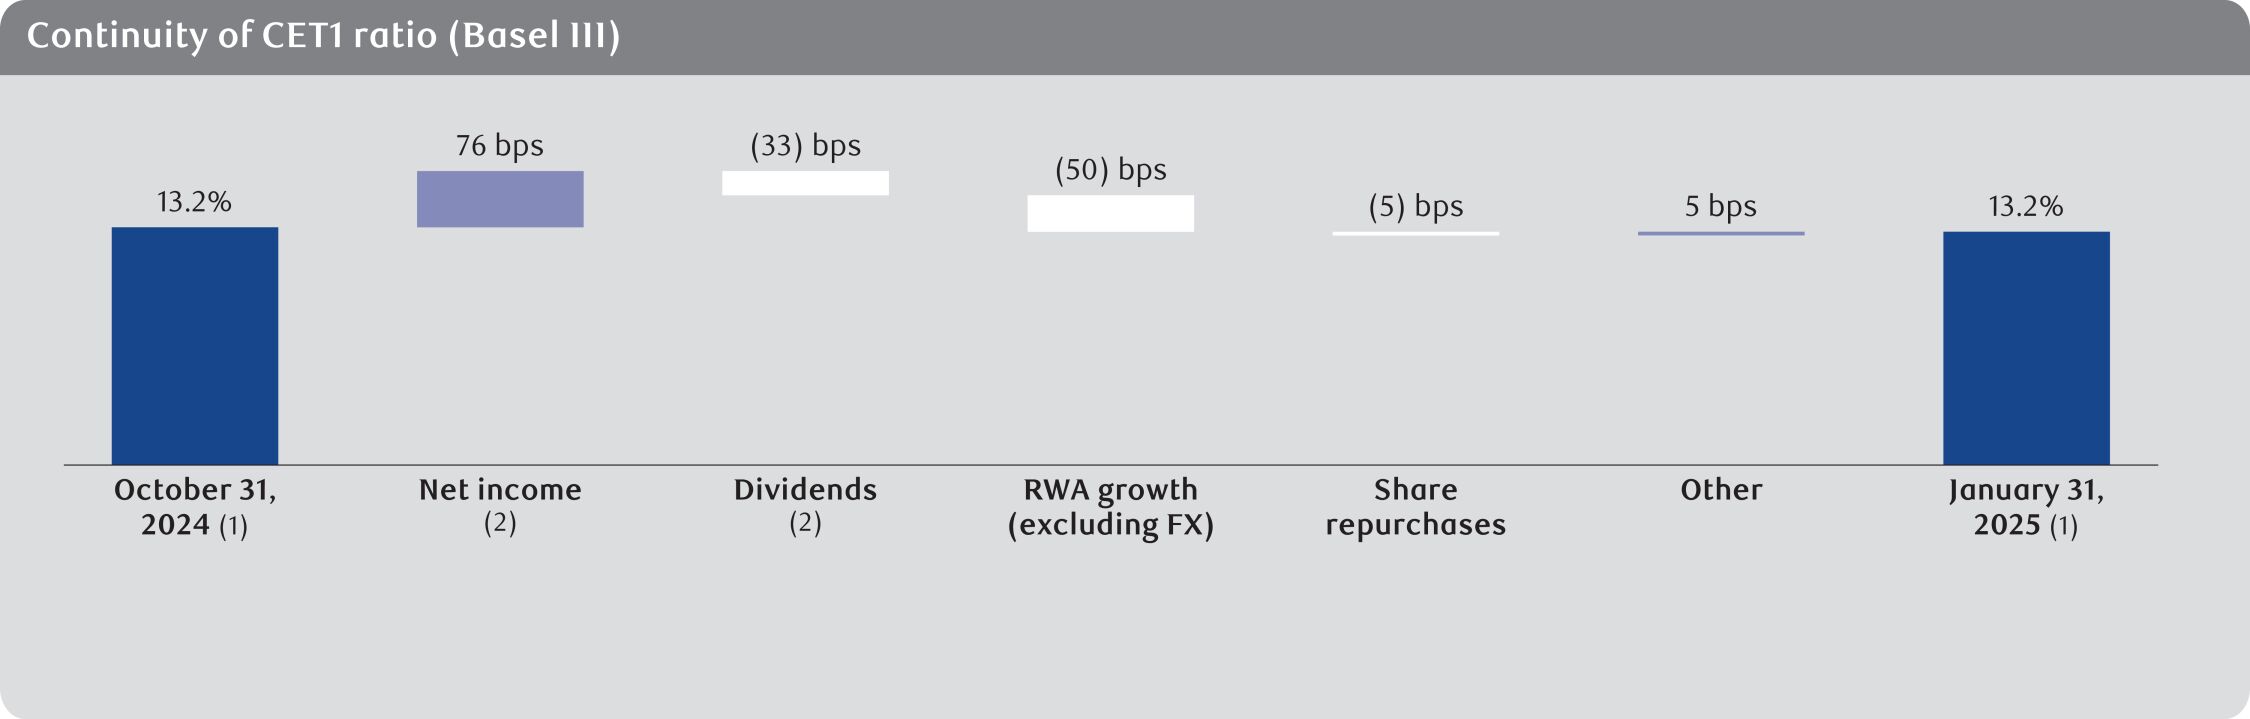
| (1) | Represents rounded figures. |
| (2) | Represents net internal capital generation of $2.9 billion or 43 bps consisting of Net income available to shareholders less common and preferred share dividends and distributions on other equity instruments. |
Our CET1 ratio of 13.2% was unchanged from last quarter, as net internal capital generation was offset by RWA growth (excluding FX).
Total RWA increased by $37 billion, mainly due to the impact of business growth primarily in corporate lending, including loan underwriting, trading related activities, and personal lending and residential mortgages in Canada. The impact of foreign exchange and net credit migration also contributed to the increase. In our CET1 ratio, the impact of foreign exchange translation on RWA is largely mitigated with economic hedges.
Our Tier 1 capital ratio of 14.6% was unchanged from last quarter, as the issuance of limited recourse capital notes (LRCNs) was offset by the factors noted above under the CET1 ratio.
Our Total capital ratio of 16.4% was unchanged from last quarter mainly reflecting the factors noted above under the Tier 1 capital ratio.
Our Leverage ratio of 4.4% was up 20 bps from last quarter, primarily due to net internal capital generation, the issuance of LRCNs and lower business-driven growth in leverage exposures.
Total leverage exposures increased by $23 billion, primarily due to the impact of foreign exchange translation, partially offset by lower business-driven leverage exposures. Business-driven leverage exposures declined mainly in repo-style transactions, partially offset by growth in trading securities, wholesale and retail loans, and cash collateral.
Our TLAC ratio of 29.8% was up 50 bps, reflecting a favourable impact from a net increase in eligible external TLAC instruments, partially offset by the factors noted above under the Total Capital ratio.
Our TLAC leverage ratio of 8.9% was up 50 bps, reflecting a favourable impact from a net increase in eligible external TLAC instruments, as well as the factors noted above under the Leverage ratio.
External TLAC instruments include long-term debt subject to conversion under the
Bail-in
regime. For further details, refer to Deposit and funding profile in the Liquidity and funding risk section.Selected capital management activity
The following table provides our selected capital management activity:
For the three months ended January 31, 2025 | ||||||||||||
| (Millions of Canadian dollars, except number of shares) | Issuance or redemption date | Number of shares | Amount | |||||||||
Tier 1 capital | ||||||||||||
Common shares activity | ||||||||||||
Issued in connection with share-based compensation plans (1) | 216 | $ | 22 | |||||||||
Purchased for cancellation (2) | (1,942 | ) | (29 | ) | ||||||||
Issuance of limited recourse capital notes (LRCNs) Series 5 (2), (3), (4) | November 1, 2024 | 1,000 | 1,396 | |||||||||
Tier 2 capital | ||||||||||||
Redemption of December 23, 2029 subordinated debentures (2), (3) | December 23, 2024 | $ | (1,500 | ) | ||||||||
Issuance of February 4, 2035 subordinated debentures (2), (3) | January 29, 2025 | $ | 1,500 | |||||||||
| (1) | Amounts include cash received for stock options exercised during the period and fair value adjustments to stock options. |
| (2) | For further details, refer to Note 10 of our Condensed Financial Statements. |
| (3) | Non-Viability Contingent Capital (NVCC) instruments. |
| (4) | For the LRCNs, the number of shares represents the number of notes issued. |
On June 10, 2024, we announced a normal course issuer bid (NCIB) to purchase up to 30 million of our common shares, commencing on June 12, 2024 and continuing until June 11, 2025, or such earlier date as we complete the repurchase of all shares permitted under the bid. For the three months ended January 31, 2025, the total number of common shares repurchased and cancelled under our NCIB program was approximately 1,942 thousand. The total cost of the shares repurchased was $338 million. Since the inception of this NCIB, the total number of common shares repurchased and cancelled was approximately 2,830 thousand, at a cost of approximately $478 million.
Royal Bank of Canada
We determine the amount and timing of purchases under the NCIB, subject to prior consultation with OSFI. Purchases may be made through the TSX, the NYSE and other designated exchanges and alternative Canadian trading systems. The price paid for repurchased shares is the prevailing market price at the time of acquisition.
On November 1, 2024, we issued US$1,000 million of LRCN Series 5 at a price of US$1,000 per note. The LRCN Series 5 bear interest at a fixed rate of 6.350% per annum until November 24, 2034. Thereafter, the interest rate on the LRCN Series 5 will reset every five years at a rate per annum equal to the prevailing
5-Year
U.S. Treasury Rate plus 2.257% until their maturity on November 24, 2084.On December 23, 2024, we redeemed all $1,500 million of our outstanding NVCC 2.88% subordinated debentures due December 23, 2029 for 100% of their principal amount plus accrued interest to, but excluding, the redemption date.
On January 29, 2025, we issued $1,500 million of NVCC subordinated debentures. The notes bear interest at a fixed rate of 4.279% per annum until February 4, 2030, and at the Daily Compounded Canadian Overnight Repo Rate Average plus 1.45% thereafter until their maturity on February 4, 2035.
Selected share data
(1)
As at January 31, 2025 | ||||||||||||
| (Millions of Canadian dollars, except number of shares and as otherwise noted) | Number of shares | Amount | Dividends declared per share | |||||||||
Common shares issued | 1,413,354 | $ | 21,006 | $ | 1.48 | |||||||
Treasury shares – common shares (2) | (476 | ) | (83 | ) | ||||||||
Common shares outstanding | 1,412,878 | $ | 20,923 | |||||||||
Stock options and awards | ||||||||||||
Outstanding | 8,077 | |||||||||||
Exercisable | 4,105 | |||||||||||
First preferred shares issued | ||||||||||||
Non-cumulative Series BD(3), (4) | 24,000 | $ | 600 | $ | 0.20 | |||||||
Non-cumulative Series BF(3), (4) | 12,000 | 300 | 0.19 | |||||||||
Non-cumulative Series BH(4) | 6,000 | 150 | 0.31 | |||||||||
Non-cumulative Series BI(4) | 6,000 | 150 | 0.31 | |||||||||
Non-cumulative Series BO(3), (4) | 14,000 | 350 | 0.37 | |||||||||
Non-cumulative Series BT(3), (4), (5) | 750 | 750 | 4.20% | |||||||||
Non-cumulative Series BU(3), (4), (5) | 750 | 750 | 7.408% | |||||||||
Non-cumulative Series BW(3), (4), (5) | 600 | 600 | 6.698% | |||||||||
Other equity instruments issued | ||||||||||||
Limited recourse capital notes Series 1 (3), (4), (6), (7) | 1,750 | 1,750 | 4.50% | |||||||||
Limited recourse capital notes Series 2 (3), (4), (6), (7) | 1,250 | 1,250 | 4.00% | |||||||||
Limited recourse capital notes Series 3 (3), (4), (6), (7) | 1,000 | 1,000 | 3.65% | |||||||||
Limited recourse capital notes Series 4 (3), (4), (6), (7) | 1,000 | 1,370 | 7.50% | |||||||||
Limited recourse capital notes Series 5 (3), (4), (6), (7) | 1,000 | 1,396 | 6.35% | |||||||||
Preferred shares and other equity instruments issued | 70,100 | 10,416 | ||||||||||
Treasury instruments – preferred shares and other equity instruments (2) | (28 | ) | (12 | ) | ||||||||
Preferred shares and other equity instruments outstanding | 70,072 | $ | 10,404 | |||||||||
Dividends on common shares | $ | 2,092 | ||||||||||
Dividends on preferred shares and distributions on other equity instruments (8) | 118 | |||||||||||
| (1) | For further details about our capital management activity, refer to Note 10 of our Condensed Financial Statements. |
| (2) | Positive amounts represent a short position and negative amounts represent a long position. |
| (3) | Dividend rate will reset every five years. |
| (4) | NVCC instruments. |
| (5) | The dividends declared per share represent the per annum dividend rate applicable to the shares issued as at the reporting date. |
| (6) | For LRCN Series, the number of shares represent the number of notes issued and the dividends declared per share represent the annual interest rate percentage applicable to the notes issued as at the reporting date. |
| (7) | In connection with the issuance of LRCN Series 1, on July 28, 2020, we issued $1,750 million of First Preferred Shares Series BQ (Series BQ); in connection with the issuance of LRCN Series 2, on November 2, 2020, we issued $1,250 million of First Preferred Shares Series BR (Series BR); in connection with the issuance of LRCN Series 3, on June 8, 2021, we issued $1,000 million of First Preferred Shares Series BS (Series BS); in connection with the issuance of LRCN Series 4 on April 24, 2024, we issued US$1,000 million of First Preferred Shares Series BV (Series BV); and in connection with the issuance of LRCN Series 5 on November 1, 2024, we issued US$1,000 million of First Preferred Shares Series BX (Series BX). The Series BQ, BR and BS preferred shares were issued at a price of $1,000 per share and the Series BV and BX preferred shares were issued at a price of US$1,000 per share. The Series BQ, BR, BS, BV and BX preferred shares were issued to a consolidated trust to be held as trust assets in connection with the LRCN series. For further details, refer to Note 19 of our 2024 Annual Consolidated Financial Statements. |
| (8) | Excludes distributions to non-controlling interests. |
As
at February 21, 2025, the number of outstanding common shares was 1,412,531,522, net of treasury shares held of 851,250, and the number of stock options and awards was 8,048,483.
42 First Quarter 2025
Royal Bank of Canada
NVCC provisions require the conversion of the capital instrument into a variable number of common shares in the event that OSFI deems a bank to be
non-viable
or a federal or provincial government in Canada publicly announces that a bank has accepted or agreed to accept a capital injection. If a NVCC trigger event were to occur, our NVCC capital instruments as at January 31, 2025, which were the preferred shares Series BD, BF, BH, BI, BO, BT, BU, BW, LRCN Series 1, LRCN Series 2, LRCN Series 3, LRCN Series 4, LRCN Series 5 and subordinated debentures due on January 27, 2026, June 30, 2030, January 28, 2033, November 3, 2031, May 3, 2032, February 1, 2033, April 3, 2034, August 8, 2034, and February 4, 2035 would be converted into common shares pursuant to an automatic conversion formula with a conversion price based on the greater of: (i) a contractual floor price of $5.00 (subject to adjustment in certain circumstances), and (ii) the current market price of our common shares at the time of the trigger event(10-day
weighted average). Based on a floor price of $5.00 and including an estimate for accrued dividends and interest, these NVCC capital instruments would convert into a maximum of approximately 6.3 billion common shares, in aggregate, which would represent a dilution impact of 81.6% based on the number of common shares outstanding as at January 31, 2025.Global systemically important banks
(G-SIBs)
13 assessment indicators(1)
The BCBS and FSB use 13 indicators in the assessment methodology for determining the systemic importance of large global banks. As noted previously, we are designated as a
G-SIB.
The following table provides the 13 indicators used in theG-SIB
assessment methodology:| (Millions of Canadian dollars) | October 31 2024 | October 31 2023 | ||||||
Cross-jurisdictional activity (2) | ||||||||
Cross-jurisdictional claims | $ | 1,023,919 | $ | 1,095,074 | ||||
Cross-jurisdictional liabilities | 794,662 | 822,122 | ||||||
Size (3) | ||||||||
Total exposures as defined for use in the Basel III leverage ratio | 2,387,168 | 2,205,597 | ||||||
Interconnectedness (4) | ||||||||
Intra-financial system assets | 198,763 | 178,747 | ||||||
Intra-financial system liabilities | 160,819 | 154,580 | ||||||
Securities outstanding | 579,357 | 453,282 | ||||||
Substitutability/financial institution infrastructure (5) | ||||||||
Payment activity | 48,863,795 | 48,548,510 | ||||||
Assets under custody | 4,482,490 | 3,903,071 | ||||||
Underwritten transactions in debt and equity markets | 288,311 | 217,449 | ||||||
Trading volume | ||||||||
Fixed income | 9,494,080 | 8,692,240 | ||||||
Equities and other securities | 6,856,367 | 5,488,456 | ||||||
Complexity (6) | ||||||||
Notional amount of over-the-counter | 34,254,579 | 26,584,099 | ||||||
Trading and investment securities | 94,511 | 79,676 | ||||||
Level 3 assets | 5,404 | 5,190 | ||||||
| (1) | The G-SIBs indicators are prepared based on the methodology prescribed in BCBS updated guidelines published in July 2018, and are disclosed in accordance with OSFI’s Global Systemically Important Banks – Public Disclosure Requirements Advisory. The indicators are based on the regulatory scope of consolidation, which excludes RBC Insurance subsidiaries, unless otherwise specified by the assessment methodology. For our 2024 standaloneG-SIB disclosure, please refer to our Regulatory Disclosures at rbc.com/investor relations. |
| (2) | Represents a bank’s level of interaction outside its domestic jurisdiction. |
| (3) | Represents the total on- andoff- balance sheet exposures of the bank, as determined by leverage ratio rules, which reflect OSFI’s implementation of the final Basel III reforms, prior to regulatory adjustments. |
| (4) | Represents transactions with other financial institutions. |
| (5) | Represents the extent to which the bank’s services could be substituted by other institutions. |
| (6) | Includes the level of complexity and volume of a bank’s trading activities represented through derivatives, trading securities, investment securities and level 3 assets. |
2024 vs. 2023
During 2024, notional amounts of over-the-counter derivatives increased primarily due to higher trading activity in interest rate and foreign exchange contracts. Assets under custody increased primarily due to market appreciation. The increase in total exposures as defined for use in the Basel III leverage ratio was mainly driven by the impact of the acquisition of HSBC Canada and business growth in retail and wholesale loans. Other movements primarily reflect normal course of business activity.
Royal Bank of Canada
Accounting and control matters |
Summary of accounting policies and estimates |
Our Condensed Financial Statements are presented in compliance with International Accounting Standard (IAS) 34. Our material accounting policies are described in Note 2 of our audited 2024 Annual Consolidated Financial Statements.
Interim Financial Reporting
Future changes in accounting policies and disclosures
Future changes in accounting policies and disclosures that are not yet effective for us are described in Note 2 of our audited 2024 Annual Consolidated Financial Statements.
Controls and procedures |
Disclosure controls and procedures
As of January 31, 2025, management evaluated, under the supervision of and with the participation of the President and Chief Executive Officer and the Chief Financial Officer, the effectiveness of our disclosure controls and procedures as defined under rules adopted by the Canadian securities regulatory authorities and the U.S. SEC. Based on that evaluation, the President and Chief Executive Officer and the Chief Financial Officer concluded that our disclosure controls and procedures were effective as of January 31, 2025.
Internal control over financial reporting
No changes were made in our internal control over financial reporting during the quarter ended January 31, 2025 that have materially affected, or are reasonably likely to materially affect, our internal control over financial reporting.
Related party transactions |
In the ordinary course of business, we provide normal banking services and operational services, and enter into other transactions with associated and other related corporations, including our joint venture entities, on terms similar to those offered to
non-related
parties. We grant loans to directors, officers and other employees at rates normally accorded to preferred clients. In addition, we offer deferred share and other plans tonon-employee
directors, executives and certain other key employees. For further information, refer to Notes 12 and 25 of our audited 2024 Annual Consolidated Financial Statements.44 First Quarter 2025
Royal Bank of Canada
Glossary |
Adjusted Results and Measures
We believe that providing adjusted results as well as certain measures and ratios enhances comparability with prior periods and enables readers to better assess trends in the underlying businesses. For further details, including a reconciliation, refer to the Key performance and
non-GAAP
measures section.| • | Adjusted effective income tax rate |
| • | Adjusted income before income taxes |
| • | Adjusted income taxes |
| • | Adjusted net income |
| • | Adjusted net income available to common shareholders |
| • | Adjusted non-interest expensenon-interest expense excluding the impact of specified items and amortization of acquisition-related intangibles. |
| • | Adjusted total revenue |
Acceptances
A bill of exchange or negotiable instrument drawn by the borrower for payment at maturity and accepted by a bank. The acceptance constitutes a guarantee of payment by the bank and can be traded in the money market. The bank earns a “stamping fee” for providing this guarantee.
Allowance for credit losses (ACL)
The amount deemed adequate by management to absorb expected credit losses as at the balance sheet date. The allowance is established for all financial assets subject to impairment assessment, including certain loans, debt securities, customers’ liability under acceptances, financial guarantees, and undrawn loan commitments. The allowance is changed by the amount of provision for credit losses recorded, which is charged to income, and decreased by the amount of write-offs net of recoveries in the period.
ACL on loans ratio
ACL on loans ratio is calculated as ACL on loans as a percentage of total loans and acceptances.
Asset-backed securities (ABS)
Securities created through the securitization of a pool of assets, for example auto loans or credit card loans.
Assets under administration (AUA)
Assets administered by us, which are beneficially owned by clients, unless otherwise noted. Services provided in respect of assets under administration are of an administrative nature, including safekeeping, collecting investment income, settling purchase and sale transactions, and record keeping.
Assets under management (AUM)
Assets managed by us, which are beneficially owned by clients, unless otherwise noted. Services provided in respect of assets under management include the selection of investments and the provision of investment advice. We have assets under management that are also administered by us and included in assets under administration.
Attributed capital
Attributed capital to our business segments is based on the Basel III regulatory capital and leverage requirements other than for our insurance segment for which we attribute capital based only on economic capital.
Auction rate securities (ARS)
Debt securities whose interest rates are regularly reset through an auction process.
Average earning assets, net
Average earning assets include interest-bearing deposits with other banks, securities, net of applicable allowance, assets purchased under reverse repurchase agreements and securities borrowed, loans, net of allowance, cash collateral and margin deposits. Insurance assets, and all other assets not specified are excluded. The averages are based on the daily balances for the period.
Basis point (bp)
One
one-hundredth
of a percentage point (.01%).Collateral
Assets pledged as security for a loan or other obligation. Collateral can take many forms, such as cash, highly rated securities, property, inventory, equipment and receivables.
Collateralized debt obligation (CDO)
Securities with multiple tranches that are issued by structured entities and collateralized by debt obligations including bonds and loans. Each tranche offers a varying degree of risk and return so as to meet investor demand.
Commercial mortgage-backed securities (CMBS)
Securities created through the securitization of commercial mortgages.
Commitments to extend credit
Unutilized amount of credit facilities available to clients either in the form of loans, bankers’ acceptances and other
on-balance
sheet financing, or throughoff-balance
sheet products such as guarantees and letters of credit.Common Equity Tier 1 (CET1) capital
A regulatory Basel III capital measure comprised mainly of common shareholders’ equity less regulatory deductions and adjustments for goodwill and intangibles, defined benefit pension fund assets, shortfall in allowances and other specified items. The CET1 capital is calculated in accordance with OSFI’s CAR guideline. For more details, refer to the Capital management section.
Common Equity Tier 1 capital ratio
A risk-based capital measure calculated as CET1 capital divided by risk-weighted assets. The CET1 ratio is calculated in accordance with OSFI’s CAR guideline.
Contractual service margin (CSM)
For insurance contracts, the CSM represents the unearned profit (net inflows) for providing insurance coverage. For reinsurance contracts held, the CSM represents the net cost or net gain of purchasing reinsurance.
Covered bonds
Full recourse
on-balance
sheet obligations issued by banks and credit institutions that are fully collateralized by assets over which investors enjoy a priority claim in the event of an issuer’s insolvency.Credit default swaps (CDS)
A derivative contract that provides the purchaser with a
one-time
payment should the referenced entity/entities default (or a similar triggering event occur).Derivative
A contract between two parties, which requires little or no initial investment and where payments between the parties are dependent upon the movements in price of an underlying instrument, index or financial rate. Examples of derivatives include swaps, options, forward rate agreements and futures. The notional amount of the derivative is the contract amount used as a reference point to calculate the payments to be exchanged between the two parties, and the notional amount itself is generally not exchanged by the parties.
Dividend payout ratio
Common dividends as a percentage of net income available to common shareholders.
Dividend yield
Dividends per common share divided by the average of the high and low share price in the relevant period.
Earnings per share (EPS), basic
Calculated as net income available to common shareholders divided by the average number of shares outstanding. Adjusted EPS, basic is calculated in the same manner, using adjusted net income available to common shareholders.
Earnings per share (EPS), diluted
Calculated as net income available to common shareholders divided by the average number of shares outstanding adjusted for the dilutive effects of stock options and other convertible securities. Adjusted EPS, diluted is calculated in the same manner, using adjusted net income available to common shareholders.
Efficiency ratio
Non-interest
expense as a percentage of total revenue. Adjusted efficiency ratio is calculated in the same manner, using adjustednon-interest
expense and adjusted total revenue.Expected credit losses
The difference between the contractual cash flows due to us in accordance with the relevant contractual terms and the cash flows that we expect to receive, discounted to the balance sheet date.
Fair value
Fair value of a financial instrument is the price that would be received to sell an asset or paid to transfer a liability in an orderly transaction between market participants at the measurement date.
Royal Bank of Canada
Funding valuation adjustment
Funding valuation adjustments are calculated to incorporate cost and benefit of funding in the valuation of uncollateralized and under-collateralized OTC derivatives. Future expected cash flows of these derivatives are discounted to reflect the cost and benefit of funding the derivatives by using a funding curve, implied volatilities and correlations as inputs.
Guarantees and standby letters of credit
These primarily represent irrevocable assurances that a bank will make payments in the event that its client cannot meet its financial obligations to third parties. Certain other guarantees, such as bid and performance bonds, represent
non-financial
undertakings.Hedge
A risk management technique used to mitigate exposure from market, interest rate or foreign currency exchange risk arising from normal banking operations. The elimination or reduction of such exposure is accomplished by establishing offsetting positions. For example, assets denominated in foreign currencies can be offset with liabilities in the same currencies or through the use of foreign exchange hedging instruments such as futures, options or foreign exchange contracts.
Hedge funds
A type of investment fund, marketed to accredited high net worth investors, that is subject to limited regulation and restrictions on its investments compared to retail mutual funds, and that often utilize aggressive strategies such as selling short, leverage, program trading, swaps, arbitrage and derivatives.
High-quality liquid assets (HQLA)
HQLA are cash or assets that can be converted into cash quickly through sales (or by being pledged as collateral) with no significant loss of value.
Impaired loans
Loans are classified as impaired when there has been a deterioration of credit quality to the extent that management no longer has reasonable assurance of timely collection of the full amount of principal and interest in accordance with the contractual terms of the loan agreement. Credit card balances are not classified as impaired as they are directly written off after payments are 180 days past due.
Insurance contracts
Contracts under which we accept significant insurance risk from a policyholder by agreeing to compensate the policyholder if a specified uncertain future event adversely affects the policyholder. Insurance contracts also include reinsurance contracts issued by us to compensate another company for claims arising from underlying insurance contracts issued by that other company.
Insurance investment result
Calculated as Net investment income from the Insurance segment, Insurance finance income (expense) from insurance contracts and Reinsurance finance income (expense) from reinsurance contracts held. Net investment income primarily comprises interest and dividend income and net gains (losses) on financial instruments and derivatives relating to the Insurance segment. Insurance and reinsurance finance income (expense) represents the net effect of and changes in the time value of money and financial risks on insurance contracts and reinsurance contracts held, respectively.
Insurance service result
Calculated as Insurance revenue less Insurance service expense from insurance contracts and Net income (expense) from reinsurance contracts held. Insurance revenue represents the revenue recognized in the period as we provide insurance services for the groups of insurance contracts. Insurance service expense represents the costs incurred in providing insurance services in the period, which includes incurred claims and other directly attributable expenses, allocation of acquisition costs, changes relating to past or current services and changes in loss components of onerous groups of contracts. Net income (expense) from reinsurance contracts held represents the amounts recovered from the reinsurers less the allocation of premiums paid on reinsurance contracts held.
International Financial Reporting Standards (IFRS)
IFRS are principles-based standards, interpretations and the framework adopted by the International Accounting Standards Board.
Leverage ratio
A Basel III regulatory measure, the ratio divides Tier 1 capital by the leverage exposure measure. The leverage ratio is a
non-risk
based measure and is calculated in accordance with OSFI’s LR guideline.Leverage ratio exposure
The leverage ratio exposure is calculated in accordance with OSFI’s LR guideline and is defined as the sum of total assets plus
off-balance
sheet items after certain adjustments.Liquidity Coverage Ratio (LCR)
The LCR is a Basel III standard that aims to ensure that an institution has an adequate stock of unencumbered HQLA that consists of cash or assets that can be converted into cash at little or no loss of value in private markets, to meet its liquidity needs for a 30 calendar day liquidity stress scenario. The LCR is calculated in accordance with OSFI’s LAR guideline.
Loan-to-value
Calculated based on the total facility amount for the residential mortgage and RBC Homeline Plan product divided by the value of the related residential property.
Master netting agreement
An agreement between us and a counterparty designed to reduce the credit risk of multiple derivative transactions through the creation of a legal right of offset of exposure in the event of a default.
Net interest income
The difference between what is earned on assets such as loans and securities and what is paid on liabilities such as deposits and subordinated debentures.
Net interest margin (NIM) on average earning assets, net
Calculated as net interest income divided by average earning assets, net.
Net Stable Funding Ratio (NSFR)
The NSFR is a Basel III standard that requires institutions to maintain a stable funding profile defined as available amount of stable funding (ASF) in relation to the composition of their assets and
off-balance
sheet activities defined as required amount of stable funding (RSF). The ratio should be at least equal to 100% on an ongoing basis. The NSFR is calculated in accordance with OSFI’s LAR guideline.Normal course issuer bid (NCIB)
A program for the repurchase of our own shares for cancellation through a stock exchange that is subject to the various rules of the relevant stock exchange and securities commission.
Notional amount
The contract amount used as a reference point to calculate payments for derivatives.
Off-balance
sheet financial instrumentsA variety of arrangements offered to clients, which include credit derivatives, written put options, backstop liquidity facilities, stable value products, financial standby letters of credit, performance guarantees, credit enhancements, mortgage loans sold with recourse, commitments to extend credit, securities lending, documentary and commercial letters of credit, sponsor member guarantees, securities lending indemnifications and indemnifications.
Office of the Superintendent of Financial Institutions Canada (OSFI)
The primary regulator of federally chartered financial institutions and federally administered pension plans in Canada. OSFI’s mission is to safeguard policyholders, depositors and pension plan members from undue loss.
Operating leverage
The difference between our revenue growth rate and
non-interest
expense growth rate.Options
A contract or a provision of a contract that gives one party (the option holder) the right, but not the obligation, to perform a specified transaction with another party (the option issuer or option writer) according to specified terms.
Provision for credit losses (PCL)
The amount charged to income necessary to bring the allowance for credit losses to a level determined appropriate by management. This includes provisions on performing and impaired financial assets.
PCL on loans ratio
PCL on loans ratio is calculated using PCL on loans as a percentage of average net loans and acceptances.
RBC Homeline Plan products
This is comprised of residential mortgages and secured personal loans whereby the borrower pledges real estate as collateral.
Reinsurance contracts held
Contracts under which we transfer significant insurance risk to a reinsurer that compensates us for claims relating to underlying insurance contracts issued by us and are accounted for separately from the underlying insurance contracts to which they relate.
Repurchase agreements
These involve the sale of securities for cash and the simultaneous repurchase of the securities for value at a later date. These transactions normally do not constitute economic sales and therefore are treated as collateralized financing transactions.
Return on common equity (ROE)
Net income available to common shareholders, expressed as a percentage of average common equity. ROE is based on actual balances of average common equity before rounding. Adjusted ROE is calculated in the same manner, using adjusted net income available to common shareholders.
46 First Quarter 2025
Royal Bank of Canada
Reverse repurchase agreements
These involve the purchase of securities for cash and the simultaneous sale of the securities for value at a later date. These transactions normally do not constitute economic sales and therefore are treated as collateralized financing transactions.
Risk-weighted assets (RWA)
Assets adjusted by a regulatory risk-weight factor to reflect the riskiness of
on-
andoff-balance
sheet exposures. Certain assets are not risk-weighted, but deducted from capital. The calculation is defined by OSFI’s CAR guideline. For more details, refer to the Capital management section.Securities lending
Transactions in which the owner of securities agrees to lend it under the terms of a prearranged contract to a borrower for a fee. Collateral for the loan consists of either high quality securities or cash and collateral value must be at least equal to the market value of the loaned securities. Borrowers pay a negotiated fee for loans collateralized by securities, whereas for cash collateral lenders pay borrowers interest at a negotiated rate and reinvest the cash collateral to earn a return. An intermediary such as a bank often acts as agent lender for the owner of the security in return for a share of the revenue earned by the owner from lending securities. Most often, agent lenders indemnify the owner against the risk of the borrower’s failure to redeliver the loaned securities – counterparty credit risk if a borrower defaults and market risk if the value of the
non-cash
collateral declines. The agent lender does not indemnify against the investment risk ofre-investing
cash collateral which is borne by the owner.Securities sold short
A transaction in which the seller sells securities and then borrows the securities in order to deliver them to the purchaser upon settlement. At a later date, the seller buys identical securities in the market to replace the borrowed securities.
Securitization
The process by which various financial assets are packaged into newly issued securities backed by these assets.
Standardized Approach (SA) for credit risk
Risk weights prescribed by OSFI are used to calculate RWA for the credit risk exposures. Credit assessments by OSFI-recognized external credit rating agencies of Standard & Poor’s Financial Services LLP; Moody’s Investor Service, Inc.; Fitch Ratings, Inc.; and DBRS Limited are used to risk-weight our Sovereign and Bank exposures based on the standards and guidelines issued by OSFI.
Structured entities
A structured entity is an entity in which voting or similar rights are not the dominant factor in deciding who controls the entity, such as when the activities that significantly affect the entity’s returns are directed by means of contractual arrangements. Structured entities often have restricted activities, narrow and well defined objectives, insufficient equity to finance their activities, and financing in the form of multiple contractually-linked instruments.
Taxable equivalent basis (teb)
Income from certain specified tax advantaged sources (U.S. tax credit investment business as well as eligible Canadian taxable corporate dividends received on or before December 31, 2023) is increased to a level that would make it comparable to income from taxable sources. There is an offsetting adjustment in the tax provision, thereby generating the same
after-tax
net income.Tier 1 capital and Tier 1 capital ratio
Tier 1 capital comprises predominantly of CET1 capital, with additional Tier 1 items such as preferred shares, limited recourse capital notes and
non-controlling
interests in subsidiaries Tier 1 instruments. The Tier 1 capital ratio is calculated in accordance with OSFI’s CAR guideline by dividing Tier 1 capital by risk-weighted assets.Tier 2 capital
Tier 2 capital consists mainly of subordinated debentures that meet certain criteria, certain loan loss allowances and
non-controlling
interests in subsidiaries’ Tier 2 instruments.Total loss absorbing capacity (TLAC)
The aggregate of Tier 1 capital, Tier 2 capital, and external TLAC instruments which allow conversion in whole or in part into common shares under the Canada Deposit Insurance Corporation Act and meet all of the eligibility criteria under the guideline.
TLAC ratio
The risk-based TLAC ratio is defined as TLAC divided by total risk-weighted assets. The TLAC ratio is calculated in accordance with OSFI’s TLAC guideline.
TLAC leverage ratio
The TLAC leverage ratio is defined as TLAC divided by the leverage ratio exposure. The TLAC leverage ratio is calculated in accordance with OSFI’s TLAC guideline.
Total capital and total capital ratio
Total capital is defined as the total of Tier 1 and Tier 2 capital. The total capital ratio is calculated in accordance with OSFI’s CAR guideline by dividing total capital by risk-weighted assets.
Tranche
A security class created whereby the risks and returns associated with a pool of assets are packaged into several classes of securities offering different risk and return profiles from those of the underlying asset pool. Tranches are typically rated by ratings agencies, and reflect both the credit quality of underlying collateral as well as the level of protection based on the tranches’ relative subordination.
Unattributed capital
Unattributed capital represents common equity in excess of common equity attributed to our business segments and is reported in the Corporate Support segment.
Value-at-Risk
A generally accepted risk-measurement concept that uses statistical models based on historical information to estimate within a given level of confidence the maximum loss in market value we would experience in our financial portfolio from an adverse
one-day
movement in market rates and prices.Royal Bank of Canada
Enhanced Disclosure Task Force recommendations index |
We aim to present transparent, high-quality risk disclosures by providing disclosures in our 2024 Annual Report, Q1 2025 Report to Shareholders (RTS), Supplementary Financial Information package (SFI), and Pillar 3 Report, in accordance with recommendations from the FSB’s Enhanced Disclosure Task Force (EDTF). Information within the SFI and Pillar 3 Report is not and should not be considered incorporated by reference into our Q1 2025 Report to Shareholders.
The following index summarizes our disclosure by EDTF recommendation:
Location of disclosure | ||||||||||
Type of Risk | Recommendation | Disclosure | RTS page | Annual Report page | SFI page | |||||
General | 1 | Table of contents for EDTF risk disclosure | 47 | 140 | 1 | |||||
| 2 | Define risk terminology and measures | 69-75, 137-139 | – | |||||||
| 3 | Top and emerging risks | 66-69 | – | |||||||
| 4 | New regulatory ratios | 38-40 | 114-120 | – | ||||||
Risk governance, risk management and business model | 5 | Risk management organization | 69-75 | – | ||||||
| 6 | Risk culture | 69-75 | – | |||||||
| 7 | Risk in the context of our business activities | 124 | – | |||||||
| 8 | Stress testing | 73, 85 | – | |||||||
Capital adequacy and risk-weighted assets (RWA) | 9 | Minimum Basel III capital ratios and Domestic systemically important bank surcharge | 38 | 114-120 | – | |||||
| 10 | Composition of capital and reconciliation of the accounting balance sheet to the regulatory balance sheet | – | * | |||||||
| 11 | Flow statement of the movements in regulatory capital | – | 19 | |||||||
| 12 | Capital strategic planning | 114-120 | – | |||||||
| 13 | RWA by business segments | – | 20 | |||||||
| 14 | Analysis of capital requirement, and related measurement model information | 75-79 | * | |||||||
| 15 | RWA credit risk and related risk measurements | – | * | |||||||
| 16 | Movement of RWA by risk type | – | 20 | |||||||
| 17 | Basel back-testing | 72, 75-77 | 31 | |||||||
Liquidity | 18 | Quantitative and qualitative analysis of our liquidity reserve | 29 | 92-93, 98-99 | – | |||||
Funding | 19 | Encumbered and unencumbered assets by balance sheet category, and contractual obligations for rating downgrades | 30, 32 | 94, 97 | – | |||||
| 20 | Maturity analysis of consolidated total assets, liabilities and off-balance sheet commitments analyzed by remaining contractual maturity at the balance sheet date | 36-37 | 101-102 | – | ||||||
| 21 | Sources of funding and funding strategy | 30-32 | 94-96 | – | ||||||
Market risk | 22 | Relationship between the market risk measures for trading and non-trading portfolios and the balance sheet | 27-28 | 89-90 | – | |||||
| 23 | Decomposition of market risk factors | 25-26 | 85-90 | – | ||||||
| 24 | Market risk validation and back-testing | 85 | – | |||||||
| 25 | Primary risk management techniques beyond reported risk measures and parameters | 85-88 | – | |||||||
Credit risk | 26 | Bank’s credit risk profile | 21-24 | 75-85, 187-194 | 21-31* | |||||
Quantitative summary of aggregate credit risk exposures that reconciles to the balance sheet | 60-64 | 131-136 | * | |||||||
| 27 | Policies for identifying impaired loans | 77-79, 126, 157-160 | – | |||||||
| 28 | Reconciliation of the opening and closing balances of impaired loans and impairment allowances during the year | – | 23, 28 | |||||||
| 29 | Quantification of gross notional exposure for over-the-counter | 80 | 32 | |||||||
| 30 | Credit risk mitigation, including collateral held for all sources of credit risk | 78-79 | * | |||||||
Other | 31 | Other risk types | 104-113 | – | ||||||
| 32 | Publicly known risk events | 108-109, 236-237 | – | |||||||
| * | These disclosure requirements are satisfied or partially satisfied by disclosures provided in our Pillar 3 Report for the quarter ended January 31, 2025 and for the year ended October 31, 2024. |
48 First Quarter 2025
Royal Bank of Canada
Interim Condensed Consolidated Financial Statements |
Interim Condensed Consolidated Balance Sheets |
| As at | ||||||||
| (Millions of Canadian dollars) | January 31 2025 | October 31 2024 | ||||||
Assets | ||||||||
Cash and due from banks | $ | 71,200 | $ | 56,723 | ||||
Interest-bearing deposits with banks | 47,924 | 66,020 | ||||||
Securities | ||||||||
| Trading | 189,416 | 183,300 | ||||||
Investment, net of applicable allowance (Note 4) | 298,609 | 256,618 | ||||||
488,025 | 439,918 | |||||||
Assets purchased under reverse repurchase agreements and securities borrowed | 280,451 | 350,803 | ||||||
Loans (Note 5) | ||||||||
| Retail | 633,400 | 626,978 | ||||||
| Wholesale | 379,250 | 360,439 | ||||||
1,012,650 | 987,417 | |||||||
Allowance for loan losses (Note 5) | (6,600 | ) | (6,037 | ) | ||||
1,006,050 | 981,380 | |||||||
Other | ||||||||
| Customers’ liability under acceptances | 74 | 35 | ||||||
| Derivatives | 153,686 | 150,612 | ||||||
| Premises and equipment | 6,878 | 6,852 | ||||||
| Goodwill | 19,578 | 19,286 | ||||||
| Other intangibles | 7,712 | 7,798 | ||||||
| Other assets | 109,448 | 92,155 | ||||||
297,376 | 276,738 | |||||||
Total assets | $ | 2,191,026 | $ | 2,171,582 | ||||
Liabilities and equity | ||||||||
Deposits (Note 6) | ||||||||
| Personal | $ | 535,614 | $ | 522,139 | ||||
| Business and government | 871,259 | 839,670 | ||||||
| Bank | 35,067 | 47,722 | ||||||
1,441,940 | 1,409,531 | |||||||
Other | ||||||||
| Acceptances | 74 | 35 | ||||||
| Obligations related to securities sold short | 45,460 | 35,286 | ||||||
| Obligations related to assets sold under repurchase agreements and securities loaned | 274,592 | 305,321 | ||||||
| Derivatives | 161,590 | 163,763 | ||||||
| Insurance contract liabilities | 23,477 | 22,231 | ||||||
| Other liabilities | 96,960 | 94,677 | ||||||
602,153 | 621,313 | |||||||
Subordinated debentures (Note 10 ) | 13,670 | 13,546 | ||||||
Total liabilities | 2,057,763 | 2,044,390 | ||||||
Equity attributable to shareholders | ||||||||
Preferred shares and other equity instruments (Note 10 ) | 10,404 | 9,031 | ||||||
Common shares (Note 10 ) | 20,923 | 20,952 | ||||||
| Retained earnings | 90,754 | 88,608 | ||||||
| Other components of equity | 11,086 | 8,498 | ||||||
133,167 | 127,089 | |||||||
Non-controlling interests | 96 | 103 | ||||||
Total equity | 133,263 | 127,192 | ||||||
Total liabilities and equity | $ | 2,191,026 | $ | 2,171,582 | ||||
The accompanying notes are an integral part of these Interim Condensed Consolidated Financial Statements.
Royal Bank of Canada
Interim Condensed Consolidated Statements of Income |
| For the three months ended | ||||||||
| (Millions of Canadian dollars, except per share amounts) | January 31 2025 | January 31 2024 | ||||||
Interest and dividend income (Note 3) | ||||||||
| Loans | $ | 14,330 | $ | 12,269 | ||||
| Securities | 4,832 | 4,554 | ||||||
| Assets purchased under reverse repurchase agreements and securities borrowed | 5,924 | 7,221 | ||||||
| Deposits and other | 1,369 | 1,565 | ||||||
26,455 | 25,609 | |||||||
Interest expense (Note 3) | ||||||||
| Deposits and other | 11,816 | 11,305 | ||||||
| Other liabilities | 6,526 | 7,786 | ||||||
| Subordinated debentures | 165 | 186 | ||||||
18,507 | 19,277 | |||||||
Net interest income | 7,948 | 6,332 | ||||||
Non-interest income | ||||||||
Insurance service result (Note 7) | 286 | 187 | ||||||
Insurance investment result (Note 7) | 82 | 141 | ||||||
| Trading revenue | 1,195 | 804 | ||||||
| Investment management and custodial fees | 2,667 | 2,185 | ||||||
| Mutual fund revenue | 1,236 | 1,030 | ||||||
| Securities brokerage commissions | 471 | 388 | ||||||
| Service charges | 612 | 554 | ||||||
| Underwriting and other advisory fees | 674 | 606 | ||||||
| Foreign exchange revenue, other than trading | 318 | 262 | ||||||
| Card service revenue | 317 | 326 | ||||||
| Credit fees | 435 | 395 | ||||||
| Net gains on investment securities | 55 | 70 | ||||||
| Income (loss) from joint ventures and associates | 19 | 12 | ||||||
| Other | 424 | 193 | ||||||
8,791 | 7,153 | |||||||
Total revenue | 16,739 | 13,485 | ||||||
Provision for credit losses (Notes 4 and 5) | 1,050 | 813 | ||||||
Non-interest expense | ||||||||
Human resources (Note 8 ) | 5,987 | 5,163 | ||||||
| Equipment | 681 | 619 | ||||||
| Occupancy | 429 | 407 | ||||||
| Communications | 327 | 321 | ||||||
| Professional fees | 502 | 624 | ||||||
| Amortization of other intangibles | 435 | 352 | ||||||
| Other | 895 | 838 | ||||||
9,256 | 8,324 | |||||||
Income before income taxes | 6,433 | 4,348 | ||||||
Income taxes (Note 9) | 1,302 | 766 | ||||||
Net income | $ | 5,131 | $ | 3,582 | ||||
Net income attributable to: | ||||||||
| Shareholders | $ | 5,129 | $ | 3,580 | ||||
Non-controlling interests | 2 | 2 | ||||||
$ | 5,131 | $ | 3,582 | |||||
Basic earnings per share (in dollars) (Note 1 1 ) | $ | 3.54 | $ | 2.50 | ||||
Diluted earnings per share (in dollars) (Note 1 1 ) | 3.54 | 2.50 | ||||||
Dividends per common share (in dollars) | 1.48 | 1.38 | ||||||
The accompanying notes are an integral part of these Interim Condensed Consolidated Financial Statements.
50 First Quarter 2025
Royal Bank of Canada
Interim Condensed Consolidated Statements of Comprehensive Income |
| For the three months ended | ||||||||
| (Millions of Canadian dollars) | January 31 2025 | January 31 2024 | ||||||
Net income | $ | 5,131 | $ | 3,582 | ||||
Other comprehensive income (loss), net of taxes | ||||||||
Items that will be reclassified subsequently to income: | ||||||||
Net change in unrealized gains (losses) on debt securities and loans at fair value through other comprehensive income | ||||||||
| Net unrealized gains (losses) on debt securities and loans at fair value through other comprehensive income | 184 | 788 | ||||||
| Provision for credit losses recognized in income | (2 | ) | – | |||||
| Reclassification of net losses (gains) on debt securities and loans at fair value through other comprehensive income to income | (61 | ) | (49 | ) | ||||
121 | 739 | |||||||
Foreign currency translation adjustments | ||||||||
| Unrealized foreign currency translation gains (losses) | 3,634 | (2,151 | ) | |||||
| Net foreign currency translation gains (losses) from hedging activities | (1,671 | ) | 922 | |||||
| Reclassification of losses (gains) on net investment hedging activities to income | – | 1 | ||||||
1,963 | (1,228 | ) | ||||||
Net change in cash flow hedges | ||||||||
| Net gains (losses) on derivatives designated as cash flow hedges | 668 | (602 | ) | |||||
| Reclassification of losses (gains) on derivatives designated as cash flow hedges to income | (159 | ) | (181 | ) | ||||
509 | (783 | ) | ||||||
Items that will not be reclassified subsequently to income: | ||||||||
Remeasurement gains (losses) on employee benefit plans (Note 8 ) | 38 | 42 | ||||||
| Net gains (losses) from fair value changes due to credit risk on financial liabilities designated at fair value through profit or loss | (508 | ) | (701 | ) | ||||
| Net gains (losses) on equity securities designated at fair value through other comprehensive income | 14 | 55 | ||||||
(456 | ) | (604 | ) | |||||
Total other comprehensive income (loss), net of taxes | 2,137 | (1,876 | ) | |||||
Total comprehensive income (loss) | $ | 7,268 | $ | 1,706 | ||||
Total comprehensive income attributable to: | ||||||||
| Shareholders | $ | 7,261 | $ | 1,707 | ||||
Non-controlling interests | 7 | (1 | ) | |||||
$ | 7,268 | $ | 1,706 | |||||
The income tax effect on the Interim Condensed Consolidated Statements of Comprehensive Income is shown in the table below.
| For the three months ended | ||||||||
| (Millions of Canadian dollars) | January 31 2025 | January 31 2024 | ||||||
Income taxes on other comprehensive income | ||||||||
| Net unrealized gains (losses) on debt securities and loans at fair value through other comprehensive income | $ | 121 | $ | 303 | ||||
| Provision for credit losses recognized in income | – | – | ||||||
| Reclassification of net losses (gains) on debt securities and loans at fair value through other comprehensive income to income | (18 | ) | (16 | ) | ||||
| Unrealized foreign currency translation gains (losses) | 19 | (17 | ) | |||||
| Net foreign currency translation gains (losses) from hedging activities | (620 | ) | 340 | |||||
| Reclassification of losses (gains) on net investment hedging activities to income | – | – | ||||||
| Net gains (losses) on derivatives designated as cash flow hedges | 264 | (262 | ) | |||||
| Reclassification of losses (gains) on derivatives designated as cash flow hedges to income | (60 | ) | (68 | ) | ||||
| Remeasurement gains (losses) on employee benefit plans | 14 | 22 | ||||||
| Net gains (losses) from fair value changes due to credit risk on financial liabilities designated at fair value through profit or loss | (194 | ) | (271 | ) | ||||
| Net gains (losses) on equity securities designated at fair value through other comprehensive income | 4 | 20 | ||||||
| Total income tax expenses (recoveries) | $ | (470 | ) | $ | 51 | |||
The accompanying notes are an integral part of these Interim Condensed Consolidated Financial Statements.
Royal Bank of Canada
Interim Condensed Consolidated Statements of Changes in Equity |
For the three months ended January 31, 2025 | ||||||||||||||||||||||||||||||||||||||||||||||||
Other components of equity | ||||||||||||||||||||||||||||||||||||||||||||||||
| (Millions of Canadian dollars) | Preferred shares and other equity instruments | Common shares | Treasury – preferred shares and other equity instruments | Treasury – common shares | Retained earnings | FVOCI securities and loans | Foreign currency translation | Cash flow hedges | Total other components of equity | Equity attributable to shareholders | Non-controlling interests | Total equity | ||||||||||||||||||||||||||||||||||||
Balance at beginning of period | $ | 9,020 | $ | 21,013 | $ | 11 | $ | (61 | ) | $ | 88,608 | $ | (897 | ) | $ | 7,128 | $ | 2,267 | $ | 8,498 | $ | 127,089 | $ | 103 | $ | 127,192 | ||||||||||||||||||||||
| Changes in equity | ||||||||||||||||||||||||||||||||||||||||||||||||
| Issues of share capital and other equity instruments | 1,396 | 22 | – | – | (10 | ) | – | – | – | – | 1,408 | – | 1,408 | |||||||||||||||||||||||||||||||||||
| Common shares purchased for cancellation | – | (29 | ) | – | – | (309 | ) | – | – | – | – | (338 | ) | – | (338 | ) | ||||||||||||||||||||||||||||||||
| Redemption of preferred shares and other equity instruments | – | – | – | – | – | – | – | – | – | – | – | – | ||||||||||||||||||||||||||||||||||||
| Sales of treasury shares and other equity instruments | – | – | 510 | 1,594 | – | – | – | – | – | 2,104 | – | 2,104 | ||||||||||||||||||||||||||||||||||||
| Purchases of treasury shares and other equity instruments | – | – | (533 | ) | (1,616 | ) | – | – | – | – | – | (2,149 | ) | – | (2,149 | ) | ||||||||||||||||||||||||||||||||
| Share-based compensation awards | – | – | – | – | 13 | – | – | – | – | 13 | – | 13 | ||||||||||||||||||||||||||||||||||||
| Dividends on common shares | – | – | – | – | (2,092 | ) | – | – | – | – | (2,092 | ) | – | (2,092 | ) | |||||||||||||||||||||||||||||||||
| Dividends on preferred shares and distributions on other equity instruments | – | – | – | – | (118 | ) | – | – | – | – | (118 | ) | (14 | ) | (132 | ) | ||||||||||||||||||||||||||||||||
| Other | – | – | – | – | (11 | ) | – | – | – | – | (11 | ) | – | (11 | ) | |||||||||||||||||||||||||||||||||
| Net income | – | – | – | – | 5,129 | – | – | – | – | 5,129 | 2 | 5,131 | ||||||||||||||||||||||||||||||||||||
| Total other comprehensive income (loss), net of taxes | – | – | – | – | (456 | ) | 121 | 1,958 | 509 | 2,588 | 2,132 | 5 | 2,137 | |||||||||||||||||||||||||||||||||||
Balance at end of period | $ | 10,416 | $ | 21,006 | $ | (12 | ) | $ | (83 | ) | $ | 90,754 | $ | (776 | ) | $ | 9,086 | $ | 2,776 | $ | 11,086 | $ | 133,167 | $ | 96 | $ | 133,263 | |||||||||||||||||||||
| For the three months ended January 31, 2024 | ||||||||||||||||||||||||||||||||||||||||||||||||
| Other components of equity | ||||||||||||||||||||||||||||||||||||||||||||||||
| (Millions of Canadian dollars) | Preferred shares and other equity instruments | Common shares | Treasury – preferred shares and other equity instruments | Treasury – common shares | Retained earnings | FVOCI securities and loans | Foreign currency translation | Cash flow hedges | Total other components of equity | Equity attributable to shareholders | Non-controlling interests | Total equity | ||||||||||||||||||||||||||||||||||||
Balance at beginning of period | $ | 7,323 | $ | 19,398 | $ | (9 | ) | $ | (231 | ) | $ | 81,059 | $ | (1,860 | ) | $ | 6,612 | $ | 2,756 | $ | 7,508 | $ | 115,048 | $ | 99 | $ | 115,147 | |||||||||||||||||||||
| Changes in equity | ||||||||||||||||||||||||||||||||||||||||||||||||
| Issues of share capital and other equity instruments | 750 | 758 | – | – | (6 | ) | – | – | – | – | 1,502 | – | 1,502 | |||||||||||||||||||||||||||||||||||
| Common shares purchased for cancellation | – | – | – | – | – | – | – | – | – | – | – | – | ||||||||||||||||||||||||||||||||||||
| Redemption of preferred shares and other equity instruments | (23 | ) | – | – | – | 2 | – | – | – | – | (21 | ) | – | (21 | ) | |||||||||||||||||||||||||||||||||
| Sales of treasury shares and other equity instruments | – | – | 113 | 1,227 | – | – | – | – | – | 1,340 | – | 1,340 | ||||||||||||||||||||||||||||||||||||
| Purchases of treasury shares and other equity instruments | – | – | (123 | ) | (1,080 | ) | – | – | – | – | – | (1,203 | ) | – | (1,203 | ) | ||||||||||||||||||||||||||||||||
| Share-based compensation awards | – | – | – | – | 8 | – | – | – | – | 8 | – | 8 | ||||||||||||||||||||||||||||||||||||
| Dividends on common shares | – | – | – | – | (1,944 | ) | – | – | – | – | (1,944 | ) | – | (1,944 | ) | |||||||||||||||||||||||||||||||||
| Dividends on preferred shares and distributions on other equity instruments | – | – | – | – | (58 | ) | – | – | – | – | (58 | ) | (1 | ) | (59 | ) | ||||||||||||||||||||||||||||||||
| Other | – | – | – | – | 12 | – | – | – | – | 12 | – | 12 | ||||||||||||||||||||||||||||||||||||
| Net income | – | – | – | – | 3,580 | – | – | – | – | 3,580 | 2 | 3,582 | ||||||||||||||||||||||||||||||||||||
| Total other comprehensive income (loss), net of taxes | – | – | – | – | (604 | ) | 739 | (1,225 | ) | (783 | ) | (1,269 | ) | (1,873 | ) | (3 | ) | (1,876 | ) | |||||||||||||||||||||||||||||
Balance at end of period | $ | 8,050 | $ | 20,156 | $ | (19 | ) | $ | (84 | ) | $ | 82,049 | $ | (1,121 | ) | $ | 5,387 | $ | 1,973 | $ | 6,239 | $ | 116,391 | $ | 97 | $ | 116,488 | |||||||||||||||||||||
The accompanying notes are an integral part of these Interim Condensed Consolidated Financial Statements.
52 First Quarter 2025
Royal Bank of Canada
Interim Condensed Consolidated Statements of Cash Flows |
| For the three months ended | ||||||||
(Millions of Canadian dollars) | January 31 2025 | January 31 2024 | ||||||
Cash flows from operating activities | ||||||||
Net income | $ | 5,131 | $ | 3,582 | ||||
Adjustments for non-cash items and others | ||||||||
Provision for credit losses | 1,050 | 813 | ||||||
Depreciation | 323 | 320 | ||||||
Deferred income taxes | 28 | (606 | ) | |||||
Amortization and impairment of other intangibles | 451 | 354 | ||||||
Net changes in investments in joint ventures and associates | (19 | ) | (12 | ) | ||||
Losses (Gains) on investment securities | (55 | ) | (70 | ) | ||||
Losses (Gains) on disposition of businesses | – | (4 | ) | |||||
Adjustments for net changes in operating assets and liabilities | ||||||||
Insurance contract liabilities | 1,246 | 2,316 | ||||||
Net change in accrued interest receivable and payable | (979 | ) | 175 | |||||
Current income taxes | (590 | ) | 315 | |||||
Derivative assets | (3,074 | ) | 37,412 | |||||
Derivative liabilities | (2,173 | ) | (35,655 | ) | ||||
Trading securities | (6,116 | ) | (2,521 | ) | ||||
Loans, net of securitizations | (25,783 | ) | (5,838 | ) | ||||
Assets purchased under reverse repurchase agreements and securities borrowed | 70,352 | (7,680 | ) | |||||
Obligations related to assets sold under repurchase agreements and securities loaned | (30,729 | ) | (748 | ) | ||||
Obligations related to securities sold short | 10,174 | 1,361 | ||||||
Deposits, net of securitizations | 32,409 | 9,481 | ||||||
Brokers and dealers receivable and payable | (806 | ) | (497 | ) | ||||
Other | (19,686 | ) | (4,141 | ) | ||||
Net cash from (used in) operating activities | 31,154 | (1,643 | ) | |||||
Cash flows from investing activities | ||||||||
Change in interest-bearing deposits with banks | 18,096 | 10,006 | ||||||
Proceeds from sales and maturities of investment securities | 57,018 | 65,480 | ||||||
Purchases of investment securities | (90,543 | ) | (60,887 | ) | ||||
Net acquisitions of premises and equipment and other intangibles | (681 | ) | (482 | ) | ||||
Net proceeds from (cash transferred for) dispositions | – | 9 | ||||||
Net cash from (used in) investing activities | (16,110 | ) | 14,126 | |||||
Cash flows from financing activities | ||||||||
Issuance of subordinated debentures | 1,500 | – | ||||||
Repayment of subordinated debentures | (1,500 | ) | – | |||||
Issue of common shares, net of issuance costs | 21 | 36 | ||||||
Common shares purchased for cancellation | (338 | ) | – | |||||
Issue of preferred shares and other equity instruments, net of issuance costs | 1,386 | 744 | ||||||
Redemption of preferred shares and other equity instruments | – | (21 | ) | |||||
Sales of treasury shares and other equity instruments | 2,104 | 1,340 | ||||||
Purchases of treasury shares and other equity instruments | (2,149 | ) | (1,203 | ) | ||||
Dividends paid on shares and distributions paid on other equity instruments | (2,101 | ) | (1,240 | ) | ||||
Dividends/distributions paid to non-controlling interests | – | (1 | ) | |||||
Change in short-term borrowings of subsidiaries | – | 533 | ||||||
Repayment of lease liabilities | (154 | ) | (153 | ) | ||||
Net cash from (used in) financing activities | (1,231 | ) | 35 | |||||
Effect of exchange rate changes on cash and due from banks | 664 | (160 | ) | |||||
Net change in cash and due from banks | 14,477 | 12,358 | ||||||
Cash and due from banks at beginning of period (1) | 56,723 | 61,989 | ||||||
Cash and due from banks at end of period (1) | $ | 71,200 | $ | 74,347 | ||||
Cash flows from operating activities include: | ||||||||
Amount of interest paid | $ | 19,477 | $ | 18,920 | ||||
Amount of interest received | 26,047 | 24,950 | ||||||
Amount of dividends received | 1,063 | 1,058 | ||||||
Amount of income taxes paid | 1,242 | 855 | ||||||
| (1) | We are required to maintain balances due to regulatory requirements or contractual restrictions from central banks, other regulatory authorities, and other counterparties. The total balances were $2 billion as at January 31, 2025 (October 31, 2024 – $2 billion; January 31, 2024 – $3 billion; October 31, 2023 – $3 billion). |
The accompanying notes are an integral part of these Interim Condensed Consolidated Financial Statements.
Royal Bank of Canada
Note 1 General information |
Our unaudited Interim Condensed Consolidated Financial Statements (Condensed Financial Statements) are presented in compliance with International Accounting Standard (IAS) 34. The Condensed Financial Statements do not include all the information and disclosures required in the annual financial statements and should be read in conjunction with our audited 2024 Annual Consolidated Financial Statements and the accompanying notes included on pages 148 to 247 in our 2024 Annual Report. Unless otherwise stated, monetary amounts are stated in Canadian dollars. Tabular information is stated in millions of dollars, except as noted. On February 26, 2025, the Board of Directors authorized the Condensed Financial Statements for issue.
Interim Financial Reporting
Note 2 Summary of material accounting policies, estimates and judgments |
The Condensed Financial Statements have been prepared using the same accounting policies and methods used in the preparation of our audited 2024 Annual Consolidated Financial Statements. Our material accounting policies and future changes in accounting policies and disclosures that are not yet effective for us are described in Note 2 of our audited 2024 Annual Consolidated Financial Statements.
Note 3 Fair value of financial instruments |
Carrying value and fair value of financial instruments
The following tables provide a comparison of the carrying values and fair values for financial instruments classified or designated as fair value through profit or loss (FVTPL) and fair value through other comprehensive income (FVOCI), and financial instruments measured at amortized cost. Embedded derivatives are presented on a combined basis with the host contracts. Refer to Note 2 and Note 3 of our audited 2024 Annual Consolidated Financial Statements for a description of the valuation techniques and inputs used in the fair value measurement of our financial instruments. There have been no significant changes to our determination of fair value during the quarter.
As at January 31, 2025 | ||||||||||||||||||||||||||||||||||||
Carrying value and fair value | Carrying value | Fair value | ||||||||||||||||||||||||||||||||||
| (Millions of Canadian dollars) | Financial instruments classified as FVTPL | Financial instruments designated as FVTPL | Financial instruments classified as FVOCI | Financial instruments designated as FVOCI | Financial instruments measured at amortized cost | Financial instruments measured at amortized cost | Total carrying amount | Total fair value | ||||||||||||||||||||||||||||
Financial assets | ||||||||||||||||||||||||||||||||||||
Interest-bearing deposits with banks | $ | – | $ | 40,233 | $ | – | $ | – | $ | 7,691 | $ | 7,691 | $ | 47,924 | $ | 47,924 | ||||||||||||||||||||
Securities | ||||||||||||||||||||||||||||||||||||
Trading | 184,877 | 4,539 | – | – | – | – | 189,416 | 189,416 | ||||||||||||||||||||||||||||
Investment, net of applicable allowance | – | – | 194,997 | 1,291 | 102,321 | 98,320 | 298,609 | 294,608 | ||||||||||||||||||||||||||||
184,877 | 4,539 | 194,997 | 1,291 | 102,321 | 98,320 | 488,025 | 484,024 | |||||||||||||||||||||||||||||
Assets purchased under reverse repurchase agreements and securities borrowed | 213,419 | – | – | – | 67,032 | 67,034 | 280,451 | 280,453 | ||||||||||||||||||||||||||||
Loans, net of applicable allowance | ||||||||||||||||||||||||||||||||||||
Retail | 865 | – | 591 | – | 628,399 | 624,923 | 629,855 | 626,379 | ||||||||||||||||||||||||||||
Wholesale | 11,741 | 2,620 | 997 | – | 360,837 | 358,736 | 376,195 | 374,094 | ||||||||||||||||||||||||||||
12,606 | 2,620 | 1,588 | – | 989,236 | 983,659 | 1,006,050 | 1,000,473 | |||||||||||||||||||||||||||||
Other | ||||||||||||||||||||||||||||||||||||
Derivatives | 153,686 | – | – | – | – | – | 153,686 | 153,686 | ||||||||||||||||||||||||||||
Other assets (1) | 12,795 | – | – | – | 60,143 | 60,143 | 72,938 | 72,938 | ||||||||||||||||||||||||||||
Financial liabilities | ||||||||||||||||||||||||||||||||||||
Deposits | ||||||||||||||||||||||||||||||||||||
Personal | $ | 582 | $ | 35,129 | $ | 499,903 | $ | 502,116 | $ | 535,614 | $ | 537,827 | ||||||||||||||||||||||||
Business and government (2) | 210 | 165,267 | 705,782 | 707,453 | 871,259 | 872,930 | ||||||||||||||||||||||||||||||
Bank (3) | – | 3,266 | 31,801 | 31,813 | 35,067 | 35,079 | ||||||||||||||||||||||||||||||
792 | 203,662 | 1,237,486 | 1,241,382 | 1,441,940 | 1,445,836 | |||||||||||||||||||||||||||||||
Other | ||||||||||||||||||||||||||||||||||||
Obligations related to securities sold short | 45,460 | – | – | – | 45,460 | 45,460 | ||||||||||||||||||||||||||||||
Obligations related to assets sold under repurchase agreements and securities loaned | – | 232,369 | 42,223 | 42,223 | 274,592 | 274,592 | ||||||||||||||||||||||||||||||
Derivatives | 161,590 | – | – | – | 161,590 | 161,590 | ||||||||||||||||||||||||||||||
Other liabilities (4) | (1,676 | ) | 5 | 74,234 | 74,602 | 72,563 | 72,931 | |||||||||||||||||||||||||||||
Subordinated debentures | – | – | 13,670 | 13,755 | 13,670 | 13,755 | ||||||||||||||||||||||||||||||
54 First Quarter 2025
Royal Bank of Canada
Note 3 Fair value of financial instruments (continued) |
| As at October 31, 2024 | ||||||||||||||||||||||||||||||||||||
| Carrying value and fair value | Carrying value | Fair value | ||||||||||||||||||||||||||||||||||
| (Millions of Canadian dollars) | Financial instruments classified as FVTPL | Financial instruments designated as FVTPL | Financial instruments classified as FVOCI | Financial instruments designated as FVOCI | Financial instruments measured at amortized cost | Financial instruments measured at amortized cost | Total carrying amount | Total fair value | ||||||||||||||||||||||||||||
Financial assets | ||||||||||||||||||||||||||||||||||||
| Interest-bearing deposits with banks | $ | – | $ | 53,996 | $ | – | $ | – | $ | 12,024 | $ | 12,024 | $ | 66,020 | $ | 66,020 | ||||||||||||||||||||
| Securities | ||||||||||||||||||||||||||||||||||||
| Trading | 182,346 | 954 | – | – | – | – | 183,300 | 183,300 | ||||||||||||||||||||||||||||
| Investment, net of applicable allowance | – | – | 155,118 | 1,242 | 100,258 | 96,336 | 256,618 | 252,696 | ||||||||||||||||||||||||||||
| 182,346 | 954 | 155,118 | 1,242 | 100,258 | 96,336 | 439,918 | 435,996 | |||||||||||||||||||||||||||||
| Assets purchased under reverse repurchase agreements and securities borrowed | 284,311 | – | – | – | 66,492 | 66,492 | 350,803 | 350,803 | ||||||||||||||||||||||||||||
| Loans, net of applicable allowance | ||||||||||||||||||||||||||||||||||||
| Retail | 915 | – | 580 | – | 622,098 | 619,320 | 623,593 | 620,815 | ||||||||||||||||||||||||||||
| Wholesale | 6,177 | 2,030 | 1,003 | – | 348,577 | 345,561 | 357,787 | 354,771 | ||||||||||||||||||||||||||||
| 7,092 | 2,030 | 1,583 | – | 970,675 | 964,881 | 981,380 | 975,586 | |||||||||||||||||||||||||||||
| Other | ||||||||||||||||||||||||||||||||||||
| Derivatives | 150,612 | – | – | – | – | – | 150,612 | 150,612 | ||||||||||||||||||||||||||||
Other assets (1) | 11,770 | – | – | – | 50,093 | 50,093 | 61,863 | 61,863 | ||||||||||||||||||||||||||||
Financial liabilities | ||||||||||||||||||||||||||||||||||||
| Deposits | ||||||||||||||||||||||||||||||||||||
| Personal | $ | 508 | $ | 33,799 | $ | 487,832 | $ | 490,170 | $ | 522,139 | $ | 524,477 | ||||||||||||||||||||||||
Business and government (2) | 191 | 156,238 | 683,241 | 684,748 | 839,670 | 841,177 | ||||||||||||||||||||||||||||||
Bank (3) | – | 10,530 | 37,192 | 37,183 | 47,722 | 47,713 | ||||||||||||||||||||||||||||||
| 699 | 200,567 | 1,208,265 | 1,212,101 | 1,409,531 | 1,413,367 | |||||||||||||||||||||||||||||||
| Other | ||||||||||||||||||||||||||||||||||||
| Obligations related to securities sold short | 35,286 | – | – | – | 35,286 | 35,286 | ||||||||||||||||||||||||||||||
| Obligations related to assets sold under repurchase agreements and securities loaned | – | 270,663 | 34,658 | 34,658 | 305,321 | 305,321 | ||||||||||||||||||||||||||||||
| Derivatives | 163,763 | – | – | – | 163,763 | 163,763 | ||||||||||||||||||||||||||||||
Other liabilities (4) | (1,407 | ) | – | 69,597 | 69,850 | 68,190 | 68,443 | |||||||||||||||||||||||||||||
| Subordinated debentures | – | – | 13,546 | 13,602 | 13,546 | 13,602 | ||||||||||||||||||||||||||||||
| (1) | Includes Customers’ liability under acceptances and financial instruments recognized in Other assets. |
| (2) | Business and government deposits include deposits from regulated deposit-taking institutions other than banks. |
| (3) | Bank deposits refer to deposits from regulated banks and central banks. |
| (4) | Includes Acceptances and financial instruments recognized in Other liabilities. |
Royal Bank of Canada
Fair value of assets and liabilities measured at fair value on a recurring basis and classified using the fair value hierarchy
| As at | ||||||||||||||||||||||||||||||||||||||||||
January 31, 2025 | October 31, 2024 | |||||||||||||||||||||||||||||||||||||||||
Fair value measurements using | Netting adjustments | Fair value measurements using | Netting adjustments | |||||||||||||||||||||||||||||||||||||||
| (Millions of Canadian dollars) | Level 1 | Level 2 | Level 3 | Fair value | Level 1 | Level 2 | Level 3 | Fair value | ||||||||||||||||||||||||||||||||||
Financial assets | ||||||||||||||||||||||||||||||||||||||||||
Interest-bearing deposits with banks | $ | – | $ | 40,233 | $ | – | $ | $ | 40,233 | $ | – | $ | 53,996 | $ | – | $ | $ | 53,996 | ||||||||||||||||||||||||
Securities | ||||||||||||||||||||||||||||||||||||||||||
Trading | ||||||||||||||||||||||||||||||||||||||||||
Debt issued or guaranteed by: | ||||||||||||||||||||||||||||||||||||||||||
Canadian government (1) | ||||||||||||||||||||||||||||||||||||||||||
Federal | 10,654 | 2,035 | – | 12,689 | 11,611 | 2,173 | – | 13,784 | ||||||||||||||||||||||||||||||||||
Provincial and municipal | – | 16,867 | – | 16,867 | – | 16,588 | – | 16,588 | ||||||||||||||||||||||||||||||||||
U.S. federal, state, municipal and agencies (1), (2) | 2,767 | 32,660 | – | 35,427 | 1,852 | 29,136 | – | 30,988 | ||||||||||||||||||||||||||||||||||
Other OECD government (3) | 4,286 | 5,333 | – | 9,619 | 2,481 | 2,153 | – | 4,634 | ||||||||||||||||||||||||||||||||||
Mortgage-backed securities (1) | – | 60 | – | 60 | – | 3 | – | 3 | ||||||||||||||||||||||||||||||||||
Asset-backed securities | – | 1,683 | – | 1,683 | – | 1,434 | – | 1,434 | ||||||||||||||||||||||||||||||||||
Corporate debt and other debt | – | 26,360 | – | 26,360 | – | 26,195 | – | 26,195 | ||||||||||||||||||||||||||||||||||
Equities | 81,481 | 2,587 | 2,643 | 86,711 | 84,814 | 2,316 | 2,544 | 89,674 | ||||||||||||||||||||||||||||||||||
99,188 | 87,585 | 2,643 | 189,416 | 100,758 | 79,998 | 2,544 | 183,300 | |||||||||||||||||||||||||||||||||||
Investment | ||||||||||||||||||||||||||||||||||||||||||
Debt issued or guaranteed by: | ||||||||||||||||||||||||||||||||||||||||||
Canadian government (1) | ||||||||||||||||||||||||||||||||||||||||||
Federal | 8,084 | 9,659 | – | 17,743 | 4,623 | 8,546 | – | 13,169 | ||||||||||||||||||||||||||||||||||
Provincial and municipal | – | 9,159 | – | 9,159 | – | 7,554 | – | 7,554 | ||||||||||||||||||||||||||||||||||
U.S. federal, state, municipal and agencies (1) | 75 | 101,855 | – | 101,930 | 42 | 80,224 | – | 80,266 | ||||||||||||||||||||||||||||||||||
Other OECD government | 5,975 | 9,759 | – | 15,734 | 2,370 | 7,786 | – | 10,156 | ||||||||||||||||||||||||||||||||||
Mortgage-backed securities (1) | – | 2,411 | 32 | 2,443 | – | 2,603 | 31 | 2,634 | ||||||||||||||||||||||||||||||||||
Asset-backed securities | – | 11,333 | – | 11,333 | – | 9,357 | – | 9,357 | ||||||||||||||||||||||||||||||||||
Corporate debt and other debt | – | 36,513 | 142 | 36,655 | – | 31,839 | 143 | 31,982 | ||||||||||||||||||||||||||||||||||
Equities | 439 | 329 | 523 | 1,291 | 432 | 304 | 506 | 1,242 | ||||||||||||||||||||||||||||||||||
14,573 | 181,018 | 697 | 196,288 | 7,467 | 148,213 | 680 | 156,360 | |||||||||||||||||||||||||||||||||||
Assets purchased under reverse repurchase agreements and securities borrowed | – | 213,419 | – | 213,419 | – | 284,311 | – | 284,311 | ||||||||||||||||||||||||||||||||||
Loans | – | 14,938 | 1,876 | 16,814 | – | 8,924 | 1,781 | 10,705 | ||||||||||||||||||||||||||||||||||
Other | ||||||||||||||||||||||||||||||||||||||||||
Derivatives | ||||||||||||||||||||||||||||||||||||||||||
Interest rate contracts | – | 28,132 | 293 | 28,425 | – | 27,719 | 354 | 28,073 | ||||||||||||||||||||||||||||||||||
Foreign exchange contracts | – | 102,583 | 1 | 102,584 | – | 98,480 | 3 | 98,483 | ||||||||||||||||||||||||||||||||||
Credit derivatives | – | 325 | – | 325 | – | 273 | – | 273 | ||||||||||||||||||||||||||||||||||
Other contracts | 1,236 | 23,986 | 116 | 25,338 | 2,553 | 23,830 | 21 | 26,404 | ||||||||||||||||||||||||||||||||||
Valuation adjustments | – | (997 | ) | 9 | (988 | ) | – | (1,067 | ) | 14 | (1,053 | ) | ||||||||||||||||||||||||||||||
Total gross derivatives | 1,236 | 154,029 | 419 | 155,684 | 2,553 | 149,235 | 392 | 152,180 | ||||||||||||||||||||||||||||||||||
Netting adjustments | (1,998) | (1,998 | ) | (1,568) | (1,568 | ) | ||||||||||||||||||||||||||||||||||||
Total derivatives | 153,686 | 150,612 | ||||||||||||||||||||||||||||||||||||||||
Other assets | 5,743 | 7,045 | 7 | 12,795 | 5,291 | 6,472 | 7 | 11,770 | ||||||||||||||||||||||||||||||||||
$ | 120,740 | $ | 698,267 | $ | 5,642 | $ | (1,998) | $ | 822,651 | $ | 116,069 | $ | 731,149 | $ | 5,404 | $ | (1,568) | $ | 851,054 | |||||||||||||||||||||||
Financial liabilities | ||||||||||||||||||||||||||||||||||||||||||
Deposits | ||||||||||||||||||||||||||||||||||||||||||
Personal | $ | – | $ | 35,077 | $ | 634 | $ | $ | 35,711 | $ | – | $ | 33,829 | $ | 478 | $ | $ | 34,307 | ||||||||||||||||||||||||
Business and government | – | 165,477 | – | 165,477 | – | 156,429 | – | 156,429 | ||||||||||||||||||||||||||||||||||
Bank | – | 3,266 | – | 3,266 | – | 10,530 | – | 10,530 | ||||||||||||||||||||||||||||||||||
Other | ||||||||||||||||||||||||||||||||||||||||||
Obligations related to securities sold short | 13,162 | 32,298 | – | 45,460 | 15,172 | 20,114 | – | 35,286 | ||||||||||||||||||||||||||||||||||
Obligations related to assets sold under repurchase agreements and securities loaned | – | 232,369 | – | 232,369 | – | 270,663 | – | 270,663 | ||||||||||||||||||||||||||||||||||
Derivatives | ||||||||||||||||||||||||||||||||||||||||||
Interest rate contracts | – | 24,971 | 828 | 25,799 | – | 24,852 | 847 | 25,699 | ||||||||||||||||||||||||||||||||||
Foreign exchange contracts | – | 102,527 | 67 | 102,594 | – | 93,164 | 54 | 93,218 | ||||||||||||||||||||||||||||||||||
Credit derivatives | – | 291 | – | 291 | – | 218 | – | 218 | ||||||||||||||||||||||||||||||||||
Other contracts | 2,152 | 32,516 | 571 | 35,239 | 3,212 | 42,961 | 324 | 46,497 | ||||||||||||||||||||||||||||||||||
Valuation adjustments | – | (336 | ) | 1 | (335 | ) | – | (297 | ) | (4 | ) | (301 | ) | |||||||||||||||||||||||||||||
Total gross derivatives | 2,152 | 159,969 | 1,467 | 163,588 | 3,212 | 160,898 | 1,221 | 165,331 | ||||||||||||||||||||||||||||||||||
Netting adjustments | (1,998) | (1,998 | ) | (1,568) | (1,568 | ) | ||||||||||||||||||||||||||||||||||||
Total derivatives | 161,590 | 163,763 | ||||||||||||||||||||||||||||||||||||||||
Other liabilities | 331 | (2,002 | ) | – | (1,671 | ) | 287 | (1,694 | ) | – | (1,407 | ) | ||||||||||||||||||||||||||||||
$ | 15,645 | $ | 626,454 | $ | 2,101 | $ | (1,998) | $ | 642,202 | $ | 18,671 | $ | 650,769 | $ | 1,699 | $ | (1,568) | $ | 669,571 | |||||||||||||||||||||||
| (1) | As at January 31, 2025, residential and commercial mortgage-backed securities (MBS) included in all fair value levels of trading securities were $18,079 million and $nil (October 31, 2024 – $17,154 million and $nil), respectively, and in all fair value levels of Investment securities were $28,674million and $2,400million (October 31, 2024 – $27,048 million and $2,568 million), respectively. |
| (2) | United States (U.S.). |
| (3) | Organisation for Economic Co-operation and Development (OECD). |
56 First Quarter 2025
Royal Bank of Canada
Note 3 Fair value of financial instruments (continued) |
Fair value measurements using significant unobservable inputs (Level 3 Instruments)
A financial instrument is classified as Level 3 in the fair value hierarchy if one or more of its unobservable inputs may significantly affect the measurement of its fair value. In preparing the financial statements, appropriate levels for these unobservable input parameters are chosen so that they are consistent with prevailing market evidence or management judgment. Due to the unobservable nature of the prices or rates, there may be uncertainty about the valuation of these Level 3 financial instruments.
During the three months ended January 31, 2025, there were no significant changes made to the valuation techniques and ranges and weighted averages of unobservable inputs used in the determination of fair value of Level 3 financial instruments. As at January 31, 2025, the impacts of adjusting one or more of the unobservable inputs by reasonably possible alternative assumptions did not change significantly from the impacts disclosed in our audited 2024 Annual Consolidated Financial Statements.
Changes in fair value measurement for instruments measured on a recurring basis and categorized in Level 3
For the three months ended January 31, 2025 | ||||||||||||||||||||||||||||||||||||
| (Millions of Canadian dollars) | Fair value at beginning of period | Gains (losses) included in earnings | Gains (losses) included in OCI | Purchases (issuances) | Settlement (sales) and other | Transfers into Level 3 | Transfers out of Level 3 | Fair value at end of period | Gains (losses) included in earnings for positions still held | |||||||||||||||||||||||||||
Assets | ||||||||||||||||||||||||||||||||||||
Securities | ||||||||||||||||||||||||||||||||||||
Trading | ||||||||||||||||||||||||||||||||||||
Equities | $ | 2,544 | $ | (64 | ) | $ | 59 | $ | 207 | $ | (104 | ) | $ | 1 | $ | – | $ | 2,643 | $ | (42 | ) | |||||||||||||||
2,544 | (64 | ) | 59 | 207 | (104 | ) | 1 | – | 2,643 | (42 | ) | |||||||||||||||||||||||||
Investment | ||||||||||||||||||||||||||||||||||||
Mortgage-backed securities | 31 | – | 1 | – | – | – | – | 32 | n.a. | |||||||||||||||||||||||||||
Corporate debt and other debt | 143 | – | 6 | – | (7 | ) | – | – | 142 | n.a. | ||||||||||||||||||||||||||
Equities | 506 | – | 20 | – | (3 | ) | – | – | 523 | n.a. | ||||||||||||||||||||||||||
680 | – | 27 | – | (10 | ) | – | – | 697 | n.a. | |||||||||||||||||||||||||||
Loans | 1,781 | (3 | ) | 23 | 90 | (19 | ) | 7 | (3 | ) | 1,876 | (1 | ) | |||||||||||||||||||||||
Other | ||||||||||||||||||||||||||||||||||||
Net derivative balances (3) | ||||||||||||||||||||||||||||||||||||
Interest rate contracts | (493 | ) | 12 | – | (67 | ) | 3 | 2 | 8 | (535 | ) | 12 | ||||||||||||||||||||||||
Foreign exchange contracts | (51 | ) | (14 | ) | – | 1 | – | – | (2 | ) | (66 | ) | (25 | ) | ||||||||||||||||||||||
Other contracts | (303 | ) | (21 | ) | (13 | ) | (12 | ) | 4 | (225 | ) | 115 | (455 | ) | (16 | ) | ||||||||||||||||||||
Valuation adjustments | 18 | – | – | (10 | ) | – | – | – | 8 | – | ||||||||||||||||||||||||||
Other assets | 7 | – | – | – | – | – | – | 7 | – | |||||||||||||||||||||||||||
$ | 4,183 | $ | (90 | ) | $ | 96 | $ | 209 | $ | (126 | ) | $ | (215 | ) | $ | 118 | $ | 4,175 | $ | (72 | ) | |||||||||||||||
Liabilities | ||||||||||||||||||||||||||||||||||||
Deposits | $ | (478 | ) | $ | 1 | $ | (6 | ) | $ | (232 | ) | $ | 62 | $ | (166 | ) | $ | 185 | $ | (634 | ) | $ | 37 | |||||||||||||
$ | (478 | ) | $ | 1 | $ | (6 | ) | $ | (232 | ) | $ | 62 | $ | (166 | ) | $ | 185 | $ | (634 | ) | $ | 37 | ||||||||||||||
Royal Bank of Canada
| For the three months ended January 31, 2024 | ||||||||||||||||||||||||||||||||||||
| (Millions of Canadian dollars) | Fair value at beginning of period | Gains (losses) included in earnings | Gains (losses) included in OCI (1) | Purchases (issuances) | Settlement (sales) and other (2) | Transfers into Level 3 | Transfers out of Level 3 | Fair value at end of period | Gains (losses) included in earnings for positions still held | |||||||||||||||||||||||||||
Assets | ||||||||||||||||||||||||||||||||||||
Securities | ||||||||||||||||||||||||||||||||||||
Trading | ||||||||||||||||||||||||||||||||||||
| Equities | $ | 2,266 | $ | (18 | ) | $ | (36 | ) | $ | 98 | $ | (24 | ) | $ | – | $ | – | $ | 2,286 | $ | 1 | |||||||||||||||
| 2,266 | (18 | ) | (36 | ) | 98 | (24 | ) | – | – | 2,286 | 1 | |||||||||||||||||||||||||
Investment | ||||||||||||||||||||||||||||||||||||
| Mortgage-backed securities | 29 | – | 1 | – | – | – | – | 30 | n.a. | |||||||||||||||||||||||||||
| Corporate debt and other debt | 149 | – | 3 | – | (4 | ) | – | – | 148 | n.a. | ||||||||||||||||||||||||||
| Equities | 466 | – | (4 | ) | – | – | – | – | 462 | n.a. | ||||||||||||||||||||||||||
| 644 | – | – | – | (4 | ) | – | – | 640 | n.a. | |||||||||||||||||||||||||||
Loans | 1,859 | (46 | ) | (8 | ) | 165 | (193 | ) | 38 | – | 1,815 | (44 | ) | |||||||||||||||||||||||
Other | ||||||||||||||||||||||||||||||||||||
Net derivative balances (3) | ||||||||||||||||||||||||||||||||||||
| Interest rate contracts | (662 | ) | 80 | – | 12 | 16 | 17 | 2 | (535 | ) | 84 | |||||||||||||||||||||||||
| Foreign exchange contracts | (49 | ) | (11 | ) | 1 | 5 | 5 | – | – | (49 | ) | (11 | ) | |||||||||||||||||||||||
| Other contracts | (438 | ) | (123 | ) | 14 | (15 | ) | (2 | ) | (7 | ) | 222 | (349 | ) | (71 | ) | ||||||||||||||||||||
| Valuation adjustments | 3 | – | – | 1 | – | – | – | 4 | — | |||||||||||||||||||||||||||
| Other assets | 11 | – | – | – | (1 | ) | – | – | 10 | — | ||||||||||||||||||||||||||
| $ | 3,634 | $ | (118 | ) | $ | (29 | ) | $ | 266 | $ | (203 | ) | $ | 48 | $ | 224 | $ | 3,822 | $ | (41 | ) | |||||||||||||||
Liabilities | ||||||||||||||||||||||||||||||||||||
Deposits | $ | (383 | ) | $ | (47 | ) | $ | 3 | $ | (122 | ) | $ | 13 | $ | (1 | ) | $ | 108 | $ | (429 | ) | $ | (33 | ) | ||||||||||||
| $ | (383 | ) | $ | (47 | ) | $ | 3 | $ | (122 | ) | $ | 13 | $ | (1 | ) | $ | 108 | $ | (429 | ) | $ | (33 | ) | |||||||||||||
| (1) | These amounts include the foreign currency translation gains or losses arising on consolidation of foreign subsidiaries relating to the Level 3 instruments, where applicable. The unrealized gains on Investment securities recognized in OCI were $15 million for the three months ended January 31, 2025 (January 31, 2024 – gains of $10 million), excluding the translation gains or losses arising on consolidation. |
| (2) | Other includes amortization of premiums or discounts recognized in net income. |
| (3) | Net derivatives as at January 31, 2025 included derivative assets of $419 million (January 31, 2024 – $384 million) and derivative liabilities of $1,467million (January 31, 2024 – $1,313 million). |
| n.a. | not applicable |
Transfers between fair value hierarchy levels for instruments carried at fair value on a recurring basis
Transfers between Level 1 and Level 2, and transfers into and out of Level 3 are assumed to occur at the end of the period. For an asset or a liability that transfers into Level 3 during the period, the entire change in fair value for the period is excluded from the Gains (losses) included in earnings for positions still held column of the above reconciliation, whereas for transfers out of Level 3 during the period, the entire change in fair value for the period is included in the same column of the above reconciliation.
Transfers between Level 1 and 2 are dependent on whether fair value is obtained on the basis of quoted market prices in active markets (Level 1).
During the three months ended January 31, 2025, there were no significant transfers out of Level 1 to Level 2. During the three months ended January 31, 2024, transfers out of Level 1 to Level 2 included Investment U.S. federal, state, municipal and agencies debt of
$123 million.During the three months ended January 31, 2025 and January 31, 2024, there were no significant transfers out of Level 2 to Level 1.
Transfers between Level 2 and Level 3 are primarily due to either a change in the market observability for an input, or a change in an unobservable input’s significance to a financial instrument’s fair value.
During the three months ended January 31, 2025, transfers out of Level 2 to Level 3 included Other contracts and Deposits due to changes in the significance of unobservable inputs. During the three months ended January 31, 2024, there were no significant transfers out of Level 2 to Level 3.
During the three months ended January 31, 2025, transfers out of Level 3 to Level 2 included Deposits and Other contracts due to changes in the significance of unobservable inputs and changes in the market observability of inputs. During the three months ended January 31, 2024, transfers out of Level 3 to Level 2 included Other contracts and Deposits due to changes in the market observability of inputs and changes in the significance of unobservable inputs.
58 First Quarter 2025
Royal Bank of Canada
Note 3 Fair value of financial instruments (continued) |
Net interest income from financial instruments
Interest and dividend income arising from financial assets and financial liabilities and the associated costs of funding are reported in Net interest income.
| For the three months ended | ||||||||
(Millions of Canadian dollars) | January 31 2025 | January 31 2024 | ||||||
Interest and dividend income (1), (2) | ||||||||
| Financial instruments measured at fair value through profit or loss | $ | 7,922 | $ | 9,474 | ||||
| Financial instruments measured at fair value through other comprehensive income | 2,049 | 1,608 | ||||||
| Financial instruments measured at amortized cost | 16,484 | 14,527 | ||||||
26,455 | 25,609 | |||||||
Interest expense (1) | ||||||||
| Financial instruments measured at fair value through profit or loss | 8,045 | 9,084 | ||||||
| Financial instruments measured at amortized cost | 10,462 | 10,193 | ||||||
18,507 | 19,277 | |||||||
| Net interest income | $ | 7,948 | $ | 6,332 | ||||
| (1) | Excludes interest and dividend income for the three months ended January 31, 2025 of $365 million (January 31, 2024 – $272 million) and interest expense for the three months ended January 31, 2025 of $43 million (January 31, 2024 – $11 million) presented in Insurance investment result in the Interim Condensed Consolidated Statements of Income. |
| (2) | Includes dividend income for the three months ended January 31, 2025 of $996 million (January 31, 2024 – $957 million) presented in Interest and dividend income in the Interim Condensed Consolidated Statements of Income. |
Note 4 Securities |
Unrealized gains and losses on securities at FVOCI
(1), (2)
| As at | ||||||||||||||||||||||||||||||||||
January 31, 2025 | October 31, 2024 | |||||||||||||||||||||||||||||||||
| (Millions of Canadian dollars) | Cost/ Amortized cost | Gross unrealized gains | Gross unrealized losses | Fair value | Cost/ Amortized cost | Gross unrealized gains | Gross unrealized losses | Fair value | ||||||||||||||||||||||||||
| Debt issued or guaranteed by: | ||||||||||||||||||||||||||||||||||
| Canadian government | ||||||||||||||||||||||||||||||||||
| Federal | $ | 17,728 | $ | 42 | $ | (27 | ) | $ | 17,743 | $ | 13,165 | $ | 31 | $ | (27 | ) | $ | 13,169 | ||||||||||||||||
| Provincial and municipal | 9,169 | 30 | (40 | ) | 9,159 | 7,563 | 27 | (36 | ) | 7,554 | ||||||||||||||||||||||||
| U.S. federal, state, municipal and agencies | 103,191 | 316 | (1,577 | ) | 101,930 | 81,632 | 333 | (1,699 | ) | 80,266 | ||||||||||||||||||||||||
| Other OECD government | 15,765 | 11 | (42 | ) | 15,734 | 10,199 | 6 | (49 | ) | 10,156 | ||||||||||||||||||||||||
| Mortgage-backed securities | 2,445 | 7 | (9 | ) | 2,443 | 2,646 | 3 | (15 | ) | 2,634 | ||||||||||||||||||||||||
| Asset-backed securities | 11,302 | 34 | (3 | ) | 11,333 | 9,343 | 17 | (3 | ) | 9,357 | ||||||||||||||||||||||||
| Corporate debt and other debt | 36,590 | 107 | (42 | ) | 36,655 | 31,932 | 101 | (51 | ) | 31,982 | ||||||||||||||||||||||||
| Equities | 745 | 552 | (6 | ) | 1,291 | 728 | 519 | (5 | ) | 1,242 | ||||||||||||||||||||||||
$ | 196,935 | $ | 1,099 | $ | (1,746 | ) | $ | 196,288 | $ | 157,208 | $ | 1,037 | $ | (1,885 | ) | $ | 156,360 | |||||||||||||||||
| (1) | Excludes $102,321 million ofheld-to-collect |
| (2) | Gross unrealized gains and losses includes $(38) million of allowance for credit losses on debt securities at FVOCI as at January 31, 2025 (October 31, 2024 – $(35) million) recognized in income and Other components of equity. |
Allowance for credit losses on investment securities
The following tables reconcile the opening and closing allowance for debt securities at FVOCI and amortized cost by stage. Reconciling items include the following:
| • | Transfers between stages, which are presumed to occur before any corresponding remeasurement of the allowance. |
| • | Purchases, which reflect the allowance related to assets newly recognized during the period, including those assets that were derecognized following a modification of terms. |
| • | Sales and maturities, which reflect the allowance related to assets derecognized during the period without a credit loss being incurred, including those assets that were derecognized following a modification of terms. |
| • | Changes in risk, parameters and exposures, which comprise the impact of changes in model inputs or assumptions, including changes in forward-looking macroeconomic conditions; partial repayments; changes in the measurement following a transfer between stages; and unwinding of the time value discount due to the passage of time. |
Royal Bank of Canada
Allowance for credit losses – securities at FVOCI
(1)
| For the three months ended | ||||||||||||||||||||||||||||||||||||||||||||
January 31, 2025 | January 31, 2024 | |||||||||||||||||||||||||||||||||||||||||||
Performing | Impaired | Performing | Impaired | |||||||||||||||||||||||||||||||||||||||||
| (Millions of Canadian dollars) | Stage 1 | Stage 2 | Stage 3 | Total | Stage 1 | Stage 2 | Stage 3 (2) | Total | ||||||||||||||||||||||||||||||||||||
| Balance at beginning of period | $ | 6 | $ | – | $ | (41 | ) | $ | (35 | ) | $ | 4 | $ | – | $ | (37 | ) | $ | (33 | ) | ||||||||||||||||||||||||
| Provision for credit losses | ||||||||||||||||||||||||||||||||||||||||||||
| Transfers to stage 1 | – | – | – | – | – | – | – | – | ||||||||||||||||||||||||||||||||||||
| Transfers to stage 2 | – | – | – | – | – | – | – | – | ||||||||||||||||||||||||||||||||||||
| Transfers to stage 3 | – | – | – | – | – | – | – | – | ||||||||||||||||||||||||||||||||||||
| Purchases | 2 | – | – | 2 | 3 | – | – | 3 | ||||||||||||||||||||||||||||||||||||
| Sales and maturities | (1 | ) | – | – | (1 | ) | (1 | ) | – | – | (1 | ) | ||||||||||||||||||||||||||||||||
| Changes in risk, parameters and exposures | (3 | ) | – | (2 | ) | (5 | ) | (2 | ) | – | (2 | ) | (4 | ) | ||||||||||||||||||||||||||||||
| Exchange rate and other | – | – | 1 | 1 | – | – | 2 | 2 | ||||||||||||||||||||||||||||||||||||
| Balance at end of period | $ | 4 | $ | – | $ | (42 | ) | $ | (38 | ) | $ | 4 | $ | – | $ | (37 | ) | $ | (33 | ) | ||||||||||||||||||||||||
| (1) | Expected credit losses on debt securities at FVOCI are not separately recognized on the balance sheet as the related securities are recorded at fair value. The cumulative amount of credit losses recognized in income is presented in Other components of equity. |
| (2) | Reflects changes in the allowance for purchased credit-impaired securities. |
Allowance for credit losses – securities at amortized cost
| For the three months ended | ||||||||||||||||||||||||||||||||||||||||||||
January 31, 2025 | January 31, 2024 | |||||||||||||||||||||||||||||||||||||||||||
Performing | Impaired | Performing | Impaired | |||||||||||||||||||||||||||||||||||||||||
| (Millions of Canadian dollars) | Stage 1 | Stage 2 | Stage 3 | Total | Stage 1 | Stage 2 | Stage 3 | Total | ||||||||||||||||||||||||||||||||||||
| Balance at beginning of period | $ | 6 | $ | 8 | $ | – | $ | 14 | $ | 8 | $ | 15 | $ | – | $ | 23 | ||||||||||||||||||||||||||||
| Provision for credit losses | ||||||||||||||||||||||||||||||||||||||||||||
| Transfers to stage 1 | – | – | – | – | – | – | – | – | ||||||||||||||||||||||||||||||||||||
| Transfers to stage 2 | – | – | – | – | – | – | – | – | ||||||||||||||||||||||||||||||||||||
| Transfers to stage 3 | – | – | – | – | – | – | – | – | ||||||||||||||||||||||||||||||||||||
| Purchases | 1 | – | – | 1 | 3 | – | – | 3 | ||||||||||||||||||||||||||||||||||||
| Sales and maturities | – | – | – | – | – | – | – | – | ||||||||||||||||||||||||||||||||||||
| Changes in risk, parameters and exposures | (1 | ) | – | – | (1 | ) | (2 | ) | – | – | (2 | ) | ||||||||||||||||||||||||||||||||
| Exchange rate and other | – | – | – | – | – | (1 | ) | – | (1 | ) | ||||||||||||||||||||||||||||||||||
| Balance at end of period | $ | 6 | $ | 8 | $ | – | $ | 14 | $ | 9 | $ | 14 | $ | – | $ | 23 | ||||||||||||||||||||||||||||
Credit risk exposure by internal risk rating
The following table presents the fair value of debt securities at FVOCI and gross carrying amount of securities at amortized cost. Risk ratings are based on internal ratings used in the measurement of expected credit losses as at the reporting date, as outlined in the internal ratings maps in the Credit risk section of our 2024 Annual Report.
| As at | ||||||||||||||||||||||||||||||||||||||||||||
January 31, 2025 | October 31, 2024 | |||||||||||||||||||||||||||||||||||||||||||
Performing | Impaired | Performing | Impaired | |||||||||||||||||||||||||||||||||||||||||
| (Millions of Canadian dollars) | Stage 1 | Stage 2 | Stage 3 | Total | Stage 1 | Stage 2 | Stage 3 (1) | Total | ||||||||||||||||||||||||||||||||||||
Investment securities | ||||||||||||||||||||||||||||||||||||||||||||
Securities at FVOCI | ||||||||||||||||||||||||||||||||||||||||||||
| Investment grade | $ | 194,062 | – | – | $ | 194,062 | $ | 154,100 | $ | – | $ | – | $ | 154,100 | ||||||||||||||||||||||||||||||
Non-investment grade | 793 | – | – | 793 | 875 | – | – | 875 | ||||||||||||||||||||||||||||||||||||
| Impaired | – | – | 142 | 142 | – | – | 143 | 143 | ||||||||||||||||||||||||||||||||||||
194,855 | – | 142 | 194,997 | 154,975 | – | 143 | 155,118 | |||||||||||||||||||||||||||||||||||||
Items not subject to impairment (2) | 1,291 | 1,242 | ||||||||||||||||||||||||||||||||||||||||||
$ | 196,288 | $ | 156,360 | |||||||||||||||||||||||||||||||||||||||||
Securities at amortized cost | ||||||||||||||||||||||||||||||||||||||||||||
| Investment grade | $ | 101,251 | – | $ | – | $ | 101,251 | $ | 99,224 | $ | – | $ | – | $ | 99,224 | |||||||||||||||||||||||||||||
Non-investment grade | 901 | 183 | – | 1,084 | 856 | 192 | – | 1,048 | ||||||||||||||||||||||||||||||||||||
102,152 | 183 | – | 102,335 | 100,080 | 192 | – | 100,272 | |||||||||||||||||||||||||||||||||||||
| Allowance for credit losses | 6 | 8 | – | 14 | 6 | 8 | – | 14 | ||||||||||||||||||||||||||||||||||||
$ | 102,146 | $ | 175 | $ | – | $ | 102,321 | $ | 100,074 | $ | 184 | $ | – | $ | 100,258 | |||||||||||||||||||||||||||||
| (1) | Reflects $142 million of purchased credit - impaired securities (October 31, 2024 – $143 million). |
| (2) | Investment securities at FVOCI not subject to impairment represent equity securities designated as FVOCI. |
60 First Quarter 2025
Royal Bank of Canada
Note 5 Loans and allowance for credit losses |
Allowance for credit losses
| For the three months ended | ||||||||||||||||||||||||||||||||||||||||||
January 31, 2025 | January 31, 2024 | |||||||||||||||||||||||||||||||||||||||||
| (Millions of Canadian dollars) | Balance at beginning of period | Provision for credit losses | Net write-offs | Exchange rate and other | Balance at end of period | Balance at beginning of period | Provision for credit losses | Net write-offs | Exchange rate and other | Balance at end of period | ||||||||||||||||||||||||||||||||
| Retail | ||||||||||||||||||||||||||||||||||||||||||
| Residential mortgages | $ | 572 | $ | 73 | $ | (2 | ) | $ | (7 | ) | $ | 636 | $ | 481 | $ | 74 | $ | (1 | ) | $ | (12 | ) | $ | 542 | ||||||||||||||||||
| Personal | 1,482 | 247 | (189 | ) | (6 | ) | 1,534 | 1,228 | 202 | (139 | ) | (4 | ) | 1,287 | ||||||||||||||||||||||||||||
| Credit cards | 1,233 | 223 | (193 | ) | 1 | 1,264 | 1,069 | 183 | (150 | ) | (1 | ) | 1,101 | |||||||||||||||||||||||||||||
| Small business | 272 | 46 | (24 | ) | (5 | ) | 289 | 194 | 37 | (15 | ) | (4 | ) | 212 | ||||||||||||||||||||||||||||
| Wholesale | 2,793 | 464 | (79 | ) | 32 | 3,210 | 2,326 | 329 | (149 | ) | (61 | ) | 2,445 | |||||||||||||||||||||||||||||
| Customers’ liability under acceptances | – | – | – | – | – | 50 | (7 | ) | – | – | 43 | |||||||||||||||||||||||||||||||
$ | 6,352 | $ | 1,053 | $ | (487) | $ | 15 | $ | 6,933 | $ | 5,348 | $ | 818 | $ | (454 | ) | $ | (82 | ) | $ | 5,630 | |||||||||||||||||||||
| Presented as: | ||||||||||||||||||||||||||||||||||||||||||
| Allowance for loan losses | $ | 6,037 | $ | 6,600 | $ | 5,004 | $ | 5,299 | ||||||||||||||||||||||||||||||||||
| Other liabilities – Provisions | 311 | 328 | 288 | 282 | ||||||||||||||||||||||||||||||||||||||
| Customers’ liability under acceptances | – | – | 50 | 43 | ||||||||||||||||||||||||||||||||||||||
| Other components of equity | 4 | 5 | 6 | 6 | ||||||||||||||||||||||||||||||||||||||
The following table reconciles the opening and closing allowance for each major product of loans and commitments as determined by our modelled, scenario-weighted allowance and the application of expert credit judgment as applicable. Reconciling items include the following:
| • | Transfers between stages, which are presumed to occur before any corresponding remeasurements of the allowance. |
| • | Originations, which reflect the allowance related to assets newly recognized during the period, including those assets that were derecognized following a modification of terms. |
| • | Maturities, which reflect the allowance related to assets derecognized during the period without a credit loss being incurred, including those assets that were derecognized following a modification of terms. |
| • | Changes in risk, parameters and exposures, which comprise the impact of changes in model inputs or assumptions, including changes in forward-looking macroeconomic conditions; partial repayments and additional draws on existing facilities; changes in the measurement following a transfer between stages; and unwinding of the time value discount due to the passage of time in stage 1 and stage 2. |
Royal Bank of Canada
Allowance for credit losses – Retail and wholesale loans
| For the three months ended | ||||||||||||||||||||||||||||||||||||||
January 31, 2025 | January 31, 2024 | |||||||||||||||||||||||||||||||||||||
Performing | Impaired | Performing | Impaired | |||||||||||||||||||||||||||||||||||
| (Millions of Canadian dollars) | Stage 1 | Stage 2 | Stage 3 | Total | Stage 1 | Stage 2 | Stage 3 | Total | ||||||||||||||||||||||||||||||
Residential mortgages | ||||||||||||||||||||||||||||||||||||||
| Balance at beginning of period | $ | 215 | $ | 126 | $ | 231 | $ | 572 | $ | 223 | $ | 90 | $ | 168 | $ | 481 | ||||||||||||||||||||||
| Provision for credit losses | ||||||||||||||||||||||||||||||||||||||
| Transfers to stage 1 | 25 | (25 | ) | – | – | 17 | (17 | ) | – | – | ||||||||||||||||||||||||||||
| Transfers to stage 2 | (4 | ) | 6 | (2 | ) | – | (6 | ) | 10 | (4 | ) | – | ||||||||||||||||||||||||||
| Transfers to stage 3 | (1 | ) | (14 | ) | 15 | – | (1 | ) | (8 | ) | 9 | – | ||||||||||||||||||||||||||
| Originations | 23 | – | – | 23 | 19 | – | – | 19 | ||||||||||||||||||||||||||||||
| Maturities | (5 | ) | (6 | ) | – | (11 | ) | (4 | ) | (4 | ) | – | (8 | ) | ||||||||||||||||||||||||
| Changes in risk, parameters and exposures | (37 | ) | 69 | 29 | 61 | (1 | ) | 40 | 24 | 63 | ||||||||||||||||||||||||||||
| Write-offs | – | – | (4 | ) | (4 | ) | – | – | (4 | ) | (4 | ) | ||||||||||||||||||||||||||
| Recoveries | – | – | 2 | 2 | – | – | 3 | 3 | ||||||||||||||||||||||||||||||
| Exchange rate and other | 2 | 2 | (11 | ) | (7 | ) | (2 | ) | (1 | ) | (9 | ) | (12 | ) | ||||||||||||||||||||||||
| Balance at end of period | $ | 218 | $ | 158 | $ | 260 | $ | 636 | $ | 245 | $ | 110 | $ | 187 | $ | 542 | ||||||||||||||||||||||
Personal | ||||||||||||||||||||||||||||||||||||||
| Balance at beginning of period | $ | 305 | $ | 966 | $ | 211 | $ | 1,482 | $ | 280 | $ | 793 | $ | 155 | $ | 1,228 | ||||||||||||||||||||||
| Provision for credit losses | ||||||||||||||||||||||||||||||||||||||
| Transfers to stage 1 | 144 | (144 | ) | – | – | 125 | (125 | ) | – | – | ||||||||||||||||||||||||||||
| Transfers to stage 2 | (21 | ) | 24 | (3 | ) | – | (19 | ) | 20 | (1 | ) | – | ||||||||||||||||||||||||||
| Transfers to stage 3 | (1 | ) | (39 | ) | 40 | – | (1 | ) | (28 | ) | 29 | – | ||||||||||||||||||||||||||
| Originations | 28 | – | – | 28 | 22 | – | – | 22 | ||||||||||||||||||||||||||||||
| Maturities | (13 | ) | (53 | ) | – | (66 | ) | (12 | ) | (46 | ) | – | (58 | ) | ||||||||||||||||||||||||
| Changes in risk, parameters and exposures | (136 | ) | 254 | 167 | 285 | (114 | ) | 229 | 123 | 238 | ||||||||||||||||||||||||||||
| Write-offs | – | – | (223 | ) | (223 | ) | – | – | (169 | ) | (169 | ) | ||||||||||||||||||||||||||
| Recoveries | – | – | 34 | 34 | – | – | 30 | 30 | ||||||||||||||||||||||||||||||
| Exchange rate and other | (1 | ) | 1 | (6 | ) | (6 | ) | (1 | ) | – | (3 | ) | (4 | ) | ||||||||||||||||||||||||
| Balance at end of period | $ | 305 | $ | 1,009 | $ | 220 | $ | 1,534 | $ | 280 | $ | 843 | $ | 164 | $ | 1,287 | ||||||||||||||||||||||
Credit cards | ||||||||||||||||||||||||||||||||||||||
| Balance at beginning of period | $ | 207 | $ | 1,026 | $ | – | $ | 1,233 | $ | 203 | $ | 866 | $ | – | $ | 1,069 | ||||||||||||||||||||||
| Provision for credit losses | ||||||||||||||||||||||||||||||||||||||
| Transfers to stage 1 | 155 | (155 | ) | – | – | 137 | (137 | ) | – | – | ||||||||||||||||||||||||||||
| Transfers to stage 2 | (28 | ) | 28 | – | – | (28 | ) | 28 | – | – | ||||||||||||||||||||||||||||
| Transfers to stage 3 | (1 | ) | (137 | ) | 138 | – | (1 | ) | (108 | ) | 109 | – | ||||||||||||||||||||||||||
| Originations | 2 | – | – | 2 | 3 | – | – | 3 | ||||||||||||||||||||||||||||||
| Maturities | (1 | ) | (12 | ) | – | (13 | ) | (1 | ) | (8 | ) | – | (9 | ) | ||||||||||||||||||||||||
| Changes in risk, parameters and exposures | (128 | ) | 307 | 55 | 234 | (125 | ) | 272 | 42 | 189 | ||||||||||||||||||||||||||||
| Write-offs | – | – | (234 | ) | (234 | ) | – | – | (259 | ) | (259 | ) | ||||||||||||||||||||||||||
| Recoveries | – | – | 41 | 41 | – | – | 109 | 109 | ||||||||||||||||||||||||||||||
| Exchange rate and other | – | 1 | – | 1 | – | – | (1 | ) | (1 | ) | ||||||||||||||||||||||||||||
| Balance at end of period | $ | 206 | $ | 1,058 | $ | – | $ | 1,264 | $ | 188 | $ | 913 | $ | – | $ | 1,101 | ||||||||||||||||||||||
Small business | ||||||||||||||||||||||||||||||||||||||
| Balance at beginning of period | $ | 80 | $ | 86 | $ | 106 | $ | 272 | $ | 70 | $ | 66 | $ | 58 | $ | 194 | ||||||||||||||||||||||
| Provision for credit losses | ||||||||||||||||||||||||||||||||||||||
| Transfers to stage 1 | 13 | (13 | ) | – | – | 5 | (5 | ) | – | – | ||||||||||||||||||||||||||||
| Transfers to stage 2 | (4 | ) | 4 | – | – | (5 | ) | 5 | – | – | ||||||||||||||||||||||||||||
| Transfers to stage 3 | – | (3 | ) | 3 | – | – | (2 | ) | 2 | – | ||||||||||||||||||||||||||||
| Originations | 9 | – | – | 9 | 9 | – | – | 9 | ||||||||||||||||||||||||||||||
| Maturities | (6 | ) | (5 | ) | – | (11 | ) | (3 | ) | (5 | ) | – | (8 | ) | ||||||||||||||||||||||||
| Changes in risk, parameters and exposures | (13 | ) | 18 | 43 | 48 | (5 | ) | 15 | 26 | 36 | ||||||||||||||||||||||||||||
| Write-offs | – | – | (29 | ) | (29 | ) | – | – | (18 | ) | (18 | ) | ||||||||||||||||||||||||||
| Recoveries | – | – | 5 | 5 | – | – | 3 | 3 | ||||||||||||||||||||||||||||||
| Exchange rate and other | 1 | – | (6 | ) | (5 | ) | 1 | – | (5 | ) | (4 | ) | ||||||||||||||||||||||||||
| Balance at end of period | $ | 80 | $ | 87 | $ | 122 | $ | 289 | $ | 72 | $ | 74 | $ | 66 | $ | 212 | ||||||||||||||||||||||
Wholesale | ||||||||||||||||||||||||||||||||||||||
| Balance at beginning of period | $ | 787 | $ | 1,038 | $ | 968 | $ | 2,793 | $ | 774 | $ | 785 | $ | 767 | $ | 2,326 | ||||||||||||||||||||||
| Provision for credit losses | ||||||||||||||||||||||||||||||||||||||
| Transfers to stage 1 | 55 | (55 | ) | – | – | 50 | (50 | ) | – | – | ||||||||||||||||||||||||||||
| Transfers to stage 2 | (21 | ) | 30 | (9 | ) | – | (55 | ) | 58 | (3 | ) | – | ||||||||||||||||||||||||||
| Transfers to stage 3 | (2 | ) | (135 | ) | 137 | – | (3 | ) | (9 | ) | 12 | – | ||||||||||||||||||||||||||
| Originations | 236 | – | – | 236 | 124 | – | – | 124 | ||||||||||||||||||||||||||||||
| Maturities | (186 | ) | (100 | ) | – | (286 | ) | (97 | ) | (87 | ) | – | (184 | ) | ||||||||||||||||||||||||
| Changes in risk, parameters and exposures | (48 | ) | 190 | 372 | 514 | (101 | ) | 173 | 317 | 389 | ||||||||||||||||||||||||||||
| Write-offs | – | – | (91 | ) | (91 | ) | – | – | (160 | ) | (160 | ) | ||||||||||||||||||||||||||
| Recoveries | – | – | 12 | 12 | – | – | 11 | 11 | ||||||||||||||||||||||||||||||
| Exchange rate and other | 14 | 24 | (6 | ) | 32 | 17 | (17 | ) | (61 | ) | (61 | ) | ||||||||||||||||||||||||||
| Balance at end of period | $ | 835 | $ | 992 | $ | 1,383 | $ | 3,210 | $ | 709 | $ | 853 | $ | 883 | $ | 2,445 | ||||||||||||||||||||||
62 First Quarter 2025
Royal Bank of Canada
Note 5 Loans and allowance for credit losses (continued) |
Key inputs and assumptions
The following provides an update on the key inputs and assumptions used in the measurement of expected credit losses. For further details, refer to Note 2 and Note 5 of our audited 2024 Annual Consolidated Financial Statements.
Our base scenario reflects rising unemployment rates in the near-term in Canada and the U.S. Central bank policy interest rate cuts are expected to continue in Canada as inflation declines and the economy remains weak. The U.S. central bank policy rate is expected to remain unchanged for the medium term due to resilient U.S. economic growth and lower unemployment rates, which places upward pressure on U.S. inflation.
Downside scenarios, including two additional and more severe downside scenarios designed for the real estate and energy sectors, reflect the possibility of a more severe macroeconomic shock beginning in calendar Q2 2025 relative to our base scenario. In these scenarios, conditions are expected to deteriorate from calendar Q1 2025 levels for up to 18 months, followed by a recovery for the remainder of the period.
These scenarios assume monetary policy responses that return the economy to a
long-run,
sustainable growth rate within the forecast period.The upside scenario reflects slightly stronger economic growth than the base scenario, without prompting a further offsetting monetary policy response as compared to our base scenario, followed by a return to a
long-run
sustainable growth rate within the forecast period.Protectionist U.S. trade polic
y
, including the imposition of tariffs, is giving rise to heightened economic uncertainty globally. Broad-based tariffs implemented over an extended duration pose a downside risk to the economic outlook included in our base scenario, with the potential to drive recession outcomes. Our downside scenarios reflect the possibility for a wide range of macroeconomic shocks, including more severe recessionary forecasts than are expected for reasonably possible tariff outcomes. Our scenario weights consider the downside risk and the uncertainty present as at January 31, 2025. Subsequent changes to our forecast and related estimates will be reflected in our allowance for credit losses in future periods.On February 1, 2025, the U.S. government implemented broad-based tariffs on Canada, Mexico and China, which resulted in those governments announcing retaliatory measures. Subsequently, on February 3, 2025, the Canadian and Mexican tariffs were delayed by 30 days. On February 10, 2025, the U.S. government imposed additional tariffs on steel and aluminum imports, to be effective March 12, 2025. The final details of these tariffs, including extent, duration, retaliatory measures and impacts on the broader economy continue to remain
uncertain.
Royal Bank of Canada
The
following
provides additional detail about our calendar quarter forecasts for certain key macroeconomic variables used in the models to estimate the allowance for credit losses:| • | Unemployment rates – In our base forecast, we expect the Canadian unemployment rate to rise to 6.9% in calendar Q1 2025, peaking at 7.0% in calendar Q2 2025, then returning to its long run equilibrium by calendar Q1 2028. The U.S. unemployment rate is expected to rise to 4.2% in calendar Q1 2025, then increase to its long run equilibrium level by calendar Q3 2027. |
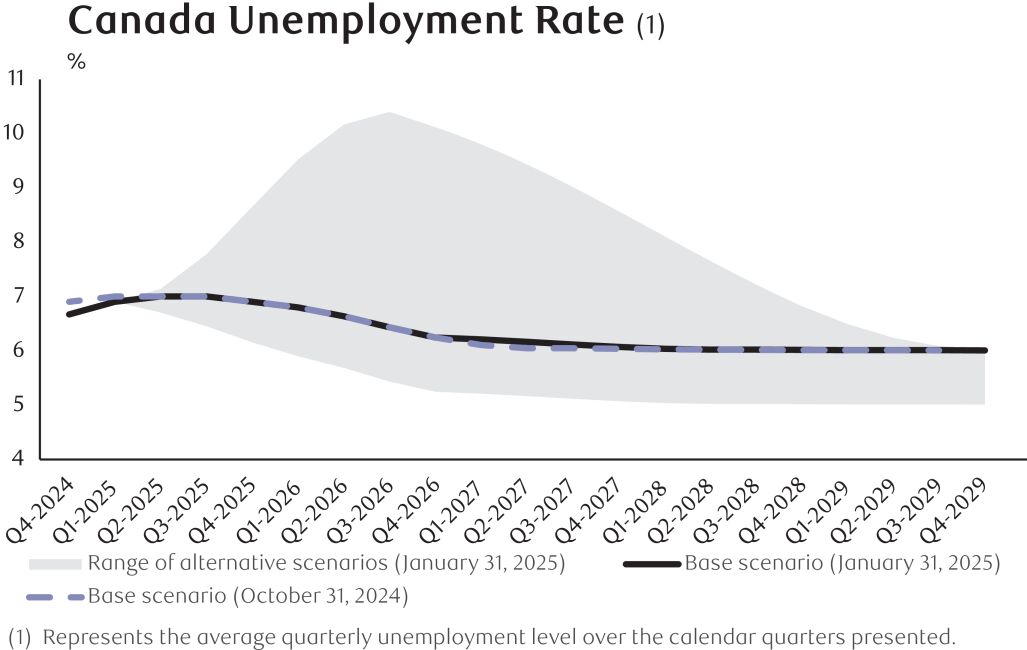 |  |
| • | Gross Domestic Product (GDP ) |
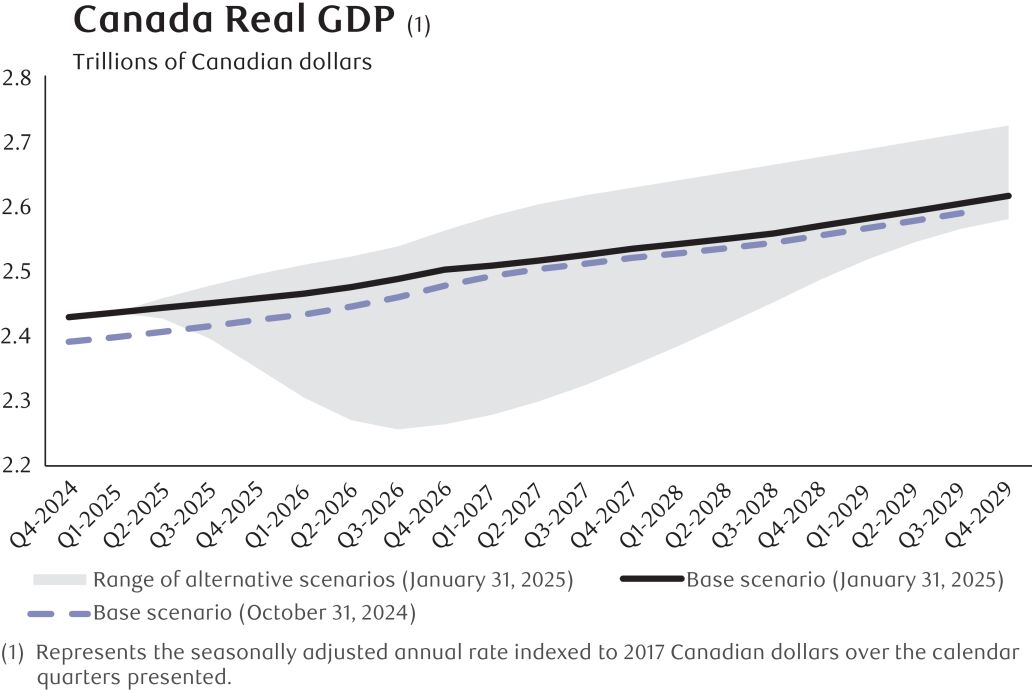 |  |
| • | Canadian housing price index |
| • | Oil price (West Texas Intermediate in US$) – In our base forecast, we expect oil prices to average $65 per barrel over the next 12 months from calendar Q1 2025 and $64 per barrel in the following 2 to 5 years. The range of average prices in our alternative downside and upside scenarios is $26 to $84 per barrel for the next 12 months and $43 to $70 per barrel for the following 2 to 5 years. As at October 31, 2024 , our base forecast included an average price of $69 per barrel for the next 12 months and $66 per barrel for the following 2 to 5 years. |
64 First Quarter 2025
Royal Bank of Canada
Note 5 Loans and allowance for credit losses (continued) |
Credit risk exposure by internal risk rating
The following table presents the gross carrying amount of loans measured at amortized cost, and the full contractual amount of undrawn loan commitments subject to the impairment requirements of IFRS 9. Risk ratings are based on internal ratings used in the measurement of expected credit losses as at the reporting date, as outlined in the internal ratings maps for Wholesale and Retail facilities in the Credit risk section of our 2024 Annual Report.
Financial Instruments
As at | ||||||||||||||||||||||||||||||||||
January 31, 2025 | October 31, 2024 | |||||||||||||||||||||||||||||||||
| (Millions of Canadian dollars) | Stage 1 | Stage 2 | Stage 3 | Total | Stage 1 | Stage 2 | Stage 3 (1) | Total | ||||||||||||||||||||||||||
Retail | ||||||||||||||||||||||||||||||||||
Loans outstanding – Residential mortgages | ||||||||||||||||||||||||||||||||||
| Low risk | $ | 390,911 | $ | 1,340 | $ | – | $ | 392,251 | $ | 388,742 | $ | 1,354 | $ | – | $ | 390,096 | ||||||||||||||||||
| Medium risk | 19,584 | 3,268 | – | 22,852 | 18,419 | 4,479 | – | 22,898 | ||||||||||||||||||||||||||
| High risk | 1,903 | 6,788 | – | 8,691 | 1,761 | 6,593 | – | 8,354 | ||||||||||||||||||||||||||
Not rated (2) | 53,440 | 2,433 | – | 55,873 | 52,569 | 1,479 | – | 54,048 | ||||||||||||||||||||||||||
| Impaired | – | – | 1,390 | 1,390 | – | – | 1,233 | 1,233 | ||||||||||||||||||||||||||
465,838 | 13,829 | 1,390 | 481,057 | 461,491 | 13,905 | 1,233 | 476,629 | |||||||||||||||||||||||||||
Items not subject to impairment (3) | 865 | 915 | ||||||||||||||||||||||||||||||||
| Total | $ | 481,922 | $ | 477,544 | ||||||||||||||||||||||||||||||
Loans outstanding – Personal | ||||||||||||||||||||||||||||||||||
| Low risk | $ | 84,776 | $ | 1,476 | $ | – | $ | 86,252 | $ | 82,904 | $ | 1,680 | $ | – | $ | 84,584 | ||||||||||||||||||
| Medium risk | 5,001 | 3,051 | – | 8,052 | 5,525 | 3,063 | – | 8,588 | ||||||||||||||||||||||||||
| High risk | 692 | 2,444 | – | 3,136 | 592 | 2,365 | – | 2,957 | ||||||||||||||||||||||||||
Not rated (2) | 11,787 | 606 | – | 12,393 | 11,303 | 498 | – | 11,801 | ||||||||||||||||||||||||||
| Impaired | – | – | 414 | 414 | – | – | 408 | 408 | ||||||||||||||||||||||||||
| Total | $ | 102,256 | $ | 7,577 | $ | 414 | $ | 110,247 | $ | 100,324 | $ | 7,606 | $ | 408 | $ | 108,338 | ||||||||||||||||||
Loans outstanding – Credit cards | ||||||||||||||||||||||||||||||||||
| Low risk | $ | 17,185 | $ | 175 | $ | – | $ | 17,360 | $ | 17,363 | $ | 177 | $ | – | $ | 17,540 | ||||||||||||||||||
| Medium risk | 1,944 | 2,352 | – | 4,296 | 1,999 | 2,436 | – | 4,435 | ||||||||||||||||||||||||||
| High risk | 69 | 2,285 | – | 2,354 | 75 | 2,289 | – | 2,364 | ||||||||||||||||||||||||||
Not rated (2) | 1,161 | 60 | – | 1,221 | 1,173 | 53 | – | 1,226 | ||||||||||||||||||||||||||
| Total | $ | 20,359 | $ | 4,872 | $ | – | $ | 25,231 | $ | 20,610 | $ | 4,955 | $ | – | $ | 25,565 | ||||||||||||||||||
Loans outstanding – Small business | ||||||||||||||||||||||||||||||||||
| Low risk | $ | 9,883 | $ | 664 | $ | – | $ | 10,547 | $ | 9,428 | $ | 773 | $ | – | $ | 10,201 | ||||||||||||||||||
| Medium risk | 2,759 | 931 | – | 3,690 | 2,740 | 962 | – | 3,702 | ||||||||||||||||||||||||||
| High risk | 241 | 1,152 | – | 1,393 | 214 | 1,086 | – | 1,300 | ||||||||||||||||||||||||||
Not rated (2) | 6 | – | – | 6 | 7 | – | – | 7 | ||||||||||||||||||||||||||
| Impaired | – | – | 364 | 364 | – | – | 321 | 321 | ||||||||||||||||||||||||||
| Total | $ | 12,889 | $ | 2,747 | $ | 364 | $ | 16,000 | $ | 12,389 | $ | 2,821 | $ | 321 | $ | 15,531 | ||||||||||||||||||
Undrawn loan commitments – Retail | ||||||||||||||||||||||||||||||||||
| Low risk | $ | 289,662 | $ | 789 | $ | – | $ | 290,451 | $ | 284,036 | $ | 592 | $ | – | $ | 284,628 | ||||||||||||||||||
| Medium risk | 12,243 | 442 | – | 12,685 | 12,110 | 381 | – | 12,491 | ||||||||||||||||||||||||||
| High risk | 778 | 759 | – | 1,537 | 746 | 602 | – | 1,348 | ||||||||||||||||||||||||||
Not rated (2) | 10,689 | 131 | – | 10,820 | 10,715 | 88 | – | 10,803 | ||||||||||||||||||||||||||
| Total | $ | 313,372 | $ | 2,121 | $ | – | $ | 315,493 | $ | 307,607 | $ | 1,663 | $ | – | $ | 309,270 | ||||||||||||||||||
Wholesale – Loans outstanding | ||||||||||||||||||||||||||||||||||
| Investment grade | $ | 121,571 | $ | 1,617 | $ | – | $ | 123,188 | $ | 116,549 | $ | 1,471 | $ | – | $ | 118,020 | ||||||||||||||||||
Non-investment grade | 195,781 | 25,961 | – | 221,742 | 189,889 | 26,826 | – | 216,715 | ||||||||||||||||||||||||||
Not rated (2) | 13,554 | 697 | – | 14,251 | 12,871 | 721 | – | 13,592 | ||||||||||||||||||||||||||
| Impaired | – | – | 5,708 | 5,708 | – | – | 3,905 | 3,905 | ||||||||||||||||||||||||||
330,906 | 28,275 | 5,708 | 364,889 | 319,309 | 29,018 | 3,905 | 352,232 | |||||||||||||||||||||||||||
Items not subject to impairment (3) | 14,361 | 8,207 | ||||||||||||||||||||||||||||||||
| Total | $ | 379,250 | $ | 360,439 | ||||||||||||||||||||||||||||||
Undrawn loan commitments – Wholesale | ||||||||||||||||||||||||||||||||||
| Investment grade | $ | 355,501 | $ | 794 | $ | – | $ | 356,295 | $ | 345,236 | $ | 516 | $ | – | $ | 345,752 | ||||||||||||||||||
Non-investment grade | 175,491 | 14,961 | – | 190,452 | 170,212 | 14,512 | – | 184,724 | ||||||||||||||||||||||||||
Not rated (2) | 3,646 | 19 | – | 3,665 | 3,290 | 17 | – | 3,307 | ||||||||||||||||||||||||||
| Total | $ | 534,638 | $ | 15,774 | $ | – | $ | 550,412 | $ | 518,738 | $ | 15,045 | $ | – | $ | 533,783 | ||||||||||||||||||
| (1) | Includes $87 million of purchased credit-impaired loans (October 31, 2024 – $109 million). |
| (2) | In certain cases where an internal risk rating is not assigned, we use other approved credit risk assessment or rating methodologies, policies and tools to manage our credit risk. |
| (3) | Items not subject to impairment are loans held at FVTPL. |
Loans past due but not impaired
(1), (2)
| As at | ||||||||||||||||||||||||||
January 31, 2025 | October 31, 2024 | |||||||||||||||||||||||||
| (Millions of Canadian dollars) | 30 to 89 days | 90 days and greater | Total | 30 to 89 days | 90 days and greater | Total | ||||||||||||||||||||
| Retail | $ | 2,824 | $ | 282 | $ | 3,106 | $ | 2,542 | $ | 263 | $ | 2,805 | ||||||||||||||
| Wholesale | 1,927 | 16 | 1,943 | 1,454 | 4 | 1,458 | ||||||||||||||||||||
$ | 4,751 | $ | 298 | $ | 5,049 | $ | 3,996 | $ | 267 | $ | 4,263 | |||||||||||||||
| (1) | Excludes loans less than 30 days past due as they are not generally representative of the borrowers’ ability to meet their payment obligations. |
| (2) | Amounts presented may include loans past due as a result of administrative processes, such as mortgage loans on which payments are restrained pending payout due to sale or refinancing. Past due loans arising from administrative processes are not representative of the borrowers’ ability to meet their payment obligations. |
Royal Bank of Canada
Note 6 Deposits |
| As at | ||||||||||||||||||||||||||||||||||
January 31, 2025 | October 31, 2024 | |||||||||||||||||||||||||||||||||
| (Millions of Canadian dollars) | Demand | Notice | Term | Total | Demand (1) | Notice (2) | Term (3) | Total | ||||||||||||||||||||||||||
| Personal | $ | 218,021 | $ | 68,036 | $ | 249,557 | $ | 535,614 | $ | 205,714 | $ | 62,845 | $ | 253,580 | $ | 522,139 | ||||||||||||||||||
| Business and government | 382,232 | 20,514 | 468,513 | 871,259 | 369,943 | 20,157 | 449,570 | 839,670 | ||||||||||||||||||||||||||
| Bank | 10,989 | 2 | 24,076 | 35,067 | 9,675 | 641 | 37,406 | 47,722 | ||||||||||||||||||||||||||
$ | 611,242 | $ | 88,552 | $ | 742,146 | $ | 1,441,940 | $ | 585,332 | $ | 83,643 | $ | 740,556 | $ | 1,409,531 | |||||||||||||||||||
Non-interest-bearing (4) | ||||||||||||||||||||||||||||||||||
| Canada | $ | 150,867 | $ | 8,062 | $ | 218 | $ | 159,147 | $ | 144,712 | $ | 7,164 | $ | 203 | $ | 152,079 | ||||||||||||||||||
| United States | 35,748 | – | – | 35,748 | 38,520 | – | – | 38,520 | ||||||||||||||||||||||||||
Europe (5) | 297 | – | – | 297 | 11 | – | – | 11 | ||||||||||||||||||||||||||
| Other International | 8,210 | – | – | 8,210 | 7,758 | – | – | 7,758 | ||||||||||||||||||||||||||
Interest-bearing (4) | ||||||||||||||||||||||||||||||||||
| Canada | 372,829 | 16,395 | 583,255 | 972,479 | 355,221 | 14,468 | 594,066 | 963,755 | ||||||||||||||||||||||||||
| United States | 30,248 | 63,147 | 72,123 | 165,518 | 28,389 | 61,087 | 75,933 | 165,409 | ||||||||||||||||||||||||||
Europe (5) | 7,080 | 838 | 64,694 | 72,612 | 5,013 | 851 | 53,295 | 59,159 | ||||||||||||||||||||||||||
| Other International | 5,963 | 110 | 21,856 | 27,929 | 5,708 | 73 | 17,059 | 22,840 | ||||||||||||||||||||||||||
$ | 611,242 | $ | 88,552 | $ | 742,146 | $ | 1,441,940 | $ | 585,332 | $ | 83,643 | $ | 740,556 | $ | 1,409,531 | |||||||||||||||||||
| (1) | Demand deposits are deposits for which we do not have the right to require notice of withdrawal, which include both savings and chequing accounts. |
| (2) | Notice deposits are deposits for which we can legally require notice of withdrawal. These deposits are primarily savings accounts. |
| (3) | Term deposits are deposits payable on a fixed date, and include term deposits, guaranteed investment certificates and similar instruments. |
| (4) | The geographical splits of the deposits are based on the point of origin of the deposits and where the revenue is recognized. As at January 31, 2025, deposits denominated in U.S. dollars, British pounds, Euro and other foreign currencies were $528 billion, $36 billion, $61 billion and $32 billion, respectively (October 31, 2024 – $511 billion, $34 billion, $53 billion and $29 billion, respectively). |
| (5) | Europe includes the United Kingdom and the Channel Islands. |
Contractual maturities of term deposits
(1)
| As at | ||||||||
(Millions of Canadian dollars) | January 31 2025 | October 31 2024 | ||||||
Within 1 year: | ||||||||
less than 3 months | $ | 185,514 | $ | 207,698 | ||||
3 to 6 months | 109,311 | 94,585 | ||||||
6 to 12 months | 174,958 | 173,603 | ||||||
1 to 2 years | 88,196 | 79,777 | ||||||
2 to 3 years | 56,649 | 61,175 | ||||||
3 to 4 years | 43,665 | 45,767 | ||||||
4 to 5 years | 17,665 | 20,692 | ||||||
Over 5 years | 66,188 | 57,259 | ||||||
$ | 742,146 | $ | 740,556 | |||||
| (1) | The aggregate amount of term deposits in denominations of one hundred thousand dollars or more is $674 billion (October 31, 2024 – $670 billion). |
Note 7 Insurance and reinsurance |
Insurance service and insurance investment results
The following table provides the composition of Insurance service result and Insurance investment result for insurance contracts issued and reinsurance contracts held.
| For the three months ended | ||||||||
(Millions of Canadian dollars) | January 31 2025 | January 31 2024 | ||||||
Insurance service result | ||||||||
Insurance revenue | $ | 1,408 | $ | 1,205 | ||||
Insurance service expense | (1,124 | ) | (984 | ) | ||||
Net income (expense) from reinsurance contracts held | 2 | (34 | ) | |||||
$ | 286 | $ | 187 | |||||
Insurance investment result | ||||||||
Net investment income | $ | 370 | $ | 2,018 | ||||
Insurance finance income (expense) | (300 | ) | (1,976 | ) | ||||
Reinsurance finance income (expense) | 12 | 99 | ||||||
$ | 82 | $ | 141 | |||||
Insurance service and insurance investment results | $ | 368 | $ | 328 | ||||
66 First Quarter 2025
Royal Bank of Canada
Note 8 Employee benefits – Pension and other post-employment benefits |
We offer a number of defined benefit and defined contribution plans which provide pension and post-employment benefits to eligible employees. The following tables present the composition of our pension and other post-employment benefit expense and the effects of remeasurements recorded in OCI:
Pension and other post-employment benefit expense
| For the three months ended | ||||||||||||||||||
| Pension plans | Other post-employment benefit plans | |||||||||||||||||
| (Millions of Canadian dollars) | January 31 2025 | January 31 2024 | January 31 2025 | January 31 2024 | ||||||||||||||
| Current service costs | $ | 52 | $ | 46 | $ | 8 | $ | 8 | ||||||||||
| Net interest expense (income) | (40 | ) | (38 | ) | 19 | 20 | ||||||||||||
| Remeasurements of other long-term benefits | – | – | 2 | 10 | ||||||||||||||
| Administrative expense | 6 | 4 | – | – | ||||||||||||||
| Defined benefit pension expense | 18 | 12 | 29 | 38 | ||||||||||||||
| Defined contribution pension expense | 157 | 106 | – | – | ||||||||||||||
$ | 175 | $ | 118 | $ | 29 | $ | 38 | |||||||||||
Pension and other post-employment benefit remeasurements
(1)
| For the three months ended | ||||||||||||||||||
| Defined benefit pension plans | Other post-employment benefit plans | |||||||||||||||||
| (Millions of Canadian dollars) | January 31 2025 | January 31 2024 | January 31 2025 | January 31 2024 | ||||||||||||||
| Actuarial (gains) losses: | ||||||||||||||||||
Changes in financial assumptions (2) | $ | 343 | $ | 1,271 | $ | 34 | $ | 120 | ||||||||||
| Experience adjustments | – | – | – | 1 | ||||||||||||||
| Return on plan assets (excluding interest based on discount rate) | (429 | ) | (1,469 | ) | – | – | ||||||||||||
$ | (86 | ) | $ | (198 | ) | $ | 34 | $ | 121 | |||||||||
| (1) | Market based assumptions, including Changes in financial assumptions and Return on plan assets, are reviewed on a quarterly basis. All other assumptions are updated during our annual review of plan assumptions. |
| (2) | Changes in financial assumptions in our defined benefit pension plans primarily relate to changes in discount rates. |
Note 9 Income taxes |
Pillar Two legislation
The Organisation for Economic
Co-operation
and Development’s
two-pillar
plan includes a
15
% global
minimum corporate tax on certain multinational enterprises (Pillar Two). Pillar Two legislation in certain countries in which RBC operates became effective for us beginning November 1, 2024, including the Global Minimum Tax Act (GMTA) in Canada, which increased RBC’s effective tax rate by approximately 1.6% for the three months ended January 31, 2025.
Note 10 Significant capital and funding transactions |
Preferred shares and other equity instruments
On November 1, 2024, we issued US$1,000 million of Limited Recourse Capital Notes Series 5 (LRCN Series 5) with recourse limited to assets (Trust Assets) held by a
third-party
trustee in a consolidated trust (Limited Recourse Trust). The Trust Assets consist of US$1,000 million of our First Preferred Shares, Series BX (Series BX Preferred Shares), issued concurrently with LRCN Series 5 at a price of US$1,000 per Series BX Preferred Share.The price per LRCN Series 5 note is US$1,000 and will bear interest paid quarterly at a fixed rate of 6.35% per annum until November 24, 2034
and thereafter at a rate per annum, reset every fifth year, equal to the prevailing 5-year U.S. Treasury Rate plus
2.257% until maturity on November 24, 2084. In the event of(i) non-payment
of interest on any interest payment date,(ii) non-payment
of the redemption price in case of a redemption of LRCN Series 5, (iii)non-payment
of principal at the maturity of LRCN Series 5, or (iv) an event of default on the notes, noteholders will have recourse only to the Trust Assets and each noteholder will be entitled to receive its pro rata share of the Trust Assets. In such an event, the delivery of the Trust Assets will represent the full and complete extinguishment of our obligations under LRCN Series 5.LRCN Series 5 are redeemable on or prior to maturity to the extent we redeem Series BX Preferred Shares on certain redemption dates as set out in the terms of Series BX Preferred Shares and subject to the consent and approval of OSFI.
Royal Bank of Canada
The terms of Series BX Preferred Shares and LRCN Series 5 include NVCC provisions necessary for them to qualify as Tier 1 regulatory capital under Basel III. NVCC provisions require the conversion of the instrument into a variable number of common shares in the event that OSFI deems the Bank
non-viable
or a federal or provincial government in Canada publicly announces that the Bank has accepted or agreed to accept a capital injection. In such an event, LRCN Series 5 will be automatically redeemed and the redemption price will be satisfied by the delivery of the Trust Assets, which will consist of common shares pursuant to an automatic conversion of Series BX Preferred Shares. The terms of Series BX Preferred Shares include an automatic conversion formula with a conversion price based on the greater of: (i) a floor price
o
f $5.00 (subject to adjustment in certain circumstances), and (ii) the current market price of our common shares based on the volume weighted average trading price of our common shares on the Toronto Stock Exchange. The number of common shares issued in respect of each Series BX Preferred Share will be determined by dividing the share value of Series BX Preferred Shares (including declared and unpaid dividends) by the conversion price. The number of common shares delivered to each noteholder will be based on such noteholder’s pro rata interest in the Trust Assets.LRCN Series 5 are compound instruments with both equity and liability features as payments of interest and principal in cash are made at our discretion. The
non-payment
of interest and principal in cash does not constitute an event of default and will trigger delivery of Series BX Preferred Shares. The liability component of the notes has a nominal value and, as a result, the full proceeds received have been presented as equity.Subordinated debentures
On December 23, 2024, we redeemed all $1,500 million of our outstanding NVCC 2.88% subordinated debentures due December 23, 2029 for 100% of their principal amount plus interest accrued to, but excluding, the redemption date.
On January 29, 2025, we issued $1,500 million of NVCC subordinated debentures. The notes bear interest at a fixed rate of 4.279% per annum until February 4, 2030, and at the Daily Compounded Canadian Overnight Repo Rate Average plus 1.45% thereafter until maturity on February 4, 2035.
Common shares issued
| For the three months ended | ||||||||||||||||||
January 31, 2025 | January 31, 2024 | |||||||||||||||||
| (Millions of Canadian dollars, except number of shares) | Number of shares (thousands) | Amount | Number of shares (thousands) | Amount | ||||||||||||||
Issued in connection with share-based compensation plans (1) | 216 | $ | 22 | 400 | $ | 38 | ||||||||||||
Issued in connection with dividend reinvestment plan (2) | – | – | 6,135 | 720 | ||||||||||||||
Purchased for cancellation (3) | (1,942 | ) | (29 | ) | – | – | ||||||||||||
(1,726 | ) | $ | (7 | ) | 6,535 | $ | 758 | |||||||||||
| (1) | Amounts include cash received for stock options exercised during the period and the fair value adjustment to stock options. |
| (2) | The requirements of our dividend reinvestment plan (DRIP) are satisfied through either open market share purchases or shares issued from treasury. During the three months ended January 31, 2025, the requirements of our DRIP were satisfied through open market share purchases. For the three months ended January 31, 2024, the requirements of our DRIP were satisfied through shares issued from treasury. |
| (3) | During the three months ended January 31, 2025, under the NCIB we purchased for cancellation common shares at a total fair value of $338 million (average cost of $174.00 per share), with a book value of $29 million (book value of $14.85per share). During the three months ended January 31, 2024, we did not have an active NCIB and therefore we did not purchase any common shares for cancellation. |
Note 1 1 Earnings per share |
| For the three months ended | ||||||||
| (Millions of Canadian dollars, except share and per share amounts) | January 31 2025 | January 31 2024 | ||||||
Basic earnings per share | ||||||||
| Net income | $ | 5,131 | $ | 3,582 | ||||
| Dividends on preferred shares and distributions on other equity instruments | (118 | ) | (58 | ) | ||||
Net income attributable to non-controlling interests | (2 | ) | (2 | ) | ||||
| Net income available to common shareholders | $ | 5,011 | $ | 3,522 | ||||
| Weighted average number of common shares (in thousands) | 1,413,937 | 1,406,324 | ||||||
| Basic earnings per share (in dollars) | $ | 3.54 | $ | 2.50 | ||||
Diluted earnings per share | ||||||||
| Net income available to common shareholders | $ | 5,011 | $ | 3,522 | ||||
| Weighted average number of common shares (in thousands) | 1,413,937 | 1,406,324 | ||||||
Stock options (1) | 2,565 | 1,291 | ||||||
| Issuable under other share-based compensation plans | – | 26 | ||||||
| Average number of diluted common shares (in thousands) | 1,416,502 | 1,407,641 | ||||||
| Diluted earnings per share (in dollars) | $ | 3.54 | $ | 2.50 | ||||
| (1) | The dilutive effect of stock options was calculated using the treasury stock method. When the exercise price of options outstanding is greater than the average market price of our common shares, the options are excluded from the calculation of diluted earnings per share. For the three months ended January 31, 2025, an average of 459,803 outstanding options with an average exercise price of $177.97 were excluded from the calculation of diluted earnings per share. For the three months ended January 31, 2024, an average of 2,216,903 outstanding options with an average exercise price of $130.78 were excluded from the calculation of diluted earnings per share. |
68 First Quarter 2025
Royal Bank of Canada
Note 12 Legal and regulatory matters |
We are a large global institution that is subject to many different complex legal and regulatory requirements that continue to evolve. We are and have been subject to a variety of legal proceedings, including civil claims and lawsuits, regulatory examinations, investigations, audits and requests for information by various governmental regulatory agencies and law enforcement authorities in various jurisdictions. Some of these matters may involve novel legal theories and interpretations and may be advanced under criminal as well as civil statutes, and some proceedings could result in the imposition of civil, regulatory enforcement or criminal penalties. We review the status of all proceedings on an ongoing basis and will exercise judgment in resolving them in such manner as we believe to be in our best interest. In many proceedings, it is inherently difficult to determine whether any loss is probable or to reliably estimate the amount of any loss. This is an area of significant judgment and uncertainty and the extent of our financial and other exposure to these proceedings after taking into account current provisions could be material to our results of operations in any particular period though we do not believe that the ultimate resolution of any such matter will have a material effect on our consolidated financial condition.
Our significant legal proceedings and regulatory matters are described in Note 24 of our audited 2024 Annual Consolidated Financial Statements and as updated below. Based on the facts currently known, except as may otherwise be noted, it is not possible at this time for us to predict the ultimate outcome of these proceedings or the timing of their resolution.
Royal Bank of Canada Trust Company (Bahamas) Limited proceedings
On January 17, 2025, the U.S. Department of Labor (DOL) proposed exemptive relief to allow Royal Bank of Canada to continue to qualify for the Qualified Professional Asset Manager (QPAM) exemption under the Employee Retirement Income Security Act from March 5, 2025 through March 4, 2030. On February 21, 2025, the DOL proposed to extend the effective period of the previously issued exemptive relief for up to six months. While there can be no assurances, we anticipate the issuance of the proposed exemptive relief, or the proposed extension of our existing relief, by March 5, 2025.
U.K. Competition and Markets Authority investigation
In February 2025, Royal Bank of Canada and RBC Europe Limited entered into a settlement with the U.K. Competition and Markets Authority and agreed to make payment of £34.2 million in full and final resolution of the matter.
Note 1 3 Results by business segment |
Composition of business segments
For management purposes, based on the products and services offered, we are organized into five business segments: Personal Banking, Commercial Banking, Wealth Management, Insurance and Capital Markets.
For the three months ended January 31, 2025 | ||||||||||||||||||||||||||||
| (Millions of Canadian dollars) | Personal Banking | Commercial Banking | Wealth Management | Insurance | Capital Markets | Corporate Support | Total | |||||||||||||||||||||
Net interest income (3) | $ | 3,505 | $ | 1,796 | $ | 1,394 | $ | – | $ | 918 | $ | 335 | $ | 7,948 | ||||||||||||||
Non-interest income | 1,306 | 331 | 4,174 | 406 | 2,838 | (264 | ) | 8,791 | ||||||||||||||||||||
| Total revenue | 4,811 | 2,127 | 5,568 | 406 | 3,756 | 71 | 16,739 | |||||||||||||||||||||
| Provision for credit losses | 488 | 339 | 81 | – | 142 | – | 1,050 | |||||||||||||||||||||
Non-interest expense | 2,015 | 710 | 4,204 | 87 | 2,041 | 199 | 9,256 | |||||||||||||||||||||
| Income (loss) before income taxes | 2,308 | 1,078 | 1,283 | 319 | 1,573 | (128 | ) | 6,433 | ||||||||||||||||||||
| Income taxes (recoveries) | 630 | 301 | 303 | 47 | 141 | (120 | ) | 1,302 | ||||||||||||||||||||
Net income | $ | 1,678 | $ | 777 | $ | 980 | $ | 272 | $ | 1,432 | $ | (8 | ) | $ | 5,131 | |||||||||||||
Non-interest expense includes: | ||||||||||||||||||||||||||||
| Depreciation and amortization | $ | 274 | $ | 26 | $ | 317 | $ | (2 | ) | $ | 144 | $ | (1 | ) | $ | 758 | ||||||||||||
| For the three months ended January 31, 2024 | ||||||||||||||||||||||||||||
| (Millions of Canadian dollars) | Personal Banking (4) | Commercial Banking (4) | Wealth Management (4) | Insurance | Capital Markets (2) | Corporate Support (2) | Total | |||||||||||||||||||||
Net interest income (3) | $ | 2,854 | $ | 1,282 | $ | 1,230 | $ | – | $ | 661 | $ | 305 | $ | 6,332 | ||||||||||||||
Non-interest income | 1,177 | 331 | 3,457 | 363 | 2,290 | (465 | ) | 7,153 | ||||||||||||||||||||
| Total revenue | 4,031 | 1,613 | 4,687 | 363 | 2,951 | (160 | ) | 13,485 | ||||||||||||||||||||
| Provision for credit losses | 464 | 170 | 11 | 1 | 167 | – | 813 | |||||||||||||||||||||
Non-interest expense | 1,724 | 542 | 3,841 | 71 | 1,642 | 504 | 8,324 | |||||||||||||||||||||
| Income (loss) before income taxes | 1,843 | 901 | 835 | 291 | 1,142 | (664 | ) | 4,348 | ||||||||||||||||||||
| Income taxes (recoveries) | 490 | 251 | 171 | 71 | (12 | ) | (205 | ) | 766 | |||||||||||||||||||
Net income | $ | 1,353 | $ | 650 | $ | 664 | $ | 220 | $ | 1,154 | $ | (459 | ) | $ | 3,582 | |||||||||||||
Non-interest expense includes: | ||||||||||||||||||||||||||||
| Depreciation and amortization | $ | 235 | $ | – | $ | 311 | $ | 4 | $ | 124 | $ | (2 | ) | $ | 672 | |||||||||||||
| (1) | On March 28, 2024, we completed the HSBC Canada transaction. HSBC Canada results have been consolidated from the closing date, and are included in our Personal Banking, Commercial Banking, Wealth Management and Capital Markets segments. |
| (2) | Taxable equivalent basis. |
| (3) | Interest revenue is reported net of interest expense as we rely primarily on net interest income as a performance measure. |
| (4) | Effective the fourth quarter of 2024, the Personal & Commercial Banking segment became two standalone business segments: Personal Banking and Commercial Banking. With this change, RBC Direct Investing moved from the previous Personal & Commercial Banking segment to the Wealth Management segment. Amounts have been revised from those previously presented to conform to our new basis of segment presentation. |
Royal Bank of Canada
Total assets and total liabilities by business segment
As at January 31, 2025 | ||||||||||||||||||||||||||||
| (Millions of Canadian dollars) | Personal Banking | Commercial Banking | Wealth Management | Insurance | Capital Markets | Corporate Support | Total | |||||||||||||||||||||
| Total assets | $ | 558,197 | $ | 190,602 | $ | 188,607 | $ | 30,780 | $ | 1,129,747 | $ | 93,093 | $ | 2,191,026 | ||||||||||||||
| Total liabilities | 558,163 | 190,594 | 186,977 | 30,663 | 1,129,705 | (38,339 | ) | 2,057,763 | ||||||||||||||||||||
| As at October 31, 2024 | ||||||||||||||||||||||||||||
| (Millions of Canadian dollars) | Personal Banking | Commercial Banking | Wealth Management | Insurance | Capital Markets | Corporate Support | Total | |||||||||||||||||||||
| Total assets | $ | 555,029 | $ | 187,142 | $ | 184,503 | $ | 29,288 | $ | 1,127,661 | $ | 87,959 | $ | 2,171,582 | ||||||||||||||
| Total liabilities | 554,970 | 187,135 | 183,055 | 29,158 | 1,127,564 | (37,492 | ) | 2,044,390 | ||||||||||||||||||||
Note 1 4 Capital management |
Regulatory capital and capital ratios
OSFI formally establishes risk-based capital and leverage minimums and Total Loss Absorbing Capacity (TLAC) ratios for deposit-taking institutions in Canada. During the first
quarter of 2025, we complied with all applicable capital, leverage and TLAC
requirements
, including the Domestic Stability Buffer, imposed by OSFI.| As at | ||||||||
| (Millions of Canadian dollars, except percentage amounts and as otherwise noted) | January 31 2025 | October 31 2024 | ||||||
Capital (1) | ||||||||
| CET1 capital | $ | 93,321 | $ | 88,936 | ||||
| Tier 1 capital | 103,718 | 97,952 | ||||||
| Total capital | 115,914 | 110,487 | ||||||
Risk-weighted assets (RWA) used in calculation of capital ratios (1) | ||||||||
| Credit risk | $ | 579,866 | $ | 548,809 | ||||
| Market risk | 36,530 | 33,930 | ||||||
| Operational risk | 92,545 | 89,543 | ||||||
Total RWA | $ | 708,941 | $ | 672,282 | ||||
Capital ratios and Leverage ratio (1) | ||||||||
| CET1 ratio | 13.2% | 13.2% | ||||||
| Tier 1 capital ratio | 14.6% | 14.6% | ||||||
| Total capital ratio | 16.4% | 16.4% | ||||||
| Leverage ratio | 4.4% | 4.2% | ||||||
| Leverage ratio exposure | $ | 2,367,402 | $ | 2,344,228 | ||||
TLAC available and ratios (2) | ||||||||
| TLAC available | $ | 211,585 | $ | 196,659 | ||||
| TLAC ratio | 29.8% | 29.3% | ||||||
| TLAC leverage ratio | 8.9% | 8.4% | ||||||
| (1) | Capital, RWA and capital ratios are calculated using OSFI’s Capital Adequacy Requirements (CAR) guideline and the Leverage ratio is calculated using OSFI’s Leverage Requirements (LR) guideline. Both the CAR guideline and LR guideline are based on the Basel III framework. |
| (2) | TLAC available and TLAC ratios are calculated using OSFI’s TLAC guideline. The TLAC standard is applied at the resolution entity level which for us is deemed to be Royal Bank of Canada and its subsidiaries. A resolution entity and its subsidiaries are collectively called a resolution group. The TLAC ratio and TLAC leverage ratio are calculated using the TLAC available as a percentage of total RWA and leverage exposure, respectively. |