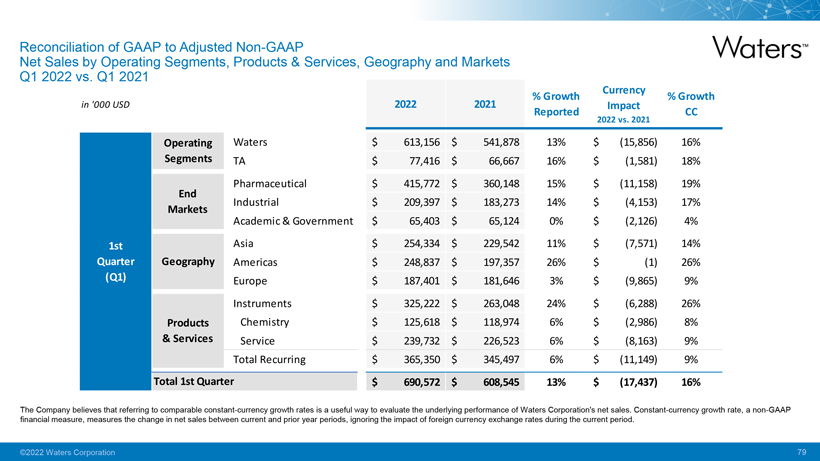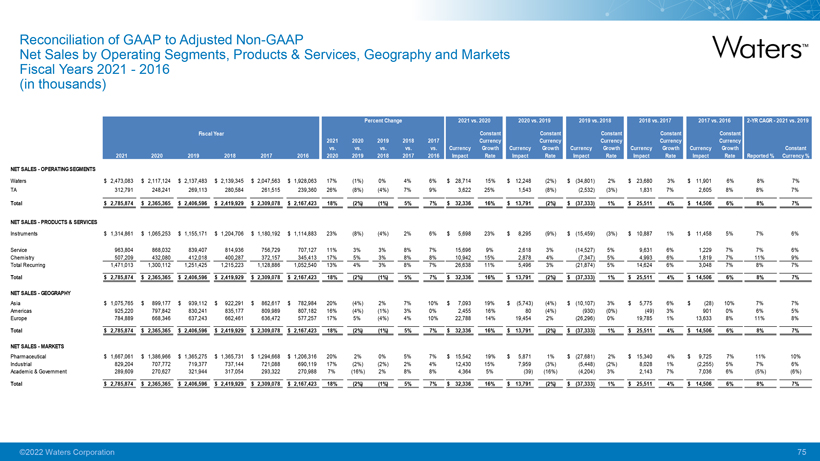
Net Reconciliation Sales by Operating of GAAP Segments, to Adjusted Products Non-GAAP & Services, Geography and Markets Fiscal (in thousands) Years 2021—2016
NET SALES—OPERATING SEGMENTS
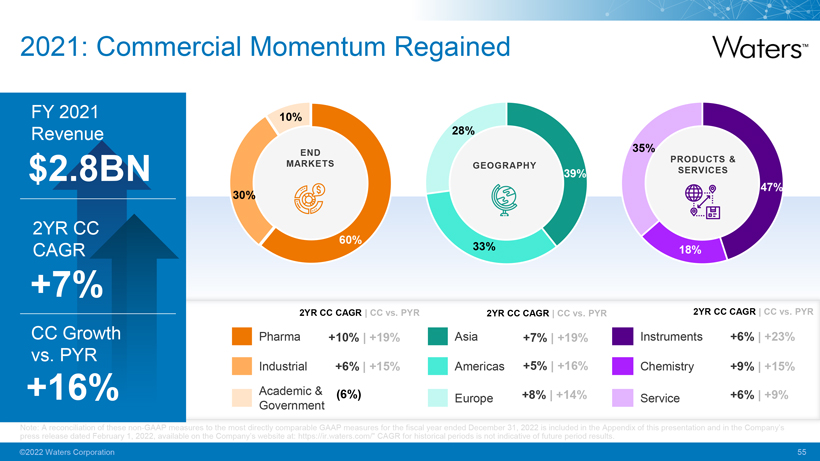
Waters $ 2,473,083 $ 2,117,124 $ 2,137,483 $ 2,139,345 $ 2,047,563 $ 1,928,063 17% (1%) 0% 4% 6% $ 28,714 15% $ 12,248 (2%) $ (34,801) 2% $ 23,680 3% $ 11,901 6% 8% 7% TA312,791248,241269,113280,584261,515239,360 26% (8%) (4%) 7% 9%3,622 25%1,543 (8%)(2,532) (3%)1,831 7%2,605 8% 8% 7%
Total $ 2,785,874 $ 2,365,365 $ 2,406,596 $ 2,419,929 $ 2,309,078 $ 2,167,423 18% (2%) (1%) 5% 7% $ 32,336 16% $ 13,791 (2%) $ (37,333) 1% $ 25,511 4% $ 14,506 6% 8% 7%
NET SALES—PRODUCTS & SERVICES
Instruments $ 1,314,861 $ 1,065,253 $ 1,155,171 $ 1,204,706 $ 1,180,192 $ 1,114,883 23% (8%) (4%) 2% 6% $5,698 23% $8,295 (9%) $ (15,459) (3%) $ 10,887 1% $ 11,458 5% 7% 6%
Service963,804868,032839,407814,936756,729707,127 11% 3% 3% 8% 7% 15,696 9%2,618 3% (14,527) 5%9,631 6%1,229 7% 7% 6% Chemistry507,209432,080412,018400,287372,157345,413 17% 5% 3% 8% 8% 10,942 15%2,878 4%(7,347) 5%4,993 6%1,819 7% 11% 9% Total Recurring 1,471,013 1,300,112 1,251,4251,215,223 1,128,886 1,052,540 13% 4% 3% 8% 7% 26,638 11%5,496 3% (21,874) 5% 14,624 6%3,048 7% 8% 7%
Total $ 2,785,874 $ 2,365,365 $ 2,406,596 $ 2,419,929 $ 2,309,078 $ 2,167,423 18% (2%) (1%) 5% 7% $ 32,336 16% $ 13,791 (2%) $ (37,333) 1% $ 25,511 4% $ 14,506 6% 8% 7%
NET SALES—GEOGRAPHY
Asia $ 1,075,765 $899,177 $939,112 $922,291 $862,617 $782,984 20% (4%) 2% 7% 10% $7,093 19% $ (5,743) (4%) $ (10,107) 3% $5,775 6% $(28) 10% 7% 7% Americas925,220797,842830,241835,177809,989807,182 16% (4%) (1%) 3% 0%2,455 16%80 (4%)(930) (0%)(49) 3%901 0% 6% 5% Europe784,889668,346637,243662,461636,472577,257 17% 5% (4%) 4% 10% 22,788 14% 19,454 2% (26,296) 0% 19,785 1% 13,633 8% 11% 8%
Total $ 2,785,874 $ 2,365,365 $ 2,406,596 $ 2,419,929 $ 2,309,078 $ 2,167,423 18% (2%) (1%) 5% 7% $ 32,336 16% $ 13,791 (2%) $ (37,333) 1% $ 25,511 4% $ 14,506 6% 8% 7%
NET SALES—MARKETS
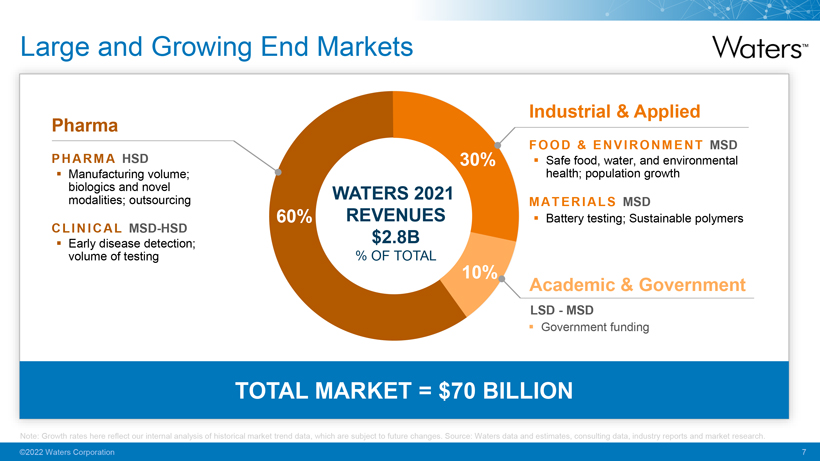
Pharmaceutical $ 1,667,061 $ 1,386,966 $ 1,365,275 $ 1,365,731 $ 1,294,668 $ 1,206,316 20% 2% 0% 5% 7% $ 15,542 19% $5,871 1% $ (27,681) 2% $ 15,340 4% $9,725 7% 11% 10% Industrial829,204707,772719,377737,144721,088690,119 17% (2%) (2%) 2% 4% 12,430 15%7,959 (3%)(5,448) (2%)8,028 1% (2,255) 5% 7% 6% Academic & Government289,609270,627321,944317,054293,322270,988 7% (16%) 2% 8% 8%4,364 5%(39) (16%)(4,204) 3%2,143 7%7,036 6% (5%) (6%)
Total $ 2,785,874 $ 2,365,365 $ 2,406,596 $ 2,419,929 $ 2,309,078 $ 2,167,423 18% (2%) (1%) 5% 7% $ 32,336 16% $ 13,791 (2%) $ (37,333) 1% $ 25,511 4% $ 14,506 6% 8% 7%