Exhibit 99.1

 |


Table of Contents
Credicorp Ltd. (NYSE:BAP) | 3 | |
Financial Overview | 3 | |
01 | lnterest-Earning Assets (IEA) | 8 |
02 | Funding Structure | 15 |
03 | Net lnterest lncome (Nll) | 21 |
04 | Portfolio Quality | 26 |
05 | Other income | 34 |
06 | lnsurance Underwriting Results | 38 |
07 | Operating Expenses | 43 |
08 | Operating Efficiency | 46 |
09 | Regulatory Capital | 49 |
10 | Digital Transformation | 52 |
11 | Economic Perspectives | 57 |
12 | Appendix | 62 |
| 2 | |
 | |
|

| 3 | |
| |
|
Fourth Quarter Results
*Net Income attributable to Credicorp
According to the latest official information, economic activity reported growth of 3.5% YoY in November, result that represented an increase of 1.3% with regard to the figure reported in November 2019. Thus, GDP growth is estimated to stand at 3.3% YoY in 4Q21 and 13% in 2021 with regard to 2020. This recovery was driven mainly by the reopening of the economy; ample monetary and fiscal stimulus; mandates to release pension and severance indemnity funds; and a favorable international environment for our export products. In addition, the sanitary situation has improved as a result of the vaccination program, through which 84% of the population older than 12 has received least two doses.
Loan Growth


| 4 | |
| |
|
| Other income | ||
QoQ and on a FY basis, Other Income grew in line with the increase in Core Other Income. YoY evolution, growth in core income was offset by higher losses fixed-income trading portfolio during 4Q21. |
Insurance Underwriting Result
In 4Q21, the insurance underwriting result returned to pre-pandemic levels and grew 81.8% QoQ, driven by an increase in net earned premiums in the Life and P&C businesses and by a decrease in claims in P&C. YoY, growth stood at 50.4%, fueled primarily by an increase in net earned premiums in both businesses, and to a lesser extent, a decrease in claims in the Life business. In FY analysis, losses were recorded in 2021 due to growth in claims in the Life Business in the context of the pandemic.
Operating Efficiency
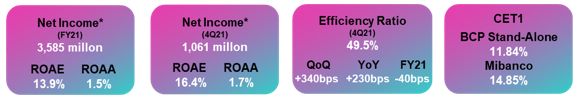
The efficiency ratio stood at 49.5% in 4Q21, which reflected a deterioration of 340bps QoQ and 230bps YoY. This evolution was attributable to growth in expenses for digital transformation and disruptive initiatives at BCP Stand-alone and to an increase in variable compensation at the majority of companies. FY, the ratio in 2021 stood at 45.9%, which is 40bps below the figure in 2020. This evolution was primarily due to improvements in efficiency at Mibanco, which offset higher expenses at BCP Stand-alone.
Net income at Credicorp and Contribution by Business Line
Contribution* and ROAE by subsidiary in 4Q21 (S/ million)
Credicorp Net Income 4Q21 S/1,061 million, ROAE 16.4%
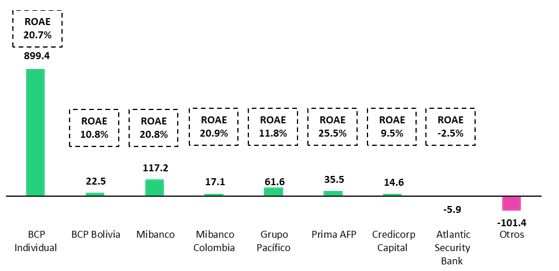
*Contributions to Credicorp reflect the eliminations for consolidation purposes (eliminations for transactions among Credicorp’s subsidiaries or between Credicorp and its subsidiaries).
- In Mibanco, the figure is lower than the net income because Credicorp owns 99.921% of Mibanco (directly and indirectly). ROAE including goodwill of BCP from the acquisition of Edyficar (Approximately US$ 50.7 million) was 4.5% in 4Q20, 13.2% in 3Q21 and 19.7% in 4Q21. FY was -17.8% for December 2020 and 11.5% for December 2021.
- In Grupo Pacifico, the contribution is higher than the net income because Credicorp owns 65.20% directly, and 33.57% through Grupo Credito. Figures include unrealized gains or losses that are considered in Pacifico’s Net Equity from the investment portfolio of Pacifico Vida. ROAE excluding such unrealized gains was 1.5% in 4Q20, 13.3% in 3Q21 and 12.6% in 4Q21. FY was 8.2% for December 2020 and -6.4% for December 2021.
- Others includes Grupo Credito excluding Prima (Servicorp and Emisiones BCP Latam), others of Atlantic Security Holding Corporation and others of Credicorp Ltd.
| 5 | |
| |
|
| 6 | |
| |
|
Overview Financial Information: Fourth Quarter 2021
| Credicorp Ltd. | Quarter | % change | Year | % change | ||||||||||||||||||||||||||||
| S/ 000 | 4Q20 | 3Q21 | 4Q21 | QoQ | YoY | 2020 | 2021 | 2021 / 2020 | ||||||||||||||||||||||||
| Net interest, similar income and expenses | 2,068,560 | 2,451,708 | 2,477,847 | 1.1 | % | 19.8 | % | 8,571,342 | 9,361,980 | 9.2 | % | |||||||||||||||||||||
| Provision for credit losses on loan portfolio, net of recoveries | (732,665 | ) | (164,414 | ) | (126,782 | ) | -22.9 | % | -82.7 | % | (5,920,508 | ) | (1,212,223 | ) | -79.5 | % | ||||||||||||||||
| Net interest, similar income and expenses, after provision for credit losses on loan portfolio | 1,335,895 | 2,287,294 | 2,351,065 | 2.8 | % | 76.0 | % | 2,650,834 | 8,149,757 | 207.4 | % | |||||||||||||||||||||
| Total other income | 1,329,533 | 1,238,683 | 1,301,959 | 5.1 | % | -2.1 | % | 4,406,217 | 4,926,866 | 11.8 | % | |||||||||||||||||||||
| Insurance underwriting result | 84,867 | 70,204 | 127,657 | 81.8 | % | 50.4 | % | 358,133 | (3,721 | ) | n.a | |||||||||||||||||||||
| Total other expenses | (1,981,310 | ) | (1,977,794 | ) | (2,221,574 | ) | 12.3 | % | 12.1 | % | (7,191,023 | ) | (7,740,086 | ) | 7.6 | % | ||||||||||||||||
| Profit (loss) before income tax | 768,985 | 1,618,387 | 1,559,107 | -3.7 | % | 102.7 | % | 224,161 | 5,332,816 | 2279.0 | % | |||||||||||||||||||||
| Income tax | (103,174 | ) | (428,037 | ) | (471,860 | ) | 10.2 | % | 357.3 | % | 109,977 | (1,660,987 | ) | n.a | ||||||||||||||||||
| Net profit (loss) | 665,811 | 1,190,350 | 1,087,247 | -8.7 | % | 63.3 | % | 334,138 | 3,671,829 | 998.9 | % | |||||||||||||||||||||
| Non-controlling interest | 12,407 | 26,651 | 26,631 | -0.1 | % | 114.6 | % | (12,756 | ) | 87,247 | n.a | |||||||||||||||||||||
| Net profit (loss) attributable to Credicorp | 653,404 | 1,163,699 | 1,060,616 | -8.9 | % | 62.3 | % | 346,894 | 3,584,582 | 933.3 | % | |||||||||||||||||||||
| Net profit (loss) / share (S/) | 8.19 | 14.59 | 13.30 | -8.9 | % | 62.3 | % | 4.35 | 44.94 | 933.3 | % | |||||||||||||||||||||
| Loans | 137,659,885 | 146,551,226 | 147,597,412 | 0.7 | % | 7.2 | % | 137,659,885 | 147,597,412 | 7.2 | % | |||||||||||||||||||||
| Deposits and obligations | 142,365,502 | 152,548,368 | 150,340,862 | -1.4 | % | 5.6 | % | 142,365,502 | 150,340,862 | 5.6 | % | |||||||||||||||||||||
| Net equity | 24,945,870 | 25,192,569 | 26,496,767 | 5.2 | % | 6.2 | % | 24,945,870 | 26,496,767 | 6.2 | % | |||||||||||||||||||||
| Profitability | ||||||||||||||||||||||||||||||||
| Net interest margin | 3.73 | % | 4.23 | % | 4.25 | % | 2 bps | 52 bps | 4.30 | % | 4.10 | % | -20 bps | |||||||||||||||||||
| Risk-adjusted Net interest margin | 2.41 | % | 3.95 | % | 4.04 | % | 9 bps | 163 bps | 1.33 | % | 3.57 | % | 224 bps | |||||||||||||||||||
| Funding cost | 1.34 | % | 1.21 | % | 1.24 | % | 3 bps | -10 bps | 1.78 | % | 1.29 | % | -49 bps | |||||||||||||||||||
| ROAE | 10.8 | % | 18.5 | % | 16.4 | % | -210 bps | 560 bps | 1.4 | % | 13.9 | % | 1250 bps | |||||||||||||||||||
| ROAA | 1.1 | % | 1.9 | % | 1.7 | % | -20 bps | 60 bps | 0.2 | % | 1.5 | % | 130 bps | |||||||||||||||||||
| Loan portfolio quality | ||||||||||||||||||||||||||||||||
| Internal overdue ratio (1) | 3.40 | % | 3.73 | % | 3.76 | % | 3 bps | 36 bps | 3.40 | % | 3.76 | % | 36 bps | |||||||||||||||||||
| Internal overdue ratio over 90 days | 2.69 | % | 2.76 | % | 2.85 | % | 9 bps | 16 bps | 2.69 | % | 2.85 | % | 16 bps | |||||||||||||||||||
| NPL ratio (2) | 4.61 | % | 4.96 | % | 4.98 | % | 2 bps | 37 bps | 4.61 | % | 4.97 | % | 36 bps | |||||||||||||||||||
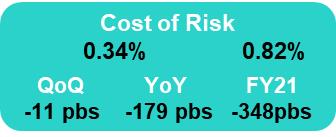
| Cost of risk (3) | 2.13 | % | 0.45 | % | 0.34 | % | -11 bps | -179 bps | 4.30 | % | 0.82 | % | -348 bps | |||||||||||||||||||
| Coverage ratio of IOLs | 211.7 | % | 165.8 | % | 152.7 | % | -1310 bps | -5900 bps | 211.7 | % | 152.9 | % | -5880 bps | |||||||||||||||||||
| Coverage ratio of NPLs | 156.1 | % | 124.8 | % | 115.3 | % | -950 bps | -4080 bps | 156.1 | % | 115.5 | % | -4060 bps | |||||||||||||||||||
| Operating efficiency | ||||||||||||||||||||||||||||||||
| Efficiency ratio (4) | 47.2 | % | 46.1 | % | 49.5 | % | 340 bps | 230 bps | 46.3 | % | 45.9 | % | -40 bps | |||||||||||||||||||
| Operating expenses / Total average assets | 3.05 | % | 3.20 | % | 3.52 | % | 32 bps | 47 bps | 3.19 | % | 3.19 | % | 0 bps | |||||||||||||||||||
| Insurance ratios | ||||||||||||||||||||||||||||||||
| Combined ratio of P&C (5) (6) | 81.4 | % | 94.1 | % | 86.5 | % | -760 bps | 510 bps | 81.4 | % | 86.5 | % | 510 bps | |||||||||||||||||||
| Loss ratio (6) | 75.4 | % | 76.5 | % | 71.3 | % | -520 bps | -410 bps | 68.5 | % | 93.1 | % | 2460 bps | |||||||||||||||||||
| Capital adequacy - BCP Stand-alone (7) | ||||||||||||||||||||||||||||||||
| Global Capital ratio (8) | 14.93 | % | 15.16 | % | 14.94 | % | -22 bps | 1 bps | 14.93 | % | 14.94 | % | 1 bps | |||||||||||||||||||
| Tier 1 ratio (9) | 10.41 | % | 10.00 | % | 9.94 | % | -6 bps | -47 bps | 10.41 | % | 9.94 | % | -47 bps | |||||||||||||||||||
| Common equity tier 1 ratio (10) | 11.40 | % | 11.10 | % | 11.84 | % | 74 bps | 44 bps | 11.40 | % | 11.84 | % | 44 bps | |||||||||||||||||||
| Capital adequacy - Mibanco (7) | ||||||||||||||||||||||||||||||||
| Global Capital ratio (8) | 19.82 | % | 16.74 | % | 16.36 | % | -38 bps | -346 bps | 19.82 | % | 16.36 | % | -346 bps | |||||||||||||||||||
| Tier 1 ratio (9) | 17.67 | % | 14.25 | % | 13.93 | % | -32 bps | -374 bps | 17.67 | % | 13.93 | % | -374 bps | |||||||||||||||||||
| Common equity tier 1 ratio (10) | 17.70 | % | 15.10 | % | 14.85 | % | -25 bps | -285 bps | 17.70 | % | 14.85 | % | -285 bps | |||||||||||||||||||
| Employees | 36,806 | 35,733 | 36,358 | 1.7 | % | -1.2 | % | 36,806 | 36,358 | -1.2 | % | |||||||||||||||||||||
| Share Information | ||||||||||||||||||||||||||||||||
| Issued Shares | 94,382 | 94,382 | 94,382 | 0.0 | % | 0.0 | % | 94,382 | 94,382 | 0.0 | % | |||||||||||||||||||||
| Treasury Shares (11) | 14,915 | 14,866 | 14,850 | -0.1 | % | -0.4 | % | 14,915 | 14,866 | -0.3 | % | |||||||||||||||||||||
| Outstanding Shares | 79,467 | 79,516 | 79,532 | 0.0 | % | 0.1 | % | 79,467 | 79,516 | 0.1 | % | |||||||||||||||||||||
(1) Internal overdue loans includes overdue loans and loans under legal collection, according to our internal policy for overdue loans. Internal Overdue ratio: Internal overdue loans / Total loans.
(2) Non-performing loans (NPL): Internal overdue loans + Refinanced loans. NPL ratio: NPL / Total loans.
(3) Cost of risk: Annualized provision for loan losses, net of recoveries / Total loans.
(4) Efficiency ratio = (Salaries and employee benefits + Administrative expenses + Depreciation and amortization + Association in participation + Acquisition cost) / (Net interest, similar income and expenses + Fee Income + Net gain on foreign exchange transaction + Net Gain From associates + Net gain on derivatives held for trading + Result on exchange differences + Net Premiums Earned).
(5) Combined ratio = (Net claims / Net earned premiums) + [(Acquisition cost + Operating expenses) / Net earned premiums]. Does not include Life insurance business.
(6) Considers Grupo Pacifico's figures before eliminations for consolidation to Credicorp.
(7) All Capital ratios for BCP Stand-alone and Mibanco are based on Peru GAAP.
(8) Regulatory Capital / Risk-weighted assets (legal minimum = 10% since July 2011).
(9) Tier 1 = Capital + Legal and other capital reserves + Accumulated earnings with capitalization agreement + (0.5 x Unrealized profit and net income in subsidiaries) - Goodwill - (0.5 x Investment in subsidiaries) + Perpetual subordinated debt (maximum amount that can be included is 17.65% of Capital + Reserves + Accumulated earnings with capitalization agreement + Unrealized profit and net income in subsidiaries - Goodwill).
(10) Common Equity Tier I = Capital + Reserves – 100% of applicable deductions (investment in subsidiaries, goodwill, intangibles and net deferred taxes that rely on future profitability) + retained earnings + unrealized gains.
Adjusted Risk-Weighted Assets = Risk-weighted assets - (RWA Intangible assets, excluding goodwill, + RWA Deferred tax assets generated as a result of temporary differences in income tax, in excess of 10% of CET1, + RWA Deferred tax assets generated as a result of past losses)."
(11) These shares are held by Atlantic Security Holding Corporation (ASHC) and for shared based payments.
| 7 | |
| |
|

| 8 | |
| |
|
| 1. | Interest Earning Assets (IEA) |
| Interest earning assets | As of | % change | ||||||||||||||||||
| S/ 000 | Dec 20 | Sep 21 | Dec 21 | QoQ | YoY | |||||||||||||||
| Cash and due from banks | 28,544,161 | 36,137,443 | 32,392,465 | -10.4 | % | 13.5 | % | |||||||||||||
| Interbank funds | 32,221 | 9,782 | 2,943 | -69.9 | % | -90.9 | % | |||||||||||||
| Total investments | 55,173,742 | 48,110,456 | 48,952,499 | 1.8 | % | -11.3 | % | |||||||||||||
| Cash collateral, reverse repurchase agreements and securities borrowing | 2,394,302 | 2,555,337 | 1,766,948 | -30.9 | % | -26.2 | % | |||||||||||||
| Financial assets designated at fair value through profit or loss | 823,270 | 981,508 | 974,664 | -0.7 | % | 18.4 | % | |||||||||||||
| Total loans | 137,659,885 | 146,551,226 | 147,597,412 | 0.7 | % | 7.2 | % | |||||||||||||
| Total interest earning assets | 224,627,581 | 234,345,752 | 231,686,931 | -1.1 | % | 3.1 | % | |||||||||||||
1.1. Structure and Evolution of IEA
Composition of IEA
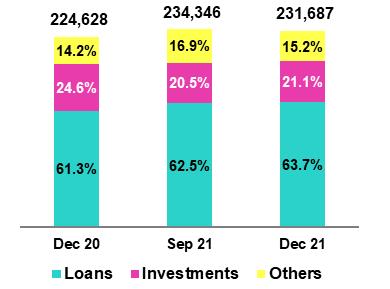
At the end of December 2021, loans, our most profitable asset, represented 63.7% of IEAs, followed by investments with 21.1% and other assets1 with 15.2%. IEAs dropped -1.1% QoQ driven by a decrease in available funds but increased +3.1% YoY due to loan growth.
Loans continued to report an uptick in their share of the IEA structure in 4Q21, spurred by growth in structural loans. It is important to note that GP loans registered a decrease in their share of IEAs, following the same trend seen in the previous quarter. GP loans’ share of total IEA fell from 11.0% in Dec-20 to 9.0% in Sept-21 and 8.1% in Dec-21. Structural loans went from representing 50.3% of the IEAs in Dec-20 to accounting for 53.6% of the pool in Sept-21 and 55.6% in Dec-21.
QoQ, investments registered an increase in their share of IEAs while the share of liquid assets fell. The inverse occurred YoY, given that the share of investments fell while the share of liquid assets increased.
Loans (quarter-end balances)
It is important to note that loan evolution in recent quarters has been affected by exchange rate volatility and by the progressive decline in GP balances.
QoQ, total loans increased +0.7% and structural loans +2.7%; both metrics were affected by the -3.6% decrease in the exchange rate. If we exclude the exchange rate effect, total loans grew +2.0% QoQ and structural loans, 4.2%. This reflected:
| (i) | Structural growth was led by Retail Banking at BCP Stand-alone. All segments contributed to expansion, with the exception of SME-Business. Growth was driven by economic recovery in general and by personal consumption in particular given seasonal effects at year-end and due to the fact that sanitary restrictions were loosened. |
| (ii) | Mibanco’s portfolio registered structural growth of +4.7% in a context marked by record-high levels of disbursements. The microfinance segment was very dynamic in the last quarter of the year, in line with the seasonality that businesses experience at year-end. |
GP loans fell -11.2% QoQ.
YoY, total loans increased +7.2% versus a +14.1% increase in structural loans. This dynamic was driven by the +10.1% uptick in the exchange rate. If we exclude the exchange rate effect, total loans grew +3.9% and structural loans, +10.0%, driven by:
| (i) | Growth in the Wholesale Banking portfolio at BCP, which was associated with an increase in disbursements due to a reactivation in internal demand; campaigns to increase market share; and a strong impulse from fishing and agriculture campaigns in 2021. |
1 Includes Cash and Due from Banks; Interbank Funds; Cash Collateral, reverse repurchase agreements, and securities borrowings, and Financial Assets designated at fair value through profit or loss.
| 9 | |
| |
|
| (ii) | Growth in the Retail Banking portfolio at BCP was led by SME-Pyme in a context marked by an uptick in economic activity due to a loosening of pandemic restrictions. |
| (iii) | Expansion of 10.8% in Mibanco’s portfolio, where disbursements have surpassed pre-pandemic levels since 3Q21. It is important to note that in 4Q21, disbursements actually hit record highs. |
GP loans fell -24.2% YoY.
Total Investments
| Total Investments | As of | % change | ||||||||||||||||||
| S/ 000 | Dec 20 | Sep 21 | Dec 21 | QoQ | YoY | |||||||||||||||
| Fair value through profit or loss investments | 6,467,471 | 6,661,600 | 5,928,497 | -11.0 | % | -8.3 | % | |||||||||||||
| Fair value through other comprehensive income investments | 43,743,889 | 33,261,505 | 34,758,443 | 4.5 | % | -20.5 | % | |||||||||||||
| Amortized cost investments | 4,962,382 | 8,187,351 | 8,265,559 | 1.0 | % | 66.6 | % | |||||||||||||
| Total investments | 55,173,742 | 48,110,456 | 48,952,499 | 1.8 | % | -11.3 | % | |||||||||||||
Total investments increased +1.8% QoQ due to purchases of low-risk instruments and new allocations of certificates of deposits. YoY, total investments fell -11.3% due to: i) sales of investments in the second and third quarter of 2021 under a strategy to reduce the portfolio’s duration and, ii) expiration of certificates of deposit (which were not renewed).
Other IEA
Available funds fell -10.4% QoQ, which was primarily driven by client withdrawals. YoY, available funds increased +13.4%. This growth was attributable to (i) cash generated by the sale of investments to reduce portfolio duration (ii) expirations of certificates of deposits (which were not renewed) and (iii) an increase in deposit balances after clients deposited funds from pension fund withdrawals.
| 1.2. | Credicorp Loans |
| 1.2.1. | Evolution of average daily balances (ADB) |
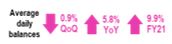
Average daily balances for loans fell -0.9% QoQ and +5.8% YoY in the fourth quarter. YoY, ADB registered growth of +9.9%.
As was the case for quarter-end balances, exchange rate volatility affected the dynamics of our portfolios in general but had a more marked effect on those that have higher dollarization levels, such as the Wholesale Banking segments at BCP and segments at Mibanco Colombia and BCP Bolivia.
ADB balances provide the most complete picture of how loan interest, which constitutes Credicorp’s primary source of income, has evolved. Additionally, average daily balances reflect trends or variations to a different degree than quarter-end balances which may include pre-payments or loans made at the end of the quarter. In comparative terms, these payments, affect average daily balances less than quarter-end balances and as such, the former provide a more balanced picture of loan evolution.
It is important to note that the gradual amortization of GP loans also affected the evolution of our portfolios.
| 10 | |
| |
|
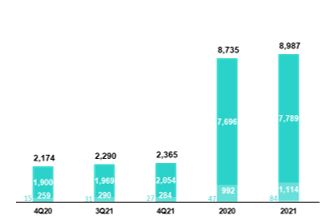
Evolution of ADB of loans by business segment (1)(2)
| TOTAL LOANS | ||||||||||||||||||||||||||||||||||||||||||||||||||||||||
| Expressed in million S/ | Structural | % change | % change Structural | % Part. in total loans | Structural | |||||||||||||||||||||||||||||||||||||||||||||||||||
| 4Q20 | 3Q21 | 4Q21 | 4Q20 | 3Q21 | 4Q21 | QoQ | YoY | QoQ | YoY | 4Q20 | 3Q21 | 4Q21 | 4Q21 | |||||||||||||||||||||||||||||||||||||||||||
| BCP Stand-alone | 112,981 | 120,722 | 119,100 | 91,075 | 101,482 | 101,729 | -1.3 | % | 5.4 | % | 0.2 | % | 11.7 | % | 82.4 | % | 82.5 | % | 82.1 | % | 81.2 | % | ||||||||||||||||||||||||||||||||||
| Wholesale Banking | 51,675 | 57,831 | 56,359 | 44,988 | 53,048 | 52,289 | -2.5 | % | 9.1 | % | -1.4 | % | 16.2 | % | 37.7 | % | 39.5 | % | 38.8 | % | 41.7 | % | ||||||||||||||||||||||||||||||||||
| Corporate | 28,522 | 32,610 | 31,851 | 27,771 | 32,115 | 31,426 | -2.3 | % | 11.7 | % | -2.1 | % | 13.2 | % | 20.8 | % | 22.3 | % | 22.0 | % | 25.1 | % | ||||||||||||||||||||||||||||||||||
| Middle - Market | 23,153 | 25,221 | 24,508 | 17,216 | 20,933 | 20,864 | -2.8 | % | 5.9 | % | -0.3 | % | 21.2 | % | 16.9 | % | 17.2 | % | 16.9 | % | 16.6 | % | ||||||||||||||||||||||||||||||||||
| Retail Banking | 61,306 | 62,891 | 62,741 | 46,088 | 48,434 | 49,439 | -0.2 | % | 2.3 | % | 2.1 | % | 7.3 | % | 44.7 | % | 43.0 | % | 43.2 | % | 39.4 | % | ||||||||||||||||||||||||||||||||||
| SME - Business | 10,893 | 11,400 | 10,484 | 4,652 | 5,524 | 5,302 | -8.0 | % | -3.8 | % | -4.0 | % | 14.0 | % | 7.9 | % | 7.8 | % | 7.2 | % | 4.2 | % | ||||||||||||||||||||||||||||||||||
| SME - Pyme | 19,239 | 19,626 | 19,717 | 10,262 | 11,046 | 11,597 | 0.5 | % | 2.5 | % | 5.0 | % | 13.0 | % | 14.0 | % | 13.4 | % | 13.6 | % | 9.3 | % | ||||||||||||||||||||||||||||||||||
| Mortgage | 17,218 | 18,133 | 18,432 | 17,218 | 18,133 | 18,432 | 1.6 | % | 7.1 | % | 1.6 | % | 7.1 | % | 12.6 | % | 12.4 | % | 12.7 | % | 14.7 | % | ||||||||||||||||||||||||||||||||||
| Consumer | 9,544 | 10,000 | 10,296 | 9,544 | 10,000 | 10,296 | 3.0 | % | 7.9 | % | 3.0 | % | 7.9 | % | 7.0 | % | 6.8 | % | 7.1 | % | 8.2 | % | ||||||||||||||||||||||||||||||||||
| Credit Card | 4,412 | 3,731 | 3,813 | 4,412 | 3,731 | 3,813 | 2.2 | % | -13.6 | % | 2.2 | % | -13.6 | % | 3.2 | % | 2.5 | % | 2.6 | % | 3.0 | % | ||||||||||||||||||||||||||||||||||
| Mibanco | 12,679 | 13,083 | 13,352 | 9,865 | 10,429 | 10,990 | 2.1 | % | 5.3 | % | 5.4 | % | 11.4 | % | 9.2 | % | 8.9 | % | 9.2 | % | 8.8 | % | ||||||||||||||||||||||||||||||||||
| Mibanco Colombia | 866 | 1,047 | 1,064 | 866 | 1,047 | 1,064 | 1.6 | % | 22.9 | % | 1.6 | % | 22.9 | % | 0.6 | % | 0.7 | % | 0.7 | % | 0.8 | % | ||||||||||||||||||||||||||||||||||
| Bolivia | 8,272 | 9,408 | 9,230 | 8,272 | 9,408 | 9,230 | -1.9 | % | 11.6 | % | -1.9 | % | 11.6 | % | 6.0 | % | 6.4 | % | 6.4 | % | 7.4 | % | ||||||||||||||||||||||||||||||||||
| ASB | 2,342 | 2,130 | 2,327 | 2,342 | 2,130 | 2,327 | 9.2 | % | -0.6 | % | 9.2 | % | -0.6 | % | 1.7 | % | 1.5 | % | 1.6 | % | 1.9 | % | ||||||||||||||||||||||||||||||||||
| BAP's total loans | 137,140 | 146,389 | 145,073 | 112,420 | 124,496 | 125,339 | -0.9 | % | 5.8 | % | 0.7 | % | 11.5 | % | 100.0 | % | 100.0 | % | 100.0 | % | 100.0 | % | ||||||||||||||||||||||||||||||||||
 | Largest contraction in volumes Highest growth in volumes |
For consolidation purposes, loans generated in FC are converted to LC.
(1) Structural Portfolio excludes the average daily balances from loans offered through de Reactiva Peru y FAE-Mype Government Programs.
(2) Figures differ from previously reported.
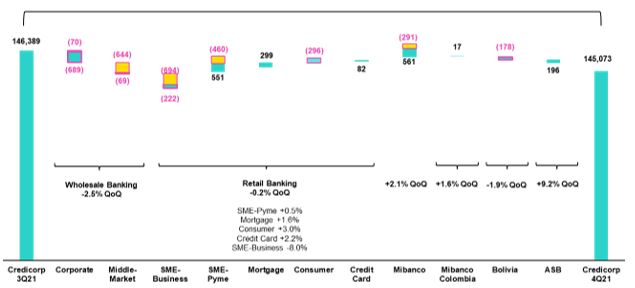
QoQ growth in ADB balances for loans by segment
Expressed in millions of S/
-0.9% (+0.7% Structural Portfolio)
 | Government Programs (Reactiva and FAE-Mype) Structural |
The figure above shows a decrease of -0.9% QoQ (+0.7% structural) in loans measured in ADB. QoQ, the exchange rate effect was negative for our FC portfolios due to drop in the exchange rate. If we exclude this effect, total loans grew +0.1% while structural loans rose +1.8%. The structural variation, if we exclude the exchange rate effect, was due to the following in order of magnitude:
| (i) | Growth in the Retail Banking portfolio where the SME-Pyme segment led expansion, followed by Mortgage and Consumer. The Credit Card segment reversed its downward trend for the first time since the beginning of the pandemic. These dynamics were driven by economic reactivation, a loosening of sanitary restrictions, and the seasonal effect of an uptick in business activity and private consumption at year-end. |
| (ii) | Growth at Mibanco, where disbursements hit a record high, was also noteworthy this quarter. Mibanco Colombia also contributed to expansion through higher-than-expected commercial results. The company continues to gain market share in the microfinance industry in Colombia. |
| (iii) | Wholesale Banking registered a decrease in its structural loan balances. |
GP fell -9.9% QoQ.
| 11 | |
| |
|
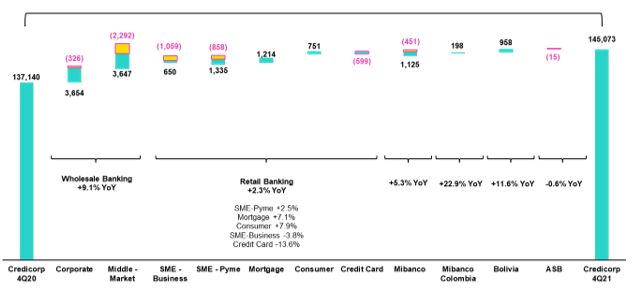
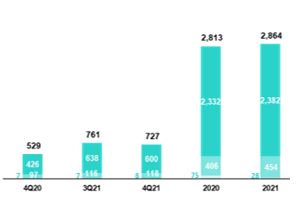
YoY growth in ADB of loans by segment
Expressed in millions of S/
+5.8% (+11.5% Structural Portfolio)
 | Government Programs (Reactiva and FAE-Mype) Structural |
YoY, the portfolio’s evolution was positively impacted by an increase in the exchange rate, which contributed to growth in our FC portfolios. If we exclude the exchange rate effect, total loans increased +2.4% and structural loans, +7.4%. If we isolate the exchange rate effect, the structural evolution was driven by:
| (i) | Growth in Wholesale Banking, which registered an uptick in disbursements in 2021 due to reactivation of internal demand and campaigns for specific sectors and clients. |
| (ii) | Growth in the Retail Banking portfolio, which was led by SME-Pyme, followed by Mortgage, Consumer and SME-Business. Dynamism in Retail Banking was partially offset by a decrease in Credit Card balances after clients used funds from economic relief measures to reduce debt in this segment. |
| (iii) | Growth in Mibanco loans, which was bolstered by on-going growth in disbursements. In 3Q21, disbursements at Mibanco Peru surpassed pre-pandemic levels and in 4Q21, they hit record highs. At Mibanco Colombia, the portfolio grew more than 10% YoY. This expansion was driven by dynamism in the industry sector and by an improvement in the company’s productivity levels, which was coupled with an increase in commercial capacities. |
GP fell -20.2% YoY.
| 12 | |
| |
|
Growth in ADB (12 months) for loans by segments
Expressed in millions of S/
+9.9% (+2.9% Structural Portfolio)
| Government Programs (Reactiva and FAE-Mype) Structural |
Growth in ADB (12 months) was +9.9%. This result was primarily attributable to two scenarios: i) total balances were inflated by the presence of GP loans and ii) upward variations in the exchange rate. If we exclude the exchange rate effect, total loans increased 6.2% while structural loans fell -1.2%. The evolution of the structural portfolio, minus the effect of the exchange rate, was attributable to:
| (i) | A drop in the Wholesale Banking Portfolio, which was primarily visible in the Corporate Banking segment. This decline was driven by the fact that companies had fewer financial needs given that they had already shored up liquidity at the beginning of the pandemic. In Middle Market Banking, a decrease in the demand for loans reflected the fact that this segment benefitted amply from government financial relief programs and had fewer financial needs. |
| (ii) | Within Retail Banking, the drop in the Credit Card segment was noteworthy. A decrease in the risk appetite in this segment, and the fact that clients used heightened liquidity to amortize their credit debt, contributed to this decline. |
| (iii) | The retail segments: SME-Pyme, Mortgage and Consumer evolved positively. |
GP grew +72.1% FY.
| 13 | |
| |
|
1.2.2. Evolution of the dollarization level of Credicorp loans by segment
Evolution of average daily loan balances by currency (1)(2)
| DOMESTIC CURRENCY LOANS | % change | FOREIGN CURRENCY LOANS | % part. by currency | |||||||||||||||||||||||||||||||||||||||||||||||||||||||||||||||||
| Expressed in million S/ | Structural | % change | Structural | Expressed in million US$ | 4Q21 | |||||||||||||||||||||||||||||||||||||||||||||||||||||||||||||||
| 4Q20 | 3Q21 | 4Q21 | 4Q20 | 3Q21 | 4Q21 | QoQ | YoY | QoQ | YoY | 4Q20 | 3Q21 | 4Q21 | QoQ | YoY | LC | FC | ||||||||||||||||||||||||||||||||||||||||||||||||||||
| BCP Stand-alone | 80,945 | 83,441 | 84,592 | 59,039 | 64,202 | 67,221 | 1.4 | % | 4.5 | % | 4.7 | % | 13.9 | % | 8,865 | 9,127 | 8,600 | -5.8 | % | -3.0 | % | 71.0 | % | 29.0 | % | |||||||||||||||||||||||||||||||||||||||||||
| Wholesale Banking | 26,490 | 28,562 | 28,967 | 19,802 | 23,779 | 24,898 | 1.4 | % | 9.4 | % | 4.7 | % | 25.7 | % | 6,969 | 7,165 | 6,827 | -4.7 | % | -2.0 | % | 51.4 | % | 48.6 | % | |||||||||||||||||||||||||||||||||||||||||||
| Corporate | 12,596 | 14,771 | 15,077 | 11,845 | 14,276 | 14,652 | 2.1 | % | 19.7 | % | 2.6 | % | 23.7 | % | 4,407 | 4,367 | 4,181 | -4.3 | % | -5.1 | % | 47.3 | % | 52.7 | % | |||||||||||||||||||||||||||||||||||||||||||
| Middle-Market | 13,894 | 13,791 | 13,890 | 7,957 | 9,503 | 10,246 | 0.7 | % | 0.0 | % | 7.8 | % | 28.8 | % | 2,562 | 2,798 | 2,646 | -5.4 | % | 3.3 | % | 56.7 | % | 43.3 | % | |||||||||||||||||||||||||||||||||||||||||||
| Retail Banking | 54,455 | 54,880 | 55,625 | 39,237 | 40,423 | 42,323 | 1.4 | % | 2.1 | % | 4.7 | % | 7.9 | % | 1,896 | 1,962 | 1,774 | -9.6 | % | -6.5 | % | 88.7 | % | 11.3 | % | |||||||||||||||||||||||||||||||||||||||||||
| SME - Business | 8,402 | 8,076 | 7,780 | 2,161 | 2,199 | 2,597 | -3.7 | % | -7.4 | % | 18.1 | % | 20.2 | % | 689 | 815 | 674 | -17.3 | % | -2.2 | % | 74.2 | % | 25.8 | % | |||||||||||||||||||||||||||||||||||||||||||
| SME - Pyme | 19,040 | 19,441 | 19,517 | 10,062 | 10,861 | 11,398 | 0.4 | % | 2.5 | % | 4.9 | % | 13.3 | % | 55 | 45 | 50 | 9.5 | % | -9.9 | % | 99.0 | % | 1.0 | % | |||||||||||||||||||||||||||||||||||||||||||
| Mortgage | 15,063 | 15,960 | 16,391 | 15,063 | 15,960 | 16,391 | 2.7 | % | 8.8 | % | 2.7 | % | 8.8 | % | 596 | 532 | 509 | -4.4 | % | -14.7 | % | 88.9 | % | 11.1 | % | |||||||||||||||||||||||||||||||||||||||||||
| Consumer | 8,119 | 8,469 | 8,898 | 8,119 | 8,469 | 8,898 | 5.1 | % | 9.6 | % | 5.1 | % | 9.6 | % | 394 | 375 | 348 | -7.1 | % | -11.7 | % | 86.4 | % | 13.6 | % | |||||||||||||||||||||||||||||||||||||||||||
| Credit Card | 3,831 | 2,933 | 3,039 | 3,831 | 2,933 | 3,039 | 3.6 | % | -20.7 | % | 3.6 | % | -20.7 | % | 161 | 195 | 193 | -1.2 | % | 20.0 | % | 79.7 | % | 20.3 | % | |||||||||||||||||||||||||||||||||||||||||||
| Mibanco | 12,191 | 12,614 | 12,880 | 9,377 | 9,960 | 10,518 | 2.1 | % | 5.7 | % | 5.6 | % | 12.2 | % | 135 | 115 | 118 | 2.6 | % | -12.9 | % | 96.5 | % | 3.5 | % | |||||||||||||||||||||||||||||||||||||||||||
| Mibanco Colombia | - | - | - | - | - | - | - | - | - | - | 240 | 256 | 265 | 3.5 | % | 10.7 | % | - | 100.0 | % | ||||||||||||||||||||||||||||||||||||||||||||||||
| Bolivia | - | - | - | - | - | - | - | - | - | - | 2,289 | 2,302 | 2,300 | -0.1 | % | 0.5 | % | - | 100.0 | % | ||||||||||||||||||||||||||||||||||||||||||||||||
| ASB | - | - | - | - | - | - | - | - | - | - | 648 | 521 | 580 | 11.2 | % | -10.5 | % | - | 100.0 | % | ||||||||||||||||||||||||||||||||||||||||||||||||
| Total loans | 93,136 | 96,056 | 97,472 | 68,416 | 74,162 | 77,738 | 1.5 | % | 4.7 | % | 4.8 | % | 13.6 | % | 12,177 | 12,322 | 11,863 | -3.7 | % | -2.6 | % | 67.2 | % | 32.8 | % | |||||||||||||||||||||||||||||||||||||||||||
| Largest contraction in volumes Highest growth in volumes |
For consolidation purposes, loans generated in FC are converted to LC.
(1) Structural Portfolio excludes the average daily balances from loans offered through de Reactiva Peru y FAE-Mype Government Programs.
(2) Figures differ from previously reported
YoY evolution of the dollarization level by Credicorp Segment (1)(2)(3)

(1) Average daily balances.
(2) The FC share of Credicorp’s loan portfolio is calculated including BCP Bolivia and ASB, however the chart shows only the loan books of BCP Stand-alone and Mibanco.
(3) The year with the historic maximum level of dollarization for Wholesale Banking was 2012, for Mibanco was 2016, for Credit Card was in 2021 and for the rest of segments was 2009.
YoY, the portfolio’s dollarization level grew slightly due to the exchange rate effect (LC depreciation) and to an uptick in amortizations of GP loans.
| 14 | |
| |
|
| 15 | |
| |
|
2. Funding sources
2.1 Funding Structure
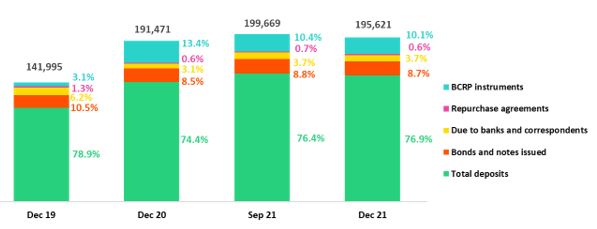
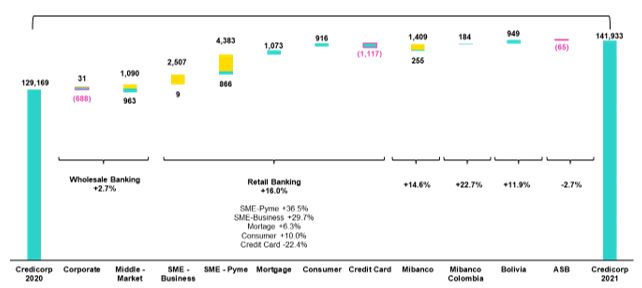
The funding level fell 2.0% QoQ. If we isolate the exchange rate effect, the level falls 0.3%. In terms of structure, the following dynamics stand out:
| (i) | Growth in the share of Deposits (76.9% vs 76.4% in 3Q21), which occurred despite a slight QoQ contraction in volume. |
| (ii) | An on-going reduction in the share of BCRP Instruments (10.1% vs 10.4% in 3Q21). This was fueled by amortizations of Reactiva loans, mainly at BCP Stand-alone. |
| (iii) | A slight decrease in the share of Bonds and Issued Notes, which fell from 8.8% in 3Q21 to |
8.7% in 4Q21. This drop was primarily due to the expiration both corporate and subordinated bonds at BCP Stand-alone.
In the YoY analysis, the total funding level increased +2.2%. If we exclude the exchange rate effect, the level falls -2.4%. The increase in the share of deposits was noteworthy (76.9% vs 74.4% in 4Q20); this result was driven by an uptick in personal liquidity, which was attributable to government relief facilities. The aforementioned was offset by a drop in BCRP instruments (10.0% vs 13.4%), which was associated with amortization of Reactiva loans.
2.2. Deposits
| Deposits | As of | % change | ||||||||||||||||||
| S/ 000 | Dec 20 | Sep 21 | Dec 21 | QoQ | YoY | |||||||||||||||
Demand deposits | 54,530,356 | 61,112,084 | 58,629,661 | -4.1 | % | 7.5 | % | |||||||||||||
Saving deposits | 50,069,129 | 54,365,781 | 56,945,262 | 4.7 | % | 13.7 | % | |||||||||||||
Time deposits | 29,324,090 | 31,601,351 | 29,995,810 | -5.1 | % | 2.3 | % | |||||||||||||
Severance indemnity deposits | 7,736,747 | 4,681,224 | 4,017,065 | -14.2 | % | -48.1 | % | |||||||||||||
Interest payable | 705,180 | 787,928 | 753,064 | -4.4 | % | 6.8 | % | |||||||||||||
| Total Deposits | 142,365,502 | 152,548,368 | 150,340,862 | -1.4 | % | 5.6 | % | |||||||||||||
Deposits registered a drop QoQ. Nonetheless, if we isolate the exchange rate effect, growth of 0.4% was evident.
The main drivers of these movements were:
| (i) | The drop in demand deposits, which fell -4.1% (-2.0% if we exclude the exchange rate effect), was driven mainly by a decrease in current accounts in LC held by corporate clients and, to a lesser extent, by current accounts held by retail banking clients. The aforementioned reduction in retail accounts reflected clients’ use of funds from AFPs. |
| (ii) | A -5.1% decline in time deposits (-3.1% if we exclude the exchange rate effect). This drop was mainly driven by BCP Stand-alone in Corporate Banking. |
| 16 | |
| |
|
| (iii) | A significant drop in Severance Indemnity Deposits, which was driven by a government mandate that freed up these funds for withdrawal until the last day of 2021; this was slightly mitigated by inflows of severance indemnity deposits, which are made in November every year. |
| (iv) | Growth in savings deposits particularly at BCP Stand-alone, which grew +4.7% QoQ (6.4% if we exclude the exchange rate effect). This growth was mainly spurred from higher levels of savings by individuals, associated with bonus payments in the month of December. |
In YoY terms, total deposits grew +5.6% (+0.6% if we exclude the exchange rate effect). Growth was mainly driven by savings and demand deposits, which was triggered by higher personal liquidity (after AFP and Severance Indemnity funds were released).
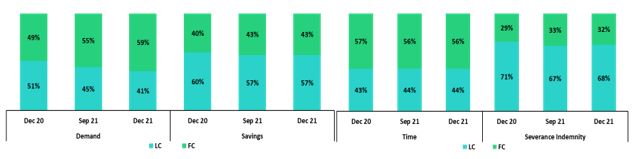
2.2.1. Deposits: Dollarization Level
Total Deposits by Currency
(measured in quarter-end balances)
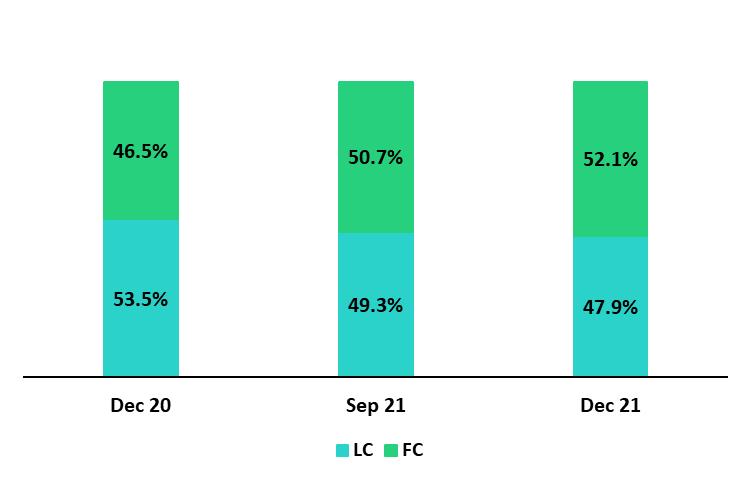
FC’s share of deposits rose from 50.7% at the end of September to 52.1% at the end of December. This increase was mainly driven by withdrawals from demand deposits in LC and was partially mitigated by the exchange rate effect. If the exchange rate had remained constant, dollarization would have increased to 53.0%.
In the YoY analysis, the dollarization level increased from 46.5% to 52.1%, which was spurred by the 10.1% depreciation in the sol. If we exclude this effect, dollarization in FC would have stood at just 49.6%
Deposits by type and currency
(measured in quarter-end balances)
2.3. Other sources of funding
| Other funding sources | As of | % change | ||||||||||||||||||
| S/ 000 | Dec 20 | Sep 21 | Dec 21 | QoQ | YoY | |||||||||||||||
Due to banks and correspondents | 5,978,257 | 7,466,434 | 7,212,946 | -3.4 | % | 20.7 | % | |||||||||||||
BCRP instruments | 25,734,963 | 20,746,109 | 19,692,474 | -5.1 | % | -23.5 | % | |||||||||||||
Repurchase agreements | 1,072,920 | 1,330,811 | 1,296,277 | -2.6 | % | 20.8 | % | |||||||||||||
Bonds and notes issued | 16,319,407 | 17,577,630 | 17,078,829 | -2.8 | % | 4.7 | % | |||||||||||||
| Total other funding sources | 49,105,547 | 47,120,984 | 45,280,526 | -3.9 | % | -7.8 | % | |||||||||||||
The total of Other sources of funding fell -3.9% QoQ. If we exclude the exchange rate effect, the reduction stands at -2.5%. This evolution reflects:
The drop registered in BCRP Instruments, which was mainly driven by BCP Stand-alone in a context of Reactiva loan amortizations.
| 17 | |
| |
|
The decrease in Due to banks and correspondents, which was driven by a decrease in debt obligations at BCP Stand-alone after instruments held with foreign financial institutions in FC expired.
In the YoY evolution, a -7.8% decreased was registered; this was primarily attributable to a drop in the balance of BCRP Instruments at BCP Stand-alone, which was impacted by progressive amortizations of Reactiva loans. The aforementioned was partially offset by a variation in the exchange rate given that a high percentage of total debt is in FC.
2.4. Loans / Deposits (L/D)
Loan / Deposit ratio by subsidiary
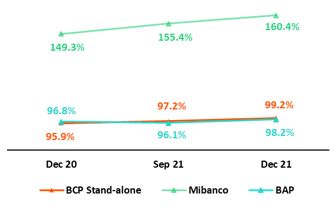
The L/D ratio at Credicorp rose slightly after the level of deposits fell. At the subsidiary level, both BP Stand-alone and Mibanco registered growth in their L/D ratios.
In the YoY analysis, the L/D ratio at Credicorp, BCP Stand-alone and Mibanco also increased.
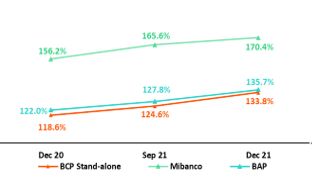
Local Currency
Foreign Currency
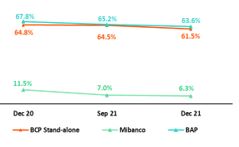
In the QoQ analysis by currency, slight growth was registered in the L/D ratio in LC ratio at Credicorp, BCP Individual and Mibanco. The L/D ratio in FC fell slightly a Credicorp, BCP Individual and Mibanco. YoY, the L/D ratio in LC fell at Credicorp, BCP and Mibanco. Growth in loans at Mibanco was driven by record-high disbursement levels in 4Q21. During the same period, a decrease was reported for the L/D ratio in FC for l Credicorp, BCP and Mibanco.
| 18 | |
| |
|
2.5. Funding Cost
Funding Cost – Credicorp (1)
(1) Structural Funding Cost deducts the impact in expenses and funding related to GP Loans (BCRP Repos) and deducts non-recurring events from Interest Expenses
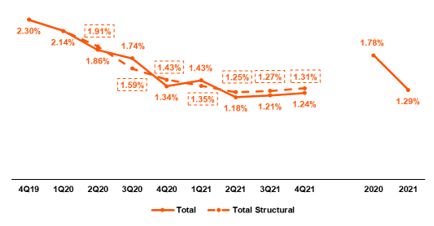
Credicorp’s funding cost in the fourth quarter remained low and stood at 1.24% (+3bps QoQ) in a context of strong growth in interest rates and an increase in the share of low-cost deposits in the funding mix. Th structural funding cost, which excludes the effects of funding generated by Reactiva loans and other non-recurring funding expenses, rose slightly to 1.31% (+4bps QoQ).
In the YoY analysis, the Cost of funding in the fourth quarter fell -10 pbs, which was primarily driven by an increase in the share of low-cost deposits in the funding mix.
In the FY analysis, the funding cost in 2021 fell -49 bps with regard to last year’s figure. This was triggered primarily by an increase in the share of low-cost deposits in the funding mix and by the execution of liability management transactions.
Funding Cost – Credicorp In Local Currency (1)
(1) Structural Funding Cost deducts the impact in expenses and funding related to GP Loans (BCRP Repos) and deducts non-recurring events from Interest Expenses
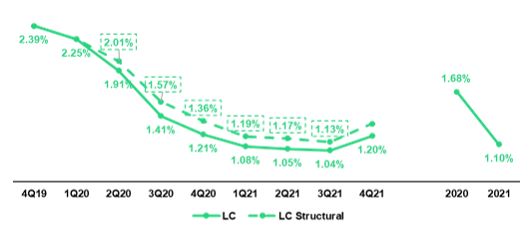
The cost of funding in LC increased 16 bps. This dynamic was driven by withdrawals from demand and time deposits in LC and by an increase in interest rates. With regard to structural funding, the funding cost in LC rose to 1.33% in 4Q21 (+20 bps).
| 19 | |
| |
|
Funding Cost - Credicorp in Foreign Currency(1)

(1) Structural Funding Cost deducts the impact in expenses and funding related to GP Loans (BCRP Repos) and deducts non-recurring events from Interest Expenses
The decrease in the cost of funding in FC (-11bps) was associated with an increase in the share of low-cost FC deposits.
The funding cost in LC and FC fell -1bps and -22bps YoY respectively. The cost of FC funding dropped due to the effects of liability transactions that were executed throughout the year.
Funding cost by subsidiary (1)
(1) Structural Funding Cost deducts the impact in expenses and funding related to GP Loans (BCRP Repos) and deducts non-recurring events from Interest Expenses
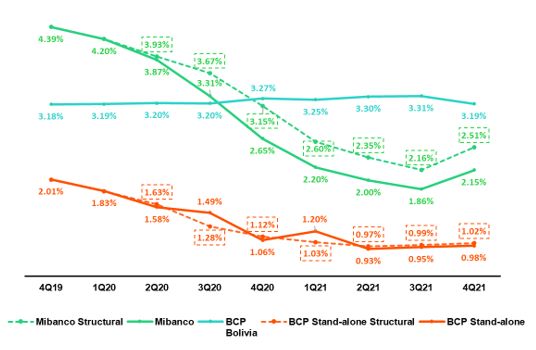
| (i) | The funding cost at BCP Stand-alone increased slightly to 0.98% (+3 bps QoQ). YoY, a decrease of -9 bps was reported in the cost of funding. This was associated with (i) an uptick in the share of deposits and (ii) the rate effect, which was primarily generated by a subordinated debt management transaction. |
| (ii) | The funding cost at Mibanco increased considerably (+29 bps QoQ), which was attributable to repricing of the institutional funding base due to an increase in interest rates. In the YoY analysis, a drop of -50 bps was recorded. This result was mainly driven by an uptick in institutional banking’s share of the funding mix (this type of funding is less expenses than retail funding). |
| (iii) | The cost of funding at BCP Bolivia fell at 3.19% (-12 bps). In the YoY analysis, the cost fell -8 bps. |
| 20 | |
| |
|
| 21 | |
| |
|
3. Net interest income (NII)
| Net interest income | Quarter | % change | Year | % change | ||||||||||||||||||||||||||||
| S/ 000 | 4Q20 | 3Q21 | 4Q21 | QoQ | YoY | 2020 | 2021 | 2021 / 2020 | ||||||||||||||||||||||||
| Interest income | 2,703,100 | 3,051,000 | 3,091,754 | 1.3 | % | 14.4 | % | 11,547,648 | 11,850,406 | 2.6 | % | |||||||||||||||||||||
| Interest on loans | 2,325,836 | 2,607,349 | 2,654,383 | 1.8 | % | 14.1 | % | 10,027,834 | 10,170,680 | 1.4 | % | |||||||||||||||||||||
| Dividends on investments | 3,987 | 19,668 | 6,212 | -68.4 | % | 55.8 | % | 25,603 | 40,637 | 58.7 | % | |||||||||||||||||||||
| Interest on deposits with banks | 8,456 | 12,185 | 23,480 | 92.7 | % | 177.7 | % | 74,814 | 49,637 | -33.7 | % | |||||||||||||||||||||
| Interest on securities | 351,502 | 385,874 | 395,815 | 2.6 | % | 12.6 | % | 1,372,163 | 1,526,793 | 11.3 | % | |||||||||||||||||||||
| Other interest income | 13,319 | 25,924 | 11,864 | -54.2 | % | -10.9 | % | 47,234 | 62,659 | 32.7 | % | |||||||||||||||||||||
| Interest expense (1) | 634,540 | 599,292 | 613,907 | 2.4 | % | -3.3 | % | 2,976,306 | 2,488,426 | -16.4 | % | |||||||||||||||||||||
| Interest on deposits | 245,221 | 209,564 | 222,992 | 6.4 | % | -9.1 | % | 1,188,335 | 865,474 | -27.2 | % | |||||||||||||||||||||
| Interest on borrowed funds | 118,457 | 110,308 | 111,625 | 1.2 | % | -5.8 | % | 557,141 | 435,426 | -21.8 | % | |||||||||||||||||||||
| Interest on bonds and subordinated notes | 185,104 | 179,476 | 175,690 | -2.1 | % | -5.1 | % | 883,912 | 800,801 | -9.4 | % | |||||||||||||||||||||
| Other interest expense (1) | 85,758 | 99,944 | 103,600 | 3.7 | % | 20.8 | % | 346,918 | 386,725 | 11.5 | % | |||||||||||||||||||||
| Net interest income (1) | 2,068,560 | 2,451,708 | 2,477,847 | 1.1 | % | 19.8 | % | 8,571,342 | 9,361,980 | 9.2 | % | |||||||||||||||||||||
| Adjusted Net interest income (2) | 2,161,800 | 2,420,842 | 2,457,471 | 1.5 | % | 13.7 | % | 9,006,448 | 9,305,567 | 3.3 | % | |||||||||||||||||||||
| Risk-adjusted Net interest income (1) | 1,335,895 | 2,287,294 | 2,351,065 | 2.8 | % | 76.0 | % | 2,650,834 | 8,149,757 | 207.4 | % | |||||||||||||||||||||
| Average interest earning assets (1) | 222,098,498 | 231,912,064 | 233,016,342 | 0.5 | % | 4.9 | % | 199,243,133 | 228,157,256 | 14.5 | % | |||||||||||||||||||||
| Net interest margin (3) | 3.73 | % | 4.23 | % | 4.25 | % | 2bps | 52bps | 4.30 | % | 4.10 | % | -20bps | |||||||||||||||||||
| Risk-adjusted Net interest margin (3) | 2.41 | % | 3.95 | % | 4.04 | % | 9bps | 163bps | 2.28 | % | 6.12 | % | 384bps | |||||||||||||||||||
| Net provisions for loan losses / Net interest income | 35.42 | % | 6.71 | % | 5.12 | % | -1.6 | % | -30.3 | % | 69.07 | % | 12.95 | % | -56.12 | % | ||||||||||||||||
(1) Figures differ from previously reported.
(2) Adjusted for (i) impairment from cero interest-rate loans and (ii) expenses related to liability management operations at BCP Stand-Alone.
(3) Annualized.
3.1. Interest Income
Interest Income – local currency
(S/ millions)
Interest income – foreign currency
(S/ millions)
 |
In the QoQ analysis, the increase of +1.3% in Interest income in the fourth quarter (+1.7% adjusted, excluding non-recurring income) was primarily attributable to growth in the volume of structural loans at BCP Stand-alone and Mibanco. The dynamics of interest generation were as follows:
| (i) | Volume+mix effect: the volume effect was positive due to growth in structural loans, which was partially offset by a drop in investments. This dynamic generated a more profitable IEA structure. |
| (ii) | Price effect: the price effect was negative due to competitive pressures in Wholesale Banking, which exercised downward pressure on interest rates on loans. This impact was partially offset by growth in yields in the investment portfolio and by an uptick in available funds. |
In the YoY analysis, interest income grew +14.4% in the fourth quarter (+9.8% adjusted, excluding non-recurring expenses). This result was driven, in part, by the exchange rate. If we exclude the exchange rate effect, interest income rose 11.4% (+6.9% adjusted), which was mainly attributable to an increase in structural loan volumes and, to a lesser extent, to an uptick in market rates.
In terms of the volume and price effect, the evolution was as follows:
| (i) | Volume + mix effect: the effect was positive and was attributable to growth in structural loans. This increase was partially offset through a strategy to shrink the investment portfolio to reduce exposure to interest rate movements. |
| 22 | |
| |
|
| (ii) | Price effect: the effect was positive due to an increase in interest rates, which began in the third quarter of 2021 and has, affected yields on investments and available funds. This growth was partially offset by a drop in active interest rates in Wholesale Banking due to competitive pressures. |
In the FY analysis, interest income in 2021 rose +2.6% but fell -1.4% after non-recurring expenses associated with zero-rate loans granted during the pandemic were excluded from the calculation. This reduction was driven by the following dynamics:
| (i) | Price effect: the price effect was negative given that market rates dropped in comparison to those seen in 2020, which impacted the yield of our interest-earning assets. |
| (ii) | Volume + mix effect: this effect was positive and was driven by growth in the share of loans and the share of investments in the IEA mix. |
3.2. Interest expenses
Interest expense – local currency
(S/ millions)
Interest expense – foreign currency
(S/ millions)
 |
In the QoQ analysis, interest expenses in the fourth quarter grew +2.4%; this was primarily attributable to an increase in interest on deposits. In terms of the mix and price effect, the dynamic was as follows:
| (i) | Price effect: the increase in market rates contributed to growth in interest expenses on deposits. |
| (ii) | Volume/mix effect: generated by the move to replace Reactiva funding (low-cost) with bank debt. This contributed to increase interest on loans. |
In the YoY analysis, interest expenses fell -3.3% due to an exchange rate effect. If we keep the exchange rate constant, interest expenses fall -8.7% YoY in a context marked by lower interest on deposits, bonds and subordinated notes. This dynamic was driven by the following:
| (i) | Mix effect: growth in the share of low-cost deposits in the funding mix. |
| (ii) | Price effect: drop in the cost of funding for bonds and issued notes, which was primarily attributable to a subordinated debt management operation at BCP Stand-alone. |
In the FY analysis, interest expenses fell -16.4% (-16.3% adjusted, excluding non-recurring expenses associated with liability management at BCP Stand-alone). Similar to the YoY dynamic, the drop in interest expenses in 2021 was attributable to a lower-cost funding structure and to a drop in market interest rates.
| 23 | |
| |
|
3.3. Net interest margin (NIM) and Risk-adjusted NIM
NIM and Risk Adjusted NIM at Credicorp
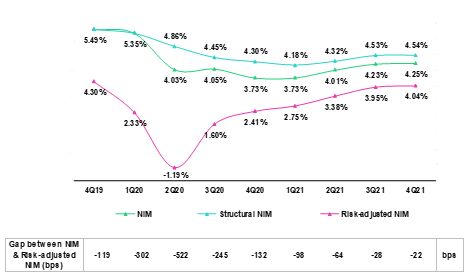
NIM stood at 4.25% in 4Q21, which topped the 4.23% obtained in 2Q21 and the 3.73% reported in 4Q20. The margin was impacted by non-recurring income associated with impairment amortization in 2020. The impact of non-recurring income on NIM in 4Q21 was positive (+3bps). NIM continued to be negatively impacted by GP loans. The effect of these loans on NIM declined throughout 2021, falling from -39bps in 4Q20 to -32bps in 4Q21. The analysis of structural NIM, which excludes non-recurring events and the effect of GP, indicates that:
| (i) | The Structural Portfolio registered a NIM of 4.54% in 4Q21, which represented an increase of +1bps QoQ, in line with the positive evolution of the IEA mix. |
| (ii) | YoY, Structural NIM rose from 4.30% to 4.54%, which represented an increase of +24bp and was attributable to: |
| a) | Volume+mix effect: Growth in structural loans generated a more profitable mix of IEAs. The uptick in the share of low-cost deposits took place in the context of a less expensive funding structure. |
| b) | Rate effect: liability management operations led to a reduction in the rates of our fixed income issuances. |
| (iii) | FY, structural NIM in 2021 fell -20pbs, going from 4.30% in 2020 to 4.10% at the end of 2021. This decline was due to the fact that interest rates in 2021 were lower than those reported in 2020. The aforementioned was partially offset by the dynamics of liabilities, which led financial expenses to fall in 2021. |
‘
The table below provides details of the NIM and Risk-adjusted NIM of Credicorp’s main subsidiaries:
NIM Breakdown | BCP Stand-alone | Mibanco | BCP Bolivia | Credicorp (1) | Risk Adjusted NIM Breakdown | BCP Stand-alone | Mibanco | BCP Bolivia | Credicorp (1) | |||||||||||||||||||||||||
| 4Q20 | 3.60 | % | 10.20 | % | -2.99 | % | 3.73 | % | 4Q20 | 2.28 | % | 7.09 | % | -4.37 | % | 2.41 | % | |||||||||||||||||
| 3Q21 | 3.57 | % | 12.59 | % | 3.23 | % | 4.23 | % | 3Q21 | 3.49 | % | 9.46 | % | 2.47 | % | 3.95 | % | |||||||||||||||||
| 4Q21 | 3.68 | % | 12.83 | % | 2.71 | % | 4.25 | % | 4Q21 | 3.48 | % | 11.81 | % | 2.45 | % | 4.04 | % | |||||||||||||||||
| 2020 | 3.94 | % | 10.84 | % | 1.81 | % | 4.30 | % | 2020 | 1.02 | % | 3.22 | % | -0.63 | % | 1.33 | % | |||||||||||||||||
| 2021 | 3.52 | % | 11.85 | % | 2.93 | % | 4.10 | % | 2021 | 3.07 | % | 9.14 | % | 2.88 | % | 3.57 | % | |||||||||||||||||
NIM: Annualized Net interest income / Average period end and period beginning interest earning assets.
Risk-Adjusted NIM: (Annualized Net interest income - annualized provisions) / Average period end and period beginning interest earning assets.
(1) Credicorp also includes Mibanco colombia, Credicorp Capital, Prima, Pacífico, ASB and Eliminations for consolidation purposes.
The dynamics of NIM at BCP Stand-alone, which is the largest contributor to consolidated NIM at the Credicorp level, followed the same patterns as those described for Credicorp. As such the paragraphs that follow focus on Mibanco and BCP Bolivia, which represent smaller but nonetheless important components of consolidated NIM:
| 24 | |
| |
|
| (i) | Mibanco Perú registered an increase in NIM of +24bps QoQ, +262bps YoY and +101bps FY due to (i) the evolution of structural loans and (ii) reversals of interest reimbursements on reprogrammed loans that became delinquent1. These reversals are made once we write off the corresponding portfolios because reimbursed interest is also included in loan provisions for loans that became delinquent. |
| (ii) | QoQ, BCP Bolivia registered a drop of -52pbs in its margin due to the reduction of loan volumes, which was mainly attributable to a decrease in its appetite for retail and micro loans. The latter was partially offset by an increase in disbursements in the wholesale banking segments. YoY and FY, NIM rose +570bps and+112bps respectively. This result was primarily driven by the base effect generated by impairment associated with loans granted in 4Q20 in the context of the pandemic. |
Risk-adjusted NIM rose +9bps QoQ, which was attributable to the positive evolution of the IEA mix. This indicator rose +163bps YoY and +224pbs FY due to a significant reduction in provisions and to the factors that drove the variation in NIM.
2 In 2021, we registered provisions for interest income that was accrued over the reprogrammed loans grace periods and was not paid-back when grace periods expired due to delinquency.
| 25 | |
| |
|

| 26 | |
| |
|
4. Portfolio Quality
4.1. Provisions and CofR
Provision for credit losses on loan portfolio, net of recoveries | Quarter | % change | Year | % change | ||||||||||||||||||||||||||||
| S/ 000 | 4Q20 | 3Q21 | 4Q21 | QoQ | YoY | 2020 | 2021 | 2021 / 2020 | ||||||||||||||||||||||||
| Gross provision for credit losses on loan portfolio | (785,194 | ) | (265,158 | ) | (229,804 | ) | -13.3 | % | -70.7 | % | (6,080,289 | ) | (1,558,951 | ) | -74.4 | % | ||||||||||||||||
| Recoveries of written-off loans | 52,529 | 100,744 | 103,022 | 2.3 | % | 96.1 | % | 159,781 | 346,728 | 117.0 | % | |||||||||||||||||||||
| Provision for credit losses on loan portfolio, net of recoveries | (732,665 | ) | (164,414 | ) | (126,782 | ) | -22.9 | % | -82.7 | % | (5,920,508 | ) | (1,212,223 | ) | -79.5 | % | ||||||||||||||||
Cost of risk and Provisions | Quarter | % change | Year | % change | ||||||||||||||||||||||||||||
| 4Q20 | 3Q21 | 4Q21 | QoQ | YoY | 2020 | 2021 | 2021 / 2020 | |||||||||||||||||||||||||
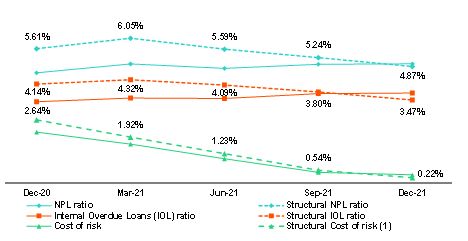
Cost of risk (1) | 2.13 | % | 0.45 | % | 0.34 | % | -11 bps | -179 bps | 4.30 | % | 0.82 | % | -348 bps | |||||||||||||||||||
Structural Cost of risk (2) | 2.64 | % | 0.54 | % | 0.22 | % | -32 bps | -242 bps | 5.12 | % | 0.89 | % | -423 bps | |||||||||||||||||||
(1) Annualized Provision for credit losses on loan portfolio, net of recoveries / Total loans.
(2) The Structural Cost of risk excludes the provisions for credit losses on loan portfolio, net of recoveries and total loans from the Reactiva Peru and FAE Government Programs
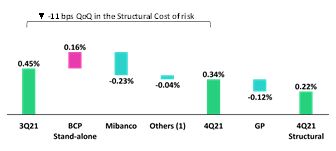
Provisions contracted -22.9% QoQ, which reflected the same trend seen in recent quarters. In this context, the cost of risk fell -11 bps and hit record lows. This was primarily driven by:
| • | SMEs: mainly driven by SME-Pyme, which was attributable to a reduction in the PD (Probability of Default) and LGD (Loss Given Default) risk levels due to adjustments to score models and lower delinquency respectively. |
| • | Mibanco: due to methodological adjustments to the PD (Probability of Default) Bottom-Up models; to a decrease in risk levels, which was attributable to an improvement in originations; and to collection processes. The aforementioned was partially attenuated by an uptick in the number of loans that progressed from Stage 1 to Stage 2. |
| • | BCP Bolivia: due to a reduction in calculation of the PD model, which drove recovery of written-off loans. |
The aforementioned was partially attenuated by growth in expenses in Wholesale Banking and Individuals Banking at BCP Stand-alone due to an uptick in advancements between Stages and after forecasts for economic activity in 2022 were revised downward. This was offset by a decrease in the PD levels of SME-Pyme.
If we exclude the GP effects, the structural cost of risk is 0.22% (-12 bps vs the total ratio) due to the fact that the largest volume of provisions in BCP Stand-alone was associated with the GP portfolio.
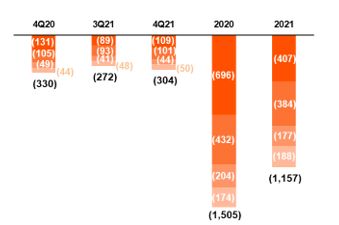
QoQ Evolution of the Cost of Risk
(1) Others include BCP Bolivia, Mibanco Colombia, ASB and eliminations.
YoY Evolution of the Cost of Risk
(1) Others include BCP Bolivia, Mibanco Colombia, ASB and eliminations.
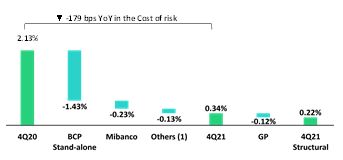
In the YoY analysis, provisions fell -70.7%; this was primarily driven by an upward revision in macroeconomic projections and by an uptick in positive payment behavior. Improvements in this regard were seen across the banking subsidiaries and were reflected in the -179 decrease in the cost of risk. This drop was mainly driven by:
| • | Individuals: which was fueled primarily by a drop in expenses in Consumer Banking after clients’ income levels improved (spurring a consequent decrease in debt with the financial system) and secondarily, by lower expenses in SME-Pyme Banking, which reflected adjustments to PD and LGD models. |
| • | Mibanco: which registered a significant uptick in the recovery of written-off loans; a decrease in progression to Stage 3; and improvements in client payment behavior. The aforementioned was offset by growth in provisions after adjustments were made to write-off policies. |
| 27 | |
| |
|
| • | SMEs: in line with what was mentioned in the TaT analysis. This was partially mitigated by the increase in SME-Business due to the update in the loss ratios of clients in the Structural and GP portfolios. |
The aforementioned was mitigated by the potential for new entries to NPL portfolio; an update in provisioning requirement for non-performing clients in Wholesale Banking; and an increase in provisions to cover the uptick of +7.2% in structural disbursements YoY.
If we exclude GP provisions and loans from the calculation base, the structural cost of risk reduced -242 bps YoY.
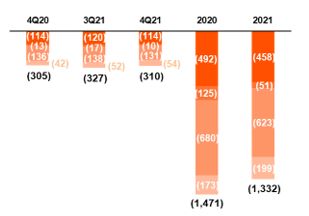
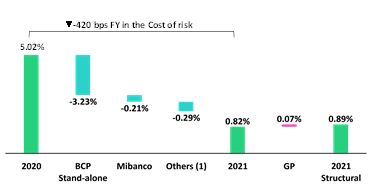
Full Year Evolution of the Cost of Risk
(1) Others include BCP Bolivia, Mibanco Colombia, ASB and eliminations.
In the full year analysis, provisions fell -79.5%. This evolution was due to the fact that significant numbers of forward-looking provisions were set aside in 2020 in a context of greater uncertainty than that seen in 2021. The contractions in provisions registered by each subsidiary are in line with the factors explained in the YoY analysis. In this scenario, the cost of risk fell to 0.82% at the end of December, which represented a contraction of -348 bps. If we exclude GP provisions and loans from the calculation base, the structural cost of risk situates at 0.89% (-423 bps vs 2020).
4.2. Delinquency
When examining portfolio delinquency, it is important to differentiate the evolution of the structural portfolio from that of the portfolio for Government Programs Loans (GP):
Structural Portfolio:
| Structural Portfolio quality and Delinquency ratios (1) | As of | % change | ||||||||||||||||||
| S/ 000 | Dec 20 | Sep 21 | Dec 21 | QoQ | YoY | |||||||||||||||
| Structural Total loans (Quarter-end balance) | 113,017,894 | 125,528,623 | 128,927,787 | 2.7 | % | 14.1 | % | |||||||||||||
| Structural Allowance for loan losses | 9,763,229 | 8,934,930 | 8,280,467 | -7.3 | % | -15.2 | % | |||||||||||||
| Structural Write-offs | 509,001 | 670,273 | 683,181 | 1.9 | % | 34.2 | % | |||||||||||||
| Structural IOLs | 4,675,731 | 4,776,182 | 4,475,373 | -6.3 | % | -4.3 | % | |||||||||||||
| Structural Refinanced loans | 1,664,626 | 1,798,965 | 1,799,541 | 0.0 | % | 8.1 | % | |||||||||||||
| Structural NPLs | 6,340,357 | 6,575,146 | 6,274,914 | -4.6 | % | -1.0 | % | |||||||||||||
| Structural IOL ratio | 4.14 | % | 3.80 | % | 3.47 | % | -33 bps | -67 bps | ||||||||||||
| Structural NPL ratio | 5.61 | % | 5.24 | % | 4.87 | % | -37 bps | -74 bps | ||||||||||||
| Structural Allowance for loan losses over Structural Total loans | 8.6 | % | 7.1 | % | 6.4 | % | -70 bps | -222 bps | ||||||||||||
| Structural Coverage ratio of NPLs | 154.0 | % | 135.9 | % | 132.0 | % | -393 bps | -2203 bps | ||||||||||||
(1) The Structural Portfolio excludes Government Programs (GP) effects.
In the QoQ analysis we find:
| • | IOL portfolio: a drop of -6.3% in IOL loans, which was primarily attributable to a contraction in overdue loans at Mibanco, in a context marked by an improvement in payment behavior and a decrease in loans under legal collection. |
| • | Refinanced Portfolio: remained stable as an increase in Mibanco was offset by a decrease in refinanced loans at BCP Stand-alone and BCP Bolivia. |
| • | Write-offs: the increase of +1.9% is due to Mibanco, whose charge-off levels reached all-time highs. This was partially attenuated by the decrease in write-offs at BCP Individual, which returned to pre-pandemic levels. |
| 28 | |
| |
|
| • | NPL Ratio: the ratio fell -37 bps, primarily driven by a drop in IOL loans at Mibanco and by an increase in total loans at BCP Stand-alone. |
| • | Coverage for the NPL portfolio: the ratio fell -393 bps; this is reflected by a drop in allowances for loan losses, which outpaced the decrease registered in IOL loans. |
In the YoY analysis:
| • | IOL portfolio: the reduction of -4.3% is mainly attributable to Individuals and Mibanco, which registered an improvement in payment behavior. The aforementioned was partially offset by an increase in IOLs in the SMEs segment after grace periods expired and more clients entered default. |
| • | Refinanced portfolio: the increase of +8.1% was generated by an uptick in loan reprogramming for clients at BCP Stand-alone due to the pandemic. |
| • | Write-offs: the combined banking subsidiaries reported +34.2% growth in write offs, which was led by Mibanco. |
| • | NPL Ratio: the drop of -74 bps was due to an increase in total loans (+14.1%) and to a decrease in the NPL volume (-1.0%). |
| • | Coverage for the NPL Portfolio: the contraction was primarily attributable to growth in the NPL portfolio and, to a lesser extent, to a drop in the allowance for loan losses. |
| (i) | GP Portfolio: |
| GP Portfolio quality and Delinquency ratios (1) | As of | % change | ||||||||||||||||||
| S/ 000 | Dec 20 | Sep 21 | Dec 21 | QoQ | YoY | |||||||||||||||
| GP Total loans (Quarter-end balance) | 24,641,991 | 21,022,603 | 18,669,625 | -11.2 | % | -24.2 | % | |||||||||||||
GP Allowance for loan losses | 135,531 | 142,519 | 196,841 | 38.1 | % | 45.2 | % | |||||||||||||
GP IOLs | - | 697,503 | 1,075,885 | 54.2 | % | n.a | ||||||||||||||
| GP IOL ratio | - | 3.32 | % | 5.76 | % | 244 bps | n.a | |||||||||||||
| GP Allowance for loan losses over GP Total loans | 0.5 | % | 0.7 | % | 1.1 | % | 37 bps | 50 bps | ||||||||||||
GP Coverage ratio of IOLs | - | 20.4 | % | 18.3 | % | -213 bps | n.a | |||||||||||||
(1) Government Programs (GP) include Reactiva Peru and FAE.
In the QoQ analysis:
| • | IOL portfolio: growth was driven by SME-Pyme at BCP Stand-alone and at Mibanco, which was attenuated by decreases in Wholesale Banking at BCP Stand-alone. |
| • | IOL Ratio: the increase was attributable to an uptick in IOL loans and to a reduction in total loans. |
| • | Coverage for the IOL Ratio: the reduction was due primarily to growth in IOL loans. |
The consolidated figures for Credicorp’s Total Portfolio, which reflect the evolutions of the Structural Portfolio and GP portfolio discussed above, were as follows:
| 29 | |
| |
|
Total Portfolio:
| Portfolio quality and Delinquency ratios | As of | % change | ||||||||||||||||||
| S/ 000 | Dec 20 | Sep 21 | Dec 21 | QoQ | YoY | |||||||||||||||
| Total loans (Quarter-end balance) | 137,659,885 | 146,551,226 | 147,597,412 | 0.7 | % | 7.2 | % | |||||||||||||
Allowance for loan losses | 9,898,760 | 9,077,449 | 8,477,308 | -6.6 | % | -14.4 | % | |||||||||||||
Write-offs | 509,001 | 670,273 | 683,181 | 1.9 | % | 34.2 | % | |||||||||||||
Internal overdue loans (IOLs) (1) | 4,675,731 | 5,473,685 | 5,551,258 | 1.4 | % | 18.7 | % | |||||||||||||
Internal overdue loans over 90-days (1) | 3,709,865 | 4,051,717 | 4,203,671 | 3.8 | % | 13.3 | % | |||||||||||||
Refinanced loans | 1,664,626 | 1,798,965 | 1,799,541 | 0.0 | % | 8.1 | % | |||||||||||||
Non-performing loans (NPLs) (2) | 6,340,357 | 7,272,650 | 7,350,799 | 1.1 | % | 15.9 | % | |||||||||||||
| IOL ratio | 3.40 | % | 3.73 | % | 3.76 | % | 3 bps | 36 bps | ||||||||||||
| IOL over 90-days ratio | 2.69 | % | 2.76 | % | 2.85 | % | 9 bps | 16 bps | ||||||||||||
| NPL ratio | 4.61 | % | 4.96 | % | 4.98 | % | 2 bps | 37 bps | ||||||||||||
| Allowance for loan losses over Total loans | 7.2 | % | 6.2 | % | 5.7 | % | -45 bps | -145 bps | ||||||||||||
Coverage ratio of IOLs | 211.7 | % | 165.8 | % | 152.7 | % | -1313 bps | -5900 bps | ||||||||||||
Coverage ratio of IOL 90-days | 266.8 | % | 224.0 | % | 201.7 | % | -2238 bps | -6516 bps | ||||||||||||
Coverage ratio of NPLs | 156.1 | % | 124.8 | % | 115.3 | % | -950 bps | -4080 bps | ||||||||||||
(1) Includes overdue loans and loans under legal collection (Quarter-end balances).
(2) Non-performing loans include internal overdue loans and refinanced loans (Quarter-end balances).
The Evolution of Portfolio Quality Ratios and Delinquency
(1) The Structural Cost of risk excludes the provisions for credit losses on loan portfolio, net of recoveries and total loans from the Reactiva Peru and FAE Government Programs.
When analyzing the evolution of delinquency indicators, it is necessary to note that: (i) traditional delinquency indicators (IOL and NPL ratios) continue to be distorted by the presence of loans that have collateral (commercial and residential properties). This means that a significant portion of loans that are more than 150 days overdue cannot be written off, despite being fully provisioned, given that the judicial process to liquidate the collateral can take up to five years on average.
In the context described above, Credicorp’s NPL ratio increased +2 bps QoQ. This result was mainly driven by NPL loans from the GP portfolio. It is important to note that structural NPL ratios were lower than total ratios.
In the YoY analysis, the ratio increased +37 bps. Growth was spurred by grace period expirations in the GP Portfolio, which were subsequently reflected in the increases seen in IOL and refinanced loans. In this scenario, the ratio situated at 4.98%.
| 30 | |
| |
|
4.2.1 Delinquency by segment
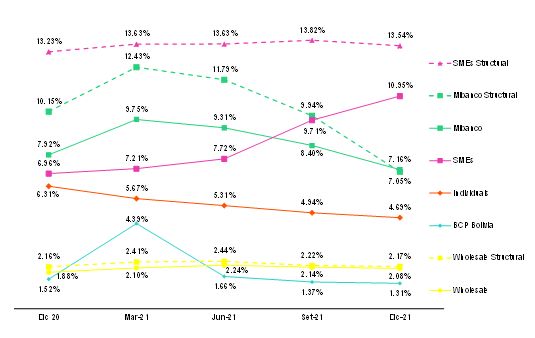
NPL Ratio by Segment
It is important to look at the following in the analysis of the NPL ratio by segment:
| (i) | Structural Portfolio |
In the QoQ analysis:
| • | Wholesale: the ratio fell -5 bps in a context of loan growth, as indicated in section 1.2.1. Loan evolution by business segment, and due to a drop in IOL and refinanced loans, which was associated with a small number of clients in Corporate Banking. |
| • | SME: the NPL ratio fell -28 bps given that the increase in loans (+6.5%) outpaced growth in NPL portfolio (+4.4%). |
| • | Personal: the drop of -25 bps was attributable to an increase in individuals’ liquidity after bonuses were paid in the month of December. |
| • | Mibanco: the reduction of -288 bps was attributable to a drop in IOL and refinanced loans, which was attributable to proactive collections and an increase in write-offs. Improvement was also driven by loan growth. |
| • | BCP Bolivia: the - 7 bps decline was attributable to clients’ positive payment behavior. It is important to note that the effects of grace period expirations will be evident in 2022. |
In the YoY analysis:
| • | Wholesale: increased +2 bps due to growth in the volume of IOL loans, which was associated with the evolution of a client in the Leisure and Tourism industry, whose services were negatively impacted by the pandemic. This was partially offset by the significant increase in loans (+22.6%). |
| • | SME: growth of +31 bps was due primarily to the deterioration of the SME-Pyme portfolio, which was impacted by an increase in the expirations volume. |
| • | Personal: a significant drop of -162 bps was registered due to improvements in payment behavior given that individuals were more liquid after AFP and CTS funds were released. |
| • | Mibanco: the contraction of -310 bps in the ratio was driven by positive payment behavior and by an increase in write-offs and loan disbursements. |
| • | BCP Bolivia: the -22-bps reduction followed the same trend as in the QoQ analysis and was complemented by loan growth and higher write-offs. |
| 31 | |
| |
|
| (ii) | GP Portfolio: |
In the QoQ analysis:
In 4Q21, grace period expirations were subsequently reflected in portfolio deterioration, particularly in the SME segment at BCP Stand-alone. At the beginning of 2021, clients began to make advance payments; this reduced the loan volume and affected delinquency ratios via a denominator effect.
| (iii) | Total Portfolio: |
In the QoQ and YoY analysis, ratios for total loans followed the same trends as those seen for the structural portfolio and were negatively impacted by the recent deterioration of the PG portfolio. It should be noted that overdue PG loans in late stages of delinquency are being recovered through state guarantees. For more information on honoring processes, see 4.3.2 Government Programs (PG).
4.3 Reprogramming and Payment Management3
4.3.1 Structural Portfolio4
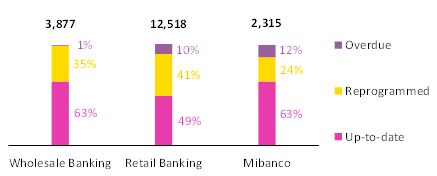
At the end of December, Credicorp’s structural portfolio registered growth of +2.7% QoQ and +14.1% YoY. For more information regarding this evolution, see section 1.2.1 Loan evolution by business segment. The reprogrammed structural portfolio continued to fall and represented 10% of total structural loans at quarter-end, which reflected a contraction of -330 bps QoQ and -680 bps YoY.
Evolution of the payment ratio5 (%)
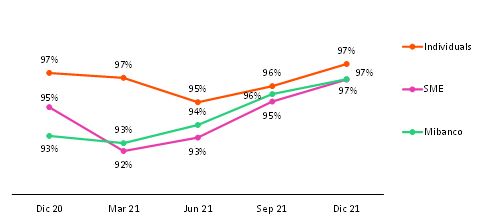
At the end of 2021, the payment ratio reported improvement both QoQ and YoY in all segments in a context in which the volume of installments due grew alongside an uptick in grace period expirations. The percentage of installments with maturities is 98% for Individuals, 82% for SME and 83% for Mibanco. Improvements in ratios were driven by an uptick in liquidity due to economic reactivation; the release of CTS and AFP funds; and bonus payments.
With regard to delinquency6, the majority is concentrated in early stages with high recovery levels, which is not reflected in the loan book balance. In Retail Banking, delinquency stood at 4.3%, which represents a contraction of -90 bps QoQ. 69% of this delinquency is contained in the less than 30 days overdue stages. Late delinquency (31 to 120 days), which includes loans that are considered more difficult to recover, deteriorated slightly due to the SME segment; this was attributable to clients who also have GP loans and did not apply for reprogramming facilities. The presence of these loans led to deterioration in both the structural portfolio and the GP portfolio. At Mibanco, IOL ratio fell -100 bps QoQ and stood at 5.8% after an uptick in transactions and income levels led to a subsequent improvement in payment ratios.
3 Portfolio Management figures, which focus on analyzing new delinquency. Figures do not include loans that are over 120 days overdue, special accounts and the under legal collections portfolio.
4 Figures do not include the government loan portfolios (GP).
5 Payment ratio: loan balances with up-to-date payments/balances of loans with due installments.
6 The overdue portfolio includes capital and interest on overdue loans beginning on day 1 and ending on day 120.
| 32 | |
| |
|
4.3.2 Government Programs (GP)7
Government Programs by Segment (S/ millions)
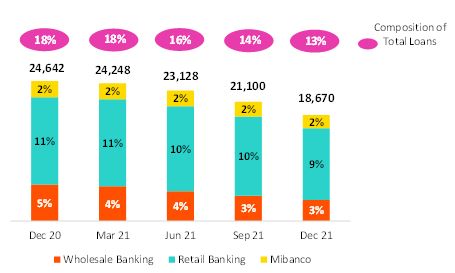
In 4Q21, GP loans dropped -11.2%. This reduction was driven by anticipated amortizations, mainly in SME-Business and Middle Market segments. At the end of the quarter, GP loans represented 13% of Credicorp’s total portfolio (in comparison to 14% in Sep 21). The reprogrammed GP portfolio registered a slight contraction and represented 38% of total GP loans at quarter-end. It is important to note that requests for reprogramming were accepted until the end of 4Q21; as such, real deterioration will only become evident in coming quarters.
In the YoY analysis, the GP portfolio fell -24.2%. The trend is similar to that seen QoQ (keep in mind that the peak of the GP portfolio was in 4Q20. This translated into a reduction of -5pp versus the results reported at the end of December 20.
Portfolio composition by Segment (S/ millions)
At the end of December, an uptick was registered in the reprogrammed portfolio in all segments. This situation was spurred by Peruvian government facilities, which allowed clients to reprogram loans if their sales volumes met certain requirements. IOL loans also reflected a higher level of deterioration due to an increase in grace period expirations. In Retail Banking, 45% of overdue loans are in an early stage of less than 31 days of delinquency. Total amortization in the Wholesale, Retail and Mibanco portfolios expires in 2.1 years, 2.3 years and 2.8 years respectively.
Finally, it is important to note that the GP portfolios are backed by State guarantees. At the end of September, average guarantee levels were situated at 83%, 91% and 97% for Wholesale, Retail and Mibanco respectively. Loans that become more than 90 days past due are transferred to Special Accounts and Payment Solutions, which notify regulatory entities to execute collateral agreements. At the end of 4Q21, there 1,561 requests in the honoring process, and 1,466 requests have already been honored (payments received) from Reactiva Peru program.
7 Government loans include current, overdue and reprogrammed loans through Reactiva Peru and FAE.
| 33 | |
| |
|

| 34 | |
| |
|
5. Other Income
| Other Income | Quarter | % change | Year | % change | ||||||||||||||||||||||||||||
| (S/ 000) | 4Q20 | 3Q21 | 4Q21 | QoQ | YoY | 2020 | 2021 | 2021 / 2020 | ||||||||||||||||||||||||
Fee income | 873,156 | 876,391 | 924,161 | 5.5 | % | 5.8 | % | 2,912,778 | 3,493,734 | 19.9 | % | |||||||||||||||||||||
Net gain on foreign exchange transactions | 151,464 | 238,886 | 269,354 | 12.8 | % | 77.8 | % | 622,783 | 920,797 | 47.9 | % | |||||||||||||||||||||
Net gain on securities | 162,523 | 5,739 | 2,550 | -55.6 | % | -98.4 | % | 458,410 | (45,371 | ) | -109.9 | % | ||||||||||||||||||||
Net gain from associates (1) | 19,296 | 19,090 | 13,224 | -30.7 | % | -31.5 | % | 64,672 | 74,021 | 14.5 | % | |||||||||||||||||||||
Net gain on derivatives held for trading | 18,298 | 43,086 | 27,049 | -37.2 | % | n.a. | 40,789 | 185,271 | 354.2 | % | ||||||||||||||||||||||
Net gain from exchange differences | 10,278 | 3,233 | (8,923 | ) | -376.0 | % | -186.8 | % | 19,804 | 34,698 | 75.2 | % | ||||||||||||||||||||
Other non-financial income | 94,518 | 52,258 | 74,544 | 42.6 | % | -21.1 | % | 286,981 | 263,716 | -8.1 | % | |||||||||||||||||||||
| Total other income | 1,329,533 | 1,238,683 | 1,301,959 | 5.1 | % | -2.1 | % | 4,406,217 | 4,926,866 | 11.8 | % | |||||||||||||||||||||
| (1) | Includes gains on other investments, mainly made up of the profit of Banmedica. |
| (2) | Differs from what was previously reported due to reclassification of IFRS16. |
Evolution of non-financial income

(1) Others includes Net gain from associates, Net gain from exchange difference and other non-financial income.
QoQ evolution of non-financial income
(1) Others includes Grupo Credito, Credicorp Stand-alone, eliminations y others.
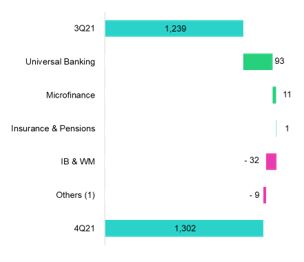
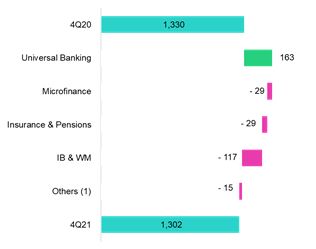
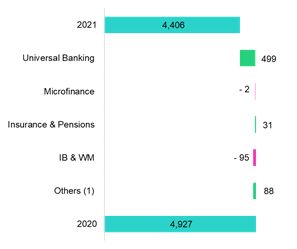
In the QoQ and YoY analysis, core other income rose 7.0% and 16.5% respectively. This evolution was driven by growth Net fee income in Universal Banking (+6.6%) and Microfinance (+14.3%), which is described in detail in the following section, and by an increase in the Net gain on foreign exchange transactions in Universal Banking, which registered unusually high levels of growth during both periods due to exchange rate volatility.
Non-core other income fell -12.1% due to the negative results registered in Investment Banking and Wealth Management for the Net gain on securities. This result was attributable to poor results in the local fixed income trading portfolio for Peru in a context of low market rates. The aforementioned was partially offset by an improvement in results for the Net gain on derivatives held for trading, which was driven by gains on FX swaps in Universal Banking.
Additionally, YoY, Insurance and Pensions registered a devaluation in its portfolio, which led to a subsequent drop in the Net gain on securities.
Combined, these results led to a +5.1% QoQ increase and -2.1% YoY decrease in other income.
| 35 | |
| |
|
YoY evolution of non-financial income
(1) Others includes Grupo Credito, Credicorp Stand-alone, eliminations y others.
FY evolution of non-financial income
(1) Others includes Grupo Credito, Credicorp Stand-alone, eliminations y others.
FY, the positive evolution (+24.9%) of core other income was driven by growth in Net fee income in Universal Banking; and Investment Banking and Wealth Management. In the first case, higher income was attributable to reactivation in 2021, which generated an uptick in transactionality that offset the effect created by the government’s decision to eliminate fees for certain concepts. In the case of Investment Banking and Wealth Management, the rise was due to an increase in fees, especially from investment products offered to Wealth Management clients on offshore platforms.
In contrast, other non-core income evolved negatively (-41.2%) due to:
| (i) | Losses registered in the Net gain on securities in Universal Banking after bonds from the fixed income portfolio at BCP Stand-alone were sold under a strategy to reduce the portfolio’s sensitivity. |
| (ii) | The lower Net gain on securities in Investment Banking and Wealth Management due to the extraordinary gains during 2020 generated by an investment at fair value with changes in other comprehensive income in ASB. |
In the aforementioned context, other income rose +11.8%.
| 36 | |
| |
|
5.1. Fee Income
5.1.2. Fee income in the Banking Business
Composition of fee income in the banking business
| Fee Income | Quarter | % change | Year | % change | |||||||||||||||||||||||||||||
| S/ 000 | 4Q20 | 3Q21 | 4Q21 | QoQ | YoY | 2020 | 2021 | 2021 / 2020 | |||||||||||||||||||||||||
Miscellaneous accounts (1) | 184,634 | 211,284 | 232,863 | 10.2 | % | 26.1 | % | 630,881 | 805,394 | 27.7 | % | ||||||||||||||||||||||
Credit cards (2) | 65,867 | 44,557 | 59,774 | 34.2 | % | -9.3 | % | 190,689 | 214,568 | 12.5 | % | ||||||||||||||||||||||
Drafts and transfers | 83,451 | 108,981 | 103,389 | -5.1 | % | 23.9 | % | 248,398 | 395,792 | 59.3 | % | ||||||||||||||||||||||
Personal loans (2) | 26,463 | 17,925 | 27,464 | 53.2 | % | 3.8 | % | 95,310 | 97,268 | 2.1 | % | ||||||||||||||||||||||
SME loans (2) | 24,343 | 7,441 | 17,570 | 136.1 | % | -27.8 | % | 69,762 | 56,367 | -19.2 | % | ||||||||||||||||||||||
Insurance (2) | 26,112 | 28,713 | 28,551 | -0.6 | % | 9.3 | % | 98,028 | 111,351 | 13.6 | % | ||||||||||||||||||||||
Mortgage loans (2) | 11,066 | 7,277 | 8,494 | 16.7 | % | -23.2 | % | 33,683 | 32,907 | -2.3 | % | ||||||||||||||||||||||
Off-balance sheet (3) | 53,825 | 65,919 | 62,521 | -5.2 | % | 16.2 | % | 201,579 | 248,897 | 23.5 | % | ||||||||||||||||||||||
Payments and collections (3) | 106,078 | 117,185 | 119,246 | 1.8 | % | 12.4 | % | 389,521 | 451,485 | 15.9 | % | ||||||||||||||||||||||
Commercial loans (3)(4) | 17,628 | 16,504 | 20,036 | 21.4 | % | 13.7 | % | 62,680 | 68,698 | 9.6 | % | ||||||||||||||||||||||
Foreign trade (3) | 14,775 | 18,497 | 15,503 | -16.2 | % | 4.9 | % | 48,390 | 67,096 | 38.7 | % | ||||||||||||||||||||||
Corporate finance and mutual funds (4) | 14,136 | 9,165 | 11,902 | 29.9 | % | -15.8 | % | 56,122 | 47,661 | -15.1 | % | ||||||||||||||||||||||
Mibanco | 57,140 | 18,583 | 29,776 | 60.2 | % | -47.9 | % | 84,951 | 76,732 | -9.7 | % | ||||||||||||||||||||||
BCP Bolivia | 27,886 | 30,494 | 26,852 | -11.9 | % | -3.7 | % | 98,169 | 122,437 | 24.7 | % | ||||||||||||||||||||||
ASB | 6,101 | 24,545 | 27,643 | 12.6 | % | 353.1 | % | 31,309 | 85,636 | 173.5 | % | ||||||||||||||||||||||
Others (4)(5) | 7,861 | 16,150 | 12,169 | -24.7 | % | 54.8 | % | 36,259 | 43,921 | 21.1 | % | ||||||||||||||||||||||
| Total fee income | 727,365 | 743,220 | 803,753 | 8.1 | % | 10.5 | % | 2,375,732 | 2,926,210 | 23.2 | % | ||||||||||||||||||||||
Source: BCP
(1) Saving accounts, current accounts, debit card and master account.
(2) Mainly Retail fees.
(3) Mainly Wholesale fees.
(4) Figures differ from previously reported, please consider the data presented on this report.
(5) Includes fees from trust business, wealth management, network usage and other services to third parties, among others.
Fee income in the banking business grew 8.1% QoQ. The components that registered the highest growth were:
| (i) | Miscellaneous accounts, where growth was driven by an uptick in consumption (seasonality at year-end) in establishments through POS with debit cards (+30.9%). It is important to note that a large portion of this consumption takes place in establishments that generate higher fees. |
| (ii) | Credit Cards, where growth, as in the case of debit cards, was driven by higher consumption in establishments and payment through POS. |
| (iii) | Mibanco, after payment of fees relative to insurance for reprogrammed loans was regularized and third-party fees dropped. |
| (iv) | SME-Pyme loans, due to growth in fees for on-line disbursements, which registered an uptick this quarter. |
YoY and FY, growth was fueled primarily by Miscellaneous Accounts and Drafts and Transfers given that in 2020, these fees were waived to assist clients during the pandemic. Additionally, during the second quarter of the year, foreign transfers and transfers to correspondents registered unusually high levels, which generated higher fees for these concepts. The aforementioned was partially offset by a decrease in fee income at Mibanco due to the elimination of penalties on late payments, which has been in place since June 2021.
It is important to note that although fees for fund withdrawals from correspondents and for late payments have been suspended since June, our fee income was 6.13% higher than that registered pre-pandemic year (2021 vs 2019). This was attributable to growth in fees for drafts and transfers (+49.5%), miscellaneous accounts 12.08% and off-balance sheet (+28.8%).
| 37 | |
| |
|

| 38 | |
| |
|
6. Insurance Underwriting Result
Insurance underwriting result (1) | Quarter | % change | Year | % change | |||||||||||||||||||||||||||||
| S/ 000 | 4Q20 | 3Q21 | 4Q21 | QoQ | YoY | 2020 | 2021 | 2021 / 2020 | |||||||||||||||||||||||||
Net earned premiums | 652,670 | 675,571 | 712,087 | 5.4 | % | 9.1 | % | 2,428,060 | 2,671,530 | 10.0 | % | ||||||||||||||||||||||
Net claims | (492,737 | ) | (517,951 | ) | (509,278 | ) | -1.7 | % | 3.4 | % | (1,708,113 | ) | (2,341,917 | ) | 37.1 | % | |||||||||||||||||
Acquisition cost (2) | (75,066 | ) | (87,416 | ) | (75,152 | ) | -14.0 | % | 0.1 | % | (361,814 | ) | (333,334 | ) | -7.9 | % | |||||||||||||||||
| Total insurance underwriting result | 84,867 | 70,204 | 127,657 | 81.8 | % | 50.4 | % | 358,133 | (3,721 | ) | -101.0 | % | |||||||||||||||||||||
(1) Includes the results of the Life, Property & Casualty and Crediseguros business.
(2) Includes net fees and underwriting expenses.
6.1. Life insurance
Total premiums in Life Insurance (S/ millions) | Net earned premiums (8) (S/ millions) |
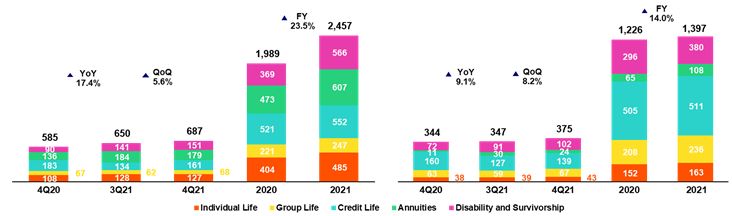 | |
Total premiums increased 5.6% QoQ. Growth was driven by: (i) Credit Life, which was attributable to a growth in loans, regularization of premiums and to an adjustment in the premium pricing both at BCP and Mibanco, (ii) Disability and Survivorship (D&S), which registered recovery in premium collections for Disability and Survivorship under the collective policy (SISCO V regimen⁽9⁾) and (iii) Group Life, which reported an increase in renewals of SCTR (Complementary Insurance for high-risk Occupations).
In the YoY analysis, total premiums increased 17.4%, which was driven by (i) D&S, which experienced an uptick in premium collections under the new SISCO V regimen via an increase in the premium rate; (ii) Annuities, due to growth in sales of Survivorship Annuities, (iii) Individual Life, which registered higher sales and an exchange rate effect; and (v) Group Life, mainly for price adjustments. The aforementioned, was mitigated by (v) Credit Life, which registered lower sales at the Alliance channel (given negative impact at Banco de la Nacion and Financiera Oh!), and at Mibanco given 4Q20 premium adjustments.
At a full year basis, total premiums increased 23.5%, driven by the country’s economic recovery. The D&S and Annuities segments drove growth in premiums. It is worth noting that the evolution of D&S reflected the fact that the premium rate under SISCO V is higher than that seen under SISCO IV.
Net earned premiums in the fourth quarter increased 8.2% QoQ and 9.1% YoY. This evolution as driven by the same factors described in the previous analysis. FY, net earned premiums grew 14.0%.
(8) Total premiums excluding premiums ceded to reinsurance and premium reserves.
(9) Public bidding process as a result of which the insurance companies that will collectively manage the risks of disability, survival and burial of AFP members for the period 2021-2022 are selected.
| 39 | |
| |
|
Net Life Insurance Claims
(S/ millions)
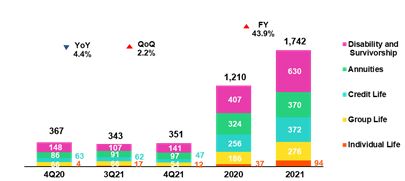
Net claims increased 2.2% QoQ in the fourth quarter. This result was attributable to the fact that S/ 1 million (vs reserve releases for 104 million in 3Q21) in IBNR⁽10⁾ reserves were set aside for COVID-19 and to the uptick in pension payments through Individual Annuities. The effect of setting aside reserves this quarter was mitigated by the decrease in reported claims after fewer COVID cases were reported once the second wave of the pandemic ceded. Reported claims, which were driven primarily by the Credit Life and D&S segments, totaled S/ 80 million (vs S/ 150 million in 3Q210.
In the YoY analysis, net claims fell 4.4%. This result was primarily attributable to the fact that fewer IBNR reserves were set aside for COVID-19 (S/ 1 million vs S/ 25 million in 4Q20), in line with the improvement in the sanitary situation and with an increase in ceded premiums in the D&S segment. This dynamic was partially attenuated by an increase in pension payments through Individual Annuities. In FY terms, claims increased 43.9%, which was due mainly to growth in claims for COVID, which totaled S/ 567.3 million (vs S/ 260.3 million in 2020).
It is important to note that after having registered a peak for COVID-19 claims in 2Q21, claims began to fall in July. This trend continues to be favorable and reflects the positive evolution of the vaccination process. At the end of 2021, more than 80% of the target population had been vaccinated with at least two doses.
6.2. P&C Insurance
Total P&C premiums (S/ millions) | Net earned premiums (11) (S/ millions) |
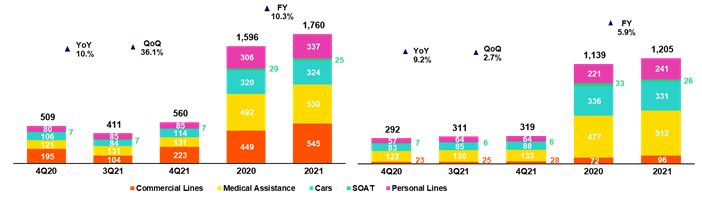 | |
Total premiums increased 36.1% QoQ, which was due, in part, to a seasonal effect. Growth was primarily driven by the following segments: (i) Commercial Lines, due to the volume of policy renewals in Fire, Maritime-Hull and Third-party Liability and (ii) Cars, due to growth in premiums after the broker and bancassurance channels reported increases in new clients and renewals.
In the YoY analysis, total premiums reported growth of 10.0%, which was attributable mainly to (i) Commercial Lines, due to an uptick in sales of policies in Fire, Maritime-Hull and Transportation, (ii) Medical Assistance, due to growth in premium renewals for comprehensive health and oncological products, (iii) Cars, due to an increase in renewals in the Brokers and Digital Sales channels, and (iv) Personal lines, due to an increase in policy issuances for the credit card product through digital sales and Personal Accidents. Finally, in a full year basis, total premiums grew 10.3% in a context of economic recovery.
(10) Incurred but not reported
(11) Total premiums less premiums ceded to reinsurance and premium reserves.
| 40 | |
| |
|
Net earned premiums increased 2.7% QoQ this quarter. This evolution was driven by the same factors outlined in the analysis of total premiums. These effects were partially attenuated by an increase in the ceded premium volume in Commercial Lines and to an increase in reserves for current risk, particularly in Cars. In the YoY analysis, net earned premiums increased 9.2%. Finally, in the FY analysis, net earned premiums increased 5.9% in 2021 in a context of economic recovery at the national level.
Net Claims in P&C
(S/ millions)
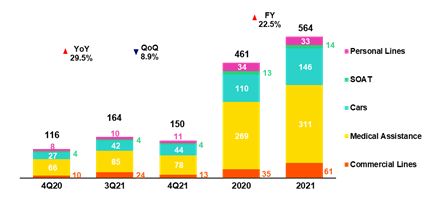
Net claims fell 8.9% QoQ. This contraction is primarily due to the evolution of: (i) Commercial Lines, which registered an increase in severity last quarter in insurance for All Risk for Contractors (machinery) and Transportation, (ii) Medical Assistance, which reported a decrease in case frequency for medical services through comprehensive health products. This was mitigated by (iii) Cars, due to an increase in claims frequency and in the use of vehicles; (iv) SOAT, which registered higher cases, and (v) Personal Lines mainly in the SME business multi-risk product due to fires.
In the YoY analysis, net claims increased 29.5% during the fourth quarter. This growth was primarily driven by (i) Cars and SOAT, which experienced an uptick in claims frequency and (ii) Medical Assistance, which registered growth in claims due to growth in expenses relative to COVID claims and to the fact that claims for other illnesses increased, (ii) Commercial Lines, given an uptick in cases in the transportation line and contractors all risks insurance, and (iv) Personal Lines, due to an increase in the SME business multi-risk product. Finally, in the FY analysis, net claims increased 22.5% in 2021 driven by the same factors outlined in the YoY analysis; growth in claims was mitigated by a decrease in Personal Lines due to drop in case frequency relative to the card protection product.
6.3. Acquisition Cost
| Acquisition cost | Quarter | % change | Year | % change | |||||||||||||||||||||||||||||
| S/ 000 | 4Q20 | 3Q21 | 4Q21 | QoQ | YoY | 2020 | 2021 | 2021 / 2020 | |||||||||||||||||||||||||
Net fees | (63,831 | ) | (51,617 | ) | (56,359 | ) | 9.2 | % | -11.7 | % | (239,219 | ) | (217,389 | ) | -9.1 | % | |||||||||||||||||
Underwriting expenses | (19,628 | ) | (33,543 | ) | (22,526 | ) | -32.8 | % | 14.8 | % | (132,994 | ) | (119,468 | ) | -10.2 | % | |||||||||||||||||
Underwriting income | 8,393 | (2,256 | ) | 3,734 | -265.5 | % | -55.5 | % | 10,399 | 3,524 | -66.1 | % | |||||||||||||||||||||
| Acquisition cost | (75,066 | ) | (87,416 | ) | (75,152 | ) | -14.0 | % | 0.1 | % | (361,814 | ) | (333,334 | ) | -7.9 | % | |||||||||||||||||
Acquisition cost by business
(S/ millions)
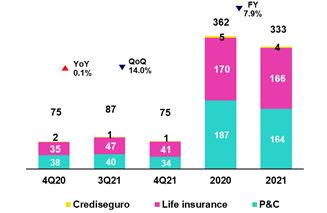
| 41 | |
| |
|
The acquisition cost fell 14.0% QoQ in the fourth quarter, which was primarily due to a decrease in the underwriting expense. In P&C, the decrease in the underwriting expense was attributable to provision releases for sale expenses for promotions and to provision releases for uncollectible premiums, particularly in Cars. In the Life business, the decrease in underwriting expenses was due primarily to provision releases for expenses for uncollectible premiums associated with reinsurance.
In the YoY analysis, the acquisition cost in the fourth quarter remained almost constant. Growth in underwriting expenses was offset by a drop in expenses for commissions. In the Life business, an increase in the acquisition cost was driven primarily by a decrease in underwriting income due to profit-sharing with reinsurers in 4Q20. In P&C, the decrease in the acquisition cost was attributable to a drop in commissions, particularly in Personal Lines.
In the FY analysis, the acquisition cost fell 7.9% in 2021 given that the underwriting expense registered in 2020 in P&C was particularly high, mainly due to the evolution of Cars (in line with premium reimbursements in the context of the pandemic) and to a decrease in commissions in P&C and life in 2021.
6.4. Underwriting Result by Business
Underwriting Result by Business
(S/ millions)
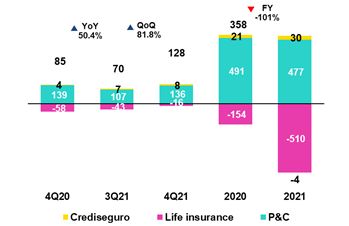
In the QoQ analysis, the underwriting result grew 81.8% in the fourth quarter and returned to pre-pandemic levels due to the positive evolution of both businesses. In P&C, the increase in the underwriting result was associated with growth in net earned premiums through Medical Assistance, Commercial Lines and Cars and with a decrease in claims, which reflected severe claims last quarter. In Life Business, the increase in the underwriting result was attributable to an increase in net earned premiums, particularly through Credit Life, D&S and Group Life. This was attenuated by an increase in claims due to set aside IBNR reserves for COVID-19.
In the YoY analysis, the improvement in the underwriting result was driven by an increase in net earned premiums in both business and to a decrease in claims in Life, in line with a decrease in the number of reserves set aside after the end of the second wave of COVID-19. The aforementioned was attenuated by growth in claims in P&C, which was mainly attributable to Medical Assistance, Commercial Lines and Cars.
On a full year basis, the lower result in 2021 was attributable to the evolution of Life insurance and, to a lesser extent, to that of P&C. Life insurance was impacted by a growth in claims reported and IBNR as a result of the second wave of COVID-19. The aforementioned was mitigated by growth in net earned premiums and a reduction in acquisition costs. In P&C, the decrease in the underwriting result was attributable to growth in claims through the Medical Assistance, Cars and Commercial Lines due to an uptick in claims frequency and severity after mobilization restrictions were lifted in the year; this was mitigated by growth in net earned premiums, which was mainly associated with an increase in sales through the Medical Assistance, Commercial Lines and Personal Lines.
| 42 | |
| |
|

| 43 | |
| |
|
| Operating expenses | Quarter | % change | Year | % change | |||||||||||||||||||||||||||||
| S/ 000 | 4Q20 | 3Q21 | 4Q21 | QoQ | YoY | 2020 | 2021 | 2021 / 2020 | |||||||||||||||||||||||||
Salaries and employees benefits | 792,336 | 915,564 | 1,013,176 | 10.7 | % | 27.9 | % | 3,312,954 | 3,668,476 | 10.7 | % | ||||||||||||||||||||||
Administrative, general and tax expenses (1) | 742,098 | 803,156 | 899,290 | 12.0 | % | 21.2 | % | 2,386,108 | 2,956,093 | 23.9 | % | ||||||||||||||||||||||
Depreciation and amortization (1) | 164,541 | 170,960 | 181,660 | 6.3 | % | 10.4 | % | 669,915 | 683,254 | 2.0 | % | ||||||||||||||||||||||
Association in participation | 17,079 | 10,426 | 13,965 | 33.9 | % | -18.2 | % | 52,019 | 47,176 | -9.3 | % | ||||||||||||||||||||||
Acquisition cost (2) | 75,066 | 87,416 | 75,152 | -14.0 | % | 0.1 | % | 361,814 | 333,334 | -7.9 | % | ||||||||||||||||||||||
Operating expenses (3) | 1,791,120 | 1,987,522 | 2,183,243 | 9.8 | % | 21.9 | % | 6,782,810 | 7,688,333 | 13.4 | % | ||||||||||||||||||||||
| (1) | 4Q20 figures differ from what was previously reported by reclassification of IFRS16. |
| (2) | The acquisition cost of Pacifico includes net fees and underwriting expenses. |
| (3) | Operating expenses = Salaries and employee’s benefits + Administrative expenses + Depreciation and amortization + Association in participation + Acquisition cost. |
Composition of operating expenses
December-21
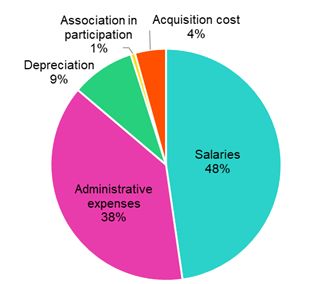
In the QoQ, YoY and FY analysis, expenses rose due to:
| (i) | Growth in administrative and general expenses and taxes given that we are in the process of accelerating our digital transformation and as such, have increased investment in technology, data analysis, consultancy, among others. |
| (ii) | An increase in Salaries and Employee Benefits, after earnings rose in a context marked by economic reactivation and moves to hire more specialized technical profiles under our digital transformation strategy. |
It is important to note that exchange rate volatility had a significant impact on expenses this year. If we exclude this effect, growth in expenses stands at 13.2% (decrease of 20bps).
7.1. Administrative and General Expenses and Taxes
Administrative and general expenses and taxes
| Administrative, general and tax expenses | Quarter | % change | Year | % change | |||||||||||||||||||||||||||||
| S/ 000 | 4Q20 | 3Q21 | 4Q21 | QoQ | YoY | 2020 | 2021 | 2021 / 2020 | |||||||||||||||||||||||||
IT expenses and IT third-party services | 176,548 | 181,936 | 234,556 | 28.9 | % | 32.9 | % | 515,542 | 691,402 | 34.1 | % | ||||||||||||||||||||||
Advertising and customer loyalty programs | 42,989 | 35,080 | 76,266 | 117.4 | % | 77.4 | % | 349,745 | 486,885 | 39.2 | % | ||||||||||||||||||||||
Audit Services, Consulting and professional fees | 129,489 | 123,603 | 185,896 | 50.4 | % | 43.6 | % | 219,671 | 312,752 | 42.4 | % | ||||||||||||||||||||||
Taxes and contributions | 75,477 | 80,626 | 62,644 | -22.3 | % | -17.0 | % | 266,704 | 289,484 | 8.5 | % | ||||||||||||||||||||||
Infrastructure maintenance and repair | 82,359 | 114,551 | 97,026 | -15.3 | % | 17.8 | % | 133,257 | 176,093 | 32.1 | % | ||||||||||||||||||||||
Transport and communications | 51,956 | 59,578 | 66,026 | 10.8 | % | 27.1 | % | 167,517 | 222,706 | 32.9 | % | ||||||||||||||||||||||
Agents' Fees | 25,124 | 26,486 | 27,960 | 5.6 | % | 11.3 | % | 87,899 | 104,700 | 19.1 | % | ||||||||||||||||||||||
Leases of low value and short-term | 17,473 | 25,710 | 15,530 | -39.6 | % | -11.1 | % | 70,404 | 86,417 | 22.7 | % | ||||||||||||||||||||||
Miscellaneous supplies | 21,311 | 13,068 | 15,035 | 15.1 | % | -29.4 | % | 67,537 | 57,093 | -15.5 | % | ||||||||||||||||||||||
Security and protection | 16,536 | 15,468 | 16,381 | 5.9 | % | -0.9 | % | 64,439 | 63,500 | -1.5 | % | ||||||||||||||||||||||
Electricity and water | 14,532 | 11,102 | 14,384 | 29.6 | % | -1.0 | % | 51,649 | 48,886 | -5.3 | % | ||||||||||||||||||||||
Subscriptions and quotes | 13,978 | 13,312 | 14,717 | 10.6 | % | 5.3 | % | 49,212 | 54,674 | 11.1 | % | ||||||||||||||||||||||
Insurances | 17,550 | 36,968 | 13,957 | -62.2 | % | -20.5 | % | 46,047 | 64,519 | 40.1 | % | ||||||||||||||||||||||
Electronic processing | 12,619 | 10,863 | 7,574 | -30.3 | % | -40.0 | % | 36,920 | 39,528 | 7.1 | % | ||||||||||||||||||||||
Cleaning | 5,155 | 4,630 | 4,987 | 7.7 | % | -3.3 | % | 22,900 | 20,105 | -12.2 | % | ||||||||||||||||||||||
Services by third-party | 16,819 | 16,131 | 43,598 | 170.3 | % | 159.2 | % | 48,869 | 86,283 | 76.6 | % | ||||||||||||||||||||||
Others (1) | 22,183 | 34,045 | 2,753 | -91.9 | % | -87.6 | % | 187,796 | 151,066 | -19.6 | % | ||||||||||||||||||||||
| Total administrative and general expenses | 742,098 | 803,157 | 899,290 | 12.0 | % | 21.2 | % | 2,386,108 | 2,956,093 | 23.9 | % | ||||||||||||||||||||||
(1) The balance consists mainly of security and protection services, cleaning service, representation expenses, electricity and water utilities, insurance policiy expenses, subscription expenses and commission expenses.
| 44 | |
| |
|
In the QoQ, YoY and FY analysis, administrative and general expenses and taxes rose due to:
| (i) | Growth in expenses in IT expenses and IT third-party services, which was fueled by new IT projects for digital transformation, disruptive initiatives, business improvements and sustainability. |
| (ii) | Growth in expenses in Advertising and customer loyalty programs due to an uptick in consumption of LATAM miles through the LATAM fidelity program, which reflects an increase in consumption with debit or credit cards in 2021. |
| (iii) | Growth in expenses in Audit Services, Consulting and professional fees was generated by an increase in investment in in the digital transformation program and in new disruptive initiatives. |
| 45 | |
| |
|

| 46 | |
| |
|
8. Operating Efficiency
| Operating Efficiency | Quarter | % change | Year | % change | |||||||||||||||||||||||||||||
| S/ 000 | 4Q20 | 3Q21 | 4Q21 | QoQ | YoY | 2020 | 2021 | 2021 / 2020 | |||||||||||||||||||||||||
Operating expenses (1) | 1,791,120 | 1,987,522 | 2,183,243 | 9.8 | % | 21.9 | % | 6,782,810 | 7,688,333 | 13.35 | % | ||||||||||||||||||||||
Operating income (2) | 3,793,722 | 4,307,965 | 4,414,799 | 2.5 | % | 16.4 | % | 14,660,228 | 16,742,031 | 14.2 | % | ||||||||||||||||||||||
Efficiency ratio (3) | 47.2 | % | 46.1 | % | 49.5 | % | 340 bps | 230 bps | 46.3 | % | 45.9 | % | -40 bps | ||||||||||||||||||||
Operating expenses / Total average assets (4) | 3.05 | % | 3.20 | % | 3.52 | % | 32 bps | 47 bps | 3.19 | % | 3.19 | % | 0 bps | ||||||||||||||||||||
(1) Operating expenses = Salaries and employee’s benefits + Administrative expenses + Depreciation and amortization + Association in participation + Acquisition cost.
(2) Operating income = Net interest, similar income and expenses + Fee income + Net gain on foreign exchange transactions + Net gain from associates + Net gain on derivatives held for trading + Net gain from exchange differences + Net premiums earned
(3) Operating expenses / Operating income.
(4) Operating expenses / Average of Total Assets. Average is calculated with period beginning and period-ending balances.
| 8.1 | Efficiency ratio by income and expense items |
FY efficiency ratio by account

(1) Other operating income includes: Net gain on foreign exchange transactions, Net gain from associates, Net gain on derivatives held for trading and Net gain from exchange difference.
(2) Other operating expenses includes: Acquisition cost and Association in participation.
QoQ and YoY, the efficiency ratio fell 340bps and 230bps respectively. These results were attributable to: i) an increase in Salaries and employee benefits in a context marked by higher earnings and efforts to hire more specialized technical profiles and ii) growth in Administrative and general taxes and expenses related to digital transformation.
FY, the efficiency ratio improved 40 bps due to:
| (i) | An increase in Net interest income due to an improvement in the funding structure and an increase in structural loans at Mibanco. |
| (ii) | Growth in Net fee income, which was driven by an uptick in transactions due to the economic reactivation. It is important to note that fee income was up despite the fact that late payments fee and fees for withdrawals from correspondents were suspended since June due to regulatory changes. |
| (iii) | Growth in Net gains on foreign exchange transactions due to exchange rate volatility during the year. |
| (iv) | Higher income for Net earned Premiums, which increased after Pacifico won a large tranche of SISCO V, which offers higher premiums than SISCO IV. Growth in this component was also driven by an increase in premiums for credit life insurance, in line with a rebound in loan disbursements at Mibanco. |
The aforementioned improvement was partially offset by growth in Administrative and general expenses and taxes (higher expenses for digital transformation at BCP) and in Salaries and Employee benefits (in line with higher earnings).
| 47 | |
| |
|
8.2. Efficiency Ratio reported by subsidiary (1)
BCP Stand-alone | BCP Bolivia | Mibanco Peru | Mibanco Colombia | Pacifico | Prima AFP | Credicorp | ||||||||||||||||
| 4Q20 | 41.4 | % | -140.8 | % | 55.7 | % | 95.4 | % | 39.7 | % | 45.6 | % | 47.2 | % | ||||||||
| 3Q21 | 45.3 | % | 53.0 | % | 49.7 | % | 86.4 | % | 36.9 | % | 51.1 | % | 46.1 | % | ||||||||
| 4Q21 | 47.4 | % | 70.0 | % | 55.6 | % | 67.4 | % | 35.2 | % | 61.2 | % | 49.5 | % | ||||||||
| Var. QoQ | 210 bps | 1700 bps | 590 bps | -1900 bps | -170 bps | 1010 bps | 340 bps | |||||||||||||||
| Var. YoY | 600 bps | 21080 bps | -10 bps | -2800 bps | -450 bps | 1560 bps | 230 bps |
| 2020 | 40.9 | % | 87.8 | % | 62.6 | % | 97.5 | % | 39.0 | % | 47.3 | % | 46.3 | % | ||||||||
| 2021 | 43.4 | % | 60.3 | % | 57.9 | % | 0.0 | % | 36.5 | % | 50.7 | % | 45.9 | % | ||||||||
% change 2021 / 2020 | 250 bps | -2750 bps | -470 bps | -9750 bps | -250 bps | 340 bps | -40 bps |
| (1) | (Salaries and employees benefits + Administrative, general and tax expenses + Depreciation and amortization + Acquisition cost + Association in participation) / (Net interest income + Fee income + Net gain on foreign exchange transactions + Net gain from associates + Net gain on derivatives held for trading + Result on exchange differences + Net premiums earned). |
In the QoQ and YoY analysis, the efficiency ratio deteriorated due to an uptick in expenses for digital transformation and for disruptive initiatives at BCP Stand-alone.
FY evolution of the efficiency ratio by subsidiary
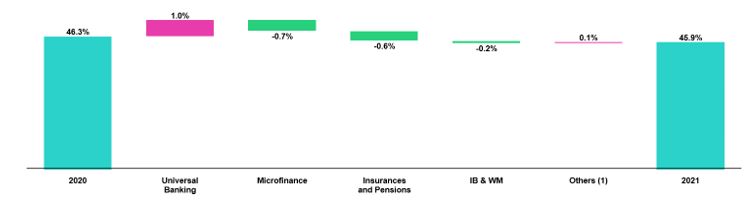
(1) Others includes Grupo Credito, among other subsidiaries and consolidation eliminations.
FY, efficiency registered an improvement due to:
| (i) | Growth in interest income at Mibanco due to an increase in structural loan disbursements. |
| (ii) | Higher fee income at Pacífico after in won part of the SISCO V tender. |
| (iii) | The increase in Net fee income in Investment Banking and Wealth Management due to growth in commissions charged to clients that enter international platforms through ASB services and in brokerage fees. |
The aforementioned improvement was partially offset by an increase in general expenses in Universal Banking, where efforts to implement the digital transformation strategy and disruptive initiatives have been accelerated.
| 48 | |
| |
|

| 49 | |
| |
|
9. Regulatory Capital
9.1. Credicorp Regulatory Capital
Credicorp’s regulatory capital ratio was 1.53 at the end of 4Q21.
In the QoQ analysis, the regulatory capital ratio remained stable. This result was driven by a decrease in capital requirements, offset by a reduction in subordinated debt balances associated with an exchange rate effect.
In the YoY analysis, the capital ratio registered an increase from 1.38 to 1.53, which was attributable to (i) higher levels of subordinated debt (associated with the exchange rate effect) and (ii) growth in eligible provisions that can be considered regulatory capital. SBS’s decision to decrease credit risk requirements for companies in the financial system also boosted the Capital ratio.
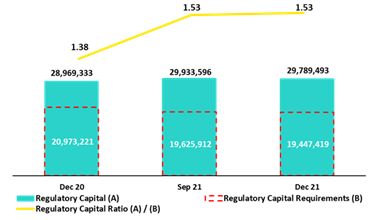
9.2. Regulatory Capital BCP Stand-alone – Perú GAAP
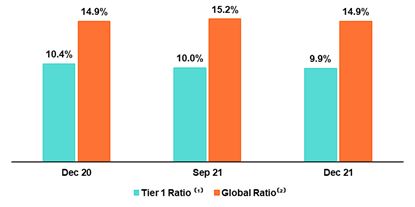
At the end of 4Q21, the Tier 1 regulatory ratio and the Global capital ratio at BCP Stand-alone stood at 9.9% (-6 bps QoQ) and 14.9% (-22 bps QoQ) respectively. Growth of +0.6% in regulatory RWAs was noteworthy and in line with loan growth. The global capital ratio reflected a drop of -0.8%, which was attributable to a reduction in the subordinated debt due to the appreciation of the sol.
(1) Regulatory Tier 1 Capital / Total Risk-weighted assets
(2) Total Regulatory Capital / Total Risk-weighted assets (legal minimum = 10% since July 2011)
In the YoY analysis, the Tier 1 regulatory ratio fell 47 bps while the global ratio remained constant (+1 bps). These results were attributable to the 7.3% YoY increase in regulatory RWAs, which was partially offset by an increase in the level of Tier 1 regulatory equity (+2.4%). This growth was attributable to decision in the month of March to capitalize earnings and set aside reserves. The global capital ratio registered a 7.4% increase YoY. This growth was driven by an uptick in subordinated debt, which was primarily generated by the exchange rate effect.
Common Equity Tier 1 Ratio – BCP Stand-alone
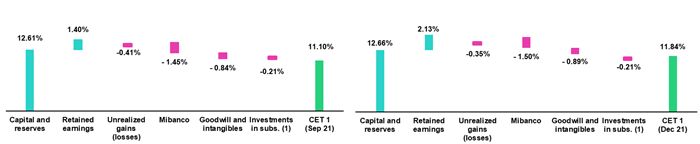
(1) Includes investments in BCP Bolivia and other subsidiaries
Finally, the Common Equity Tier 1 ratio (CET1) at BCP registered growth of + 74 bps QoQ and at the end of 4Q21, stood at 4.84%. This evolution was primarily driven by: (i) an increase in the CET1 balance (+6.2% QoQ), in line with an improvement in retained earnings at BCP.
In the YoY analysis, the CET1 ratio increased +44 bps due to +10.2% growth in the CET1 balance. The aforementioned was partially offset by growth in RWAs (+6.1% YoY). It is important to note that the increase described for the CET1 balance was driven primarily by growth in retained earnings at BCP (+264%), which was mitigated by the unrealized losses that accumulated over the first 9 months of the year.
| 50 | |
| |
|
9.3. Regulatory Capital Mibanco – Perú GAAP
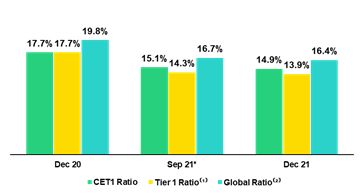
At the end of 4Q21, the Tier 1 regulatory ratio and the global capital ratio at Mibanco stood at 13.9% and 16.4% after falling -32 bps and -38 bps respectively. These results were impacted by the increase in regulatory RWAs (+4.9%), which was in turn driven by loan growth. The aforementioned was somewhat attenuated by an increase in accumulated earnings with capitalization agreements.
(1) Regulatory Tier 1 Capital / Total Risk-weighted assets
(2) Total Regulatory Capital / Total Risk-weighted assets (legal minimum = 10% since July 2011)
(*) Ratios differ from previously reported, please consider the data presented on this report.
The YoY evolution shows a decrease of -374 bps and -346 bps in the Tier 1 regulatory ratio and the global capital ratio respectively. Both variations were attributable to +14.0% growth in regulatory RWAs, which was driven by loan expansion. The drop in both ratios was associated with a decrease in the company’s share capital after provisions were set aside to cover this account (local accounting) in March 2021.
Finally, the CET1 Ratio fell -25 bps QoQ to stand at 14.9% in 4Q21. This decrease was mainly driven by +4.9% growth in RWAs, which was attributable to loan growth. This effect was partially mitigated by growth in retained earnings (+27.6%). In the YoY analysis the CET1 Ratio fell -285 bps in a context of loan growth.
| 51 | |
| |
|

| 52 | |
| |
|
In 2021, we pushed to accelerate the transformation journey across Credicorp. This entailed increasing investment in technology and seeking to attract and develop specialized talent, which are key enablers that generate constant challenges. We sought to anticipate our clients’ new needs and improve our products and services to efficiently satisfy and strengthen our long-term competitiveness.
In 4Q21, we redesigned our disruptive innovation model to complement our incumbents’ transformation and to ensure that we remain on the cutting-edge. Our main objective is to strengthen the capacity to incubate new businesses in the innovation centers for each LOB while we develop innovation for current and/or future businesses through our recently consolidated Corporate Venture Capital Center, Krealo.
10.1 Digital Transformation BCP Stand-alone
10.1.1 Digitalization in Personal Banking
Evolution of Digital Clients (1)
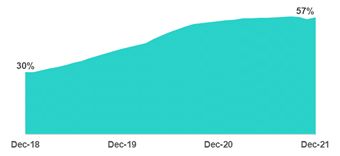
Composition of digital clients (1) by segment
| Segment | 4T20 | 3T21 | 4T21 | |||||||||
| Enalta | 86 | % | 87 | % | 99 | % | ||||||
| Affluent | 80 | % | 81 | % | 81 | % | ||||||
| Consumer | 54 | % | 56 | % | 55 | % | ||||||
| Total | 55 | % | 57 | % | 57 | % |
(1) Digital Clients: Retail banking customers who carry out 50% of their monetary transactions through digital channels; or bought products online in the last 12 months.
The number of digital clients has followed an upward trend over the last few quarters. In 4Q21, digital clients represented 57% of Personal Banking’s total clients. Through digital channels, we seek to offer convenience and better client experiences while optimizing our efficiency in the mid-term. We are accelerating initiatives to improve functionalities, cybersecurity and digital products.
10.1.2 Migration of Transactions to digital channels
Evolution of averange monthly transactions per channel
Expressed in millions of transactions
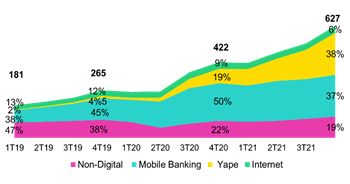
Evolution of average monthly monetary transactions per channel and the transactions unit cost
Expressed in millions of transactions

The monthly average of total transactions grew +18.6% QoQ and +48.6% YoY, which was driven mainly by monetary transactions (+15.4% QoQ and +60.2%) in a quarter that is characterized by high consumption every year.
In digital channels, growth in monthly average transactions was noteworthy in:
| 53 | |
| |
|
| (i) | Yape, which grew 42.6% QoQ and 215.0% YoY. This channel is currently used by our clients more than any other (see section 10.1.5. Disruptive Initiatives – Yape.). |
| (ii) | Mobile Banking, which grew 1.3% QoQ and 32.0% YoY. Mobile Banking has grown at a constant rate since the pandemic began. |
In traditional channels, growth in monthly average transactions was driven by:
| (i) | Agentes BCP, which grew +5.3 QoQ and +16.5% YoY in line with an increase in the number of agents under our plan to optimize the physical network. |
| (ii) | POS, which grew +20.0% QoQ and +87.2% YoY in a context marked by economic reactivation and seasonal factors in the last quarter of the year. |
The fact that transactions have migrated to digital and cost-efficient channels, the monthly average transactions cost well from 0.27 in 4Q20 to 0.19 in 4Q21.
10.1.3 Self-Service and Digital Sales
Digital sales, measured in units, continue to follow an upward trend.
At the end of 4Q21, self-service sales represented 15% of total units sold compared to 11% in 4Q20 while digital sales accounted for 34% of total units sold versus 26% in 4Q20.
Retail Banking Sales
| Unit sold per Quarter | % Change | Year | % Change | |||||||||||||||||||||||||||||
| 4Q20 | 3Q21 | 4Q21 | TaT | AaA | 2020 | 2021 | 2021 / 2020 | |||||||||||||||||||||||||
Traditionals Sales | 1,517,597 | 1,100,932 | 1,373,079 | 24.7 | % | -9.5 | % | 4,470,429 | 5,000,375 | 11.9 | % | |||||||||||||||||||||
Selfserved Sales (1) | 258,734 | 376,945 | 421,675 | 11.9 | % | 63.0 | % | 1,031,029 | 1,401,616 | 35.9 | % | |||||||||||||||||||||
Digital Sales (2) | 620,133 | 879,604 | 926,953 | 5.4 | % | 49.5 | % | 2,038,468 | 3,352,517 | 64.5 | % | |||||||||||||||||||||
| Total Sales | 2,396,464 | 2,357,481 | 2,721,707 | 15.4 | % | 13.6 | % | 7,539,926 | 9,754,508 | 29.4 | % | |||||||||||||||||||||
| (1) | Sales made through ATMs and Kioskos BCP. |
| (2) | Sales made through Mobile Banking, Internet Banking, Yape and other digital channels. |
Self-service sales registered growth of 46% for Savings Accounts and 15% for Advance on Wages in 2021.
Among Digital channels, YoY growth in Advance on Wages was noteworthy, along with expansion in Insurance (+395%) and Personal Loans (+132%). It is important to note that YoY growth in 2021 has been led by digital channels. This year, the team’s efforts were focused on improving service channels’ operating stability and cybersecurity to bolster client satisfaction.
10.1.4 Optimization of BCP’s Physical Network
The advance of client migration to digital channels has spurred an optimization of BCP’s physical network. The optimization process entails closing branches and increasing the number of Agentes and ATMs to complement our transactional capacity. This involves remodeling and reviewing branch designs to reflect the importance of commercial roles.
BCP Points of Contact
| As of | change (units) | |||||||||||||||||||
| Dec 20 | Sep 21 | Dec 21 | QoQ | YoY | ||||||||||||||||
Branches | 388 | 359 | 357 | -2 | -31 | |||||||||||||||
ATMs | 2,317 | 2,248 | 2,222 | -26 | -95 | |||||||||||||||
Agentes BCP | 7,003 | 6,998 | 8,054 | 1,056 | 1,051 | |||||||||||||||
| Total BCP's Network | 9,708 | 9,605 | 10,633 | 1,028 | 925 | |||||||||||||||
| 54 | |
| |
|
10.1.5 Disruptive Initiatives – Yape
Yape is an application for money transfers and payments via a mobile phone or single QR code. The purpose of this app is to replace the use of cash for small-ticket, recurrent transfers or payments for services. Today, Yape’s ambition is more beyond this:
| (i) | To become a SuperApp. |
| (ii) | To contribute advancing efforts to financially include more Peruvians who have no access to banking services. |
| (iii) | To become the main digital channel through which companies sell in Peru. |
Yape users evolution
Expressed in million of users
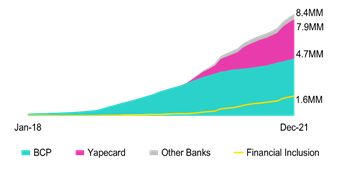
Yape users by type
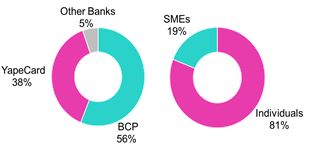
The number of Yape users continues to register sharp growth and we reached the 8.4 million user mark at the end of 2021. This growth was strengthened by the creation of Yapecard in May 2020, which allows users to open a digital account solely with an ID (no bank account required). Currently, 54% of Yape users are active on a monthly basis.
Yape, mainly through YapeCard, has spurred the financial inclusion of 1.6 million people in Peru. Yapecard acted as a successful conduit for government pandemic relief payments, which began in November 2020. This has generated a useful platform to capture new users who were not previously banked.
Finally, if we look at the current composition of Yape users, BCP clients represent 56% of total users; Yapecard, 38% (+4% with regard to Sept-21); and users of associated financial institutions, 5%. Additionally, 19% of users are microbusinesses, which have digitalized their charges and transactions through Yape.
Evolución de volumen transado mensual y ticket promedio por transacción
Volumen expresado en millones de soles
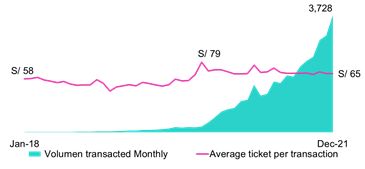
The monthly transaction volume through Yape began to grow exponentially in March 2020 due to:
| (i) | Migration from using cash to using Yape. |
| (ii) | The penetration of Yapecard in non-banked segments. |
The average ticket per transaction was S/66 this past year, which is evidence that Yape is basically used for small amounts. As such, Yape directly competes with cash and not with mobile banking applications from financial institutions, which are used for larger transactions.
| 55 | |
| |
|
10.2 Mibanco’s Hybrid Model
10.2.1 Disbursements generated through leads
Evolution of disbursements generated through leads Expressed on million of soles 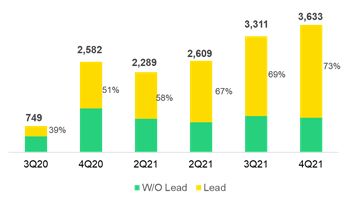 | Mibanco’s hybrid model in based on the capacity to generate loans through leads. Mibanco initiated efforts to use client data analysis before the pandemic. Nonetheless, it was not until post-2020 (initiation of economic reactivation) that the lead process’s power to generate loans became fully evident. In 4Q21, 73% of disbursement balances were generated through leads. This represented growth of 4% with regard to the figure in 3Q21 and 22% with regard to 4Q20’s print. |
10.2.2 Disbursements through alternative channels
In 2020, to better meet the needs of Mibanco’s clients, we began to make loan disbursements through alternative channels. This has allowed clients to receive disbursed amounts directly through internet home banking or via mobile banking, eliminating the need to visit a branch.
Evolution of disbursements through alternative channels Expressed on thousands of operations 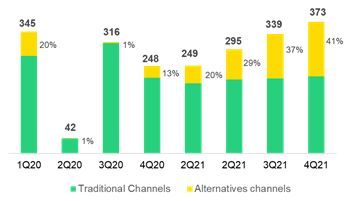 | In the fourth quarter of 2020, loan disbursement through alternative channels began to pick up, in line with an increase in total disbursements due to: (i) The country’s economic reactivation (ii) The second Reactiva program, which focused on microbusinesses. In 4Q21, disbursements through alternative channels accounted for 41% of total disbursements and represented 11.2% of the total amount disbursed over the quarter. |
| 56 | |
| |
|
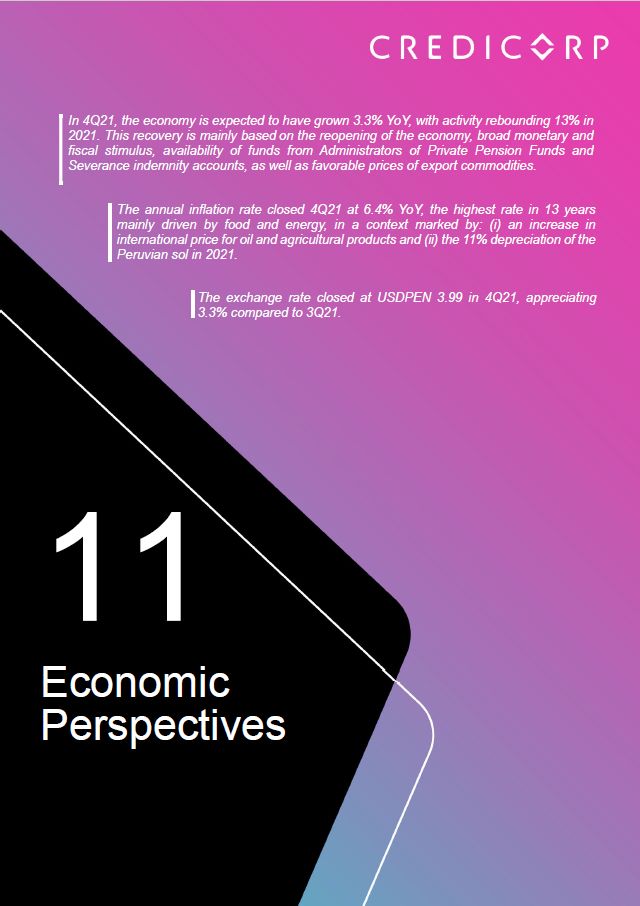
| 57 | |
| |
|
11. Economic Outlook
11.1. Peru: Economic Forecast
| Peru | 2018 | 2019 | 2020 | 2021 (3) | 2022 (3) | |||||||||||||||
| GDP (US$ Millions) | 225,430 | 230,966 | 205,188 | 222,001 | 227,655 | |||||||||||||||
| Real GDP (% change) | 4.0 | 2.2 | -11.0 | 13.0 | 2.5 | |||||||||||||||
| GDP per capita (US$) | 7,001 | 7,107 | 6,289 | 6,730 | 6,835 | |||||||||||||||
| Domestic demand (% change) | 4.2 | 2.3 | -9.4 | 14.6 | 2.4 | |||||||||||||||
| Total consumption (% change) | 3.6 | 2.9 | 3.0 | |||||||||||||||||
| Private Consumption (% change) | 3.8 | 3.0 | 3.0 | |||||||||||||||||
| Gross fixed investment (as % GDP) | 21.6 | 21.1 | 18.7 | 20.9 | 20.2 | |||||||||||||||
| Private Investment (% change) | 4.4 | 4.0 | 0.0-2.0 | |||||||||||||||||
| Public Investment (% change) | 6.8 | -2.1 | 8.0 | |||||||||||||||||
System loan growth (% change)(1) | 10.3 | 6.4 | 12.9 | 6.5 | - | |||||||||||||||
Inflation(2) | 2.2 | 1.9 | 2.0 | 6.4 | 3.0 | |||||||||||||||
| Reference Rate | 2.75 | 2.25 | 0.25 | 2.50 | 4.50 | |||||||||||||||
| Exchange rate, end of period | 3.37 | 3.31 | 3.62 | 4.00 | 4.00 | |||||||||||||||
| Exchange rate, (% change) | 0.0 | 0.0 | 0.0 | 0.1 | 0.0 | |||||||||||||||
| Fiscal balance (% GDP) | -2.3 | -1.6 | -8.9 | -2.6 | -3.0 | |||||||||||||||
| Public Debt (as % GDP) | 25.8 | 26.8 | 34.7 | 35.7 | 37.5 | |||||||||||||||
| Trade balance (US$ Millions) | 7,197 | 6,614 | 7,750 | 15,000 | 17,000 | |||||||||||||||
| (As % GDP) | 3.2 | % | 2.9 | % | 3.8 | % | 6.8 | % | 7.5 | % | ||||||||||
| Exports | 49,066 | 47,688 | 42,413 | 61,000 | 63,000 | |||||||||||||||
| Imports | 41,870 | 41,074 | 34,663 | 46,000 | 46,000 | |||||||||||||||
| Current account balance (US$ Millions) | -3,915 | -2,397 | 1,321 | -4,325 | -4,625 | |||||||||||||||
| Current account balance (As % GDP) | -1.7 | % | -1.5 | % | 0.5 | % | -1.9 | % | -2.0 | % | ||||||||||
| Net international reserves (US$ Millions) | 60,121 | 68,316 | 74,707 | 78,495 | 78,500 | |||||||||||||||
| (As % GDP) | 26.7 | % | 29.6 | % | 36.4 | % | 35.4 | % | 34.5 | % | ||||||||||
| (As months of imports) | 17 | 20 | 26 | 20 | 20 | |||||||||||||||
Source: INEI, BCRP, and SBS.
(1) Financial System, Current Exchange Rate.
(2) Inflation target: 1% - 3%.
(3) Estimates by BCP Economic Research as of December 2021.
11.2. Main Macroeconomic Variables
Gross Domestic Product
(Annual Variations, % YoY)
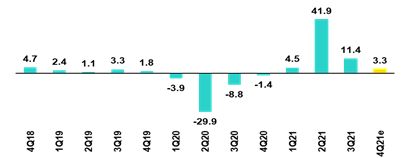
Source: BCRP
*Estimate: BCP
In 4Q21, the Peruvian economy is expected to have grown 3.3% YoY (3Q21 11.4%), and 13% in year 2021. For 2022, growth expectations are around 2.5%. The rebound in activity in 2021 is attributable to the reopening of the economy, broad monetary and fiscal stimulus, availability of funds from Administrators of Private Pension Funds (AFP in Spanish) and Severance indemnity accounts (CTS in Spanish), as well as favorable prices of export commodities.
| 58 | |
| |
|
Inflation and Monetary Policy Rate
(%)
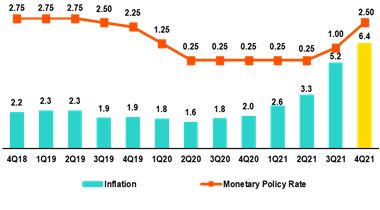 | The annual inflation rate closed 4Q21 at 6.4% YoY (3Q21: 5.2%). This print, which represents the highest increase in 13 years, exceeded the upper limit of the BCRP's target range (1%-3%). The acceleration of inflation in 4Q21 was mainly driven by food and energy, in a context marked by: (i) an increase in international price for oil and agricultural products (in 4Q21 compared to 4Q20, corn prices rose 23%, and wheat 20%) and (ii) the 11% depreciation of the Peruvian sol in 2021. |
Sources: BCRP e INEI
Inflation excluding food and energy, closed at 3.2% YoY (3Q21: 2.9%).
Since August, the Central Reserve Bank has responded to increases in inflation and price expectations by raising its reference rate, which went from 0.25% to 2.50% at the end of 2021. Through these measures, the monetary authority hopes to bring inflation expectations back to the target range (1% to 3%).
Fiscal Result and Current Account Balance
(% of GDP, Quarter)
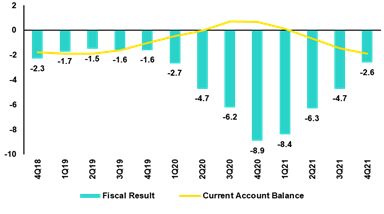 | The annualized fiscal balance closed 4Q21 at -2.6% of GDP compared to -4.8% in 3Q21 and -8.9% in 4Q20. The notable reduction in the fiscal deficit is mainly attributable to the increase in fiscal revenues, spurred by economic rebound and favorable export prices. The copper price at the end of 2021 stood at US$ 4.42/lb, which was 20% higher than the print in 2020 and 58% above the figure registered in 2019. In yearly averages, copper prices rose from US$ 2.80/lb in 2020 to US$ 4.23 in 2021, an increase of 55%. |
Source: BCRP
*Estimate: BCP
In YoY terms, current revenues at the general government level increased 43.3% in 2021 versus the figure in 2020 (20.6% compared to 2019). In this context, the fiscal revenue ratio, expressed as a percentage of GDP, increased to 21.1%, versus 19.7% in 2019 and 17.8% in 2020.
Non-financial expenses at the general government level increased 9.4% YoY in 2021, (25.7% compared to 2019). This was primarily attributable to spending on gross capital formation (36.1%) and on goods and services (18.7%) to respond to the health emergency, and partially offset by a decrease in transfers to households (-12.7%). The non-financial expenses ratio represented 22.3% of GDP 2021 (2020: 24.7% but still higher than 2019: 20.0%).
In 4Q21, the Public Treasury made successful a global bond issuance in USD for 4 billion and in Euros, for 1 billion. These issuances, coupled with issuance of nearly USD 5 billion in 1Q21, brought the total issuance amount in 2021 to USD 10 billion.
With regard to Credit Rating for Peru´s Long-Run Foreign Currency Debt, in September 2021 the rating agency Moody's Investor lowered Peru's rating to Baa1 from A3 and changed the outlook to Stable from Negative. In October, the rating agency Standard and Poor's maintained Peru's credit rating at BBB+, but lowered the outlook from stable to negative. In October, Fitch Rating downgraded Peru's rating from BBB+ to BBB with a stable outlook.
In terms of external accounts, the current account deficit is expected to stand -1.9% of GDP in 2021 (compared to 0.6% in 2020). Exports are at historic highs: total for January-November 2021 stood at USD 61.8 billion, up +45% compared to 2020 and +30% compared to 2019. Imports totaled USD 47.4 billion; up +38% compared to 2020, and +16% compared to 2019. The terms of trade January-November 2021 rose 13% YoY compared to 2020 and are close to historic highs (June 2021).
| 59 | |
| |
|
Exchange Rate
(PEN per USD)
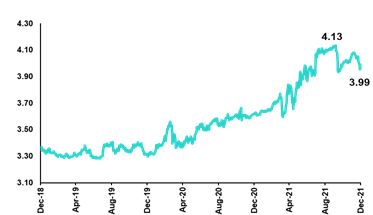 | The exchange rate closed at USDPEN 3.99 in 4Q21, which represented an appreciation of 3.3% compared to the figure at the end of 3Q21 (USDPEN 4.1345, historic maximum) and a depreciation of 11% compared to the print at the end of 2020 (USDPEN 3.6180). It is important to highlight that in the region, the only currency that followed the same trend in 4Q21 was the Mexican Peso, which appreciated (0.5%); the rest in the region’s currencies depreciated as follows: the Brazilian Real (2.4%), the Chilean Peso (5.1%) and the Colombian Peso (6.7%). |
Source: SBS
In 4Q21, the Central Bank made net sales in the spot foreign exchange market for US$2,552 million and accumulated sales for US$11,626 million in 2021. The entity continued to use a set of foreign exchange instruments to mitigate pressures on the exchange rate: at the end of 4Q21, the balance of CDR BCRP stood at PEN 1.4 billion (3Q21: PEN 3.9 billion) while the balance of Foreign Exchange Swaps (sale) was PEN 37.8 billion (3Q21: PEN 29.4 billion).
Net International Reserves closed 4Q21 US$ 78.5 billion, which topped the level registered in 3Q21 (US$ 76.0 billion) and also surpassed the level reported at the end of 2020 (US$ 74.7 billion). The Central Banks's foreign exchange position stood at US$ 57.3 billion, which represented an increase of US$ 1.4 billion compared to the figure at the end of 3Q21.
| 60 | |
| |
|
Safe Harbor for Forward-Looking Statements
This material includes “forward-looking statements” within the meaning of Section 27A of the U.S. Securities Act of 1933 and Section 21E of the U.S. Securities Exchange Act of 1934. All statements other than statements of historical fact are forward-looking and may contain information about financial results, economic conditions, trends and known uncertainties. Forward-looking statements are not assurances of future performance. Instead, they are based only on our management’s current views, beliefs, expectations and assumptions regarding the future of our business, future plans and strategies, projections, anticipated events and trends, the economy and other future conditions.
Many forward-looking statements can be identified by words such as: “anticipate”, “intend”, “plan”, “goal”, “seek”, “believe”, “project”, “estimate”, “expect”, “strategy”, “future”, “likely”, “would”, “may”, “should”, “will”, “see” and similar references to future periods. Examples of forward-looking statements include, among others, statements or estimates we make regarding guidance relating to losses in our credit portfolio, efficiency ratio, provisions and non-performing loans, current or future market risk and future market conditions, expected macroeconomic events and conditions, our belief that we have sufficient capital and liquidity to fund our business operations, expectations of the effect on our financial condition of claims, legal actions, environmental costs, contingent liabilities and governmental and regulatory investigations and proceedings, strategy for customer retention, growth, governmental programs and regulatory initiatives, credit administration, product development, market position, financial results and reserves and strategy for risk management.
We caution readers that forward-looking statements involve known and unknown risks and uncertainties that could cause actual results, performance or events to differ materially from those that we expect or that are expressed or implied in the forward-looking statements, depending on the outcome of certain factors, including, without limitation, adverse changes in:
| • | Economic conditions in Peru; |
| • | The occurrence of natural disasters or political or social instability in Peru; |
| • | The adequacy of the dividends that our subsidiaries are able to pay to us, which may affect our ability to pay dividends to shareholders and corporate expenses; |
| • | Performance of, and volatility in, financial markets, including Latin-American and other markets; |
| • | The frequency, severity and types of insured loss events; |
| • | Fluctuations in interest rate levels; |
| • | Foreign currency exchange rates, including the Sol/US Dollar exchange rate; |
| • | Deterioration in the quality of our loan portfolio; |
| • | Increasing levels of competition in Peru and other markets in which we operate; |
| • | Developments and changes in laws and regulations affecting the financial sector and adoption of new international guidelines; |
| • | Changes in the policies of central banks and/or foreign governments; |
| • | Effectiveness of our risk management policies and of our operational and security systems; |
| • | Losses associated with counterparty exposures; |
| • | The scope of the coronavirus (“COVID-19”) outbreak, actions taken to contain the COVID-19 and related economic effects from such actions and our ability to maintain adequate staffing; and |
| • | Changes in Bermuda laws and regulations applicable to so-called non-resident entities. |
See “Item 3. Key Information—3.D Risk Factors” and “Item 5. Operating and Financial Review and Prospects” in our most recent Annual Report on Form 20-F filed with the U.S. Securities and Exchange Commission for additional information and other such factors.
You are cautioned not to place undue reliance on these forward-looking statements, which speak only as of the date hereof and are based only on information currently available to us. Therefore, you should not rely on any of these forward-looking statements. We undertake no obligation to publicly update or revise these or any other forward-looking statements that may be made to reflect events or circumstances after the date hereof, whether as a result of changes in our business strategy or new information, to reflect the occurrence of unanticipated events or otherwise.
| 61 | |
| |
|

| 62 | |
| |
|
12.1. Credicorp
CREDICORP LTD. AND SUBSIDIARIES
CONSOLIDATED STATEMENT OF FINANCIAL POSITION
(In S/ thousands, IFRS)
| As of | % change | |||||||||||||||||||
| Dec 2020 | Set 2021 | Dec 2021 | QoQ | YoY | ||||||||||||||||
| ASSETS | ||||||||||||||||||||
| Cash and due from banks | ||||||||||||||||||||
| Non-interest bearing | 8,176,612 | 8,360,631 | 6,925,332 | -17.2 | % | -15.3 | % | |||||||||||||
| Interest bearing | 28,576,382 | 36,147,225 | 32,395,408 | -10.4 | % | 13.4 | % | |||||||||||||
| Total cash and due from banks | 36,752,994 | 44,507,856 | 39,320,740 | -11.7 | % | 7.0 | % | |||||||||||||
| Cash collateral, reverse repurchase agreements and securities borrowing | 2,394,302 | 2,555,337 | 1,766,948 | -30.9 | % | -26.2 | % | |||||||||||||
| Fair value through profit or loss investments | 6,467,471 | 6,661,600 | 5,928,497 | -11.0 | % | -8.3 | % | |||||||||||||
| Fair value through other comprehensive income investments | 43,743,889 | 33,261,505 | 34,758,443 | 4.5 | % | -20.5 | % | |||||||||||||
| Amortized cost investments | 4,962,382 | 8,187,351 | 8,265,559 | 1.0 | % | 66.6 | % | |||||||||||||
| Loans | 137,659,885 | 146,551,226 | 147,597,412 | 0.7 | % | 7.2 | % | |||||||||||||
| Current | 132,984,154 | 141,077,541 | 142,046,154 | 0.7 | % | 6.8 | % | |||||||||||||
| Internal overdue loans | 4,675,731 | 5,473,685 | 5,551,258 | 1.4 | % | 18.7 | % | |||||||||||||
| Less - allowance for loan losses | (9,898,760 | ) | (9,077,449 | ) | (8,477,308 | ) | -6.6 | % | -14.4 | % | ||||||||||
| Loans, net | 127,761,125 | 137,473,777 | 139,120,104 | 1.2 | % | 8.9 | % | |||||||||||||
| Financial assets designated at fair value through profit or loss | 823,270 | 981,508 | 974,664 | -0.7 | % | 18.4 | % | |||||||||||||
| Accounts receivable from reinsurers and coinsurers | 919,419 | 1,097,493 | 1,198,379 | 9.2 | % | 30.3 | % | |||||||||||||
| Premiums and other policyholder receivables | 937,223 | 801,531 | 921,103 | 14.9 | % | -1.7 | % | |||||||||||||
| Property, plant and equipment, net | 2,077,803 | 1,911,478 | 1,895,196 | -0.9 | % | -8.8 | % | |||||||||||||
| Due from customers on acceptances | 455,343 | 776,863 | 532,404 | -31.5 | % | 16.9 | % | |||||||||||||
| Investments in associates | 645,886 | 648,041 | 658,697 | 1.6 | % | 2.0 | % | |||||||||||||
| Intangible assets and goodwill, net | 2,639,297 | 2,682,216 | 2,710,080 | 1.0 | % | 2.7 | % | |||||||||||||
Other assets (1) | 6,825,759 | 9,995,835 | 6,771,170 | -32.3 | % | -0.8 | % | |||||||||||||
| Total Assets | 237,406,163 | 251,542,391 | 244,821,984 | -2.7 | % | 3.1 | % | |||||||||||||
| LIABILITIES AND EQUITY | ||||||||||||||||||||
| Deposits and obligations | ||||||||||||||||||||
| Non-interest bearing | 47,623,119 | 54,546,530 | 51,851,206 | -4.9 | % | 8.9 | % | |||||||||||||
| Interest bearing | 94,742,383 | 98,001,838 | 98,489,656 | 0.5 | % | 4.0 | % | |||||||||||||
| Total deposits and obligations | 142,365,502 | 152,548,368 | 150,340,862 | -1.4 | % | 5.6 | % | |||||||||||||
| Payables from repurchase agreements and securities lending | 27,923,617 | 23,363,030 | 22,013,866 | -5.8 | % | -21.2 | % | |||||||||||||
| BCRP instruments | 25,734,963 | 20,746,109 | 19,692,474 | -5.1 | % | -23.5 | % | |||||||||||||
| Repurchase agreements with third parties | 1,072,920 | 1,330,811 | 1,296,277 | -2.6 | % | 20.8 | % | |||||||||||||
| Repurchase agreements with customers | 1,115,734 | 1,286,110 | 1,025,115 | -20.3 | % | -8.1 | % | |||||||||||||
| Due to banks and correspondents | 5,978,257 | 7,466,434 | 7,212,946 | -3.4 | % | 20.7 | % | |||||||||||||
| Bonds and notes issued | 16,319,407 | 17,577,630 | 17,078,829 | -2.8 | % | 4.7 | % | |||||||||||||
| Banker’s acceptances outstanding | 455,343 | 776,863 | 532,404 | -31.5 | % | 16.9 | % | |||||||||||||
| Reserves for property and casualty claims | 2,050,474 | 2,583,777 | 2,555,580 | -1.1 | % | 24.6 | % | |||||||||||||
| Reserve for unearned premiums | 9,624,602 | 9,928,912 | 9,978,931 | 0.5 | % | 3.7 | % | |||||||||||||
| Accounts payable to reinsurers | 338,446 | 278,220 | 463,825 | 66.7 | % | 37.0 | % | |||||||||||||
| Financial liabilities at fair value through profit or loss | 561,602 | 879,177 | 325,571 | -63.0 | % | -42.0 | % | |||||||||||||
| Other liabilities | 6,343,266 | 10,434,536 | 7,281,731 | -30.2 | % | 14.8 | % | |||||||||||||
| Total Liabilities | 211,960,516 | 225,836,947 | 217,784,545 | -3.6 | % | 2.7 | % | |||||||||||||
| Net equity | 24,945,870 | 25,192,569 | 26,496,767 | 5.2 | % | 6.2 | % | |||||||||||||
| Capital stock | 1,318,993 | 1,318,993 | 1,318,993 | 0.0 | % | 0.0 | % | |||||||||||||
| Treasury stock | (208,433 | ) | (207,745 | ) | (207,534 | ) | -0.1 | % | -0.4 | % | ||||||||||
| Capital surplus | 192,625 | 215,071 | 228,853 | 6.4 | % | 18.8 | % | |||||||||||||
| Reserves | 21,429,635 | 21,350,150 | 21,364,272 | 0.1 | % | -0.3 | % | |||||||||||||
| Unrealized gains and losses | 1,865,898 | 19,435 | 235,902 | 1113.8 | % | -87.4 | % | |||||||||||||
| Retained earnings | 347,152 | 2,496,665 | 3,556,281 | 42.4 | % | 924.4 | % | |||||||||||||
| Non-controlling interest | 499,777 | 512,875 | 540,672 | 5.4 | % | 8.2 | % | |||||||||||||
| Total Net Equity | 25,445,647 | 25,705,444 | 27,037,439 | 5.2 | % | 6.3 | % | |||||||||||||
| Total liabilities and equity | 237,406,163 | 251,542,391 | 244,821,984 | -2.7 | % | 3.1 | % | |||||||||||||
| Off-balance sheet | 133,568,004 | 154,907,974 | 151,136,879 | -2.4 | % | 13.2 | % | |||||||||||||
| Total performance bonds, stand-by and L/Cs. | 20,973,810 | 22,665,879 | 22,914,343 | 1.1 | % | 9.3 | % | |||||||||||||
| Undrawn credit lines, advised but not committed | 86,074,859 | 94,165,966 | 88,382,322 | -6.1 | % | 2.7 | % | |||||||||||||
| Total derivatives (notional) and others | 26,519,335 | 38,076,129 | 39,840,214 | 4.6 | % | 50.2 | % | |||||||||||||
(1) The amounts differ from those previously reported in 2020 period due to reclassifications.
| 63 | |
| |
|
CREDICORP LTD. AND SUBSIDIARIES
CONSOLIDATED STATEMENT OF INCOME
(In S/ thousands, IFRS)
| Quarter | % change | Year | % change | |||||||||||||||||||||||||||||
| 4Q20 | 3Q21 | 4Q21 | QoQ | YoY | 2020 | 2021 | 2021 / 2020 | |||||||||||||||||||||||||
| Interest income and expense | ||||||||||||||||||||||||||||||||
| Interest and dividend income | 2,703,100 | 3,051,000 | 3,091,754 | 1.3 | % | 14.4 | % | 11,547,648 | 11,850,406 | 2.6 | % | |||||||||||||||||||||
Interest expense (1) | (634,540 | ) | (599,292 | ) | (613,907 | ) | 2.4 | % | -3.3 | % | (2,976,306 | ) | (2,488,426 | ) | -16.4 | % | ||||||||||||||||
| Net interest income | 2,068,560 | 2,451,708 | 2,477,847 | 1.1 | % | 19.8 | % | 8,571,342 | 9,361,980 | 9.2 | % | |||||||||||||||||||||
| Gross provision for credit losses on loan portfolio | (785,194 | ) | (265,158 | ) | (229,804 | ) | -13.3 | % | -70.7 | % | (6,080,289 | ) | (1,558,951 | ) | -74.4 | % | ||||||||||||||||
| Recoveries of written-off loans | 52,529 | 100,744 | 103,022 | 2.3 | % | 96.1 | % | 159,781 | 346,728 | 117.0 | % | |||||||||||||||||||||
| Provision for credit losses on loan portfolio, net of recoveries | (732,665 | ) | (164,414 | ) | (126,782 | ) | -22.9 | % | -82.7 | % | (5,920,508 | ) | (1,212,223 | ) | -79.5 | % | ||||||||||||||||
| - | - | - | ||||||||||||||||||||||||||||||
| Risk-adjusted net interest income | 1,335,895 | 2,287,294 | 2,351,065 | 2.8 | % | 76.0 | % | 2,650,834 | 8,149,757 | 207.4 | % | |||||||||||||||||||||
| Non-financial income | ||||||||||||||||||||||||||||||||
| Fee income | 873,156 | 876,391 | 924,161 | 5.5 | % | 5.8 | % | 2,912,778 | 3,493,734 | 19.9 | % | |||||||||||||||||||||
| Net gain on foreign exchange transactions | 151,464 | 238,886 | 269,354 | 12.8 | % | 77.8 | % | 622,783 | 920,797 | 47.9 | % | |||||||||||||||||||||
| Net gain on sales of securities | 162,523 | 5,739 | 2,550 | -55.6 | % | -98.4 | % | 458,410 | (45,371 | ) | n.a. | |||||||||||||||||||||
| Net gain from associates | 19,296 | 19,090 | 13,224 | -30.7 | % | -31.5 | % | 64,672 | 74,021 | 14.5 | % | |||||||||||||||||||||
| Net gain on derivatives held for trading | 18,298 | 43,086 | 27,049 | -37.2 | % | 47.8 | % | 40,789 | 185,271 | 354.2 | % | |||||||||||||||||||||
| Net gain from exchange differences | 10,278 | 3,233 | (8,923 | ) | n.a. | n.a. | 19,804 | 34,698 | 75.2 | % | ||||||||||||||||||||||
| Other non-financial income | 94,518 | 52,258 | 74,544 | 42.6 | % | -21.1 | % | 286,981 | 263,716 | -8.1 | % | |||||||||||||||||||||
| Total non-financial income | 1,329,533 | 1,238,683 | 1,301,959 | 5.1 | % | -2.1 | % | 4,406,217 | 4,926,866 | 11.8 | % | |||||||||||||||||||||
| Insurance underwriting result | ||||||||||||||||||||||||||||||||
| Net earned premiums | 652,670 | 675,571 | 712,087 | 5.4 | % | 9.1 | % | 2,428,060 | 2,671,530 | 10.0 | % | |||||||||||||||||||||
| Net claims | (492,737 | ) | (517,951 | ) | (509,278 | ) | -1.7 | % | 3.4 | % | (1,708,113 | ) | (2,341,917 | ) | 37.1 | % | ||||||||||||||||
| Acquisition cost (1) | (75,066 | ) | (87,416 | ) | (75,152 | ) | -14.0 | % | 0.1 | % | (361,814 | ) | (333,334 | ) | -7.9 | % | ||||||||||||||||
| Total insurance underwriting result | 84,867 | 70,204 | 127,657 | 81.8 | % | 50.4 | % | 358,133 | (3,721 | ) | -101.0 | % | ||||||||||||||||||||
| Total expenses | �� | |||||||||||||||||||||||||||||||
| Salaries and employee benefits | (792,336 | ) | (915,564 | ) | (1,013,176 | ) | 10.7 | % | 27.9 | % | (3,312,954 | ) | (3,668,476 | ) | 10.7 | % | ||||||||||||||||
| Administrative, general and tax expenses | (742,098 | ) | (803,156 | ) | (899,290 | ) | 12.0 | % | 21.2 | % | (2,386,108 | ) | (2,956,093 | ) | 23.9 | % | ||||||||||||||||
| Depreciation and amortization | (164,541 | ) | (170,960 | ) | (181,660 | ) | 6.3 | % | 10.4 | % | (669,915 | ) | (683,254 | ) | 2.0 | % | ||||||||||||||||
| Impairment loss on goodwill | - | - | - | n.a. | n.a. | (63,978 | ) | - | n.a. | |||||||||||||||||||||||
| Association in participation | (17,079 | ) | (10,426 | ) | (13,965 | ) | 33.9 | % | -18.2 | % | (52,019 | ) | (47,176 | ) | -9.3 | % | ||||||||||||||||
| Other expenses | (265,256 | ) | (77,688 | ) | (113,483 | ) | 46.1 | % | -57.2 | % | (706,049 | ) | (385,087 | ) | -45.5 | % | ||||||||||||||||
| Total expenses | (1,981,310 | ) | (1,977,794 | ) | (2,221,574 | ) | 12.3 | % | 12.1 | % | (7,191,023 | ) | (7,740,086 | ) | 7.6 | % | ||||||||||||||||
| Profit before income tax | 768,985 | 1,618,387 | 1,559,107 | -3.7 | % | 102.7 | % | 224,161 | 5,332,816 | 2279.0 | % | |||||||||||||||||||||
| Income tax | (103,174 | ) | (428,037 | ) | (471,860 | ) | 10.2 | % | 357.3 | % | 109,977 | (1,660,987 | ) | n.a. | ||||||||||||||||||
| Net profit | 665,811 | 1,190,350 | 1,087,247 | -8.7 | % | 63.3 | % | 334,138 | 3,671,829 | 998.9 | % | |||||||||||||||||||||
| Non-controlling interest | 12,407 | 26,651 | 26,631 | -0.1 | % | 114.6 | % | (12,756 | ) | 87,247 | n.a. | |||||||||||||||||||||
| Net profit attributable to Credicorp | 653,404 | 1,163,699 | 1,060,616 | -8.9 | % | 62.3 | % | 346,894 | 3,584,582 | 933.3 | % | |||||||||||||||||||||
(1) The acquisition cost of Pacifico includes net fees and underwriting expenses.
| 64 | |
| |
|
Regulatory Capital and Capital Adequary Ratios
(S/ thousands, IFRS)
| As of | % Change | |||||||||||||||||||
| Dec 20 | Sep 21 | Dec 21 | QoQ | YoY | ||||||||||||||||
| Capital Stock | 1,318,993 | 1,318,993 | 1,318,993 | 0.0 | % | 0.0 | % | |||||||||||||
| Treasury Stocks | (208,433 | ) | (207,745 | ) | (207,538 | ) | -0.1 | % | -0.4 | % | ||||||||||
| Capital Surplus | 192,625 | 215,071 | 228,857 | 6.4 | % | 18.8 | % | |||||||||||||
Legal and Other capital reserves (1) | 21,429,635 | 21,350,150 | 21,364,272 | 0.1 | % | -0.3 | % | |||||||||||||
Minority interest (2) | 443,402 | 423,897 | 420,062 | -0.9 | % | -5.3 | % | |||||||||||||
Loan loss reserves (3) | 1,838,145 | 1,993,306 | 2,001,065 | 0.4 | % | 8.9 | % | |||||||||||||
| Perpetual subordinated debt | - | - | - | - | - | |||||||||||||||
| Subordinated Debt | 5,491,480 | 6,393,706 | 6,173,159 | -3.4 | % | 12.4 | % | |||||||||||||
| Investments in equity and subordinated debt of financial and insurance companies | (715,614 | ) | (727,585 | ) | (712,518 | ) | -2.1 | % | -0.4 | % | ||||||||||
| Goodwill | (820,899 | ) | (826,196 | ) | (796,859 | ) | -3.6 | % | -2.9 | % | ||||||||||
| Current year Net Loss | - | - | - | - | - | |||||||||||||||
Deduction for subordinated debt limit (50% of Tier I excluding deductions) (4) | - | - | - | - | - | |||||||||||||||
Deduction for Tier I Limit (50% of Regulatory capital) (4) | - | - | - | - | - | |||||||||||||||
| Regulatory Capital (A) | 28,969,333 | 29,933,596 | 29,789,493 | -0.5 | % | 2.8 | % | |||||||||||||
Tier 1 (5) | 15,312,787 | 15,305,134 | 15,353,163 | 0.3 | % | 0.3 | % | |||||||||||||
Tier 2 (6) + Tier 3 (7) | 13,656,546 | 14,628,462 | 14,436,330 | -1.3 | % | 5.7 | % | |||||||||||||
Financial Consolidated Group (FCG) Regulatory Capital Requirements (8) | 20,136,258 | 18,710,799 | 18,530,113 | -1.0 | % | -8.0 | % | |||||||||||||
Insurance Consolidated Group (ICG) Capital Requirements (9) | 1,304,266 | 1,418,922 | 1,430,567 | 0.8 | % | 9.7 | % | |||||||||||||
| FCG Capital Requirements related to operations with ICG | (467,303 | ) | (503,809 | ) | (513,262 | ) | 1.9 | % | 9.8 | % | ||||||||||
| ICG Capital Requirements related to operations with FCG | - | - | - | - | - | |||||||||||||||
| Regulatory Capital Requirements (B) | 20,973,221 | 19,625,912 | 19,447,419 | -0.9 | % | -7.3 | % | |||||||||||||
| Regulatory Capital Ratio (A) / (B) | 1.38 | 1.53 | 1.53 | 0.01 | 0.15 | |||||||||||||||
Required Regulatory Capital Ratio (10) | 1.00 | 1.00 | 1.00 | |||||||||||||||||
(1) Legal and other capital reserves include restricted capital reserves (PEN 14,745 million) and optional capital reserves (PEN 6,661 million).
(2) Minority interest includes Tier I (PEN 421 million)
(3) Up to 1.25% of total risk-weighted assets of Banco de Credito del Perú, Solución Empresa Administradora Hipotecaria, Mibanco and Atlantic Security Bank.
(4) Tier II + Tier III can not be more than 50% of total regulatory capital.
(5) Tier I = capital + restricted capital reserves + Tier I minority interest - goodwill - (0.5 x investment in equity and subordinated debt of financial and insurance companies)+ perpetual subordinated debt.
(6) Tier II = subordinated debt + TierII minority interest tier + loan loss reserves - (0.5 x investment in equity and subordinated debt of financial and insurance companies).
(7) Tier III = Subordinated debt covering market risk only.
(8) Includes regulatory capital requirements of the financial consolidated group.
(9) Includes regulatory capital requirements of the insurance consolidated group.
(10) Regulatory Capital / Total Regulatory Capital Requirements (legal minimum = 1.00).
| 65 | |
| |
|
12.2. Credicorp Stand-alone
Credicorp Ltd.
Separate Statement of Financal Position
(S/ thousands, IFRS)
| As of | % change | |||||||||||||||||||
| Dec 20 | Sep 21 | Dec 21 | QoQ | YoY | ||||||||||||||||
| ASSETS | ||||||||||||||||||||
| Cash and cash equivalents | 1,114,167 | 598,770 | 179,104 | -70.1 | % | -83.9 | % | |||||||||||||
| At fair value through profit or loss | 234,825 | 1,091,138 | 1,050,218 | -3.8 | % | n.a | ||||||||||||||
| Fair value through other comprehensive income investments | 463,421 | 342,485 | 346,979 | 1.3 | % | -25.1 | % | |||||||||||||
| In subsidiaries and associates investments | 29,118,425 | 29,862,234 | 31,168,827 | 4.4 | % | 7.0 | % | |||||||||||||
| Loans | - | - | - | 0.0 | % | 0.0 | % | |||||||||||||
| Other assets | 191 | 328 | 322 | -1.8 | % | 68.6 | % | |||||||||||||
| Total Assets | 30,931,029 | 31,894,955 | 32,745,450 | 2.7 | % | 5.9 | % | |||||||||||||
| LIABILITIES AND NET SHAREHOLDERS' EQUITY | ||||||||||||||||||||
| Dividend Payable | - | 471,912 | - | n.a. | n.a. | |||||||||||||||
| Bonds and notes issued | 1,794,879 | 2,066,412 | 1,980,311 | -4.2 | % | 10.3 | % | |||||||||||||
| Other liabilities | 110,827 | 143,382 | 159,403 | 11.2 | % | 43.8 | % | |||||||||||||
| Total Liabilities | 1,905,706 | 2,681,706 | 2,139,714 | -20.2 | % | 12.3 | % | |||||||||||||
| NET EQUITY | ||||||||||||||||||||
| Capital stock | 1,318,993 | 1,318,993 | 1,318,993 | 0.0 | % | 0.0 | % | |||||||||||||
| Capital Surplus | 384,542 | 384,542 | 384,542 | 0.0 | % | 0.0 | % | |||||||||||||
| Reserve | 21,070,409 | 20,945,491 | 20,945,491 | 0.0 | % | -0.6 | % | |||||||||||||
| Unrealized results | 1,666,481 | (281,545 | ) | 62,163 | n.a. | n.a. | ||||||||||||||
| Retained earnings | 4,584,898 | 6,845,768 | 7,894,547 | 15.3 | % | 72.2 | % | |||||||||||||
| Total net equity | 29,025,323 | 29,213,249 | 30,605,736 | 4.8 | % | 5.4 | % | |||||||||||||
| Total Liabilities And Equity | 30,931,029 | 31,894,955 | 32,745,450 | 2.7 | % | 5.9 | % | |||||||||||||
| Quarter | % change | |||||||||||||||||||
| 4Q20 | 3Q21 | 4Q21 | QoQ | YoY | ||||||||||||||||
| Interest income | ||||||||||||||||||||
| Net share of the income from investments in subsidiaries and associates | 627,467 | 1,256,878 | 1,092,707 | -13.1 | % | 74.1 | % | |||||||||||||
| Interest and similar income | 2,881 | 13,909 | 308 | -97.8 | % | -89.3 | % | |||||||||||||
| Net gain on financial assets at fair value through profit or loss | - | 3,860 | (2,258 | ) | -158.5 | % | n.a | |||||||||||||
| Total income | 630,348 | 1,274,647 | 1,090,757 | -14.4 | % | 73.0 | % | |||||||||||||
| Interest and similar expense | (13,372 | ) | (15,161 | ) | (15,018 | ) | -0.9 | % | n.a | |||||||||||
| Administrative and general expenses | (2,924 | ) | (4,367 | ) | (7,601 | ) | 74.1 | % | 160.0 | % | ||||||||||
| Total expenses | (16,296 | ) | (19,528 | ) | (22,619 | ) | 15.8 | % | 38.8 | % | ||||||||||
| Operating income | 614,052 | 1,255,119 | 1,068,138 | -14.9 | % | 73.9 | % | |||||||||||||
| Exchange differences, net | (38 | ) | (415 | ) | (142 | ) | -65.8 | % | 273.7 | % | ||||||||||
| Other, net | 1,194 | (6 | ) | (8 | ) | 33.3 | % | -100.7 | % | |||||||||||
(3,589 | ) | (421 | ) | (150 | ) | -64.4 | % | -95.8 | % | |||||||||||
| Profit before income tax | 615,208 | 1,254,698 | 1,067,988 | -14.9 | % | 73.6 | % | |||||||||||||
| Income tax | - | (20,079 | ) | (19,228 | ) | -4.2 | % | n.a | ||||||||||||
| Net income | 615,208 | 1,234,619 | 1,048,760 | -15.1 | % | 70.5 | % | |||||||||||||
| Double Leverage Ratio | 100.32 | % | 102.22 | % | 101.84 | % | -38bps | 152bps | ||||||||||||
| 66 | |
| |
|
BANCO DE CREDITO DEL PERU AND SUBSIDIARIES
CONSOLIDATED STATEMENT OF FINANCIAL POSITION
(In S/ thousands, IFRS)
| As of | % change | |||||||||||||||||||
| Dec 20 | Sep 21 | Dec 21 | QoQ | YoY | ||||||||||||||||
| ASSETS | ||||||||||||||||||||
| Cash and due from banks | ||||||||||||||||||||
| Non-interest bearing | 5,814,295 | 6,157,037 | 4,895,726 | -20.5 | % | -15.8 | % | |||||||||||||
| Interest bearing | 27,257,699 | 33,783,609 | 30,481,516 | -9.8 | % | 11.8 | % | |||||||||||||
| Total cash and due from banks | 33,071,994 | 39,940,646 | 35,377,242 | -11.4 | % | 7.0 | % | |||||||||||||
| Cash collateral, reverse repurchase agreements and securities borrowing | 1,345,981 | 1,027,761 | 344,460 | -66.5 | % | -74.4 | % | |||||||||||||
| Fair value through profit or loss investments | 2,168,500 | 1,406,424 | 1,261,896 | -10.3 | % | -41.8 | % | |||||||||||||
| Fair value through other comprehensive income investments | 29,604,474 | 18,191,125 | 19,367,305 | 6.5 | % | -34.6 | % | |||||||||||||
| Amortized cost investments | 4,933,333 | 7,597,755 | 7,677,804 | 1.1 | % | 55.6 | % | |||||||||||||
| Loans | 125,716,877 | 133,369,027 | 134,734,202 | 1.0 | % | 7.2 | % | |||||||||||||
| Current | 121,179,978 | 128,090,680 | 129,311,792 | 1.0 | % | 6.7 | % | |||||||||||||
| Internal overdue loans | 4,536,899 | 5,278,347 | 5,422,410 | 2.7 | % | 19.5 | % | |||||||||||||
| Less - allowance for loan losses | (9,266,046 | ) | (8,474,947 | ) | (7,937,985 | ) | -6.3 | % | -14.3 | % | ||||||||||
| Loans, net | 116,450,831 | 124,894,080 | 126,796,217 | 1.5 | % | 8.9 | % | |||||||||||||
Property, furniture and equipment, net (1) | 1,789,869 | 1,634,143 | 1,628,645 | -0.3 | % | -9.0 | % | |||||||||||||
| Due from customers on acceptances | 455,343 | 776,863 | 532,404 | -31.5 | % | 16.9 | % | |||||||||||||
Other assets (2) | 5,882,200 | 7,497,739 | 6,321,863 | -15.7 | % | 7.5 | % | |||||||||||||
| Total Assets | 195,702,525 | 202,966,536 | 199,307,836 | -1.8 | % | 1.8 | % | |||||||||||||
| Liabilities and Equity | ||||||||||||||||||||
| Deposits and obligations | ||||||||||||||||||||
Non-interest bearing (1) | 43,740,097 | 47,262,689 | 44,598,038 | -5.6 | % | 2.0 | % | |||||||||||||
Interest bearing (1) | 83,231,861 | 86,404,649 | 87,552,576 | 1.3 | % | 5.2 | % | |||||||||||||
| Total deposits and obligations | 126,971,958 | 133,667,338 | 132,150,614 | -1.1 | % | 4.1 | % | |||||||||||||
| Payables from repurchase agreements and securities lending | 26,267,587 | 21,308,690 | 20,250,739 | -5.0 | % | -22.9 | % | |||||||||||||
| BCRP instruments | 25,734,963 | 20,746,109 | 19,692,474 | -5.1 | % | -23.5 | % | |||||||||||||
| Repurchase agreements with third parties | 532,624 | 562,581 | 558,265 | -0.8 | % | 4.8 | % | |||||||||||||
| Due to banks and correspondents | 5,843,676 | 6,973,909 | 6,684,191 | -4.2 | % | 14.4 | % | |||||||||||||
| Bonds and notes issued | 13,811,673 | 14,838,736 | 14,482,984 | -2.4 | % | 4.9 | % | |||||||||||||
| Banker’s acceptances outstanding | 455,343 | 776,863 | 532,404 | -31.5 | % | 16.9 | % | |||||||||||||
| Financial liabilities at fair value through profit or loss | 205,898 | 484,531 | - | -100.0 | % | -100.0 | % | |||||||||||||
Other liabilities (3) | 3,811,752 | 5,287,243 | 4,444,071 | -15.9 | % | 16.6 | % | |||||||||||||
| Total Liabilities | 177,367,887 | 183,337,310 | 178,545,003 | -2.6 | % | 0.7 | % | |||||||||||||
| Net equity | 18,217,739 | 19,505,851 | 20,633,464 | 5.8 | % | 13.3 | % | |||||||||||||
| Capital stock | 10,774,006 | 11,024,006 | 11,024,006 | 0.0 | % | 2.3 | % | |||||||||||||
| Reserves | 5,947,808 | 6,488,969 | 6,488,969 | 0.0 | % | 9.1 | % | |||||||||||||
| Unrealized gains and losses | 697,475 | (583,178 | ) | (495,371 | ) | n.a. | n.a. | |||||||||||||
| Retained earnings | 798,450 | 2,576,054 | 3,615,860 | 40.4 | % | 352.9 | % | |||||||||||||
| Non-controlling interest | 116,899 | 123,375 | 129,369 | 4.9 | % | 10.7 | % | |||||||||||||
| Total Net Equity | 18,334,638 | 19,629,226 | 20,762,833 | 5.8 | % | 13.2 | % | |||||||||||||
| Total liabilities and equity | 195,702,525 | 202,966,536 | 199,307,836 | -1.8 | % | 1.8 | % | |||||||||||||
| Off-balance sheet | 114,520,519 | 139,250,038 | 136,495,830 | -2.0 | % | 19.2 | % | |||||||||||||
| Total performance bonds, stand-by and L/Cs. | 19,477,129 | 20,761,917 | 21,203,561 | 2.1 | % | 8.9 | % | |||||||||||||
| Undrawn credit lines, advised but not committed | 70,391,997 | 80,631,043 | 75,333,998 | -6.6 | % | 7.0 | % | |||||||||||||
| Total derivatives (notional) and others | 24,651,393 | 37,857,078 | 39,958,271 | 5.6 | % | 62.1 | % | |||||||||||||
(1) Right of use asset of lease contracts is included by application of IFRS 16.
(2) Mainly includes intangible assets, other receivable accounts and tax credit.
(3) Mainly includes other payable accounts.
| 67 | |
| |
|
BANCO DE CREDITO DEL PERU AND SUBSIDIARIES
CONSOLIDATED STATEMENT OF INCOME
(In S/ thousands, IFRS)
| Quarter | % change | Year | % change | |||||||||||||||||||||||||||||
| 4Q21 | 3Q21 | 4Q21 | QoQ | YoY | 2020 | 2021 | 2021 / 2020 | |||||||||||||||||||||||||
| Interest income and expense | ||||||||||||||||||||||||||||||||
| Interest and dividend income | 2,456,757 | 2,542,011 | 2,626,005 | 3.3 | % | 6.9 | % | 10,099,154 | 10,022,744 | -0.8 | % | |||||||||||||||||||||
Interest expense (1) | (498,254 | ) | (443,398 | ) | (459,334 | ) | 3.6 | % | -7.8 | % | (2,450,702 | ) | (1,896,683 | ) | -22.6 | % | ||||||||||||||||
Net interest income (1) | 1,958,503 | 2,098,613 | 2,166,671 | 3.2 | % | 10.6 | % | 7,648,452 | 8,126,061 | 6.2 | % | |||||||||||||||||||||
| Provision for credit losses on loan portfolio | (735,523 | ) | (249,273 | ) | (224,506 | ) | -9.9 | % | -69.5 | % | (5,752,462 | ) | (1,539,152 | ) | -73.2 | % | ||||||||||||||||
| Recoveries of written-off loans | 47,591 | 93,671 | 95,748 | 2.2 | % | 101.2 | % | 147,854 | 323,538 | 118.8 | % | |||||||||||||||||||||
| Provision for credit losses on loan portfolio, net of recoveries | (687,932 | ) | (155,602 | ) | (128,758 | ) | -17.3 | % | -81.3 | % | (5,604,608 | ) | (1,215,614 | ) | -78.3 | % | ||||||||||||||||
| Risk-adjusted net interest income | 1,270,571 | 1,943,011 | 2,037,913 | 4.9 | % | 60.4 | % | 2,043,844 | 6,910,447 | 238.1 | % | |||||||||||||||||||||
| Non-financial income | ||||||||||||||||||||||||||||||||
| Fee income | 694,348 | 688,357 | 749,416 | 8.9 | % | 7.9 | % | 2,248,910 | 2,718,531 | 20.9 | % | |||||||||||||||||||||
| Net gain on foreign exchange transactions | 180,363 | 234,313 | 239,930 | 2.4 | % | 33.0 | % | 654,537 | 888,261 | 35.7 | % | |||||||||||||||||||||
| Net gain on securities | 11,194 | (30,017 | ) | (7,511 | ) | -75.0 | % | n.a. | 125,383 | (125,890 | ) | -200.4 | % | |||||||||||||||||||
| Net gain on derivatives held for trading | 5,538 | 462 | 27,477 | 5847.4 | % | 396.2 | % | 52,451 | 72,103 | 37.5 | % | |||||||||||||||||||||
Net gain from exchange differences (1) | 3,996 | 11,037 | (4,593 | ) | n.a. | n.a. | (5,031 | ) | 60,439 | n.a. | ||||||||||||||||||||||
| Others | 29,187 | 31,437 | 33,562 | 6.8 | % | 15.0 | % | 179,816 | 165,125 | -8.2 | % | |||||||||||||||||||||
Total other income (1) | 924,626 | 935,589 | 1,038,281 | 11.0 | % | 12.3 | % | 3,256,066 | 3,778,569 | 16.0 | % | |||||||||||||||||||||
| Total expenses | ||||||||||||||||||||||||||||||||
| Salaries and employee benefits | (534,217 | ) | (629,810 | ) | (715,877 | ) | 13.7 | % | 34.0 | % | (2,350,479 | ) | (2,581,498 | ) | 9.8 | % | ||||||||||||||||
Administrative expenses (1) | (578,252 | ) | (634,281 | ) | (694,702 | ) | 9.5 | % | 20.1 | % | (1,819,557 | ) | (2,279,368 | ) | 25.3 | % | ||||||||||||||||
Depreciation and amortization (1) | (126,974 | ) | (131,420 | ) | (137,757 | ) | 4.8 | % | 8.5 | % | (518,149 | ) | (522,347 | ) | 0.8 | % | ||||||||||||||||
| Other expenses | (135,309 | ) | (50,893 | ) | (65,712 | ) | 29.1 | % | -51.4 | % | (450,721 | ) | (224,875 | ) | -50.1 | % | ||||||||||||||||
Total expenses (1) | (1,374,752 | ) | (1,446,404 | ) | (1,614,048 | ) | 11.6 | % | 17.4 | % | (5,138,906 | ) | (5,608,088 | ) | 9.1 | % | ||||||||||||||||
| Profit before income tax | 820,445 | 1,432,196 | 1,462,146 | 2.1 | % | 78.2 | % | 161,004 | 5,080,928 | 3055.8 | % | |||||||||||||||||||||
| Income tax | (209,212 | ) | (371,383 | ) | (416,361 | ) | 12.1 | % | 99.0 | % | 83,298 | (1,418,736 | ) | n.a. | ||||||||||||||||||
| Net profit | 611,233 | 1,060,813 | 1,045,785 | -1.4 | % | 71.1 | % | 244,302 | 3,662,192 | 1399.0 | % | |||||||||||||||||||||
| Non-controlling interest | (978 | ) | (3,838 | ) | (5,979 | ) | 55.8 | % | n.a. | 19,974 | (13,139 | ) | n.a. | |||||||||||||||||||
| Net profit attributable to BCP Consolidated | 610,255 | 1,056,975 | 1,039,806 | -1.6 | % | 70.4 | % | 264,276 | 3,649,053 | 1280.8 | % | |||||||||||||||||||||
(1) The figures differ from those presented in the 2020 financial year
BANCO DE CREDITO DEL PERU AND SUBSIDIARIES
SELECTED FINANCIAL INDICATORS
| Quarter | Year | |||||||||||||||||||
| 4Q20 | 3Q21 | 4Q21 | 2020 | 2021 | ||||||||||||||||
| Profitability | ||||||||||||||||||||
Earnings per share (1) | 0.054 | 0.093 | 0.092 | 0.023 | 0.322 | |||||||||||||||
ROAA (2)(3) | 1.3 | % | 2.1 | % | 2.1 | % | 0.2 | % | 1.8 | % | ||||||||||
ROAE (2)(3) | 13.8 | % | 22.0 | % | 20.7 | % | 1.4 | % | 18.8 | % | ||||||||||
Net interest margin (2)(3) | 4.15 | % | 4.32 | % | 4.45 | % | 4.55 | % | 4.22 | % | ||||||||||
Risk adjusted NIM (2)(3) | 2.69 | % | 4.00 | % | 4.19 | % | 1.22 | % | 3.59 | % | ||||||||||
Funding Cost (2)(3)(4) | 1.17 | % | 1.00 | % | 1.05 | % | 1.63 | % | 1.09 | % | ||||||||||
| Quality of loan portfolio | ||||||||||||||||||||
IOL ratio | 3.61 | % | 3.96 | % | 4.02 | % | 3.61 | % | 4.02 | % | ||||||||||
NPL ratio | 4.90 | % | 5.27 | % | 5.33 | % | 4.90 | % | 5.33 | % | ||||||||||
Coverage of IOLs | 204.2 | % | 160.6 | % | 146.4 | % | 204.2 | % | 146.4 | % | ||||||||||
Coverage of NPLs | 150.5 | % | 120.6 | % | 110.6 | % | 150.5 | % | 110.6 | % | ||||||||||
Cost of risk (5) | 2.19 | % | 0.47 | % | 0.38 | % | 4.46 | % | 0.90 | % | ||||||||||
| Operating efficiency | ||||||||||||||||||||
Oper. expenses as a percent. of total income - reported (6) | 43.6 | % | 46.0 | % | 48.7 | % | 44.2 | % | 45.4 | % | ||||||||||
Oper. expenses as a percent. of av. tot. assets (2)(3)(6) | 2.56 | % | 2.77 | % | 3.08 | % | 2.70 | % | 2.73 | % | ||||||||||
| Share Information | ||||||||||||||||||||
N° of outstanding shares (Million) | 11,317 | 11,317 | 11,317 | 11,317 | 11,317 | |||||||||||||||
(1) Shares outstanding of 11,317 million is used for all periods since shares have been issued only for capitalization of profits.
(2) Ratios are annualized.
(3) Averages are determined as the average of period-beginning and period-ending balances.
(4) The funding costs differs from previously reported due to a methodoloy change in the denominator, which no longer includes the following accounts: acceptances outstanding, reserves for property and casualty claims, reserve for unearned premiums, reinsurance payable and other liabilities.
(5) Cost of risk: Annualized provision for loan losses / Total loans.
(6) Total income includes net interest income, fee income, net gain on foreign exchange transactions, result on exchange difference and net gain on derivatives. Operating expenses includes Salaries and social benefits, administrative, general and tax expenses and depreciation and amortization.
| 68 | |
| |
|
BANCO DE CREDITO DEL PERU
STATEMENT OF FINANCIAL POSITION
(S/ thousands, IFRS)
| As of | % change | |||||||||||||||||||
| Dec 20 | Sep 20 | Dec 21 | QoQ | YoY | ||||||||||||||||
| ASSETS | ||||||||||||||||||||
| Cash and due from banks | ||||||||||||||||||||
| Non-interest bearing | 5,322,420 | 5,666,863 | 4,366,498 | -22.9 | % | -18.0 | % | |||||||||||||
| Interest bearing | 25,948,221 | 32,819,306 | 29,965,362 | -8.7 | % | 15.5 | % | |||||||||||||
| Total cash and due from banks | 31,270,641 | 38,486,169 | 34,331,860 | -10.8 | % | 9.8 | % | |||||||||||||
| Cash collateral, reverse repurchase agreements and securities borrowing | 1,345,981 | 1,027,761 | 344,460 | -66.5 | % | -74.4 | % | |||||||||||||
| Fair value through profit or loss investments | 2,168,500 | 1,406,424 | 1,261,896 | -10.3 | % | -41.8 | % | |||||||||||||
| Fair value through other comprehensive income investments | 28,452,224 | 16,931,666 | 18,041,469 | 6.6 | % | -36.6 | % | |||||||||||||
| Amortized cost investments | 4,636,804 | 7,307,678 | 7,384,150 | 1.0 | % | 59.3 | % | |||||||||||||
| Loans | 113,464,992 | 121,459,651 | 122,752,170 | 1.1 | % | 8.2 | % | |||||||||||||
| Current | 109,850,172 | 117,256,286 | 118,242,794 | 0.8 | % | 7.6 | % | |||||||||||||
| Internal overdue loans | 3,614,820 | 4,203,365 | 4,509,376 | 7.3 | % | 24.7 | % | |||||||||||||
| Less - allowance for loan losses | (7,434,988 | ) | (6,976,762 | ) | (6,786,094 | ) | -2.7 | % | -8.7 | % | ||||||||||
| Loans, net | 106,030,004 | 114,482,889 | 115,966,076 | 1.3 | % | 9.4 | % | |||||||||||||
| Property, furniture and equipment, net | 1,429,864 | 1,328,385 | 1,332,705 | 0.3 | % | -6.8 | % | |||||||||||||
| Due from customers on acceptances | 455,343 | 776,863 | 532,404 | -31.5 | % | 16.9 | % | |||||||||||||
| Investments in associates | 2,098,825 | 2,214,558 | 2,333,611 | 5.4 | % | 11.2 | % | |||||||||||||
Other assets (1) | 4,964,018 | 6,576,750 | 5,492,025 | -16.5 | % | 10.6 | % | |||||||||||||
| Total Assets | 182,852,204 | 190,539,143 | 187,020,656 | -1.8 | % | 2.3 | % | |||||||||||||
| Liabilities and Equity | ||||||||||||||||||||
| Deposits and obligations | ||||||||||||||||||||
| Non-interest bearing | 43,733,838 | 47,272,754 | 44,590,124 | -5.7 | % | 2.0 | % | |||||||||||||
| Interest bearing | 74,612,197 | 77,851,798 | 79,200,967 | 1.7 | % | 6.2 | % | |||||||||||||
| Total deposits and obligations | 118,346,035 | 125,124,552 | 123,791,091 | -1.1 | % | 4.6 | % | |||||||||||||
| Payables from repurchase agreements and securities lending | 23,736,011 | 19,109,582 | 18,042,526 | -5.6 | % | -24.0 | % | |||||||||||||
| BCRP instruments | 23,203,388 | 18,547,001 | 17,484,261 | -5.7 | % | -24.6 | % | |||||||||||||
| Repurchase agreements with third parties | 532,623 | 562,581 | 558,265 | -0.8 | % | 4.8 | % | |||||||||||||
| Due to banks and correspondents | 4,910,261 | 6,191,543 | 5,842,071 | -5.6 | % | 19.0 | % | |||||||||||||
| Bonds and notes issued | 13,678,986 | 14,652,059 | 14,294,675 | -2.4 | % | 4.5 | % | |||||||||||||
| Banker’s acceptances outstanding | 455,343 | 776,863 | 532,404 | -31.5 | % | 16.9 | % | |||||||||||||
| Financial liabilities at fair value through profit or loss | 205,898 | 484,531 | - | -100.0 | % | -100.0 | % | |||||||||||||
Other liabilities (2) | 3,299,330 | 4,690,015 | 3,884,639 | -17.2 | % | 17.7 | % | |||||||||||||
| Total Liabilities | 164,631,864 | 171,029,145 | 166,387,406 | -2.7 | % | 1.1 | % | |||||||||||||
| Net equity | 18,220,340 | 19,509,998 | 20,633,250 | 5.8 | % | 13.2 | % | |||||||||||||
| Capital stock | 10,774,006 | 11,024,006 | 11,024,006 | 0.0 | % | 2.3 | % | |||||||||||||
| Reserves | 5,947,808 | 6,488,968 | 6,488,969 | 0.0 | % | 9.1 | % | |||||||||||||
| Unrealized gains and losses | 697,475 | (583,178 | ) | (495,371 | ) | n.a. | n.a. | |||||||||||||
| Retained earnings | 801,051 | 2,580,202 | 3,615,646 | 40.1 | % | 351.4 | % | |||||||||||||
| Total Net Equity | 18,220,340 | 19,509,998 | 20,633,250 | 5.8 | % | 13.2 | % | |||||||||||||
| Total liabilities and equity | 182,852,204 | 190,539,143 | 187,020,656 | -1.8 | % | 2.3 | % | |||||||||||||
| Off-balance sheet | 112,868,480 | 135,953,567 | 133,169,883 | -2.0 | % | 18.0 | % | |||||||||||||
| Total performance bonds, stand-by and L/Cs. | 19,477,403 | 20,762,191 | 21,203,561 | 2.1 | % | 8.9 | % | |||||||||||||
| Undrawn credit lines, advised but not committed | 70,775,980 | 79,357,524 | 73,424,937 | -7.5 | % | 3.7 | % | |||||||||||||
| Total derivatives (notional) and others | 22,615,097 | 35,833,852 | 38,541,385 | 7.6 | % | 70.4 | % | |||||||||||||
(1) Mainly includes intangible assets, other receivable accounts and tax credit.
(2) Mainly includes other payable accounts.
| 69 | |
| |
|
BANCO DE CREDITO DEL PERU
STATEMENT OF INCOME
(S/ thousands, IFRS)
| Quarter | % change | Year | % change | |||||||||||||||||||||||||||||
| 4Q20 | 3Q21 | 4Q21 | QoQ | YoY | 2020 | 2021 | 2021 / 2020 | |||||||||||||||||||||||||
| Interest income and expense | ||||||||||||||||||||||||||||||||
Interest and dividend income | 1,994,352 | 1,996,856 | 2,059,066 | 3.1 | % | 3.2 | % | 8,197,914 | 7,925,892 | -3.3 | % | |||||||||||||||||||||
Interest expense (1) | (424,178 | ) | (393,036 | ) | (399,009 | ) | 1.5 | % | -5.9 | % | (2,106,029 | ) | (1,667,138 | ) | -20.8 | % | ||||||||||||||||
| Net interest income | 1,570,174 | 1,603,820 | 1,660,057 | 3.5 | % | 5.7 | % | 6,091,885 | 6,258,754 | 2.7 | % | |||||||||||||||||||||
| Provision for credit losses on loan portfolio | (614,866 | ) | (103,385 | ) | (161,595 | ) | 56.3 | % | -73.7 | % | (4,636,694 | ) | (1,038,026 | ) | -77.6 | % | ||||||||||||||||
Recoveries of written-off loans | 38,392 | 70,441 | 68,765 | -2.4 | % | 79.1 | % | 120,245 | 245,038 | 103.8 | % | |||||||||||||||||||||
| Provision for credit losses on loan portfolio, net of recoveries | (576,474 | ) | (32,944 | ) | (92,830 | ) | 181.8 | % | -83.9 | % | (4,516,449 | ) | (792,988 | ) | -82.4 | % | ||||||||||||||||
| Risk-adjusted net interest income | 993,700 | 1,570,876 | 1,567,227 | -0.2 | % | 57.7 | % | 1,575,436 | 5,465,766 | 246.9 | % | |||||||||||||||||||||
| Other income | ||||||||||||||||||||||||||||||||
| Fee income | 636,331 | 669,583 | 719,473 | 7.5 | % | 13.1 | % | 2,162,357 | 2,641,301 | 22.1 | % | |||||||||||||||||||||
Net gain on foreign exchange transactions | 179,165 | 231,547 | 237,450 | 2.5 | % | 32.5 | % | 647,856 | 880,261 | 35.9 | % | |||||||||||||||||||||
Net gain on securities | 11,196 | (30,044 | ) | 115,361 | -484.0 | % | 930.4 | % | 125,410 | 47,632 | -62.0 | % | ||||||||||||||||||||
Net gain from associates | 27,656 | 73,843 | (7,952 | ) | n.a. | n.a. | (352,658 | ) | 81,970 | n.a. | ||||||||||||||||||||||
Net gain on derivatives held for trading | 4,410 | 4,260 | 26,429 | 520.4 | % | 499.3 | % | 49,034 | 73,593 | 50.1 | % | |||||||||||||||||||||
Net gain from exchange differences | 4,966 | 7,277 | (1,993 | ) | n.a. | n.a. | 6,227 | 57,451 | 822.6 | % | ||||||||||||||||||||||
Others | 31,447 | 32,642 | 34,444 | 5.5 | % | 9.5 | % | 160,377 | 158,160 | -1.4 | % | |||||||||||||||||||||
| Total other income | 895,171 | 989,108 | 1,123,212 | 13.6 | % | 25.5 | % | 2,798,603 | 3,940,368 | 40.8 | % | |||||||||||||||||||||
| Total expenses | ||||||||||||||||||||||||||||||||
Salaries and employee benefits | (366,503 | ) | (449,094 | ) | (512,934 | ) | 14.2 | % | 40.0 | % | (1,601,800 | ) | (1,825,012 | ) | 13.9 | % | ||||||||||||||||
Administrative expenses | (520,291 | ) | (580,194 | ) | (621,878 | ) | 7.2 | % | 19.5 | % | (1,638,967 | ) | (2,043,570 | ) | 24.7 | % | ||||||||||||||||
Depreciation and amortization (2) | (105,542 | ) | (111,360 | ) | (117,924 | ) | 5.9 | % | 11.7 | % | (424,265 | ) | (437,740 | ) | 3.2 | % | ||||||||||||||||
Other expenses | (105,980 | ) | (37,124 | ) | (48,719 | ) | 31.2 | % | -54.0 | % | (385,499 | ) | (178,800 | ) | -53.6 | % | ||||||||||||||||
| Total expenses | (1,098,316 | ) | (1,177,772 | ) | (1,301,455 | ) | 10.5 | % | 18.5 | % | (4,050,531 | ) | (4,485,122 | ) | 10.7 | % | ||||||||||||||||
| Profit before income tax | 790,555 | 1,382,212 | 1,388,984 | 0.5 | % | 75.7 | % | 323,508 | 4,921,012 | 1421.1 | % | |||||||||||||||||||||
Income tax | (179,868 | ) | (324,697 | ) | (353,540 | ) | 8.9 | % | 96.6 | % | (57,043 | ) | (1,274,774 | ) | 2134.8 | % | ||||||||||||||||
| Net profit attributable to BCP Stand-alone | 610,687 | 1,057,515 | 1,035,444 | -2.1 | % | 69.6 | % | 266,465 | 3,646,238 | 1268.4 | % | |||||||||||||||||||||
(1) As of 2019, financing expenses related to lease agreements is included according to the application of IFRS 16.
(2) From this quarter, the effect is being incorporated by the application of IFRS 16, which corresponds to a greater depreciation for the asset for right-of-use". Likewise, the expenses related to the depreciation of improvements in building for rent is being reclassified to the item "Other expenses".
BANCO DE CREDITO DEL PERU
SELECTED FINANCIAL INDICATORS
| Quarter | Year | |||||||||||||||||||
| 4Q20 | 3Q21 | 4Q21 | 2020 | 2021 | ||||||||||||||||
| Profitability | ||||||||||||||||||||
ROAA (2)(3) | 1.3 | % | 2.2 | % | 2.2 | % | 0.2 | % | 2.0 | % | ||||||||||
ROAE (2)(3) | 13.8 | % | 22.0 | % | 20.6 | % | 1.4 | % | 18.8 | % | ||||||||||
Net interest margin (1)(2) | 3.60 | % | 3.57 | % | 3.68 | % | 3.94 | % | 3.52 | % | ||||||||||
Risk adjusted NIM (1)(2) | 2.28 | % | 3.49 | % | 3.48 | % | 1.02 | % | 3.07 | % | ||||||||||
Funding Cost (1)(2) | 1.07 | % | 0.95 | % | 0.98 | % | 1.51 | % | 1.03 | % | ||||||||||
| Quality of loan portfolio | ||||||||||||||||||||
| IOL ratio | 3.19 | % | 3.46 | % | 3.67 | % | 3.19 | % | 3.67 | % | ||||||||||
| NPL ratio | 4.51 | % | 4.86 | % | 5.04 | % | 4.51 | % | 5.04 | % | ||||||||||
| Coverage of IOLs | 205.7 | % | 166.0 | % | 150.5 | % | 205.7 | % | 150.5 | % | ||||||||||
| Coverage of NPLs | 145.1 | % | 118.3 | % | 109.6 | % | 145.1 | % | 109.6 | % | ||||||||||
Cost of risk (3) | 2.03 | % | 0.11 | % | 0.30 | % | 3.98 | % | 0.65 | % | ||||||||||
| Operating efficiency | ||||||||||||||||||||
Oper. expenses as a percent. of total income - reported (4) | 41.4 | % | 45.3 | % | 47.4 | % | 40.9 | % | 43.4 | % | ||||||||||
Oper. expenses as a percent. of av. tot. assets (1)(2) | 2.19 | % | 2.41 | % | 2.65 | % | 2.00 | % | 2.62 | % | ||||||||||
(1) Ratios are annualized.
(2) Averages are determined as the average of period-beginning and period-ending balances.
(3) Cost of risk: Annualized provision for loan losses / Total loans.
(4) Total income includes net interest income, fee income, net gain on foreign exchange transactions, result on exchange difference and net gain on derivatives. Operating expenses includes Salaries and social benefits, administrative, general and tax expenses and depreciation and amortization.
| 70 | |
| |
|
Regulatory and Capital Adecuacy Ratios at BCP Stand-alone
(In S/ thousands, Peru GAAP)
| Regulatory Capital and Capital Adequacy Ratios - SBS | As of | % change | |||||||||||||||||||
| S/ 000 | Dec 20 | Sep 21 | Dec 21 | QoQ | YoY | ||||||||||||||||
| Capital Stock | 11,067,387 | 11,317,387 | 11,317,387 | 0.0 | % | 2.3 | % | ||||||||||||||
| Legal and Other capital reserves | 6,166,670 | 6,707,831 | 6,707,831 | 0.0 | % | 8.8 | % | ||||||||||||||
| Accumulated earnings with capitalization agreement | - | - | - | n.a. | n.a. | ||||||||||||||||
Loan loss reserves (1) | 1,595,916 | 1,720,951 | 1,735,372 | 0.8 | % | 8.7 | % | ||||||||||||||
| Perpetual subordinated debt | - | - | - | n.a. | n.a. | ||||||||||||||||
| Subordinated Debt | 4,817,188 | 5,595,900 | 5,397,450 | -3.5 | % | 12.0 | % | ||||||||||||||
| Investment in subsidiaries and others, net of unrealized profit and net income | (2,314,790 | ) | (2,263,805 | ) | (2,263,805 | ) | 0.0 | % | -2.2 | % | |||||||||||
| Investment in subsidiaries and others | (2,297,879 | ) | (2,377,058 | ) | (2,435,661 | ) | 2.5 | % | 6.0 | % | |||||||||||
| Unrealized profit and net income in subsidiaries | (16,911 | ) | 113,253 | 171,857 | 51.7 | % | n.a. | ||||||||||||||
| Goodwill | (122,083 | ) | (122,083 | ) | (122,083 | ) | 0.0 | % | 0.0 | % | |||||||||||
| Total Regulatory Capital - SBS | 21,210,287 | 22,956,180 | 22,772,151 | -0.8 | % | 7.4 | % | ||||||||||||||
| Off-balance sheet | 90,253,383 | 100,119,715 | 94,628,498 | -5.5 | % | 4.8 | % | ||||||||||||||
Regulatory Tier 1 Capital (2) | 14,783,879 | 15,142,988 | 15,142,988 | 0.0 | % | 2.4 | % | ||||||||||||||
Regulatory Tier 2 Capital (3) | 6,426,408 | 7,813,192 | 7,629,163 | -2.4 | % | 18.7 | % | ||||||||||||||
Total risk-weighted assets - SBS (4) | 142,042,877 | 151,415,294 | 152,376,235 | 0.6 | % | 7.3 | % | ||||||||||||||
| Credit risk-weighted assets | 125,874,294 | 135,576,214 | 137,707,535 | 1.6 | % | 9.4 | % | ||||||||||||||
Market risk-weighted assets (5) | 4,859,241 | 3,792,119 | 2,408,770 | -36.5 | % | -50.4 | % | ||||||||||||||
| Operational risk-weighted assets | 11,309,343 | 12,046,961 | 12,259,930 | 1.8 | % | 8.4 | % | ||||||||||||||
| Total capital requirement -SBS | 16,359,370 | 13,925,638 | 14,356,117 | 3.1 | % | -12.2 | % | ||||||||||||||
| Credit risk capital requirement | 12,587,429 | 10,561,112 | 10,846,097 | 2.7 | % | -13.8 | % | ||||||||||||||
| Market risk capital requirement | 485,924 | 312,746 | 379,212 | 21.3 | % | -22.0 | % | ||||||||||||||
| Operational risk capital requirement | 1,130,934 | 1,179,465 | 1,204,696 | 2.1 | % | 6.5 | % | ||||||||||||||
| Additional capital requirements | 2,155,082 | 1,872,315 | 1,926,112 | 2.9 | % | -10.6 | % | ||||||||||||||
Common Equity Tier 1 - Basel (6) | 15,292,575 | 15,869,607 | 16,856,292 | 6.2 | % | 10.2 | % | ||||||||||||||
| Capital and reserves | 17,234,057 | 18,025,217 | 18,025,217 | 0.0 | % | 4.6 | % | ||||||||||||||
| Retained earnings | 832,931 | 2,007,214 | 3,032,691 | 51.1 | % | 264.1 | % | ||||||||||||||
| Unrealized gains (losses) | 691,094 | (591,123 | ) | (497,304 | ) | -15.9 | % | -172.0 | % | ||||||||||||
| Goodwill and intangibles | (1,167,628 | ) | (1,194,644 | ) | (1,268,650 | ) | 6.2 | % | 8.7 | % | |||||||||||
| Investments in subsidiaries | (2,297,879 | ) | (2,377,058 | ) | (2,435,661 | ) | 2.5 | % | 6.0 | % | |||||||||||
Risk-Weighted Assets - Basel (7) | 134,192,100 | 142,988,956 | 142,406,954 | -0.4 | % | 6.1 | % | ||||||||||||||
| Total risk-weighted assets | 142,042,877 | 151,415,294 | 152,376,235 | 0.6 | % | 7.3 | % | ||||||||||||||
| (-) RWA Intangible assets, excluding goodwill. | 9,264,963 | 9,779,459 | 10,927,753 | 11.7 | % | 17.9 | % | ||||||||||||||
| (+) RWA Deferred tax assets generated as a result of temporary differences in income tax, in excess of 10% of CET1 | 1,414,185 | 1,353,120 | 958,471 | -29.2 | % | -32.2 | % | ||||||||||||||
| (+) RWA Deferred tax assets generated as a result of past losses | - | - | - | - | - | ||||||||||||||||
| Capital ratios | |||||||||||||||||||||
Regulatory Tier 1 ratio (8) | 10.41 | % | 10.00 | % | 9.94 | % | -6 bps | -47 bps | |||||||||||||
Common Equity Tier 1 ratio (9) | 11.40 | % | 11.10 | % | 11.84 | % | 74 bps | 44 bps | |||||||||||||
Global Capital ratio (10) | 14.93 | % | 15.16 | % | 14.94 | % | -22 bps | 1 bps | |||||||||||||
| Risk-weighted assets / Regulatory capital | 6.70 | 6.60 | 6.69 | 1.4 | % | -0.1 | % | ||||||||||||||
(1) Up to 1.25% of total risk-weighted assets.
(2) Regulatory Tier 1 Capital = Capital + Legal and other capital reserves + Accumulated earnings with capitalization agreement + (0.5 x Unrealized profit and net income in subsidiaries) - Goodwill - (0.5 x Investment in subsidiaries) + Perpetual subordinated debt (maximum amount that can be included is 17.65% of Capital + Reserves + Accumulated earnings with capitalization agreement + Unrealized profit and net income in subsidiaries - Goodwill).
(3) Regulatory Tier 2 Capital = Subordinated debt + Loan loss reserves + Unrestricted Reserves + (0.5 x Unrealized profit and net income in subsidiaries) - (0.5 x Investment in subsidiaries).
(4) Since July 2012, Total Risk-weighted assets = Credit risk-weighted assets * 1.00 + Capital requirement to cover market risk * 10 + Capital requirement to cover operational risk * 10 * 1.00 (since July 2014)
(5) It includes capital requirement to cover price and rate risk.
(6) Common Equity Tier I = Capital + Reserves – 100% of applicable deductions (investment in subsidiaries, goodwill, intangibles and net deferred taxes that rely on future profitability) + retained earnings + unrealized gains.
(7) Adjusted Risk-Weighted Assets = Risk-weighted assets - (RWA Intangible assets, excluding goodwill, + RWA Deferred tax assets generated as a result of temporary differences in income tax, in excess of 10% of CET1, + RWA Deferred tax assets gene@Holarated as a result of past losses).
(8) Regulatory Tier 1 Capital / Total Risk-weighted assets
(9) Common Equity Tier I / Adjusted Risk-Weighted Assets
(10) Total Regulatory Capital / Total Risk-weighted assets (legal minimum = 10% since July 2011)
| 71 | |
| |
|
BCP BOLIVIA
(S/ thousands, IFRS)
| As of | % change | |||||||||||||||||||
| Dec 20 | Sep 21 | Dec 21 | QoQ | YoY | ||||||||||||||||
| ASSETS | ||||||||||||||||||||
| Cash and due from banks | 2,325,205 | 2,625,523 | 2,374,838 | -9.5 | % | 2.1 | % | |||||||||||||
| Investments | 1,483,229 | 1,794,096 | 1,778,292 | -0.9 | % | 19.9 | % | |||||||||||||
| Total loans | 8,838,281 | 9,919,102 | 9,596,816 | -3.2 | % | 8.6 | % | |||||||||||||
| Current | 8,703,786 | 9,782,780 | 9,471,577 | -3.2 | % | 8.8 | % | |||||||||||||
| Internal overdue loans | 89,481 | 95,751 | 89,850 | -6.2 | % | 0.4 | % | |||||||||||||
| Refinanced | 45,014 | 40,572 | 35,390 | -12.8 | % | -21.4 | % | |||||||||||||
| Allowance for loan losses | (614,337 | ) | (467,583 | ) | (448,075 | ) | -4.2 | % | -27.1 | % | ||||||||||
| Net loans | 8,223,944 | 9,451,520 | 9,148,741 | -3.2 | % | 11.2 | % | |||||||||||||
| Property, plant and equipment, net | 54,898 | 61,986 | 67,170 | 8.4 | % | 22.4 | % | |||||||||||||
| Other assets | 385,144 | 414,892 | 430,775 | 3.8 | % | 11.8 | % | |||||||||||||
| Total assets | 12,472,420 | 14,348,016 | 13,799,816 | -3.8 | % | 10.6 | % | |||||||||||||
| LIABILITIES AND NET SHAREHOLDERS' EQUITY | ||||||||||||||||||||
| Deposits and obligations | 10,722,703 | 12,114,178 | 11,554,075 | -4.6 | % | 7.8 | % | |||||||||||||
| Due to banks and correspondents | 78,187 | 89,697 | 106,430 | 18.7 | % | 36.1 | % | |||||||||||||
| Bonds and subordinated debt | 168,936 | 191,218 | 185,592 | -2.9 | % | 9.9 | % | |||||||||||||
| Other liabilities | 811,553 | 1,111,166 | 1,119,145 | 0.7 | % | 37.9 | % | |||||||||||||
| Total liabilities | 11,781,380 | 13,506,259 | 12,965,242 | -4.0 | % | 10.0 | % | |||||||||||||
| Net equity | 691,040 | 841,757 | 834,574 | -0.9 | % | 20.8 | % | |||||||||||||
| TOTAL LIABILITIES AND NET SHAREHOLDERS' EQUITY | 12,472,420 | 14,348,016 | 13,799,816 | -3.8 | % | 10.6 | % | |||||||||||||
| Quarter | % change | Year | % change | |||||||||||||||||||||||||||||
| 4Q20 | 3Q21 | 4Q21 | QoQ | YoY | 2020 | 2021 | 2021 / 2020 | |||||||||||||||||||||||||
| Net interest income | -79,373 | 97,603 | 83,842 | -14.1 | % | n.a. | 181,692 | 336,530 | 85.2 | % | ||||||||||||||||||||||
| Provision for loan losses, net of recoveries | (36,599 | ) | (23,161 | ) | (7,908 | ) | -65.9 | % | -78.4 | % | (245,311 | ) | (5,535 | ) | -97.7 | % | ||||||||||||||||
| Net interest income after provisions | -115,972 | 74,441 | 75,934 | 2.0 | % | n.a. | -63,619 | 330,995 | n.a. | |||||||||||||||||||||||
| Non-financial income | 31,187 | 44,902 | 48,202 | 7.3 | % | 54.6 | % | 110,151 | 166,326 | 51.0 | % | |||||||||||||||||||||
| Total expenses | (79,517 | ) | (78,514 | ) | (90,747 | ) | 15.6 | % | 14.1 | % | (260,356 | ) | (361,989 | ) | 39.0 | % | ||||||||||||||||
| Translation result | 215 | (89 | ) | 10 | n.a. | -95.3 | % | 134 | (70 | ) | n.a. | |||||||||||||||||||||
| Income taxes | 143,500 | (17,619 | ) | (10,866 | ) | -38.3 | % | n.a. | 139,434 | (62,994 | ) | n.a. | ||||||||||||||||||||
| Net income | (20,586 | ) | 23,121 | 22,532 | 2.5 | % | n.a. | (74,257 | ) | 72,267 | n.a. | |||||||||||||||||||||
| Efficiency ratio | -140.8 | % | 53.0 | % | 70.0 | % | 1700 pbs | 21080 pbs | 87.8 | % | 60.3 | % | -2750 pbs | |||||||||||||||||||
| ROAE | -12.0 | % | 11.5 | % | 10.8 | % | -70 pbs | 2273 pbs | -10.4 | % | 9.5 | % | 1987 pbs | |||||||||||||||||||
| L/D ratio | 82.4 | % | 81.9 | % | 83.1 | % | 120 pbs | 63 pbs | ||||||||||||||||||||||||
| IOL ratio | 1.01 | % | 0.97 | % | 0.94 | % | -10 pbs | -7 pbs | ||||||||||||||||||||||||
| NPL ratio | 1.52 | % | 1.37 | % | 1.31 | % | -10 pbs | -21 pbs | ||||||||||||||||||||||||
| Coverage of IOLs | 686.6 | % | 488.3 | % | 498.7 | % | 1040 pbs | -18786 pbs | ||||||||||||||||||||||||
| Coverage of NPLs | 456.8 | % | 343.0 | % | 357.8 | % | 1480 pbs | -9900 pbs | ||||||||||||||||||||||||
| Branches | 54 | 43 | 44 | 1 | -10 | |||||||||||||||||||||||||||
| Agentes | 851 | 876 | 1011 | 135 | 160 | |||||||||||||||||||||||||||
| ATMs | 310 | 306 | 310 | 4 | 0 | |||||||||||||||||||||||||||
| Employees | 1,650 | 1,575 | 1,568 | -7 | -82 | |||||||||||||||||||||||||||
| 72 | |
| |
|
12.6. Mibanco
MIBANCO
(In S/ thousands, IFRS)
| As of | % change | |||||||||||||||||||
| Dec 20 | Sep 20 | Dec 21 | QoQ | YoY | ||||||||||||||||
| ASSETS | ||||||||||||||||||||
Cash and due from banks | 1,861,011 | 1,577,391 | 1,107,339 | -29.8 | % | -40.5 | % | |||||||||||||
Investments | 1,435,436 | 1,525,592 | 1,591,562 | 4.3 | % | 10.9 | % | |||||||||||||
| Total loans | 12,928,787 | 13,288,672 | 13,512,892 | 1.7 | % | 4.5 | % | |||||||||||||
| Current | 11,904,708 | 12,172,179 | 12,544,853 | 3.1 | % | 5.4 | % | |||||||||||||
| Internal overdue loans | 913,273 | 1,067,142 | 905,082 | -15.2 | % | -0.9 | % | |||||||||||||
| Refinanced | 110,806 | 49,351 | 62,957 | 27.6 | % | -43.2 | % | |||||||||||||
| Allowance for loan losses | -1,821,546 | -1,487,787 | -1,145,702 | -23.0 | % | -37.1 | % | |||||||||||||
| Net loans | 11,107,241 | 11,800,884 | 12,367,190 | 4.8 | % | 11.3 | % | |||||||||||||
Property, plant and equipment, net | 165,559 | 145,753 | 144,237 | -1.0 | % | -12.9 | % | |||||||||||||
Other assets | 1,080,247 | 1,035,653 | 952,303 | -8.0 | % | -11.8 | % | |||||||||||||
| Total assets | 15,649,493 | 16,085,272 | 16,162,630 | 0.5 | % | 3.3 | % | |||||||||||||
| LIABILITIES AND NET SHAREHOLDERS' EQUITY | ||||||||||||||||||||
| Deposits and obligations | 8,661,124 | 8,620,050 | 8,426,058 | -2.3 | % | -2.7 | % | |||||||||||||
| Due to banks and correspondents | 1,362,275 | 2,232,497 | 2,413,663 | 8.1 | % | 77.2 | % | |||||||||||||
| Bonds and subordinated debt | 132,687 | 186,677 | 188,310 | 0.9 | % | 41.9 | % | |||||||||||||
| Other liabilities | 3,383,480 | 2,803,336 | 2,771,810 | -1.1 | % | -18.1 | % | |||||||||||||
| Total liabilities | 13,539,566 | 13,842,559 | 13,799,841 | -0.3 | % | 1.9 | % | |||||||||||||
| Net equity | 2,109,927 | 2,242,714 | 2,362,789 | 5.4 | % | 12.0 | % | |||||||||||||
| TOTAL LIABILITIES AND NET SHAREHOLDERS' EQUITY | 15,649,493 | 16,085,272 | 16,162,630 | 0.5 | % | 3.3 | % | |||||||||||||
| Quarter | % change | Full Year | % change | |||||||||||||||||||||||||||||
| 4Q20 | 3Q21 | 4Q21 | QoQ | YoY | 2020 | 2021 | 2021 / 2020 | |||||||||||||||||||||||||
| Net interest income | 386,545 | 493,183 | 505,001 | 2.4 | % | 30.6 | % | 1,550,046 | 1,860,353 | 20.0 | % | |||||||||||||||||||||
| Provision for loan losses, net of recoveries | -117,946 | -122,711 | -40,058 | -67.4 | % | -66.0 | % | (1,090,281 | ) | (425,938 | ) | -60.9 | % | |||||||||||||||||||
| Net interest income after provisions | 268,599 | 370,472 | 464,943 | 25.5 | % | 73.1 | % | 459,765 | 1,434,415 | 212.0 | % | |||||||||||||||||||||
| Non-financial income | 59,491 | 22,207 | 31,668 | 42.6 | % | -46.8 | % | 107,847 | 98,766 | -8.4 | % | |||||||||||||||||||||
| Total expenses | -277,169 | -269,221 | -314,635 | 16.9 | % | 13.5 | % | (1,088,344 | ) | (1,124,072 | ) | 3.3 | % | |||||||||||||||||||
| Translation result | - | - | - | 0.0 | % | 0.0 | % | - | - | 0.0 | % | |||||||||||||||||||||
| Income taxes | -27,942 | -46,543 | -62,113 | 33.5 | % | 122.3 | % | 141,718 | (142,971 | ) | n.a. | |||||||||||||||||||||
| Net income | 22,979 | 76,915 | 119,863 | 55.8 | % | 122.3 | % | -379,014 | 266,138 | n.a. | ||||||||||||||||||||||
| Efficiency ratio | 55.7 | % | 49.7 | % | 55.6 | % | 590 bps | -10 bps | 63.1 | % | 55.8 | % | -730 bps | |||||||||||||||||||
| ROAE | 4.8 | % | 13.9 | % | 20.8 | % | 690 bps | 1600 bps | -18.1 | % | 11.9 | % | 3000 bps | |||||||||||||||||||
| ROAE incl. Goowdill | 4.5 | % | 13.2 | % | 19.7 | % | 650 bps | 1520 bps | -17.8 | % | 11.5 | % | 2930 bps | |||||||||||||||||||
| L/D ratio | 149.3 | % | 154.2 | % | 160.4 | % | 621 pbs | 1110 bps | ||||||||||||||||||||||||
| IOL ratio | 7.1 | % | 8.0 | % | 6.7 | % | -130 bps | -40 pbs | ||||||||||||||||||||||||
| NPL ratio | 7.9 | % | 8.4 | % | 7.2 | % | -120 bps | -70 pbs | ||||||||||||||||||||||||
| Coverage of IOLs | 199.5 | % | 139.4 | % | 126.6 | % | -1280 bps | -7290 bps | ||||||||||||||||||||||||
| Coverage of NPLs | 177.9 | % | 133.3 | % | 118.4 | % | -1490 bps | -5950 bps | ||||||||||||||||||||||||
Branches (1) | 323 | 318 | 315 | -3 | -8 | |||||||||||||||||||||||||||
| Employees | 10,781 | 9,874 | 9,878 | 4 | -903 | |||||||||||||||||||||||||||
(1) Includes Banco de la Nacion branches, which in December 20 were 34, in September 21 were 34 and in December 21 were 34
| 73 | |
| |
|
Regulatory Capital and Capital Adequacy Ratios at Mibanco
(S/ thousands, Peru GAAP)
| As of | % change | |||||||||||||||||||
| Dec 20 | Sep 21* | Dec 21 | QoQ | YoY | ||||||||||||||||
| Capital Stock | 2,114,500 | 1,714,577 | 1,714,577 | 0.0 | % | -18.9 | % | |||||||||||||
| Legal and Other capital reserves | 246,305 | 246,305 | 246,305 | 0.0 | % | 0.0 | % | |||||||||||||
| Accumulated earnings with capitalization agreement | - | 94,945 | 143,318 | 50.9 | % | N/A | ||||||||||||||
Loan loss reserves (1) | 133,221 | 146,213 | 155,006 | 6.0 | % | 16.4 | % | |||||||||||||
| Perpetual subordinated debt | - | - | - | n.a. | n.a. | |||||||||||||||
| Subordinated Debt | 130,000 | 185,000 | 185,000 | 0.0 | % | 42.3 | % | |||||||||||||
| Investment in subsidiaries and others, net of unrealized profit and net income | - | - | - | n.a. | n.a. | |||||||||||||||
| Investment in subsidiaries and others | - | - | - | n.a. | n.a. | |||||||||||||||
| Unrealized profit and net income in subsidiaries | - | - | - | n.a. | n.a. | |||||||||||||||
| Goodwill | (139,180 | ) | (139,180 | ) | (139,180 | ) | 0.0 | % | 0.0 | % | ||||||||||
| Accumulated Losses | (35,204 | ) | - | - | n.a. | -100.0 | % | |||||||||||||
| Total Regulatory Capital - SBS | 2,449,642 | 2,247,861 | 2,305,026 | 2.5 | % | -5.9 | % | |||||||||||||
Regulatory Tier 1 Capital (2) | 2,183,682 | 1,913,912 | 1,962,285 | 2.5 | % | -10.1 | % | |||||||||||||
Regulatory Tier 2 Capital (3) | 265,960 | 333,948 | 342,741 | 2.6 | % | 28.9 | % | |||||||||||||
Total risk-weighted assets - SBS (4) | 12,356,336 | 13,430,936 | 14,087,582 | 4.9 | % | 14.0 | % | |||||||||||||
| Credit risk-weighted assets | 10,314,642 | 11,320,727 | 12,017,913 | 6.2 | % | 16.5 | % | |||||||||||||
Market risk-weighted assets (5) | 134,862 | 229,235 | 180,974 | -21.1 | % | 34.2 | % | |||||||||||||
| Operational risk-weighted assets | 1,906,832 | 1,880,975 | 1,888,695 | 0.4 | % | -1.0 | % | |||||||||||||
| Total capital requirement | 1,236,634 | 1,344,094 | 1,409,758 | 4.9 | % | 14.0 | % | |||||||||||||
| Credit risk capital requirement | 1,031,464 | 1,132,073 | 1,201,791 | 6.2 | % | 16.5 | % | |||||||||||||
| Market risk-weighted assets | 13,486 | 22,923 | 18,097 | -21.1 | % | 34.2 | % | |||||||||||||
| Operational risk capital requirement | 190,683 | 188,097 | 188,869 | 0.4 | % | -1.0 | % | |||||||||||||
| Additional capital requirements | 1,000 | 1,000 | 1,000 | 0.0 | % | 0.0 | % | |||||||||||||
Common Equity Tier 1 - Basel (6) | 2,097,427 | 1,892,846 | 1,953,762 | 3.2 | % | -6.8 | % | |||||||||||||
| Capital and reserves | 2,360,805 | 1,960,882 | 1,960,882 | 0.0 | % | -16.9 | % | |||||||||||||
| Retained earnings | (35,204 | ) | 201,478 | 257,116 | 27.6 | % | n.a. | |||||||||||||
| Unrealized gains (losses) | 7,691 | (5,892 | ) | (5,702 | ) | -3.2 | % | n.a. | ||||||||||||
| Goodwill and intangibles | (235,865 | ) | (246,432 | ) | (258,533 | ) | 4.9 | % | 9.6 | % | ||||||||||
| Excess DT of 10% CET1 Basilea | - | (17,191 | ) | - | -100.0 | % | n.a. | |||||||||||||
| Investments in subsidiaries | - | #DIV/0! | N/A | |||||||||||||||||
Adjusted Risk-Weighted Assets - Basel (7) | 11,851,948 | 12,537,634 | 13,156,427 | 4.9 | % | 11.0 | % | |||||||||||||
| Total risk-weighted assets | 12,356,336 | 13,430,936 | 14,087,582 | 4.9 | % | 14.0 | % | |||||||||||||
| (-) RWA Intangible assets, excluding goodwill. | 746,454 | 1,049,844 | 1,175,376 | 12.0 | % | 57.5 | % | |||||||||||||
| (+) RWA Deferred tax assets generated as a result of temporary differences in income tax, in excess of 10% of CET1 | 242,065 | 238,755 | 244,220 | 2.3 | % | 0.9 | % | |||||||||||||
| (-) RWA assets that exceed 10% of CET1 SBS | - | 80,966 | - | -100.0 | % | n.a. | ||||||||||||||
| (-) RWA difference between excees SBS and Basel methodology | - | 1,247 | - | -100.0 | % | n.a. | ||||||||||||||
| (-) RWA adjustment for state coverage, originated by temporary difference | - | - | - | N/A | - | |||||||||||||||
| (+) RWA Deferred tax assets generated as a result of past losses | - | - | - | N/A | - | |||||||||||||||
| Capital ratios | ||||||||||||||||||||
Regulatory Tier 1 ratio (8) | 17.67 | % | 14.25 | % | 13.93 | % | -32 bps | -374 bps | ||||||||||||
Common Equity Tier 1 ratio (9) | 17.70 | % | 15.10 | % | 14.85 | % | -25 bps | -285 bps | ||||||||||||
Global Capital ratio (10) | 19.82 | % | 16.74 | % | 16.36 | % | -38 bps | -346 bps | ||||||||||||
| Risk-weighted assets / Regulatory capital | 5.04 | 5.97 | 6.11 | 2.3 | % | 21.2 | % | |||||||||||||
(1) Up to 1.25% of total risk-weighted assets.
(2) Regulatory Tier 1 Capital = Capital + Legal and other capital reserves + Accumulated earnings with capitalization agreement + (0.5 x Unrealized profit and net income in subsidiaries) - Goodwill - (0.5 x Investment in subsidiaries) + Perpetual subordinated debt (maximum amount that can be included is 17.65% of Capital + Reserves + Accumulated earnings with capitalization agreement + Unrealized profit and net income in subsidiaries - Goodwill).
(3) Regulatory Tier 2 Capital = Subordinated debt + Loan loss reserves + Unrestricted Reserves + (0.5 x Unrealized profit and net income in subsidiaries) - (0.5 x Investment in subsidiaries).
(4) Since July 2012, Total Risk-weighted assets = Credit risk-weighted assets * 1.00 + Capital requirement to cover market risk * 10 + Capital requirement to cover operational risk * 10 * 1.00 (since July 2014)
(5) It includes capital requirement to cover price and rate risk.
(6) Common Equity Tier I = Capital + Reserves – 100% of applicable deductions (investment in subsidiaries, goodwill, intangibles and net deferred taxes that rely on future profitability) + retained earnings + unrealized gains.
(7) Adjusted Risk-Weighted Assets = Risk-weighted assets - (RWA Intangible assets, excluding goodwill, + RWA Deferred tax assets generated as a result of temporary differences in income tax, in excess of 10% of CET1, + RWA Deferred tax assets generated as a result of past losses).
(8) Regulatory Tier 1 Capital / Total Risk-weighted assets
(9) Common Equity Tier I / Adjusted Risk-Weighted Assets
(10) Total Regulatory Capital / Total Risk-weighted assets (legal minimum = 10% since July 2011)
(*) Sep 21 Ratios differ from previously reported, please consider the data presented on this report
| 74 | |
| |
|
Investment Banking & Wealth Management
(S/ thousands, IFRS)
| Investment Banking and Wealth Management | Quarter | % change | Year | % change | |||||||||||||||||||||||||||||
| S/ 000 | 4Q20 | 3Q21 | 4Q21 | QoQ | YoY | 2020 | 2021 | 2021 / 2020 | |||||||||||||||||||||||||
| Net interest income | 19,349 | 14,290 | 14,681 | 2.7 | % | -24 | % | 68,404 | 75,113 | 9.8 | % | ||||||||||||||||||||||
| Non-financial income | 302,575 | 217,358 | 184,296 | -15.2 | % | -39.1 | % | 889,305 | 793,451 | -10.8 | % | ||||||||||||||||||||||
| Fee income | 156,753 | 149,029 | 155,193 | 4.1 | % | -1.0 | % | 506,505 | 620,753 | 22.6 | % | ||||||||||||||||||||||
| Net gain on foreign exchange transactions | -21,862 | -3,033 | 15,822 | n.a | n.a | -10,213 | 16,807 | n.a | |||||||||||||||||||||||||
| Net gain on sales of securities | 101,559 | 34,790 | -6,334 | n.a | n.a | 312,947 | 28,588 | -90.9 | % | ||||||||||||||||||||||||
| Derivative Result | 13,027 | 42,607 | -435 | n.a | n.a | -11,372 | 112,884 | n.a | |||||||||||||||||||||||||
| Result from exposure to the exchange rate | 5,671 | -10,599 | 763 | n.a | -86.5 | % | 26,748 | -22,532 | n.a | ||||||||||||||||||||||||
| Other income | 47,427 | 4,564 | 19,287 | 322.6 | % | -59.3 | % | 64,690 | 36,951 | -42.9 | % | ||||||||||||||||||||||
Operating expenses (1) | -225,503 | -166,716 | -189,766 | 13.8 | % | -15.8 | % | -728,584 | -675,254 | -7.3 | % | ||||||||||||||||||||||
| Operating income | 96,421 | 64,932 | 9,211 | -85.8 | % | -90.4 | % | 229,125 | 193,310 | -15.6 | % | ||||||||||||||||||||||
| Income taxes | -12,595 | -9,284 | 347 | n.a | n.a | -36,535 | -25,388 | -30.5 | % | ||||||||||||||||||||||||
| Non-controlling interest | 453 | 1,537 | 923 | -39.9 | % | 103.8 | % | 816 | 4,032 | 394.1 | % | ||||||||||||||||||||||
| Net income | 83,373 | 54,111 | 8,635 | -84.0 | % | -89.6 | % | 191,774 | 163,890 | -14.5 | % | ||||||||||||||||||||||
* Unaudited results.
(1) Includes: Salaries and employee benefits + Administrative expenses + Assigned expenses + Depreciation and amortization + Tax and contributions + Other expenses.
| 75 | |
| |
|
GRUPO PACIFICO
(S/ in thousands )
| As of | % change | |||||||||||||||||||
| Dec20 | Sep 21 | Dec 21 | QoQ | YoY | ||||||||||||||||
Total assets | 16,021,597 | 15,949,391 | 16,487,225 | 3.4 | % | 2.9 | % | |||||||||||||
Invesment on securities (6) | 12,348,185 | 12,129,220 | 12,491,114 | 3.0 | % | 1.2 | % | |||||||||||||
Technical reserves | 11,694,653 | 12,531,003 | 12,543,226 | 0.1 | % | 7.3 | % | |||||||||||||
Net equity | 2,971,337 | 1,895,643 | 2,280,033 | 20.3 | % | -23.3 | % | |||||||||||||
| Quarter | % change | Year | % change | |||||||||||||||||||||||||||||
| 4Q20 | 3Q21 | 4Q21 | QoQ | YoY | 2020 | 2021 | 2021 / 2020 | |||||||||||||||||||||||||
| Net earned premiums | 657,373 | 677,204 | 714,026 | 5.4 | % | 8.6 | % | 2,461,195 | 2,686,710 | 9.2 | % | |||||||||||||||||||||
| Net claims | (495,532 | ) | (517,950 | ) | (509,279 | ) | -1.7 | % | 2.8 | % | (1,731,944 | ) | (2,346,469 | ) | 35.5 | % | ||||||||||||||||
| Net fees | (173,855 | ) | (149,570 | ) | (165,647 | ) | 10.7 | % | -4.7 | % | (572,234 | ) | (602,506 | ) | 5.3 | % | ||||||||||||||||
| Net underwriting expenses | (11,234 | ) | (35,798 | ) | (18,792 | ) | -47.5 | % | 67.3 | % | (128,488 | ) | (115,944 | ) | -9.8 | % | ||||||||||||||||
| Underwriting result | (23,247 | ) | (26,115 | ) | 20,309 | n.a. | n.a. | 28,529 | (378,210 | ) | n.a. | |||||||||||||||||||||
| Medical services gross margin | #DIV/0! | #DIV/0! | #DIV/0! | |||||||||||||||||||||||||||||
| Net financial income | 137,684 | 182,019 | 163,616 | -10.1 | % | 18.8 | % | 559,784 | 654,276 | 16.9 | % | |||||||||||||||||||||
| Total expenses | (119,900 | ) | (111,326 | ) | (131,029 | ) | 17.7 | % | 9.3 | % | (443,626 | ) | (455,035 | ) | 2.6 | % | ||||||||||||||||
| Other income | 16,424 | 16,413 | 17,650 | 7.5 | % | 7.5 | % | 46,170 | 47,481 | 2.8 | % | |||||||||||||||||||||
| Traslations results | (2,276 | ) | 547 | (1,559 | ) | n.a. | -31.5 | % | -2,036 | -537 | -73.6 | % | ||||||||||||||||||||
| EPS business deduction | 16,625 | 12,994 | 8,785 | -32.4 | % | -47.2 | % | 60,034 | 53,956 | -10.1 | % | |||||||||||||||||||||
| Medical Assistance insurance deduction | (17,079 | ) | (10,426 | ) | (13,965 | ) | 34.0 | % | -18.2 | % | (52,020 | ) | (47,176 | ) | -9.3 | % | ||||||||||||||||
| Income tax | 391 | (333 | ) | (1,486 | ) | n.a. | n.a. | (2,197 | ) | (5,247 | ) | 138.8 | % | |||||||||||||||||||
| Income before minority interest | 8,621 | 63,773 | 62,321 | -2.3 | % | n.a. | 194,639 | (130,491 | ) | -167.0 | % | |||||||||||||||||||||
| Non-controlling interest | (921 | ) | (1,245 | ) | (760 | ) | -38.9 | % | -17.4 | % | (3,796 | ) | (4,394 | ) | 15.8 | % | ||||||||||||||||
| Net income | 7,701 | 62,529 | 61,560 | -1.5 | % | n.a. | 190,843 | (134,885 | ) | -170.7 | % | |||||||||||||||||||||
| Ratios | ||||||||||||||||||||||||||||||||
| Ceded | 20.6 | % | 16.8 | % | 21.4 | % | 460 bps | 80 bps | 16.2 | % | 18.2 | % | 200 bps | |||||||||||||||||||
Loss ratio (1) | 75.4 | % | 76.5 | % | 71.3 | % | -520 bps | -410 bps | 70.4 | % | 87.3 | % | 1690 bps | |||||||||||||||||||
| Fees + underwriting expenses, net / net earned premiums | 28.2 | % | 27.4 | % | 25.8 | % | -160 bps | -240 bps | 28.5 | % | 26.7 | % | -180 bps | |||||||||||||||||||
| Underwriting results / net earned premiums | ||||||||||||||||||||||||||||||||
| Operating expenses / net earned premiums | 18.2 | % | 16.4 | % | 18.4 | % | 200 bps | 20 bps | 18.0 | % | 16.9 | % | -110 bps | |||||||||||||||||||
ROAE (2)(3) | 1.2 | % | 12.7 | % | 11.9 | % | -80 bps | 1070 bps | 6.7 | % | -5.0 | % | -1170 bps | |||||||||||||||||||
| Return on written premiums | 0.7 | % | 5.6 | % | 4.8 | % | -80 bps | 410 bps | 5.2 | % | -3.1 | % | -830 bps | |||||||||||||||||||
Combined ratio of Life (4) | 135.6 | % | 95.1 | % | 96.7 | % | 160 bps | -3890 bps | 135.6 | % | 96.7 | % | -3890 bps | |||||||||||||||||||
Combined ratio of P&C (5) | 81.4 | % | 94.1 | % | 86.5 | % | -760 bps | 510 bps | 81.4 | % | 86.5 | % | 510 bps | |||||||||||||||||||
| Equity requirement ratio⁽⁷⁾ | 1.34 | 1.19 | 1.18 | -150 bps | -1600 bps | 1.34 | 1.18 | -1600 bps | ||||||||||||||||||||||||
*Financial statements without consolidation adjustments.
(1) Excluding investments in real estate.
(2) Net claims / Net earned premiums.
(3) Includes unrealized gains.
(4) Annualized and average are determined as the average of period beginning and period ending.
(5) (Net claims / Net earned premiums) + Reserves / Net earned premiums) + [(Acquisition cost + total expenses) / Net earned premiums] - (Net Financial Income without real state sales, securities sales, impairment loss and fluctuation / Net earned premiums).
(6) (Net claims / Net earned premiums) + [(Acquisition cost + total expenses) / Net earned premiums].
(7) Support to cover credit risk, market risk and operational risk.
From 1Q15 and on, Grupo Pacifico’s financial statements reflect the the agreement with Banmédica (in equal parts) of the businesses of:
| (i) | private health insurance managed by Grupo Pacífico and included in its Financial Statements in each of the accounting lines; |
| (ii) | corporate health insurance (dependent workers); and |
| (iii) | medical services. |
The businesses described in ii) and iii) are managed by Banmedica, therefore they do not consolidate in Grupo Pacifico’s financial statements. The 50% of net income generated by Banmedica is recorded in Grupo Pacifico’s Income Statement as a gain/loss on investments in subsidiaries.
As explained before, corporate health insurance and medical services businesses are consolidated by Banmedica. The following table reflects the consolidated results from which Grupo Pacifico receives the 50% net income.
| 76 | |
| |
|
Corporate health insurance and Medical services
(S/ in thousands )
| Quarter | % change | Year | % change | |||||||||||||||||||||||||||||
| 4Q20 | 3Q21 | 4Q21 | QoQ | YoY | 2020 | 2021 | 2021 / 2020 | |||||||||||||||||||||||||
| Results | ||||||||||||||||||||||||||||||||
| Net earned premiums | 288,742 | 301,598 | 303,539 | 0.6 | % | 5.1 | % | 1,119,511 | 1,171,433 | 4.6 | % | |||||||||||||||||||||
| Net claims | (223,322 | ) | (259,820 | ) | (271,100 | ) | 4.3 | % | 21.4 | % | (854,107 | ) | (1,019,908 | ) | 19.4 | % | ||||||||||||||||
| Net fees | (11,583 | ) | (12,836 | ) | (13,613 | ) | 6.1 | % | 17.5 | % | (47,341 | ) | (50,990 | ) | 7.7 | % | ||||||||||||||||
| Net underwriting expenses | (1,997 | ) | (2,566 | ) | (2,282 | ) | -11.1 | % | 14.3 | % | (10,418 | ) | (10,137 | ) | -2.7 | % | ||||||||||||||||
| Underwriting result | 51,839 | 26,376 | 16,544 | -37.3 | % | -68.1 | % | 207,645 | 90,397 | -56.5 | % | |||||||||||||||||||||
| Net financial income | 1,671 | 1,775 | 1,351 | -23.9 | % | -19.2 | % | 5,851 | 6,217 | 6.3 | % | |||||||||||||||||||||
| Total expenses | (28,515 | ) | (22,725 | ) | (25,499 | ) | 12.2 | % | -10.6 | % | (86,281 | ) | (88,112 | ) | 2.1 | % | ||||||||||||||||
| Other income | 2,280 | (8 | ) | 3,940 | n.a. | 72.8 | % | 3,199 | 3,502 | 9.5 | % | |||||||||||||||||||||
| Traslations results | 271 | 5,087 | (2,818 | ) | -155.4 | % | n.a. | 3,352 | 6,659 | 98.7 | % | |||||||||||||||||||||
| Income tax | (9,023 | ) | (8,175 | ) | (118 | ) | -98.6 | % | -98.7 | % | (42,202 | ) | (13,436 | ) | -68.2 | % | ||||||||||||||||
| Net income before Medical services | 18,523 | 2,329 | (6,601 | ) | n.a. | -135.6 | % | 91,564 | 5,227 | -94.3 | % | |||||||||||||||||||||
| Net income of Medical services | 14,647 | 23,575 | 24,088 | 2.2 | % | 64.5 | % | 28,180 | 102,352 | 263.2 | % | |||||||||||||||||||||
| Net income | 33,170 | 25,904 | 17,487 | -32.5 | % | -47.3 | % | 119,744 | 107,579 | -10.2 | % | |||||||||||||||||||||
| 77 | |
| |
|
12.10. Prima AFP
| As of | % change | |||||||||||||||||||
| 4Q20 | 3Q21 | 4Q21 | QoQ | YoY | ||||||||||||||||
Total assets | 1,107,706 | 796,553 | 839,772 | 5.4 | % | -24.2 | % | |||||||||||||
Total liabilities | 407,536 | 257,554 | 265,185 | 3.0 | % | -34.9 | % | |||||||||||||
Net shareholders' equity | 700,170 | 538,999 | 574,587 | 6.6 | % | -17.9 | % | |||||||||||||
(*) The net profitability of lace and mutual funds is being presented net of taxes, for which the retroactive change was made (it was presented gross before)
Prima AFP
(S/ thousands, IFRS)
| Quarter | % change | Year | % change | |||||||||||||||||||||||||||||
| 4Q20 | 3Q21 | 4Q21 | QoQ | YoY | 2020 | 2021 | 2021 / 2020 | |||||||||||||||||||||||||
| Income from commissions | 87,314 | 94,620 | 89,170 | -5.8 | % | 2.1 | % | 352,085 | 378,722 | 7.6 | % | |||||||||||||||||||||
| Administrative and sale expenses | (33,670 | ) | (42,006 | ) | (46,757 | ) | 11.3 | % | 38.9 | % | (136,563 | ) | (166,053 | ) | 21.6 | % | ||||||||||||||||
| Depreciation and amortization | (5,795 | ) | (5,845 | ) | (6,144 | ) | 5.1 | % | 6.0 | % | (24,003 | ) | (23,454 | ) | -2.3 | % | ||||||||||||||||
| Operating income | 47,849 | 46,769 | 36,269 | -22.5 | % | -24.2 | % | 191,519 | 189,215 | -1.2 | % | |||||||||||||||||||||
| Other income and expenses, net (profitability of lace) | 36,425 | (2,371 | ) | 10,406 | -538.8 | % | -71.4 | % | 20,367 | 13,058 | -35.9 | % | ||||||||||||||||||||
| Income tax | (21,190 | ) | (13,592 | ) | (10,400 | ) | -23.5 | % | -50.9 | % | (63,022 | ) | (56,353 | ) | -10.6 | % | ||||||||||||||||
| Net income before translation results | 63,084 | 30,806 | 36,275 | 17.8 | % | -42.5 | % | 148,863 | 145,921 | -2.0 | % | |||||||||||||||||||||
| Translations results | (134 | ) | 891 | (812 | ) | -191.1 | % | 507.1 | % | (723 | ) | 136 | -118.8 | % | ||||||||||||||||||
| Net income | 62,950 | 31,697 | 35,463 | 11.9 | % | -43.7 | % | 148,141 | 146,057 | -1.4 | % | |||||||||||||||||||||
ROAE (1) | 37.7 | % | 21.4 | % | 25.5 | % | 405 pbs | -1220 pbs | 21.2 | % | 22.9 | % | 173 pbs | |||||||||||||||||||
| (1) | Net shareholders' equity includes unrealized gains from Prima's investment portfolio. |
| Funds under management | ||||||||||||||||
| Funds under management | Sep 21 | % share | Dec 21 | % share | ||||||||||||
| Fund 0 | 1,205 | 3.1 | % | 1,277 | 3.2 | % | ||||||||||
| Fund 1 | 6,394 | 16.5 | % | 6,286 | 15.7 | % | ||||||||||
| Fund 2 | 26,698 | 69.0 | % | 27,836 | 69.4 | % | ||||||||||
| Fund 3 | 4,421 | 11.4 | % | 4,725 | 11.8 | % | ||||||||||
| Total S/ Millions | 38,719 | 100 | % | 40,125 | 100 | % | ||||||||||
Source: SBS
Nominal profitability over the last 12 months
| Sep 21 / Sep 20 | Dec 21 / Dec 20 | |||||||
| Fund 0 | 1.0 | % | 0.7 | % | ||||
| Fund 1 | 4.2 | % | -2.2 | % | ||||
| Fund 2 | 11.7 | % | 6.4 | % | ||||
| Fund 3 | 23.1 | % | 18.9 | % | ||||
| AFP fees | ||
| Fee based on flow | 1.60% | Applied to the affiliates' monthly remuneration. |
| Mixed fee | ||
| Flow | 0.18% | Applied to the affiliates' monthly remuneration since June 2017. Feb 17- may 17 =0.87%. |
| Balance | 1.25% | Applies annualy to the new balance since February 2013 for new affiliates to the system and beginning on June 2013 for old affiliates who have chosen this commission scheme. |
Main Indicators
| Main indicators and market share | Prima 3Q21 | System 3Q21 | % share 3Q21 | Prima 4Q21 | System 4Q21 | % share 4Q21 | ||||||||||||||||||
| Affiliates | 2,351,087 | 8,120,364 | 29.0 | % | 2,349,596 | 8,251,977 | 28.5 | % | ||||||||||||||||
New affiliations (1) | - | 139,360 | 0.0 | % | - | 138,417 | 0.0 | % | ||||||||||||||||
| Funds under management (S/ Millions) | 38,719 | 129,169 | 30.0 | % | 40,125 | 133,310 | 30.1 | % | ||||||||||||||||
| Collections (S/ Millions) | 1,016 | 3,591 | 28.3 | % | 1,073 | 3,647 | 29.4 | % | ||||||||||||||||
Voluntary contributions (S/ Millions) (2) | 1,035 | 2,596 | 39.9 | % | 1,039 | 2,687 | 38.7 | % | ||||||||||||||||
RAM (S/ Millions) (2) (3) | 1,316 | 4,322 | 30.4 | % | 1,323 | 4,336 | 30.5 | % | ||||||||||||||||
Source: SBS
(1) As of June 2019, another AFP has the exclusivity of affiliations.
(2) Information available as of November 2021.
(3) Prima AFP estimate: Average of aggregated income for flow during the last 4 months, excluding special collections and voluntary contribution fees.
.
| 78 | |
| |
|
Wholesale Banking
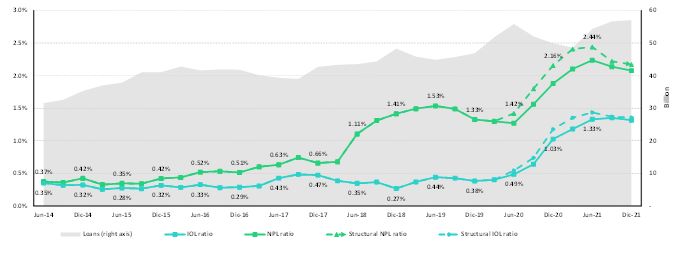
SME-Business
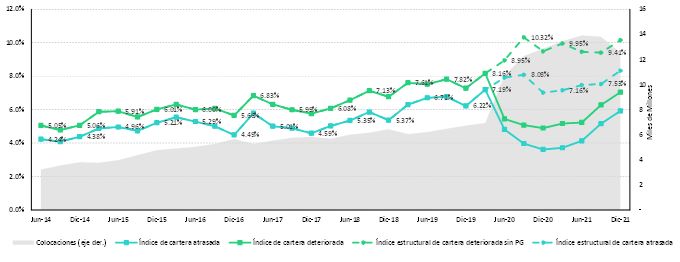
SME-Pyme
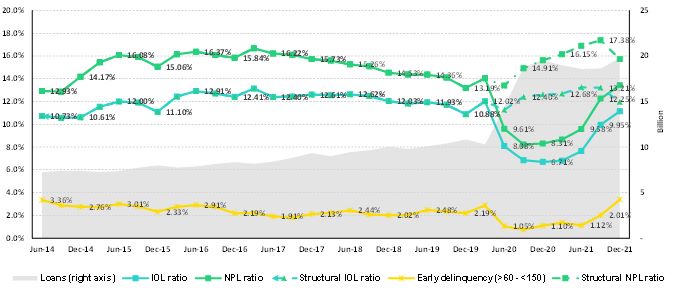
| 79 | |
| |
|
Mortgage
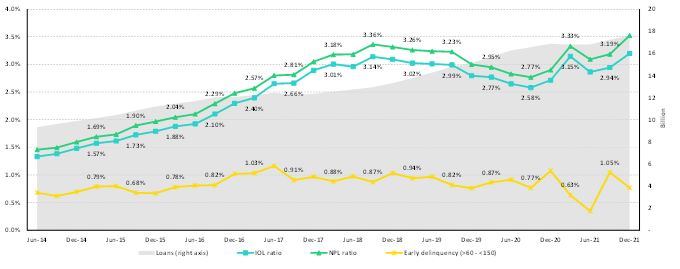
Consumer
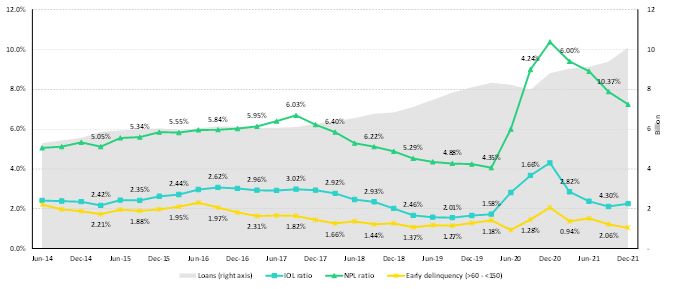
Credit Card
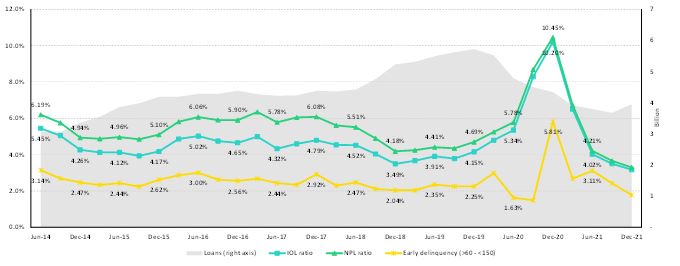
| 80 | |
| |
|
Mibanco
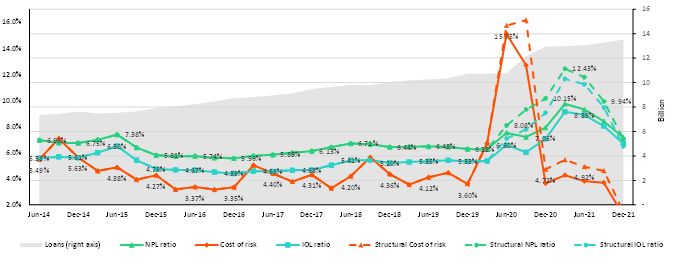
BCP Bolivia

| 81 | |
| |
|
12.12. Table of calculations
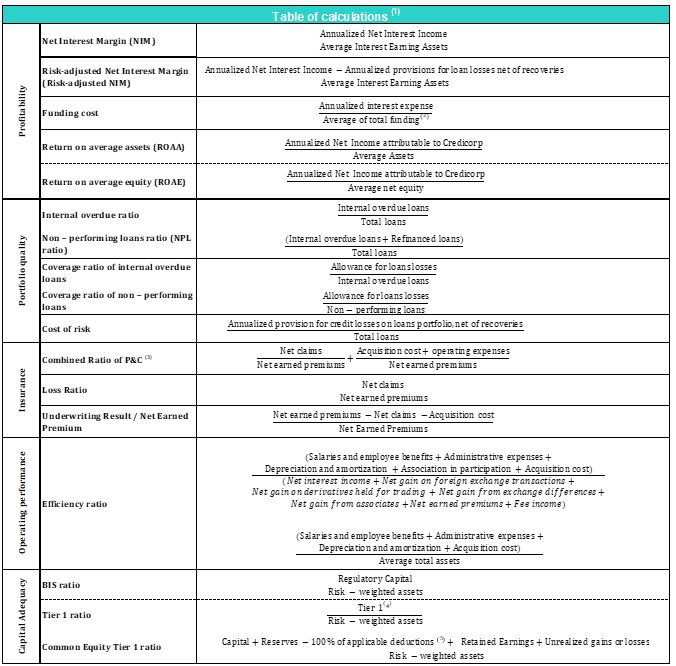
(1) Averages are determined as the average of period-beginning and period-ending balances.
(2) Includes total deposits, due to banks and correspondents, BCRP instruments, repurchase agreements and bonds and notes issued.
(3) Does not include Life insurance business.
(4) Tier 1 = Capital + Legal and other capital reserves + Accumulated earnings with capitalization agreement + (0.5 x Unrealized profit and net income in subsidiaries) - Goodwill - (0.5 x Investment in subsidiaries) + Perpetual subordinated debt (maximum amount that can be included is 17.65% of Capital + Reserves + Accumulated earnings with capitalization agreement + Unrealized profit and net income in subsidiaries - Goodwill).
(5) Includes investment in subsidiaries, goodwill, intangibles and deferred tax that rely on future profitability.
| 82 | |
| |
|
Government Program Loans (“GP or GP loans”) | Loan Portfolio related to Reactiva Peru and FAE-Mype programs to respond quickly and effectively to liquidity needs and maintain the payment chain. |
Structural Loans | Loan Portfolio excluding GP Loans. |
| Non-Recurring Events at Interest Income | Impairment charge (related to the government facility that allowed for deferrement of certain installments at zero cost) and subsequent amortization thereof. |
| Non-Recurring Events at Interest Expense | Charges related to the liability management operation at BCP (3Q20, 1Q21). |
Structural Cost of risk | Cost of Risk related to the Structural Loans. It excludes, in the numerator, provisions for credit losses on GP loans, and in the denominator, the total amount of GP Loans. |
Structural NPL ratio | NPL Ratio related to Structural Loans. It excludes the impact of GP Loans. |
Structural NIM | NIM related to structural loans and other interest earning assets. It deducts the impact from GP loans and non-recurring events from Interest Income and Interest Expenses. |
Structural Funding Cost | Funding Cost deducting the impact in expenses and funding related to GP Loans and deducting non-recurring events from Interest Expense. |
| 83 | |
| |