| | | |
| | At the end of 2Q22, 72.2% of Credicorp’s deposit volume was low-cost, which represents a competitive advantage in a context of rising funding costs. In YoY terms, low-cost deposits (FX Neutral) fell 5.1%, driven by a decrease in demand deposits in LC clients moved to amortize GP loans. Likewise, Severance Indemnity deposits (CTS) dropped 23.6% (FX neutral) YoY after the government decreed that funds be released for withdrawal. Over the same period, Time Deposits registered an increase after a migration from low-cost deposits to this deposit type to take advantage of higher interest rates.
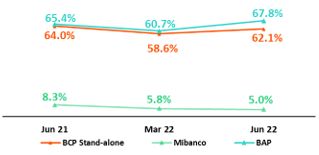
At the end of May 2022, BCP Stand-alone’s share of total deposits stood at 32.4% (-100 bps with regard to June 2021). This evolution was triggered by drop in demand deposits related to the amortization of Reactiva loans. Mibanco reported an MS of 2.5% (+30bps with regard to June 2021) in a context marked by an uptick in time deposits after retail clients that had withdrawn funds last year due to unfavorable juncture migrated back. | |
| | | |
| Deposits | As of | % change | Currency |
| S/ 000 | Jun 21 | Mar 22 | Jun 22 | QoQ | YoY | LC | FC |
| Demand deposits | 59,998,764 | 56,923,859 | 51,554,195 | -9.4% | -14.1% | 41.9% | 58.1% |
| Saving deposits | 52,687,270 | 56,454,479 | 54,936,107 | -2.7% | 4.3% | 52.9% | 47.1% |
| Time deposits | 30,302,103 | 30,029,261 | 35,923,266 | 19.6% | 18.6% | 48.4% | 51.6% |
| Severance indemnity deposits | 5,456,510 | 3,750,593 | 4,155,932 | 10.8% | -23.8% | 70.1% | 29.9% |
| Interest payable | 717,156 | 757,772 | 871,075 | 15.0% | 21.5% | 48.2% | 51.8% |
| Total Deposits | 149,161,803 | 147,915,964 | 147,440,575 | -0.3% | -1.2% | 48.2% | 51.8% |
Our deposit base fell 0.3% QoQ. FX neutral fell 2.0% due to:
| | • | An 11.2% drop in Demand Deposits, which was triggered by the fact that Wholesale Clients at BCP Stand-alone used deposit balances to amortize Reactiva loans and to regularize income tax; |
| | • | A 4.2% drop in Savings Deposits, which was driven by an outflow from LC funds. The latter was partially offset by an increase in FC after individuals purchased US Dollars at BCP Stand-alone; |
| | • | A 17.6% increase in Time Deposits, which was driven primarily by evolution at BCP Stand-alone (fund inflows due to rising interest rates) and by an uptick at Mibanco, which also, reflects efforts to capture stable funding. |
| | • | Growth of 9.7% in Severance Indemnity Deposits, given that statutory payments are deposited in May. The effect of these deposits was partially offset after the government lifted restrictions to fund access. |
Low-cost deposits (Demand + savings) represented 72.2% of total deposits, which represented a drop of 4.5 p.p QoQ.
In the YoY analysis, deposits fell 1.2%. FX neutral deposits dropped 0.7%, driven by:
| | • | A 13.6% drop in Demand Deposits in both currencies after clients used balances to amortize Reactiva loans and meet other liquidity needs. |
| | • | A 23.6% decrease in Severance Indemnity Deposits after restrictions on fund use were lifted. |
| | • | A 19.1% increase in Time Deposits, spurred by outflows from low-cost deposits at BCP Stand-alone to this deposit type to take advantage of higher interest rates and to a lesser extent, by an increase in the Time Deposit volume at Mibanco, after retail clients that had withdrawn funds last year due to the juncture migrated back. |
| | • | Growth of 4.7% in Savings Deposits, after funds were released from AFPs and Severance Indemnity Accounts (CTS) and subsequently deposited in FC to hedge against exchange rate volatility. |
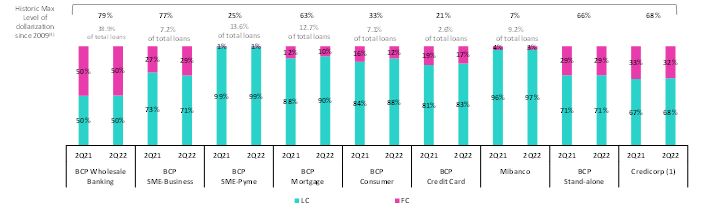
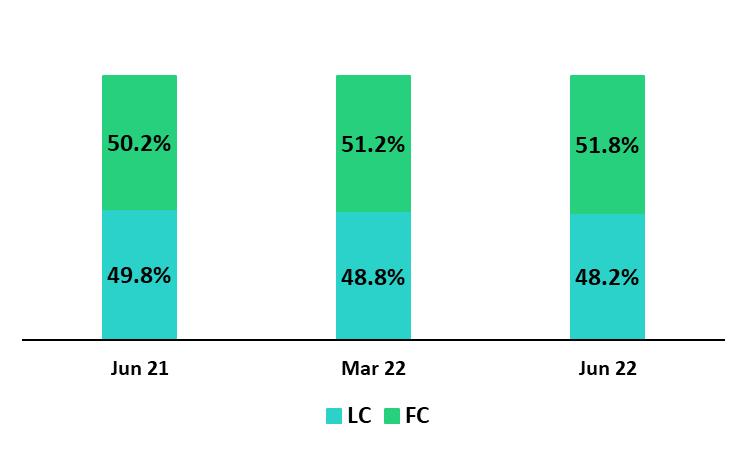
Deposit Dollarization Level
Deposits by Currency
(measured in quarter-end balances)
At the end of June 2022, the dollarization level was up 0.6 p.p. QoQ (-0.3 p.p FX neutral) due to an uptick in the exchange rate. Savings Deposits absorbed the brunt of this impact after individuals at BCP Stand-alone moved to purchase dollars. Dollarization levels of Time Deposits fell slightly after LC balances registered growth in a context of interest rate hikes in LC.
In YoY terms, dollarization rose. This was primarily driven by 4.3% drop in LC deposits, which was attributable to a decrease in Demand Deposits, which in turn reflected the consumption of excess liquidity and the use of funds to amortize Reactiva loans. FC balances increased 1.9% (+2.8% with a constant exchange rate), through Time Deposits and Savings Deposits. |
Deposits by currency and type
(measured in quarter-end balances)
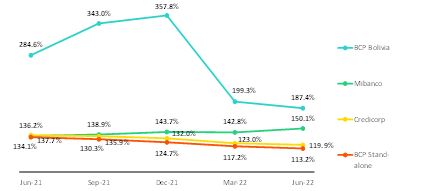
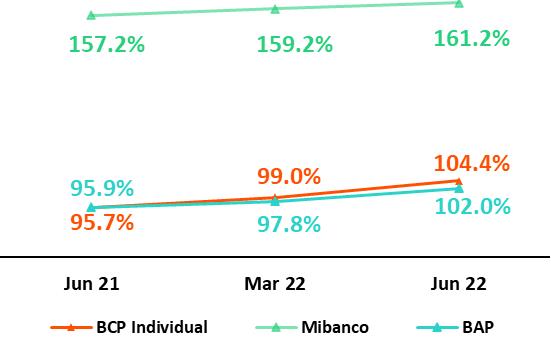
Loan/Deposit Ratio (L/D Ratio)
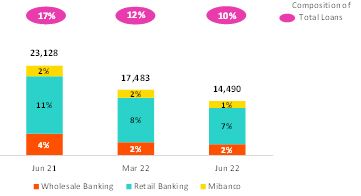
The L/D ratio rose 8.7 and 3.9 percentage points YoY at BCP Stand-alone and Mibanco respectively. This growth reflects a significant uptick in loan origination at both subsidiaries due to economic reactivation. In parallel, deposit balances fell, driven by reduced volumes of Demand Deposits in LC, mainly at BCP Individual and triggered by amortization of GP loans. In this scenario, the L/D ratio at Credicorp stood at 102%.
L/D Ratio Foreign Currency
Market Share of Deposits in the Peruvian Financial System
At the end of May 2022, the MS of Total Deposits at BCP Stand-alone and Mibanco in Peru was 32.4% and 2.5% (-100bps and +30bps with regard to June 2021 respectively. At BCP Stand-alone Demand Deposits dropped due to amortizations of loans through government programs, where the bank was a major player. The increase of the share of Time Deposits at Mibanco is noteworthy and primarily attributable to a returned of funds from retail clients and secondarily, to the bank’s successful strategy to capture stable funds.
It is noteworthy, in a context of higher interest rates, BCP leads the market share of low-cost deposits in the Peruvian financial system.
03 Interest-earning assets (“IEAs”) and Funding
| | | |
| | At the end of 2Q22 IEAs dropped 3.1% YoY, due to a decrease in cash and due from banks and investment’s balances, which was partially offset by growth in structural loans. The decrease in cash and due from banks reflects the drop in the liquidity level of the banking system, the use of liquid assets to fund loan growth and the fact that dividend payments were made this quarter. Investments fell 17.2% YoY, mainly due to the expiration of CDs, which were not renewed. The latter was aimed to maintain liquidity in a context of loan growth but with a reduced funding balance. Structural loans increased 14.1% YoY, driven by growth in economic activity and in client consumption. YoY, funding fell 4.6%, spurred by lower balances of BCRP instruments and the utilization of deposits balances by clients, which impacted our low-cost funding base (core deposits). | |
| | | |
3.1. IEAs
| Interest Earning Assets | As of | % change |
| S/000 | Jun 21 | Mar 22 | Jun 22 | QoQ | YoY |
| Cash and due from banks | 29,058,684 | 29,560,067 | 23,644,089 | -20.0% | -18.6% |
| Interbank funds | 16,790 | 3,445 | 187,376 | 5339.1% | 1016.0% |
| Total investments | 54,772,644 | 48,145,429 | 45,342,775 | -5.8% | -17.2% |
| Cash collateral, reverse repurchase agreements and securities borrowing | 1,616,654 | 1,516,855 | 2,046,209 | 34.9% | 26.6% |
| Financial assets designated at fair value through profit or loss | 921,851 | 856,337 | 765,195 | -10.6% | -17.0% |
| Total loans | 143,091,752 | 144,621,513 | 150,370,184 | 4.0% | 5.1% |
| Total interest earning assets | 229,478,375 | 224,703,646 | 222,355,828 | -1.0% | -3.1% |
QoQ, IEAs fell 1.0%. This evolution was triggered by a decrease in balances cash and due from banks and investments, which was partially offset by loan growth.
The decline in cash and due from banks was associated with (i) a system-wide decrease in liquidity levels due to amortizations of government program (GP) loans, (ii) the use of liquid assets to fund loan growth, and (iii) Credicorp’s dividend payment. The decrease in investments was attributable to the expiration of certificates of deposits, which were not renewed to maintain liquidity in a climate marked by both loan growth and a decrease in the funding base.
Loans grew 4.0%, spurred by mixed dynamics, where growth was influenced by an exchange rate effect on our dollar-denominated portfolio, and by amortizations in GP loans. If we isolate the exchange rate effect and the effect of variation in the GP loan balance, structural loans grew 4.9%, driven by better dynamics at both the wholesale and retail portfolios.
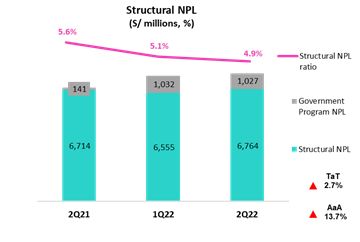
YoY, IEAs fell 3.1%. This decline was spurred by the same factors identified in the quarterly analysis, but the YoY evolution reflects a larger reduction of investment balances, which was attributable to (i) a drop in the company and system-wide liquidity levels due to the decrease in GP loan balances following amortizations and to (ii) strategies to reduce the portfolio duration. Structural loans rose 14.1% in line with post-pandemic economic recovery while government loans fell 42.0%.
3.2. Funding
| Funding | As of | | | % change | |
| S/ 000 | Jun 21 | Mar 22 | Jun 22 | QoQ | YoY |
| Deposits and obligations | 149,161,803 | 147,915,964 | 147,440,575 | -0.3% | -1.2% |
| Due to banks and correspondents | 6,239,161 | 6,362,990 | 6,456,360 | 1.5% | 3.5% |
| BCRP instruments | 23,329,990 | 17,532,350 | 16,031,618 | -8.6% | -31.3% |
| Repurchase agreements | 1,276,678 | 1,218,028 | 1,340,423 | 10.0% | 5.0% |
| Bonds and notes issued | 16,951,481 | 16,044,671 | 16,579,674 | 3.3% | -2.2% |
| Total funding | 196,959,113 | 189,074,003 | 187,848,650 | -0.6% | -4.6% |
QoQ, funding fell 0.6% mainly due to a decrease in the BCRP instrument volume, which was attributable to amortizations of GP loans. YoY, funding fell 4.6%. This evolution was driven primarily by amortizations of GP loans and by moves by retail and wholesale clients to use account balances.
04 Net Interest Income (NII)
| | | |
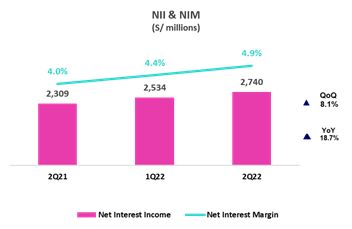
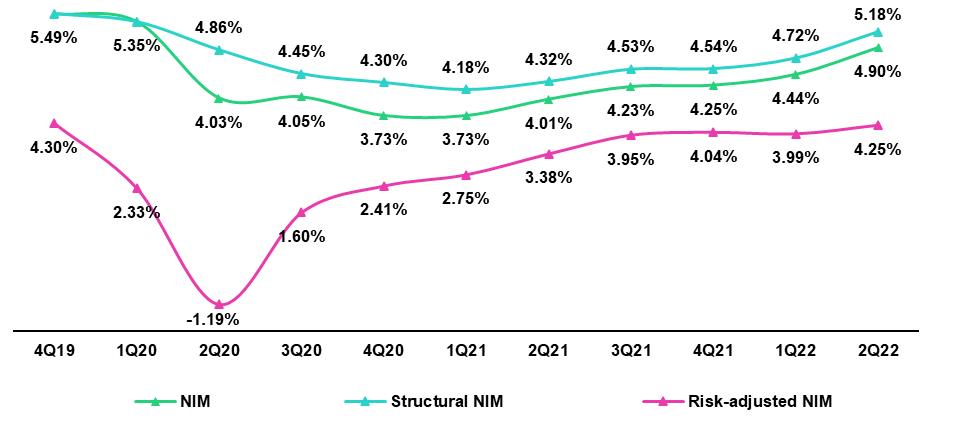
| | In 2Q22, Net Interest Income continued to recover. This evolution was attributable to the fact that loans ─our highest yielding asset─ reported strong growth, which was accompanied by our effective repricing strategies. It is worth mentioning that the volume dynamics explained in the IEAs section led to a higher yielding IEA mix. These factors offset the negative effect generated by an increase in the funding cost that was driven by higher interest rates and by a decrease in low-cost funding sources which negatively impacted the funding mix. At the end of 2Q22, 56% of the funding base was composed of low-cost deposits. In this context, the Net Interest Margin in 2Q22 rose 46bps QoQ and 89bps YoY to stand at 4.90% while the Structural Net Interest Margin stood at 5.18% (+46bps QoQ, +86pbs YoY). | |
| | | |
| Net Interest Income / Margin | Quarter | | | % change | As of | | % change |
| S/ 000 | 2Q21 | 1Q22 | 2Q22 | QoQ | YoY | Jun 21 | Jun 22 | Jun 22 / Jun 21 |
| Interest Income | 2,891,579 | 3,172,346 | 3,488,113 | 10.0% | 20.6% | 5,707,652 | 6,660,459 | 16.7% |
| Interest Expense | 582,537 | 638,256 | 747,673 | 17.1% | 28.3% | 1,275,227 | 1,385,929 | 8.7% |
| Net Interest Income | 2,309,042 | 2,534,090 | 2,740,440 | 8.1% | 18.7% | 4,432,425 | 5,274,530 | 19.0% |
| | | | | | | | | |
| Balances | | | | | | | | |
| Average Interest Earning Assets (IEA) | 230,237,853 | 228,195,289 | 223,529,737 | -2.0% | -2.9% | 227,052,978 | 227,021,380 | 0.0% |
| Average Funding | 197,108,681 | 192,347,695 | 188,461,327 | -2.0% | -4.4% | 194,215,081 | 191,735,019 | -1.3% |
| | | | | | | | | |
| Yields | | | | | | | | |
| Yield on IEAs | 5.02% | 5.56% | 6.24% | 68bps | 122bps | 5.03% | 5.87% | 84bps |
| Cost of Funds | 1.18% | 1.33% | 1.59% | 26bps | 41bps | 1.31% | 1.45% | 14bps |
| Net Interest Margin (NIM) | 4.01% | 4.44% | 4.90% | 46bps | 89bps | 3.90% | 4.65% | 75bps |
| Risk-Adjusted Net Interest Margin | 3.38% | 3.99% | 4.25% | 26bps | 87bps | 3.09% | 4.10% | 101bps |
| Peru's Reference Rate | 0.25% | 4.00% | 5.50% | 150bps | 525bps | 0.25% | 5.50% | 525bps |
| FED funds rate | 0.25% | 0.50% | 1.75% | 125bps | 150bps | 0.25% | 1.75% | 150bps |
Net Interest Income rose 8.1% QoQ, 18.7% YoY during the quarter and 19.0% YTD as of the end of June given that growth in income outpaced the increase registered in expenses in a context marked by rising interest rates, on-going growth in structural loans, and a drop in low-yield assets. The positive evolution of interest income offset growth in expenses, which was attributable to an uptick in passive rates and a reduction in low-cost funding. In this scenario, NIM grew 46pbs QoQ, 89bps YoY and 75bps YTD to stand at 4.90% in 2Q22 and 4.65% YTD at the end of June.
For more information on interest income and interest expenses by segment, see annex 12.3.
Structural NIM registered an uptick in recovery, driven by a higher-yield balance structure and the positive price effect generated by an increase in interest rates and active yield management strategies. This dynamic also explains the evolution of the Risk-Adjusted NIM, which stood at 4.25% this quarter, very close to pre-pandemic levels.
To analyze the evolution of Net Interest Income, it is important to differentiate dynamics by currency given that the trends for volumes and variations in market rates vary for each. The reference rate in LC (BCRP) increased 150bps QoQ and 375bps YoY while the FC rate (FED funds rate) rose 125bps QoQ and 150 bps YoY.
04. Net Interest Income (NII)
|
Dynamics of Net Interest Income by Currency
| Interest Income / IEA | 2Q21 | 1Q22 | 2Q22 | | Jun 21 | Jun 22 |
| S/ millions | Average | | | Average | | | Average | | | | Average | | | Average | | |
| | Balance | Income | Yields | Balance | Income | Yields | Balance | Income | Yields | | Balance | Income | Yields | Balance | Income | Yields |
| Cash and equivalents | 30,485 | 6 | 0.1% | 30,979 | 35 | 0.5% | 26,697 | 48 | 0.7% | | 28,826 | 14 | 0.1% | 28,113 | 83 | 0.6% |
| Other IEA | 2,598 | 16 | 2.4% | 2,557 | 19 | 2.9% | 2,592 | 14 | 2.2% | | 2,878 | 25 | 1.7% | 2,777 | 33 | 2.4% |
| Investments | 57,093 | 394 | 2.8% | 48,549 | 433 | 3.6% | 46,744 | 497 | 4.2% | | 54,973 | 760 | 2.8% | 47,148 | 929 | 3.9% |
| Loans | 140,061 | 2,476 | 7.1% | 146,109 | 2,686 | 7.4% | 147,496 | 2,930 | 7.9% | | 140,376 | 4,909 | 7.0% | 148,984 | 5,615 | 7.5% |
| Structural | 116,439 | 2,397 | 8.2% | 128,597 | 2,619 | 8.1% | 132,651 | 2,871 | 8.7% | | 116,557 | 4,744 | 8.1% | 132,982 | 5,490 | 8.3% |
| Government Programs | 23,622 | 79 | 1.3% | 17,513 | 66 | 1.5% | 14,845 | 59 | 1.6% | | 23,819 | 165 | 1.4% | 16,002 | 125 | 1.6% |
| Total IEA | 230,238 | 2,892 | 5.0% | 228,195 | 3,172 | 5.6% | 223,530 | 3,488 | 6.2% | | 227,053 | 5,708 | 5.0% | 227,021 | 6,660 | 5.9% |
| IEA (LC) | 59.9% | 75.7% | 6.4% | 57.8% | 78.8% | 7.6% | 58.6% | 78.2% | 8.3% | | 60.5% | 75.9% | 6.3% | 57.2% | 78.5% | 8.1% |
| IEA (FC) | 40.1% | 24.3% | 3.0% | 42.2% | 21.2% | 2.8% | 41.4% | 21.8% | 3.3% | | 39.5% | 24.1% | 3.1% | 42.8% | 21.5% | 2.9% |
| Interest Expense / Funding | 2Q21 | 1Q22 | 2Q22 | | Jun 21 | Jun 22 |
| S/ millions | Average | | | Average | | | Average | | | | Average | | | Average | | |
| | Balance | Expense | Yields | Balance | Expense | Yields | Balance | Expense | Yields | | Balance | Expense | Yields | Balance | Expense | Yields |
| Deposits | 148,894 | 210 | 0.6% | 149,128 | 259 | 0.7% | 147,678 | 337 | 0.9% | | 145,764 | 433 | 0.6% | 148,891 | 596 | 0.8% |
| BCRP + Due to Banks | 29,589 | 101 | 1.4% | 25,400 | 116 | 1.8% | 23,192 | 142 | 2.4% | | 30,641 | 213 | 1.4% | 24,697 | 258 | 2.1% |
| Bonds and Notes | 17,407 | 179 | 4.1% | 16,562 | 165 | 4.0% | 16,312 | 168 | 4.1% | | 16,635 | 446 | 5.4% | 16,829 | 334 | 4.0% |
| Others | 1,218 | 92 | 30.3% | 1,257 | 98 | 31.1% | 1,279 | 101 | 31.5% | | 1,175 | 183 | 31.2% | 1,318 | 198 | 30.1% |
| Total Funding | 197,109 | 583 | 1.2% | 192,348 | 638 | 1.3% | 188,461 | 748 | 1.6% | | 194,215 | 1,275 | 1.3% | 191,735 | 1,386 | 1.4% |
| Funding (LC) | 54.5% | 48.6% | 1.1% | 51.4% | 53.6% | 1.4% | 51.4% | 58.4% | 1.8% | | 55.5% | 45.5% | 1.1% | 51.0% | 56.2% | 1.6% |
| Funding (FC) | 45.5% | 51.4% | 1.3% | 48.6% | 46.4% | 1.3% | 48.6% | 41.6% | 1.4% | | 44.5% | 54.5% | 1.6% | 49.0% | 43.8% | 1.3% |
| | | | | | | | | | | | | | | | | |
| NIM | 230,238 | 2,309 | 4.0% | 228,195 | 2,534 | 4.4% | 223,530 | 2,740 | 4.9% | | 227,053 | 4,432 | 3.9% | 227,021 | 5,275 | 4.6% |
| NIM (LC) | 59.9% | 82.5% | 5.5% | 57.8% | 85.1% | 6.5% | 58.6% | 83.7% | 7.0% | | 60.5% | 84.6% | 2.7% | 57.2% | 84.4% | 3.4% |
| NIM (FC) | 40.1% | 17.5% | 1.7% | 42.2% | 14.9% | 1.6% | 41.4% | 16.3% | 1.9% | | 39.5% | 15.4% | 0.8% | 42.8% | 15.6% | 0.8% |
QoQ analysis
QoQ, Net Interest Income rose 8.1%. This evolution was driven primarily by the dynamics of IEAs in LC and by Peru’s reference rate. IEAs in LC represent 59% of total IEAs and account for 84% of the Net Interest Margin generated in 2Q22.
Local Currency Dynamics (LC)
Net Interest Income in LC rose 6.3%, product of the fact that growth in interest income outpaced the increase reported for expenses due to the following dynamics:
Average IEAs in LC fell slightly and registered mixed variations in their components. Average structural loans grew 3.8% while liquid assets, investments and government program loans (GP) dropped. The movements in these accounts generated a higher-yield IEA mix in LC. Yields on components of IEA in LC increased, mainly for our loans and investments, which reflects the increase in Peru’s reference rate and our active yield management strategies. Yields of IEAs in LC rose from 7.6% in 1Q22 to 8.3% in 2Q22. Accordingly, the key factors that contributed to a 9.2% increase in interest income in LC were price and mix effects.
Average funding in LC fell 2.1%, driven by a decrease in the volumes of BCRP instruments and deposits after GP loans were amortized. Within the deposit mix, funds from demand deposits and savings deposits (both low cost) migrated to time deposits, which entail higher costs and led the funding cost to rise. The funding cost in LC rose from 1.4% in 1Q21 to 1.8% in 2Q22, driven primarily by an increase in market rates, which subsequently impacted wholesale banking deposits and funding sources. Interest expenses in LC increased 27.5% due to negative price and mix effects.
Dynamics in Foreign Currency (FC)
Net Interest Income in FC rose 18.9% due to the following dynamics:
Average IEA in FC fell 3.9%, spurred by a decrease in the balance for liquid assets and investments. This drop was partially offset by loan growth, where wholesale segments drove demand. The aforementioned dynamic generated a higher-yield mix of IEAs in FC. FC rates increased slightly, in line with growth in the FED’s funds rate. Higher yields and a favorable evolution of the IEA mix led interest income in FC to rise 12.8%.
Average funding in FC dropped 1.9%, spurred by income tax regularization payments, which impacted account balances, and the fact that wholesale funding registered a decrease. The cost of funding this quarter rose due to interest rate hikes in US Dollars. In this context, interest expenses in FC rose 5.1%.
04. Net Interest Income (NII)
|
YoY Analysis
YoY, Net Interest Income rose 18.7%, driven primarily by the evolution of IEAs and of LC rates.
Dynamics in Local Currency (LC)
Net Interest Income in LC rose 20.3% YoY in tandem with the following dynamics:
Average IEA in LC fell 5.0% YoY due to the following:
| | • | Average structural loans grew 20.3% after origination levels rose in Wholesale Banking, Retail Banking and Microfinance; |
| | • | Average balances of government programs fell 37.2% due to loan amortization; |
| | • | Investments fell after certificates of deposits were not renewed to maintain liquidity to fund loan growth, and sales of sovereign bonds to reduce the portfolio’s duration; and |
| | • | Available funds fell due to a drop in liquidity in the system; dividends distribution; and a reduction in retail funding. |
Movements in these accounts led to a higher-yield IEA mix in LC. Yields on assets with shorter maturities (Available funds and Short-term Investments) increased due to upward shifts in the reference rate, which led market rates in LC to rise. Additionally, our loan portfolio has benefitted from higher yields through effective repricing strategies. Combined, these effects boosted the yield of IEA in LC, which rose from 6.4% in 2Q21 to 8.3% in 2Q22. In this context, income in LC increased 24.7%, driven by an uptick in the volume of structural loans and by a positive price effect across IEAs.
Average funding in LC fell 9.9% due to lower balances of BCRP Instruments and low-cost deposits, in line with our clients’ amortizations of Reactiva loans.
Yields on LC funding sources increased, in particular for interest-bearing deposits and BCRP Instruments, in line with the increase in the reference rate. The cost of funds in LC rose from 1.1% in 2Q21 to 1.8% in 2Q22. Due the price effect, interest expenses in LC increased 54.1%.
Dynamics in Foreign Currency (FC)
Net Interest Income in FC grew 11.1%, which was driven by the following dynamics:
Average IEA in FC remained stable given that the drop in investments was offset by an uptick in structural loans. This generated a positive mix effect on the IEA yield.
The IEA yield in FC rose from 3.0% in 2Q21 to 3.3% in 2Q22 due to the mix effect described above and to a slight increase in yields on liquid assets. Positive volume and price effects led FC income to rise 8.1%.
Average funding in FC rose 2.1%, which was attributable to an increase in savings deposits after clients migrated to the US dollar as a refuge in a context marked by exchange rate volatility. The FC funding cost rose from 1.3% in 2Q21 to 1.4% in 2Q22, in line with an increase in FC rates. Interest expenses in FC grew 4.0%, which was primarily attributable to an increase in passive rates.
YTD analysis
In the YTD analysis, Net interest Income rose 19%. The drivers of this growth were the same as those that drove the YoY evolution.
| | | |
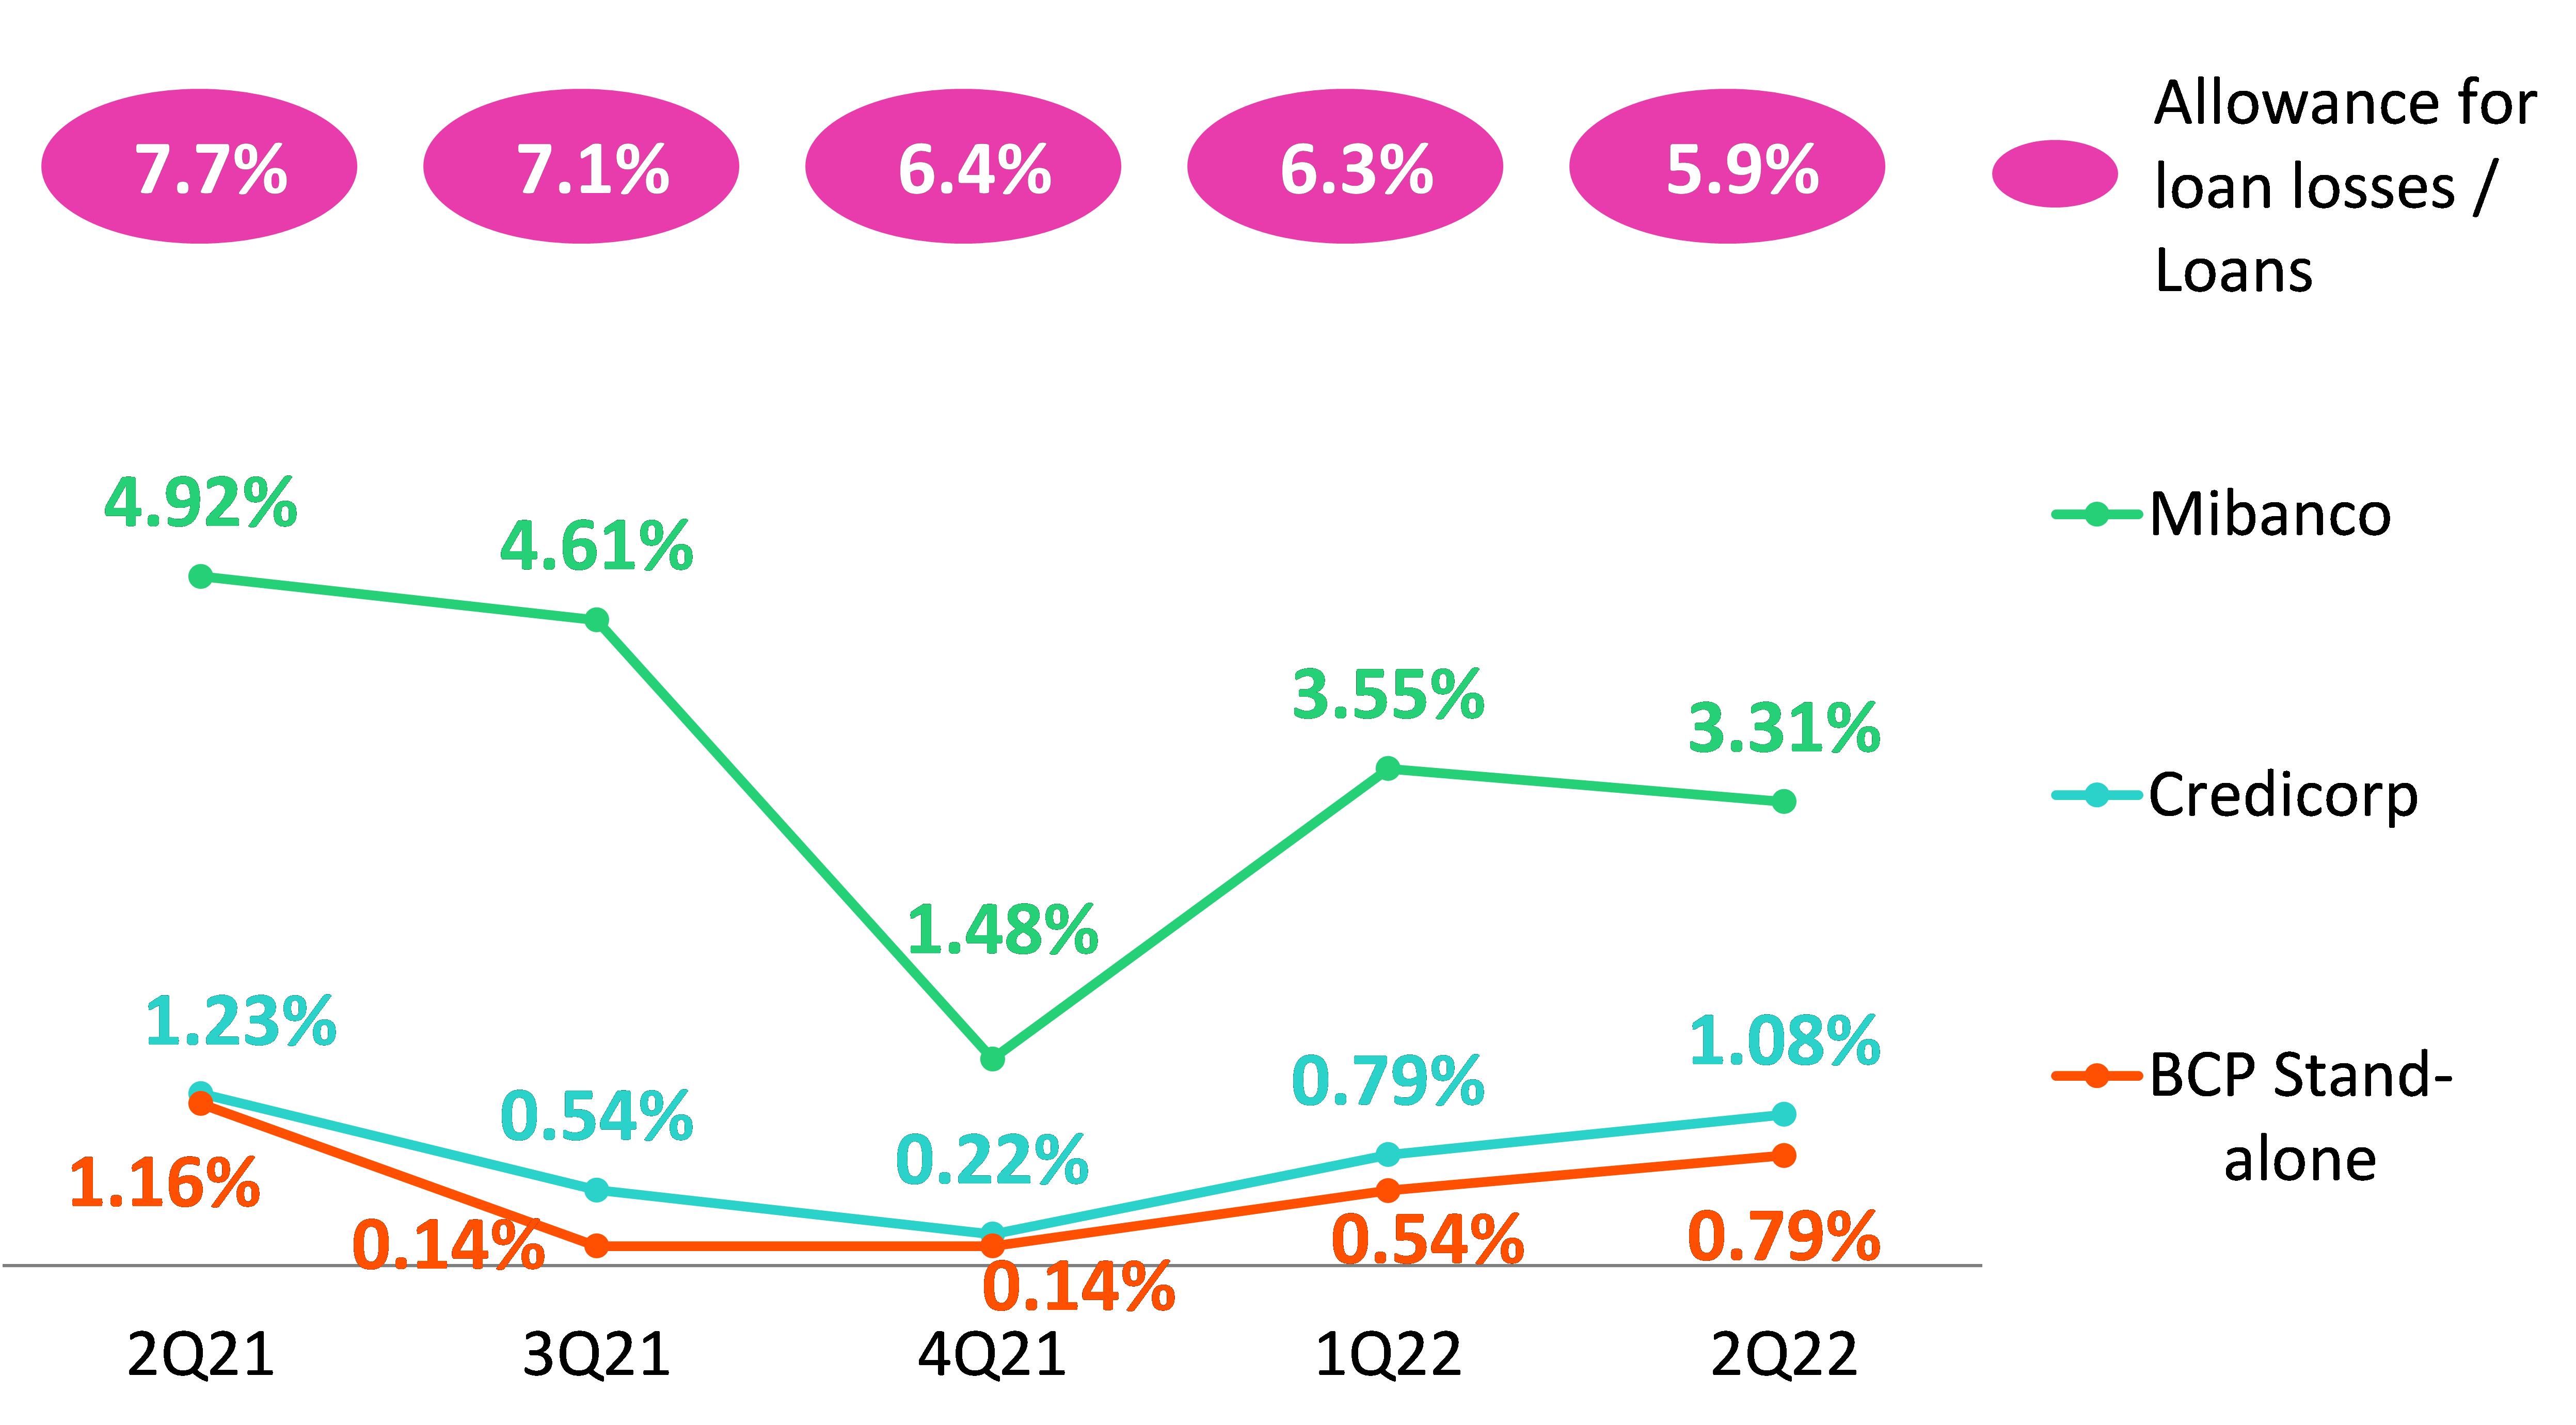
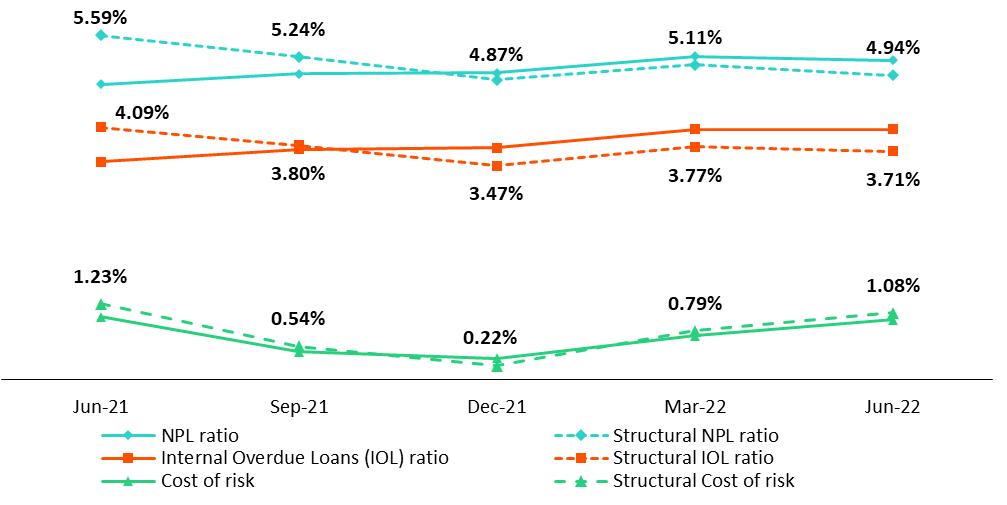
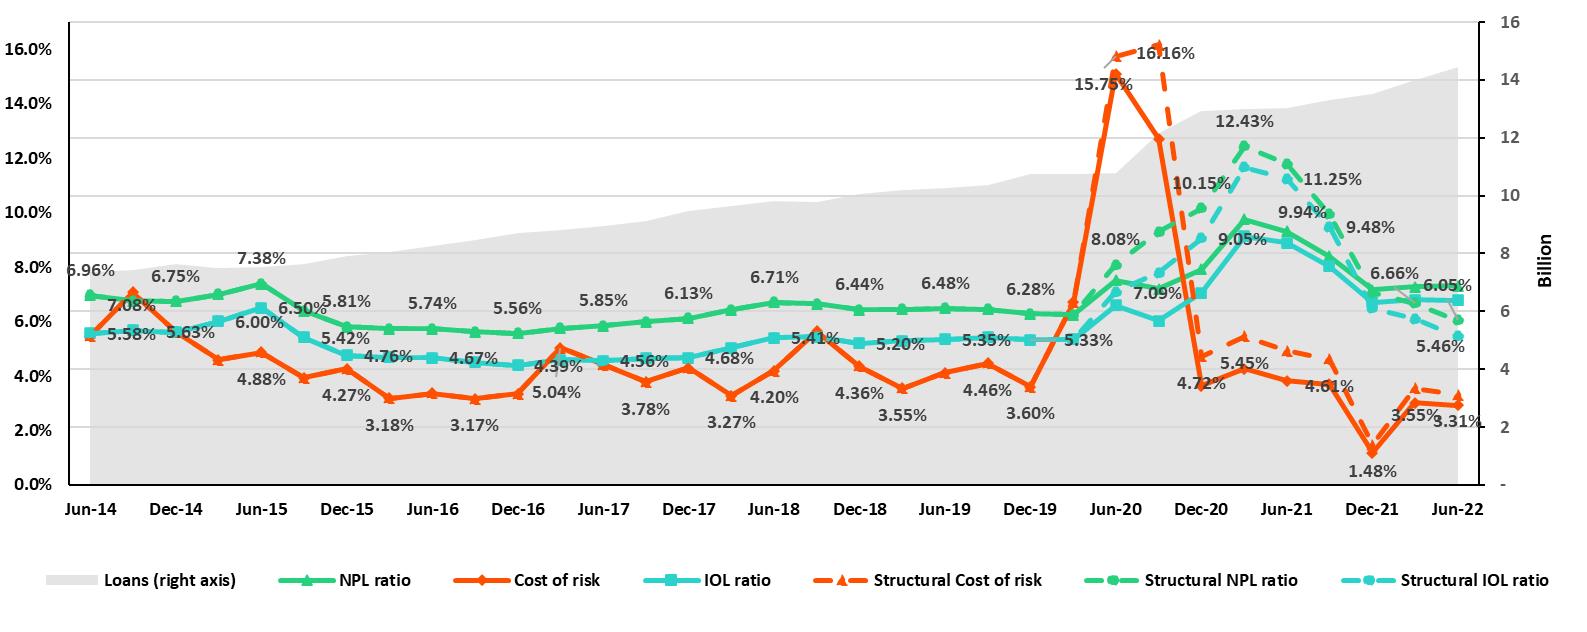
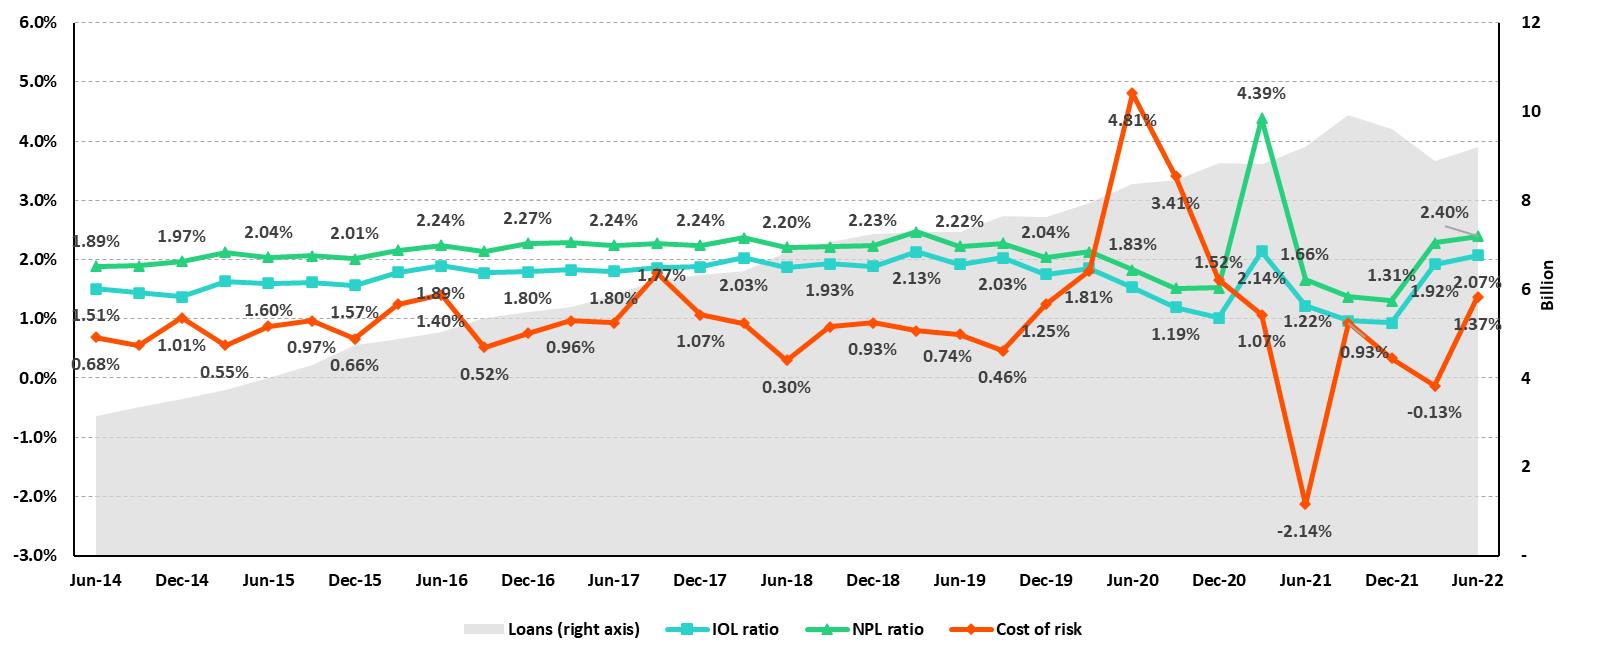
| | Structural provisions remain below pre-pandemic levels. Nonetheless, provisions increased QoQ due to the deterioration of economic projections. Growth in expenses was primarily driven by the Individuals segment at BCP Stand-alone and by BCP Bolivia and to a lesser extent by a reduction in recoveries of written-off loans. YoY, structural Provisions remained stable, given that higher expenses at BCP Bolivia were offset by a decrease at BCP Stand-alone and Mibanco.
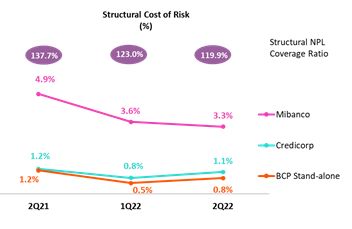
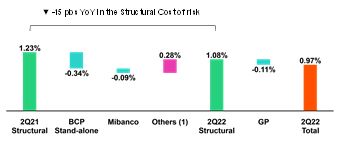
The Structural Cost of Risk (CoR) stood at 1.08% in 2Q22. This quarter, the increase in provisions was offset by Loan growth. YTD, the reduction in provisions was attributable to our prudent management during the pandemic. Currently, CoR is situated in the inferior range of our guidance. | |
| | | |
Provisions(1) and Cost of Risk (CoR) of the Structural Portfolio
| Structural Loan Portfolio Provisions | Quarter | % change | As of | % change |
| S/ 000 | 2Q21 | 1Q22 | 2Q22 | QoQ | YoY | Jun 21 | Jun 22 | Jun 22 / Jun 21 |
| Gross provision for credit losses on loan portfolio | (446,508) | (346,809) | (453,605) | 30.8% | 1.6% | (1,053,509) | (800,414) | -24.0% |
| Recoveries of written-off loans | 77,627 | 93,091 | 83,745 | -10.0% | 7.9% | 142,962 | 176,836 | 23.7% |
| Provision for credit losses on loan portfolio, net of recoveries | (368,881) | (253,718) | (369,860) | 45.8% | 0.3% | (910,547) | (623,578) | -31.5% |
Structural Cost of risk (1) | 1.23% | 0.79% | 1.08% | 29 bps | -15 bps | 1.52% | 0.91% | -61 bps |
(1) Annualized Provision for credit losses on loan portfolio, net of recoveries.
(2) The Structural Cost of risk excludes the Provisions for credit losses on loan portfolio, net of recoveries and Total Loans from the Reactiva Peru and FAE Government Programs.
QoQ structural Provisions increased, which was mainly attributable to the evolution at BCP Stand-alone. Notably, the structural Cost of Risk remains within the Guidance range. The segments that pushed the ratio upwards were:
| • | Individuals: mainly Consumer and Credit Card (CC) after the macroeconomic variables of our models were updated to reflect the deterioration in real and projected indicators (such as GDP and inflation), which led real and forward-looking risk to increase for low-income clients. Additionally, the increase in Credit Cards was triggered by a change in the portfolio mix, where the share of “revolving” vs “total payers” clients rose. The Mortgage segment also registered an expansion in provisions due to an increase in client risk; and |
| • | BCP Bolivia: due to grace periods expirations; debt forgiveness and charge-offs, which reached historic levels; together with an exchange rate effect. In line with grace periods expirations, we expect a normalization of provisions during the 2H22, given that most of the delinquency from reprogrammed operations was already materialized in the first half of the year. |
The above was partially attenuated by a reduction in provisions for Wholesale Banking at BCP Stand-alone, which was mainly driven by a base effect from 1Q21, when methodological adjustments were made to models. The drop in was attributable to SMEs at BCP Stand-alone, which registered an improvement in payment behavior among a specific set of clients. Mibanco also registered a decrease in provisions, albeit comparatively lower, due to positive payment behavior. However, we expect expenses at Mibanco to increase in 2H22 due to a less favorable macroeconomic context.
Structural Cost of Risk by Subsidiary
YoY, the structural provisions increased slightly, while the structural CoR fell 15 bps due to a denominator effect. Within the main variations, the following stood out: |
| • | Bolivia: growth in provisions for approximately S/80 million was primarily driven by the base effect given that in 2Q21, historically low levels of provisions were reported due to reversals after the Bank required clients in the Consumer segment to provide collateral against loans. |
The aforementioned was offset by a drop in provisions expenses in Individuals and Wholesale Banking at BCP Stand-alone and, to a lesser extent, by a drop in expenses at Mibanco after methodological adjustments were made to its models to reflect variations in payment behavior. In Individuals, the reduction was driven by a base effect in 2Q21, when extraordinary provisions were set aside for Mortgage loans. In Wholesale Banking, the reduction was spurred by a drop in the balance of Stage 3 loans of specific clients. At Mibanco, the decline was attributable to a decrease in volumes of written-off loans.
Provisions and CoR in the Government Loan Portfolio (PG)
| GP Loan Portfolio Provisions | Quarter | % change | As of | % change |
| S/ 000 | 2Q21 | 1Q22 | 2Q22 | QoQ | YoY | Jun 21 | Jun 22 | Jun 22 / Jun 21 |
| Gross provision for credit losses on loan portfolio | 5,501 | (3,872) | 6,569 | -269.6% | 19.4% | (10,480) | 2,697 | -125.7% |
| Recoveries of written-off loans | - | - | - | - | - | - | - | - |
| Provision for credit losses on loan portfolio, net of recoveries | 5,501 | (3,872) | 6,569 | -269.6% | 19.4% | (10,480) | 2,697 | -125.7% |
GP Cost of risk (1) | -0.10% | 0.09% | -0.20% | -29 bps | -10 bps | 0.09% | -0.04% | -13 bps |
(1) The GP Cost of risk includes the Provisions for credit losses on loan portfolio, net of recoveries and Total Loans from the Reactiva Peru and FAE Government Programs.
GP Provisions fell QoQ after more honoring processes of state-backed guarantees were executed and the portfolio registered lower levels of deterioration, particularly in SME-Pyme. YoY, the drop reflects an uptick in amortizations and effective execution of honoring processes.
The GP Allowances for loan losses represents 2% of the total Allowances balance at Credicorp. This volume reflects the fact that state-backed coverage of GP loans is significant (loan coverage between 80% to 98%). For more information, see 1.2 Portfolio Quality – NPL Portfolio of Government Loans.
Provisions and CoR of Total Portfolio
| Loan Portfolio Provisions | Quarter | % change | As of | % change |
| S/ 000 | 2Q21 | 1Q22 | 2Q22 | QoQ | YoY | Jun 21 | Jun 22 | Jun 22 / Jun 21 |
| Gross provision for credit losses on loan portfolio | (441,007) | (350,681) | (447,036) | 27.5% | 1.4% | (1,063,989) | (797,717) | -25.0% |
| Recoveries of written-off loans | 77,627 | 93,091 | 83,745 | -10.0% | 7.9% | 142,962 | 176,836 | 23.7% |
| Provision for credit losses on loan portfolio, net of recoveries | (363,380) | (257,590) | (363,291) | 41.0% | 0.0% | (921,027) | (620,881) | -32.6% |
Cost of risk (1) | 1.02% | 0.71% | 0.97% | 26 bps | -5 bps | 1.29% | 0.83% | -46 bps |
(1) Annualized Provision for credit losses on loan portfolio, net of recoveries / Total Loans.
The analysis of structural and GP loans shows that the CoR for the total portfolio rose 26bps QoQ and dropped -5bps YoY. The impact of GP loans, which stood at 11 bps, was attributable to a denominator effect, in line with amortizations of GP loans.
QoQ Evolution of the Cost of Risk

(1) Others include BCP Bolivia, Mibanco Colombia, ASB Bank Corp and eliminations.
YoY Evolution of the Cost of Risk
(1) Others include BCP Bolivia, Mibanco Colombia, ASB Bank Corp and eliminations.
| | | |
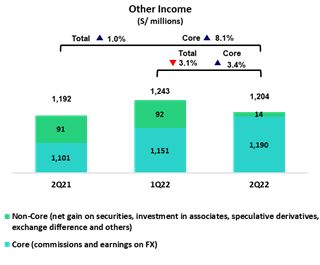
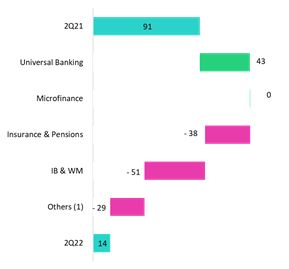
| | Other core income rose maintains a growing trend driven by growth in fees in a context marked by an uptick in transactions and higher on-going FX volatility.
Non-core other income fell due to Net losses on securities. These losses were driven by higher volatility in the stock markets, which negatively affected investments at Credicorp Stand-alone, Prima, ASB and Pacífico. | |
| | | |
6.1 Other core income
| Core Other Income | Quarter | % Change | As of | % Change |
| (S/ 000) | 2Q21 | 1Q22 | 2Q22 | QoQ | YoY | Jun 21 | Jun 22 | Jun 22/ Jun 21 |
| Fee income | 862,411 | 891,031 | 920,492 | 3.3% | 6.7% | 1,693,182 | 1,811,523 | 7.0% |
| Net gain on foreign exchange transactions | 238,440 | 259,710 | 269,059 | 3.6% | 12.8% | 413,251 | 528,769 | 28.0% |
| Total other income Core | 1,100,851 | 1,150,741 | 1,189,551 | 3.4% | 8.1% | 2,106,433 | 2,340,292 | 11.1% |
The upward trend in
other core income continued. This positive evolution was led by BCP Stand-alone, which registered an increase in fee income due to an uptick in digital transactions, which reflected on-going migration from traditional to digital channels, and growth in POS use. In this context, cashless transactions represented 43% of the transaction amount at the end of June. Mibanco also reported an increase in fee income, which was driven primarily by growth in insurance sales and secondarily by a decrease in in fees paid to commercial partners. The aforementioned was partially offset by a drop in fee income from mutual funds, after extraordinary income from entry to third-party funds through international platforms were reported in 2Q21. Gains of foreign exchange transactions continued to trend upward due to growth in transaction volumes and an uptick in exchange rate volatility.
Fee income by banking business
Composition of fee income by banking business
| Banking Business Fees | Quarter | % Change | As of | % Change |
| S/ 000 | 2Q21 | 1Q22 | 2Q22 | TaT | AaA | Jun 21 | Jun 22 | Jun 22 / Jun 21 |
Payments and transactionals (1) | 234,282 | 290,197 | 306,095 | 5.48% | 30.65% | 460,039 | 596,292 | 29.62% |
Liability accounts (2) | 207,005 | 217,956 | 234,038 | 7.38% | 13.06% | 624,606 | 692,623 | 10.89% |
Loan Disbursement (3) | 88,473 | 90,576 | 91,940 | 1.51% | 3.92% | 575,178 | 634,510 | 10.32% |
| Off-balance sheet | 60,592 | 60,370 | 59,304 | -1.77% | -2.13% | 286,081 | 302,190 | 5.63% |
| Mibanco (Peru and Colombia) | 16,713 | 33,276 | 35,190 | 5.75% | 110.56% | 160,252 | 188,140 | 17.40% |
| Insurances | 26,897 | 30,303 | 28,823 | -4.88% | 7.16% | 93,882 | 127,592 | 35.91% |
| BCP Bolivia | 30,558 | 27,400 | 25,470 | -7.04% | -16.65% | 119,176 | 111,996 | -6.02% |
| Wealth Management and Corporate Finance | 21,590 | 18,785 | 18,126 | -3.51% | -16.04% | 98,537 | 89,781 | -8.89% |
| ASB | 11,202 | 12,280 | 9,483 | -22.78% | -15.34% | 57,784 | 58,674 | 1.54% |
Others (4) | 9,407 | 4,596 | -1,145 | -124.91% | -112.17% | 42,566 | 25,214 | -40.77% |
| Total | 706,719 | 785,739 | 807,324 | 2.75% | 14.24% | 2,518,100 | 2,827,012 | 12.27% |
(1) Corresponds to fees from: credit and debit cards; payments and collections.
(2) Corresponds to fees from: Account maintenance, interbank transfers, national money orders y international transfers.
(3) Corresponds to fees from retail and wholesale loan disbursements.
(4) Use of third-party network, other services to third parties and Commissions in foreign branches.
Fees for banking services registered maintain a growing trend due to:
| | • | Economic reactivation in Peru as well as growth in digital transactions and an uptick in the use of POS, both of which were reflected an increase in fee paying transactions. In the aforementioned context, credit and debit cards registered growth of 32% and 118% year over year respectively. |
| | • | Fees relative maintenance of deposits and for interbank transfers rose 51% year over year. |
| | • | Fees relative to loan disbursements rose, led by personal loans (+12% QoQ, +96% YoY and +72% YTD). In a context marked by an uptick in digital adoption, 71% of the personal loans were granted through digital channels. |
| | • | Growth in the fee level registered by Mibanco, which was driven by an uptick in sales of bancassurance; and in the level reported by Mibanco Colombia for microfinance fees, which was associated with an uptick in loan disbursements. |
The aforementioned was partially offset by an increase in fees relative to other networks use and other third-party services.
6.2 Other Non-Core income
| Non-core Other income | Quarter | % Change | As of | % Change |
| (S/ 000) | 2Q21 | 1Q22 | 2Q22 | QoQ | YoY | Jun 21 | Jun 22 | Jun 22/ Jun 21 |
| Net gain on securities | (69,947) | (56,866) | (94,180) | n.a. | n.a. | (53,660) | (151,046) | 181.5% |
Net gain from associates (1) | 12,302 | 24,014 | 29,219 | 21.7% | 137.5% | 41,707 | 53,233 | 27.6% |
| Net gain on derivatives held for trading | 52,606 | (5,982) | 12,304 | n.a. | -76.6% | 131,153 | 6,322 | -95.2% |
| Net gain from exchange differences | 32,959 | (17,060) | (17,066) | 0.0% | -151.8% | 23,677 | (34,126) | -244.1% |
| Other non-financial income | 62,923 | 147,902 | 84,152 | -43.1% | 33.7% | 136,914 | 232,054 | 69.5% |
| Total other income Non-Core | 90,843 | 92,008 | 14,429 | -84.3% | -84.1% | 279,791 | 106,437 | -62.0% |
| (1) | Includes net income from other investments, mainly from the result of Banmedica. |
YoY evolution of other non-core income
(thousands of soles)
(1)Others includes Grupo Credito, Credicorp Stand-alone, eliminations y others.
YTD evolution of other non-core income
(thousands of soles)
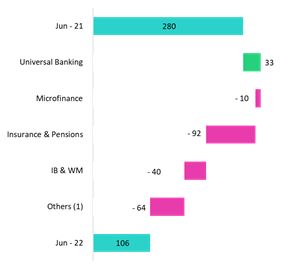
Other non-core income fell driven primarily by to the negative results reported for the Net loss on securities in a context impacted by higher levels of volatility across stock markets this quarter. This volatility has mainly affected:
| • | Investments in mutual funds at Credicorp Stand-alone, |
| • | International fixed-income portfolios at ASB and Credicorp Capital, |
| • | Investments that are part of Prima’s legal reserve; and |
| • | Fixed-income investments at Pacífico. |
In addition, YoY, other non-core income was affected by Net Loss on derivatives at BCP Stand-alone which maintains where these losses were offset by higher interest income on investments in fixed income in LC.
YTD, these losses were partially offset by extraordinary income at BCP Stand-alone, which was associated with tax refunds in 1Q22.
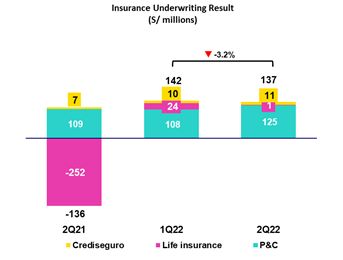
07 Insurance Underwriting Results
| | | |
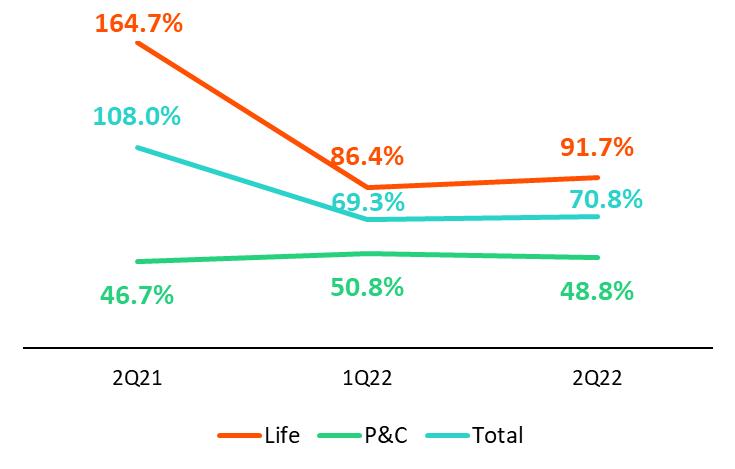
| | The insurance underwriting result registered a decrease of 3.2% QoQ. This result was driven by growth in claims in the life business attributable to higher cases reported and the negative effect of inflation, partially mitigated by an improvement in the results of the P&C business. In the YoY and YTD analysis, the underwriting result increased due to a drop in claims in the Life business associated with the improvement in the sanitary context. Net earned premiums also rose YoY and YTD in both the Life and P&C lines, which reflected economic reactivation. | |
| | | |
Insurance underwriting result (1) | Quarter | % change | As of | % change |
| S/ 000 | | 2Q21 | 1Q22 | 2Q22 | QoQ | YoY | Jun 2021 | Jun 2022 | 2022 / 2021 |
| Total | Net earned premiums | 639,944 | 690,536 | 695,547 | 0.7% | 8.7% | 1,283,872 | 1,386,083 | 8.0% |
| Net claims | (691,335) | (478,506) | (492,258) | 2.9% | -28.8% | (1,314,688) | (970,764) | -26.2% |
Acquisition cost (2) | (84,944) | (70,484) | (66,247) | -6.0% | -22.0% | (170,766) | (136,731) | -19.9% |
| Total insurance underwriting result | (136,335) | 141,546 | 137,042 | -3.2% | n.a. | (201,582) | 278,588 | n.a. |
| Loss Ratio | 108.0% | 69.3% | 70.8% | 150 pbs | -3720 pbs | 102.4% | 70.0% | -3240 pbs |
| Net earned premiums | 331,825 | 365,492 | 365,452 | 0.0% | 10.1% | 674,983 | 730,944 | 8.3% |
| Life | Net claims | (546,439) | (315,718) | (335,204) | 6.2% | -38.7% | (1,048,152) | (650,922) | -37.9% |
| | Loss Ratio | 164.7% | 86.4% | 91.7% | 530 pbs | -7300 pbs | 155.3% | 89.1% | -6620 pbs |
| Net earned premiums | 291,172 | 308,891 | 313,518 | 1.5% | 7.7% | 575,595 | 622,408 | 8.1% |
| P&C | Net claims | (135,982) | (156,851) | (153,046) | -2.4% | 12.5% | (250,114) | (309,897) | 23.9% |
| | Loss Ratio | 46.7% | 50.8% | 48.8% | -200 pbs | 210 pbs | 43.5% | 49.8% | 630 pbs |
(1) Includes the results of the Life, Property & Casualty and Crediseguros business.
(2) Includes net fees and underwriting expenses.
From a QoQ perspective, the underwriting result decreased. This was attributable to 6.2% growth in claims in the Life business, which was primarily attributable to higher cases reported in D&S and Credit Life, also the negative effect of inflation on Group Life particularly in Complementary Insurance for Occupational Risk (SCTR) product. It is important to note that this quarter, reported cases dropped and IBNR reserves for COVID-19 were released, which reflected the fact that the fourth wave of the pandemic has generated less severe impacts. This result was partially mitigated by growth in net earned premiums and a decrease in claims in P&C.
From a YoY perspective, the insurance underwriting result returned to positive terrain. This evolution was drive by the following factors:
| | • | A 38.7% decrease in claims in the Life business. This reflected the improvement in the sanitary situation and the fact that COVID-19 reserves were released in a context marked by advances in vaccination in 2Q22 versus 2Q21, when higher levels of excess mortality were reported; this was partially mitigated by an inflationary effect; |
| | • | Growth of 10.1% and 7.7% in net earned premiums in the Life and P&C businesses respectively associated with economic reactivation; and |
| | • | A drop of 22.0% in the acquisition cost, which was driven primarily by a drop in commissions after a contract in the alliance channel expired at the end of 2021 and to a lesser extent by a decrease in underwriting expenses in the P&C business. |
In YTD terms, Insurance Underwriting results rose specifically in the life business due to lower excess mortality from COVID-19 given the advance in vaccination process and to a lesser extent, the improvement in net earned premiums in both businesses associate to the economic reactivation.
07. Insurance Underwriting Results
|
Net Earned Premiums by Business
Net earned premiums in the Life Business (1)
(S/ millions)
Net Earned Premiums in P&C
(1)(S/ millions)
In the QoQ analysis, net earned premiums in the Life business remained stable. Growth in Credit Life stood out and was attributable to an uptick in sales through BCP and Mibanco. This effect was offset by a drop in Disability and Survivorship and Group Life. In P&C, net earned premiums rose 1.5%, which was primarily driven by growth in Cars and Medical Assistance.
In the YoY and YTD analysis, net premiums in the Life Insurance business reported growth of 10.1% and 8.3% respectively in (i) Credit Life, which was primarily associated with an increase in premiums through BCP and Mibanco and (ii) Group Life, in line with price adjustments and an uptick in new sales for the Complementary Insurance for Occupational Risk Product (SCTR). Net premiums rose in P&C, 7.7% YoY and 8.1% YTD, drive by: (i) Personal Lines, due to growth in sales for Card Protection products and Household Mortgages through Bancassurance channel, and (ii) Medical Assistance, which was associated with growth in sales for Oncological and Compensation Products.
The Total Loss Ratio stood at 70.8%, (+150 bps QoQ). This result was driven primarily by the Life business (+530 bps QoQ), which was in turn due to the evolution of (i) Group Life, where inflation impacted compensation for Complementary Insurance for Occupational Risk and (ii) Disability and Survivorship, due to an increase in cases. It is important to note that COVID-19 IBNR reserves were released in 2Q22, which reflected a drop in reported COVID-19 claims due to an improvement in the sanitary situation and the advances in the vaccination process.
The Loss Ratio in the P&C business fell 200 bps QoQ. This was primarily attributable to the evolution of Commercial Lines, which reported high claims frequency in the previous quarter, particularly in the Transportation and Machinery lines and (ii) Cars, which reported a drop in claims frequency in the business segment.
In the YoY and YTD analysis, the Total Loss Ratio improved due to a 28.8% and 26.2% reduction respectively in net claims primarily in the Life business. This was associated with a decrease in reported COVID-19 cases and to the release of IBNR COVID-19 reserves, in line with the positive evolution of the vaccination process.
It is important to mention that the negative impact of inflation on claims and the accumulation of technical reserves adjusted for constant purchasing power are counterbalanced by a positive impact on net interest income associated with the assets that back said claims and reserves.
1 Total premiums less premiums ceded to reinsurance and adjustments in constitution of technical reserves
07. Insurance Underwriting Results
|
Acquisition Cost
| Acquisition cost | Quarter | % change | As of | % change |
| S/ 000 | 2Q21 | 1Q22 | 2Q22 | QoQ | YoY | Jun 2021 | Jun 2022 | 2022 / 2021 |
| Net fees | (53,808) | (39,875) | (39,352) | -1.3% | -26.9% | (109,413) | (79,227) | -27.6% |
| Underwriting expenses | (31,842) | (31,286) | (27,943) | -10.7% | -12.2% | (63,399) | (59,230) | -6.6% |
| Underwriting income | 706 | 678 | 1,047 | 54.5% | 48.5% | 2,045 | 1,725 | -15.6% |
| Acquisition cost | (84,944) | (70,484) | (66,248) | -6.0% | -22.0% | (170,767) | (136,732) | -19.9% |
Finally, the acquisition cost fell 6.0% QoQ, 22.0% YoY and 19.9% YTD. In the QoQ analysis, the decline is due primarily to a drop in underwriting expenses in the P & C business, mainly in Cars due to a decrease in sales expenses for promotions. The aforementioned was partially attenuated by an increase in underwriting expenses in Life, and in Individual Life in particular. In the YoY and YTD analysis, the acquisition cost fell after a contract in the Alliance channel expired at thde end of 2021.
|
| |
| Operating expenses increased in core businesses as due to an uptick in administrative expenses, which was primarily associated with IT development and secondarily to un uptick in expenses for customer loyalty program due to higher transactionality. Growth in variable compensation reflects the fact that commercial targets were exceed this quarter. Finally, expenses related to disruptive initiatives continue to grow. | |
|
| |
| Operating expenses | Quarter | % change | As of | % change |
| S/ 000 | 2Q21 | 1Q22 | 2Q22 | QoQ | YoY | Jun 21 | Jun 22 | Jun 22 / Jun 21 |
| Salaries and employees benefits | 882,177 | 977,953 | 975,420 | -0.3% | 10.6% | 1,739,736 | 1,953,373 | 12.3% |
| Administrative, general and tax expenses | 672,805 | 725,539 | 850,972 | 17.3% | 26.5% | 1,253,647 | 1,576,511 | 25.8% |
| Depreciation and amortization | 163,869 | 164,514 | 168,845 | 2.6% | 3.0% | 330,634 | 333,359 | 0.8% |
| Association in participation | 8,879 | 7,691 | 10,329 | 34.3% | 16.3% | 22,785 | 18,020 | -20.9% |
Acquisition cost (1) | 84,944 | 70,484 | 66,247 | -6.0% | -22.0% | 170,766 | 136,731 | -19.9% |
| Operating expenses | 1,812,674 | 1,946,181 | 2,071,813 | 6.5% | 14.3% | 3,517,568 | 4,017,994 | 14.2% |
| (1) | The acquisition cost of Pacifico includes net fees and underwriting expenses. |
For the expenses analysis, YoY and YTD movements will be taken into account in order to eliminate seasonal effects between quarters.
Operating expenses continue to rise due to:
| | • | Growth in Administrative and general expenses and taxes, which was attributable to growth in IT expenses related to the digital transformation strategy, and to an increase in transactional expenses in a context marked by economic reactivation and an uptick in consumption; and |
| | • | Increase in Salaries and Employee benefits, after more provisions were set aside for earnings this quarter. Variable compensation rose after commercial targets for the quarter were exceeded. |
Administrative and general expenses and taxes
| Administrative and general expenses | Quarter | % Change | As of | % change |
| S/ 000 | 2Q21 | 1Q22 | 2Q22 | QoQ | YoY | Jun - 21 | Jun - 22 | Jun - 22 / Jun - 21 |
| IT expenses and IT third-party services | 155,615 | 200,757 | 218,788 | 9.0% | 40.6% | 292,648 | 419,545 | 43.4% |
| Advertising and customer loyalty programs | 105,060 | 110,497 | 156,285 | 41.4% | 48.8% | 177,386 | 266,782 | 50.4% |
| Taxes and contributions | 77,406 | 74,063 | 78,510 | 6.0% | 1.4% | 146,214 | 152,573 | 4.3% |
| Audit Services, Consulting and professional fees | 60,317 | 52,518 | 70,586 | 34.4% | 17.0% | 102,042 | 123,104 | 20.6% |
| Transport and communications | 47,341 | 40,164 | 49,771 | 23.9% | 5.1% | 87,723 | 89,935 | 2.5% |
| Repair and maintenance | 29,325 | 29,939 | 39,913 | 33.3% | 36.1% | 56,768 | 69,852 | 23.0% |
| Agents' Fees | 25,218 | 27,018 | 26,091 | -3.4% | 3.5% | 50,254 | 53,109 | 5.7% |
| Services by third-party | 23,002 | 18,411 | 25,922 | 40.8% | 12.7% | 42,047 | 44,333 | 5.4% |
| Leases of low value and short-term | 20,145 | 20,931 | 22,610 | 8.0% | 12.2% | 41,047 | 43,541 | 6.1% |
| Miscellaneous supplies | 14,171 | 19,077 | 20,657 | 8.3% | 45.8% | 28,990 | 39,734 | 37.1% |
| Security and protection | 15,692 | 15,476 | 15,798 | 2.1% | 0.7% | 31,651 | 31,274 | -1.2% |
| Subscriptions and quotes | 13,462 | 13,437 | 15,664 | 16.6% | 16.4% | 26,645 | 29,101 | 9.2% |
| Electricity and water | 12,709 | 10,677 | 13,567 | 27.1% | 6.8% | 23,400 | 24,244 | 3.6% |
| Electronic processing | 11,123 | 7,693 | 8,208 | 6.7% | -26.2% | 21,091 | 15,901 | -24.6% |
| Insurance | 5,320 | 8,916 | 5,925 | -33.5% | 11.4% | 13,594 | 14,841 | 9.2% |
| Cleaning | 5,206 | 4,506 | 5,203 | 15.5% | -0.1% | 10,488 | 9,709 | -7.4% |
Others (1) | 51,693 | 71,459 | 77,474 | 8.4% | 49.9% | 101,659 | 148,933 | 46.5% |
| Total | 672,805 | 725,539 | 850,972 | 17.3% | 26.5% | 1,253,647 | 1,576,511 | 25.8% |
(1) Others consists mainly of security and protection services, cleaning service, representation expenses, electricity and water utilities, insurance policy expenses, subscription expenses and commission expenses.
Administrative and general expenses and taxes rose due to:
| | • | Growth in IT expenses and systems outsourcing, which was related to cybersecurity, infrastructure upgrades, development of new applications, renewal and improvement of software; and |
| | • | A 62% increase in Advertising expenses, which was primarily associated with disruptive initiatives. If we exclude disruptive expenses, expenses for advertising register a 15% increase. |
| | • | The 38% increase in expenses for the Loyalty Program. This was related to an increase of consumption of LATAM miles, which reflected growth in consumption with credit and debit cards at establishments (related fees up 44%). |
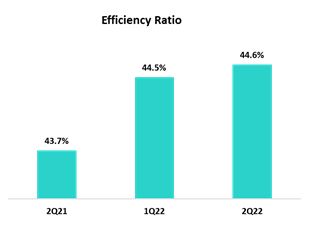
09 Operating Efficiency
| | | |
| | The efficiency ratio deteriorated 60bps YTD after growth in expenses outpaced the expansion in. If we exclude expenses related to disruptive initiatives (Yape + Krealo) from both 1S22 and 1S21, the efficiency ratio improves 34bps YTD. . | |
| | | |
| Operating Efficiency | Quarter | % change | Year | % change |
| S/ 000 | 2Q21 | 1Q22 | 2Q22 | QoQ | YoY | Jun - 21 | Jun - 22 | Jun - 22 / Jun - 21 |
| Operating expenses (1) | 1,812,674 | 1,946,181 | 2,071,813 | 6.5% | 14.3% | 3,517,568 | 4,017,994 | 14.2% |
| Operating income (2) | 4,147,704 | 4,376,339 | 4,649,995 | 6.3% | 12.1% | 8,019,267 | 9,026,334 | 12.6% |
| Efficiency ratio (3) | 43.7% | 44.5% | 44.6% | 10 bps | 90 bps | 43.9% | 44.5% | 60 bps |
| (1) | Operating expenses = Salaries and employee’s benefits + Administrative expenses + Depreciation and amortization + Association in participation + Acquisition cost. |
| (2) | Operating income = Net interest, similar income and expenses + Fee income + Net gain on foreign exchange transactions + Net gain from associates + Net gain on derivatives held for trading + Net gain from exchange differences + Net premiums earned |
| (3) | Operating expenses / Operating income. |
Efficiency Ratio by Subsidiary
| | BCP Stand-alone | BCP Bolivia | Mibanco Peru | Mibanco Colombia | Pacifico | Prima AFP | Credicorp |
| 2Q21 | 40.3% | 58.9% | 55.6% | 74.1% | 36.6% | 44.9% | 43.7% |
| 1Q22 | 40.6% | 59.9% | 53.0% | 79.2% | 36.1% | 54.5% | 44.5% |
| 2Q22 | 41.5% | 58.0% | 50.4% | 75.6% | 34.6% | 52.6% | 44.6% |
| Var. QoQ | 90 bps | -190 bps | -260 bps | -360 bps | -150 bps | -190 bps | 10 bps |
| Var. YoY | 120 bps | -90 bps | -520 bps | 150 bps | -200 bps | 770 bps | 90 bps |
| | | | | | | | |
| Jun - 21 | 40.2% | 59.3% | 58.6% | 76.1% | 37.0% | 45.7% | 43.9% |
| Jun - 22 | 41.1% | 58.9% | 51.6% | 77.3% | 35.4% | 53.5% | 44.5% |
% change Jun - 22 / Jun - 21 | 90 bps | -40 bps | -700 bps | 120 bps | -160 bps | 780 bps | 60 bps |
The analysis of the efficiency ratio is performed based on income and expenses in a YTD basis in order to eliminate seasonal effects between quarters.
The deterioration of the efficiency ratio is mainly due to the fact that expenses in BCP Stand-alone increased more than income. These expenses are related to:
• IT development and increased benefits of the customer loyalty program due to an uptick in transactionality,
• higher variable compensation after commercial targets were exceed this quarter; and
• the evolution of disruptive initiatives.
The aforementioned deterioration was partially offset by an improvement in efficiency at Mibanco Peru, which was attributable to an increase in interest income through active interest rate management in a context of rising funding cost. Advances in the implementation of Mibanco’s hybrid model has enabled to maintain it to control operating expenses and bolster disbursement levels through leads and alternative channels.
If we exclude expenses related to internal disruptive initiatives (Yape) and to our Corporate Venture Capital Center (Krealo) from both 2022 and 2021, Credicorp’s efficiency ratio improves 34bsp YTD.
| | | |
| | The Regulatory Capital Ratio was 1.56 times above the required level. BCP Stand-alone’s ratio increased 36 bps YoY to stand at 11.6%, which reflected a 9.5% increase in capital and reserves and the uptick in retained earnings results. Mibanco’s CET1 ratio remained relatively stable at 15.2%. | |
| | | |
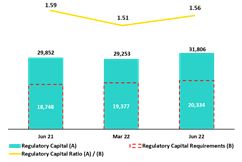
10.1 Credicorp’s Regulatory Capital
Credicorp’s regulatory capital ratio was 1.56 times above the required capital level at the end of 2Q22. In the QoQ analysis, the ratio rose 5bps due to a 11.2% increase in Optional Capital Reserves and Restricted Reserves, which was associated with balance transfers from the accumulated earnings account. This was partially offset by an increase in capital requirements to cover the uptick in loan growth reported at BCP Stand-alone and Mibanco.
In the YoY analysis, the Regulatory Capital Ratio was relatively stable.
10.2 BCP Stand-alone’s Regulatory Capital Ratio
At the end of 2Q22, the Tier 1 and Global Capital Ratio at BCP Stand-alone stood at 10.3% (-49bps QoQ) and 15.2% (-56bps QoQ) respectively. These reductions were primarily driven by the increase in loans’ share of risk-weighted assets (RWAs). In the case of the Global Regulatory Ratio, the aforementioned dynamic was partially offset by growth in the Subordinated Debt Balance, which was spurred by exchange rate movements.
In the YoY analysis, these ratios remained stable.
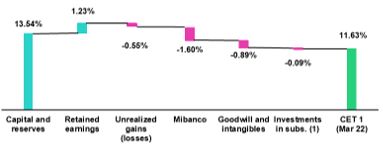
Common Equity Tier 1 Ratio IFRS – BCP Stand-alone
BCP’s Common Equity Tier 1 Ratio (CET 1) under IFRS accounting reflected a drop of 6bps QoQ, standing at 11.57% for 2Q22. This was associated to growth in Risk-weighted Assets (+4.7%) was partially offset by an increase in Retained Earnings Results (+66.5%). Finally, in the YoY analysis, the CET1 ratio rose 36bps, driven by a 9.5% increase in Capital and Reserves, which was spurred by the capitalization of earnings from 2021 and by the uptick reported for Retained Earnings Results. This evolution was partially mitigated by 6.9% growth in RWAs.
10.3 Mibanco’s Regulatory Capital
At the end of 2Q22, the Tier 1 Regulatory Ratio and the Global Capital Ratio at Mibanco stood at 12.6% (-69bps QoQ) and 14.8% (-80bps QoQ) respectively. This evolution was driven primarily by the 5.5% increase in Risk-Weighted Assets (RWAs), which in turn reflected an uptick in loan growth.
The YoY evolution shows a 214 bps and 244 bps decrease in the Tier 1 Regulatory and Global Capital Ratio respectively. Both variations were fueled by a 23.3% increase in RWAs and were driven by the same factors mentioned in the QoQ analysis.
Finally, the CET1 Ratio under IFRS accounting was relatively stable QoQ and YoY. The accumulation of retained earnings was offset by the increase in RWAs. Mainly due to Credit Risk.
| | | |
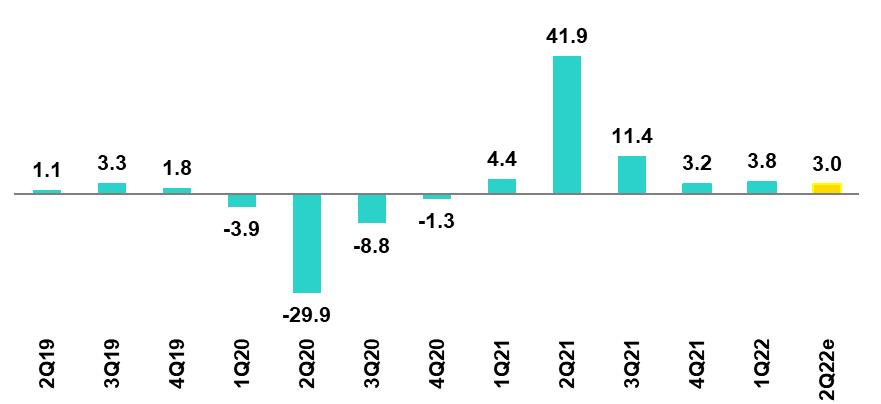
| | Estimates indicate that the Peruvian economy grew 3.0% YoY in 2Q22, driven primarily by the service sector and non-primary manufacturing. The uptick in the service sector was triggered by a loosening of restrictions, which benefitted lodging, restaurant and transportation businesses in particular. Growth this quarter was offset by a 1.5% drop in primary activities, which was fueled by a downturn in mining production.
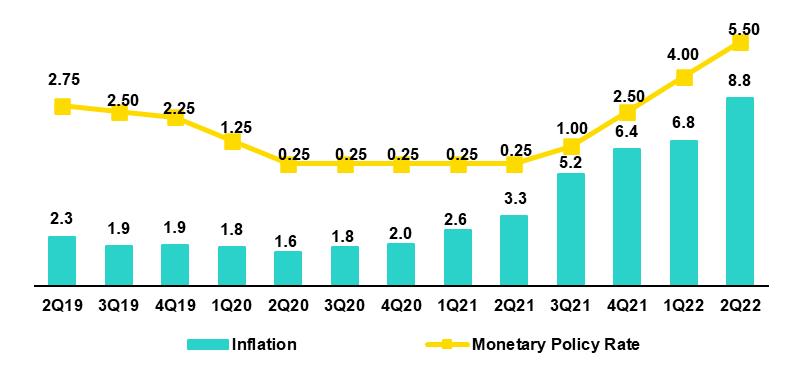
The annual Inflation rate for 2Q22 closed at 8.8% YoY, which represented the highest point since July 1997. The uptick was primarily driven by rising prices for imported commodities in the context set by the war in the Ukraine.
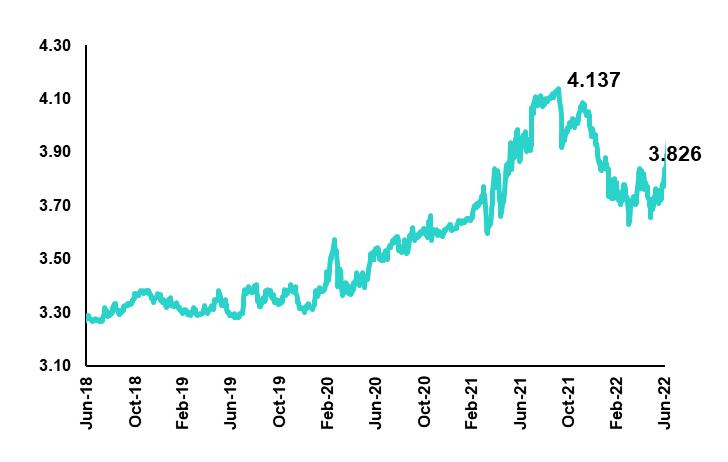
According to BCRP, the exchange rate closed at USDPEN 3.826 in 2Q22, which represents a decrease of 4.1% from the 3.676 registered in 1Q22. | |
| | | |
Peru: Economic Forecast
| Peru | 2018 | 2019 | 2020 | 2021 | 2022 (3) |
| GDP (US$ Millions) | 226,856 | 232,447 | 205,553 | 225,661 | 250,462 |
| Real GDP (% change) | 4.0 | 2.2 | -11.0 | 13.5 | 2.5 |
| GDP per capita (US$) | 7,045 | 7,152 | 6,300 | 6,831 | 7,507 |
| Domestic demand (% change) | 4.2 | 2.3 | -9.8 | 14.6 | 2.5 |
| Gross fixed investment (as % GDP) | 22.4 | 21.8 | 19.7 | 21.9 | 20.7 |
| Public Debt (as % GDP) | 25.6 | 26.6 | 34.6 | 35.9 | 34.5 |
| System loan growth (% change)(1) | 10.3 | 6.4 | 12.9 | 7.0 | 1.8 |
| Inflation(2) | 2.2 | 1.9 | 2.0 | 6.4 | 7.3 |
| Reference Rate | 2.75 | 2.25 | 0.25 | 2.50 | 7.00 |
| Exchange rate, end of period | 3.37 | 3.31 | 3.62 | 3.99 | 3.85 |
| Exchange rate, (% change) | 4.0% | -1.8% | 9.3% | 10.3% | -3.5% |
| Fiscal balance (% GDP) | -2.3 | -1.6 | -8.9 | -2.5 | -2.0 |
| Trade balance (US$ Millions) | 7,197 | 6,614 | 8,196 | 14,833 | 9,500 |
| (As % GDP) | 3.2% | 2.8% | 4.0% | 6.6% | 3.8% |
| Exports | 49,066 | 47,688 | 42,905 | 63,151 | 64,800 |
| Imports | 41,870 | 41,074 | 34,709 | 48,317 | 55,300 |
| Current account balance (As % GDP) | -1.7% | -1.5% | 1.2% | -2.3% | -4.5% |
| Net international reserves (US$ Millions) | 60,121 | 68,316 | 74,707 | 78,495 | 74,000 |
| (As % GDP) | 26.5% | 29.4% | 36.3% | 34.8% | 29.5% |
| (As months of imports) | 17 | 20 | 26 | 19 | 16 |
Sources: INEI, BCRP, y SBS.
(1) Financial System, Current Exchange Rate
(2) Inflation target: 1% - 3%
(3) Estimates by BCP Economic Research as of August, 2022.
Main Macroeconomic Variables
Gross Domestic Product
(Annual Variations, % YoY)
Source: BCRP
*Estimate; BCP
In 2Q22, the Peruvian economy is expected to have grown 3.0% YoY (1Q22 3.8% YoY). Non-primary sectors are expected to register 4.2% growth YoY, propelled by an uptick in the service sector and in non-primary manufacturing. Services (lodging and restaurants and transportation) continue to benefit from advances on the vaccination front and the lifting of restrictions on movement. Non-primary manufacturing is expected to have registered growth in most branches of activity. Finally, Primary activities more than likely dropped 1.5% YoY, in a context marked by a 6.0% deterioration in mining production. According to INEI, the economy grew 2.3% YoY in May and 3.7% YoY in April.
Annual Inflation and Central Bank Reference Rate
(%)
The annual inflation rate in 2Q22 closed at 8.8% YoY, the highest print since July 1997 and well above the upper limit of the BCRP's target range (1%-3%). At the end of 2Q22, food and energy inflation rose to 13.5% YoY, due in large part to rising prices for imported commodities in a context impacted by the war in the Ukraine. Core inflation (excluding food and energy) stood at 5.0% YoY, which is close to the historic high reported 22 years ago in November 2000.
Since August 2021, the Central Reserve Bank (BCRP) has been responding to the increases in inflation and price expectations by raising its reference rate from 0.25% to 5.5% in June 2022. Thus, the monetary authority seeks to return inflation expectations to their target range (1% to 3%) in the second half of part of 2023. On July 7th, the BCRP raised its rate to 6.0% and its next monetary policy meeting will take place on Thursday, August 11.
Fiscal Balance and Current Account Balance
(% of GDP, Quarter)
The annualized fiscal deficit for 2Q22 was 1.0% of GDP, compared to 6.3% in 2Q21. In the first semester, the current income of the general government increased 27% YoY, driven by an increase in collections for income tax collection (48%), the General Sales Tax for imports (23%) and non-tax income (25%). In 1S22, non-financial expenses at the general government level grew 4.5% YoY in the first semester. In this context, current spending grew 3.7%; capital spending, 3.3%; and other capital spending, 26.8%.
In April, Fitch Ratings affirmed its credit rating for Peru's long-term debt in foreign currency at BBB with a stable outlook. S&P rates Peru at BBB with a stable outlook, and Moody's, Baa1 with a stable outlook.
In terms of external accounts, the current account deficit according to the latest BCRP Inflation Report closed 1Q22 at 5.7% of GDP, and in accumulated terms for the last 4 quarters, the current account deficit stood at 3.2% of GDP. As of May 2022, exports reached a near-record high, totaling US$ 67.3 billion over the 12-months accumulated period. Imports also reached a historical record, annualized to May, of USD 51.8 billion. Thus, the accumulated trade surplus 12 months to May stood at USD 15.4 billion, a decrease compared to the accumulated 12 months to March 2022, which reached USD 16.3 billion and set a historical record.
In May, the terms of trade registered a decrease of 12.7% compared to the same month of 2021. Import prices rose 18.5% due to higher prices for oil and derivatives, food and industrial inputs, while export prices rose to a lesser extent (3.5%). Despite a YoY drop, terms of trade stood 8.4% higher than the level reported in May 2019.
Exchange rate
(PEN per USD)
According to the Central Bank. the exchange rate closed at USDPEN 3.826 in 2Q22 (3.676 in 1Q22 and 3.99 in 4Q21), depreciating 4.1% compared to the end of 1Q22. It is important to note that the region's currencies depreciated during 2Q22 compared to the 1Q22: the Chilean Peso 16.8% (1Q21: 7.7%) and the Colombian Peso 10.3% (1Q21: 7.4%), the Brazilian Real 10.9% (1Q21: 14.9%), the Mexican Peso 1.3% (1Q21: 3.2%). It should be noted that as of July 19th, 2022, USDPEN closed at 3.8750, which represented a depreciation of 5.2% compared to the figure at the end of 1Q22.
Net International Reserves closed 2Q22 at US$73.3 billion, falling below the US$75.3 billion reported in 1Q21 and the US$78.5 billion registered at year-end. BCR's foreign exchange position stood at US$ 52.7 billion, which represented a drop of US$ 3.6 billion compared to the figure at the end of 1Q22. This reduction was primarily driven by net sales of foreign currency to the public sector to strengthen the fiscal stabilization fund.
In 2Q22, BCRP made net sales in the spot foreign exchange market for US$641 million, which topped the US$371 million registered in 1Q22. Sales were concentrated in April (US$ 392 million) followed by June (US$212 million).
Safe Harbor for Forward-Looking Statements |
This material includes “forward-looking statements” within the meaning of Section 27A of the U.S. Securities Act of 1933 and Section 21E of the U.S. Securities Exchange Act of 1934. All statements other than statements of historical fact are forward-looking and may contain information about financial results, economic conditions, trends and known uncertainties. Forward-looking statements are not assurances of future performance. Instead, they are based only on our management’s current views, beliefs, expectations and assumptions regarding the future of our business, future plans and strategies, projections, anticipated events and trends, the economy and other future conditions.
Many forward-looking statements can be identified by words such as: “anticipate”, “intend”, “plan”, “goal”, “seek”, “believe”, “project”, “estimate”, “expect”, “strategy”, “future”, “likely”, “would”, “may”, “should”, “will”, “see” and similar references to future periods. Examples of forward-looking statements include, among others, statements or estimates we make regarding guidance relating to losses in our credit portfolio, efficiency ratio, provisions and non-performing loans, current or future market risk and future market conditions, expected macroeconomic events and conditions, our belief that we have sufficient capital and liquidity to fund our business operations, expectations of the effect on our financial condition of claims, legal actions, environmental costs, contingent liabilities and governmental and regulatory investigations and proceedings, strategy for customer retention, growth, governmental programs and regulatory initiatives, credit administration, product development, market position, financial results and reserves and strategy for risk management.
We caution readers that forward-looking statements involve known and unknown risks and uncertainties that could cause actual results, performance or events to differ materially from those that we expect or that are expressed or implied in the forward-looking statements, depending on the outcome of certain factors, including, without limitation, adverse changes in:
• The occurrence of natural disasters or political or social instability in Peru;
• The adequacy of the dividends that our subsidiaries are able to pay to us, which may affect our ability to pay dividends to shareholders and corporate expenses;
• Performance of, and volatility in, financial markets, including Latin-American and other markets;
• The frequency, severity and types of insured loss events;
• Fluctuations in interest rate levels;
• Foreign currency exchange rates, including the Sol/US Dollar exchange rate;
• Deterioration in the quality of our loan portfolio;
• Increasing levels of competition in Peru and other markets in which we operate;
• Developments and changes in laws and regulations affecting the financial sector and adoption of new international guidelines;
• Changes in the policies of central banks and/or foreign governments;
• Effectiveness of our risk management policies and of our operational and security systems;
• Losses associated with counterparty exposures;
• The scope of the coronavirus (“COVID-19”) outbreak, actions taken to contain the COVID-19 and related economic effects from such actions and our ability to maintain adequate staffing; and
• Changes in Bermuda laws and regulations applicable to so-called non-resident entities.
See “Item 3. Key Information—3.D Risk Factors” and “Item 5. Operating and Financial Review and Prospects” in our most recent Annual Report on Form 20-F filed with the U.S. Securities and Exchange Commission for additional information and other such factors.
You are cautioned not to place undue reliance on these forward-looking statements, which speak only as of the date hereof and are based only on information currently available to us. Therefore, you should not rely on any of these forward-looking statements. We undertake no obligation to publicly update or revise these or any other forward-looking statements that may be made to reflect events or circumstances after the date hereof, whether as a result of changes in our business strategy or new information, to reflect the occurrence of unanticipated events or otherwise.
| 12.1. Physical Channels | 45 |
| 12.2. Loan Portfolio Quality | 45 |
| 12.3 Net Interest Income (INI) | 49 |
| 12.4. Regulatory Capital | 50 |
| 12.5. Financial Statements and Ratios by Business | 53 |
| 12.5.1. Credicorp Consolidated | 53 |
| 12.5.2. Credicorp Stand-alone | 55 |
| 12.5.3. BCP Consolidated | 56 |
| 12.5.4. BCP Stand-alone | 60 |
| 12.5.5. BCP Bolivia | 62 |
| 12.5.6. Mibanco | 63 |
| 12.5.7. Prima AFP | 64 |
| 12.5.8. Grupo Pacifico | 66 |
| 12.5.9. Investment Banking & Wealth Management | 68 |
| 12.6. Table of calculations | 69 |
| 12.7. Glossary of terms | 70 |
12.1. Physical Point of contact
Physical Point of Contact (Units) | As of | change (units) |
| Jun-21 | Mar-22 | Jun-22 | QoQ | YoY |
| Branches | 730 | 706 | 691 | -15 | -39 |
| ATMs | 2,596 | 2,551 | 2,540 | -11 | -56 |
| Agentes | 7,669 | 8,916 | 9,863 | 947 | 2,194 |
| Total | 10,995 | 12,173 | 13,094 | 921 | 2,099 |
12.2. Loan Portfolio Quality
Loan Portfolio Quality (in Quarter-end Balances)
Government Program (GP) Loan Portfolio Quality (in Quarter-end Balances)
GP Portfolio quality and Delinquency ratios (1) | As of | % change |
| S/000 |
| | Jun 21 | Mar 22 | Jun 22 | QoQ | YoY |
| GP Total loans (Quarter-end balance) | 22,996,351 | 16,355,873 | 13,334,009 | -18.5% | -42.0% |
| GP Allowance for loan losses | 146,011 | 200,713 | 194,144 | -3.3% | 33.0% |
| GP IOLs | 140,784 | 1,031,670 | 1,027,377 | -0.4% | n.a |
| GP IOL ratio | 0.61% | 6.31% | 7.70% | 139 bps | 709 bps |
| GP Allowance for loan losses over GP Total loans | 0.6% | 1.2% | 1.5% | 23 bps | 83 bps |
| GP Coverage ratio of IOLs | 103.7% | 19.5% | 18.9% | -56 bps | n.a |
| (1) | Government Programs (GP) include Reactiva Peru and FAE-Mype. |
Portfolio Quality Ratios by Segment
Wholesale Banking
SME-Business
SME-Pyme
Mortgage
Consumer
Credit Card
Mibanco
BCP Bolivia
12.3 Net Interest Income (NII)
NII Summary
| Net interest income | Quarter | % change | As of | % change |
| S/ 000 | 2Q21 | 1Q22 | 2Q22 | QoQ | YoY | Jun 21 | Jun 22 | Jun 22 / Jun 21 |
| Interest income | 2,891,579 | 3,172,346 | 3,488,113 | 10.0% | 20.6% | 5,707,652 | 6,660,459 | 16.7% |
| Interest on loans | 2,476,187 | 2,685,552 | 2,929,782 | 9.1% | 18.3% | 4,908,948 | 5,615,334 | 14.4% |
| Dividends on investments | 11,536 | 4,320 | 13,682 | 216.7% | 18.6% | 14,757 | 18,002 | 22.0% |
| Interest on deposits with banks | 6,076 | 35,351 | 47,785 | 35.2% | 686.5% | 13,972 | 83,135 | 495.0% |
| Interest on securities | 382,140 | 428,456 | 482,872 | 12.7% | 26.4% | 745,104 | 911,328 | 22.3% |
| Other interest income | 15,640 | 18,667 | 13,992 | -25.0% | -10.5% | 24,871 | 32,660 | 31.3% |
| Interest expense | 582,537 | 638,256 | 747,673 | 17.1% | 28.3% | 1,275,227 | 1,385,929 | 8.7% |
| Interest on deposits | 210,275 | 258,939 | 336,953 | 30.1% | 60.2% | 432,918 | 595,892 | 37.6% |
| Interest on borrowed funds | 101,265 | 116,231 | 141,530 | 21.8% | 39.8% | 213,493 | 257,762 | 20.7% |
| Interest on bonds and subordinated notes | 178,664 | 165,496 | 168,366 | 1.7% | -5.8% | 445,635 | 333,861 | -25.1% |
| Other interest expense | 92,333 | 97,590 | 100,824 | 3.3% | 9.2% | 183,181 | 198,414 | 8.3% |
| Net interest income | 2,309,042 | 2,534,090 | 2,740,440 | 8.1% | 18.7% | 4,432,425 | 5,274,530 | 19.0% |
Adjusted Net interest income (2) | 2,346,170 | 2,522,080 | 2,740,440 | 8.7% | 16.8% | 4,540,699 | 5,362,530 | 18.1% |
| Risk-adjusted Net interest income | 1,945,662 | 2,276,500 | 2,377,149 | 4.4% | 22.2% | 3,511,398 | 4,653,649 | 32.5% |
| Average interest earning assets | 230,237,853 | 228,195,289 | 223,529,737 | -2.0% | -2.9% | 227,052,978 | 227,021,380 | 0.0% |
Net interest margin (1) | 4.01% | 4.44% | 4.90% | 46bps | 89bps | 3.90% | 4.65% | 75bps |
Risk-adjusted Net interest margin (1) | 3.38% | 3.99% | 4.25% | 26bps | 87bps | 3.09% | 4.10% | 101bps |
| Net provisions for loan losses / Net interest income | 15.74% | 10.16% | 13.26% | 3.1% | -2.5% | 20.78% | 11.77% | -9.01% |
13) Annualized.
Net Interest Margin (NIM) and Risk Adjusted NIM by subsidiary
| NIM Breakdown | BCP Stand-alone | Mibanco | BCP Bolivia | Credicorp |
| 2Q21 | 3.43% | 11.88% | 2.83% | 4.01% |
| 1Q22 | 3.85% | 12.71% | 2.76% | 4.44% |
| 2Q22 | 4.29% | 12.95% | 2.88% | 4.90% |
NIM: Annualized Net interest income / Average period end and period beginning interest earning assets.
| Risk Adjusted NIM Breakdown | BCP Stand-alone | Mibanco | BCP Bolivia | Credicorp |
| 2Q21 | 2.81% | 8.66% | 4.57% | 3.38% |
| 1Q22 | 3.52% | 10.10% | 2.86% | 3.99% |
| 2Q22 | 3.79% | 10.41% | 1.77% | 4.25% |
Risk-Adjusted NIM: (Annualized Net interest income - annualized provisions) / Average period end and period beginning interest earning assets.
12.4. Regulatory Capital
Regulatory Capital and Capital Adequary Ratios
(S/ thousands, IFRS)
| | As of | % Change |
| | Jun 21 | Mar 22 | Jun 22 | QoQ | YoY |
| Capital Stock | 1,318,993 | 1,318,993 | 1,318,993 | 0.0% | 0.0% |
| Treasury Stocks | (207,756) | (207,700) | (207,518) | -0.1% | -0.1% |
| Capital Surplus | 224,103 | 227,361 | 231,179 | 1.7% | 3.2% |
Legal and Other capital reserves (1) | 21,725,663 | 21,292,614 | 23,666,823 | 11.2% | 8.9% |
Minority interest (2) | 429,448 | 493,113 | 490,576 | -0.5% | 14.2% |
Loan loss reserves (3) | 1,913,045 | 1,971,343 | 2,074,630 | 5.2% | 8.4% |
| Perpetual subordinated debt | - | - | - | - | - |
| Subordinated Debt | 5,979,619 | 5,695,192 | 5,863,208 | 3.0% | -1.9% |
| Investments in equity and subordinated debt of financial and insurance companies | (717,711) | (727,620) | (829,315) | 14.0% | 15.6% |
| Goodwill | (813,492) | (809,980) | (802,622) | -0.9% | -1.3% |
| Current year Net Loss | - | - | - | - | - |
Deduction for subordinated debt limit (50% of Tier I excluding deductions) (4) | - | - | - | - | - |
Deduction for Tier I Limit (50% of Regulatory capital) (4) | - | - | - | - | - |
| Regulatory Capital (A) | 29,851,912 | 29,253,316 | 31,805,954 | 8.7% | 6.5% |
| | | | | | |
Tier 1 (5) | 15,337,348 | 15,402,884 | 16,973,919 | 10.2% | 10.7% |
Tier 2 (6) + Tier 3 (7) | 14,514,564 | 13,850,433 | 14,832,035 | 7.1% | 2.2% |
| |
|
|
| | |
Financial Consolidated Group (FCG) Regulatory Capital Requirements (8) | 17,894,230 | 18,372,067 | 19,270,916 | 4.9% | 7.7% |
Insurance Consolidated Group (ICG) Capital Requirements (9) | 1,325,595 | 1,450,871 | 1,512,297 | 4.2% | 14.1% |
| FCG Capital Requirements related to operations with ICG | (471,394) | (446,149) | (449,113) | 0.7% | -4.7% |
| ICG Capital Requirements related to operations with FCG | - | - | - | - | - |
| Regulatory Capital Requirements (B) | 18,748,432 | 19,376,789 | 20,334,099 | 4.9% | 8.5% |
| Regulatory Capital Ratio (A) / (B) | 1.59 | 1.51 | 1.56 | | |
Required Regulatory Capital Ratio (10) | 1.00 | 1.00 | 1.00 | | |
(1) Legal and other capital reserves include restricted capital reserves (PEN 14,745 million) and optional capital reserves (PEN 6,661 million).
(2) Minority interest includes Tier I (PEN 421 million)
(3) Up to 1.25% of total risk-weighted assets of Banco de Credito del Peru, Solucion Empresa Administradora Hipotecaria, Mibanco and ASB Bank Corp.
(4) Tier II + Tier III can not be more than 50% of total regulatory capital.
(5) Tier I = capital + restricted capital reserves + Tier I minority interest - goodwill - (0.5 x investment in equity and subordinated debt of financial and insurance companies)+ perpetual subordinated debt.
(6) Tier II = subordinated debt + TierII minority interest tier + loan loss reserves - (0.5 x investment in equity and subordinated debt of financial and insurance companies).
(7) Tier III = Subordinated debt covering market risk only.
(8) Includes regulatory capital requirements of the financial consolidated group.
(9) Includes regulatory capital requirements of the insurance consolidated group.
(10) Regulatory Capital / Total Regulatory Capital Requirements (legal minimum = 1.00).
Regulatory and Capital Adecuacy Ratios at BCP Stand-alone
(In S/ thousands)
| Regulatory Capital and Capital Adequacy Ratios - SBS | As of | % change |
| S/ 000 | Jun 21 | Mar 22 | Jun 22 | QoQ | YoY |
| Capital Stock | 11,317,387 | 12,176,365 | 12,176,365 | 0.0% | 7.6% |
| Legal and Other capital reserves | 6,707,831 | 7,516,510 | 7,516,897 | 0.0% | 12.1% |
| Accumulated earnings with capitalization agreement | - | - | - | n.a. | n.a. |
| Loan loss reserves (1) | 1,676,768 | 1,707,458 | 1,797,358 | 5.3% | 7.2% |
| Perpetual subordinated debt | - | - | - | n.a. | n.a. |
| Subordinated Debt | 5,223,300 | 5,007,300 | 5,163,750 | 3.1% | -1.1% |
| Investment in subsidiaries and others, net of unrealized profit and net income | (2,263,859) | (2,432,571) | (2,436,525) | 0.2% | 7.6% |
| Investment in subsidiaries and others | (2,326,241) | (2,535,289) | (2,674,646) | 5.5% | 15.0% |
| Unrealized profit and net income in subsidiaries | 62,381 | 102,718 | 238,121 | 131.8% | n.a. |
| Goodwill | (122,083) | (122,083) | (122,083) | 0.0% | 0.0% |
| Total Regulatory Capital - SBS | 22,539,343 | 23,852,979 | 24,095,761 | 1.0% | 6.9% |
| |
|
|
| | |
| Off-balance sheet | 96,842,778 | 87,775,815 | 91,019,217 | 3.7% | -6.0% |
| |
| |
| | |
| Regulatory Tier 1 Capital (2) | 15,142,961 | 16,220,724 | 16,219,133 | 0.0% | 7.1% |
| Regulatory Tier 2 Capital (3) | 7,396,382 | 7,632,256 | 7,876,628 | 3.2% | 6.5% |
| | |
| | | |
| Total risk-weighted assets - SBS (4) | 146,936,014 | 151,045,319 | 158,176,424 | 4.7% | 7.6% |
| Credit risk-weighted assets | 132,013,903 | 135,397,192 | 142,632,376 | 5.3% | 8.0% |
| Market risk-weighted assets (5) | 3,127,460 | 2,231,891 | 1,868,921 | -16.3% | -40.2% |
| Operational risk-weighted assets | 11,794,652 | 13,416,236 | 13,675,127 | 1.9% | 15.9% |
| | |
| | | |
| Total capital requirement - SBS | 13,925,638 | 14,355,691 | 15,023,680 | 4.7% | 7.9% |
| Credit risk capital requirement | 10,561,112 | 10,831,775 | 11,410,590 | 5.3% | 8.0% |
| Market risk capital requirement | 312,746 | 223,189 | 186,892 | -16.3% | -40.2% |
| Operational risk capital requirement | 1,179,465 | 1,341,624 | 1,367,513 | 1.9% | 15.9% |
| Additional capital requirements | 1,872,315 | 1,959,102 | 2,058,686 | 5.1% | 10.0% |
| |
|
|
| | |
| Common Equity Tier 1 - Basel IFRS (6) | 15,557,626 | 16,477,382 | 17,160,382 | 4.1% | 10.3% |
| Capital and reserves | 17,512,975 | 19,180,633 | 19,181,019 | 0.0% | 9.5% |
| Retained earnings | 1,522,687 | 1,740,668 | 2,897,372 | 66.5% | 90.3% |
| Unrealized gains (losses) | (123,542) | (780,063) | (1,089,747) | 39.7% | n.a |
| Goodwill and intangibles | (1,230,017) | (1,266,218) | (1,312,578) | 3.7% | 6.7% |
| Investments in subsidiaries | (2,124,477) | (2,397,638) | (2,515,685) | 4.9% | 18.4% |
| | | | | | |
| Risk-Weighted Assets - Basel IFRS (7) | 138,825,472 | 141,697,998 | 148,378,629 | 4.7% | 6.9% |
| Total risk-weighted assets | 146,936,014 | 151,045,319 | 158,176,424 | 4.7% | 7.6% |
| (-) RWA Intangible assets, excluding goodwill. | 10,013,815 | 10,798,886 | 11,347,690 | 5.1% | 13.3% |
| (+) RWA Deferred tax assets generated as a result of temporary differences in income tax, in excess of 10% of CET1 | 1,383,156 | 882,435 | 904,457 | 2.5% | -34.6% |
| (+) RWA Deferred tax assets generated as a result of past losses | - | - | - | n.a. | n.a. |
| (+) IFRS Adjustments (11) | 520,116 | 569,130 | 645,439 | 13.4% | 24.1% |
| | | | | | |
| Capital ratios | | | | | |
| Regulatory Tier 1 ratio (8) | 10.31% | 10.74% | 10.25% | -49 bps | -6 bps |
| Common Equity Tier 1 ratio (9)(12) | 11.21% | 11.63% | 11.57% | -6 bps | 36 bps |
| Regulatory Global Capital ratio (10) | 15.34% | 15.79% | 15.23% | -56 bps | -11 bps |
| Risk-weighted assets / Regulatory capital | 6.52 | 6.33 | 6.56 | 3.7% | 0.7% |
(1) Up to 1.25% of total risk-weighted assets.
(2) Regulatory Tier 1 Capital = Capital + Legal and other capital reserves + Accumulated earnings with capitalization agreement + (0.5 x Unrealized profit and net income in subsidiaries) - Goodwill - (0.5 x Investment in subsidiaries) + Perpetual subordinated debt (maximum amount that can be included is 17.65% of Capital + Reserves + Accumulated earnings with capitalization agreement + Unrealized profit and net income in subsidiaries - Goodwill).
(3) Regulatory Tier 2 Capital = Subordinated debt + Loan loss reserves + Unrestricted Reserves + (0.5 x Unrealized profit and net income in subsidiaries) - (0.5 x Investment in subsidiaries).
(4) Since July 2012, Total Risk-weighted assets = Credit risk-weighted assets * 1.00 + Capital requirement to cover market risk * 10 + Capital requirement to cover operational risk * 10 * 1.00 (since July 2014)
(5) It includes capital requirement to cover price and rate risk.
(6) Common Equity Tier I = Capital + Reserves – 100% of applicable deductions (investment in subsidiaries, goodwill, intangibles and net deferred taxes that rely on future profitability) + retained earnings + unrealized gains. Figures differ from previously reported cause current calculations are based on IFRS figures.
(7) Adjusted Risk-Weighted Assets = Risk-weighted assets - (RWA Intangible assets, excluding goodwill, + RWA Deferred tax assets generated as a result of temporary differences in income tax, in excess of 10% of CET1, + RWA Deferred tax assets generated as a result of past losses). Figures differ from previously reported cause current calculations are based on IFRS figures.
(8) Regulatory Tier 1 Capital / Total Risk-weighted assets
(9) Common Equity Tier I / Adjusted Risk-Weighted Assets Risk-Weighted Assets
(10) Total Regulatory Capital / Total Risk-weighted assets (legal minimum = 10% since July 2011)
(11) Adjustments for differences in balance assets under Local Accounting (which regulatory Rwas are calculated) and IFRS in the Right of use account (lease). As of March 2022, the 'Right of Use' account increased to S/ 364M, explained the 64% of the adjustment. The rest adjustments correspond to differences in stock of provisions and Deferred Taxes.
(12) Common Equity Tier I calculated based on IFRS Accounting
Regulatory Capital and Capital Adequacy Ratios at Mibanco
(S/ thousands)
| | As of | % change |
| | Jun 21 | Mar 22 | Jun 22 | QoQ | YoY |
| Capital Stock | 1,714,577 | 1,840,606 | 1,840,606 | 0.0% | 7.4% |
| Legal and Other capital reserves | 246,305 | 264,221 | 264,221 | 0.0% | 7.3% |
| Accumulated earnings with capitalization agreement | 46,524 | - | - | n.a. | -100.0% |
Loan loss reserves (1) | 138,555 | 163,711 | 171,843 | 5.0% | 24.0% |
| Perpetual subordinated debt |
|
|
| n.a. | n.a. |
| Subordinated Debt | 185,000 | 185,000 | 179,000 | -3.2% | -3.2% |
| Investment in subsidiaries and others, net of unrealized profit and net income | - | - | - | n.a. | n.a. |
| Investment in subsidiaries and others | - | - | - | n.a. | n.a. |
| Unrealized profit and net income in subsidiaries | - | - | - | n.a. | n.a. |
| Goodwill | (139,180) | (139,180) | (139,180) | 0.0% | 0.0% |
| Accumulated Losses | - | - | - | n.a. | n.a. |
| Total Regulatory Capital - SBS | 2,191,781 | 2,314,357 | 2,316,490 | 0.1% | 5.7% |
| | | | | | |
Regulatory Tier 1 Capital (2) | 1,865,495 | 1,962,906 | 1,962,906 | 0.0% | 5.2% |
Regulatory Tier 2 Capital (3) | 326,287 | 351,451 | 353,583 | 0.6% | 8.4% |
| | | |
| | |
Total risk-weighted assets - SBS (4) | 12,703,309 | 14,825,319 | 15,638,132 | 5.5% | 23.1% |
| Credit risk-weighted assets | 10,662,694 | 12,747,979 | 13,605,110 | 6.7% | 27.6% |
Market risk-weighted assets (5) | 170,320 | 177,097 | 105,570 | -40.4% | -38.0% |
| Operational risk-weighted assets | 1,870,294 | 1,900,243 | 1,927,452 | 1.4% | 3.1% |
| |
|
| | | |
| Total capital requirement | 1,384,066 | 1,618,510 | 1,708,934 | 5.6% | 23.5% |
| Credit risk capital requirement | 1,066,269 | 1,274,798 | 1,360,511 | 6.7% | 27.6% |
| Market risk-weighted assets | 17,032 | 17,710 | 10,557 | -40.4% | -38.0% |
| Operational risk capital requirement | 187,029 | 190,024 | 192,745 | 1.4% | 3.1% |
| Additional capital requirements | 113,735 | 135,978 | 145,121 | 6.7% | 27.6% |
| | | | | | |
Common Equity Tier 1 - Basel IFRS (6) | 1,827,004 | 2,133,203 | 2,254,712 | 5.7% | 23.4% |
| Capital and reserves | 2,489,011 | 2,632,956 | 2,632,956 | 0.0% | 5.8% |
| Retained earnings | (316,452) | (160,683) | (32,701) | 79.6% | 89.7% |
| Unrealized gains (losses) | 697 | (8,191) | (13,045) | 59.3% | n.a. |
| Goodwill and intangibles | (321,948) | (330,879) | (332,498) | 0.5% | 3.3% |
| Excess DT of 10% CET1 Basilea | (24,304) | - | - | n.a. | n.a. |
| | | | | | |
Adjusted Risk-Weighted Assets - Basel IFRS (7) | 12,052,925 | 14,022,901 | 14,787,085 | 5.4% | 22.7% |
| Total risk-weighted assets | 12,703,309 | 14,825,319 | 15,638,132 | 5.5% | 23.1% |
| (-) RWA Intangible assets, excluding goodwill. | 836,447 | 1,166,501 | 1,199,443 | 2.8% | 43.4% |
| (+) RWA Deferred tax assets generated as a result of temporary differences in income tax, in excess of 10% of CET1 | 232,440 | 161,572 | 175,275 | 8.5% | -24.6% |
| (+) IFRS Adjustments | 269,854 | 168,871 | 151,442 | -10.3% | -43.9% |
| (+) RWA for Market Risk difference (exchange risk) for temporary difference | 25,202 | 33,640 | 21,679 | -35.6% | -14.0% |
| (-) RWA assets that exceed 10% of CET1 SBS | 352,031 | - | - | n.a. | -100.0% |
| (-) RWA difference between excees SBS and Basel methodology | (10,598) | - | - | n.a. | -100.0% |
| (-) RWA adjustment for state coverage, originated by temporary difference | - | - | - | N/A | - |
| (+) RWA Deferred tax assets generated as a result of past losses | - | - | - | N/A | - |
| | | | | | |
| Capital ratios | | | | | |
Regulatory Tier 1 ratio (8) | 14.69% | 13.24% | 12.55% | -69 bps | -214 bps |
Common Equity Tier 1 ratio (9)(11) | 15.16% | 15.21% | 15.25% | 4 bps | 9 bps |
Regulatory Global Capital ratio (10) | 17.25% | 15.61% | 14.81% | -80 bps | -244 bps |
| Risk-weighted assets / Regulatory capital | 5.80 | 6.41 | 6.75 | 5.4% | 16.5% |
(1) Up to 1.25% of total risk-weighted assets.
(2) Regulatory Tier 1 Capital = Capital + Legal and other capital reserves + Accumulated earnings with capitalization agreement + (0.5 x Unrealized profit and net income in subsidiaries) - Goodwill - (0.5 x Investment in subsidiaries) + Perpetual subordinated debt (maximum amount that can be included is 17.65% of Capital + Reserves + Accumulated earnings with capitalization agreement + Unrealized profit and net income in subsidiaries - Goodwill).
(3) Regulatory Tier 2 Capital = Subordinated debt + Loan loss reserves + Unrestricted Reserves + (0.5 x Unrealized profit and net income in subsidiaries) - (0.5 x Investment in subsidiaries).
(4) Since July 2012, Total Risk-weighted assets = Credit risk-weighted assets * 1.00 + Capital requirement to cover market risk * 10 + Capital requirement to cover operational risk * 10 * 1.00 (since July 2014)
(5) It includes capital requirement to cover price and rate risk.
(6) Common Equity Tier I = Capital + Reserves – 100% of applicable deductions (investment in subsidiaries, goodwill, intangibles and net deferred taxes that rely on future profitability) + retained earnings + unrealized gains.
(7) Adjusted Risk-Weighted Assets = Risk-weighted assets - (RWA Intangible assets, excluding goodwill, + RWA Deferred tax assets generated as a result of temporary differences in income tax, in excess of 10% of CET1, + RWA Deferred tax assets generated as a result of past losses). Figures differ from previously reported cause current calculations are based on IFRS figures.
(8) Regulatory Tier 1 Capital / Total Risk-weighted assets
(9) Common Equity Tier I / Adjusted Risk-Weighted Assets Risk-Weighted Assets
(10) Total Regulatory Capital / Total Risk-weighted assets (legal minimum = 10% since July 2011)
(11) Common Equity Tier I calculated based on IFRS Accounting
12.5. Financial Statements and Ratios by Business
12.5.1. Credicorp Consolidated
CREDICORP LTD. AND SUBSIDIARIES
CONSOLIDATED STATEMENT OF FINANCIAL POSITION
(In S/ thousands, IFRS)
| As of | % change |
| | Jun 21 | Mar 22 | Jun 22 | QoQ | YoY |
| ASSETS | | | | | |
| Cash and due from banks | | | | | |
| Non-interest bearing | 8,883,164 | 6,748,517 | 7,017,129 | 4.0% | -21.0% |
| Interest bearing | 29,075,474 | 29,563,512 | 23,831,465 | -19.4% | -18.0% |
| | | | | | |
| Total cash and due from banks | 37,958,638 | 36,312,029 | 30,848,594 | -15.0% | -18.7% |
| | | | | | |
| Cash collateral, reverse repurchase agreements and securities borrowing | 1,616,654 | 1,516,855 | 2,046,209 | 34.9% | 26.6% |
| | | | | | |
| Fair value through profit or loss investments | 6,791,288 | 4,628,870 | 4,187,000 | -9.6% | -38.4% |
| Fair value through other comprehensive income investments | 40,273,400 | 35,452,509 | 32,955,721 | -7.0% | -18.2% |
| Amortized cost investments | 7,707,956 | 8,064,050 | 8,200,054 | 1.7% | 6.4% |
| | | | | | |
| Loans | 143,091,752 | 144,621,513 | 150,370,184 | 4.0% | 5.1% |
| Current | 138,037,399 | 138,748,514 | 144,264,928 | 4.0% | 4.5% |
| Internal overdue loans | 5,054,353 | 5,872,999 | 6,105,256 | 4.0% | 20.8% |
| Less - allowance for loan losses | (9,391,151) | (8,262,383) | (8,306,500) | 0.5% | -11.5% |
| Loans, net | 133,700,601 | 136,359,130 | 142,063,684 | 4.2% | 6.3% |
| | | | | | |
| Financial assets designated at fair value through profit or loss | 921,851 | 856,337 | 765,195 | -10.6% | -17.0% |
| Accounts receivable from reinsurers and coinsurers | 1,043,042 | 1,166,096 | 1,105,527 | -5.2% | 6.0% |
| Premiums and other policyholder receivables | 780,824 | 873,505 | 816,076 | -6.6% | 4.5% |
| Property, plant and equipment, net | 1,944,127 | 1,864,825 | 1,837,436 | -1.5% | -5.5% |
| Due from customers on acceptances | 558,934 | 524,448 | 743,925 | 41.8% | 33.1% |
| Investments in associates | 627,683 | 629,009 | 636,217 | 1.1% | 1.4% |
| Intangible assets and goodwill, net | 2,647,676 | 2,703,238 | 2,729,593 | 1.0% | 3.1% |
Other assets (1) | 8,455,556 | 6,949,490 | 7,645,232 | 10.0% | -9.6% |
| | | | | | |
| Total Assets | 245,028,230 | 237,900,391 | 236,580,463 | -0.6% | -3.4% |
| | | | | | |
| LIABILITIES AND EQUITY | | | | | |
| Deposits and obligations | | | | | |
| Non-interest bearing | 52,879,988 | 50,939,859 | 46,043,988 | -9.6% | -12.9% |
| Interest bearing | 96,281,815 | 96,976,105 | 101,396,587 | 4.6% | 5.3% |
| Total deposits and obligations | 149,161,803 | 147,915,964 | 147,440,575 | -0.3% | -1.2% |
| | | | | | |
| Payables from repurchase agreements and securities lending | 25,963,227 | 19,388,995 | 18,138,863 | -6.4% | -30.1% |
| BCRP instruments | 23,329,990 | 17,532,350 | 16,031,618 | -8.6% | -31.3% |
| Repurchase agreements with third parties | 1,276,678 | 1,218,028 | 1,340,423 | 10.0% | 5.0% |
| Repurchase agreements with customers | 1,356,559 | 638,617 | 766,822 | 20.1% | -43.5% |
| | | | | | |
| Due to banks and correspondents | 6,239,161 | 6,362,990 | 6,456,360 | 1.5% | 3.5% |
| Bonds and notes issued | 16,951,481 | 16,044,671 | 16,579,674 | 3.3% | -2.2% |
| Banker’s acceptances outstanding | 558,934 | 524,448 | 743,925 | 41.8% | 33.1% |
| Reserves for property and casualty claims | 2,492,303 | 2,475,580 | 2,551,089 | 3.1% | 2.4% |
| Reserve for unearned premiums | 9,664,914 | 9,482,582 | 9,150,249 | -3.5% | -5.3% |
| Accounts payable to reinsurers | 317,185 | 414,506 | 343,959 | -17.0% | 8.4% |
| Financial liabilities at fair value through profit or loss | 313,256 | 232,185 | 527,541 | 127.2% | 68.4% |
| Other liabilities | 7,789,038 | 7,656,939 | 7,927,550 | 3.5% | 1.8% |
| | | | | | |
| Total Liabilities | 219,451,302 | 210,498,860 | 209,894,043 | -0.3% | -4.4% |
| | | | | | |
| Net equity | 25,073,706 | 25,192,569 | 26,175,222 | -2.6% | 4.4% |
| Capital stock | 1,318,993 | 1,318,993 | 1,318,993 | 0.0% | 0.0% |
| Treasury stock | (207,756) | (207,745) | (207,518) | -0.1% | -0.1% |
| Capital surplus | 224,103 | 215,071 | 231,179 | 1.7% | 3.2% |
| Reserves | 21,725,663 | 21,350,150 | 23,666,823 | 11.2% | 8.9% |
| Unrealized gains and losses | 677,159 | 19,435 | (1,098,325) | 144.4% | -262.2% |
| Retained earnings | 347,152 | 2,496,665 | 3,556,281 | -51.7% | 69.5% |
| | | | | | |
| Non-controlling interest | 503,222 | 528,905 | 545,456 | 3.1% | 8.4% |
| | | | | | |
| Total Net Equity | 25,576,928 | 27,401,531 | 26,720,678 | -2.5% | 4.5% |
| | | | | | |
| Total liabilities and equity | 245,028,230 | 237,900,391 | 236,614,721 | -0.5% | -3.4% |
| | | | | | |
| Off-balance sheet | 149,828,527 | 142,337,944 | 142,573,498 | 0.2% | -4.8% |
| Total performance bonds, stand-by and L/Cs. | 22,723,385 | 21,196,817 | 21,331,467 | 0.6% | -6.1% |
| Undrawn credit lines, advised but not committed | 91,280,633 | 80,155,277 | 84,820,503 | 5.8% | -7.1% |
| Total derivatives (notional) and others | 35,824,509 | 40,985,850 | 36,421,528 | -11.1% | 1.7% |
(1) Includes mainly accounts receivables from brokerage and others.
CREDICORP LTD. AND SUBSIDIARIES
CONSOLIDATED STATEMENT OF INCOME
(In S/ thousands, IFRS)
| | Quarter | % change | As of | % change |
| | 2Q21 | 1Q22 | 2Q22 | QoQ | YoY | Jun-21 | Jun-22 | Jun-21/ Jun-22 |
| Interest income and expense | | | | | | | | |
| Interest and dividend income | 2,891,579 | 3,172,346 | 3,488,113 | 10.0% | 20.6% | 5,707,652 | 6,660,459 | 16.7% |
Interest expense (1) | (582,537) | (638,256) | (747,673) | 17.1% | 28.3% | (1,275,227) | (1,385,929) | 8.7% |
| Net interest income | 2,309,042 | 2,534,090 | 2,740,440 | 8.1% | 18.7% | 4,432,425 | 5,274,530 | 19.0% |
| | | | | | | | | |
| Gross provision for credit losses on loan portfolio | (441,007) | (350,681) | (447,036) | 27.5% | 1.4% | (1,063,989) | (797,717) | -25.0% |
| Recoveries of written-off loans | 77,627 | 93,091 | 83,745 | -10.0% | 7.9% | 142,962 | 176,836 | 23.7% |
| Provision for credit losses on loan portfolio, net of recoveries | (363,380) | (257,590) | (363,291) | 41.0% | 0.0% | (921,027) | (620,881) | -32.6% |
| | | | | | | | | |
| Risk-adjusted net interest income | 1,945,662 | 2,276,500 | 2,377,149 | 4.4% | 22.2% | 3,511,398 | 4,653,649 | 32.5% |
| | | | | | | | | |
| Non-financial income | | | | | | | | |
| Fee income | 862,411 | 891,031 | 920,492 | 3.3% | 6.7% | 1,693,182 | 1,811,523 | 7.0% |
| Net gain on foreign exchange transactions | 232,668 | 262,196 | 253,941 | -3.1% | 9.1% | 412,557 | 516,137 | 25.1% |
| Net gain on sales of securities | (69,947) | (56,866) | (94,180) | n.a. | n.a. | (53,660) | (151,046) | 181.5% |
| Net gain from associates | 12,302 | 24,014 | 29,219 | 21.7% | 137.5% | 41,707 | 53,233 | 27.6% |
| Net gain on derivatives held for trading | 45,413 | (138) | 4,784 | -3566.7% | -89.5% | 115,136 | 4,646 | -96.0% |
| Net gain from exchange differences | 45,924 | (25,390) | 5,572 | n.a. | n.a. | 40,388 | (19,818) | -149.1% |
| Other non-financial income | 62,923 | 147,902 | 84,152 | -43.1% | 33.7% | 136,914 | 232,054 | 69.5% |
| Total non-financial income | 1,191,694 | 1,242,749 | 1,203,980 | -3.1% | 1.0% | 2,386,224 | 2,446,729 | 2.5% |
| | | | | | | | | |
| Insurance underwriting result | | | | | | | | |
| Net earned premiums | 639,944 | 690,536 | 695,547 | 0.7% | 8.7% | 1,283,872 | 1,386,083 | 8.0% |
| Net claims | (691,335) | (478,506) | (492,258) | 2.9% | -28.8% | (1,314,688) | (970,764) | -26.2% |
Acquisition cost (1) | (84,944) | (70,484) | (66,247) | -6.0% | -22.0% | (170,766) | (136,731) | -19.9% |
| Total insurance underwriting result | (136,335) | 141,546 | 137,042 | -3.2% | n.a. | (201,582) | 278,588 | -238.2% |
| | | | | | | | | |
| Total expenses | | | | | | | | |
| Salaries and employee benefits | (882,177) | (977,953) | (975,420) | -0.3% | 10.6% | (1,739,736) | (1,953,373) | 12.3% |
| Administrative, general and tax expenses | (672,805) | (725,539) | (850,972) | 17.3% | 26.5% | (1,253,647) | (1,576,511) | 25.8% |
| Depreciation and amortization | (163,869) | (164,514) | (168,845) | 2.6% | 3.0% | (330,634) | (333,359) | 0.8% |
| Association in participation | (8,879) | (7,691) | (10,329) | 34.3% | 16.3% | (22,785) | (18,020) | -20.9% |
| Other expenses | (132,717) | (74,485) | (49,244) | -33.9% | -62.9% | (193,916) | (123,729) | -36.2% |
| Total expenses | (1,860,447) | (1,950,182) | (2,054,810) | 5.4% | 10.4% | (3,540,718) | (4,004,992) | 13.1% |
| | | | | | | | | |
| Profit before income tax | 1,140,574 | 1,710,613 | 1,663,361 | -2.8% | 45.8% | 2,155,322 | 3,373,974 | 56.5% |
| | | | | | | | | |
| Income tax | (423,491) | (546,001) | (513,181) | -6.0% | 21.2% | (761,090) | (1,059,182) | 39.2% |
| | | | | | | | | |
| Net profit | 717,083 | 1,164,612 | 1,150,180 | -1.2% | 60.4% | 1,394,232 | 2,314,792 | 66.0% |
| Non-controlling interest | 17,614 | 27,786 | 28,420 | 2.3% | 61.3% | 33,965 | 56,206 | 65.5% |
| Net profit attributable to Credicorp | 699,469 | 1,136,826 | 1,121,760 | -1.3% | 60.4% | 1,360,267 | 2,258,586 | 66.0% |
(1) The acquisition cost of Pacifico includes net fees and underwriting expenses.
12.5.2. Credicorp Stand-alone
Credicorp Ltd.
Separate Statement of Financal Position
(S/ thousands, IFRS)
| | As of | % change |
| | Jun 21 | Mar 21 | Jun 22 | QoQ | YoY |
| ASSETS | | | | | |
| Cash and cash equivalents | 1,019,773 | 168,634 | 115,612 | -31.4% | -88.7% |
| At fair value through profit or loss | 520,413 | 947,826 | 938,816 | -1.0% | n.a |
| Fair value through other comprehensive income investments | 397,551 | 343,373 | 332,280 | -3.2% | -16.4% |
| In subsidiaries and associates investments | 29,354,310 | 31,647,183 | 31,251,710 | -1.2% | 6.5% |
| Other assets | 345 | 106 | 230 | 117.0% | -33.3% |
| | | | | | |
| Total Assets | 31,292,392 | 33,107,122 | 32,638,648 | -1.4% | 4.3% |
| | | | | | |
| LIABILITIES AND NET SHAREHOLDERS' EQUITY | | | | | |
| | | | | | |
| Due to banks, correspondents and other entities | - | - | 240,996 | n.a. | n.a. |
| Bonds and notes issued | 1,914,141 | 1,850,185 | 1,901,462 | 2.8% | -0.7% |
| Other liabilities | 149,936 | 195,286 | 164,451 | -15.8% | 9.7% |
| | | | | | |
| Total Liabilities | 2,064,077 | 2,045,471 | 2,306,909 | 12.8% | 11.8% |
| | | | | | |
| NET EQUITY | | | | | |
| Capital stock | 1,318,993 | 1,318,993 | 1,318,993 | 0.0% | 0.0% |
| Capital Surplus | 384,542 | 384,542 | 384,542 | 0.0% | 0.0% |
| Reserve | 21,417,403 | 20,945,491 | 23,300,350 | 11.2% | 8.8% |
| Unrealized results | 495,986 | (638,233) | (1,285,376) | n.a. | n.a. |
| Retained earnings | 5,611,391 | 9,050,858 | 6,613,230 | -26.9% | 17.9% |
| | | | | | |
| Total net equity | 29,228,315 | 31,061,651 | 30,331,739 | -2.3% | 3.8% |
| | | | | | |
| Total Liabilities And Equity | 31,292,392 | 33,107,122 | 32,638,648 | -1.4% | 4.3% |
| | Quarter | % change |
| | 2Q21 | 1Q22 | 2Q22 | QoQ | YoY |
| Interest income | | | | | |
| | | | | | |
| Net share of the income from investments in subsidiaries and associates | 725,297 | 1,236,032 | 1,425,812 | 15.4% | 96.6% |
| Interest and similar income | 7,062 | 298 | 7,056 | 2267.8% | -0.1% |
| Net gain on financial assets at fair value through profit or loss | 4,898 | (26,898) | (41,316) | 53.6% | n.a |
| Total income | 737,257 | 1,209,432 | 1,391,552 | 15.1% | 88.7% |
| | | | | | |
| Interest and similar expense | (14,357) | (13,651) | (14,778) | 8.3% | n.a |
| Administrative and general expenses | (3,832) | (4,259) | (3,766) | -11.6% | -1.7% |
| Total expenses | (18,189) | (17,910) | (18,544) | 3.5% | 2.0% |
| | | | | | |
| Operating income | 719,068 | 1,191,522 | 1,373,008 | 15.2% | 90.9% |
| | | | | | |
| Net gain (losses) from exchange differences | (15) | (145) | (752) | 418.6% | 4913.3% |
| Other, net | (10) | 232 | (13) | -105.6% | 30.0% |
| | | | | | |
| Profit before income tax | 719,043 | 1,191,609 | 1,372,243 | 15.2% | 90.8% |
| Income tax | (19,546) | (42,000) | (42,290) | 0.7% | n.a |
| Net income | 699,497 | 1,149,609 | 1,329,953 | 15.7% | 90.1% |
| | | | | | |
| Double Leverage Ratio | 100.43% | 101.89% | 103.03% | 115bps | 260bps |
BANCO DE CREDITO DEL PERU AND SUBSIDIARIES
CONSOLIDATED STATEMENT OF FINANCIAL POSITION
(In S/ thousands, IFRS)
| | As of | % change |
| | Jun 21 | Mar 22 | Jun 22 | QoQ | YoY |
| ASSETS | | | | | |
| Cash and due from banks | | | | | |
| Non-interest bearing | 6,919,815 | 4,959,579 | 5,236,507 | 5.6% | -24.3% |
| Interest bearing | 26,482,164 | 28,253,501 | 22,383,291 | -20.8% | -15.5% |
| Total cash and due from banks | 33,401,979 | 33,213,080 | 27,619,798 | -16.8% | -17.3% |
| | | | | |
| Cash collateral, reverse repurchase agreements and securities borrowing | 544,937 | 202,127 | 542,521 | 168.4% | -0.4% |
| | | | | |
| Fair value through profit or loss investments | 2,118,559 | 729,168 | 163,187 | -77.6% | -92.3% |
| Fair value through other comprehensive income investments | 25,716,257 | 20,202,882 | 17,868,118 | -11.6% | -30.5% |
| Amortized cost investments | 7,366,267 | 7,538,562 | 7,630,677 | 1.2% | 3.6% |
| | | | | |
| Loans | 130,864,182 | 132,578,949 | 138,012,365 | 4.1% | 5.5% |
| Current | 126,045,797 | 126,930,472 | 132,146,911 | 4.1% | 4.8% |
| Internal overdue loans | 4,818,385 | 5,648,477 | 5,865,454 | 3.8% | 21.7% |
| Less - allowance for loan losses | (8,797,871) | (7,769,920) | (7,813,526) | 0.6% | -11.2% |
| Loans, net | 122,066,311 | 124,809,029 | 130,198,839 | 4.3% | 6.7% |
| | | | | | |
Property, furniture and equipment, net (1) | 1,729,286 | 1,628,645 | 1,593,758 | -2.1% | -7.8% |
| Due from customers on acceptances | 532,584 | 532,404 | 524,448 | -1.5% | -1.5% |
| Investments in associates | 18,901 | 31,859 | 26,411 | -17.1% | 39.7% |
Other assets (2) | 6,455,086 | 6,321,863 | 6,100,840 | -3.5% | -5.5% |
| | | | | | |
| Total Assets | 200,246,075 | 194,945,753 | 193,370,326 | -0.8% | -3.4% |
| | | | | |
| Liabilities and Equity | | | | | |
| Deposits and obligations | | | | | |
Non-interest bearing (1) | 45,881,848 | 45,297,294 | 40,994,205 | -9.5% | -10.7% |
Interest bearing (1) | 86,547,213 | 85,125,304 | 88,145,130 | 3.5% | 1.8% |
| Total deposits and obligations | 132,429,061 | 130,422,598 | 129,139,335 | -1.0% | -2.5% |
| | | | | | |
| Payables from repurchase agreements and securities lending | 23,879,115 | 18,064,487 | 16,578,846 | -8.2% | -30.6% |
| BCRP instruments | 23,329,990 | 17,532,350 | 16,031,618 | -8.6% | -31.3% |
| Repurchase agreements with third parties | 549,125 | 532,137 | 547,228 | 2.8% | -0.3% |
| Due to banks and correspondents | 5,636,702 | 5,872,463 | 5,963,573 | 1.6% | 5.8% |
| Bonds and notes issued | 14,368,316 | 13,575,977 | 14,093,426 | 3.8% | -1.9% |
| Banker’s acceptances outstanding | 558,934 | 524,448 | 743,925 | 41.8% | 33.1% |
| Financial liabilities at fair value through profit or loss | 84,071 | - | 210,393 | 0.0% | 150.3% |
Other liabilities (3) | 4,261,450 | 6,211,275 | 5,512,852 | -11.2% | 29.4% |
| Total Liabilities | 181,217,649 | 174,671,248 | 172,242,350 | -1.4% | -5.0% |
| | | | | | |
| Net equity | 18,908,512 | 20,140,022 | 20,987,313 | 4.2% | 11.0% |
| Capital stock | 11,024,006 | 11,882,984 | 11,882,984 | 0.0% | 7.8% |
| Reserves | 6,488,969 | 7,297,648 | 7,298,035 | 0.0% | 12.5% |
| Unrealized gains and losses | (123,542) | (780,063) | (1,089,747) | n.a. | n.a. |
| Retained earnings | 1,519,079 | 1,739,453 | 2,896,041 | 66.5% | 90.6% |
| | | | | | |
| Non-controlling interest | 119,914 | 134,483 | 140,663 | 4.6% | 17.3% |
| | | | | | |
| Total Net Equity | 19,028,426 | 20,274,505 | 21,127,976 | 4.2% | 11.0% |
| | | | | |
| Total liabilities and equity | 200,246,075 | 194,945,753 | 193,370,326 | -0.8% | -3.4% |
| | | | | |
| Off-balance sheet | 131,540,506 | 131,406,579 | 130,782,706 | -0.5% | -0.6% |
| Total performance bonds, stand-by and L/Cs. | 21,228,772 | 19,638,213 | 19,490,337 | -0.8% | -8.2% |
| Undrawn credit lines, advised but not committed | 75,964,511 | 70,893,784 | 74,845,631 | 5.6% | -1.5% |
| Total derivatives (notional) and others | 34,347,223 | 40,874,582 | 36,446,738 | -10.8% | 6.1% |
(1) Right of use asset of lease contracts is included by application of IFRS 16.
(2) Mainly includes intangible assets, other receivable accounts and tax credit.
(3) Mainly includes other payable accounts.
BANCO DE CREDITO DEL PERU AND SUBSIDIARIES
CONSOLIDATED STATEMENT OF INCOME
(In S/ thousands, IFRS)
| | Quarter | % change | As of | % change |
| | 2Q21 | 1Q22 | 2Q22 | QoQ | YoY | Jun 21 | Jun 22 | Jun 22 / Jun 21 |
| Interest income and expense | | | | | | | | |
| Interest and dividend income | 2,446,731 | 2,712,960 | 2,988,885 | 10.2% | 22.2% | 4,854,728 | 5,701,845 | 17.4% |
| Interest expense | (438,943) | (494,035) | (590,599) | 19.5% | 34.6% | (993,951) | (1,084,634) | 9.1% |
| Net interest income | 2,007,788 | 2,218,925 | 2,398,286 | 8.1% | 19.4% | 3,860,777 | 4,617,211 | 19.6% |
| | | | | | | | |
| Provision for credit losses on loan portfolio | (480,116) | (340,235) | (400,124) | 17.6% | -16.7% | (1,065,373) | (740,359) | -30.5% |
| Recoveries of written-off loans | 73,023 | 86,428 | 77,244 | -10.6% | 5.8% | 134,119 | 163,672 | 22.0% |
| Provision for credit losses on loan portfolio, net of recoveries | (407,093) | (253,807) | (322,880) | 27.2% | -20.7% | (931,254) | (576,687) | -38.1% |
| | | | | | | | |
| Risk-adjusted net interest income | 1,600,695 | 1,965,118 | 2,075,406 | 5.6% | 29.7% | 2,929,523 | 4,040,524 | 37.9% |
| | | | | | | | | |
| Non-financial income | | | | | | | | |
| Fee income | 648,980 | 731,705 | 753,835 | 3.0% | 16.2% | 1,280,758 | 1,485,540 | 16.0% |
| Net gain on foreign exchange transactions | 240,553 | 242,504 | 243,566 | 0.4% | 1.3% | 414,018 | 486,070 | 17.4% |
| Net gain (loss) on securities | (130,474) | (1,898) | (2,611) | 37.6% | -98.0% | (88,362) | (4,509) | -94.9% |
| Net gain (loss) on derivatives held for trading | 31,844 | (10,978) | (19,037) | 73.4% | -159.8% | 44,164 | (30,015) | -168.0% |
| Net gain (loss) from exchange differences | 56,816 | (17,051) | 9,043 | -153.0% | -84.1% | 53,995 | (8,008) | -114.8% |
| Others | 41,734 | 120,328 | 46,354 | -61.5% | 11.1% | 100,126 | 166,682 | 66.5% |
| Total other income | 889,453 | 1,064,610 | 1,031,150 | -3.1% | 15.9% | 1,804,699 | 2,095,760 | 16.1% |
| | | | | | | | | |
| Total expenses | | | | | | | | |
| Salaries and employee benefits | (632,636) | (694,339) | (688,691) | -0.8% | 8.9% | (1,235,811) | (1,383,030) | 11.9% |
| Administrative expenses | (516,669) | (532,560) | (638,366) | 19.9% | 23.6% | (950,386) | (1,170,926) | 23.2% |
| Depreciation and amortization | (125,592) | (126,426) | (130,253) | 3.0% | 3.7% | (253,170) | (256,679) | 1.4% |
| Other expenses | (59,093) | (49,556) | (52,035) | 5.0% | -11.9% | (108,269) | (101,591) | -6.2% |
| Total expenses | (1,333,990) | (1,402,881) | (1,509,345) | 7.6% | 13.1% | (2,547,636) | (2,912,226) | 14.3% |
| | | | | | | | | |
| Profit before income tax | 1,156,158 | 1,626,847 | 1,597,211 | -1.8% | 38.1% | 2,186,586 | 3,224,058 | 47.4% |
| | | | | | | | | |
| Income tax | (356,194) | (466,694) | (434,823) | -6.8% | 22.1% | (630,992) | (901,517) | 42.9% |
| | | | | | | | | |
| Net profit | 799,964 | 1,160,153 | 1,162,388 | 0.2% | 45.3% | 1,555,594 | 2,322,541 | 49.3% |
| Non-controlling interest | (2,742) | (5,157) | (6,426) | 24.6% | 134.4% | (3,322) | (11,583) | 248.7% |
| Net profit attributable to BCP Consolidated | 797,222 | 1,154,996 | 1,155,962 | 0.1% | 45.0% | 1,552,272 | 2,310,958 | 48.9% |
BANCO DE CREDITO DEL PERU AND SUBSIDIARIES
SELECTED FINANCIAL INDICATORS
| | Quarter | As of |
| | 2Q21 | 1Q22 | 2Q22 | Jun 21 | Jun 22 |
| Profitability | | | | | |
Earnings per share (1) | 0.065 | 0.095 | 0.095 | 0.127 | 0.190 |
ROAA (2)(3) | 1.6% | 2.3% | 2.4% | 1.6% | 2.4% |
ROAE (2)(3) | 17.2% | 22.7% | 22.5% | 16.7% | 22.5% |
Net interest margin (2)(3) | 4.12% | 4.63% | 5.10% | 4.02% | 4.91% |
Risk adjusted NIM (2)(3) | 3.28% | 4.10% | 4.41% | 3.05% | 4.30% |
Funding Cost (2)(3)(4) | 0.99% | 1.16% | 1.42% | 1.14% | 1.30% |
| | | | | | |
| Quality of loan portfolio | | | | | |
| IOL ratio | 3.68% | 4.26% | 4.25% | 3.68% | 4.25% |
| NPL ratio | 5.03% | 5.52% | 5.44% | 5.03% | 5.44% |
| Coverage of IOLs | 182.6% | 137.6% | 133.2% | 182.6% | 133.2% |
| Coverage of NPLs | 133.7% | 106.2% | 104.0% | 133.7% | 104.0% |
Cost of risk (5) | 1.24% | 0.77% | 0.94% | 1.42% | 0.84% |
| | | | | | |
| Operating efficiency | | | | | |
Oper. expenses as a percent. of total income - reported (6) | 42.7% | 42.8% | 43.0% | 43.1% | 42.9% |
Oper. expenses as a percent. of av. tot. assets (2)(3)(6) | 2.54% | 2.75% | 3.00% | 2.5% | 2.9% |
| | | | | | |
| Share Information | | | | | |
| N° of outstanding shares (Million) | 12,176 | 12,176 | 12,176 | 12,176 | 12,176 |
(1) Shares outstanding of 12,176 million is used for all periods since shares have been issued only for capitalization of profits.
(2) Ratios are annualized.
(3) Averages are determined as the average of period-beginning and period-ending balances.
(4) The funding costs differs from previously reported due to a methodoloy change in the denominator, which no longer includes the following accounts: acceptances outstanding, reserves for property and casualty claims, reserve for unearned premiums, reinsurance payable and other liabilities.
(5) Cost of risk: Annualized provision for loan losses / Total loans.
(6) Total income includes net interest income, fee income, net gain on foreign exchange transactions, result on exchange difference and net gain on derivatives. Operating expenses includes Salaries and social benefits, administrative, general and tax expenses and depreciation and amortization.
BANCO DE CREDITO DEL PERU
STATEMENT OF FINANCIAL POSITION
(S/ thousands, IFRS)
| | As of | % change |
| | Jun 21 | Mar 22 | Jun 22 | QoQ | YoY |
| ASSETS | | | | | |
| Cash and due from banks | | | | | |
| Non-interest bearing | 6,919,815 | 4,959,579 | 5,236,507 | 5.6% | -24.3% |
| Interest bearing | 26,482,164 | 28,253,501 | 22,383,291 | -20.8% | -15.5% |
| Total cash and due from banks | 33,401,979 | 33,213,080 | 27,619,798 | -16.8% | -17.3% |
| | | | | | |
| Cash collateral, reverse repurchase agreements and securities borrowing | 544,937 | 202,127 | 542,521 | 168.4% | -0.4% |
| | | | | | |
| Fair value through profit or loss investments | 2,118,559 | 729,168 | 163,187 | -77.6% | -92.3% |
| Fair value through other comprehensive income investments | 25,716,257 | 20,202,882 | 17,868,118 | -11.6% | -30.5% |
| Amortized cost investments | 7,366,267 | 7,538,562 | 7,630,677 | 1.2% | 3.6% |
| | | | | | |
| Loans | 130,864,182 | 132,578,949 | 138,012,365 | 4.1% | 5.5% |
| Current | 126,045,797 | 126,930,472 | 132,146,911 | 4.1% | 4.8% |
| Internal overdue loans | 4,818,385 | 5,648,477 | 5,865,454 | 3.8% | 21.7% |
| Less - allowance for loan losses | (8,797,871) | (7,769,920) | (7,813,526) | 0.6% | -11.2% |
| Loans, net | 122,066,311 | 124,809,029 | 130,198,839 | 4.3% | 6.7% |
| | | | | | |
Property, furniture and equipment, net (1) | 1,729,286 | 1,628,645 | 1,593,758 | -2.1% | -7.8% |
| Due from customers on acceptances | 532,584 | 532,404 | 524,448 | -1.5% | -1.5% |
| Investments in associates | 18,901 | 31,859 | 26,411 | -17.1% | 39.7% |
Other assets (2) | 6,455,086 | 6,321,863 | 6,100,840 | -3.5% | -5.5% |
| | | | | | |
| Total Assets | 200,246,075 | 194,945,753 | 193,370,326 | -0.8% | -3.4% |
| | | | | | |
| Liabilities and Equity | | | | | |
| Deposits and obligations | | | | | |
Non-interest bearing (1) | 45,881,848 | 45,297,294 | 40,994,205 | -9.5% | -10.7% |
Interest bearing (1) | 86,547,213 | 85,125,304 | 88,145,130 | 3.5% | 1.8% |
| Total deposits and obligations | 132,429,061 | 130,422,598 | 129,139,335 | -1.0% | -2.5% |
| | | | | | |
| Payables from repurchase agreements and securities lending | 23,879,115 | 18,064,487 | 16,578,846 | -8.2% | -30.6% |
| BCRP instruments | 23,329,990 | 17,532,350 | 16,031,618 | -8.6% | -31.3% |
| Repurchase agreements with third parties | 549,125 | 532,137 | 547,228 | 2.8% | -0.3% |
| Due to banks and correspondents | 5,636,702 | 5,872,463 | 5,963,573 | 1.6% | 5.8% |
| Bonds and notes issued | 14,368,316 | 13,575,977 | 14,093,426 | 3.8% | -1.9% |
| Banker’s acceptances outstanding | 558,934 | 524,448 | 743,925 | 41.8% | 33.1% |
| Financial liabilities at fair value through profit or loss | 84,071 | - | 210,393 | 0.0% | 150.3% |
Other liabilities (3) | 4,261,450 | 6,211,275 | 5,512,852 | -11.2% | 29.4% |
| Total Liabilities | 181,217,649 | 174,671,248 | 172,242,350 | -1.4% | -5.0% |
| | | | | | |
| Net equity | 18,908,512 | 20,140,022 | 20,987,313 | 4.2% | 11.0% |
| Capital stock | 11,024,006 | 11,882,984 | 11,882,984 | 0.0% | 7.8% |
| Reserves | 6,488,969 | 7,297,648 | 7,298,035 | 0.0% | 12.5% |
| Unrealized gains and losses | (123,542) | (780,063) | (1,089,747) | n.a. | n.a. |
| Retained earnings | 1,519,079 | 1,739,453 | 2,896,041 | 66.5% | 90.6% |
| | | | | | |
| Non-controlling interest | 119,914 | 134,483 | 140,663 | 4.6% | 17.3% |
| | | | | | |
| Total Net Equity | 19,028,426 | 20,274,505 | 21,127,976 | 4.2% | 11.0% |
| | | | | | |
| Total liabilities and equity | 200,246,075 | 194,945,753 | 193,370,326 | -0.8% | -3.4% |
| | | | | | |
| Off-balance sheet | 131,540,506 | 131,406,579 | 130,782,706 | -0.5% | -0.6% |
| Total performance bonds, stand-by and L/Cs. | 21,228,772 | 19,638,213 | 19,490,337 | -0.8% | -8.2% |
| Undrawn credit lines, advised but not committed | 75,964,511 | 70,893,784 | 74,845,631 | 5.6% | -1.5% |
| Total derivatives (notional) and others | 34,347,223 | 40,874,582 | 36,446,738 | -10.8% | 6.1% |
(1) Right of use asset of lease contracts is included by application of IFRS 16.
(2) Mainly includes intangible assets, other receivable accounts and tax credit.
(3) Mainly includes other payable accounts.
12.5.4. BCP Stand-alone
BANCO DE CREDITO DEL PERU
STATEMENT OF FINANCIAL POSITION
(S/ thousands, IFRS)
| | As of | % change |
| | Jun 21 | Mar 22 | Jun 22 | QoQ | YoY |
| ASSETS | | | | | |
| Cash and due from banks | | | | | |
| Non-interest bearing | 6,413,791 | 4,429,348 | 4,596,609 | 3.8% | -28.3% |
| Interest bearing | 25,585,201 | 27,448,742 | 21,860,250 | -20.4% | -14.6% |
| Total cash and due from banks | 31,998,992 | 31,878,090 | 26,456,859 | -17.0% | -17.3% |
| | | | | | |
| Cash collateral, reverse repurchase agreements and securities borrowing | 544,937 | 202,127 | 542,521 | 168.4% | -0.4% |
| | | | | | |
| Fair value through profit or loss investments | 2,118,559 | 729,168 | 163,187 | -77.6% | -92.3% |
| Fair value through other comprehensive income investments | 24,477,519 | 18,749,758 | 16,569,716 | -11.6% | -32.3% |
| Amortized cost investments | 7,071,197 | 7,249,994 | 7,331,851 | 1.1% | 3.7% |
| | | | | | |
| Loans | 118,872,541 | 120,541,004 | 125,535,209 | 4.1% | 5.6% |
| Current | 115,221,323 | 115,852,249 | 120,657,794 | 4.1% | 4.7% |
| Internal overdue loans | 3,651,218 | 4,688,755 | 4,877,415 | 4.0% | 33.6% |
| Less - allowance for loan losses | (7,124,855) | (6,616,033) | (6,636,936) | 0.3% | -6.8% |
| Loans, net | 111,747,686 | 113,924,971 | 118,898,273 | 4.4% | 6.4% |
| | | | | | |
Property, furniture and equipment, net (1) | 1,359,061 | 1,314,065 | 1,291,209 | -1.7% | -5.0% |
| Due from customers on acceptances | 558,934 | 524,448 | 743,925 | 41.8% | 33.1% |
| Investments in associates | 2,142,791 | 2,429,540 | 2,541,615 | 4.6% | 18.6% |
Other assets (2) | 5,836,135 | 5,360,983 | 6,295,694 | 17.4% | 7.9% |
| | | | | | |
| Total Assets | 187,855,811 | 182,363,144 | 180,834,850 | -0.8% | -3.7% |
| | | | | | |
| Liabilities and Equity | | | | | |
| Deposits and obligations | | | | | |
| Non-interest bearing | 45,880,454 | 45,294,239 | 40,978,979 | -9.5% | -10.7% |
| Interest bearing | 78,320,355 | 76,416,598 | 79,282,172 | 3.7% | 1.2% |
| Total deposits and obligations | 124,200,809 | 121,710,837 | 120,261,151 | -1.2% | -3.2% |
| | | | | | |
| Payables from repurchase agreements and securities lending | 21,394,306 | 16,093,566 | 14,886,829 | -7.5% | -30.4% |
| BCRP instruments | 20,845,181 | 15,561,430 | 14,339,601 | -7.9% | -31.2% |
| Repurchase agreements with third parties | 549,125 | 532,137 | 547,228 | 2.8% | -0.3% |
| Due to banks and correspondents | 4,830,856 | 4,905,616 | 4,946,046 | 0.8% | 2.4% |
| Bonds and notes issued | 14,179,541 | 13,319,276 | 13,833,991 | 3.9% | -2.4% |
| Banker’s acceptances outstanding | 558,934 | 524,448 | 743,925 | 41.8% | 33.1% |
| Financial liabilities at fair value through profit or loss | 84,071 | - | 210,393 | 0.0% | 150.3% |
Other liabilities (3) | 3,695,174 | 5,668,164 | 4,963,871 | -12.4% | 34.3% |
| Total Liabilities | 168,943,691 | 162,221,907 | 159,846,206 | -1.5% | -5.4% |
| | | | | | |
| Net equity | 18,912,120 | 20,141,237 | 20,988,644 | 4.2% | 11.0% |
| Capital stock | 11,024,006 | 11,882,984 | 11,882,984 | 0.0% | 7.8% |
| Reserves | 6,488,969 | 7,297,648 | 7,298,035 | 0.0% | 12.5% |
| Unrealized gains and losses | (123,542) | (780,063) | (1,089,747) | 39.7% | 782.1% |
| Retained earnings | 1,522,687 | 1,740,668 | 2,897,372 | 66.5% | 90.3% |
| | | | | | |
| Total Net Equity | 18,912,120 | 20,141,237 | 20,988,644 | 4.2% | 11.0% |
| | | | | | |
| Total liabilities and equity | 187,855,811 | 182,363,144 | 180,834,850 | -0.8% | -3.7% |
| | | | | | |
| Off-balance sheet | 119,457,875 | 127,873,817 | 131,117,219 | 2.5% | 9.8% |
| Total performance bonds, stand-by and L/Cs. | 21,229,047 | 19,638,213 | 19,490,337 | -0.8% | -8.2% |
| Undrawn credit lines, advised but not committed | 75,613,731 | 68,137,602 | 71,528,880 | 5.0% | -5.4% |
| Total derivatives (notional) and others | 22,615,097 | 40,098,002 | 40,098,002 | 0.0% | 77.3% |
(1) Mainly includes intangible assets, other receivable accounts and tax credit.
(2) Mainly includes other payable accounts.
BANCO DE CREDITO DEL PERU
STATEMENT OF INCOME
(S/ thousands, IFRS)
| | Quarter | % change | As of | % change |
| | 2Q21 | 1Q22 | 2Q22 | QoQ | YoY | Jun 21 | Jun 22 | Jun 22 / Jun 21 |
| Interest income and expense | | | | | | | | |
| Interest and dividend income | 1,930,221 | 2,120,216 | 2,340,804 | 10.4% | 21.3% | 3,869,970 | 4,461,020 | 15.3% |
Interest expense (1) | (382,994) | (414,863) | (481,139) | 16.0% | 25.6% | (875,093) | (896,002) | 2.4% |
| Net interest income | 1,547,227 | 1,705,353 | 1,859,665 | 9.0% | 20.2% | 2,994,877 | 3,565,018 | 19.0% |
| | | | | | | | | |
| Provision for credit losses on loan portfolio | (337,668) | (202,768) | (268,439) | 32.4% | -20.5% | (773,046) | (471,207) | -39.0% |
| Recoveries of written-off loans | 55,807 | 56,125 | 51,155 | -8.9% | -8.3% | 105,832 | 107,280 | 1.4% |
| Provision for credit losses on loan portfolio, net of recoveries | (281,861) | (146,643) | (217,284) | 48.2% | -22.9% | (667,214) | (363,927) | -45.5% |
| | | | | | | | | |
| Risk-adjusted net interest income | 1,265,366 | 1,558,710 | 1,642,381 | 5.4% | 29.8% | 2,327,663 | 3,201,091 | 37.5% |
| | | | | | | | | |
| Other income | | | | | | | | |
| Fee income | 637,821 | 706,861 | 727,644 | 2.9% | 14.1% | 1,252,244 | 1,434,505 | 14.6% |
| Net gain on foreign exchange transactions | 238,775 | 238,738 | 240,387 | 0.7% | 0.7% | 411,264 | 479,125 | 16.5% |
| Net gain (losses) on securities | (130,488) | 90,463 | 112,761 | 24.6% | -186.4% | (88,525) | 203,224 | -329.6% |
| Net gain from associates | 52,809 | 5,701 | 7,421 | n.a. | n.a. | 66,919 | 13,122 | n.a. |
| Net gain (losses) on derivatives held for trading | 31,076 | (9,976) | (16,568) | 66.1% | -153.3% | 42,904 | (26,544) | -161.9% |
| Net gain (losses) from exchange differences | 55,219 | (10,017) | 7,249 | n.a. | n.a. | 52,167 | (2,768) | -105.3% |
| Others | 41,144 | 110,750 | 45,276 | -59.1% | 10.0% | 91,075 | 156,026 | 71.3% |
| Total other income | 926,356 | 1,132,520 | 1,124,170 | -0.7% | 21.4% | 1,828,048 | 2,256,690 | 23.4% |
| | | | | | | | |
| Total expenses | | | | | | | | |
| Salaries and employee benefits | (444,586) | (501,213) | (487,698) | -2.7% | 9.7% | (862,983) | (988,911) | 14.6% |
| Administrative expenses | (461,867) | (463,927) | (575,071) | 24.0% | 24.5% | (841,499) | (1,038,998) | 23.5% |
Depreciation and amortization (2) | (104,592) | (105,859) | (109,824) | 3.7% | 5.0% | (208,456) | (215,683) | 3.5% |
| Other expenses | (50,765) | (43,686) | (46,381) | 6.2% | -8.6% | (92,958) | (90,067) | -3.1% |
| Total expenses | (1,061,810) | (1,114,685) | (1,218,974) | 9.4% | 14.8% | (2,005,896) | (2,333,659) | 16.3% |
| | | | | | | | | |
| Profit before income tax | 1,129,912 | 1,576,545 | 1,547,577 | -1.8% | 37.0% | 2,149,815 | 3,124,122 | 45.3% |
| | | | | | | | | |
| Income tax | (332,151) | (420,120) | (391,499) | -6.8% | 17.9% | (596,536) | (811,619) | 36.1% |
| | | | | | | | | |
| Net profit attributable to BCP Stand-alone | 797,761 | 1,156,425 | 1,156,078 | 0.0% | 44.9% | 1,553,279 | 2,312,503 | 48.9% |
BANCO DE CREDITO DEL PERU
SELECTED FINANCIAL INDICATORS
| | Quarter | As od |
| | 2Q21 | 1Q22 | 2Q22 | Jun 21 | Jun 22 |
| Profitability | | | | | |
ROAA (2)(3) | 1.7% | 2.5% | 2.5% | 1.7% | 2.5% |
ROAE (2)(3) | 17.2% | 22.7% | 22.5% | 16.7% | 22.5% |
Net interest margin (2)(3) | 3.43% | 3.85% | 4.29% | 3.38% | 4.11% |
Risk adjusted NIM (2)(3) | 2.81% | 3.52% | 3.79% | 2.63% | 3.69% |
Funding Cost (2)(3)(4) | 0.93% | 1.04% | 1.24% | 1.08% | 1.16% |
| | - | - | - |
|
|
| Quality of loan portfolio | | | | | |
| IOL ratio | 3.07% | 3.89% | 3.89% | 3.07% | 3.89% |
| NPL ratio | 4.50% | 5.22% | 5.13% | 4.50% | 5.13% |
| Coverage of IOLs | 195.1% | 141.1% | 136.1% | 195.1% | 136.1% |
| Coverage of NPLs | 133.1% | 105.2% | 103.0% | 133.1% | 103.0% |
Cost of risk (5) | 0.95% | 0.49% | 0.69% | 1.12% | 0.58% |
| |
| | | | |
| Operating efficiency |
|
|
| | |
Oper. expenses as a percent. of total income - reported (6) | 40.3% | 40.6% | 41.5% | 40.2% | 4.1% |
Oper. expenses as a percent. of av. tot. assets (2)(3)(6) | 2.15% | 2.32% | 2.58% | 2.06% | 2.47% |
(1) Shares outstanding of 12,176 million is used for all periods since shares have been issued only for capitalization of profits.
(2) Ratios are annualized.
(3) Averages are determined as the average of period-beginning and period-ending balances.
(4) The funding costs differs from previously reported due to a methodology change in the denominator, which no longer includes the following accounts: acceptances outstanding, reserves for property and casualty claims, reserve for unearned premiums, reinsurance payable and other liabilities.
(5) Cost of risk: Annualized provision for loan losses / Total loans.
(6) Total income includes net interest income, fee income, net gain on foreign exchange transactions, result on exchange difference and net gain on derivatives. Operating expenses includes Salaries and social benefits, administrative, general and tax expenses and depreciation and amortization.
12.5.5. BCP Bolivia
BCP BOLIVIA
(S/ thousands, IFRS)
| | As of | % change |
| | Jun 21 | Mar 21 | Jun 22 | QoQ | YoY |
| ASSETS | | | | | |
| Cash and due from banks | 2,228,226 | 2,220,657 | 2,308,217 | 3.9% | 3.6% |
| Investments | 1,671,904 | 1,598,725 | 1,562,065 | -2.3% | -6.6% |
| Total loans | 9,197,759 | 8,890,948 | 9,208,057 | 3.6% | 0.1% |
| Current | 9,045,300 | 8,688,239 | 8,987,381 | 3.4% | -0.6% |
| Internal overdue loans | 112,005 | 170,937 | 191,007 | 11.7% | 70.5% |
| Refinanced | 40,455 | 31,772 | 29,669 | -6.6% | -26.7% |
| Allowance for loan losses | (433,953) | (404,078) | (413,446) | 2.3% | -4.7% |
| Net loans | 8,763,806 | 8,486,870 | 8,794,611 | 3.6% | 0.4% |
| Property, plant and equipment, net | 56,091 | 62,645 | 64,017 | 2.2% | 14.1% |
| Other assets | 393,292 | 368,350 | 350,795 | -4.8% | -10.8% |
| Total assets | 13,113,320 | 12,737,246 | 13,079,705 | 2.7% | -0.3% |
| | | | | | |
| LIABILITIES AND NET SHAREHOLDERS' EQUITY | | | | | |
| Deposits and obligations | 11,057,286 | 10,678,175 | 10,955,468 | 2.6% | -0.9% |
| Due to banks and correspondents | 119,795 | 89,938 | 86,639 | -3.7% | -27.7% |
| Bonds and subordinated debt | 178,578 | 171,787 | 178,395 | 3.8% | -0.1% |
| Other liabilities | 994,580 | 1,007,946 | 1,038,527 | 3.0% | 4.4% |
| Total liabilities | 12,350,240 | 11,947,847 | 12,259,029 | 2.6% | -0.7% |
| | | | | | |
| Net equity | 763,080 | 789,399 | 820,677 | 4.0% | 7.5% |
| | | | | | |
| TOTAL LIABILITIES AND NET SHAREHOLDERS' EQUITY | 13,113,320 | 12,737,246 | 13,079,705 | 2.7% | -0.3% |
| | Quarter | % change | As of | % change |
| | 2Q21 | 1Q22 | 2Q22 | QoQ | YoY | Jun 21 | Jun 22 | Jun 22/ Jun 21 |
| Net interest income | 79,897 | 81,157 | 82,086 | 1.1% | 2.7% | 181,692 | 336,530 | 85.2% |
| Provision for loan losses, net of recoveries | 49,116 | 2,858 | (31,509) | -1202.4% | -164.2% | (245,311) | (5,535) | -97.7% |
| Net interest income after provisions | 129,012 | 84,015 | 50,577 | -39.8% | -60.8% | -63,619 | 330,995 | n.a. |
| Non-financial income | 37,598 | 39,645 | 43,982 | 10.9% | 17.0% | 110,151 | 166,326 | 51.0% |
| Total expenses | (127,985) | (72,563) | (44,296) | -39.0% | -65.4% | (260,356) | (361,989) | 39.0% |
| Translation result | 21 | 17 | (41) | -343.2% | -297.3% | 134 | (70) | n.a. |
| Income taxes | (23,486) | (30,640) | (33,364) | 8.9% | 42.1% | 139,434 | (62,994) | n.a. |
| Net income | 15,161 | 20,474 | 16,859 | 17.7% | 11.2% | (74,257) | 72,267 | n.a. |
| | | | | | | | | |
| Efficiency ratio | 58.9% | 59.9% | 58.0% | -190 pbs | -90 pbs | 59.3% | 58.9% | -40 pbs |
| ROAE | 8.2% | 10.1% | 8.4% | -170 pbs | 20 pbs | -10.4% | 9.5% | 1987 pbs |
| L/D ratio | 83.2% | 83.3% | 84.0% | 70 pbs | 87 pbs | | | |
| IOL ratio | 1.22% | 1.92% | 2.07% | 20 pbs | 85 pbs | | | |
| NPL ratio | 1.66% | 2.28% | 2.40% | 10 pbs | 74 pbs | | | |
| Coverage of IOLs | 387.4% | 236.4% | 216.5% | -1990 pbs | -17098 pbs | | | |
| Coverage of NPLs | 284.6% | 199.3% | 187.4% | -1190 pbs | -9729 pbs | | | |
| Branches | 48 | 45 | 45 | 0 | -3 | | | |
| Agentes | 851 | 1078 | 1090 | 12 | 239 | | | |
| ATMs | 305 | 310 | 312 | 2 | 7 | | | |
| Employees | 1,564 | 1,586 | 1,604 | 18 | 40 | | | |
12.5.6. Mibanco
MIBANCO
(In S/ thousands, IFRS)
| | As of | % change |
| | Jun 21 | Mar 22 | Jun 22 | QoQ | YoY |
| ASSETS | | | | | |
| Cash and due from banks | 1,477,527 | 1,400,085 | 1,242,267 | -11.3% | -15.9% |
| Investments | 1,533,808 | 1,746,228 | 1,597,228 | -8.5% | 4.1% |
| Total loans | 13,039,316 | 13,983,905 | 14,434,898 | 3.2% | 10.7% |
| Current | 11,824,810 | 12,965,841 | 13,379,071 | 3.2% | 13.1% |
| Internal overdue loans | 1,158,977 | 951,029 | 979,685 | 3.0% | -15.5% |
| Refinanced | 55,529 | 67,035 | 76,142 | 13.6% | 37.1% |
| Allowance for loan losses | -1,662,457 | -1,146,067 | -1,168,604 | 2.0% | -29.7% |
| Net loans | 11,376,859 | 12,837,838 | 13,266,294 | 3.3% | 16.6% |
| Property, plant and equipment, net | 148,899 | 139,875 | 136,399 | -2.5% | -8.4% |
| Other assets | 1,075,526 | 854,944 | 823,401 | -3.7% | -23.4% |
| Total assets | 15,612,618 | 16,978,970 | 17,065,588 | 0.5% | 9.3% |
| | | | | | |
| LIABILITIES AND NET SHAREHOLDERS' EQUITY |
| | | | |
| Deposits and obligations | 8,292,913 | 8,782,960 | 8,956,909 | 2.0% | 8.0% |
| Due to banks and correspondents | 1,898,921 | 2,952,092 | 3,014,403 | 2.1% | 58.7% |
| Bonds and subordinated debt | 188,775 | 256,701 | 259,436 | 1.1% | 37.4% |
| Other liabilities | 3,058,752 | 2,523,136 | 2,247,632 | -10.9% | -26.5% |
| Total liabilities | 13,439,362 | 14,514,889 | 14,478,379 | -0.3% | 7.7% |
| | | | | | |
| Net equity | 2,173,257 | 2,464,082 | 2,587,209 | 5.0% | 19.0% |
| | | | | | |
| TOTAL LIABILITIES AND NET SHAREHOLDERS' EQUITY | 15,612,618 | 16,978,970 | 17,065,588 | 0.5% | 9.3% |
| | Quarter | % change | As of | % change |
| | 2Q21 | 1Q22 | 2Q22 | QoQ | YoY | Jun 21 | Jun 22 | Jun 22/ Jun 21 |
| Net interest income | 458,762 | 512,222 | 537,262 | 4.9% | 17.1% | 862,169 | 1,049,484 | 21.7% |
| Provision for loan losses, net of recoveries | -124,451 | -105,337 | -105,522 | 0.2% | -15.2% | -263,169 | -210,859 | -19.9% |
| Net interest income after provisions | 334,311 | 406,885 | 431,740 | 6.1% | 29.1% | 599,000 | 838,625 | 40.0% |
| Non-financial income | 16,552 | 30,620 | 29,708 | -3.0% | 79.5% | 44,891 | 60,328 | 34.4% |
| Total expenses | -271,465 | -288,029 | -290,293 | 0.8% | 6.9% | -540,215 | -578,322 | 7.1% |
| Translation result | 0 | 0 | 0 | 0.0% | 0.0% | 0 | 0 | 0.0% |
| Income taxes | -24,093 | -46,540 | -43,174 | -7.2% | 79.2% | -34,316 | -89,714 | 161.4% |
| Net income | 55,305 | 102,935 | 127,982 | 24.3% | 131.4% | 69,360 | 230,917 | 232.9% |
| | | | | | | | | |
| Efficiency ratio | 55.6% | 53.0% | 50.4% | -262 pbs | -520 pbs | 58.62% | 51.60% | -700 pbs |
| ROAE | 10.3% | 17.1% | 20.3% | 319 pbs | 1000 pbs | 6.48% | 18.64% | 1210 pbs |
| ROAE incl. Goowdill | 9.8% | 16.3% | 19.4% | 302 pbs | 960 pbs | 6.18% | 17.83% | 1160 pbs |
| L/D ratio | 157.2% | 159.2% | 161.2% | 194 pbs | 400 pbs | | | |
| IOL ratio | 8.9% | 6.8% | 6.8% | -1 pbs | -210 pbs | | | |
| NPL ratio | 9.3% | 7.3% | 7.3% | 3 pbs | -200 pbs | | | |
| Coverage of IOLs | 143.4% | 120.5% | 119.3% | -122 pbs | -2410 pbs | | | |
| Coverage of NPLs | 136.9% | 112.6% | 110.7% | -189 pbs | -2620 pbs | | | |
Branches (1) | 319 | 310 | 304 | -6 | -15 | | | |
| Employees | 10,057 | 9,810 | 9,593 | -217 | -464 | | | |
(1) Includes Banco de la Nacion branches, which in June 21, March 22 and June 22 were 34.
12.5.7. Prima AFP
Prima AFP
(In S/ thousands, IFRS)
| | Quarter | % change | As of | % change |
| | 2Q21 | 1Q22 | 2Q22 | QoQ | YoY | Jun 21 | Jun 22 | Jun 22 / Jun 21 |
| Income from commissions | 97,331 | 93,192 | 98,749 | 6.0% | 1.5% | 194,932 | 191,941 | -1.5% |
| Administrative and sale expenses | (38,412) | (43,800) | (45,786) | 4.5% | 19.2% | (77,290) | (89,586) | 15.9% |
| Depreciation and amortization | (5,541) | (6,215) | (6,247) | 0.5% | 12.7% | (11,465) | (12,461) | 8.7% |
| Operating income | 53,378 | 43,178 | 46,717 | 8.2% | -12.5% | 106,177 | 89,894 | -15.3% |
| Other income and expenses, net (profitability of lace)* | 6,577 | (4,133) | (17,121) | 314.3% | -360.3% | 5,023 | (21,254) | -523.1% |
| Income tax | (16,134) | (13,194) | (16,032) | 21.5% | -0.6% | (32,361) | (29,226) | -9.7% |
| Net income before translation results | 43,822 | 25,851 | 13,563 | -47.5% | -69.0% | 78,840 | 39,414 | -50.0% |
| Translations results | 479 | (1,416) | 529 | -137.4% | 10.5% | 57 | (887) | -1653.9% |
| Net income | 44,301 | 24,434 | 14,092 | -42.3% | -68.2% | 78,897 | 38,527 | -51.2% |
ROAE (1) | 28.5% | 19.8% | 13.5% | -636 pbs | -1503 pbs | 23.5% | 15.4% | -806 pbs |
| | As of | % change |
| | 2Q21 | 1Q22 | 2Q22 | QoQ | YoY |
| Total assets | 867,605 | 872,173 | 694,432 | -20.4% | -20.0% |
| Total liabilities | 223,284 | 460,279 | 268,858 | -41.6% | 20.4% |
| Net shareholders' equity | 644,321 | 411,894 | 425,574 | 3.3% | -33.9% |
(*) The net profitability of lace and mutual funds is being presented net of taxes, for which the retroactive change was made (it was presented gross before)
(1) Net shareholders' equity includes unrealized gains from Prima's investment portfolio.
Funds under management
| Funds under management | Dec 21 | % share | Jun 22 | % share |
| Fund 0 | 1,240 | 3.1% | 1,325 | 3.6% |
| Fund 1 | 5,960 | 15.1% | 5,522 | 15.0% |
| Fund 2 | 27,387 | 69.3% | 25,567 | 69.5% |
| Fund 3 | 4,924 | 12.5% | 4,374 | 11.9% |
| Total S/ Millions | 39,510 | 100% | 36,789 | 100% |
Source: SBS.
Nominal profitability over the last 12 months
| | Dec 21 / Dec 20 | Jun 22 / Jun 21 |
| Fund 0 | 1.2% | 2.3% |
| Fund 1 | -4.0% | -8.9% |
| Fund 2 | 1.1% | -7.0% |
| Fund 3 | 11.6% | -2.7% |
AFP commissions
| Fee based on flow | 1.60% | Applied to the affiliates' monthly remuneration. |
| Mixed fee | | | |
| | | | |
| Flow | | 0.18% | Applied to the affiliates' monthly remuneration since June 2017. Feb 17- may 17 =0.87%. |
| | | | |
| Balance | | 1.25% | Applies annualy to the new balance since February 2013 for new affiliates to the system and beginning on June 2013 for old affiliates who have chosen this commission scheme. |
Main indicators
| Main indicators and market share | Prima 1Q22 | System 1Q22 | % share 1Q22 | Prima 2Q22 | System 2Q22 | % share 2Q22 |
| Affiliates | 2,349,153 | 8,387,918 | 28.0% | 2,347,956 | 8,529,346 | 27.5% |
| New affiliations (1) | - | 93,252 | 0.0% | - | 144,713 | 0.0% |
| Funds under management (S/ Millions) | 39,510 | 132,214 | 29.9% | 36,789 | 122,771 | 30.0% |
| Collections (S/ Millions) | 1030 | 3,536 | 29.1% | 1054 | 3,666 | 28.8% |
| Voluntary contributions (S/ Millions) (3) | 980 | 2,600 | 37.7% | 820 | 2,180 | 37.6% |
| RAM (S/ Millions) (2) | 1,376 | 4,571 | 30.1% | 1,468 | 4,733 | 31.0% |
Source: SBS
(1) As of June 2019, another AFP has the exclusivity of affiliations.
(2) Prima AFP estimate: Average of aggregated income for flow during the last 4 months, excluding special collections and voluntary contribution fees.
12.5.8. Grupo Pacifico
GRUPO PACIFICO
(S/ in thousands )
| | As of | % change |
| | Jun21 | Mar 22 | Jun 22 | QoQ | YoY |
| Total assets | 15,775,105 | 15,630,799 | 15,229,244 | -2.6% | -3.5% |
| Invesment on securities (6) | 12,102,502 | 11,951,579 | 11,573,077 | -3.2% | -4.4% |
| Technical reserves | 12,173,277 | 11,962,492 | 11,707,217 | -2.1% | -3.8% |
| Net equity | 2,125,685 | 2,205,194 | 2,101,532 | -4.7% | -1.1% |
| | Quarter | % change | As of | % change |
| | 2Q21 | 1Q22 | 2Q22 | QoQ | YoY | Jun 21 | Jun 22 | Jun 22/ Jun 21 |
| Net earned premiums | 643,970 | 692,774 | 697,921 | 0.7% | 8.4% | 1,295,480 | 1,390,695 | 7.3% |
| Net claims | (691,450) | (478,506) | (492,257) | 2.9% | -28.8% | (1,319,240) | (970,764) | -26.4% |
| Net fees | (144,590) | (149,160) | (152,233) | 2.1% | 5.3% | (287,290) | (301,393) | 4.9% |
| Net underwriting expenses | (31,136) | (30,608) | (26,896) | -12.1% | -13.6% | (61,354) | (57,504) | -6.3% |
| Underwriting result | (223,206) | 34,499 | 26,535 | -23.1% | -111.9% | (372,404) | 61,034 | -116.4% |
| | | | | | | | |
| Net financial income | 159,184 | 148,315 | 182,955 | 23.4% | 14.9% | 308,641 | 331,271 | 7.3% |
| | | | | | | | | |
| Total expenses | (103,844) | (121,720) | (118,352) | -2.8% | 14.0% | (212,680) | (240,073) | 12.9% |
| | | | | | | | | |
| Other income | 10,177 | 12,339 | 6,109 | -50.5% | -40.0% | 13,419 | 18,448 | 37.5% |
| Traslations results | (92) | (5,416) | (287) | -94.7% | 213.1% | 475 | (5,704) | n.a. |
| EPS business deduction | 8,800 | 14,653 | 17,941 | 22.4% | 103.9% | 32,177 | 32,594 | 1.3% |
| Medical Assistance insurance deduction | (8,879) | (7,691) | (10,329) | 34.3% | 16.3% | (22,785) | (18,020) | |
| Income tax | (2,029) | (2,684) | (3,510) | 30.8% | 73.0% | (3,428) | (6,194) | 80.7% |
| | | | | | | | |
| Income before minority interest | (159,887) | 72,294 | 101,063 | 39.8% | n.a. | (256,585) | 173,356 | n.a. |
| Non-controlling interest | (659) | (1,348) | (1,763) | 30.8% | 167.7% | (2,389) | (3,111) | 30.2% |
| | | | | | | | | |
| Net income | (160,546) | 70,946 | 99,300 | 40.0% | n.a. | (258,974) | 170,246 | n.a. |
| | | | | | | | | |
| Ratios | | | | | | | | |
| Ceded | 15.5% | 21.5% | 14.2% | -730 pbs | -130 pbs | 16.9% | 18.2% | 130 pbs |
Loss ratio (1) | 107.4% | 69.1% | 70.5% | -140 pbs | 3690 pbs | 101.8% | 69.8% | 3200 pbs |
| Fees + underwriting expenses, net / net earned premiums | 27.3% | 25.9% | 25.7% | 20 pbs | 160 pbs | 26.9% | 25.8% | 110 pbs |
| Operating expenses / net earned premiums | 16.1% | 17.6% | 17.0% | 60 pbs | -90 pbs | 16.4% | 17.3% | -90 bps |
ROAE (2)(3) | -28.4% | 12.8% | 18.6% | 580 pbs | 4700 pbs | -20.1% | 16.5% | 3660 pbs |
| Return on written premiums | 17.0% | 6.0% | 9.7% | 370 pbs | 2670 pbs | -13.3% | 7.7% | 2100 pbs |
Combined ratio of Life (4) | 143.3% | 89.6% | 89.8% | 20 pbs | -5350 pbs | 143.3% | 89.8% | -5350 pbs |
Combined ratio of P&C (5) | 88.9% | 94.4% | 89.9% | -450 pbs | 100 pbs | 88.9% | 89.9% | 100 pbs |
Equity requirement ratio (7) | 1.22 | 1.24 | 1.18 | -600 pbs | -350 pbs | 1.22 | 1.18 | -350 pbs |
*Financial statements without consolidation adjustments.
(1) Excluding investments in real estate.
(2) Net claims / Net earned premiums.
(3) Includes unrealized gains.
(4) Annualized and average are determined as the average of period beginning and period ending.
(5) (Net claims / Net earned premiums) + Reserves / Net earned premiums) + [(Acquisition cost + total expenses) / Net earned premiums] - (Net Financial Income without real state sales, securities sales, impairment loss and fluctuation / Net earned premiums).
(6) (Net claims / Net earned premiums) + [(Acquisition cost + total expenses) / Net earned premiums].
(7) Support to cover credit risk, market risk and operational risk.
From 1Q15 and on, Grupo Pacifico’s financial statements reflect the agreement with Banmedica (in equal parts) of the businesses of:
| • | private health insurance managed by Grupo Pacifico and included in its Financial Statements in each of the accounting lines; |
| • | corporate health insurance (dependent workers); and |
The businesses described in ii) and iii) are managed by Banmedica, therefore they do not consolidate in Grupo Pacifico’s financial statements. The 50% of net income generated by Banmedica is recorded in Grupo Pacifico’s Income Statement as a gain/loss on investments in subsidiaries.
As explained before, corporate health insurance and medical services businesses are consolidated by Banmedica. The following table reflects the consolidated results from which Grupo Pacifico receives the 50% net income.
Corporate health insurance and Medical services
(S/ in thousands )
| | Quarter | % change | As of | % change |
| | 2Q21 | 1Q22 | 2Q22 | QoQ | YoY | Jun 21 | Jun 22 | Jun 22/ Jun 21 |
| Results | | | | | | | | |
| Net earned premiums | 288,352 | 314,362 | 315,592 | 0.4% | 9.4% | 566,296 | 629,954 | 11.2% |
| Net claims | (273,350) | (276,082) | (266,259) | -3.6% | -2.6% | (488,989) | (542,341) | 10.9% |
| Net fees | (12,231) | (13,671) | (13,395) | -2.0% | 9.5% | (24,540) | (27,065) | 10.3% |
| Net underwriting expenses | (2,412) | (3,263) | (2,505) | -23.2% | 3.8% | (5,289) | (5,768) | 9.0% |
| Underwriting result | 358 | 21,346 | 33,434 | 56.6% | n.a. | 47,477 | 54,780 | 15.4% |
| | | | | | | | | |
| Net financial income | 1,904 | 1,883 | 1,759 | -6.6% | -7.6% | 3,091 | 3,642 | 17.8% |
| Total expenses | (19,179) | (18,870) | (20,251) | 7.3% | 5.6% | (39,888) | (39,122) | -1.9% |
| Other income | (13) | 1,226 | 40 | -96.7% | -417.2% | (430) | 1,266 | -394.6% |
| Traslations results | 3,005 | (4,397) | 1,784 | -140.6% | -40.6% | 4,390 | (2,613) | -159.5% |
| Income tax | 3,503 | (424) | (6,114) | n.a. | -274.5% | (5,143) | (6,537) | 27.1% |
| | | | | | | | | |
| Net income before Medical services | (10,422) | 763 | 10,652 | n.a. | n.a. | 9,499 | 11,415 | 20.2% |
| | | | | | | | | |
| Net income of Medical services | 27,939 | 28,460 | 25,076 | -11.9% | -10.2% | 54,689 | 53,535 | -2.1% |
| | | | | | | | | |
| Net income | 17,517 | 29,222 | 35,728 | 22.3% | 104.0% | 64,188 | 64,951 | 1.2% |
12.5.9. Investment Banking & Wealth Management
Investment Banking & Wealth Management
(S/ thousands, IFRS)
| Investment Banking and Wealth Management | Quarter | % change | As of | % change |
| S/ 000 | 2Q21 | 1Q22 | 2Q22 | QoQ | YoY | Jun 21 | Jun 22 | Jun 22 / Jun 21 |
| Net interest income | 23,055 | 19,340 | 18,930 | -2.1% | -18% | 46,142 | 38,270 | -17.1% |
| Non-financial income | 213,732 | 179,997 | 146,646 | -18.5% | -31.4% | 391,797 | 326,643 | -16.6% |
| Fee income | 168,937 | 137,586 | 138,468 | 0.6% | -18.0% | 316,531 | 276,054 | -12.8% |
| Net gain on foreign exchange transactions | -2,498 | 8,160 | 12,338 | 51.2% | n.a | 4,712 | 20,498 | 335.0% |
| Net gain on sales of securities | 44,184 | 10,696 | -15,406 | n.a | n.a | 132 | -4,710 | n.a |
| Derivative Result | 21,640 | 4,997 | 31,345 | n.a | 44.8% | 86,729 | 36,342 | -58.1% |
| Result from exposure to the exchange rate | -24,660 | 10,557 | -28,225 | n.a | 14.5% | -29,407 | -17,668 | -39.9% |
| Other income | 6,129 | 8,001 | 8,126 | 1.6% | 32.6% | 13,100 | 16,127 | 23.1% |
| Operating expenses (1) | -162,087 | -162,258 | -160,877 | -0.9% | -0.7% | -318,772 | -323,135 | 1.4% |
| Operating income | 74,700 | 37,079 | 4,699 | -87.3% | -93.7% | 119,167 | 41,778 | -64.9% |
| Income taxes | -9,314 | -1,548 | 273 | -117.6% | -102.9% | -16,451 | -1,275 | -92.2% |
| Non-controlling interest | 943 | 757 | 459 | -39.4% | -51.3% | 1,572 | 1,216 | -22.6% |
| Net income | 64,443 | 34,774 | 4,513 | -87.0% | -93.0% | 101,144 | 39,287 | -61.2% |
(1) Includes: Salaries and employees benefits + Administrative expenses + Assigned expenses + Depreciation and amortization + Tax and contributions + Other expenses.
12.6. Table of calculations
(1) Averages are determined as the average of period-beginning and period-ending balances.
(2) Includes total deposits, due to banks and correspondents, BCRP instruments, repurchase agreements and bonds and notes issued.
(3) Does not include Life insurance business.
(4) Tier 1 = Capital + Legal and other capital reserves + Accumulated earnings with capitalization agreement + (0.5 x Unrealized profit and net income in subsidiaries) - Goodwill - (0.5 x Investment in subsidiaries) + Perpetual subordinated debt (maximum amount that can be included is 17.65% of Capital + Reserves + Accumulated earnings with capitalization agreement + Unrealized profit and net income in subsidiaries - Goodwill).
(5) Includes investment in subsidiaries, goodwill, intangibles and deferred tax that rely on future profitability.
12.7. Glossary of terms
| | Term | | | Definition | |
| | Government Program Loans ("GP" or "GP Loans") | | | Loan Portfolio related to Reactiva Peru and FAE-Mype programs to respond quickly and effectively to liquidity needs and maintain the payment chain. | |
| | Structural Loans | | | Loan Portfolio excluding GP Loans. | |
| | Non-Recurring Events at Interest Income | | | Impairment charge (related to the government facility that allowed for deferment of certain installments at zero cost) and subsequent amortization thereof. | |
| | Non-Recurring Events at Interest Expenses | | | Charges related to the liability management operation at BCP Stand-alone (3Q20 and 1Q21). | |
| | Structural Cost of Risk | | | Cost of Risk related to the Structural Loans. It excludes, in the numerator, provisions for credit losses on GP loans, and in the denominator, the total amount of GP Loans. | |
| | Structural NPL ratio | | | NPL Ratio related to Structural Loans. It excludes the impact of GP Loans. | |
| | Structural NIM | | | NIM related to Structural Loans and Other Interest Earning Assets. It deducts the impact of GP Loans and Non-recurring Events from Interest Income and Interest Expenses. | |
| | Structural Funding Cost | | | Funding Cost deducting the impact in expenses and funding related to GP Loans and deducting Non-recurring Events from Interest Expenses | |
70