3Q/2022 Milagros Cigüeñas Roxana Mossi Fernando Castillo, CFA Andrea Sertzen, FRM Diego Nieto, FRM Sebastian Ardiles investorrelations@credicorpperu.com
Contributions* and ROE by subsidiary in 3Q22(S/ millions)
*Contributions to Credicorp reflect the eliminations for consolidation purposes (eliminations for transactions among Credicorp’s subsidiaries or between Credicorp and its subsidiaries).
- The figure is lower than the net income of BCP Stand Alone as contribution do not consider investments in other Credicorp subsidiaries (Mibanco).
- The figure is lower than the net income of Mibanco as Credicorp owns 99.924% of Mibanco (directly and indirectly).
- The contribution is higher than Grupo Pacifico’s net income because Credicorp owns 65.20% directly, and 33.66% through Grupo Credito.
- Includes Grupo Credito excluding Prima, others of Atlantic Security Holding Corporation and others of Credicorp Ltd.
Summary of Financial Performance and Outlook |
The improvement in YoY profitability at BCP was driven by Core Income, specifically Net Interest Income. Strong structural loan origination, along with a disciplined repricing strategy, spurred this growth. This evolution was partially offset by an uptick in provisions. |
Pacifico Seguros reported a substantial improvement in profitability due to growth in net earned premiums, which was driven primarily by the Bancassurance channel, and to a drop in claims in Life, which reflects an improvement in the sanitary situation. |
Mibanco continued to register solid performance. This trajectory was fueled by the positive dynamics of NII, which reflected effective pricing policies, and by lower provisions. The hybrid model continued to generate improvements in our relationship managers’ productivity. |
Investment Banking and
Wealth Management |
This business continued to be challenged by the current context. Asset Management and Wealth Management continued to feel the effects generated by fund outflows in 2021 |
We continue to expect a ROE around 17.5% for the full year figure. Current loan dynamics in a context of high inflation and interest rate hikes lead us to expect that the Net Interest Margin and Cost of Risk figures will situate near the upper end of the guidance range. |
| Credicorp Ltd. | Quarter | % change | As of | % change |
| S/ 000 | 3Q21 | 2Q22 | 3Q22 | QoQ | YoY | Sep 21 | Sep 22 | Sep 22 / Sep 21 |
| Net interest, similar income and expenses | 2,451,099 | 2,740,440 | 3,001,426 | 9.5% | 22.5% | 6,882,370 | 8,274,919 | 20.2% |
| Provision for credit losses on loan portfolio, net of recoveries | (164,414) | (363,291) | (459,976) | 26.6% | 179.8% | (1,085,441) | (1,080,857) | -0.4% |
| Net interest, similar income and expenses, after provision for credit losses on loan portfolio | 2,286,685 | 2,377,149 | 2,541,450 | 6.9% | 11.1% | 5,796,929 | 7,194,062 | 24.1% |
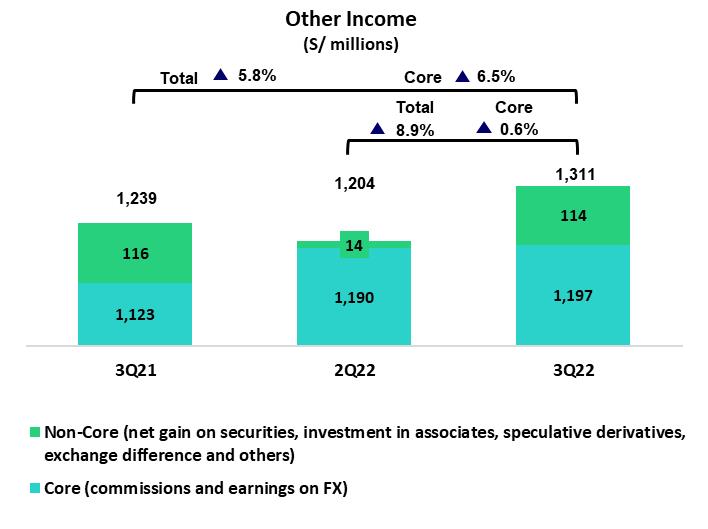
| Total other income | 1,238,683 | 1,203,980 | 1,310,585 | 8.9% | 5.8% | 3,624,907 | 3,757,314 | 3.7% |
| Insurance underwriting result | 70,204 | 137,042 | 198,842 | 45.1% | 183.2% | (131,378) | 477,430 | -463.4% |
| Total other expenses | (1,977,185) | (2,054,810) | (2,141,519) | 4.2% | 8.3% | (5,516,749) | (6,145,474) | 11.4% |
| Profit (loss) before income tax | 1,618,387 | 1,663,361 | 1,909,358 | 14.8% | 18.0% | 3,773,709 | 5,283,332 | 40.0% |
| Income tax | (428,037) | (513,181) | (575,083) | 12.1% | 34.4% | (1,189,127) | (1,634,265) | 37.4% |
| Net profit (loss) | 1,190,350 | 1,150,180 | 1,334,275 | 16.0% | 12.1% | 2,584,582 | 3,649,067 | 41.2% |
| Non-controlling interest | 26,651 | 28,420 | 31,855 | 12.1% | 19.5% | 60,616 | 88,061 | 45.3% |
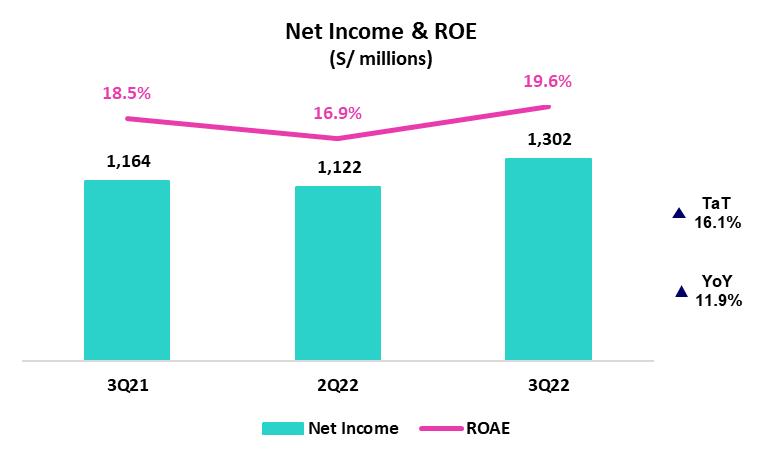
| Net profit (loss) attributable to Credicorp | 1,163,699 | 1,121,760 | 1,302,420 | 16.1% | 11.9% | 2,523,966 | 3,561,006 | 41.1% |
| Net profit (loss) / share (S/) | 14.59 | 14.06 | 16.33 | 16.1% | 11.9% | 31.64 | 44.65 | 41.1% |
| Loans | 146,551,226 | 150,370,184 | 151,392,202 | 0.7% | 3.3% | 146,551,226 | 151,392,202 | 3.3% |
| Deposits and obligations | 152,548,368 | 147,440,575 | 152,792,014 | 3.6% | 0.2% | 152,548,368 | 152,792,014 | 0.2% |
| Net equity | 25,192,569 | 26,175,222 | 27,109,054 | 3.6% | 7.6% | 25,192,569 | 27,109,054 | 7.6% |
| Profitability | | | | | | | | |
| Net interest margin | 4.23% | 4.90% | 5.31% | 41 bps | 108 bps | 4.00% | 4.78% | 78 bps |
| Risk-adjusted Net interest margin | 3.94% | 4.25% | 4.50% | 25 bps | 56 bps | 3.37% | 4.16% | 79 bps |
| Funding cost | 1.21% | 1.59% | 0.87% | 48 bps | 86 bps | 1.28% | 1.62% | 34 bps |
| ROAE | 18.5% | 16.9% | 19.6% | 270 bps | 110 bps | 13.4% | 17.7% | 430 bps |
| ROAA | 1.9% | 1.9% | 2.2% | 30 bps | 30 bps | 1.4% | 1.9% | 50 bps |
| Loan portfolio quality | | | | | | | | |
Internal overdue ratio (1) | 3.73% | 4.06% | 4.13% | 7 bps | 40 bps | 3.73% | 4.13% | 40 bps |
| Internal overdue ratio over 90 days | 2.76% | 3.06% | 3.08% | 2 bps | 32 bps | 2.76% | 3.08% | 32 bps |
NPL ratio (2) | 4.96% | 5.18% | 5.32% | 14 bps | 36 bps | 4.96% | 5.32% | 36 bps |
Cost of risk (3) | 0.45% | 0.97% | 1.22% | 25 bps | 77 bps | 0.45% | 1.22% | 77 bps |
| Coverage ratio of IOLs | 165.8% | 136.1% | 128.5% | -760 bps | -3730 bps | 165.8% | 128.7% | -3710 bps |
| Coverage ratio of NPLs | 124.8% | 106.6% | 99.6% | -700 bps | -2500 bps | 124.8% | 99.8% | -2500 bps |
| Operating efficiency | | | | | | | | |
Efficiency ratio (4) | 46.1% | 44.6% | 42.8% | -180 bps | -330 bps | 44.7% | 43.9% | -80 bps |
| Operating expenses / Total average assets | 3.20% | 3.49% | 3.58% | 9 bps | 38 bps | 3.00% | 3.37% | 40 bps |
| Insurance ratios | | | | | | | | |
Combined ratio of P&C (5) (6) | 94.1% | 89.9% | 91.2% | 130 bps | -290 bps | 94.1% | 91.2% | -290 bps |
Loss ratio (6) | 76.5% | 70.5% | 63.5% | -700 bps | -1300 bps | 93.1% | 67.6% | -2550 bps |
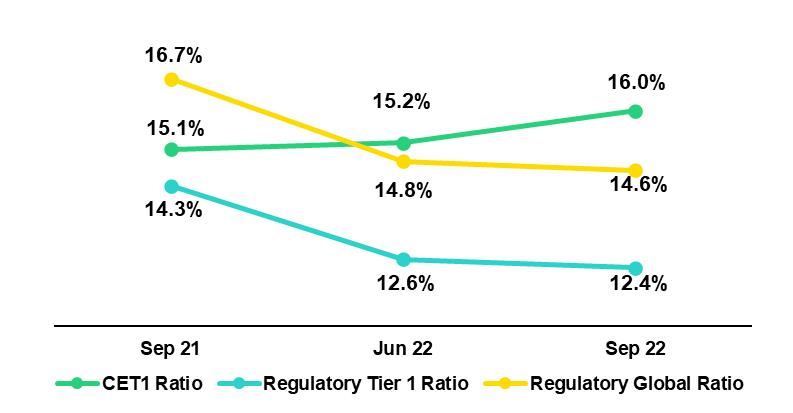
Capital adequacy - BCP Stand-alone (7) | | | | | | | | |
Global Capital ratio (8) | 15.16% | 15.23% | 14.93% | -30 bps | -23 bps | 15.16% | 14.93% | -23 bps |
Tier 1 ratio (9) | 10.00% | 10.25% | 9.94% | -31 bps | -6 bps | 10.00% | 9.94% | -6 bps |
Common equity tier 1 ratio (10) (12) | 11.20% | 11.57% | 11.83% | 26 bps | 63 bps | 11.20% | 11.83% | 63 bps |
Capital adequacy - Mibanco (7) | | | | | | | | |
Global Capital ratio (8) | 16.74% | 14.83% | 14.61% | -22 bps | -213 bps | 16.74% | 14.61% | -213 bps |
Tier 1 ratio (9) | 14.25% | 12.55% | 12.36% | -19 bps | -189 bps | 14.25% | 12.36% | -189 bps |
Common equity tier 1 ratio (10) (12) | 15.10% | 15.25% | 16.00% | 75 bps | 90 bps | 15.10% | 16.00% | 90 bps |
| Employees | 35,733 | 34,398 | 35,692 | 3.8% | -0.1% | 35,733 | 35,692 | -0.1% |
| Share Information | | | | | | | | |
| Issued Shares | 94,382 | 94,382 | 94,382 | 0.0% | 0.0% | 94,382 | 94,382 | 0.0% |
Treasury Shares (11) | 14,866 | 14,849 | 14,849 | 0.0% | -0.1% | 14,866 | 14,849 | -0.1% |
| Outstanding Shares | 79,516 | 79,533 | 79,533 | 0.0% | 0.0% | 79,516 | 79,533 | 0.0% |
(1) Internal overdue loans include overdue loans and loans under legal collection, according to our internal policy for overdue loans. Internal Overdue ratio: Internal overdue loans / Total loans.
(2) Non-performing loans (NPL): Internal overdue loans + Refinanced loans. NPL ratio: NPL / Total loans.
(3) Cost of risk: Annualized provision for loan losses, net of recoveries / Total loans.
(4) Efficiency ratio = (Salaries and employee benefits + Administrative expenses + Depreciation and amortization + Association in participation + Acquisition cost) / (Net interest, similar income and expenses + Fee Income + Net gain on foreign exchange transactions + Net Gain From associates + Net gain on derivatives held for trading + Result on exchange differences + Net Premiums Earned).
(5) Combined ratio = (Net claims / Net earned premiums) + [(Acquisition cost + Operating expenses) / Net earned premiums]. Does not include Life insurance business.
(6) Considers Grupo Pacifico's figures before eliminations for consolidation to Credicorp.
(7) All Capital ratios for BCP Stand-alone and Mibanco are based on Peru GAAP.
(8) Regulatory Capital / Risk-weighted assets (legal minimum = 10% since July 2011).
(9) Tier 1 = Capital + Legal and other capital reserves + Accumulated earnings with capitalization agreement + (0.5 x Unrealized profit and net income in subsidiaries) - Goodwill - (0.5 x Investment in subsidiaries) + Perpetual subordinated debt (maximum amount that can be included is 17.65% of Capital + Reserves + Accumulated earnings with capitalization agreement + Unrealized profit and net income in subsidiaries - Goodwill).
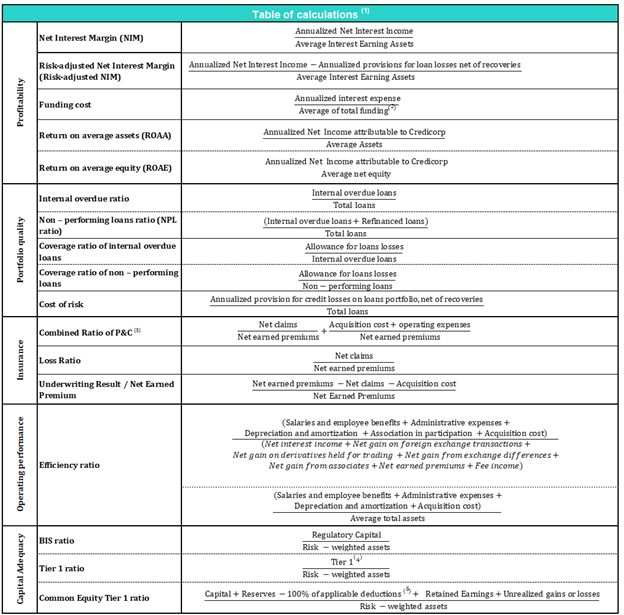
(10) Common Equity Tier I = Capital + Reserves – 100% of applicable deductions (investment in subsidiaries, goodwill, intangibles and net deferred taxes that rely on future profitability) + retained earnings + unrealized gains.
Adjusted Risk-Weighted Assets = Risk-weighted assets - (RWA Intangible assets, excluding goodwill, + RWA Deferred tax assets generated as a result of temporary differences in income tax, in excess of 10% of CET1, + RWA Deferred tax assets generated as a result of past losses)."
(11) Consider shares held by Atlantic Security Holding Corporation (ASHC) and stock awards.
(12) Common Equity Tier I calculated based on IFRS Accounting.
Credicorp’s Strategy Update |
Credicorp is a customer-centric financial group that is committed to developing and delivering cutting edge, relevant, products and services. The digital transformation of its core business acts as a key lever to drive growth and ensure long-term competitiveness. During the conference call this quarter, management will highlight the progress that BCP, the Group’s main subsidiary, has achieved on the transformation front. Work began earlier at BCP, as a such, higher levels of maturity have been reached.
BCP is rapidly developing new income generating opportunities while deepening connections with customers to become more relevant in their day-to-day. Through a strong focus on attracting and retaining the best talent, BCP is accelerating the development of core enablers of its digital transformation strategy, Data & Analytics, IT and Cybersecurity. Management will present the significant progress made on all fronts, but there is still ground to cover.
Main KPIs of Credicorp’s Strategy
| | Experience  | Efficiency  | Growth  |
| | Traditional Business Transformation (1) | | Subsidiary | 3Q19 | 3Q21 | 3Q22 |
| | Day to Day | | | | | |
| | | 
| | BCP | 38% | 56% | 63% |
| | Digital monetary transactions (3)z | | | BCP | 25% | 49% | 62% |
| | Transactional cost by unit |  | | BCP | 0.40 | 0.22 | 0.09 |
| | Disbursements through leads (4) | | | Mibanco | ND. | 70% | 74% |
| | Disbursements through alternative channels (5) | | | Mibanco | 16% | 39% | 43% |
| | | | | Mibanco | 23.31 | 21.91 | 23.07 |
| | Cashless | | | | | | |
| | Cashless transactions (7) | | | BCP | 21% | 36% | 45% |
| | Mobile Banking rating Apple |  | | BCP | ND. | 2.1 | 4.7 |
| | Mobile Banking rating Android | | | BCP | 3.3 | 2.0 | 3.9 |
| | Digital Acquisition | | | | | | |
| | | | | BCP | 15% | 34% | 44% |
| | | | | BCP | 24% | 57% | 58% |
(1) Figures for September 2019, 2021, and 2022
(2) Digital Client: Retail Banking clients that conduct 50% of their monetary transactions through digital channels or have purchased an online in the last 12 months. Since this quarter Digital Clients includes Yapecard Clients. Digital clients/ Total Retail Banking clients.
(3) Retail Monetary Transactions conducted through Retail Banking, Internet Banking, Yape and Telecredito/Total Retail Monetary Transactions in Retail Banking.
(4) Disbursements generated through leads/Total disbursements.
(5) Disbursements conducted through alternative channels/Total disbursements.
(6) Number of loans disbursed/ Total relationship managers.
(7) Amount transacted through Mobile Banking, Internet Banking, Yape y POS/ Total amount transacted through Retail Banking.
(8) Units sold by Retail Banking through digital channels/ Total number of units sold by Retail Banking.
(9) Retail Banking loans disbursed through digital channels/ Total Retail banking loans disbursed.
Credicorp’s Strategy Update |
Disruptive Initiatives: Yape
Yape continues to grow, anchored by three solid pillars:
| • | Is the main payment venue in the country: At the end of 3Q22, the app had 10.9 million users with a monthly activity rate of 64%. To make the user base and usability levels more robust, Yape has rolled out different campaigns to bolster affiliation and increase the application’s use. |
Additionally, Yape continues to register an upward trend in mobile top-ups. The app began to offer this service to clients in November 2021 and in 3Q22, more than 18 million top-ups were reported, which represents a market share of 10%.
| • | Present in the daily life of all Yaperos. To create value for clients, Yape launched Yape Promos on September 5, 2022, and now 100% of Yaperos can access this option through Yape’s menu. As of 3Q22, Yape reported diverse alliances with establishments in the restaurant, health, transportation and entertainment segments and expects to continue to grow its number of affiliates. |
| • | Covers Yaperos’ financial needs: Yape launched a Microloan option to the public at the end of August. In the month of September, 23 thousand loans were made. |
| | Disruptive Initiatives: Yape (1) | 3Q19 | 3Q21 | 3Q22 |
| | Day to Day | | | |
| | % Microbusiness users (2) | | 9% | 17% | 19% |
| | Mobile phone top-ups (thousands) | | - | - | 6,793 |
| | Cashless | | | | |
| | Users (thousands) | | 1,485 | 7,205 | 10,878 |
| | % User’s clients of BCP (3) | | 100% | 69% | 56% |
| | % of Yapecard Users (4) | | - | 28% | 39% |
| | Active users (thousands) (5) | | 429 | 3,543 | 6,937 |
| | % Active users on a monthly basis (6) | | 29% | 49% | 64% |
| | No. of monthly Transactions (thousands) | | 1,744 | 37,728 | 120,217 |
| | Monthly transaction amount (millions, S/) | | 87 | 2,406 | 6,367 |
| | Number of monthly transactions by Active Yapero (7) | | 4 | 11 | 17 |
| (1) | Figures for September 2019, 2021, and 2022 |
| (2) | Yape users that are Microbusinesses/Total Yape users |
| (3) | BCP clients that are Yape users/Total Yape users |
| (4) | Yapecard users / Total Yape users |
| (5) | Yape users that have conducted at least one transaction a month |
| (6) | Yape users that have conducted at least one transaction in the past month/Total Yape Users |
| (7) | Number of Yape transactions/Active Users |
Credicorp’s Strategy Update |
Integrating sustainability in our businesses
For more information on our sustainability strategy, program and initiatives, please review our “2020-25 Sustainability Strategy” and our “2021 Annual and Sustainability Report”.
The milestones hit in the third quarter of 2022 in the framework of the Sustainability Program include:
Governance Front – Roll-out of our renewed code of ethics and our latest recognitions
GenÉTICA Credicorp, our renewed Code of Ethics, acts as a guide for the organization and provides information on the principles, values and expectations that anchor our decisions. This new code places more emphasis on relations with our stakeholders (employees, clients, suppliers, shareholders and community) and provides illustrative examples to address the recurring situations that employees experience during the course of our business operations. In the month of August, a campaign was rolled out to disseminate the Code group-wide by means of different communications tools and internal education initiatives. At the end of 3Q22, more than 1,000 employees participated in on-site activities; 13,000+ in livestreamed sessions; and the web document: ”Code of Ethics” was visualized 10,800+ times.
The “2022 Latin American Executive Team Rankings”, which are built by the Institutional Investor magazine recognized Credicorp’s ESG program as the best in Peru.
Environmental Front– Driving environmental sustainability through the financial sector
| • | BCP granted 3 certified green loans for more than US$115 million to companies in the electricity generation and manufacturing industries for renewable energy projects and recyclable products respectively. |
| • | Credicorp Capital and Prima AFP continue to develop relations with their portfolios’ prioritized issuers to promote sustainable practices in the companies we invest. Under CDP’s “Non-Disclosure Campaign, Credicorp Capital instigated 6 issuers to begin reporting under CDP standards. This campaign seeks to ensure more transparency regarding issuers’ management of and contributions to climate change, deforestation and water security. |
| • | Prima AFP published its “Reporte de Inversiones responsables 2022”, which covers the company’s main advances in integrating ESG factors in the analysis of investments and provides information on its strategy. As of today, 62% of Prima’s investment portfolio is analyzed considering ESG factors and we expect to reach the 80% mark by the end of 2022. |
| • | Within the enabler to manage ESG risks, the Sustainable Operations Committee was set up to review credit operations that have potential to be sustainable and approve categorization. On this front, we continue to work on implementing the group-wide exclusions of economic activities, update the ESG questionnaires that portfolio companies are required to complete and strengthen our taxonomy. These efforts will help us identify more sustainable opportunities. |
Social Front – Expanding financial inclusion and helping businesses grow
| • | Credicorp published the second edition of its financial inclusion index: “Credicorp Financial Inclusion Index 2022” which is developed by IPSOS Perú to measure the level of access, use and perceived quality of the financial system in 8 Latam countries. This year’s report included Argentina. |
| • | As of September 2022, Yape has propitiated the financial inclusion of more than 2.1 million people and launched microcredits through this platform. Mibanco, through its microfinance role, has included more than 660 thousand entrepreneurs in the financial system in the last seven years. |
| • | By the end of 3Q22, BCP had disbursed more than S/1,000 million to the SME-Pyme segment through invoice discounting. This product leverages the power of electronic invoicing and has benefitted more than 1,000 businesses, 85% of which were not previously subjects of credit. |
| • | Mibanco reinserted 878 clients through its program “A-morosos”, which seeks to reincorporate individuals with debt over 120 days past-due within the financial system. |
| • | Yevo, the online ecosystem for entrepreneurs operated by Mibanco, topped the 150k mark for affiliates. |
| • | BCP Bolivia registered the highest rating in the Bolivian financial system in the ranking “Responsabilidad Social Empresarial de AESA”(Fitch Ratings). |
| | | |
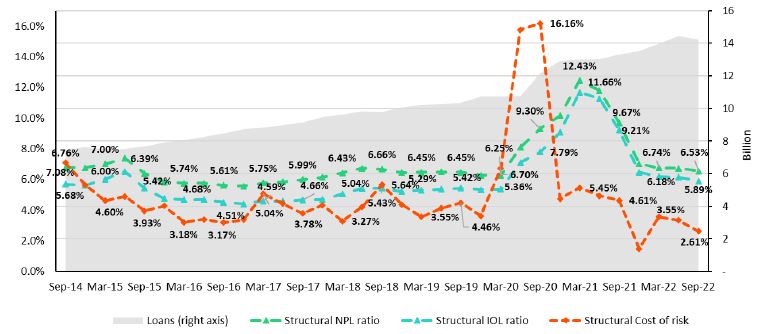
| | Structural loans increased QoQ, led by the evolution in Corporate Banking, Consumer and Mortgages at BCP Stand-alone, which rolled out campaigns for Working Capital; made product improvements; and experienced a decrease in prepayments, respectively. Mibanco continues to grow but at a slower pace due to a more prudent approach to lending. YoY, growth in structural loans was concentrated in Retail Banking and Mibanco in a context of economic reactivation. The Structural NPL ratio decreased QoQ as a result of the increase in structural loans and the drop in the IOL portfolio due to an increase in write-offs this quarter. | |
| | | |
Structural loans (in Average Daily Balances) (1)(2)(3)
Structural Loans (S/ millions) | As of | Volume change | % change | % Part. in total structural loans |
|
| Sep 21 | Jun 22 | Sep 22 | QoQ | YoY | QoQ | YoY | Sep 21 | Jun 22 | Sep 22 |
| BCP Stand-alone | 101,483 | 106,391 | 112,276 | 5,885 | 10,794 | 5.5% | 10.6% | 81.5% | 81.5% | 81.8% |
| Wholesale Banking | 53,048 | 53,460 | 56,969 | 3,508 | 3,920 | 6.6% | 7.4% | 42.6% | 41.0% | 41.5% |
| Corporate | 32,115 | 32,099 | 34,686 | 2,587 | 2,571 | 8.1% | 8.0% | 25.8% | 24.6% | 25.3% |
| Middle - Market | 20,933 | 21,361 | 22,282 | 921 | 1,349 | 4.3% | 6.4% | 16.8% | 16.4% | 16.2% |
| Retail Banking | 48,434 | 52,931 | 55,308 | 2,377 | 6,874 | 4.5% | 14.2% | 38.9% | 40.6% | 40.3% |
| SME - Business | 5,524 | 5,143 | 5,714 | 571 | 191 | 11.1% | 3.5% | 4.4% | 3.9% | 4.2% |
| SME - Pyme | 11,046 | 12,204 | 12,637 | 432 | 1,590 | 3.5% | 14.4% | 8.9% | 9.4% | 9.2% |
| Mortgage | 18,133 | 19,301 | 19,739 | 438 | 1,606 | 2.3% | 8.9% | 14.6% | 14.8% | 14.4% |
| Consumer | 10,000 | 11,848 | 12,444 | 597 | 2,444 | 5.0% | 24.4% | 8.0% | 9.1% | 9.1% |
| Credit Card | 3,731 | 4,435 | 4,774 | 339 | 1,042 | 7.6% | 27.9% | 3.0% | 3.4% | 3.5% |
| Mibanco | 10,429 | 12,313 | 12,782 | 469 | 2,354 | 3.8% | 22.6% | 8.4% | 9.4% | 9.3% |
| Mibanco Colombia | 1,047 | 1,152 | 1,163 | 11 | 116 | 1.0% | 11.1% | 0.8% | 0.9% | 0.8% |
| Bolivia | 9,408 | 8,622 | 8,992 | 370 | -416 | 4.3% | -4.4% | 7.6% | 6.6% | 6.5% |
| ASB | 2,123 | 2,030 | 2,084 | 54 | -39 | 2.7% | -1.8% | 1.7% | 1.6% | 1.5% |
| BAP's total loans | 124,488 | 130,508 | 137,298 | 6,790 | 12,809 | 5.2% | 10.3% | 100.0% | 100.0% | 100.0% |
| For consolidation purposes, Loans generated in Foreign Currency (FC) are converted to Local Currency (LC). |
|
(1) Includes Work out unit, and other banking. For Quarter-end Balances figures, please refer to “12. Annexes – 12.2 Loan Portfolio Quality”. (2) Structural Portfolio excludes the Loans offered through Reactiva Peru and FAE-Mype Government Programs (GP). | 
|
| (3) Internal Management Figures |
|
QoQ, if we exclude the exchange rate effect (USDPEN: +4.1%), loans increased 4.3%. Growth was driven primarily by:
| • | Wholesale Banking, which registered growth in short term transactions in both Foreign Currency (FC) and Local Currency (LC) in the Corporate Banking segment and secondarily, Middle Market Banking, via an uptick in financing for working capital. |
| • | An uptick in Consumer, after improvements were made to the Credito Efectivo to satisfy the needs of digital clients and initiatives were rolled out to capture clients from the competition through debt purchase offers via traditional channels. |
| • | SME-Business, driven by working capital loans growth due to growth in working capital loans after clients paid off Reactiva loans. |
| • | Mortgage, given that a lower level of prepayments this quarter offset the drop in disbursements generated by an increase in market rates. |
| • | An increase in SME-Pyme, which registered growth among the smallest clients in the portfolio (loans <90 thousand soles). The higher level of risk in this segment is offset by higher rates. |
| • | An uptick in Mibanco, due to growth in sales by Relationship Managers, who reported higher levels of productivity (levels increased to 15.4 operations per month in 3Q22 versus 14.3 in 2Q22). |
YoY, if we exclude the exchange rate effect (USDPEN: -3.7%), loans grew 12.6%. Growth was driven primarily by:
| • | Wholesale Banking, where the Corporate and Middle Market segments reported growth, which reflected an increase in needs for Working Capital and a base effect in 3Q21, when some clients amortized their debt. It is important to note that the MS of Wholesale Banking has increased 36bps since the beginning of the year. |
| • | Retail Banking at BCP, where the Consumer segment and SME-Pyme led expansion followed by the Mortgage and Credit Card segments. These dynamics were driven by an upswing in consumption due to economic reactivation. |
| • | Mibanco, where disbursements rose after the hybrid model facilitated centralized assessment and led to improvements in distribution channels. At the end of September 22, disbursements through leads (centralized assessment) represented 74.3% of total disbursements vs 70.0% in September 21. It is important to note the sustained growth in the average disbursement ticket, which was driven by an uptick in leads to clients with better risk profiles. |
Government Program Loans (in Average Daily Balances – S/ millions)
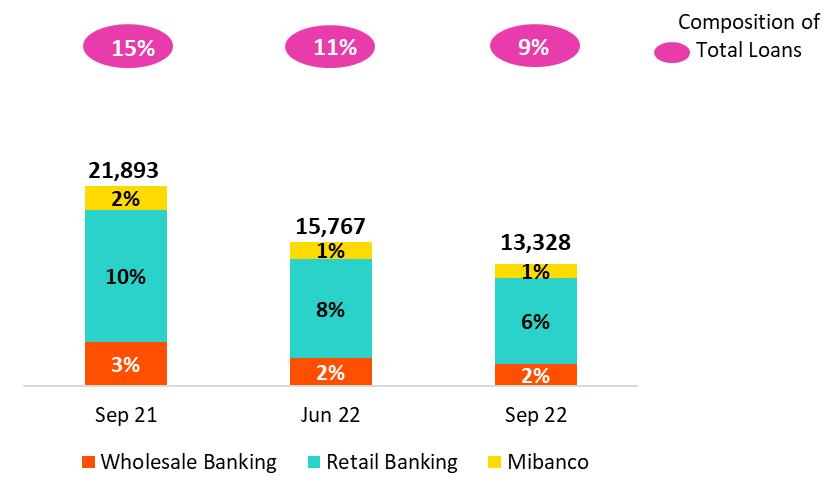
Government program loans dropped 15.5% QoQ and 39.1% YoY in average daily balances due to amortizations in Middle Market Banking and in SME Business at BCP Stand-alone.
It is important to note that GP loans in quarter-end balances represented 8% of total loans (vs 10% in Jun22 and 14% in Sep21).
The term for total amortization of GP loans in the Wholesale Banking, Retail Banking and Mibanco portfolios expires, on average, in 1.2, 1.6 and 2.7 years respectively.
Total loans (in Average Daily Balances) (1) (2)
Total Loans (S/ millions) | As of | Volume change | % change | % Part. in total loans |
|
| Sep 21 | Jun 22 | Sep 22 | QoQ | YoY | QoQ | YoY | Jun 21 | Mar 22 | Jun 22 |
| BCP Stand-alone | 120,722 | 120,299 | 124,101 | 3,801 | 3,379 | 3.2% | 2.8% | 82.5% | 82.2% | 82.4% |
| Wholesale Banking | 57,831 | 56,447 | 59,387 | 2,940 | 1,556 | 5.2% | 2.7% | 39.5% | 38.6% | 39.4% |
| Corporate | 32,610 | 32,435 | 34,961 | 2,526 | 2,351 | 7.8% | 7.2% | 22.3% | 22.2% | 23.2% |
| Middle - Market | 25,221 | 24,012 | 24,426 | 414 | -795 | 1.7% | -3.2% | 17.2% | 16.4% | 16.2% |
| Retail Banking | 62,891 | 63,852 | 64,713 | 861 | 1,823 | 1.3% | 2.9% | 43.0% | 43.7% | 43.0% |
| SME - Business | 11,400 | 9,330 | 9,219 | -110 | -2,181 | -1.2% | -19.1% | 7.8% | 6.4% | 6.1% |
| SME - Pyme | 19,626 | 18,939 | 18,537 | -402 | -1,089 | -2.1% | -5.5% | 13.4% | 12.9% | 12.3% |
| Mortgage | 18,133 | 19,301 | 19,739 | 438 | 1,606 | 2.3% | 8.9% | 12.4% | 13.2% | 13.1% |
| Consumer | 10,000 | 11,848 | 12,444 | 597 | 2,444 | 5.0% | 24.4% | 6.8% | 8.1% | 8.3% |
| Credit Card | 3,731 | 4,435 | 4,774 | 339 | 1,042 | 7.6% | 27.9% | 2.5% | 3.0% | 3.2% |
| Mibanco | 13,083 | 14,172 | 14,286 | 114 | 1,203 | 0.8% | 9.2% | 8.9% | 9.7% | 9.5% |
| Mibanco Colombia | 1,047 | 1,152 | 1,163 | 11 | 116 | 1.0% | 11.1% | 0.7% | 0.8% | 0.8% |
| Bolivia | 9,408 | 8,622 | 8,992 | 370 | -416 | 4.3% | -4.4% | 6.4% | 5.9% | 6.0% |
| ASB | 2,123 | 2,030 | 2,084 | 54 | -39 | 2.7% | -1.8% | 1.5% | 1.4% | 1.4% |
| BAP's total loans | 146,382 | 146,275 | 150,626 | 4,351 | 4,244 | 3.0% | 2.9% | 100.0% | 100.0% | 100.0% |
For consolidation purposes, Loans generated in Foreign Currency (FC) are converted to Local Currency (LC). | |
(1) Includes Work out unit, and other banking. For Quarter-end Balances figures, please refer to “12. Annexes – 12.2 Loan Portfolio Quality”. | |
(2) Internal Management Figures | |
QoQ and YoY, loan growth was driven by the positive results of the structural portfolio at BCP Stand-alone. This improvement was offset by the contraction in GP loans.
Evolution of the Dollarization Level of Loans (in Average Daily Balances) (1)(2)
| Total Loans | Local Currency (LC) - S/ millions | % change | % Structural change | Foreign Currency (FC) - US$ millions | % change | % part. by currency |
Total | Structural | Total | Sep 22 |
| Sep 21 | Jun-22 | Sep 22 | Sep 21 | Jun-22 | Sep 22 | QoQ | YoY | QoQ | YoY | Sep 21 | Jun-22 | Sep 22 | QoQ | YoY | LC | FC |
| BCP Stand-alone | 83,442 | 85,162 | 85,871 | 64,202 | 71,254 | 74,047 | 0.8% | 2.9% | 3.9% | 15.3% | 9,127 | 9,278 | 9,765 | 5.2% | 7.0% | 69.2% | 30.8% |
| Wholesale Banking | 28,562 | 28,411 | 28,943 | 23,779 | 25,424 | 26,524 | 1.9% | 1.3% | 4.3% | 11.5% | 7,165 | 7,403 | 7,777 | 5.1% | 8.5% | 48.7% | 51.3% |
| Corporate | 14,771 | 15,375 | 16,303 | 14,276 | 15,039 | 16,029 | 6.0% | 10.4% | 6.6% | 12.3% | 4,367 | 4,505 | 4,767 | 5.8% | 9.1% | 46.6% | 53.4% |
| Middle-Market | 13,791 | 13,036 | 12,639 | 9,503 | 10,385 | 10,495 | -3.0% | -8.4% | 1.1% | 10.4% | 2,798 | 2,899 | 3,011 | 3.9% | 7.6% | 51.7% | 48.3% |
| Retail Banking | 54,880 | 56,751 | 56,929 | 40,423 | 45,830 | 47,523 | 0.3% | 3.7% | 3.7% | 17.6% | 1,962 | 1,875 | 1,988 | 6.0% | 1.3% | 88.0% | 12.0% |
| SME - Business | 8,076 | 6,586 | 6,100 | 2,199 | 2,400 | 2,595 | -7.4% | -24.5% | 8.2% | 18.0% | 815 | 724 | 797 | 10.0% | -2.3% | 66.2% | 33.8% |
| SME - Pyme | 19,441 | 18,775 | 18,368 | 10,861 | 12,040 | 12,467 | -2.2% | -5.5% | 3.5% | 14.8% | 45 | 43 | 43 | -0.3% | -4.4% | 99.1% | 0.9% |
| Mortgage | 15,960 | 17,353 | 17,684 | 15,960 | 17,353 | 17,684 | 1.9% | 10.8% | 1.9% | 10.8% | 532 | 514 | 525 | 2.1% | -1.3% | 89.6% | 10.4% |
| Consumer | 8,469 | 10,373 | 10,850 | 8,469 | 10,373 | 10,850 | 4.6% | 28.1% | 4.6% | 28.1% | 375 | 390 | 407 | 4.6% | 8.7% | 87.2% | 12.8% |
| Credit Card | 2,933 | 3,664 | 3,927 | 2,933 | 3,664 | 3,927 | 7.2% | 33.9% | 7.2% | 33.9% | 195 | 203 | 216 | 6.3% | 10.7% | 82.3% | 17.7% |
| Mibanco | 12,614 | 13,696 | 13,812 | 9,960 | 11,837 | 12,309 | 0.9% | 9.5% | 4.0% | 23.6% | 115 | 126 | 121 | -3.8% | 5.6% | 96.7% | 3.3% |
| Mibanco Colombia | - | - | - | - | - | - | - | - | - | - | 256 | 304 | 297 | -2.4% | 16.0% | - | 100.0% |
| Bolivia | - | - | - | - | - | - | - | - | - | - | 2,302 | 2,277 | 2,297 | 0.9% | -0.2% | - | 100.0% |
| ASB Bank Corp. | - | - | - | - | - | - | - | - | - | - | 520 | 536 | 532 | -0.7% | 2.5% | - | 100.0% |
| Total loans | 96,056 | 98,858 | 99,684 | 74,162 | 83,091 | 86,356 | 0.8% | 3.8% | 3.9% | 16.4% | 12,320 | 12,521 | 13,012 | 3.9% | 5.6% | 66.2% | 33.8% |
| (1) Includes Work out unit, and other banking. | |
| (2) Internal Management Figures. |
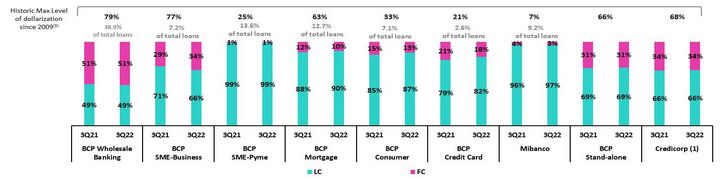
At the end of September 2022, the dollarization level of structural loans increased 112bps QoQ (37.1% in September 22). This evolution was primarily driven by the uptick in FC disbursements in Wholesale Banking (whose share in FC grew 100bps QoQ) and by the variation in the exchange rate, which impacted Wholesale Banking and SME Business at BCP Stand-alone in particular. The LC portfolio grew 3.9%, led by Corporate Banking and Consumer.
YoY, the dollarization level of the structural portfolio dropped (-332pbs) given that growth in LC loans (+16.4%) outpaced the expansion in FC (+5.6%). The increase registered in LC was led by Consumer, SME-Pyme and Corporate Banking at BCP Stand-alone and driven by economic reactivation and moves to penetrate new segments. In FC, growth was spurred by Wholesale Banking.
Evolution of the Dollarization Level of Structural Loans (in Average Daily Balances)*
(1) The FC share of Credicorp’s loan portfolio is calculated including BCP Bolivia and ASB Bank Corp., however the chart shows only the loan books of BCP Stand-alone and Mibanco.
(2) The year with the historic maximum level of dollarization for Wholesale Banking was 2012, for Mibanco was 2016, for Credit Card was in 2021 and for the rest of segments was 2009.
* For dollarization figures in quarter-end period, please refer to “12. Annexes – 12.2 Loan Portfolio Quality
Loan Evolution in Quarter-end Balances
Structural loans grew 2.5% QoQ in quarter-end balances. If we exclude the increase in the exchange rate, structural loans rose 1.0% QoQ, which was attributable to Wholesale Banking, Consumer and Mortgage at BCP Stand-alone and driven by the same factors as those outlined in the analysis of average daily balances. If we include the contraction in the GP portfolio in the analysis, total loans rose 0.7% QoQ (-0.7% if we isolate the exchange rate effect).
In YoY terms, structural loans increased 10.8%. If we exclude the exchange rate effect, structural loans rose 12.4%, driven by the same segments that drove QoQ growth. If we incorporate the drop in the GP portfolio in the analysis, total loans grew 3.3% YoY.
1.2. Portfolio Quality
Quality of the Structural Portfolio (in Quarter-end balances)
| Structural Portfolio quality and Delinquency ratios | As of | % change |
| S/ 000 | Sep 21 | Jun 22 | Sep 22 | QoQ | YoY |
| Structural loans (Quarter-end balance) | 125,528,623 | 135,722,381 | 139,092,027 | 2.5% | 10.8% |
| Structural Allowance for loan losses | 8,934,930 | 8,112,356 | 7,755,432 | -4.4% | -13.2% |
| Structural Write-offs | 670,273 | 413,501 | 837,924 | 102.6% | 25.0% |
| Structural IOLs | 4,747,553 | 5,163,525 | 5,037,163 | -2.4% | 6.1% |
| Structural Refinanced loans | 1,798,965 | 1,686,186 | 1,808,982 | 7.3% | 0.6% |
| Structural NPLs | 6,546,518 | 6,849,711 | 6,846,145 | -0.1% | 4.6% |
| Structural IOL ratio | 3.78% | 3.80% | 3.62% | -18 bps | -16 bps |
| Structural NPL ratio | 5.22% | 5.05% | 4.92% | -13 bps | -30 bps |
| Structural Allowance for loan losses over Structural loans | 7.1% | 6.0% | 5.6% | -40 bps | -154 bps |
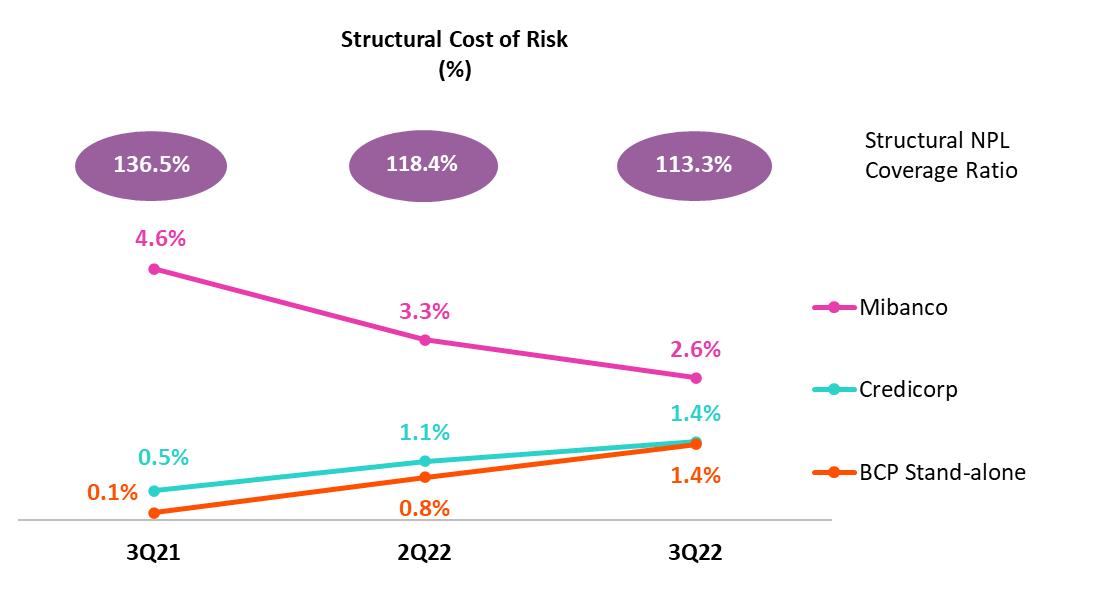
| Structural Coverage ratio of NPLs | 136.5% | 118.4% | 113.3% | -515 bps | -2320 bps |
(1) The Structural Portfolio excludes Government Programs (GP) effects.
The volume of the structural NPL portfolio fell QoQ by -0.1%. Growth in new entrants to the NPL portfolio in SME-Pyme, Individuals and Wholesale segment was offset by write-offs in the SME-Pyme segments, Individuals and Mibanco this quarter. YoY, the structural NPL portfolio grew 4.6% due to an increase in overdue loans in SME-Pyme and in refinanced loans in Wholesale Banking. The aforementioned was partially offset by a drop in the IOL portfolio at Mibanco. In the aforementioned context, the structural NPL ratio stood at 4.92%.
In the QoQ analysis, the segments that contributed to the reduction in structural NPL loans were:
| • | Small and Medium Businesses, where growth in new entrants to the NPL portfolio was offset by the expansion in write-offs this quarter (for more information, see the section on Structural write-offs). Growth in NPLs was driven by SME-Pyme after higher-risk segments were penetrated (debt below S/90,000). In these segments, higher risk was offset by higher interest rates. The deterioration in risk remains within our risk appetite for this segment. |
| • | Individuals, within this segment, similar to the situation in SME-Pyme, growth in new entrants to the NPL portfolio was offset by write-offs this quarter, mainly in Consumer (for more information, see the Section on Structural Write-offs). |
The reduction in NPLs was partially attenuated by growth in the refinanced portfolio in Wholesale Banking. Refinancing was concentrated within specific clients in the real estate sector (building and office leasing) and tourism (hotels), mainly in Middle Market Banking, which were severely impacted by the pandemic and had been offered debt refinancing facilities. It is important to note that this increase is in line with expectations and reflects the real delinquency levels of clients now that restrictions on loan progression to later stages of delinquency have been lifted and more clients find themselves in need of refinancing.
In the YoY analysis, growth in NPLs was attributable to:
| • | Small and Medium Companies: The deterioration of this portfolio was attributable primarily to the SME-Pyme segment and was driven by the same factors as those outlined for the QoQ evolution. |
| • | Wholesale: Growth in the refinanced portfolio corresponds to the same factors that drove the QoQ variation. |
Growth in the NPL portfolio was attenuated by a reduction in NPLS at Mibanco, which was generated by a base effect in 3Q21 after grace periods for reprogrammed loans expired and loans fell delinquent.
Structural write-offs (in quarter-end balances – S/ thousands)
QoQ, growth in structural loans (+103%) was attributable to:
| • | Small and Medium businesses after regulatory restrictions were lifted on write-offs of structural loans held by clients that possess both a structural loan and Reactiva loans. This quarter marked the first wave of write-offs and the trend is expected to continue. |
| • | Mibanco, after a review of the under legal recovery portfolio determined that a larger portion of this portfolio could be written-off. |
| • | Consumer, where a review of regulations found that a portion of the loans under legal recovery with guarantees could be written-off. |
YoY growth in NPLS was driven by an uptick in write-offs in small and medium businesses, for the same reasons outlined in the QoQ explanation.
Coverage Ratio of Structural NPL Loans
QoQ, the reduction in the NPL coverage ratio was attributable to growth in delinquency in the SME-Pyme segments and Individuals and in refinanced loans in Wholesale Banking.
YoY, the downward trend was attributable to growth in the NPL portfolio. The trend was also fueled by BCP Bolivia, given that reserves have been released due to better-than-expected payment behavior.
NPL loans in the Government Loan Portfolio (in quarter-end balances– S/ thousands)
QoQ, NPL loans in the GP portfolio increased due to the expiration of grace periods for reprogrammed loans, where payment capacities were impaired by an adverse economic climate.
For loans that are more than 90 days overdue, honoring processes have begun to execute State guarantees. Average guarantees cover 84%, 91% and 97% of Wholesale Banking, Retail Banking and Mibanco respectively.
Quality of the Total Portfolio (in quarter-end balances)
| Loan Portfolio Quality and Delinquency Ratios | As of | % change |
| S/ 000 | Sep 21 | Jun 22 | Sep 22 | QoQ | YoY |
| Total loans (Quarter-end balance) | 146,551,226 | 150,370,184 | 151,392,202 | 0.7% | 3.3% |
| Allowance for loan losses | 9,077,449 | 8,306,500 | 8,030,104 | -3.3% | -11.5% |
| Write-offs | 670,273 | 413,501 | 837,924 | 102.6% | 25.0% |
Internal overdue loans (IOLs) (1)(2) | 5,473,685 | 6,105,256 | 6,250,131 | 2.4% | 14.2% |
Internal overdue loans over 90-days (1) | 4,051,717 | 4,596,259 | 4,667,608 | 1.6% | 15.2% |
Refinanced loans (2) | 1,798,965 | 1,686,186 | 1,808,982 | 7.3% | 0.6% |
Non-performing loans (NPLs) (3) | 7,272,650 | 7,791,442 | 8,059,113 | 3.4% | 10.8% |
| IOL ratio | 3.73% | 4.06% | 4.13% | 7 bps | 40 bps |
| IOL over 90-days ratio | 2.76% | 3.06% | 3.08% | 2 bps | 32 bps |
| NPL ratio | 4.96% | 5.18% | 5.32% | 14 bps | 36 bps |
| Allowance for loan losses over Total loans | 6.2% | 5.5% | 5.3% | -22 bps | -89 bps |
| Coverage ratio of IOLs | 165.8% | 136.1% | 128.5% | -757 bps | -3736 bps |
| Coverage ratio of IOL 90-days | 224.0% | 180.7% | 172.0% | -868 bps | -5200 bps |
| Coverage ratio of NPLs | 124.8% | 106.6% | 99.6% | -697 bps | -2518 bps |
(1) Includes Overdue Loans and Loans under legal collection. (Quarter-end balances net of deferred earnings).
(2) Figures net of deferred earnings.
(3) Non-performing Loans include Internal overdue loans and Refinanced loans. (Quarter-end balances net of deferred earnings
In this context, the NPL ratio increased 14bps QoQ and 36bps YoY due to deterioration and amortization in the GP portfolio.
| | | |
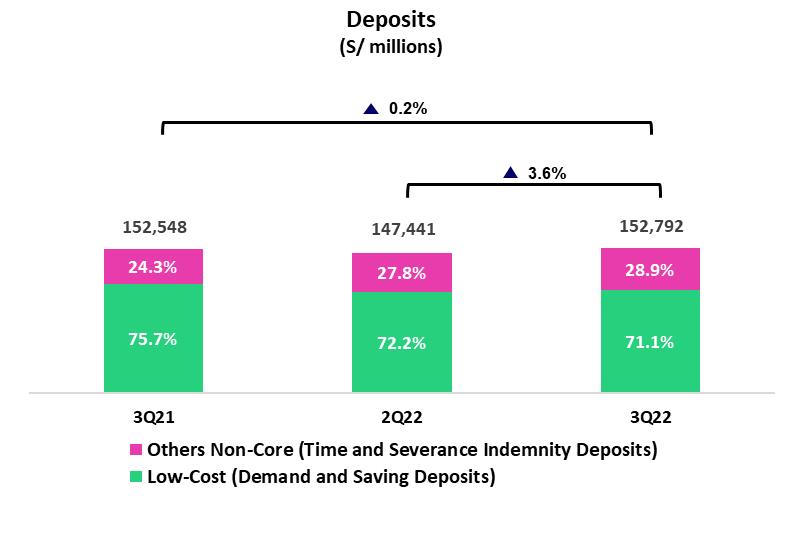
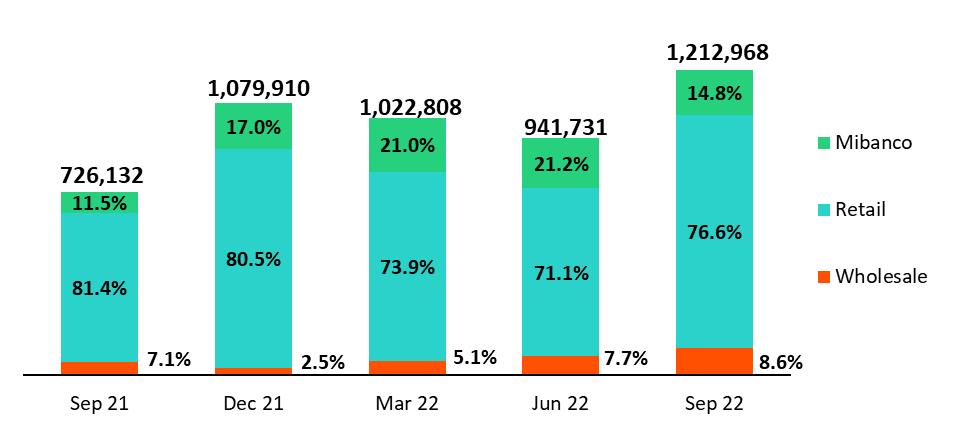
| | At the end of 3Q22, 71.1% of total deposits were low-cost, which represents a competitive advantage in a context of rising interest rates. In YoY terms, low-cost deposits decreased 4.1% (at a constant exchange rate). This drop was driven mainly by a reduction in demand deposits held by companies that amortized GP loans. Severance Indemnity Deposits dropped 19.0% (at a constant exchange rate) after restrictions on fund withdrawals were lifted. Time Deposits, which received an inflow of funds from low-cost deposits as clients moved to take advantage of higher interest rates, registered an upward trend. At the end of August 2022, BCP Stand-alone + Mibanco’s market share stood at 35.7% (+44bps with regard to Sept 21). This improvement was spurred mainly by growth in the MS of Time Deposits in a context of higher rates. | |
| | | |
| Deposits | As of | % change | Currency |
| S/ 000 | Sep 21 | Jun 22 | Sep 22 | QoQ | YoY | LC | FC |
| Demand deposits | 61,112,084 | 51,554,195 | 53,512,524 | 3.8% | -12.4% | 41.9% | 58.1% |
| Saving deposits | 54,365,781 | 54,936,107 | 55,154,337 | 0.4% | 1.5% | 52.9% | 47.1% |
| Time deposits | 31,601,351 | 35,923,266 | 39,372,047 | 9.6% | 24.6% | 48.4% | 51.6% |
| Severance indemnity deposits | 4,681,224 | 4,155,932 | 3,745,597 | -9.9% | -20.0% | 70.1% | 29.9% |
| Interest payable | 787,928 | 871,075 | 1,007,509 | 15.7% | 27.9% | 48.2% | 51.8% |
| Total Deposits | 152,548,368 | 147,440,575 | 152,792,014 | 3.6% | 0.2% | 48.2% | 51.8% |
Our deposit base increased 3.6% QoQ. If we isolate the exchange rate effect, growth stood at 1.6%. The following dynamics were noteworthy:
| • | 7.3% growth in Time Deposits, which driven primarily by FC deposits at BCP Stand-alone after the bank captured more funds in a context marked by rate increases and exchange rate volatility. |
| • | 1.7% in Demand Deposits, which reflected an uptick in LC deposits, in part after clients deposited funds from pension fund withdrawals. This dynamic was partially offset by a drop in FC deposits, which fell despite an uptick in the exchange rate. |
| • | 1.4% reduction in Savings Deposits, which was fueled by the exchange rate effect. Additionally, fund migration from FC to LC was significant. |
| • | 11.0% decrease in Severance Deposits after restrictions on fund withdrawals were lifted. It is important to note that these funds will be available until the end of 2023. |
Low-cost deposits (Demand + savings) accounted for 71.1% of total deposits, which represents a drop of 1.1% QoQ.
In the YoY analysis, deposits rose 0.2%. If we isolate the exchange rate effect, deposits grew 2.1%. The following dynamics were in play this quarter:
| • | A 27.2% increase in Time Deposits, which was primarily driven by a migration of funds from low-cost to time deposits at BCP Stand-alone due to an increase in rates. The evolution at ASB, which received fund inflows from Peru in a context marked by political-economic uncertainty, also contributed to the upward trend in time deposits. |
| • | 3.2% growth in Savings Deposits, which reflects captures of savings in FC; the aforementioned was partially offset by outflows of funds in LC. |
| • | A 10.7% reduction in Demand Deposits in both currencies, which was primarily driven by movements in company accounts after clients used funds to amortize Reactiva loans and cover other needs for liquidity. |
| • | A 19.0% drop in Severance Deposits, after restrictions on withdrawals were lifted. |
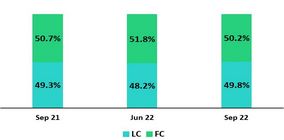
Dollarization Level of Deposits
Deposits by currency
(measured in quarter-end balances)
At the end of September 2022, the dollarization level of Total Deposits fell 1.6 p.p. QoQ (-2.6 p.p. if we exclude the exchange rate effect). This dynamic was attributable to Demand demands after clients in BCP Stand-alone deposited funds from pension fund withdrawals accounts in LC. This was partially offset by growth in FC Time Deposits.
In YoY terms, the dollarization level fell 0.5 p.p. This decrease occurred despite growth in the FC deposit volume (+6.3% at a constant rate of exchange) and was fueled by a drop in the exchange rate (-3.7% YoY), which registered a peak in September 2021. It is important to note that LC deposits rose 1.2% over the period.
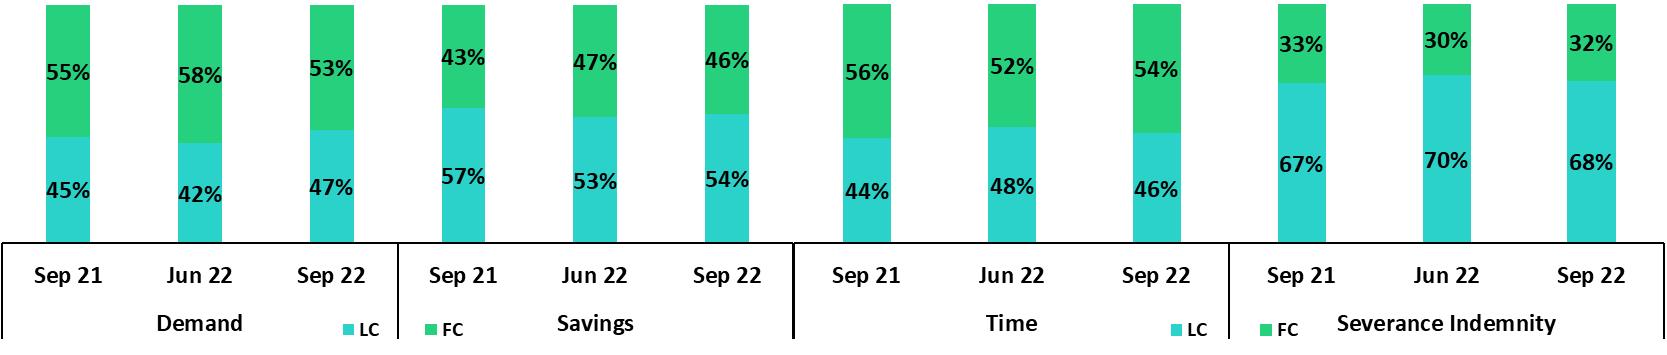
Deposits by currency and type
(measured in quarter-end balances)
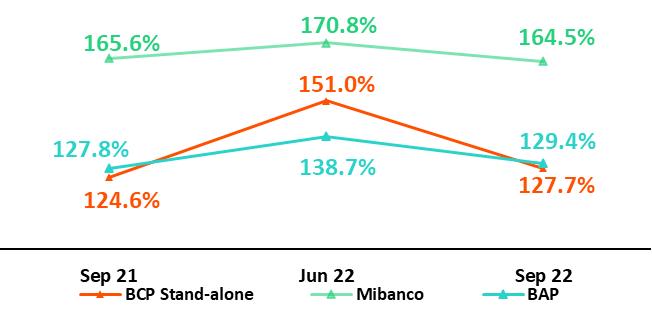
Loan/Deposit Ratio (L/D ratio)
The L/D ratio fell 3.0 and 6.3 percentage points QoQ at BCP Stand-alone and Mibanco respectively. This drop was associated with growth in total deposits ─ in time deposits in particular ─ at both subsidiaries in a context of rising interest rates. In parallel, the loan balance decelerated at BCP Stand-alone and fell at Mibanco. Credicorp’s L/D ratio stood at 99.1%.
L/D Ratio in Local Currency
L/D Ratio in Foreign Currency
Market share of Deposits in the Peruvian Financial System
At the end of August 2022, the MS in Total Deposits at BCP Stand-alone and Mibanco stood at 33.3% and 2.4% (+30bps and +14bps with regard to September 2021) respectively.
At BCP Stand-alone, growth in Time Deposit’s share of total deposits (+250bps), which was driven be commercial efforts to bolster the ranks of Deposits in our funding structure. BCP reported a decrease in the share of Demand Deposits, which reflected moves by businesses to amortize loans from Reactiva, where the bank was the major source of lending.
It is important to note that BCP continues to hold the highest market share of low-cost deposits in the Peruvian financial system, with an MS of 40.6% at the end of August 2022 (+0.9% with regard to September 2021).
03 Interest-earning assets (“IEA”) and Funding
| | | |
| | At the end of 3Q22, IEA rose 3.4% QoQ. This growth was driven primarily by an increase in Cash and Due from Banks and Investments and secondarily, by an uptick in Loans. Higher balances for liquid assets reflect growth of 3.5% in the funding base, which was led by growth in captures of deposits and bank financing. YoY, IEAs fell 1.9%, which was attributable to a decrease in balances of Cash and Due from Banks and Investments after the drop in system-wide liquidity and the use of funds to finance loan growth. Funding decreased 2.6%, which reflected a decrease in BCRP instruments due to amortizations of Government Loan programs (GP). If we isolate the exchange rate effect, structural loans rise 1.0% QoQ, driven primarily by wholesale loans at BCP. YoY, the increase stands at 12.4%, which reflects economic recovery post-pandemic. | |
| | | |
3.1. IEA
| Interest Earning Assets | As of | % change |
| S/000 | Sep 21 | Jun 22 | Sep 22 | QoQ | YoY |
| Cash and due from banks | 36,147,225 | 23,831,465 | 29,330,082 | 23.1% | -18.9% |
| Total investments | 48,110,456 | 45,342,775 | 46,843,270 | 3.3% | -2.6% |
| Cash collateral, reverse repurchase agreements and securities borrowing | 2,555,337 | 2,046,209 | 1,586,967 | -22.4% | -37.9% |
| Financial assets designated at fair value through profit or loss | 981,508 | 765,195 | 767,425 | 0.3% | -21.8% |
| Total loans | 146,551,226 | 150,370,184 | 151,392,202 | 0.7% | 3.3% |
| Total interest earning assets | 234,345,752 | 222,355,828 | 229,919,946 | 3.4% | -1.9% |
QoQ, IEA increased 3.4%. Growth was driven by an uptick in Cash and Due from Banks, Investments and structural loans.
Significant growth in Cash and Due from Banks was attributable to an increase in the funding base at BCP and Mibanco. The majority of these funds are held in BCRP accounts, which generate returns. Investments increased 3.3% over the same period, in line with growth in IEA.
Loan levels remained stable in a context of mixed dynamics. The positive impetus provided by an uptick in the US Dollar was offset by the amortization of government program (GP) loans. Structural loans increased 2.5% (1.0%, excluding the exchange rate effect), driven primarily by short-term loans in the wholesale portfolio.
YoY, IEA fell 1.9% due to a drop in balances of Cash and Due from Banks and Investments, which was partially offset by Loan growth. Cash and Due from Banks decreased this quarter due to: (i) a reduction in liquidity levels in the banking system following amortizations of GP loans and (ii) the use of liquid funds to finance Loan growth. It is important to note that structural loans increased 10.8% (12.4% excluding the exchange rate effect), which reflects economic recovery post-pandemic. GP loans fell 41.5%.
3.2. Funding
| Funding | As of | % change |
| S/ 000 | Sep 21 | Jun 22 | Sep 22 | QoQ | YoY |
| Deposits and obligations | 152,548,368 | 147,440,575 | 152,792,014 | 3.6% | 0.2% |
| Due to banks and correspondents | 7,466,434 | 6,456,360 | 9,002,035 | 39.4% | 20.6% |
| BCRP instruments | 20,746,109 | 16,031,618 | 14,449,597 | -9.9% | -30.4% |
| Repurchase agreements | 1,330,811 | 1,340,423 | 1,182,946 | -11.7% | -11.1% |
| Bonds and notes issued | 17,577,630 | 16,579,674 | 17,019,694 | 2.7% | -3.2% |
| Total funding | 199,669,352 | 187,848,650 | 194,446,286 | 3.5% | -2.6% |
QoQ, funding increased 3.5%, driven by (i) an uptick in deposit captures and (ii) growth in other sources of funding, mainly due to banks and notes. YoY funding fell 2.6%. This decline was spurred by a drop in the balance of BCRP instruments, which were impacted by amortizations of GP loans.
04 Net Interest Income (NII)
| | | |
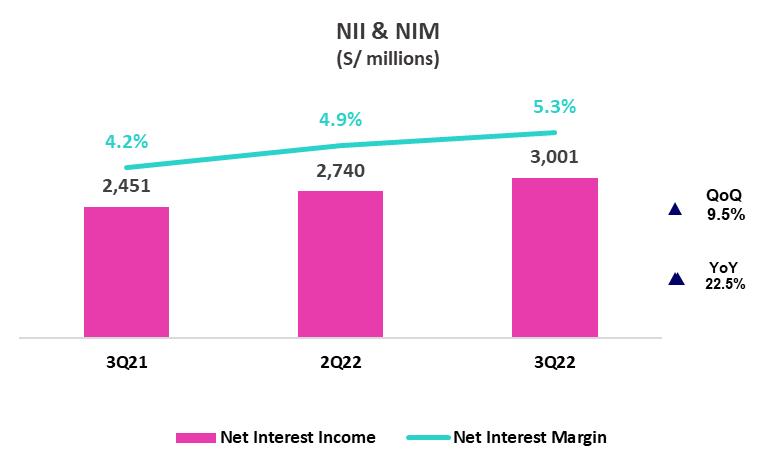
| | In 3Q22, Net Interest Income continued to recover. This evolution was primarily driven by the increase in market rates and disciplined pricing management. It is important to note that the volume dynamics described in the section on IEAs generated a higher-yield mix where liquid assets with lower rates continue to fall and structural loans are on the rise. These factors offset the negative effect generated by an increase in the cost of funds in a context marked by growth in passive interest rates and expansion in expensive funding sources. Notwithstanding, at the end of 3Q22, low-cost deposits constituted 55.9% of the funding structure. In this context, in the 3Q22, the Net interest margin rose 41bps QoQ and 108bps YoY to stand at 5.31% while the Structural Net Interest Margin stood at 5.58% (+40bps QoQ, +105bps YoY). | |
| | | |
| Net Interest Income / Margin | Quarter | % change | As of | % change |
| S/ 000 | 3Q21 | 2Q22 | 3Q22 | QoQ | YoY | Sep 21 | Sep 22 | Sep 22 / Sep 21 |
| Interest Income | 3,051,000 | 3,488,113 | 3,988,681 | 14.4% | 30.7% | 8,758,652 | 10,649,140 | 21.6% |
| Interest Expense | 599,901 | 748,085 | 987,255 | 32.0% | 64.6% | 1,876,282 | 2,374,221 | 26.5% |
| Net Interest Income | 2,451,099 | 2,740,028 | 3,001,426 | 9.5% | 22.5% | 6,882,370 | 8,274,919 | 20.2% |
| | | | | | | | | |
| Balances | | | | | | | | |
| Average Interest Earning Assets (IEA) | 231,912,064 | 223,529,737 | 226,137,887 | 1.2% | -2.5% | 229,486,667 | 230,803,439 | 0.6% |
| Average Funding | 198,314,233 | 188,461,327 | 191,164,166 | 1.4% | -3.6% | 195,570,200 | 195,050,534 | -0.3% |
| | | | | | | | | |
| Yields | | | | | | | | |
| Yield on IEAs | 5.26% | 6.24% | 7.06% | 82bps | 180bps | 5.09% | 6.15% | 106bps |
| Cost of Funds | 1.21% | 1.59% | 2.07% | 48bps | 86bps | 1.28% | 1.62% | 34bps |
| Net Interest Margin (NIM) | 4.23% | 4.90% | 5.31% | 41bps | 108bps | 4.00% | 4.78% | 78bps |
| Risk-Adjusted Net Interest Margin | 3.94% | 4.25% | 4.50% | 25bps | 56bps | 3.37% | 4.16% | 79bps |
| Peru's Reference Rate | 1.00% | 5.50% | 6.75% | 125bps | 575bps | 1.00% | 6.75% | 575bps |
| FED funds rate | 0.25% | 1.75% | 3.25% | 150bps | 300bps | 0.25% | 3.25% | 300bps |
Net Interest Income grew 9.5% QoQ and 22.5% YoY this quarter and 20.2% YTD at the end of September, driven by the fact that growth in income outstripped the expansion in expenses in an environment marked by rising interest rates. Structural loans continued to evolve positively while liquidity fell, which reflects amortizations of GP loans. Growth in interest income offset an uptick in interest expenses due to rate hikes and growth in more costly funding sources. In this context, NIM rose 41bps QoQ, 108bps YoY and 78bps YTD in 3Q22 to stand at 5.31% in 3Q22 and 4.78% in the first nine months of 2022.
For more information on income and interest expenses by item, please see annex 12.3.
Net interest margin
Structural NIM accelerated its pace of recovery due to the positive price effect generated by rising rates and active yield management in our business segments. The factors that drove the NIM dynamic also spurred the evolution of risk-adjusted NIM, which reached pre-pandemic levels and stood at 4.50% this quarter.
To analyze the evolution of Net Interest Income, it is important to differentiate dynamics by currency given that trends for volumes and variations in market rates are different for each. The LC reference rate (BCRP) increased 125bps QoQ and 575bps YoY while the FC rate (FED funds rate) increased 150bps QoQ and 300bps YoY.
04. Net Interest Income (NII) |
Dynamics for Net Interest Income by Currency
| Interest Income / IEA | 3Q21 | 2Q22 | 3Q22 | | Sep 21 | Sep 22 |
| S/ millions | Average | | | Average | | | Average | | | | Average | | | Average | | |
| | Balance | Income | Yields | Balance | Income | Yields | Balance | Income | Yields | | Balance | Income | Yields | Balance | Income | Yields |
| Cash and equivalents | 32,611 | 12 | 0.1% | 26,697 | 48 | 0.7% | 26,581 | 139 | 2.1% | | 32,362 | 26 | 0.1% | 30,863 | 222 | 1.0% |
| Other IEA | 3,038 | 26 | 3.4% | 2,592 | 14 | 2.2% | 2,523 | 10 | 1.6% | | 3,377 | 51 | 2.0% | 2,488 | 43 | 2.3% |
| Investments | 51,442 | 406 | 3.2% | 46,744 | 497 | 4.2% | 46,093 | 551 | 4.8% | | 51,642 | 1,165 | 3.0% | 47,898 | 1,480 | 4.1% |
| Loans | 144,821 | 2,607 | 7.2% | 147,496 | 2,930 | 7.9% | 150,881 | 3,289 | 8.7% | | 142,106 | 7,516 | 7.1% | 149,495 | 8,904 | 7.9% |
| Structural | 122,812 | 2,521 | 8.2% | 132,651 | 2,871 | 8.7% | 138,335 | 3,235 | 9.4% | | 119,273 | 7,265 | 8.1% | 134,281 | 8,725 | 8.7% |
| Government Programs | 22,009 | 86 | 1.6% | 14,845 | 59 | 1.6% | 12,546 | 54 | 1.7% | | 22,832 | 251 | 1.5% | 15,214 | 180 | 1.6% |
| Total IEA | 231,912 | 3,051 | 5.3% | 223,530 | 3,488 | 6.2% | 226,078 | 3,989 | 7.1% | | 229,487 | 8,759 | 5.1% | 230,743 | 10,649 | 6.2% |
| IEA (LC) | 57.5% | 75.1% | 6.9% | 58.6% | 78.2% | 8.3% | 56.9% | 75.0% | 9.3% | | 58.9% | 75.6% | 6.5% | 56.2% | 77.2% | 8.5% |
| IEA (FC) | 42.5% | 24.9% | 3.1% | 41.4% | 21.8% | 3.3% | 43.1% | 25.0% | 4.1% | | 41.1% | 24.4% | 3.0% | 43.8% | 22.8% | 3.2% |
| Interest Expense / Funding | 3Q21 | 2Q22 | 3Q22 | | Sep 21 | Sep 22 |
| S/ millions | Average | | | Average | | | Average | | | | Average | | | Average | | |
| | Balance | Expense | Yields | Balance | Expense | Yields | Balance | Expense | Yields | | Balance | Expense | Yields | Balance | Expense | Yields |
| Deposits | 150,855 | 210 | 0.6% | 147,678 | 337 | 0.9% | 150,116 | 510 | 1.4% | | 147,457 | 642 | 0.6% | 151,566 | 1,106 | 1.0% |
| BCRP + Due to Banks | 28,891 | 110 | 1.5% | 23,192 | 142 | 2.4% | 22,970 | 186 | 3.2% | | 29,963 | 324 | 1.4% | 25,179 | 444 | 2.3% |
| Bonds and Notes | 17,265 | 179 | 4.2% | 16,312 | 168 | 4.1% | 16,800 | 180 | 4.3% | | 16,949 | 625 | 4.9% | 17,049 | 514 | 4.0% |
| Others | 1,304 | 99 | 30.3% | 1,279 | 101 | 31.7% | 1,278 | 111 | 34.8% | | 1,202 | 282 | 31.3% | 1,256 | 310 | 32.9% |
| Total Funding | 198,314 | 598 | 1.2% | 188,461 | 748 | 1.6% | 191,164 | 987 | 2.1% | | 195,570 | 1,873 | 1.3% | 195,051 | 2,374 | 1.6% |
| Funding (LC) | 52.8% | 45.3% | 1.0% | 51.4% | 58.4% | 1.8% | 51.1% | 57.8% | 2.3% | | 54.6% | 45.4% | 1.1% | 51.2% | 56.9% | 1.8% |
| Funding (FC) | 47.2% | 54.7% | 1.4% | 48.6% | 41.6% | 1.4% | 48.9% | 42.2% | 1.8% | | 45.4% | 54.6% | 1.5% | 48.8% | 43.1% | 1.4% |
| | | | | | | | | | | | | | | | | |
| NIM | 231,912 | 2,453 | 4.2% | 223,530 | 2,740 | 4.9% | 226,078 | 3,001 | 5.3% | | 229,487 | 6,885 | 6.0% | 230,743 | 8,276 | 7.2% |
| NIM (LC) | 57.5% | 82.3% | 6.1% | 58.6% | 83.7% | 7.0% | 56.9% | 80.7% | 7.5% | | 58.9% | 83.8% | 4.3% | 56.2% | 83.0% | 5.3% |
| NIM (FC) | 42.5% | 17.7% | 1.8% | 41.4% | 16.3% | 1.9% | 43.1% | 19.3% | 2.4% | | 41.1% | 16.2% | 1.2% | 43.8% | 17.0% | 1.4% |
QoQ Analysis
QoQ, Net Interest Income rose 9.5%. The evolution was mainly driven by the increase in LC and FC rates. IEA in LC represent 57% of total IEA and account for 81% of the Net Interest Income generated in 3Q22.
Dynamics in Local Currency (LC)
Net interest income in LC rose 5.6% after growth in interest income outpaced th expansion in expenses, which was due to the following dynamics:
Average IEAs in LC fell slightly and registered mixed variations in their components. Average structural loans increased 2.8% while liquid assets, investments and GP loans fell. Movements in these accounts generated a higher yield IEA mix in LC. The rates associated with components of IEA increased, in particular for loans and cash and equivalents, in line with growth in Peru’s reference rate and our active yield management. The yield on IEA in LC rose from 8.3% in 2Q22 to 9.3% in 3Q22. In this context, the price effect spearheaded the dynamic that contributed to 9.7% growth in interest income in LC.
Average funding in LC rose 0.9% due to growth in deposits and in time deposits in particular, which are more expensive than demand and savings deposits. It is important to note the demand and saving deposits also contributed, although to a lesser extent, to growth in funding. This dynamic generated a more expensive deposit mix. Other sources of funding fell 4.2%, which was mainly attributable to a decline in balances of Reactiva funding, which was partially offset by growth in short-term due to banks. The funding cost in LC rose from 1.8% in 2Q22 to 2.3% in 3Q22, which primarily reflects the increase in market rates for deposits and an uptick in the share of more expensive sources of funding. Interest expenses in LC rose 30.9% due to negative price and mix factors.
Dynamics in Foreign Currency (FC)
Net Interest Income in FC increased 29.6% due to the following dynamics:
Average IEA in FC grew 5.2% due to growth in loans and available funds. Higher growth in loans than in other assets led to a higher-yield IEA mix in FC. FC rates increased in line with FED rate hikes. Higher interest rates and the evolution of loans led interest income in FC to increase 31.2%.
Average funding in FC rose 2.0%. This reflected the increase in sources of funding with higher rates, such as time deposits and due to banks, which was offset by a reduction in demand deposits. The funding cost increase was driven primarily by growth in FC rates and a negative mix effect generated by the increase in wholesale funding. In this context, interest expenses in FC increased 33.4%.
YoY Analysis
YoY, Net Interest Income rose 22.5%. This evolution was primarily attributable to the trajectory of IEA and rates in LC.
04. Net Interest Income (NII) |
Dynamics in Local Currency (LC)
Net Interest Income in LC rose 20.0% YoY, in line with the following dynamics:
Average IEA in LC fell 3.4% YoY, driven by:
| • | Average structural loans grew 16.4% after origination rose in the Wholesale, Retail and Microfinance segments; |
| • | Average balances of government program loans fell 38.8% after clients amortized balances; |
| • | Available funds and investments fell due to a drop in liquidity system-wide, which reflected Reactiva amortizations. |
Movements in these accounts led the yield on IEA in LC to rise. Active rates with shorter durations (Available funds and Short-term Investments) increased in line with the reference rate. Additionally, strategies for active yield management led to an increase in disbursement rates, primarily for short-term loans. Combined, these effects led the IEA yield in LC to rise from 6.9% in 3Q21 to 9.3% in 3Q22. In this context, income in LC increased 30.7% due to a positive rate effect across IEA and an increase in the volume of structural loans.
Average funding in LC fell 6.7% due to a drop in repos balances in BCRP and a decrease in low-cost deposits, which was in line with Reactiva amortizations.
The rates of the components of LC funding increased, in particular for interest-bearing deposits and bank financing, which rose in line with reference rate hikes. The cost of funding in LC rose from 1.0% in 3Q21 to 2.3% in 3Q22. The price effect led interest expenses in LC to double.
Dynamics in Foreign Currency (FC)
Net Interest Income in FC rose 33.8%, which reflected the following dynamics:
Average IEA in FC fell 1.2% after loan growth was offset by a drop in available funds and investment balances. This dynamic generated a positive rate effect in the IEA yield.
The IEA yield in FC rose from 3.1% in 3Q21 to stand at 4.1% in 3Q22 due to an increase in market rates and the aforementioned mix effect. In summary, the positive price and mix effects generated income in FC to rise 30.8%.
Average funding in FC fell 0.1%; this was driven by a drop in expensive sources of funding, which was partially offset by growth in deposits. The funding cost in FC increased 1.4% in 3Q21 to stand at 1.8% in 3Q22, in line with an uptick in FC rates. Interest expenses in FC rose 26.8%, which was mainly spurred by an increase in passive rates.
YTD Analysis
YTD, Net Interest Income rose 20.2%, driven by the same factors as those that fueled the YoY evolution.
| | | |
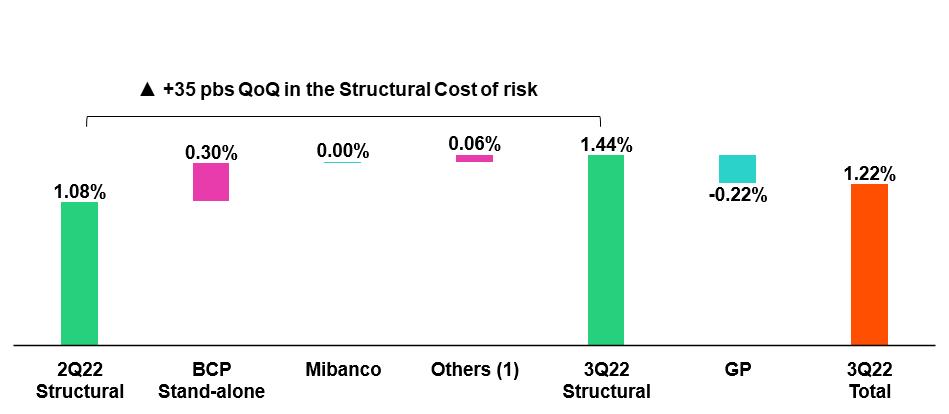
| | QoQ, the provisions expense increased due to an uptick in SME provisions which reflects efforts to penetrate higher yield and riskier segments; and a base effect that impacted the SME segment in particular. This was partially offset by methodological improvements in the risk models at Mibanco. YoY, higher provisions correspond to a base effect, given that, in 3Q21, extraordinarily low provisions were recorded after uncertainty surrounding the pandemic waned significantly. In the aforementioned context, the structural Cost of Risk (CofR) stood at 1.44% at the end of 3Q22 and 1.04% YTD. | |
| | | |
Provisions (1) and Cost of Risk (CoR) of the Structural Portfolio
| Structural Loan Portfolio Provisions | Quarter | % change | As of | % change |
| S/ 000 | 3Q21 | 2Q22 | 3Q22 | QoQ | YoY | Sep 21 | Sep 22 | Sep 22 / Sep 21 |
| Gross provision for credit losses on loan portfolio | (268,650) | (453,605) | (584,841) | 28.9% | 117.7% | (1,318,666) | (1,345,663) | 2.0% |
| Recoveries of written-off loans | 100,744 | 83,745 | 85,273 | 1.8% | -15.4% | 243,706 | 262,109 | 7.6% |
| Provision for credit losses on loan portfolio, net of recoveries | (167,906) | (369,860) | (499,568) | 35.1% | 197.5% | (1,074,960) | (1,083,554) | 0.8% |
Structural Cost of risk (1) | 0.54% | 1.09% | 1.44% | 35 bps | 90 bps | 1.14% | 1.04% | -10 bps |
(1) Annualized Provision for credit losses on loan portfolio, net of recoveries.
(2) The Structural Cost of risk excludes the Provisions for credit losses on loan portfolio, net of recoveries and Total Loans from the Reactiva Peru and FAE Government Programs.
QoQ, Structural Provisions grew mainly in BCP Individual, which led the structural CoR to rise 35bps. This evolution was propelled by the uptick in the provision expense for the SME-Pyme segment, which was driven by: (i) growth in segments with higher yields and commensurately higher risk profiles; (ii) a base effect given that during 2Q22 an extraordinarily low expense was recorded driven by methodological improvements that reflected a more favorable environment after the pandemic and (iii) write-offs that were reported for clients who also had Reactiva loans, generating higher expenses. The variation in provisions is within our risk appetite.
The aforementioned was partially attenuated by a drop in provisions expenses in the following segments:
| • | Individuals – Mortgage, due to methodological improvements in risk models. |
| • | Mibanco, driven by a methodological adjustments that will not be repeated next quarter. This resulted in a particularly low level of provisions. |
YoY, the provisions expense for structural loans increased considerably and the structural CofR rose 90bps. Growth in the provisions expenses was driven by:
Structural Cost of Risk by Subsidiary
A base effect given that in 3Q21, extraordinarily low provisions were recognized in the Consumer, SME and Wholesale segments to reflect the fact that uncertainty was dissipating.
Growth in provisions was partially offset by a decrease in expenses at:
| • | Mibanco, due to the aforementioned QoQ dynamic and to the post-covid environment. |
YTD, the provision expense remained relatively stable.
Provisions and CoR in the Government Loan Portfolio (PG)
| GP Loan Portfolio Provisions | Quarter | % change | As of | % change |
| S/ 000 | 3Q21 | 2Q22 | 3Q22 | QoQ | YoY | Sep 21 | Sep 22 | Sep 22 / Sep 21 |
| Gross provision for credit losses on loan portfolio | 3,492 | 6,569 | 39,592 | n.a | 88.1% | (10,480) | 2,697 | -125.7% |
| Recoveries of written-off loans | - | - | - | - | - | - | - | - |
| Provision for credit losses on loan portfolio, net of recoveries | 3,492 | 6,569 | 39,592 | n.a | n.a | (10,481) | 2,697 | -125.7% |
GP Cost of risk (1) | -0.07% | -0.18% | -1.29% | -111 bps | -122 bps | 0.07% | -0.03% | -10 bps |
(1) The GP Cost of risk includes the Provisions for credit losses on loan portfolio, net of recoveries and Total Loans from the Reactiva Peru and FAE Government Programs.
GP provisions fell significantly QoQ due to an uptick in honoring of State guarantees. YoY, the drop reflects growth in amortizations and positive results through honoring processes.
The provisions balance for GP loans represents 7% of Credicorp’s total provisions balance. The relatively small balance reflects the fact that GP loans are backed by guarantees that cover between 80-98% of the disbursement amount. For more information, see 1.2 Portfolio Quality– NPL portfolio for GP Loans.
Provisions and CoR of Total Portfolio
| Loan Portfolio Provisions | Quarter | % change | As of | % change |
| S/ 000 | 3Q21 | 2Q22 | 3Q22 | QoQ | YoY | Sep 21 | Sep 22 | Sep 22 / Sep 21 |
| Gross provision for credit losses on loan portfolio | (265,158) | (447,036) | (545,249) | 22.0% | 105.6% | (1,329,147) | (1,342,966) | 1.0% |
| Recoveries of written-off loans | 100,744 | 83,745 | 85,273 | 1.8% | -15.4% | 243,706 | 262,109 | 7.6% |
| Provision for credit losses on loan portfolio, net of recoveries | (164,414) | (363,291) | (459,976) | 26.6% | 179.8% | (1,085,440) | (1,080,857) | -0.4% |
Cost of risk (1) | 0.45% | 0.97% | 1.22% | 25 bps | 77 bps | 0.99% | 0.95% | -4 bps |
(1) Annualized Provision for credit losses on loan portfolio, net of recoveries / Total Loans.
The analysis of structural and GP loans shows that the CoR for the total portfolio rose 26bps QoQ and dropped -5bps YoY. The impact of GP loans, which stood at 11bps, was attributable to a denominator effect, in line with amortizations of GP loans.
QoQ Evolution of the Cost of Risk
(1) Others include BCP Bolivia, Mibanco Colombia, ASB Bank Corp and eliminations. YoY Evolution of the Cost of Risk
(1) Others include BCP Bolivia, Mibanco Colombia, ASB Bank Corp and eliminations.
| | | |
| | Other core income continues to follow an upward trend. This improvement was fueled by growth in fee income, which was driven by an uptick in transactions and improvements in FX products and channels. Other non-core income grew QoQ, mainly due to gains in the fixed income portfolio at Credicorp Capital Colombia. YoY and YTD, non-core other income decreased due to Net Losses on Securities which was driven by stock market volatility, and its consequents impacts on investments at Credicorp Individual, Prima, ASB and Pacifico. | |
| | | |
6.1 Other core income
| Core Other Income | Quarter | % Change | As of | % Change |
| (S/ 000) | 3Q21 | 2Q22 | 3Q22 | QoQ | YoY | Sep 21 | Sep 22 | Sep 22/ Sep 21 |
| Fee income | 876,391 | 920,492 | 934,244 | 1.5% | 6.6% | 2,569,573 | 2,745,767 | 6.9% |
| Net gain on foreign exchange transactions | 246,649 | 269,059 | 262,167 | -2.6% | 6.3% | 659,900 | 790,936 | 19.9% |
| Total other income Core | 1,123,040 | 1,189,551 | 1,196,411 | 0.6% | 6.5% | 3,229,473 | 3,536,703 | 9.5% |
QoQ the upward trend in core income continued, led by BCP Stand-alone, which registered growth in fee income due to an uptick in transactions through digital venues and POS. In this context, 43% of the transaction amount corresponds to transactions that do not involve cash. The aforementioned was partially offset by a drop in fees for insurance at Mibanco, which was associated with the reduction in loan disbursements. Exchange rate transactions fell alongside a reduction in capital market operations at Credicorp Capital and ASB.
YoY and YTD, fee income rose at BCP And Mibanco. This growth was driven by an uptick in transactions and in loan disbursements, which were partially offset by a drop in fees relative to mutual funds given that in 2Q21 and 3Q21, extraordinary income was reported due to inflows of third-party funds through international platforms. Gains on FX transactions continued to follow an upward trend due to growth in transaction volumes and the improvement in products and channels offered.
Fee income by banking business
Composition of fee income by banking business
| Banking Business Fees | Quarter | % Change | As of | % Change |
| S/ 000 | 3Q21 | 2Q22 | 3Q22 | QoQ | YoY | Sep 21 | Sep 22 | Sep 22 / Sep 21 |
Payments and transactionals (1) | 258,756 | 306,095 | 328,202 | 7.22% | 26.84% | 718,794 | 924,494 | 28.62% |
Liability accounts (2) | 226,051 | 234,038 | 237,873 | 1.64% | 5.23% | 967,842 | 1,061,962 | 9.72% |
Loan Disbursement (3) | 67,644 | 91,940 | 100,721 | 9.55% | 48.90% | 868,872 | 973,104 | 12.00% |
| Off-balance sheet | 65,919 | 59,304 | 60,283 | 1.65% | -8.55% | 419,644 | 463,194 | 10.38% |
| Mibanco (Peru and Colombia) | 26,046 | 35,190 | 32,258 | -8.33% | 23.85% | 252,217 | 280,681 | 11.29% |
| Insurances | 28,713 | 28,823 | 31,382 | 8.88% | 9.29% | 148,641 | 191,232 | 28.65% |
| BCP Bolivia | 30,494 | 25,470 | 26,296 | 3.24% | -13.77% | 178,383 | 169,674 | -4.88% |
| Wealth Management and Corporate Finance | 24,545 | 18,126 | 15,593 | -13.97% | -36.47% | 153,577 | 131,670 | -14.26% |
| ASB | 7,385 | 9,483 | 10,422 | 9.90% | 41.13% | 89,713 | 84,689 | -5.60% |
Others (4) | 15,131 | -1,145 | -4,922 | 329.84% | -132.53% | 65,082 | 30,714 | -52.81% |
| Total | 750,683 | 807,324 | 838,108 | 3.81% | 11.65% | 3,862,766 | 4,311,414 | 11.61% |
(1) Corresponds to fees from: credit and debit cards; payments and collections.
(2) Corresponds to fees from: Account maintenance, interbank transfers, national money orders y international transfers.
(3) Corresponds to fees from retail and wholesale loan disbursements.
(4) Use of third-party network, other services to third parties and Commissions in foreign branches.
Fee income for banking services followed an upward trajectory QoQ, YoY and YTD due to:
| • | Growth in transactions and on-going migration to digital venues and POS, which unlike cash, generate fee income. In the aforementioned context, consumption with debit cards rose 13% QoQ, 76% YoY and 69% YTD while credit card use rose 8% QoQ, 32% YoY and 38% YTD. |
| • | Growth in fees for credit disbursements, which rose QoQ due to an uptick of 34% in loans for foreign trade and YoY and YTD in personal loans, via increases of 49% and 65% respectively. |
| • | Growth in fees for passive account maintenance and interbank transfers. Interbank transfers increased 21% QoQ, 53% YoY and 58% YTD. |
The aforementioned was partially offset by a decrease in fees relative to Mutual Funds, which was in term associated with a drop in the AUM level.
6.2 Other non-core income
| Non-core Other income | Quarter | % Change | As of | % Change |
| (S/ 000) | 3Q21 | 2Q22 | 3Q22 | QoQ | YoY | Sep 21 | Sep 22 | Sep 22/ Sep 21 |
| Net gain on securities | 5,739 | (94,180) | (25,459) | n.a. | n.a. | (47,921) | (176,505) | n.a. |
Net gain from associates (1) | 19,090 | 29,219 | 25,806 | -11.7% | 35.2% | 60,797 | 79,039 | 30.0% |
| Net gain on derivatives held for trading | 43,365 | 12,304 | 53,008 | n.a. | 22.2% | 174,518 | 59,330 | -66.0% |
| Net gain from exchange differences | (4,809) | (17,066) | (4,071) | -76.1% | -15.3% | 18,868 | (38,197) | -302.4% |
| Other non-financial income | 52,258 | 84,152 | 64,890 | -22.9% | 24.2% | 189,172 | 296,944 | 57.0% |
| Total other income Non-Core | 115,643 | 14,429 | 114,174 | 691.3% | -1.3% | 395,434 | 220,611 | -44.2% |
| (1) | Includes gains on other investments, which are mainly attributable to the Banmedica result. |
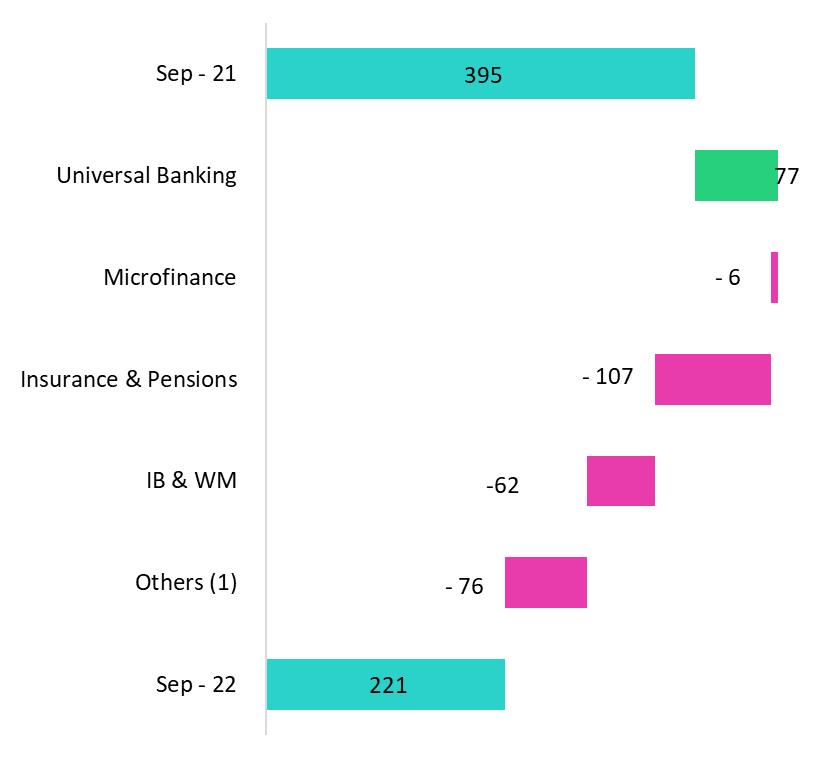
YTD evolution of non-core income
(thousands of soles)
YoY evolution of non-core income
(thousands of soles)
| (1) Others includes Grupo Credito, Credicorp Individual, eliminations and others. |
Other non-core income rose QoQ, which was primarily attributable to a decrease in net losses on securities given that Credicorp Capital Colombia reported gains on its fixed income portfolio in 3Q22. Additionally, results for speculative derivatives improved at BCP Stand-alone, Credicorp Capital and ASB, which reflected the change in valuation of these instruments from LIBOR to SOFR.
YoY and YTD, other non-core income fell due to an uptick in net losses on securities after rising market rates led to devaluation of the SOFR fixed income portfolios at different subsidiaries. YTD, losses were partially offset by extraordinary income at BCP in 1Q22, which was associated with tax refund for payments made in 2021.
07 Insurance Underwriting Results
| | | |
| | The insurance underwriting result rose 45.1% QoQ in the last quarter to reach the highest level this year. The aforementioned was driven primarily by the Life Business, which registered growth in premiums across all lines (mainly in Credit Life and Group Life products) and a decrease in claims associated with an improvement in sanitary conditions. In the YoY and YTD analysis, the insurance underwriting result rose due to a drop in claims in the Life business and growth in net earned premiums in both business lines, which reflects the impact of economic reactivation. The aforementioned was partially attenuated by increase in claims in P&C in the accumulated. | |
| | | |
Insurance underwriting result (1) | Quarter | % change | As of | % change |
| S/ 000 | 3Q21 | 2Q22 | 3Q22 | QoQ | YoY | Sep 21 | Sep 22 | Sep 22 / Sep 21 |
| Total | Net earned premiums | 675,571 | 695,547 | 751,936 | 8.1% | 11.3% | 1,959,443 | 2,138,019 | 9.1% |
| Net claims | (517,951) | (492,258) | (478,039) | -2.9% | -7.7% | (1,832,639) | (1,448,803) | -20.9% |
Acquisition cost (2) | (87,416) | (66,247) | (75,055) | 13.3% | -14.1% | (258,182) | (211,786) | -18.0% |
| Total insurance underwriting result | 70,204 | 137,042 | 198,842 | 45.1% | 183.2% | (131,378) | 477,430 | n.a. |
| Loss Ratio | 76.7% | 70.8% | 63.6% | -720 bps | -1310 bps | 93.5% | 67.8% | -2570 bps |
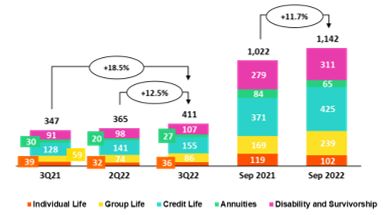
| Life | Net earned premiums | 346,986 | 365,452 | 411,042 | 12.5% | 18.5% | 1,021,969 | 1,141,986 | 11.7% |
| Net claims | (343,269) | (335,204) | (315,334) | -5.9% | -8.1% | (1,391,421) | (966,256) | -30.6% |
| Loss Ratio | 98.9% | 91.7% | 76.7% | -1500 bps | -2220 bps | 136.2% | 84.6% | -5160 bps |
| P&C | Net earned premiums | 310,653 | 313,518 | 324,127 | 3.4% | 4.3% | 886,248 | 946,536 | 6.8% |
| Net claims | (164,369) | (153,046) | (158,037) | 3.3% | -3.9% | (414,483) | (467,935) | 12.9% |
| Loss Ratio | 52.9% | 48.8% | 48.8% | 0 bps | -410 bps | 46.8% | 49.4% | 260 bps |
(1) Includes the results of the Life, Property & Casualty and Crediseguros business
(2) Includes net fees and underwriting expenses.
From a QoQ perspective, the underwriting result rose due to an 8.1% increase in net earned premiums and a drop in net claims. Both Life and P&C reported an uptick in net earned premiums, but growth was led by Life with an increase of 12.5%. In particular, (i) Credit Life, which registered higher sales of products through BCP and Banco de la Nacion and (ii) Group Life, which reported growth through its Complementary Insurance for Occupational Risk (SCTR) product. Reported claims dropped in Life this quarter as COVID-19 waned. This dynamic was partially mitigated by an increase in claims in P&C and by an uptick in the acquisition cost in both businesses, related to higher premiums.
From a YoY perspective, the insurance underwriting result improved significantly. The following factors stood out:
| • | Growth in net earned premiums in the Life (+18.5%) and P&C businesses (+4.3%) due to economic reactivation post-pandemic; |
| • | A drop in claims in the Life business (-8.1%), which reflects a decrease in COVID-19 claims in a context of advances in the vaccination level. P & C also reported a decrease in claims, to the order of 3.9%; |
| • | A 14.1% decrease in the acquisition cost, which reflected a decrease in commissions after a contract in the alliance channel expired at the end of 2021. |
YTD, the underwriting result entered positive terrain. This evolution was primarily driven by the Life business and was associated with a drop in excess mortality for COVID-19. Growth in the level of net earned premiums, which reflected economic reactivation, also bolstered the result this quarter.
07. Insurance Underwriting Results |
Net Earned Premiums by Business
Net Earned Premiums in the Life Business(1)(S/ millions) Net Earned Premiums in P&C Business(1)
(S/ millions)
In the QoQ analysis, net earned premiums in the Life business rose across products. Growth was noteworthy in (i) Credit Life, which was attributable to an uptick in sales through BCP due to higher consumer credit and Banco de la Nacion; (ii) Group Life, which was primarily attributable to Complementary Insurance for Occupational Risk (SCTR) due to a seasonal effect generated by statutory bonuses and (iii) D&S associated with higher revenue collection in SISCO V⁽2⁾.
In the P&C business, net earned premiums rose 3.4%, driven primarily by (i) Personal Lines, which reflects an upswing in Home Mortgage and Card Protection products and (ii) Cars through bancassurance and brokers channels.
In the YoY and YTD analysis, net earned premiums in the Life business rose 18.5% and 11.7% respectively, particularly in (i) Credit Life, due to growth in the Bancassurance channel given higher consumer credit, (ii) Group Life, in line with price adjustments and growth in new sales of Complementary Insurance for Occupational Risk products and (iii) D&S, given that the insured base broadened in a context of recovery of business activities. Net earned premiums for P&C increased 4.3% YoY and 6.8% YTD, driven by: (i) Medical Assistance, due to an uptick in sales of Oncological Compensation products and (ii) Personal Lines, due to growth in sales of Home Mortgage and Card protection products in the Bancassurance channel.
Net Claims by Business
The Net Loss Ratio stood at 63.6%, (-720bps QoQ). The drop in claims in the Life business was particularly noteworthy (-1500bps QoQ) and was driven by a drop in claims for (i) D & S, due to a decrease in regular cases and reported COVID-19 cases and (ii) Individual Life, due to a release of IBNR reserves and to a lesser extent to group life insurance products. The Net Loss Ratio for the P&C business remained stable QoQ. It is important to note the 3.3% increase in claims; this evolution was attributable to Medical Assistance which reflected an increase in visits to clinics by insured parties and regularization of lags in claims reporting. Additionally, Cars and SOAT reported an increase in case frequency.
In the YoY and YTD analysis, the Net Loss Ratio improved after net claims in the Life business fell 7.7% and 20.9% respectively. This dynamic was driven by a decline in COVID cases due to an improvement in the sanitary situation.
1 Total premiums less premiums ceded to reinsurance and adjustments in constitution of technical reserves.
2 Public bidding process as a result of which the insurance companies that will collectively manage the risks of disability, survival and burial of AFP members for the period 2021-2022 are selected.
07. Insurance Underwriting Results |
Acquisition cost
| Acquisition cost | Quarter | % change | As of | % change |
| S/ 000 | 3Q21 | 2Q22 | 3Q22 | QoQ | YoY | Sep 21 | Sep22 | Sep 22 / Sep 21 |
| Net fees | (51,617) | (39,352) | (43,738) | 11.1% | -15.3% | (161,030) | (122,965) | -23.6% |
| Underwriting expenses | (33,542) | (27,943) | (32,619) | 16.7% | -2.8% | (96,942) | (91,848) | -5.3% |
| Underwriting income | (2,257) | 1,047 | 1,302 | 24.4% | n.a. | (210) | 3,027 | n.a. |
| Acquisition cost | (87,416) | (66,248) | (75,055) | 13.3% | -14.1% | (258,182) | (211,786) | -18.0% |
The acquisition cost increased 13.3% QoQ, which reflects an upswing in underwriting results in the P & C business and an increase in commissions in the Life business. In the Life Business, growth in the acquisition cost is attributable to an increase in commissions through Credit Life and Complementary Insurance for Occupational Risk (SCTR), which was associated with growth in registered premiums. In the P & C line, the increase in the acquisition cost was attributable to higher underwriting expenses in Cars, Commercial Line and Medical Assistance, after more provisions were set aside for uncollectible premiums, and to Personal Lines.
In the YoY and YTD analysis, the acquisition cost fell 14.1% and 18.0% respectively. This evolution was primarily attributable to a decrease in commissions in the Life business after a contract in the alliance channel expired at the end of 2021 and underwriting expenses fell in the P&C business.
08 Operating Expenses
| | | |
| | Operating expenses rose, driven mainly by an increase variable compensation, which was attributable to an uptick in loan disbursements and better resuts this quarter. Growth in administrative expenses was associated with IT developments and higher expenses for fidelity programs, which rose alongsidegrowth in transactions. Finally, expenses for disruptive initiatives continue to rise. | |
| | | |
| Operating expenses | Quarter | % change | As of | % change |
| S/ 000 | 3Q21 | 2Q22 | 3Q22 | QoQ | YoY | Sep 21 | Sep 22 | Sep 22 / Sep 21 |
| Salaries and employees benefits | 915,564 | 975,420 | 1,021,946 | 4.8% | 11.6% | 2,655,300 | 2,975,319 | 12.1% |
| Administrative, general and tax expenses | 802,547 | 850,560 | 870,852 | 2.4% | 8.5% | 2,055,040 | 2,446,326 | 19.0% |
| Depreciation and amortization | 170,960 | 168,845 | 173,500 | 2.8% | 1.5% | 501,594 | 506,859 | 1.0% |
| Association in participation | 10,426 | 10,329 | 9,999 | -3.2% | -4.1% | 33,211 | 28,019 | -15.6% |
Acquisition cost (1) | 87,416 | 66,247 | 75,055 | 13.3% | -14.1% | 258,182 | 211,786 | -18.0% |
| Operating expenses | 1,986,913 | 2,071,401 | 2,151,352 | 3.9% | 8.3% | 5,503,327 | 6,168,309 | 12.1% |
| (1) | The acquisition cost of Pacifico includes net fees and underwriting expenses. |
For the expenses analysis, YoY and YTD movements will be taken into account in order to eliminate seasonal effects between quarters.
Operating expenses continue to rise due to:
| • | Growth in Administrative and general expenses and taxes, which was attributable to growth in IT expenses related to the digital transformation strategy, and to an increase in transactional expenses in a context marked by economic reactivation and an uptick in consumption; and |
| • | Increase in Salaries and Employee benefits, after more provisions were set aside for earnings this quarter. Variable compensation rose after commercial targets for the quarter were exceeded. |
Administrative and general expenses and taxes
| Administrative and general expenses | Quarter | % Change | As of | % change |
| S/ 000 | 3Q21 | 2Q22 | 3Q22 | QoQ | YoY | Sep 21 | Sep 22 | Sep 22 / Sep 21 |
| IT expenses and IT third-party services | 196,970 | 236,252 | 229,025 | -3.1% | 16.3% | 497,800 | 666,034 | 33.8% |
| Advertising and customer loyalty programs | 123,603 | 156,285 | 173,728 | 11.2% | 40.6% | 300,989 | 440,510 | 46.4% |
| Taxes and contributions | 80,626 | 78,510 | 51,963 | -33.8% | -35.6% | 226,840 | 204,536 | -9.8% |
| Audit Services, Consulting and professional fees | 114,073 | 70,654 | 74,790 | 5.9% | -34.4% | 216,268 | 197,962 | -8.5% |
| Transport and communications | 54,312 | 49,771 | 74,435 | 49.6% | 37.1% | 142,035 | 164,370 | 15.7% |
| Repair and maintenance | 30,125 | 40,832 | 30,563 | -25.1% | 1.5% | 88,170 | 101,334 | 14.9% |
| Agents' Fees | 26,486 | 26,091 | 25,574 | -2.0% | -3.4% | 76,740 | 78,683 | 2.5% |
| Services by third-party | 26,094 | 33,791 | 29,799 | -11.8% | 14.2% | 69,797 | 82,001 | 17.5% |
| Leases of low value and short-term | 23,517 | 22,610 | 24,171 | 6.9% | 2.8% | 64,564 | 67,712 | 4.9% |
| Miscellaneous supplies | 13,068 | 20,657 | 25,266 | 22.3% | 93.3% | 42,058 | 65,000 | 54.5% |
| Security and protection | 15,468 | 15,798 | 16,841 | 6.6% | 8.9% | 47,119 | 48,115 | 2.1% |
| Subscriptions and quotes | 13,363 | 15,968 | 14,013 | -12.2% | 4.9% | 40,448 | 43,418 | 7.3% |
| Electricity and water | 11,102 | 13,567 | 11,867 | -12.5% | 6.9% | 34,502 | 36,111 | 4.7% |
| Electronic processing | 10,863 | 8,208 | 7,770 | -5.3% | -28.5% | 31,954 | 23,671 | -25.9% |
| Insurance | 36,968 | 4,888 | 40,561 | 729.8% | 9.7% | 48,798 | 54,365 | 11.4% |
| Cleaning | 4,630 | 5,203 | 5,358 | 3.0% | 15.7% | 15,118 | 15,067 | -0.3% |
Others (1) | 21,888 | 50,850 | 35,128 | -30.9% | 60.5% | 111,840 | 157,437 | 40.8% |
| Total | 803,156 | 849,935 | 870,852 | 2.5% | 8.4% | 2,055,040 | 2,446,326 | 19.0% |
(1) Others consists mainly of security and protection services, cleaning service, representation expenses, electricity and water utilities, insurance policy expenses, subscription expenses and commission expenses.
Administrative and general expenses and taxes rose due to:
| • | Growth in IT expenses and systems outsourcing, which was related to cybersecurity, infrastructure upgrades, development of new applications, renewal and improvement of software; and |
| • | A 62% increase in Advertising expenses, which was primarily associated with disruptive initiatives. If we exclude disruptive expenses, expenses for advertising register a 15% increase. |
| • | The 38% increase in expenses for the Loyalty Program. This was related to an increase of consumption of LATAM miles, which reflected growth in consumption with credit and debit cards at establishments (related fees up 44%). |
| | | |
| | The efficiency ratio improved 180bps QoQ, 330bps YoY and 80pbs YTD, driven by uptick in core income. If we exclude expenses related to disruptive initiatives (Yape + Krealo), the efficiency ratio improves 200bps YTD. Finally, it is important to note that due to seasonal factors, expenses tend to be higher in the last quarter of the year. | |
| | | |
| Operating Efficiency | Quarter | % change | Year | % change |
| S/ 000 | 3Q21 | 2Q22 | 3Q22 | QoQ | YoY | Sep 21 | Sep 22 | Sep 22 / Sep 21 |
| Operating expenses (1) | 1,986,913 | 2,071,401 | 2,151,352 | 3.9% | 8.3% | 5,503,327 | 6,168,309 | 12.1% |
| Operating income (2) | 4,307,356 | 4,649,583 | 5,024,516 | 8.1% | 16.6% | 12,325,469 | 14,049,813 | 14.0% |
| Efficiency ratio (3) | 46.1% | 44.6% | 42.8% | -180 bps | -330 bps | 44.7% | 43.9% | -80 bps |
| (1) | Operating expenses = Salaries and employee’s benefits + Administrative expenses + Depreciation and amortization + Association in participation + Acquisition cost. |
| (2) | Operating income = Net interest, similar income and expenses + Fee income + Net gain on foreign exchange transactions + Net gain from associates + Net gain on derivatives held for trading + Net gain from exchange differences + Net premiums earned |
| (3) | Operating expenses / Operating income. |
Efficiency ratio reported by subsidiary
| | BCP Stand-alone | BCP Bolivia | Mibanco Peru | Mibanco Colombia | Pacifico | Prima AFP | Credicorp |
| 3Q21 | 45.3% | 53.0% | 49.7% | 86.3% | 32.3% | 51.1% | 46.1% |
| 2Q22 | 41.5% | 58.0% | 50.4% | 75.4% | 34.6% | 52.6% | 44.6% |
| 3Q22 | 38.8% | 61.3% | 49.6% | 80.6% | 33.8% | 50.2% | 42.8% |
| Var. QoQ | -270 bps | 330 bps | -80 bps | 520 bps | -80 bps | -240 bps | -180 bps |
| Var. YoY | -650 bps | 830 bps | -10 bps | -570 bps | 150 bps | -90 bps | -330 bps |
| | | | | | | | |
| Sep 21 | 42.0% | 56.9% | 55.4% | 79.9% | 35.4% | 47.5% | 44.6% |
| Sep 22 | 40.3% | 59.7% | 50.9% | 78.3% | 34.8% | 52.4% | 43.9% |
% change Sep 22 / Sep 21 | -170 bps | 280 bps | -450 bps | -160 bps | -60 bps | 490 bps | -70 bps |
QoQ, YoY and YTD, the efficiency ratio improved, which was primarily driven by an uptick in core income at BCP Stand-alone and Mibanco. Within core income, growth was led by net interest income, which reflects the increase in market rates and an increase in the loan volume.
If we exclude expenses related to internal disruptive initiatives (Yape) and our Corporate Venture Capital Center (Krealo) in both 2022 and 2021, Credicorp’s efficiency ratio improves 200bps YTD.
| | | |
| | Credicorp’s Regulatory Capital Ratio was 1.45 times higher than level required by the regulator. The CET1 ratio at BCP Stand-alone increased 63bps YoY to stand at 11.8%. Growth in RWAs (+6.4%) was offset by growth in capital and reserves (+9.5%) and an uptick in YTD results (+62.3%) Mibanco’s CET1 ratio rose 75bps to stand at 16.0%. Growth in RWAs (+17.6%) was more than offset by the improvement in YTD results. | |
| | | |
10.1 Credicorp Regulatory Capital
Credicorp’s regulatory capital ratio was 1.45 times higher than the required capital level at the end of 3Q22. In the QoQ analysis, the ratio fell 11bps due to an 8.5% increase in capital requirements to cover portfolio growth at BCP Stand-alone and Mibanco. This was partially offset by growth in regulatory capital of 0.6% driven by (i) an increase in subordinated debt (associated with an exchange rate effect) and (ii) growth in provisions that can be considered regulatory capital.
In the YoY analysis, the Regulatory Capital Ratio fell 8bps.
10.2 Regulatory Capital at BCP Stand-alone

Cifras en millones S/.
At the end of 3Q22, the Tier 1 ratio and Regulatory Global Ratio at BCP Stand-alone were situated at 9.9% (-31bps QoQ) and 14.9% (-30bps QoQ) respectively. These reductions were primarily driven by the impact of an increase in loans within risk-weighted assets (RWAs). In the case of the Regulatory Global Ratio, the aforementioned dynamic was partially offset by growth in the Subordinated Debt balance, which was fueled by exchange rate movements. In the YoY analysis, these ratios fell 6bps and 23bps respectively.
Ratio Common Equity Tier 1 IFRS – Stand-alone
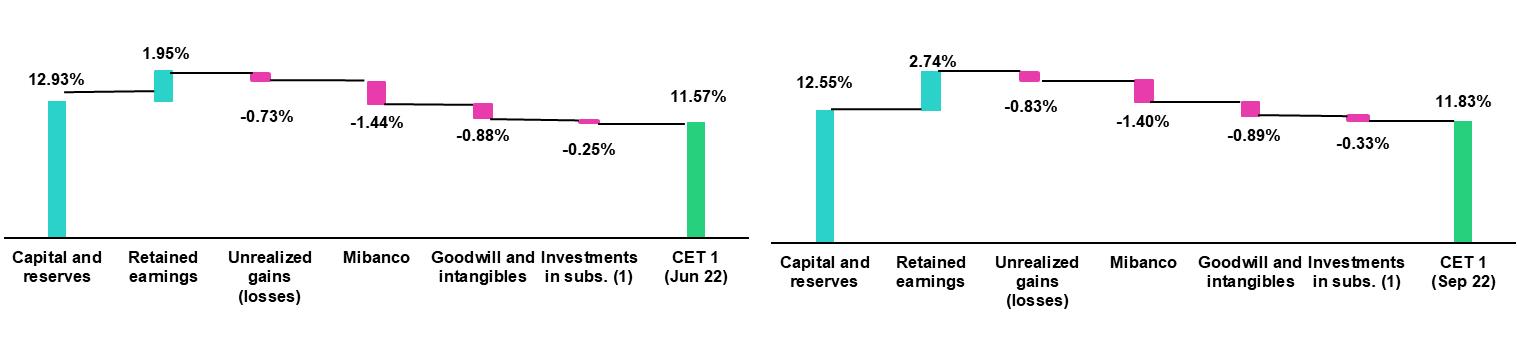
The Common Equity Tier 1 (CET 1) ratio at BCP, which is calculated according to IFRS, registered an uptick of 26bps QoQ to close 3Q22 at 11.83%. This evolution was driven by growth in the balance for Accumulated Results (+66.5%), which was partially offset by an increase in RWAs (+3.0%). Finally, in the YoY analysis, the CET1 ratio increased 63bps. This growth was driven by an increase in Capital and Reserves (+9.5%) and Retained Earnings (+62.3%), which outstripped the 6.4% increase in RWAs.
10.3 Mibanco’s Regulatory Capital
At the end of 3Q22, the Tier 1 and Global Capital ratios at Mibanco stood at 12.4% (-19bps QoQ) and 14.6% (-22bps QoQ) respectively. These variations reflect slight growth of 1.6% in Risk Weighted Assets (RWAs), which was in turn driven by loan expansion.
The YoY evolution shows a drop of 189bps and 213bps in the Tier 1 ratio and Regulatory Global Ratio respectively. Both variations were fueled by the 18.3% increase in RWAs, which was in turn driven by loan growth.
Finally, the CET1 Ratio, calculated according to IFRS, reported growth of 75bps QoQ and 90bps YoY. The increase in RWAs (+1.1% QoQ; +17.6 YoY), which was mainly attributable to an uptick in RWAs for credit risk, was more than offset by the growth registered for Common Equity Tier 1 (+6.1%; +24.6% YoY).
| | | |
| | Estimates indicate that the Peruvian economy grew 1.7% YoY in 3Q22, driven primarily by sectors such commerce, services, and construction. Growth this quarter was offset by 1.2% drop-in primary activities, which was attributable to the deterioration of metal mining production.
The annual Inflation rate for 3Q22 closed at 8.5% YoY, after having reached a peak of 8.8% in 2Q22. It is important to mention, that BCRP has increased the reference rate to reduce inflation by the end of 2023.
According to BCRP, the Exchange rate closed at USPEN 3.982 in 3Q22, which represents a depreciation of 4.1% from the 3.826 registered in 2Q22. | |
| | | |
Peru: Economic Forecast
| Peru | 2018 | 2019 | 2020 | 2021 | 2022 (3) |
|
| GDP (US$ Millions) | 226,856 | 232,447 | 205,553 | 225,661 | 252,599 |
| Real GDP (% change) | 4.0 | 2.2 | -11.0 | 13.6 | 2.8 |
| GDP per capita (US$) | 7,045 | 7,152 | 6,300 | 6,831 | 7,571 |
| Domestic demand (% change) | 4.2 | 2.3 | -9.8 | 14.7 | 2.4 |
| Gross fixed investment (as % GDP) | 22.4 | 21.8 | 19.7 | 22.0 | 20.6 |
| Public Debt (as % GDP) | 25.6 | 26.6 | 34.6 | 35.9 | 34.3 |
| System loan growth (% change)(1) | 10.3 | 6.4 | -4.3 | 12.6 | 11.0 |
| Inflation(2) | 2.2 | 1.9 | 2.0 | 6.4 | 7.9 |
| Reference Rate | 2.75 | 2.25 | 0.25 | 2.50 | 7.25 |
| Exchange rate, end of period | 3.37 | 3.31 | 3.62 | 3.99 | 3.85 |
| Exchange rate, (% change) | 4.0% | -1.8% | 9.3% | 10.3% | -3.5% |
| Fiscal balance (% GDP) | -2.3 | -1.6 | -8.9 | -2.5 | -2.0 |
| Trade balance (US$ Millions) | 7,201 | 6,879 | 8,196 | 14,833 | 10,500 |
| (As % GDP) | 3.2% | 3.0% | 4.0% | 6.6% | 4.2% |
| Exports | 49,066 | 47,980 | 42,905 | 63,151 | 66,900 |
| Imports | 41,866 | 41,101 | 34,709 | 48,317 | 56,400 |
| Current account balance (As % GDP) | -1.3% | -0.7% | 1.2% | -2.3% | -4.6% |
| Net international reserves (US$ Millions) | 60,121 | 68,316 | 74,707 | 78,495 | 74,000 |
| (As % GDP) | 26.5% | 29.4% | 36.3% | 34.8% | 29.3% |
| (As months of imports) | 17 | 20 | 26 | 19 | 16 |
Sources: INEI, BCRP, y SBS.
(1) Financial System, Current Exchange Rate
(2) Inflation target: 1% - 3%
(3) Estimates by BCP Economic Research as of October 2022
Main Macroeconomic Variables
Gross Domestic Product
(Annual Variations, % YoY)
Sources: BCRP
*Estimate: BCP
In 3Q22, the Peruvian economy is expected to have grown 1.7% YoY (2Q22 3.3% YoY, 1Q22 3.8% YoY). Non-primary sectors are projected to have grown around 2.5% YoY, driven by the evolution of the commerce, services and construction sectors. Primary activities are expected to fall -1.2 YoY due the deterioration in July-August 2022, which was driven by a 5.2% YoY decline in metal mining production. According to INEI, the monthly index of national production grew 1.7% YoY in August which led the economy to grow 1.5% YoY in the July-August 2022.
Annual Inflation and Central Bank Reference Rate
(%)
The 3Q22 annual inflation rate in Metropolitan Lima closed at 8.5% YoY, after standing at 8.8% in 2Q22 the highest print since July 1997 and well above the upper limit of the BCRP's target range (1%-3%). At the end of 3Q22, core inflation (excluding food and energy) stood at 5.5% YoY (maximum in almost 22 years).
The Central Reserve Bank (BCRP) began responding to the increase in inflation and price expectations by raising its reference rate from 0.25% in August 2021 to 6.75% in September 2022. The monetary authority seeks to return inflation expectations to their target range (1% to 3%), and as of September inflation expectations for the end of 2023 and 2024 are 4% and 3% respectively. On October 6th, BCRP raised its rate to a historical high of 7.0%. The next policy meeting is on November 10th.
Fiscal Balance and Current Account Balance
(% of GDP, Quarter)
Source: BCRP*
Estimate: BCP
The annualized fiscal deficit for 3Q22 was -1.1% of GDP, compared to -4.7% of GDP in 3Q21. In September, the current income of the general government increased 13.6% YoY. The non-financial expenses of the general government fell 9.2% YoY with current spending falling 17.3%. This decline was attributable to an increase in direct transfers in September 2021 for “Bono Yanapay”. Over the same period, capital spending (gross capital formation and other capital spending) grew 19.4%.
On October 20, Fitch Ratings lowered the outlook for Peru's long-term debt in foreign currency to negative from stable, with BBB. S&P rates at BBB with a stable outlook. Moody's rates at Baa1 with a stable outlook.
In external accounts, the current account deficit closed 2Q22 at -4.6% of GDP, and in accumulated terms for the last 4 quarters, it stood at -3.6% of GDP.
The 12-month accumulated trade surplus to August 2022, after hitting a historical high in March 2022 of USD 16.3 billion, stood at USD 13.5 billion, which represents a decrease of USD 2.2 billion compared to the 12-month accumulated to June 2022 of USD 15.7 billion. As of August 2022, in 12-month accumulated terms, exports totaled USD 68.0 billion, marginally below June 2022 USD 68.3 billion, which constituted a historical record. Imports also reached a historical record annualized to August of USD 54.6 billion.
In August 2022, the terms of trade registered a decrease of 10.0% YoY compared to August of 2021. Import prices rose 12.3% due to higher prices for oil and derivatives as well as food and industrial inputs, while export prices rose less (1.1% YoY). Despite the decline in the latter, the terms of trade index was 8.1% higher than the level in August 2019.
Exchange Rate
(PEN per USD)
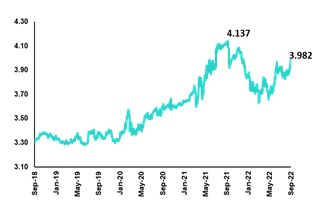
Source: BCRP
According to the Central Bank. the exchange rate closed at USDPEN 3.9820 in 3Q22 (3.826 in 2Q22; 3.676 in 1Q22; and 3.99 in 4Q21), depreciating 4.1% compared to the end of 2Q22. It is important to note that the region's currencies depreciated in 3Q22 versus 2Q22: the Colombian Peso 11.0%, the Chilean Peso 5.5%, the Brazilian Real 3.0%, the Mexican Peso 0.1%. It should be noted that as of October 21st, 2022, the USDPEN stood at 3.9880.
Net International Reserves closed 3Q22 at USD 74.2 billion, improving from the USD 73.3 billion in 2Q22, but below the figure at the end of 2021 (USD78.5 billion). The Central Bank’s foreign exchange position stood at USD 52.4 billion, a marginal drop of USD 0.2 billion compared to the end of 2Q22.
In 3Q22, the BCRP made net sales in the spot foreign exchange market for USD 214 million, below the USD 641 million reported in 2Q22. Sales were concentrated in July with USD 114 million, and in September with USD 100 million.
Safe Harbor for Forward-Looking Statements |
This material includes “forward-looking statements” within the meaning of Section 27A of the U.S. Securities Act of 1933 and Section 21E of the U.S. Securities Exchange Act of 1934. All statements other than statements of historical fact are forward-looking and may contain information about financial results, economic conditions, trends and known uncertainties. Forward-looking statements are not assurances of future performance. Instead, they are based only on our management’s current views, beliefs, expectations and assumptions regarding the future of our business, future plans and strategies, projections, anticipated events and trends, the economy and other future conditions.
Many forward-looking statements can be identified by words such as: “anticipate”, “intend”, “plan”, “goal”, “seek”, “believe”, “project”, “estimate”, “expect”, “strategy”, “future”, “likely”, “would”, “may”, “should”, “will”, “see” and similar references to future periods. Examples of forward-looking statements include, among others, statements or estimates we make regarding guidance relating to losses in our credit portfolio, efficiency ratio, provisions and non-performing loans, current or future market risk and future market conditions, expected macroeconomic events and conditions, our belief that we have sufficient capital and liquidity to fund our business operations, expectations of the effect on our financial condition of claims, legal actions, environmental costs, contingent liabilities and governmental and regulatory investigations and proceedings, strategy for customer retention, growth, governmental programs and regulatory initiatives, credit administration, product development, market position, financial results and reserves and strategy for risk management.
We caution readers that forward-looking statements involve known and unknown risks and uncertainties that could cause actual results, performance or events to differ materially from those that we expect or that are expressed or implied in the forward-looking statements, depending on the outcome of certain factors, including, without limitation, adverse changes in:
• The occurrence of natural disasters or political or social instability in Peru;
• The adequacy of the dividends that our subsidiaries are able to pay to us, which may affect our ability to pay dividends to shareholders and corporate expenses;
• Performance of, and volatility in, financial markets, including Latin-American and other markets;
• The frequency, severity and types of insured loss events;
• Fluctuations in interest rate levels;
• Foreign currency exchange rates, including the Sol/US Dollar exchange rate;
• Deterioration in the quality of our loan portfolio;
• Increasing levels of competition in Peru and other markets in which we operate;
• Developments and changes in laws and regulations affecting the financial sector and adoption of new international guidelines;
• Changes in the policies of central banks and/or foreign governments;
• Effectiveness of our risk management policies and of our operational and security systems;
• Losses associated with counterparty exposures;
• The scope of the coronavirus (“COVID-19”) outbreak, actions taken to contain the COVID-19 and related economic effects from such actions and our ability to maintain adequate staffing; and
• Changes in Bermuda laws and regulations applicable to so-called non-resident entities.
See “Item 3. Key Information—3.D Risk Factors” and “Item 5. Operating and Financial Review and Prospects” in our most recent Annual Report on Form 20-F filed with the U.S. Securities and Exchange Commission for additional information and other such factors.
You are cautioned not to place undue reliance on these forward-looking statements, which speak only as of the date hereof and are based only on information currently available to us. Therefore, you should not rely on any of these forward-looking statements. We undertake no obligation to publicly update or revise these or any other forward-looking statements that may be made to reflect events or circumstances after the date hereof, whether as a result of changes in our business strategy or new information, to reflect the occurrence of unanticipated events or otherwise.
| 12.1. Physical Channels | 45 |
| 12.2. Loan Portfolio Quality | 45 |
| 12.3 Net Interest Income (INI) | 50 |
| 12.4. Regulatory Capital | 51 |
| 12.5. Financial Statements and Ratios by Business | 54 |
| 12.5.1. Credicorp Consolidated | 54 |
| 12.5.2. Credicorp Stand-alone | 56 |
| 12.5.3. BCP Consolidated | 57 |
| 12.5.4. BCP Stand-alone | 60 |
| 12.5.5. BCP Bolivia | 62 |
| 12.5.6. Mibanco | 63 |
| 12.5.7. Prima AFP | 64 |
| 12.5.8. Grupo Pacifico | 65 |
| 12.5.9. Investment Banking & Wealth Management | 67 |
| 12.6. Table of calculations | 68 |
| 12.7. Glossary of terms | 69 |
12.1. Physical Point of contact
Physical Point of Contact (Units) | As of | change (units) |
| Sep 21 | Jun 22 | Sep 22 | QoQ | YoY |
| Branches | 721 | 691 | 681 | -10 | -40 |
| ATMs | 2,554 | 2,540 | 2,598 | 58 | 44 |
| Agentes | 7,896 | 9,863 | 10,525 | 662 | 2,629 |
| Total | 11,171 | 13,094 | 13,804 | 710 | 2,633 |
12.2. Loan Portfolio Quality
Loan Portfolio Quality (in Quarter-end Balances)
Government Program (GP) Loan Portfolio Quality (in Quarter-end Balances)
GP Portfolio quality and Delinquency ratios (1) | As of | % change |
| S/000 |
| | Sep 21 | Jun 22 | Sep 22 | QoQ | YoY |
| GP Total loans (Quarter-end balance) | 21,022,603 | 14,647,803 | 12,300,175 | -16.0% | -41.5% |
| GP Allowance for loan losses | 142,519 | 194,144 | 274,672 | 41.5% | 92.7% |
| GP IOLs | 726,132 | 941,731 | 1,212,968 | 28.8% | 0.67 |
| GP IOL ratio | 3.45% | 6.43% | 9.86% | 343 bps | 641 bps |
| GP Allowance for loan losses over GP Total loans | 0.7% | 1.3% | 2.2% | 90 bps | 155 bps |
| GP Coverage ratio of IOLs | 19.6% | 20.6% | 22.6% | 202 bps | 301 bps |
(1) Government Programs (GP) include Reactiva Peru and FAE-Mype.
Portfolio Quality Ratios by Segment
Wholesale Banking
SME-Business
Mortgage
Credit Card
BCP Bolivia
12.3 Net Interest Income (NII)
NII Summary
| Net interest income | Quarter | % change | As of | % change |
| S/ 000 | 3Q21 | 2Q22 | 3Q22 | QoQ | YoY | Sep 21 | Sep 22 | Sep 22 / Sep 21 |
| Interest income | 3,051,000 | 3,488,113 | 3,988,681 | 14.4% | 30.7% | 8,758,652 | 10,649,140 | 21.6% |
| Interest on loans | 2,607,349 | 2,929,782 | 3,288,864 | 12.3% | 26.1% | 7,516,297 | 8,904,198 | 18.5% |
| Dividends on investments | 19,668 | 13,682 | 7,498 | -45.2% | -61.9% | 34,425 | 25,500 | -25.9% |
| Interest on deposits with banks | 12,185 | 47,784 | 139,077 | 191.1% | N/A | 26,157 | 222,212 | N/A |
| Interest on securities | 385,874 | 482,872 | 543,325 | 12.5% | 40.8% | 1,130,978 | 1,454,653 | 28.6% |
| Other interest income | 25,924 | 13,993 | 9,917 | -29.1% | -61.7% | 50,795 | 42,577 | -16.2% |
| Interest expense | 599,901 | 748,085 | 987,255 | 32.0% | 64.6% | 1,876,282 | 2,374,221 | 26.5% |
| Interest on deposits | 209,564 | 336,953 | 510,116 | 51.4% | 143.4% | 642,482 | 1,106,008 | 72.1% |
| Interest on borrowed funds | 110,308 | 141,531 | 185,891 | 31.3% | 68.5% | 323,801 | 443,653 | 37.0% |
| Interest on bonds and subordinated notes | 189,055 | 176,941 | 188,502 | 6.5% | -0.3% | 652,181 | 539,235 | -17.3% |
| Other interest expense | 90,974 | 92,660 | 102,746 | 10.9% | 12.9% | 257,818 | 285,325 | 10.7% |
| Net interest income | 2,451,099 | 2,740,028 | 3,001,426 | 9.5% | 22.5% | 6,882,370 | 8,274,919 | 20.2% |
| Risk-adjusted Net interest income | 2,286,685 | 2,376,737 | 2,541,450 | 6.9% | 11.1% | 5,796,929 | 7,194,062 | 24.1% |
| Average interest earning assets | 231,912,064 | 223,529,737 | 226,137,887 | 1.2% | -2.5% | 229,486,667 | 230,803,439 | 0.6% |
Net interest margin (1) | 4.23% | 4.90% | 5.31% | 41bps | 108bps | 4.00% | 4.78% | 78bps |
Risk-adjusted Net interest margin (1) | 3.94% | 4.25% | 4.50% | 25bps | 56bps | 3.37% | 4.16% | 79bps |
| Net provisions for loan losses / Net interest income | 6.71% | 13.26% | 15.33% | 2.1% | 8.6% | 15.77% | 13.06% | -2.71% |
(1) Annualized.
Net Interest Margin (NIM) and Risk Adjusted NIM by subsidiary
| NIM Breakdown | BCP Stand-alone | Mibanco | BCP Bolivia | Credicorp |
| 3Q21 | 3.57% | 12.59% | 3.23% | 4.23% |
| 2Q22 | 4.29% | 12.95% | 2.88% | 4.90% |
| 3Q22 | 4.83% | 12.99% | 2.81% | 5.31% |
NIM: Annualized Net interest income / Average period end and period beginning interest earning assets.
| Risk Adjusted NIM Breakdown | BCP Stand-alone | Mibanco | BCP Bolivia | Credicorp |
| 3Q21 | 3.49% | 9.46% | 2.47% | 3.94% |
| 2Q22 | 3.79% | 10.41% | 1.77% | 4.25% |
| 3Q22 | 4.00% | 10.99% | 2.50% | 4.50% |
Risk-Adjusted NIM: (Annualized Net interest income - annualized provisions) / Average period end and period beginning interest earning assets.
12.4. Regulatory Capital
Regulatory Capital and Capital Adequary Ratios
(S/ thousands, IFRS)
| | As of | % Change |
| | Sep 21 | Jun 22 | Sep 22 | QoQ | YoY |
| Capital Stock | 1,318,993 | 1,318,993 | 1,318,993 | 0.0% | 0.0% |
| Treasury Stocks | (207,745) | (207,518) | (207,518) | 0.0% | -0.1% |
| Capital Surplus | 215,071 | 231,179 | 225,832 | -2.3% | 5.0% |
Legal and Other capital reserves (1) | 21,350,150 | 23,666,823 | 23,687,946 | 0.1% | 10.9% |
Minority interest (2) | 423,897 | 490,576 | 488,486 | -0.4% | 15.2% |
Loan loss reserves (3) | 1,993,306 | 2,074,630 | 2,139,971 | 3.1% | 7.4% |
| Perpetual subordinated debt | - | - | - | - | - |
| Subordinated Debt | 6,393,706 | 5,863,208 | 6,015,765 | 2.6% | -5.9% |
| Investments in equity and subordinated debt of financial and insurance companies | (727,585) | (829,315) | (868,747) | 4.8% | 19.4% |
| Goodwill | (826,196) | (802,622) | (788,179) | -1.8% | -4.6% |
| Current year Net Loss | - | - | - | - | - |
Deduction for subordinated debt limit (50% of Tier I excluding deductions) (4) | - | - | - | - | - |
Deduction for Tier I Limit (50% of Regulatory capital) (4) | - | - | - | - | - |
| Regulatory Capital (A) | 29,933,596 | 31,805,954 | 32,012,549 | 0.6% | 6.9% |
| | | | | | |
Tier 1 (5) | 15,305,134 | 16,973,919 | 16,961,210 | -0.1% | 10.8% |
Tier 2 (6) + Tier 3 (7) | 14,628,462 | 14,832,035 | 15,051,339 | 1.5% | 2.9% |
| | | | | | |
Financial Consolidated Group (FCG) Regulatory Capital Requirements (8) | 18,710,799 | 19,270,916 | 20,973,716 | 8.8% | 12.1% |
Insurance Consolidated Group (ICG) Capital Requirements (9) | 1,418,922 | 1,512,297 | 1,558,334 | 3.0% | 9.8% |
| FCG Capital Requirements related to operations with ICG | (503,809) | (449,113) | (465,143) | 3.6% | -7.7% |
| ICG Capital Requirements related to operations with FCG | - | - | - | - | - |
| Regulatory Capital Requirements (B) | 19,625,912 | 20,334,099 | 22,066,907 | 8.5% | 12.4% |
| Regulatory Capital Ratio (A) / (B) | 1.53 | 1.56 | 1.45 | | |
Required Regulatory Capital Ratio (10) | 1.00 | 1.00 | 1.00 | | |
(1) Legal and other capital reserves include restricted capital reserves (PEN 14,745 million) and optional capital reserves (PEN 6,661 million).
(2) Minority interest includes Tier I (PEN 421 million)
(3) Up to 1.25% of total risk-weighted assets of Banco de Credito del Peru, Solucion Empresa Administradora Hipotecaria, Mibanco and ASB Bank Corp.
(4) Tier II + Tier III can not be more than 50% of total regulatory capital.
(5) Tier I = capital + restricted capital reserves + Tier I minority interest - goodwill - (0.5 x investment in equity and subordinated debt of financial and insurance companies)+ perpetual subordinated debt.
(6) Tier II = subordinated debt + TierII minority interest tier + loan loss reserves - (0.5 x investment in equity and subordinated debt of financial and insurance companies).
(7) Tier III = Subordinated debt covering market risk only.
(8) Includes regulatory capital requirements of the financial consolidated group.
(9) Includes regulatory capital requirements of the insurance consolidated group.
(10) Regulatory Capital / Total Regulatory Capital Requirements (legal minimum = 1.00).
Regulatory and Capital Adecuacy Ratios at BCP Stand-alone
(In S/ thousands)
| Regulatory Capital and Capital Adequacy Ratios - SBS | As of | % change |
| S/ 000 | Sep 21 | Jun 22 | Sep 22 | QoQ | YoY |
| Capital Stock | 11,317,387 | 12,176,365 | 12,176,365 | 0.0% | 7.6% |
| Legal and Other capital reserves | 6,707,831 | 7,516,897 | 7,516,897 | 0.0% | 12.1% |
| Accumulated earnings with capitalization agreement | - | - | - | n.a. | n.a. |
| Loan loss reserves (1) | 1,720,951 | 1,797,358 | 1,845,016 | 2.7% | 7.2% |
| Perpetual subordinated debt | - | - | - | n.a. | n.a. |
| Subordinated Debt | 5,595,900 | 5,163,750 | 5,374,350 | 4.1% | -4.0% |
| Investment in subsidiaries and others, net of unrealized profit and net income | (2,263,805) | (2,436,525) | (2,436,525) | 0.0% | 7.6% |
| Investment in subsidiaries and others | (2,377,058) | (2,674,646) | (2,774,129) | 3.7% | 16.7% |
| Unrealized profit and net income in subsidiaries | 113,253 | 238,121 | 337,605 | 41.8% | 198.1% |
| Goodwill | (122,083) | (122,083) | (122,083) | 0.0% | 0.0% |
| Total Regulatory Capital - SBS | 22,956,180 | 24,095,761 | 24,354,019 | 1.1% | 6.1% |
| | | | | | |
| Off-balance sheet | 100,119,715 | 91,019,217 | 94,156,153 | 3.4% | -6.0% |
| | | | | | |
| Regulatory Tier 1 Capital (2) | 15,142,988 | 16,219,133 | 16,219,133 | 0.0% | 7.1% |
| Regulatory Tier 2 Capital (3) | 7,813,192 | 7,876,628 | 8,134,886 | 3.3% | 4.1% |
| | | | | | |
| Total risk-weighted assets - SBS (4) | 151,415,294 | 158,176,424 | 163,140,250 | 3.1% | 7.7% |
| Credit risk-weighted assets | 135,576,214 | 142,632,376 | 146,511,610 | 2.7% | 8.1% |
| Market risk-weighted assets (5) | 3,792,119 | 1,868,921 | 2,618,693 | 40.1% | -30.9% |
| Operational risk-weighted assets | 12,046,961 | 13,675,127 | 14,009,947 | 2.4% | 16.3% |
| | | | | | |
| Total capital requirement - SBS | 14,356,117 | 15,023,680 | 16,360,962 | 8.9% | 14.0% |
| Credit risk capital requirement | 10,846,097 | 11,410,590 | 12,453,487 | 9.1% | 14.8% |
| Market risk capital requirement | 379,212 | 186,892 | 261,869 | 40.1% | -30.9% |
| Operational risk capital requirement | 1,204,696 | 1,367,513 | 1,400,995 | 2.4% | 16.3% |
| Additional capital requirements | 1,926,112 | 2,058,686 | 2,244,611 | 9.0% | 16.5% |
| | | | | | |
| Common Equity Tier 1 - Basel IFRS (6) | 16,090,388 | 17,160,382 | 18,084,114 | 5.4% | 12.4% |
| Capital and reserves | 17,512,975 | 19,181,019 | 19,181,019 | 0.0% | 9.5% |
| Retained earnings | 2,580,201 | 2,897,372 | 4,187,468 | 44.5% | 62.3% |
| Unrealized gains (losses) | (583,178) | (1,089,747) | (1,274,918) | 17.0% | n.a |
| Goodwill and intangibles | (1,228,407) | (1,312,578) | (1,355,924) | 3.3% | 10.4% |
| Investments in subsidiaries | (2,191,203) | (2,515,685) | (2,653,531) | 5.5% | 21.1% |
| | | | | | |
| Risk-Weighted Assets - Basel IFRS (7) | 143,602,974 | 148,337,779 | 152,849,186 | 3.0% | 6.4% |
| Total risk-weighted assets | 151,415,294 | 158,176,424 | 163,140,250 | 3.1% | 7.7% |
| (-) RWA Intangible assets, excluding goodwill. | 10,137,459 | 11,347,690 | 11,847,404 | 4.4% | 16.9% |
| (+) RWA Deferred tax assets generated as a result of temporary differences in income tax, in excess of 10% of CET1 | 1,711,120 | 884,457 | 909,119 | 2.8% | -46.9% |
| (+) RWA Deferred tax assets generated as a result of past losses | - | - | - | n.a. | n.a. |
| (+) IFRS Adjustments (11) | 614,018 | 624,588 | 647,220 | 3.6% | 5.4% |
| | | | | | |
| Capital ratios | | | | | |
| Regulatory Tier 1 ratio (8) | 10.00% | 10.25% | 9.94% | -31 bps | -6 bps |
| Common Equity Tier 1 ratio (9)(12) | 11.20% | 11.57% | 11.83% | 26 bps | 63 bps |
| Regulatory Global Capital ratio (10) | 15.16% | 15.23% | 14.93% | -30 bps | -23 bps |
| Risk-weighted assets / Regulatory capital | 6.60 | 6.56 | 6.70 | 2.0% | 1.6% |
(1) Up to 1.25% of total risk-weighted assets.
(2) Regulatory Tier 1 Capital = Capital + Legal and other capital reserves + Accumulated earnings with capitalization agreement + (0.5 x Unrealized profit and net income in subsidiaries) - Goodwill - (0.5 x Investment in subsidiaries) + Perpetual subordinated debt (maximum amount that can be included is 17.65% of Capital + Reserves + Accumulated earnings with capitalization agreement + Unrealized profit and net income in subsidiaries - Goodwill).
(3) Regulatory Tier 2 Capital = Subordinated debt + Loan loss reserves + Unrestricted Reserves + (0.5 x Unrealized profit and net income in subsidiaries) - (0.5 x Investment in subsidiaries).
(4) Since July 2012, Total Risk-weighted assets = Credit risk-weighted assets * 1.00 + Capital requirement to cover market risk * 10 + Capital requirement to cover operational risk * 10 * 1.00 (since July 2014)
(5) It includes capital requirement to cover price and rate risk.
(6) Common Equity Tier I = Capital + Reserves – 100% of applicable deductions (investment in subsidiaries, goodwill, intangibles and net deferred taxes that rely on future profitability) + retained earnings + unrealized gains. Figures differ from previously reported cause current calculations are based on IFRS figures.
(7) Adjusted Risk-Weighted Assets = Risk-weighted assets - (RWA Intangible assets, excluding goodwill, + RWA Deferred tax assets generated as a result of temporary differences in income tax, in excess of 10% of CET1, + RWA Deferred tax assets generated as a result of past losses). Figures differ from previously reported cause current calculations are based on IFRS figures.
(8) Regulatory Tier 1 Capital / Total Risk-weighted assets
(9) Common Equity Tier I / Adjusted Risk-Weighted Assets Risk-Weighted Assets
(10) Total Regulatory Capital / Total Risk-weighted assets (legal minimum = 10% since July 2011)
(11) Adjustments for differences in balance assets under Local Accounting (which regulatory Rwas are calculated) and IFRS in the Right of use account (lease). As of March 2022, the 'Right of Use' account increased to S/ 364M, explained the 64% of the adjustment. The rest adjustments correspond to differences in stock of provisions and Deferred Taxes.
(12) Common Equity Tier I calculated based on IFRS Accounting
Regulatory Capital and Capital Adequacy Ratios at Mibanco
(S/ thousands)
| | As of | % change |
| | Sep 21 | Jun 22 | Sep 22 | QoQ | YoY |
| Capital Stock | 1,714,577 | 1,840,606 | 1,840,606 | 0.0% | 7.4% |
| Legal and Other capital reserves | 246,305 | 264,221 | 264,221 | 0.0% | 7.3% |
| Accumulated earnings with capitalization agreement | 94,945 | - | - | n.a. | -100.0% |
Loan loss reserves (1) | 146,213 | 173,947 | 176,520 | 1.5% | 20.7% |
| Perpetual subordinated debt | | | | n.a. | n.a. |
| Subordinated Debt | 185,000 | 179,000 | 179,000 | 0.0% | -3.2% |
| Investment in subsidiaries and others, net of unrealized profit and net income | - | - | - | n.a. | n.a. |
| Investment in subsidiaries and others | | | | n.a. | n.a. |
| Unrealized profit and net income in subsidiaries | | | | n.a. | n.a. |
| Goodwill | (139,180) | (139,180) | (139,180) | 0.0% | 0.0% |
| Accumulated Losses | - | - | - | n.a. | n.a. |
| Total Regulatory Capital - SBS | 2,247,861 | 2,318,594 | 2,321,167 | 0.1% | 3.3% |
| | | | | | |
Regulatory Tier 1 Capital (2) | 1,913,912 | 1,962,906 | 1,962,906 | 0.0% | 2.6% |
Regulatory Tier 2 Capital (3) | 333,948 | 355,687 | 358,260 | 0.7% | 7.3% |
| | | | | | |
Total risk-weighted assets - SBS (4) | 13,430,936 | 15,638,132 | 15,882,853 | 1.6% | 18.3% |
| Credit risk-weighted assets | 11,320,727 | 13,605,110 | 13,811,480 | 1.5% | 22.0% |
Market risk-weighted assets (5) | 229,235 | 105,570 | 115,614 | 9.5% | -49.6% |
| Operational risk-weighted assets | 1,880,975 | 1,927,452 | 1,955,759 | 1.5% | 4.0% |
| | | | | | |
| Total capital requirement | 1,463,848 | 1,708,934 | 1,744,815 | 2.1% | 19.2% |
| Credit risk capital requirement | 1,132,073 | 1,360,511 | 1,381,148 | 1.5% | 22.0% |
| Market risk-weighted assets | 22,923 | 10,557 | 11,561 | 9.5% | -49.6% |
| Operational risk capital requirement | 188,097 | 192,745 | 195,576 | 1.5% | 4.0% |
| Additional capital requirements | 120,754 | 145,121 | 156,530 | 7.9% | 29.6% |
| | | | | | |
Common Equity Tier 1 - Basel IFRS (6) | 1,919,613 | 2,254,711 | 2,392,636 | 5.7% | 23.4% |
| Capital and reserves | 2,489,011 | 2,632,956 | 2,632,956 | 0.0% | 5.8% |
| Retained earnings | (239,537) | (32,701) | 114,341 | n.a. | n.a. |
| Unrealized gains (losses) | (6,761) | (13,045) | (16,074) | 23.2% | 137.8% |
| Goodwill and intangibles | (323,100) | (332,498) | (338,587) | 1.8% | 4.8% |
| | | | | | |
Adjusted Risk-Weighted Assets - Basel IFRS (7) | 12,713,766 | 14,787,085 | 14,956,200 | 1.1% | 17.6% |
| Total risk-weighted assets | 13,430,936 | 15,638,132 | 15,882,853 | 1.6% | 18.3% |
| (-) RWA Intangible assets, excluding goodwill. | 1,049,844 | 1,199,443 | 1,280,505 | 6.8% | 22.0% |
| (+) RWA Deferred tax assets generated as a result of temporary differences in income tax, in excess of 10% of CET1 | 238,755 | 169,072 | 169,072 | 0.0% | -29.2% |
| (+) IFRS Adjustments | (22,981) | 157,645 | 171,774 | 9.0% | -847.4% |
| (+) RWA for Market Risk difference (exchange risk) for temporary difference | 37,182 | 21,679 | 13,007 | -40.0% | -65.0% |
| (-) RWA assets that exceed 10% of CET1 SBS | 80,966 | - | - | n.a. | -100.0% |
| (-) RWA difference between excees SBS and Basel methodology | 1,247 | - | - | n.a. | -100.0% |
| | | | | | |
| Capital ratios | | | | | |
Regulatory Tier 1 ratio (8) | 14.25% | 12.55% | 12.36% | -19 bps | -189 bps |
Common Equity Tier 1 ratio (9)(11) | 15.10% | 15.25% | 16.00% | 75 bps | 90 bps |
Regulatory Global Capital ratio (10) | 16.74% | 14.83% | 14.61% | -22 bps | -213 bps |
| Risk-weighted assets / Regulatory capital | 5.97 | 6.74 | 6.84 | 1.5% | 14.5% |
(1) Up to 1.25% of total risk-weighted assets.
(2) Regulatory Tier 1 Capital = Capital + Legal and other capital reserves + Accumulated earnings with capitalization agreement + (0.5 x Unrealized profit and net income in subsidiaries) - Goodwill - (0.5 x Investment in subsidiaries) + Perpetual subordinated debt (maximum amount that can be included is 17.65% of Capital + Reserves + Accumulated earnings with capitalization agreement + Unrealized profit and net income in subsidiaries - Goodwill).
(3) Regulatory Tier 2 Capital = Subordinated debt + Loan loss reserves + Unrestricted Reserves + (0.5 x Unrealized profit and net income in subsidiaries) - (0.5 x Investment in subsidiaries).
(4) Since July 2012, Total Risk-weighted assets = Credit risk-weighted assets * 1.00 + Capital requirement to cover market risk * 10 + Capital requirement to cover operational risk * 10 * 1.00 (since July 2014)
(5) It includes capital requirement to cover price and rate risk.
(6) Common Equity Tier I = Capital + Reserves – 100% of applicable deductions (investment in subsidiaries, goodwill, intangibles and net deferred taxes that rely on future profitability) + retained earnings + unrealized gains.
(7) Adjusted Risk-Weighted Assets = Risk-weighted assets - (RWA Intangible assets, excluding goodwill, + RWA Deferred tax assets generated as a result of temporary differences in income tax, in excess of 10% of CET1, + RWA Deferred tax assets generated as a result of past losses). Figures differ from previously reported cause current calculations are based on IFRS figures.
(8) Regulatory Tier 1 Capital / Total Risk-weighted assets
(9) Common Equity Tier I / Adjusted Risk-Weighted Assets Risk-Weighted Assets
(10) Total Regulatory Capital / Total Risk-weighted assets (legal minimum = 10% since July 2011)
(11) Common Equity Tier I calculated based on IFRS Accounting
12.5. Financial Statements and Ratios by Business
12.5.1. Credicorp Consolidated
CREDICORP LTD. AND SUBSIDIARIES
CONSOLIDATED STATEMENT OF FINANCIAL POSITION
(In S/ thousands, IFRS)
| | As of | % change |
| | Sep 21 | Jun 22 | Sep 22 | QoQ | YoY |
| ASSETS | | | | | |
| Cash and due from banks | | | | | |
| Non-interest bearing | 8,360,631 | 7,017,129 | 6,919,212 | -1.4% | -17.2% |
| Interest bearing | 36,147,225 | 23,831,465 | 29,330,082 | 23.1% | -18.9% |
| | | | | | |
| Total cash and due from banks | 44,507,856 | 30,848,594 | 36,249,294 | 17.5% | -18.6% |
| | | | | | |
| Cash collateral, reverse repurchase agreements and securities borrowing | 2,555,337 | 2,046,209 | 1,586,967 | -22.4% | -37.9% |
| | | | | | |
| Fair value through profit or loss investments | 6,661,600 | 4,187,000 | 4,550,783 | 8.7% | -31.7% |
| Fair value through other comprehensive income investments | 33,261,505 | 32,955,721 | 34,263,930 | 4.0% | 3.0% |
| Amortized cost investments | 8,187,351 | 8,200,054 | 8,028,557 | -2.1% | -1.9% |
| | | | | | |
Loans
| 146,551,226 | 150,370,184 | 151,392,202 | 0.7% | 3.3% |
| Current | 141,077,541 | 144,264,928 | 145,142,071 | 0.6% | 2.9% |
| Internal overdue loans | 5,473,685 | 6,105,256 | 6,250,131 | 2.4% | 14.2% |
| Less - allowance for loan losses | (9,077,449) | (8,306,500) | (8,030,104) | -3.3% | -11.5% |
| Loans, net | 137,473,777 | 142,063,684 | 143,362,098 | 0.9% | 4.3% |
| | | | | | |
| Financial assets designated at fair value through profit or loss | 981,508 | 765,195 | 767,425 | 0.3% | -21.8% |
| Accounts receivable from reinsurers and coinsurers | 1,097,493 | 1,105,527 | 1,063,972 | -3.8% | -3.1% |
| Premiums and other policyholder receivables | 801,531 | 816,076 | 803,886 | -1.5% | 0.3% |
| Property, plant and equipment, net | 1,911,478 | 1,837,436 | 1,786,136 | -2.8% | -6.6% |
| Due from customers on acceptances | 776,863 | 743,925 | 697,119 | -6.3% | -10.3% |
| Investments in associates | 648,041 | 636,217 | 660,849 | 3.9% | 2.0% |
| Intangible assets and goodwill, net | 2,682,216 | 2,729,593 | 2,767,341 | 1.4% | 3.2% |
Other assets (1) | 9,995,835 | 7,645,232 | 7,327,839 | -4.2% | -26.7% |
| | | | | | |
| Total Assets | 251,542,391 | 236,580,463 | 243,916,196 | 3.1% | -3.0% |
| | | | | | |
| LIABILITIES AND EQUITY | | | | | |
| Deposits and obligations | | | | | |
| Non-interest bearing | 54,546,530 | 46,043,988 | 46,625,814 | 1.3% | -14.5% |
| Interest bearing | 98,001,838 | 101,396,587 | 106,166,200 | 4.7% | 8.3% |
| Total deposits and obligations | 152,548,368 | 147,440,575 | 152,792,014 | 3.6% | 0.2% |
| | | | | | |
| Payables from repurchase agreements and securities lending | 23,363,030 | 18,138,863 | 16,575,580 | -8.6% | -29.1% |
| BCRP instruments | 20,746,109 | 16,031,618 | 14,449,597 | -9.9% | -30.4% |
| Repurchase agreements with third parties | 1,330,811 | 1,340,423 | 1,182,946 | -11.7% | -11.1% |
| Repurchase agreements with customers | 1,286,110 | 766,822 | 943,037 | 23.0% | -26.7% |
| | | | | | |
| Due to banks and correspondents | 7,466,434 | 6,456,360 | 9,002,035 | 39.4% | 20.6% |
| Bonds and notes issued | 17,577,630 | 16,579,674 | 17,019,694 | 2.7% | -3.2% |
| Banker’s acceptances outstanding | 776,863 | 743,925 | 697,119 | -6.3% | -10.3% |
| Reserves for property and casualty claims | 2,583,777 | 2,551,089 | 2,608,744 | 2.3% | 1.0% |
| Reserve for unearned premiums | 9,928,912 | 9,150,249 | 9,101,140 | -0.5% | -8.3% |
| Accounts payable to reinsurers | 278,220 | 343,959 | 328,031 | -4.6% | 17.9% |
| Financial liabilities at fair value through profit or loss | 879,177 | 527,541 | 333,453 | -36.8% | -62.1% |
| Other liabilities | 10,434,536 | 7,927,550 | 7,780,443 | -1.9% | -25.4% |
| | | | | | |
| Total Liabilities | 225,836,947 | 209,859,785 | 216,238,253 | 3.0% | -4.3% |
| | | | | | |
| Net equity | 25,192,569 | 26,175,222 | 27,109,054 | 3.6% | 7.6% |
| Capital stock | 1,318,993 | 1,318,993 | 1,318,993 | 0.0% | 0.0% |
| Treasury stock | (207,745) | (207,518) | (207,518) | 0.0% | -0.1% |
| Capital surplus | 215,071 | 231,179 | 225,832 | -2.3% | 5.0% |
| Reserves | 21,350,150 | 23,666,823 | 23,687,946 | 0.1% | 10.9% |
Unrealized gains and losses | 19,435 | (1,098,325) | (1,482,023) | 34.9% | -7725.5% |
| Retained earnings | 2,496,665 | 2,264,070 | 3,565,824 | 57.5% | 42.8% |
| | | | | | |
| Non-controlling interest | 512,875 | 545,456 | 568,889 | 4.3% | 10.9% |
| | | | | | |
| Total Net Equity | 25,705,444 | 26,720,678 | 27,677,943 | 3.6% | 7.7% |
| | | | | | |
| Total liabilities and equity | 251,542,391 | 236,580,463 | 243,916,196 | 3.1% | -3.0% |
| | | | | | |
| Off-balance sheet | 154,907,974 | 142,573,498 | 151,545,926 | 6.6% | -1.9% |
| Total performance bonds, stand-by and L/Cs. | 22,665,879 | 21,331,467 | 21,399,132 | 0.3% | -5.6% |
| Undrawn credit lines, advised but not committed | 94,165,966 | 84,820,503 | 87,600,569 | 3.3% | -7.0% |
| Total derivatives (notional) and others | 38,076,129 | 36,421,528 | 42,546,225 | 16.8% | 11.7% |
(1) Includes mainly accounts receivables from brokerage and others.
CREDICORP LTD. AND SUBSIDIARIES
CONSOLIDATED STATEMENT OF INCOME
(In S/ thousands, IFRS)
| | Quarter | % change | As of | % change |
| | 3Q21 | 2Q22 | 3Q22 | QoQ | YoY | Sep 21 | Sep 22 | Sep 22 / Sep 21 |
| Interest income and expense | | | | | | | | |
| Interest and dividend income | 3,051,000 | 3,488,113 | 3,988,681 | 14.4% | 30.7% | 8,758,652 | 10,649,140 | 21.6% |
Interest expense (1) | (599,901) | (748,085) | (987,255) | 32.0% | 64.6% | (1,876,282) | (2,374,221) | 26.5% |
| Net interest income | 2,451,099 | 2,740,028 | 3,001,426 | 9.5% | 22.5% | 6,882,370 | 8,274,919 | 20.2% |
| | | | | | | | |
| Gross provision for credit losses on loan portfolio | (265,158) | (447,036) | (545,249) | 22.0% | 105.6% | (1,329,147) | (1,342,966) | 1.0% |
| Recoveries of written-off loans | 100,744 | 83,745 | 85,273 | 1.8% | -15.4% | 243,706 | 262,109 | 7.6% |
| Provision for credit losses on loan portfolio, net of recoveries | (164,414) | (363,291) | (459,976) | 26.6% | 179.8% | (1,085,441) | (1,080,857) | -0.4% |
| | | | | | | | | |
| Risk-adjusted net interest income | 2,286,685 | 2,376,737 | 2,541,450 | 6.9% | 11.1% | 5,796,929 | 7,194,062 | 24.1% |
| Non-financial income | | | | | | | | |
| Fee income | 876,391 | 920,492 | 934,244 | 1.5% | 6.6% | 2,569,573 | 2,745,767 | 6.9% |
| Net gain on foreign exchange transactions | 246,649 | 269,059 | 262,167 | -2.6% | 6.3% | 659,900 | 790,936 | 19.9% |
| Net gain on sales of securities | 5,739 | (94,180) | (25,459) | -73.0% | -543.6% | (47,921) | (176,505) | 268.3% |
| Net gain from associates | 19,090 | 29,219 | 25,806 | -11.7% | 35.2% | 60,797 | 79,039 | 30.0% |
| Net gain on derivatives held for trading | 43,365 | 12,304 | 53,008 | 330.8% | 22.2% | 174,518 | 59,330 | -66.0% |
| Net gain from exchange differences | (4,809) | (17,066) | (4,071) | -76.1% | -15.3% | 18,868 | (38,197) | -302.4% |
| Other non-financial income | 52,258 | 84,152 | 64,890 | -22.9% | 24.2% | 189,172 | 296,944 | 57.0% |
| Total non-financial income | 1,238,683 | 1,203,980 | 1,310,585 | 8.9% | 5.8% | 3,624,907 | 3,757,314 | 3.7% |
| | | | | | | | | |
| Insurance underwriting result | | | | | | | | |
| Net earned premiums | 675,571 | 695,547 | 751,936 | 8.1% | 11.3% | 1,959,443 | 2,138,019 | 9.1% |
| Net claims | (517,951) | (492,258) | (478,039) | -2.9% | -7.7% | (1,832,639) | (1,448,803) | -20.9% |
Acquisition cost (1) | (87,416) | (66,247) | (75,055) | 13.3% | -14.1% | (258,182) | (211,786) | -18.0% |
| Total insurance underwriting result | 70,204 | 137,042 | 198,842 | 45.1% | 183.2% | (131,378) | 477,430 | -463.4% |
| | | | | | | | | |
| Total expenses | | | | | | | | |
| Salaries and employee benefits | (915,564) | (975,420) | (1,021,946) | 4.8% | 11.6% | (2,655,300) | (2,975,319) | 12.1% |
| Administrative, general and tax expenses | (802,547) | (850,560) | (870,852) | 2.4% | 8.5% | (2,055,040) | (2,446,326) | 19.0% |
| Depreciation and amortization | (170,960) | (168,845) | (173,500) | 2.8% | 1.5% | (501,594) | (506,859) | 1.0% |
| Association in participation | (10,426) | (10,329) | (9,999) | -3.2% | -4.1% | (33,211) | (28,019) | -15.6% |
| Other expenses | (77,688) | (49,244) | (65,222) | 32.4% | -16.0% | (271,604) | (188,951) | -30.4% |
| Total expenses | (1,977,185) | (2,054,398) | (2,141,519) | 4.2% | 8.3% | (5,516,749) | (6,145,474) | 11.4% |
| | | | | | | | | |
| Profit before income tax | 1,618,387 | 1,663,361 | 1,909,358 | 14.8% | 18.0% | 3,773,709 | 5,283,332 | 40.0% |
| | | | | | | | | |
| Income tax | (428,037) | (513,181) | (575,083) | 12.1% | 34.4% | (1,189,127) | (1,634,265) | 37.4% |
| | | | | | | | | |
| Net profit | 1,190,350 | 1,150,180 | 1,334,275 | 16.0% | 12.1% | 2,584,582 | 3,649,067 | 41.2% |
| Non-controlling interest | 26,651 | 28,420 | 31,855 | 12.1% | 19.5% | 60,616 | 88,061 | 45.3% |
| Net profit attributable to Credicorp | 1,163,699 | 1,121,760 | 1,302,420 | 16.1% | 11.9% | 2,523,966 | 3,561,006 | 41.1% |
(1) The acquisition cost of Pacifico includes net fees and underwriting expenses.
12.5.2. Credicorp Stand-alone
Credicorp Ltd.
Separate Statement of Financal Position
(S/ thousands, IFRS)
| | As of | % change |
| | Sep 21 | Jun 22 | Sep 22 | QoQ | YoY |
| ASSETS | | | | | |
| Cash and cash equivalents | 598,770 | 115,612 | 125,092 | 8.2% | -79.1% |
| At fair value through profit or loss | 1,091,138 | 938,816 | 967,331 | 3.0% | -11.3% |
| Fair value through other comprehensive income investments | 342,485 | 332,280 | 313,739 | -5.6% | -8.4% |
| In subsidiaries and associates investments | 29,862,234 | 31,251,710 | 32,308,088 | 3.4% | 8.2% |
| Other assets | 328 | 230 | 12,115 | n.a | n.a |
| | | | | | |
| Total Assets | 31,894,955 | 32,638,648 | 33,726,365 | 3.3% | 5.7% |
| | | | | | |
| LIABILITIES AND NET SHAREHOLDERS' EQUITY | | | | | |
| | | | | | |
| Due to banks, correspondents and other entities | 471,912 | 240,996 | 256,528 | 6.4% | -45.6% |
| Bonds and notes issued | 2,066,412 | 1,901,462 | 1,993,778 | 4.9% | -3.5% |
| Other liabilities | 143,382 | 164,451 | 218,687 | 33.0% | 52.5% |
| | | | | | |
| Total Liabilities | 2,681,706 | 2,306,909 | 2,468,993 | 7.0% | -7.9% |
| | | | | | |
| NET EQUITY | | | | | |
| Capital stock | 1,318,993 | 1,318,993 | 1,318,993 | 0.0% | 0.0% |
| Capital Surplus | 384,542 | 384,542 | 384,542 | 0.0% | 0.0% |
| Reserve | 20,945,491 | 23,300,350 | 23,300,350 | 0.0% | 11.2% |
| Unrealized results | (281,545) | (1,285,376) | (1,661,404) | 29.3% | n.a |
| Retained earnings | 6,845,768 | 6,613,230 | 7,914,891 | 19.7% | 15.6% |
| | | | | | |
| Total net equity | 29,213,249 | 30,331,739 | 31,257,372 | 3.1% | 7.0% |
| | | | | | |
| Total Liabilities And Equity | 31,894,955 | 32,638,648 | 33,726,365 | 3.3% | 5.7% |
| | Quarter | % change |
| | 3Q21 | 2Q22 | 3Q22 | QoQ | YoY |
| Interest income | | | | | |
| | | | | | |
| Net share of the income from investments in subsidiaries and associates | 1,256,878 | 1,425,812 | 1,379,036 | -3.3% | 9.7% |
| Interest and similar income | 13,909 | 7,056 | 307 | -95.6% | -97.8% |
| Net gain on financial assets at fair value through profit or loss | 3,860 | (41,316) | (10,214) | -75.3% | -364.6% |
| Total income | 1,274,647 | 1,391,552 | 1,369,129 | -1.6% | 7.4% |
| | | | | | |
| Interest and similar expense | (15,161) | (14,778) | (19,155) | 29.6% | 26.3% |
| Administrative and general expenses | (4,367) | (3,766) | (5,908) | 56.9% | 35.3% |
| Total expenses | (19,528) | (18,544) | (25,063) | 35.2% | 28.3% |
| | | | | | |
| Operating income | 1,255,119 | 1,373,008 | 1,344,066 | -2.1% | 7.1% |
| | | | | | |
| Net gain (losses) from exchange differences | (415) | (752) | 31 | -104.1% | -107.5% |
| Other, net | (6) | (13) | 231 | n.a | n.a |
| | | | | | |
| Profit before income tax | 1,254,698 | 1,372,243 | 1,344,328 | -2.0% | 7.1% |
| Income tax | (20,079) | (42,290) | (42,000) | -0.7% | 109.2% |
| Net income | 1,234,619 | 1,329,953 | 1,302,328 | -2.1% | 5.5% |
| | | | | | |
| Double Leverage Ratio | 102.22% | 103.03% | 103.36% | 33 bps | 114 bps |
12.5.3. BCP Consolidated
BANCO DE CREDITO DEL PERU AND SUBSIDIARIES
CONSOLIDATED STATEMENT OF FINANCIAL POSITION
(In S/ thousands, IFRS)
| | As of | % change |
| | Sep-21 | Jun-22 | Sep-22 | QoQ | YoY |
| ASSETS | | | | | |
| Cash and due from banks | | | | | |
| Non-interest bearing | 6,157,037 | 5,236,507 | 5,458,040 | 4.2% | -11.4% |
| Interest bearing | 33,783,609 | 22,383,291 | 28,265,953 | 26.3% | -16.3% |
| Total cash and due from banks | 39,940,646 | 27,619,798 | 33,723,993 | 22.1% | -15.6% |
| | | | | | |
| Cash collateral, reverse repurchase agreements and securities borrowing | 1,027,761 | 542,521 | 308,959 | -43.1% | -69.9% |
| | | | | | |
| Fair value through profit or loss investments | 1,406,424 | 163,187 | 307,513 | 88.4% | -78.1% |
| Fair value through other comprehensive income investments | 18,167,181 | 17,868,118 | 18,277,389 | 2.3% | 0.6% |
| Amortized cost investments | 7,597,755 | 7,630,677 | 7,500,013 | -1.7% | -1.3% |
| | | | | | |
| Loans | 133,369,027 | 138,012,365 | 138,419,933 | 0.3% | 3.8% |
| Current | 128,090,680 | 132,146,911 | 132,426,874 | 0.2% | 3.4% |
| Internal overdue loans | 5,278,347 | 5,865,454 | 5,993,059 | 2.2% | 13.5% |
| Less - allowance for loan losses | (8,474,947) | (7,813,526) | (7,541,660) | -3.5% | -11.0% |
| Loans, net | 124,894,080 | 130,198,839 | 130,878,273 | 0.5% | 4.8% |
| | | | | | |
Property, furniture and equipment, net (1) | 1,634,143 | 1,558,507 | 1,500,806 | -3.7% | -8.2% |
| Due from customers on acceptances | 776,863 | 743,925 | 697,119 | -6.3% | -10.3% |
| Investments in associates | 23,944 | 26,411 | 29,953 | 13.4% | 25.1% |
Other assets (2) | 7,497,739 | 7,018,343 | 6,645,503 | -5.3% | -11.4% |
| | | | | | |
| Total Assets | 202,966,536 | 193,370,326 | 199,869,521 | 3.4% | -1.5% |
| | | | | | |
| Liabilities and Equity | | | | | |
| Deposits and obligations | | | | | |
Non-interest bearing (1) | 47,262,689 | 40,994,205 | 42,200,017 | 2.9% | -10.7% |
Interest bearing (1) | 86,404,649 | 88,145,130 | 91,406,523 | 3.7% | 5.8% |
| Total deposits and obligations | 133,667,338 | 129,139,335 | 133,606,540 | 3.5% | 0.0% |
| | | | | | |
| Payables from repurchase agreements and securities lending | 21,308,690 | 16,578,846 | 15,001,393 | -9.5% | -29.6% |
| BCRP instruments | 20,746,109 | 16,031,618 | 14,449,597 | -9.9% | -30.4% |
| Repurchase agreements with third parties | 562,581 | 547,228 | 551,796 | 0.8% | -1.9% |
| Due to banks and correspondents | 6,973,909 | 5,963,573 | 8,563,079 | 43.6% | 22.8% |
| Bonds and notes issued | 14,838,736 | 14,093,426 | 14,518,870 | 3.0% | -2.2% |
| Banker’s acceptances outstanding | 776,863 | 743,925 | 697,119 | -6.3% | -10.3% |
| Financial liabilities at fair value through profit or loss | 484,531 | 210,393 | 140,146 | 0.0% | -71.1% |
Other liabilities (3) | 5,287,243 | 5,512,852 | 5,102,548 | -7.4% | -3.5% |
| Total Liabilities | 183,337,310 | 172,242,350 | 177,629,695 | 3.1% | -3.1% |
| | | | | | |
| Net equity | 19,505,851 | 20,987,313 | 22,091,980 | 5.3% | 13.3% |
| Capital stock | 11,024,006 | 11,882,984 | 11,882,984 | 0.0% | 7.8% |
| Reserves | 6,488,969 | 7,298,035 | 7,298,035 | 0.0% | 12.5% |
| Unrealized gains and losses | (583,178) | (1,089,747) | (1,274,918) | 17.0% | 118.6% |
| Retained earnings | 2,576,054 | 2,896,041 | 4,185,879 | 44.5% | 62.5% |
| | | | | | |
| Non-controlling interest | 123,375 | 140,663 | 147,846 | 5.1% | 19.8% |
| | | | | | |
| Total Net Equity | 19,629,226 | 21,127,976 | 22,239,826 | 5.3% | 13.3% |
| | | | | | |
| Total liabilities and equity | 202,966,536 | 193,370,326 | 199,869,521 | 3.4% | -1.5% |
| | | | | | |
| Off-balance sheet | 139,250,038 | 130,782,706 | 139,052,767 | 6.3% | -0.1% |
| Total performance bonds, stand-by and L/Cs. | 20,761,917 | 19,490,337 | 20,443,858 | 4.9% | -1.5% |
| Undrawn credit lines, advised but not committed | 80,631,043 | 74,845,631 | 76,051,652 | 1.6% | -5.7% |
| Total derivatives (notional) and others | 37,857,078 | 36,446,738 | 42,557,257 | 16.8% | 12.4% |
(1) Right of use asset of lease contracts is included by application of IFRS 16.
(2) Mainly includes intangible assets, other receivable accounts and tax credit.
(3) Mainly includes other payable accounts.
BANCO DE CREDITO DEL PERU AND SUBSIDIARIES
CONSOLIDATED STATEMENT OF INCOME
(In S/ thousands, IFRS)
| | Quarter | % change | As of | % change |
| | 3Q21 | 2Q22 | 3Q22 | QoQ | YoY | Sep 21 | Sep 22 | Sep 22 / Sep 21 |
| Interest income and expense | | | | | | | | |
| Interest and dividend income | 2,542,011 | 2,988,885 | 3,462,081 | 15.8% | 36.2% | 7,396,739 | 9,163,926 | 23.9% |
| Interest expense | (443,398) | (590,599) | (799,839) | 35.4% | 80.4% | (1,437,349) | (1,884,473) | 31.1% |
| Net interest income | 2,098,613 | 2,398,286 | 2,662,242 | 11.0% | 26.9% | 5,959,390 | 7,279,453 | 22.2% |
| | | | | | | | - | |
| Provision for credit losses on loan portfolio | (249,273) | (400,124) | (522,071) | 30.5% | 109.4% | (1,314,646) | (1,262,430) | -4.0% |
| Recoveries of written-off loans | 93,671 | 77,244 | 78,403 | 1.5% | -16.3% | 227,790 | 242,075 | 6.3% |
| Provision for credit losses on loan portfolio, net of recoveries | (155,602) | (322,880) | (443,668) | 37.4% | 185.1% | (1,086,856) | (1,020,355) | -6.1% |
| | | | | | | - | |
| Risk-adjusted net interest income | 1,943,011 | 2,075,406 | 2,218,574 | 6.9% | 14.2% | 4,872,534 | 6,259,098 | 28.5% |
| | | | | | | | - | |
| Non-financial income | | | | | | | - | |
| Fee income | 688,357 | 753,835 | 784,132 | 4.0% | 13.9% | 1,969,115 | 2,269,672 | 15.3% |
| Net gain on foreign exchange transactions | 234,313 | 243,566 | 246,518 | 1.2% | 5.2% | 648,331 | 732,588 | 13.0% |
| Net gain (loss) on securities | (30,017) | (2,611) | (5,587) | 114.0% | -81.4% | (118,379) | (10,096) | -91.5% |
| Net gain (loss) on derivatives held for trading | 462 | (19,037) | 17,037 | -189.5% | 3587.7% | 44,626 | (12,978) | -129.1% |
| Net gain (loss) from exchange differences | 11,037 | 9,043 | 10,962 | 21.2% | -0.7% | 65,032 | 2,954 | -95.5% |
| Others | 31,437 | 46,354 | 36,947 | -20.3% | 17.5% | 131,563 | 203,629 | 54.8% |
| Total other income | 935,589 | 1,031,150 | 1,090,009 | 5.7% | 16.5% | 2,740,288 | 3,185,769 | 16.3% |
| | | | | | | | - | |
| Total expenses | | | | | | | - | |
| Salaries and employee benefits | (629,810) | (688,691) | (732,377) | 6.3% | 16.3% | (1,865,621) | (2,115,407) | 13.4% |
| Administrative expenses | (634,281) | (638,366) | (641,330) | 0.5% | 1.1% | (1,584,666) | (1,812,256) | 14.4% |
| Depreciation and amortization | (131,420) | (130,253) | (133,638) | 2.6% | 1.7% | (384,590) | (390,317) | 1.5% |
| Other expenses | (50,893) | (52,035) | (48,213) | -7.3% | -5.3% | (159,163) | (149,804) | -5.9% |
| Total expenses | (1,446,404) | (1,509,345) | (1,555,558) | 3.1% | 7.5% | (3,994,040) | (4,467,784) | 11.9% |
| | | | | | | | - | |
| Profit before income tax | 1,432,196 | 1,597,211 | 1,753,025 | 9.8% | 22.4% | 3,618,782 | 4,977,083 | 37.5% |
| | | | | | | | - | |
| Income tax | (371,383) | (434,823) | (455,802) | 4.8% | 22.7% | (1,002,375) | (1,357,319) | 35.4% |
| | | | | | | | - | |
| Net profit | 1,060,813 | 1,162,388 | 1,297,223 | 11.6% | 22.3% | 2,616,407 | 3,619,764 | 38.3% |
| Non-controlling interest | (3,838) | (6,426) | (7,385) | 14.9% | 92.4% | (7,160) | (18,968) | 164.9% |
| Net profit attributable to BCP Consolidated | 1,056,975 | 1,155,962 | 1,289,838 | 11.6% | 22.0% | 2,609,247 | 3,600,796 | 38.0% |
BANCO DE CREDITO DEL PERU AND SUBSIDIARIES
SELECTED FINANCIAL INDICATORS
| | Quarter | As of |
| | 3Q21 | 2Q22 | 3Q22 | Sep 21 | Sep 22 |
| Profitability | | | | | |
Earnings per share (1) | 0.087 | 0.095 | 0.106 | 0.214 | 0.296 |
ROAA (2)(3) | 2.1% | 2.4% | 2.6% | 1.7% | 2.4% |
ROAE (2)(3) | 22.0% | 22.5% | 24.0% | 18.4% | 22.3% |
Net interest margin (2)(3) | 4.32% | 5.10% | 5.61% | 4.11% | 5.11% |
Risk adjusted NIM (2)(3) | 4.00% | 4.41% | 4.67% | 3.36% | 4.40% |
Funding Cost (2)(3)(4) | 1.00% | 1.42% | 1.90% | 1.10% | 1.49% |
| | | | | | |
| Quality of loan portfolio | | | | | |
| IOL ratio | 3.96% | 4.25% | 4.33% | 3.96% | 4.33% |
| NPL ratio | 5.27% | 5.44% | 5.61% | 5.27% | 5.61% |
| Coverage of IOLs | 160.6% | 133.2% | 125.8% | 160.6% | 125.8% |
| Coverage of NPLs | 120.6% | 104.0% | 97.2% | 120.6% | 97.2% |
Cost of risk (5) | 0.47% | 0.94% | 1.28% | 1.09% | 0.98% |
| | | | | | |
| Operating efficiency | | | | | |
Oper. expenses as a percent. of total income - reported (6) | 46.0% | 43.0% | 40.5% | 44.1% | 42.0% |
Oper. expenses as a percent. of av. tot. assets (2)(3)(6) | 2.77% | 3.00% | 3.07% | 2.6% | 2.9% |
| | | | | | |
| Share Information | | | | | |
| N° of outstanding shares (Million) | 12,176 | 12,176 | 12,176 | 12,176 | 12,176 |
(1) Shares outstanding of 12,176 million is used for all periods since shares have been issued only for capitalization of profits.
(2) Ratios are annualized.
(3) Averages are determined as the average of period-beginning and period-ending balances.
(4) The funding costs differs from previously reported due to a methodoloy change in the denominator, which no longer includes the following accounts: acceptances outstanding, reserves for property and casualty claims, reserve for unearned premiums, reinsurance payable and other liabilities.
(5) Cost of risk: Annualized provision for loan losses / Total loans.
(6) Total income includes net interest income, fee income, net gain on foreign exchange transactions, result on exchange difference and net gain on derivatives. Operating expenses includes Salaries and social benefits, administrative, general and tax expenses and depreciation and amortization.
12.5.4. BCP Stand-alone
BANCO DE CREDITO DEL PERU
STATEMENT OF FINANCIAL POSITION
(S/ thousands, IFRS)
| | As of | % change |
| | Sep 21 | Jun 22 | Sep 22 | QoQ | YoY |
| ASSETS | | | | | |
| Cash and due from banks | | | | | |
| Non-interest bearing | 5,666,863 | 4,596,609 | 4,880,450 | 6.2% | -13.9% |
| Interest bearing | 32,819,306 | 21,860,250 | 27,042,976 | 23.7% | -17.6% |
| Total cash and due from banks | 38,486,169 | 26,456,859 | 31,923,426 | 20.7% | -17.1% |
| | | | | | |
| Cash collateral, reverse repurchase agreements and securities borrowing | 1,027,761 | 542,521 | 308,959 | -43.1% | -69.9% |
| | | | | | |
| Fair value through profit or loss investments | 1,406,424 | 163,187 | 307,513 | 88.4% | -78.1% |
| Fair value through other comprehensive income investments | 16,931,666 | 16,569,716 | 16,799,789 | 1.4% | -0.8% |
| Amortized cost investments | 7,307,678 | 7,331,851 | 7,206,315 | -1.7% | -1.4% |
| | | | | | |
| Loans | 121,459,651 | 125,535,209 | 126,176,601 | 0.5% | 3.9% |
| Current | 117,256,286 | 120,657,794 | 121,124,754 | 0.4% | 3.3% |
| Internal overdue loans | 4,203,365 | 4,877,415 | 5,051,847 | 3.6% | 20.2% |
| Less - allowance for loan losses | (6,976,762) | (6,636,936) | (6,450,828) | -2.8% | -7.5% |
| Loans, net | 114,482,889 | 118,898,273 | 119,725,773 | 0.7% | 4.6% |
| | | | | | |
Property, furniture and equipment, net (1) | 1,328,385 | 1,291,209 | 1,241,975 | -3.8% | -6.5% |
| Due from customers on acceptances | 776,863 | 743,925 | 697,119 | -6.3% | -10.3% |
| Investments in associates | 2,214,558 | 2,541,615 | 2,683,038 | 5.6% | 21.2% |
Other assets (2) | 6,576,750 | 6,295,694 | 6,044,500 | -4.0% | -8.1% |
| | | | | | |
| Total Assets | 190,539,143 | 180,834,850 | 186,938,407 | 3.4% | -1.9% |
| | | | | | |
| Liabilities and Equity | | | | | |
| Deposits and obligations | | | | | |
| Non-interest bearing | 47,272,754 | 40,978,979 | 42,188,122 | 3.0% | -10.8% |
| Interest bearing | 77,851,798 | 79,282,172 | 82,294,328 | 3.8% | 5.7% |
| Total deposits and obligations | 125,124,552 | 120,261,151 | 124,482,450 | 3.5% | -0.5% |
| | | | | | |
| Payables from repurchase agreements and securities lending | 19,109,582 | 14,886,829 | 13,608,037 | -8.6% | -28.8% |
| BCRP instruments | 18,547,001 | 14,339,601 | 13,056,240 | -8.9% | -29.6% |
| Repurchase agreements with third parties | 562,581 | 547,228 | 551,797 | 0.8% | -1.9% |
| Due to banks and correspondents | 6,191,543 | 4,946,046 | 7,270,985 | 47.0% | 17.4% |
| Bonds and notes issued | 14,652,059 | 13,833,991 | 14,066,770 | 1.7% | -4.0% |
| Banker’s acceptances outstanding | 776,863 | 743,925 | 697,119 | -6.3% | -10.3% |
| Financial liabilities at fair value through profit or loss | 484,531 | 210,393 | 140,146 | -33.4% | -71.1% |
Other liabilities (3) | 4,690,015 | 4,963,871 | 4,579,331 | -7.7% | -2.4% |
| Total Liabilities | 171,029,145 | 159,846,206 | 164,844,838 | 3.1% | -3.6% |
| | | | | | |
| Net equity | 19,509,998 | 20,988,644 | 22,093,569 | 5.3% | 13.2% |
| Capital stock | 11,024,006 | 11,882,984 | 11,882,984 | 0.0% | 7.8% |
| Reserves | 6,488,968 | 7,298,035 | 7,298,035 | 0.0% | 12.5% |
| Unrealized gains and losses | (583,178) | (1,089,747) | (1,274,918) | 17.0% | 118.6% |
| Retained earnings | 2,580,202 | 2,897,372 | 4,187,468 | 44.5% | 62.3% |
| | | | | | |
| Total Net Equity | 19,509,998 | 20,988,644 | 22,093,569 | 5.3% | 13.2% |
| | | | | | |
| Total liabilities and equity | 190,539,143 | 180,834,850 | 186,938,407 | 3.4% | -1.9% |
| | | | | | |
| Off-balance sheet | 135,953,567 | 131,117,219 | 135,853,514 | 3.6% | -0.1% |
| Total performance bonds, stand-by and L/Cs. | 20,762,191 | 19,490,337 | 20,443,858 | 4.9% | -1.5% |
| Undrawn credit lines, advised but not committed | 79,357,524 | 71,528,880 | 73,712,295 | 3.1% | -7.1% |
| Total derivatives (notional) and others | 35,833,852 | 40,098,002 | 41,697,361 | 4.0% | 16.4% |
(1) Mainly includes intangible assets, other receivable accounts and tax credit.
(2) Mainly includes other payable accounts.
BANCO DE CREDITO DEL PERU
STATEMENT OF INCOME
(S/ thousands, IFRS)
| | Quarter | % change | As of | % change |
| | 3Q21 | 2Q22 | 3Q22 | QoQ | YoY | Sep 21 | Sep 22 | Sep 22 / Sep 21 |
| Interest income and expense | | | | | | | | |
| Interest and dividend income | 1,996,856 | 2,340,804 | 2,772,379 | 18.4% | 38.8% | 5,866,826 | 7,233,399 | 23.3% |
Interest expense (1) | (393,036) | (481,139) | (661,526) | 37.5% | 68.3% | (1,268,129) | (1,557,528) | 22.8% |
| Net interest income | 1,603,820 | 1,859,665 | 2,110,853 | 13.5% | 31.6% | 4,598,697 | 5,675,871 | 23.4% |
| | | | | | | | | |
| Provision for credit losses on loan portfolio | (103,385) | (268,439) | (412,876) | 53.8% | 299.4% | (876,431) | (884,083) | 0.9% |
| Recoveries of written-off loans | 70,441 | 51,155 | 53,547 | 4.7% | -24.0% | 176,274 | 160,827 | -8.8% |
| Provision for credit losses on loan portfolio, net of recoveries | (32,944) | (217,284) | (359,329) | 65.4% | 990.7% | (700,157) | (723,256) | 3.3% |
| | | | | | | | | |
| Risk-adjusted net interest income | 1,570,876 | 1,642,381 | 1,751,524 | 6.6% | 11.5% | 3,898,540 | 4,952,615 | 27.0% |
| | | | | | | | | |
| Other income | | | | | | | | |
| Fee income | 669,583 | 727,644 | 761,968 | 4.7% | 13.8% | 1,921,827 | 2,196,473 | 14.3% |
| Net gain on foreign exchange transactions | 231,547 | 240,387 | 242,395 | 0.8% | 4.7% | 642,810 | 721,520 | 12.2% |
| Net gain (losses) on securities | (30,044) | 112,761 | 132,170 | 17.2% | -539.9% | (118,568) | 335,394 | -382.9% |
| Net gain from associates | 73,843 | 7,421 | 2,958 | -60.1% | -96.0% | 140,762 | 16,080 | -88.6% |
| Net gain (losses) on derivatives held for trading | 4,260 | (16,568) | 15,290 | -192.3% | 258.9% | 47,164 | (11,254) | -123.9% |
| Net gain (losses) from exchange differences | 7,277 | 7,249 | 10,109 | 39.5% | 38.9% | 59,444 | 7,341 | -87.7% |
| Others | 32,642 | 45,276 | 36,792 | -18.7% | 12.7% | 123,716 | 192,818 | 55.9% |
| Total other income | 989,108 | 1,124,170 | 1,201,682 | 6.9% | 21.5% | 2,817,155 | 3,458,372 | 22.8% |
| | | | | | | | | |
| Total expenses | | | | | | | | |
| Salaries and employee benefits | (449,094) | (487,698) | (536,526) | 10.0% | 19.5% | (1,312,078) | (1,525,437) | 16.3% |
| Administrative expenses | (580,194) | (575,071) | (571,621) | -0.6% | -1.5% | (1,421,692) | (1,610,619) | 13.3% |
Depreciation and amortization (2) | (111,360) | (109,824) | (113,129) | 3.0% | 1.6% | (319,816) | (328,812) | 2.8% |
| Other expenses | (37,124) | (46,381) | (43,590) | -6.0% | 17.4% | (130,081) | (133,657) | 2.7% |
| Total expenses | (1,177,772) | (1,218,974) | (1,264,866) | 3.8% | 7.4% | (3,183,667) | (3,598,525) | 13.0% |
| | | | | | | | | |
| Profit before income tax | 1,382,212 | 1,547,577 | 1,688,340 | 9.1% | 22.1% | 3,532,028 | 4,716,298 | 33.5% |
| | | | | | | | - | |
| Income tax | (324,697) | (391,499) | (398,244) | 1.7% | 22.7% | (921,234) | (1,209,863) | 31.3% |
| | | | | | | | | |
| Net profit attributable to BCP Stand-alone | 1,057,515 | 1,156,078 | 1,290,096 | 11.6% | 22.0% | 2,610,794 | 3,506,435 | 34.3% |
BANCO DE CREDITO DEL PERU
SELECTED FINANCIAL INDICATORS
| | Quarter | As od |
| | 3Q21 | 2Q22 | 3Q22 | Sep 21 | Sep 22 |
| Profitability | | | | | |
ROAA (2)(3) | 2.2% | 2.5% | 2.8% | 1.9% | 2.5% |
ROAE (2)(3) | 22.0% | 22.5% | 24.0% | 18.5% | 21.7% |
Net interest margin (2)(3) | 3.57% | 4.29% | 4.83% | 3.44% | 4.33% |
Risk adjusted NIM (2)(3) | 3.49% | 3.79% | 4.01% | 2.91% | 3.78% |
Funding Cost (2)(3)(4) | 0.95% | 1.24% | 1.69% | 1.04% | 1.33% |
| | | | | | |
| Quality of loan portfolio | | | | | |
| IOL ratio | 3.46% | 3.89% | 4.00% | 3.46% | 4.00% |
| NPL ratio | 4.86% | 5.13% | 5.34% | 4.86% | 5.34% |
| Coverage of IOLs | 166.0% | 136.1% | 127.7% | 166.0% | 127.7% |
| Coverage of NPLs | 118.3% | 103.0% | 95.7% | 118.3% | 95.7% |
Cost of risk (5) | 0.11% | 0.69% | 1.14% | 0.77% | 0.76% |
| | | | | | |
| Operating efficiency | | | | | |
Oper. expenses as a percent. of total income - reported (6) | 45.3% | 41.6% | 38.9% | 42.0% | 40.3% |
Oper. expenses as a percent. of av. tot. assets (2)(3)(6) | 2.41% | 2.58% | 2.66% | 2.18% | 2.51% |
(1) Shares outstanding of 12,176 million is used for all periods since shares have been issued only for capitalization of profits.
(2) Ratios are annualized.
(3) Averages are determined as the average of period-beginning and period-ending balances.
(4) The funding costs differs from previously reported due to a methodology change in the denominator, which no longer includes the following accounts: acceptances outstanding, reserves for property and casualty claims, reserve for unearned premiums, reinsurance payable and other liabilities.
(5) Cost of risk: Annualized provision for loan losses / Total loans.
(6) Total income includes net interest income, fee income, net gain on foreign exchange transactions, result on exchange difference and net gain on derivatives. Operating expenses includes Salaries and social benefits, administrative, general and tax expenses and depreciation and amortization.
12.5.5. BCP Bolivia
BCP BOLIVIA
(S/ thousands, IFRS)
| | As of | % change |
| | Sep 21 | Jun 22 | Sep 22 | QoQ | YoY |
| ASSETS | | | | | |
| Cash and due from banks | 2,625,523 | 2,308,217 | 1,984,367 | -14.0% | -24.4% |
| Investments | 1,794,096 | 1,562,065 | 1,548,424 | -0.9% | -13.7% |
| Total loans | 9,919,102 | 9,208,057 | 9,642,982 | 4.7% | -2.8% |
| Current | 9,782,780 | 8,987,381 | 9,411,840 | 4.7% | -3.8% |
| Internal overdue loans | 95,751 | 191,007 | 203,915 | 6.8% | 113.0% |
| Refinanced | 40,572 | 29,669 | 27,227 | -8.2% | -32.9% |
| Allowance for loan losses | (467,583) | (413,446) | (414,697) | 0.3% | -11.3% |
| Net loans | 9,451,520 | 8,794,611 | 9,228,285 | 4.9% | -2.4% |
| Property, plant and equipment, net | 61,986 | 64,017 | 66,016 | 3.1% | 6.5% |
| Other assets | 414,892 | 350,795 | 316,286 | -9.8% | -23.8% |
| Total assets | 14,348,016 | 13,079,705 | 13,143,378 | 0.5% | -8.4% |
| | | | | | |
| LIABILITIES AND NET SHAREHOLDERS' EQUITY | | | | | |
| Deposits and obligations | 12,114,178 | 10,955,468 | 11,173,682 | 2.0% | -7.8% |
| Due to banks and correspondents | 89,697 | 86,639 | 86,986 | 0.4% | -3.0% |
| Bonds and subordinated debt | 191,218 | 178,395 | 101,757 | -43.0% | -46.8% |
| Other liabilities | 1,111,166 | 1,038,527 | 909,268 | -12.4% | -18.2% |
| Total liabilities | 13,506,259 | 12,259,029 | 12,271,692 | 0.1% | -9.1% |
| | | | | | |
| Net equity | 841,757 | 820,677 | 871,686 | 6.2% | 3.6% |
| | | | | | |
| TOTAL LIABILITIES AND NET SHAREHOLDERS' EQUITY | 14,348,016 | 13,079,705 | 13,143,378 | 0.5% | -8.4% |
| | Quarter | % change | As of | % change |
| | 3Q21 | 2Q22 | 3Q22 | QoQ | YoY | Sep 21 | Sep 22 | Sep 22 / Sep 21 |
| Net interest income | 97,603 | 82,086 | 163,563 | 99.3% | 67.6% | 252,688 | 245,649 | -2.8% |
| Provision for loan losses, net of recoveries | (23,161) | (31,509) | (6,342) | -79.9% | -72.6% | 2,373 | (37,851) | n.a |
| Net interest income after provisions | 74,441 | 50,577 | 157,222 | 210.9% | 111.2% | 255,061 | 207,798 | -18.5% |
| Non-financial income | 44,902 | 43,982 | 86,685 | 97.1% | 93.1% | 118,124 | 130,668 | 10.6% |
| Total expenses | (78,514) | (44,296) | (138,413) | 212.5% | 76.3% | (271,242) | (182,709) | -32.6% |
| Translation result | (89) | (41) | (52) | 26.6% | -41.1% | (80) | (94) | 16.9% |
| Income taxes | (17,619) | (33,364) | (71,046) | 112.9% | 303.2% | (52,128) | (104,410) | 100.3% |
| Net income | 23,121 | 16,859 | 34,395 | -104.0% | 48.8% | 49,736 | 51,254 | 3.1% |
| | | | | | | | | |
| Efficiency ratio | 53.0% | 58.0% | 61.3% | 330 bps | 830 bps | 55.9% | 58.6% | 270 bps |
| ROAE | 11.5% | 8.4% | 16.3% | 790 bps | 473 bps | 13.0% | 12.0% | -96 bps |
| L/D ratio | 81.9% | 84.0% | 86.3% | 230 bps | 442 bps | | | |
| IOL ratio | 0.97% | 2.07% | 2.11% | 0 bps | 114 bps | | | |
| NPL ratio | 1.37% | 2.40% | 2.40% | 0 bps | 103 bps | | | |
| Coverage of IOLs | 488.3% | 216.5% | 203.4% | -1310 bps | -28496 bps | | | |
| Coverage of NPLs | 343.0% | 187.4% | 179.4% | -800 bps | -16359 bps | | | |
| Branches | 43 | 45 | 45 | 0 | 2 | | | |
| Agentes | 876 | 1090 | 1177 | 87 | 301 | | | |
| ATMs | 306 | 312 | 311 | -1 | 5 | | | |
| Employees | 1,575 | 1,604 | 1,622 | 18 | 47 | | | |
12.5.6. Mibanco
MIBANCO
(In S/ thousands, IFRS)
| | As of | % change |
| | Sep 21 | Jun 22 | Sep 22 | QoQ | YoY |
| ASSETS | | | | | |
| Cash and due from banks | 1,577,391 | 1,242,267 | 1,869,624 | 50.5% | 18.5% |
| Investments | 1,525,592 | 1,597,228 | 1,771,298 | 10.9% | 16.1% |
| Total loans | 13,288,672 | 14,434,898 | 14,228,231 | -1.4% | 7.1% |
| Current | 12,172,179 | 13,379,071 | 13,213,979 | -1.2% | 8.6% |
| Internal overdue loans | 1,067,142 | 979,685 | 933,425 | -4.7% | -12.5% |
| Refinanced | 49,351 | 76,142 | 80,827 | 6.2% | 63.8% |
| Allowance for loan losses | -1,487,787 | -1,168,604 | -1,083,337 | -7.3% | -27.2% |
| Net loans | 11,800,884 | 13,266,294 | 13,144,894 | -0.9% | 11.4% |
| Property, plant and equipment, net | 145,753 | 136,399 | 132,815 | -2.6% | -8.9% |
| Other assets | 1,035,653 | 823,401 | 689,100 | -16.3% | -33.5% |
| Total assets | 16,085,272 | 17,065,588 | 17,607,731 | 3.2% | 9.5% |
| | | | | | |
| LIABILITIES AND NET SHAREHOLDERS' EQUITY | | | | | |
| Deposits and obligations | 8,620,050 | 8,956,909 | 9,185,353 | 2.6% | 6.6% |
| Due to banks and correspondents | 2,232,497 | 3,014,403 | 3,315,936 | 10.0% | 48.5% |
| Bonds and subordinated debt | 186,677 | 259,436 | 452,100 | 74.3% | 142.2% |
| Other liabilities | 2,803,336 | 2,247,632 | 1,923,119 | -14.4% | -31.4% |
| Total liabilities | 13,842,559 | 14,478,379 | 14,876,508 | 2.7% | 7.5% |
| | | | | | |
| Net equity | 2,242,714 | 2,587,209 | 2,731,223 | 5.6% | 21.8% |
| | | | | | |
| TOTAL LIABILITIES AND NET SHAREHOLDERS' EQUITY | 16,085,272 | 17,065,588 | 17,607,731 | 3.2% | 9.5% |
| | Quarter | % change | As of | % change |
| | 3Q21 | 2Q22 | 3Q22 | QoQ | YoY | Sep 21 | Sep 22 | Sep 22 / Sep 21 |
| Net interest income | 493,183 | 537,262 | 550,121 | 2.4% | 11.5% | 1,355,353 | 1,599,606 | 18.0% |
| Provision for loan losses, net of recoveries | -122,711 | -105,522 | -84,932 | -19.5% | -30.8% | -385,880 | -295,791 | -23.3% |
| Net interest income after provisions | 370,472 | 431,740 | 465,189 | 7.7% | 25.6% | 969,472 | 1,303,815 | 34.5% |
| Non-financial income | 22,207 | 29,708 | 30,844 | 3.8% | 38.9% | 67,098 | 91,172 | 35.9% |
| Total expenses | -269,221 | -290,293 | -291,817 | 0.5% | 8.4% | -809,437 | -870,139 | 7.5% |
| Translation result | 0 | 0 | 0 | 0.0% | 0.0% | 0 | 0 | 0.0% |
| Income taxes | -46,543 | -43,174 | -57,174 | 32.4% | 22.8% | -80,858 | -146,888 | 81.7% |
| Net income | 76,915 | 127,982 | 147,042 | 14.9% | 91.2% | 146,275 | 377,960 | 158.4% |
| | | | | | | | | |
| Efficiency ratio | 49.7% | 50.4% | 49.6% | -74 bps | -7 bps | 55.36% | 50.94% | -450 bps |
| ROAE | 13.9% | 20.3% | 22.1% | 184 bps | 816 bps | 9.16% | 20.09% | 1090 bps |
| ROAE incl. Goowdill | 13.2% | 19.4% | 21.2% | 178 bps | 792 bps | 8.60% | 19.02% | 1040 bps |
| L/D ratio | 154.2% | 161.2% | 154.9% | -626 bps | 74 bps | | | |
| IOL ratio | 8.0% | 6.8% | 6.6% | -23 bps | -147 bps | | | |
| NPL ratio | 8.4% | 7.3% | 7.1% | -19 bps | -127 bps | | | |
| Coverage of IOLs | 139.4% | 119.3% | 116.1% | -322 bps | -2336 bps | | | |
| Coverage of NPLs | 133.3% | 110.7% | 106.8% | -387 bps | -2644 bps | | | |
Branches (1) | 318 | 304 | 297 | -7 | -21 | | | |
| Employees | 9,874 | 9,593 | 9,596 | 3 | -278 | | | |
(1) Includes Banco de la Nacion branches, which in September 21, June 22 and September 22 were 34.
Prima AFP
(In S/ thousands, IFRS)
| | As of | % change |
| | 3Q21 | 2Q22 | 3Q22 | QoQ | YoY |
| Total assets | 796,553 | 694,432 | 734,766 | 5.8% | -7.8% |
| Total liabilities | 257,554 | 268,858 | 278,345 | 3.5% | 8.1% |
| Net shareholders' equity | 538,999 | 425,574 | 456,421 | 7.2% | -15.3% |
| | Quarter | % change | As of | % change |
| | 3Q21 | 2Q22 | 3Q22 | QoQ | YoY | Sep 21 | Sep 22 | Sep 22 / Sep 21 |
| Income from commissions | 94,620 | 98,749 | 93,922 | -4.9% | -0.7% | 289,552 | 285,863 | -1.3% |
| Administrative and sale expenses | (42,006) | (45,786) | (40,561) | -11.4% | -3.4% | (119,296) | (130,147) | 9.1% |
| Depreciation and amortization | (5,845) | (6,247) | (6,449) | 3.2% | 10.3% | (17,310) | (18,910) | 9.2% |
| Operating income | 46,769 | 46,717 | 46,913 | 0.4% | 0.3% | 152,946 | 136,807 | -10.6% |
| Other income and expenses, net (profitability of lace)* | (2,371) | (17,121) | (1,469) | -91.4% | -38.0% | 2,652 | (22,723) | -956.9% |
| Income tax | (13,592) | (16,032) | (14,762) | -7.9% | 8.6% | (45,953) | (43,989) | -4.3% |
| Net income before translation results | 30,806 | 13,563 | 30,681 | 126.2% | -0.4% | 109,646 | 70,095 | -36.1% |
| Translations results | 891 | 529 | 49 | -90.7% | -94.5% | 948 | (838) | -188.3% |
| Net income | 31,697 | 14,092 | 30,730 | 118.1% | -3.0% | 110,594 | 69,257 | -37.4% |
ROAE (1) | 21.4% | 13.5% | 27.9% | 1441 bps | 644 bps | 23.8% | 17.9% | -589 bps |
(*) The net profitability of lace and mutual funds is being presented net of taxes, for which the retroactive change was made (it was presented gross before)
(1) Net shareholders' equity includes unrealized gains from Prima's investment portfolio.
Funds under management
| Funds under management | Jun 22 | % share | Sep 22 | % share |
| Fund 0 | 1,325 | 3.6% | 1,321 | 4.3% |
| Fund 1 | 5,522 | 15.0% | 5,078 | 16.5% |
| Fund 2 | 25,567 | 69.5% | 20,517 | 66.7% |
| Fund 3 | 4,374 | 11.9% | 3,840 | 12.5% |
| Total S/ Millions | 36,789 | 100% | 30,755 | 100% |
Source: SBS.
Nominal profitability over the last 12 months
| | Jun 22 / Jun 21 | Sep 22 / Sep 21 |
| Fund 0 | 2.3% | 3.7% |
| Fund 1 | -8.9% | -8.4% |
| Fund 2 | -7.0% | -8.1% |
| Fund 3 | -2.7% | -7.1% |
AFP commissions
| Fee based on flow | 1.60% | Applied to the affiliates' monthly remuneration. |
| Mixed fee | | | |
| | | | |
| Flow | | 0.18% | Applied to the affiliates' monthly remuneration since June 2017. Feb 17- may 17 =0.87%. |
| | | | |
| Balance | | 1.25% | Applies annualy to the new balance since February 2013 for new affiliates to the system and beginning on June 2013 for old affiliates who have chosen this commission scheme. |
Main indicators
| Main indicators and market share | Prima 2Q22 | System 2Q22 | % share 2Q22 | Prima 3Q22 | System 3Q22 | % share 3Q22 |
| Affiliates | 2,347,956 | 8,529,346 | 27.5% | 2,346,509 | 8,684,144 | 27.0% |
New affiliations (1) | | 144,713 | 0.0% | | 158,592 | 0.0% |
| Funds under management (S/ Millions) | 36,789 | 122,771 | 30.0% | 30,755 | 103,106 | 29.8% |
| Collections (S/ Millions) | 1054 | 3,666 | 28.8% | 982 | 3,641 | 27.0% |
Voluntary contributions (S/ Millions) (3) | 820 | 2,180 | 37.6% | 810 | 2,214 | 36.6% |
RAM (S/ Millions) (2) | 1,468 | 4,733 | 31.0% | 1,409 | 4,538 | 31.1% |
Source: SBS
(1) As of June 2019, another AFP has the exclusivity of affiliations.
(2) Prima AFP estimate: Average of aggregated income for flow during the last 4 months, excluding special collections and voluntary contribution fees.
12.5.8. Grupo Pacifico
GRUPO PACIFICO
(S/ in thousands )
| | As of | % change |
| | Sep 21 | Jun 22 | Sep 22 | QoQ | YoY |
| Total assets | 15,949,391 | 15,229,244 | 15,302,437 | 0.5% | -4.1% |
Invesment on securities (6) | 12,129,220 | 11,573,077 | 11,776,123 | 1.8% | -2.9% |
| Technical reserves | 12,531,003 | 11,707,217 | 11,715,964 | 0.1% | -6.5% |
| Net equity | 1,895,643 | 2,101,532 | 2,104,227 | 0.1% | 11.0% |
| | Quarter | % change | As of | % change |
| | 3Q21 | 2Q22 | 3Q22 | QoQ | YoY | Sep 21 | Sep 22 | Sep 22/ Sep 21 |
| Net earned premiums | 677,204 | 697,921 | 753,089 | 7.9% | 11.2% | 1,972,683 | 2,143,784 | 8.7% |
| Net claims | (517,950) | (492,257) | (478,040) | -2.9% | -7.7% | (1,837,191) | (1,448,803) | -21.1% |
| Net fees | (149,570) | (152,233) | (160,758) | 5.6% | 7.5% | (436,859) | (462,151) | 5.8% |
| Net underwriting expenses | (35,798) | (26,896) | (31,317) | 16.4% | -12.5% | (97,152) | (88,821) | -8.6% |
| Underwriting result | (26,115) | 26,535 | 82,975 | 212.7% | -417.7% | (398,519) | 144,008 | n.a. |
| | | | | | | | | |
| Net financial income | 182,019 | 182,955 | 187,362 | 2.4% | 2.9% | 490,661 | 518,633 | 5.7% |
| | | | | | | | | |
| Total expenses | (111,326) | (118,352) | (123,397) | 4.3% | 10.8% | (324,006) | (363,470) | 12.2% |
| | | | | | | | | |
| Other income | 16,413 | 6,109 | 6,494 | 6.3% | -60.4% | 29,832 | 24,942 | -16.4% |
| Traslations results | 547 | (287) | 1,603 | -657.9% | 193.2% | 1,022 | (4,100) | n.a. |
| EPS business deduction | 12,994 | 17,941 | 17,393 | -3.1% | 33.9% | 45,171 | 49,987 | 10.7% |
| Medical Assistance insurance deduction | (10,426) | (10,329) | (9,999) | -3.2% | -4.1% | (33,211) | (28,019) | -15.6% |
| Income tax | (333) | (3,510) | (3,028) | -13.7% | N/A | (3,761) | (9,222) | 145.2% |
| | | | | | | | | |
| Income before minority interest | 63,773 | 101,063 | 159,402 | 57.7% | 150.0% | (192,812) | 332,759 | n.a. |
| Non-controlling interest | (1,245) | (1,763) | (1,431) | -18.8% | 14.9% | (3,633) | (4,542) | 25.0% |
| | | | | | | | | |
| Net income | 62,529 | 99,300 | 157,972 | 59.1% | 152.6% | (196,445) | 328,217 | n.a. |
| | | | | | | | | |
| Ratios | | | | | | | | |
| Ceded | 16.8% | 14.2% | 15.4% | 120 bps | -140 bps | 16.9% | 17.2% | 30 bps |
Loss ratio (1) | -76.5% | -70.5% | -63.5% | 700 bps | 1300 bps | -93.1% | -67.6% | 2550 bps |
| Fees + underwriting expenses, net / net earned premiums | -27.4% | -25.7% | -25.5% | 20 bps | 190 bps | -27.1% | -25.7% | 140 bps |
| Operating expenses / net earned premiums | -16.4% | -17.0% | -16.4% | 60 bps | 0 bps | -16.4% | -17.0% | -60 bps |
ROAE (2)(3) | 12.6% | 18.6% | 30.1% | 1150 bps | 1750 bps | -20.1% | 16.5% | 3660 bps |
| Return on written premiums | 5.6% | 9.7% | 14.3% | 460 bps | 870 bps | -10.5% | 20.1% | 3060 bps |
Combined ratio of Life (4) | 95.1% | 89.8% | 79.6% | -1020 bps | -1550 bps | 95.1% | 79.6% | -1550 bps |
Combined ratio of P&C (5) | 94.1% | 89.9% | 91.2% | 130 bps | -290 bps | 94.1% | 91.2% | -290 bps |
Equity requirement ratio (7) | 1.19 | 1.18 | 1.15 | -300 bps | -450 bps | 1.19 | 1.15 | -450 bps |
*Financial statements without consolidation adjustments.
(1) Excluding investments in real estate.
(2) Net claims / Net earned premiums.
(3) Includes unrealized gains.
(4) Annualized and average are determined as the average of period beginning and period ending.
(5) (Net claims / Net earned premiums) + Reserves / Net earned premiums) + [(Acquisition cost + total expenses) / Net earned premiums] - (Net Financial Income without real state sales, securities sales, impairment loss and fluctuation / Net earned premiums).
(6) (Net claims / Net earned premiums) + [(Acquisition cost + total expenses) / Net earned premiums].
(7) Support to cover credit risk, market risk and operational risk.
From 1Q15 and on, Grupo Pacifico’s financial statements reflect the agreement with Banmedica (in equal parts) of the businesses of:
| • | private health insurance managed by Grupo Pacifico and included in its Financial Statements in each of the accounting lines; |
| • | corporate health insurance (dependent workers); and |
The businesses described in ii) and iii) are managed by Banmedica, therefore they do not consolidate in Grupo Pacifico’s financial statements. The 50% of net income generated by Banmedica is recorded in Grupo Pacifico’s Income Statement as a gain/loss on investments in subsidiaries.
As explained before, corporate health insurance and medical services businesses are consolidated by Banmedica. The following table reflects the consolidated results from which Grupo Pacifico receives the 50% net income.
Corporate health insurance and Medical services
(S/ in thousands )
| | Quarter | % change | As of | % change |
| | 3Q21 | 2Q22 | 3Q22 | QoQ | YoY | Sep 21 | Sep 22 | Sep 21 / Sep 22 |
| Results | | | | | | | | |
| Net earned premiums | 301,598 | 315,592 | 331,323 | 5.0% | 9.9% | 867,894 | 961,277 | 10.8% |
| Net claims | (259,820) | (266,259) | (276,094) | 3.7% | 6.3% | (748,809) | (818,435) | 9.3% |
| Net fees | (12,836) | (13,395) | (14,323) | 6.9% | 11.6% | (37,377) | (41,389) | 10.7% |
| Net underwriting expenses | (2,566) | (2,505) | (2,652) | 5.9% | 3.4% | (7,856) | (8,420) | 7.2% |
| Underwriting result | 26,376 | 33,434 | 38,253 | 14.4% | 45.0% | 73,853 | 93,033 | 26.0% |
| | | | | | | | | |
| Net financial income | 1,775 | 1,759 | 2,749 | 56.3% | 54.9% | 4,866 | 6,390 | 31.3% |
| Total expenses | (22,725) | (20,251) | (20,826) | 2.8% | -8.4% | (62,613) | (59,948) | -4.3% |
| Other income | (8) | 40 | (2,854) | n.a. | n.a. | (438) | (1,588) | 262.9% |
| Traslations results | 5,087 | 1,784 | 2,046 | 14.7% | -59.8% | 9,477 | (567) | n.a. |
| Income tax | (8,175) | (6,114) | (12,191) | 99.4% | 49.1% | (13,318) | (18,729) | 40.6% |
| | | | | | | | | |
| Net income before Medical services | 2,329 | 10,652 | 7,176 | -32.6% | 208.2% | 11,828 | 18,592 | 57.2% |
| | | | | | | | | |
| Net income of Medical services | 23,575 | 25,076 | 27,598 | 10.1% | 17.1% | 78,264 | 81,134 | 3.7% |
| | | | | | | | | |
| Net income | 25,904 | 35,728 | 34,775 | -2.7% | 34.2% | 90,091 | 99,725 | 10.7% |
12.5.9. Investment Banking & Wealth Management
| Investment Banking and Wealth Management | Quarter | % change | As of | % change |
| S/ 000 | 3Q21 | 2Q22 | 3Q22 | QoQ | YoY | Sep 21 | Sep 22 | Sep 22 / Sep 21 |
| Net interest income | 14,290 | 18,930 | 19,025 | 0.5% | 33% | 60,432 | 57,295 | -5.2% |
| Non-financial income | 217,358 | 146,646 | 177,191 | 20.8% | -18.5% | 609,155 | 503,834 | -17.3% |
| Fee income | 149,029 | 138,468 | 133,374 | -3.7% | -10.5% | 465,560 | 409,428 | -12.1% |
| Net gain on foreign exchange transactions | -3,033 | 12,338 | 15,136 | 22.7% | n.a | 985 | 23,001 | 2235.1% |
| Net gain on sales of securities | 34,790 | -15,406 | 12,747 | n.a | -63.4% | 34,922 | 8,035 | -77.0% |
| Derivative Result | 42,607 | 31,345 | 37,650 | 20.1% | -11.6% | 113,319 | 72,317 | -36.2% |
| Result from exposure to the exchange rate | -10,599 | -28,225 | -29,955 | 6.1% | 182.6% | -23,295 | -33,319 | 43.0% |
| Other income | 4,564 | 8,126 | 8,245 | 1.5% | 80.7% | 17,664 | 24,372 | 38.0% |
Operating expenses (1) | -166,716 | -160,877 | -159,294 | -1.0% | -4.5% | -485,488 | -482,429 | -0.6% |
| Operating income | 64,932 | 4,699 | 36,922 | N/A | -43.1% | 184,099 | 78,700 | -57.3% |
| Income taxes | -9,284 | 273 | -7,928 | N/A | -14.6% | -25,735 | -9,204 | -64.2% |
| Non-controlling interest | 1,537 | 459 | 763 | 66.3% | -50.3% | 3,109 | 1,979 | -36.3% |
| Net income | 54,111 | 4,513 | 28,231 | N/A | -47.8% | 155,255 | 67,517 | -56.5% |
(1) Includes: Salaries and employee’s benefits + Administrative expenses + Assigned expenses + Depreciation and amortization + Tax and contributions + Other expenses.
12.6. Table of calculations
(1) Averages are determined as the average of period-beginning and period-ending balances.
(2) Includes total deposits, due to banks and correspondents, BCRP instruments, repurchase agreements and bonds and notes issued.
(3) Does not include Life insurance business.
(4) Tier 1 = Capital + Legal and other capital reserves + Accumulated earnings with capitalization agreement + (0.5 x Unrealized profit and net income in subsidiaries) - Goodwill - (0.5 x Investment in subsidiaries) + Perpetual subordinated debt (maximum amount that can be included is 17.65% of Capital + Reserves + Accumulated earnings with capitalization agreement + Unrealized profit and net income in subsidiaries - Goodwill).
(5) Includes investment in subsidiaries, goodwill, intangibles and deferred tax that rely on future profitability.
12.7. Glossary of terms
| | Term | | Definition |
| | Government Program Loans ("GP" or "GP Loans") | | Loan Portfolio related to Reactiva Peru and FAE-Mype programs to respond quickly and effectively to liquidity needs and maintain the payment chain. |
| | Structural Loans | | Loan Portfolio excluding GP Loans. |
| | Non-Recurring Events at Interest Income | | Impairment charge (related to the government facility that allowed for deferment of certain installments at zero cost) and subsequent amortization thereof. |
| | Non-Recurring Events at Interest Expenses | | Charges related to the liability management operation at BCP Stand-alone (3Q20 and 1Q21). |
| | Structural Cost of Risk | | Cost of Risk related to the Structural Loans. It excludes, in the numerator, provisions for credit losses on GP loans, and in the denominator, the total amount of GP Loans. |
| | Structural NPL ratio | | NPL Ratio related to Structural Loans. It excludes the impact of GP Loans. |
| | Structural NIM | | NIM related to Structural Loans and Other Interest Earning Assets. It deducts the impact of GP Loans and Non-recurring Events from Interest Income and Interest Expenses. |
| | Structural Funding Cost | | Funding Cost deducting the impact in expenses and funding related to GP Loans and deducting Non-recurring Events from Interest Expenses |
69