Exhibit 99.1

 | | | Earnings Release 1Q / 2023 |
Table of Contents
 | Operating and Financial Highlights | 03 | |
| Senior Management Quotes | 05 | |
| Fourth Quarter 2023 Earnings Conference Call | 06 | |
| Summary of Financial Performance and Outlook | 07 | |
| Financial Overview | 12 | |
| Credicorp’s Strategy Update | 13 | |
| Analysis of 1Q23 Consolidated Results | ||
| 01 | Loans and Portfolio Quality | 16 | |
| 02 | Deposits | 24 | |
| 03 | Interest Earning Assets and Funding | 26 | |
| 04 | Net Interest Income | 27 | |
| 05 | Provisions | 30 | |
| 06 | Other Income | 33 | |
| 07 | Insurance Underwriting Results | 36 | |
| 08 | Operating Expenses | 39 | |
| 09 | Operating Efficiency | 41 | |
| 10 | Regulatory Capital | 42 | |
| 11 | Economic Outlook | 44 | |
| 12 | Appendix | 48 | |
2
| | | Earnings Release 1Q / 2023 |
| Operating and Financial Highlights |
Credicorp Ltd. Reports First Quarter 2023 Financial and Operating Results
ROE of 18.7% Driven by Resilient Core Income
Cost of Risk Stable Sequentially Remaining High impacted by Social and Climatic Events in Peru
Lima, Peru – May 5, 2023 – Credicorp Ltd. (“Credicorp” or “the Company”) (NYSE: BAP | BVL: BAP), the leading financial services holding company in Peru with a presence in Chile, Colombia, Bolivia and Panama today reported its unaudited results for the quarter ended March 31, 2023. Financial results are expressed in Soles and are presented in accordance with International Financial Reporting Standards (IFRS). Effective 1Q23, the Company reports under IFRS 17 accounting standards for insurance contracts. While the impact on consolidated net income is not material, the reclassification of line items in the P&L has impacted the efficiency ratio. To facilitate comparability, figures for 1Q22 and 4Q22 have been restated to reflect IFRS 17.
1Q23 OPERATING AND FINANCIAL HIGHLIGHTS
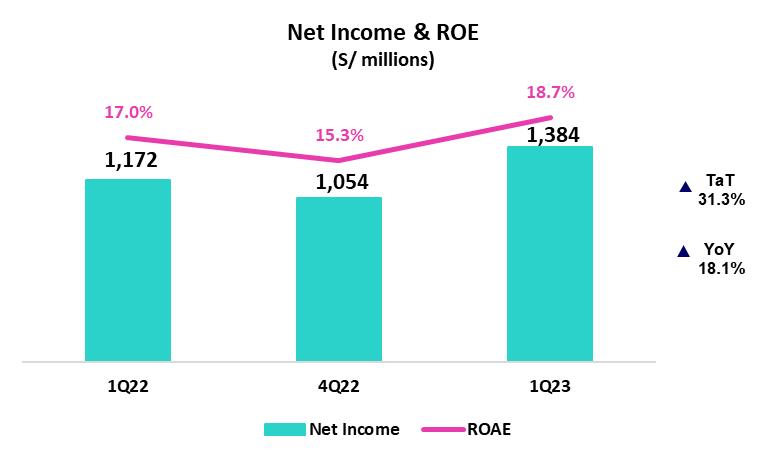
| • | Net Income attributable to Credicorp increased 18.1% YoY to stand at S/1,384 million, driven by an improvement in performance in Universal Banking and strong results in the Insurance business. ROAE rose to 18.7% in the quarter, up from 17.0% in 1Q22 and seasonally higher than the 15.3% reported in 4Q22. |
| • | Structural Loans, measured in average daily balances, declined 0.7% QoQ, primarily due to seasonality in Wholesale Banking, but increased 9.7% YoY led by growth in Retail Banking at BCP and by Mibanco. |
| • | Total Deposits at quarter-end increased 1.1% QoQ and 0.5% YoY to S/148,623 million, where the high interest rate backdrop continued to drive migration from Demand and Saving Deposits to Time Deposits. Low-cost Deposits represented 54.7% of total funding. |
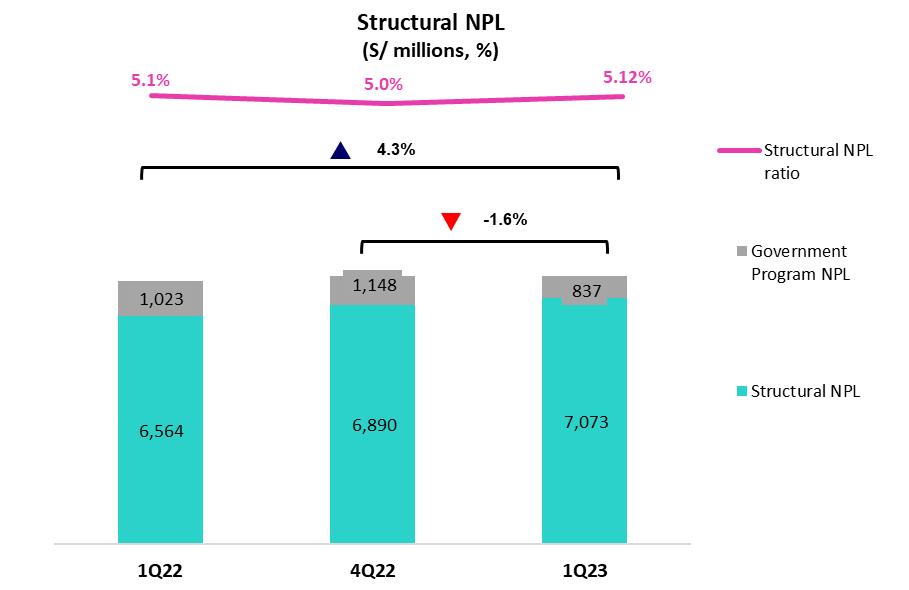
| • | The Structural NPL ratio increased 17 bps QoQ to 5.12%, driven by an increase coin the volume of the overdue portfolio in Wholesale Banking, which was already provisioned given that our models anticipate deterioration; Mibanco, which was impacted by social and climatic events in an adverse macroeconomic environment; and Consumer and Credit Card loans, after higher-risk segments were targeted in 2022. |
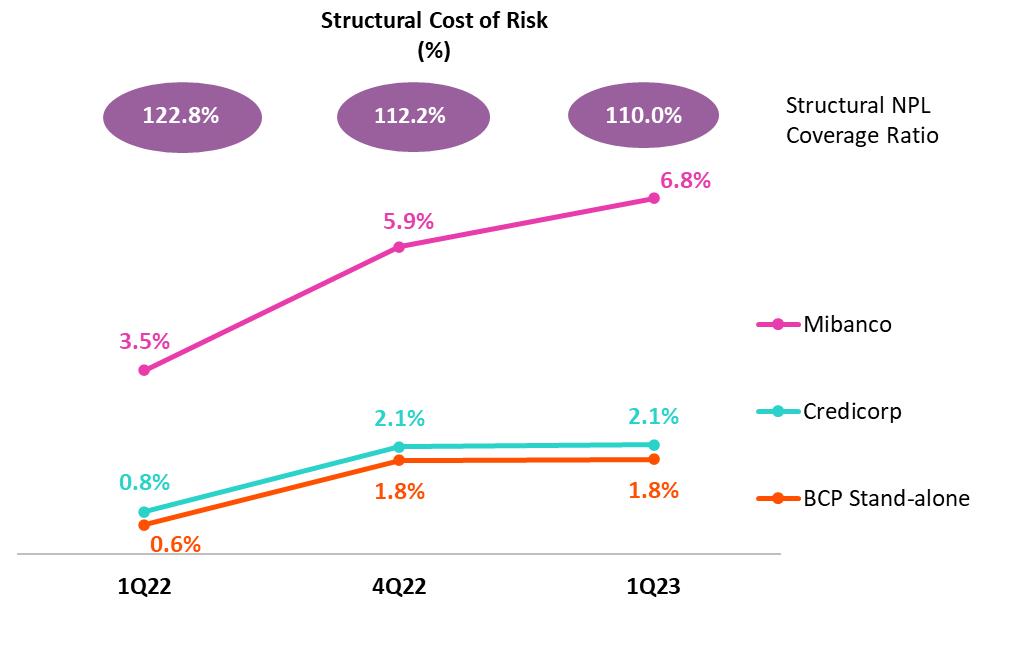
| • | Structural Provisions increased 1.3% QoQ, driven by Retail Banking at BCP and Mibanco and, partially offset by Wholesale Banking. At BCP, provisions in retail banking rose, reflecting a downturn in customer payment as well as the impacts of an update to macroeconomic outlook variables such as inflation, interest rates and GDP growth. Mibanco increased provisions due to social and climate events. In this context, stringent origination standards were applied in specific consumer segments at BCP, and the risk appetite was adjusted in a number of geographies and segments at Mibanco. The Structural Cost of Risk remained stable QoQ while Structural NPL Coverage dropped to 110.0%, which reflects an uptick in the weight of collateralized refinanced wholesale loans. |
| • | Core Income declined 1.4% QoQ but increased 18.9% YoY reflecting structural loan growth and a high interest rate environment. Net Interest Income (NII) remained stable QoQ and was up 28.8% YoY, while FX Volumes and Fees contracted in both periods. On the back of higher interest rates, the Net Interest Margin increased 9 bps QoQ and 138 bps YoY to stand at 5.84%. |
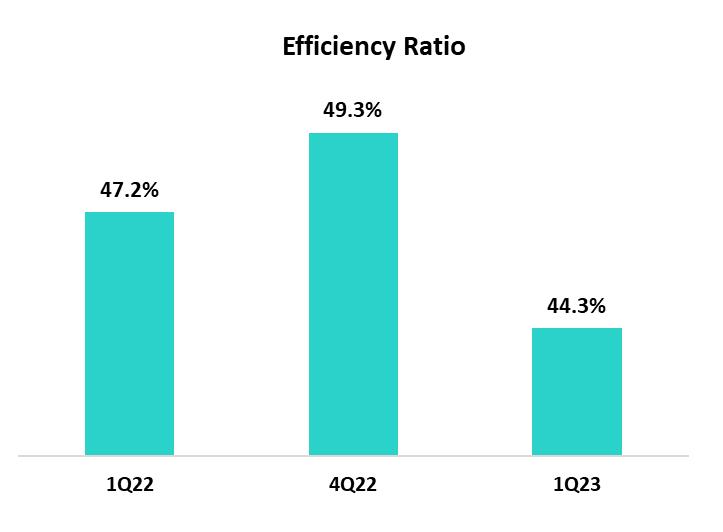
| • | The Efficiency Ratio, which has been restated under IFRS17, improved 290 bps in the QoQ comparision and stood at 44.3%. This improvement was mainly driven by an uptick in operating income at BCP stand-alone and Pacifico, which more than offset the growth reported for expenses in a context marked by on-going investment in disruptive initiatives and digital transformation. |
3
| | | Earnings Release 1Q / 2023 |
| Operating and Financial Highlights |
| • | The CET1 Ratio for BCP Stand-Alone at quarter-end was 11.9%, up 30 bps YoY but down 66 bps QoQ which reflected a dividend declaration this quarter, CET1 at Mibanco rose 38 bps YoY to stand at 16.4% but declined 8 bps QoQ. |
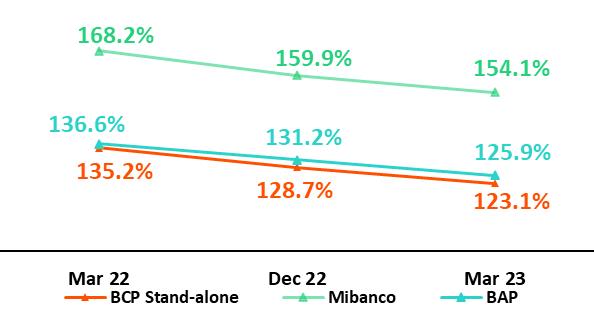
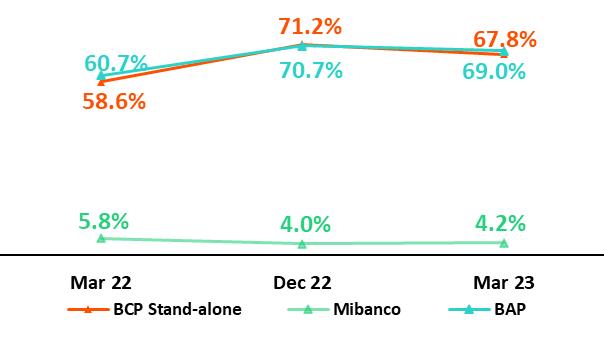
| • | At BCP stand-alone, 30-day local currency LCR currency stood at 154.1% under regulatory standards and 138.7% based on more stringent internal standards, while USD 30-day LCR stood at 203.7% and 123.1% under regulatory and more stringent internal standards, respectively. |
| • | Credicorp maintains a diversified, liquid investment portfolio with investment portfolios Held to Maturity and Available for Sale accounting for 5% and 15% of Interest Earnings Assets, respectively. |
| • | Advancing our Strategic Initiatives: Yape continues to drive financial inclusion and topped 8.8 million monthly active users (MAU) by quarter-end. Monthly income per MAU continues to increase and reached S/1.8 in 1Q23. We believe Yape is on track to reach cashflow breakeven in 2024 |
| • | On the ESG front, we recently added two new members to our Board and increased the participation of women to 1/3; maintained the independence of the majority of members; and added expertise in digital transformation and fintech innovation. We also defined our corporate environmental strategy and roadmap, which includes developing capabilities to measure our portfolio carbon footprint; promoting green financing; and fine-tuning management of environmental risks. Implementation will begin in 2Q23. More information can be found in our recently published 2022 Annual and Sustainability Report. |
| • | On April 27, the Board of Directors declared a cash dividend of S/25.00 per share equivalent to a total payment of S/ 2,359,557,925 to be paid out on June 9th, 2023. |
4
| | | Earnings Release 1Q / 2023 |
Senior Management Quotes |
SENIOR MANAGEMENT QUOTES
5
| | | Earnings Release 1Q / 2023 |
| Senior Management Quotes |
FIRST QUARTER 2023 EARNINGS CONFERENCE CALL
Date: Monday May 8th, 2023
Time: 10:30 am ET (9:30 am Lima, Peru time)
Hosts: Gianfranco Ferrari - CEO, Cesar Rios - Chief Financial Officer, Francesca Raffo – Chief Innovation Officer, Reynaldo Llosa - Chief Risk Officer, Cesar Rivera - Head of Insurance and Pensions, Carlos Sotelo – Mibanco CFO, and the Investor Relations Team.
To pre-register for the listen-only webcast presentation use the following link:
https://dpregister.com/DiamondPassRegistration/register?confirmationNumber=10177940&linkSecurityString=f920c53eb4
Callers who pre-register will be given a conference passcode and unique PIN to gain immediate access to the call and bypass the live operator. Participants may pre-register at any time, including up to and after the call start time.
Those unable to pre-register may dial in by calling:
1 844 435 0321 (U.S. toll free)
1 412 317 5615 (International)
Conference ID: Credicorp Conference Call
The webcast will be archived for one year on our investor relations website at:
https://credicorp.gcs-web.com/events-and-presentations/upcoming-events
For a full version of Credicorp´s Fourth Quarter 2022 Earnings Release, please visit:
https://credicorp.gcs-web.com/financial-information/quarterly-results
6
| | | Earnings Release 1Q / 2023 |
Summary of Financial Performance and Outlook |
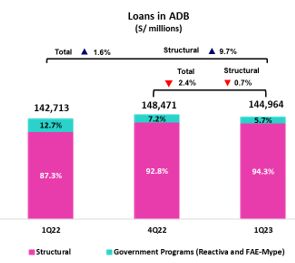
Loans (in Average Daily Balances)
Structural balances, measured in ADB, dropped 0.7% QoQ to stand at S/136,758 million. This decrease was fueled mainly by Wholesale Banking at BCP and was partially offset by Retail Banking at BCP and by Mibanco.
YoY, structural loans grew 9.7%, driven mainly by Retail Banking via Consumer and Mortgage and secondarily by Wholesale Banking, via Corporate banking.
The Government Loan Portfolio (GP) represented 5.7% of the total portfolio in average daily balances (4.9% in quarter-end balances).
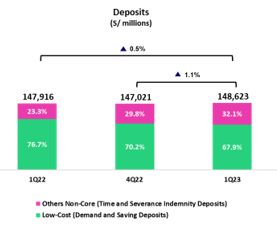
Deposits
Our deposit base measured in quarter-end balances increased 1.1% QoQ. This growth was mainly attributable to growth in Time Deposits at BCP, which was concentrated in FC and in line with higher interest rates.
In the YoY comparison, the deposit base increased 0.5%. The migration from Low-cost Deposits to Time Deposits in both LC and FC led this evolution and reflected the impact of rising rates.
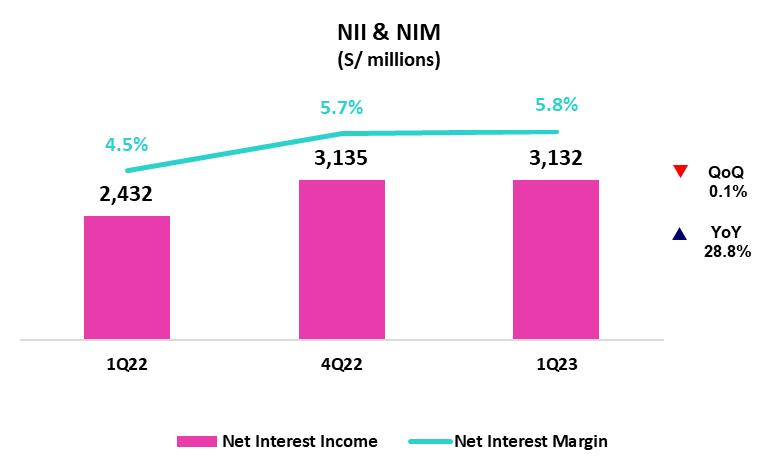
Net interest income (NII) and Margin (NIM)
NII remained relatively stable QoQ and stood at S/3,132 million. Growth in Income was spurred by the recomposition of the loan portfolio mix and by repricing of Available Funds, while the uptick in expenses reflected the migration from Low-Cost Deposits to Time Deposits. In this context, growth in the IEA yield was similar to the expansion registered by the Funding cost. NIM1 stood at 5.84%.
YoY, Net interest income rose 28.8%, driven primarily by the evolution of rates in both currencies and by growth in the LC loan portfolio.
(1) For further details on the new NIM calculation due to IFRS17, please refer to Annex 12.1.8
7
| | | Earnings Release 1Q / 2023 |
Summary of Financial Performance and Outlook |
Structural Portfolio Quality and Cost of Risk (CofR)
QoQ, the balance of the structural NPL portfolio rose 2.7%. Growth in the NPL volume was concentrated in (i) Wholesale Banking, due to an increase in overdue loans, particularly in the Construction sector (ii) Mibanco, attributable to the negative impact of social protests and (iii) Consumer and Credit Card, which reflects the impact of penetration of higher-risk segments. In this context, the structural NLP ratio stood at 5.12% (+17 bps) at the end of 1Q23.
YoY, the structural NPL volume rose 7.8%, driven by Wholesale Banking, Consumer and Credit Cards.
The structural CofR increased 4 bps QoQ, spurred by an uptick in provisions in (i) SME at BCP, due to a deterioration in payment behavior after the bank incurred in higher-risk segments (ii) Individuals, attributable to a deterioration in payment behavior in Consumer and Credit Cards due to the reason outlined above. (iii) Mibanco, due to the negative impact of social protests in the south and intense rains in the north. In this context, the structural CofR stood at 2.10%.
YoY, the structural CofR rose significantly (+128 bps), in line with growth in provisions. This increase was led by Individuals and Mibanco Due to a deterioration in payment behavior and a particularly low provision base in 1Q22. Provisions for SMEs continue at high levels, despite a YoY improvement, in line with portfolio deterioration.
The structural NPL coverage ratio continues to follow a downward trend and stood at 110.0% in 1Q23.
8
| | | Earnings Release 1Q / 2023 |
Summary of Financial Performance and Outlook |
Other income
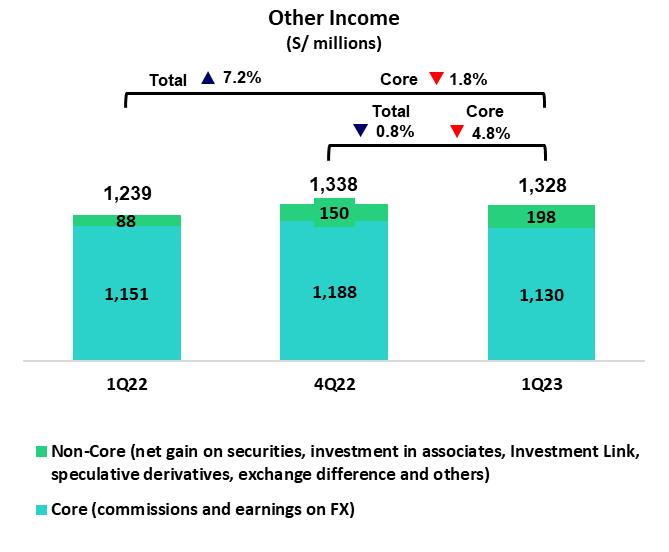
Other Core Income (Commissions + Gains on FX transactions) fell 4.8% QoQ and 1.8% YoY due to a drop in the net gain on FX transactions. The aforementioned drop QoQ and YoY reflects a seasonal effect on transaction volumes and income from the net gain on foreign exchange transactions at BCP Stand-alone. QoQ and YoY, fee income decreased due to the elimination of inter-plaza fees in Universal Banking.
Other Non-core income1 increased 31.4% QoQ, which reflected the impact of a sale of a judicial portfolio. YoY, growth of 124.6% was driven by an uptick in the Net gain on securities.
(1) For more details regarding the content of this grouping, please refer to Annex 12.1.8
Insurance Underwriting Result
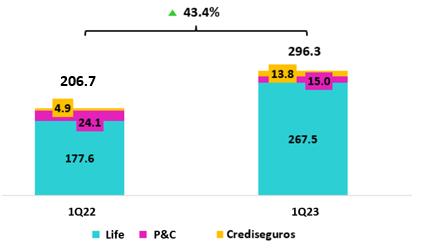
The Insurance Underwriting Result1 rose 43.4% YoY. This evolution was mainly attributable to the Life business, which registered an improvement due to an uptick in written premiums in D&S and Credit Life. The P&C business reported a drop in its result, which reflects an uptick in claims, particularly in P&C Risks and Cars.(1) For more details regarding the new composition of Insurance Underwriting Result to reflect IFRS17, please refer to Annex 12.1.8
9
| | | Earnings Release 1Q / 2023 |
Summary of Financial Performance and Outlook |
Efficiency
In 1Q23, the Efficiency ratio1 stood at 44.3%. This evolution represented an improvement of 290 bps with regard to 1Q22 and reflected an uptick in operating income at BCP and Pacífico.
(1) For more details regarding the new calculation of the Efficiency ratio due to IFRS17, please refer to Annex 12.1.8
Net Income attributable to Credicorp
In 1Q23, net income attributable to Credicorp was S/1,384 million, up +31.3% QoQ and +18.1% YoY. With these results, net shareholders’ equity was S/30,360 million (+4.7% QoQ). In this scenario, ROE stood at 18.7%.
Contributions* and ROE by subsidiary in 1Q23
(S/ millions)
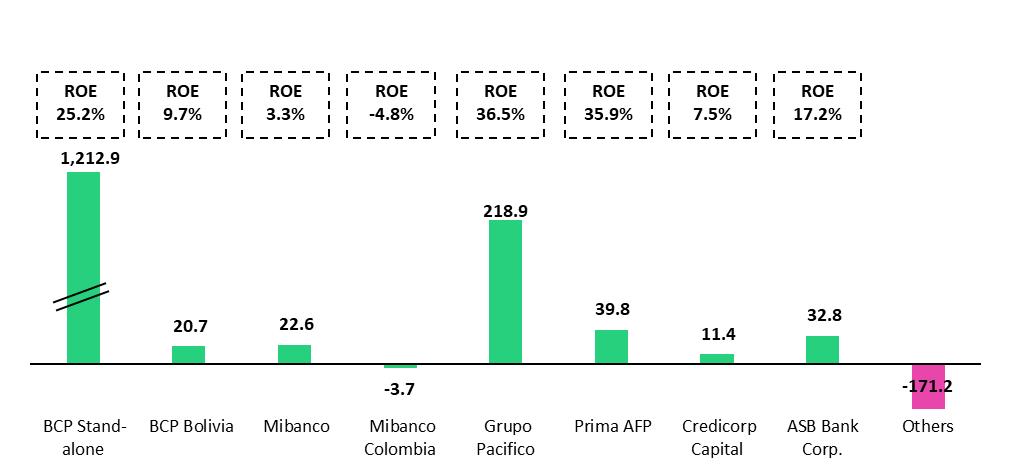
*Contributions to Credicorp reflect eliminations for consolidation purposes (eliminations for transactions among Credicorp’s subsidiaries or between Credicorp and its subsidiaries).
- At BCP Stand Alone, the figure is lower than net income because it does not include gains on investments in other Credicorp subsidiaries (Mibanco).
- At Mibanco, the figure is lower than net income because Credicorp owns 99.924% of Mibanco (directly and indirectly).
- The contribution of Grupo Pacífico presented here is higher than the earnings reported for Pacífico Seguros because it includes 100% of Crediseguros (including 48% under Grupo Credito).
10
| | | Earnings Release 1Q / 2023 |
Summary of Financial Performance and Outlook |
11
| | | Earnings Release 1Q / 2023 |
Financial Overview |
| Credicorp Ltd. | Quarter | % change | |||
| S/ 000 | 1Q22 | 4Q22 | 1Q23 | QoQ | YoY |
| Net interest, similar income and expenses | 2,431,707 | 3,134,778 | 3,132,089 | -0.1% | 28.8% |
| Provision for credit losses on loan portfolio, net of recoveries | (257,590) | (730,681) | (726,998) | -0.5% | 182.2% |
| Net interest, similar income and expenses, after provision for credit losses on loan portfolio | 2,174,117 | 2,404,097 | 2,405,091 | 0.0% | 10.6% |
| Total other income | 1,239,398 | 1,338,227 | 1,328,064 | -0.8% | 7.2% |
| Insurance underwriting result | 206,667 | 211,594 | 296,341 | 40.1% | 43.4% |
| Total other expenses | (1,874,519) | (2,398,955) | (2,121,697) | -11.6% | 13.2% |
| Profit (loss) before income tax | 1,745,663 | 1,554,963 | 1,907,799 | 22.7% | 9.3% |
| Income tax | (546,000) | (476,236) | (493,466) | 3.6% | -9.6% |
| Net profit (loss) | 1,199,663 | 1,078,727 | 1,414,333 | 31.1% | 17.9% |
| Non-controlling interest | 27,786 | 24,231 | 30,060 | 24.1% | 8.2% |
| Net profit (loss) attributable to Credicorp | 1,171,877 | 1,054,496 | 1,384,273 | 31.3% | 18.1% |
| Net profit (loss) / share (S/) | 14.69 | 13.22 | 17.36 | 31.3% | 18.1% |
| Loans | 144,621,513 | 148,626,374 | 145,165,713 | -2.3% | 0.4% |
| Deposits and obligations | 147,915,964 | 147,020,787 | 148,623,300 | 1.1% | 0.5% |
| Net equity | 26,818,054 | 28,997,731 | 30,359,898 | 4.7% | 13.2% |
| Profitability | |||||
Net interest margin (1) | 4.46% | 5.75% | 5.84% | 9 bps | 138 bps |
| Risk-adjusted Net interest margin | 4.01% | 4.45% | 4.54% | 9 bps | 53 bps |
Funding cost (2) | 1.32% | 2.35% | 2.61% | 26 bps | 129 bps |
| ROAE | 17.0% | 15.3% | 18.7% | 340 bps | 170 bps |
| ROAA | 1.9% | 1.9% | 2.3% | 40 bps | 40 bps |
| Loan portfolio quality | |||||
Internal overdue ratio (3) | 4.06% | 4.00% | 3.99% | -1 bps | -7 bps |
| Internal overdue ratio over 90 days | 3.06% | 3.11% | 3.02% | -9 bps | -4 bps |
NPL ratio (4) | 5.25% | 5.41% | 5.45% | 4 bps | 20 bps |
Cost of risk (5) | 0.71% | 1.97% | 2.00% | 3 bps | 129 bps |
| Coverage ratio of IOLs | 140.7% | 132.5% | 136.7% | 420 bps | -400 bps |
| Coverage ratio of NPLs | 108.9% | 97.9% | 100.1% | 220 bps | -880 bps |
| Operating efficiency | |||||
Efficiency ratio (6) | 47.2% | 49.3% | 44.3% | -500 bps | -290 bps |
| Operating expenses / Total average assets | 2.98% | 3.76% | 3.43% | -33 bps | 45 bps |
| Capital adequacy - BCP Stand-alone | |||||
Global Capital ratio (7) | 15.79% | 14.43% | 14.93% | 50 bps | -86 bps |
Tier 1 ratio (8) | 10.74% | 10.02% | 10.74% | 72 bps | 0 bps |
Common equity tier 1 ratio (9) (11) | 11.63% | 12.59% | 11.93% | -66 bps | 30 bps |
| Capital adequacy - Mibanco | |||||
Global Capital ratio (7) | 15.61% | 14.69% | 14.79% | 10 bps | -82 bps |
Tier 1 ratio (8) | 13.24% | 12.38% | 12.48% | 10 bps | -76 bps |
Common equity tier 1 ratio (9) (11) | 14.91% | 16.10% | 16.25% | 15 bps | 134 bps |
| Employees | 36,202 | 36,970 | 37,166 | 0.5% | 2.7% |
| Share Information | |||||
| Issued Shares | 94,382 | 94,382 | 94,382 | 0.0% | 0.0% |
Treasury Shares (10) | 14,862 | 14,849 | 14,887 | 0.3% | 0.2% |
| Outstanding Shares | 79,520 | 79,533 | 79,495 | 0.0% | 0.0% |
(1) Net Interest Margin = Net Interest Income (Excluding Net Insurance Financial Expenses) / Average Interest Earning Assets
(2) Funding Cost = Interest Expense (Does not include Net Insurance Financial Expenses) / Average Funding
(3) Internal Overdue Loans: includes overdue loans and loans under legal collection, according to our internal policy for overdue loans. Internal Overdue Ratio: Internal overdue loans / Total loans
(4) Non-performing loans (NPL): Internal overdue loans + Refinanced loans. NPL ratio: NPL / Total loans.
(5) Cost of risk = Annualized provision for loan losses, net of recoveries / Total loans.
(6) Efficiency Ratio = (Salaries and employee benefits + Administrative expenses + Depreciation and amortization + Association in participation) / (Net interest, similar income and expenses + Fee Income + Net gain on foreign exchange transactions + Net Gain From associates + Net gain on derivatives held for trading + Result on exchange differences + Insurance Underwriting Result)
(7) Regulatory Capital / Risk-weighted assets (legal minimum = 10% since July 2011).
(8) Tier 1 = Capital + Legal and other capital reserves + Accumulated earnings with capitalization agreement + (0.5 x Unrealized profit and net income in subsidiaries) - Goodwill - (0.5 x Investment in subsidiaries) + Perpetual subordinated debt (maximum amount that can be included is 17.65% of Capital + Reserves + Accumulated earnings with capitalization agreement + Unrealized profit and net income in subsidiaries - Goodwill).
(9) Common Equity Tier I = Capital + Reserves – 100% of applicable deductions (investment in subsidiaries, goodwill, intangibles and net deferred taxes that rely on future profitability) + retained earnings + unrealized gains.
Adjusted Risk-Weighted Assets = Risk-weighted assets - (RWA Intangible assets, excluding goodwill, + RWA Deferred tax assets generated as a result of temporary differences in income tax, in excess of 10% of CET1, + RWA Deferred tax assets generated as a result of past losses).”
(10) Consider shares held by Atlantic Security Holding Corporation (ASHC) and stock awards.
(11) Common Equity Tier I calculated based on IFRS Accounting.
12
| | | Earnings Release 1Q / 2023 |
Credicorp’s Strategy Update |
Credicorp Strategy
Credicorp is advancing in its execution of a long-term strategy that focuses on three priorities: accelerating digital transformation and innovation; ensuring with have the best talent in place; and integrating sustainability at the core of our businesses.
On June 20, 2023, we will hold Credicorp’s Investor Day in New York through a hybrid format. Senior Management will present relevant advances and provide details on how each business leverages its synergies and Credicorp’s new capacities to strengthen the Group’s sustainable growth.
The following link contains details on this event https://www.credicorpday.com/
Main KPIs of Credicorp’s Strategy
Experience  | Efficiency  | Growth  |
Traditional Business Transformation (1) | Subsidiary | 1Q22 | 4Q22 | 1Q23 | |
| Day to Day | |||||
Digital monetary transactions (2) | BCP | 52% | 65% | 69% | |
| Transactional cost by unit | BCP | 0.15 | 0.08 | 0.08 | |
Disbursements through leads (3) | Mibanco | 77% | 76% | 77% | |
Disbursements through alternative channels (4) | Mibanco | 46% | 45% | 43% | |
Mibanco Productivity (5) | Mibanco | 28.8 | 25.9 | 28.0 | |
| Cashless | |||||
Cashless transactions (6) | BCP | 36% | 48% | 48% | |
| Mobile Banking rating | BCP | 4.3 | 3.7 | 3.7 | |
| Digital Acquisition | |||||
Digital sales (7) | BCP | 50% | 61% | 48% | |
(1) Figures for March 2022, December 2022, and March 2022
(2) Retail Monetary Transactions conducted through Retail Banking, Internet Banking, Yape and Telecredito/Total Retail Monetary Transactions in Retail Banking.
(3) Disbursements generated through leads/Total disbursements.
(4) Disbursements conducted through alternative channels/Total disbursements.
(5) Number of loans disbursed/ Total relationship managers.
(6) Amount transacted through Mobile Banking, Internet Banking, Yape y POS/ Total amount transacted through Retail Banking.
(7) Units sold by Retail Banking through digital channels/ Total number of units sold by Retail Banking.
13
| | | Earnings Release 1Q / 2023 |
Credicorp’s Strategy Update |
Disruptive Initiatives: Yape
At the end of 1Q23, Yape had more than 12.3 million users, 71% of whom made transactions at least once a month. Additionally, 63% of Yape’s users utilize a BCP savings account to channel payments and 31%, Yapecard. The remaining 6% use Yape’s partnership platforms with Mibanco, Banco de la Nación and different Municipal Saving Banks. As of 2Q23, Yape users will be able to make transfers to users of other digital wallets that coexist in the Peruvian ecosystem.
Yape continues to grow by focusing on three main pillars:
| • | Be the main payment venue in the country: |
As part of this first pillar, Yape has launched four major initiatives:
| o | Mobile top-offs in November 2021. In 1Q23, Yape users purchased more than 30.4 million top-offs. This represented S/10.5 million in income for Yape last quarter. |
| o | QR payments through the main payment gateways since July 2022. In 1Q23, the total volume of QR transactions stood at 8.4 million and represented a total transaction amount of S/280 million. These payments represented 9% of the payments made through POS at BCP. |
| o | Payment buttons in October 2022. Yape clients can use this functionality to make direct payments through the web pages of affiliated establishments. In 1Q23, 668 thousand transactions were conducted through this functionality for a total transaction amount of S/41.6 million. |
| o | Service payments in January 2023. With this new functionality, Yape clients can pay receipts for electricity, water, gas and monthly telephone plans, among others. By the end of 2023, Yape users had conducted a total of 647 thousand transactions through this new functionality, which represented a total transaction amount of S/39 million. |
| • | Be present in the daily lives of all Yaperos: |
In September 2022, we launched Yape Promos, a functionality that offers Yape clients special discounts at affiliated establishments. In 1Q23, 476 thousand transactions were conducted through Yape Promos, which represented a total transaction amount of S/9.8 million.
| • | Provide solutions to Yaperos’ financial needs: |
Yape launched a Microloan functionality at the end of August 2022. In 1Q23, 148 thousand disbursements were made for a total of S/33.5 million. Additionally, thanks to data analysis, Yape has begun to derive Yaperos with larger credit needs to other channels for a complete credit risk assessment.
| Disruptive Initiatives: Yape | 1Q22 | 4Q22 | 1Q23 | |
| Day to Day | ||||
% Microbusiness users (1) | 19% | 19% | 19% | |
| Monthly Mobile Top-offs (thousands) | 6,190 | 26,216 | 30,399 | |
| Cashless | ||||
| Users (millions) | 9.1 | 11.9 | 12.3 | |
% of Users that are BCP Clients (2) | 63% | 63% | 66% | |
% of Yapecard Users (3) | 34% | 34% | 31% | |
Active Users (millions) (4) | 5.1 | 8.2 | 8.8 | |
% Users who are active monthly users (5) | 56% | 70% | 71% | |
| No. of transactions a quarter (millions) | 177.9 | 399.5 | 480.3 | |
| Monthly transaction quarterly (millions) | 10,698 | 20,845 | 24,046 | |
Monthly transactions by Active Yapero (6) | 13.6 | 19.6 | 20.3 | |
(1) Yape users that are Microbusinesses/ Total Yape Users
(2) BCP clients that are Yape users/ Total Yape Users
(3) Yapecard Users / Total Yape Users
(4) Yape users that have conducted at least one transaction in the last month
(5) Yape users that have conducted at least one transaction in the last month/Total Yape users
(6) Number of Yape users/ Active users
14
| | | Earnings Release 1Q / 2023 |
Credicorp’s Strategy Update |
Integrating sustainability in our businesses
For more information about our sustainability strategy, program and initiatives, please review the following documents:
“Sustainability Strategy 2020-25” and “Annual and Sustainability Report 2022.” Noteworthy milestones hit in the first quarter of 2023 in the framework of the Sustainability Program include:
Governance Front – Strengthening our governance structure
| • | Two new members joined the board; women’s participation on the Board increased to one third; the majority of the Board continues to be independent and now has more members with expertise in digital innovation and transformation. |
| • | The holding published its Annual and Sustainability Report 2022, which was developed with GRI and SASB standards. An in-depth Materiality Analysis was conducted in 2022, which contemplated identifying priority issues to be included in the Sustainability Report; validating or adjusting our strategy; and aligning our management with the issues prioritized by our stakeholders. |
| • | On the Asset Management front, we published an update of the Corporate Policy for Responsible and Sustainable Investments and developed Guidelines for Responsible and Sustainable Investments for Listed Companies, which currently includes corporate fixed income and equity investments. Credicorp Capital was awarded Euromoney’s Award of Excellence in the category of Best ESG Investment Team in Wealth Management in Latam. |
Environmental Front – Driving environmental sustainability from the financial sector
| • | In line with our commitment to become carbon-neutral with regard to own emissions by 2032, we completed the measurement and auditing of the carbon footprints of Credicorp’s subsidiaries in 2022. |
| • | In terms of our ESG risk management framework, we continued to apply questionnaires to clients in prioritized sectors to improve the identification and measurement of environmental risks. In 2022, 85 clients were assessed. Additionally, we set up guidelines to initiate relations with relevant issuers for the investment portfolio. |
| • | The environmental strategy was approved, which is equipped with plans of action to 2025 at the corporate level and for 7 of Credicorp’s main subsidiaries. This effort includes a strategy associated with measuring the portfolio’s emissions; exploring other relevant environmental issues in the countries in which we operate; identifying opportunities for growth in products and services, among others. Additionally, we developed a specific strategy for wholesale banking at BCP to capture opportunities for financial products and services within 4 priority sectors. |
Social Front – Expanding financial inclusion and educating about finance and entrepreneurship
Financial Inclusion:
| • | Credicorp presented its study on gender gaps in financial inclusion based on the Financial Inclusion Index 2022, which was conducted in the five countries in which Credicorp operates. According to the study, the gender gap narrowed moderately in 2022. |
| • | Yape financially included 100 thousand people this quarter, reaching an accumulated total of 1.1 million affiliates. Additionally, Yape affiliated 1.5 thousand microbusinesses within Yape’s ecosystem. BCP financially included 7 thousand micro, small and medium businesses this quarter through working capital loans (132 thousand clients financially included in 2022) and invoice discounting (1.7 thousand clients financially included in 2022). |
| • | At Pacífico, we continued to make headway in our commitment to financial inclusion through our insurance services and issued a total of 2.7 million inclusive policies by quarter-end. |
Financial Education:
| • | We continue to focus on promoting financial education through all of our subsidiaries. At BCP, more than 310 thousand people have participated in our financial education programs. At BCP Bolivia, the number of participants topped 51 thousand while Pacífico Seguros and Prima registered a total count of 400 thousand and 60 thousand participants respectively. |
| • | Mibanco has entered into educational partnerships with Fundación Oli and Socios en Salud to reach individuals at the base of the economic pyramid. Additionally, the bank worked with the Ministry of Production to roll out on-site workshops, webinars and fairs for microentrepreneurs throughout the country. In 2022, more than 247 thousand entrepreneurs benefitted from the tools and knowledge imparted through financial and digital education. |
15
| | | Earnings Release 1Q / 2023 | Analysis of 1Q23 Consolidated Results |
01 Loan Portfolio
The structural loan volume, measured in average daily balances, fell QoQ due to amortizations of Wholesale Banking loans due to a seasonal effect that is present every first quarter. This reduction was partially offset by a slight increase in loans volumes in ADB in Retail Banking and Mibanco, which have shifted their focus to concentrate on lower-risk clients in an adverse environment marked by social protests and damaging rains. YoY, structural loans in average daily balances grew due to expansion in Retail Banking segments; disbursements for working capital loans in Wholesale Banking; and growth in Mibanco’s portfolio during the second half of 2022. The Structural NPL Ratio rose QoQ and YoY due to (i) growth in the NPL loan volume in Wholesale Banking, where the new overdue portfolio was already 100% provisioned given that provision models had collected said impairment in advance; (ii) deterioration in Mibanco’s portfolio, which was impacted by social protests and damaging rains; and (iii) growth in the overdue portfolio in Retail Banking, which was concentrated in the higher-risk disbursements made in 2022. This growth was partially offset by the sale of a judicial portfolio and write-offs registered in Retail Banking in 1Q23. | ||
| 1.1. | Loans |
Structural loans (in Average Daily Balances) (1)(2)(3)
Structural Loans (S/ millions) | As of | Volume change | % change | % Part. in total structural loans | ||||||
| Mar 22 | Dec 22 | Mar 23 | QoQ | YoY | QoQ | YoY | Mar 22 | Dec 22 | Mar 23 | |
| BCP Stand-alone | 101,453 | 112,342 | 111,263 | -1,078 | 9,810 | -1.0% | 9.7% | 81.4% | 81.6% | 81.4% |
| Wholesale Banking | 51,063 | 55,622 | 53,775 | -1,847 | 2,712 | -3.3% | 5.3% | 41.0% | 40.4% | 39.3% |
| Corporate | 30,663 | 33,400 | 32,545 | -855 | 1,881 | -2.6% | 6.1% | 24.6% | 24.3% | 23.8% |
| Middle - Market | 20,400 | 22,222 | 21,230 | -992 | 831 | -4.5% | 4.1% | 16.4% | 16.1% | 15.5% |
| Retail Banking | 50,390 | 56,720 | 57,488 | 768 | 7,098 | 1.4% | 14.1% | 40.4% | 41.2% | 42.0% |
| SME - Business | 4,709 | 5,750 | 5,546 | -205 | 837 | -3.6% | 17.8% | 3.8% | 4.2% | 4.1% |
| SME - Pyme | 11,844 | 13,033 | 13,257 | 224 | 1,413 | 1.7% | 11.9% | 9.5% | 9.5% | 9.7% |
| Mortgage | 18,830 | 20,073 | 20,282 | 209 | 1,452 | 1.0% | 7.7% | 15.1% | 14.6% | 14.8% |
| Consumer | 10,975 | 12,738 | 12,984 | 247 | 2,009 | 1.9% | 18.3% | 8.8% | 9.2% | 9.5% |
| Credit Card | 4,032 | 5,126 | 5,420 | 294 | 1,388 | 5.7% | 34.4% | 3.2% | 3.7% | 4.0% |
| Mibanco | 11,411 | 13,121 | 13,335 | 214 | 1,924 | 1.6% | 16.9% | 9.2% | 9.5% | 9.8% |
| Mibanco Colombia | 1,077 | 1,174 | 1,250 | 76 | 173 | 6.5% | 16.0% | 0.9% | 0.9% | 0.9% |
| Bolivia | 8,602 | 9,034 | 8,951 | -82 | 349 | -0.9% | 4.1% | 6.9% | 6.6% | 6.5% |
| ASB | 2,103 | 2,039 | 1,958 | -81 | -145 | -4.0% | -6.9% | 1.7% | 1.5% | 1.4% |
| BAP's total loans | 124,647 | 137,710 | 136,758 | -952 | 12,112 | -0.7% | 9.7% | 100.0% | 100.0% | 100.0% |
For consolidation purposes, Loans generated in Foreign Currency (FC) are converted to Local Currency (LC). (1) Includes Work out unit, and other banking. For Quarter-end Balances figures, please refer to “12. Annexes – 12.2 Loan Portfolio Quality”. (2) Structural Portfolio excludes the Loans offered through Reactiva Peru and FAE-Mype Government Programs (GP). (3) Internal Management Figures |  |
QoQ, structural loans in average daily balances reported a slight decline due to:
| • | Wholesale Banking, where Corporate Banking and Middle Market Banking reported a drop in their balances due to seasonality, which reflected moves by clients in these segments to amortize working capital loans and financing for fixed assets in 1Q23. |
The aforementioned was partially offset by slight growth in:
| • | Retail Banking, where all segments, with the exception of SME-Business, registered slight growth with regard to 4Q22 for reasons that will be explained in the YoY dynamics. This growth was partially offset by the sale of a judicial portfolio, which was mainly compromised of SME-Pyme and Mortgage loans in particular. |
| • | Mibanco, where despite the adverse context generated by protests in the south of the country and intense rains in the north, average daily loan balances have increased. |
16
| | | Earnings Release 1Q / 2023 | Analysis of 1Q23 Consolidated Results |
| 01. Loan Portfolio |
In the current context, Mibanco has chosen to focus on clients that present lower risk according to the adjustments in risk appetite implemented in the second half of last year.
YoY, structural loans in average daily balances rose 9.7%. This increase was driven primarily by:
| • | Retail Banking, where all segments evolved positively with regard to 1Q22. This evolution was led by the Consumer segment, where higher growth was fueled by wage advances and cash loans through disbursements concentrated in lower-risk clients, followed by Mortgage, which benefitted from an uptick in new loans and a drop in prepayments in comparison to previous quarters. In the case of SME-Pyme, growth was concentrated in loans for working capital and refinancing of fixed assets in the case of larger clients with lower risk profiles. Credit Cards registered growth due to a 37% YoY increase in new card issuances and to growth in consumption in both physical establishments and online. E-commerce’s share of consumption rose from 20% in 1Q22 to 31.7% in 1Q23. |
| • | Wholesale Banking, where Corporate Banking led growth through an uptick in disbursements for working capital. |
| • | Mibanco, whose balances reflect the impact of record-high disbursements in the second half of 2022 (see previous quarter); these disbursements were generated through leads and alternative channels. |
The aforementioned was partially offset by the sale of portfolio in Retail Banking.
Government Program Loans
(in Average Daily Balances – S/ millions)
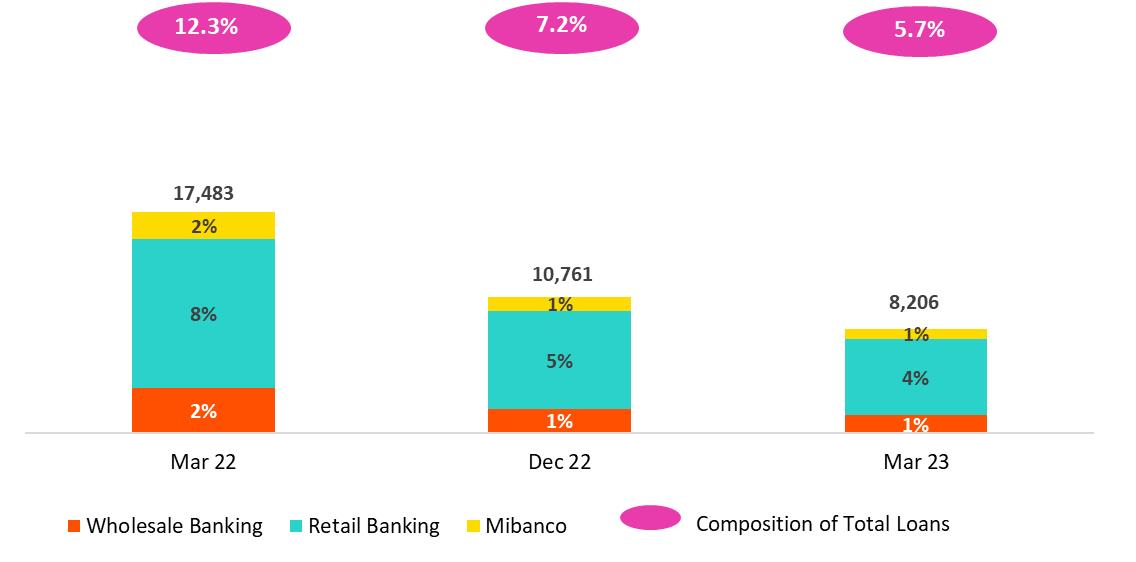
ADBs for Government Program loans (GP) dropped -23.7% QoQ and -53-1% YoY. This evolution was driven mainly by amortizations at both BCP and Mibanco. GP loans in average daily balances represented 5.7% of total loans (vs 7.2% in December 22 and 12.3% in March 22).
17
| | | Earnings Release 1Q / 2023 | Analysis of 1Q23 Consolidated Results |
| 01. Loan Portfolio |
Total loans (in Average Daily Balances) (1) (2)
Total Loans (S/ millions) | As of | Volume change | % change | % Part. in total loans | ||||||
| Mar 22 | Dec 22 | Mar 23 | QoQ | YoY | QoQ | YoY | Mar 22 | Dec 22 | Mar 23 | |
| BCP Stand-alone | 117,349 | 121,963 | 118,707 | -3,256 | 1,358 | -2.7% | 1.2% | 82.2% | 82.1% | 81.9% |
| Wholesale Banking | 54,604 | 57,497 | 55,141 | -2,356 | 537 | -4.1% | 1.0% | 38.3% | 38.7% | 38.0% |
| Corporate | 31,054 | 33,617 | 32,717 | -899 | 1,663 | -2.7% | 5.4% | 21.8% | 22.6% | 22.6% |
| Middle - Market | 23,550 | 23,881 | 22,424 | -1,456 | -1,126 | -6.1% | -4.8% | 16.5% | 16.1% | 15.5% |
| Retail Banking | 62,744 | 64,465 | 63,566 | -900 | 821 | -1.4% | 1.3% | 44.0% | 43.4% | 43.8% |
| SME - Business | 9,509 | 8,583 | 7,884 | -699 | -1,625 | -8.1% | -17.1% | 6.7% | 5.8% | 5.4% |
| SME - Pyme | 19,398 | 17,947 | 16,996 | -951 | -2,402 | -5.3% | -12.4% | 13.6% | 12.1% | 11.7% |
| Mortgage | 18,830 | 20,073 | 20,282 | 209 | 1,452 | 1.0% | 7.7% | 13.2% | 13.5% | 14.0% |
| Consumer | 10,975 | 12,738 | 12,984 | 247 | 2,009 | 1.9% | 18.3% | 7.7% | 8.6% | 9.0% |
| Credit Card | 4,032 | 5,126 | 5,420 | 294 | 1,388 | 5.7% | 34.4% | 2.8% | 3.5% | 3.7% |
| Mibanco | 13,582 | 14,261 | 14,098 | -163 | 516 | -1.1% | 3.8% | 9.5% | 9.6% | 9.7% |
| Mibanco Colombia | 1,077 | 1,174 | 1,250 | 76 | 173 | 6.5% | 16.0% | 0.8% | 0.8% | 0.9% |
| Bolivia | 8,602 | 9,034 | 8,951 | -82 | 349 | -0.9% | 4.1% | 6.0% | 6.1% | 6.2% |
| ASB | 2,103 | 2,039 | 1,958 | -81 | -145 | -4.0% | -6.9% | 1.5% | 1.4% | 1.4% |
| BAP's total loans | 142,713 | 148,471 | 144,964 | -3,507 | 2,251 | -2.4% | 1.6% | 100.0% | 100.0% | 100.0% |
For consolidation purposes, Loans generated in Foreign Currency (FC) are converted to Local Currency (LC). (1) Includes Work out unit, and other banking. For Quarter-end Balances figures, please refer to “12. Annexes – 12.2 Loan Portfolio Quality”. (2) Internal Management Figures |  |
QoQ total loans dropped and reflected the fact that growth in structural loans was insufficient to offset the drop in GP loans. YoY total loans were up, driven by the positive evolution of the structural portfolio at BCP Stand-alone and Mibanco; this improvement was partially offset by a contraction in GP loans.
Evolution of the Dollarization Level of Loans (in Average Daily Balances) (1)(2)
| Total Loans | Local Currency (LC) - S/ millions | % change | % Structural change | Foreign Currency (FC) - US$ millions | % change | % part. by currency | |||||||||||
Total | Structural | Total | Dec 22 | ||||||||||||||
| Mar 22 | Dec 22 | Mar 23 | Mar 22 | Dec 22 | Mar 23 | QoQ | YoY | QoQ | YoY | Mar 22 | Dec 22 | Mar 23 | QoQ | YoY | LC | FC | |
| BCP Stand-alone | 85,290 | 85,106 | 82,117 | 67,221 | 74,059 | 75,485 | -3.5% | -3.7% | 1.9% | 12.3% | 8,513 | 9,490 | 9,615 | 1.3% | 12.9% | 69.4% | 30.6% |
| Wholesale Banking | 29,124 | 28,351 | 25,984 | 24,898 | 26,511 | 26,475 | -8.4% | -10.8% | -0.1% | 6.3% | 6,766 | 7,505 | 7,662 | 2.1% | 13.2% | 48.8% | 51.2% |
| Corporate | 15,503 | 16,044 | 15,065 | 14,652 | 16,028 | 15,827 | -6.1% | -2.8% | -1.3% | 8.0% | 4,129 | 4,525 | 4,639 | 2.5% | 12.3% | 47.1% | 52.9% |
| Middle - Market | 13,621 | 12,307 | 10,919 | 10,246 | 10,482 | 10,648 | -11.3% | -19.8% | 1.6% | 3.9% | 2,637 | 2,980 | 3,023 | 1.5% | 14.6% | 51.2% | 48.8% |
| Retail Banking | 56,166 | 56,755 | 56,133 | 42,323 | 47,549 | 49,009 | -1.1% | -0.1% | 3.1% | 15.8% | 1,747 | 1,985 | 1,953 | -1.6% | 11.8% | 87.9% | 12.1% |
| SME - Business | 7,061 | 5,530 | 4,970 | 2,597 | 2,594 | 2,698 | -10.1% | -29.6% | 4.0% | 3.9% | 650 | 786 | 766 | -2.6% | 17.8% | 63.7% | 36.3% |
| SME - Pyme | 19,240 | 17,779 | 16,830 | 11,398 | 12,476 | 12,866 | -5.3% | -12.5% | 3.1% | 12.9% | 42 | 43 | 44 | 1.1% | 3.4% | 99.0% | 1.0% |
| Mortgage | 16,919 | 18,005 | 18,264 | 16,391 | 17,682 | 18,005 | 1.4% | 7.9% | 1.8% | 9.8% | 507 | 532 | 530 | -0.4% | 4.5% | 89.7% | 10.3% |
| Consumer | 9,617 | 11,192 | 11,514 | 8,898 | 10,851 | 11,192 | 2.9% | 19.7% | 3.1% | 25.8% | 361 | 398 | 386 | -2.9% | 7.0% | 87.9% | 12.1% |
| Credit Card | 3,329 | 4,249 | 4,555 | 3,039 | 3,946 | 4,249 | 7.2% | 36.8% | 7.7% | 39.8% | 187 | 226 | 227 | 0.7% | 21.8% | 82.8% | 17.2% |
| Mibanco | 13,109 | 13,784 | 13,619 | 10,519 | 12,309 | 12,644 | -1.2% | 3.9% | 2.7% | 20.2% | 126 | 123 | 126 | 2.5% | 0.2% | 96.7% | 3.3% |
| Mibanco Colombia | - | - | - | 0 | 0 | 0 | - | - | - | - | 286 | 303 | 329 | 8.6% | 14.8% | - | 100.0% |
| Bolivia | - | - | - | 0 | 0 | 0 | - | - | - | - | 2,284 | 2,326 | 2,352 | 1.2% | 3.0% | - | 100.0% |
| ASB Bank Corp. | - | - | - | 0 | 0 | 0 | - | - | - | - | 558 | 525 | 515 | -2.0% | -7.8% | - | 100.0% |
| Total loans | 98,399 | 98,890 | 95,735 | 77,740 | 86,368 | 88,129 | -3.2% | -2.7% | 2.0% | 13.4% | 11,767 | 12,766 | 12,936 | 1.3% | 9.9% | 66.3% | 33.7% |
For consolidation purposes, Loans generated in Foreign Currency (FC) are converted to Local Currency (LC). (1) Includes Work out unit, and other banking. For Quarter-end Balances figures, please refer to “12. Annexes – 12.2 Loan Portfolio Quality” (2) Internal Management Figures | |
At the end of March 2023, the dollarization level of structural loans fell -80bps QoQ (35.6% in March23). This evolution was spurred by growth in LC loans in all of Retail Banking’s segments (disbursements made primarily in Soles) and by the variation in the exchange rate (-1.4%), which affects Wholesale Banking portfolios in particular (disbursements made primarily in US Dollars).
18
| | | Earnings Release 1Q / 2023 | Analysis of 1Q23 Consolidated Results |
| 01. Loan Portfolio |
YoY, the dollarization level of the structural portfolio fell -207bps after growth in structural loans in LC (+13.4%) outpaced expansion in FC (+9.9%). Growth in LC was led by Consumer, Mibanco, Mortgage and SME-Pyme. In FC, the increase was driven by Wholesale Banking, where disbursements are concentrated in US Dollars.
Evolution of the Dollarization Level of Structural Loans (in Average Daily Balances) *
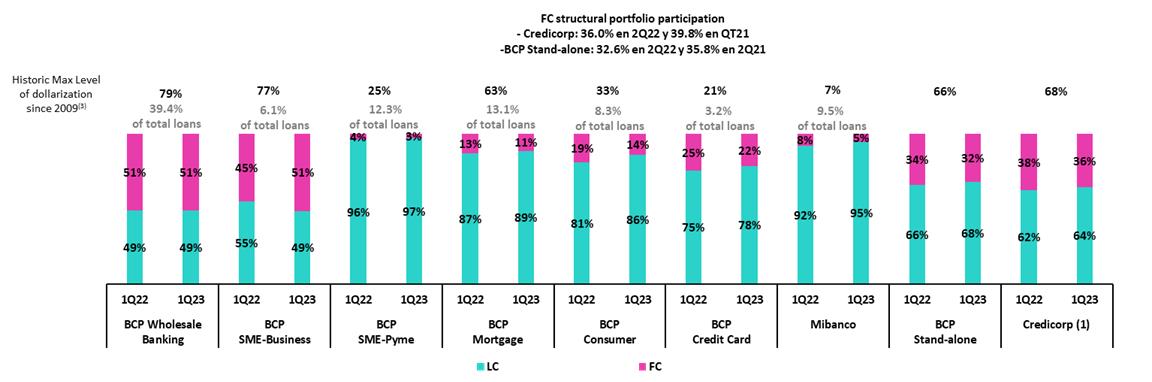
(1) The FC share of Credicorp’s loan portfolio is calculated including BCP Bolivia and ASB Bank Corp., however the chart shows only the loan books of BCP Stand-alone and Mibanco.
(2) The year with the historic maximum level of dollarization for Wholesale Banking was 2012, for Mibanco was 2016, for Credit Card was in 2021 and for the rest of segments was 2009.
* For dollarization figures in quarter-end period, please refer to “12. Annexes – 12.2 Loan Portfolio Quality
Loan Evolution in Quarter-end Balances
Structural loans fell -0.7% QoQ in quarter-end balances due to the same factors outlined in the analysis of loans measured in average daily balances. If we include the contraction in the GP portfolio in the analysis, total loans fell -2.3% QoQ.
In YoY terms, structural loans rose 8.2% in quarter-end balances due to the same drivers as those that fueled the evolution of average daily balances. If we include GP loans in the analysis, total loans rose 0.4% YoY.
1.2. Portfolio Quality
Quality of the Structural Portfolio (in Quarter-end balances)
| Structural Portfolio quality and Delinquency ratios | As of | % change | |||
| S/ 000 | Mar 22 | Dec 22 | Mar 23 | QoQ | YoY |
Structural loans (Quarter-end balance)(2) | 127,585,105 | 139,115,242 | 138,073,343 | -0.7% | 8.2% |
Structural Allowance for loan losses(2) | 8,061,670 | 7,733,575 | 7,779,501 | 0.6% | -3.5% |
| Structural Write-offs | 378,093 | 754,326 | 677,148 | -10.2% | 79.1% |
| Structural IOLs | 4,850,191 | 4,791,245 | 4,952,108 | 3.4% | 2.1% |
| Structural Refinanced loans | 1,714,074 | 2,098,748 | 2,121,068 | 1.1% | 23.7% |
| Structural NPLs | 6,564,265 | 6,889,993 | 7,073,176 | 2.7% | 7.8% |
| Structural IOL ratio | 3.80% | 3.44% | 3.59% | 15 bps | -21 bps |
| Structural NPL ratio | 5.15% | 4.95% | 5.12% | 17 bps | -3 bps |
| Structural Allowance for loan losses over Structural loans | 6.3% | 5.6% | 5.6% | 7 bps | -69 bps |
| Structural Coverage ratio of NPLs | 122.8% | 112.2% | 110.0% | -225 bps | -1282 bps |
(1) The Structural Portfolio excludes Government Programs (GP) effects.
The volume of structural NPL loans rose QoQ and YoY by 2.7% and 7.8% respectively. QoQ, the increase was driven by growth in IOL loans in Wholesale Banking. This increase was partially offset by the sale of a judicial portfolio in Retail Banking this quarter. It is important to note that, thanks to Wholesale provisions models that foresaw the potential for deterioration, the IOL portfolio was completely provisioned prior to advancement to the IOL stage. YoY, dynamics were driven by an increase in refinanced loans in Wholesale Banking.
19
| | | Earnings Release 1Q / 2023 | Analysis of 1Q23 Consolidated Results |
| 01. Loan Portfolio |
Structural NPL Ratio
In the QoQ analysis, the structural NPL ratio rose, which reflects an increase in NPL volumes. The segments that contributed to growth were:
| • | Wholesale Banking, due to an uptick in overdue loans after letters of credit were executed to cover loans to a client in the construction sector. It is important to note that these loans were already 100% provisioned given that provisions models had anticipated deterioration. |
| • | Mibanco, which was heavily impacted by the protests in the south of the country, damaging rains in the north and an adverse macroeconomic climate. These events have generated an increase in the IOL portfolio given that some clients who received early relief measures at the end of 4Q22 or 1Q23; nonetheless fell delinquent. In 1Q23, an additional tranche of clients was offered refinancing. |
| • | Consumer and Credit Cards, which reported deterioration in the portfolio disbursed in 2022 after penetrating segments with higher risk profiles. In this scenario, adjustments were made to credit guidelines to shift the focus to clients with better profiles. |
Growth in the structural NPL ratio was partially offset by the sale of a judicial recovery portfolio in Retail Banking, which was concentrated primarily in SME-Pyme and Mortgage loans. Had the bank not taken the aforementioned measures, the SME-Pyme segment would have reported deterioration in disbursements of higher-risk loans disbursed in 2022.
YoY, the structural NPL ratio fell slightly by 3bps, which reflects the impact of loan growth as outlined in the previous chapter. The uptick in loan volumes was partially offset by an increase in NPL loans, which was driven by:
| • | Wholesale Banking, given that in 2022, loans were refinanced for clients in the commercial real estate and tourism sectors, both of which were heavily impacted by the pandemic. It is important to note that these loans are backed by collateral levels that far exceed total debt. |
| • | Consumer and Credit Cards, where deterioration was driven by the same factors as those presented in the QoQ analysis. |
| • | Mibanco, where deterioration was spurred by the same factor as those outlined in the QoQ analysis |
As was the case QoQ, the uptick in the structural loan ratio was partially offset by the sale of a portfolio.
20
| | | Earnings Release 1Q / 2023 | Analysis of 1Q23 Consolidated Results |
| 01. Loan Portfolio |
Structural write-offs
(in quarter-end balances – S/ thousands)
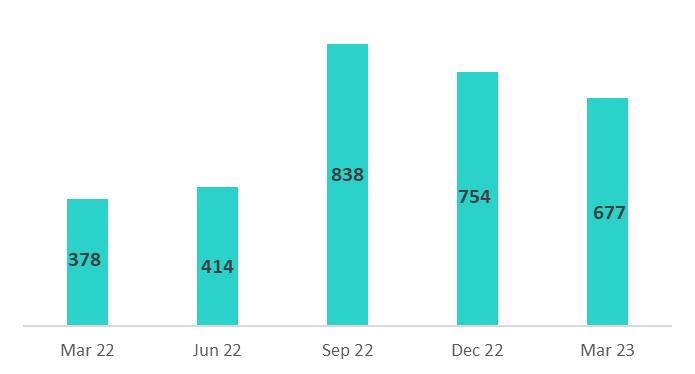
QoQ, structural loans fell -10.2%. This evolution was attributable to the fact that regulatory restrictions that impeded taking charge-offs on structural loans held by clients that also possess Reactiva loans were lifted. Consequently, the first wave of charge-offs was rolled out in the SME-Pyme sector in 3Q22 and continued through this quarter. Although charge-offs in 4Q22 were lower than those registered last quarter, the level is high and is expected to remain so over coming quarters.
YoY, growth in the NPL volume (+79.1%) was fueled by write-offs in SME-Pyme, Consumer and Mibanco. Growth in NLP loans in SME-Pyme and Mibanco was primarily driven by the factors indicated above while the uptick in Consumer was attributable to write-offs that had been postponed during the pandemic.
Coverage Ratio of Structural NPL Loans
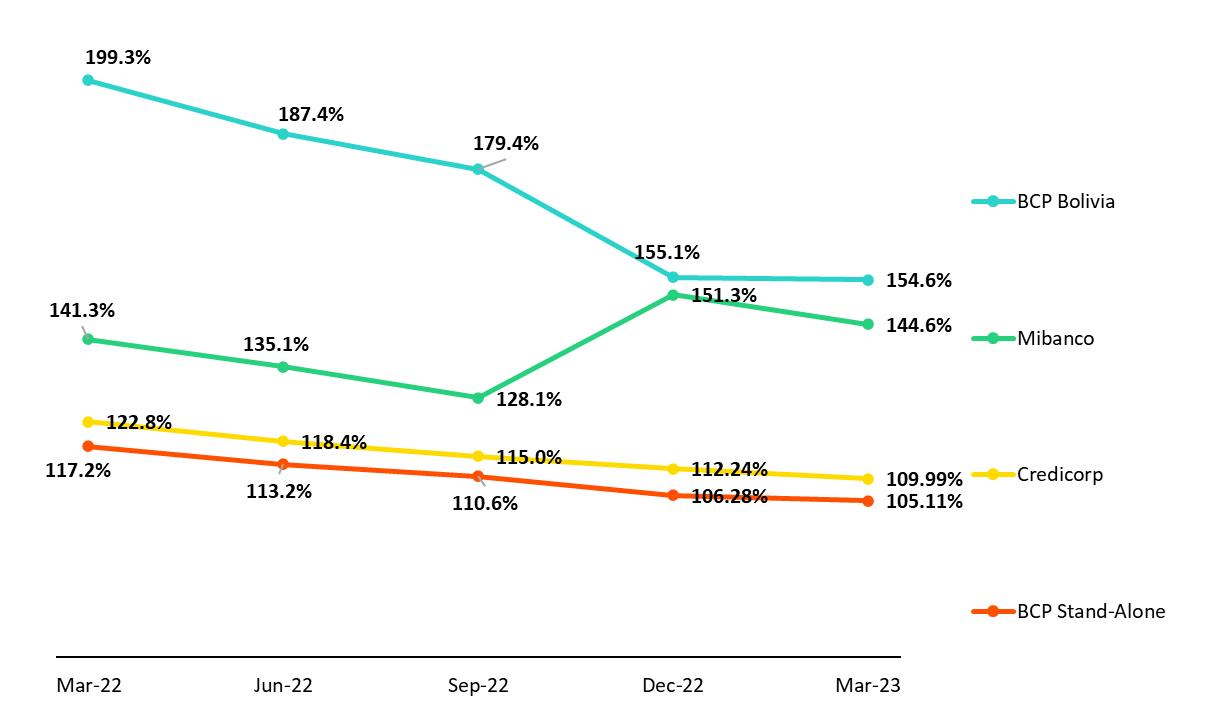
In the last few quarters, the coverage ratio for structural NPL loans has presented an on-going reduction. This decline was primarily driven by Wholesale Banking, which experienced a significant uptick in structural loan volumes in 2022 and 1Q23 due to the impulse of refinanced loans. This growth was not accompanied by a commensurate increase in provisions given that these loans are backed by collateral levels that far exceed total debt.
NPL loans in the Government Loan Portfolio
(in quarter-end balances– S/ thousands)
QoQ, the volume of NPLs dropped due to growth in honoring processes for Reactiva Loans. At the end of March 2023, a total of S/1,430 million was received for the concept of state guarantees.
To execute these guarantees, loans must present delinquency for more than 90 days. Average guarantee levels stand at 84%, 91% and 97% for Wholesale Banking, Retail Banking and Mibanco respectively.
21
| | | Earnings Release 1Q / 2023 | Analysis of 1Q23 Consolidated Results |
| 01. Loan Portfolio |
Quality of the Total Portfolio (in quarter-end balances)
| Loan Portfolio Quality and Delinquency Ratios | As of | % change | |||
| S/ 000 | Mar 22 | Dec 22 | Mar 23 | QoQ | YoY |
| Total loans (Quarter-end balance) | 144,621,513 | 148,626,374 | 145,165,713 | -2.3% | 0.4% |
| Allowance for loan losses | 8,262,383 | 7,872,402 | 7,915,350 | 0.5% | -4.2% |
| Write-offs | 378,093 | 754,326 | 677,148 | -10.2% | 79.1% |
| Internal overdue loans (IOLs) (1)(2) | 5,872,999 | 5,939,744 | 5,789,497 | -2.5% | -1.4% |
| Internal overdue loans over 90-days (1) | 4,424,384 | 4,620,461 | 4,386,959 | -5.1% | -0.8% |
| Refinanced loans (2) | 1,714,074 | 2,098,748 | 2,121,068 | 1.1% | 23.7% |
| Non-performing loans (NPLs) (3) | 7,587,073 | 8,038,492 | 7,910,565 | -1.6% | 4.3% |
| IOL ratio | 4.06% | 4.00% | 3.99% | -1 bps | -7 bps |
| IOL over 90-days ratio | 3.06% | 3.11% | 3.02% | -9 bps | -4 bps |
| NPL ratio | 5.25% | 5.41% | 5.45% | 4 bps | 20 bps |
| Allowance for loan losses over Total loans | 5.71% | 5.30% | 5.45% | 15 bps | -26 bps |
| Coverage ratio of IOLs | 140.7% | 132.5% | 136.7% | 418 bps | -400 bps |
| Coverage ratio of IOL 90-days | 186.7% | 170.4% | 180.4% | 1005 bps | -632 bps |
| Coverage ratio of NPLs | 108.9% | 97.9% | 100.1% | 200 bps | -880 bps |
(1) Includes Overdue Loans and Loans under legal collection (Quarter-end balances net of deferred earnings).
(2) Figures net of deferred earnings.
(3) Non-performing Loans include Internal overdue loans and Refinanced loans (Quarter-end balances net of deferred earnings).
Accordingly, Credicorp’s NPL ratio rose 4bps QoQ and 20bps YoY, in line with growth in structural NPL volumes.
22
| | | Earnings Release 1Q / 2023 | Analysis of 1Q23 Consolidated Results |
02 Deposits
At the end of 1Q23, 67.9% of deposits were low-cost, which represents a competitive advantage in a context of record-high interest rates. YoY, low-cost deposits fell 11.0%, which was primarily fueled by on-going growth in Time Deposits after corporate clients migrated funds to this deposit type to take advantage of higher rates. However, low-cost deposit levels remain high. Demand deposits at BCP Stand-alone and Mibanco also dropped over the period, which reflected a normalization in liquidity levels. At the end of March 2023, the market share (MS) for total deposits, which consolidates BCP Stand-alone and Mibanco, stood at 34.8% (-90bps with regard to March 22). | ||
| Deposits | As of | % change | Currency | ||||
| S/ 000 | Mar 22 | Dec 22 | Mar 23 | QoQ | YoY | LC | FC |
| Demand deposits | 56,923,859 | 48,467,247 | 47,483,662 | -2.0% | -16.6% | 46.7% | 53.3% |
| Saving deposits | 56,454,479 | 54,769,045 | 53,418,288 | -2.5% | -5.4% | 55.9% | 44.1% |
| Time deposits | 30,029,261 | 38,897,010 | 43,194,573 | 11.0% | 43.8% | 46.5% | 53.5% |
| Severance indemnity deposits | 3,750,593 | 3,824,629 | 3,322,691 | -13.1% | -11.4% | 70.2% | 29.8% |
| Interest payable | 757,772 | 1,062,856 | 1,204,086 | 13.3% | 58.9% | 50.3% | 49.7% |
| Total Deposits | 147,915,964 | 147,020,787 | 148,623,300 | 1.1% | 0.5% | 50.3% | 49.7% |
Our Total Deposit base increased 1.1% QoQ and 0.5% YoY. This growth was driven by the following dynamics:
| • | Growth of 11.0% in Time Deposits, which was driven primarily by FC deposits by corporate clients at BCP Stand-alone and secondarily by Mibanco, where clients moved to take advantage of higher rates. |
The aforementioned was partially offset by:
| • | A 2.5% reduction in Savings Deposits in both LC and FC, which was mainly attributable to a drop in volumes at BCP Stand-alone and at BCP Bolivia. The reduction in volumes at BCP Stand-alone was driven by clients’ moves to migrate funds to higher-yield deposits to take advantage of record-high interest rates while at BCP Bolivia, the decline reflects the impact of an adverse macroeconomic environment. |
| • | The 2.0% decline in Demand Deposits. This decline was triggered by a drop in FC deposits, which was in turn spurred by a reduction in the demand deposits at BCP and ASB after funds migrated to higher-yield deposits. The drop in FC was partially offset by an increase in LC over the period. |
The low-cost deposit volume (Demand + savings) has fallen and is returning to pre-pandemic levels. Nevertheless, this deposit type continues to represent a sizeable share of total deposits (67.9%).
Deposit Dollarization Level
Deposits by currency
(measured in quarter -end balances)
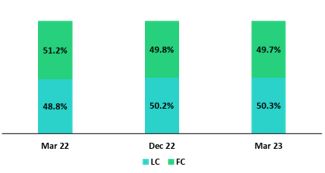
At the end of March 2023, the dollarization level of Total Deposits fell 10 bps QoQ. This drop was driven by Demand Deposits, which were impacted by the migration of funds from FC to LC at BCP Stand-alone in a context marked by a lower exchange rate and an improvement in market expectations.
In YoY terms, the dollarization level fell 150 bps. This evolution was driven by a drop in Demand Deposits in FC (-23.5%) and Savings Deposits in FC (-5.5%) and by growth in Time Deposits in LC (42.05%). These three movements reflected migration to more profitable deposits.
23
| | | Earnings Release 1Q / 2023 | Analysis of 1Q23 Consolidated Results |
| 02. Deposits |
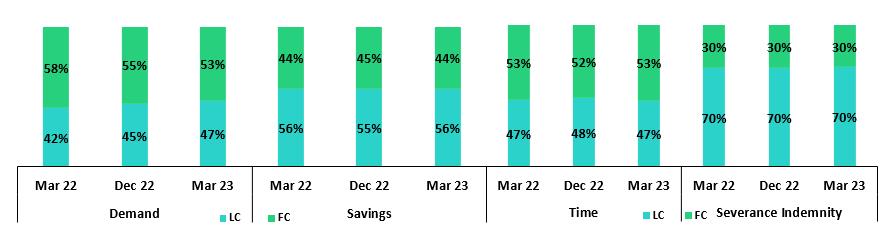
Deposits by currency and type
(measured in quarter -end balances)
Loan / Deposit Ratio (L/D Ratio)
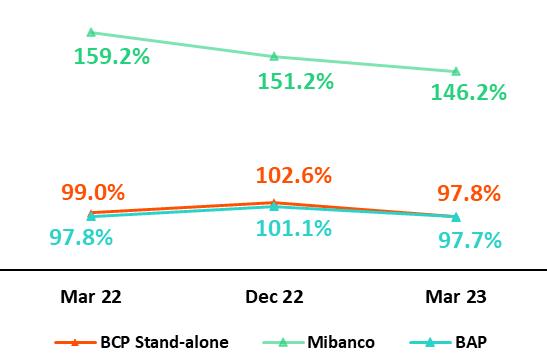
The L/D ratio fell at BCP Stand-alone and Mibanco QoQ by 475 bps and 500 bps respectively. This led the L/D ratio at BAP to decline in QoQ terms and stand at 97.7% at quarter-end (101.1% in 4Q22.). The aforementioned reduction was driven primarily by a drop in loan balances at BCP and Mibanco, and secondarily by growth in deposits, and in Time Deposits at BCP Stand-alone in particular, in a context of higher interest rates.
L/D Ratio Local Currency
L/D Ratio Foreign Currency
24
| | | Earnings Release 1Q / 2023 | Analysis of 1Q23 Consolidated Results |
| 02. Deposits |
Share of the Market for Deposits in the Peruvian Financial System
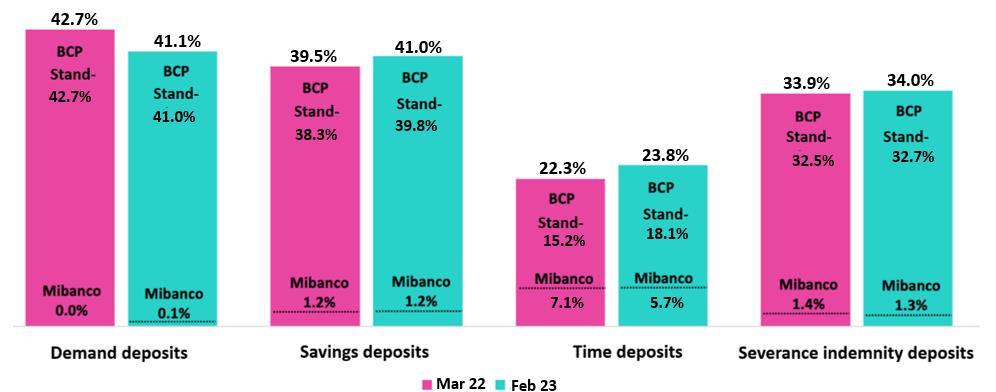
At the end of February 2023, the MS of Total Deposits of BCP Stand-alone and Mibanco in Peru stood at 32.3% and 2.5% respectively (-100bps and +100bps with regard to March 2022). With this result, BCP Stand-alone continues to lead the market by a solid margin.
Growth in BCP Stand-alone’s share of Time Deposits, which was equivalent to 290 bps, reflected fund migration from low-cost to higher-yield deposits. Demand Deposits at the bank fell this quarter, which reflects businesses’ moves to cover seasonal expenses and other liquidity needs.
It is important to note that BCP Stand-alone, with a 41.9% share as of February 2023 (+1.0% with regard to March 2022) continues to lead the market for low-cost deposits in the Peruvian financial system.
25
| | | Earnings Release 1Q / 2023 | Analysis of 1Q23 Consolidated Results |
03 Interest-earning Assets (IEA) and Funding
At the end of 1Q23 IEAs registered QoQ growth of 0.2%, driven by an uptick in Available Funds and Investments. Growth in both of the aforementioned accounts was offset by a drop in the Loan balance in a context of amortizations of Government Loans (GP). YoY, the IEAs balance fell 0.6% due to a reduction in balances of Available Funds and Investments in a context marked by lower liquidity system-wide. This decline was partially offset by the increase in the loans volume. Structural loans balance, in quarter end figures, rose 8.2%, driven primarily by the evolution of loans in Retail Banking at BCP and Mibanco. Funding fell 0.6% QoQ and 2.6% YoY due to a drop in balances of BCRP, and Bonds and Issued Notes, which reflects amortization of Reactiva loans and the expiration of a bond at BCP at the end of March. | ||
3.1. IEA1
| Interest Earning Assets | As of | % change | |||
| S/000 | Mar 22 | Dec 22 | Mar 23 | QoQ | YoY |
| Cash and due from banks | 29,563,512 | 26,897,216 | 28,158,941 | 4.7% | -4.8% |
| Total investments | 48,145,429 | 45,431,224 | 47,729,504 | 5.1% | -0.9% |
| Cash collateral, reverse repurchase agreements and securities borrowing | 1,516,855 | 1,101,856 | 1,468,180 | 33.2% | -3.2% |
| Total loans | 144,621,513 | 148,626,374 | 145,165,713 | -2.3% | 0.4% |
| Total interest earning assets | 223,847,309 | 222,056,670 | 222,522,338 | 0.2% | -0.6% |
QoQ, IEAs grew 0.2% due to an increase in Available Funds and Investments. This growth was partially offset by a drop in Loans.
The uptick registered in Available Funds was fueled by growth in the funding base of BCP and Mibanco. The majority of these funds are deposited in BCRP accounts, which currently produce favorable yields. Investment rose due to a move to increase the position in debt instruments issued by BCRP. Total loans fell 2.3%, which reflected amortizations of GP loans and a drop in the exchange rate. Structural loans fell 0.7%, which was primarily driven by a decrease in the loan balance of the Wholesale Banking portfolio.
YoY, IEA dropped 0.6%. This evolution reflected the decrease in balances for Available Funds and Investments, which was partially offset by an increase in Total Loans. The drops registered in Available Funds and Investments were attributable to a system-wide decrease in liquidity after clients moved to amortize GP loans.
Total loans reported growth of 0.4% YoY. This slight growth was spurred by a drop in GP loan balances. Over the same period, the structural loan volume rose 8.2%, driven primarily by an uptick in volumes at Retail Banking at BCP and Mibanco. GP loans, in turn, dropped 58.4% YoY.
3.2. Funding
| Funding | As of | % change | |||
| S/ 000 | Mar 22 | Dec 22 | Mar 23 | QoQ | YoY |
| Deposits and obligations | 147,915,964 | 147,020,787 | 148,623,300 | 1.1% | 0.5% |
| Due to banks and correspondents | 6,362,990 | 8,937,411 | 10,199,650 | 14.1% | 60.3% |
| BCRP instruments | 17,532,350 | 11,297,659 | 9,780,540 | -13.4% | -44.2% |
Repurchase agreements with clients and third parties(2) | 1,856,645 | 1,669,066 | 1,905,955 | 14.2% | 2.7% |
| Bonds and notes issued | 16,044,671 | 17,007,194 | 14,313,030 | -15.8% | -10.8% |
| Total funding | 189,712,620 | 185,932,117 | 184,822,475 | -0.6% | -2.6% |
QoQ and YoY, funding dropped 0.6% and 2.6% respectively due a decrease in balances for BCRP instruments (associated with the amortization of Reactiva Loans) and a reduction in the balance of Bonds and Issued Notes, which reflects the expiration of a bond at the end of March. It is important to note that deposits rose 1.1% QoQ, due primarily to growth in time deposits. YoY, the deposit volume remained relatively stable.
(1) Effective 1Q23, IEA does not include “Financial assets designated at Fair Value through P&L” (mainly comprised of Investment Link contracts) as one of its components
(2) Effective 1Q23, Funding includes Repurchase agreements with clients
26
| | | Earnings Release 1Q / 2023 | Analysis of 1Q23 Consolidated Results |
04 Net Interest Income (NII)
In 1Q23, Net Interest Income remained stable QoQ. Our disciplined management of pricing led growth in IEA yields to slightly outpace expansion in the Funding Cost. It is relevant to note that comparatively speaking, there were two fewer business days in 1Q23 than in 4Q22, which negatively impacted Net Interest Income. YoY, Net interest Income rose 28.8%, driven by higher interest rates. Rising rates favorably impacted IEA Yields (+244bps), where growth helped mitigate the downside of rate increases at the funding cost level (+129bps). Growth in structural loans also contributed, although to a lesser extent, to higher NII over the period. In this context, in 1Q23, the Net Interest Margin rose 9bps QoQ and 138bps YoY to stand at 5.84% and the Structural Net Interest Margin, 6.02% | ||
| Net Interest Income / Margin | Quarter | % change | |||
| S/ 000 | 1Q22 | 4Q22 | 1Q23 | QoQ | YoY |
| Interest Income | 3,172,346 | 4,362,142 | 4,456,106 | 2.2% | 40.5% |
| Interest Expense | (740,639) | (1,227,364) | (1,324,017) | 7.9% | 78.8% |
| Interest Expense (excluding Net Insurance Financial Expenses) | (638,881) | (1,119,124) | (1,208,267) | 8.0% | 89.1% |
| Net Insurance Financial Expenses | (101,758) | (108,240) | (115,750) | 6.9% | 13.8% |
| Net Interest Income | 2,431,707 | 3,134,778 | 3,132,089 | -0.1% | 28.8% |
| Balances | |||||
| Average Interest Earning Assets (IEA) | 227,279,809 | 225,604,596 | 222,289,504 | -1.5% | -2.2% |
| Average Funding | 193,179,562 | 190,660,720 | 185,377,296 | -2.8% | -4.0% |
| Yields | |||||
| Yield on IEAs | 5.58% | 7.73% | 8.02% | 29bps | 244bps |
| Cost of Funds | 1.32% | 2.35% | 2.61% | 26bps | 129bps |
Net Interest Margin (NIM) (1) | 4.46% | 5.75% | 5.84% | 9bps | 138bps |
| Risk-Adjusted Net Interest Margin | 4.01% | 4.45% | 4.54% | 9bps | 53bps |
| Peru’s Reference Rate | 4.00% | 7.50% | 7.75% | 25bps | 375bps |
| FED funds rate | 0.50% | 4.50% | 5.00% | 50bps | 450bps |
(1) For further detail on the new NIM calculation due to IFRS17, please refer to Annex 12.1.8
QoQ, Net interest income registered a little decrease (-0.1%) given that growth in expenses outstripped expansion in income. The increase in income was driven by IEA yields, where despite the reduction in the loan balance, the recomposition of the loan portfolio mix, together with the current interest rate environment, resulted in a positive impact. Expansion in interest expenses was fueled by an uptick in the Funding Cost, which was in turn spurred by growth in the share of more expensive sources of funding in the mix. In net terms, the increase registered in IEA yields was slightly above the growth registered for the funding cost; consequently, NIM rose 9bps QoQ to stand at 5.84%.
YoY, Net interest income rose 28.8%, driven by the fact that growth in income outstripped the expansion in expenses in an environment marked by rising interest rates. This evolution was primarily attributable to the fact that the positive effect of interest rate hikes on IEAs outweighed the negative effect of said hikes on the Funding Cost. In this context, NIM rose 138bps YoY.
Net Interest Margin
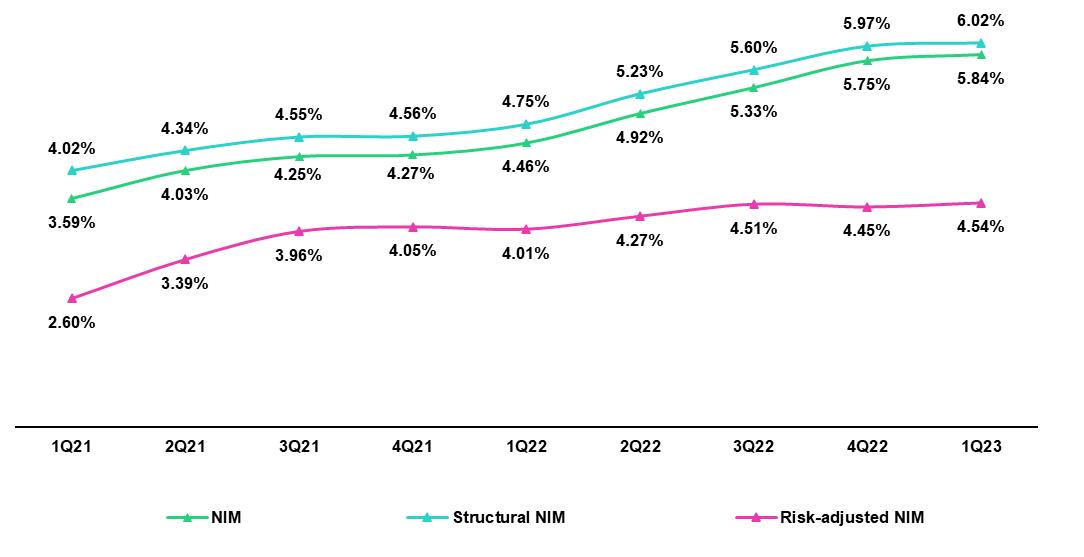
Structural NIM continued to rise QoQ thanks to the positive effect generated by active interest rate management in our business segments and to effective repricing of investments. This quarter, risk-adjusted NIM rose slightly to stand at 4.54% at quarter-end.
To analyze the evolution of Net Interest Income, it is important to differentiate dynamics by currency given that the trends in volumes market rate variations differ for each. The reference rate in LC (BCRP) increased 25bps QoQ and 375bps YoY, while the rate in FC (FED funds rate) rose 50bps QoQ and 450bps YoY.
27
| | | Earnings Release 1Q / 2023 | Analysis of 1Q23 Consolidated Results |
04. Net Interest Income (NII) |
Dynamics of Net Interest Margin by Currency
| Interest Income / IEA | 1Q22 | 4Q22 | 1Q23 | ||||||
| S/ millions | Average | Average | Average | ||||||
| Balance | Income | Yields | Balance | Income | Yields | Balance | Income | Yields | |
| Cash and equivalents | 30,979 | 35 | 0.5% | 28,114 | 236 | 3.4% | 27,528 | 277 | 4.0% |
| Other IEA | 1,642 | 19 | 4.5% | 1,344 | 48 | 14.3% | 1,285 | 16 | 5.0% |
| Investments | 48,549 | 433 | 3.6% | 46,137 | 563 | 4.9% | 46,580 | 592 | 5.1% |
| Loans | 146,109 | 2,686 | 7.4% | 150,009 | 3,515 | 9.4% | 146,896 | 3,571 | 9.7% |
| Structural | 128,256 | 2,619 | 8.2% | 139,153 | 3,459 | 9.9% | 138,594 | 3,528 | 10.2% |
| Government Programs | 17,853 | 66 | 1.5% | 10,856 | 56 | 2.1% | 8,302 | 43 | 2.1% |
| Total IEA | 227,280 | 3,172 | 5.6% | 225,605 | 4,362 | 7.7% | 222,290 | 4,456 | 8.0% |
| IEA (LC) | 58.0% | 78.8% | 7.6% | 56.6% | 73.1% | 10.0% | 56.9% | 71.2% | 10.0% |
| IEA (FC) | 42.0% | 21.2% | 2.8% | 43.4% | 26.9% | 4.8% | 43.1% | 28.8% | 5.3% |
Interest Expense(1)/ Funding | 1Q22 | 4Q22 | 1Q23 | ||||||
| S/ millions | Average | Average | Average | ||||||
| Balance | Expense | Yields | Balance | Expense | Yields | Balance | Expense | Yields | |
| Deposits | 148,756 | 259 | 0.7% | 149,489 | 582 | 1.6% | 147,822 | 677 | 1.8% |
| BCRP + Due to Banks | 25,400 | 116 | 1.8% | 21,843 | 240 | 4.4% | 20,108 | 239 | 4.8% |
| Bonds and Notes | 16,934 | 174 | 4.1% | 17,430 | 189 | 4.3% | 15,660 | 183 | 4.7% |
| Others | 1,257 | 90 | 28.6% | 1,079 | 108 | 40.1% | 1,091 | 109 | 40.1% |
| Total Funding | 193,180 | 639 | 1.3% | 190,661 | 1,119 | 2.3% | 185,377 | 1,208 | 2.6% |
| Funding (LC) | 51.2% | 53.6% | 1.4% | 50.8% | 59.0% | 2.7% | 50.5% | 55.7% | 2.9% |
| Funding (FC) | 48.8% | 46.4% | 1.3% | 49.2% | 41.0% | 2.0% | 49.5% | 44.3% | 2.3% |
| NIM | 227,280 | 2,533 | 4.5% | 225,605 | 3,243 | 5.7% | 222,290 | 3,248 | 5.8% |
| NIM (LC) | 58.0% | 85.2% | 6.5% | 56.6% | 78.0% | 7.9% | 56.9% | 77.0% | 7.9% |
| NIM (FC) | 42.0% | 14.8% | 1.6% | 43.4% | 22.0% | 2.9% | 43.1% | 23.0% | 3.1% |
(1) Excluding Net Insurance Financial Expenses.
QoQ analysis
QoQ, Net interest income remained relatively stable given that the dynamics in LC and FC offset one another. IEAs in LC represented 56.9% of total IEA and accounted for 77% of Net interest income generated in 1Q23.
Dynamics in Local Currency (LC)
Net interest income in LC fell 1.2%, which was attributable to the following dynamics:
Average IEA in LC dropped 1.0%, driven by amortizations of Government Program loans (-23.5%). The aforementioned was partially offset by growth in Investments (+4.0%) and Structural Loans (+0.5%). The implicit rates of the main components of IEA in LC remained stable. In 1Q23, the yield on IEA in LC stood at 10.0%. The aforementioned contraction in IEAs led to a consequent drop in Interest income in LC (-0.4%).
Average funding in LC fell 3.3%, which was attributable to a decrease in balances for Reactiva funding and Deposits. The funding cost in LC rose from 2.7% in 4Q22 to 2.9% in 1Q23, which reflected fund migration from low-cost deposits to Time Deposits. Interest expenses (excluding Net Insurance Financial Expenses) in LC rose 1.9%, driven primarily by an increase in the funding cost.
Foreign Currency Dynamics (FC)
Net interest Income in FC rose 3.8% due to the following dynamics:
Average IEA in FC dropped 2.1%, in line with a decrease in the exchange rate and a drop in Total loans (controlling for the exchange rate). Nonetheless, interest rate hikes led the Yield on IEAs in FC to increase from 4.8% to 5.3%. This price effect drove expansion in Interest income in FC (+9.2%).
Average funding in FC fell 2.2%. This evolution was primarily attributable to an exchange rate effect and to a drop in the balance of Bonds and Issued Notes, which reflected the impact of a bond expiration at BCP in March. Despite the aforementioned, the Funding cost rose this quarter, primarily due to an increase in rates in FC and secondarily, to the negative mix effect generated by fund migration from Low-cost deposits to Time deposits. In this context, Interest expenses (excluding Net Insurance Financial Expenses) in FC rose 16.6%.
28
| | | Earnings Release 1Q / 2023 | Analysis of 1Q23 Consolidated Results |
04. Net Interest Income (NII) |
YoY Analysis
YoY, Net interest income rose 28.8% mainly influenced by the evolution of interest rates and volumes in FC, as well as by the interest rate dynamics in LC:
Local Currency Dynamics (LC)
Net interest income in LC rose 15.9% YoY due to the following dynamics:
Average IEA in LC dropped 4.2% YoY, which reflected the impact of amortizations of Government Program loans and a drop in Available funds. The Yield on IEAs stood at 10.0% in 1Q23. In this context, LC income increased 27.0%, driven by a positive price effect across the IEAs and by growth in the Structural loan volume.
Average funding in LC declined 5.4%, which was attributable to a decrease in repo balances with BCRP, in line with amortizations of Reactiva loans. This reduction was offset by an increase in Time deposits as clients sought to take advantage of higher rates. Nonetheless, the rates of the main components of funding in LC rose, in particular for interest-bearing deposits and bank financing, in line with an increase in reference rate. The funding cost in LC increased from 1.4% in 1Q22 to 2.9% in 1Q23. Interest expenses (excluding Net Insurance Financial Expenses) rose 96.6% this quarter, driven by a price effect and by an increase in the cost of the funding structure.
Dynamics in Foreign Currency (FC)
Net interest income in FC expanded 107.9% due to the following dynamics:
Average IEA in FC increased 0.6%, driven by Loan growth and partially offset by a drop in the balances of Investments and Available funds. This dynamic generated a positive mix effect on IEAs in FC. In this context, the yield on IEA in FC rose from 2.8% in 1Q22 to 5.3% in 1Q23, fueled by interest rate hikes and the aforementioned mix effect. In net terms, positive price and mix effects led Interest income in FC to increase 90.6%.
Average funding in FC dropped 2.6%, which was attributable to a reduction in balances of Deposits, and Bonds and Issued Notes. Notwithstanding, the funding cost in FC rose from 1.3% in 1Q22 to 2.3% in 1Q23, which reflected the positive impact of higher rates in FC. This quarter, Interest rate expenses (excluding Net Insurance Financial Expenses) in FC expanded 80.5% due to a price effect.
29
| | | Earnings Release 1Q / 2023 | Analysis of 1Q23 Consolidated Results |
05 Provisions
QoQ, the provisions expense rose due to (i) deterioration in payment behavior in Retail Banking, which was concentrated in disbursements made in 2022 in segments with higher risk profiles and in SME-Pyme, Consumer and Credit Cards in particular; and (ii) the impact in Mibanco in the context marked by social protests, intense rains and deterioration in macroeconomic factors. This growth was offset by a drop in expenses in Wholesale Banking, which was driven by a decrease in exposure this quarter. Provisions rose YoY, triggered by deterioration in the payment behavior in Consumer and Credit Cards and by Mibanco, which have been impacted by the current environment in Peru and macroeconomic factors. SME-Pyme provisions levels remain high in line with its portfolio deterioration. This uptick was partially offset by an improvement in payment behavior in Wholesale Banking. In the aforementioned context, the Structural Cost of Risk (CofR) stood at 2.10% in 1Q23. | ||
Provisions and Cost of Risk (CoR) (1) of the Structural Portfolio
| Structural Loan Portfolio Provisions | Quarter | % change | |||
| S/ 000 | 1Q22 | 4Q22 | 1Q23 | QoQ | YoY |
| Gross provision for credit losses on loan portfolio | (354,553) | (799,864) | (799,129) | -0.1% | 125.4% |
| Recoveries of written-off loans | 93,091 | 84,908 | 75,109 | -11.5% | -19.3% |
| Provision for credit losses on loan portfolio, net of recoveries | (261,462) | (714,956) | (724,020) | 1.3% | 176.9% |
Structural Cost of risk (2) | 0.82% | 2.06% | 2.10% | 4 bps | 128 bps |
(1) Annualized Provision for credit losses on loan portfolio, net of recoveries.
(2) The Structural Cost of risk excludes the Provisions for credit losses on loan portfolio, net of recoveries and Total Loans from the Reactiva Peru and FAE Government Programs.
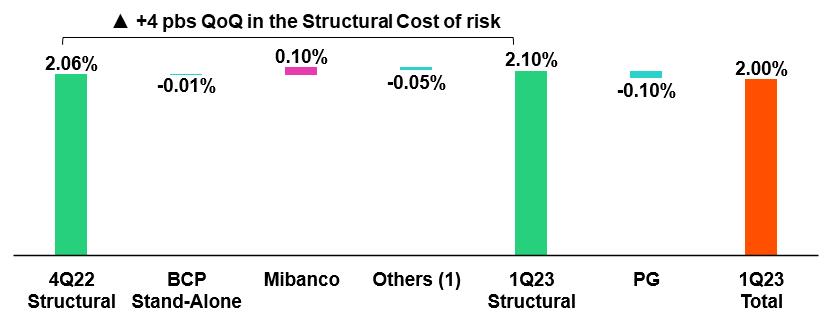
QoQ, structural provisions rose slightly. This led to a 4 bps increase in the structural CofR. The segments that drove the ratio upward were:
| • | SME-Pyme, spurred by a deterioration in payment behavior after the bank incurred in higher-risk segments in 2022. |
| • | Individuals, due to primarily to deterioration in payment behavior in Consumer and Credit Cards given that in 2022, new segments with higher risk profiles were penetrated, and secondarily to an update in macroeconomic factors, which capture new expectations for higher inflation and lower GDP in 2023. |
| • | Mibanco, whose portfolio was severely impacted by an environment punctuated by social protests in the south and intense rains in the north and by updates of macroeconomic factors to better capture deterioration in the macroeconomic context. |
Growth in total provisions was partially offset by a drop in provisions in Wholesale Banking, which experienced a decrease in its exposure level that reflected a reduction in balances and debt payments by clients that were in default.
30
| | | Earnings Release 1Q / 2023 | Analysis of 1Q23 Consolidated Results |
05. Provisions |
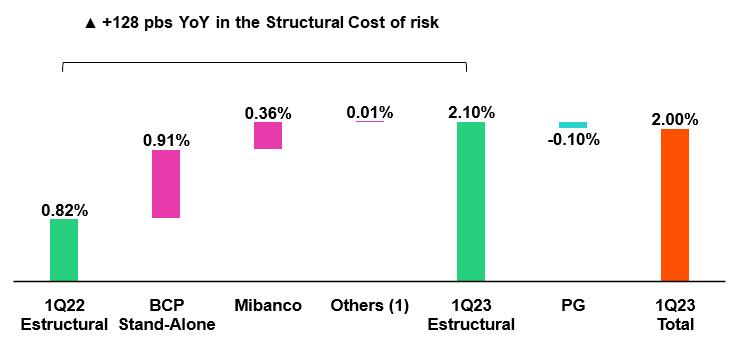
YoY the structural CofR increased 128bp, in line with growth in provisions. The uptick in provisions expenses was driven by
| • | Individuals (Consumer and Credit Cards), spurred, as well the case QoQ, by a deterioration in payment behavior and a low base effect. |
| • | Mibanco, due to the same environmental impacts outlined in the QoQ dynamics and a low base effect. |
| • | SME-Pyme, where provisions levels continue to be high in line with the deterioration of the loan portfolio despite a slight improvement with respect to 1Q22. |
Growth in total provisions expenses was partially offset by a decline in the provisions expense in the Wholesale Banking segments, which registered an improvement in payment behavior with regard to 1Q22.
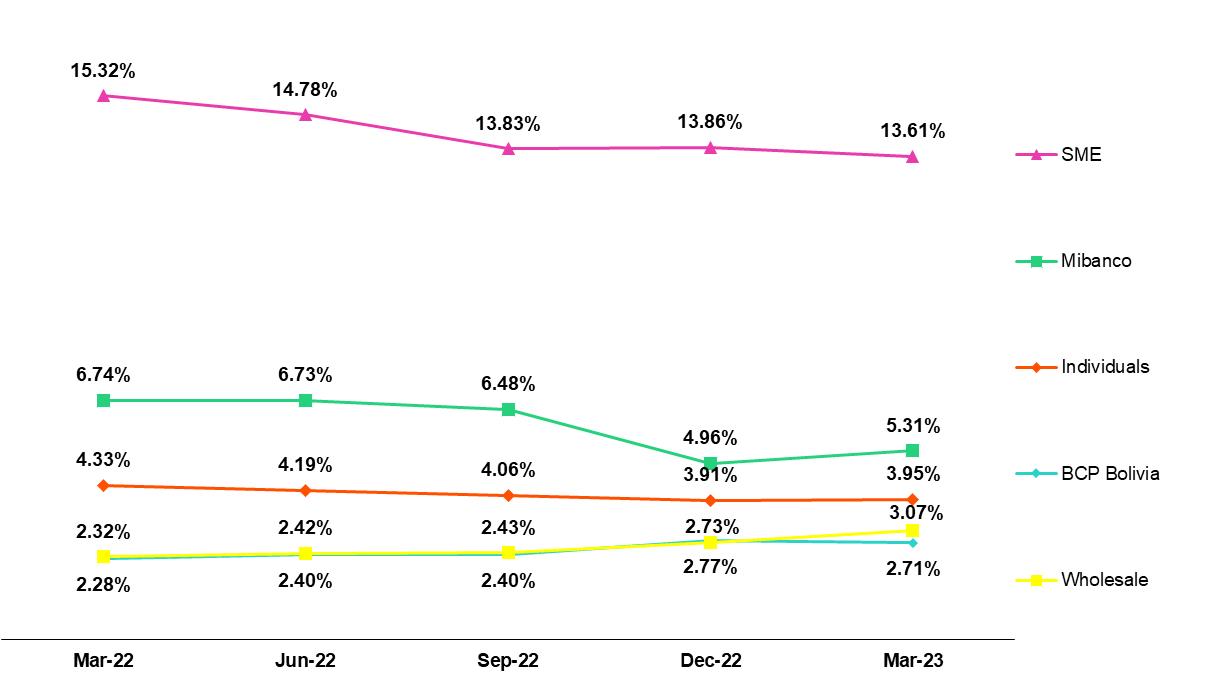
Structural Cost of Risk by Subsidiary
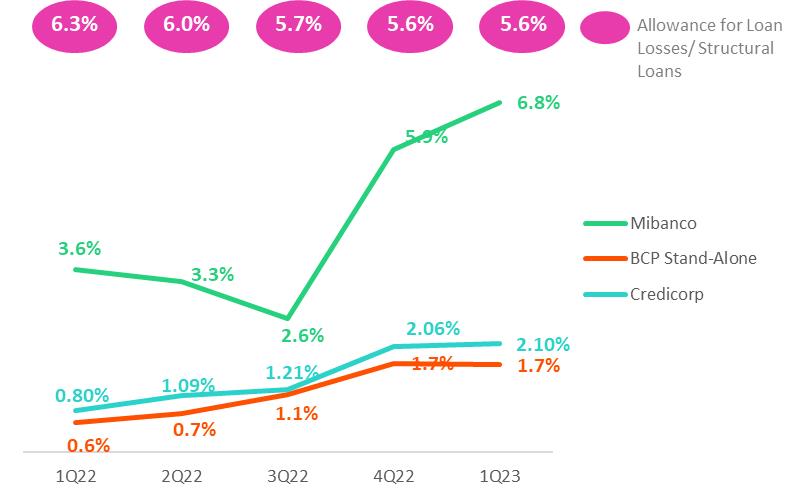
In this context, we are closely monitoring our asset quality metrics and have implemented stricter origination guidelines at specific segments within Consumer, Credit Cards and SME-Pyme. Likewise, since the second half of last year, we have reviewed the risk appetite at Mibanco and turn our focus on clients with better risk profiles.
Provisions and CoR in the Government Loan Portfolio (PG)
| GP Loan Portfolio Provisions | Quarter | % change | |||
| S/ 000 | 1Q22 | 4Q22 | 1Q23 | QoQ | YoY |
| Gross provision for credit losses on loan portfolio | 3,872 | (15,725) | (2,978) | -81.1% | -506.1% |
| Recoveries of written-off loans | - | - | - | - | - |
| Provision for credit losses on loan portfolio, net of recoveries | 3,872 | (15,725) | (2,978) | -81.1% | -176.9% |
GP Cost of risk (1) | -0.09% | 0.66% | 0.17% | -49 bps | 26 bps |
(1) The GP Cost of risk includes the Provisions for credit losses on loan portfolio, net of recoveries and Total Loans from the Reactiva Peru and FAE Government Programs.
GP provisions fell significantly both QoQ and YoY due the fact that honoring processes to execute State guarantees are on-going.
The GP provisions balance represents 1.7% of Credicorp’s total provisions. This relatively small balance is due to the existence of ample state guarantees with coverage levels that range between 80% and 98% of the loan amount. For more information, see 1.2 Portfolio Quality – Government Program Loan NPLs.
Provisions and CoR of Total Portfolio
| Loan Portfolio Provisions | Quarter | % change | |||
| S/ 000 | 1Q22 | 4Q22 | 1Q23 | QoQ | YoY |
| Gross provision for credit losses on loan portfolio | (350,681) | (815,589) | (802,107) | -1.7% | 128.7% |
| Recoveries of written-off loans | 93,091 | 84,908 | 75,109 | -11.5% | -19.3% |
| Provision for credit losses on loan portfolio, net of recoveries | (257,590) | (730,681) | (726,998) | -0.5% | 182.2% |
Cost of risk (1) | 0.71% | 1.97% | 2.00% | 3 bps | 129 bps |
(1) Annualized Provision for credit losses on loan portfolio, net of recoveries / Total Loans.
The CofR of the total portfolio, which is comprised of structural and GP loans, reported growth of 3bps QoQ and 129 bps YoY, which reflected growth in structural provisions.
31
| | | Earnings Release 1Q / 2023 | Analysis of 1Q23 Consolidated Results |
05. Provisions |
QoQ Evolution of the Cost of Risk
YoY Evolution of the Cost of Risk
(1) Others include BCP Bolivia, Mibanco Colombia, ASB Bank Corp and eliminations. |
32
| | | Earnings Release 1Q / 2023 | Analysis of 1Q23 Consolidated Results |
06 Other Income
Other Core Income fell QoQ and YoY by 4.8% and 1.8% respectively. This evolution was driven by drop in the Net gain on FX transactions in BCP, which reflected a decrease in the volatility of the US Dollar and the elimination of the inter-city transfers commission in BCP. Non-core other income increased 31.4% QoQ, which reflects an uptick in other non-financial income at BCP, and rose 124.6% YoY, fueled by growth in Net gains on securities in the Insurance and Pension businesses. | ||
6.1 Other Core Income
| Core Other Income | Quarter | % Change | |||
| (S/ 000) | 1Q22 | 4Q22 | 1Q23 | QoQ | YoY |
| Fee income | 891,628 | 894,552 | 881,781 | -1.4% | -1.1% |
| Net gain on foreign exchange transactions | 259,710 | 293,215 | 248,515 | -15.2% | -4.3% |
| Total other income Core | 1,151,338 | 1,187,767 | 1,130,296 | -4.8% | -1.8% |
QoQ and YoY, other core income fell. This decline was primarily driven by a drop in the Net gain on FX transactions, which was in turn fueled by:
| • | BCP: Exchange rate seasonality. In the last quarter of every year, a seasonal effect leads transaction volumes and income for Net gains on FX transactions to rise. |
| • | BCP Bolivia: The Central Bank of Bolivia restricted purchase/sale of US Dollars, which directly impacted the transactions volume. |
Additionally, net fee income fell due to the elimination of inter-city fees in universal banking. This reduction was partially offset by BCP Bolivia, which increased its fee for foreign transfers from 2.5% to 7.5% of the total transfer amount. For more details, see the section on fee income in the banking business.
Fee income in the banking business
Composition of fee income in the banking business
| Banking Business Fees | Quarter | % Change | |||
| S/ 000 | 1Q22 | 4Q22 | 1Q23 | QaQ | YoY |
Payments and transactionals (1) | 290,197 | 333,779 | 325,994 | -2.33% | 12.34% |
Liability accounts (2) | 217,956 | 226,496 | 177,971 | -21.42% | -18.35% |
Loan Disbursement (3) | 90,576 | 97,336 | 95,201 | -2.19% | 5.11% |
| Off-balance sheet | 60,370 | 63,247 | 61,654 | -2.52% | 2.13% |
| Mibanco (Peru and Colombia) | 33,276 | 34,164 | 59,208 | 73.30% | 77.93% |
| Insurances | 30,303 | 28,617 | 31,102 | 8.68% | 2.64% |
| BCP Bolivia | 27,400 | 24,479 | 37,765 | 54.28% | 37.83% |
| Wealth Management and Corporate Finance | 18,785 | 12,880 | 15,254 | 18.43% | -18.80% |
| ASB | 12,280 | 11,040 | 3,098 | -71.94% | -74.77% |
Others (4) | 4,596 | -16,494 | 12,830 | n.a | 179.15% |
| Total | 785,739 | 815,544 | 820,077 | 0.56% | 4.37% |
(1) Corresponds to fees from: credit and debit cards; payments and collections.
(2) Corresponds to fees from: Account maintenance, interbank transfers, national money orders y international transfers.
(3) Corresponds to fees from retail and wholesale loan disbursements.
(4) Use of third-party network, other services to third parties and Commissions in foreign branches.
Commissions for banking services rose slightly QoQ. This evolution was driven primarily by:
33
| | | Earnings Release 1Q / 2023 | Analysis of 1Q23 Consolidated Results |
06. Other Income |
| a. | Others: Last quarter, fees paid to acquirers were renegotiated, which generated extraordinary payments in 4Q22. In 1Q23, this effect was reversed. |
| b. | Mibanco: Which registered a drop in fees paid to third-parties for business-channeling agreements after the bank negotiated better conditions. |
| c. | BCP Bolivia: Which reported growth in fees from foreign transfers after the interest rate on transfers was raised from 2.5% to 7.5% of the total transaction amount. This offset the drop in FX transactions due to the political juncture. |
The aforementioned was partially offset by:
Passive and Transactional Accounts due to:
| 1. | The elimination of inter-city fees in 4Q22 for both savings and current accounts. In the last few months of 2022, these fees were eliminated, but only in some channels. In 1Q23, the process to eliminate fees across channels was completed. Accordingly, 1Q23 reflects the brunt of the impact of this change. |
YoY, growth in banking fees was driven by:
| 1. | Payment methods and services venues: which was driven by growth in transactions and on-going migration to digital channels and POS, which, unlike cash, generate fee income. YoY growth in billing for debit and credit cards stood at 19% and 26% respectively. |
| 2. | Mibanco: spurred by the same reasons as those discussed for the QoQ evolution and by a drop in fees paid to third parties for business-channeling agreements after the bank negotiated more favorable contract conditions. |
Growth in YoY terms was partially offset by the same drivers as those that offset expansion QoQ.
6.2 Other non-core income
| Non-core Other income | Quarter | % Change | |||
| (S/ 000) | 1Q22 | 4Q22 | 1Q23 | QoQ | YoY |
| Net gain on securities | (56,866) | 77,512 | 70,036 | -9.6% | n.a |
Net gain from associates (1) | 24,014 | 25,422 | 27,212 | 7.0% | 13.3% |
| Net gain on derivatives held for trading | (5,982) | 5,857 | (6,570) | n.a | 9.8% |
| Net gain from exchange differences | (8,363) | 22,039 | 22,963 | 4.2% | n.a |
| Other non-financial income | 135,257 | 19,630 | 84,127 | 328.6% | -37.8% |
| Total other income Non-Core | 88,060 | 150,460 | 197,768 | 31.4% | 124.6% |
(1) Includes gains on other investments, which are mainly attributable to the Banmedica result
QoQ evolution of non-core income
(millions of soles)
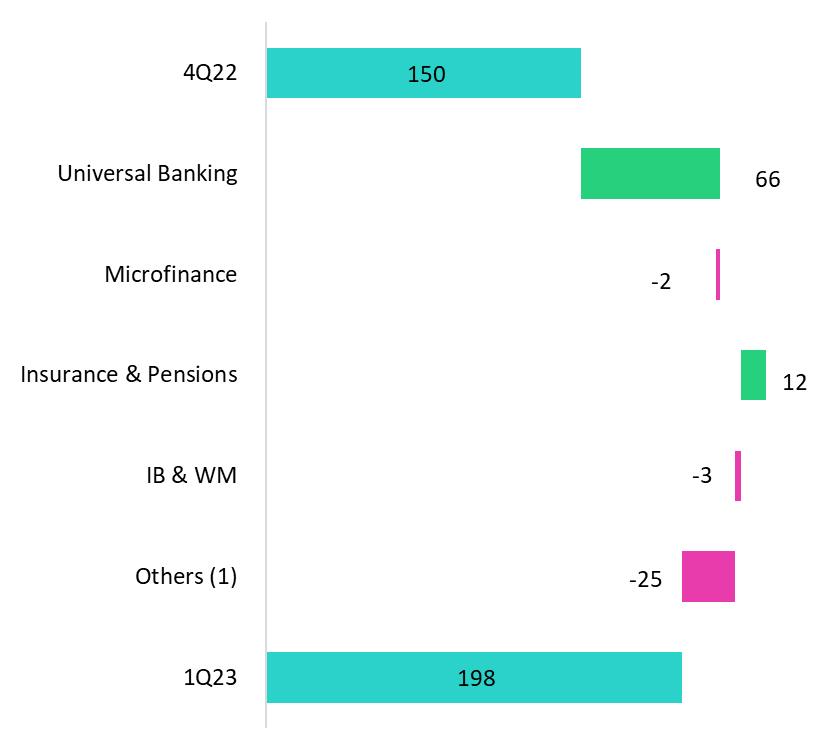
(1) Others includes Grupo Credito, Credicorp Individual, eliminations and others
YoY evolution of non-core income
(millions of soles)
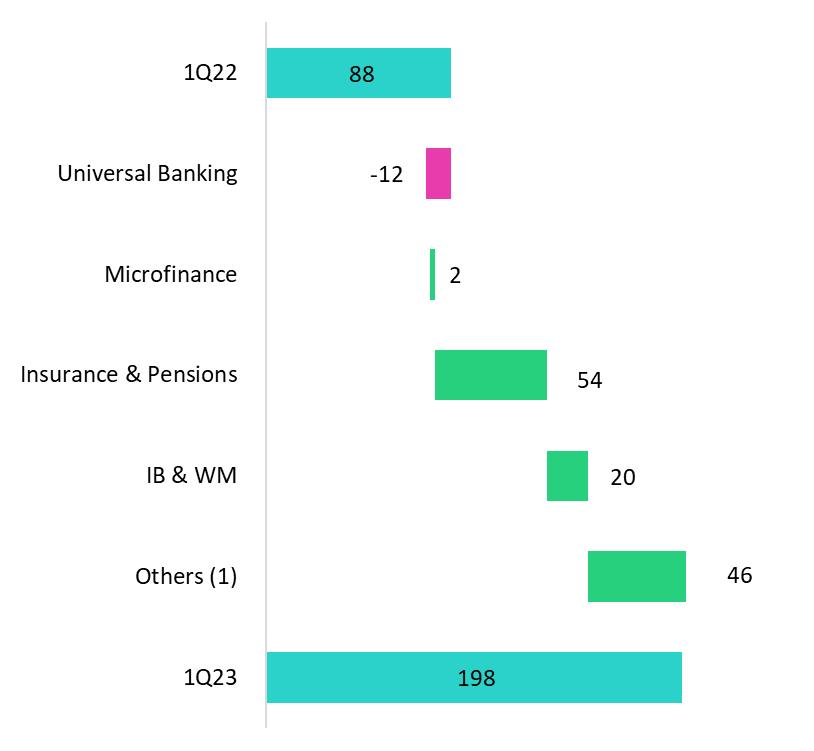
34
| | | Earnings Release 1Q / 2023 | Analysis of 1Q23 Consolidated Results |
06. Other Income |
Other non-core income rose QoQ, which was driven mainly by:
| • | Universal Banking: Due to income from the sale of an overdue and judicial recovery portfolio in retail banking. |
The aforementioned was partially offset by a drop in the Net gain on securities in the Miscellaneous line, which was driven by a drop in the value of Credicorp’s investments in mutual funds.
Other Non-Core Income rose YoY, which was primarily attributable to:
| • | Insurance and Pensions: Growth in the Net gain on securities due to a drop in losses reported on fixed income investments in 1Q22 and to an improvement in the EPS business, where we share 50% of profits, and which generated a direct impact on the investment in the associates line. |
| • | Others: Attributable to an increase in the value of Credicorp’s investments for the purchase of Investment Grade Bonds. |
| • | Investment Banking and Wealth Management: Due to positive results through the trading strategies at Credicorp Capital Colombia and ASB. |
35
| | | Earnings Release 1Q / 2023 | Analysis of 1Q23 Consolidated Results |
07 Insurance Underwriting Results
Introduction of IFRS 17
Insurance contracts combine service and financial aspects and, in many cases, generate long-term variable cash flows. To adequately reflect the impact of these aspects, IFRS 17 combines measuring future cash flows with reporting of insurance contract results during the period that the service is provided. This requires companies to present separate results for insurance, reinsurance and financial results.
IFRS was issued in 2017 to replace IFRS 4 “Insurance Contracts” to ensure that companies apply consistent criteria to improve the usefulness, transparency and comparability of Financial Statements. The standard went into effect in January 2023.
| Components | Benefits | |
Cash flows (premiums, claims and expenses), adjusted according to the discount rate. Risk adjustment (RA), compensation required for assuming non-financial risk. Contractual service margin (CSM), which represents unearned underwriting income that is recognized as income during the coverage period These components are subject to updates of cash flows based on estimates of the amount, temporality and risk of flows and discount rates | Improves the comparability of insurance entities at a global level. IFRS 4 allowed entities to use a broad range of accounting practices for insurance contracts. Adequately reflects the economic value of insurance contracts. Some previous practices for insurance accounting permitted under IFRS did not adequately reflect true underlying financial situations or the financial yields of these insurance contracts. Provides better information to users of financial statements. |
Valuation methods
IFRS 17 introduces different approaches to valuing underwriting provisions based on the product’s characteristics (Contract duration, cash flow)
| • | Premium Allocation Approach (PAA): simplification of the general measurement model. |
| • | Building Block Approach (BBA): general measurement model for default valuation of insurance contracts. |
| • | Variable Fee Approach (VFA): model for contract valuation where cash flows depend on the value of the underlying assets that back said contracts. |
36
| | | Earnings Release 1Q / 2023 | Analysis of 1Q23 Consolidated Results |
07. Insurance Underwriting Results |
Insurance Underwriting Result
| The insurance underwriting result rose 43.4% YoY due to an improvement in the results of Life Insurance. This evolution was attenuated by a drop in P&C’s results. The uptick in Life was mainly driven by D&S and Credit Life, which reflects growth in premiums due to an increase in sales and price adjustments and to a drop in claims for both regular cases and COVID-19. The decrease in P&C’s results reflects an uptick in claims in P&C Risks and Cars. | ||
| Insurance Underwriting Results | Quarter | % Change | Life | % Change | P&C | % Change | Crediseguros | % Change | ||||
| 1Q22 | 1Q23 | YoY | 1Q22 | 1Q23 | YoY | 1Q22 | 1Q23 | YoY | 1Q22 | 1Q23 | YoY | |
| Income from Insurance Contracts | 843,862 | 957,336 | 13.4% | 454,746 | 562,481 | 23.7% | 369,575 | 373,248 | 1.0% | 19,541 | 21,607 | 10.6% |
| Expenses for Insurance Contracts | (534,603) | (550,459) | 3.0% | (282,567) | (270,629) | -4.2% | (240,078) | (272,680) | 13.6% | (11,957) | (7,150) | -40.2% |
| Insurance Results | 309,258 | 406,877 | 31.6% | 172,178 | 291,852 | 69.5% | 129,496 | 100,567 | -22.3% | 7,584 | 14,457 | 90.6% |
| Reinsurance Results | (102,591) | (110,536) | 7.7% | 5,414 | (24,326) | -549.3% | (105,364) | (85,541) | -18.8% | (2,641) | (669) | -74.7% |
| Insurance Underwriting Results | 206,667 | 296,341 | 43.4% | 177,592 | 267,526 | 50.6% | 24,133 | 15,027 | -37.7% | 4,943 | 13,789 | 179.0% |
Income from Insurance Contracts*
P&C
Life Insurance
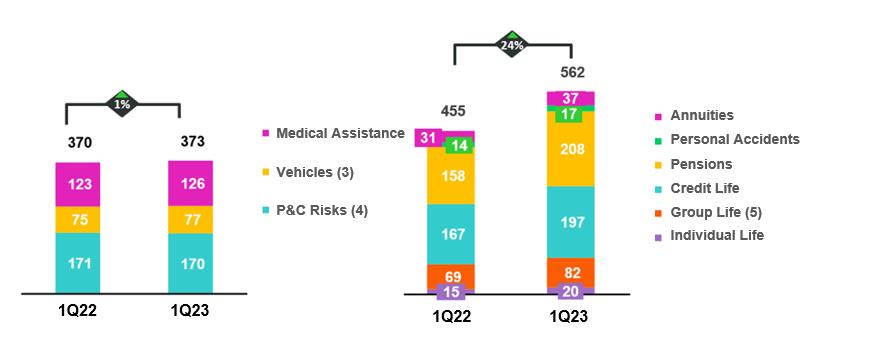
*The products corresponding to Life and P&C businesses have changed from previous reported.
(3) Includes Cars, and SOAT.
(4) Includes Wholesale Risks and Personal Lines without AP.
(5) Includes SCTR (Complementary Insurance for High-risk Occupations, Statutory Life and Group Life.
In the YoY analysis, income from insurance contracts increased 13.4%. This evolution was driven primarily by Life and to a lesser extent, P&C. In the Life business, income was up 23.7%, spurred by (i) D&S, which reflected an improvement in the terms of tender for the SISCO VI contract⁽1⁾ versus those attached to the SISCO V tender; (ii) Credit Life, due to growth in premiums from bancassurance policies at BCP Stand-alone and Banco de la Nación, which was triggered by rate adjustments and loan growth; (iii) Group Life, through the SCTR (Complementary Insurance for High-Risk Occupations). In P&C, income rose 1.0%, driven by Cars and Medical Assistance.
(1) Public tender to select the insurance companies that will collectively manage disability, survivorship and burial risks for AFP affiliates in the 2023 period.
37
| | | Earnings Release 1Q / 2023 | Analysis of 1Q23 Consolidated Results |
07. Insurance Underwriting Results |
Expenses for Insurance Contracts
P&C
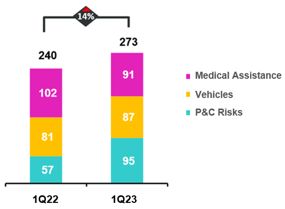
Life Insurance
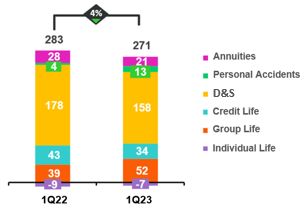
In the YoY analysis, expenses for insurance contracts rose 3.0%, driven by P&C. In the P&C, business, expenses rose 13.6% YoY due to: (i) P&C Risks, through the Card Protection product, which experienced growth in the incidence of unrecognized internet purchases; and (ii) Cars, due to the increase in case frequency. The aforementioned was partially offset by Medical Assistance, which reported a release of COVID-19 IBRN reserves. Life Insurance contracts fell 4.2%, driven mainly by D&S and Credit Life after COVID-19 cases fell in comparison to 1Q22.
Expenses for Reinsurance Contracts
Expenses for reinsurance contracts rose 7.7%. This increase was attributable to the Life Business and led by the D&S product, which registered an uptick in ceded premiums under the new SISCO VI contract. The aforementioned was mitigated by the evolution at the P&C business, which reported growth in claims under our reinsurance policies for P& C Risks.
Insurance Underwriting Results
The insurance underwriting result increased 43.4% YoY, driven by the Life Business. The increase reported in the Life business was driven by growth in premiums and a drop in claims in the Credit Life and D& S lines. The drop reported in the result for P&C was attributable to an increase in claims P&C Risks and Cars, which was mitigated by decrease in claims in Medical Assistance.
38
| | | Earnings Release 1Q / 2023 | Analysis of 1Q23 Consolidated Results |
08 Operating Expenses
Operating expenses rose YoY. This evolution was primarily driven by Administrative and general expenses through the Information Technology (IT) Expenses and Advertising and Fidelity Programs lines. Growth in expenses for these concepts is in line with our transformation strategy and also reflects an uptick in transactions and in costs associated with client fidelity programs. This quarter, Salaries and employee benefits also rose after specialized personnel were hired for IT projects. If we exclude disruption expenses, the YoY variation in Operating expenses stands at 8.9%. | ||
Total operating expenses1
| Operating expenses | Quarter | % change | |||
| S/ 000 | 1Q22 | 4Q22 | 1Q23 | QoQ | YoY |
| Salaries and employees benefits | 939,518 | 1,040,066 | 1,029,558 | -1.0% | 9.6% |
| Administrative, general and tax expenses | 696,065 | 1,042,882 | 835,060 | -19.9% | 20.0% |
| Depreciation and amortization | 151,894 | 165,180 | 160,924 | -2.6% | 5.9% |
| Association in participation | 7,691 | 12,936 | 12,612 | -2.5% | 64.0% |
| Operating expenses | 1,795,168 | 2,261,064 | 2,038,154 | -9.9% | 13.5% |
(1) Due to the application of IFRS 17, which impacts reporting for Insurance contracts, Operating Expenses have been restated and as such, differ with regard to calculations in previous reports. For more details, review annex 12.1.8.
The expense analysis will focus on YoY movements to eliminate seasonality effects between quarters.
Operating expenses continue to rise due to:
| • | Growth in Administrative and general expenses and taxes, mainly at BCP; this uptick was driven by an increase in transactional expenses and fidelity programs, growth in IT expenses related to the transformation strategy; and disruptive expenses. |
| • | An increase in Salaries and employee benefits, which was primarily fueled by growth in expenses for salaries of specialized personnel for disruptive and IT projects. |
If we exclude disruptive expenses, growth stands at 8.9% YoY.
Administrative and general expenses and taxes
| Administrative and general expenses | Quarter | % Change | |||
| S/ 000 | 1Q22 | 4Q22 | 1Q23 | QoQ | YoY |
| IT expenses and IT third-party services | 196,985 | 254,965 | 240,932 | -5.5% | 22.3% |
| Advertising and customer loyalty programs | 110,314 | 212,710 | 135,767 | -36.2% | 23.1% |
| Taxes and contributions | 67,657 | 94,647 | 85,073 | -10.1% | 25.7% |
| Audit Services, Consulting and professional fees | 51,692 | 138,978 | 51,878 | -62.7% | 0.4% |
| Transport and communications | 39,117 | 63,049 | 51,036 | -19.1% | 30.5% |
| Repair and maintenance | 29,913 | 44,734 | 25,790 | -42.3% | -13.8% |
| Agents' Fees | 27,018 | 27,673 | 26,152 | -5.5% | -3.2% |
| Services by third-party | 22,925 | 35,285 | 27,511 | -22.0% | 20.0% |
| Leases of low value and short-term | 20,931 | 25,997 | 25,116 | -3.4% | 20.0% |
| Miscellaneous supplies | 19,077 | 22,848 | 32,993 | 44.4% | 72.9% |
| Security and protection | 15,476 | 16,365 | 15,789 | -3.5% | 2.0% |
| Subscriptions and quotes | 13,012 | 14,271 | 13,086 | -8.3% | 0.6% |
| Electricity and water | 10,550 | 14,865 | 11,497 | -22.7% | 9.0% |
| Electronic processing | 7,693 | 12,225 | 8,730 | -28.6% | 13.5% |
| Insurance | 8,291 | 8,629 | 8,750 | 1.4% | 5.5% |
| Cleaning | 4,506 | 5,368 | 5,162 | -3.8% | 14.6% |
Others (1) | 50,908 | 50,273 | 69,798 | 38.8% | 37.1% |
| Total | 696,065 | 1,042,882 | 835,060 | -19.9% | 20.0% |
(1) Others consists mainly of security and protection services, cleaning service, representation expenses, electricity and water utilities, insurance policy expenses, subscription expenses and commission expenses.
39
| | | Earnings Release 1Q / 2023 | Analysis of 1Q23 Consolidated Results |
08. Operating Expenses |
The 13.5% increase in Credicorp’s expenses in YoY terms was attributable primarily to an uptick in expenses at BCP (46%) and secondarily, to expansion in expenses for our disruptive initiatives (38%). Given that these expenses, when combined, generated 80% of the increase reported YoY, the explanation that follows focuses analyzing movements within each.
Operating Expense per Business
| Operating expenses | Quarter | % change | |||
| S/ 000 | 1Q22 | 4Q22 | 1Q23 | QoQ | YoY |
| BCP | 1,039,586 | 1,332,331 | 1,146,710 | -13.9% | 10.3% |
| Milbanco | 282,253 | 300,155 | 297,780 | -0.8% | 5.5% |
| Pacifico | 58,769 | 88,790 | 64,268 | -27.6% | 9.4% |
| Disruption | 88,684 | 196,125 | 180,481 | -8.0% | 103.5% |
Others (1) | 325,876 | 343,664 | 348,915 | 1.5% | 7.1% |
| Total | 1,795,168 | 2,261,064 | 2,038,154 | -9.9% | 13.5% |
(1) Include Credicorp Capital, ASB, Prima, BCP Bolivia, Mibanco Colombia and other entities within the Group.
In the case of BCP, growth of 10.3% YoY was attributable to recurring expenses, excluding IT and technology expenses:
| • | Recurring expenses excluding Technology |
| • | Growth in expenses for client Fidelity Program, which was driven by an uptick in the consumption of LATAM miles via the use of credit and debit cards at establishments. Billing evolved positively YoY for both debit and credit cards, which registered YoY growth of 19% and 26% respectively. |
| • | Higher expenses were incurred to purchase chips for cards, which were also impacted by an increase in the price of silicon. |
| • | Increase in expenses for special projects, in line with the company’s strategy and to maintain our long-term leadership. |
| • | Technology expenses (IT) |
| • | Growth in the transactions volume led to an uptick in expenses for the use of the bank’s data service centers; |
| • | Additionally, costs to use IT applications, licenses and other software rose to enhance capacities and improve cybersecurity. |
| • | 16% more personnel who specialize in digital capacities were hired; this increase in hiring of this profile led to a consequent 8% uptick in the average salary at BCP. |
Disruption expenses rose 103.5% and represented 9% of OPEX in 1Q23. This growth was driven by investment in improvements in different functionalities and by growth in expenses for specialized personnel, which was led by initiatives such as Yape, Tenpo, Culqi, Tyba and others. Through these initiatives, we seek to strengthen our leadership in the market. If we exclude disruptive expenses, the YoY variation of operating expenses stands at 8.9%.
40
| | | Earnings Release 1Q / 2023 | Analysis of 1Q23 Consolidated Results |
09 Operating Efficiency
| The efficiency ratio improved YoY by 290 bps, in line with an uptick in core income due to growth in net interest income, which reflected the fruits of disciplined pricing management in a context of rising interest rates. | ||
| Operating Efficiency | Quarter | % change | Year | % change | ||||
| S/ 000 | 1Q22 | 4Q22 | 1Q23 | QoQ | YoY | Mar 2022 | Mar 2023 | Mar 2023 / Mar 2022 |
| Operating expenses (1) | 1,795,168 | 2,261,064 | 2,038,154 | -9.9% | 13.5% | 1,795,168 | 2,038,154 | 13.5% |
| Operating income (2) | 3,799,381 | 4,587,457 | 4,602,331 | 0.3% | 21.1% | 3,787,935 | 4,598,052 | 21.4% |
| Efficiency ratio (3) | 47.2% | 49.3% | 44.3% | -500 bps | -290 bps | 47.4% | 44.3% | -310 bps |
Due to the application of IFRS 17, which impacts reporting for Insurance contracts, Operating Income has been restated and as such, differs with regard calculations in previous reports. For more details, review annex 12.1.8
(1) Operating expenses = Salaries and m y ’s benefits + Administrative expenses + Depreciation and amortization + Association in participation + Acquisition cost.
(2) Operating income = Net interest, similar income and expenses + Fee income + Net gain on foreign exchange transactions + Net gain from associates + Net gain on derivatives held for trading + Net gain from exchange differences + Net Insurance Underwriting Results
(3) Operating expenses / Operating income (under IFRS 17)
Efficiency ratio by Subsidiary
The expense analysis will focus on YoY movements to eliminate the effects of seasonality between quarters.
| IFRS 17 | BCP Stand-alone | BCP Bolivia | Mibanco Peru | Mibanco Colombia | Pacifico | Prima AFP | Credicorp |
| 1Q22 | 40.6% | 59.9% | 53.0% | 79.0% | 32.0% | 54.5% | 47.2% |
| 4Q22 | 41.9% | 64.5% | 52.3% | 93.3% | 28.7% | 46.1% | 49.4% |
| 1Q23 | 36.8% | 60.2% | 54.1% | 93.2% | 22.1% | 49.6% | 44.3% |
| Var. YoY | -380 bps | 30 bps | 110 bps | 1420 bps | -990 bps | -490 bps | -290 bps |
To facilitate comparability as we transition from IFRS 4 to IFRS 17, it is important to note that if IFRS 4 had been applicable in 1Q23, Credicorp’s efficiency ratio would have stood at 42.9%
YoY, the efficiency ratio improved. This evolution was driven primarily by growth in core income at BCP Stand-alone. Within core income, growth in net interest income was particularly noteworthy and reflects disciplined pricing management in a context of rising interest rates.
41
| | | Earnings Release 1Q / 2023 | Analysis of 1Q23 Consolidated Results |
10 Regulatory Capital
Credicorp’s Regulatory Capital stood at 1.43 times the minimum level required by the regulatory entity. BCP Stand-alone’s CET1 ratio increased 30 bps to 11.9% An uptick in the balance of Retained Earnings (+57.8%), and Share Capital and Legal Reserves (+1.7%) drove this dynamic. Mibanco’s CET 1 ratio rose 38 bps YoY to stand at 16.4%. Growth in levels for Capital and Reserves and Retained Earnings fueled this dynamic. | ||
Credicorp’s Regulatory Capital Ratio stood 1.43 times above the minimum level required by the regulatory entity at the end of 1Q23. In the QoQ analysis the ratio rose 8 bps, after a drop in loan volumes led to a subsequent decrease in the regulatory capital level.
In the YoY analysis, the Regulatory Capital Ratio fell 8 bps. This evolution reflected an uptick in the regulatory capital levels required for loan portfolios at BCP Stand-alone and Mibanco, which was triggered by growth in loan volumes. The aforementioned increases were partially offset by growth in the balance of Discretionary and Restricted Reserves.
Figures in millions S/.
10.1 Credicorp’s Regulatory Capital
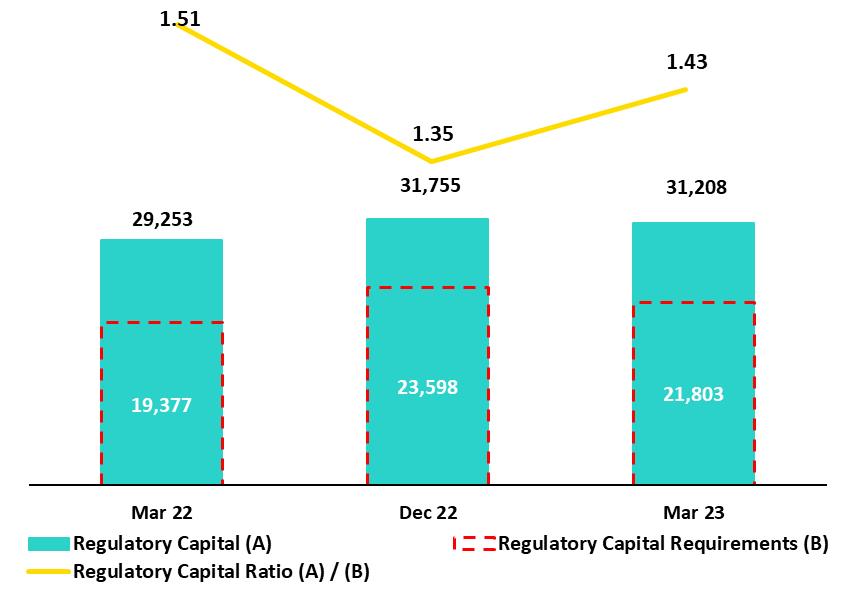
In 2022, to further align local regulations with the methodology and parameters of Basel III, the Superintendency of Banking, Insurance and AFP (SBS) issued a series of rulings that modified the concepts and methodologies used to calculate regulatory capital and solvency ratios and reset minimum thresholds.
Under this regulation, the components that financial entities must use to calculate effective equity for each level are as follows:
| • | Common Equity Tier 1 (CET 1): will include Share Capital + Reserves+ Earnings and Retained Earnings + Unrealized Gains and Losses – Investment in Subsidiaries – Goodwill and Intangibles. |
| • | Tier 1 Capital (Tier 1): will include CET 1 + Tier 1 subordinated debt. |
| • | Global Capital: will include Tier 1 + Tier 2 Subordinated Debt and generic provisions (up to 1.25% of Risk-weighted Assets). |
The changes required by SBS set new minimum limits of capital for each level:
| • | CET 1: minimum of 4.5% of Risk-weighted Assets (RWAs). |
| • | Tier 1: minimum of 6.0% de RWAs. |
| • | Global Capital: minimum of 10.0% of RWAs (2 percentage points above that required by Basel III) |
Additionally, the regulation requires the following buffers: 2.5% of maintenance capital + 2% capital for risk of market concentration risk or systemic risk + 1.5% for economic cycle when the monthly GDP has grown more than 4% in the last 30 months. All of these aspects must be covered by CET 1.
It is important to note that compliance of the aforementioned limits will be gradual with a final effective date set for 2026.
42
| | | Earnings Release 1Q / 2023 | Analysis of 1Q23 Consolidated Results |
10. Regulatory Capital |
10.2 Analysis of Capital at BCP Stand-alone
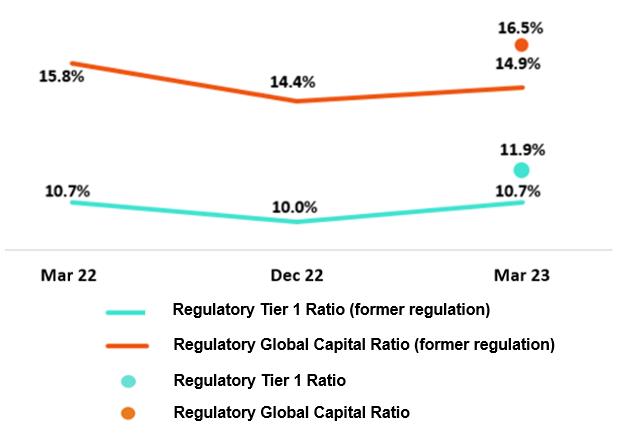
At the end of 1Q23, and based on the parameters of the former regulation, the Regulatory Tier 1 Ratio and Regulatory Global Capital Ratio for BCP Stand-alone stood at 10.7% (+72 bps QoQ) and 14.9% (+50 bps QoQ) respectively. These slight increases were primarily driven by an increase in the balances for Share Capital and Legal Reserves, which rose due to earnings capitalization in 2022. The uptick in these ratios was also impacted, albeit to a lesser extent, by a drop in loan balances for RWAs. In the YoY analysis, the Regulatory Tier 1 Ratio registered no variation.
At the end of 1Q23, and based on the new regulation, the Regulatory Tier 1 Capital Ratio and the Regulatory Global Capital Ratio stood at 11.9% and 16.5% respectively. Both ratios stand above the regulatory minimum.
The Common Equity Tier 1 (CET 1)1 ratio at BCP registered a decrease of 66 bps QoQ and stood at 11.9% at the end of 1Q23. This drop was triggered by dividend declaration, which reduced the balance of Retained Earnings. The reduction in RWA levels, driven by a decrease in the loan volume, partially offset the decrease in this ratio. Finally, in the YoY analysis, the CET 1 ratio rose 30 bps, fueled by (i) an uptick in Retained Earnings and (ii) higher levels of Share Capital and Legal Reserves.
10.3 Analysis of Capital at Mibanco
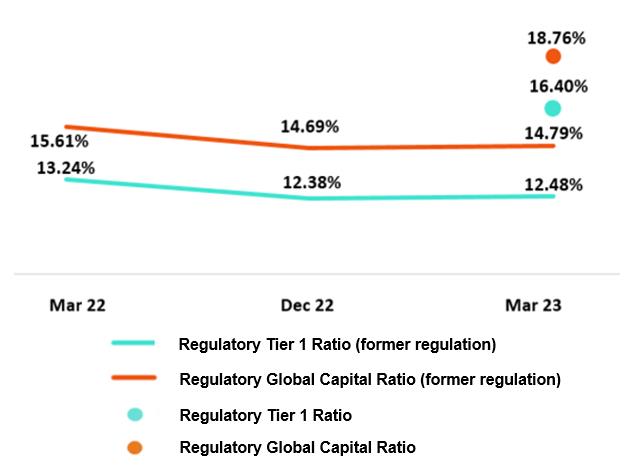
At the end of 1Q23, based on calculations under the previous regulation, Tier 1 and Regulatory Global Capital ratios at Mibanco stood at 12.48% (+10 bps QoQ) and 14.79% (+10 bps QoQ), respectively. These variations reflect the increase in Retained Earnings and an uptick in balances of Reserves. The YoY evolution registered a reduction of 76 bps and 82 bps in the Regulatory Tier 1 and Regulatory Global Capital ratios respectively. Both variations were driven by growth in RWAs, which was associated with loan expansion.
At the end of 1Q23, based on the parameters of the new regulation, the Regulatory Tier 1 Ratio and the Regulatory Global Capital Ratio for Mibanco stood at 16.40% and 18.76% respectively. Both are above the regulatory minimum.
Finally, the CET1 Ratio fell 8 bps QoQ due to an increase in RWAS. Growth in the latter was attributable to a deterioration in the portfolio’s credit risk profile, which reflected the negative impacts of an adverse economic environment in the wake of protests in the south and rains in the north. YoY, this ratio rose 38 bps due to growth in levels of Capital, Reserves and Retained Earnings
1 CET 1, unlike the other capital ratios, is calculated in accordance with IFRS.
43
| | | Earnings Release 1Q / 2023 | Analysis of 1Q23 Consolidated Results |
11 Economic Outlook
In 1Q23, the Peruvian economy is estimated to have contracted slightly by around 0.4% YoY (compared to 1.7% YoY in 4Q22), affected by social protests in January and February and intense rains and floods caused by Cyclone Yaku in March. These factors exacerbated the slowdown that was already being observed in non-primary sectors, with private consumption continuing to lose momentum and private investment deteriorating. The annual inflation rate closed the year at 8.4% YoY, remaining close to its 26-year high (8.8% in 2Q22). On the other hand, real GDP is estimated to grow by 1.8% this year. According to the Central Reserve Bank of Peru (BCRP), the exchange rate closed at USDPEN 3.7617 in 1Q23, representing an appreciation of 1.3% compared to the end of 4Q22 and a depreciation of 1.9% compared to a year ago. | ||
Peru: Economic Forecast
| Peru | 2018 | 2019 | 2020 | 2021 | 2022 | 2023 (3) |
| GDP (US$ Millions) | 226,856 | 232,447 | 205,553 | 225,953 | 244,752 | 263,866 |
| Real GDP (% change) | 4.0 | 2.2 | -11.0 | 13.6 | 2.7 | 1.8 |
| GDP per capita (US$) | 7,045 | 7,152 | 6,300 | 6,840 | 7,329 | 7,809 |
| Domestic demand (% change) | 4.1 | 2.2 | -9.9 | 14.7 | 2.3 | 0.9 |
| Gross fixed investment (as % GDP) | 22.2 | 22.5 | 21.1 | 25.2 | 25.4 | 24.2 |
| Financial system loan without Reactiva (% change) (1) | 10.3 | 6.4 | -4.3 | 12.6 | 9.7 | 5.0 |
| Inflation, end of period(2) | 2.2 | 1.9 | 2.0 | 6.4 | 8.5 | 4.8 |
| Reference Rate, end of period | 2.75 | 2.25 | 0.25 | 2.50 | 7.50 | 6.75 |
| Exchange rate, end of period | 3.37 | 3.31 | 3.62 | 3.99 | 3.81 | 3.80 |
| Exchange rate, (% change) | 4.0% | -1.8% | 9.3% | 10.3% | -4.5% | -0.3% |
| Fiscal balance (% GDP) | -2.3 | -1.6 | -8.9 | -2.5 | -1.6 | -2.0 |
| Public Debt (as % GDP) | 25.6 | 26.6 | 34.6 | 35.9 | 34.0 | 33.8 |
| Trade balance (US$ Millions) | 7,201 | 6,879 | 8,196 | 14,927 | 9,565 | 9,000 |
| (As % GDP) | 3.2% | 3.0% | 4.0% | 6.6% | 3.9% | 3.4% |
| Exports | 49,066 | 47,980 | 42,905 | 63,151 | 65,834 | 64,800 |
| Imports | 41,866 | 41,101 | 34,709 | 48,223 | 56,269 | 55,800 |
| Current account balance (US$ Millions) | -2,895 | -1,680 | 2,398 | -5,179 | -10,644 | -9,157 |
| Current account balance (As % GDP) | -1.3% | -0.7% | 1.2% | -2.3% | -4.3% | -3.5% |
| Net international reserves (US$ Millions) | 60,121 | 68,316 | 74,707 | 78,495 | 71,883 | 72,000 |
| (As % GDP) | 26.5% | 29.4% | 36.3% | 34.7% | 29.4% | 27.3% |
| (As months of imports) | 17 | 20 | 26 | 20 | 15 | 15 |
Sources: INEI, BCRP, y SBS.
(1) Financial System, Current Exchange Rate
(2) Inflation target: 1% - 3%
(3) Grey area indicates estimates by BCP Economic Research as of April 2023
44
| | | Earnings Release 1Q / 2023 | Analysis of 1Q23 Consolidated Results |
11. Economic Outlook |
Main Macroeconomic Variables
Gross Domestic Product
(Annual Variations, % YoY)
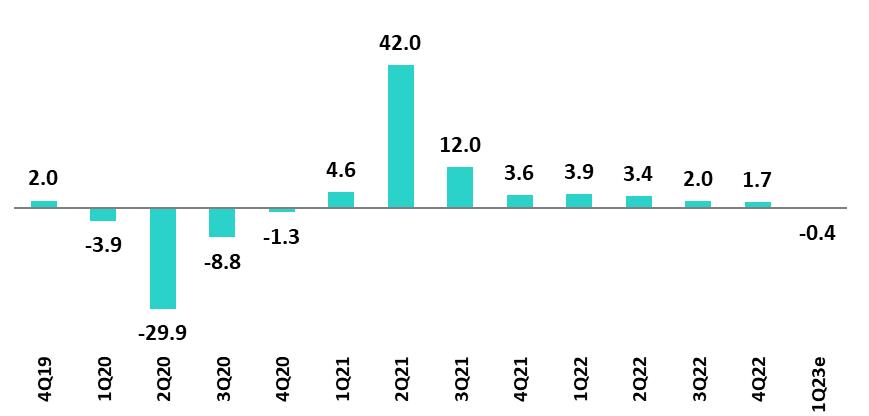
Sources: BCRP
In 1Q23, the Peruvian economy is expected to slightly contract around 0.4% YoY (4Q22 1.7% YoY) affected by the social protests of January and February and the heavy rains and floods caused by the Cyclone Yaku. These factors exacerbated the slowdown that was already taking place in the non-primary sectors as private consumption continues losing dynamism and private investment deteriorates. In the primary sector, growth in copper production from Quellaveco would have attenuated the impact of this events. According to INEI, the monthly economic activity index fell 0.6% YoY in February and 1.1% YoY in January.
Annual Inflation and Central Bank Reference Rate
(%)
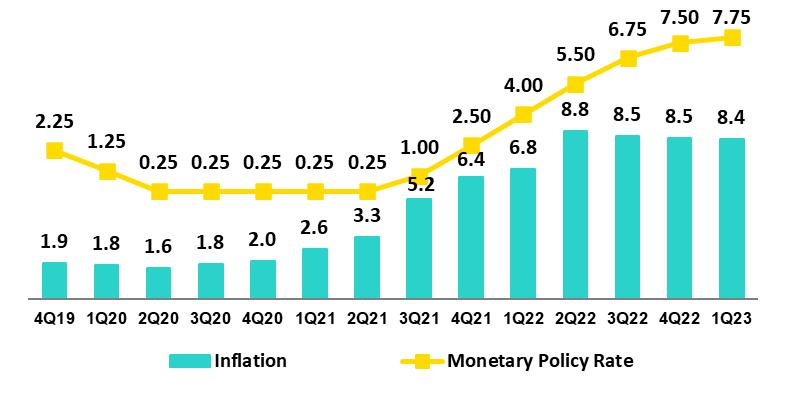
Sources: BCRP and INE
Inflation, measured using the Consumer Price index of Lima Metropolitana, closed 1Q23 at 8.4% YoY, accumulating eleven consecutive months above 8.0% YoY and remains close to its highest level in 26 years (8.8% YoY in June 2022). In the same period, core inflation (excludes food and energy) stood at 5.9% YoY, highest in 23 years. As of March 2023, inflation expectations of the financial system for late 2023 and late 2024 stood at 5.00% and 3.50%, both above the upper bound of the BCRP´s target range between 1% and 3%.
The Central Bank of Perú (BCRP) increased its monetary policy rate from 0.25% in July 2021 to 7.75% in January 2023, a historical high. On its February meeting, it surprised markets by keeping its rate stable, decision that was repeated at its March and April meeting.
45
| | | Earnings Release 1Q / 2023 | Analysis of 1Q23 Consolidated Results |
11. Economic Outlook |
Fiscal Balance and Current Account Balance
(% of GDP, Quarter)
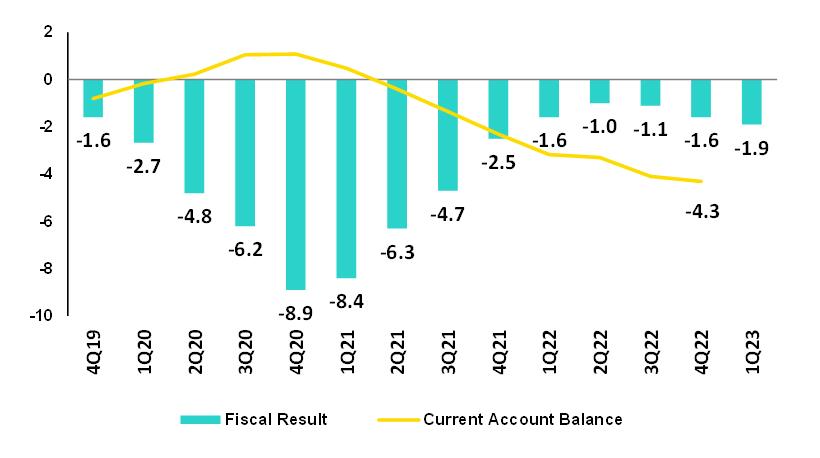
The annualized fiscal deficit in the last 12 months to March 2023 was 1.9% of GDP, higher than in December 2022 (1.6% of GDP). In 1Q23, the increase was explained, to a greater extent, by less dynamic tax revenues (+1.0% YoY), mainly due to lower revenues from the regularization of income tax. Non-financial spending grew 8.7% YoY, reflecting an increase in current expenditures (+7.2% YoY) and capital expenditures (14.4% YoY), related to public investment.
Source: BCRP* Estimate: BCP |
In January 2023, Moody’s changed the outlook for Peru’s long-term debt in foreign currency to negative from stable (and kept the credit rating at Baa1). This decision came after Fitch and Standard & Poor’s changed the outlook to negative in October and December, respectively, and affirmed their credit rating in BBB
Regarding the external accounts, the current account deficit closed Q422 at 4.3% of GDP in accumulated terms for the last 4 quarters.
The 12-month accumulated trade balance surplus to February 2023 was USD 8.7 billion, lower than the registered in January of USD 9.5 billion and far from the historical record of USD 16.1 billion of March 2022. Exports, on the same period, fell 1.9% YoY to USD 64.1 billion, driven by lower volumes and prices, while imports grew 11.9 YoY to USD 55.5 billion.
Terms of trade fell 7.0% YoY in February 2023 due to an 8.1% YoY drop in export prices, mainly lower natural gas, zinc and copper prices and a contraction of 1.2% YoY in imports prices. In YTD, terms of trade increased 1.7% and are 10.6% above October 2022 levels (lowest print since April 2020).
Exchange Rate
(PEN per USD)
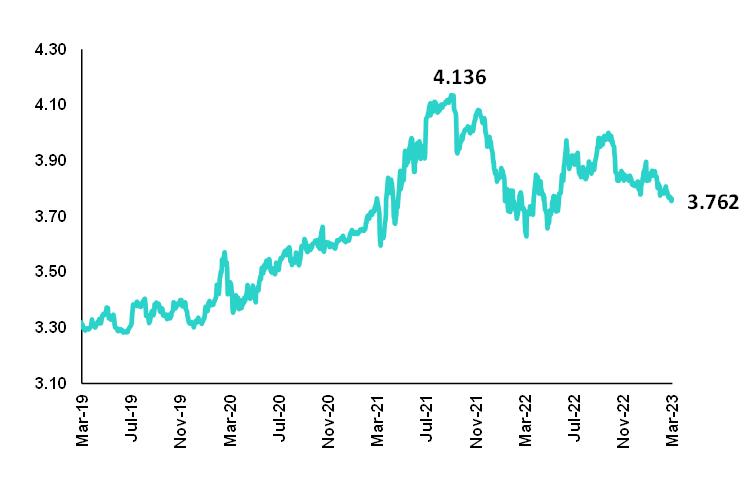
1.0 billion compared to the end of 4Q22.
According to the BCRP, the exchange rate closed 1Q23 in USDPEN 3.7617, an appreciation of 1.3% compared to the end of 4Q22 and a depreciation of 1.9% compared to one year ago. In the same period, Latam main currencies also appreciated compared to the previous quarter due to the weakening of the global dollar and still high commodity prices. Thus, the Mexican peso appreciated 7.5%, the Chilean peso 6.5%, the Brazilian Real 4.2% and the Colombian Peso 3.9%.
Net International Reserves closed 1Q23 at USD 72.7 billion, above 4Q22 (USD 71.9 billion) but below 1Q22 (USD 75.3 billion). The Central Bank’s foreign exchange position stood at USD 53.0 billion, a slight increase of USD 1.0 billion compared to the end of 4Q22.
During 1Q23, the BCRP intervened only once in the FX spot market selling USD 1 million, lower than the net sales of USD 10 million in 4Q22, which were also done in a one-day operation. In 2022, the BCRP sold USD 1.2 billion in the spot market (equivalent to 10% of 2021 net sales), with the intervention concentrated in the first semester of the year.
46
| | | Earnings Release 1Q / 2023 | Analysis of 1Q23 Consolidated Results |
Safe Harbor for Forward-Looking Statements |
This material includes “forward-looking statements” within the meaning of Section 27A of the U.S. Securities Act of 1933 and Section 21E of the U.S. Securities Exchange Act of 1934. All statements other than statements of historical fact are forward-looking and may contain information about financial results, economic conditions, trends and known uncertainties. Forward-looking statements are not assurances of future performance. Instead, they are based only on our management’s current views, beliefs, expectations and assumptions regarding the future of our business, future plans and strategies, projections, anticipated events and trends, the economy and other future conditions.
Many forward-looking statements can be identified by words such as: “anticipate”, “intend”, “plan”, “goal”, “seek”, “believe”, “project”, “estimate”, “expect”, “strategy”, “future”, “likely”, “would”, “may”, “should”, “will”, “see” and similar references to future periods. Examples of forward-looking statements include, among others, statements or estimates we make regarding guidance relating to losses in our credit portfolio, efficiency ratio, provisions and non-performing loans, current or future market risk and future market conditions, expected macroeconomic events and conditions, our belief that we have sufficient capital and liquidity to fund our business operations, expectations of the effect on our financial condition of claims, legal actions, environmental costs, contingent liabilities and governmental and regulatory investigations and proceedings, strategy for customer retention, growth, governmental programs and regulatory initiatives, credit administration, product development, market position, financial results and reserves and strategy for risk management.
We caution readers that forward-looking statements involve known and unknown risks and uncertainties that could cause actual results, performance or events to differ materially from those that we expect or that are expressed or implied in the forward-looking statements, depending on the outcome of certain factors, including, without limitation, adverse changes in:
• The occurrence of natural disasters or political or social instability in Peru;
• The adequacy of the dividends that our subsidiaries are able to pay to us, which may affect our ability to pay dividends to shareholders and corporate expenses;
• Performance of, and volatility in, financial markets, including Latin-American and other markets;
• The frequency, severity and types of insured loss events;
• Fluctuations in interest rate levels;
• Foreign currency exchange rates, including the Sol/US Dollar exchange rate;
• Deterioration in the quality of our loan portfolio;
• Increasing levels of competition in Peru and other markets in which we operate;
• Developments and changes in laws and regulations affecting the financial sector and adoption of new international guidelines;
• Changes in the policies of central banks and/or foreign governments;
• Effectiveness of our risk management policies and of our operational and security systems;
• Losses associated with counterparty exposures;
• The scope of the coronavirus (“COVID-19”) outbreak, actions taken to contain the COVID-19 and related economic effects from such actions and our ability to maintain adequate staffing; and
• Changes in Bermuda laws and regulations applicable to so-called non-resident entities.
See “Item 3. Key Information—3.D Risk Factors” and “Item 5. Operating and Financial Review and Prospects” in our most recent Annual Report on Form 20-F filed with the U.S. Securities and Exchange Commission for additional information and other such factors.
You are cautioned not to place undue reliance on these forward-looking statements, which speak only as of the date hereof and are based only on information currently available to us. Therefore, you should not rely on any of these forward-looking statements. We undertake no obligation to publicly update or revise these or any other forward-looking statements that may be made to reflect events or circumstances after the date hereof, whether as a result of changes in our business strategy or new information, to reflect the occurrence of unanticipated events or otherwise.
47
| | | Earnings Release 1Q / 2023 | Analysis of 1Q23 Consolidated Results |
12 Appendix
| 12.1. Implementation of IFRS 17 – Restatement of figures and ratios for 2022 | 49 | |
| 12.1.1. Introduction to the new standards IFRS 17 | 49 | |
| 12.1.2. Conceptual Framework | 49 | |
| 12.1.3. Recognition of Profit and Loss | 49 | |
| 12.1.4. Valuation Methods | 49 | |
| 12.1.5. Impact on Equity Under IFRS 17 | 50 | |
| 12.1.6. Reformulation of Profit and Loss Statement at Pacífico Grupo Asegurador for year 2022 | 50 | |
| 12.1.7. Reformulation Credicorp’s Profit and Loss Statement for year 2022 | 51 | |
| 12.1.8. Changes in the Methodology to Calculate Financial Indicators and their Reformulation for the year 2022 | 51 | |
| 12.1.9. Glossary of Terms Under IFRS 17 | 54 | |
| 12.2. Physical Point of contact | 54 | |
| 12.3. Loan Portfolio Quality | 55 | |
| 12.4 Net Interest Income (NII) | 60 | |
| 12.5. Regulatory Capital | 61 | |
| 12.6. Financial Statements and Ratios by Business | 66 | |
| 12.6.1. Credicorp Consolidated | 66 | |
| 12.6.2. Credicorp Stand-alone | 68 | |
| 12.6.3. BCP Consolidated | 69 | |
| 12.6.4. BCP Stand-alone | 71 | |
| 12.6.5. BCP Bolivia | 73 | |
| 12.6.6. Mibanco | 74 | |
| 12.6.7. Prima AFP | 75 | |
| 12.6.8. Grupo Pacifico | 76 | |
| 12.7. Table of calculations | 79 | |
| 12.8. Glossary of terms | 80 | |
48
| | | Earnings Release 1Q / 2023 | Analysis of 1Q23 Consolidated Results |
12. Appendix |
12.1. Implementation of IFRS 17 – Restatement of figures and ratios for 2022
12.1.1. Introduction to the new standards IFRS 17
IFRS 17 was published in May 2017 as a replacement to IFRS 4 “Insurance Contracts.” The aim of this change is to ensure that consistent measurement criteria are applied to improve transparency and the comparability of Financial Statements. The new standard became effective in January 2023.
The primary objectives of this standard include:
| (i) | Improving comparability between insurers at the global level. IFRS 4 allowed entities to use a wide variety of accounting practices with regard to insurance contracts. |
| (ii) | Adequately reflecting the economic value of insurance contracts. Some previous accounting practices allowed under IFRS failed to adequately reflect real underlying financial situations or the financial yields on insurance contracts. |
| (iii) | Providing more useful information to users of financial statements. |
12.1.2. Conceptual Framework
Insurance contracts combine attributes of risk coverage, provision of services and instruments of investments and by nature, generate cash flows (outflows such as claims payments, redemptios, expirations, pensions, attributable expenses, income such as premiums) during their term.
The difference between expected outflows and inflows (fulfillment cashflows), combined with recognition of cash value over time, constitute the best estimate of the company’s obligations. Due to potential underwriting deviations relative to expected flows, an additional reserve, known as Risk Adjustment (RA) must be set aside and the underwriting income that the company expects to obtain from its current product portfolio constitutes the Contractual Service Margin (CSM). These 3 concepts, combined with the claims reserves (including reserves for pending claims, IBNR reserves and liquidation expenses) constitute the company’s liabilities.
12.1.3. Recognition of Profit and Loss
The P & L under IFRS shows the difference between a company’s expected cash flows (valued in liabilities) and real flows that occur. Anticipated flows must be based on realistic parameters that reflect the company’s actual experience and current market interest rates.
The standard also requires that results be separated into 3 blocks: (i) Insurance service (or direct insurance), (ii) Reinsurance and (iii) Financial Results. This structure allows users to visualize the company’s sources of income.
Unlike IFRS4, which recognized profit and losses on products during their term, IFRS17 stipulates that expected losses must be recognized at a single moment, meaning upon issuance of policies, while recognition of underwriting income (CSM) must be made gradually over the effective period of products.
The company chose the Other Comprehensive Income (OCI) option, which recognizes movements of reserves generated by underwriting issues within the Profit and Loss Statement (changes in mortality, expenses, redemptions, etc.) while within Equity, only variations in liabilities generated by changes in interest rates are recognized. This variation produces an offset to that generated by investments that back reserves and lends stability to the Balance Sheet and the Profit and Loss Statement.
12.1.4. Valuation Methods
IFRS 17 introduces different approaches to valuate underwriting provisions based on the product’s characteristics (contract duration, cash flow).
| • | General Method (GM) or Building Block Approach (BBA): general default model valuation of insurance contracts. |
| • | Variable Fee Approach (VFA): model for contract valuation in which cash flows depend on the value of the underlying assets that back said contracts |
| • | Premium Allocation Approach (PAA): simplification of the general model. |
49
| | | Earnings Release 1Q / 2023 | Analysis of 1Q23 Consolidated Results |
12. Appendix |
12.1.5. Impact on Equity Under IFRS 17
The impact of the implementation of the IFRS 17 standard on the net equity balance of Pacífico Seguros is not material, registering at the end of December 2022 a net equity under IFRS 17 which is S/ 10 million greater than the net equity calculated under IFRS 4.
It should be mentioned that as of the end of December 2021 (date of the “first application” of the standard), the net equity of Pacífico Seguros under IFRS 17 was S/ 211 million less than the net equity registered under IFRS 4. This initial gap narrowed during 2022 as a result of a contraction in the value of liabilities under IFRS 17, associated with the interest rates increases.
12.1.6. Reformulation of Profit and Loss Statement at Pacífico Grupo Asegurador for year 2022
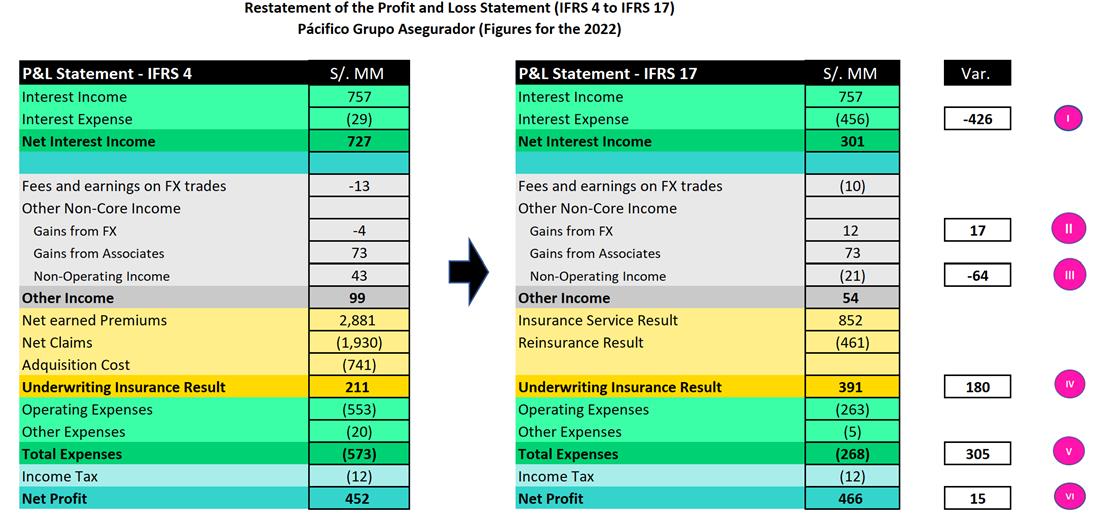
| I. | A new sub-account, “Financial Expenses associated with insurance and reinsurance activities, net” is included in the account for Interest Expenses at Pacifico Seguros. This concept corresponds to interest accredited to reserves. This interest is attributable to an update of the present value of said reserves to the date of the close of the period. This concept was previously presented as part of reserves adjustment included in the underwriting result under IFRS4. IFRS17 separates the financial component from the underwriting component. |
| II. | An impact is registered in the “Gain on exchange rate difference” line because the structure of the assets and liabilities related to insurance activities has been modified. The monetary position of these assets and liabilities changes due to the way that assets and liabilities are recognized under IFRS17. |
| III. | Some concepts of income that were previously registered (under IFRS 4) as “Non-Operating Income” are now (under IFRS 17) reclassified and included in the cash flows associated with insurance contracts. As such, these concepts are now part of the Insurance Underwriting Result. |
| IV. | Recognition of insurance underwriting income is completely different under IFRS 17. IFRS 17 recognizes that insurance contracts combine financial and service characteristics, and in many cases generate variable cash flows in the long-term. To adequately reflect these characteristics, IFRS combines measurements of future cash flows with recognition of the results of the insurance contract throughout the period in which the service is provided. IFRS 17 requires present value measurements of insurance obligations where estimates are recalculated in each reporting period. Contracts are measured using the components of: (i) Fulfilment Cash Flows, (ii) An explicit adjustment for risk or uncertainty of flows, or “Risk Adjustment” and (iii) a Contractual Service Margin, which represents unaccrued underwriting income associated with the contract. This Contractual Service Margin is recognized as income during the coverage term. Insurance contracts combine |
50
| | | Earnings Release 1Q / 2023 | Analysis of 1Q23 Consolidated Results |
12. Appendix |
financial and service characteristics, whereas IFRS combines future cash flows with registry of the results of the insurance contract during the service provision period.
| V. | One of the changes generated by the application of IFRS 17 is that it sets forth a new concept for costs that are directly associated with obtaining and fulfilling insurance contracts. Said costs are denominated “Attributable Costs” and are included in the expected flows for the disbursements associated with these contracts. Under IFRS 4, some of these expenses were included in Total Expenses. |
| VI. | The aggregate impact of implementing IFRS 17 in the Net Earnings of Pacifico Grupo Asegurador is not material and stands at S/15 million for the year 2022. |
12.1.7. Reformulation of Credicorp’s Profit and Loss Statement for year 2022
Below, we reformulate Credicorp’s Profit and Loss Statement. As is evident in the image below, the impact of implementing IFRS at Pacífico Grupo Asegurador translates to Credicorp account by account in identical or highly similar amounts. The aggregate impact of implementing IFRS 17 on the Net Earnings of Credicorp is not material and amounts to S/15 million.
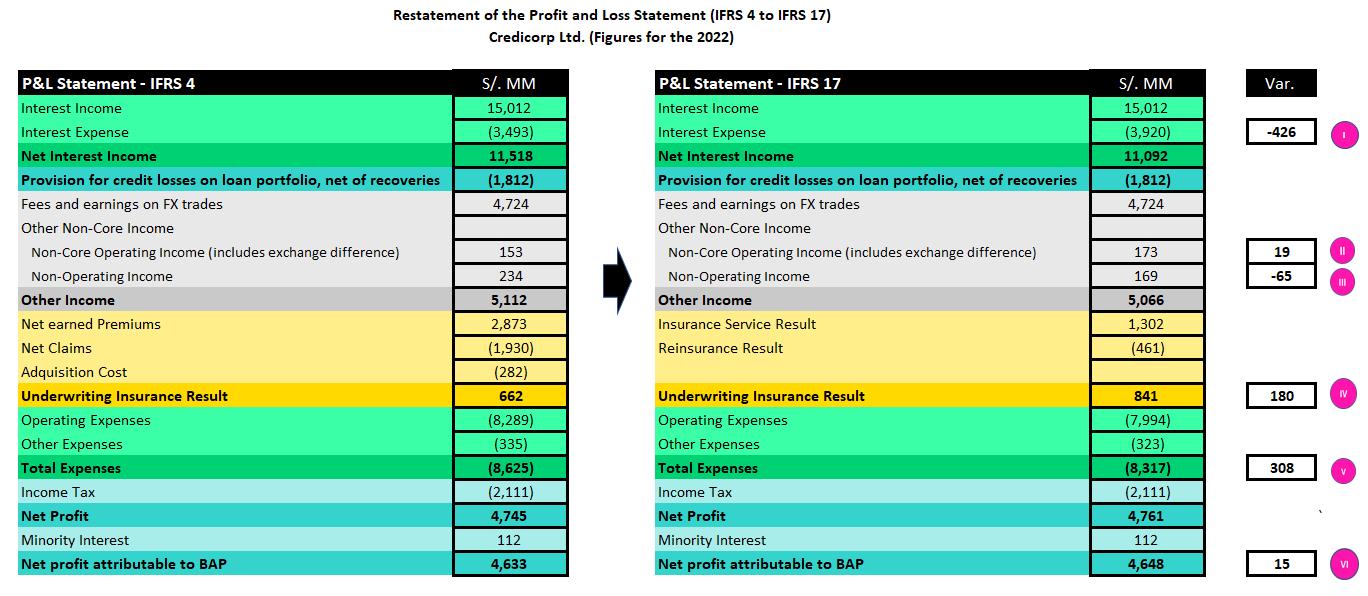
12.1.8. Changes in the Methodology to Calculate Financial Indicators and their Reformulation for the year 2022
| I. | Net Interest Margin |
The Net Interest Margin is reformulated in the following way:
Under IFRS 4, the numerator of the Net Interest Margin was comprised of the difference between Interest Income and Interest Expenses. Under IFRS 17, we need to adjust the formula because Interest Expenses now include the concept “Financial Expense associated with the insurance and reinsurance activity, net.” We seek to exclude the impact of this concept on the Net Interest Margin given that this particular kind of interest expense is not associated with a source of funding. As such, we adjust the numerator by reincorporating “Financial Expense associated with insurance and reinsurance activity, net” to “Net Interest Income” calculated under IFRS 17. It is important to note that as a result of this adjustment, the numerator of the Net Interest Margin under IRFS4 is identical to that seen under IFRS 17.
From now on, we will exclude from the denominator (average balance of Interest-earning Assets) the following: the balance associated with the account “Financial Assets at Fair Value through P&L” given that this account is primarily comprised of investments associated from Investment Link contracts, which do not accrue interests for Credicorp. This change is not related to IFRS 17.
Below, we present the aforementioned change in graphic form.
51
| | | Earnings Release 1Q / 2023 | Analysis of 1Q23 Consolidated Results |
12. Appendix |
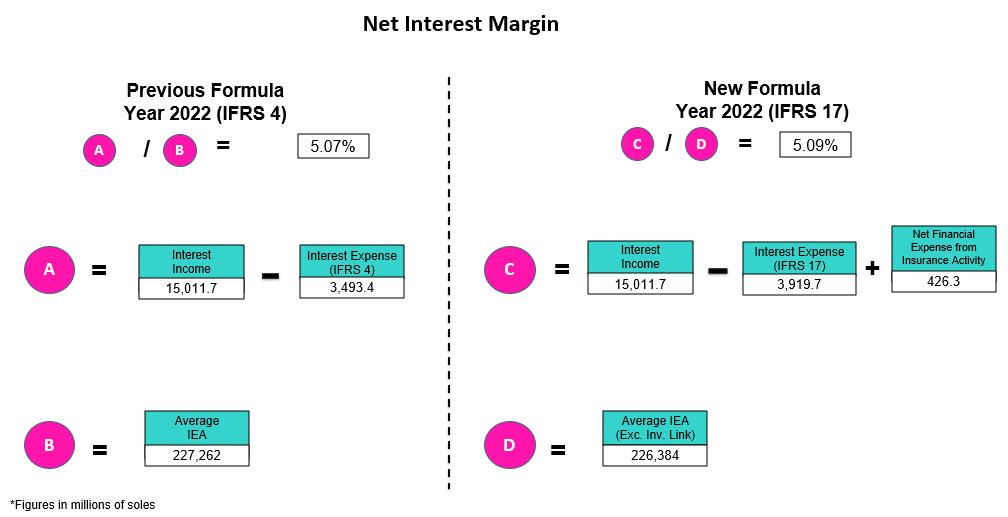
| II. | Funding Cost |
The Funding Cost indicator is being reformulated as follows: under IFRS 4, the numerator of the Funding Cost is comprised of the balance of the “Interest Expenses” account while under IFRS 17, we must adjust the formula given that Interest Expenses now include the concept of “Financial expense associated with insurance and reinsurance activity, net.” We seek to exclude the impact of this new concept on the Funding Cost given that this particular type of expense is not associated with a source of funding. As such, we adjust the numerator by deducting the “Financial Expense associated with insurance and reinsurance activity, net” from “Interest Expenses “calculated under IFRS 17. It is important to note that as a result of this adjustment, the figure for the Funding Cost under IFRS is identical to the same figure under IFRS 17. The following figure is a graphic representation of the aforementioned change.
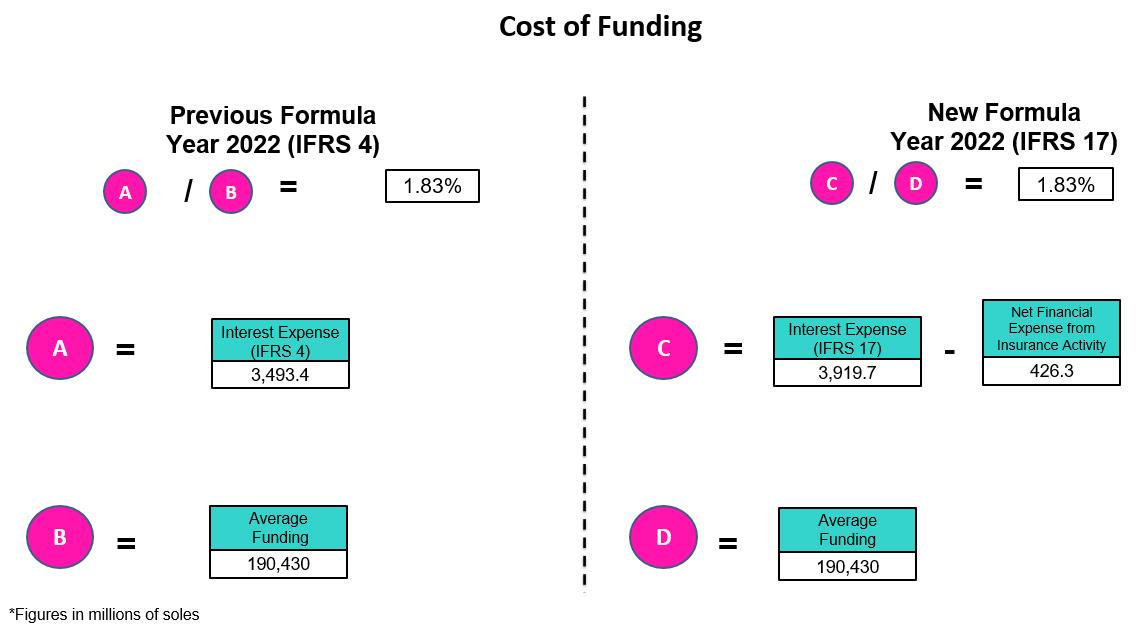
52
| | | Earnings Release 1Q / 2023 | Analysis of 1Q23 Consolidated Results |
12. Appendix |
| III. | Efficiency Ratio |
The Efficiency Ratio is being reformulated as follows:
Under IFRS 4, the numerator of the Efficiency Ratio is comprised of the total of the “Salaries and Employee Benefits,” “Administrative Expenses,” “Depreciation and Amortization,” “Expenses for Participation in Association,” and the “Acquisition Cost” accounts. Collectively, these accounts constitute “Operating Expenses.” Under IFRS 17, we make an adjustment to the components of this group of “Operating Expenses” given that the “Acquisition Cost” no longer exists in the Profit and Loss Statement under IFRS 17. Consequently, under IFRS 17, the grouping of “Operating Expenses” is comprised solely of “Salaries and Employee Benefits,” “Administrative Expenses,” “Depreciation and Amortization,” and “Expenses for Participation in Association.” It is important to note that balances of these accounts under IFRS17 are not the same as the balances of the accounts with the same name under IFRS17.
Under IFRS 4, the denominator of the Efficiency Ratio is comprised of the total of the accounts grouped as Core Operating Income (“Interest Income, net”, “Fee income, net,” and “Net gain on FX transactions”); the accounts grouped as Non-Core Operating Income (“Gain on Investments in Associates, “Gain on derivatives,” “Net gain on Exchange Differences); and the “Net Earned Premiums” account. Collectively, all of these accounts constitute “Operating Income.” Under IFRS 17, we are adjusting the components of the grouping for “Operating Income” to replace the component of “Net Earned Premiums” with the “Insurance Underwriting Result.”
It is important to note that the result of replacing the “Net Earned Premiums “account with the “Insurance Underwriting Result” in the denominator of the efficiency ratio is in fact very significant (upward). The aforementioned is due to the fact that the balance of Insurance Technical results is usually materially lower than the balance of Net Earned Premiums as Insurance Technical results have embedded the impact of charges for Incurred Claims. Below, we present a graphic depiction of the aforementioned change.
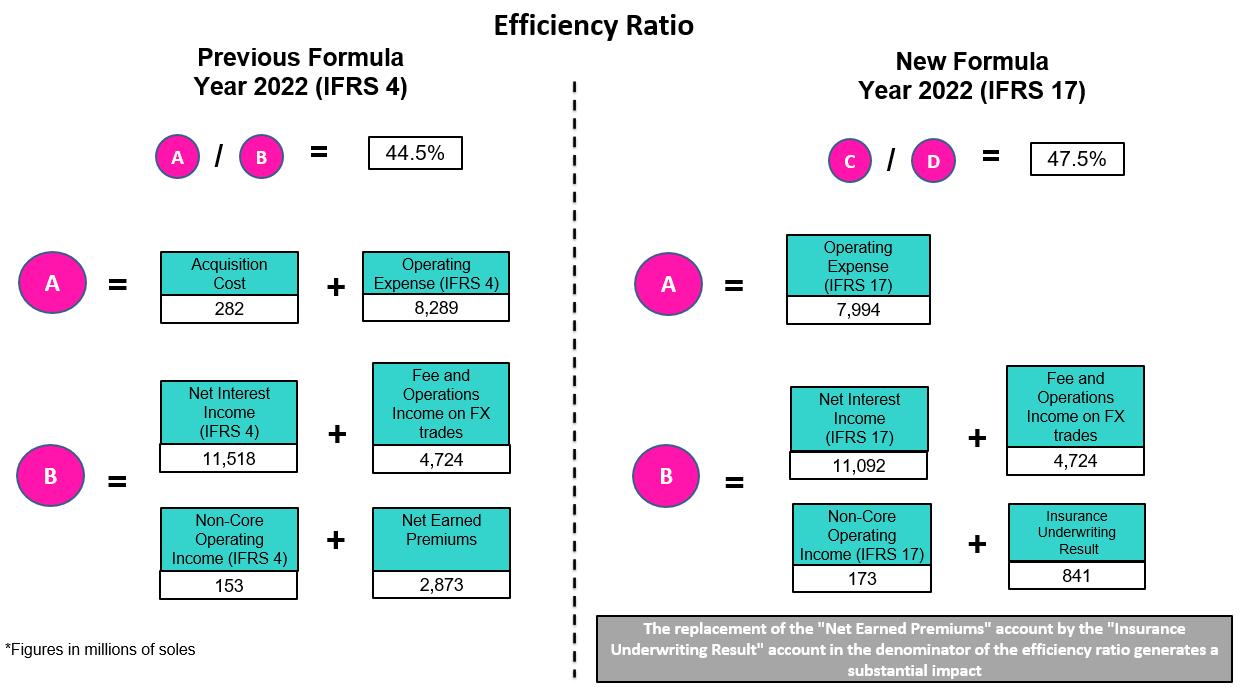
53
| | | Earnings Release 1Q / 2023 | Analysis of 1Q23 Consolidated Results |
12. Appendix |
12.1.9. Glossary of Terms Under IFRS 17
Reserve for BEL (Best Estimate Liability) o Fulfillment Cashflows. | Represents the best estimate of the difference between payments for obligations (claims, income and expenses) and premiums, flowed and brought to present value at the time of valuation. |
| Reserve for RA (risk Adjustment). | Represents the margin of prudence that will be used to cover deviations in the underwriting parameters beyond changes in the interest rate. |
Reserve for CSM (Contractual Service Margin). | Represents the present value of future underwriting income (non-financial). Income accrues over the life of the policy. |
| Attributable Expenses | Corresponds to necessary expenses to place a policy or maintain the same throughout its term. It is part of insurance flows. |
Financial Expense associated with the insurance and reinsurance activity, net | Represents interest accredited to reserves in the period after updating their present value. This concept was previously included in reserves under IFRS 4. IFRS 17 separates the financial component from the underwriting component. |
| Onerous Contracts | The contracts that the company estimates will generate underwriting losses (not including financial income) during the policy term. |
12.2. Physical Point of contact
Physical Point of Contact (1) (Units) | As of | change (units) | |||
| Mar 22 | Dec 22 | Mar 23 | QoQ | YoY | |
| Branches | 706 | 678 | 675 | -3 | -31 |
| ATMs | 2,551 | 2,595 | 2,626 | 31 | 75 |
Agentes (2) | 8,916 | 10,935 | 11,254 | 319 | 2,338 |
| Total | 12,173 | 14,208 | 14,555 | 347 | 2,382 |
| (1) | Includes Physical Point of Contact of BCP Stand-Alone, Mibanco and BCP Bolivia |
| (2) | Figures differ from previously reported due to changes in BCP Bolivia agents |
54
| | | Earnings Release 1Q / 2023 | Analysis of 1Q23 Consolidated Results |
12. Appendix |
12.3. Loan Portfolio Quality
Loan Portfolio Quality (in Quarter-end Balances
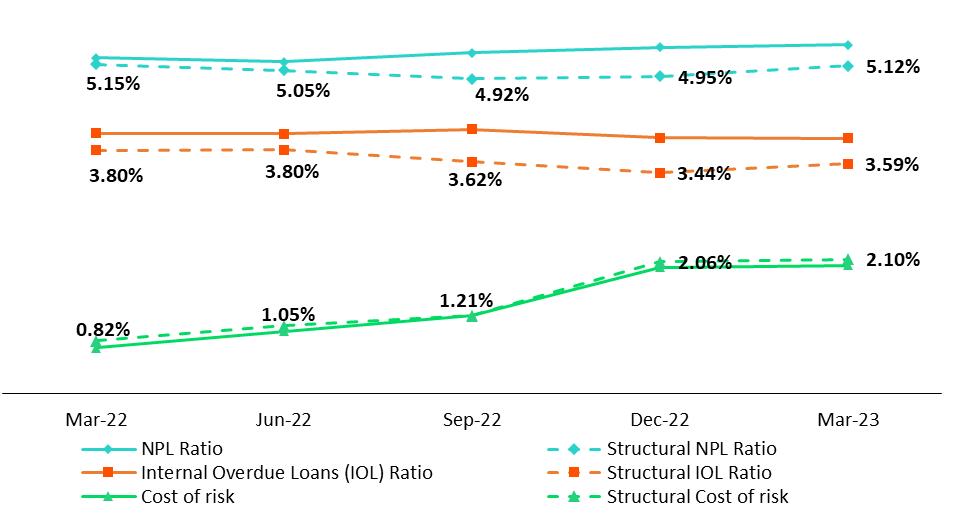
Government Program (GP) Loan Portfolio Quality (in Quarter-end Balances)
GP Portfolio quality and Delinquency ratios (1) S/000 | As of | % change | |||
Mar 22 | Dec 22 | Mar 23 | QoQ | YoY | |
| Total loans (Quarter-end balance) | 17,036,408 | 9,511,132 | 7,092,370 | -25.4% | -58.4% |
| Allowance for loan losses | 200,713 | 138,827 | 135,849 | -2.1% | -32.3% |
| IOLs | 1,022,808 | 1,148,499 | 837,389 | -27.1% | -0.18 |
| IOL ratio | 6.00% | 12.08% | 11.81% | -27 bps | 581 bps |
| Allowance for loan losses over GP Total loans | 1.2% | 1.5% | 1.9% | 46 bps | 74 bps |
| Coverage ratio of IOLs | 19.6% | 12.1% | 16.2% | 413 bps | -340 bps |
(1) Government Programs (GP) include Reactiva Peru and FAE-Mype.
55
| | | Earnings Release 1Q / 2023 | Analysis of 1Q23 Consolidated Results |
12. Appendix |
Portfolio Quality Ratios by Segment
Wholesale Banking
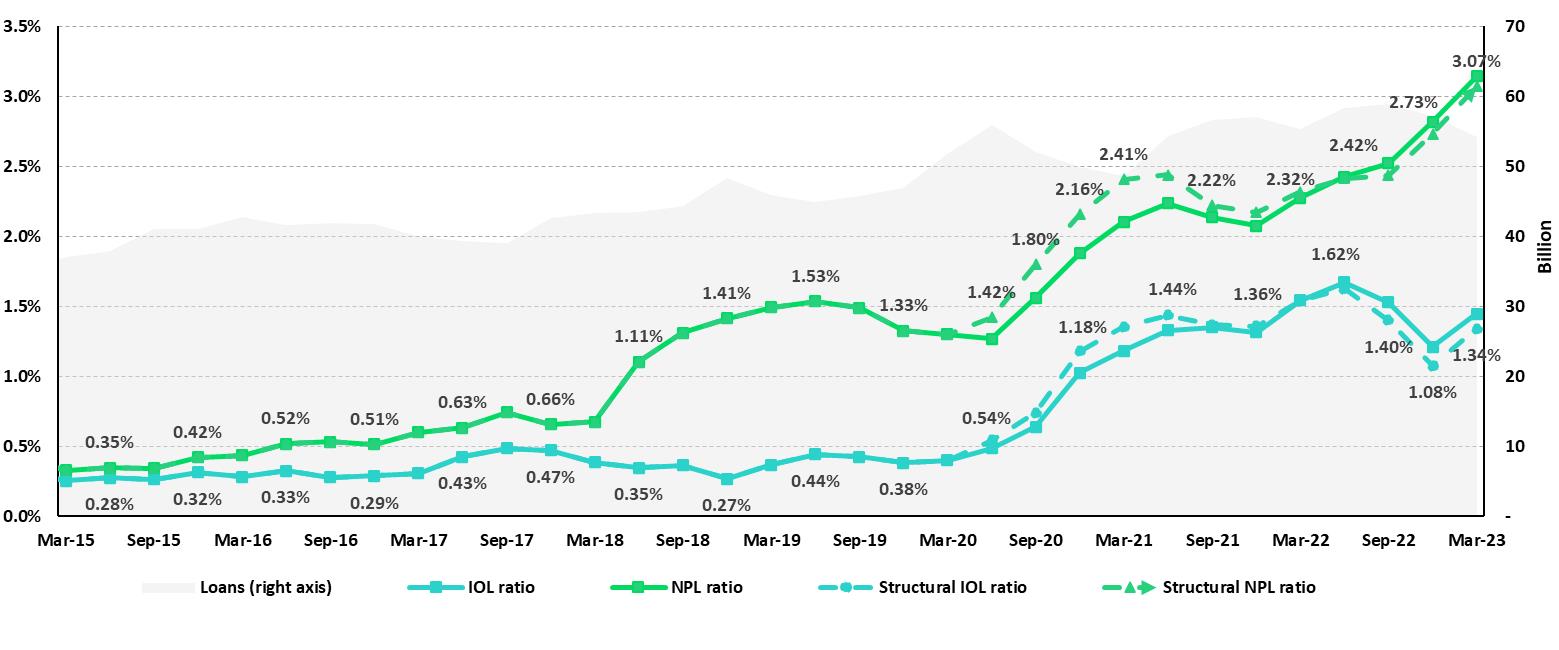
SME-Business
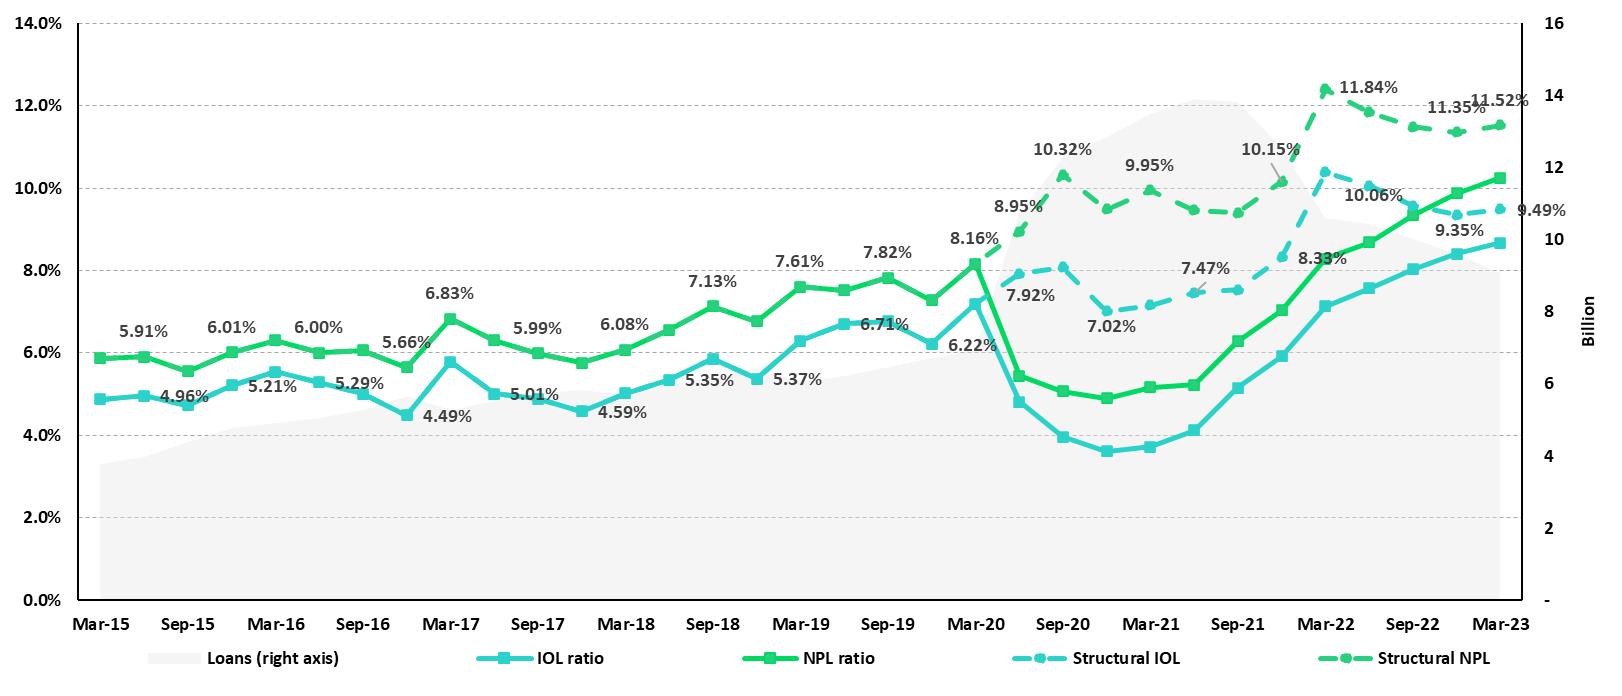
56
| | | Earnings Release 1Q / 2023 | Analysis of 1Q23 Consolidated Results |
12. Appendix |
SME-Pyme
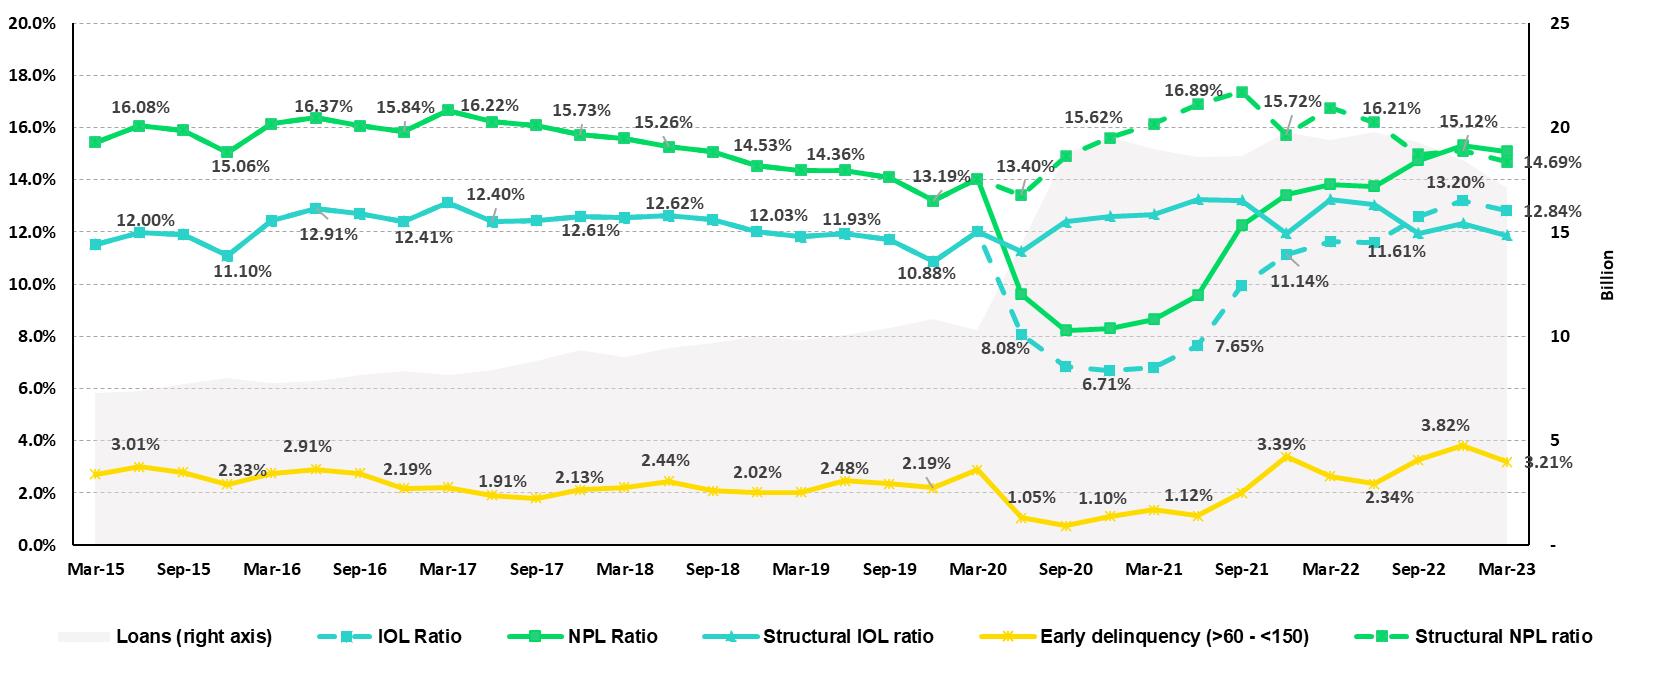
Mortgage
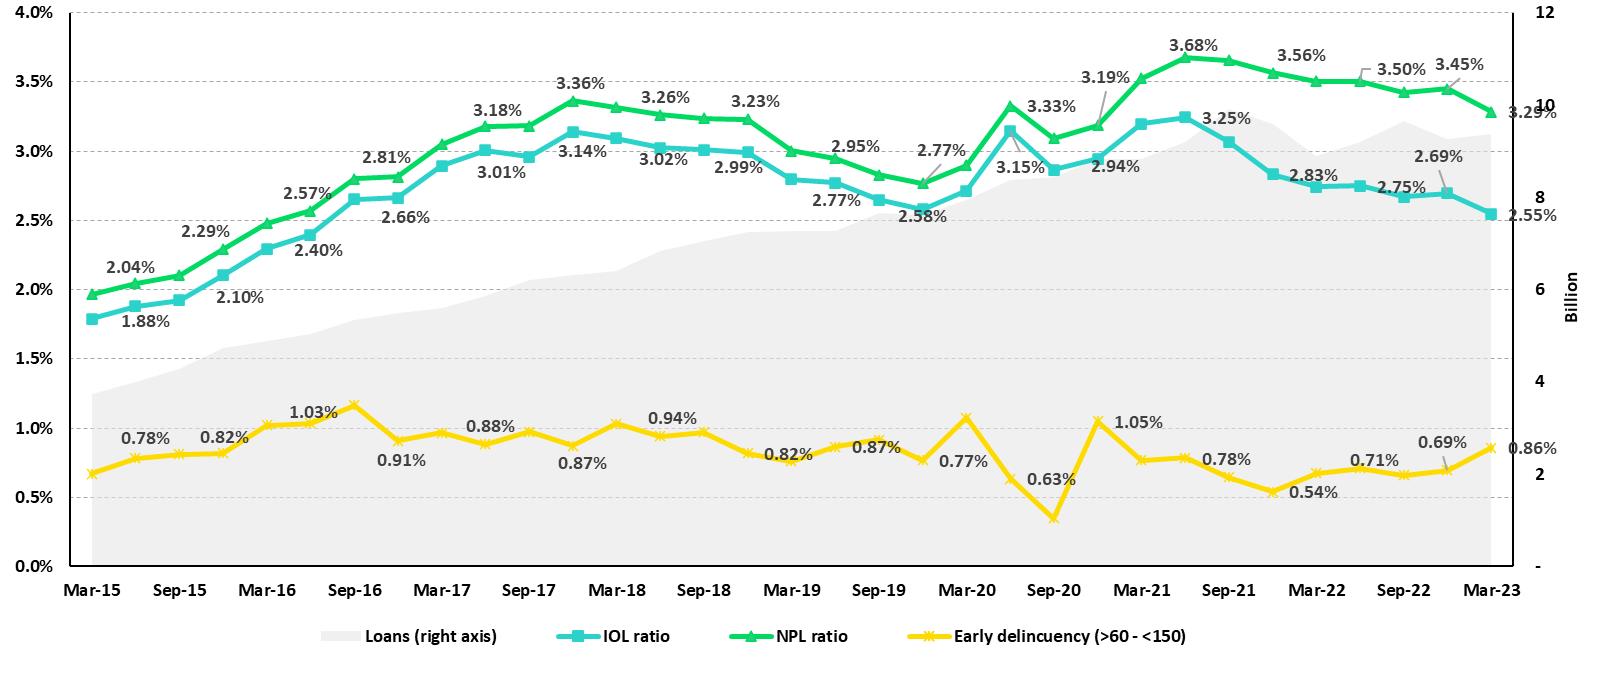
57
| | | Earnings Release 1Q / 2023 | Analysis of 1Q23 Consolidated Results |
12. Appendix |
Consumer
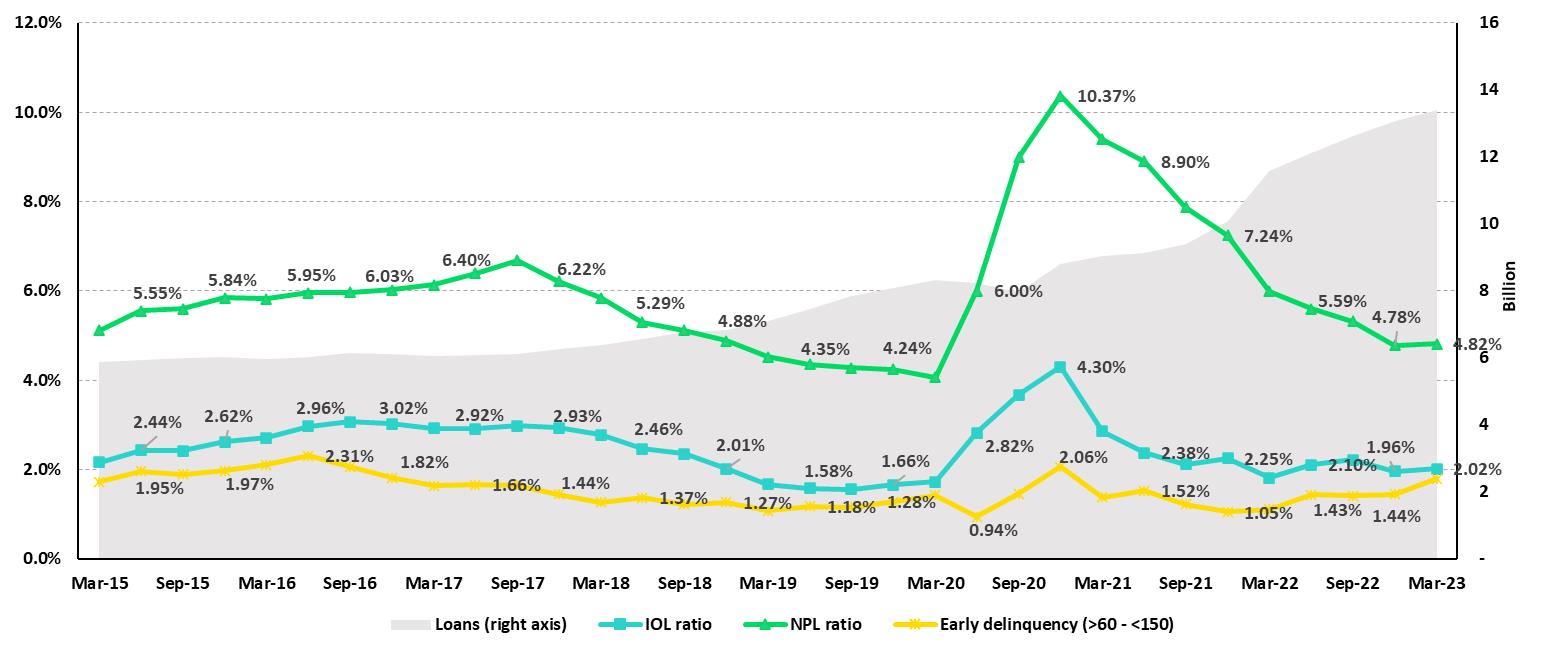
Credit Card
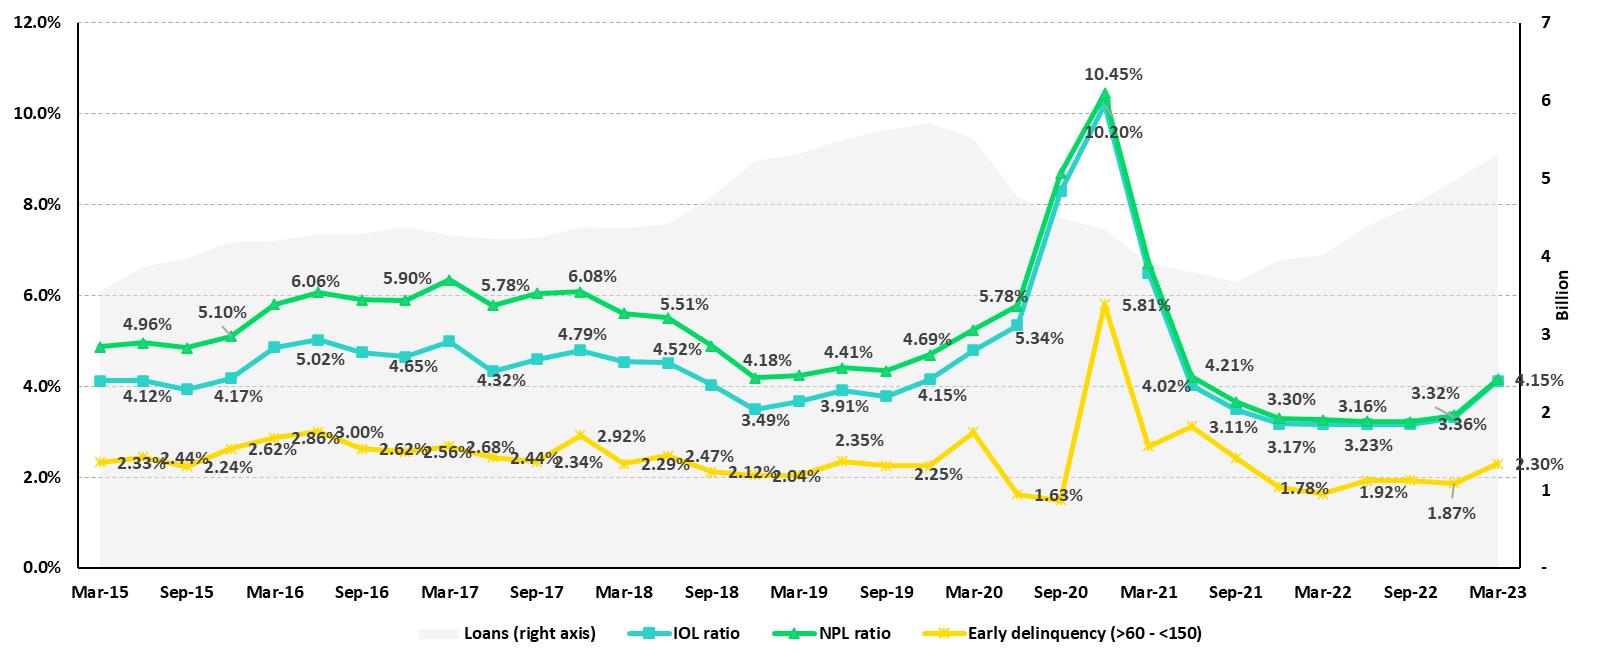
58
| | | Earnings Release 1Q / 2023 | Analysis of 1Q23 Consolidated Results |
12. Appendix |
Mibanco
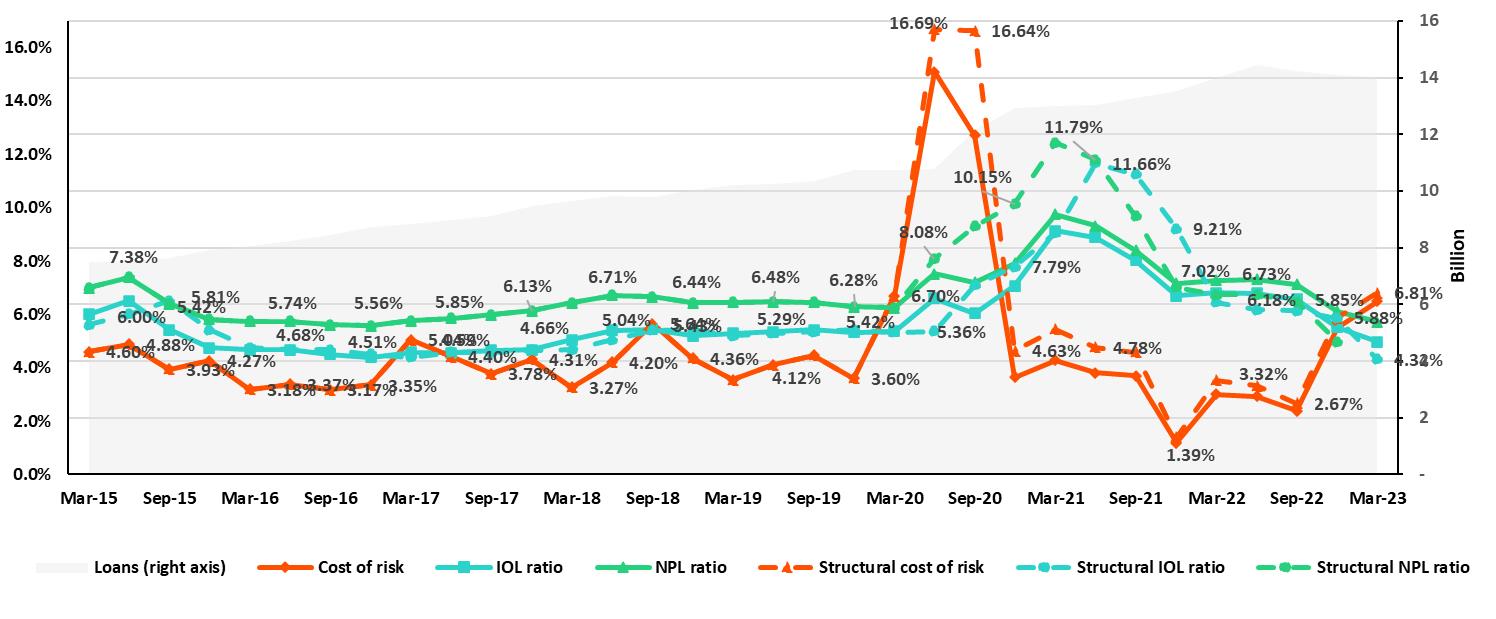
BCP Bolivia
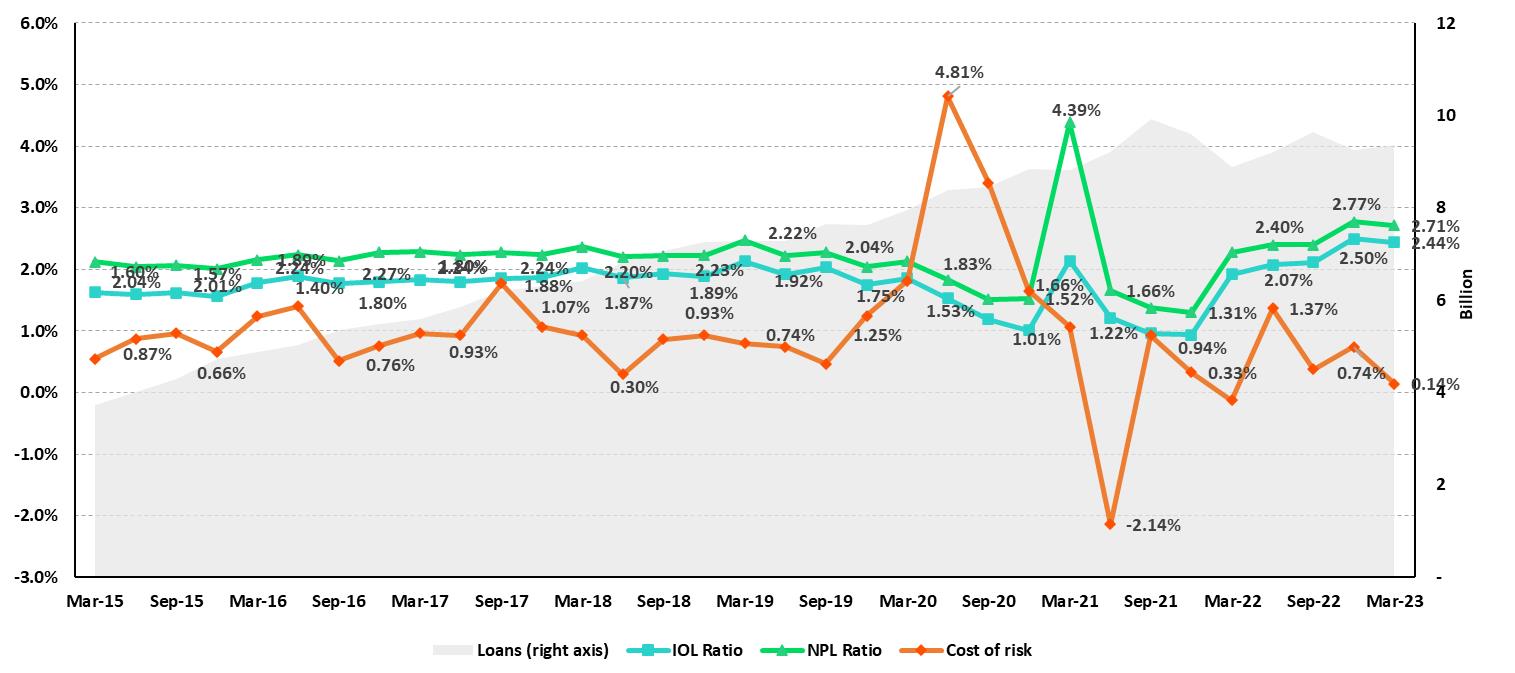
59
| | | Earnings Release 1Q / 2023 | Analysis of 1Q23 Consolidated Results |
12. Appendix |
12.4 Net Interest Income (NII)
NII Summary
| Net interest income | Quarter | % change | |||
| S/ 000 | 1Q22 | 4Q22 | 1Q23 | QoQ | YoY |
| Interest income | 3,172,346 | 4,362,142 | 4,456,106 | 2.2% | 40.5% |
| Interest on loans | 2,685,552 | 3,515,083 | 3,570,952 | 1.6% | 33.0% |
| Dividends on investments | 4,320 | 3,726 | 6,477 | 73.8% | 49.9% |
| Interest on deposits with banks | 36,834 | 236,319 | 277,371 | 17.4% | n.a. |
| Interest on securities | 438,023 | 559,041 | 585,268 | 4.7% | 33.6% |
| Other interest income | 7,617 | 47,973 | 16,038 | -66.6% | 110.6% |
| Interest expense | (740,639) | (1,227,364) | (1,324,017) | 7.9% | 78.8% |
| Interest expense (excluding Net Insurance Financial Expenses) | (638,881) | (1,119,124) | (1,208,267) | 8.0% | 89.1% |
| Interest on deposits | 258,939 | 582,237 | 677,088 | 16.3% | 161.5% |
| Interest on borrowed funds | 116,231 | 239,583 | 238,933 | -0.3% | 105.6% |
| Interest on bonds and subordinated notes | 179,609 | 188,983 | 182,898 | -3.2% | 1.8% |
| Other interest expense | 84,102 | 108,321 | 109,348 | 0.9% | 30.0% |
| Net Insurance Financial Expenses | (101,758) | (108,240) | (115,750) | 6.9% | 13.8% |
| Net interest income | 2,431,707 | 3,134,778 | 3,132,089 | -0.1% | 28.8% |
| Risk-adjusted Net interest income | 2,275,875 | 2,512,337 | 2,520,841 | 0.3% | 10.8% |
| Average interest earning assets | 227,279,809 | 225,604,596 | 222,289,504 | -1.5% | -2.2% |
Net interest margin (1) | 4.46% | 5.75% | 5.84% | 9bps | 138bps |
Risk-adjusted Net interest margin (1) | 4.01% | 4.45% | 4.54% | 9bps | 53bps |
| Net provisions for loan losses / Net interest income | 10.59% | 23.31% | 23.21% | -0.1% | 12.6% |
(1) Annualized. For further detail on the new NIM calculation due to IFRS17, please refer to Annex 12.1.8
Net Interest Margin (NIM) and Risk Adjusted NIM by subsidiary
| NIM Breakdown | BCP Stand-alone | Mibanco | BCP Bolivia | Credicorp |
| 1Q22 | 3.85% | 12.71% | 2.76% | 4.46% |
| 4Q22 | 5.41% | 12.73% | 2.71% | 5.75% |
| 1Q23 | 5.55% | 12.52% | 2.86% | 5.84% |
NIM: Annualized Net interest income (excluding Net Insurance Financial Expenses) / Average period end and period beginning interest earning assets.
| Risk Adjusted NIM Breakdown | BCP Stand-alone | Mibanco | BCP Bolivia | Credicorp |
| 1Q22 | 3.52% | 10.10% | 2.86% | 4.01% |
| 4Q22 | 4.24% | 8.14% | 2.13% | 4.45% |
| 1Q23 | 4.42% | 7.03% | 2.74% | 4.54% |
Risk-Adjusted NIM: (Annualized Net interest income (excluding Net Insurance Financial Expenses) - annualized provisions) / Average period end and period beginning interest earning assets.
60
| | | Earnings Release 1Q / 2023 | Analysis of 1Q23 Consolidated Results |
12. Appendix |
12.5. Regulatory Capital
Regulatory Capital and Capital Adequacy Ratios
(S/ Thousands, IFRS)
| As of | % Change | ||||
| Mar 22 | Dec 22 | Mar 23 | QoQ | YoY | |
| Capital Stock | 1,318,993 | 1,318,993 | 1,318,993 | 0.0% | 0.0% |
| Treasury Stocks | (207,700) | (207,518) | (208,041) | 0.3% | 0.2% |
| Capital Surplus | 227,361 | 231,556 | 226,189 | -2.3% | -0.5% |
Legal and Other capital reserves (1) | 21,292,614 | 23,702,590 | 23,603,001 | -0.4% | 10.9% |
Minority interest (2) | 493,113 | 471,171 | 514,951 | 9.3% | 4.4% |
Loan loss reserves (3) | 1,971,343 | 2,128,732 | 1,908,632 | -10.3% | -3.2% |
| Perpetual subordinated debt | - | - | - | - | - |
| Subordinated Debt | 5,695,192 | 5,770,557 | 5,649,060 | -2.1% | -0.8% |
| Investments in equity and subordinated debt of financial and insurance companies | (727,620) | (889,246) | (1,002,770) | 12.8% | 37.8% |
| Goodwill | (809,980) | (772,213) | (802,366) | 3.9% | -0.9% |
| Current year Net Loss | - | - | - | - | - |
Deduction for subordinated debt limit (50% of Tier I excluding deductions) (4) | - | - | - | - | - |
| Deduction for Tier I Limit (50% of Regulatory capital) (4) | - | - | - | - | - |
| Regulatory Capital (A) | 29,253,316 | 31,754,622 | 31,207,649 | -1.7% | 6.7% |
Tier 1 (5) | 15,402,884 | 16,955,335 | 16,906,310 | -0.3% | 9.8% |
Tier 2 (6) + Tier 3 (7) | 13,850,433 | 14,799,287 | 14,301,339 | -3.4% | 3.3% |
Financial Consolidated Group (FCG) Regulatory Capital Requirements (8) | 18,372,067 | 22,506,113 | 20,915,785 | -7.1% | 13.8% |
Insurance Consolidated Group (ICG) Capital Requirements (9) | 1,450,871 | 1,562,893 | 1,406,417 | -10.0% | -3.1% |
| FCG Capital Requirements related to operations with ICG | (446,149) | (471,371) | (518,975) | 10.1% | 16.3% |
| ICG Capital Requirements related to operations with FCG | - | - | - | - | - |
| Regulatory Capital Requirements (B) | 19,376,789 | 23,597,634 | 21,803,226 | -7.6% | 12.5% |
| Regulatory Capital Ratio (A) / (B) | 1.51 | 1.35 | 1.43 | ||
Required Regulatory Capital Ratio (10) | 1.00 | 1.00 | 1.00 | ||
(1) Legal and other capital reserves include restricted capital reserves (PEN 14,745 million) and optional capital reserves (PEN 6,661 million).
(2) Minority interest includes Tier I (PEN 421 million)
(3) Up to 1.25% of total risk-weighted assets of Banco de Credito del Peru, Solucion Empresa Administradora Hipotecaria, Mibanco and ASB Bank Corp.
(4) Tier II + Tier III cannot be more than 50% of total regulatory capital.
(5) Tier I = capital + restricted capital reserves + Tier I minority interest - goodwill - (0.5 x investment in equity and subordinated debt of financial and insurance companies) + perpetual subordinated debt.
(6) Tier II = subordinated debt + TierII minority interest tier + loan loss reserves - (0.5 x investment in equity and subordinated debt of financial and insurance companies).
(7) Tier III = Subordinated debt covering market risk only.
(8) Includes regulatory capital requirements of the financial consolidated group.
(9) Includes regulatory capital requirements of the insurance consolidated group.
(10) Regulatory Capital / Total Regulatory Capital Requirements (legal minimum = 1.00).
61
| | | Earnings Release 1Q / 2023 | Analysis of 1Q23 Consolidated Results |
12. Appendix |
Regulatory and Capital Adecuacy Ratios at BCP Stand-alone
(S/ thousands, IFRS, under regulation as of December 2022)
| Regulatory Capital and Capital Adequacy Ratios - SBS | As of | % change | |||
| S/ 000 | Mar 22 | Dec 22 | Mar 23 | QoQ | YoY |
| Capital Stock | 12,176,365 | 12,176,365 | 12,973,175 | 6.5% | 6.5% |
| Legal and Other capital reserves | 7,516,510 | 6,759,527 | 7,038,881 | 4.1% | -6.4% |
| Accumulated earnings with capitalization agreement | - | - | - | - | n.a. |
Loan loss reserves (1) | 1,707,458 | 1,838,178 | 1,634,876 | -11.1% | -4.3% |
| Perpetual subordinated debt | - | - | - | 0.0% | n.a. |
| Subordinated Debt | 5,007,300 | 5,148,900 | 5,078,700 | -1.4% | 1.4% |
| Investment in subsidiaries and others, net of unrealized profit and net income in subsidiarie | (2,432,571) | (2,436,525) | (2,838,434) | 16.5% | 16.7% |
| Investment in subsidiaries and others | (2,535,289) | (2,844,248) | (2,895,934) | 1.8% | 14.2% |
| Unrealized profit and net income in subsidiaries | 102,718 | 407,723 | 57,500 | -85.9% | -44.0% |
| Goodwill | (122,083) | (122,083) | (122,083) | 0.0% | 0.0% |
| Total Regulatory Capital - SBS | 23,852,979 | 23,364,361 | 23,765,115 | 1.7% | -0.4% |
| Off-balance sheet | 87,775,815 | 93,211,649 | 91,770,539 | -1.5% | 4.6% |
Regulatory Tier 1 Capital (2) | 16,220,724 | 16,219,133 | 17,094,343 | 5.4% | 5.4% |
Regulatory Tier 2 Capital (3) | 7,632,256 | 7,145,228 | 6,670,772 | -6.6% | -12.6% |
| Total risk-weighted assets - SBS (4) | 151,045,319 | 161,938,838 | 159,163,098 | -1.7% | 5.4% |
| Credit risk-weighted assets | 135,397,192 | 145,968,020 | 142,566,176 | -2.3% | 5.3% |
Market risk-weighted assets (5) | 2,231,891 | 1,560,281 | 1,715,934 | 10.0% | -23.1% |
| Operational risk-weighted assets | 13,416,236 | 14,410,537 | 14,880,988 | 3.3% | 10.9% |
| Total capital requirement - SBS | 14,355,691 | 17,730,539 | 17,312,244 | -2.4% | 20.6% |
| Credit risk capital requirement | 10,831,775 | 12,407,282 | 12,118,125 | -2.3% | 11.9% |
| Market risk capital requirement | 223,189 | 156,028 | 171,593 | 10.0% | -23.1% |
| Operational risk capital requirement | 1,341,624 | 1,441,054 | 1,488,099 | 3.3% | 10.9% |
| Additional capital requirements | 1,959,102 | 3,726,175 | 3,534,427 | -5.1% | 80.4% |
Common Equity Tier 1 - Basel IFRS (6) | 16,477,382 | 18,949,687 | 17,588,721 | -7.2% | 19.8% |
| Capital and reserves | 19,180,633 | 18,423,649 | 19,499,813 | 5.8% | 5.8% |
| Retained earnings | 1,740,668 | 5,249,495 | 2,746,522 | -47.7% | n.a. |
| Unrealized gains (losses) | (780,063) | (549,319) | (467,041) | -15.0% | 93.7% |
| Goodwill and intangibles | (1,266,218) | (1,472,073) | (1,454,205) | -1.2% | |
| Investments in subsidiaries | (2,397,638) | (2,702,065) | (2,736,368) | 1.3% | 5.2% |
Risk-Weighted Assets - Basel IFRS (7) | 141,697,998 | 150,535,662 | 160,419,724 | 6.6% | 13.2% |
| Total risk-weighted assets | 151,045,319 | 161,938,838 | 159,163,098 | -1.7% | 5.4% |
| (-) RWA Intangible assets, excluding goodwill. | 10,798,886 | 13,065,877 | - | -100.0% | -100.0% |
| (+) RWA Deferred tax assets generated as a result of temporary differences in income tax, in excess of 10% of CET1 | 882,435 | 917,317 | - | -100.0% | -100.0% |
| (+) RWA Deferred tax assets generated as a result of past losses | - | - | 0.0% | n.a. | |
(+) IFRS Adjustments (8) | 569,130 | 745,384 | 1,256,627 | 68.6% | 120.8% |
| Capital ratios | |||||
Regulatory Tier 1 ratio (9) | 10.74% | 10.02% | 10.74% | 72 bps | 0 bps |
Common Equity Tier 1 ratio (10)(11) | 11.63% | 12.59% | 11.93% | -66 bps | 30 bps |
Regulatory Global Capital ratio (12) | 15.79% | 14.43% | 14.93% | 50 bps | -86 bps |
| Risk-weighted assets / Regulatory capital | 6.33 | 6.93 | 6.70 | -3.4% | 5.8% |
(1) Up to 1.25% of total risk-weighted assets.
(2) Regulatory Tier 1 Capital = Capital + Legal and other capital reserves + Accumulated earnings with capitalization agreement + (0.5 x Unrealized profit and net income in subsidiaries) - Goodwill - (0.5 x Investment in subsidiaries) + Perpetual subordinated debt (maximum amount that can be included is 17.65% of Capital + Reserves + Accumulated earnings with capitalization agreement + Unrealized profit and net income in subsidiaries - Goodwill).
(3) Regulatory Tier 2 Capital = Subordinated debt + Loan loss reserves + Unrestricted Reserves + (0.5 x Unrealized profit and net income in subsidiaries) - (0.5 x Investment in subsidiaries).
(4) Since July 2012, Total Risk-weighted assets = Credit risk-weighted assets * 1.00 + Capital requirement to cover market risk * 10 + Capital requirement to cover operational risk * 10 * 1.00 (since July 2014)
(5) It includes capital requirement to cover price and rate risk.
(6) Common Equity Tier I = Capital + Reserves – 100% of applicable deductions (investment in subsidiaries, goodwill, intangibles and net deferred taxes that rely on future profitability) + retained earnings + unrealized gains. Figures differ from previously reported cause current calculations are based on IFRS figures.
(7) Adjusted Risk-Weighted Assets = Risk-weighted assets - (RWA Intangible assets, excluding goodwill, + RWA Deferred tax assets generated as a result of temporary differences in income tax, in excess of 10% of CET1, + RWA Deferred tax assets generated as a result of past losses). Figures differ from previously reported cause current calculations are based on IFRS figures.
(8) Regulatory Tier 1 Capital / Total Risk-weighted assets
(9) Common Equity Tier I / Adjusted Risk-Weighted Assets Risk-Weighted Assets
(10) Total Regulatory Capital / Total Risk-weighted assets (legal minimum = 10% since July 2011)
(11) Adjustments for differences in balance assets under Local Accounting (which regulatory Rwas are calculated) and IFRS in the Right of use account (lease). As of March 2022, the ‘Right of Use’ account increased to S/ 364M, explained the 64% of the adjustment. The rest adjustments correspond to differences in stock of provisions and Deferred Taxes.
(12) Common Equity Tier I calculated based on IFRS Accounting
62
| | | Earnings Release 1Q / 2023 | Analysis of 1Q23 Consolidated Results |
12. Appendix |
Regulatory and Capital Adequacy Ratios at BCP Stand-alone
(S/ thousands, IFRS, under current regulation as of January 2023)
| Regulatory Capital | 1Q23 |
| (S/ thousand) | |
| Capital Stock | 12,973,175 |
| Reserves | 7,038,881 |
| Accumulated earnings | 2,050,746 |
Loan loss reserves (1) | 1,634,876 |
| Perpetual subordinated debt | - |
| Subordinated Debt | 5,078,700 |
| Unrealized Profit or Losses | (1,046,284) |
| Investment in subsidiaries and others, net of unrealized profit and net income in subsidiaries | (2,613,563) |
| Intangibles | (934,718) |
| Goodwill | (122,083) |
| Total Regulatory Capital | 24,059,729 |
Tier 1 Common Equity (2) | 17,346,153 |
Regulatory Tier 1 Capital (3) | 17,346,153 |
Regulatory Tier 2 Capital (4) | 6,713,576 |
| Total risk-weighted assets | 1Q23 |
| (S/ thousand) | |
Market risk-weighted assets (5) | 1,715,934 |
| Credit risk-weighted assets | 129,623,885 |
| Operational risk-weighted assets | 14,880,988 |
| Total | 146,220,807 |
| Capital requirement | 1Q23 |
| (S/ thousand) | |
Market risk capital requirement (5) | 171,589 |
| Credit risk capital requirement | 11,018,030 |
| Operational risk capital requirement | 1,488,062 |
| Additional capital requirements | 3,534,427 |
| Total | 16,212,108 |
(1) Up to 1.25% of total risk-weighted assets.
(2) Regulatory Tier 1 Capital = Capital + Legal and other capital reserves + Accumulated earnings with capitalization agreement + (0.5 x Unrealized profit and net income in subsidiaries) - Goodwill - (0.5 x Investment in subsidiaries) + Perpetual subordinated debt (maximum amount that can be included is 17.65% of Capital + Reserves + Accumulated earnings with capitalization agreement + Unrealized profit and net income in subsidiaries - Goodwill).
[3] Regulatory Tier 1 Capital = Tier 1 Common Equity + Tier 1 Subordinated debt (perpetual)
[4] Regulatory Tier 2 Capital = Deuda Subordinated Debt + Loan los reserves
| Capital ratios | |
| Regulatory Tier 1 ratio | 11.86% |
| Regulatory Global Capital ratio | 16.45% |
Common Equity Tier 1 ratio IFRS (9)(12) | 11.93% |
63
| | | Earnings Release 1Q / 2023 | Analysis of 1Q23 Consolidated Results |
12. Appendix |
Regulatory Capital and Capital Adequacy Ratios at Mibanco
(S/ thousands, IFRS, under regulation as of December 2022)
| As of | % change | ||||
| Mar 22 | Dec 22 | Mar 23 | QoQ | YoY | |
| Capital Stock | 1,840,606 | 1,840,606 | 1,840,606 | 0.0% | 0.0% |
| Legal and Other capital reserves | 264,221 | 264,221 | 308,056 | 16.6% | 16.6% |
| Accumulated earnings with capitalization agreement | - | - | - | n.a. | n.a. |
Loan loss reserves (1) | 163,711 | 183,155 | 193,129 | 5.4% | 18.0% |
| Perpetual subordinated debt | - | - | - | n.a. | n.a. |
| Subordinated Debt | 185,000 | 179,000 | 179,000 | 0.0% | -3.2% |
| Investment in subsidiaries and others, net of unrealized profit and net income | - | - | - | n.a. | n.a. |
| Investment in subsidiaries and others | - | - | - | n.a. | n.a. |
| Unrealized profit and net income in subsidiaries | - | - | - | n.a. | n.a. |
| Goodwill | (139,180) | (139,180) | (139,180) | 0.0% | 0.0% |
| Total Regulatory Capital | 2,314,357 | 2,327,801 | 2,381,611 | 2.3% | 2.9% |
Regulatory Tier 1 Capital (2) | 1,962,906 | 1,962,906 | 2,006,801 | 2.2% | 2.2% |
Regulatory Tier 2 Capital (3) | 351,451 | 364,895 | 374,810 | 2.7% | 6.6% |
Total risk-weighted assets - SBS (4) | 14,825,319 | 15,850,329 | 16,104,381 | 1.6% | 8.6% |
| Credit risk-weighted assets | 12,747,979 | 14,345,663 | 14,535,512 | 1.3% | 14.0% |
Market risk-weighted assets (5) | 177,097 | 96,803 | 141,441 | 46.1% | -20.1% |
| Operational risk-weighted assets | 1,900,243 | 1,407,863 | 1,427,428 | 1.4% | -24.9% |
| Total capital requirement - SBS | 1,363,550 | 1,735,360 | 1,791,008 | 3.2% | 31.3% |
| Credit risk capital requirement | 1,019,838 | 1,219,381 | 1,235,519 | 1.3% | 21.1% |
Market risk capital requirement (5) | 17,710 | 9,680 | 14,144 | 46.1% | -20.1% |
| Operational risk capital requirement | 190,024 | 140,786 | 142,743 | 1.4% | -24.9% |
| Additional capital requirements | 135,978 | 365,512 | 398,603 | 9.1% | 193.1% |
Common Equity Tier 1 - Basel IFRS (6) | 2,065,340 | 2,353,353 | 2,415,504 | 2.6% | 17.0% |
| Capital and reserves | 2,104,827 | 2,104,827 | 2,148,662 | 2.1% | 2.1% |
| Retained earnings | 224,613 | 540,906 | 556,972 | 3.0% | n.a. |
| Unrealized gains (losses) | (7,360) | (11,830) | (15,467) | 30.7% | 110.1% |
| Goodwill and intangibles | (256,740) | (280,267) | (274,382) | -2.1% | 6.9% |
| Investments in subsidiaries | - | (283) | (281) | -0.7% | n.a. |
Adjusted Risk-Weighted Assets - Basel IFRS (7) | 13,854,030 | 14,613,299 | 14,860,252 | 1.7% | 7.3% |
| Total risk-weighted assets - SBS | 14,825,319 | 15,850,329 | 14,729,206 | -7.1% | -0.6% |
| (-) RWA Intangible assets, excluding goodwill | 1,166,501 | 1,408,551 | - | -100.0% | -100.0% |
| (+) RWA Deferred tax assets generated as a result of temporary differences in income tax, in excess of 10% of CET1, and other local adjustments | 161,572 | 159,880 | - | -100.0% | -100.0% |
| 33,640 | 11,641 | - | -100.0% | -100.0% | |
| n.a. | n.a. | ||||
(+) IFRS Adjustments (11) | - | - | - | n.a. | n.a. |
| Capital ratios | |||||
Regulatory Tier 1 ratio (8) | 13.24% | 12.38% | 12.46% | 8 bps | -78 bps |
Common Equity Tier 1 ratio IFRS (9)(12) | 14.91% | 16.10% | 16.25% | 15 bps | 134 bps |
Regulatory Global Capital ratio (10) | 15.61% | 14.69% | 14.79% | 10 bps | -82 bps |
| Risk-weighted assets / Regulatory capital | 6.41 | 6.81 | 6.76 | -0.7% | 5.6% |
64
| | | Earnings Release 1Q / 2023 | Analysis of 1Q23 Consolidated Results |
12. Appendix |
Regulatory Capital and Capital Adequacy Ratios at Mibanco
(S/ thousands, IFRS, under current regulation as of January 2023)
| Capital regulatorio | 1Q23 |
| (S/ miles) | |
| Capital | 1,840,606 |
| Reservas | 308,056 |
| Utilidades y Resultados Acumulados | 556,972 |
Provisiones (1) | 168,965 |
| Deuda Subordinada Perpetua | 0 |
| Deuda Subordinada | 179,000 |
| Pérdida No Realizada | -15,467 |
| Inversiones en subsidiarias y otros, netas de ganancias no realizadas y utilidades | -281 |
| Intangibles | -135,202 |
| Goodwill | -139,180 |
| Patrimonio Efectivo Total | 2,763,469 |
Capital Ordinario Nivel 1 (2) | 2,415,504 |
Patrimonio Efectivo Nivel 1 (3) | 2,415,504 |
Patrimonio Efectivo Nivel 2 (4) | 347,965 |
| Activos ponderados por riesgo | 1Q23 |
| (S/ miles) | |
| Activos ponderados por riesgo de mercado | 141,441 |
| Activos ponderados por riesgo crediticio | 13,160,337 |
| Activos ponderados por riesgo operacional | 1,427,428 |
| Total | 14,729,206 |
| Requerimiento de patrimonio | 1Q23 |
| (S/ miles) | |
| Requerimiento de patrimonio por riesgo de mercado | 14,144 |
| Requerimiento de patrimonio por riesgo crediticio | 1,118,629 |
| Requerimiento de patrimonio por riesgo operacional | 142,743 |
| Requerimientos adicionales de capital | 398,603 |
| Total | 1,674,118 |
[1] (1) Up to 1.25% of total risk-weighted assets.
[2] Common Equity Tier 1 = Capital Stock + Reserves + Accumulated earnings – Unrealized profits or losses - 100% deductions (investment in subsidiaries, goodwill, intangible assets and deferred tax assets based on future returns).
[3] Regulatory Tier 1 Capital = Common Equity Tier 1 + Tier 1 Subordinated Debt (Perpetual).
[4] Regulatory Tier 2 Capital = Subordinated Debt + Loan loss reserves.
| Ratios de Capital | |
| Ratio Capital Ordinario Nivel 1 | 16.40% |
| Ratio Patrimonio Efectivo Nivel 1 | 16.40% |
| Ratio Patrimonio Efectivo Total | 18.76% |
| Ratio CET1 NIIF | 16.38% |
65
| | | Earnings Release 1Q / 2023 | Analysis of 1Q23 Consolidated Results |
12. Appendix |
12.6. Financial Statements and Ratios by Business
12.6.1. Credicorp Consolidated
CREDICORP LTD. AND SUBSIDIARIES
CONSOLIDATED STATEMENT OF FINANCIAL POSITION
(In S/ thousands, IFRS)
| As of | % change | ||||
| Mar 22 | Dec 22 | Mar 23 | QoQ | YoY | |
| ASSETS | |||||
| Cash and due from banks | |||||
| Non-interest bearing | 6,748,517 | 7,286,624 | 6,946,112 | -4.7% | 2.9% |
| Interest bearing | 29,563,512 | 26,897,216 | 28,158,941 | 4.7% | -4.8% |
| Total cash and due from banks | 36,312,029 | 34,183,840 | 35,105,053 | 2.7% | -3.3% |
| Cash collateral, reverse repurchase agreements and securities borrowing | 1,516,855 | 1,101,856 | 1,468,180 | 33.2% | -3.2% |
| Fair value through profit or loss investments | 4,628,870 | 4,199,334 | 4,080,266 | -2.8% | -11.9% |
| Fair value through other comprehensive income investments | 35,452,509 | 30,786,161 | 33,395,987 | 8.5% | -5.8% |
| Amortized cost investments | 8,064,050 | 10,445,729 | 10,253,251 | -1.8% | 27.1% |
| Loans | 144,621,513 | 148,626,374 | 145,165,713 | -2.3% | 0.4% |
| Current | 138,748,514 | 142,686,630 | 139,376,216 | -2.3% | 0.5% |
| Internal overdue loans | 5,872,999 | 5,939,744 | 5,789,497 | -2.5% | -1.4% |
| Less - allowance for loan losses | (8,262,383) | (7,872,402) | (7,915,350) | 0.5% | -4.2% |
| Loans, net | 136,359,130 | 140,753,972 | 137,250,363 | -2.5% | 0.7% |
| Financial assets designated at fair value through profit or loss | 856,337 | 768,801 | 795,225 | 3.4% | -7.1% |
| Accounts receivable from reinsurers and coinsurers | 174,982 | 110,963 | 107,619 | -3.0% | -38.5% |
| Premiums and other policyholder receivables | 873,505 | 921,611 | 842,865 | -8.5% | -3.5% |
| Property, plant and equipment, net | 1,864,825 | 1,824,931 | 1,786,992 | -2.1% | -4.2% |
| Due from customers on acceptances | 524,448 | 699,678 | 496,170 | -29.1% | -5.4% |
| Investments in associates | 629,009 | 726,993 | 660,741 | -9.1% | 5.0% |
| Intangible assets and goodwill, net | 2,703,238 | 2,899,429 | 2,942,367 | 1.5% | 8.8% |
| Assets by insurance and reinsurance contracts | |||||
Other assets (1) | 6,901,336 | 6,293,599 | 8,118,268 | 29.0% | 17.6% |
| Total Assets | 237,871,204 | 236,750,138 | 238,324,333 | 0.7% | 0.2% |
| LIABILITIES AND EQUITY | |||||
| Deposits and obligations | |||||
| Non-interest bearing | 50,939,859 | 43,346,151 | 41,596,964 | -4.0% | -18.3% |
| Interest bearing | 96,976,105 | 103,674,636 | 107,026,336 | 3.2% | 10.4% |
| Total deposits and obligations | 147,915,964 | 147,020,787 | 148,623,300 | 1.1% | 0.5% |
| Payables from repurchase agreements and securities lending | 19,388,995 | 12,966,725 | 11,686,495 | -9.9% | -39.7% |
| BCRP instruments | 17,532,350 | 11,297,659 | 9,780,540 | -13.4% | -44.2% |
| Repurchase agreements with third parties | 1,218,028 | 976,020 | 1,206,574 | 23.6% | -0.9% |
| Repurchase agreements with customers | 638,617 | 693,046 | 699,381 | 0.9% | 9.5% |
| Due to banks and correspondents | 6,362,990 | 8,937,411 | 10,199,650 | 14.1% | 60.3% |
| Bonds and notes issued | 16,044,671 | 17,007,194 | 14,313,030 | -15.8% | -10.8% |
| Banker’s acceptances outstanding | 524,448 | 699,678 | 496,170 | -29.1% | -5.4% |
| Liabilities by insurance and reinsurance contracts | 11,984,619 | 11,974,714 | 12,291,538 | 2.6% | 2.6% |
| Accounts payable to reinsurers | 414,506 | 420,094 | 343,067 | -18.3% | -17.2% |
| Financial liabilities at fair value through profit or loss | 232,185 | 191,010 | 417,146 | 118.4% | 79.7% |
| Other liabilities | 7,655,867 | 7,943,225 | 9,019,443 | 13.5% | 17.8% |
| Total Liabilities | 210,524,245 | 207,160,838 | 207,389,839 | 0.1% | -1.5% |
| Net equity | 26,818,054 | 28,997,731 | 30,359,898 | 4.7% | 13.2% |
| Capital stock | 1,318,993 | 1,318,993 | 1,318,993 | 0.0% | 0.0% |
| Treasury stock | (207,700) | (207,518) | (208,041) | 0.3% | 0.2% |
| Capital surplus | 227,361 | 231,556 | 226,189 | -2.3% | -0.5% |
| Reserves | 21,292,614 | 23,659,626 | 23,603,001 | -0.2% | 10.9% |
| Other reserves | -318,628 | (434,838) | (403,391) | -7.2% | 26.6% |
| Retained earnings | 4,505,414 | 4,429,912 | 5,823,147 | 31.5% | 29.2% |
| - | - | - | |||
| Non-controlling interest | 528,905 | 591,569 | 574,596 | -2.9% | 8.6% |
| Total Net Equity | 27,346,959 | 29,589,300 | 30,934,494 | 4.5% | 13.1% |
| - | - | - | |||
| Total liabilities and equity | 237,871,204 | 236,750,138 | 238,324,333 | 0.7% | 0.2% |
| - | - | - | |||
| Off-balance sheet | 142,337,944 | 150,977,864 | 154,477,055 | 2.3% | 8.5% |
| Total performance bonds, stand-by and L/Cs. | 21,196,817 | 20,928,054 | 18,731,789 | -10.5% | -11.6% |
| Undrawn credit lines, advised but not committed | 80,155,277 | 86,597,041 | 87,232,214 | 0.7% | 8.8% |
| Total derivatives (notional) and others | 40,985,850 | 43,452,769 | 48,513,052 | 11.6% | 18.4% |
(1) Includes mainly accounts receivables from brokerage and others.
66
| | | Earnings Release 1Q / 2023 | Analysis of 1Q23 Consolidated Results |
12. Appendix |
CREDICORP LTD. AND SUBSIDIARIES
CONSOLIDATED STATEMENT OF INCOME
(In S/ thousands, IFRS)
| Quarter | % change | ||||
| 1Q22 | 4Q22 | 1Q23 | QoQ | YoY | |
| Interest income and expense | |||||
| Interest and similar income | 3,172,346 | 4,362,142 | 4,456,106 | 2.2% | 40.5% |
| Interest and similar expenses | (740,639) | (1,227,364) | (1,324,017) | 7.9% | 78.8% |
| Net interest, similar income and expenses | 2,431,707 | 3,134,778 | 3,132,089 | -0.1% | 28.8% |
| Gross provision for credit losses on loan portfolio | (350,681) | (815,589) | (802,107) | -1.7% | 128.7% |
| Recoveries of written-off loans | 93,091 | 84,908 | 75,109 | -11.5% | -19.3% |
| Provision for credit losses on loan portfolio, net of recoveries | (257,590) | (730,681) | (726,998) | -0.5% | 182.2% |
| - | - | - | |||
| Net interest, similar income and expenses, after provision for credit losses on loan portfolio | 2,174,117 | 2,404,097 | 2,405,091 | 0.0% | 10.6% |
| Other income | |||||
| Fee income | 891,628 | 894,552 | 881,781 | -1.4% | -1.1% |
| Net gain on foreign exchange transactions | 259,710 | 293,215 | 248,515 | -15.2% | -4.3% |
| Net loss on securities | (56,866) | 77,512 | 70,036 | -9.6% | n.a |
| Net gain from associates | 24,014 | 25,422 | 27,212 | 7.0% | 13.3% |
| Net gain (loss) on derivatives held for trading | (5,982) | 5,857 | (6,570) | -212.2% | 9.8% |
| Net gain (loss) from exchange differences | (8,363) | 22,039 | 22,963 | 4.2% | -374.6% |
| Others | 135,257 | 19,630 | 84,127 | 328.6% | -37.8% |
| Total non-financial income | 1,239,398 | 1,338,227 | 1,328,064 | -0.8% | 7.2% |
| Insurance underwriting result | |||||
| Insurance Service Result | 309,258 | 331,030 | 406,877 | 22.9% | 31.6% |
| Reinsurance Result | (102,591) | (119,436) | (110,536) | -7.5% | 7.7% |
| Total insurance underwriting result | 206,667 | 211,594 | 296,341 | 40.1% | 43.4% |
| Total expenses | |||||
| Salaries and employee benefits | (939,518) | (1,040,066) | (1,029,558) | -1.0% | 9.6% |
| Administrative, general and tax expenses | (696,065) | (1,042,882) | (835,060) | -19.9% | 20.0% |
| Depreciation and amortization | (151,894) | (165,180) | (160,924) | -2.6% | 5.9% |
| Association in participation | (7,691) | (12,936) | (12,612) | -2.5% | 64.0% |
| Other expenses | (79,351) | (137,891) | (83,543) | -39.4% | 5.3% |
| Total expenses | (1,874,519) | (2,398,955) | (2,121,697) | -11.6% | 13.2% |
| Profit before income tax | 1,745,663 | 1,554,963 | 1,907,799 | 22.7% | 9.3% |
| Income tax | (546,000) | (476,236) | (493,466) | 3.6% | -9.6% |
| Net profit | 1,199,663 | 1,078,727 | 1,414,333 | 31.1% | 17.9% |
| Non-controlling interest | 27,786 | 24,231 | 30,060 | 24.1% | 8.2% |
| Net profit attributable to Credicorp | 1,171,877 | 1,054,496 | 1,384,273 | 31.3% | 18.1% |
67
| | | Earnings Release 1Q / 2023 | Analysis of 1Q23 Consolidated Results |
12. Appendix |
12.6.2. Credicorp Stand-alone
Credicorp Ltd.
Separate Statement of Financal Position
(S/ thousands, IFRS)
| As of | % change | ||||
| Mar 22 | Dec22 | Mar23 | QoQ | YoY | |
| ASSETS | |||||
| Cash and cash equivalents | 168,634 | 136,399 | 131,218 | -3.8% | -22.2% |
| At fair value through profit or loss | 947,826 | 958,939 | 949,378 | -1.0% | n.a |
| Fair value through other comprehensive income investments | 343,373 | 306,343 | 318,962 | 4.1% | -7.1% |
| In subsidiaries and associates investments | 31,647,183 | 33,878,318 | 35,207,564 | 3.9% | 11.3% |
| Other assets | 106 | 135 | 69,217 | n.a | n.a |
| Total Assets | 33,107,122 | 35,280,134 | 36,676,339 | 4.0% | 10.8% |
| LIABILITIES AND NET SHAREHOLDERS’ EQUITY | |||||
| Due to banks, correspondents and other entities | - | - | - | n.a. | n.a. |
| Bonds and notes issued | 1,850,185 | 1,898,066 | 1,885,839 | -0.6% | 1.9% |
| Other liabilities | 195,286 | 220,642 | 267,558 | 21.3% | 37.0% |
| Total Liabilities | 2,045,471 | 2,118,708 | 2,153,397 | 1.6% | 5.3% |
| NET EQUITY | |||||
| Capital stock | 1,318,993 | 1,318,993 | 1,318,993 | 0.0% | 0.0% |
| Capital Surplus | 384,542 | 384,542 | 384,542 | 0.0% | 0.0% |
| Reserve | 20,945,491 | 23,300,350 | 23,300,350 | 0.0% | 11.2% |
| Unrealized results | (638,233) | (835,079) | (592,006) | -29.1% | n.a. |
| Retained earnings | 9,050,858 | 8,992,620 | 10,111,063 | 12.4% | 11.7% |
| Total net equity | 31,061,651 | 33,161,426 | 34,522,942 | 4.1% | 11.1% |
| Total Liabilities And Equity | 33,107,122 | 35,280,134 | 36,676,339 | 4.0% | 10.8% |
| Quarter | % change | ||||
| 1Q22 | 4Q22 | 1Q23 | QoQ | YoY | |
| Interest income | |||||
| Net share of the income from investments in subsidiaries and associates | 1,236,032 | 1,115,614 | 1,439,211 | 29.0% | 16.4% |
| Interest and similar income | 298 | 1,040 | 300 | -71.2% | 0.7% |
| Net gain on financial assets at fair value through profit or loss | (26,898) | 32,597 | 3,759 | -88.5% | n.a |
| Total income | 1,209,432 | 1,149,251 | 1,433,270 | 25.6% | 19.3% |
| Interest and similar expense | (13,651) | (20,550) | (4,407) | -78.6% | -67.7% |
| Administrative and general expenses | (4,259) | (9,272) | (13,796) | 48.8% | 223.9% |
| Total expenses | (17,910) | (29,822) | (18,203) | -39.0% | 1.6% |
| Operating income | 1,191,522 | 1,119,429 | 1,425,067 | 27.3% | 19.6% |
| Net gain (losses) from exchange differences | (145) | 85 | (158) | -285.9% | 9.0% |
| Other, net | 232 | 106 | 102 | n.a | n.a |
| Profit before income tax | 1,191,609 | 1,119,620 | 1,425,011 | 27.3% | 19.6% |
| Income tax | (42,000) | (42,000) | (46,795) | 11.4% | 11.4% |
| Net income | 1,149,609 | 1,077,620 | 1,378,216 | 27.9% | 19.9% |
| Double Leverage Ratio | 101.89% | 102.16% | 101.98% | -18bps | 10bps |
68
| | | Earnings Release 1Q / 2023 | Analysis of 1Q23 Consolidated Results |
12. Appendix |
12.6.3. BCP Consolidated
BANCO DE CREDITO DEL PERU AND SUBSIDIARIES
CONSOLIDATED STATEMENT OF FINANCIAL POSITION
(In S/ thousands, IFRS)
| As of | % change | ||||
| Mar 22 | Dec 22 | Mar 23 | QoQ | YoY | |
| ASSETS | |||||
| Cash and due from banks | |||||
| Non-interest bearing | 4,959,579 | 5,780,728 | 5,456,302 | -5.6% | 10.0% |
| Interest bearing | 28,253,501 | 25,594,929 | 26,924,509 | 5.2% | -4.7% |
| Total cash and due from banks | 33,213,080 | 31,375,657 | 32,380,811 | 3.2% | -2.5% |
| - | - | ||||
| Cash collateral, reverse repurchase agreements and securities borrowing | 202,127 | 244,017 | 232,059 | -4.9% | 14.8% |
| - | - | ||||
| Fair value through profit or loss investments | 729,168 | 1,011 | 39,638 | 3820.7% | -94.6% |
| Fair value through other comprehensive income investments | 20,202,882 | 15,260,159 | 17,702,831 | 16.0% | -12.4% |
| Amortized cost investments | 7,538,562 | 9,831,983 | 9,661,389 | -1.7% | 28.2% |
| - | - | ||||
| Loans | 132,578,949 | 136,046,442 | 132,290,495 | -2.8% | -0.2% |
| Current | 126,930,472 | 130,396,010 | 126,846,139 | -2.7% | -0.1% |
| Internal overdue loans | 5,648,477 | 5,650,432 | 5,444,356 | -3.6% | -3.6% |
| Less - allowance for loan losses | (7,769,920) | (7,408,223) | (7,450,091) | 0.6% | -4.1% |
| Loans, net | 124,809,029 | 128,638,219 | 124,840,404 | -3.0% | 0.0% |
| - | - | ||||
Property, furniture and equipment, net (1) | 1,593,758 | 1,536,875 | 1,489,392 | -3.1% | -6.5% |
| Due from customers on acceptances | 524,448 | 699,678 | 496,170 | -29.1% | -5.4% |
| Investments in associates | 31,859 | 28,578 | 18,246 | -36.2% | -42.7% |
Other assets (2) | 6,100,840 | 5,662,055 | 6,873,005 | 21.4% | 12.7% |
| - | - | ||||
| Total Assets | 194,945,753 | 193,278,232 | 193,733,945 | 0.2% | -0.6% |
| - | - | ||||
| Liabilities and Equity | - | - | |||
| Deposits and obligations | - | - | |||
Non-interest bearing (1) | 45,297,294 | 39,399,007 | 37,978,204 | -3.6% | -16.2% |
Interest bearing (1) | 85,125,304 | 90,420,659 | 93,952,305 | 3.9% | 10.4% |
| Total deposits and obligations | 130,422,598 | 129,819,666 | 131,930,509 | 1.6% | 1.2% |
| - | - | ||||
| Payables from repurchase agreements and securities lending | 18,064,487 | 11,843,594 | 10,318,686 | -12.9% | -42.9% |
| BCRP instruments | 17,532,350 | 11,297,659 | 9,780,540 | -13.4% | -44.2% |
| Repurchase agreements with third parties | 532,137 | 545,935 | 538,146 | -1.4% | 1.1% |
| Due to banks and correspondents | 5,872,463 | 8,539,195 | 9,647,935 | 13.0% | 64.3% |
| Bonds and notes issued | 13,575,977 | 13,840,114 | 10,972,861 | -20.7% | -19.2% |
| Banker’s acceptances outstanding | 524,448 | 699,678 | 496,170 | -29.1% | -5.4% |
| Financial liabilities at fair value through profit or loss | - | 7,669 | 193,031 | 2417.0% | n.a |
Other liabilities (3) | 6,211,275 | 5,256,079 | 8,245,729 | 56.9% | 32.8% |
| Total Liabilities | 174,671,248 | 170,005,995 | 171,804,921 | 1.1% | -1.6% |
| - | - | ||||
| Net equity | 20,140,022 | 23,121,902 | 21,777,751 | -5.8% | 8.1% |
| Capital stock | 11,882,984 | 11,882,984 | 12,679,794 | 6.7% | 6.7% |
| Reserves | 7,297,648 | 6,540,665 | 6,820,019 | 4.3% | -6.5% |
| Unrealized gains and losses | (780,063) | (549,319) | (467,041) | -15.0% | -40.1% |
| Retained earnings | 1,739,453 | 5,247,572 | 2,744,979 | -47.7% | 57.8% |
| - | - | ||||
| Non-controlling interest | 134,483 | 150,335 | 151,273 | 0.6% | 12.5% |
| - | - | ||||
| Total Net Equity | 20,274,505 | 23,272,237 | 21,929,024 | -5.8% | 8.2% |
| - | - | ||||
| Total liabilities and equity | 194,945,753 | 193,278,232 | 193,733,945 | 0.2% | -0.6% |
| - | - | ||||
| Off-balance sheet | 131,406,579 | 137,999,722 | 142,247,161 | 3.1% | 8.2% |
| Total performance bonds, stand-by and L/Cs. | 19,638,213 | 19,737,892 | 17,932,260 | -9.1% | -8.7% |
| Undrawn credit lines, advised but not committed | 70,893,784 | 75,276,664 | 76,157,911 | 1.2% | 7.4% |
| Total derivatives (notional) and others | 40,874,582 | 42,985,166 | 48,156,990 | 12.0% | 17.8% |
(1) Right of use asset of lease contracts is included by application of IFRS 16.
(2) Mainly includes intangible assets, other receivable accounts and tax credit.
(3) Mainly includes other payable accounts.
(2) Mainly includes intangible assets, other receivable accounts and tax credit.
(3) Mainly includes other payable accounts.
69
| | | Earnings Release 1Q / 2023 | Analysis of 1Q23 Consolidated Results |
12. Appendix |
BANCO DE CREDITO DEL PERU AND SUBSIDIARIES
CONSOLIDATED STATEMENT OF INCOME
(In S/ thousands, IFRS)
| Quarter | % change | ||||
| 1Q22 | 4Q22 | 1Q23 | QoQ | YoY | |
| Interest income and expense | |||||
| Interest and dividend income | 2,712,960 | 3,821,770 | 3,902,811 | 2.1% | 43.9% |
| Interest expense | (494,035) | (913,761) | (994,836) | 8.9% | 101.4% |
| Net interest income | 2,218,925 | 2,908,009 | 2,907,975 | 0.0% | 31.1% |
| Provision for credit losses on loan portfolio | (340,235) | (783,402) | (782,079) | -0.2% | 129.9% |
| Recoveries of written-off loans | 86,428 | 79,076 | 69,694 | -11.9% | -19.4% |
| Provision for credit losses on loan portfolio, net of recoveries | (253,807) | (704,326) | (712,385) | 1.1% | 180.7% |
| Risk-adjusted net interest income | 1,965,118 | 2,203,683 | 2,195,590 | -0.4% | 11.7% |
| Non-financial income | |||||
| Fee income | 731,705 | 766,960 | 727,489 | -5.1% | -0.6% |
| Net gain on foreign exchange transactions | 242,504 | 271,267 | 242,570 | -10.6% | 0.0% |
| Net gain (loss) on securities | (1,898) | (9,162) | (2,584) | -71.8% | 36.1% |
| Net gain (loss) on derivatives held for trading | (10,978) | 17,756 | 22,288 | 25.5% | n.a |
| Net gain (loss) from exchange differences | (17,051) | 3,265 | 4,308 | 31.9% | n.a |
| Others | 120,328 | 8,862 | 71,277 | 704.3% | -40.8% |
| Total other income | 1,064,610 | 1,058,948 | 1,065,348 | 0.6% | 0.1% |
| Total expenses | |||||
| Salaries and employee benefits | (694,339) | (768,578) | (750,011) | -2.4% | 8.0% |
| Administrative expenses | (532,560) | (810,501) | (645,131) | -20.4% | 21.1% |
| Depreciation and amortization | (126,426) | (139,688) | (134,267) | -3.9% | 6.2% |
| Other expenses | (49,556) | (76,515) | (43,944) | -42.6% | -11.3% |
| Total expenses | (1,402,881) | (1,795,282) | (1,573,353) | -12.4% | 12.2% |
| Profit before income tax | 1,626,847 | 1,467,349 | 1,687,585 | 15.0% | 3.7% |
| Income tax | (466,694) | (403,338) | (422,491) | 4.7% | -9.5% |
| Net profit | 1,160,153 | 1,064,011 | 1,265,094 | 18.9% | 9.0% |
| Non-controlling interest | (5,157) | (2,318) | (1,112) | -52.0% | -78.4% |
| Net profit attributable to BCP Consolidated | 1,154,996 | 1,061,693 | 1,263,982 | 19.1% | 9.4% |
BANCO DE CREDITO DEL PERU AND SUBSIDIARIES
SELECTED FINANCIAL INDICATORS
| Quarter | |||
| 1Q22 | 4Q22 | 1Q23 | |
| Profitability | |||
Earnings per share (1) | 0.09 | 0.08 | 0.10 |
ROAA (2)(3) | 2.3% | 2.2% | 2.6% |
ROAE (2)(3) | 22.7% | 18.8% | 22.5% |
Net interest margin (2)(3) | 4.63% | 6.12% | 6.22% |
Risk adjusted NIM (2)(3) | 4.10% | 4.64% | 4.70% |
Funding Cost (2)(3)(4) | 1.16% | 2.18% | 2.43% |
| Quality of loan portfolio | |||
| IOL ratio | 4.26% | 4.15% | 4.12% |
| NPL ratio | 5.52% | 5.67% | 5.69% |
| Coverage of IOLs | 137.6% | 131.1% | 136.8% |
| Coverage of NPLs | 106.2% | 96.0% | 98.9% |
Cost of risk (5) | 0.77% | 2.07% | 2.15% |
| Operating efficiency | |||
Oper. expenses as a percent. of total income - reported (6) | 42.8% | 43.3% | 39.2% |
Oper. expenses as a percent. of av. tot. assets (2)(3)(6) | 2.75% | 3.50% | 3.16% |
| Share Information | |||
| N° of outstanding shares (Million) | 12,973 | 12,973 | 12,973 |
(1) Shares outstanding of 12,176 million is used for all periods since shares have been issued only for capitalization of profits.
(2) Ratios are annualized.
(3) Averages are determined as the average of period-beginning and period-ending balances.
(4) The funding costs differs from previously reported due to a methodoloy change in the denominator, which no longer includes the following accounts: acceptances outstanding, reserves for property and casualty claims, reserve for unearned premiums, reinsurance payable and other liabilities.
(5) Cost of risk: Annualized provision for loan losses / Total loans.
(6) Total income includes net interest income, fee income, net gain on foreign exchange transactions, result on exchange difference and net gain on derivatives. Operating expenses includes Salaries and social benefits, administrative, general and tax expenses and depreciation and amortization.
70
| | | Earnings Release 1Q / 2023 | Analysis of 1Q23 Consolidated Results |
12. Appendix |
12.6.4. BCP Stand-alone
BANCO DE CREDITO DEL PERU
STATEMENT OF FINANCIAL POSITION
(S/ thousands, IFRS)
| | As of | % change | |||
| Mar 22 | Dec 22 | Mar 23 | QoQ | YoY | |
| ASSETS | |||||
| Cash and due from banks | |||||
| Non-interest bearing | 4,429,348 | 5,070,067 | 4,832,635 | -4.7% | 9.1% |
| Interest bearing | 27,448,742 | 24,573,419 | 26,052,997 | 6.0% | -5.1% |
| Total cash and due from banks | 31,878,090 | 29,643,486 | 30,885,632 | 4.2% | -3.1% |
| Cash collateral, reverse repurchase agreements and securities borrowing | 202,127 | 244,017 | 232,059 | -4.9% | 14.8% |
| Fair value through profit or loss investments | 729,168 | 1,011 | 39,638 | 3820.7% | -94.6% |
| Fair value through other comprehensive income investments | 18,749,758 | 14,098,087 | 16,582,128 | 17.6% | -11.6% |
| Amortized cost investments | 7,249,994 | 9,534,621 | 9,369,229 | -1.7% | 29.2% |
| Loans | 120,541,004 | 123,707,601 | 119,751,399 | -3.2% | -0.7% |
| Current | 115,852,249 | 118,841,510 | 115,009,487 | -3.2% | -0.7% |
| Internal overdue loans | 4,688,755 | 4,866,091 | 4,741,912 | -2.6% | 1.1% |
| Less - allowance for loan losses | (6,616,033) | (6,402,939) | (6,404,541) | 0.0% | -3.2% |
| Loans, net | 113,924,971 | 117,304,662 | 113,346,858 | -3.4% | -0.5% |
Property, furniture and equipment, net (1) | 1,314,065 | 1,281,645 | 1,238,722 | -3.3% | -5.7% |
| Due from customers on acceptances | 524,448 | 699,678 | 496,170 | -29.1% | -5.4% |
| Investments in associates | 2,429,540 | 2,730,184 | 2,736,368 | 0.2% | 12.6% |
Other assets (2) | 5,360,983 | 5,071,892 | 6,203,938 | 22.3% | 15.7% |
| Total Assets | 182,363,144 | 180,609,283 | 181,130,742 | 0.3% | -0.7% |
| Liabilities and Equity | |||||
| Deposits and obligations | |||||
| Non-interest bearing | 45,294,239 | 39,395,493 | 37,968,322 | -3.6% | -16.2% |
| Interest bearing | 76,416,598 | 81,232,946 | 84,477,317 | 4.0% | 10.5% |
| Total deposits and obligations | 121,710,837 | 120,628,439 | 122,445,639 | 1.5% | 0.6% |
| Payables from repurchase agreements and securities lending | 16,093,566 | 10,879,734 | 9,578,869 | -12.0% | -40.5% |
| BCRP instruments | 15,561,430 | 10,333,799 | 9,040,723 | -12.5% | -41.9% |
| Repurchase agreements with third parties | 532,137 | 545,935 | 538,146 | -1.4% | 1.1% |
| Due to banks and correspondents | 4,905,616 | 7,251,352 | 8,535,930 | 17.7% | 74.0% |
| Bonds and notes issued | 13,319,276 | 13,287,386 | 10,396,500 | -21.8% | -21.9% |
| Banker’s acceptances outstanding | 524,448 | 699,678 | 496,170 | -29.1% | -5.4% |
| Financial liabilities at fair value through profit or loss | - | 7,669 | 193,031 | 2417.0% | n.a. |
Other liabilities (3) | 5,668,164 | 4,731,200 | 7,705,309 | 62.9% | 35.9% |
| Total Liabilities | 162,221,907 | 157,485,458 | 159,351,448 | 1.2% | -1.8% |
| Net equity | 20,141,237 | 23,123,825 | 21,779,294 | -5.8% | 8.1% |
| Capital stock | 11,882,984 | 11,882,984 | 12,679,794 | 6.7% | 6.7% |
| Reserves | 7,297,648 | 6,540,665 | 6,820,019 | 4.3% | -6.5% |
| Unrealized gains and losses | (780,063) | (549,319) | (467,041) | -15.0% | -40.1% |
| Retained earnings | 1,740,668 | 5,249,495 | 2,746,522 | -47.7% | 57.8% |
| Total Net Equity | 20,141,237 | 23,123,825 | 21,779,294 | -5.8% | 8.1% |
| | |||||
| Total liabilities and equity | 182,363,144 | 180,609,283 | 181,130,742 | 0.3% | -0.7% |
| Off-balance sheet | 127,873,817 | 134,450,003 | 138,810,501 | 3.2% | 8.6% |
| Total performance bonds, stand-by and L/Cs. | 19,638,213 | 19,738,086 | 17,932,454 | -9.1% | -8.7% |
| Undrawn credit lines, advised but not committed | 68,137,602 | 73,473,563 | 73,838,085 | 0.5% | 8.4% |
| Total derivatives (notional) and others | 40,098,002 | 41,238,354 | 47,039,962 | 14.1% | 17.3% |
(1) Mainly includes intangible assets, other receivable accounts and tax credit.
(2) Mainly includes other payable accounts.
71
| | | Earnings Release 1Q / 2023 | Analysis of 1Q23 Consolidated Results |
12. Appendix |
BANCO DE CREDITO DEL PERU
STATEMENT OF INCOME
(S/ thousands, IFRS)
| Quarter | % change | ||||
| 1Q22 | 4Q22 | 1Q23 | QoQ | YoY | |
| Interest income and expense | |||||
| Interest and dividend income | 2,120,216 | 3,119,180 | 3,205,509 | 2.8% | 51.2% |
Interest expense (1) | (414,863) | (751,858) | (817,056) | 8.7% | 96.9% |
| Net interest income | 1,705,353 | 2,367,322 | 2,388,453 | 0.9% | 40.1% |
| Provision for credit losses on loan portfolio | (202,768) | (564,240) | (532,192) | -5.7% | 162.5% |
| Recoveries of written-off loans | 56,125 | 53,602 | 47,417 | -11.5% | -15.5% |
| Provision for credit losses on loan portfolio, net of recoveries | (146,643) | (510,638) | (484,775) | -5.1% | 230.6% |
| Risk-adjusted net interest income | 1,558,710 | 1,856,684 | 1,903,678 | 2.5% | 22.1% |
| Other income | |||||
| Fee income | 706,861 | 741,992 | 698,207 | -5.9% | -1.2% |
| Net gain on foreign exchange transactions | 238,738 | 267,859 | 239,547 | -10.6% | 0.3% |
| Net gain (losses) on securities | 90,463 | 37,096 | 26,998 | -27.2% | -70.2% |
| Net gain from associates | 5,701 | (864) | (7,269) | 741.3% | -227.5% |
| Net gain (losses) on derivatives held for trading | (9,976) | 9,957 | 20,553 | 106.4% | -306.0% |
| Net gain (losses) from exchange differences | (10,017) | 4,812 | 4,691 | -2.5% | -146.8% |
| Others | 110,750 | 9,937 | 68,255 | 586.9% | -38.4% |
| Total other income | 1,132,520 | 1,070,789 | 1,050,982 | -1.8% | -7.2% |
| | |||||
| Total expenses | |||||
| Salaries and employee benefits | (501,213) | (564,902) | (546,048) | -3.3% | 8.9% |
| Administrative expenses | (463,927) | (736,377) | (571,780) | -22.4% | 23.2% |
Depreciation and amortization (2) | (105,859) | (119,047) | (112,872) | -5.2% | 6.6% |
| Other expenses | (43,686) | (59,997) | (39,563) | -34.1% | -9.4% |
| Total expenses | (1,114,685) | (1,480,323) | (1,270,263) | -14.2% | 14.0% |
| Profit before income tax | 1,576,545 | 1,447,150 | 1,684,397 | 16.4% | 6.8% |
| Income tax | (420,120) | (385,123) | (420,795) | 9.3% | 0.2% |
| Net profit attributable to BCP Stand-alone | 1,156,425 | 1,062,027 | 1,263,602 | 19.0% | 9.3% |
(1) As of 2019, financing expenses related to lease agreements is included according to the application of IFRS 16.
(2) From this quarter, the effect is being incorporated by the application of IFRS 16, which corresponds to a greater depreciation for the asset for right-of-use”. Likewise, the expenses related to the depreciation of improvements in building for rent is being reclassified to the item “Other expenses”.
BANCO DE CREDITO DEL PERU
SELECTED FINANCIAL INDICATORS
| Quarter | |||
| 1Q22 | 4Q22 | 1Q23 | |
| Profitability | |||
ROAA (1)(2) | 2.5% | 2.3% | 2.8% |
ROAE (1)(2) | 22.7% | 18.8% | 22.5% |
Net interest margin (1)(2) | 3.85% | 5.41% | 5.55% |
Risk adjusted NIM (1)(2) | 3.52% | 4.24% | 4.42% |
Funding Cost (1)(2)(3) | 1.04% | 1.93% | 2.16% |
| Quality of loan portfolio | |||
| IOL ratio | 3.89% | 3.93% | 3.96% |
| NPL ratio | 5.22% | 5.53% | 5.61% |
| Coverage of IOLs | 141.1% | 131.6% | 135.1% |
| Coverage of NPLs | 105.2% | 93.5% | 95.3% |
Cost of risk (4) | 0.49% | 1.65% | 1.62% |
| Operating efficiency | |||
Oper. expenses as a percent. of total income - reported (5) | 40.7% | 41.9% | 36.8% |
Oper. expenses as a percent. of av. tot. assets (1)(2)(5) | 2.32% | 3.09% | 2.72% |
(1) Ratios are annualized.
(2) Averages are determined as the average of period-beginning and period-ending balances.
(3) The funding costs differs from previously reported due to a methodology change in the denominator, which no longer includes the following accounts: acceptances outstanding, reserves for property and casualty claims, reserve for unearned premiums, reinsurance payable and other liabilities.
(4) Cost of risk: Annualized provision for loan losses / Total loans.
(5) Total income includes net interest income, fee income, net gain on foreign exchange transactions, result on exchange difference and net gain on derivatives. Operating expenses includes Salaries and social benefits, administrative, general and tax expenses and depreciation and amortization.
72
| | | Earnings Release 1Q / 2023 | Analysis of 1Q23 Consolidated Results |
12. Appendix |
12.6.5. BCP Bolivia
BCP BOLIVIA
(S/ thousands, IFRS)
| As of | % change | ||||
| Mar 22 | Dec 22 | Mar 23 | QoQ | YoY | |
| ASSETS | |||||
| Cash and due from banks | 2,220,657 | 1,945,704 | 1,979,856 | 1.8% | -10.8% |
| Investments | 1,598,725 | 1,526,954 | 1,668,326 | 9.3% | 4.4% |
| Total loans | 8,890,948 | 9,253,908 | 9,362,120 | 1.2% | 5.3% |
| Current | 8,688,239 | 8,997,604 | 9,108,055 | 1.2% | 4.8% |
| Internal overdue loans | 170,937 | 231,247 | 228,195 | -1.3% | 33.5% |
| Refinanced | 31,772 | 25,057 | 25,869 | 3.2% | -18.6% |
| Allowance for loan losses | (404,078) | (397,602) | (392,762) | -1.2% | -2.8% |
| Net loans | 8,486,870 | 8,856,305 | 8,969,357 | 1.3% | 5.7% |
| Property, plant and equipment, net | 62,645 | 63,957 | 63,692 | -0.4% | 1.7% |
| Other assets | 368,350 | 304,873 | 290,842 | -4.6% | -21.0% |
| Total assets | 12,737,246 | 12,697,793 | 12,972,073 | 2.2% | 1.8% |
| LIABILITIES AND NET SHAREHOLDERS’ EQUITY | |||||
| Deposits and obligations | 10,678,175 | 10,985,892 | 10,836,041 | -1.4% | 1.5% |
| Due to banks and correspondents | 89,938 | 77,909 | 81,653 | 4.8% | -9.2% |
| Bonds and subordinated debt | 171,787 | 99,065 | 94,607 | -4.5% | -44.9% |
| Other liabilities | 1,007,946 | 675,099 | 1,109,657 | 64.4% | 10.1% |
| Total liabilities | 11,947,847 | 11,837,965 | 12,121,958 | 2.4% | 1.5% |
| Net equity | 789,399 | 859,828 | 850,115 | -1.1% | 7.7% |
| TOTAL LIABILITIES AND NET SHAREHOLDERS’ EQUITY | 12,737,246 | 12,697,793 | 12,972,073 | 2.2% | 1.8% |
| Quarter | % change | ||||
| 1Q22 | 4Q22 | 1Q23 | QoQ | YoY | |
| Net interest income | 81,157 | 78,977 | 82,670 | 4.7% | 1.9% |
| Provision for loan losses, net of recoveries | 2,858 | (17,126) | (3,349) | -80.4% | -217.2% |
| Net interest income after provisions | 84,015 | 61,850 | 79,321 | 28.2% | -5.6% |
| Non-financial income | 39,645 | 46,134 | 45,306 | -1.8% | 14.3% |
| Total expenses | (72,563) | (84,186) | (92,549) | 9.9% | 27.5% |
| Translation result | 17 | 188 | (51) | -127.1% | -399.7% |
| Income taxes | (30,640) | (7,228) | (11,290) | 56.2% | -63.2% |
| Net income | 20,474 | 16,759 | 20,738 | 23.7% | 1.3% |
| Efficiency ratio | 59.9% | 64.5% | 60.2% | -427 pbs | 35 pbs |
| ROAE | 10.1% | 7.7% | 9.7% | 196 pbs | -39 pbs |
| L/D ratio | 83.3% | 84.2% | 86.4% | 217 pbs | 314 pbs |
| IOL ratio | 1.92% | 2.50% | 2.44% | -6 pbs | 52 pbs |
| NPL ratio | 2.28% | 2.77% | 2.71% | -6 pbs | 43 pbs |
| Coverage of IOLs | 236.4% | 171.9% | 172.1% | 18 pbs | -6427 pbs |
| Coverage of NPLs | 199.3% | 155.1% | 154.6% | -54 pbs | -4475 pbs |
| Branches | 45 | 45 | 46 | 1 | 1 |
| Agentes | 1078 | 1355 | 1355 | 0 | 277 |
| ATMs | 310 | 312 | 313 | 1 | 3 |
| Employees | 1,586 | 1,696 | 1,690 | -6 | 104 |
73
| | | Earnings Release 1Q / 2023 | Analysis of 1Q23 Consolidated Results |
12. Appendix |
12.6.6. Mibanco
MIBANCO
(In S/ thousands, IFRS)
| As of | % change | ||||
| Mar 22 | Dec 22 | Mar 23 | QoQ | YoY | |
| ASSETS | |||||
| Cash and due from banks | 1,400,085 | 1,850,881 | 1,733,556 | -6.3% | 23.8% |
| Investments | 1,746,228 | 1,459,434 | 1,412,863 | -3.2% | -19.1% |
| Total loans | 13,983,905 | 14,089,071 | 14,006,154 | -0.6% | 0.2% |
| Current | 12,965,841 | 13,228,543 | 13,204,563 | -0.2% | 1.8% |
| Internal overdue loans | 951,029 | 776,023 | 696,787 | -10.2% | -26.7% |
| Refinanced | 67,035 | 84,505 | 104,805 | 24.0% | 56.3% |
| Allowance for loan losses | -1,146,067 | -998,261 | -1,040,487 | 4.2% | -9.2% |
| Net loans | 12,837,838 | 13,090,810 | 12,965,667 | -1.0% | 1.0% |
| Property, plant and equipment, net | 139,875 | 133,756 | 131,164 | -1.9% | -6.2% |
| Other assets | 854,944 | 691,093 | 753,989 | 9.1% | -11.8% |
| Total assets | 16,978,970 | 17,225,973 | 16,997,238 | -1.3% | 0.1% |
| LIABILITIES AND NET SHAREHOLDERS’ EQUITY | |||||
| Deposits and obligations | 8,782,960 | 9,315,188 | 9,577,206 | 2.8% | 9.0% |
| Due to banks and correspondents | 2,952,092 | 3,074,234 | 2,759,826 | -10.2% | -6.5% |
| Bonds and subordinated debt | 256,701 | 552,728 | 576,360 | 4.3% | 124.5% |
| Other liabilities | 2,523,136 | 1,502,258 | 1,282,571 | -14.6% | -49.2% |
| Total liabilities | 14,514,889 | 14,444,408 | 14,195,963 | -1.7% | -2.2% |
| Net equity | 2,464,082 | 2,781,565 | 2,801,275 | 0.7% | 13.7% |
| TOTAL LIABILITIES AND NET SHAREHOLDERS’ EQUITY | 16,978,970 | 17,225,973 | 16,997,238 | -1.3% | 0.1% |
| Quarter | % change | ||||
| 1Q22 | 4Q22 | 1Q23 | QoQ | YoY | |
| Net interest income | 512,222 | 539,510 | 518,763 | -3.8% | 1.3% |
| Provision for loan losses, net of recoveries | -105,337 | -194,245 | -227,369 | 17.1% | 115.8% |
| Net interest income after provisions | 406,885 | 345,266 | 291,394 | -15.6% | -28.4% |
| Non-financial income | 30,620 | 35,755 | 36,337 | 1.6% | 18.7% |
| Total expenses | -288,029 | -316,253 | -302,982 | -4.2% | 5.2% |
| Translation result | 0 | 0 | 0 | 0.0% | 0.0% |
| Income taxes | -46,540 | -17,814 | -1,607 | -91.0% | -96.5% |
| Net income | 102,935 | 46,954 | 23,142 | -50.7% | -77.5% |
| Efficiency ratio | 53.0% | 52.3% | 54.1% | -74 bps | -7 bps |
| ROAE | 17.1% | 6.8% | 3.3% | 184 bps | 816 bps |
| ROAE incl. Goowdill | 16.3% | 6.5% | 3.2% | 178 bps | 792 bps |
| L/D ratio | 159.2% | 151.2% | 146.2% | -626 bps | 74 bps |
| IOL ratio | 6.8% | 5.5% | 5.0% | -23 bps | -147 bps |
| NPL ratio | 7.3% | 6.1% | 5.7% | -19 bps | -127 bps |
| Coverage of IOLs | 120.5% | 128.6% | 149.3% | -322 bps | -2336 bps |
| Coverage of NPLs | 112.6% | 116.0% | 129.8% | -387 bps | -2644 bps |
Branches (1) | 310 | 297 | 296 | -1 | -14 |
| Employees | 9,810 | 9,725 | 9,904 | 179 | 94 |
(1) Includes Banco de la Nacion branches, which in December 21, September 22 and December 22 were 34.
74
| | | Earnings Release 1Q / 2023 | Analysis of 1Q23 Consolidated Results |
12. Appendix |
12.6.7. Prima AFP
| As of | % change | ||||
| Mar 22 | Dec 22 | Mar 23 | QoQ | YoY | |
| Total assets | 872,173 | 734,967 | 790,586 | 7.6% | -9.4% |
| Total liabilities | 460,279 | 238,178 | 400,483 | 68.1% | -13.0% |
| Net shareholders' equity | 411,894 | 496,789 | 390,103 | -21.5% | -5.3% |
| Quarter | % change | ||||
| 1Q22 | 4Q22 | 1Q23 | QoQ | YoY | |
| Income from commissions | 93,192 | 87,868 | 89,532 | 1.9% | -3.9% |
| Administrative and sale expenses | (43,800) | (34,262) | (38,986) | 13.8% | -11.0% |
| Depreciation and amortization | (6,215) | (5,603) | (6,194) | 10.5% | -0.3% |
| Operating income | 43,178 | 48,003 | 44,352 | -7.6% | 2.7% |
| Other income and expenses, net (profitability of lace)* | (4,133) | 4,402 | 8,742 | 98.6% | -311.5% |
| Income tax | (13,194) | (12,302) | (13,295) | 8.1% | 0.8% |
| Net income before translation results | 25,851 | 40,103 | 39,799 | -0.8% | 54.0% |
| Translations results | (1,416) | 151 | (41) | -127.3% | -97.1% |
| Net income | 24,434 | 40,254 | 39,758 | -1.2% | 62.7% |
ROAE (1) | 19.8% | 33.8% | 35.9% | 208 pbs | 1604 pbs |
(*) The net profitability of lace and mutual funds is being presented net of taxes, for which the retroactive change was made (it was presented gross before)
(1) Net shareholders’ equity includes unrealized gains from Prima’s investment portfolio.
Funds under management
| Funds under management | Dic 22 | % share | Mar 23 | % share |
| Fund 0 | 1,350 | 4.24% | 1,403 | 4.26% |
| Fund 1 | 5,316 | 16.69% | 5,533 | 16.80% |
| Fund 2 | 21,384 | 67.14% | 22,256 | 67.59% |
| Fund 3 | 3,800 | 11.93% | 3,736 | 11.35% |
| Total S/ Millions | 31,850 | 100% | 32,928 | 100% |
Source: SBS.
Nominal profitability over the last 12 months
| Dec 22 / Dec 21 | Mar 23 / Mar 22 | |
| Fund 0 | 5.2% | 6.4% |
| Fund 1 | -5.3% | 1.0% |
| Fund 2 | -7.0% | -2.2% |
| Fund 3 | -8.2% | -11.2% |
(1) Included new methodology of SBS to calculate quota value.
AFP commissions
| Fee based on flow | 1.60% | Applied to the affiliates’ monthly remuneration. | |
| Mixed fee | |||
| Flow | 0.18% | Applied to the affiliates’ monthly remuneration since June 2017. Feb 17- may 17 =0.87%. | |
| Balance | 1.25% | Applies annualy to the new balance since February 2013 for new affiliates to the system and beginning on June 2013 for old affiliates who have chosen this commission scheme. | |
Main indicators
| Main indicators and market share | Prima 4Q22 | System 4Q22 | % share 4Q22 | Prima 1Q23 | System 1Q23 | % share 1Q23 |
| Affiliates | 2,344,701 | 8,816,304 | 26.6% | 2,343,434 | 8,905,304 | 26.3% |
New affiliations (1) | - | 136,632 | 0.0% | - | 91,429 | 0.0% |
| Funds under management (S/ Millions) | 31,850 | 105,863 | 30.1% | 32,382 | 107,712 | 30.1% |
| Collections (S/ Millions) | 1005 | 3,620 | 27.8% | 664 | 2,365 | 28.1% |
| Voluntary contributions (S/ Millions) | 781 | 2,110 | 37.0% | 800 | 2,087 | 38.3% |
RAM Flow (S/ Millions) (2) | 1,340 | 4,452 | 30.1% | 1,382 | 4,590 | 30.1% |
Source: SBS
(1) As of June 2019, another AFP has the exclusivity of affiliations.
(2) Prima AFP estimate: Average of aggregated income for flow during the last 4 months, excluding special collections and voluntary contribution fees.
75
| | | Earnings Release 1Q / 2023 | Analysis of 1Q23 Consolidated Results |
12. Appendix |
12.6.8. Grupo Pacifico
GRUPO PACIFICO *
(S/ in thousands, IFRS 17)
| As of | % change | ||
| Mar 22 | Mar 23 | YoY | |
| Balance | |||
| Total assets | 15,600,882 | 16,302,041 | 4.5% |
Total Invesment (1) | 10,525,652 | 11,191,968 | 6.3% |
| Total Liabilities | 13,433,886 | 13,857,430 | 3.2% |
| Net equity | 2,149,890 | 2,431,696 | 13.1% |
| Quarter | % change | YTD | % change | |||
| 1Q22 | 1Q23 | YoY | 1Q22 | 1Q23 | YoY | |
| Insurance Service Result | 209,092 | 296,390 | 41.8% | 209,092 | 296,390 | 41.8% |
| Reinsurance Result | -102,591 | -114,009 | 11.1% | -102,591 | -114,009 | 11.1% |
| Insurance underwriting result | 106,501 | 182,381 | 71.2% | 106,501 | 182,381 | 71.2% |
| Interest income | 170,571 | 189,963 | 11.4% | 170,571 | 189,963 | 11.4% |
| Interest Expenses | -108,711 | -102,453 | -5.8% | -108,711 | -102,453 | -5.8% |
| Net Interest Income | 61,860 | 87,510 | 41.5% | 61,860 | 87,510 | 41.5% |
| Fee Income and Gain in FX | -2,863 | -3,184 | 11.2% | -2,863 | -3,184 | 11.2% |
| Other Income No Core: | - | |||||
| Net gain (loss) from exchange differences | 3,360 | -1,343 | -140.0% | 3,360 | -1,343 | -140.0% |
| Net loss on securities and associates | -10,387 | 30,090 | -389.7% | -10,387 | 30,090 | -389.7% |
| Other Income not operational | 11,313 | 12,501 | 10.5% | 11,313 | 12,501 | 10.5% |
| Other Income | 1,423 | 38,064 | N/A | 1,423 | 38,064 | N/A |
| Operating expenses | -58,769 | -64,268 | 9.4% | -58,769 | -64,268 | 9.4% |
| Other expenses | -984 | 654 | -166.5% | -984 | 654 | -166.5% |
| Total Expenses | -59,753 | -63,614 | 6.5% | -59,753 | -63,614 | 6.5% |
| Income tax | -2,684 | -3,200 | 19.2% | -2,684 | -3,200 | 19.2% |
| Net Income | 107,347 | 241,141 | 124.6% | 107,347 | 241,141 | 124.6% |
*Financial statements without consolidation adjustments.
(1) Excluding investments in real estate.
From 1Q15 and on, Grupo Pacifico’s financial statements reflect the agreement with Banmedica (in equal parts) of the businesses of:
| • | private health insurance managed by Grupo Pacifico and included in its Financial Statements in each of the accounting lines; |
| • | corporate health insurance (dependent workers); and |
| • | medical services. |
The businesses described in ii) and iii) are managed by Banmedica, therefore they do not consolidate in Grupo Pacifico’s financial statements. The 50% of net income generated by Banmedica is recorded in Grupo Pacifico’s Income Statement as a gain/loss on investments in subsidiaries.
As explained before, corporate health insurance and medical services businesses are consolidated by Banmedica. The following table reflects the consolidated results from which Grupo Pacifico receives the 50% net income.
76
| | | Earnings Release 1Q / 2023 | Analysis of 1Q23 Consolidated Results |
12. Appendix |
Corporate health insurance and Medical services
(S/ in thousands )
| Quarter | % change | ||
| 1Q22 | 1Q23 | YoY | |
| Results | |||
| Net earned premiums | 314,362 | 340,905 | 8.4% |
| Net claims | -276,082 | -259,039 | -6.2% |
| Net fees | -13,671 | -14,627 | 7.0% |
| Net underwriting expenses | -3,263 | -2,995 | -8.2% |
| Underwriting result | 21,346 | 64,243 | 201.0% |
| Net financial income | 1,883 | 4,133 | 119.5% |
| Total expenses | -18,870 | -22,469 | 19.1% |
| Other income | 1,226 | 2,709 | 121.0% |
| Traslations results | -4,397 | -1,180 | -73.2% |
| Income tax | -424 | -15,249 | N/A |
| Net income before Medical services | 763 | 32,187 | N/A |
| Net income of Medical services | 28,460 | 28,462 | 0.0% |
| Net income | 29,222 | 60,649 | 107.5% |
| (1) | Reported under IFRS 4 standards. |
77
| | | Earnings Release 1Q / 2023 | Analysis of 1Q23 Consolidated Results |
12. Appendix |
12.6.9. Investment Banking & Wealth Management
| Investment Banking and Wealth Management | Quarter | % change | |||
| S/ 000 | 1Q22 | 4Q22 | 1Q23 | QoQ | YoY |
| Net interest income | 19,340 | 22,012 | 22,042 | 0.1% | 14% |
| Non-financial income | 179,997 | 190,667 | 192,785 | 1.1% | 7.1% |
| Fee income | 137,586 | 124,761 | 122,861 | -1.5% | -10.7% |
| Net gain on foreign exchange transactions | 10,646 | 9,758 | 16,084 | 64.8% | 51.1% |
| Net gain on sales of securities | 10,696 | 42,349 | 51,902 | 22.6% | 385.2% |
| Derivative Result | 10,841 | -11,908 | -28,858 | 142.3% | -366.2% |
| Result from exposure to the exchange rate | 2,227 | 19,483 | 22,997 | 18.0% | n.a |
| Other income | 8,001 | 6,224 | 7,799 | 25.3% | -2.5% |
| Operating expenses (1) | -162,258 | -163,684 | -163,109 | -0.4% | 0.5% |
| Operating income | 37,079 | 48,995 | 51,718 | 5.6% | 39% |
| Income taxes | -1,548 | -12,803 | -7,611 | -40.6% | 391.7% |
| Non-controlling interest | 757 | -2,829 | -175 | -93.8% | -123.1% |
| Net income | 34,774 | 39,021 | 44,282 | 13.5% | 27.3% |
| (1) | Includes: Salaries and employee’s benefits + Administrative expenses + Assigned expenses + Depreciation and amortization + Tax and contributions + Other expenses. |
78
| | | Earnings Release 1Q / 2023 | Analysis of 1Q23 Consolidated Results |
12. Appendix |
12.7. Table of calculations
Table of calculations (1) |
| Profitability | Net Interest Margin (NIM) | For further details on the new NIM calculation due to IFRS17, please refer to Annex 12.1 |
Risk-adjusted Net Interest Margin (Risk-adjusted NIM) | For further details on the new NIM calculation due to IFRS17, please refer to Annex 12.1 | |
| Funding cost | For further details on the new Funding cost calculation due to IFRS17, please refer to Annex 12.1 | |
| Return on average assets (ROA) | Annualized Net Income attributable to Credicorp Average Assets | |
| Return on average equity (ROE) | Annualized Net Income attributable to Credicorp Average net equity | |
| Portfolio quality | Internal overdue ratio | Internal overdue loans Total loans |
Non – performing loans ratio (NPL ratio) | (Internal overdue loans + Refinanced loans) Total loans | |
| Coverage ratio of internal overdue loans | Allowance for loans losses Internal overdue loans | |
| Coverage ratio of non – performing loans | Allowance for loans losses Non – performing loans | |
| Cost of risk | Annualized provision for credit losses on loans portfolio, net of recoveries Total loans | |
| Operating performance | Efficiency ratio | For further details on the new Efficiency ratio calculation due to IFRS17, please refer to Annex 12.1 |
| Capital Adequacy | BIS ratio | Regulatory Capital Risk – weighted assets |
| Tier 1 ratio | Tier 1 Risk – weighted assets | |
| Common Equity Tier 1 ratio | Capital+Reserves -100% of applicable deductions (2) + Retained Earnings + Unrealized gains or losses Risk – weighted assets |
(1) Averages are determined as the average of period-beginning and period-ending balances.
(2) Includes investment in subsidiaries, goodwill, intangibles and deferred tax that rely on future profitability.
79
| | | Earnings Release 1Q / 2023 | Analysis of 1Q23 Consolidated Results |
12. Appendix |
12.8. Glossary of terms
| Term | Definition | |
| Government Program Loans (“GP” or “GP Loans”) | Loan Portfolio related to Reactiva Peru and FAE-Mype programs to respond quickly and effectively to liquidity needs and maintain the payment chain. | |
| Structural Loans | Loan Portfolio excluding GP Loans. | |
| Structural Cost of Risk | Cost of Risk related to the Structural Loans. It excludes, in the numerator, provisions for credit losses on GP loans, and in the denominator, the total amount of GP Loans. | |
| Structural NPL ratio | NPL Ratio, excluding the impact of GP Loans. | |
| Structural NIM | NIM related to Structural Loans and Other Interest Earning Assets. It deducts the impact of GP Loans | |
| Structural Funding Cost | Funding Cost deducting the impact in expenses and funding related to GP Loans |
80