SECURITIES AND EXCHANGE COMMISSION
Washington, D.C. 20549
FORM 6-K
Report of Foreign Private Issuer
Pursuant to Rule 13a-16 or 15d-16 of the
Securities Exchange Act of 1934
For the month of February 2009
CREDICORP LTD.
(Exact name of registrant as specified in its charter)
Clarendon House
Church Street
Hamilton HM 11 Bermuda
(Address of principal executive office)
Indicate by check mark whether the registrant files or will file annual reports under cover Form 20-F or Form 40-F.
Form 20-F x Form 40-F o
Indicate by check mark whether the registrant by furnishing the information contained in this Form is also thereby furnishing the information to the Commission pursuant to Rule 12g3-2(b) under the Securities Exchange Act of 1934.
Yes o No x
 | CREDICORP Ltd. Reports Fourth Quarter and Year End 2008 Earnings Lima, Peru, February 5, 2008 - Credicorp (NYSE:BAP) announced today its un-audited results for the fourth quarter of 2008. These results are reported on a consolidated basis in accordance with IFRS in nominal U.S. Dollars. HIGHLIGHTS · Credicorp reported net earnings of US$ 13.5 million for 4Q08, reflecting an 85% drop from 3Q earnings following a conservative impairment of unrealized losses on the valuation of its proprietary investments of about US$ 40.8 million, resulting from the massive market meltdown in 4Q08 and a provision totaling US$ 43.5 million to cover all potential losses and contingencies related to the alleged Madoff fraud. However, year end net earnings show still a 2% increase from 2007 results reaching US$ 357.7 million and thus revealing the strength of Credicorp’s business in the midst of the worst financial crisis in decades. · The impaired amount is considered conservative given the nature of the securities affected and offers some future upside. Translation results showed this 4Q08 a US$ 32 million loss given the revaluation of the US currency internationally and against the local currency. For the year, however, translation results have a significantly smaller impact and reflect the resistance of the local currency which dropped only 4.8% in value YoY. · Net loan growth reported by the banking business continued strong, revealing a 6.4% QoQ net loan portfolio growth, or 28.4% YoY. Nevertheless, a slow down in growth became evident in the last month of the year. Further, considering daily average balances, retail loans grew 3.5%, middle market 1.3% and corporate loans a solid 11.6% QoQ. · As expected, Net Interest Income recovered, growing 6.9% QoQ, as reserve requirements were eased and the liquidity concerns relaxed our internal liquidity policies. Furthermore, some recovery in spreads following increased risk perceptions also contributed as loans continued expanding. Whereas on the funding side, interest expense dropped as our deposit structure shifted from time deposits to more liquid demand and savings accounts. · Thus NIM improved QoQ to 4.9% from 4.3%. · Recurring non financial income shows some impact from the financial turmoil since fees generated by the asset management business and capital markets dropped resulting in total fee income for the quarter down 9.3%. Income from FX transactions did pick-up 35% QoQ, which added to some gains on the sale of securities led to an overall increase of about 16.7% QoQ and 30.6% YoY. · Loan portfolio quality remained strong at 0.79% PDL/Loans ratio and 271% coverage. Net provisioning shows again a drop due to provision reversals and despite a conservative provisioning policy throughout the year. · BCP’s consolidated numbers reflect a still very healthy and dynamic banking environment, though a slow down started to show in December. BCP’s 4Q08 income generation improved from 3Q08 with NII up 6.2%, non-financial income up 24.8% and operating expenses up only 5.5% QoQ. Though operating results improved, the appreciation of the US currency in the quarter resulted in a translation loss of US$ 28 million which lowered earnings to US$ 86.6 million for 4Q08, 6.9% below 3Q08. Nevertheless, year end results show a robust 27.7% net income growth reaching total net earnings of US$ 423.5 million in 2008. · BCP Bolivia, continues its consistent growth and reports a strong contribution of US$ 11.4 million for 4Q08, reaching a total US$ 42.9 contribution for 2008. · ASHC suffered the strongest effects of the financial turmoil since it accounts for the largest portion of impaired unrealized losses in the group and the Madoff related provisions. ASHC reported a loss contribution to Credicorp of US$ 50 million for the year 2008. · Though casualties at PPS’s property and casualty business dropped further this 4Q08, and technical results improved, the impairment of some of PPS’s investment portfolio (mainly in the Life business) was this time responsible of the losses contributed in 4Q08 which reached US$ 7.4 million. · Finally, despite the market volatility, Prima AFP reports stable growth of its business and excellent prospects. Its contribution reached US$ 1.4 million for 4Q08, but year end results were above expectations reaching US$ 11.2 million. · Credicorp’s operating performance for the year 2008 was well above our expectations, more so considering the economic turmoil. In fact, before the non-recurring items, operating results are in line with our aggressive projections. The financial crisis and market meltdown however, could not leave us unscathed, and today we can clearly see that the impact of such crisis had a cost which can still be considered moderate in the context of events. Credicorp still reports, after a very conservative action, a 2% earnings growth for the year, a ROAE of 22.3%, with a PDL ratio of 0.79%, and an efficiency ratio of 41.7%. |
I. Credicorp Ltd.
Overview
The massive market meltdown following the deepest financial crisis in decades experienced in the second half of 2008 could not leave us unscathed, and today we can clearly see the impact of such crisis. It is however important to notice that this crisis has not affected the operational results of Credicorp’s core business which remain strong, and that the impact of this crisis has been through: i) the impact of the revaluation of the US currency worldwide that generated a translation loss of US$ 32 million in our reduced but still existent Nuevos Soles exposure this quarter, ii) the significant drop in market valuation of proprietary portfolios mainly at ASHC and PPS, that led to the impairment of about US$ 41 million of unrealized losses, and iii) a provision to cover possible losses and contingencies related to the impact of the international alleged Madoff fraud on our Atlantic Blue Chip Fund and our direct exposure, which reached a total of US$ 43 million.
Of the three fronts of impact, number iii) is certainly a one-off event, completely unexpected resulting from a massive fraud. The second front, related to the valuation of portfolios we view as a conservative action given the nature (mostly AAA local and international corporate fixed income paper and equity) and status (mainly current and performing) of the securities, which offer some upside going forward as markets normalize and such papers are held to maturity. The first front related to the translation losses is probably somewhat more within our control and decisions realm, since the currency position is managed actively and such exposure can (and will) be eliminated by reducing our Nuevos Soles holdings in order to eliminate the earnings volatility it generates in our US Dollar reporting. The reduction of our Soles position started in the 3Q08 and has to be gradual given our size in the market and should be almost eliminated by the end of 1Q09.
Consequently, these extraordinary events resulting from the market turmoil cost us the income of almost a full quarter, leaving Credicorp to report an unprecedented low Net income attributable to the Holding Company for 4Q08 of only US$ 13.5 million. Before the non-recurring losses of the quarter (impairment of unrealized losses and the provision for potential contingencies related to the alleged fraud consequences which add up to US$84 million), net income reaches US$ 97.8 million for 4Q08, reflecting an improvement of operating results, as originally expected.
Given that the impact of the financial and economic crisis has not affected our core business, we perceive the cost generated by it as moderate in the context of events.
As indicated, operating results for the 4Q08 improved:
Despite the deep international financial/economic crisis, the Peruvian economy continued growing at high rates and loan growth reported by Credicorp’s banking business continued strong, revealing a 6.4% QoQ net loan portfolio growth, or 28.4% YoY. Nevertheless, a slow down in growth became evident in the last 2 months of the year, but affected only minimally the total loan growth at BCP, which measured in average balances, reached 28.3% YoY. In fact at BCP, retail loans grew this 4Q08 3.5%, middle market 1.3% and corporate loans 11.6%, being the latter the most active as they secured liquidity for year end needs.
As anticipated, Net Interest Income recovered growing 6.9% QoQ, as reserve requirements were eased and the diminishing liquidity concerns relaxed our internal liquidity policies. Furthermore, some recovery in spreads following increased risk perceptions also contributed as loans continued expanding. Whereas on the funding side, interest expense dropped as our deposit structure shifted from time deposits to more liquid demand and savings accounts.
The result was an improved NIM QoQ to 4.9% from 4.3%. Moreover, our “lending related NIM” at BCP improved from 6.9% to 7.5% revealing better spreads.
Non financial income does show the impact of the financial turmoil since fees generated by the asset management business and capital markets dropped resulting in total fee income for the quarter down 9%. Income from FX transactions however did pick-up 35% QoQ, following the volatility in the currency, and some earnings from the sale of securities of about US$ 20 million were also realized.
The insurance business continues reporting good growth, with net premiums up 23.1% QoQ and 66% compared to 4Q07. The technical results start showing the effectiveness of the new strategy and reduction of risk retention levels, mainly in the corporate property and casualty sector. This is reflected in a further - -8.5% drop in claims leading to an improved NEL (Net Earned Loss) ratio of 78.6%, down from 82% the previous quarter and 94% in 2Q08. However, this quarter, PPS’s investment portfolio contributed to the impairment of unrealized losses with US$ 11 million, and resulted in a loss contribution to Credicorp of US$ 7.4 million.
2
| Credicorp Ltd. | Quarter | Change % | Year ended | Change % | ||||||||||||||||||||||||||||
| US$ thousands | 4Q08 | 3Q08 | 4Q07 | 4Q08/4Q07 | 4Q08/3Q08 | Dec 08 | Dec 07 | Dec 08/ Dec 07 | ||||||||||||||||||||||||
| Net Interest income | 214,230 | 200,440 | 174,756 | 22.6 | % | 6.9 | % | 822,922 | 633,974 | 29.8 | % | |||||||||||||||||||||
| Total provisions, net of recoveries | (5,621 | ) | (16,713 | ) | (9,926 | ) | -43.4 | % | -66.4 | % | (47,760 | ) | (28,356 | ) | 68.4 | % | ||||||||||||||||
| Non financial income | 159,387 | 136,602 | 122,043 | 30.6 | % | 16.7 | % | 592,481 | 454,205 | 30.4 | % | |||||||||||||||||||||
| Insurance premiums and claims | 20,284 | 16,484 | 12,222 | 66.0 | % | 23.1 | % | 51,992 | 58,672 | -11.4 | % | |||||||||||||||||||||
| Operating expenses | (220,277 | ) | (213,841 | ) | (193,327 | ) | 13.9 | % | 3.0 | % | (810,556 | ) | (666,148 | ) | 21.7 | % | ||||||||||||||||
Income before non-recuring items, translation results, workers' profit sharing and income taxes | 168,002 | 122,971 | 105,768 | 58.8 | % | 36.6 | % | 609,080 | 452,347 | 34.6 | % | |||||||||||||||||||||
| Translation results | (31,813 | ) | 6,979 | 17,442 | -282.4 | % | -555.9 | % | (17,650 | ) | 34,627 | -151.0 | % | |||||||||||||||||||
| Impairment | (40,856 | ) | (5,733 | ) | (50,274 | ) | ||||||||||||||||||||||||||
| Provision Atlantic Blue Chip Fund and proprietary exposure | (43,489 | ) | (43,489 | ) | ||||||||||||||||||||||||||||
| Worker's profit sharing and income taxes | (33,771 | ) | (27,542 | ) | (24,606 | ) | 37.3 | % | 22.6 | % | (124,352 | ) | (114,581 | ) | 8.5 | % | ||||||||||||||||
| Net income | 18,073 | 96,675 | 98,605 | -81.7 | % | -81.3 | % | 373,315 | 372,393 | 0.2 | % | |||||||||||||||||||||
| Minority Interest | 4,597 | 4,075 | 4,590 | 0.2 | % | 12.8 | % | 15,575 | 21,658 | -28.1 | % | |||||||||||||||||||||
| Net income attributed to Credicorp | 13,475 | 92,601 | 94,016 | -85.7 | % | -85.4 | % | 357,740 | 350,736 | 2.0 | % | |||||||||||||||||||||
| Net income/share (US$) | 0.17 | 1.16 | 1.18 | -85.7 | % | -85.4 | % | 4.49 | 4.40 | 2.0 | % | |||||||||||||||||||||
| Total loans | 10,546,378 | 9,929,562 | 8,250,819 | 27.8 | % | 6.2 | % | 10,546,378 | 8,250,819 | 27.8 | % | |||||||||||||||||||||
| Deposits and Obligations | 13,779,414 | 13,043,454 | 11,350,714 | 21.4 | % | 5.6 | % | 13,779,414 | 11,350,714 | 21.4 | % | |||||||||||||||||||||
| Net Shareholders' Equity | 1,689,378 | 1,793,786 | 1,676,009 | 0.8 | % | -5.8 | % | 1,689,378 | 1,676,009 | 0.8 | % | |||||||||||||||||||||
| Net interest margin | 4.9 | % | 4.3 | % | 4.7 | % | 3.5 | % | 3.4 | % | ||||||||||||||||||||||
| Efficiency ratio | 46.4 | % | 42.6 | % | 46.2 | % | 41.7 | % | 43.0 | % | ||||||||||||||||||||||
| Return on average shareholders' equity | 3.1 | % | 20.7 | % | 22.9 | % | 22.3 | % | 22.9 | % | ||||||||||||||||||||||
| PDL/Total loans | 0.8 | % | 0.8 | % | 0.7 | % | 0.8 | % | 0.7 | % | ||||||||||||||||||||||
| Coverage ratio of PDLs | 270.7 | % | 297.5 | % | 343.2 | % | 270.7 | % | 343.2 | % | ||||||||||||||||||||||
| Employees | 19,882 | 19,317 | 16,160 | 19,896 | 16,160 | |||||||||||||||||||||||||||
On the cost side, total operating costs were up 3% QoQ. Nevertheless, salaries and administrative expenses which result from our network expansion and a backlog of administrative costs booked this quarter, were up 5.7% and 23.3% respectively leading to a further deterioration of the efficiency ratio to 46.4% this 4Q08 from 42.6% the previous quarter. The opening of new branches is almost completed according to plan with a total of 330 branches in operation by the end of December 2008. Even though the aggressive expansion of our network in 2008 was expected to generate a deterioration of our efficiency ratio for the year, the high income generated in the first half of the year helped the efficiency measures and resulted in an improvement from 43% in 2007 to 41.7% for 2008.
Loan portfolio quality remained strong at 0.79% PDL/Loans ratio and 271% coverage. Net provisioning shows again a drop due to provision reversals and despite a conservative provisioning policy since the beginning of the year. Despite this, we continue following a more conservative provisioning policy for our retail portfolio, increasing the internal minimum provisioning requirements in line with a more sophisticated risk assessment methodology which leads to higher net provisioning. Further, the Peruvian Superintendence has also imposed new “anti-cyclical provisioning rules” which aim at reaching higher provisions in good times and are in line with our already self imposed conservative provisioning rules.
3
2008 Year End Results
On a full year comparison however, and despite these very conservative actions, Credicorp still reported a total net income of US$ 357.7 million, showing a small but still positive 2% earnings growth for the year, a ROAE of 22.3%, with a PDL ratio of 0.79%, and an efficiency ratio of 41.7%.
The strength of its core business becomes evident with net loan growth of 28.4%. Furthermore, the loan book at BCP measured by average daily balances for the years grew at 35.5% between 2007 and 2008, with the retail segment leading the growth with a 42.9% expansion, followed by the Corporate Sector and Middle Market which expanded 40.6% and 30.2%, respectively.
Income generation remained strong despite the complicated environment (reserve requirement changes, volatility in interest rates and currency, liquidity issues, etc.) with NII growing 29.8% in the year. Further, recurring non-interest income for the year also grew 20.7% reflecting a strong 21.4% fee income growth, significantly improved results of our FX-transactional activity, up 76%, and the realization of some gains in securities sold.
| Credicorp Ltd. | Year ended | Change % | ||||||||||
| US$ thousands | Dec 08 | Dec 07 | Dec 08/ Dec 07 | |||||||||
| Net Interest income | 822,922 | 633,974 | 29.8 | % | ||||||||
| Total provisions, net of recoveries | (47,760 | ) | (28,356 | ) | 68.4 | % | ||||||
| Non financial income | 592,481 | 454,205 | 30.4 | % | ||||||||
| Insurance premiums and claims | 51,992 | 58,672 | -11.4 | % | ||||||||
| Operating expenses | (810,556 | ) | (666,148 | ) | 21.7 | % | ||||||
Income before non-recuring items, translation results, workers' profit sharing and income taxes | 609,080 | 452,347 | 34.6 | % | ||||||||
| Translation results | (17,650 | ) | 34,627 | -151.0 | % | |||||||
| Impairment | (50,274 | ) | ||||||||||
| Provision Atlantic Blue Chip Fund and proprietary exposure | (43,489 | ) | ||||||||||
| Worker's profit sharing and income taxes | (124,352 | ) | (114,581 | ) | 8.5 | % | ||||||
| Net income | 373,315 | 372,393 | 0.2 | % | ||||||||
| Minority Interest | 15,575 | 21,658 | -28.1 | % | ||||||||
| Net income attributed to Credicorp | 357,740 | 350,736 | 2.0 | % | ||||||||
| Net income/share (US$) | 4.49 | 4.40 | 2.0 | % | ||||||||
| Total loans | 10,546,378 | 8,250,819 | 27.8 | % | ||||||||
| Deposits and Obligations | 13,779,414 | 11,350,714 | 21.4 | % | ||||||||
| Net Shareholders' Equity | 1,689,378 | 1,676,009 | 0.8 | % | ||||||||
| Net interest margin | 3.5 | % | 3.4 | % | ||||||||
| Efficiency ratio | 41.7 | % | 43.0 | % | ||||||||
| Return on average shareholders' equity | 22.3 | % | 22.9 | % | ||||||||
| PDL/Total loans | 0.8 | % | 0.7 | % | ||||||||
| Coverage ratio of PDLs | 270.7 | % | 343.2 | % | ||||||||
| Employees | 19,896 | 16,160 | ||||||||||
The need of higher provisions following the expansion of our loan book and the turning of the economic cycle led however to 68.4% higher provisions in 2008. Further, operating costs do reflect the aggressive expansion of our network within the year showing an increase of 21.7% in 2008.
Despite these increased costs and the poor results from the insurance business for the year, the strong earnings generation of Credicorp’s core business led to operating earnings before the extraordinary non-recurring “crisis related charges” expanding a robust 34.6% to US$ 609.1 million in 2008 vs. US$ 452.3 million in 2007.
Thus, the non-recurring losses related to the impairment of unrealized losses in our portfolios and provisions referred to the potential consequences of the alleged Madoff fraud add up to US$ 93.8 million, which obviously depressed our year end earning from our expectations for the year, and led to our reported US$ 357.7 million net earnings at Credicorp.
4
Credicorp – the Sum of its Parts
Results of Credicorp this 4Q08 reflect the full effect of the international financial / bank crisis, which has turned into a full blown economic crisis with enormous consequences and is not leaving a single market untouched.
So far, such impact on Credicorp’s operating performance has been mild, since the core businesses of its subsidiaries remain strong. However, there have been significant market effects that generated unexpected extra-ordinary losses and that impacted differently each subsidiary:
BCP, which was more affected by the local turbulence and its own defensive policies in the third quarter, saw this 4Q08 a recovery of its operating performance as the Central Bank eased reserve requirements, the liquidity policies were relaxed and spreads in the lending activity slightly increased. While operating results for BCP recovered, the volatility in the local exchange rate generated by the strengthening of the dollar internationally produced again a translation loss, which was however contained by the gradual reduction since the 3Q of our Nuevos Soles position. Thus, BCP’s contribution to Credicorp suffered such translation loss and dropped 9% QoQ to US$ 82.9 million from US$ 90.7 million in 3Q08. On a yearly basis however, the strength of BCP’s business becomes evident as total contribution to Credicorp jumps from US$ 322.5 million in 2007 to US$ 410.9 million in 2008, an impressive 27% increase in one year.
Earnings Contribution
| (US$ Thousands) | 4Q08 | 3Q08 | 4Q07 | 4Q08/4Q07 | 4Q08/3Q08 | Dec 08 | Dec 07 | Dec 08/Dec 07 | ||||||||||||||||||||||||
| Banco de Crédito BCP(1) | 82,867 | 90,659 | 83,868 | -1 | % | -9 | % | 410,859 | 322,539 | 27 | % | |||||||||||||||||||||
| BCB | 11,414 | 10,956 | 10,065 | 13 | % | 4 | % | 42,877 | 26,996 | 59 | % | |||||||||||||||||||||
| Atlantic | (65,483 | ) | 4,205 | 4,988 | -1413 | % | -1657 | % | (50,410 | ) | 20,537 | -345 | % | |||||||||||||||||||
| PPS | (7,440 | ) | (3,589 | ) | 645 | -1253 | % | 107 | % | (15,901 | ) | 9,435 | -269 | % | ||||||||||||||||||
| Grupo Crédito (2) | 5,273 | 2,309 | 3,241 | 63 | % | 128 | % | 18,271 | 7,662 | 138 | % | |||||||||||||||||||||
| Prima | 1,437 | 1,705 | 2,307 | -38 | % | -16 | % | 11,203 | 3,032 | 269 | % | |||||||||||||||||||||
| Others | 3,836 | 604 | 934 | 311 | % | 535 | % | 7,068 | 4,630 | 53 | % | |||||||||||||||||||||
| Credicorp and Others (3) | (1,741 | ) | (983 | ) | 1,273 | -237 | % | 77 | % | (5,079 | ) | (9,437 | ) | -46 | % | |||||||||||||||||
| Credicorp Ltd. | (2,464 | ) | (1,607 | ) | 788 | -413 | % | 53 | % | (7,517 | ) | (10,882 | ) | -31 | % | |||||||||||||||||
| Otras | 723 | 624 | 485 | 0.49 | 16 | % | 2,438 | 1,445 | 69 | % | ||||||||||||||||||||||
| Net income attributable to Credicorp | 13,476 | 92,601 | 94,015 | -86 | % | -85 | % | 357,740 | 350,736 | 2 | % | |||||||||||||||||||||
(1) Includes Banco de Crédito de Bolivia.
(2) Includes Grupo Crédito, Servicorp and Prima AFP
(3) Includes taxes on BCP's and PPS's dividends, and other expenses at the holding company level.
BCP Bolivia, which is consolidated within BCP, reported a contribution of US$ 11.4 million for 4Q08 vs. US$ 11 million for 3Q08, maintaining its high level despite a significant stagnation of investment activity in the country, which should eventually generate a slowdown. It reached this way a total of US$ 42.9 million contribution for the year 2008.
ASHC was affected more directly by the international financial crisis, since its main business is asset management, both on- and off-balance-sheet. The direct impact of this massive and far reaching financial crisis on ASHC’s on-balance-sheet investment portfolio reflects its conservative investment approach, but none the less resulted in non-realized losses that affected its equity position. However, following good market practices and a conservative approach, it was decided to impair a portion of the unrealized losses leading to an impairment of US$ 26 million effective this 4Q08. Such impairment does however offer significant upside given the nature and status of the securities affected. These are mainly fixed income local and international corporate paper, which is current and performing. Thus, a recovery in the markets and/or holding to normal maturities should provide upside to recover the impaired amounts.
The table below shows the breakdown of Credicorp’s investment securities available for sale (excluding US$ 2.2 billion of BCR CDs held at BCP) by asset as at December 2008.
5
Credicorp and Subsidiaries: As of December 2008
Investment Securities Available for Sale by Assets
| In USD (000) | Book Value | Market Value | Net Gain /Loss | Impairment (Gross) | Minority Interest | Impairment (Net) | ||||||||||||||||||
| Equities | 70,111 | 137,809 | 67,698 | 16,738 | -3,078 | 13,660 | ||||||||||||||||||
| Hedge Funds | 8,968 | 7,161 | -1,807 | 1,858 | 0 | 1,858 | ||||||||||||||||||
| CMOs | 105,806 | 72,164 | -33,642 | 11,266 | 0 | 11,266 | ||||||||||||||||||
| Fixed Income | 2,425,517 | 2,428,263 | 2,747 | 19,384 | -993 | 18,391 | ||||||||||||||||||
| Non-performing securities | 7,178 | 1,713 | -5,465 | 5,080 | 0 | 5,080 | ||||||||||||||||||
| Others (*) | 112,986 | 111,990 | -996 | 6,093 | 0 | 6,093 | ||||||||||||||||||
| Total | 2,730,565 | 2,759,100 | 28,535 | 60,419 | -4,071 | 56,348 | ||||||||||||||||||
(*) Mainly investments with net realized gains in ASHC
The impairment of 2008, after minority interest, reached US$ 56.3 million, which included US$ 6 million of provisions for own investments affected by the alleged Madoff fraud. It is important to highlight that only 9% of the total impairment corresponds to assets in default and that this class represents only 0.3% of Credicorp’s investment securities (excluding BCR CDs). Our conservative investment approach in asset management is also evident when considering that 88% of the portfolio, at market value, is invested in fixed income of which 47.5% corresponds to sovereign bonds held at BCP, the remaining amount comes from ASHC and PPS positions, on which the amount impaired is only 0.8%. In the controversial CMOs category we hold mainly the most senior tranches, which have today a 70% market value. These asset class and equity investments account for the largest proportion of losses as percentage of the size of their portfolios. We would like to stress, that given the current status and nature of the portfolio impaired, an important portion is expected to have significant upside as markets recover and the impaired securities are held to maturity.
ASHC’s off-balance sheet asset management business, on the other hand, has been impacted by the alleged Madoff fraud which affected our Atlantic Blue Chip Fund and own position. Again, following good market practices, the Board of Directors of Credicorp considered convenient to provision the maximum expected potential losses and contingencies, which add up to US$ 43.4 million for the quarter. This number is composed of a provision for contingencies of US$ 36.4 million related to the Atlantic managed funds, the previously mentioned provision for losses included in the impairment table above of US$ 6 million of direct exposure, plus a US$ 1 million provision for valuation of guarantees on loans. It is important to mention that we expect this provision to cover all potential losses and contingencies related to this alleged fraud.
These extraordinary actions depressed earnings contribution and led to ASHC reporting a US$ -65 million for the 4Q08, which on a cumulative basis for the year represented a loss contribution of US$ -50 million in 2008.
The insurance business at PPS reported again good quarterly net premiums reaching the same level as last quarter, and drops in claims in the property and casualty sector, improving significantly its technical results which reached a positive US$ 3.9 million vs. a technical result of US$ -0.4 million in 3Q08. This is also reflected by its NEL ratio reaching 78.6% this 4Q08 from 82% in 3Q08 and even 94% in 2Q08. The change in business strategy which aims at a reduction of the risk retention levels in our books for the P&C corporate business is proving effective. However, the market meltdown which extended also into the Peruvian Stock Exchange, affected also PPS’s investments portfolio, as valuations of its securities in portfolio dropped significantly. Thus, PPS has followed Credicorp’s policies and proceeded as well with the impairment of unrealized losses on its portfolio. PPS’s portion of the total impaired amount at Credicorp reached US$ 7.3 million, and generated again losses this 4Q08 of US$ 7.4 million, exacerbating as well the losses accumulated for the year which reached this way a total of US$ 15.9 million.
Finally, Prima’s business results were in line with expectations showing a solid 30% YoY income growth. Prima’s income remains stable given that fees are charged on contributions and not over the value of the funds. Therefore, Prima reports good operating profits and net earnings of US$ 1.4 million for the quarter. For the year 2008, its total contribution adds up to US$ 11.2 million, an amount which is above plan. Prima’s business results should improve further as of Jan 2009 when the increased fee (from 1.5% to 1.75%) becomes effective. Prima has established a dominant position in the market, capturing important market shares (31.1% of AuM, 32.9% of collections and 45.7% of voluntary contributions to the funds).
6
II. Banco de Credito – BCP - Consolidated
Overview 4Q08
Against the backdrop of an increasingly severe international financial crisis, BCP reported still strong net 4Q08 earnings of US$86.6 million (US$ 0.06 per share). Nevertheless, these reflect a 7% QoQ drop, and a 0.5% increase compared to 4Q07, resulting in a deteriorated ROAE which fell to 25.5% below last quarter’s 28.9% and the 31.7% rate of 2007.
However, it is worthwhile to highlight that the banking and transactional businesses remained strong, as earnings before results from translation and profit sharing reached US$ 151.8 million, or 37.4% above 3Q08’s US$ 110.5 million and 58% higher than 4Q07’s US$ 96.1 million. It is evident that the impact of the international markets’ turmoil during 4Q08 reached BCP almost exclusively through the impact of a stronger dollar on the local currency, which resulted in moderate devaluation of the local currency and the subsequent impact on results from translation. Indeed, results from translation reverted the positive evolution of BCP’s business generating a US$ 28.3 million loss after the US dollar appreciated 5.5% against the Nuevo Sol in 4Q08, significantly above the 0.3% appreciation recorded in 3Q08. In turn, results in 4Q07 included earnings from translation totaling US$ 15.3 million as a result of the 2.9% devaluation of the US currency.
Core Earnings
| Core Revenues | Quarter | Change % | ||||||||||||||||||
| US$ 000 | 4Q08 | 3Q08 | 4Q07 | 4Q08/4Q07 | 4Q08/3Q08 | |||||||||||||||
| Net interest and dividend income | 189,323 | 178,288 | 155,564 | 21.7 | % | 6.2 | % | |||||||||||||
| Fee income, net | 84,826 | 87,042 | 76,708 | 10.6 | % | -2.5 | % | |||||||||||||
| Net gain on foreign exchange transactions | 33,175 | 24,497 | 21,497 | 54.3 | % | 35.4 | % | |||||||||||||
| Core Revenues | 307,324 | 289,827 | 253,769 | 21.1 | % | 6.0 | % | |||||||||||||
BCP’s core revenues grew 6% QoQ, and a significant 21.1% compared to 4T08. The strongest components were net interest income and net earnings from commissions on foreign exchange transactions.
Net Loans in 4Q08 expanded 6.4% QoQ and 27.6% compared to 4Q07, representing the most important source of growth for NII. The main drivers of this favorable performance were income from interests on loans, in particular from a healthy and dynamic corporate banking segment, where the loan portfolio went up 11.6% QoQ. This trend was supported by lower interest expenses that registered a quarterly drop of 4.8%, resulting from the re-composition of deposits towards more liquid deposits, where passive rates are lower and less international financing.
BCP profited from a volatile US dollar, which appreciated 5.5% against the Nuevo Sol in 4Q08 and created 35.4% higher revenues from fees on foreign exchange transactions, compared to a quarter earlier, and 54.3% above 4Q07’s.
Nonetheless, such outstanding results were somewhat offset by a 2.5% QoQ slip in revenues from commissions, principally due to reduced contributions from foreign branches, commercial loans, corporate finance and subsidiaries, in particular Credifondo and Credibolsa, that operate in the capital market and whose activities were impaired by stringent market conditions of 4Q08. However, this component also grew 10.6% compared to 4Q07’s.
7
| Quarter | Change | |||||||||||||||||||
| US$ 000 | 4Q08 | 3Q08 | 4Q07 | 4Q08/4Q07 | 4Q08/3Q08 | |||||||||||||||
| Net Financial income | 189,323 | 178,288 | 155,564 | 21.7 | % | 6.2 | % | |||||||||||||
| Total provisions, net of recoveries | (6,428 | ) | (17,616 | ) | (11,089 | ) | -42.0 | % | -63.5 | % | ||||||||||
| Non financial income | 141,433 | 113,308 | 103,458 | 36.7 | % | 24.8 | % | |||||||||||||
| Operating expenses | (172,499 | ) | (163,477 | ) | (151,866 | ) | 13.6 | % | 5.5 | % | ||||||||||
| Translation results | (28,346 | ) | 8,702 | 15,253 | -285.8 | % | -425.7 | % | ||||||||||||
| Worker's profit sharing and income taxes | (36,852 | ) | (26,123 | ) | (25,123 | ) | 46.7 | % | 41.1 | % | ||||||||||
| Net income | 86,631 | 93,082 | 86,197 | 0.5 | % | -6.9 | % | |||||||||||||
| Net income/share (US$) | 0.057 | 0.062 | 0.067 | -14.3 | % | -7.0 | % | |||||||||||||
| Total loans | 10,444,723 | 9,836,170 | 8,224,613 | 27.0 | % | 6.2 | % | |||||||||||||
| Deposits and obligations | 14,063,720 | 13,340,405 | 11,249,105 | 25.0 | % | 5.4 | % | |||||||||||||
| Shareholders equity | 1,400,404 | 1,319,779 | 1,132,563 | 23.6 | % | 6.1 | % | |||||||||||||
| Net financial margin | 4.6 | % | 4.3 | % | 4.8 | % | ||||||||||||||
| Efficiency ratio | 57.3 | % | 52.3 | % | 56.9 | % | ||||||||||||||
| Return on average equity | 25.5 | % | 28.9 | % | 31.7 | % | ||||||||||||||
| PDL/Total loans | 0.8 | % | 0.8 | % | 0.7 | % | ||||||||||||||
| Coverage ratio of PDLs | 271.9 | % | 299.2 | % | 351.8 | % | ||||||||||||||
| BIS ratio | 11.5 | % | 12.3 | % | 11.8 | % | ||||||||||||||
| Branches | 330 | 310 | 2.73 | |||||||||||||||||
| ATMs | 890 | 843 | 748 | |||||||||||||||||
| Employees | 15,971 | 15,379 | 12,667 | |||||||||||||||||
This quarter’s results translated into a 25 bps QoQ recovery in net interest income (NIM), which reached 4.6% although still below its 4.8% level of 4Q07. The recovery is the effect of greater yields through expanding loans (i.e. better-yielding assets), slightly wider spreads, as well as the gradual reduction of legal reserves and less liquidity concerns, both of which eased our treasury internal management policies.
Net provisioning fell 63.5% QoQ and 42% YoY, mainly due to enforcement of IAS 39 that require reverting excess provisioning. This also accounts for the QoQ fall in the coverage ratio which dropped from 299.2% to 271.9% in 4Q08. However, the past due rate remained stable, having recorded a negligible increase from 0.79% to 0.78% QoQ.
Finally, greater operating expenses weakened the efficiency ratio that reached 57.3% in 4Q08. ROAE fell to 25.5% for 4Q08, compared to a higher 3Q08’s 28.9% and 4Q07’s 31.67%.
Results for the year 2008
Despite a deepening international financial crisis, BCP performed remarkably in 2008, a fact better appreciated when analyzing annual results compared to 2007’s. Net income reached US$ 423.5 million compared to US$ 331.7 million in 2007, which represented a growth annual ratio of 27.7% . Net earnings per share reached US$ 0.28, above 2007’s US$ 0.26.
Efficiency improved with ratios falling from 51.3% to 50.3%, by year end 2008, despite strong spending in the second half linked to the network’s expansion. Annually-adjusted ROAE dropped slightly from 33% to 32.8%, principally due to net shareholder’s equity growth of 23.6% during the year, as a result of annual earnings.
These remarkable results in 2008 were accomplished through the combination of significant growth of total income, which was greater than total expenses. Outstanding revenues included a significant expansion in income from loans, commissions from the transactional business and fees from foreign exchange transactions.
Improved income from interest on loans resulted from a portfolio expansion of 27.6% YoY across all banking segments and products, as a response to a dynamic business environment driven by faster domestic demand. Growth measured by average balances during the year showed a stronger annual expansion of 35.5% of the global portfolio. Retail Banking led growth expanding at an annual 42.9% followed by 40.6% and 30.2% in Corporate and Middle Market Banking, respectively. This outcome was further reinforced by wider spreads obtained in 2008.
8
Year over year, earnings from commissions increased 19.7% principally through stronger results in credit cards, contingents (including guarantees, stand-by letters, foreign trade letters of credit), personal loans and contributions from foreign branches and subsidiaries (including Banco de Crédito de Bolivia and Credifondo).
Likewise, BCP profited from volatility in the capital and currency markets to realize net earnings from sales of securities and net commissions from foreign exchange transactions, which increased 83.7% and 82.5%, respectively.
Net financial income in 2008 was impacted by lower yields from liquid assets and investments, due to restrictive measures introduced by Peru’s Central Reserve Bank (such as higher reserve requirements) and our decision to maintain high liquidity levels in view of the severe international financial crisis. This scenario became less severe towards year-end.
Operating expenses raised 24.9%, in line with our business’s growth, principally to finance the network expansion enhancing distribution channels to improve client services and achieve our goal of deeper bank penetration. Furthermore, BCP’s high US dollar liquidity allowed reducing due to banks and correspondents with higher funding cost as a result of the financial crisis, and thereby reducing financial expenditures.
Results from currency translation overshadowed outstanding business performance by causing a US$ 12.2 million loss compared to US$ 29.6 million profits posted in 2007. Such results were the consequence of a 4.8% depreciation of the Nuevo Sol against the US dollar in 2008. Conversely, in 2007 the Nuevo Sol appreciated by 6.3%. Taxes and profit sharing rose following higher earnings for 2008 and fewer tax sheltered investments in Nuevos Soles with the Central Bank.
| Banco de Crédito and subsidiaries | Year | Change % | ||||||||||
| US$ millon | 2008 | 2007 | 2008/2007 | |||||||||
| Net interest income | 728,583 | 562,755 | 29.5 | % | ||||||||
| Banking services commissions | 336,844 | 281,310 | 19.7 | % | ||||||||
| Net gain on foreign exchange transaction | 109,032 | 59,739 | 82.5 | % | ||||||||
| Total operating earnings | 1,174,459 | 903,804 | 29.9 | % | ||||||||
| Net gain on sales of securities | 38,574 | 20,993 | 83.7 | % | ||||||||
| Other income | 17,202 | 8,487 | 102.7 | % | ||||||||
| Total income | 1,230,235 | 933,284 | 31.8 | % | ||||||||
| Provisions net of recoveries | (51,275 | ) | (33,074 | ) | 55.0 | % | ||||||
| Operating expenses | (620,007 | ) | (496,425 | ) | 24.9 | % | ||||||
| Translation Results | (12,244 | ) | 29,561 | -141.4 | % | |||||||
| Employee profit sharing | (15,201 | ) | (11,904 | ) | 27.7 | % | ||||||
| Income taxes | (107,979 | ) | (89,790 | ) | 20.3 | % | ||||||
| Net income | 423,529 | 331,652 | 27.7 | % | ||||||||
| Net income per share(US$) | 0.281 | 0.258 | 8.9 | % | ||||||||
| Total loans | 10,444,723 | 8,224,613 | 27.0 | % | ||||||||
| Deposits and obligations | 14,063,720 | 11,249,105 | 25.0 | % | ||||||||
| Net Shareholder´s equity | 1,400,404 | 1,132,563 | 23.6 | % | ||||||||
| Net interest margin | 4.5 | % | 4.9 | % | ||||||||
| Efficiency Ratio | 50.3 | % | 51.3 | % | ||||||||
| Return on average equity | 32.8 | % | 33.0 | % | ||||||||
9
II.1 Interest Earning Assets
Interest earning assets remained practically constant overall, having expanded only 0.6% QoQ and 20.2% YoY. However, these assets moved towards higher yielding segments, including loans which remained as our main growth drivers.
| Interest Earning Assets | Quarter | Change % | ||||||||||||||||||
| US$ 000 | 4Q08 | 3Q08 | 4Q07 | 4Q08/4Q07 | 4Q08/3Q08 | |||||||||||||||
| BCRP and Other Banks | 2,875,230 | 3,194,923 | 2,255,572 | 27.5 | % | -10.0 | % | |||||||||||||
| Interbank funds | 28,662 | 113,749 | 5,000 | 473.2 | % | -74.8 | % | |||||||||||||
| Trading Securities | 36,084 | 32,468 | 102,316 | -64.7 | % | 11.1 | % | |||||||||||||
| Available For Sale Securities | 3,406,248 | 3,512,873 | 3,377,263 | 0.9 | % | -3.0 | % | |||||||||||||
| Current Loans, net | 10,362,659 | 9,759,601 | 8,164,334 | 26.9 | % | 6.2 | % | |||||||||||||
| Total interest earning assets | 16,708,883 | 16,613,614 | 13,904,485 | 20.2 | % | 0.6 | % | |||||||||||||
IEA did not change significantly and grew only 0.6% QoQ. However, YoY they grew 20.2%. It’s worth noticing this result does not reflect the lively behavior of loans, that grew 6.2% QoQ and 26.9% YoY, thus remaining on the upward trend of recent years. Consequently, loan portfolio also increased its share of total interest earning assets to 62% compared to 59% in the preceding quarter.
Additionally, quarterly results are the consequence of the portfolio’s restructuring towards more available funds, principally in 3Q08 after BCR increased the legal reserve rates (which they again reduced towards year-end) and our policy to maintain more liquid instruments, a measure taken as a precaution against the spreading international crisis.
Thus, deposits at BCRP and other banks fell 10.0% QoQ, but rose 27.5% YoY, similarly to interbank funds, which dropped 74.8% QoQ after a substantial increase in the third quarter, as we moved away from more expensive interbank lending.
Investments available for sale slipped a slight 3.0% in the last quarter. The position in Central Bank CD’s reduced while sovereign and global bonds increased betting on a capital appreciation in those instruments. This phenomenon was a consequence of higher interest rates driven by a deepening crisis that motivated investors to flight to quality, subsequently subject to correction. Also noteworthy is the greater share of repurchase options and the increase in the US dollars position within our investment portfolio as a natural hedge towards the elimination of exchange rate volatility risk.
Moreover, trading securities recovered slightly during this quarter by 11.1%. However, in yearly-adjusted terms, they were hammered by the market’s intense volatility and dropped 64.7% YoY.

10
Loan portfolio
BCP’s loan portfolio remained on their upward trend, with growth of 6.2% QoQ and 27% annually, to a total US$10,444.7 million at the end of December 2008. A review of daily average balances for 4Q08, which better reflect actual loan levels, shows 5.7% growth QoQ and 28.3% YoY.
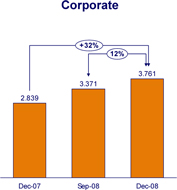
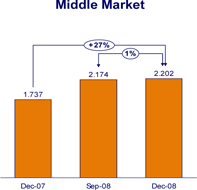
In line with annual trends, the Bank’s business segments also grew in the last quarter, Corporate Banking was the most active with an expansion of 11.6% QoQ followed by Retail Banking at 3.5% QoQ and Middle Market Banking with 1.3% QoQ.
Corporate Banking reached a daily average loan balance of US$3,761 million, its second largest quarterly growth rate in 2008. Annually, this business grew 32.5% YoY, driven by dynamic domestic demand, which still fuels corporate growth in Peru. It is also worthwhile underscoring BCP’s growth in a business where our bank is a strong market leader.
Middle Market Banking revealed a daily average portfolio of US$2,202.2 million, with a less flashy performance of 1.3% increase QoQ, below 3Q08’s rise that represented an extraordinary growth period. Annual growth reached 26.8%.
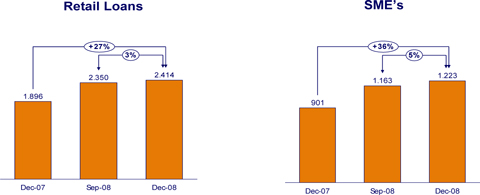
Retail Banking grew 3.5% QoQ and 30.0% YoY, to a total daily average balance in 4Q08 of US$3,636.7 million. Within this segment, the star performer was SME loans that revealed the largest growth, at 5.1% QoQ and 35.7% YoY, closely followed by consumer segment, with 5% QoQ and 53.7% YoY growth. Mortgages expanded 2.5% QoQ and 19.1% YoY, while credit cards remained static at -0.2% QoQ and registered an annual growth of 18.9%. Although credit cards daily average balances grew in domestic and foreign currency denominations, the strong depreciation of the Nuevo Sol against the US dollar in the last quarter prevents this result from being appreciated in the aggregate as positions are expressed in US dollars.

11
The below loan’s quarterly evolution by currency reveals the stronger growth of domestic currency loans:
| Domestic Currency Loans | Foreign Currency Loans | |||||||||||||||||||||||||||||||||||||||
| (Nuevos Soles million) | (US$ million) | |||||||||||||||||||||||||||||||||||||||
| 4Q07 | 3Q08 | 4Q08 | YoY | QoQ | 4Q07 | 3Q08 | 4Q08 | YoY | QoQ | |||||||||||||||||||||||||||||||
| Corporate | 2,506.5 | 2,575.3 | 2,998.8 | 19.6 | % | 16.4 | % | 2,002.7 | 2,487.4 | 2,796.4 | 39.6 | % | 12.4 | % | ||||||||||||||||||||||||||
| Middle Market | 890.7 | 1,177.7 | 1,257.4 | 41.2 | % | 6.8 | % | 1,439.5 | 1,769.7 | 1,797.7 | 24.9 | % | 1.6 | % | ||||||||||||||||||||||||||
| Retail | 3,555.7 | 5,020.1 | 5,612.2 | 57.8 | % | 11.8 | % | 1,610.6 | 1,790.9 | 1,831.1 | 13.7 | % | 2.2 | % | ||||||||||||||||||||||||||
| SME | 1,271.0 | 1,703.7 | 1,955.4 | 53.9 | % | 14.8 | % | 476.7 | 578.8 | 593.5 | 24.5 | % | 2.5 | % | ||||||||||||||||||||||||||
| Mortgages | 735.5 | 1,180.9 | 1,306.9 | 77.7 | % | 10.7 | % | 866.5 | 887.0 | 903.6 | 4.3 | % | 1.9 | % | ||||||||||||||||||||||||||
| Consumer | 722.3 | 1,171.6 | 1,331.4 | 84.3 | % | 13.6 | % | 212.6 | 262.1 | 268.7 | 26.4 | % | 2.5 | % | ||||||||||||||||||||||||||
| Credit Cards | 826.9 | 963.9 | 1,018.4 | 23.2 | % | 5.7 | % | 54.8 | 63.1 | 65.3 | 19.2 | % | 3.5 | % | ||||||||||||||||||||||||||
| Consolidated total loans* | 6,979.6 | 8,804.4 | 9,905.1 | 41.9 | % | 12.5 | % | 5,625.5 | 6,627.4 | 7,015.7 | 24.7 | % | 5.9 | % | ||||||||||||||||||||||||||
* Includes work out unit, other banking and BCP Bolivia
| · | Corporate Banking loans in US dollars, accounting for 74% of this segment’s total, grew 12.4% QoQ, while loans in domestic currency expanded 16.4% QoQ. Both increases are the largest quarterly changes in this segment during 2008. |
| · | The Middle Market Banking portfolio, where 82% of loans are foreign- currency denominated, increased 1.6% QoQ in US dollars while growth in Nuevos Soles loans was 6.8% QoQ. |
| · | Retail Banking is more diversified, with loans split roughly equally between local and foreign currency. Balances in domestic currency grew 11.8% QoQ while US dollar loans increased a moderate 2.2%. This evolution is in line with criteria for foreign exchange risk control of our clients applied during the credit analysis process. |
12
| 2006 | 2007 | 2008 | 2008/2007 | 2007/2006 | ||||||||||||||||
| Corporate | 1,805.2 | 2,400.7 | 3,375.5 | 40.6 | % | 33.0 | % | |||||||||||||
| Middle Market | 1,171.1 | 1,577.7 | 2,054.6 | 30.2 | % | 34.7 | % | |||||||||||||
| Retail | 1,710.6 | 2,371.6 | 3,390.1 | 42.9 | % | 38.6 | % | |||||||||||||
| - SME | 508.6 | 732.9 | 1,127.4 | 53.8 | % | 44.1 | % | |||||||||||||
| - Mortgages | 803.4 | 995.3 | 1,260.4 | 26.6 | % | 23.9 | % | |||||||||||||
| - Consumer | 199.7 | 360.2 | 617.9 | 71.5 | % | 80.4 | % | |||||||||||||
| - Credit Cards | 198.9 | 283.3 | 384.4 | 35.7 | % | 42.4 | % | |||||||||||||
| Total * | 5,317.6 | 6,939.7 | 9,405.4 | 35.5 | % | 30.5 | % | |||||||||||||
* Includes work out units, other banking and BCP Bolivia
Finally, portfolio growth in annual terms is worth underscoring. Global growth of loans measured in daily average balances through the year reached 35.5%, to a total US$9,405.4 million at year-end.
Among banking segments, Retail Banking was the star performer (up to 42.9%), followed by Corporate and Middle Market Banking which grew 40.6% and 30.2%, respectively.
Market Share
BCP’s loan market share remains strong despite strong competition and the Bank’s already large share. To December 2008, BCP’s share reached 31.6% strengthening its condition as the market leader. Moreover, this share is slightly higher than its 31.5% market share reported last September.
Corporate and Middle Market Banking’s market shares also reflect BCP’s strong leadership, at 47% and 34%, respectively, based on November figures.
BCP’s shares also grew in the Retail Banking segment according to our strategy. Market share in consumer or personal loans grew 30 bps to 17.3%. BCP’s share in mortgages reached 39.7%, 70 bps higher than that reported for 3Q08, while it increased its share in the highly competitive credit card segment, hitting 18.8% share. SME loans, however, dropped slightly to 18.8%.
Dollarization
Asset dollarization expanded from 57.0% in 3Q08 to 65.9% in 4Q08. This change in asset structure is largely a consequence of the increase in marketable securities in foreign currency taken as a precaution against exchange risk exposure.
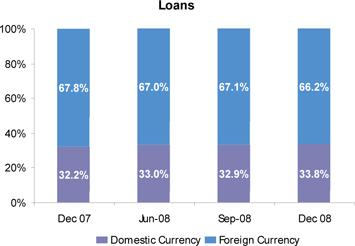
Loans in US dollars fell slightly from 67.1% to 66.2% in 4Q08. They also dropped YoY when compared to 67.8% of 4Q07:
13
II.2 Deposits and Mutual Funds
BCP deposits grew 5.4% QoQ and 25.0% YoY, thus remaining as the Bank’s main funding source for growing lending. Mutual funds totalled 45.2% market share, down from the previous quarter’s 47.5%.
| Deposits and Obligations | Quarter ended | Change % | ||||||||||||||||||
| US$ (000) | 4Q08 | 3Q08 | 4Q07 | 4Q08/4Q07 | 4Q08/3Q08 | |||||||||||||||
| Non-interest bearing deposits | 4,260,406 | 2,874,202 | 2,729,860 | 56.1 | % | 48.2 | % | |||||||||||||
| Demand deposits | 1,630,976 | 962,343 | 926,817 | 76.0 | % | 69.5 | % | |||||||||||||
| Saving deposits | 2,968,842 | 2,748,290 | 2,381,012 | 24.7 | % | 8.0 | % | |||||||||||||
| Time deposits | 4,090,043 | 5,754,903 | 4,268,233 | -4.2 | % | -28.9 | % | |||||||||||||
| Severance indemnity deposits (CTS) | 1,039,887 | 928,891 | 896,283 | 16.0 | % | 11.9 | % | |||||||||||||
| Interest payable | 73,566 | 71,776 | 46,899 | 56.9 | % | 2.5 | % | |||||||||||||
| Total customer deposits | 14,063,720 | 13,340,405 | 11,249,104 | 25.0 | % | 5.4 | % | |||||||||||||
| Mutual funds in Perú | 1,273,566,403 | 2,010,590,470 | 1,955,547,404 | -34.87 | % | -36.7 | % | |||||||||||||
| Mutual funds in Bolivia | 109,834 | 100,141 | 65,739 | 67.1 | % | 9.7 | % | |||||||||||||
| Total customer funds | 14,063,720 | 13,340,405 | 11,249,104 | 25.0 | % | 5.4 | % | |||||||||||||
Other BCP funding sources, including debt with banks and correspondents, dropped a significant 33.7% since the previous quarter. This evolution resulted from repayment of expensive short term debt, using the Bank’s foreign currency liquidity. However, it is worthwhile underscoring 75% of BCP’s funding comes from deposits, while only 7% of funding is financed through short term international bank lines.
In 4Q08, deposits were rearranged as a result of greater need of liquidity from customers and migration from mutual funds to bank deposits. Demand deposits increased a significant 69.5%. This shift benefited BCP as these deposits are a low cost funding source, and 71% of these deposits yield low or no interest at all. Likewise, severance payments accounts (CTS is the Spanish acronym) and saving deposits rose 11.9% and 8.0% QoQ, respectively. Time deposits fell 28.9%, responding to clients’ perception of low availability.
It’s worth noticing that such time deposits include deposits from the remittances securitization program totaling US$1,180 million to December 2008 undertaken by CCR Inc., a Credicorp subsidiary.

14
Market Share
A deepening international financial crisis in the last quarter featured high market volatility and stable capital markets, and funds’ flight to bank deposits. BCP’s deposit market share to December 2008 reached 38.5%, slightly below December 2007’s 38.8%.
The following chart shows the Bank’s market share by type of deposit by currency:
| Market share (%) | ||||||||
| Deposit | Domestic currency | Foreign currency | ||||||
| Demand Deposits | 44.30 | % | 47.10 | % | ||||
| Saving Deposits | 36.50 | % | 42.50 | % | ||||
| Time Deposits | 27.60 | % | 40.30 | % | ||||
| Severance Indemnity | 40.20 | % | 56.60 | % | ||||
BCP’s leadership is evident in CTS with a 51.9% market share, while the nearest competitor registers 19.8%. BCP has preserved its market leader position in all other types of deposits.
Credifondo, a BCP subsidiary, remained as leader in the mutual fund segment. However, the value of its fund under management totaled US$1,274 million to December 2008, reveling a significant decrease of 36.7% QoQ, a consequence of a stringent international financial crisis. It is important to highlight that at the end of 2008, Credifondo recorded a large 45.2% market share of total wealth under management and a 38.8% share by number of participants.
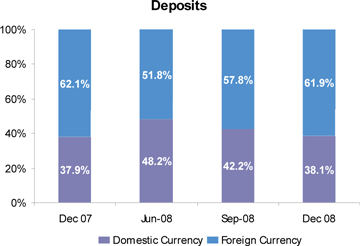
Finally, to December 2008, 38.1% of deposits were denominated in domestic currency while 61.9% were US dollar-denominated, continuing the trend toward de-dollarization of deposits that started a quarter earlier. This is at least partly explained by the public’s likely preference to hold deposits in a increasingly stronger US dollar context, and as hedging against a Nuevo Sol devaluation, which reached 5.5% during the last quarter, above the 0.3% devaluation registered during 3Q08.
II.3 Net Interest Income
NII increased 25 bps mostly due to expanding loans that, hand in hand with larger spreads, led to bigger income from loan interests. It also benefited from re-composition of deposits toward non-interest bearing deposits and lower interest demand and savings deposits.
15
| Net interest income | Quarter | Change % | ||||||||||||||||||
| US$ 000 | 4Q08 | 3Q08 | 4Q07 | 4Q08/4Q07 | 4Q08/3Q08 | |||||||||||||||
| Interest income | 327,007 | 322,921 | 272,204 | 20.1 | % | 1.3 | % | |||||||||||||
| Interest on loans | 269,851 | 246,814 | 201,414 | 34.0 | % | 9.3 | % | |||||||||||||
| Interest and dividends on investments | - | 2 | 139 | 100 | ||||||||||||||||
| Interest on deposits with banks | 17,551 | 17,129 | 17,901 | -2.0 | % | 2.5 | % | |||||||||||||
| Interest on trading securities | 34,991 | 55,584 | 47,069 | -25.7 | % | -37.0 | % | |||||||||||||
| Other interest income | 4,614 | 3,392 | 5,681 | -18.8 | % | 36.0 | % | |||||||||||||
| Interest expense | 137,684 | 144,633 | 116,640 | 18.0 | % | -4.8 | % | |||||||||||||
| Interest on deposits | 97,842 | 103,790 | 83,039 | 17.8 | % | -5.7 | % | |||||||||||||
| Interest on borrowed funds | 16,816 | 17,400 | 14,670 | 14.6 | % | -3.4 | % | |||||||||||||
| Interest on bonds and subordinated notes | 14,386 | 15,019 | 11,782 | 22.1 | % | -4.2 | % | |||||||||||||
| Other interest expense | 8,640 | 8,424 | 7,149 | 20.9 | % | 2.6 | % | |||||||||||||
| Net interest income | 189,323 | 178,288 | 155,564 | 21.7 | % | 6.2 | % | |||||||||||||
| Average interest earning assets | 16,661,248 | 16,568,839 | 12,966,755 | 28.5 | % | 0.6 | % | |||||||||||||
| Net interest margin* | 4.55 | % | 4.30 | % | 4.80 | % | ||||||||||||||
*Annualized
The banking business remained on the 2008 upward trend as reflected by the 9.3% QoQ growth of loan interest earnings, the largest quarterly growth rate of the year, and a slight increase in spreads. Growth reached 34% when compared to the same quarter in 2007. Smaller interests from securities resulting from the Bank’s sharp reduction in BCR CD’s that led to lower interest income attenuated the positive evolution.
Favorable results in NII are also accounted for lower interest expenses that dropped 4.8% QoQ linked mainly to deposit re-composition that significantly reduced time deposits, which pay the highest interest rate, and increased non-interest bearing deposits and saving accounts, on the other hand. Altogether, interest paid on deposits dropped 5.7%. Moreover, the results mentioned before were reinforced by a smaller debt to banks and correspondents that led to lower interest expenses and a reduction in bonds and subordinated debt, resulting from smaller issuances in 2008’s last quarter.
A combination of slight growth of interest income and smaller interest expenses resulted in a major 6.2% QoQ of net interest income. As a consequence of such changes, NIIM grew from 4.3% in 3Q08 to 4.6% in 4Q08. Although interest income revealed 20.1% growth compared to 4Q07, NIIM fell 25 bps after a significant increase in deposits, which in turn led to a 17.8% increase in interest expenses on deposits.
Nevertheless, it’s worthwhile highlighting an evaluation of NII in the loan business that reveals a strong positive evolution in 4Q08 to 7.5% above 6.9% in 3Q08 and 6.8% in 4Q08, thus reflecting also better loan spreads.

16
II.4 Loan provisions
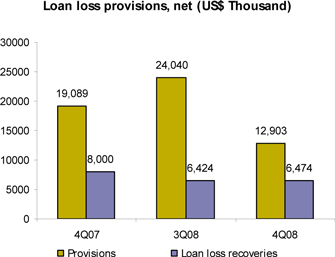
Net Provisioning fell 63.5% QoQ due to provision reversion of US$13 from enforcement of IAS 39 methodology. The portfolio quality index remained at a healthy 0.79%, slightly above 3Q08’s 0.78%.
| Provisión for loan losses | Quarter ended | Change % | ||||||||||||||||||
| US$ 000 | 4Q08 | 3Q08 | 4Q07 | 4Q08/4Q07 | 4Q08/3Q08 | |||||||||||||||
| Provisions | (12,903 | ) | (24,040 | ) | (19,089 | ) | -32.4 | % | -46.3 | % | ||||||||||
| Loan loss recoveries | 6,474 | 6,424 | 8,000 | -19.1 | % | 0.8 | % | |||||||||||||
| Total provisions, net of recoveries | (6,428 | ) | (17,616 | ) | (11,089 | ) | -42.0 | % | -63.5 | % | ||||||||||
| Total loans | 10,444,723 | 9,836,170 | 8,224,613 | 27.0 | % | 6.2 | % | |||||||||||||
| Reserve for loan losses (RLL) | 223,161 | 229,071 | 212,060 | 5.2 | % | -2.6 | % | |||||||||||||
| Bcp's Charge-Off amount | 13,160 | 11,929 | 12,034 | 9.36 | % | 10.32 | % | |||||||||||||
| Past due loans (PDL) | 82,064 | 76,569 | 60,279 | 36.1 | % | 7.2 | % | |||||||||||||
| PDL/Total loans | 0.79 | % | 0.78 | % | 0.73 | % | ||||||||||||||
| Coverage | 271.93 | % | 299.17 | % | 351.80 | % | ||||||||||||||
Gross loan provisioning reached US$ 25.9 million in 4Q08 but it was reduced by a US$ 13 million reversion according to IAS 39. IAS requires provisions for the difference between the present value of future cash flows and the loan portfolio value. Hence, if provisioning is higher than required a deduction is made, as happened in 4Q08. In addition, revenues from recovery of written off loans remained at last quarter levels.
Past due loans reached US$ 82.1 million at 4Q08, 7.2% higher than September 2008’s US$ 76.6 million, leading to a small increase in the past due indicator, which rose from 0.78% to 0.79%. Such decline is not an indication of degrading portfolio quality but a natural consequence of growing business. Reserves for past due loans fell slightly compared to 3Q08’s (- 2.6%), although they increased 5.2% YoY.
II.5 Non Financial Income
Non-financial revenues grew 24.8% QoQ attributable to earnings from commissions on foreign currency transactions and sales of securities. BCP profited from the US dollar’s and the capital market’s volatility to pick earnings from sales of fixed income and equity securities.
17
| Non financial income | Quarter | Change % | ||||||||||||||||||
| US$ 000 | 4Q08 | 3Q08 | 4Q07 | 4Q08/4Q07 | 4Q08/3Q08 | |||||||||||||||
| Fee income | 84,826 | 87,042 | 76,708 | 10.6 | % | -2.5 | % | |||||||||||||
| Net gain on foreign exchange transactions | 33,175 | 24,497 | 21,497 | 54.3 | % | 35.4 | % | |||||||||||||
| Net gain on sales of securities | 15,325 | (3,128 | ) | 2,661 | 475.9 | % | -589.9 | % | ||||||||||||
| Other income | 8,107 | 4,897 | 2,592 | 212.8 | % | 65.6 | % | |||||||||||||
| Total non financial income | 141,433 | 113,308 | 103,458 | 36.7 | % | 24.8 | % | |||||||||||||
Revenues from commissions fell 2.5% QoQ, or US$ 2.2 million, mainly due to shrinking commissions from commercial loans (-63.8%), Corporate Financing (-68.2%) and Branches and Subsidiaries including Credifondo and Credibolsa, where commissions fell, after tumbling capital market prices (- 12.3%). The slide was attenuated by strong commission performance in mortgage loans, credit cards and consumer loans.
The monthly average number of commission-earning transactions reached 40.8 million in 4Q08, 10.3% higher QoQ and 22.4% stronger compared to 4Q07. Such positive evolution was prompted principally by more ViaBCP web-banking, more frequent use of the Bank’s ATMs, and operations through its Agentes BCP.
| Quarter | Change % | |||||||||||||||||||
| N° de Transactions per channel | Average 4Q08 | Average 3Q08 | Average 4Q07 | 4Q08/ 4Q07 | 4Q08/ 3Q08 | |||||||||||||||
| Teller | 10,478,167 | 10,040,941 | 9,383,312 | 11.7 | % | 4.4 | % | |||||||||||||
| ATMs Via BCP | 7,154,602 | 6,241,016 | 5,540,733 | 29.1 | % | 14.6 | % | |||||||||||||
| Balance Inquiries | 2,671,103 | 2,386,611 | 2,468,491 | 8.2 | % | 11.9 | % | |||||||||||||
| Telephone Banking | 1,321,179 | 1,174,645 | 1,178,386 | 12.1 | % | 12.5 | % | |||||||||||||
| Internet Banking Via BCP | 9,507,673 | 8,598,560 | 7,284,193 | 30.5 | % | 10.6 | % | |||||||||||||
| Agente BCP | 2,400,437 | 1,942,643 | 1,092,778 | 119.7 | % | 23.6 | % | |||||||||||||
| Telecrédito | 3,816,293 | 3,345,913 | 3,374,932 | 13.1 | % | 14.1 | % | |||||||||||||
| Direct Debit | 422,867 | 308,098 | 346,710 | 22.0 | % | 37.3 | % | |||||||||||||
| Points of Sale P.O.S. | 2,785,821 | 2,746,508 | 2,489,588 | 11.9 | % | 1.4 | % | |||||||||||||
| Other ATMs network | 227,863 | 203,957 | 168,839 | 35.0 | % | 11.7 | % | |||||||||||||
| Total transactions | 40,786,007 | 36,988,893 | 33,315,920 | 22.4 | % | 10.3 | % | |||||||||||||
Shown below is the evolution of the Bank’s channel networks, where become evident the strong growth of Agentes BCP. This low cost channel has expanded customer access to the banking system.
| Balance as of | Change % | |||||||||||||||||||
| Dec 08 | Sep 08 | Dec 07 | Dec 08/Dec 07 | Dec 08/Sep 08 | ||||||||||||||||
| Branches | 330 | 277 | 273 | 20.9 | % | 19.1 | % | |||||||||||||
| ATMs | 890 | 778 | 748 | 19.0 | % | 14.4 | % | |||||||||||||
| Agentes BCP | 1,851 | 1,358 | 1,221 | 51.6 | % | 36.3 | % | |||||||||||||
| Total | 3,071 | 2,413 | 2,242 | 37.0 | % | 27.3 | % | |||||||||||||
Earnings from fees on foreign exchange transactions also increased. Quarterly Nuevo Sol devaluation against the dollar reached 5.5%, significantly higher than last quarter’s 0.3%. Income these transactions reached US$ 33.2 million, higher than earnings of US$ 24.5 million and US$ 21.5 million recorded in 3Q08 and 4Q07, respectively.
Sales of Securities led to a net US$3.1 million loss last quarter as a consequence of the international crisis but closed 4Q08 with a net US$15.3 million profit resulting mainly from sales of sovereign bonds, thereby reverting 3Q08’s results and leading to earnings above 4Q07’s US$ 12.7 million.
18
II.6 Operating Costs and Efficiency
Despite the 6% increase in revenues from operations, the efficiency index deteriorated slightly, as a result of 16.1% larger operating expenses, and rose above their 52.29% and 56.89% levels of 3Q08 and 4Q07, respectively, to 57.2% in the last quarter of 2008.
| Operating expenses | Quarter | Change % | ||||||||||||||||||
| US$ 000 | 4Q08 | 3Q08 | 4Q07 | 4Q08/4Q07 | 4Q08/3Q08 | |||||||||||||||
| Salaries and employees benefits | 88,805 | 83,496 | 75,147 | 18.2 | % | 6.4 | % | |||||||||||||
| Administrative, general and tax expenses | 74,407 | 56,266 | 59,234 | 25.6 | % | 32.2 | % | |||||||||||||
| Depreciation and amortizacion | 12,740 | 11,800 | 10,000 | 27.4 | % | 8.0 | % | |||||||||||||
| Other expenses | (3,453 | ) | 11,915 | 7,485 | -146.1 | % | -129.0 | % | ||||||||||||
| Total operating expenses | 172,499 | 163,477 | 151,866 | 13.6 | % | 5.5 | % | |||||||||||||
| Efficiency Ratio | 57.25 | % | 52.29 | % | 56.89 | % | ||||||||||||||
In 4Q08, operating expenses increased significantly due to larger expenditures in salaries and administration, which together account for 94.6% of the total. The 6.4% QoQ increase in remunerations resulted from additional profit sharing-related expenditures; new hiring that increased the number of workers from 15,379 to 15,971, and training expenditure.
It’s worthwhile underscoring that fix and variable salaries did not have a significant impact on this increase. Salaries are denominated in local currency and after 5.5% quarterly devaluation they reached a level similar to 3Q08’s when translated into a US dollar-denominated wage.
Administrative and general expenses rose a significant 32.2% QoQ and 25.6% compared to 4Q07’s triggered by increases on marketing, computing and consultancies. The largest marketing related expenses were connected to image, brand and product campaigns, such as LANPASS, BCP trademark and ABC value campaigns.
System expenses grew due to renewal and additional Microsoft licenses, software maintenance, equipment repair and maintenance expenditures, general support and costs relating to support for system development.
Administrative expenses and the corresponding quarterly changes are detailed below:
| Administrative Expenses | Quarter | Change % | ||||||||||||||||||||||||||||||
| US$ (000) | 4Q08 | % | 3Q08 | % | 4Q07 | % | 4Q08/4Q07 | 4Q08/ 3Q08 | ||||||||||||||||||||||||
| Marketing | 14,765 | 20 | % | 6,260 | 11 | % | 12,180 | 21 | % | 21.2 | % | 135.9 | % | |||||||||||||||||||
| Systems | 9,749 | 13 | % | 5,054 | 9 | % | 9,121 | 15 | % | 6.9 | % | 92.9 | % | |||||||||||||||||||
| Transportation | 5,476 | 7 | % | 5,421 | 10 | % | 4,864 | 8 | % | 12.6 | % | 1.0 | % | |||||||||||||||||||
| Consulting | 5,172 | 7 | % | 3,169 | 6 | % | 3,174 | 5 | % | 62.9 | % | 63.2 | % | |||||||||||||||||||
| Maintenance | 3,415 | 5 | % | 2,403 | 4 | % | 2,319 | 4 | % | 47.3 | % | 42.1 | % | |||||||||||||||||||
| Communications | 3,139 | 4 | % | 2,843 | 5 | % | 2,217 | 4 | % | 41.6 | % | 10.4 | % | |||||||||||||||||||
| Other expenses | 20,794 | 28 | % | 17,537 | 31 | % | 15,632 | 26 | % | 33.0 | % | 18.6 | % | |||||||||||||||||||
| Property taxes and others | 5,129 | 7 | % | 5,290 | 9 | % | 4,897 | 8 | % | 4.7 | % | -3.1 | % | |||||||||||||||||||
| Other subsidiaries and eliminations, net | 6,768 | 9 | % | 8,287 | 15 | % | 4,829 | 8 | % | 40.1 | % | -18.3 | % | |||||||||||||||||||
| Total Administrative Expenses | 74,407 | 100 | % | 56,266 | 100 | % | 59,234 | 100 | % | 25.6 | % | 32.2 | % | |||||||||||||||||||
While business related expenditures increased fueled by business growth, other expenditures fell 129% QoQ. This drop is explained by writing down of a contingency provision made in 2007 in view of the political crisis in Bolivia at that time that was unnecessary in view of the current situation.
19
II.7 Shareholders’ Equity and Regulatory Capital
Total shareholders’ equity totaled US$1.4 billion as at December 2008 or 6.1% QoQ mainly due to net profits earned in 4Q08 (US$86.6 million). ROAE in 4Q08 reached 25.48%, lower than 3Q08’s 28.93% and 4Q07’s 31.67%. These changes resulted from the translation effect in quarterly results created by volatility. Nonetheless, quarterly figures throughout 2008 reflect the high return rates of BCP’s business.
| Shareholders' equity | Quarter | Change % | ||||||||||||||||||
| US$ 000 | 4Q08 | 3Q08 | 4Q07 | 4Q08/4Q07 | 4Q08/3Q08 | |||||||||||||||
| Capital stock | 439,474 | 439,474 | 364,706 | 20.5 | % | 0.0 | % | |||||||||||||
| Reserves | 388,062 | 388,062 | 282,189 | 37.5 | % | 0.0 | % | |||||||||||||
| Unrealized Gains and Losses | 34,746 | 43,354 | 57,771 | -39.9 | % | -19.9 | % | |||||||||||||
| Retained Earnings | 114,593 | 111,994 | 96,245 | 19.1 | % | 2.3 | % | |||||||||||||
| Income for the year | 423,529 | 336,895 | 331,652 | 27.7 | % | 25.7 | % | |||||||||||||
| Total shareholders' equity | 1,400,404 | 1,319,779 | 1,132,563 | 23.6 | % | 6.1 | % | |||||||||||||
| Return on average equity (ROAE) | 25.48 | % | 28.93 | % | 31.67 | % | ||||||||||||||
At the end of December 2008, the capital adequacy ratio for BCP was 11.52% (8.68 times), lower than 3Q08’s 12.25% (8.17 times) but well above the system’s mandatory minimum (9.1%). Lower ratio results principally from an increase in risk weighted assets, a natural result of loan growth and, in addition, a stronger foreign currency (US$) position to prevent the impact of volatility on translation when International Financial Reporting Standards results are reported. An increase in capital provisioning was also required as an expanded foreign currency (US$) position must be reflected as an increased market risk in Peruvian accounting. At the end of 2008, risk weighted assets were comprised of US$527.2 million for market risk, for which hedging required US$47.9 million cash equity.
Furthermore, profits are withheld for capitalization in a effort to further strength BCP’s cash equity in terms of TIER I. Profits withheld totaled US$229.4 million as at December 2008, well above last September’s (+70.6%).
At the end of 2008, Tier I had increased 34.3% YoY to US$1,020 million. This increase is mainly explained by the increase in earnings earmarked for capitalization. TIER II reached US$283 million or a slight 3.8% YoY due to smaller subordinated debt. These changes increased the cash equity to US$1,303 million of which US$278.7 million are subordinated debt.
| Regulatory Capital and Capital Adequancy Ratios | Balance as of | Change % | ||||||||||||||||||
| US$ (000) | Dec-08 | Sep-08 | Dec-08 | Dec 08/ Dec 07 | Dec 08/ Sep08 | |||||||||||||||
| Capital Stock, net | 480,346 | 506,817 | 429,415 | 11.9 | % | -5.2 | % | |||||||||||||
| Legal and Other capital reserves | 423,052 | 446,365 | 346,418 | 22.1 | % | -5.2 | % | |||||||||||||
| Net income capitalized | 229,299 | 134,409 | 74,019 | 209.8 | % | 70.6 | % | |||||||||||||
| Investment in subsidiaries and others | 209,393 | 194,526 | 170,317 | 22.9 | % | 7.6 | % | |||||||||||||
| Goodwill | 8,027 | 8,320 | 5,445 | 47.4 | % | -3.5 | % | |||||||||||||
| Generic Contingency loss reserves | 109,207 | 103,338 | 85,005 | 28.5 | % | 5.7 | % | |||||||||||||
| Subordinated Debt | 278,688 | 289,099 | 294,648 | -5.4 | % | -3.6 | % | |||||||||||||
| Total Regulatory Capital | 1,303,173 | 1,277,183 | 1,053,743 | 23.7 | % | 2.0 | % | |||||||||||||
Tier 1 (1) | 1,019,974 | 982,008 | 759,249 | 34.3 | % | 3.9 | % | |||||||||||||
Tier 2 (2) | 283,199 | 295,174 | 294,494 | -3.8 | % | -4.1 | % | |||||||||||||
| Risk-weighted assets | 10,787,723 | 10,277,314 | 8,603,291 | 25.4 | % | 5.0 | % | |||||||||||||
| Market risk | 47,928 | 13,744 | 26,714 | 79.4 | % | 248.7 | % | |||||||||||||
| Capital ratios | ||||||||||||||||||||
| BIS ratio | 11.52 | % | 12.25 | % | 11.84 | % | ||||||||||||||
| Risk-weighted assets / Regulatory Capital | 8.68 | 8.17 | 8.44 | |||||||||||||||||
(1) Tier 1 = Capital + Reserves + Net Income capitalized - Goodwill - (0.5 x Inverstment in Subsidiaries)
(2) Tier 2 = Subordinated Debt + Generic Contigency loss reserves - (0.5 x Investment in subsidiaries)
20
III. Banco de Crédito de Bolivia
Bolivian Financial System
Total loans in Bolivia bank system grew from US$ 3,035 million in December 2007 to US$ 3,566 million in December 2008 or 17.5% up. Loan quality throughout the bank system has increased slightly compared to 2007. At the end of 2007, PDL/Loans ratio throughout the system reached 5.6%, fell to 5.2% in June 2008 and finally dropped to 4.3% in December. In addition, the banking system coverage ratio was 144.3% in December 2008, up from 112.2% a year earlier
Deposits in the Bolivian banking system grew from US$4,236 million to US$ 5,676 million QoQ, a 34.0% increase that reflected inflation adjustments and growth in local-currency denominated deposits. This growth was distributed among demand deposits (30.0% up), 49.6% larger savings and a 23.3% increase in time deposits compared to December 2007.
BCP Bolivia - Results
In 4Q08, BCP Bolivia net income reached US$13.0 million, which represents an increase of 18.2% QoQ and 34 % YoY, triggered mainly by larger net interest income (3.2% QoQ and 32.3% YoY) and expanding non-financial revenues (20.1% QoQ and 57.7% YoY).
A conservative credit risk management strategy resulted in a PDL/Loans ratio of 2.0% (2.0% in 3Q08 and 1.7% in 4Q07) and a higher coverage ratio of 230.6% (185.0% in 3Q08 and 240.1% in 4Q07). These indicators show BCP Bolivia is a top performer in Bolivia’s banking system, where the corresponding ratios reached 4.3 and 144.3%, respectively. BCP Bolivia’s ROAE was 46.1%, lower than September 2008’s 47.5%. However, this still represents a healthy ratio given existing international market conditions.
Assets and liabilities
Total loans as at December 2008 reached US$ 477.5 million or 4.5%, lower than the US$ 499.8 million for September 2008 and 3.0% higher YoY. The decrease QoQ is a consequence of risk expectations for the next year’s economy performance, i.e. slower GDP despite slower CPI growth compared to the beginning of 2008. In addition, the changing international economic and financial scenario has hurt expectations about the US dollar’s strength and future exchange policies, all of which will also be reflected in trends evidenced by local currency denominated loans.
This quarter, Retail Banking grew 2.3% QoQ and 24.3% YoY, with important effects on the bank ‘s results as this segment accounts for 52.2% of the entire portfolio and registers the largest spreads. Corporate and Middle Market Banking account for 42.9% of portfolio and show smaller returns that retail banking.
The star performers in terms of growth within the Retail Banking products were Individual Cash Loans (56.1% increase QoQ) and PYME loans (+42.7% QoQ). Together, they account for 33.3% of the retail portfolio. Mortgage loans, accounting for 47.0% of this portfolio, grew 0.4% QoQ and 3.2% YoY.
On the liabilities side, BCP Bolivia experienced 1.4% QoQ drop but a 16.3% YoY increase in deposits. Growing savings deposits 5.6% QoQ and 33.7% YoY), followed by also larger time deposits (2.0% QoQ and 8.8% YoY) as well as demand deposits (-11.2% QoQ and 2.4% up YoY) are worth underscoring.
Net shareholders’ equity grew 10.5% QoQ due to larger profits (41.3% YoY) for this quarter, partially mitigated by lower non-realized earnings (-99.5% QoQ). Likewise, our net shareholders equity expanded 27.5% YoY.
Finally, BCP Bolivia held a 13.1% market share of the loans market and 13.3% in deposits ranking our bank third for loan and deposits in the entire Bolivian banking system. BCP Bolivia continues to strengthen its position in the strategic products and services by including innovative products and creating a reputation as the bank with the safest transactions. BCP Bolivia has continued expanding its BCP Agents to increase market penetration in customer segments not yet served by the bank system. To December 2008, BCP operated through 92 BCP Agents.
21
| Banco de Crédito de Bolivia | Quarter | Change % | ||||||||||||||||||
| US$ million | 4Q08 | 3Q08 | 4Q07 | 4Q08 / 4Q07 | 4Q08/3Q08 | |||||||||||||||
| Total Loans | 477.5 | 499.8 | 463.8 | 3.0 | % | -4.5 | % | |||||||||||||
| Past due loans | 9.2 | 9.9 | 7.8 | 17.9 | % | -7.1 | % | |||||||||||||
| Loan loss reserves | (20.8 | ) | (18.4 | ) | (18.6 | ) | 11.8 | % | 13.0 | % | ||||||||||
| Total Assets | 939.7 | 956.0 | 821.9 | 14.3 | % | -1.7 | % | |||||||||||||
| Deposits | 771.9 | 782.7 | 663.9 | 16.3 | % | -1.4 | % | |||||||||||||
| Shareholders net equity | 108.2 | 97.9 | 85.1 | 27.1 | % | 10.5 | % | |||||||||||||
| Net Income | 13.0 | 11.0 | 9.7 | 34.0 | % | 18.2 | % | |||||||||||||
| PDL/Total loans | 2.0 | % | 2.0 | % | 1.7 | % | ||||||||||||||
| Coverage ratio of PDLs | 230.6 | % | 185.0 | % | 240.1 | % | ||||||||||||||
| ROAE | 46.1 | % | 47.5 | % | 37.2 | % | ||||||||||||||
| Branches | 64 | 63 | 61 | |||||||||||||||||
| ATMs | 182 | 181 | 157 | |||||||||||||||||
| Employees | 1,585 | 1,553 | 1,337 | |||||||||||||||||
22
IV. Atlantic Security Holding Corporation
From all of the Credicorp subsidiaries, ASHC received the strongest embattlement from the financial crisis. This quarter, not only a large impairment of securities affected by the market meltdown was recorded, but also a potential losses and contingencies related to the alleged Madoff fraud had to be reported.
Atlantic US Blue Chip Fund (AUSBCF) one of the funds managed on behalf of our customers went insolvent as a result of the collapse of Madoff Securities. Confronted by this alleged fraud, the company decided to constitute provisions for US$ 43.5 anticipating losses in its proprietary positions as well as any other potential contingencies arising from such event.
Total Core Revenues for 4QT08 reported US$7.3 million, reporting a decrease of 9.6% QoQ and 10.3% YoY. This decrease in core revenues is concentrated in the 7.2% QoQ drop of net interest income. On a YoY comparison, NII was still 18.2% higher.
The quarterly drop in net interest income is the result of changes in the structure of interest earning assets and its associated market yields; these changes corresponds to the slowdown of investment acquisition transactions and the retention of available cash generated by maturities and interest income from investment portfolio with the sole objective of maintaining the company with high levels of liquidity. This liquidity-based strategy resulted in less interest income in relation to prior quarters.
| ASHC | Quarter | Change % | ||||||||||||||||||
| (US$ Million) | 4Q08 | 3Q08 | 4Q07 | 4Q08 / 4Q07 | 4Q08 / 3Q08 | |||||||||||||||
| Net interest income | 5.8 | 6.3 | 4.9 | 18.2 | -7.2 | |||||||||||||||
| Dividend income | 0.2 | 0.0 | 0.2 | -32.2 | 838.4 | |||||||||||||||
| Fees and commissions from services | 2.0 | 2.2 | 2.2 | -9.8 | -10.6 | |||||||||||||||
| Net gains on foreign exchange transactions | -0.6 | -0.4 | 0.8 | -174.4 | -59.0 | |||||||||||||||
| Core Revenues | 7.3 | 8.1 | 8.2 | -10.3 | -9.6 | |||||||||||||||
| Impairment provisions, net of recoveries | -26.0 | -5.7 | -3.1 | -749.8 | -354.0 | |||||||||||||||
Provision Atlantic Blue Chip Fund and proprietary exposure | -43.5 | 0.0 | 0.0 | 100.0 | 100.0 | |||||||||||||||
| Net gains from sale of securities | 3.4 | 1.5 | 2.4 | 41.6 | 128.6 | |||||||||||||||
| Other income | 1.4 | 2.5 | 0.4 | 227.7 | -44.8 | |||||||||||||||
| Operating expenses | -2.0 | -2.1 | -2.9 | -30.3 | -5.0 | |||||||||||||||
| Net income | -59.4 | 4.2 | 5.0 | -1,291.8 | -1,513.7 | |||||||||||||||
| Net income/share | -0.7 | 0.1 | 0.1 | -1,027.1 | -1,199.7 | |||||||||||||||
| Total loans | 201.4 | 151.6 | 130.1 | 54.8 | 32.8 | |||||||||||||||
| Total investments available for sale | 575.6 | 671.8 | 853.7 | -32.6 | -14.3 | |||||||||||||||
| Total asset | 1,454.2 | 1,325.5 | 1,615.3 | -10.0 | 9.7 | |||||||||||||||
| Total deposits | 1,270.2 | 1,131.1 | 1,382.9 | -8.1 | 12.3 | |||||||||||||||
| Shareholder's equity | 115.7 | 180.0 | 214.1 | -46.0 | -35.7 | |||||||||||||||
| Net interest margin | 1.82 | % | 2.06 | % | 1.34 | % | ||||||||||||||
| Efficiency ratio | 16.8 | % | 17.7 | % | 26.6 | % | ||||||||||||||
| Return on average equity | -160.8 | % | 8.9 | % | 9.4 | % | ||||||||||||||
| PDL / Total loans | 0.00 | 0.00 | 0.00 | |||||||||||||||||
| Cover ratio | 0.6 | % | 0.9 | % | 1.0 | % | ||||||||||||||
| BIS ratio | 14.11 | % | 16.84 | % | 15.07 | % | ||||||||||||||
Commissions and fees income reports US$ 2 million representing a decrease of -10.6% when compared with 3QT08 results of US$ 2.2 million and -10% when compared with the figure of the same quarter 2007. These item reports lower volumes on a quarterly and yearly basis due to lower incentive and management fees charged to customers through asset management products, as a direct result of dropdowns on performance yields and net asset value of managed funds which are the base for determination of such commissions and fees.
Foreign exchange operations reports a US$ 0.6 million loss which represents an increase of 59% when compared 3Q08 figures. This loss arises from the un-hedged positions in euros, currency that has presented significant devaluation against the US dollar during this quarter.
As stated before, results of ASHC were however also strongly affected by the high level of provisions reported in 4Q08 which reached US$ 35.7 million, associated with the impairment of available-for-sale investments. As reported in previous quarters, reserves were constituted to confront possible losses related to credit exposure of issuers. Not withstanding, during this 4Q the financial crisis reached its most critical peak of the year, affecting the liquidity of financial markets and generating a generalized meltdown in the prices of securities.
23
The investment portfolio maintains a significant concentration of 79% on “safe” investment grade securities. Maintaining this structure through the year confirms the investment strategy of the company which is based on generating earnings through yields, rather than making profits through the trading of securities. Based on this fact, we expect important reserve recoveries as the market corrections begin.
On the other hand, a conservative decision to realize gains in some positions resulted in earnings of US$ 6.0 millions from the sale of securities, outperforming results in the compared quarters.
Efficiency ratio reported a decrease from 17.7% in 3Q08 to 13.8% in this 4Q08. The improvement is due to profits generated from realized gains and an unchanged level of operating expenses.
Bottom line losses reflect the worst quarter for ASHC and absorb most of the impact on Credicorp from the strongest financial crisis in decades. Total loss contributed to Credicorp amounts to US$56 million for the 4Q08, and results in a loss contribution for the year 2008 of US$ 50.4 million.
Asset levels increased by 9.7% QoQ, and decreased 10.0% YoY. This higher asset levels is a result of the increase in available cash, generated by the maturities of investments, migration from customers’ off-balance products to traditional deposits and the reinforcement of shareholders’ equity through the direct capitalization received in this quarter.
The capitalization was executed through the issuance of common stock for US$ 20.0 million and a long-term subordinated debt agreement for US$ 15.0 million.
| ASHC | ||||||||||||
| (US$ Million) | 2008 | 2007 | Change % | |||||||||
| Net interest income | 24.1 | 18.7 | 28.7 | |||||||||
| Dividend income | 22.4 | 19.6 | 14.3 | |||||||||
| Fees and commissions from services | 8.5 | 9.2 | -7.7 | |||||||||
| Net gains on foreign exchange transactions | -0.3 | 2.0 | -115.8 | |||||||||
| Core Revenues | 54.6 | 49.5 | 10.3 | |||||||||
| Impairment provisions, net of recoveries | -35.4 | -5.3 | -567.6 | |||||||||
| Provision Atlantic Blue Chip Fund and proprietary exposure | -43.5 | 0.0 | 100.0 | |||||||||
| Net gains from sale of securities | 5.6 | 2.6 | 118.1 | |||||||||
| Other income | 4.7 | 2.0 | 127.2 | |||||||||
| Operating expenses | -8.4 | -9.3 | 9.4 | |||||||||
| Net income | -22.4 | 39.5 | -156.7 | |||||||||
| Contribution to Credicorp (After Consolidation Adjustments) | -50.4 | 20.5 | -345.9 | |||||||||
Interest Earning Assets
Interest earning assets reached US$ 1,332 million, as shown in the table below. This figure increased 11.0% QoQ, while a YoY drop of 9.9% was observed. The quarterly increase is the result of a 38.4% increase in available cash balances and a 32.8% increase in credit operations on this quarter. These increases compensate the reported decrease of 12.8% in the investment portfolio, reduced by the maturities and market value loss during this quarter.
The share of investment-grade securities in the investment portfolio is 79%, emphasizing ASB’s prudent investment policy of concentrating its portfolio in high credit quality investments. Although the size of the portfolio reveals a reducing trend, its composition has not changed significantly in the last year.
24
| INTEREST EARNING ASSETS* | Quarter | Change % | ||||||||||||||||||
| (US$ Million) | 4Q 2008 | 3Q 2008 | 4Q 2007 | 4Q08 / 4Q07 | 4Q08 / 3Q08 | |||||||||||||||
| Due from banks | 584 | 422 | 548 | 6.6 | % | 38.4 | % | |||||||||||||
| Loans | 201 | 152 | 130 | 54.8 | % | 32.8 | % | |||||||||||||
| Investments | 546 | 626 | 799 | -31.7 | % | -12.8 | % | |||||||||||||
| Total interest-earning assets | 1,332 | 1,200 | 1,478 | -9.9 | % | 11.0 | % | |||||||||||||
(*) Excludes investments in equities and mutual funds.
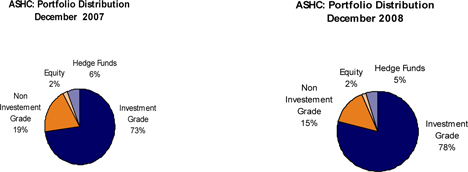
Asset Management Business
The asset management business includes, besides third party managed funds, customers’ deposits, mutual funds and proprietary investments held for custody. The total of these funds has decreased by 13.0% QoQ and 19.0% YoY.
This decrease is a result of a general drop on market value of managed funds and securities in custody on behalf of customers, which is also in line with the reported loss of value of the available for sale investments portfolio. In addition to this market value loss, many of our customers have opted out in favor of safe investments such as traditional time deposits, causing a migration to these banking products.
During this 4Q08, the collapse of Madoff Securities LLC had a negative effect in our asset management business through the failure of one of the feeder funds of the above company, which at the same time was the sole asset of one of our managed funds (AUSBCF). The collapse of this fund originated a decrease in this item of approximately US$ 110 millions represented by the Net Asset Value (NAV) of our fund in which our customers were investors. Customers’ contributions to this fund were approximately US$ 65.9 millions at the close of 4QT08.

25
V. Prima AFP
V1. Recent evolution of the private pension fund market
Increasingly weaker international financial markets at the beginning of the last quarter led to a sharp fall in managed funds. In November and December markets rebounded slightly while the local currency slipped. As a consequence, at the end of the last quarter, the system’s total funds under administration dropped 11.6% compared to the previous quarter, from US$ 17.9 billion in September 2008 to US$15.8 billion in December.
Transactions in the private pension market also slowed down in the fourth quarter. Membership transfers dropped from 67,000 total to 60,000, quarter over quarter, while new affiliations dropped from 59,000 to 46,000 in the same period. By December-end, the system’s total membership reached 4.3 million.
System revenues in the fourth quarter reached US$57.4 million, or 11.8% more YoY. Larger revenues result from a larger contribution’s payroll created by a livelier economy and formal job market.
System-wide operational expenses reached US$43.2 million, with earning from operations totaling US$14.3 million, or 91.5% more than the earnings from operations year over year. Despite the AFPs strong operations bottom line, local accounting guidelines require posting losses in reserves created by sliding international financial markets. (Losses from legal provisioning reached US$16.1 million in this period.) After accounting for other revenues and expenses, and provisioning for taxes and profit sharing, AFPs posted a fourth quarter US$7.7 million net loss.
Private Pension Fund System: Main Indicators
| At the end of the period: | 4Q08 | 3Q08 | 4Q07 | |||||||||
| Affiliates (thousand) | 4,296 | 4,260 | 4,101 | |||||||||
| % Change (1) | 0.8 | % | 1.2 | % | 1.3 | % | ||||||
| Sales force | 1,763 | 1,942 | 2,340 | |||||||||
| Asset under management (US$ mm) | 15,875 | 17,969 | 20,371 | |||||||||
| % Change (1) | -11.7 | % | -15.6 | % | 0.4 | % | ||||||
| Income (US$ mm) | 57.4 | 69.9 | 51.4 | |||||||||
| Operating Expenses (US$ mm) | 43.2 | 46.2 | 43.9 | |||||||||
| Operating income (US$ mm) | 14.3 | 23.8 | 7.4 | |||||||||
| Net Income (US$ mm) | -7.7 | -16.2 | (0.5 | ) |
Source: Conasev, SBS:
(1) Quarter Variation
(2) The third quarter includes double collection
(3) In local Peruvian accounting, legal reserves are included in the income statement as opposed to the IFRS
There is no infomation for results adjusted to international financial reporting standards for the Total System.
V2. Prima AFP
Despite the severe financial crisis and the impact of sliding securities markets worldwide on asset management businesses, and reported portfolios losses, Prima reported satisfactory earnings and effective sales and administrative cost reductions aimed at enhancing efficiencies. Revenues and earnings from operations in the fourth quarter reached a net US$1.4 million, for a total 2008 accumulated earnings reaching US$11.2 million, well above last year’s US$3 million.
26
PRIMA AFP: Main quarterly indicators and market share
PRIMA 4Q08 | System 4Q08 | Share 4Q08 % | PRIMA 3Q08 | System 3Q08 | Share 4Q08 % | |||||||||||||||||||
| Affiliates (1) | 1,045,410 | 4,296,480 | 24.3 | % | 1,040,568 | 4,259,889 | 24.4 | % | ||||||||||||||||
| New affiliations (2) | 9,538 | 45,959 | 20.8 | % | 11,575 | 59,436 | 19.5 | % | ||||||||||||||||
| Fund under management US$ mm (1) | 4,862 | 15,875 | 30.6 | % | 5,588 | 17,969 | 31.1 | % | ||||||||||||||||
| Collections US$ mm (3) | 119 | 366 | 32.4 | % | 146 | 445 | 32.9 | % | ||||||||||||||||
| Voluntary Contributions US$ mm (4) | 62 | 137 | 45.3 | % | 91 | 199 | 45.7 | % | ||||||||||||||||
| RAM US$ mm (5) | 344 | 1,063 | 32.3 | % | 344 | 1,061 | 32.4 | % | ||||||||||||||||
Source: Superintencia de Banca y Seguros
(1) Accumulated to the Quarter
(2) Available information as of november 2008
(3) Available information as of november. Prima's estimates
Monthly remuneration retained, earnings base calculation estimated by PRIMA on average earning during the last 4 months excluding double collection effect, special collections and voluntary contributions fees.
Commercial results
New and transfer members in the fourth quarter numbered 21,700 (12,200 transfers and 9,500 new affiliations), less than in the previous quarter. This lower number of commercial transactions was evident not just at Prima but also throughout the system, reflecting a shrinking sales force. Outbound transfers slowed down in the previous quarter though within the company’s forecast range. RAM net results were satisfactory during this quarter.
PRIMA recorded the system’s highest collection rate (32.3%) and the largest share of voluntary contributions to the system’s voluntary funds to November (45.3%).
PRIMA’s funds under management reached US$ 4,862 million or 30.6% of the system’s fund to December 2008. This market share indicator slipped slightly in the second half, as weaker financial markets hurt mostly Fund 3, where PRIMA has the largest market share.
Investments
Hurting international financial systems hurt investments during the period. Still, it is worth recalling pension fund investments are managed for the long term, above short term fluctuations. Results over the last 24 months show investment funds yielded a healthy 5.24% for Fund 1, -1.00% in Fund 2, and -9.88% in Fund 3. Prima’s returns from these funds ranked third, first and second system-wide. Consolidated pension fund management companies’ Fund 2 nominal growth since the system started operating averages 13.05%.
We show below each fund’s share of the total manager portfolio to December 2008.
PRIMA AFP: Funds under manaagement as of December 2008
| Dec-08 | % | Sep-08 | % | |||||||||||||
| Fund 1 | 397 | 8.2 | % | 354 | 6.3 | % | ||||||||||
| Fund 2 | 3,355 | 69.0 | % | 3,704 | 66.3 | % | ||||||||||
| Fund 3 | 1,110 | 22.8 | % | 1,530 | 27.4 | % | ||||||||||
| Total US$ mm | 4,862 | 100.0 | % | 5,588 | 100.0 | % | ||||||||||
Source: Superintendencia de Banca y Seguros
27
Financial results
Revenues
Prima’s fourth quarter revenues totaled US$15.5 million. Results for this period do not include the impact of double collection from regular monthly salaries and year-end bonuses. (Fund management companies’ revenues are usually 60 to 70% higher in January and August when members receive their mid-year and year-end mandatory bonuses.) A comparison of 2007 and 2008 fourth quarter revenues (US$14.4 million in 4Q07) reveals a 7.8% increase.
Base salaries used to figure out contributions to PRIMA are still the system’s highest and commanded a 32.3% market share computed from the revenue and administration fee figures disclosed by each pension manager. Therefore, the total member monthly contributions to PRIMA are the system’s highest. The administration fee is deducted from this total.
PRIMA’s balance of voluntary contributions under management to November (based on data from the Banks and Insurance Companies Commission) fell 28% quarter over quarter, again as a consequence of slipping international financial markets.
PRIMA AFP: Total earnings-US$ Million
| PRIMA Nov-08 | SISTEMA Nov-08 | Part. % | ||||||||||
| Income (1) | 5.2 | 18.7 | 27.5 | % | ||||||||
| Administrative Fees (2) | 1.50 | % | n.a. | |||||||||
| RAM estimated base (3) | 344 | 1,063 | 32.3 | % | ||||||||
Prima AFP estimates. In acordance to local public informati,(CONASEV)
(1) Average income from the last four months, excluding special colletions and voluntary contibution fees
Available information for the system as of november 2008.
(2) Administrative fee of 1.75% would be effective since january 2009
(3) RAM: Monthly Accumulated Salary
Expenditures
PRIMA’s 4Q08 operating expenses remained stable. Sales and administrative payroll expenses trended slightly downward while marketing expenses dropped compared to a quarter before.
Results from operations this period reached US$2.9 million, in line with forecasts. Results take account of merger related charges through the amortization of assets included in the Purchase Price Allocation. Once the property and equipment amortization and depreciation charges are added, D&A this quarter totals US$2.2 million.
The downward, but more stable, trend of the Peruvian currency QoQ, caused an exchange translation effect and the adjustment of deferred liabilities that resulted in a net loss of US$0.3 million. After tax and profit sharing provisioning, PRIMA’s net earnings this period reached US$1.43 million. Net accumulated earnings in 2008 totaled US11.20 million, exceeding our expectations.
Compared to a year ago, administration and sales costs were US$2.6 million higher in 4Q08, mainly as a result of deferring the cost of purchasing the Union Vida customer portfolio.
At the end of the fourth quarter, the company’s total assets were worth US$222.2 million, with matching liabilities totaling US$92.2 million and assets worth US$129.2 million.
28
The company’s main financial figures appear below.
PRIMA AFP: Main financial indicators (US$ thousand) (1)
| 4Q08 | 3Q08 | 4Q07 | Change % 4Q08/4Q07 | 2008 | 2007 | Var % 08/07 | ||||||||||||||||||||||
| Income | 15,538 | 19,591 | 14,478 | 7.3 | % | 70,720 | 54,417 | -23.1 | % | |||||||||||||||||||
| Administrative and sale expenses | (10,424 | ) | (11,493 | ) | (7,836 | ) | 33.0 | % | (41,818 | ) | (38,022 | ) | -9.1 | % | ||||||||||||||
| Depreciation and amortization | (2,172 | ) | (2,310 | ) | (2,054 | ) | 5.7 | % | (8,802 | ) | (8,389 | ) | -4.7 | % | ||||||||||||||
| Net operating income | 2,942 | 5,788 | 4,588 | -35.9 | % | 20,101 | 8,006 | -60.2 | % | |||||||||||||||||||
| Other income and expenses, net | (933 | ) | (844 | ) | (959 | ) | -2.8 | % | (4,155 | ) | (3,793 | ) | -8.7 | % | ||||||||||||||
| Workers' protif sharing and Income tax | (245 | ) | (1,695 | ) | (1,443 | ) | -83.0 | % | (5,082 | ) | (1,310 | ) | -74.2 | % | ||||||||||||||
| Net income before translation results | 1,764 | 3,249 | 2,186 | -19.3 | % | 10,864 | 2,903 | -73.3 | % | |||||||||||||||||||
| Translation results and deferred liabilities | (328 | ) | (1,545 | ) | 119 | -375.3 | % | 337 | 128 | -62.1 | % | |||||||||||||||||
| Net income (losses) | 1,437 | 1,704 | 2,305 | -37.7 | % | 11,201 | 3,031 | -72.9 | % | |||||||||||||||||||
| Total Assets | 222,242 | 237,950 | 246,095 | -9.7 | % | 222,242 | 246,391 | 10.9 | % | |||||||||||||||||||
| Total Liabilities | 92,975 | 106,382 | 116,485 | -20.2 | % | 92,975 | 116,784 | 25.6 | % | |||||||||||||||||||
| Equity | 129,268 | 131,568 | 129,610 | -0.3 | % | 129,268 | 129,607 | 0.3 | % | |||||||||||||||||||
(1) (IFRS)
29
VI. EL PACIFICO PERUANO SUIZA AND SUBSIDIARIES
VI.1 PACIFICO GROUP
Pacifico Insurance Group, a consolidation of general (PPS), life (PV) and health (EPS) insurance businesses, posted a US$9.8 million net loss in 4Q08, compared to earnings totaling US$1.2 million in 3Q08.
The difference in results is principally accounted for by i) a US$11.3 million loss in 4Q08 triggered by the impact of the international financial meltdown on our investments, and ii) windfall financial revenues worth US$5.9 million in 3Q08 thanks to earnings from securities sales.
Losses in 4Q08 are explained by the company’s decision in December to increase its provisioning (PPS US$ -6.9 million and PV US$ -4.4 million) by adjusting its portfolio value to reflect a more conservative policy and international financial reporting standards. Once this special adjustment and the company’s portfolio profile are factored into our analysis, a conservative and suitable corporate investment exposure appears. This contrasts with the financial revenues in 3Q08, which were comprised of earnings for US$5.9 million PPS earned in August from sales on stock in Inversiones Centenario’s portfolio.
It is however noteworthy, that even though the investments’ results led to the poor bottom line numbers reported, the insurance business itself improved significantly after the changes in the company’s business strategy implemented throughout the year. The technical results reached US$3.9 million in 4Q08 compared to a loss of US$0.4 million a quarter earlier. This improvement is mainly the result of an important reduction in the claims rate at PPS that dropped from 85.4% in 3Q08 to 77.2% in 4Q08.
Thus, contributions to Credicorp in 4Q08 was hurt by the abovementioned adjustment in PPS and PV investment portfolios, and a net translation loss of US$2.6 million, totaling - US$7.4 million compared to a smaller loss under the same heading in 3Q08.
| US$ Thousand | Net Earnings* | Ajustment for | Total Contribution | ||||||||||||||||||||||
| Period | PPS | PV | EPS | PGA | Consolidation and | to BAP | |||||||||||||||||||
| 4Q07 | (3,266 | ) | 3,351 | 768 | 853 | (208 | ) | 645 | |||||||||||||||||
| 1Q08 | (121 | ) | 2,544 | 797 | 3,093 | (750 | ) | 2,343 | |||||||||||||||||
| 2Q08 | (7,657 | ) | 692 | (2,759 | ) | (9,525 | ) | 2,311 | (7,214 | ) | |||||||||||||||
| 3Q08 | (2,537 | ) | 4,569 | (900 | ) | 1,221 | (4,810 | ) | (3,589 | ) | |||||||||||||||
| 4Q08 | (9,253 | ) | 1,156 | (1,731 | ) | (9,824 | ) | 2,384 | (7,440 | ) | |||||||||||||||
| Var % 4Q08 / 3Q08 | n.a. | -75 | % | n.a. | -905 | % | n.a. | n.a. | |||||||||||||||||
| Var % 4Q08 / 4Q07 | n.a. | -65 | % | -325 | % | -1251 | % | n.a. | -1253 | % | |||||||||||||||
Net results at year-end 2008 reached a total US$15.0 million compared to net profits of US$12.5 million in 2007. The difference is mainly accounted for by the US$11.3 million adjustment in portfolio value mentioned above and the increased claims rate this year of 84.3% as compared to the previous year of 77.7%. Part of the difference in net results is also due to the exchange rate translation effect that resulted in a US$3.4 million loss in 2008 while in 2007 this same effect resulted in a positive US$3.9 million, giving rise to a US$7.3 million balance.
Net earned premiums in 2008 reached US$405.7 million or 32% greater than a year before. The following table shows the amounts of premiums in each segment. Significant growth is evident in all cases from 2007 to 2008.
| 2008 | 2007 | |||||||||||||||||||||||
| PPS | PV | EPS | PPS | PV | EPS | |||||||||||||||||||
| Total Gross Premiums | 296.8 | 178.2 | 116.5 | 240.4 | 136.7 | 91.4 | ||||||||||||||||||
| Retained Premiums | 188.3 | 172.9 | 116.5 | 145.7 | 134.1 | 91.4 | ||||||||||||||||||
| Net Premiums Earned | 175.1 | 115.5 | 116.4 | 128.3 | 89.1 | 91.2 | ||||||||||||||||||
30
PGA’s share of the net earned premiums market at the end of November 2008 was 39.2% compared to 37.7% a year earlier.
General expenses grew US$80.3 million or 10-9% larger in 2008, mainly accounted for by a larger sales force at PV that added commercial momentum to accomplish 30.4% growth in direct life insurance premiums. The general expenditures to net premiums ratio at PGA dropped from 23.6% in 2007 to 19.8% in 2008.
Despite negative results in 2008, Pacífico Grupo Asegurador companies continued to put into practice their successful strategy to increase penetration of the persons’ insurance segment, to fragment and diversify risk, transfer exposure to large corporate risk to the international reinsurance market, and thereby make results more predictable and less volatile.
VI.2 PACIFICO GENERAL P&C INSURANCE (PPS)
Net cumulative results to December 2008 totaled a US$19.6 million loss accounted for by principally five major general risk claims that created losses for US$11.9 million (an equivalent to a seven point claim rate) and ii) a US$6.9 million loss resulting from an adjustment to the value of the investment portfolio in December triggered by the international financial crisis and its impact on the Lima Stock Exchange (BVL) index.
The recovery of PPS’s insurance is obvious. In 4Q08 its technical results reached US$2.3million, a considerable improvement after the US$1.9 million loss posted in 3Q08. Behind the recovery is principally the lower claims rate, down to 77.2% in 4Q08 from 85.4% a quarter earlier. Nevertheless, the net –US$9.2 million 4Q08 net result was strongly impacted by the adjustment in stock valuation mentioned earlier.
The improvement in technical results from 3Q08 to 4Q08 is mainly accounted for by a lower claims rate in Car & Mandatory Car (SOAT is the Spanish acronym) insurance (down from 87.1% to 77.1%) and General Insurance (a drop from 74.4% to 60.3%). Steps in recent months to increase rates and deductibles as well as changes in insurance contract terms improved technical results in these two lines in 2008’s last quarter, as shown in the following table.
Technical Results by Unit Business
| 4Q08 | 3Q08 | |||||||||||||||||||||||||||||||
| US$ millon | Vehicles & SOAT | Assistance | P&C | TOTAL PPS | Vehicles & SOAT | Assistance | P&C | TOTAL PPS | ||||||||||||||||||||||||
| Net Premiums Earned | 19.1 | 12.1 | 16.4 | 47.6 | 17.2 | 11.4 | 17.1 | 45.7 | ||||||||||||||||||||||||
| Technical Results | 0.1 | (1.3 | ) | 3.5 | 2.3 | (2.3 | ) | (1.1 | ) | 1.5 | (1.9 | ) | ||||||||||||||||||||
| Net claims / Earned Net Premiums | 77.1 | % | 100.2 | % | 60.3 | % | 77.2 | % | 87.1 | % | 99.2 | % | 74.4 | % | 85.4 | % | ||||||||||||||||
| Technical Results / Earned net Premiums | 0.5 | % | -10.8 | % | 21.6 | % | 4.9 | % | -13.6 | % | -9.4 | % | 8.7 | % | -4.2 | % | ||||||||||||||||
Car & Mandatory Car technical results totaling US$0.1 million in 4Q08 are an improvement over 3Q08, though still below target. The recovery reveals the positive impact of new policies and insurance terms in a branch experiencing steeply rising theft rates. Total car theft nationwide reached US$6.7 million between 2000 and 2007 while in 2008 car theft is expected to reach US$35 million.
The company will continue to put its claim reduction plan into force. Even better results are expected as we renew the car portfolio and cease to renew undesired business SOAT certificates.
Technical results in Health Care totaled –US$1.3 million in 4Q08, slightly worse than 3Q08’s -US$1.1 million. A strategy to stabilize this business line continues to focus on reviewing rates and terms while protecting competitiveness through outstanding service quality.
31
Claims rates for General Insurance continued to fall for the third month in a row (2Q08 109%, 3Q08 74.4% and 4Q08 60.3%) following a strategy to develop capacities to underwrite risk, and manage reinsurance to reduce retention and volatility of the company’s bottom line.
PPS posted US$4.1 million net financial loss in 4Q08 compared to earnings of US$8.7 million in 3Q08. The drop is explained mainly through the loss of stock value totaling US$6.9 million in December as explained above and earnings of US$5.9 million from sales of Inversiones Centenario stock in August.
In sum, during 4Q08, PPS, the general insurance branch, (i) saw revenues from net insurance premiums totaling US$47.6 million while (ii) total operation costs reached US$55.1 million. These figures give a (iii) 116% combined ratio of which 77 percent points may be attributed to costs or expenses related to net claims, 18 percent points are due to business purchase costs, and the remaining 21% are general and administrative expenses.
Pacifico General Insurance’s business line is actively pursuing initiatives in the three fronts of claims and purchase costs and general expenses to significantly bring down its combined ratio. Remarkably, this indicator has slipped for the third quarter in a row, from 144% in 2Q08 to 116% in 4Q08.
VI.3 PACIFICO VIDA
Pacifico Life Insurance (PV is the Spanish acronym) earned US$1.9 million before minority interests in 4Q08, lower than 3Q08’s US$7.4 million.
Lower quarter-to-quarter earnings stem mainly from 4Q08 losses realized in sales of securities after the December correction of US$4.4 million created by the world financial meltdown, and greater provisioning reaching US$2.8 million stemming from degrading investments backing life products with a savings component. These were partly offset by sales of US Treasury bonds totaling US$2.2 million in December. Significantly, 3Q08 posted US$1.1 million earnings from sales of Sovereign Global Bonds, and another US$0.95million from sales of local corporate bonds.
| Products | Total Premiums | Change % | ||||||||||||||||||
| (US$ Million) | 4Q08 | 3Q08 | 4Q07 | 3Q08 | 4Q07 | |||||||||||||||
| Individual life | 11.6 | 11.1 | 9.3 | 5.2 | % | 25.7 | % | |||||||||||||
| Individual annuity | 8.0 | 9.4 | 11.0 | -14.8 | % | -27.7 | % | |||||||||||||
| Disability & survivor ( Pénsion) | 9.0 | 9.3 | 7.4 | -3.1 | % | 22.3 | % | |||||||||||||
| Credit Life | 5.7 | 5.4 | 3.2 | 6.0 | % | 77.2 | % | |||||||||||||
| Personal accidents | 2.6 | 2.5 | 2.0 | 3.4 | % | 30.9 | % | |||||||||||||
| Group life (Law) | 1.9 | 2.1 | 1.5 | -10.2 | % | 21.3 | % | |||||||||||||
| Group life | 3.0 | 2.9 | 3.1 | 3.7 | % | -2.0 | % | |||||||||||||
| Limited workers compensation | 2.2 | 2.7 | 1.8 | -21.0 | % | 17.0 | % | |||||||||||||
| TOTAL | 44.037 | 45.4027 | 39.3674 | -3.0 | % | 11.9 | % | |||||||||||||
General expenses dropped 12.2% QoQ to US$7.4 million. The expenditures to net earned premiums fell from 27% in 3Q08 to 23% in 4Q08. The net earned claims rate dropped from 70.1% in 3Q08 to 68.8% in 4Q08, mainly thanks to improvements in pension insurance plans.
PV’s results before minority interests in 2008 reached US$14.4 million, 42% lower than in 2007 due to a rise in the claims rate from 71% to 74.3%. Pension insurance plans experienced the greatest claims’ increases. There, claims reached 141.0% in 2008 due to the required adjustments to reserves arising from higher rates payable for guarantee assets triggered by the international crisis
32
VI.4 PACIFICO HEALTH (EPS)
Health business posted US$1.7 million losses in 4Q08, larger than the US$0.9 million loss posted in 3Q08.
Technical results reached US$0.6 million in 4Q08 compared to US$1.4 million in 3Q08. The accounting loss is mainly accounted for by:
| i) | a 2.7% drop compared to 3Q08 in revenues after local currency denominated contributions from clients are converted into dollars simultaneously with a rising dollar exchange rate, and the additional contributions in 3Q08 linked to July bonuses earned by members on corporate payrolls. |
| ii) | a larger claims rate, 91.3% in 4Q08 (2 points above 3Q08). Quarterly claims rates were significantly impaired by larger IBNR (incurred but not reported) reserves reaching US$2.1 million in 4Q08 compared to US$1.3 million a quarter earlier. |
To reduce the claims rate the company enforces a plan to standardize and increase rates, co-insurance and deductibles for high consumption accounts. It also has adjusted the terms of health contracts to reduce service costs and improve technical results.
General expenses totaling US$2.4 million are 8% lower than a quarter earlier, thanks mainly to lower cost of third party services. The EPS’s cost management and containment have reduced the general expenses to net earned premium ratio to 8.2%.
By 2008-end, the company posted US$4.6 million loss compared to earnings of US$2.7 million in 2007.
Total claims in 2008 were worth US$105.1 million reflecting a net claims rate for earned premiums of 90.3% compared to 82.4% in the year before. In addition to the increased cost of health care and larger provisioning, the company also witnessed greater frequency in use of insurance services, reflecting the consumers’ growing purchasing power.
General expenses in 2008 reached US$10.8 million, or 2% above 2007 figures. As a percent of net earned premiums, general expenses reached 8.9% in 2008, compared to 11.1% in 2007, in line with international standards.
33
VII. ECONOMIC OUTLOOK
Economic Activity
Peru’s economy grew 5.1% in November, the slowest since April 2006, as a result of banking holidays during the Asia Pacific Economic Council (APEC) summit and slower foreign demand. Internal demand, including construction, services and commerce continued to expand while export-driven industries (both conventional and non conventional) slowed down significantly.
This differential behavior can be more readily seen in non primary manufacturing for exports where apparel (-10.0% in November and -0.9% from January to November) and yarns and textiles (-15.6% and -2.6% down in the same period) evidently suffer the impact of the international recession, while other industries like metal products for the construction industry (+20.2% and +31.0%, respectively) and non alcoholic beverages (+14.9% and 13.8%) continue to grow at annually adjusted double digit rates. Ironically, mining grew 12.4% in November, the fastest growth that month though this was the consequence of the impact on statistics of the coming in line of Block 56 that expanded hydrocarbons output by over 20%. Block 56 contributes almost 5% of total mining output.
Although the international recession looms larger, the growth outlook for coming months remains strong, largely relying on lively domestic demand which, however, is expected to decline as 2009 wears on through the combined impact of higher and more volatile exchange rates, and lower disposable incomes, a consequence of deteriorating terms of trade. Countercyclical fiscal and monetary policies will then become all the more important, to stimulate infrastructure and low income housing projects, on the one hand, and lower interest rates to foster growth of credits, on the other. Once account is taken of last year’s fiscal surplus of 2.0% of GDP and the Central Bank’s prime rate currently stands at 6.5% (against the background of sliding annual inflation rates) there is ample room for both types of policies.
Gross Domestic Product and Internal Demand
(Annualized percentage variation)
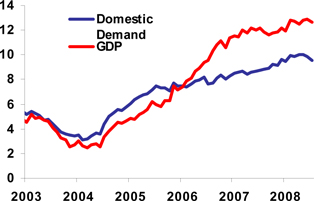
Source: INEI
34
External Sector
Peru’s trade surplus in the 12 months to November reached US$4 billion or less than the US$4.5 billion surplus at the end of 2007. This is accounted for by annually adjusted growth of imports reaching 36.4% (principally capital goods and inputs, higher oil and food prices, compared to 2007, despite a year-end correction). To this we must add a 4.7% fall in exports. Foreign sales from December 2007 to November 2008 reached US$32.2 billion. Non traditional exports performed significantly better (+25.7%) than conventional exports (+13.9%). Inputs exports grew 44.2% while capital goods exports expanded 57.5%. Consumer goods exports moved more slowly (41.6%). Discounting for the price effect, imports grew at an annual 23.7% (31.8% to year end 2007) reflecting a still strong domestic demand.
Finally, the Central Bank’s repeated foreign currency sales, foreign currency reserves grew at a more moderate annual pace reaching US$30,386 million to January 20, or US$810 million less than at the end of 2008. (Foreign currency reserves peaked at US$35,625 million in April last year).
Exports and Imports
(Annualized percentage variation)
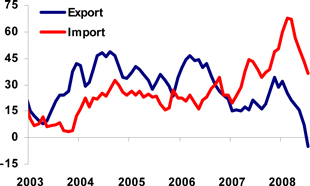
Source: BCRP
Prices and Exchange rate
Cumulative inflation in Metropolitan Lima at the end of 2008 reached 6.65%, well above the Central Bank’s inflation target (2% ± 1%) and last year’s final 3.9% figure. This is the highest inflation since inflation targeting was introduced in 2002.
Inflation surged despite lower international food prices and slower local fuel prices made possible by the Fuel Price Stabilization Fund. However, price increase inertia led to higher prices even for non tradable goods and services.
Given the decline in the international economy, commodity prices are expected to remain low, thus tampering pressure for higher prices in coming months. Against this backdrop, the Central Bank cut legal reserve rates for deposits in domestic and foreign currencies, though they are still higher than at the beginning of 2008. This policy is expected to continue.
In an international scenario of greater risk and avid search for more liquid and secure assets, capitals have started to leave emerging markets, resulting in higher exchange rates in Latin America in general, and Peru in particular. In recent weeks, the Nuevo Sol has depreciated at an annually adjusted rate of about 7.0% despite the Central Bank’s interventions in the currency market. The Central Bank has been effective in moderating exchange volatility but not to revert the upward trend of the exchange rate. Central Bank sales since October border four billion dollars. The exchange rate reaches about 3.15 nuevos soles to the dollar though amidst greater volatility driven by the stronger dollar worldwide, in particular against the euro and the UK pound.
35
| Consumer price index | Exchange Rate and purchases US$ BCRP | |
| (Annual percentage variation) | (S/. per dollar and US$ MM) | |
 | 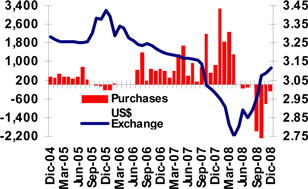 | |
Source: INEI, BCR
Fiscal Sector
Tax revenues grew 5.1% year over year to reach total 15.6% GDP tax pressure. Collection surged significantly in the first nine months and slowed down in the last quarter, consistent with a world economic slowdown and the impact of the world financial meltdown.
Value added tax collection grew 18.2% while third category income tax expanded 6.6%. Together they account for almost 80% of total tax revenues. Collection of back taxes fell (-41.4%) thanks to lower mining sector payments resulting from high payments on account during 2007 that closely matched tax payments due by the mining industry.
On the expenditure side, government expenses moved at a lively pace, expanding by 50% in real terms, at both central, and regional and local government levels. In addition to moderate increases (4.3%) in current expenses, higher expenditure translated into a smaller government bottom line (2.2% of GDP) compared to 2007 (3.1% of GDP).
36
Fiscal Income of the Central Government
(Annual percentage variation)
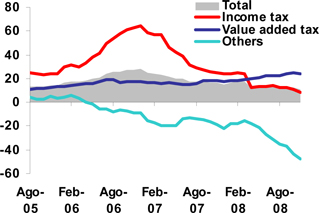
Source: Sunat
Banking System
Preliminary Central Bank reports to December revealed bank loans in dollars expanded 27.0% in 2008 (compared to 41.0% in 2006 and 36.9% to June 2008), despite an upward trending exchange rate in the second half that mitigated the expansion in soles (33.8% in 2008, even higher than the 30.9% rate of 2007). Consumer loans expanded the most (40.1% to September and 47.3% to 2007-close). Also to be highlighted is the 35.4% growth in commercial and micro-business loans. Home loans grew at a faster pace that rose from 16.3% in December 2007 to 21.5% growth pace at the end of 2008 (though the expansion clip had reached 24.3% annually in September).
Deposits continued to grow as well. Dollar denominated deposits grew 28.4% compared to year end 2007 (when year over year growth reached 30.8%). Growth took place mainly in term deposits (36.3%). Other deposits (demand deposits, savings and CTS severance accounts) grew at a lower than average annual rate.
Dollars in the banking system shrank as a percent of total bank funds, although the trend reverted partially toward year end, responding to a change in patterns in time deposits where the dollar share shrank from 65.7% to 55.8%, though a parallel reduction was seen in dollar denominated in savings (a drop from 56.7% to 54.5%). Dollarization of demand deposits increased from 48.3% to 53.4% (after reaching a 42.4% low in April). Dollar loans accounted for 57.8% of total loans (after reaching 61.8% in December 2007), principally thanks to small mortgage loans in dollars (from 80.2% to 71.1%).
Finally, interest rates trended down again after a third quarter surge prompted by a higher perceived country risk. The lending rate in local currency (TAMN) closed 2008 at 23.0% (22.3% at the end of 2007 but 24.3% in September 2008). The interest rate charged for dollar denominated loans (TAMEX) closed at 10.5% (as at the end of 2007). The interest rates paid for deposits in local and foreign currency closed 2008 at 3.8% and 1.9%, respectively. It is worth highlighting these latter figures as they are lower than the corresponding rates at the end of 2007 (2.5%) that resulted from an increase in perceptions of greater upward pressures on exchange rates.
37
Main Financial Indicators
| 2006 | 2007 | 2008 | ||||||||||||||||||||||||||||||||||
Year | IQ | IIQ | IIIQ | IVQ | Year (E) | IQ | IIQ | IIIQ | ||||||||||||||||||||||||||||
| GDP (US$ MM) | 92,439 | 23,855 | 27,510 | 26,579 | 29,561 | 107,504 | 23,855 | 27,510 | 26,579 | |||||||||||||||||||||||||||
| Real GDP (var. %) | 7.7 | 8.5 | 8.1 | 8.9 | 9.8 | 8.9 | 9.7 | 11.0 | 9.5 | |||||||||||||||||||||||||||
| GDP per-cápita (US$) | 3,400 | 3,454 | 3,971 | 3,825 | 4,242 | 3,873 | 3,413 | 3,924 | 3,768 | |||||||||||||||||||||||||||
| Domestic demand (var. %) | 10.3 | 11.5 | 10.8 | 13.4 | 11.7 | 11.8 | 11.6 | 14.3 | 13.3 | |||||||||||||||||||||||||||
| Consumption (var. %) | 6.4 | 8.3 | 8.1 | 8.0 | 9.0 | 8.3 | 8.3 | 9.0 | 8.9 | |||||||||||||||||||||||||||
| Private Investment (var. %) | 18.9 | 16.9 | 22.5 | 27.9 | 22.5 | 22.6 | 23.0 | 35.8 | 31.6 | |||||||||||||||||||||||||||
| CPI (annual change, %) | 1.1 | 0.3 | 1.6 | 2.8 | 3.9 | 3.9 | 5.5 | 5.7 | 6.2 | |||||||||||||||||||||||||||
| Exchange rate, eop (S/. per US$) | 3.20 | 3.18 | 3.17 | 3.09 | 3.00 | 3.00 | 2.74 | 2.97 | 2.98 | |||||||||||||||||||||||||||
| Devaluation (annual change, %) | -6.8 | -5.2 | -2.8 | -5.0 | -6.1 | -6.1 | -13.8 | -6.4 | -3.56 | |||||||||||||||||||||||||||
| Exchange rate, average (S/. per US$) | 3.26 | 3.19 | 3.17 | 3.14 | 2.98 | 3.12 | 2.89 | 2.82 | 2.90 | |||||||||||||||||||||||||||
| Non-Financial Public Sector (% of GDP) | 2.1 | 5.0 | 8.1 | 2.1 | -2.4 | 3.1 | 4.3 | 5.4 | 1.5 | |||||||||||||||||||||||||||
| Central government current revenues (% of GD | 17.4 | 17.3 | 20.4 | 17.5 | 17.1 | 18.1 | 18.1 | 19.5 | 18.5 | |||||||||||||||||||||||||||
| Tax Income (% of GDP) | 15.0 | 14.9 | 17.6 | 15.2 | 14.7 | 15.6 | 15.5 | 16.5 | 15.8 | |||||||||||||||||||||||||||
| Non Tax Income (% of GDP) | 2.4 | 2.4 | 2.8 | 2.3 | 2.4 | 2.5 | 2.6 | 3.0 | 2.7 | |||||||||||||||||||||||||||
| Current expenditures (% of GDP) | 12.3 | 11.7 | 14.0 | 11.5 | 13.1 | 12.6 | 10.5 | 10.6 | 16.2 | |||||||||||||||||||||||||||
| Capital expenditures (% of GDP) | 2.0 | 0.7 | 1.4 | 2.3 | 4.0 | 2.1 | 1.1 | 1.7 | 2.5 | |||||||||||||||||||||||||||
| Trade Balance (US$ MM) | 8,934 | 1,539 | 2,245 | 2,300 | 2,273 | 8,356 | 1,457 | 910 | 821 | |||||||||||||||||||||||||||
| Exports (US$ MM) | 23,800 | 5,747 | 6,741 | 7,594 | 7,874 | 27,956 | 7,721 | 8,460 | 8,796 | |||||||||||||||||||||||||||
| Imports (US$ MM) | 14,866 | 4,208 | 4,497 | 5,294 | 5,601 | 19,599 | 6,264 | 7,550 | 7,975 | |||||||||||||||||||||||||||
| Current Account Balance (US$ MM) | 2,755 | 92 | 368 | 500 | 544 | 1,505 | -744 | -1,282 | -845 | |||||||||||||||||||||||||||
| Current Account Balance (% of GDP) | 3.0 | 0.4 | 1.3 | 1.9 | 1.8 | 1.4 | -3.1 | -4.7 | -3.2 | |||||||||||||||||||||||||||
38
Company Description:
Credicorp Ltd. (NYSE: BAP) is the leading financial services holding company in Peru. It primarily operates via its four principal Subsidiaries: Banco de Credito del Peru (BCP), Atlantic Security Holding Corporation (ASHC), El Pacífico-Peruano Suiza Compañía de Seguros y Reaseguros (PPS) and Grupo Credito. Credicorp is engaged principally in commercial banking (including trade finance, corporate finance and leasing services), insurance (including commercial property, transportation and marine hull, automobile, life, health and pension fund underwriting insurance) and investment banking (including brokerage services, asset management, trust, custody and securitization services, trading and investment). BCP is the Company's primary subsidiary.
Safe Harbor for forward-looking statements:
This material includes “forward-looking statements” within the meaning of Section 21E of the Securities Exchange Act of 1934. All statements other than statements of historical information provided herein are forward-looking and may contain information about financial results, economic conditions, trends and known uncertainties.
The Company cautions readers that actual results could differ materially from those expected by the Company, depending on the outcome of certain factors, including, without limitation: (1) adverse changes in the Peruvian economy with respect to the rates of inflation, economic growth, currency devaluation, and other factors, (2) adverse changes in the Peruvian political situation, including, without limitation, the reversal of market-oriented reforms and economic recovery measures, or the failure of such measures and reforms to achieve their goals, and (3) adverse changes in the markets in which the Company operates, including increased competition, decreased demand for financial services, and other factors. Readers are cautioned not to place undue reliance on these forward-looking statements, which speak only as of the date hereof.
The Company undertakes no obligation to release publicly the result of any revisions to these forward-looking statements which may be made to reflect events or circumstances after the date hereof, including, without limitation, changes in the Company’s business strategy or planned capital expenditures, or to reflect the occurrence of unanticipated events.
39
CREDICORP LTD. AND SUBSIDIARIES
CONSOLIDATED BALANCE SHEETS
(In US$ thousands, IFRS)
| As of | Dec 08/ | Dec 08/ | ||||||||||||||||||
| Dec 08 | Sep 08 | Dec 07 | Dec 07 | Sep 08 | ||||||||||||||||
| Assets | ||||||||||||||||||||
| Cash and due from banks | ||||||||||||||||||||
| Non-interest bearing | 2,655,820 | 591,053 | 620,918 | 327.7 | % | 349.3 | % | |||||||||||||
| Interest bearing | 1,107,181 | 3,365,197 | 2,452,947 | -54.9 | % | -67.1 | % | |||||||||||||
| Total cash and due from banks | 3,763,001 | 3,956,250 | 3,073,865 | 22.4 | % | -4.9 | % | |||||||||||||
| Marketable securities, net | 36,084 | 32,468 | 50,995 | -29.2 | % | 11.1 | % | |||||||||||||
| Loans | 10,546,378 | 9,929,562 | 8,250,819 | 27.8 | % | 6.2 | % | |||||||||||||
| Current | 10,463,514 | 9,852,112 | 8,189,249 | 27.8 | % | 6.2 | % | |||||||||||||
| Past Due | 82,864 | 77,449 | 61,570 | 34.6 | % | 7.0 | % | |||||||||||||
| Less - Reserve for possible loan losses | (224,337 | ) | (230,390 | ) | (211,319 | ) | 6.2 | % | -2.6 | % | ||||||||||
| Loans, net | 10,322,042 | 9,699,172 | 8,039,500 | 28.4 | % | 6.4 | % | |||||||||||||
| Investments securities available for sale | 4,972,592 | 5,209,636 | 5,228,641 | -4.9 | % | -4.6 | % | |||||||||||||
| Reinsurance assets | 165,144 | 150,936 | 116,141 | 42.2 | % | 9.4 | % | |||||||||||||
| Premiums and other policyholder receivables | 111,561 | 110,790 | 85,495 | 30.5 | % | 0.7 | % | |||||||||||||
| Property, plant and equipment, net | 329,458 | 312,653 | 274,935 | 19.8 | % | 5.4 | % | |||||||||||||
| Due from customers on acceptances | 232,580 | 217,302 | 35,901 | 547.8 | % | 7.0 | % | |||||||||||||
| Other assets | 1,130,639 | 1,080,273 | 800,425 | 41.3 | % | 4.7 | % | |||||||||||||
| Total Assets | 21,063,099 | 20,769,479 | 17,705,898 | 19.0 | % | 1.4 | % | |||||||||||||
| Liabilities and shareholders' equity | ||||||||||||||||||||
| Deposits and Obligations | ||||||||||||||||||||
| Non-interest bearing | 4,345,273 | 2,757,069 | 2,926,308 | 48.5 | % | 57.6 | % | |||||||||||||
| Interest bearing | 9,434,142 | 10,286,385 | 8,424,406 | 12.0 | % | -8.3 | % | |||||||||||||
| Total deposits and Obligations | 13,779,414 | 13,043,454 | 11,350,714 | 21.4 | % | 5.6 | % | |||||||||||||
| Due to banks and correspondents | 2,330,707 | 2,805,330 | 2,323,665 | 0.3 | % | -16.9 | % | |||||||||||||
| Acceptances outstanding | 232,580 | 217,302 | 35,901 | 547.8 | % | 7.0 | % | |||||||||||||
| Reserves for property and casualty claims | 822,856 | 812,990 | 688,249 | 19.6 | % | 1.2 | % | |||||||||||||
| Reserve for unearned premiums | 144,914 | 149,725 | 127,278 | 13.9 | % | -3.2 | % | |||||||||||||
| Reinsurance payable | 55,841 | 50,056 | 21,914 | 154.8 | % | 11.6 | % | |||||||||||||
| Bonds and subordinated debt | 799,083 | 836,909 | 702,298 | 13.8 | % | -4.5 | % | |||||||||||||
| Other liabilities | 1,101,392 | 944,947 | 640,606 | 71.9 | % | 16.6 | % | |||||||||||||
| Minority interest | 106,933 | 114,981 | 139,264 | -23.2 | % | -7.0 | % | |||||||||||||
| Total liabilities | 19,373,721 | 18,975,693 | 16,029,889 | 20.9 | % | 2.1 | % | |||||||||||||
| Capital stock | 471,912 | 471,912 | 471,912 | 0.0 | % | 0.0 | % | |||||||||||||
| Treasury stock | (73,107 | ) | (73,107 | ) | (73,107 | ) | 0.0 | % | 0.0 | % | ||||||||||
| Capital surplus | 140,693 | 140,693 | 140,693 | 0.0 | % | 0.0 | % | |||||||||||||
| Reserves | 815,387 | 815,387 | 587,218 | 38.9 | % | 0.0 | % | |||||||||||||
| Unrealized gains | (45,171 | ) | 72,713 | 179,550 | -125.2 | % | -162.1 | % | ||||||||||||
| Retained earnings | 379,664 | 366,189 | 369,743 | 2.7 | % | 3.7 | % | |||||||||||||
| Net Shareholder's equity | 1,689,378 | 1,793,786 | 1,676,009 | 0.8 | % | -5.8 | % | |||||||||||||
| Total liabilities and net shareholder's equity | 21,063,099 | 20,769,479 | 17,705,898 | 19.0 | % | 1.4 | % | |||||||||||||
| Contingent Credits | 6,083,243 | 6,335,325 | 5,035,068 | 20.8 | % | -4.0 | % | |||||||||||||
40
CREDICORP LTD. AND SUBSIDIARIES
QUARTERLY INCOME STATEMENT
(In US$ thousands, IFRS)
| Quarter | Change % | Year ended | Change % | |||||||||||||||||||||||||||||
| 4Q08 | 3Q08 | 4Q07 | 4Q08/ 4Q07 | 4Q08/ 3Q08 | Dec 08 | Dec 07 | Dec 08/Dec 07 | |||||||||||||||||||||||||
| Interest income and expense | ||||||||||||||||||||||||||||||||
| Interest and dividend income | 356,374 | 350,362 | 325,969 | 9.3 | % | 1.7 | % | 1,384,540 | 1,065,974 | 29.9 | % | |||||||||||||||||||||
| Interest expense | (142,145 | ) | (149,922 | ) | (151,213 | ) | -6.0 | % | -5.2 | % | (561,618 | ) | (432,000 | ) | 30.0 | % | ||||||||||||||||
| Net interest and dividend income | 214,230 | 200,440 | 174,756 | 22.6 | % | 6.9 | % | 822,922 | 633,974 | 29.8 | % | |||||||||||||||||||||
| Provision for loan losses | (5,621 | ) | (16,713 | ) | (9,926 | ) | -43.4 | % | -66.4 | % | (47,760 | ) | (28,356 | ) | 68.4 | % | ||||||||||||||||
| Non financial income | ||||||||||||||||||||||||||||||||
| Fee income | 93,676 | 103,327 | 88,314 | 6.1 | % | -9.3 | % | 394,247 | 324,761 | 21.4 | % | |||||||||||||||||||||
| Net gain on foreign exchange transactions | 32,559 | 24,110 | 22,316 | 45.9 | % | 35.0 | % | 108,709 | 61,778 | 76.0 | % | |||||||||||||||||||||
| Net gain on sales of securities | 18,811 | (875 | ) | 3,643 | 416.3 | % | -2249.1 | % | 51,936 | 41,357 | 25.6 | % | ||||||||||||||||||||
| Other | 14,341 | 10,040 | 7,769 | 84.6 | % | 42.8 | % | 37,588 | 26,310 | 42.9 | % | |||||||||||||||||||||
| Total non financial income, net | 159,387 | 136,602 | 122,043 | 30.6 | % | 16.7 | % | 592,481 | 454,205 | 20.7 | % | |||||||||||||||||||||
| Insurance premiums and claims | ||||||||||||||||||||||||||||||||
| Net premiums earned | 105,044 | 104,124 | 81,113 | 29.5 | % | 0.9 | % | 393,903 | 297,272 | 32.5 | % | |||||||||||||||||||||
| Net claims incurred | (24,435 | ) | (26,710 | ) | (20,516 | ) | 19.1 | % | -8.5 | % | (101,890 | ) | (67,689 | ) | 50.5 | % | ||||||||||||||||
| Increase in cost for life and health policies | (60,324 | ) | (60,930 | ) | (48,374 | ) | 24.7 | % | -1.0 | % | (240,020 | ) | (170,911 | ) | 40.4 | % | ||||||||||||||||
| Total other operating income, net | 20,284 | 16,484 | 12,222 | 66.0 | % | 23.1 | % | 51,992 | 58,672 | -11.4 | % | |||||||||||||||||||||
| Operating expenses | ||||||||||||||||||||||||||||||||
| Salaries and employees benefits | (107,010 | ) | (101,259 | ) | (89,585 | ) | 19.5 | % | 5.7 | % | (387,701 | ) | (308,597 | ) | 25.6 | % | ||||||||||||||||
| Administrative, general and tax expenses | (83,270 | ) | (67,524 | ) | (66,366 | ) | 25.5 | % | 23.3 | % | (269,291 | ) | (206,894 | ) | 30.2 | % | ||||||||||||||||
| Depreciation and amortization | (16,224 | ) | (15,396 | ) | (13,363 | ) | 21.4 | % | 5.4 | % | (59,724 | ) | (51,172 | ) | 16.7 | % | ||||||||||||||||
| Merger Expenses | - | - | - | 100.0 | % | 100.0 | % | - | - | 0.0 | % | |||||||||||||||||||||
| Other | (13,773 | ) | (29,662 | ) | (24,012 | ) | -42.6 | % | -53.6 | % | (93,840 | ) | (99,484 | ) | -5.7 | % | ||||||||||||||||
| Total operating expenses | (220,277 | ) | (213,841 | ) | (193,327 | ) | 13.9 | % | 3.0 | % | (810,556 | ) | (666,148 | ) | 21.7 | % | ||||||||||||||||
| Income before non-recuring items translation results,workers' profit sharing and income taxes | 168,002 | 122,971 | 105,768 | 58.8 | % | 36.6 | % | 609,080 | 452,347 | 34.6 | % | |||||||||||||||||||||
| Translation result | (31,813 | ) | 6,979 | 17,442 | -282.4 | % | -555.9 | % | (17,650 | ) | 34,627 | -151.0 | % | |||||||||||||||||||
| Impairment | (40,856 | ) | (5,733 | ) | (50,274 | ) | ||||||||||||||||||||||||||
| Provision Atlantic Blue Chip Fund and proprietary exposure | (43,489 | ) | (43,489 | ) | ||||||||||||||||||||||||||||
| Workers’ profit sharing | (4,260 | ) | (3,301 | ) | (2,046 | ) | 108.1 | % | 29.1 | % | (14,845 | ) | (12,956 | ) | 14.6 | % | ||||||||||||||||
| Income taxes | (29,512 | ) | (24,241 | ) | (22,559 | ) | 30.8 | % | 21.7 | % | (109,508 | ) | (101,624 | ) | 7.8 | % | ||||||||||||||||
| Net income | 18,073 | 96,675 | 98,605 | -81.7 | % | -81.3 | % | 373,315 | 372,393 | 0.2 | % | |||||||||||||||||||||
| Minority interest | 4,597 | 4,075 | 4,590 | 0.2 | % | 12.8 | % | 15,575 | 21,658 | -28.1 | % | |||||||||||||||||||||
| Net income attributed to Credicorp | 13,475 | 92,601 | 94,016 | -85.7 | % | -85.4 | % | 357,740 | 350,736 | 2.0 | % | |||||||||||||||||||||
41
CREDICORP LTD. AND SUBSISIARIES
SELECTED FINANCIAL INDICATORS
| Quarter | Year ended | |||||||||||||||||||
| 4Q08 | 3Q08 | 4Q07 | Dec 08 | Dec 07 | ||||||||||||||||
| Profitability | ||||||||||||||||||||
| Net income per common share (US$ per share)(1) | 0.17 | 1.16 | 1.18 | 4.49 | 4.40 | |||||||||||||||
| Net interest margin on interest earning assets (2) | 4.89 | % | 4.35 | % | 4.67 | % | 3.46 | % | 3.40 | % | ||||||||||
| Return on average total assets (2)(3) | 0.26 | % | 1.80 | % | 2.25 | % | 1.72 | % | 2.17 | % | ||||||||||
| Return on average shareholders' equity (2)(3) | 3.09 | % | 20.66 | % | 22.94 | % | 22.31 | % | 22.87 | % | ||||||||||
| No. of outstanding shares (millions)(4) | 79.76 | 79.76 | 79.76 | 79.76 | 79.76 | |||||||||||||||
| Quality of loan portfolio | ||||||||||||||||||||
| Past due loans as a percentage of total loans | 0.79 | % | 0.78 | % | 0.75 | % | 0.79 | % | 0.75 | % | ||||||||||
| Reserves for loan losses as a percentage of total past due loans | 270.73 | % | 297.47 | % | 343.22 | % | 270.73 | % | 343.22 | % | ||||||||||
| Reserves for loan losses as a percentage of total loans | 2.13 | % | 3.57 | % | 2.56 | % | 2.13 | % | 2.56 | % | ||||||||||
| Operating efficiency | ||||||||||||||||||||
| Oper. expense as a percent. of total income (5) | 46.35 | % | 42.63 | % | 46.20 | % | 41.67 | % | 43.00 | % | ||||||||||
| Oper. expense as a percent. of av. tot. assets(2)(3)(5) | 3.95 | % | 3.57 | % | 4.04 | % | 3.45 | % | 3.51 | % | ||||||||||
| Average balances (millions of US$) (3) | ||||||||||||||||||||
| Interest earning assets | 17,519.39 | 18,436.55 | 14,980.54 | 23,780.28 | 18,637.68 | |||||||||||||||
| Total Assets | 20,916.29 | 20,624.78 | 16,743.78 | 20,770.53 | 16,147.16 | |||||||||||||||
| Net equity | 1,741.58 | 1,792.43 | 1,639.52 | 1,767.00 | 1,604.30 | |||||||||||||||
(1) Based on Net Income attributed to BAP. Number of shares outstanding of 79.8 million in all periods.
(2) Ratios are annualized.
(3) Averages are determined as the average of period-beginning and period-ending balances.
(4) Net of treasury shares. The total number of shares was of 94.38 million.
(5) Total income includes net interest income, fee income, net gain on foreign exchange transactions and net premiums earned.
Operating expense does not include Other expenses.
(6) For holding's financial institutions.
(7) Risk-weighted assets include market risk.
42
BANCO DE CREDITO DEL PERU AND SUBSIDIARIES
CONSOLIDATED BALANCE SHEET
(In US$ thousands, IFRS)
| As of | Change % | |||||||||||||||||||
| Dec 08 | Sep 08 | Dec 07 | Dec 08/ Dec 07 | Dec 08/ Sep 08 | ||||||||||||||||
| ASSETS | ||||||||||||||||||||
| Cash and due from banks | 3,526,552 | 3,871,243 | 2,765,209 | 27.5 | % | -8.9 | % | |||||||||||||
| Cash and BCRP | 2,620,166 | 3,029,179 | 2,362,339 | 10.9 | % | -13.5 | % | |||||||||||||
| Deposits in other Banks | 875,302 | 721,464 | 393,042 | 122.7 | % | 21.3 | % | |||||||||||||
| Interbanks | 28,662 | 113,749 | 5,000 | 473.2 | % | -74.8 | % | |||||||||||||
| Accrued interest on cash and due from banks | 2,422 | 6,851 | 4,828 | -49.8 | % | -64.6 | % | |||||||||||||
| Marketable securities, net | 36,084 | 32,468 | 102,316 | -64.7 | % | 11.1 | % | |||||||||||||
| Loans | ||||||||||||||||||||
| Current | 10,362,659 | 9,759,601 | 8,164,334 | 26.9 | % | 6.2 | % | |||||||||||||
| Past Due | 82,064 | 76,569 | 60,279 | 36.1 | % | 7.2 | % | |||||||||||||
| Less - Reserve for possible loan losses | (223,161 | ) | (229,071 | ) | (212,060 | ) | 5.2 | % | -2.6 | % | ||||||||||
| Loans, net | 10,221,562 | 9,607,099 | 8,012,553 | 27.6 | % | 6.4 | % | |||||||||||||
| Investment securities available for sale | 3,406,248 | 3,512,873 | 3,377,263 | 0.9 | % | -3.0 | % | |||||||||||||
| Property, plant and equipment, net | 261,967 | 252,008 | 217,049 | 20.7 | % | 4.0 | % | |||||||||||||
| Due from customers acceptances | 232,580 | 217,302 | 35,822 | 549.3 | % | 7.0 | % | |||||||||||||
| Other assets | 822,440 | 781,378 | 661,126 | 24.4 | % | 5.3 | % | |||||||||||||
| Total Assets | 18,507,433 | 18,274,371 | 15,171,338 | 22.0 | % | 1.3 | % | |||||||||||||
| LIABILITIES AND SHAREHOLDERS' EQUITY | ||||||||||||||||||||
| Deposits and obligations | 14,063,720 | 13,340,405 | 11,249,105 | 25.0 | % | 5.4 | % | |||||||||||||
| Demand deposits | 5,891,382 | 3,836,545 | 3,656,678 | 61.1 | % | 53.6 | % | |||||||||||||
| Saving deposits | 2,968,842 | 2,748,290 | 2,381,012 | 24.7 | % | 8.0 | % | |||||||||||||
| Time deposits | 4,090,043 | 5,754,903 | 4,268,233 | -4.2 | % | -28.9 | % | |||||||||||||
| Severance indemnity deposits (CTS) | 1,039,887 | 928,891 | 896,283 | 16.0 | % | 11.9 | % | |||||||||||||
| Interest payable | 73,566 | 71,776 | 46,899 | 56.9 | % | 2.5 | % | |||||||||||||
| Due to banks and correspondents | 1,179,863 | 1,778,253 | 1,459,359 | -19.2 | % | -33.7 | % | |||||||||||||
| Bonds and subordinated debt | 809,148 | 857,270 | 721,056 | 12.2 | % | -5.6 | % | |||||||||||||
| Acceptances outstanding | 232,580 | 217,302 | 35,822 | 549.3 | % | 7.0 | % | |||||||||||||
| Other liabilities | 821,718 | 761,362 | 573,433 | 43.3 | % | 7.9 | % | |||||||||||||
| Total liabilities | 17,107,029 | 16,954,592 | 14,038,775 | 21.9 | % | 0.9 | % | |||||||||||||
| NET SHAREHOLDERS' EQUITY | 1,400,404 | 1,319,779 | 1,132,563 | 23.6 | % | 6.1 | % | |||||||||||||
| Capital stock | 439,474 | 439,474 | 364,706 | 20.5 | % | 0.0 | % | |||||||||||||
| Reserves | 388,062 | 388,062 | 282,189 | 37.5 | % | 0.0 | % | |||||||||||||
| Unrealized Gains and Losses | 34,746 | 43,354 | 57,771 | -39.9 | % | -19.9 | % | |||||||||||||
| Retained Earnings | 114,593 | 111,994 | 96,245 | 19.1 | % | 2.3 | % | |||||||||||||
| Income for the year | 423,529 | 336,895 | 331,652 | 27.7 | % | 25.7 | % | |||||||||||||
| TOTAL LIABILITIES and NET SHAREHOLDERS' EQUITY | 18,507,433 | 18,274,371 | 15,171,338 | 22.0 | % | 1.3 | % | |||||||||||||
| CONTINGENT CREDITS | 6,047,377 | 6,296,226 | 5,011,497 | 20.7 | % | -4.0 | % | |||||||||||||
43
BANCO DE CREDITO DEL PERU AND SUBSIDIARIES
QUARTERLY INCOME STATEMENT
(In US$ thousands, IFRS)
Three months ended | Change % | twelve months ended | Change % | |||||||||||||||||||||||||||||
4Q08 | 3Q08 | 4Q07 | 4Q08/ 4Q07 | 4Q08/ 3Q08 | Dec 08 | Dec 07 | Dec 08/ Dec 07 | |||||||||||||||||||||||||
| Interest income and expense | ||||||||||||||||||||||||||||||||
| Interest and dividend income | 327,007 | 322,921 | 272,204 | 20.1 | % | 1.3 | % | 1,266,009 | 927,954 | 36.4 | % | |||||||||||||||||||||
| Interest expense | (137,684 | ) | (144,633 | ) | (116,640 | ) | 18.0 | % | -4.8 | % | (537,426 | ) | (365,199 | ) | 47.2 | % | ||||||||||||||||
| Net interest and dividend income | 189,323 | 178,288 | 155,565 | 21.7 | % | 6.2 | % | 728,583 | 562,755 | 29.5 | % | |||||||||||||||||||||
| Provision for loan losses | (6,428 | ) | (17,616 | ) | (11,089 | ) | -42.0 | % | -63.5 | % | (51,275 | ) | (33,074 | ) | 55.0 | % | ||||||||||||||||
| Non financial income | ||||||||||||||||||||||||||||||||
| Banking services commissions | 84,826 | 87,042 | 76,708 | 10.6 | % | -2.5 | % | 336,844 | 281,310 | 19.7 | % | |||||||||||||||||||||
| Net gain on foreign exchange transactions | 33,175 | 24,497 | 21,497 | 54.3 | % | 35.4 | % | 109,032 | 59,739 | 82.5 | % | |||||||||||||||||||||
| Net gain on sales of securities | 15,325 | (3,128 | ) | 2,661 | 476.0 | % | -589.9 | % | 38,574 | 20,993 | 83.7 | % | ||||||||||||||||||||
| Other | 8,107 | 4,897 | 2,592 | 212.7 | % | 65.5 | % | 17,202 | 8,487 | 102.7 | % | |||||||||||||||||||||
| Total fees and income from services, net | 141,433 | 113,308 | 103,458 | 36.7 | % | 24.8 | % | 501,652 | 370,529 | 35.4 | % | |||||||||||||||||||||
| Operating expenses | ||||||||||||||||||||||||||||||||
| Salaries and employees benefits | (88,805 | ) | (83,496 | ) | (75,147 | ) | 18.2 | % | 6.4 | % | (314,725 | ) | (242,983 | ) | 29.5 | % | ||||||||||||||||
| Administrative expenses | (74,407 | ) | (56,266 | ) | (59,234 | ) | 25.6 | % | 32.2 | % | (229,862 | ) | (182,105 | ) | 26.2 | % | ||||||||||||||||
| Depreciation and amortization | (12,740 | ) | (11,800 | ) | (10,000 | ) | 27.4 | % | 8.0 | % | (45,882 | ) | (38,446 | ) | 19.3 | % | ||||||||||||||||
| Other | 3,453 | (11,915 | ) | (7,485 | ) | -146.1 | % | -129.0 | % | (29,538 | ) | (32,891 | ) | -10.2 | % | |||||||||||||||||
| Total operating expenses | (172,499 | ) | (163,477 | ) | (151,866 | ) | 13.6 | % | 5.5 | % | (620,007 | ) | (496,425 | ) | 24.9 | % | ||||||||||||||||
| Income before translation results,workers' profit sharing and income taxes | 151,828 | 110,503 | 96,067 | 58.0 | % | 37.4 | % | 558,953 | 403,785 | 38.4 | % | |||||||||||||||||||||
| Translation result | (28,346 | ) | 8,702 | 15,253 | -285.8 | % | -425.7 | % | (12,244 | ) | 29,561 | -141.4 | % | |||||||||||||||||||
| Workers’ profit sharing | (4,708 | ) | (2,947 | ) | (1,813 | ) | 159.6 | % | 59.7 | % | (15,201 | ) | (11,904 | ) | 27.7 | % | ||||||||||||||||
| Income taxes | (32,143 | ) | (23,176 | ) | (23,310 | ) | 37.9 | % | 38.7 | % | (107,979 | ) | (89,790 | ) | 20.3 | % | ||||||||||||||||
| Net income | 86,631 | 93,082 | 86,197 | 0.5 | % | -6.9 | % | 423,529 | 331,652 | 27.7 | % | |||||||||||||||||||||
44
BANCO DE CREDITO DEL PERU AND SUBSIDIARIES
SELECTED FINANCIAL INDICATORS
| Three months ended | Twelve months ended | |||||||||||||||||||
| 4Q08 | 3Q08 | 4Q07 | Dec-08 | Dec-07 | ||||||||||||||||
| Profitability | ||||||||||||||||||||
| Net income per common share (US$ per share)(1) | 0.057 | 0.062 | 0.067 | 0.281 | 0.258 | |||||||||||||||
| Net interest margin on interest earning assets (2) | 4.55 | % | 4.30 | % | 4.80 | % | 4.54 | % | 4.90 | % | ||||||||||
| Return on average total assets (2)(3) | 1.88 | % | 2.05 | % | 2.43 | % | 2.35 | % | 2.53 | % | ||||||||||
| Return on average shareholders' equity (2)(3) | 25.48 | % | 28.93 | % | 31.67 | % | 32.77 | % | 32.97 | % | ||||||||||
| No. of outstanding shares (millions) | 1,508.29 | 1,508.29 | 1,286.53 | 1,508.29 | 1,286.53 | |||||||||||||||
| Quality of loan portfolio | ||||||||||||||||||||
| Past due loans as a percentage of total loans | 0.79 | % | 0.78 | % | 0.73 | % | 0.79 | % | 0.73 | % | ||||||||||
| Reserves for loan losses as a percentage of total past due loans | 271.93 | % | 299.17 | % | 351.80 | % | 271.93 | % | 351.80 | % | ||||||||||
| Reserves for loan losses as a percentage of total loans | 2.14 | % | 2.33 | % | 2.58 | % | 2.14 | % | 2.58 | % | ||||||||||
| Operating efficiency | ||||||||||||||||||||
| Oper. expense as a percent. of total income (4) | 57.25 | % | 52.29 | % | 56.89 | % | 50.28 | % | 51.29 | % | ||||||||||
| Oper. expense as a percent. of av. tot. assets(2)(3)(4) | 3.83 | % | 3.35 | % | 4.07 | % | 3.28 | % | 3.53 | % | ||||||||||
| Capital adequacy | ||||||||||||||||||||
| Total Regulatory Capital (US$Mn) | 1,303.2 | 1,277.2 | 1,053.7 | 1,303.2 | 1,053.7 | |||||||||||||||
| "Tier I" Capital (US$Mn) | 1,020.0 | 982.0 | 759.2 | 1,020.0 | 759.2 | |||||||||||||||
| Regulatory capital / risk-weighted assets (5) | 11.5 | % | 12.2 | % | 11.8 | % | 11.5 | % | 11.8 | % | ||||||||||
| Average balances (millions of US$) (3) | ||||||||||||||||||||
| Interest earning assets | 16,661.2 | 16,568.8 | 12,966.8 | 16,064.5 | 11,474.1 | |||||||||||||||
| Total Assets | 18,390.9 | 18,123.8 | 14,200.3 | 18,013.6 | 13,131.8 | |||||||||||||||
| Net equity | 1,360.1 | 1,287.0 | 1,088.8 | 1,292.5 | 1,005.8 | |||||||||||||||
(1) Shares outstanding of 1,287 million is used for all periods since shares have been issued only for capitalization of profits and inflation adjustment.
(2) Ratios are annualized.
(3) Averages are determined as the average of period-beginning and period-ending balances.
(4) Total income includes net interest income, fee income and net gain on foreign exchange transactions. Operating expense includes personnel expenses, administrative expenses and depreciation and amortization
(5) Risk-weighted assets include market risk assets
45
EL PACIFICO-PERUANO SUIZA Y SUBSIDIARIAS
Chart 8
(in thousand dollars)
| Balance to and for the period of three month ending | Twelve months ended | |||||||||||||||||||
| Dec 08 | Sep 08 | Dec 07 | Dec 08 | Dec 07 | ||||||||||||||||
| 4Q08 | 3Q08 | 4Q07 | ||||||||||||||||||
| Results | ||||||||||||||||||||
| Total premiums | 152,497 | 148,334 | 128,225 | 587,568 | 465,081 | |||||||||||||||
| Ceded premiums | 34,518 | 25,361 | 24,050 | 111,194 | 95,215 | |||||||||||||||
| Ajustment of reserves | 10,130 | 15,973 | 20,098 | 70,645 | 62,594 | |||||||||||||||
| Earned net premiums | 107,849 | 107,001 | 84,076 | 405,730 | 307,272 | |||||||||||||||
| Direct claims | 95,714 | 104,371 | 97,998 | 406,485 | 325,302 | |||||||||||||||
| Ceded claims | 10,954 | 16,731 | 29,108 | 64,574 | 86,702 | |||||||||||||||
| Net claims | 84,760 | 87,640 | 68,891 | 341,911 | 238,600 | |||||||||||||||
| Direct commissions | 18,066 | 24,966 | 9,296 | 65,546 | 36,850 | |||||||||||||||
| Commissions Received | 2,050 | 1,738 | 918 | 8,730 | 5,558 | |||||||||||||||
| Net commissions | 16,016 | 23,228 | 8,378 | 56,816 | 31,291 | |||||||||||||||
| Technical expenses | 5,772 | (929 | ) | 9,237 | 24,798 | 30,534 | ||||||||||||||
| Technical results | 2,618 | 2,503 | 2,960 | 10,130 | 8,605 | |||||||||||||||
| Net technical expenses | 3,154 | (3,432 | ) | 6,277 | 14,668 | 21,929 | ||||||||||||||
| Technical results | 3,920 | (436 | ) | 530 | (7,664 | ) | 15,452 | |||||||||||||
| Financial Income | 18,273 | 17,128 | 14,957 | 70,432 | 56,464 | |||||||||||||||
| Gains on sale of Real State and Securities | (14,210 | ) | 6,738 | 2,161 | (628 | ) | 19,871 | |||||||||||||
| Renting ( net of expenses) | 751 | 720 | 681 | 2,943 | 2,700 | |||||||||||||||
| (-) Financial expenses | 523 | 824 | 216 | 2,313 | 2,204 | |||||||||||||||
| Financial income , net | 4,291 | 23,762 | 17,583 | 70,435 | 76,831 | |||||||||||||||
| Salaries and benefits | 10,953 | 10,190 | 9,469 | 42,757 | 37,791 | |||||||||||||||
| Administrative expenses | 8,685 | 10,776 | 8,457 | 37,598 | 34,693 | |||||||||||||||
| Third party services | 3,668 | 4,515 | 3,666 | 16,249 | 15,073 | |||||||||||||||
| Sundry management expenses | 1,549 | 1,756 | 1,625 | 7,019 | 6,751 | |||||||||||||||
| Provisions | 1,237 | 1,230 | 1,156 | 4,921 | 4,053 | |||||||||||||||
| Taxes | 1,231 | 1,358 | 1,118 | 4,848 | 4,105 | |||||||||||||||
| Other expenses | 1,000 | 1,917 | 892 | 4,561 | 4,711 | |||||||||||||||
| General Expenses | 19,637 | 20,966 | 17,925 | 80,354 | 72,485 | |||||||||||||||
| Other income | 1,352 | 90 | 866 | 2,261 | 2,572 | |||||||||||||||
| Translation results | (2,669 | ) | (154 | ) | 1,779 | (3,402 | ) | 3,941 | ||||||||||||
| Employee participation and income tax | (3,630 | ) | (1,726 | ) | (72 | ) | (9,182 | ) | 4,331 | |||||||||||
| Income before Minority Interest | (9,115 | ) | 4,021 | 2,905 | (9,543 | ) | 21,979 | |||||||||||||
| Minority interest | 709 | 2,800 | 2,054 | 5,492 | 9,522 | |||||||||||||||
| Net income | (9,824 | ) | 1,221 | 851 | (15,035 | ) | 12,457 | |||||||||||||
| Balance (end of period) | ||||||||||||||||||||
| Total Assets | 1,308,096 | 1,303,089 | 1,197,943 | 1,308,096 | 1,197,943 | |||||||||||||||
| Investment on Securities and Real State (1) | 822,297 | 853,733 | 821,278 | 822,297 | 821,278 | |||||||||||||||
| Technical Reserves | 968,499 | 963,148 | 817,510 | 968,499 | 817,510 | |||||||||||||||
| Net Equity | 146,255 | 152,645 | 206,103 | 146,255 | 206,103 | |||||||||||||||
| Ratios | ||||||||||||||||||||
| Ceded Premiums / Total Premiums | 22.6 | % | 17.1 | % | 18.8 | % | 18.9 | % | 20.5 | % | ||||||||||
| Net claims / Earned net premiums | 78.6 | % | 81.9 | % | 81.9 | % | 84.3 | % | 77.7 | % | ||||||||||
| Commissions + technical expenses , net / Earnend net premiums | 17.8 | % | 18.5 | % | 17.4 | % | 17.6 | % | 17.3 | % | ||||||||||
| technical results / Earned net premiums | 3.6 | % | -0.4 | % | 0.6 | % | -1.9 | % | 5.0 | % | ||||||||||
| General Expenses / Earned net premiums | 18.2 | % | 19.6 | % | 21.3 | % | 19.8 | % | 23.6 | % | ||||||||||
| Return on Equity (2)(3) | -23.8 | % | 2.9 | % | 1.7 | % | -10.3 | % | 6.0 | % | ||||||||||
| Return on Total Premiums | -6.4 | % | 0.8 | % | 0.7 | % | -2.6 | % | 2.7 | % | ||||||||||
| Net Equity / Total Assets | 11.2 | % | 11.7 | % | 17.2 | % | 11.2 | % | 17.2 | % | ||||||||||
| Increase in Technical Reserves | 8.6 | % | 13.0 | % | 19.3 | % | 14.8 | % | 16.9 | % | ||||||||||
| General Expenses / Assets (2)(3) | 6.2 | % | 6.7 | % | 6.3 | % | 6.1 | % | 6.1 | % | ||||||||||
| Comibined Ratio of PPS + PS (4) | 112.3 | % | 117.4 | % | 120.1 | % | 118.4 | % | 116.6 | % | ||||||||||
| Net Claims / Earned net premiums | 82.6 | % | 86.9 | % | 87.2 | % | 88.5 | % | 81.1 | % | ||||||||||
| General Expenses and Commissions / Earned net premiums | 29.7 | % | 30.5 | % | 32.9 | % | 29.9 | % | 35.5 | % | ||||||||||
(1)Real State Investment were excluded
(2) Annualized
(3) Average are determined as the average of period-beggining and period ending
(4) Without consolidated adjustments
46
SIGNATURE
Pursuant to the requirements of the Securities Exchange Act of 1934, the registrant has duly caused this report to be signed on its behalf by the undersigned, thereunto duly authorized.
Date: February 9, 2009
| CREDICORP LTD. | ||
| By: | /s/ Guillermo Castillo | |
Guillermo Castillo Authorized Representative | ||
FORWARD-LOOKING STATEMENTS
This press release may contain forward-looking statements. These statements are statements that are not historical facts, and are based on management's current view and estimates of future economic circumstances, industry conditions, company performance and financial results. The words "anticipates", "believes", "estimates", "expects", "plans" and similar expressions, as they relate to the company, are intended to identify forward-looking statements. Statements regarding the declaration or payment of dividends, the implementation of principal operating and financing strategies and capital expenditure plans, the direction of future operations and the factors or trends affecting financial condition, liquidity or results of operations are examples of forward-looking statements. Such statements reflect the current views of management and are subject to a number of risks and uncertainties. There is no guarantee that the expected events, trends or results will actually occur. The statements are based on many assumptions and factors, including general economic and market conditions, industry conditions, and operating factors. Any changes in such assumptions or factors could cause actual results to differ materially from current expectations.