UNITED STATES SECURITIES AND EXCHANGE COMMISSIONWASHINGTON, D.C. 20549
FORM 20-F
| ¨ | REGISTRATION STATEMENT PURSUANT TO SECTION 12(b) OR (g) OF THE SECURITIES EXCHANGE ACT OF 1934 |
OR
| x | ANNUAL REPORT PURSUANT TO SECTION 13 OR 15(d) OF THE SECURITIES EXCHANGE ACT OF 1934 |
For the fiscal year ended December 31, 2008
OR
| ¨ | TRANSITION REPORT PURSUANT TO SECTION 13 OR 15(d) OF THE SECURITIES EXCHANGE ACT OF 1934 |
OR
| ¨ | SHELL COMPANY REPORT PURSUANT TO SECTION 13 OR 15 (d) OF THE SECURITIES EXCHANGE ACT OF 1934 |
Date of event requiring this shell company report ______________
For the transition period from to
Commission file number 1-14014
CREDICORP LTD.
(Exact name of registrant as specified in its
charter)
BERMUDA
(Jurisdiction of incorporation or organization)
Of our subsidiary
Banco de Crédito del Perú:
Calle Centenario 156
La Molina
Lima 12, Perú
(Address of principal executive offices)
__________________________________________________________
Securities registered or to be registered pursuant to Section 12(b) of the Act.
| Title of each class | Name of each exchange on which registered |
| Common Shares, par value $5.00 per share | New York Stock Exchange |
Securities registered or to be registered pursuant to Section 12(g) of the Act. None
Securities for which there is a reporting obligation pursuant to Section 15(d) of the Act. None
Indicate the number of outstanding shares of each of the issuer’s classes of capital or common stock as of the close of the period covered by the annual report.
Common Shares, par value $5.00 per share 94,382,317
Indicate by check mark if the registrant is a well-known seasoned issuer, as defined in Rule 405 of the Securities Act.
Yes x No ¨
If this report is an annual or transition report, indicate by check mark if the registrant is not required to file reports pursuant to Section 13 or 15(d) of the Securities Exchange Act of 1934.
Yes ¨ No x
Indicate by check mark whether the registrant (1) has filed all reports required to be filed by Section 13 or 15(d) of the Securities Exchange Act of 1934 during the preceding 12 months (or for such shorter period that the registrant was required to file such reports), and (2) has been subject to such filing requirements for the past 90 days.
Yes x No ¨
Indicate by check mark whether the registrant is a large accelerated filer, an accelerated filer, or a non-accelerated filer. See definition of “accelerated filer and large accelerated filer” in Rule 12b-2 of the Exchange Act.
Large accelerated filer x Accelerated filer ¨ Non-accelerated filer ¨
Indicate by check mark which financial statement item the registrant has elected to follow.
Item 17 ¨ Item 18 x
If this is an annual report, indicate by check mark whether the registrant is a shell company (as defined in Rule 12b-2 of the Exchange Act).
Yes ¨ No x
TABLE OF CONTENTS
| PRESENTATION OF FINANCIAL INFORMATION | 1 |
| CAUTIONARY STATEMENT WITH RESPECT TO FORWARD-LOOKING STATEMENTS | 2 |
| | | |
| PART I | | |
| | | |
| ITEM 1. | IDENTITY OF DIRECTORS, SENIOR MANAGEMENT AND ADVISERS | 3 |
| ITEM 2. | OFFER STATISTICS AND EXPECTED TIMETABLE | 3 |
| ITEM 3. | KEY INFORMATION | 3 |
| ITEM 4. | INFORMATION ON THE COMPANY | 12 |
| ITEM 4A. | UNRESOLVED STAFF COMMENTS | 93 |
| ITEM 5. | OPERATING AND FINANCIAL REVIEW AND PROSPECTS | 93 |
| ITEM 6. | DIRECTORS, SENIOR MANAGEMENT AND EMPLOYEES | 117 |
| ITEM 7. | MAJOR SHAREHOLDERS AND RELATED PARTY TRANSACTIONS | 123 |
| ITEM 8. | FINANCIAL INFORMATION | 125 |
| ITEM 9. | THE OFFER AND LISTING | 126 |
| ITEM 10. | ADDITIONAL INFORMATION | 130 |
| ITEM 11. | QUANTITATIVE AND QUALITATIVE DISCLOSURES ABOUT MARKET RISK | 132 |
| ITEM 12. | DESCRIPTION OF SECURITIES OTHER THAN EQUITY SECURITIES | 142 |
| ITEM 13. | DEFAULTS, DIVIDEND ARREARAGES AND DELINQUENCIES | 142 |
| ITEM 14. | MATERIAL MODIFICATIONS TO THE RIGHTS OF SECURITY HOLDERS AND USE OF PROCEEDS | 142 |
| ITEM 15. | CONTROLS AND PROCEDURES | 142 |
| ITEM 16A. | AUDIT COMMITTEE FINANCIAL EXPERT | 146 |
| ITEM 16B. | CODE OF ETHICS | 146 |
| ITEM 16C. | PRINCIPAL ACCOUNTANT FEES AND SERVICES | 146 |
| ITEM 16D. | EXEMPTIONS FROM THE LISTING STANDARDS FOR AUDIT COMMITTEES | 147 |
| ITEM 16E. | PURCHASES OF EQUITY SECURITIES BY THE ISSUER AND AFFILIATED PURCHASERS | 148 |
| ITEM 16F. | CHANGE IN REGISTRANT’S CERTIFYING ACCOUNTANT | 148 |
| ITEM 16G. | CORPORATE GOVERNANCE | 148 |
| ITEM 17. | FINANCIAL STATEMENTS | 152 |
| ITEM 18. | FINANCIAL STATEMENTS | 152 |
| ITEM 19. | EXHIBITS | 153 |
| CERTIFICATIONS PURSUANT TO SECTION 302 OF THE U.S. SARBANES-OXLEY ACT OF 2002 | |
| CERTIFICATIONS PURSUANT TO SECTION 302 OF THE U.S. SARBANES-OXLEY ACT OF 2002 | |
PRESENTATION OF FINANCIAL INFORMATION
Unless otherwise specified or the context otherwise requires, references in this Form 20-F (also referred to as the Annual Report), to “$,” “US$,” “Dollars,” “U.S. Dollars,” are to United States Dollars, and references to “S/.,” “Nuevo Sol” or “Nuevos Soles” are to Peruvian Nuevos Soles and references to “foreign currency” are to U.S. Dollars. Each Nuevo Sol is divided into 100 céntimos (cents).
Credicorp Ltd. is a Bermuda limited liability company (and is referred to in this Annual report as Credicorp, we, or us, and means either Credicorp as a separate entity or as an entity together with our consolidated subsidiaries as the context may require). We maintains our financial books and records in U.S. Dollars and present our financial statements in accordance with International Financial Reporting Standards (IFRS), as issued by the International Accounting Standards Board (IASB). IFRS differ in certain respects from United States Generally Accepted Accounting Principles (U.S. GAAP).
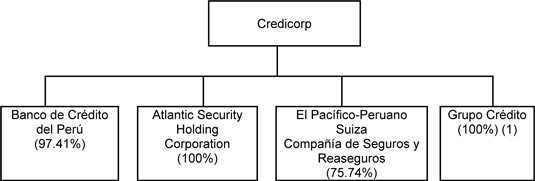
We operate primarily through our four principal subsidiaries, Banco de Crédito del Perú (which together with its consolidated subsidiaries is referred to as BCP), Atlantic Security Holding Corporation (which together with its consolidated subsidiaries is referred to as ASHC), El Pacífico-Peruano Suiza Compañía de Seguros y Reaseguros (which together with its consolidated subsidiaries is referred to as Pacífico Peruano Suiza or PPS) and Grupo Crédito S.A. (which together with its consolidated subsidiaries is referred to as Grupo Crédito). BCP’s activities include commercial banking, investment banking and retail banking. As of and for the year ended December 31, 2008, BCP accounted for 75.1% of our total revenues, 87.3% of our total assets, 117.9% of our net income and 80.6% of our net equity. Unless otherwise specified, the individual financial information for BCP, ASHC, PPS and Grupo Crédito included in this Annual Report has been derived from the audited consolidated financial statements of each such entity. See “Item 3. Key Information—(A) Selected Financial Data” and “Item 4. Information on the Company—(A) History and Development of the Company.”
“Item 3. Key Information—(A) Selected Financial Data” contains key information related to our performance. This information was obtained mainly from our consolidated financial statements as of December 31, 2004, 2005, 2006, 2007 and 2008.
Our management’s criteria on foreign currency translation for the purpose of preparing the Credicorp Consolidated Financial Statements is described in “Item 5. Operating and Financial Review and Prospects—(A) Operating Results—(1) Critical Accounting Policies—Foreign Currency Translation.”
Some of our subsidiaries maintain their operations and balances in Nuevo Soles. As a result, this Annual Report contains certain Nuevo Sol amounts translated into U.S. Dollars which is solely for the convenience of the reader. You should not construe any of these translations as representations that the Nuevo Sol amounts actually represent such equivalent U.S. Dollar amounts or could be converted into U.S. Dollars at the rate indicated as of the dates mentioned herein, or at all. Unless otherwise indicated, these U.S. Dollar amounts have been translated from Nuevos Soles at an exchange rate of S/.3.140 = US$1.00, which is the December 31, 2008 exchange rate set by the Peruvian Superintendencia de Banca, Seguros y AFP (the Superintendency of Banks, Insurance and Pension Funds, or the SBS). The average of the bid and offered free market exchange rates published by the SBS for June 25, 2009 was S/.3.024 per US$1.00. Translating amounts expressed in Nuevos Soles on a specified date (at the prevailing exchange rate on that date) may result in the presentation of U.S. Dollar amounts that are different from the U.S. Dollar amounts that would have been obtained by translating Nuevos Soles on another specified date (at the prevailing exchange rate on that different specified date). See also “Item 3. Key Information—(A) Selected Financial Data—Exchange Rates” for information regarding the average rates of exchange between the Nuevo Sol and the U.S. Dollar for the periods specified therein. The Federal Reserve Bank of New York does not publish a noon buying rate for Nuevos Soles.
CAUTIONARY STATEMENT WITH RESPECT TO
FORWARD-LOOKING STATEMENTS
Certain statements contained in this Annual Report are not historical facts, including, without limitation, certain statements made in the sections entitled “Item 3. Key Information,” “Item 4. Information on the Company,” “Item 5. Operating and Financial Review and Prospects” and “Item 11. Quantitative and Qualitative Disclosures about Market Risk,” which are forward-looking statements within the meaning of Section 27A of the U.S. Securities Act of 1933 and Section 21E of the U.S. Securities Exchange Act of 1934 (or the Exchange Act). These forward-looking statements are based on our management’s current views and assumptions and involve known and unknown risks and uncertainties that could cause actual results, performance or events to differ materially from those expressed or implied in the forward-looking statements. Therefore, actual results, performance or events may be materially different from those in the forward-looking statements due to, without limitation:
| | · | general economic conditions, including in particular economic conditions in Peru; |
| | · | performance of financial markets, including emerging markets; |
| | · | the frequency and severity of insured loss events; |
| | · | currency exchange rates, including the Nuevo Sol/U.S. Dollar exchange rate; |
| | · | increasing levels of competition in Peru and other emerging markets; |
| | · | changes in laws and regulations; |
| | · | changes in the policies of central banks and/or foreign governments; and |
| | · | general competitive factors, in each case on a global, regional and/or national basis. |
See “Item 3. Key Information—(D) Risk Factors,” and “Item 5. Operating and Financial Review and Prospects.”
We are not under any obligation to, and we expressly disclaims any such obligation to, update or alter our forward-looking statements, whether as a result of new information, future events or otherwise.
PART I
ITEM 1. | IDENTITY OF DIRECTORS, SENIOR MANAGEMENT AND ADVISERS |
Not applicable.
ITEM 2. | OFFER STATISTICS AND EXPECTED TIMETABLE |
Not applicable.
(A) | Selected Financial Data |
The following table presents summary of our consolidated financial information at the dates and for the periods indicated. This selected financial data is presented in U.S. Dollars. You should read this information in conjunction with, and qualify this information in its entirety by reference to, the Credicorp Consolidated Financial Statements, also presented in U.S. Dollars.
The summary of our consolidated financial data as of, and for the years ended, December 31, 2004, 2005, 2006, 2007 and 2008 is derived from the Credicorp Consolidated Financial Statements audited by Medina, Zaldívar, Paredes & Asociados S.C.R.L, member of Ernst & Young Global, independent registered public accountants.
The report of Medina, Zaldívar, Paredes & Asociados S.C.R.L on the Credicorp Consolidated Financial Statements as of December 31, 2007 and 2008 and for the years ended December 31, 2006, 2007 and 2008 appears elsewhere in this Annual Report.
SELECTED FINANCIAL DATA
| | | Year ended December 31, | |
| | | 2004 | | | 2005 | | | 2006 | | | 2007 | | | 2008 | |
| | | (U.S. Dollars in thousands, except percentages, ratios, and per common share data) | |
| INCOME STATEMENT DATA: | | | | | | | | | | | | | | | |
| IFRS: | | | | | | | | | | | | | | | |
| Interest income | | US$ | 542,842 | | | US$ | 612,432 | | | US$ | 782,002 | | | US$ | 1,065,974 | | | US$ | 1,400,334 | |
| Interest expense | | | (160,298 | ) | | | (173,159 | ) | | | (283,478 | ) | | | (432,000 | ) | | | (577,411 | ) |
| Net Interest income | | | 382,544 | | | | 439,273 | | | | 498,524 | | | | 633,974 | | | | 822,923 | |
| Provision for loan losses (1) | | | (16,131 | ) | | | 6,356 | | | | 4,243 | | | | (28,439 | ) | | | (48,760 | ) |
| Net interest income after provision for loan losses | | | 366,413 | | | | 445,629 | | | | 502,767 | | | | 605,535 | | | | 774,163 | |
| Fees and commissions from banking services | | | 201,474 | | | | 206,163 | | | | 243,778 | | | | 324,761 | | | | 394,247 | |
| Net gains (loss) from sales of securities | | | 10,135 | | | | 8,965 | | | | 27,281 | | | | 46,376 | | | | 51,936 | |
| Net gains on foreign exchange transactions | | | 24,165 | | | | 29,286 | | | | 41,638 | | | | 61,778 | | | | 108,709 | |
| Net premiums earned | | | 192,672 | | | | 218,955 | | | | 251,261 | | | | 297,272 | | | | 393,903 | |
| Other income | | | 8,105 | | | | 21,571 | | | | 26,197 | | | | 90,022 | | | | 37,672 | |
| Claims on insurance activities | | | (154,325 | ) | | | (175,500 | ) | | | (186,522 | ) | | | (238,600 | ) | | | (341,910 | ) |
| Operating expenses | | | (459,928 | ) | | | (477,073 | ) | | | (585,058 | ) | | | (747,089 | ) | | | (922,299 | ) |
| Merger costs | | | (3,742 | ) | | | 0 | | | | (5,706 | ) | | | 0 | | | | 0 | |
| Income before translation result and income tax | | | 184,969 | | | | 277,996 | | | | 315,636 | | | | 440,055 | | | | 496,421 | |
| Translation result | | | 2,040 | | | | (9,597 | ) | | | 15,216 | | | | 34,627 | | | | (17,650 | ) |
| Income tax | | | (45,497 | ) | | | (73,546 | ) | | | (83,587 | ) | | | (102,287 | ) | | | (109,508 | ) |
| Net income | | | 141,512 | | | | 194,853 | | | | 247,265 | | | | 372,395 | | | | 369,263 | |
Attributable to: | | | | | | | | | | | | | | | | | | | | |
| Net income attributable to Credicorp’s equity holders | | | 130,747 | | | | 181,885 | | | | 230,013 | | | | 350,735 | | | | 357,756 | |
| Minority interest | | | 10,765 | | | | 12,968 | | | | 17,252 | | | | 21,660 | | | | 11,507 | |
| | | | | | | | | | | | | | | | | | | | | |
| Net income per common share attributable to Credicorp´s equity holders (2) | | | 1.64 | | | | 2.28 | | | | 2.88 | | | | 4.40 | | | | 4.49 | |
| Cash dividends declared per common share | | | 0.80 | | | | 1.10 | | | | 1.30 | | | | 1.50 | | | | 1.50 | |
| BALANCE SHEET DATA: | | | | | | | | | | | | | | | | | | | | |
| IFRS: | | | | | | | | | | | | | | | | | | | | |
| Total assets | | | 9,087,560 | | | | 11,036,075 | | | | 12,881,529 | | | | 17,705,898 | | | | 20,821,069 | |
| Total loans (3) | | | 4,559,018 | | | | 4,972,975 | | | | 5,877,361 | | | | 8,183,845 | | | | 10,456,284 | |
| Reserves for loan losses (1) | | | (271,873 | ) | | | (218,636 | ) | | | (210,586 | ) | | | (229,700 | ) | | | (248,063 | ) |
| Total deposits | | | 6,270,972 | | | | 7,067,754 | | | | 8,799,134 | | | | 11,299,671 | | | | 13,877,028 | |
| Equity attributable to Credicorp’s equity holders | | | 1,065,197 | | | | 1,190,440 | | | | 1,396,822 | | | | 1,676,009 | | | | 1,689,172 | |
| Minority interest | | | 85,253 | | | | 101,515 | | | | 136,946 | | | | 139,264 | | | | 106,933 | |
| Net Equity | | | 1,150,450 | | | | 1,291,955 | | | | 1,533,768 | | | | 1,815,273 | | | | 1,796,105 | |
| SELECTED RATIOS | | | | | | | | | | | | | | | | | | | | |
| IFRS: | | | | | | | | | | | | | | | | | | | | |
| Net interest margin (4) | | | 4.85 | % | | | 4.90 | % | | | 4.64 | % | | | 4.50 | % | | | 4.47 | % |
| Return on average total assets (5) | | | 1.50 | % | | | 1.81 | % | | | 1.92 | % | | | 2.29 | % | | | 1.86 | % |
| Return on average equity attributable to Credicorp’s equity holders (6) | | | 13.55 | % | | | 16.39 | % | | | 18.44 | % | | | 22.67 | % | | | 20.21 | % |
| Operating expenses as a percentage of net interest and non-interest income (7) | | | 49.18 | % | | | 46.25 | % | | | 50.26 | % | | | 50.62 | % | | | 40.23 | % |
| | | Year ended December 31, | |
| | | 2004 | | | 2005 | | | 2006 | | | 2007 | | | 2008 | |
| | | (U.S. Dollars in thousands, except percentages, ratios, and per common share data) |
| Operating expenses as a percentage of average assets | | | 5.28 | % | | | 4.74 | % | | | 4.89 | % | | | 4.88 | % | | | 4.79 | % |
| Equity attributable to Credicorp’s equity holders as a percentage of period end total assets | | | 11.72 | % | | | 10.79 | % | | | 10.84 | % | | | 9.47 | % | | | 8.11 | % |
| Regulatory capital as a percentage of risk weighted assets (8) | | | 14.04 | % | | | 13.10 | % | | | 11.98 | % | | | 12.80 | % | | | 12.33 | % |
| Total past-due loan amounts as a percentage of total loans (9) | | | 3.49 | % | | | 1.93 | % | | | 1.31 | % | | | 0.75 | % | | | 0.79 | % |
| Reserves for loan losses as a percentage of total loans | | | 5.96 | % | | | 3.97 | % | | | 3.24 | % | | | 2.58 | % | | | 2.15 | % |
| Reserves for loan losses as a percentage of total loans and other contingent credits (10) | | | 4.99 | % | | | 3.19 | % | | | 2.59 | % | | | 2.17 | % | | | 1.84 | % |
| Reserves for loan losses as a percentage of total past-due loans (11) | | | 170.93 | % | | | 206.22 | % | | | 247.85 | % | | | 343.68 | % | | | 270.72 | % |
| Reserves for loan losses as a percentage of substandard loans (12) | | | 54.11 | % | | | 65.42 | % | | | 78.24 | % | | | 100.45 | % | | | 112.26 | % |
| (1) | Provision for loan losses and reserve for loan losses include provisions and reserves with respect to total loans and contingent credits, net of write-off recoveries. |
| (2) | We have 100 million authorized common shares. As of December 31, 2008, we had issued 94.4 million common shares, of which 14.6 million are held by ASHC. The per common share data given considers net outstanding shares (common shares net of shares held by BCP, ASHC and PPS) of 79.7 million in 2002 to 2008. See Notes 16 and 25 to the Credicorp Consolidated Financial Statements. |
| (3) | Net of unearned interest, but prior to reserve for loan losses. In addition to loans outstanding, we had contingent loans of US$889.1 million, US$1,220.9 million, US$1,455.4 million, US$1,564.5 million and US$1,755.9 million, as of December 31, 2004, 2005, 2006, 2007 and 2008, respectively. See Note 19 to the Credicorp Consolidated Financial Statements. |
| (4) | Net interest income as a percentage of average interest-earning assets, computed as the average of period-beginning and period-ending balances on a monthly basis. |
| (5) | Net income as a percentage of average total assets, computed as the average of period-beginning and period-ending balances. |
| (6) | Net income as a percentage of average equity attributable to our equity holders, computed as the average of period-beginning and period-ending balances, and calculated on a monthly basis. |
| (7) | Sum of the salaries and employee’s benefits, administrative expenses, depreciation and amortization, as a percentage of the sum of net interest income and non-interest income, less net gains from sales of securities and other income. |
| (8) | Regulatory capital calculated in accordance with guidelines by the Basel Committee on Banking Regulations and Supervisory Practices of International Settlements (or the BIS I Accord) as adopted by the SBS. See “Item 5. Operating and Financial Review and Prospects—(B) Liquidity and Capital Resources—Regulatory Capital and Capital Adequacy Ratios.” |
| (9) | BCP considers loans past due after 90 days for installment loans, which include mortgage loans but exclude consumer loans. ASHC considers past due all overdue loans except for consumer loans, which are considered past due when the scheduled principal and/or interest payments are overdue for more than 90 days. For IFRS 7 disclosure requirements on past-due loans, See Note 29.1 to the Credicorp Consolidated Financial Statements. See “Item 4. Information on the Company—(B) Business Overview—(12) Selected Statistical Information—(iii) Loan Portfolio—Classification of the Loan Portfolio Based on the Borrower’s Payment Performance.” |
| (10) | Other contingent credits primarily consist of guarantees, stand-by letters and letters of credit. See Note 19 to the Credicorp Consolidated Financial Statements. |
| (11) | Reserves for loan and contingent credit losses, as a percentage of all past-due loans, with no reduction for collateral securing such loans. Reserves for loan and contingent credit losses include reserves with respect to total loans and other credits. |
| (12) | Reserves for loan and contingent credit losses as a percentage of loans classified in categories C, D or E. See “Item 4. Information on the Company—(B) Business Overview—(12) Selected Statistical Information—(iii) Loan Portfolio—Classification of Loan Portfolio.” |
Exchange Rates
The following table sets forth the high and low month-end rates and the average and end-of-period rates for the sale of Nuevos Soles for U.S. Dollars for the periods indicated.
| Year ended December 31, | | High (1) | | | Low (1) | | | Average (2) | | | Period-end (3) | |
| | | (Nominal Nuevos Soles per U.S. Dollar) | |
| 2004 | | | 3.500 | | | | 3.283 | | | | 3.410 | | | | 3.283 | |
| 2005 | | | 3.440 | | | | 3.249 | | | | 3.295 | | | | 3.420 | |
| 2006 | | | 3.455 | | | | 3.195 | | | | 3.274 | | | | 3.195 | |
| 2007 | | | 3.197 | | | | 2.998 | | | | 3.125 | | | | 2.998 | |
| 2008 | | | 3.135 | | | | 2.751 | | | | 2.939 | | | | 3.135 | |
Source: Bloomberg
| (1) | Highest and lowest of the 12 month-end exchange rates for each year based on the offered rate. |
| (2) | Average of month-end exchange rates based on the offered rate. |
| (3) | End-of-period exchange rates based on the offered rate. |
The following table sets forth the high and low rates for the sale of Nuevos Soles for U.S. Dollars for the indicated months.
| | | | | | | |
| | | (Nominal Nuevos Soles per U.S. Dollar) | |
| 2008 | | | | | | |
| December | | | 3.142 | | | | 3.081 | |
| 2009 | | | | | | | | |
| January | | | 3.187 | | | | 3.131 | |
| February | | | 3.251 | | | | 3.202 | |
| March | | | 3.259 | | | | 3.107 | |
| April | | | 3.145 | | | | 2.981 | |
| May | | | 3.051 | | | | 2.950 | |
| June (through June 25) | | | 3.024 | | | | 2.967 | |
Source: Bloomberg
(1) Highest and lowest of the daily closing exchange rates for each month based on the offered rate.
The average of the bid and offered free market exchange rates published by the SBS for June 25, 2009 was S/.3.024 per US$1.00.
| (B) | Capitalization and Indebtedness |
Not applicable.
| (C) | Reasons for the Offer and Use of Proceeds |
Not applicable.
Our businesses are affected by many external and other factors in the markets in which we operate. Different risk factors can impact our businesses and the ability to effectively operate our businesses and business strategies. You should consider the risk factors carefully and read them in conjunction with all the information in this document.
Our geographic location exposes us to risk related to Peruvian political and economic conditions.
Most of BCP’s, PPS’s and Prima AFP’s operations and customers are located in Peru. In addition, although ASHC is based outside of Peru, most of its customers are located in Peru. Accordingly, our results of operations and financial conditions will be dependent on the level of economic activity in Peru. Changes in economic or other policies of the Peruvian government (which has exercised and continues to exercise a substantial influence over many aspects of the private sector) could affect our results of operations and financial condition. Similarly, other political or economic developments in Peru, including government-induced effects on inflation, devaluation, and economic growth could affect our operations and financial condition.
For several decades, Peru had a history of political instability that has included military coups and a succession of regimes with differing policies and programs. Past governments have frequently intervened in the nation’s economy and social structure. Among other actions, past governments have imposed controls on prices, exchange rates, local and foreign investment, and international trade. Past governments have also restricted the ability of companies to dismiss employees, expropriated private sector assets and prohibited the payment of profits to foreign investors.
In July 1990, Alberto Fujimori was elected President and implemented a broad-based reform of Peru’s political system and economic and social conditions. The reform was aimed at stabilizing the economy, restructuring the national government (by reducing bureaucracy), privatizing state-owned companies, promoting private investment, eradicating corruption and bribery in the judicial system, developing and strengthening free markets, institutionalizing democratic representation, and enacting programs for the strengthening of basic services related to education, health, housing and infrastructure. After taking office for his third term in July 2000, under extreme protest, President Fujimori was forced to call for general elections due to the outbreak of corruption scandals. Fujimori later resigned in favor of a transitory government.
During 1980s and early 1990s the Sendero Luminoso (Shining Path), and the Movimiento Revolucionario Tupac Amaru (MRTA), terrorist organizations were particularly active in Peru. Although the Shining Path and MRTA were almost de-activated in the 1990s, any resumption of activities by these or other terrorist organizations may adversely affect our operations.
In 2001, Alejandro Toledo became President, ending two years of political turmoil. President Toledo retained, for the most part, the economic policies of the previous government. He focused on promoting private investment, eliminating tax exemptions, and reducing underemployment and unemployment. President Toledo also implemented fiscal austerity programs, among other proposals, in order to stimulate the economy. Despite Peru’s moderate economic growth, the Toledo administration faced public unrest spurred by the high rates of unemployment, underemployment, and poverty.
In the elections held in April 2006, no presidential candidate received the required 50% or more of the votes. As a result, a second round election between the top two presidential candidates, Ollanta Humala Tasso from the Partido Unión por el Peru, or the UPP, and Alan García Pérez of the Partido Alianza Popular Revolucionaria, or APRA, was held on June 4, 2006. Although Alan García Pérez was elected, he has no majority in Congress. President García had previously served as President of Peru from 1985 to 1990, a period which was marked by a severe economic crisis. He is following conservative economic policies and has indicated a desire to avoid the mistakes of his past government. The García administration has followed economic policies similar to those of the Toledo administration, which included achieving sustained economic growth, increasing exports of Peruvian goods, reducing unemployment, underemployment, and poverty, reforming the tax system, fostering private investment, and increasing public investment in education, public health and other social programs, while reducing overall public spending.
The Peruvian government’s economic policies during the last decade have provided the fundamentals to support the positive performance of the economy. As a result, the international financial crisis has not impacted Peru as severely as other countries. In addition, the current government has also implemented a US$3 billion anti-crisis program to alleviate the effects of the crisis. However, while the economic policies of recent Peruvian governments have been relatively stable, we cannot assure you that future governments will maintain favorable economic policies.
Foreign exchange fluctuations and exchange controls may adversely affect our financial condition and results of operations.
Even though the functional currency of our financial statements is U.S. Dollars and our dividends are paid in U.S. Dollars, BCP and PPS, for local statutory purposes, prepare their financial statements and pay dividends in Nuevos Soles. The Peruvian government does not currently impose restrictions on a company’s ability to transfer U.S. Dollars from Peru to other countries, to convert Peruvian currency into U.S. Dollars, or to pay dividends abroad. Nevertheless, Peru has had restrictive exchange controls in the past, and there can be no assurance that the Peruvian government will continue to permit such transfers, payments or conversions without any restrictions. See “Item 10. Additional Information—(D) Exchange Controls.” In addition, depreciation of the Nuevo Sol against the U.S. Dollar would decrease the U.S. Dollar value of any dividends BCP and PPS pay us, which would have a negative impact on our ability to pay dividends to shareholders.
Although Peru’s foreign reserves currently compare favorably with those of many other Latin American countries, we cannot assure you that Peru will be able to maintain adequate foreign reserves to meet its foreign currency-denominated obligations. Similarly, we cannot assure you that Peru will not impose exchange controls should its foreign reserves decline. A decline in Peruvian foreign reserves to inadequate levels, among other economic circumstances, could lead to currency devaluation or a volatility of short-term capital inflows. We have taken steps to manage the gap between our foreign currency-denominated assets and liabilities in several ways, including closely matching the volumes and maturities of our Nuevo Sol-denominated loans against our Nuevo Sol-denominated deposits. Nevertheless, a sudden and significant devaluation of the Nuevo Sol could have a material adverse effect on our financial condition and results of operations. See “Item 11. Quantitative and Qualitative Disclosures about Market Risk—Foreign Exchange Risk.”
Also, a significant group of BCP’s borrowers and PPS’s insureds generate Nuevo Sol revenues from their own clients. Devaluation of the Nuevo Sol against the U.S. Dollar could negatively impact BCP’s and PPS’s clients ability to repay loans or make premium payments. Despite any devaluation, and absent any change in foreign exchange regulations, BCP and PPS would be expected to continue to repay U.S. Dollar-denominated deposits and U.S. Dollar-denominated insurance benefits in U.S. Dollars. Therefore, any significant devaluation of the Nuevo Sol against the U.S. Dollar could have a material adverse effect on our results of operations and financial condition.
It may be difficult to serve process on or enforce judgments against us or our principals residing outside of the United States.
A significant majority of our directors and officers live outside the United States (principally in Peru). All or most of our assets and those of our principals are located outside the United States. As a result, it may not be possible for investors to effect service of process within the United States upon us or our principals to bring forth a civil suit under the United States securities laws in United States courts. We have been advised by our Peruvian counsel that liability under the United States federal securities laws may not be enforceable in original actions in Peruvian courts. Also, judgments of United States courts obtained in actions under the United States federal securities laws may not be enforceable. Similarly, Bermudian counsel advised us that courts in Bermuda may not enforce judgments obtained in other jurisdictions, or entertain actions in Bermuda including judgments predicated upon civil liability provisions of the United States federal securities law, against us or our directors or officers under the securities laws of those jurisdictions.
In addition, our bye-laws, contain a broad waiver by shareholders of any claim or right of action, both individually and on our behalf, against any of our officers or directors. This waiver limits the rights of shareholders to assert claims against our officers and directors for any action taken by an officer or director. It also limits the rights of shareholders to assert claims against officers or any directors for the failure of an officer or director to take any action, in the performance of his or her duties, except with respect to any matter involving any willful negligence, willful default, fraud or dishonesty on the part of the officer or director.
Our ability to pay dividends to shareholders and to pay corporate expenses may be adversely affected by the ability of our subsidiaries to pay dividends to us.
As a holding company, our ability to make dividend payments, if any, and to pay corporate expenses will depend upon the receipt of dividends and other distributions from our operating subsidiaries. Our principal subsidiaries are BCP, PPS, ASHC and Grupo Crédito. If our subsidiaries do not have funds available, or are otherwise restricted from paying us dividends, we may be limited in our ability to pay dividends to shareholders. Currently, there are no restrictions on the ability of BCP, ASHC, PPS or Grupo Crédito to pay dividends abroad. In addition, our right to participate in the distribution of assets of any subsidiary, upon any subsidiary’s liquidation or reorganization (and thus the ability of holders of our securities to benefit indirectly from such distribution), is subject to the prior claims of creditors of that subsidiary, except where we are considered a creditor of the subsidiary. Accordingly, our securities will effectively be subordinated to all existing and future liabilities of our subsidiaries, and holders of our securities should look only to our assets for payments.
A deterioration in the quality of our loan portfolio may adversely affect our results of operations.
Given that a significant percentage of our revenues are related to banking activities, a deterioration of loan quality may have an adverse impact on our financial condition and results of operations. On the one hand, loan portfolio risk associated with lending to certain economic sectors or clients in certain market segments can be mitigated through adequate diversification policies. On the other hand, our pursuit of opportunities in which we can charge higher interest rates, thereby increasing revenues, may reduce diversification of the loan portfolio and expose us to greater credit risk. We believe that significant opportunities exist in middle market and consumer lending in Peru. We also believe that we can, on average, charge higher interest rates on such loans as compared with interest charged on loans in our core corporate banking business, made primarily to clients that operate in industrial and commercial economic sectors.
Accordingly, our strategy includes a greater emphasis on middle market and consumer loans, as well as continued growth of our loan portfolio in general. An increase in the portfolio’s exposure to these areas could be accompanied by greater credit risk. The greater credit risk is not only due to the speed and magnitude of the increase, but also to the shift to lending to the middle market and consumer sectors, which have higher risk profiles compared with loans to large corporate customers. Given the changing composition of our loan portfolio, historical loss experience may not be indicative of future loan loss experience.
Because we are subject to banking regulation and supervision in Peru, Bolivia, the Cayman Islands, Panama and the United States, changes to the regulatory framework in any of these countries could adversely affect our business.
We are mainly subject to extensive supervision and regulation through the SBS’s consolidated supervision regulations, which oversee all of our subsidiaries and offices including those located outside Peru. The SBS and the Banco Central de Reserva, or the Central Bank, supervise and regulate BCP’s operations. Peru’s constitution and the SBS’s statutory charter grant the SBS the authority to oversee and control banks and other financial institutions. The SBS and the Central Bank have general administrative responsibilities over BCP, including designation of capitalization and reserve requirements. In past years, the Central Bank has, on numerous occasions, changed the deposit reserve requirements applicable to Peruvian commercial banks as well as the rate of interest paid on deposit reserves and the amount of deposit reserves on which no interest is payable by the Central Bank. Such changes in the supervision and regulation of BCP may adversely affect our results of operations and financial condition. See “Item 4. Information on the Company—(B) Business Overview—(11) Supervision and Regulation—(ii) BCP.”
We are also regulated by the United States Federal Reserve, which shares regulatory responsibility with the State of Florida Department of Banking and Finance - Office of Financial Regulation. Similarly, we are regulated by other governmental entities in other jurisdictions. In the Cayman Islands, we are subject to the supervision and regulation of the Cayman Islands Monetary Authority, or CIMA, while in Bolivia, we are subject to the supervision of the Superintendency of Banks and Financial Entities and regulations established by the Central Bank of Bolivia. In Panama, we are subject to the supervision of the Superintendency of Banks and the regulatory framework set forth in the Decree Law 9 of February 25, 1998. Changes in the supervision and regulation of our subsidiaries in other countries may adversely affect our results of operations and financial condition.
Changes to insurance regulations in Peru may impact the ability of our insurance subsidiary to underwrite and price risk effectively, and may adversely affect our operating performance and financial condition.
Our insurance business is carried out by our subsidiary PPS. The insurance business is subject to regulation by the SBS. Insurance regulation in Peru is an area of constant change. New legislation or regulations may adversely affect PPS’s ability to underwrite and price risks accurately, which in turn would affect underwriting results and business profitability. PPS is unable to predict whether and to what extent new laws and regulations that would affect its business will be adopted in the future. PPS is also unable to predict the timing of any such adoption and what effects any new laws or regulations would have on its operations, profitability, and financial condition.
Our operating performance and financial condition depend on PPS’s ability to underwrite and set premium rates accurately for a full spectrum of risks. PPS must generate sufficient premiums to offset losses, loss adjustment expenses, and underwriting expenses so it may earn a profit. To price premium rates accurately, PPS must:
| | · | collect and analyze a substantial volume of data; |
| | · | develop, test, and apply appropriate rating formulae; |
| | · | closely monitor changes in trends in a timely fashion; and |
| | · | project both severity and frequency with reasonable accuracy. |
If PPS fails to assess accurately the risks that it assumes or does not accurately estimate its retention, it may fail to establish adequate premium rates. Failure to establish adequate premium rates could reduce income and have a materially adverse effect on its operating results or financial condition. Moreover, there is inherent uncertainty in the process of establishing property and casualty loss reserves. Reserves are estimates based on actuarial and statistical projections at a given point in time of what PPS ultimately expects to pay out on claims and the cost of adjusting those claims, based on the facts and circumstances then known. Factors affecting these projections include, among others, changes in medical costs, repair costs, and regulation. Any negative effect on PPS could have a material adverse effect on our results of operations and financial condition.
We are facing increased competition that may impede our growth.
BCP has experienced increased competition, including increased pressure on margins. This is primarily a result of the presence of the following:
| | · | Highly liquid commercial banks in the market; |
| | · | Local and foreign investment banks with substantial capital, technology, and marketing resources; and |
| | · | Local pension funds that lend to BCP’s corporate customers through participation in those customers’ securities issues. |
Larger Peruvian companies have gained access to new sources of capital, through local and international capital markets, and BCP’s existing and new competitors have increasingly made inroads into the higher margin, middle market, and retail banking sectors. Such increased competition, with entrants who may have greater access to capital at lower costs, has affected BCP’s loan growth as well as reduced the average interest rates that BCP can charge its customers.
Competitors may also appropriate greater resources and be more successful in the development of technologically advanced products and services that may compete directly with BCP’s products and services. Such competition would adversely affect the acceptance of BCP’s products and/or lead to adverse changes in spending and saving habits of BCP’s customer base. If competing entities are successful in developing products and services that are more effective or less costly than the products and services developed by BCP, BCP’s products and services may be unable to compete successfully. Even if BCP’s products and services prove to be more effective than those developed by other entities, such other entities may be more successful in marketing their products and services than BCP because of their greater financial resources, higher sales and marketing capacity, and other factors. BCP may not be able to maintain its market share if it is not able to match its competitors’ loan pricing or keep pace with their development of new products and services. Any negative impact on BCP could have a materially adverse effect on our results of operations and financial condition.
Fluctuation and volatility of capital markets and interest rates may decrease our net income.
We may suffer losses related to the investments by BCP, ASCH, PPS, Grupo Crédito and other subsidiaries in fixed income and equity securities, and to their respective positions in currency markets, because of changes in market prices, defaults, fluctuations in market interest rates or exchange rates or other reasons. A downturn in the capital markets may lead us to register net losses due to the decline in the value of these positions. Additionally, a downturn in the capital markets could lead to negative net revenues from trading positions caused by volatility in prices in the financial markets, even in the absence of a general economic downturn.
Fluctuations in market interest rates, or changes in the relative structure between short-term interest rates and long-term interest rates, could cause a decrease in interest rates charged on interest-earning assets, relative to interest rates paid on interest-bearing liabilities. Such an occurrence could adversely affect our financial condition by causing a decrease in net interest income.
| ITEM 4. | INFORMATION ON THE COMPANY |
| (A) | History and Development of the Company |
We are a limited liability company that was incorporated in Bermuda on October 20, 1995 to act as a holding company, coordinate the policy and administration of our subsidiaries, and engage in investing activities. Our principal activity is to coordinate and manage the business plans of our subsidiaries in an effort to implement universal banking services and develop our insurance business, focusing on Peru and Bolivia along with limited investments in other countries of the region. We conduct our financial services business exclusively through our subsidiaries. Our registered address is Clarendon House, 2 Church Street, Bermuda. The management and administrative office (i.e., principal place of business) in Peru of our subsidiary, Banco de Crédito del Perú, is Calle Centenario 156, La Molina, Lima 12, Peru, and the phone number is 51-1-313-2000.
We are the largest financial services holding company in Peru and are closely identified with our principal subsidiary, BCP, the country’s largest bank and the leading supplier of integrated financial services in Peru. We are engaged principally in commercial banking (including trade finance, corporate finance and leasing services), insurance (including commercial property, transportation and marine hull, automobile, life, health and pension fund underwriting insurance) and investment banking (including brokerage, trust, custody and securitization services, asset management and proprietary trading and investment). As of December 31, 2008, our total assets were US$20.8 billion and our net equity was US$1.8 billion. Our net income attributable to our equity holders in 2007 and 2008 was US$350.7 million and US$357.8 million, respectively. See “Item 3. Key Information—(A) Selected Financial Data” and “Item 5. Operating and Financial Review and Prospects.” The following table gives certain financial information about us by principal business segments as of and for the year ended December 31, 2008 (See Note 26 to the Credicorp Consolidated Financial Statements):
| | | As of and for the Year ended December 31, 2008 | |
| | | | | | | | | | |
| | | (U.S. Dollars in millions) | |
| Commercial Banking | | US$ | 1,797 | | | US$ | 804 | | | US$ | 19,168 | |
| Insurance | | | 469 | | | | 118 | | | | 1,231 | |
| Pension Fund Administration | | | 71 | | | | 0 | | | | 224 | |
| Investment Banking and others | | | 50 | | | | (47 | ) | | | 198 | |
| Credicorp | | US$ | 2,387 | | | US$ | 875 | | | US$ | 20,821 | |
We conduct our commercial banking and investment banking activities primarily through BCP, the largest (in terms of total assets, loans, deposits, net equity and net income) full-service Peruvian commercial bank, and ASHC, a diversified financial services company. We conduct our pension fund business through Prima AFP and our insurance activities through PPS, which is the second largest Peruvian insurance company in terms of premiums, fees and net income. You should note that the term “Peruvian commercial bank,” “Peruvian insurance company” and other similar terms used in this Annual Report do not include the assets, results or operations of any foreign parent company or foreign subsidiary of such Peruvian company.
We were formed in 1995 for the purpose of acquiring, through an exchange offer, the common shares of BCP, ASHC and PPS. Pursuant to this exchange offer, in October 1995 we acquired 90.1% of BCP, 98.2% of ASHC and 75.8% of PPS. We acquired the remaining 1.8% outstanding shares of ASHC in March 1996, pursuant to another exchange offer. See “Item 4. Information on the Company—(C) Organizational Structure.”
In December 1995, we purchased 99.99% of Inversiones Crédito (whose name has changed to Grupo de Crédito), a non-financial entity with assets of US$335.9 million as of December 2008. Grupo de Crédito’s main subsidiary is Prima AFP.
In August 1997, we acquired 39.5% of BCB from BCP for US$9.2 million. In July 1998, we acquired 94.86% of Banco de La Paz, a Bolivian bank with US$52.1 million in assets, which we subsequently merged with BCB in January 1999. During this time, we also increased our beneficial ownership in BCB to 55.79%, which left BCP with ownership of the remaining 44.21%. In November 2001, however, BCP bought back 55.53% of our interest in BCB for US$31.5 million. As of December 31, 2008, BCB operated 63 branches and 181 ATMs located throughout Bolivia. BCB’s results have been consolidated in the BCP financial statements since the date of its acquisition by BCP in November 1993.
In March 2002, we made a tender offer for outstanding BCP shares for S/.1.80 per share, approximately equal to the book value of such shares, disbursing directly and through our subsidiary PPS an amount of approximately US$35.3 million. As a result of the tender offer, our equity stake in BCP increased from 90.6% to 97.0% (including shares held by PPS).
In December 2002, BCP acquired Banco Santander Central Hispano-Perú, or BSCH-Perú, for US$50.0 million. Since that date, BSCH-Perú has been included in BCP’s consolidated financial statements. On December 31, 2002, BSCH-Perú had total assets of US$975.2 million, total loans of US$719.4 million and deposits of US$659.0 million. BSCH-Perú was merged into BCP on February 28, 2003.
In March 2003, BCP added to its 55% stake by acquiring for US$17.0 million the remaining 45% of the equity shares of Solución Financiera de Crédito del Perú S.A. (or Solución) from Banco de Crédito e Inversiones de Chile (or BCI) and other foreign shareholders. As a result, Solución once again became a BCP wholly-owned subsidiary. In March 2004, substantially all of Solución’s assets and liabilities were absorbed into BCP’s Peruvian banking operations. Solución’s net income in 2003 was US$7.6 million, and it had, as of February 28, 2004, a loan portfolio of US$88.4 million, with a 3.0% past-due ratio.
In 2003, BCP converted Banco de Crédito Overseas Limited, or BCOL, its offshore bank in the Bahamas, into a vehicle to conduct investments and sold it to ASHC. ASHC then consolidated BCOL into its operations during 2004. In accordance with our policy regarding holdings of equity interests in non-financial companies, we then caused certain long-term equity interests that were previously held by BCOL to be transferred to BCP and then in turn transferred to Grupo Crédito. In April 2004, PPS sold substantially all of its holdings of our equity shares to ASHC (see “Item 7. Major Shareholders and Related Party Transactions—(A) Major Shareholders”).
In March 2004, PPS acquired 100% of Novasalud Perú S.A. – Entidad Prestadora de Salud, or Novasalud EPS, which is one of three private health insurance providers in Peru, for US$6.5 million. PPS then merged Novasalud EPS with Pacífico S.A. Entidad Prestadora de Salud (or Pacífico Salud), a subsidiary of PPS.
In 1997, we acquired Banco Tequendama, a Colombian banking enterprise. In 2002, we sold Banco Tequendama’s Venezuelan branches. In March 2005, we then sold Banco Tequendama to a Colombian bank. While this sale was publicly announced in October 2004 and became effective on January 1, 2005, it was not completed until March 2005 after all required approvals were obtained from the Colombian authorities. We did not record any significant gain as a result of this transaction.
In January 2005, BCP and Bank of America (the principal shareholder of Fleet Boston N.A.) agreed to engage in a buy-sale transaction of the loan portfolio of the Peruvian branch of Bank Boston N.A. BCP paid approximately US$353.8 million in cash for the loan portfolio, which included commercial loans, mortgage and leasing operations. The transaction was recorded at acquisition cost.
In February 2005, we were authorized by Peruvian regulatory authorities to establish Prima AFP, of which Grupo Crédito is the main shareholder. Prima AFP started operations in August 2005.
In August 2006, Prima AFP acquired Unión Vida AFP, which is a pension fund operating in the Peruvian market. Prima AFP’s acquisition of Unión Vida AFP, which was formerly held by Grupo Santander Perú S.A., was a strategic move toward consolidation as part of its efforts to gain a leading position in the pension fund market. This acquisition enabled Prima AFP to position itself as the second ranking company in market share terms (affiliates and assets under management), with the second highest returns and the lowest commission for affiliates (who invest a portion of their salary each month). The merger between Prima AFP and Unión Vida AFP was consummated in December 2006.
In 2006, Prima AFP incurred significant merger expenses relative to its size, reaching the end of the year with losses of US$20.7 million. However, Prima AFP had a net income of US$11.2 million during 2008, with 1,045,410 affiliates and funds under management of US$4,865 million.
In November 2006, we bought PPS’s remaining 1.02% of BCP shares, generating goodwill with respect to the minority interest acquired we acquired (0.25%) of approximately US$7.2 million.
The following tables show our organization and the organization of our principal subsidiaries as of December 31, 2008 and their relative percentage contribution to our total assets, total revenues, net income and net equity at the same date (see “—(C) Organizational Structure”):
| | | As of and for the Year ended December 31, 2008 (1) | |
| | | Total Assets | | | Total Revenue | | | Net Income (Loss) | | | Net Equity | |
| Banco de Crédito del Perú | | | 87.3 | % | | | 75.1 | % | | | 117.9 | % | | | 80.6 | % |
| Atlantic Security Holding Corporation | | | 4.9 | % | | | 1.1 | % | | | -14.1 | % | | | 5.5 | % |
| El Pacífico-Peruano Suiza Compañía de Seguros y Reaseguros (2) | | | 5.9 | % | | | 20.4 | % | | | -5.9 | % | | | 4.3 | % |
| Grupo Crédito (3) | | | 1.5 | % | | | 3.4 | % | | | 5.2 | % | | | 13.9 | % |
| Others (4) | | | 0.4 | % | | | 0.0 | % | | | -3.1 | % | | | -4.3 | % |
| (1) | Percentages determined based on the Credicorp Consolidated Financial Statements. |
| (2) | Includes PPS and Pacífico Vida. |
| (3) | Includes Prima AFP and others. |
| (4) | Includes Credicorp Ltd., CCR Inc., Credicorp Securities Inc. and others. |
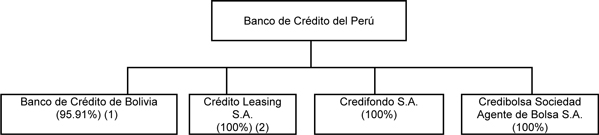
The following tables show the organization of BCP and its principal subsidiaries as of December 31, 2008:
| | | As of and for the Year ended December 31, 2008 (3) | |
| | | Total Assets | | | Total Revenue | | | Net Income (Loss) | | | Net Equity | |
| Banco de Crédito del Perú | | | 93.0 | % | | | 89.9 | % | | | 85.5 | % | | | 84.3 | % |
| Banco de Crédito de Bolivia | | | 5.0 | % | | | 6.6 | % | | | 10.1 | % | | | 8.1 | % |
| Crédito Leasing S.A. | | | 1.3 | % | | | 1.5 | % | | | 0.2 | % | | | 1.7 | % |
| Financiera de Crédito Solución | | | 0.2 | % | | | 0.2 | % | | | 0.0 | % | | | 0.6 | % |
| Credifondo S.A. | | | 0.1 | % | | | 1.2 | % | | | 2.0 | % | | | 1.9 | % |
| Credibolsa Sociedad Agente de Bolsa S.A. | | | 0.1 | % | | | 0.4 | % | | | 0.9 | % | | | 0.9 | % |
| Others (4) | | | 0.3 | % | | | 0.2 | % | | | 1.3 | % | | | 2.5 | % |
| (1) | Credicorp holds an additional 4.08% stake. |
| (2) | It will be absorbed by BCP on July 1, 2009. |
| (3) | Percentages determined based on BCP’s consolidated financial statements as of and for the year ended December 31, 2008. |
| (4) | Includes Creditítulos S.A., Inmobiliaria BCP and others. |
(1) Introduction – Review of 2008
General
Despite the existence of an international financial crisis, in 2008 we recorded net income after minority interests of US$357.8 million, which was 2.0% higher than our net earnings in 2007. We incurred charges of US$181.6 million, which included: (i) US$60.4 million to impair a deteriorated investment portfolio caused by declining stock prices; (ii) US$36.4 million for a provision by ASHC for potential losses and contingencies related to an ASHC-managed fund that had invested with Bernard L. Madoff Investment Securities LLC, or Madoff Securities, on behalf of its clients; (iii) US$67.1 million of expense to hedge SARs Program, and (iv) US$17.7 million from an exchange loss caused by the depreciation of the Nuevo Sol against the U.S. Dollar.
We have addressed these losses by the following:
| | · | In accordance with our approach toward provisions for market-related value adjustments in our investment portfolio, we made a large provision against our deteriorated investment portfolio that we considered sufficient for the financial year 2008. |
| | · | We implemented tighter and more conservative asset management and investment policies to avoid third party risks, such as those associated with the Madoff Securities. |
| | · | We are introducing a modification of the SAR program to minimize the need for variations in provisions related to the program. We are making this modification because the SAR program has generated income volatility due to an imperfect hedge that has caused fluctuations in provisions, which has been intensified by the recent high volatility of our stock. |
| | · | We gradually reduced our exposure to the volatility of the Nuevo Sol by the end of the first quarter of 2009 by exchanging higher yielding Nuevos Soles-denominated government instruments to investments in U.S. Dollars. |
BCP’s banking business remained strong and profitable in 2008, showing significant resilience to the international financial crisis. Our performance in the asset management business through Prima AFP yielded positive results as the income generation trend continued upwards.
ASHC’s private banking business asset management revenues, however, were negatively impacted by the global financial crisis due to unrealized losses from asset market valuations. Likewise, our results were negatively affected by the insurance business due to high casualties and the restructuring of our insurance business’s risk portfolio which led to an increased emphasis on the mass retail insurance business and a decreased emphasis on lower corporate risk holdings. Despite these negative impacts, however, we experienced growth and generation of revenue.
Our total assets grew to US$20.8 billion as of December 31, 2008, a 17.6% increase from the US$17.7 billion as of December 31, 2007, as a result of strong growth (22.9%) in deposits that supported the expansion of our loan business. Loans grew by 27.8% in 2008 (compared to 39.2% in 2007, 18.2% in 2006) following the progress of the Peruvian economy (which had GDP growth rate of 9.8% in 2008). As part of our provision policy, provision for loan losses net of recoveries increased by 71.5% to US$48.8 million (compared to US$28.4 million in 2007). Our past-due loans ratio of 0.79% at the end of 2008 was consistent with that of 2007 (0.75%) and had a coverage ratio of 270.7% (i.e., reserves for loans as a percentage of past-due loans). Finally, our return on average net equity decreased slightly yet remained at a profitable level of 20.2% in 2008 (compared to 22.7% in 2007).
BCP
In 2008, we received an earnings contribution of US$410.9 million resulting from BCP’s year-end 2008 net profit that totaled US$423.5 million. This earnings contribution was 27.4% larger as compared to last year’s profits (US$322.5 million). Despite the present financial environment, BCP set a new record for earnings in 2008 and continued on its average annual growth trend of 38.2% since 2004. As a result, BCP’s average return on net equity (ROE) improved to 32.8%, which is above the Peruvian financial system’s average (31.1%).
The main drivers behind BCP’s performance were: (i) solid growth in net interest income resulting from significant loan portfolio expansion across all segments and products, (ii) a considerable increase in non-financial income derived from the raise of fees and commissions as well as higher gains on foreign exchange transactions and on sales of securities and (iii) expansion of its network with an appropriate expenditure control.
The significant growth of BCP total assets (22.1%) was a result of the expansion of its loan portfolio by 28.1% (which totaled US$10.2 billion), whose participation in total assets increased from 43.6% in 2007 to 55.9% by the end of 2008. BCP’s total past-due loans reached US$82.1 million (36.1% higher than the US$60.3 million registered in 2007) while refinanced and restructured loans decreased by 37.6%, from US$88.5 million in 2007 to US$55.2 million at the end of 2008. The composition of BCP’s loan portfolio did not change significantly—wholesale banking and retail banking accounted for 62% and 38% of its total portfolio, respectively (similar to the levels registered in 2007 (63% and 37%)).
The average daily balances of BCP’s corporate and middle market banking loans grew significantly, by 40.6% and 30.2%, respectively, from 2007. This growth was driven by expanding domestic demand along with dynamic business at all levels (sector, industry, region and segments). As a result, BCP continued to lead the Peruvian financial system with a market share of 48.1% for the corporate segment and 37.1% for the middle market.
BCP’s retail banking portfolio continued its success and grew 42.9% in 2008, reaching an average daily balance of US$3,390. In terms of growth and yields, BCP’s consumer loans were the best performing product, reaching 72% growth (measured in average daily balances) to a total volume of US$618 million, followed by loans to small companies which grew 54% to US$1,127 million. Credit cards grew 36%, reaching US$384 million, while mortgage credits expanded 27%, totaling US$1,260 million.
In 2008, BCP also restructured all of its other liquid assets. This was reflected by BCP’s share of available funds, such as cash over total assets, which rose from 15.3% to 19.3%. This increase was result of the Central Bank’s policy against inflation through increased reserve requirements during the first nine months of 2008, and a deepening international crisis in the closing quarter during which BCP increased liquidity as a precautionary measure. BCP’s investment portfolio increased 0.4% in 2008 and held positions in conservative, highly liquid and safe instruments, such as BCR certificates of deposit.
On the liabilities side, BCP’s deposits reached US$14,235 million on December 31, 2008 (a 27.3% increase from the previous year). This increase in deposits not only continues to reinforce BCP’s funding structure as deposits account for 84.2% of all funding sources, but also serves to strengthen BCP’s market share (which is 38.5%). Demand deposits experienced the fastest growth at 36.7%, while time and savings deposits grew 25.9% and 24.7%, respectively. Severance Accounts, or CTS, expanded a moderate 16% due to increased market competition and customer sensitivity to interest earned on such deposits. Furthermore, in 2008, BCP, through a special vehicle, CCR Inc. (which was consolidated into Credicorp), issued (i) US$300 million of securitized structured bonds, which were deposited in its Panamanian branch, and (ii) US$410 million of syndicated senior loan facility.
BCP has conservative provisioning and long-term risk management policies, keeping its coverage ratio above the average ratio in the Peruvian banking system. In 2008, however, this ratio decreased from the previous year (351.8% as compared to 271.9%). Total cumulative provisions reached US$223.2 million, which is 6.3% higher from the previous year.
In 2008, BCP focused its strategy on strengthening its customer service, which is related to its goal of providing improved customer access to the financial system and thereby increasing its penetration into the market. In following its network expansion plan, BCP opened 57 additional branches (58.3% more than 2007) by the end of 2008, further strengthening its market position. BCP also opened 142 new ATMs in 2008 (for a total of 890 ATMs), while its Agente BCP grew significantly by adding 630 agents (for a total of 1,851 agents as of December 2008). As a result of its strategy, BCP’s average number of transactions in 2008 increased 22.1% from 2007 and its transactional business was therefore able to originate higher income for fees and commissions.
As a result of strong growth in its branch network, BCP’s operating expenses increased 12%. This increase is largely attributed to higher personnel expenses as more employees were hired (15,971 at the end of 2008 as compared to 12,667 in 2007), and to increased general and administrative expenses due mainly to marketing campaigns and IT growth. Nevertheless, an increase of 29.9% in operating income offset the higher operating expenses and BCP’s efficiency ratio thereby reached 50.3% (which was lower than its 2007 ratio of 51.3%).
Overall, BCP’s results exceeded forecasts and contributed to our achievements and increased profitability.
BCP Bolivia
In 2008, Banco de Crédito de Bolivia, or BCP Bolivia, obtained a net profit of US$44.5 million, which was 64.5% higher than its 2007 results of US$27 million. BCP Bolivia’s 2008 results were due in part to the strong performance of high return business segments, such as consolidated markets (businesses larger than the small business segment but that do not qualify for the wholesale segment) which grew 77.2%, and the small business segment which expanded its loan portfolio by 42.7%. The performance in these segments resulted in increased diversification growth in BCP Bolivia’s retail banking portfolio.
BCP Bolivia remained as one of the top banks in Bolivia in 2008, posting better results in the following categories as compared to the averages in the Bolivian banking system: 39.9% return on equity, 2.0% past-due loan ratio and 230.6% coverage ratio (as compared to 20.7%, 4.8% and 144.3%, respectively).
BCP Bolivia’s loan portfolio expanded by 2.8% from year-end 2007 totaling US$472.6 million at year-end 2008. This expansion was mainly due to a 17.8% growth in retail banking, which compensated for its 9.6% contraction in wholesale banking.
Although BCP Bolivia increased its positive contribution to our results in 2008, the country of Bolivia still experiences a volatile political environment and shows evidence of significant stagnation in investment activity.
ASHC
Of all our subsidiaries, ASHC experienced the worst effects of the global financial crisis. In 2008, ASHC recorded a US$22.4 million loss, which gave us a negative contribution of US$50.4 million after our dividend revenues were canceled as part of our consolidation of financial statements. This negative performance by ASHC was caused mainly by (i) a large impairment charge required for ASHC’s portfolio of investment securities due to a decline in the capital markets and (ii) by a provision for potential losses and contingencies related to the alleged Madoff fraud.
As a result of these non-recurring and extraordinary events, ASHC’s total assets contracted by 10%, resulting in total assets of US$1,454.2 million at year-end 2008 (as compared to US$1,615.7 million at year-end 2007). Also, third party assets under management decreased 26.8% from US$2,241.8 million at year-end 2007 to US$1,639.3 million at year-end 2008, and deposits dropped 8.1% to US$1,283.6 million as of December 31, 2008. Nevertheless, ASHC’s loan portfolio expanded 54.8% during 2008 with a 0.0% NPL ratio.
In 2009, although ASHC will not modify its low-risk proprietary investment strategy, we expect an increase in ASHC’s financial margin as a direct consequence of widening credit spreads. We expect ASHC’s asset management business to take advantage of the fact that, in spite of the market conditions of 2008, it still achieved adequate returns for its customers. ASHC aims to improve its 2008 results in order to continue to give us a positive contribution.
PPS
In 2008, PPS, which encompasses Pacífico Seguros, Pacífico Vida and Pacífico Salud EPS, reported a net loss of US$15.0 million (compared to a US$12.5 million net earnings in 2007). Although PPS’s net earned premiums grew 32% from 2007, its claims rose by 43.3% which caused its earnings of US$15.5 million in 2007 to turn to losses of US$7.7 million in 2008. Additionally, PPS recorded US$11.3 million as an impairment and US$3.4 million as a translation loss (which was attributable to the devaluation of the Nuevo Sol against the U.S. Dollar). As a result, the contribution we received from PPS dropped considerably, from earnings of US$9.4 million in 2007 to a loss of US$15.9 million in 2008. Nevertheless, PPS maintains its position as one of the primary insurance groups in Peru with a combined market share of 34.4% for the general insurance, health insurance and life insurance segments.
PPS completed its restructuring plan that started in 2006 and achieved a reduction in retained premiums in its high risk property and casualty segment from 51.9% in 2007 to 35% in 2008. Additionally, PPS’s premiums from the retail business increased as a percentage of total premiums, rising from 38% in 2006 to 47% in 2008.
In 2009, PPS will continue to focus on its retail business by developing products to introduce customers to the advantages of insurance. There is enormous potential growth in Peru’s insurance industry given the industry’s weak market penetration. Efficiency and risk management will continue to be main indicators in measuring PPS’s performance. Efficiently utilizing the BCP network is an essential component of PPS’s growth strategy for 2009 since capitalizing on synergies between the insurance business and the distribution channels of the banking business may lead PPS to greater penetration in the insurance industry.
Prima AFP
Peruvian pension funds experienced a difficult year in 2008. The international financial crisis caused a combined negative yield of 20.4% for the three types of funds managed by AFPs. Nevertheless, Prima AFP was able to continue to strengthen its position by adjusting its processes and organization to provide high-quality services and timely and transparent information to its clients. As a result, the contribution we received from Prima AFP in 2008 reached US$11.2 million, as compared to US$3.0 million in 2007.
Prima AFP assets under management decreased 24.1% from US$6.4 billion at year-end 2007 to US$4.9 billion as of December 31, 2008. By year-end 2008, Prima AFP’s share of total funds under management reached 30.6%, slightly lower than 31.4% at year-end 2007, ranking Prima AFP as the second largest fund management company in the sector.
Prima AFP’s revenues in 2008 reached US$70.7 million, an increase of 23.1% from 2007, as a result of a stable and improved portfolio of contributing members that was supported by a growing Peruvian labor market. These revenues, however, were partially offset by the increase of 15.8% in operating expenses.
In 2009, Prima AFP plans to maximize its contribution to us by focusing on strengthening its affiliate base, preserving its existing client portfolio through providing pension and investment counseling, and controlling operating expenses.
The following table sets forth the contribution to the consolidated net income attributable to our equity holders by each of our principal subsidiaries:
| | | 2006 | | | 2007 | | 2008 | | | Variation 2008/2007 | |
| | | (U.S. Dollars in millions, except percentages) | |
| BCP (1) | | | 238.9 | | | | 322.5 | | | | 410.9 | | | | 27 | % |
| ASCH | | | 15.4 | | | | 20.5 | | | | (50.4 | ) | | | -345 | % |
| PPS | | | 14.5 | | | | 9.4 | | | | (15.9 | ) | | | -269 | % |
| Grupo Crédito (2) | | | (38.8 | ) | | | (1.7 | ) | | | 13.2 | | | | 876 | % |
| Total | | | 230.0 | | | | 350.7 | | | | 357.8 | | | | 2 | % |
| (1) | Includes Banco de Crédito de Bolivia, which contributed US$42.9 million in 2008, US$27.0 million in 2007, and US$14.1 million in 2006. |
| (2) | Includes Prima AFP (which recorded a net income of US$11.2 million in 2008, US$3.0 million in 2007 and losses of US$20.7 million in 2006), Credicorp Securities, Credicorp Ltd. (which mainly includes expenses and the tax withheld in connection with the estimation of the dividends to be distributed to us by our Peruvian subsidiaries (BCP and PPS)) and others. |
(2) Strategy
Credicorp was established to create a financial group that would benefit from the synergies among the group’s companies and would become a leader within each business market in which the companies operate. In moving steadily toward achieving these strategic goals, we have become a leading financial group. However, we do not operate in a static environment and 2008 has demonstrated how quickly and dramatically the world can change.
Our greatest challenge is to adapt to these changes without losing focus of our goals. The financial crisis that peaked in 2008 and its effect on economies throughout the world will continue in 2009. Although its effect on us was not significant compared to other companies, the crisis has led us to more closely scrutinize each of the strategic decisions that shape our business.
In reviewing our strategic decisions, we re-formulated our basic strategy to focus on identifying synergies that will increase our efficiencies. This strategy involves greater integration to improve the management of our companies by more extensively sharing our talents, intelligence and experience.
In 2009, through greater interaction in the decision-making process, we will seek to capitalize our synergies by aligning the individual interests of each of our companies with our overall objectives. Additionally, we will take into account the capacities available throughout the entire organization when making decisions about achieving the objectives of an individual company. Furthermore, we have incorporated sustainability into our objectives as the financial crisis has once again demonstrated the need to build a business that can be sustained over time.
The strength of our businesses has been built on the foundation of an organization with a long tradition, deep-rooted culture of customer service, and true commitment to developing our country’s economy and markets. Consequently, we believe we must:
| | · | Focus on our core traditional banking business, on the development of our insurance business and on responsible asset management; |
| | · | Place our customers’ interests first by preserving and investing our assets conservatively and by providing innovative products that meet our customers’ needs; and |
| | · | Contribute to developing Peru’s financial system by increasing bank penetration, increasing product accessibility, and introducing insurance to additional customers while keeping it affordable. |
We are convinced that our 2008 results confirm that we are moving toward accomplishing our objectives. For this reason, many of our strategic steps for 2009 are focused not only on business segments experiencing the largest growth but also improving our own decision-making processes and designing strategies to better consolidate information, capabilities and strengths shared between our companies.
The following is a description of the specific strategies employed by our various businesses:
Banking Business
| | · | Banco de Crédito del Perú – BCP |
| | · | Banco de Crédito – BCP Bolivia |
| | · | Atlantic Security Bank – ASB |
The main objective of our banking business strategy is to accomplish sustainable and highly profitable growth. We can accomplish this objective by greater bank penetration, responding to our customer’s needs, increasing efficiency, and global and comprehensive risk management, which require focusing on:
| | · | Designing innovative products that meet our customers’ needs; |
| | · | Improving risk management and more quickly assessing risk while we incorporate the four types of risk—credit, market, operational and reputational risk; |
| | · | Reviewing and streamlining our operative processes; and |
| | · | Improving our distribution model to offer greater value added through our different distribution channels and automated transactional services. |
Through these initiatives, we expect to accomplish higher efficiencies and grow actively but profitably. This strategy, while applied to all three entities, may vary slightly with each entity. For BCP Bolivia, our strategy also includes reconciling its interests with those of the Bolivian nation as well as adapting the above initiatives to a less dynamic market. With respect to ASB, as a consequence of global financial crisis, we must reestablish its customers’ trust in the investment markets and in our own asset management capabilities.
Insurance Business
Our strategy in the insurance business includes being more selective in our risk retention in the general corporate insurance market, given the mismatch between insured levels and our ability to underwrite and/or absorb such risk. Although fully implementing this strategy will require time, we have already started to see its positive effects.
Given the enormous potential in the retail insurance business due to the industry’s low penetration into the general public, we also focused on PPS’s retail business by developing products that will introduce customers to the advantages of insurance.
The strategies described above for the banking business that focus on growth, efficiency and risk management apply as well to PPS and its life and health insurance business. In addition, the strategy of capitalizing synergies is of great importance in the insurance business as a result of the insurance business’s considerable potential to benefit from the distribution channels of the banking business in selling insurance products, which may also lead to greater market penetration. Consequently, the efficient use of the BCP network through greater integration and alignment of objectives between the two companies is an essential component of PPS’s growth strategy and will receive special attention in 2009.
Asset Management Business
| | · | Atlantic Security Holding Corporation – ASHC |
Our strategy in the asset management business is to rebuild our customers’ confidence in the financial markets, the private pension funds system and our ability to manage their assets. Our initiatives to reach our customers by designing useful products, improving risk management and accomplishing greater efficiencies are applied to all segments of the asset management business. We aim to rebuild our customers’ confidence based on an extremely cautious, conservative and simple investment strategy.
Outlook for 2009
The current economic crisis has caused much uncertainty in the global markets. Although its impact was not completely felt in Peru during 2008, the crisis undoubtedly slowed down Peru’s economic activity in the first quarter of 2009. Nevertheless, we predict the effects of the crisis will not stop growth in Peru. Strong external and fiscal accounts, significant foreign currency reserves, and the Peruvian financial system’s high solvency ratios provide a sufficient foundation for Peru to successfully manage these challenges.
We are successfully poised to face the challenges of the crisis by relying on our strong equity position, our technical and professional capital, the loyalty and trust of our clients, and the commitment of our talented employees. We predict that our business will continue to grow, albeit at a slower pace than during recent years.
In the banking business, we expect higher credit risk and, consequently, the need for larger provisioning. With respect to ASB, we believe that all precautions have been taken to handle the international financial crisis and we expect a recovery in 2009. The insurance business should improve and reverse the negative results of 2008, and we have implemented numerous measures to reduce risk and restructure premiums. In our pension fund management business, we expect a year of growth in client base.
(3) Credicorp Operating Groups
We conduct our business operations through four different principal subsidiaries: BCP and subsidiaries (which include BCB), Atlantic Security Holding Corporation, Pacífico Peruano Suiza and Grupo Crédito (which includes Prima AFP).
The majority of our commercial banking business is carried out through BCP, which is our largest subsidiary and the oldest bank in Peru. A portion of our commercial banking business is also carried out by ASHC, which principally serves Peruvian private banking customers through offices in Panama. We conduct commercial banking activities in Bolivia through BCB, a full service commercial bank with US$754 million in deposits, US$941.7 million in assets and US$458.9 million in net loans, as of December 31, 2008. As of such date, BCB was the third largest Bolivian bank in terms of loans and deposits, with 13.1% and 13.3% market share, respectively.
Our commercial banking business is organized into wholesale banking activities, which are carried out by BCP’s Wholesale Banking Group and the corporate banking operations of ASHC), and retail banking activities, which are carried out by BCP’s Retail Banking Group. We perform our leasing operations either directly through BCP or through Crédito Leasing S.A. (or Credileasing), a subsidiary of BCP that will be absorbed by BCP on July 1, 2009.
We apply uniform credit policies and approval and review procedures, which are based on conservative criteria adopted by BCP, to all of BCP’s subsidiaries. Our general manager is in charge of setting the general credit policies for our different business areas. These policies are set within the guidelines established by Peruvian financial sector laws and SBS regulations (See “—(11) Supervision and Regulation—(ii) BCP”) and the guidelines set forth by our Board of Directors.
Our deposit-taking operations are principally managed by BCP’s Retail Banking Group and ASHC’s Private Banking Group. See “(12) Selected Statistical Information—(iv) Deposits.”
The majority of our trading and brokerage activities are conducted through BCP, ASHC and Credicorp Securities Inc. (also referred to as Credicorp Securities), which is one of our wholly-owned subsidiaries. Credicorp Securities is a U.S. registered broker-dealer with its offices in Miami. Our asset management business is carried out by BCP in Peru, through its subsidiary Credifondo, by ASHC and by Prima AFP, the pension fund administrator.
We offer investment banking products and services through BCP and ASHC. BCP offers clients a wide range of such products and services, such as brokerage, mutual fund and custody services through its branch network in Lima and, on a more limited basis, throughout the rest of Peru. In addition, we also distribute such products through ASHC.
In the last few years, we consolidated an important line of business, asset management, for our customers. As of December 31, 2008 our assets under management totaled US$7.6 billion, a contraction of 27.1% from year-end 2007, which was due to a drastic drop in the market values of securities caused by the international financial crisis. The majority of our asset management business is performed through our subsidiary, Prima AFP. Mutual funds represent another contributor to our asset management business carried out through BCP’s mutual funds subsidiary, Credifondo Sociedad Administradora de Fondos Mutuos (or Credifondo). Credifondo leads the Peruvian market with a share of 45.2% of the total assets currently under management. Finally, BCP’s affiliate, Atlantic Security Bank, offers the international mutual funds and financial advisory services to BCP’s private banking customers.
We have reorganized a corporate supervision project entitled “Asset Management” due to the size of these businesses, the importance of the commissions they generate and, above all, the fiduciary responsibility they entail. The main objectives of the project are to establish homogeneous risk control and investment policies and to evaluate the management and results of the portfolios under management based on best international practices.
Asset Management is composed of four main components:
| | · | Portfolio Management: We seek to consolidate the good performance of our portfolios and funds through strict risk control and an appropriate level of diversification. To achieve this, we focus on improving three key aspects: investment policies, investment processes and management metrics. |
| | · | Financial Management: We focus on providing quality financial advisory services, building customer loyalty, and encouraging customers to invest in a diverse combination of securities according to their risk profile. Our objective is to improve the standards of the advisory services that our commercial bank offers and to distinguish between the levels of advisory services provided to different sectors. |
| | · | Brokerage: We attempt to provide a timely and high quality service, offering competitive execution costs, channeling a greater proportion of the assets traded by our companies to profitable investments and identifying opportunities for joint action (resulting in better prices), in addition to improving controls aimed at avoiding possible conflicts of interest. |
| | · | Risk Analysis: We seek to identify, quantify, regulate and, ultimately, minimize the risks associated with operations, credit, market, liquidity, legal contingencies, conflict of interests and other risks. Another objective of our risk analysis is setting corporate investment limits, creating a portfolio investments risk manual, and ensuring strict compliance with risk control rules. |
We conduct our insurance operations exclusively through PPS and its subsidiaries, which provide a broad range of insurance products. PPS focuses on three business areas, general insurance through Pacífico Seguros, life and pension insurance through Pacífico Vida, and health care insurance through Pacífico Salud EPS. PPS, like other major Peruvian insurance companies, sells its products both directly and through independent brokers and agents. Directly written policies tend to be for large commercial clients, as well as for life and health insurance lines.
(4) BCP and Subsidiaries
(i) General
BCP’s activities include commercial banking, investment banking and retail banking. As of December 31, 2008, the consolidated operations of BCP ranked first among Peruvian banks in terms of total assets of US$18.5 billion, total loans of US$10.2 billion, deposits of US$14.2 billion and net equity of US$1.4 billion. At the end of 2008, BCP’s loans, on an unconsolidated basis, represented approximately 31.6% and the deposits represented approximately 38.5% of the total Peruvian banking system, respectively.
As of December 31, 2008, BCP had the largest branch network of any commercial bank in Peru with 330 branches. BCP operates an agency in Miami and a branch in Panama.
As of and for the year ended December 31, 2008, BCP accounted for 80.8% of our total revenues, 87.3% of total assets, 107.1% of net income and 78.9% of net equity. BCP’s operations are supervised and regulated by the SBS and the Central Bank.
In May 2009, BCP began grouping its client base according to the following criteria:
| Client Segmentation |
| Group | | Sales (US$MM) | | Sales (US$MM) |
| | | | | From May 2009 onwards |
| Micro-business | | Up to 0.3 | | Up to 0.5 |
| Small Business | | From 0.3 to 1.5 | | From 0.5 to 6.7 |
| Middle market | | From 1.5 to 30 | | From 6.7 to 30 |
| Corporate | | Higher than 30 | | Higher than 30 |
The grouping was a result of an analysis which addressed factors beyond the simple size and volume of activity for each client, such as clients’ affiliation with other companies or groups, the degree of follow-up required, and their credit ratings.
Subsidiaries
BCP’s corporate structure consists of a group of local subsidiaries offering specialized financial services, which complement BCP’s commercial banking activities. In addition to its local subsidiaries, BCP has an agency in Miami and a branch in Panama, a subsidiary in Bolivia and an affiliate bank, Atlantic Security Bank, in the Cayman Islands.
BCP and its principal subsidiaries as of December 31, 2008 are as follows:
| · | Banco de Crédito de Bolivia, or BCB, is BCP’s commercial bank in Bolivia. BCP owns 96% of BCB and we hold the remaining interest. Currently, BCB is the third largest bank in Bolivia in terms of deposits and loans market share and has a network of 63 offices located throughout Bolivia. BCB owns one of Bolivia’s largest brokerage houses, Credibolsa S.A. Agente de Bolsa. BCP targets middle- and small-sized clients and offers a broad range of corporate, personal banking and leasing products. BCB’s results are consolidated in BCP’s financial statements. |
| · | Credibolsa Sociedad Agente de Bolsa, or Credibolsa, was established in June 1991 and is 100% owned by BCP. It is engaged in portfolio advisory and brokerage activities in the Lima Stock Exchange. |
| · | Crédito Leasing S.A., or Credileasing, offers a large variety of financial leasing products. Credileasing was established in July 1996 and is 100% owned by BCP. It will be absorbed by BCP on July 1, 2009. |
| · | Credifondo Sociedad Administradora de Fondos Mutuos, or Credifondo, is a mutual fund management company that was established in 1994. Credifondo is 100% owned by BCP. |
| · | Creditítulos S.A., or Creditítulos was established in 1997 and is 100% owned by BCP. Creditítulos serves as an asset securitization entity. |
| | · | Inmobiliaria BCP is the real estate subsidiary of BCP. It manages and promotes the sale of real estate that has been foreclosed or received in payment by BCP. Inmobiliaria BCP is 100% owned by BCP. |
(ii) Wholesale Banking Group
BCP’s Wholesale Banking Group, which competes with local and foreign banks, has traditionally represented the majority of BCP’s loans. BCP’s traditional relationships provide its Wholesale Banking Group with a competitive advantage.
During 2008, the Wholesale Banking Group maintained its positive trend in loan placements, posting average portfolio levels of US$5,431 million in 2008 (36.6% higher than in 2007). This result was achieved despite BCP’s already large market share, aggressive competition, and financial disintermediation caused by the rapid development of the local capital markets. BCP has the largest capital base among Peruvian banks, which provides it with more resources to meet the financing needs of its corporate clients. BCP has established longstanding client relationships with virtually all of the major industrial and commercial groups in Peru. The Wholesale Banking Group provides its customers with short- and medium-term loans in local and foreign currencies, foreign trade-related financing and lease financing.
The Wholesale Banking Group is divided into the following areas:
| · | Corporate Banking, which provides loans and other credit services to companies with annual revenues in excess of US$30 million; |
| · | Middle Market Banking, which serves mid-sized companies; |
| · | International Banking, which manages BCP’s relationship with financial institutions locally and abroad, trade products and international operations services; |
| · | Corporate Finance, which provides underwriting and financial advisory services to corporate and middle market clients; |
| · | Business Finance, which finances business projects and manages the financial leasing product; |
| · | Institutional Banking, which focuses principally on serving non-profit organizations, state-owned companies and other major institutions; and |
| · | Business Services, which develops transactional services. |
Net interest income from the wholesale banking sector reached US$141 million, a growth which resulted from the increase in business volume and compensated for the reduction in lending rates. Income from financial services accounted for 46% of the total income generated by the wholesale banking sector.
Although state-controlled corporations are served by BCP’s Wholesale Banking Group, mostly in connection with international trade finance, BCP does not regularly extend loans directly to the Peruvian government or to regional or municipal governments.
Corporate Banking
According to BCP’s internal reports, loans provided by its Corporate Banking Area represent 34% of BCP’s total loans granted in 2008. Despite the relatively small growth of this group (due to the growing array of financing alternatives offered by the capital markets), corporate banking loans grew for the fifth consecutive year and reached an average portfolio balance of US$3,377 million, which represents a 41% increase compared to 2007. These loans were approximately 73% foreign currency-denominated (primarily U.S. Dollar-denominated) and 27% Nuevo Sol-denominated. As in the middle market banking sector, the Corporate Banking Area has faced a very aggressive competition in terms of rates, which resulted in a reduction in lending spreads. On the deposit side, corporate deposits kept growing, accounting for approximately 35% of BCP’s total deposits.
Client Profile: The Corporate Banking Area is focused on serving large-sized companies that have an annual turnover of over US$30 million, audited financial statements and dominant market positions in their particular products or brands. Even if they do not meet the above criteria, BCP may classify other firms in this category if they belong to very large economic groups from industries that are important to the country’s economy.
Products: The Corporate Banking Area offers a broad range of products and tailors its product offerings to meet each client’s unique requirements. In general, this Area is expected to offer high-value-added products and services, particularly cash management services, at competitive prices.
The majority the Corporate Banking Area’s financing is provided to fund sales, international trade and inventories. In general, the Corporate Banking Area grants short-term financing. However, it can provide longer term financing for companies in need of financing capital expenditures and fixed assets, among other purposes. The Area also offers term financing (in all cases backed by real guarantees), financial leasing, factoring, and domestic collections and nationwide fund transfers.
Additionally, Corporate Banking clients can obtain investment banking, advisory and financing services through the Corporate Finance Area, which operates as part of the Wholesale Banking Group and also serves major middle market clients.
Guarantees received by this area consist of (i) receivables in the case of sales financing, (ii) warrants or pledges on inventory in the case of inventory financing and (iii) real guarantees, in the case of financing for fixed asset acquisitions and improvements to their infrastructure.
There is a limited growth prospect in this business due to high market penetration and competition from capital markets in loans.
Middle Market Banking
BCP’s Middle Market Banking Area generally serves the same industries and offers the same products as its Corporate Banking Area. Its focus, however, is on providing its customers with working capital loans which are primarily secured by accounts receivables. This is accomplished by arranging financing for medium- and long-term investment programs, including leasing services offered through our leasing unit. BCP has a middle market client portfolio of approximately 5,400 companies.
According to BCP’s internal reports, the annual average loan portfolio of the middle market banking area of BCP reached US$2.1 billion in 2008, or 30.3% higher than the average US$1.5 billion in 2007 (US$1.1 billion in 2006). This occurred growth occurred despite the enforcement of stringent credit quality requirements. BCP expects significant opportunities in lending to middle market businesses, particularly in Peru’s agriculture, fishing and construction industries, where special emphasis has been placed and specific task areas have been created to attend to the needs of these economic groups.
BCP’s medium-term financing products, which include structured loans, project financing and syndicated transactions, are designed to accommodate specific clients’ needs. Through these products, BCP has been an active lender and financial advisor to Peru’s mining, technology and energy sectors. In addition to its regular sources of funds, BCP is an intermediary of Corporación Financiera de Desarrollo (Development Finance Corporation, or COFIDE, a second-floor bank fully owned by the Peruvian government). In several medium-term credit lines for project financings in certain sectors, BCP is also an intermediary of international financial institutions such as Corporación Andina de Fomento (Andean Development Corporation, or CAF), the International Finance Corporation (or IFC) and the Inter-American Development Bank.
Financial margins in the Middle Market Banking Area continue to be attractive. Because of their size, middle market companies in Peru generally do not have access to the local or international capital markets or to credit from foreign banks. In addition, we believe that middle market companies have benefited significantly from the overall economic improvements in Peru over the past few years. Loan quality problems have been addressed through procedures and organizational changes that have focused on improving the loan approval and credit-risk assessment processes.
The Middle Market Banking Area, through seven regional managers nationwide, focuses on organizations with annual revenue levels between US$1.5 million to US$30 million. Generally, these clients are not listed on the stock exchange but in some cases are capable of issuing financial obligations or commercial papers. Their financial information is reliable and audited. These companies are typically family-controlled but professionally managed.
The products offered to middle market clients resemble those offered to corporate banking clients. The three major types of products are:
| | · | Revolving credit lines to finance inventories and sales, as well as stand-by letters of credit and international trade financing; |
| | · | Financing for short-term requirements such as current account credits and temporary account advances (overdrafts); and |
| | · | Financing for medium and long-term requirements using intermediation resources (term deposits) and various types of financial leasing financing. |
The Middle Market Banking Area requires that all facilities granted to middle market clients be guaranteed by the main shareholders and their respective spouses. In addition, these clients are usually required to grant real guarantees of assets unrelated to the business, such as real estate owned by the shareholders.
Institutional Banking
BCP’s Institutional Banking Area serves non-profit organizations, whether public or private, which includes approximately 1,000 state and local government entities, international bodies, educational institutions and non-governmental organizations. Specialized teams in both BCP’s Wholesale Banking and Retail Banking groups serve these clients.
The Institutional Banking Area is strategically important due to the business potential of its clients (which demand diverse products and services) and the opportunities its clients present for generating income from fees and cross-selling opportunities. BCP’s institutional banking clients are principally users of transactional products and require consultancy for investment management. BCP’s strategy in this Area is focused on building customer loyalty by offering customized services at relatively competitive rates and providing outstanding service quality. The institutional banking clients mainly require remote office banking, collections and automated payroll payment services.
International Banking
BCP’s International Banking Area is focused primarily on providing short-term credit for international trade, which is funded with internal resources or with credit lines from foreign banks and institutions. Medium-term lines of credit funded by international commercial banks and other countries’ governmental institutions are also provided to clients. In addition, this area earns fees by confirming guarantees issued by international banks and other fees as a result of the international payment business. The International Banking Area also promotes international trade activities with its local clients by structuring trade products and services, establishing conferences and assessing the customer in a wide range of trade products.
Since September 2008, the International Banking Area has also been supervising the trade Back Office Unit (International Operations). BCP maintains business relations with correspondent banks, development banks, multilateral and export credit agencies in countries around the world. At present, BCP manages credit lines for foreign trade transactions, working capital and medium- and long-term investment projects.
The current international market volatility has left BCP with a large amount of liquidity in U.S. Dollars. BCP has been active borrowing short-term funds in the international markets, and until August 2008, BCP participated in securitization programs for medium- and long-term.
According to the Superintendencia Nacional de Administracion Tributaria, or SUNAT, in 2008 Peruvian exports increased 12.2% to US$31.2 billion from US$27.8 billion in 2007. This result was principally due to increased exports of commodities (gold, silver and iron) and of manufactured goods (metalmecanic and agribusiness). During the same year (based on BCP’s internal report), BCP’s exports volume increased 2.8% to US$11.1 billion from US$10.8 billion in 2007, which amounted to 35.6% of total Peruvian exports.
Total Peruvian imports were US$29.9 billion in 2008, increasing 45.9% from US$20.5 billion in 2007, which was primarily due to a higher demand for capital goods (industry, construction and transportation), raw materials for industry, and consumer goods. BCP’s import letters of credit, collections and transfers amounted to US$6.1 billion in 2008, increasing from US$4.3 billion in 2007.
BCP has a direct presence abroad through its agency in Miami and its branch in Panama. It has access to a wide network of foreign correspondent banks and can offer several internationally competitive products to its customers.
BCP has correspondent banking relationships and uncommitted credit lines with more than 80 banks for foreign trade operations, financing of working capital and medium- and long-term investment projects. During 2008, BCP intensively used its funding credit lines with correspondent banks due to an intensive growth in its trade portfolio.
Corporate Finance
BCP’s Corporate Finance Area provides a wide range of underwriting and financial advisory services to corporate clients and middle market businesses and has a leading position in the local market. The Corporate Finance Area was incorporated into BCP’s Wholesale Banking Group in 1996 in order to enhance its effectiveness as the demands of Peru’s larger corporations moved away from loan-based operations toward capital markets-based operations. In 2008, the Corporate Finance Area focused on investment banking and structured financing and grew alongside the expanding Peruvian economy and, particularly, the local capital markets. As a result, the Corporate Finance Area generated income exceeding US$8.4 million from structuring, counseling and placing commissions.
The Corporate Finance Area’s growth was a consequence of an increased demand for financing due to an increase in number and size of new projects in Peru in which the Area played a major role. The main projects in 2008 included:
| | · | A medium-term syndicated loan to Compañía de Minas Buenaventura for US$450 million which was the largest structured financing provided by a local bank; |
| | · | A leasing arrangement for US$95 million for Duke Energy Egenor to build the Las Flores thermal power plant; |
| | · | Syndicated loans to Transportadora de Gas del Perú, or TGP, for US$80 million and US$150 million to expand capacity of the gas pipeline from Camisea to Lima; |
| | · | A back leasing transaction for S/.244 million; and |
| | · | A medium-term loan to Inversiones en Turismo, or Intursa, for US$50 million to partially finance its investment plan which includes the Westin Lima Hotel. |
In the capital markets, among other transactions, we successfully structured the takeover bid for ordinary stock issued by a mining company, as well as a private stock offering made in the Lima Stock Exchange and the Alternative Investment Market (AIM) of the London Stock Exchange. Also, the Corporate Finance Area was actively involved in the first private issuance of bonds by Chilean companies in Peru, which totaled more than S/.500 million.
Leasing
BCP’s financial leasing business, Credileasing, offers and manages financial leasing operations. It also carries out medium-term operations, principally for small- and medium-sized companies. BCP is the leader with a market share of 36.2% of total leasing. Credileasing will be absorbed by BCP on July 1, 2009.
BCP’s management estimates that Credileasing is currently the largest in Peru with a market share of 36.2% as of December 31, 2008. The principal means of financing for Credileasing is through the issuance of specific leasing bonds and mid-term loans granted by BCP. The total amount of outstanding leasing bonds reached S/.307.4 million (US$97.8 million) as of December 31, 2008. According to the SBS, Credileasing’s market share among specialized leasing companies was 51.8% as of December 31, 2008.
The financial leasing business grew by 54.7% during 2008. BCP’s leasing loan balances show a 107.3% growth in 2008 as a consequence of tax rule stabilization applicable to leasing operations and the growth of the Peruvian economy.
Growth during 2008 was driven by business loans in sectors requiring investment in mining, transportation services to mining companies, energy generation and manufacturing companies. Loan demand also increased in the telecommunications sector and small-sized companies sector.
Business Services
BCP’s Business Services Area is in charge of developing transactional services that handle the exchange of information and money transfers to corporations, midsize companies, institutions and micro-business companies. This Area is responsible for both the development and marketing of transactional (or “cash management”) services for BCP’s corporate and institutional clients. More than 30 product groups are offered, aiming at strengthening ties with clients, assuring their loyalty and reciprocity in the business carried out with BCP, reducing costs using electronic channels, and increasing fee income.
Services managed by the Business Services Area include collections (automated trade bill collection and electronic factoring), automated payments (direct credits to personnel and suppliers accounts and money transfers), electronic office banking, and cash management through checking accounts with special features.
During 2008, transactional services continued to contribute to BCP’s earnings. The monthly average number of current accounts increased by 16.3% and fee revenues increased by 14.3% compared to those of 2007. This improvement is mainly the result of the dynamism experienced in the small business sector (also referred to as SME). Collection services, such as bills and companies’ collections, generated commissions that increased 12.2% and 35.4%, respectively, over the 2007 collections. This improvement is explained, in part, by BCP’s strategic decision to offer value to its clients through the implementation of a more efficient mechanism of information related to these services. The higher demand by clients for the remote banking service Telecredito also generated 30.1% more transactions than 2007. Likewise, other commissions generated by remittances abroad grew 11.4% from those generated in 2007, and the transaction volume generated by electronic factoring increased 19% in 2008. Finally, the electronic service for invoice financing, recently introduced in the market, grew by 63.9% in volume from 2007.
(iii) Retail Banking Group
According to BCP’s internal reports, retail banking-related loans continued to grow and thereby maintained their 37% share of BCP’s total loans. Retail banking-related deposits also grew, increasing their share from 46% to 48% of BCP’s total deposits. Income from fees grew 18% between 2007 and 2008, reaching US$200 million by year end 2008.
Between 2006 and 2007, the Retail Banking Group’s loan volumes increased by 48%, reaching US$2,898 million. During 2008, loans grew again by 27%, a growth of US$795 million, to US$3,694 million. This growth can be attributed to consumer lending, which includes installment loans and credit cards, small and micro business loans and home mortgages. With respect to deposits, BCP’s Retail Banking Group has also shown constant growth, by growing 30% (US$1,406 million) between 2006 and 2007, and US$1,061 million in 2008 for a total of US$7,181 million.
With the segmentation of its retail client base, BCP is able to focus on cross-selling its products and improving per-client profitability. The Retail Banking Group has undertaken several projects to improve one-on-one marketing techniques and tools for the sale of its products to all market segments. BCP’s management expects the retail banking business to be one of the principal growth areas for BCP’s lending activities.
BCP’s retail banking serves individuals and small-sized companies with annual sales levels of up to US$1.5 million. BCP’s objective is to establish profitable long-term relationships with its broad client base, using segmentation strategies that satisfy the specific needs of each client type. BCP’s retail distribution strategy changed at the beginning of 2007, when BCP started using the branch network as the center for all transactional and commercial activities. BCP now has a commercial division, in charge of all direct sales forces and the branches, which in turn are organized on a geographic level. Each branch is responsible for servicing and selling products to three customers groups: exclusive banking, small business banking and consumer banking. In addition, each branch is responsible for coordinating the different channels offered within the branch, such as account managers, customer service representatives and tellers.
The Marketing Division is responsible for product, channel and segment management. During 2008, BCP has seen an unprecedented investment in infrastructure and human resources to support its “banking the unbanked” strategy. In addition, BCP experienced an explosive growth in channels, including 57 additional transactional and commercial, 142 new and 630 correspondent banking offices, as well as more than 3,000 new employees. Demonstrating its leadership in attracting new customers, BCP now services nearly three million customers with its network of 330 offices, 890 ATMs and 1,851 correspondent banking offices.
Exclusive Banking
Exclusive banking is BCP’s upscale retail banking area which manages a select number of individual customers. These customers are key to BCP because of their high loan and deposit volume and their attractive profitability.
Exclusive banking customers receive a differentiated value plan which includes (i) access to innovative products, (ii) dedicated customer services channels such as specialized account managers and/or expert phone banking, (iii) privileged preferential service in the branches at the teller window and (iv) special interest rates on loans. BCP’s exclusive customers, totaling about 150,000, must have good credit record and at least US$20,000 in loans within the banking system or US$30,000 in deposits with BCP. Approximately 100,000 of the most profitable exclusive clients are serviced through specialized accounts managers responsible for improving per-client profitability and achieving long-term relationships through personalized service, cross-selling and share of wallet strategies. Account managers are also responsible for new customer acquisition, particularly through mortgage loans. The higher end of this segment also has access to investment advisors who prepare customized investment plans consisting of capital market products and mutual funds. The exclusive banking segment is very profitable, generating 28% of the retail group’s income while managing 5% of the total customer base and approximately 44% of the retail baking’s deposit and loan volume.
Small Business Banking
BCP’s small business segment now accounts for 265,000 clients. Customers are divided into three groups with different business models, services levels, and products access. The first group is top-end small business banking, which serves approximately 9,000 clients and has annual sales between US$300,000 and US$1.5 million. The next group of 130,000 small business clients has annual sales between US$10,000 and US$300,000. The third group of approximately 126,000 very small business customers has only deposit product needs.
In addition to products, such as revolving credit lines repaid in installments, BCP also helps the development of the small and micro (SME lending) business segments, which composed of individuals who primarily derive their income from small, family-run businesses, in two ways: (i) client training programs through seminars and presentations and (ii) formalization programs based upon alliances with government institutions such as Prompyme, the Ministry of Labor and Social Promotion, municipalities and the Peruvian Center for the Promotion of Small Business. BCP’s total loans to small businesses as of December 31, 2008 amounted to US$1,345 million, which represented another year of consecutive growth of more than US$300 million per year.
According to BCP’s internal reports, the Small Business Banking loan portfolio grew from US$679 million in 2006 to US$1,037 million in 2007 and to US$1,345 million in 2008. In terms of deposits, this group increased deposits from US$913 million in 2006 to US$1,197 million in 2007, and to US$1,562 million in 2008.
Consumer Banking
Consumer banking is in charge of developing strategies for the retail customers not included in exclusive banking or small business banking. Its customer base is approximately 2.5 million medium to low income individuals. Consumer banking focuses its attention on customers who receive their payroll through BCP (which represents more than 720,000 clients). Its strategies vary from basic acquisition of new accounts for wage-earners with special terms regarding fees and interest rates, to more sophisticated, aggressive cross-sell and retention programs that expand benefits to non-banking products (i.e., access to discounted products). BCP has continued excelling in expanding its debit card as a form of payment, maintaining more than half of the market share in withdrawals and payments with debit cards, which is a year-to-year increase of 400,000 cards. BCP concluded 2008 with more than 2.7 million cards.
Mortgage Lending
As of December 31, 2008, BCP was the largest mortgage lender in Peru with a market share of 35.8% of total mortgage loans in the Peruvian banking system. This was largely the result of BCP’s extensive marketing campaigns and its improvements in the quality of procedures for extending credit and establishing guarantees.
BCP expects the mortgage lending business to continue to grow because of (i) low levels of penetration in the financial market, (ii) increasing demand for housing, (iii) the availability of funds for the Peruvian government’s MiVivienda low-income housing program and (iv) the current economic outlook for controlled inflation and economic growth in Peru.
BCP had US$1,330 million of outstanding mortgage loans as of December 31, 2008 (as compared to US$1,132 million at year-end 2007 and US$868 million at year-end 2006).
All programs of mortgage financing are available to customers with minimum monthly income of US$400. The MiVivienda program, a program supported by government resources, placed a limit of US$35,000 on the value of the house to be purchased. BCP will finance up to 90% of the appraised value of a property where monthly mortgage payments do not exceed 30% of the client’s stable net income. The maximum maturity of the mortgage loans BCP offers is 25 years, in U.S. Dollars, and 20 years, in local currency. Within the mortgage lending business, BCP offers variable, fixed and Libor-based interest rates on home mortgage loans denominated in both U.S. Dollars and Nuevos Soles. However, BCP’s mortgage portfolio is predominantly variable rate and U.S. Dollar-denominated.
In May 2006, the original MiVivienda program was terminated. However, local banks (with government’s approval) launched a similar project, known as MiVivienda2, to which proprietary funds contribute. In addition, in March 2007, BCP created a new program financed by the government called Mi Hogar, which targeted persons with a lower income profile. The conditions of the new program are almost identical to those of the first MiVivienda, except that financing is in local currency.
Consumer Lending (Credit Cards and Installment Loans)
Consumer lending, credit cards and installment loans have grown significantly as improving economic conditions have led to increased consumer spending. BCP expects the strong demand for these products to continue. In addition to interest income, BCP derives fee income from customer application and maintenance, retailer transactions, and merchant processing, finance and penalty charges on credit cards.
Peru’s economic growth has had a huge impact on the consumer credit market, which grew by a total of 30% during 2007 and 2008. The outstanding balance was US$1,095 million at year-end 2008: US$405 million for credit card and US$689 million in installment loans. BCP’s market share in consumer lending increased during 2008 from 17.9% to 19.2%. This 37% growth in consumer lending was achieved while maintaining a low 3.2% ratio of delinquent accounts (over 30 days).
In 2008, installment loans experienced unprecedented growth of US$214 million in outstanding balances (a 45% increase from 2007). This result is due in part to BCP’s strategic change to broaden its customer base. Fifty percent of BCP’s new loans in 2008 came from customers with a monthly gross income of less than US$400.
In the credit card business, BCP continued to apply segmented strategies. BCP continues to offer value to its high-end customers through partnerships with the airline LAN and with Primax, a chain of gas stations. These programs, coupled with BCP’s own travel program, enabled it to reach record levels, both in point generation and point usage (exchanges). To catch the attention of the lower income segment, BCP worked on streamlining its risk assessment and card delivery process.
In addition, BCP has been continuously improving monitoring and optimizing its scoring models, which includes, among others, behavior, payments and income forecasting. As a result, in 2008 BCP achieved a growth of 17%, or a US$58 million increase, in outstanding balances over the previous year. According to BCP’s internal records, the number of active credit cards has constantly increased from 325,000 at year-end 2006 to 387,000 at year-end 2007 and further to 430,000 at year-end 2008. In addition, annual purchases increased from US$592 million in 2006 to US$868 million in 2007, and to US$1,131 million in 2008.
BCP is also the largest shareholder of VISANET, holding approximately 40% of its total shares. The number of VISANET electronic payment terminals grew to approximately 50,000 at year-end 2008, as compared to 41,000 at year-end 2007, 28,000 at year-end 2006 and 18,000 at year-end 2005.
(iv) Capital Markets Group
In addition to BCP’s wholesale and retail banking operations, BCP operates a capital markets group, which currently is the largest capital markets and brokerage distribution system in Peru. The principal activities of the Capital Markets Group include currency transactions (both for clients and on a proprietary basis) as well as treasury, custody and trust, investment advisory services, and general research activities.
BCP’s products are distributed through its subsidiaries and branches. BCP’s close relationship and coordination with its subsidiaries has established BCP as the market leader in the capital markets business.
Credibolsa is BCP’s brokerage subsidiary through which BCP offers a wide variety of variable and fixed-income products and services. Credibolsa’s activities include the structuring and placement of primary market issues and the execution and trading of secondary market transactions.
Creditítulos is BCP’s asset securitization subsidiary through which BCP offers local securitization structuring to corporate entities.
Credifondo is BCP’s fund management subsidiary, which offers investment fund products and services. Fund types offered by Credifondo include short/long term, U.S. Dollar and local currency, fixed/variable income and real estate funds.
Trading and Brokerage Services
In 2008, the effects of the international financial crisis hit the Peruvian stock market. The Lima Stock Exchange’s general index, or IGBVL, fell 60% and total trading fell to US$4,963 million (a drop of almost 48%). Fixed Income and Report Operations over the IGBVL reached US$2,668 million, 13% lower than the average volume of 2007.
Although 2008 was a difficult year for stock markets, Credibolsa maintained its leadership position in the Lima Stock Exchange. In 2008, Credibolsa had 19.8% of the total trading volume in variable equity instruments on the Lima Stock Exchange and 49.6% of the volume in trading of fixed income instruments on the Exchange, compared to 19.1% and 35.9% in 2007, respectively. Credibolsa’s trading volume was generated by domestic customers (both retail and institutional), by foreign institutional clients and by our proprietary trading.
We expect a difficult year in 2009 as a consequence of the international financial crisis. However, BCP’s management believes that Credibolsa will continue expanding its business based on its ability to provide appropriate advice to clients while offering various products that meet their requirements. Furthermore, BCP’s wholesale banking marketing represents an important strength that allows it to reach main companies in the local market, while BCP’s branch network helps to expand its business in the retail banking segment.
Treasury, Foreign Exchange and Proprietary Trading
BCP’s treasury and foreign exchange groups are active participants in money market and foreign exchange trading. These groups manage BCP’s foreign exchange positions and reserves and are also involved in analyzing liquidity and other asset/liability matters. The trading desk plays an important role in short-term money markets in Nuevos Soles and in foreign currencies. It has also been active in the auctions of certificates of deposit by Peru’s central bank as well as in financings through certificates of deposit, interbank transactions and guaranteed negotiable notes, among other instruments.
According to BCP’s internal reports, its foreign exchange transaction volume was US$22.7 billion in the forward market, compared to US$17.7 billion in 2007. In the spot market, transaction volume increased from US$49.4 billion in 2007 to US$69.4 billion in 2008.
Since 2007, BCP has adhered to best international cash management practices. BCP created the Assets and Liabilities Management Service (or ALM) which is responsible for managing its balance sheet under the Asset and Liabilities Committee (or ALCO) oversight. ALM is responsible for managing BCP’s balance sheet and for accepting reasonable interest rate and liquidity risks through management of the short- and long-term transfer rates. In 2008, BCP’s active ALM business management created revenues of US$27.6 million.
BCP’s proprietary trading consists of trading and short-term investments in securities, which includes instruments from various countries. These short-term investments are primarily made to facilitate its treasury management and corporate finance efforts. This has become an increasingly important part of BCP’s business, as BCP seeks returns on excess liquidity pending improved lending conditions. During 2008, the investments were mainly oriented to Nuevo Soles-denominated instruments such as BCRP certificates of deposits and government bonds.
Asset Management
Credifondo S.A., Sociedad Administradora de Fondos Mutuos de Inversión en Valores, or Credifondo, provides advice to and operates mutual funds in Peru. It is the largest mutual fund manager in Peru based upon data from the Peruvian securities market authority, the Comisión Nacional Supervisora de Empresas y Valores, or CONASEV. As of December 31, 2008, total Peruvian funds in the mutual funds system amounted to US$2.8 billion, decreasing 34.9% from US$4.3 billion in 2007.
According to CONASEV, as of December 31, 2008, Credifondo managed ten separate funds, with a total of 98,497 participants (38.8% of total participants) compared to 114,340 (41.6% of total participants) in 2007. Among the securities in which the different funds specialize are: equities, U.S. Dollar-denominated bonds, Nuevo Sol-denominated bonds, U.S. Dollar-denominated short-term securities and U.S. Dollar-denominated real estate securities. As of December 31, 2008, Credifondo’s total managed funds amounted to US$1,274 million, decreasing from US$1,956 million as of December 31, 2007. Because these funds are subject to certain volatility, there can be no assurance as to their future performance. As a result, we do not guarantee any return on these investments.
As of December 31, 2008, our Bolivian fund administrator managed a total of US$109.9 million of third-party funds (US$70.9 million in 2007).
Trust, Custody and Securitization Services
According to BCP’s internal reports, BCP holds US$18.0 billion in securities for over 61,105 domestic and foreign clients. BCP provides custody services that include the physical keeping of securities and the payment of dividends and interest. In addition, BCP acts as paying agent for securities of which it does not keep custody. BCP is one of the few banks in Peru qualified to serve as a foreign custodian for U.S. mutual funds. Trust services include (i) escrow, (ii) administration and representation services, (iii) supervision of transactions completed for its clients and (iv) transfer settlement and payment services for local securities issues. These services allow BCP to adequately represent its clients’ activities in the local and international securities markets.
La Fiduciaria S.A., or Fiduciaria, is an associated entity and the first specialized trust services company in Peru. We hold a 45% interest in Fiduciaria. In its eighth year of existence, Fiduciaria has managed trusts for a majority of the institutions in the national financial system, putting itself at the forefront of fiduciary services in Peru. Fiduciaria’s operations encompass sectors including energy, communications, mining, tourism, fishing, education and construction. Fiduciaria ended 2008 with 153 outstanding operations.
(v) Lending Policies and Procedures
BCP’s uniform credit policies and approval and review procedures are based upon conservative criteria and are uniformly applied to all of its subsidiaries. These policies are in accordance with the guidelines established by Peruvian financial sector laws and SBS regulations. (See “—(11) Supervision and Regulation—(ii) BCP,” and the guidelines set forth by our board of directors.)
BCP’s credit approval process is based primarily on an evaluation of the borrower’s repayment capacity and on commercial and banking references. BCP determines a corporate borrower’s repayment capacity by analyzing the historical and projected financial condition of the company and of the industry in which it operates. Other important factors that BCP analyzes include the company’s current management, banking references, past experiences in similar transactions, and collateral to be provided.
For the evaluation of BCP’s corporate borrowers, credit officers prepare a risk assessment report, which analyzes the client’s ability to repay its obligations, determines the probability of default of the client using an internal risk rating model, and defines the maximum credit exposure that the BCP wants to hold with the company.
For BCP’s individual and small business borrowers, it evaluates credits based on the client’s capacity for repayment, a documented set of policies (regarding the client’s financial track record among other issues), and in most cases, credit scores, which assign loan-loss probabilities that relate to expected returns of each market segment. Approximately two-thirds of BCP’s credit card and consumer loan application decisions are made by automatic systems. The complement and all mortgage and small business loans are currently made by credit officers reporting to a centralized unit. In analyzing credit risk, the Retail Banking Group assesses the client’s financial track record and other aspects in order to determine its ability to repay debt. In addition, in every case a loan approval is subject to a number of credit scoring models, which assign loan-loss probabilities that relate to expected returns of each market sector.
Success in the small business and personal lending areas depends largely on BCP’s ability to obtain reliable credit information about prospective borrowers. BCP, together with several partners, formed a credit research company called Infocorp in November 1995. In addition, the SBS has expanded its credit exposure database service to cover all businesses or individuals with any amount borrowed from a Peruvian financial institution. This database includes information on the loan risk category in which the borrowers are classified: “Normal,” “Potential Problem,” “Deficient,” “Doubtful” and “Loss.”
BCP has a strictly enforced policy with respect to the lending authority of its loan officers. It also has procedures to ensure that these limits are adhered to before a loan is disbursed. Under BCP’s credit approval process, the lending authority for middle market, small business, and personal loans is centralized into a specialized credit risk analysis area, whose officers have been granted lending limits. To ensure that loan officers and credit analysis officers are complying with their lending authority, the credit department and BCP’s internal auditors regularly examine credit approvals, in addition to the controls built into the loan approval workflow systems.
The following table briefly summarizes BCP’s policy on lending limits for loan officers and credit risk analysis officers. Requests for credit facilities in excess of the limits set forth below are reviewed by BCP’s general manager, executive committee or, if the amount of the proposed facility is sufficiently large, board of directors.
In US$ thousands | | Risk without collateral or with only personal collateral or guarantee | | | Risk with preferred guarantees (1) | |
| Board of Directors | | Regulatory limit | | | Regulatory limit | |
| Executive Committee | | US$ | 145,000 | | | US$ | 145,000 | |
| General Manager | | US$ | 15,000 | | | US$ | 30,000 | |
| Credit Group Manager | | US$ | 7,500 | | | US$ | 15,000 | |
| Credit Risk Manager | | US$ | 4,000 | | | US$ | 8,000 | |
| Credit Risk Chiefs | | US$ | 1,000 | | | US$ | 3,000 | |
| Retail Credit Risk Manager | | US$ | 500 | | | US$ | 500 | |
| | (1) | Preferred guarantees include deposits in cash, stand-by letters, securities and other liquid assets with market price, mortgages, non-real estate property guarantees and assets generated by leasing operations. |
BCP believes that an important factor in maintaining the quality of its loan portfolio is the selection and training of its loan and risk officers. BCP requires loan officers to have degrees in economics, accounting or business administration from competitive local or foreign universities. In addition, the training program consists of a six-month rotation through all of the business-related areas of BCP and the credit risk analysis area. After the training period is over, trainees are assigned as assistants to loan officers for a period of at least one year before they can be promoted to loan officers. Loan officers also receive additional training throughout their careers at BCP. Laterally-hired officers are generally required to have previously held positions as loan officers.
In general, BCP is a secured lender. As of December 31, 2008, approximately US$4.8 billion of the loan portfolio and contingent credits were secured by collateral, which represents 41.7% of the total loan portfolio based upon BCP’s unconsolidated figures (43.8% as of December 31, 2007 and 43.83% as of December 31, 2006). Liquid collateral is a small portion of the total collateral. In general, if BCP requires collateral for the extension of credit, it requires collateral valued at between 10% and 50% above the facilities granted. The appraisal of illiquid collateral, in particular real estate assets, machinery and equipment, is performed by independent experts when required for specific reasons.
The existence of collateral does not affect the loan classification process according to regulations in effect as of December 1998. Pursuant to Peruvian banking law, secured loans, or the portion thereof covered by collateral, classified in Class “B,” “C,” or “D” risk categories have a lower loan loss provision requirement for Peruvian accounting purposes. If a borrower is classified as substandard or below, then BCP’s entire credit exposure to that borrower is so classified.
BCP conducts unannounced internal audits on the financial statements, consistent with local banking regulation of the different jurisdictions in which it operates.
(vi) Deposits
Deposits are principally managed by BCP’s Retail Banking Group. The main objective of BCP’s Retail Banking Group operations has historically been to develop a diversified and stable deposit base in order to provide a low-cost source of funding. This deposit base has traditionally been one of BCP’s greatest strengths. BCP has historically relied on the more traditional, stable, low cost deposit sources, which it considers to be its core deposits: time, demand deposits, savings and CTS deposits. CTS deposits, or Severance Indemnity Deposits, are funded by companies in the name of their employees. CTS deposits amount to one month’s salary per year and may be withdrawn by the employee only upon termination of employment or upon transfer to another bank, subject to certain exceptions. Exceptions include disposing of 50% of the CTS deposit at any time and disposing of up to 80% at once for home purchase. For the year 2009 and 2010 and as part of the Government program to minimize the impact of the international crisis, individuals may dispose 100% of their CTS deposits.
As of December 31, 2008, deposits represented 84.2% of BCP’s total source funding. BCP’s extensive branch network facilitates access to this type of stable and low-cost funding. BCP’s corporate clients are also an important source of funding for BCP. As of December 31, 2008, BCP’s Wholesale Banking Group accounted for approximately 51% of total deposits. Of all deposits from BCP’s Wholesale Banking Group, 61.8% were Nuevo Sol-denominated and the balance (38.2%) were foreign currency-denominated (almost entirely in U.S. Dollars).
(vii) Support Areas
BCP’s commercial banking operations are supported by its Market Risk Area, which evaluates and helps administer credit relationships, establishes credit policies and monitors credit risk. See “—(4) BCP and Subsidiaries—(v) Lending Policies and Procedures.”
BCP’s Planning and Finance Area is in charge of planning, accounting and investor relations functions and is also responsible for analyzing the economic, business and competitive environment in order to provide the information necessary to support senior management’s decision-making.
In addition to the above, BCP’s Administration Group is generally responsible for information technology, quality control, institutional and public relations, human resources, the legal department, security, maintenance and supplies.
Information Technology
BCP is a technology leader in the Peruvian banking sector. All of BCP’s Retail Banking Group services and a substantial portion of BCP’s corporate banking services are fully computerized. All of BCP’s points of service, including branches, ATMs and POS terminals, are linked to BCP’s data processing center, which permits BCP to monitor and analyze service while allowing most transactions to be executed on a real-time, online basis.
BCP’s technology operations and initiatives are managed by BCP’s electronic data processing and software development departments. These departments develop, install, maintain and operate all of BCP’s software applications, management information and security systems and install branch hardware equipment. BCP’s most critical operational data and software are stored on a mainframe computer system, access to which is controlled by a series of authorized passwords, in the frame of very strong IT security policies.
BCP considers its technology platform to be one of its main competitive strengths and has continued to invest in this area to maintain its competitive position in the banking sector. Therefore, BCP’s investments in IT have provided the computing power, storage capacity, bandwidth and other IT services to the best of their class.
BCP’s Systems and Organization Group’s mission is to act as technological partner with the various businesses of BCP. It designs and manages computer and communications systems, designs and enhances processes, manages strategic projects, and provides consultancy in technological and organizational aspects.
During 2008, BCP’s expenses on systems totaled US$97.9 million, of which US$79.2 million were recurring expenses and US$18.7 million were allocated to specific projects. These totals were higher than those of 2007, which were US$78.7 million, US$61.9 million and US$16.8 million, respectively. BCP’s investments totaled US$60.9 million, of which US$16.6 million were for tactical projects, US$27.5 million for core processes, and US$16.8 million for subsistence projects. Again, these amounts higher were than those reported for 2007 (US$35.1 million, US$13.8 million, US$13.4 million and US$7.9 million, respectively).
During 2008, BCP started an important project to redesign the branches to strengthen interactions among all staff within one single system, optimize work processes and improve customer care. The diagnostic phase of this project and the pilot executed in some branches were carried out with the assistance of a McKinsey team.
Furthermore, to continue with the objective of increasing lending in the Retail Banking Group, BCP expanded its “Loans Integrated Model”, or MIC, to consumer loans. The Loans Integrated Model, which was started in 2007 for credit cards, provides customers instant reply to credit card applications and approved credit lines. In 2009, the system will also be used for mortgage loan screening to give customers point of contact response.
BCP continued to align its systems to the technological architecture by building and implementing shared services. In 2008, two modules of SAP were implemented—human resources and procurement. During 2009, the accounting module will start. Three other important projects were concluded: (i) implementation of the collections management system for retail banking products; (ii) migration of Telecredito system to a new platform, which is more robust, modern and user-friendly, allowing BCP client companies to carry out their transactions more efficiently; and (iii) implementation of a new system to manage clients’ applications and complaints.
As part of the “Excellence in Continuous Operations” program, or ECO program, the new IT center at the La Molina headquarters was inaugurated at the end of 2008. Likewise, BCP concluded the architecture and general design of the new computer center that will be built in Chorrillos to replace the downtown Lima facility. With these two updated and interconnected computer centers, BCP will simultaneously backup operations against incidents in either of them, without service interruptions. BCP’s facilities will include state of the art, highly efficient, reliable and redundant facilities using the most recent techniques and methodologies to guarantee high availability of its services at all times.
BCP has devised the “Improving IT Actions” program, or MAS, to implement the best market practices for its management model. MAS should enhance BCP’s competitiveness and simplify its financial services, allowing it to accomplish tangible and sustainable improvements in quality and time to market. To integrate these efforts, BCP established a new MAS team composed of a group of highly experienced professionals that will receive the advice of a renowned consultancy company, a steering committee and a MAS executive committee drawn from BCP’s main management departments.
In order to streamline the decision-making regarding technology issues in accordance with the strategic objectives of the organization, BCP continues to consolidate its IT governance policy. The Systems Committee, together with the IT Systems and Organization Division, follow up on the condition of the strategic technology projects on a monthly basis. Moreover, BCP has strengthened its IT governance committee, which is led by the Deputy General Manager and includes the Finance Division Manager, the Business and Corporate Banking Division Manager, the Systems and Organization Division Manager, the Marketing Manager, the Business Solutions Manager and the Systems Development Manager.
Marketing
BCP continually works to protect and strengthen the BCP brand. BCP has a proactive attitude towards competition and, focusing on change and innovation, it seeks to promote its products and services by constantly improving them. In this manner, BCP aims to meet market needs with the ultimate purpose of creating the highest possible value for its clients and shareholders. In 2008, BCP continued its strategy which was based on two fronts:
Generating Value: In terms of generating value, BCP continues to develop strategies to approach different customer groups. BCP’s increasing use of Customer Relation Management (CRM) tools across all sectors enables it to reach customers and provide them with personalized offers and terms in a timely manner. In an effort to build long-term relationships, the BCP has boosted its development and training activities. These activities include training programs with small-business owners supported by Universidad del Pacífico, the fair organization ExpoNegocios, and Bodegas y Mercados, as well as intensive seminars conducted in different cities across the country.
Another key element for BCP to create value is innovation. BCP has launched several innovative products, including new service products for very wealthy customers, new benefits for customers whose wages are paid at their BCP accounts, and the development of the Línea Múltiple de Negocios (Multiple Business Line) that allows its customers to meet their financial needs with a comprehensive, easy-to-use product.
Quality in Service: Quality in service is a permanent goal for BCP. BCP has progressed in this area by implementing a new regulation promulgated under the Consumer Protection Law, which included significant investments toward improving service and keeping customers informed about BCP’s products and services. BCP has also implemented longer working hours in its branches.
BCP’s improved processes and supporting tools have enabled it to leverage growing businesses. BCP successfully implemented its new commercial loan disbursement process (promissory notes, loans, advances and issuing bank guarantees nationwide) by using CAPS as a tool. The result was an improvement in BCP’s customer service timing and to reduction in its business consultants’ and assistants’ workload.
(viii) Anti-Money Laundering Policies
BCP and all the companies under our group have adopted corporate policies and procedures for “know your customer,” “know your market,” “know your correspondent bank” and “know your employee” as an integral part of our anti-money laundering program. These policies and procedures are required to be followed by all of BCP’s employees and ultimately are the responsibility of its board of directors, chief executive officer and corporate compliance officer.
BCP’s corporate compliance officer, who is responsible for the monitoring and oversight of the program, is also responsible for coordinating with the compliance officers of each of the foreign branches (BCP Panama and BCP Miami), affiliates (Atlantic Security Bank and Credicorp Securities) and foreign subsidiaries (BCP Bolivia). These institutions must also comply with all regulatory laws established in the countries in which they operate.
The Financial Intelligence Unit is the government entity responsible for receiving, analyzing and disseminating suspicious transaction reports filed by obligated entities. It was created under Law 27693 in April of 2002, as amended by Laws 28009 and 28306, and incorporated under Law 29038 in June 2007 as a specialized unit of the SBS. The Financial Intelligence Unit is autonomous, both functionally and technically.
One of the main banking regulations, Law 838-2008, requires that all financial institutions supervised by the SBS have an anti-money laundering and terrorist financing compliance program that includes adequate policies, monitoring of client operations, evaluation of red flags, registration of all cash operations and a training program for all staff.
(ix) Employees
As of December 31, 2008, BCP had 15,969 employees, compared to 12,667 employees as of December 31, 2007 and 10,769 employees as of December 31, 2006. All employees of banks in Peru are given the option of belonging to an employee union. These employee unions are collectively represented by the Federación de Empleados Bancarios (Federation of Banking Employees or FEB).
(5) Atlantic Security Holding Corporation
ASHC engages in private banking, asset management, proprietary investment and trade finance. ASCH was incorporated in December 1981 in the Cayman Islands and principally serves Peruvian-based customers through banking offices in Panama.
A portion of our commercial banking business is also carried out by ASHC, which principally serves Peruvian private banking customers through offices in Panama. As of December 31, 2008, ASHC had total assets of US$1,454.2 million and shareholders’ equity of US$115.7 million (compared with US$1,615.7 million and US$214.1 million, respectively, as of December 31, 2007). ASHC reported a net loss of US$22.4 million in 2008, compared with a net income of US$39.4 million in 2007 (with both totals including income from dividends). Larger revenues from dividends are a consequence of our strong dividend payments in 2008, resulting from improved earnings in the prior year. Nevertheless, they are not reflected in the consolidated results. As a result, ASHC’s net income attributable to us decreased from US$20.5 million in 2007 to a negative contribution of US$50.4 million in 2008.
Total loans outstanding in ASHC’s portfolio were US$203.2 million and US$131.8 million at December 31, 2008 and 2007, respectively, representing an increase of 54.8%. Deposits decreased 8.1% to US$1,283.6 million at December 31, 2008 from US$1,396.4 million at December 31, 2007. Third-party assets under management decreased 26.8% from US$2,241.8 million in 2007 to US$1,639.3 million in 2008, principally due to the general market meltdown observed during 2008 which directly affected the value of customers’ investment portfolios. ASHC’s past-due loans as a percentage of total loans were 0.0% from 2004 through 2008.
ASHC’s Corporate Banking Group makes working capital and bridge loans. As of December 31, 2008, approximately 41.5% of ASHC’s loans were to Peruvian companies, 0.5% were to companies in Bolivia, 16.3% were to companies in Colombia, 5.8% were to companies in Mexico, and the remainder were to borrowers in other Latin American countries. ASHC’s trade finance activities are conducted by its Corporate Banking Group. ASHC has concentrated its extensions of credit on short-term trade transactions with Latin American countries other than Peru.
ASHC’s policy is to provide funding to customers on the basis of approved lines of credit. ASHC’s Investment Committee meets weekly to discuss the entire credit risk inherent in the risk portfolio, composed of loans and investment securities. ASHC’s loan officers operate within established credit limits ranging from US$50,000 to US$500,000. Regardless of whether an approved facility exists for a client, any transaction in excess of US$500,000 requires the approval of senior management.
In addition, all credit extensions are monitored by ASHC’s general manager and reviewed monthly by the board of directors of ASHC.
ASHC’s Private Banking Group’s clients have traditionally provided a stable funding source for ASHC, as many are long-time clients who maintain their deposits with ASHC. As of December 31, 2008, ASHC had approximately 3,500 customers. Currently, about 95% of ASHC’s private banking clients are Peruvian.
ASHC trades on its own account primarily by making medium-term investments in fixed income securities, equity securities and sovereign debt. Its portfolio includes investment grade and non-investment grade debt securities of public companies and, to a much lesser extent, private U.S. debt and equity issues. Such securities are subject to substantial volatility and there can be no assurance as to their future performance. As of December 31, 2008, ASHC had approximately US$575.6 million, at fair value, invested in these types of securities (US$853.7 million in 2007). ASHC generally utilizes its own funds for these activities rather than borrowings. ASHC also holds an equity investment in us with a fair value of approximately US$730.5 million at December 31, 2008 (US$1,115.6 million at December 31, 2007). ASHC’s investment portfolio, future purchases, sales, overall investment strategy and general profile of its investment portfolio are reviewed on a weekly basis by an investment committee. Its strategic decisions and general investment profile are also assessed on a monthly basis by an Asset-Liability Committee, or ALCO, which is composed of members of its senior management. ASHC’s board of directors reviews and approves country risk exposure limits on a monthly basis. Its credit risk by counterparty is evaluated on a consolidated basis, including direct and indirect risk, such as interbank placements, loans, commitments, guarantees received, and trading securities purchased in the secondary market.
ASHC’s Asset Management Group conducts ASHC’s management of third-party funds which, including the aggregate of third-party assets, had total assets under management of US$1,639.4 million as of December 31, 2008, compared to US$2,241.8 million as of December 31, 2007. This decrease was principally due to the general decrease in market value of its customers’ investment portfolios. Investment decisions for funds, except for outsourced funds, are made by senior officers within ASHC in accordance with guidelines of its Investment Committee.
(6) Pacífico Peruano Suiza
We conduct our insurance activities through Pacífico Peruano Suiza (PPS) and its subsidiaries, El Pacífico Vida and Pacífico Salud, which together make up Pacífico Grupo Asegurador, which provides a broad range of insurance products in the property and casualty, life and health businesses.
In 2008, the six most significant lines together constituted 79.3% of total premiums written by PPS. These six lines are commercial property damage (including fire, earthquake and allied lines and limited liability risks), automobile, health, life and pension fund underwriting and life annuities. PPS is the second leading Peruvian insurance company, including private health companies, with a market share of 34.2% based on net premiums earned and fees in 2008.
In 2008, we were attributed a consolidated net loss from PPS of US$15.9 million as compared to a net gain of US$9.4 million in 2007. PPS’s total premiums increased 26% to US$587.6 million in 2008 from US$467.2 million in 2007, and net premiums earned, net of reinsured premiums and of technical reserves (as defined below in “―(ii) Claims and Reserves”), were US$405.7 million in 2008, increasing 32% compared to 2007.
PPS’s net underwriting results decreased from a gain of US$15.5 million in 2007 to a loss of US$7.7 million in 2008. This is mainly explained by the increase of net claims paid as a percentage of net premiums written from 77.7% during 2007 to 84.3% during 2008.
PPS’s business in property, casualty and private health is highly concentrated, with a client base of over 24,000 companies and over 310,000 individuals, including individuals affiliated with group health insurance programs through the companies by which they are employed. As of December 2008, PPS’s revenues from policies written for its three largest and 20 largest customers represented 6.5% and 19.3% of total premiums in its property and casualty and health insurance business, respectively. PPS’s property insurance lines are sold through agents and brokers, while life insurance is sold by its own sales force. The ten largest brokers in the property and casualty as well as in the private health segment accounted for approximately 41.2% of total premiums as of December 31, 2008 (40.3% as of December 31, 2007).
El Pacífico Vida (or Pacífico Vida), PPS’s life insurance subsidiary, is 38%-owned by ALICO, a subsidiary of AIG. In 2008, Pacífico Vida had total premiums of US$180.4 million, a 31.8% increase from total premiums of US$136.9 million in 2007.
Pacífico Vida’s market share was 27.6% in 2008, versus 25.8% in 2007. Its individual life and personal injury businesses increased by 31.7%, reaching a market share of 32.8%. This increase was mainly due to its development of new products, improvement of productivity and growth of its sales force. Pacífico Vida’s life annuity business expanded 13.7% in total premiums and increased its market share from 19.2% to 19.9%. Its pension fund underwriting business grew 33% with respect to the same period in 2007. Likewise, Group Life and Credit Life increased due to business with BCP such as credit cards and mortgage loans. In 2008, total premiums on Group Life, Group Life Ley and SCTR (limited workers compensation) increased by 28.6%. Credit Life, the most dynamic product, reached an increase of 102% over that of 2007 and represented 11.2% of total direct premiums (compared to 7.3% in 2007). Pacífico Vida generated financial earnings of US$14.5 million in 2008.
Pacífico Salud reported total revenue of US$119.6 million and net loss of US$4.4 million in 2008 due mainly to an increase in claims. The net loss ratio increased to 88.7% in 2008 from 80.1% in 2007.
| (i) | Underwriting, Clients and Reinsurance |
Underwriting decisions for substantially all of PPS’s insurance (property and casualty) risks are made through its central underwriting office. PPS’s own risk management staff inspects most medium and medium-to-large commercial risks prior to their underwriting, whereas third party surveyors are employed to inspect smaller risks. Underwriting standards are approved by its board of directors on a yearly basis.
PPS utilizes reinsurance to limit its maximum aggregate losses and minimize exposure on large risks. Reinsurance is placed with reinsurance companies based on evaluation of the financial capacity of the reinsurer, terms of coverage and price. PPS’s principal reinsurers in 2007 were, among others, Lloyd’s, New Hampshire Insurance Co., Münchener Ruck, Zurich Insurance Ireland Ltd., Hannover Ruck, Brit Insurance Ltd., Zurich Ins. Co., Swiss Reinsurance Co. Ltd., Berkley Insurance Co. and Everest Reinsurance. Premiums ceded to reinsurers represented 18.9% in 2008. PPS acts as a reinsurer on a very limited basis, providing its excess reinsurance capacity to other Peruvian insurers who are unable to satisfy their reinsurance requirements.
As of December 31, 2008, premiums for reinsurance written by PPS totaled US$6.4 million. Although PPS historically has obtained reinsurance for a substantial portion of its earthquake-related risks through excess loss contracts, there can be no assurance that a major catastrophe would not have a material adverse impact on its results of operations or financial condition. See “—(ii) Claims and Reserves.”
Net claims paid by PPS as a percentage of net premiums written (i.e., the net loss ratio) reached 84.3% in 2008, up from 77.7% in 2007.
The net loss ratio in the property and casualty segment, which represented 50.5% of PPS’s premiums in 2008 (51.3% in 2007), increased to 87.2% in 2008 from 80.2% in 2007, mainly due to the low performance of fire and allied lines as well as the technical lines. The net loss ratio from the fire and allied lines, which represented 20.1% of property and casualty premiums in 2008 (22.3% in 2007), increased from 81.4% in 2007 to 105.1% in 2008. The net loss ratio of the technical lines, which was 8.1% of property and casualty premiums in 2008 (9.4% in 2007), decreased from 140.4% in 2007 to 126.7% in 2008.
The net loss ratio in the life insurance lines increased from 70% in 2007 to 74% in 2008, due to the low performance of disability and survivor (pension fund) and of individual annuity.
The net loss ratio of individual annuity, which represented 22.4% of total direct premiums in 2008 (26% in 2007) increased from 70.4% in 2007 to 85.9% in 2008. Disability and survivor insurance increased from 72.9% in 2007 to 84.3% in 2008 and represented 19.8% of total direct premiums (19.6% in 2007).
The net loss ratio in the health insurance lines increased from 82.3% in 2007 to 90.2% in 2008 and represented 19.8% of PPS’s premiums in 2008 (19.5% in 2007).
PPS is required to establish (i) claims reserves with respect to pending claims in its property-casualty business, (ii) reserves for future benefit obligations under its in-force life and accident insurance policies and (iii) unearned premium reserves with respect to that portion of premiums written that is allocable to the unexpired portion of the related policy periods (which are also collectively referred to as technical reserves).
PPS establishes claims reserves with respect to claims when reported, as well as for incurred but not reported (or IBNR) claims. Such reserves are reflected as liabilities in PPS’s financial statements.
PPS records as liabilities in its financial statements actuarially determined reserves calculated to meet its obligations under its life and accident policies and its pension fund underwriting business. These reserves are determined using mortality tables, morbidity assumptions, interest rates and methods of calculation in accordance with international practices.
Pursuant to SBS regulations, PPS establishes pre-event reserves for catastrophic risks with respect to earthquake coverage. See “—(11) Supervision and Regulation—(v) PPS—Reserve Requirements.” In accordance with IFRS principles, the pre-event reserves and income charges for catastrophic reserves are not considered in our consolidated financial statements.
There can be no assurance that ultimate claims will not exceed PPS’s reserves.
| (iii) | Investment Portfolio |
As of December 31, 2008, the book value of PPS’s portfolio (which includes Pacífico Seguros, Pacífico Vida and Pacífico Salud) was US$822.3 million, which included US$40.2 million in equity securities and US$728.1 million in bonds. In addition, real estate investments gross book value reached US$31.8 million. The book value of Pacífico Seguros in 2008 was US$131.2 million and was invested mainly in short-term debt instruments and equity, while Pacífico Vida’s book value was close to US$683.6 million and was mainly invested in long-term debt instruments. Pacífico Salud, on the other hand, had a small portfolio with a book value of US$7.4 million and was mainly invested in short-term debt instruments.
As part of its improvement process, PPS changed its investment policy to employ the best international risk management practices and tools. PPS also incorporated the recommendations of Solvencia II and Basel II with a view to developing a better match of terms and currencies with its liabilities, especially in connection with obligations vis-à-vis PPS’s insured customers.
PPS reported financial income in 2008 of US$70.4 million as compared to US$76.8 million in 2007. This outcome is explained by the growth of the life insurance business’s fixed income and time deposit investments as well as by an impairment made in both the life and property and casualty businesses.
PPS’s investments profits earned during 2008 were lower than those of 2007 due to the international financial crisis and its negative impact on PPS’s equity portfolio. Because of the decrease in the stock market, PPS had to make an impairment of US$11.2 million in December 2008, reporting a net loss of US$0.6 million by year-end, out of the initial profit earned by capital gain in the first eleven months of 2008.
Although large payments were required to cover for significant claims in 2008, cash inflow generated by sales premium, stock sales, fixed income earnings and real estate rent fees allowed Pacífico Seguros to make additional investments. The property and casualty’s equity portfolio decreased from US$56.6 million in 2007 to US$40.2 million in 2008 and its fixed income portfolio increased from US$764.6 million in 2007 to US$782.1 million in 2008, allowing PPS to assure large reserves for possible future claims.
PPS’s main strategy is to have an appropriate match of currencies and terms for its assets and liabilities. Since an important part of its premiums is U.S. Dollar-denominated and much of its current operations are conducted in U.S. Dollars, most of its assets are invested in U.S. Dollars. In 2008, 86.7% of gross premiums received by the property and casualty business were U.S. Dollar-denominated (compared to 71.4% in 2007).
PPS’s investments are made primarily to meet its solvency equity ratio and to provide reserves for claims. PPS manages its investments under two distinct portfolios. The first portfolio is designed to match the liabilities of property, automobile and health lines, and the second portfolio is designed to match the liabilities of life and annuities lines. Each portfolio is managed under the authority of its own committee, which reviews portfolio strategies on a monthly basis. PPS invests in foreign markets, emphasizing investments in the U.S. and European sovereign debt, and has adopted strict policies related to investment decisions. PPS’s investment strategies and policies are reviewed and approved by its board of directors.
We are attempting to expand PPS’s sales network by using the branch network of Banco de Crédito. PPS offers, in collaboration with BCP, a life and health insurance product, personal life insurance product that combines accidental death coverage with renewable term life insurance, car insurance, leasing insurance and credit life.
(7) Grupo Crédito/Prima AFP
Continuing to pursue its strategy of fast growth and positioning in the market, on August 24, 2006, Prima AFP reached an agreement with Grupo Santander Perú S.A. for the acquisition of 99.97% of Unión Vida AFP. Prima AFP’s acquisition was completed for a total of US$141 million, with the final purchase price being determined by arbitration proceedings between the parties. As a result, we received a reimbursement in an approximate amount of US$4.5 million. See Note 2 to Credicorp Consolidated Financial Statements. Of the US$141 million purchase price, US$112 million came from a capital increase and US$29 million came from a BCP loan. Prima AFP subsequently engaged in a tender offer directed at minority shareholders.
In 2008, the pension fund market was stable with competition for transfers being less severe. Prima AFP maintained its leading market position due to a stronger value proposal aimed at providing quality information and service to its members.
Strong productivity by Prima AFP’s sales management helped Prima AFP preserve a high quality portfolio and reach its monthly insurable remuneration (or RAM) growth goals, which is the basis of the its revenues. The sales management’s strong productivity also contributed to Prima AFP maintaining a robust market share.
With regard to contributions collection, Prima AFP maintained the largest market share (32.7% as of December 2008). This figure was slightly lower than the previous year, as market turbulence reduced voluntary contributions.
In the commercial field, Prima AFP strengthened its position by increasing the number of contributors and improving its core source of revenues. Pursuant to in-house estimates based on revenues and taking into account the 1.5% administration fee, Prima AFP’s basis remuneration for revenues increased in 2008. This increase allowed Prima AFP once again to garner the highest share of the market (32.3%).
With respect to investments, weaker international and local financial markets hurt the value of funds under management. Thus, as of December 2008, the value of assets under management was US$4.9 billion, a 30.6% market share.
Prima AFP’s rate of return in the last 24 months placed it in the first and second positions for funds two and three, respectively, and in third position for fund one. In terms of risk-adjusted returns, Prima AFP ranked first for fund two, which is in line with its objective of managing the lowest-risk investments.
In 2008, Prima AFP registered total revenues for US$72.3 million and profits of US$11.2 million (IFRS results) through growth of its revenue base and a gradual reduction in operative expenses.
Income from administration fees reached US$70.7 million, 30.5% higher than 2007. This increase was made possible by a strong contributing client portfolio which has remained stable throughout 2008, and was further supported by a growing Peruvian labor market. In 2008, Prima AFP expected to strengthen its “Voluntary Contribution” product as a complement of its revenues. However, the world’s financial crisis strongly impaired the value of this product and its contribution to the business fell drastically. In accordance the deteriorating market, in 2008 the volume of voluntary contributions under management fell to US$61.9 million as of December 2008. However, the company still holds the largest share in the system (44.7%).
Prima AFP’s personnel expenses reached US$25.8 million, an increase of 14.5% compared to 2007. This outcome was a result of heavier personnel charges (mainly increases in charges for bonuses). This expense would have been higher, however, had it not been for the reduced commercial activity (lower commissions and expenses).
The Peruvian banking sector is currently composed of 16 commercial banking institutions. As of December 31, 2008, BCP (excluding foreign branches) ranked first among all Peruvian banks in terms of assets, deposits and loans with a market share of 36.0% of assets, 37.3% of deposits and 34.0% of loans.
Major Peruvian Banks as of December 31, 2008 | | | | | | | | | |
| BCP | | | 36.0 | % | | | 37.3 | % | | | 34.0 | % |
| BBVA Banco Continental | | | 22.7 | % | | | 21.4 | % | | | 23.5 | % |
| Scotiabank Perú | | | 16.6 | % | | | 17.7 | % | | | 16.2 | % |
| Interbank | | | 9.9 | % | | | 10.1 | % | | | 10.2 | % |
| Banco Interamericano de Finanzas | | | 2.8 | % | | | 3.1 | % | | | 3.0 | % |
Source: SBS
We believe that the Peruvian banking industry will continue to be a competitive environment within a generalized excess liquidity situation. This increased competition may in the future affect our loan growth and reduce the average interest rates that we may charge our customers, as well as reduce our fee income.
Since 1999, excess liquidity at major Peruvian banks has put pressure on margins. We do not intend to pursue corporate lending opportunities that are unprofitable solely in order to maintain market share. We expect BCP’s corporate banking to grow at levels similar to GDP growth. We will seek to maintain our close relationships with corporate customers, focusing on providing prompt responses to their requirements and setting competitive prices. To this end, we are currently updating our information systems to improve customer service and to allow management to obtain information on customer and business profitability more efficiently. We also intend to expand the range of BCP’s investment banking and cash management products.
In its core corporate lending and trade finance businesses, ASHC principally competes with larger international institutions. ASHC attributes its ability to compete effectively with larger lending institutions to its (i) aggressive marketing efforts, (ii) ability as a smaller, more flexible institution to make decisions quickly and respond rapidly to customer needs, (iii) association with BCP and (iv) superior knowledge of the region, particularly the Peruvian market.
In BCP’s Wholesale Banking Group, its Corporate Banking Area has experienced increased competition and pressure on margins over the last few years. This is primarily the result of new entrants into the market, including foreign and privatized commercial banks, as well as local and foreign investment banks and non-bank credit providers, such as pension fund administrators (or AFPs) and mutual fund companies.
In addition, Peruvian companies have gained access to new sources of capital through the local and international capital markets. In recent years, the AFPs and mutual funds-managed assets have increased at rates over those experienced by the banking system. The private pension fund assets reached US$15.9 billion as of December 31, 2008, contracting by 22.1% since December 31, 2007 (when funds totaled US$20.4 billion), due to the effect of the international financial crisis on the Peruvian stock market and pension fund system. Total mutual funds reached US$2.8 billion in 2008, a 35.8% decrease from US$4.3 billion in 2007, which was also due to the crisis.
| | (iii) | Other Financial Institutions |
Other institutions in the Peruvian financial system tend to specialize in a given market sector. These institutions include finance companies, municipal and rural savings and credit associations, municipal public credit associations, and savings and credit cooperatives. They mainly issue retail loans to small and micro-businesses and consumer and mortgage loans to individuals. These markets have shown substantial increases in recent years. BCP is facing strong competition from these credit providers, primarily with respect to (i) micro-business loans, where such providers lent US$1.6 billion as of December 31, 2008, or 47.2% of the total in the financial system, and (ii) consumer loans, where such providers lent US$623.9 million, or 10.6% of the total in the financial system. BCP also faces strong competition in its credit card operations from credit cards issued by retail stores.
In retail banking, we have found that small businesses are able to borrow from banks at better rates than those provided by suppliers. The rates offered by BCP are competitive with those of other banks and other types of financial institutions.
We believe that BCP’s reputation as a sound institution, together with its nationwide branch network coverage, provides it with an advantage over its principal competitors.
Peruvian insurance companies compete principally on the basis of price, as well as on the basis of name recognition, customer service and product features. PPS believes that its competitive pricing, solid image, and quality of customer service are significant aspects of its overall competitiveness. In addition, PPS believes that its long relationship with AIG has provided PPS with competitive advantages through access to AIG’s expertise in underwriting, claims management and other business areas. While increased foreign entry into the Peruvian insurance market may put additional pressure on premium rates, particularly for commercial coverage, PPS believes that in the long-term foreign competition will increase the quality and strength of the industry. PPS believes that its size and its extensive experience in the Peruvian insurance market provide it with a competitive advantage over foreign competitors.
However, competition in the Peruvian insurance industry has increased substantially since the industry was deregulated in 1991, with particularly strong competition in the area of large commercial policies, for which rates and coverage typically are negotiated individually. The loss by PPS to competitors of even a small number of major customers or brokers could have a material impact on PPS’s premium levels and market share.
| (9) | Peruvian Government and Economy |
While we are incorporated in Bermuda, substantially all of BCP’s and PPS’s operations and customers are located in Peru. Although ASHC is based outside of Peru, a substantial number of its customers are also located in Peru. Accordingly, our results of operations and financial condition could be affected by changes in economic or other policies of the Peruvian government, which has exercised and continues to exercise a substantial influence over many aspects of the private sector. Also, our results of operations and financial condition may be affected by other political or economic developments in Peru, such as a devaluation of the Nuevo Sol relative to the U.S. Dollar or the imposition of exchange controls by the Peruvian government. See “Item 10. Additional Information—(D) Exchange Controls.” Our results of operations and financial condition are dependent on the level of economic activity in Peru.
During the past several decades, Peru has had a history of political instability that has included military coups d’état and different governmental regimes, which in the past have frequently intervened in the nation’s economy and social structure. See “Item 3. Key Information—(D) Risk Factors.” In 1987, the administration of President Alan García attempted to nationalize the banking system. Facing an attempt by the state to control BCP, the majority shareholders of BCP at that time sold a controlling interest in BCP to its employees, which prevented the government from gaining control of BCP. See “—(C) Organizational Structure.”
In the past, Peru experienced significant levels of terrorist activity, which escalated in the late 1980s and early 1990s. See “Item 3. Key Information—(D) Risk Factors.” Upon being elected to office in 1990, President Alberto Fujimori’s government made substantial progress in suppressing Shining Path and MRTA terrorist activity, including the arrest of the leader and second level of leadership in each terrorist group, as well as approximately 2,000 others.
Between 1990 and 2000, President Fujimori implemented a broad-based reform of Peru’s political system, economy and social conditions. See “Item 3. Key Information—(D) Risk Factors.” President Fujimori resigned in 2000 in favor of a transitory government due to an outbreak of corruption scandals. President Toledo then assumed the presidency in 2001 after two years of political turmoil, facing high unemployment and underemployment, an economic recession and social need.
Despite the economic strides achieved between 1990 and 2000, poverty remains a persistent problem in Peru, with more than half of the population living below the poverty line, which the World Bank defines as monthly income of less than US$60 per capita, adjusted to reflect differences in purchasing power. A significant number of Peruvians live on an income of less than US$30 per capita per month.
Peru has experienced continuous economic growth since the second half of 2001. President Toledo retained, for the most part, the economic policies of the previous government, focusing on achieving sustained economic growth by: increasing exports, reducing unemployment, reforming the tax system (primarily by increasing the tax base and improving tax collection), fostering private investment by promoting concessions, maintaining low inflation and the floating exchange rate, improving oversight, transparency guidelines and requirements in regulated sectors of the economy, improving the efficiency of the public sector, and maintaining open trade policies.
President Toledo transferred the presidency to Alan García Pérez on July 28, 2006, following Mr. García’s victory in the run-off of the presidential elections held on June 4, 2006. Mr. García has sent positive signals to the international financial markets and has substantially retained the economic policies of the previous government.
At the beginning of the 1990s, President Fujimori liberalized price and wage controls in the private sector, eliminated all restrictions on capital flows, instituted emergency taxes to reduce the fiscal deficit and liberalized interest rates. Furthermore, his government established an agenda to institute a wide-ranging privatization plan and re-establish relations with the international financial community. President Toledo, and now President García, continued these market-oriented policies but, facing some populist initiatives from Congress and social pressures from unions and regional movements, they have passed some interventionist measures.
In the late 1980s and early 1990s, the Peruvian economy was very volatile. Since 1999, Peruvian economy has grown continuously. Between 2001 and 2008, each year Peru’s economic growth has been higher than in the previous year, with a 5.9% annual average. For this year, several risks of a different nature may have influence on growth (i.e., the global financial crisis, a severe worsening in Latin American economic conditions and the swine flu), but even in a global comparison, it is expected that Peru will be among the countries with higher growth.
In 2008, the main driver for growth was domestic demand since exports lost dynamism in a context of deteriorated global market. Although investment was a key factor on growth, with public investment growing almost 50%, its contribution to total growth was only 17%, which was lower than the contribution of private consumption and of private investment. For 2009, the importance of public expenditure is not its ability to replace private expenditure, but its role to generate positive expectations on private consumers and investors.
The decision of the United States in August 2002 to renew and expand tax benefits through the ATPDEA for certain Latin American export products was very beneficial to the manufacturing sector because of its inclusion of Peruvian textiles. In May 2004, a free trade agreement began to be negotiated with the United States, together with Colombia and Ecuador. During 2007, the Free Trade Agreement (FTA) with the United States was signed and the trade deal was put into effect on February 1, 2009, concluding a long process of trade negotiations and goodwill. The FTA makes permanent the special access to the U.S. market currently enjoyed under the Andean Trade Promotion and Drug Eradication Act. The current trade between these countries is about US$11 billion annually (18.5% of total trade). The FTA is expected to encourage higher export growth and diversification, as well as accelerate reforms that will further enhance the investment climate in Peru, which is already benefiting from foreign direct investment at historic highs. During the 2008 APEC Summit, important progress was made towards the FTA with China, which has been recently ratified. According to the Ministry of Foreign Trade and Tourism, the other Asian countries with free trade agreements in progress are Japan, Thailand and South Korea.
It has taken almost two decades of continued implementation of sound economic policies and a strong political commitment to generate a notable improvement in Peru’s economic condition. Peru’s strong macroeconomic performance was underpinned by wide-ranging structural reforms to improve the functioning of markets, foster private sector participation, and modernize the role of the state. In the early 1990s, Peru was one of the first emerging countries to undertake a simultaneous trade and capital account liberalization, accompanied by a flexible exchange rate regime and a deep reform of the financial system. Among several important transformations aimed at enhancing external competitiveness and investor confidence, Peru modernized the civil service and reformed the labor market. Peru’s authorities remain committed to prudent financial policies to preserve the macroeconomic stability and a further deepening of structural reforms to sustain growth and entrench poverty reduction.
Peru’s trade surplus in 2008 was US$3.1 billion which was well below its 2006 record (US$9 billion). In the last quarter of 2008 Peru had its first trade deficit since the first quarter of 2002. This decline was caused by a steep increase in imports (45.1%) due to higher commodity prices and to a construction boom that has stimulated capital goods imports, specifically for pipelines. Exports grew only 13.1% as a consequence of the international crisis. Traditional products reported a slowdown in its trend, increasing only 10.9%, in a context of reduction in prices mainly during the second half of the year. On the other hand, no traditional products grew 19.7%.
Peru has had a history of high and persistent current account deficits. In 2006, however, Peru had a record surplus of US$2.9 billion, which is equivalent to 3.1% of its GDP. This amount decreased in 2007, with a surplus of US$1.2 billion (1.1% of GDP) and became a deficit again in 2008 (US$4.2 million, or 3.3% of GDP).
Peru’s financial account had a surplus of US$0.7 billion in 2006, due mainly to repayment of external debt made by the public sector. This account grew substantively in 2007 and reached US$8.3 billion due mainly to higher foreign direct investment and long-term loans. The decrease in 2008 was concentrated in the last quarter due mainly to the behavior of foreign direct investment.
The flow of foreign direct investment, or FDI, into Peru was US$3.5 billion in 2006 and US$5.3 billion in 2007. Despite the US$4.0 billion in 2008 FDI, the result was not necessarily bad news as during the last quarter of 2008, Peruvian companies increased their participation in other Latin American companies, which resulted in a US$1 billion net outflow.
The inflation rate in Peru, as measured by the Lima consumer price index, has fallen from 7,650.0% in 1990 to 1.1% in 2006. However, despite the Peruvian Central Bank’s 2% inflation goal, with a +/-1% range, inflation was 3.9% in 2007 and 6.7% in 2008, due to higher international commodity prices (with Peru being a net importer of fuel and food).
The average bank market exchange rate for Nuevos Soles in Peru was S/.3.14 per US$1.00 on December 31, 2008, a 4.7% depreciation after a 6.5% average appreciation during 2006 and 2007. The Nuevo Sol was getting stronger during the first half of the year because of an attractive interest rate differential that stimulated a short-run dollar inflow. This excess of dollars in the market was countered by the Central Bank buying dollars in market. While the Central Bank issued deposit receipts to “sterilize” the amount of its interventions to avoid speculations, the Central Bank generated a 120% reserves rate for non-resident deposits in Nuevos Soles. This measure was effective and, together with higher worries about emerging markets in the second half of 2008, the exchange rate increased from S/.2.69 per dollar on April 3 to S/.3.14 per dollar at the end of the year.
The sound policy framework put in place in recent years and the build up of international reserves have contributed to significantly reduce Peru’s economic vulnerabilities and poverty (even though poverty still affects almost 40% of the population) and enhance its business environment. Peru’s strong fiscal surpluses in recent years have also supported a significant reduction in public debt and improved maturity structure. In the current uncertain global outlook, these are important fiscal buffers. A sound monetary policy, well-established in a framework that targets inflation, has also been instrumental in helping to maintain macroeconomic stability and reduce dollarization. Structural reforms have reduced Peru’s fiscal and financial vulnerabilities. Free trade agreements and the search of new markets to open new trade destinations, lower informality, and improvement in the business climate have helped improve Peru’s long-term growth prospects, which are reflected in a higher investment and a higher potential growth.
These achievements have placed Peru in a strong position to face the expected deterioration in external conditions. Building on Peru’s strong fundamentals, including a resilient financial system, several measures have been appropriately implemented by the authorities that will help to limit spillovers, preserve adequate liquidity conditions in the domestic markets, and bolster domestic confidence. As a result, orderly liquidity conditions in the financial system have been preserved, but recent data show some increase in deposit and credit dollarization, although in the long term it has decreased to 57.5% in 2008 from 80.5% in 2001.
Peruvian authorities have been implementing reforms to further strengthen its financial system. Large official reserves—currently over US$30 billion, equivalent to 13 months of imports—and strong financial soundness indicators, along with the banks’ limited financial reliance on external funding, have helped preserve the system’s stability. Peruvian authorities have recently introduced prudential measures, including more restrictive rules for consumer credit and new dynamic provisioning made effective last December, and strengthened banks’ minimum capital requirements as Basel II is gradually implemented.
On the fiscal side, Peruvian authorities have announced several measures to shield its economy from the global crisis and enhance confidence. These measures include maintaining a program of public investment as well as maintaining support for construction, micro and small enterprises, exporters, and social programs. To further boost confidence, the authorities have also lined up access to contingent credit lines from official creditors. The total amount of these programs is over US$3 billion, which is financed with the public savings of previous years. The issue is currently not whether the government has enough resources to implement its countercyclical policy, but rather the pace at which it is implementing such policy in the context where central government decisions have lost importance and resources have been increasingly transferred to local and regional governments.
As a result, the near term domestic economic outlook still remains favorable, although risks remain on the downside. The pace of economic growth is expected to decelerate to 3.0% in 2009, reflecting the global slowdown, lower terms of trade, and tighter financial conditions that would affect net exports and private investment. With the global price disinflation underway, inflation should decelerate toward the 2% (+/- 1%) target range. A more severe and prolonged global slowdown could also extend the downside risks into 2010, although there is currently a low probability of such scenario. Nevertheless, Peru’s medium-term prospects are favorable and require preserving prudent macroeconomic policies and dealing with long-standing structural challenges.
| (10) | The Peruvian Financial System |
As our activities are conducted primarily through banking and insurance subsidiaries operating in Peru, a summary of the Peruvian financial system is set forth below.
On December 31, 2008, the Peruvian financial system consisted of the following principal participants: the Central Bank, the SBS, 13 banking institutions (not including Banco de la Nación, a Peruvian state-owned bank), four finance companies and five leasing companies. In addition, Peru has various mutual mortgage associations, municipal and rural savings and credit associations, municipal public credit associations and savings and credit cooperatives.
The present text of Law 26702 was passed in December 1996. Law 26702 regulates Peruvian financial and insurance companies. In general, it provides for tighter loan loss reserve standards, brings asset risk weighting in line with Basel Committee on Banking Regulations and Supervisory Practices of International Settlements (or the Basel Accord) guidelines, broadens supervision of financial institutions by the SBS to include holding companies, and includes specific treatment of a series of recently developed products in the capital markets and derivatives areas. The primary law governing the Peruvian financial system before the enactment of Law 26702 was Legislative Decree 637, passed in 1991 and amended by Legislative Decree 770, which substantially reformed the Peruvian financial system and modified regulations initially issued in 1930.
The Central Reserve Bank (or the Central Bank) was established in 1922. Pursuant to the Peruvian Constitution, its primary role is to ensure the stability of the Peruvian monetary system. The Central Bank regulates Peru’s money supply, administers international reserves, issues currency, determines Peru’s balance of payments and other monetary accounts, and furnishes information regarding the country’s financial situation. It also represents the government of Peru before the IMF and the Latin American Reserve Fund (a financial institution whose purpose is to provide balance of payments assistance to its member countries by granting credits or guaranteeing loans to third parties).
The highest decision-making authority within the Central Bank is its seven-member board of directors. Each director serves a five-year term. Of the seven directors, four are selected by the executive branch and three are selected by the Congress. The Chairman of the Central Bank is one of the executive branch nominees but must be approved by Peru’s Congress.
The Central Bank’s board of directors develops and oversees monetary policy, establishes reserve requirements for entities within the financial system, and approves guidelines for the management of international reserves. All entities within the financial system are required to comply with the decisions of the Central Bank.
The SBS, whose authority and activities are discussed in “—(11) Supervision and Regulation,” is the regulatory authority in charge of implementing and enforcing Law 26702 and, more generally, supervising and regulating all financial, insurance and pension fund institutions in Peru.
In June 2008, Law 1028 and 1052 were approved modifying Law 26702 with the following objectives: (i) to strengthen and to increase competitiveness, (ii) to implement Basel II and (iii) to adapt the current regulatory framework to the Agreement of Commercial Promotion, APC, signed between Peru and the United States.
The main amendments defined in Law 1028 were aimed to promote the development of Peruvian capital market by extending the range of financial services that could be offered by microfinance institutions (i.e., non-banks) without requiring SBS permission.
Law 1028 also modified the framework in which the Peruvian financial system is to be harmonized with the new international standards established by the Basel II Accord (which aims to minimize the issues regarding regulatory arbitrage). Starting in July 2009, Peruvian financial institutions will apply the standardized method to calculate their capital requirement related to credit, market and operational risk. Also, from July 2009, the SBS will start receiving applications to use Internal Models Methods for any of these three risks. Meanwhile, if an institution requires lower capital using its internal models than by using the current approach, it will have to maintain between 80% and 95% of the higher amount during the first years.
Law 1052 aims to include and synchronize Law 26702 and the APC’s framework, particularly regarding insurance services. The amendments allow offering cross-border services and have simplified the process for international institutions to enter into the Peruvian market by establishing subsidiaries.
| | (iv) | Financial System Institutions |
Under Peruvian law, financial system institutions are classified as banks, financing companies, other non-banking institutions, specialized companies and investment banks. BCP is classified as a bank.
Banks
A bank is defined by Law 26702 as an enterprise whose principal business consists of (i) receiving money from the public, whether by deposits or by any other form of contract, and (ii) using such money (together with the bank’s own capital and funds obtained from other sources) to grant loans or discount documents, or in operations that are subject to market risks.
Banks are permitted to carry out various types of financial operations, including the following: (i) receiving demand deposits, time deposits, savings deposits and deposits in trust; (ii) granting direct loans; (iii) discounting or advancing funds against bills of exchange, promissory notes and other credit instruments; (iv) granting mortgage loans and accepting bills of exchange in connection with the mortgage loans; (v) granting conditional and unconditional guaranties; (vi) issuing, confirming, receiving and discounting letters of credit; (vii) acquiring and discounting certificates of deposit, warehouse receipts, bills of exchange and invoices of commercial transactions; (viii) performing credit operations with local and foreign banks, as well as making deposits in those institutions; (ix) issuing and placing local currency and foreign currency bonds, as well as promissory notes and negotiable certificates of deposits; (x) issuing certificates in foreign currency and entering into foreign exchange transactions; (xi) purchasing banks and non-Peruvian institutions which conduct financial intermediation or securities exchange transactions in order to maintain an international presence; (xii) purchasing, holding and selling gold and silver as well as stocks and bonds listed on one of the Peruvian stock exchanges and issued by companies incorporated in Peru; (xiii) acting as financial agent for investments in Peru for external parties; (xiv) purchasing, holding and selling instruments evidencing public debt, whether internal or external, as well as obligations of the Central Bank; (xv) making collections, payments and transfers of funds; (xvi) receiving securities and other assets in trust and leasing safety deposit boxes; and (xvii) issuing and administering credit cards and accepting and performing trust functions.
In addition, banks may carry out financial leasing operations by forming separate departments or subsidiaries. Banks may also promote and direct operations in foreign commerce, underwrite initial public offerings, and provide financial advisory services apart from the administration of their clients’ investment portfolios. By forming a separate department within the bank, universal banks may also act as trustees in trust agreements.
Law 26702 authorizes banks to operate, through their subsidiaries, warehouse companies, securities brokerage companies and leasing companies, and to establish and administer mutual funds.
Branches of foreign banks enjoy the same rights and are subject to the same obligations as branches of Peruvian banks. Multinational banks, with operations in various countries, may perform the same activities as Peruvian banks, although their foreign activities are not subject to Peruvian regulations. To carry out banking operations in the local market, multinational banks must maintain a certain portion of their capital in Peru, in at least the minimum amount that is required of Peruvian banks.
Finance Companies
Under Law 26702, finance companies are authorized to carry out the same operations as banks, with the exception of (i) issuing loans as overdrafts in checking accounts, (ii) participating in certain derivative operations, (iii) starting securitization operations and (iv) establishing subsidiaries in certain specialized fields, such as bonded warehouses, currency transportation and custody, among others.
Other Financial Institutions
The Peruvian financial system has a number of less significant entities which may provide credit, accept deposits or otherwise act as financial intermediaries on a limited basis. Leasing companies specialize in financial leasing operations where goods are leased over the term of the contract and in which one party has the option of purchasing the goods at a predetermined price. Savings and loans associations or cooperatives may accept certain types of savings deposits and provide other similar financial services.
Peru also has numerous mutual housing associations, municipal savings and credit associations, savings and credit cooperatives and municipal credit bureaus. The impact of these institutions on the financial system in Peru has not been significant.
Insurance Companies
Since the Peruvian insurance industry was deregulated in 1991, insurance companies have been authorized to conduct all types of operations and to enter into all forms of agreements that are needed to offer risk coverage to customers. Insurance companies may also invest in financial and non-financial assets, although they are subject to the regulations on investments and reserves established in Law 26702 and the regulations issued by the SBS.
Law 26702 is the principal law governing insurance companies in Peru. The SBS is charged with the supervision and regulation of all insurance companies. The formation of an insurance company requires prior authorization of the SBS.
The insurance industry has experienced consolidation in recent years with the number of companies decreasing from 19 in 1991 to 13 in 2008.
| (11) | Supervision and Regulation |
Currently there are no applicable regulations under Bermuda law that are likely to materially impact our operations as they are currently structured. Under Bermuda law, there is no regulation applicable to us, as a holding company, that would require that we separate the operations of our subsidiaries incorporated and existing outside Bermuda. Since our activities will be conducted primarily through our subsidiaries in Peru, the Cayman Islands and Bolivia, a summary of Peruvian banking and insurance regulations and Cayman Islands banking regulations is set forth below.
We are, along with BCP, subject to certain requirements set forth in Law 26702 as well as certain SBS regulations, including SBS Resolution No.0446-2000, which was enacted in June 2000 and which approved the “Regulation of the Consolidated Supervision of Financial and Mixed Conglomerates.” These regulations affect BCP and us primarily in the areas of reporting and risk control guidelines, limitations, ratios and capital requirements.
Because at year-end our common shares are listed on the Lima Stock Exchange in addition to the New York Stock Exchange, we are subject to certain reporting requirements of the CONASEV, the securities market regulator, and the Lima Stock Exchange. See “Item 9. The Offer and Listing—(C) Markets—The Lima Stock Exchange—(ii) Market Regulation.”
Overview
BCP’s operations are regulated by Peruvian law. The regulations for the operations of the Peruvian financial sector are stated in Law 26702. The SBS periodically issues resolutions that cause Law 26702 to be implemented and enforced. See “—(10) The Peruvian Financial System.” The SBS, under the direction of the Superintendency of Banks and Insurance Companies, supervises and regulates entities that Law 26702 classifies as financial institutions. These entities include commercial banks, finance companies, small business finance companies, savings and loan corporations, financial services companies such as trust companies and investment banks, and insurance companies. Financial institutions must seek the SBS’s authorization before beginning new operations.
BCP’s operations are supervised and regulated by the SBS and the Central Bank. Those who violate Law 26702 and its underlying regulations are subject to administrative sanctions and criminal penalties. Additionally, the SBS and the Central Bank have the authority to issue fines to financial institutions and their directors and officers if they violate the laws or regulations of Peru, or their own institutions’ bye-laws.
CONASEV is the Peruvian government institution in charge of (i) promoting the securities markets, (ii) making sure fair competition takes place in the markets, (iii) supervising the management of businesses that trade in the markets and (iv) regulating their activities and accounting practices. BCP must inform CONASEV of significant events that affect its business and is required to provide financial statements to the Lima Stock Exchange each quarter. BCP is regulated by CONASEV through Credibolsa, which is BCP’s wholly-owned brokerage house, and Credifondo, which is BCP’s wholly-owned mutual fund administration company. CONASEV examines Credibolsa and Credifondo on a regular basis.
Under Peruvian law, banks may conduct brokerage operations and administer mutual funds but must do so through subsidiaries. However, bank employees may market the financial products of the bank’s brokerage and mutual fund subsidiaries. Banks are prohibited from issuing insurance policies, but are not prohibited from distributing insurance policies issued by insurance companies.
Authority of the SBS
Peru’s Constitution and Law 26702 (which contains the statutory charter of the SBS) grant the SBS the authority to oversee and control banks and financial institutions (with the exception of brokerage firms), insurance and reinsurance companies, companies that receive deposits from the general public and other similar entities as defined by the law. The SBS is also responsible for supervising the Central Bank to ensure that it abides by its statutory charter and bye-laws. Law 27328, enacted in July 2000, transferred to the SBS the supervision and regulation of the private AFPs which had been previously supervised and regulated by a specialized superintendency.
The SBS is granted administrative, financial and operating autonomy. Its objectives include protecting the public interest, ensuring the financial stability of the institutions over which it has authority and punishing violators of its regulations. Its responsibilities include: (i) reviewing and approving, with the assistance of the Central Bank, the establishment and organization of subsidiaries of the institutions it regulates; (ii) overseeing mergers, dissolutions and reorganization of banks, financial institutions and insurance companies; (iii) supervising financial, insurance and related companies from which information on an individual or consolidated basis is required, through changes in ownership and management control (this supervision also applies to non-bank holding companies, such as us); (iv) reviewing the bye-laws and amendments of bye-laws of these companies; (v) issuing criteria governing the transfer of bank shares, when permitted by law, for valuation of assets and liabilities and for minimum capital requirements; and (vi) controlling the Central de Riesgos (Bank Risk Assessment Center), to which all banks are legally required to provide information regarding all businesses and individuals with whom they deal without regard to the amount of credit risk (the information provided is made available to all banks to allow them to monitor individual borrowers’ overall exposure to Peru’s banks). In addition to the SBS supervising BCP, we are also supervised by the SBS on the basis that we are a financial conglomerate conducting the majority of our operations in Peru.
Management of Operational Risk
SBS Resolution No. 006-2002 established guidelines for operational risk management, which includes a broad range of risks. Resolution No. 006-2002 defines operational risks as those dealing with the possibility of suffering financial losses due to deficiencies in internal procedures, information technology or personnel, or the occurrence of adverse external events. It also establishes responsibilities for developing policies and procedures to identify, measure, control and report such risks. Banks are required to adequately manage risks involved in the performance and continuity of their operations and services. This is required so that banks will minimize their possible financial losses and reputation damage due to policies or procedures that are inadequate or do not exist.
Following these SBS guidelines, the guidelines issued by the Basel Committee on Banking Supervision, and the advice of international consultants, we have appointed a specialized team that is responsible for operational risk management across our organization. This team reports regularly to our risk committee, top managers and board of directors.
We intend to be guided by the risk control standards of international financial institutions that are noted for their leadership in this field. Our overall objective is to implement an efficient and permanent monitoring system to control operational risks, while the actual management of risk control procedures is conducted by the areas that carry out critical activities.
During 2008, we broadened the responsibility of our operational risk team. Currently, along with critical processes and new products risk analysis, we are assessing operational risks related to critical suppliers, critical information assets, and technological components.
We have also fully developed the business continuity management, or BCM, discipline, which involves the implementation of continuity plans for critical business processes, incident management and training and testing.
Furthermore, based on the SBS Resolution No. 037-2008 “Integral Management of Operational Risk” (published on January 2008), we have consolidated our procedures to register, collect, analyze and report operational losses.
Pursuant to Section 404 of the Sarbanes-Oxley Act of 2002, we are required to make certain certifications regarding our internal controls over financial reporting as of December 31, 2008. We have developed internal methods to evaluate how effective our internal controls are over our financial reporting. In addition, we are implementing computer programs that will allow us to continuously monitor, assess and document our internal controls. During 2008, we evaluated our internal controls over financial reporting and obtained the attestation of our independent auditors. See “Item 15. Controls and Procedures.”
Capital Adequacy Requirements
Since the approval of Legislative Decree 637 in 1991, the SBS has issued capital adequacy requirements for credit institutions and adopted a framework that is structurally similar to that proposed by the Basel Accord. Weights that were assigned to various classes of assets and the contents of the classifications were initially more stringent under Legislative Decrees 637 and 770 than under the Basel Accord. Law 26702 has adopted criteria similar to the Basel Accord and provides for five categories of assets, with different risk weights assigned to each category. The categories range from risk-free assets, to which a weight of 0% is assigned, to assets which require a weight of 100%. Banks are required to prepare and submit to the SBS, within the first 15 days of each month, a report that analyzes the bank’s assets for the previous month and totals its regulatory capital. Foreign currency-denominated assets are valued in Nuevos Soles at the SBS average exchange rate in effect as of the date of the report.
According to Article 184 of Law 26702, regulatory capital consists of the sum of (i) paid-in capital, legal reserves, discretionary reserves (if any), reserves incurred but not specifically identified loan losses in the loan portfolio or other indirect credit exposure (up to 1% of the total value of both) and a percentage of certain subordinated bonds issued by the bank, less (ii) equity investments in all consolidated subsidiaries. According to Article 184, regulatory capital can be segmented and applied to cover credit risks and market risks. SBS regulations require the segregation of regulatory capital to cover foreign exchange risk exposure and to cover risk related to investments in equity shares.
Law 26702 required that the total amount of risk-weighted assets cannot exceed 11 times the regulatory capital of the bank, which means that BCP must maintain regulatory capital at a level of at least 9.09% of its total risk-weighted assets. The limit of 11 times risk-weighted assets to regulatory capital was phased in and became effective in December 1999. Any bank that is not in compliance with the capital adequacy requirements of Law 26702 is required to post a special deposit with the Central Bank, which is frozen until the bank is within the capital adequacy requirements. Regulatory capital in excess of credit risk requirements may be applied to cover market risks. In general, foreign exchange risk positions require a coverage of 9.09% of regulatory capital. As of December 31, 2008, BCP’s unconsolidated amount of risk-weighted assets was 8.68 times the regulatory capital, or regulatory capital was 11.52% of risk-weighted assets.
Regulations for the supervision of market risks require banks to establish internal policies and procedures to monitor these risks, as well as market risk exposure limits. These regulations define market risks as the probable loss derived from exposure to various classes of commodities, securities, foreign exchange, derivative operations or commercial assets that banks may hold and that that could be registered or not in their balance sheets.
As explained in “—(ii) The Peruvian Financial System,” from July 2009 onwards, financial institutions will calculate their capital requirements using the standardized methods based on the Basel II Accord (Law 1028). Furthermore, Law 1028 established that banks require capital that is higher or equal to 10% of risk weighted assets from credit risk plus 10 times the requirement for market and operational risks. The ratio will be implemented gradually until July 2011.
The new Article 184 of Law 26702, as modified by Law 1028, provides that regulatory capital of banks may be used to cover credit risk, market risk and operational risk. Regulatory capital is composed of the sum of basic capital and supplementary capital, and is calculated in accordance with the following procedure:
| | · | Basic Capital: Basic capital, or Tier 1 capital, is calculated in accordance with the following: (i) add paid-in-capital (which includes common stock and perpetual non-cumulative preferred stock), legal reserves, supplementary capital premiums and such voluntary reserves that can only be reduced with prior written consent of the Superintendency of Banks, Insurance and Pension Funds (also referred to below as the Superintendency); (ii) add retained earnings of past years and the current year (for which capitalization has been agreed upon); (iii) add other elements that have characteristics of permanence and loss absorption that are similar to elements in item (i) above, according to the regulations to be issued by the Superintendency; (iv) deduct any losses of past years and of the current year, as well as deducting any deficit of loan loss provisions; (v) deduct any goodwill resulting from a corporate reorganization and from any acquisition of investments and (vi) deduct half of the amount referred to under paragraph C below. Absent any Tier 2 capital components, 100% of the amount referred to under the paragraph below titled “Deductions” must be deducted from Tier 1 capital. The elements referred to under item (iii) above should not exceed 17.65% of the amount resulting from adding all components listed under items (i), (ii), (iv) and (v) in this paragraph. |
| | · | Supplementary Capital: Supplementary capital is calculated by the sum of Tier 2 capital and Tier 3 capital. Tier 2 capital should be calculated in accordance with the following: (i) add voluntary reserves that may be reduced without any prior consent from the Superintendency; (ii) add the eligible portion of redeemable subordinated debt and of any other components that have characteristics of debt and equity as provided by the Superintendency; (iii) for banks using the Standardized Approach Method (or SAM) for capital adequacy purposes—add the generic loan loss provision up to 1.25% of total credit risk-weighted assets; or, alternatively, for banks using the Internal Ratings-Based Method (or IRB)—add the generic loan loss provision, but only up to 0.6% of total credit risk-weighted assets (pursuant to article 189 of the Law) and (iv) deduct half of the amount referred to under the paragraph below titled “Deductions”. In case there is no Tier 2 capital, 100% of the amount referred to under the paragraph below titled “Deductions” must be deducted from Tier 1 capital. Tier 3 capital will be composed of redeemable subordinated debt that is incurred with the exclusive purpose of covering market risk, as referred to in Article 233 of the Law. |
| | · | Deductions: Pursuant to the foregoing paragraphs, the following should be deducted from Tier 1 capital and Tier 2 capital: (i) all investments in shares and subordinated debt issued by other local or foreign financial institutions and insurance companies; (ii) all investments in shares and subordinated debt issued by an affiliate with which the bank consolidates its financial statements, including its holding company and such subsidiaries referred to in Articles 34 and 224 of the Law, in accordance with regulations issued by the Superintendency; (iii) the amount in which an investment in shares issued by a company with which the bank does not consolidate its financial statements and which is not part of the bank’s negotiable portfolio, exceeds 15% of the bank’s regulatory capital; (iv) the aggregate amount of all investments in shares issued by companies with which the bank does not consolidate its financial statements and which is not part of the bank’s negotiable portfolio, exceeds 60% of the regulatory capital; (v) when applicable, the amount resulting from the formula prescribed in Article 189 of the Law. For the purposes herein, “regulatory capital” should exclude the concepts referred to in (iii), (iv) and (iv) of this paragraph. |
The Superintendency will establish the additional requirements that any components of regulatory capital must satisfy. In addition, Article 185 of the Law provides that the following limits are applicable for calculating regulatory capital: (i) the aggregate amount of supplementary capital must not exceed the aggregate amount of basic capital; (ii) the amount of redeemable Tier 2 subordinated instruments must be limited to 50% of the amount resulting from the sum of Tier 1 components listed in items (i) through (v) of the paragraph above titled “Supplementary Capital”; (iii) the amount of Tier 3 capital must be limited to 250% of the amount resulting from the sum of Tier 1 components listed in items (i) through (v) of the paragraph above titled “Supplementary Capital,” in the amounts assigned to cover market risk.
Legal Reserve Requirements
Pursuant to Article 67 of Law 26702, all banks must create a legal reserve. Each year a bank must allocate 10% of its net income to its legal reserve until its legal reserve is equal to 35% of its paid-in capital stock. Any subsequent increases in paid-in capital will imply a corresponding increase in the required level of the legal reserves to be funded as described above. As of December 31, 2008, BCP’s consolidated legal reserve was S/.546.5 million (US$174 million), equivalent to 36.2% of BCP’s paid-in capital as of such date.
Provisions for Loan Losses
Guidelines for the establishment of provisions for loan losses by Peruvian credit institutions, including commercial banks, are set by the SBS. Law 26702 grants authority to the SBS to establish loan reserves and does not allow for the inclusion of collateral in determining the net amount of outstanding credit risk subject to provision. SBS Resolution No. 41-2005, enacted in January 2005, requires additional provisions for credits subject to foreign exchange risk, which are recorded for local purposes. Starting January 2010, SBS Resolution No. 11356-2008, enacted in November 2008, will require banks to implement a new framework for the assessment and classification of debtors. The same SBS Resolution requires the establishment of pro-cyclical provisions starting December 2008. However, we estimate and record our allowance for loan losses according to the criteria set out in IAS 39, adjusting the local provisions as necessary. See Note 3(f)(ii) and 3(i) to the Credicorp Consolidated Financial Statements.
Provisions for Country Risk
SBS Resolution No. 505-2002 requires the establishment of provisions for exposure to country risk, which is defined as including sovereign risk, transfer risk and expropriation or nationalization risk, that may affect operations with companies or individuals in foreign countries. The SBS has also established guidelines for the procedures and responsibilities for the management of country risk. We estimate and record our allowance for country risk according to the criteria set out in IAS 39. See Note 3(f)(ii) and 3(i) to the Credicorp Consolidated Financial Statements.
Central Bank Reserve Requirements
Under Law 26702, banks and finance companies are required to maintain a legal reserve for certain obligations. The Central Bank may require additional and marginal reserves. The exact level and method of calculation of the reserve requirement is set by the Central Bank. In calculating the required legal reserve, the following, pursuant to regulations issued by the SBS, are obligations: demand and time deposits, savings accounts, securities, certain bonds and funds administered by the bank. The Central Bank requires reserves on amounts due to foreign banks and other foreign financial companies, which were not previously considered obligations. The regulation excludes funding from other central banks, governments or multilateral lending agencies.
Between August 2000 and December 2007, the rate of the legal reserve has been 6% of the obligations described above. During 2008, the legal reserve requirement was increased several times to 7% in February 2008, to 8% in March 2008, to 8.5% in May 2008, and to 9% in August 2008 as a measure to control inflation. At the beginning of 2009 and as part of the Government program to alleviate the impact of the international crisis, the legal reserve rate was reduced to 6.5% in February and to 6% in April. The reserve may be kept in cash by the corresponding bank or finance company, with a minimum of 1% held in deposits in current accounts in the Central Bank. Obligations in foreign currency are subject to an additional reserve requirement that was 35% until December 2008 when it was reduced to 30%. There is no additional reserve for obligations in local currency. The legal reserve (6%) and the additional reserve must be calculated in Nuevos Soles for obligations in local currency and in U.S. Dollars for obligations in foreign currency. The Central Bank oversees compliance with the reserve requirements.
The Central Bank also establishes the interest rate payable on the reserves that exceed the legal 6% requirement. The interest rate is expected to be periodically revised by the Central Bank in accordance with monetary policy objectives. The interest rate was increased over the year 2008 reaching a maximum level of 6.5% since September. As a result of the international crisis and to lessen its effects, the Central Bank has reduced the interest rate during 2009 to 6.25% in February, to 6% in March, to 5% in April, to 4% in May and to 3% in June.
In the past few years, the Central Bank has on numerous occasions changed the deposit reserve requirements applicable to Peruvian commercial banks, the rate of interest paid on deposit reserves, and the amount of deposit reserves on which no interest must be paid by the Central Bank. Changes in the supervision and regulation of BCP, such as changes in deposit reserve requirements or in the amount of interest payable on deposit reserve requirements, may adversely affect our business, financial condition and results of operations.
Lending Activities
Law 26702 sets maximum amounts of credit that each financial institution may extend to a single borrower. Under Law 26702, a single borrower includes an individual or an economic group. An economic group constituting a single or common risk, according to Law 26702, includes a person, such person’s close relatives and companies in which such person or close relatives have significant share ownership or decision-making capability. According to current regulations, shareholders who own or control directly or indirectly at least one-tenth of a company’s shares are considered significant shareholders. Significant decision-making capability is deemed to be present when, among other factors, a person or group can exercise material and continuous influence upon the decisions of a company, when a person or company holds seats on the board of directors or has principal officers in another company, or when it can be assumed that one company or person is the beneficial recipient of credit facilities granted to another company.
The limits for credit extended to one borrower vary according to the type of borrower and the collateral received. The limit applicable to credit for any Peruvian borrower is 10% of the bank’s regulatory capital, applied to both unconsolidated and consolidated records, which may be increased to up to 30% if the loan is collateralized in a manner acceptable under Law 26702. If a financial institution exceeds these limits, the SBS may impose a fine on the institution. As of December 31, 2008, the 10.0% credit limit per borrower of BCP, unconsolidated, was S/.410.0 million (US$130.7 million) for unsecured loans, and the 30.0% limit amounted to S/.1,231.2 million (US$392.2 million) for secured loans.
In certain limited circumstances, the Central Bank has the authority to establish maximum limits on the interest rates that commercial banks and other financial institutions may charge on loans pursuant to Article 52 of the organic law of the Central Bank. No such limits are currently in place. However, there can be no assurance that in the future the Central Bank will not establish maximum limits on the interest rates that commercial banks or other financial institutions may charge.
Related Party Transactions
Law 26702 regulates and limits transactions with related parties and affiliates of financial institutions. In 1997, the SBS and CONASEV enacted regulations with precise definitions of indirect ownership, related parties and economic groups, which serve as the basis for determining limits on transactions with related parties and affiliates. These regulations also provide the basis for the subsequent development of specific standards for the supervision of financial and mixed conglomerates formed by financial institutions.
The total amount of loans to directors, employees or close relatives of any such persons may not exceed 7% of a bank’s paid-in capital in the aggregate. All loans made to any single related party borrower may not exceed 0.35% of paid-in capital (i.e., 5% of the overall 7% limit).
In addition, under Law 26702, as amended by Law 27102, the aggregate amount of loans to related party borrowers considered to be an economic group may not exceed 30% (previously 75%) of a bank’s regulatory capital. For purposes of this test, related party borrowers include (i) any corporation holding, directly or indirectly, 4% or more of a bank’s shares, (ii) directors, (iii) certain of a bank’s principal executive officers or (iv) persons affiliated with the administrators of the bank. See “—Lending Activities” above for the meaning of “economic group” under Law 26702. Loans to individual related party borrowers are also subject to the limits on lending to a single borrower described under “—Lending Activities” above. All loans to related parties must be made on terms no more favorable than the best terms that BCP offers to the public.
Ownership Restrictions
Law 26702 establishes certain restrictions on the ownership of a bank’s shares. Banks must have at least two unrelated shareholders at all times. Restrictions are placed on the ownership of shares of any bank by persons that have committed certain crimes, as well as by public officials who have supervisory powers over banks or who are majority shareholders of an enterprise of a similar nature. All transfers of shares in a bank must be reported after the fact to the SBS by the bank. Transfers involving the acquisition by any individual or corporation, whether directly or indirectly, of more than 10% of a bank’s capital stock must receive prior authorization from the SBS. The SBS may deny authorization to such transfer of shares if the purchasers (or their shareholders in the case of juridical persons) are legally disabled, have engaged in illegal activity in the area of banking, finance, insurance or reinsurance, or if objections are raised on the basis of the purchaser’s moral fitness or economic solvency. The decision of the SBS on this matter is final, and cannot be overturned in the courts. If a transfer is made without obtaining the prior approval of the SBS, the purchaser may be fined an amount equivalent to the value of the securities transferred. In addition, the purchaser will be required to sell the securities within 30 days, or the fine will double, and the purchaser is disqualified from exercising its voting rights at shareholders’ meetings. Foreign investors receive the same treatment as Peruvian nationals and are subject to the limitations described above.
Finally, under Peruvian law, individuals or corporations that acquire more than 3% of a bank’s shares or 1% in a period of 12 months are subject to any information requirement that the SBS may need.
Risk Rating
Law 26702 and SBS Resolution No. 672 require that all financial companies be rated by at least two risk rating companies on a semi-annual basis (updated in March and September), in addition to the SBS’s own assessment. Criteria to be considered in the rating include risk management and control procedures, loan quality, financial strength, profitability, liquidity and financial efficiency. Five risk categories are assigned, from “A” (lowest risk) to “E” (highest risk), allowing for sub-categories within each letter. As of December 2008, BCP was assigned the “A+” risk category by its two rating agencies, Equilibrium Clasificadora de Riesgo and Apoyo and Associates International.
Deposit Fund
Law 26702 provides for mandatory deposit insurance to protect all types of deposits of financial institutions by establishing the Fondo de Seguro de Depósitos (Deposit Insurance Fund or the Fund) for individuals, associations, not-for-profit companies, and demand deposits of non-financial companies. Financial institutions must pay an annual premium calculated on the basis of the type of deposits accepted by the entity and the risk classification of such entity, made by the SBS and at least two independent risk-rating agencies. The annual premiums begin at 0.45% of total funds on deposit under the coverage of the Fund, if BCP is classified in the lowest risk category, and increase to 1.45% applicable to banks in the highest risk category. The maximum amount (defined on a monthly basis) that a customer is entitled to recover from the Fund is S/.82,664 until the end of August 2009.
Intervention by the SBS
Pursuant to Law 26702, as amended by Law 27102, the SBS has the power to seize the operations and assets of a bank. These laws provide for three levels of intervention by the SBS: a supervisory regime, an intervention regime and the liquidation of the bank. Any of these actions may be taken if certain events occur, including if the bank: (i) interrupts payments on its liabilities, (ii) repeatedly fails to comply with the instructions of the SBS or the Central Bank, (iii) repeatedly violates the law or the provisions of the bank’s bye-laws, (iv) repeatedly manages its operations in an unauthorized or unsound manner or (v) has its regulatory capital fall or be reduced by more than 50%. Rather than seizing the operations and assets of a bank, the SBS may adopt other measures, including (i) placing additional requirements on a commercial bank, (ii) ordering it to increase its capital stock or divest certain or all of its assets, or (iii) imposing a special supervision regime during which BCP must adhere to a financial restructuring plan.
The SBS intervention rule stops a bank’s operations and may last for a maximum of 45 days, which may be extended for a second period of up to 45 additional days. During this time, the SBS may institute measures such as: (i) canceling losses by reducing reserves, capital and subordinated debt, (ii) segregating certain assets and liabilities for transfer to another financial institution and (iii) merging the intervened bank with another acquiring institution according to the program established by Urgent Decree No. 108-2000, enacted in November 2000. After the intervention, the SBS will proceed to liquidate BCP except if the preceding option (iii) was applied.
General
Atlantic Security Bank (or ASB), a subsidiary of ASHC, is a Cayman Islands bank with a branch in Panama. ASB is regulated by the regulatory authorities of the Cayman Islands while its Panama branch is regulated by the banking authorities of Panama. The supervision of ASB by Cayman Islands and Panamanian regulatory authorities is less extensive than the supervision and regulation of U.S. banks by U.S. banking authorities. In particular, ASB does not have a lender of last resort and its deposits are not guaranteed by any government agency.
ASB is registered as an exempted company and is licensed in the Cayman Islands pursuant to the Banks and Trust Companies Law (2003 Revision) (also referred to as the Cayman Banking Law). ASB holds an unrestricted Category B Banking and Trust License, as well as a Mutual Fund Administrator License. As a holder of a Category B License, ASB may not take deposits from any person residing in the Cayman Islands other than another licensee, an exempted company or an ordinary non-resident company which is not carrying on business in the Cayman Islands.
ASB also may not invest in any asset which represents a claim on any person residing in the Cayman Islands except a claim resulting from: (i) a loan to an exempted or an ordinary non-resident company not carrying on business in the Cayman Islands; (ii) a loan by way of mortgage to a member of its staff or to a person possessing or being deemed to possess Caymanian status under the immigration law, for the purchase or construction of a residence in the Cayman Islands to be owner-occupied; (iii) a transaction with another licensee or (iv) the purchase of bonds or other securities issued by the government of the Cayman Islands, a body incorporated by statute, or a company in which the government is the sole or majority beneficial owner. In addition, ASB may not, without the written approval of the Cayman Islands Monetary Authority (also referred to as the Authority), carry on any business in the Cayman Islands other than for which the Category B License has been obtained.
There are no specified ratio or liquidity requirements under the Cayman Banking Law, but the Authority expects observance of prudent banking practices. As a matter of general practice, the ratio of liabilities to capital and surplus should not exceed 40-to-1 and the ratio of risk-weighted assets to capital and surplus should not exceed 8.33-to-1 (12%). There is a statutory minimum net worth requirement of US$480,000, but, in the normal course of events, the Authority will require a bank or trust company to maintain a higher paid-in capital appropriate to its business. It is the practice of the Authority to require compliance with the guidelines promulgated by the Basel Accord on Banking Regulations and Supervisory Practices although, in special circumstances, different gearing and/or capital risk asset ratios may be negotiated. Compliance with the Cayman Banking Law is monitored by the Authority.
Continuing Requirements
Under the law of the Cayman Islands, ASB is subject to the following continuing requirements: (i) to ensure good standing under the Cayman Islands Companies Law, including the filing of annual and other returns and the payment of annual fees; (ii) to file with the Registrar of Companies particulars of any change in the information or documents required to be supplied to him and to pay annual fees; (iii) to file quarterly with the Authority certain prescribed forms; (iv) to file with the Authority audited accounts within three months of each financial year (in the case of a locally incorporated bank which is not part of a substantial international banking group, current practice is also to request a senior officer or board member to discuss these accounts each year personally at a meeting with the Authority) and (v) to file an annual questionnaire.
ASB is required by the Cayman Banking Law to have at least two directors. Additionally, ASB must receive prior approval from the Authority (i) for any proposed change in the directors or senior officers, though in exceptional cases a waiver can be obtained enabling changes to be reported after the event or even annually in the case of a branch of a substantial international bank; (ii) for the issue, transfer or other disposal of shares (it is rare for a waiver to be granted with respect to shares except in the case of a branch of a substantial international bank and where the shares are widely held and publicly traded); (iii) for any significant change in the business plan filed on the filing of the original license application or (iv) to open a subsidiary, branch, agency or representative office outside the Cayman Islands. Finally, ASB must obtain the prior approval of the Authority to change its name and must also notify the Authority of any change in the principal office and authorized agents in the Cayman Islands.
Until February 2009, the Bolivian banking system operated under the Ley de Bancos y Entidades Financieras (the Law of Banks and Financial Entities) No. 1488, enacted on April 14, 1993, and modified by Law 2297, of December 20, 2001, which granted supervisory powers to the Superintendency of Banks and Financial Entities. Additionally, it established that Banco Central de Bolivia (the Central Bank of Bolivia) regulated financial intermediation and deposit-gathering activities, determined monetary and foreign exchange policies, and established reserve requirements on deposits and capital adequacy guidelines that banks and financial companies were required to follow. Also, the Superintendencia de Pensiones, Valores y Seguros (the Superintendency of Pensions, Securities and Insurance) supervised brokerage activities and mutual funds management that were conducted through BCB’s subsidiaries Credibolsa S.A. and Credifondo S.A., respectively. These subsidiaries operated under the Ley del Mercado de Valores (the Securities Markets Law) No. 1834, enacted on March 31, 1998.
The new constitution of Bolivia, which was approved by referendum on February 2009, established that the Bolivian financial system is to be regulated as follows:
(i) The Central Bank of Bolivia is in charge of maintaining the stability of the internal monetary value and can regulate monetary policy, control foreign exchange policies, regulate the payment system, authorize the issuing of money and administrate international reserves.
(ii) All financial entities (banks, mutual funds, securities, insurance and others) are regulated by a new regulatory entity, the Financial System Supervisory Authority (or FSSA), which was created by the Supreme Decree 29894. The FSSA (or ASFI in Spanish) has assumed all regulatory functions held previously be the Superintendency of Banks and Financial Entities and the Superintendency of Pensions, Securities and Insurance.
Even though this new regulatory framework was established by the new Bolivian constitution, the changes were not significant and therefore did not materially impact BCB’s business.
Overview
PPS’s operations are regulated by Law 26702 and the SBS. Peruvian insurance companies must regularly submit reports to the SBS regarding their operations. In addition, the SBS conducts on-sight reviews of the performance of insurance companies at least on an annual basis. The SBS conducts these reviews primarily to review a company’s compliance with solvency margin and reserve requirements, investment requirements and rules governing the recognition of premium income. If the SBS determines that a company is unable to meet the solvency margin or technical reserve requirements, or is unable to pay claims as they come due, it may either liquidate the company or permit it to merge with another insurance company.
Under Peruvian law, insurance companies may engage in certain credit risk operations, such as guarantees, bonds and trusteeships, but are prohibited from offering other banking services, operating mutual funds or offering portfolio management services. In addition, insurance companies may not conduct brokerage operations for third parties.
Peruvian insurance companies are prohibited from having an ownership interest in other insurance or reinsurance companies of the same class or in private pension funds.
Establishment of an Insurance Company
Insurance companies must seek the authorization of the SBS before commencing operations. Peruvian law establishes certain minimum capital requirements for insurance and reinsurance companies. These requirements must be met through cash investments in the company. The statutory amounts are expressed in constant value.
Solvency Requirements
Pursuant to Law 26702, the SBS regulates the solvency margin of Peruvian insurance companies. The solvency margin is based upon calculations that take into account the amount of premiums written and losses incurred during a specified period prior to the date on which the calculation is made.
Insurance companies must also maintain solvency equity, which must be the greater of (i) the solvency margin and (ii) the minimum capital requirement, as established by law. The required amount of solvency equity is recalculated at least quarterly. If the insurance company has outstanding credit risk operations, part of the solvency equity should be set aside for their coverage.
Legal Reserve Requirements
Peruvian law also requires that all insurance companies establish a legal guarantee reserve for policyholders by setting aside 10% of income before taxes until the reserve reaches at least 35% of paid-in capital.
Reserve Requirements
Pursuant to Law 26702 and regulations issued by the SBS, Peruvian insurance companies must establish technical reserves. See “—(6) Pacífico Peruano Suiza—(ii) Claims and Reserves.” Law 26702 also requires insurance companies to create a reserve for IBNR claims, which are reflected as a liability, net of recoveries and reinsurance, in the Credicorp Consolidated Financial Statements. Reserves for IBNR claims are estimated by using generally accepted actuarial reserving methods. See Note 3(e) to the Credicorp Consolidated Financial Statements. Finally, PPS is required by the SBS to establish pre-event reserves for risk of catastrophes, which, in accordance with IFRS principles, are not considered in our financial statements. See “—(6) Pacífico Peruano Suiza—(ii) Claims and Reserves.”
Investment Requirements
Pursuant to Law 26702, the total amount of an insurance company’s solvency equity and technical reserves must be permanently supported by diversified assets, which may not be pledged or otherwise encumbered. The investment regulations further state that deposits in and bonds of one financial institution together cannot exceed 10% of the total of an insurer’s solvency equity and technical reserves combined. In general, no more than 20% of an insurance company’s solvency equity and technical reserves combined may be invested in instruments (including stocks and bonds) issued by a company or group of companies. In addition, in order for an insurance company to invest in non-Peruvian securities, the securities must be rated by an internationally recognized credit rating company and the asset class must be authorized by Peruvian SBS regulations. Securities owned by insurance companies must be registered in the Public Registry of Securities of Peru or the comparable registry of their respective country.
Related Party Transactions
Law 26702 generally provides that insurance companies may not extend credit to or guarantee the obligations of employees or members of the board of directors, except for unique home mortgage loans to employees.
Ownership Restrictions
Law 26702 sets forth the same types of restrictions regarding the ownership and transfer of insurance company shares as it does regarding the ownership and transfer of shares in banks. See “—(11) Supervision and Regulation—(ii) BCP—Overview.”
| (12) | Selected Statistical Information |
In the following tables, we have set forth certain selected statistical information and ratios regarding our business for the periods indicated. You should read the selected statistical information in conjunction with the information included in “Item 5. Operating and Financial Review and Prospects—(A) Operating Results” and the Credicorp Consolidated Financial Statements (and the notes that accompany the financial statements). The statistical information and discussion and analysis given below for the years 2004, 2005, 2006, 2007 and 2008 reflect our consolidated financial position as well as that of our subsidiaries, as of December 31, 2004, 2005, 2006, 2007 and 2008 and our results of operations for 2004, 2005, 2006, 2007 and 2008.
| | (i) | Average Balance Sheets and Income from Interest-Earning Assets |
The tables below set forth selected statistical information based on our average balance sheets prepared on a consolidated basis. Except as otherwise indicated, we have classified average balances by currency (Nuevos Soles or foreign currency (primarily U.S. Dollars)) rather than by the domestic or international nature of the balance. In addition, except where noted, the average balances are based on the quarterly ending balances in each year. Any of these quarter-end balances that were denominated in Nuevos Soles have been converted into U.S. Dollars using the applicable SBS exchange rate as of the date of such balance. We have in certain cases restated nominal average interest rates as real average interest rates using the formula described below. Our management believes that adjusting average balances and average interest rates for inflation in this manner provides more meaningful information for investors than unadjusted average balances and rates, and does not believe that the stated averages present trends materially differ from those that would be presented by daily averages.
Real Average Interest Rates
We calculated the real average interest rates set forth in the tables below by adjusting the nominal average interest rates on Nuevo Sol-denominated assets and liabilities using the following formula:
Where:
| R(s) | = | real average interest rate on Nuevo Sol-denominated assets and liabilities for the period. |
| N(s) | = | nominal average interest rate on Nuevo Sol-denominated assets and liabilities for the period. |
| I | = | inflation rate in Peru for the period (based on the Peruvian consumer price index). |
Under this adjustment formula, assuming positive nominal average interest rates, the real average interest rate on a portfolio of Nuevo Sol-denominated assets or liabilities would be equal to the nominal average interest rate on that portfolio if the inflation rate were zero. The real average interest rate would be less than the nominal average interest rate if the inflation rate were positive, and the real average interest rate would be greater than the nominal average interest rate if the inflation rate were negative (i.e., becomes a deflation rate). In addition, the real average interest rate would be negative if the inflation rate were greater than the average nominal interest rate.
The following tables show average balances for all of our assets and liabilities, interest earned and paid amounts, and nominal rates and real rates for our interest-earning assets and interest-bearing liabilities, all for the years ended December 31, 2006, 2007 and 2008.
Average Balance Sheets
Assets, Interest Earned and Average Interest Rates
| | | Year ended December 31, | |
| | | 2006 | | | 2007 | | | 2008 | |
| | | Average Balance | | | Interest Earned | | | Real Avg. Rate | | | Nominal Avg. Rate | | | Average Balance | | | Interest Earned | | | Real Avg. Rate | | | Nominal Avg. Rate | | | Average Balance | | | Interest Earned | | | Real Avg. Rate | | | Nominal Avg. Rate | |
| | | (U.S. Dollars in thousands, except percentages) | |
| ASSETS: | | | | | | | | | | | | | | | | | | | | | | | | | | | | | | | | | | | | |
| Interest-earning assets: | | | | | | | | | | | | | | | | | | | | | | | | | | | | | | | | | | | | |
| Deposits in Central Bank | | | | | | | | | | | | | | | | | | | | | | | | | | | | | | | | | | | | |
| Nuevos Soles | | US$ | 13,346 | | | US$ | 157 | | | | 0.16 | % | | | 1.18 | % | | US$ | 16,559 | | | US$ | 339 | | | | 1.00 | % | | | 2.05 | % | | US$ | 221,485 | | | US$ | 10,055 | | | | 3.46 | % | | | 4.54 | % |
| Foreign Currency | | | 1,763,854 | | | | 56,813 | | | | 3.22 | | | | 3.22 | | | | 1,422,395 | | | | 46,582 | | | | 3.27 | | | | 3.27 | | | | 1,737,797 | | | | 27,859 | | | | 1.60 | | | | 1.60 | |
| Total | | | 1,777,200 | | | | 56,970 | | | | 3.20 | | | | 3.21 | | | | 1,438,954 | | | | 46,921 | | | | 3.25 | | | | 3.26 | | | | 1,959,282 | | | | 37,914 | | | | 1.81 | | | | 1.94 | |
| Deposits in other banks | | | | | | | | | | | | | | | | | | | | | | | | | | | | | | | | | | | | | | | | | | | | | | | | |
| Nuevos Soles | | | 43,684 | | | | 1,762 | | | | 2.99 | | | | 4.03 | | | | 30,337 | | | | 1,224 | | | | 2.99 | | | | 4.04 | | | | 68,990 | | | | 2,821 | | | | 3.05 | | | | 4.09 | |
| Foreign Currency | | | 711,694 | | | | 35,154 | | | | 4.94 | | | | 4.94 | | | | 1,002,633 | | | | 57,672 | | | | 5.75 | | | | 5.75 | | | | 778,822 | | | | 30,396 | | | | 3.90 | | | | 3.90 | |
| Total | | | 755,378 | | | | 36,916 | | | | 4.83 | | | | 4.89 | | | | 1,032,970 | | | | 58,896 | | | | 5.67 | | | | 5.70 | | | | 847,812 | | | | 33,217 | | | | 3.83 | | | | 3.92 | |
| Investment securities | | | | | | | | | | | | | | | | | | | | | | | | | | | | | | | | | | | | | | | | | | | | | | | | |
| Nuevos Soles | | | 985,054 | | | | 49,916 | | | | 4.02 | | | | 5.07 | | | | 2,110,943 | | | | 138,028 | | | | 5.47 | | | | 6.54 | | | | 2,453,796 | | | | 192,987 | | | | 6.78 | | | | 7.86 | |
| Foreign Currency | | | 1,589,978 | | | | 85,789 | | | | 5.40 | | | | 5.40 | | | | 2,131,911 | | | | 93,734 | | | | 4.40 | | | | 4.40 | | | | 3,355,232 | | | | 110,865 | | | | 3.30 | | | | 3.30 | |
| Total | | | 2,575,032 | | | | 135,705 | | | | 4.87 | | | | 5.27 | | | | 4,242,854 | | | | 231,762 | | | | 4.93 | | | | 5.46 | | | | 5,809,028 | | | | 303,852 | | | | 4.77 | | | | 5.23 | |
| Total loans (1) | | | | | | | | | | | | | | | | | | | | | | | | | | | | | | | | | | | | | | | | | | | | | | | | |
| Nuevos Soles | | | 1,307,784 | | | | 178,469 | | | | 12.51 | | | | 13.65 | | | | 1,942,261 | | | | 262,402 | | | | 12.37 | | | | 13.51 | | | | 2,987,721 | | | | 400,395 | | | | 12.27 | | | | 13.40 | |
| Foreign Currency | | | 4,104,477 | | | | 359,202 | | | | 8.75 | | | | 8.75 | | | | 5,101,392 | | | | 439,070 | | | | 8.61 | | | | 8.61 | | | | 6,533,987 | | | | 563,546 | | | | 8.62 | | | | 8.62 | |
| Total | | | 5,412,261 | | | | 537,671 | | | | 9.66 | | | | 9.93 | | | | 7,043,653 | | | | 701,472 | | | | 9.65 | | | | 9.96 | | | | 9,521,708 | | | | 963,941 | | | | 9.77 | | | | 10.12 | |
| Total dividend-earning assets | | | | | | | | | | | | | | | | | | | | | | | | | | | | | | | | | | | | | | | | | | | | | | | | |
| Nuevos Soles | | | 119,106 | | | | 6,171 | | | | 4.13 | | | | 5.18 | | | | 215,100 | | | | 6,004 | | | | 1.76 | | | | 2.79 | | | | 174,356 | | | | 6,672 | | | | 2.79 | | | | 3.83 | |
| Foreign Currency | | | 109,129 | | | | 2,970 | | | | 2.72 | | | | 2.72 | | | | 118,334 | | | | 3,079 | | | | 2.60 | | | | 2.60 | | | | 107,567 | | | | 5,542 | | | | 5.15 | | | | 5.15 | |
| Total | | | 228,235 | | | | 9,141 | | | | 3.46 | | | | 4.01 | | | | 333,434 | | | | 9,083 | | | | 2.06 | | | | 2.72 | | | | 281,923 | | | | 12,214 | | | | 3.69 | | | | 4.33 | |
| Total interest-earning assets | | | | | | | | | | | | | | | | | | | | | | | | | | | | | | | | | | | | | | | | | | | | | | | | |
| Nuevos Soles | | | 2,468,974 | | | | 236,475 | | | | 8.48 | | | | 9.58 | | | | 4,315,200 | | | | 407,997 | | | | 8.36 | | | | 9.45 | | | | 5,906,348 | | | | 612,930 | | | | 9.27 | | | | 10.38 | |
| Foreign Currency | | | 8,279,132 | | | | 539,928 | | | | 6.52 | | | | 6.62 | | | | 9,776,665 | | | | 640,137 | | | | 6.55 | | | | 6.55 | | | | 12,513,405 | | | | 738,208 | | | | 5.90 | | | | 5.90 | |
| Total | | | 10,748,106 | | | | 776,403 | | | | 6.97 | | | | 7.22 | | | | 14,091,865 | | | | 1,048,134 | | | | 7.10 | | | | 7.44 | | | | 18,419,753 | | | | 1,351,138 | | | | 6.98 | | | | 7.34 | |
| Noninterest-earning assets: | | | | | | | | | | | | | | | | | | | | | | | | | | | | | | | | | | | | | | | | | | | | | | | | |
| Cash and due from banks | | | | | | | | | | | | | | | | | | | | | | | | | | | | | | | | | | | | | | | | | | | | | | | | |
| Nuevos Soles | | | 168,332 | | | | | | | | | | | | | | | | 250,118 | | | | | | | | | | | | | | | | 308,321 | | | | | | | | | | | | | |
| Foreign Currency | | | 200,523 | | | | | | | | | | | | | | | | 255,715 | | | | | | | | | | | | | | | | 259,761 | | | | | | | | | | | | | |
| Total | | | 368,855 | | | | | | | | | | | | | | | | 505,833 | | | | | | | | | | | | | | | | 568,082 | | | | | | | | | | | | | |
| Reserves for loan losses | | | | | | | | | | | | | | | | | | | | | | | | | | | | | | | | | | | | | | | | | | | | | | | | |
| Nuevos Soles | | | (33,859 | ) | | | | | | | | | | | | | | | (37,601 | ) | | | | | | | | | | | | | | | (68,072 | ) | | | | | | | | | | | | |
| Foreign Currency | | | (167,337 | ) | | | | | | | | | | | | | | | (154,917 | ) | | | | | | | | | | | | | | | (156,850 | ) | | | | | | | | | | | | |
| Total | | | (201,196 | ) | | | | | | | | | | | | | | | (192,518 | ) | | | | | | | | | | | | | | | (224,922 | ) | | | | | | | | | | | | |
| Premises and equipment | | | | | | | | | | | | | | | | | | | | | | | | | | | | | | | | | | | | | | | | | | | | | | | | |
| Nuevos Soles | | | 165,610 | | | | | | | | | | | | | | | | 182,308 | | | | | | | | | | | | | | | | 269,221 | | | | | | | | | | | | | |
| Foreign Currency | | | 79,281 | | | | | | | | | | | | | | | | 73,948 | | | | | | | | | | | | | | | | 26,805 | | | | | | | | | | | | | |
| Total | | | 244,891 | | | | | | | | | | | | | | | | 256,256 | | | | | | | | | | | | | | | | 296,026 | | | | | | | | | | | | | |
| Other non-interest-earning assets and gain from derivatives instruments and other interest income | | | | | | | | | | | | | | | | | | | | | | | | | | | | | | | | | | | | | | | | | | | | | | | | |
| Nuevos Soles | | | 84,716 | | | | 1,629 | | | | | | | | | | | | 334,653 | | | | 2,066 | | | | | | | | | | | | 527,364 | | | | 1,193 | | | | | | | | | |
| Foreign Currency | | | 412,659 | | | | 3,971 | | | | | | | | | | | | 561,477 | | | | 15,774 | | | | | | | | | | | | 747,978 | | | | 48,003 | | | | | | | | | |
| Total | | | 497,375 | | | | 5,600 | | | | | | | | | | | | 896,130 | | | | 17,840 | | | | | | | | | | | | 1,275,342 | | | | 49,196 | | | | | | | | | |
| Total non-interest-earning assets | | | | | | | | | | | | | | | | | | | | | | | | | | | | | | | | | | | | | | | | | | | | | | | | |
| Nuevos Soles | | | 384,799 | | | | 1,629 | | | | | | | | | | | | 729,478 | | | | 2,066 | | | | | | | | | | | | 1,036,834 | | | | 1,193 | | | | | | | | | |
| Foreign Currency | | | 525,126 | | | | 3,971 | | | | | | | | | | | | 736,223 | | | | 15,774 | | | | | | | | | | | | 877,694 | | | | 48,003 | | | | | | | | | |
| Total | | | 909,925 | | | | 5,600 | | | | | | | | | | | | 1,465,701 | | | | 17,840 | | | | | | | | | | | | 1,914,528 | | | | 49,196 | | | | | | | | | |
| Total average assets | | | | | | | | | | | | | | | | | | | | | | | | | | | | | | | | | | | | | | | | | | | | | | | | |
| Nuevos Soles | | | 2,853,773 | | | | 238,104 | | | | 7.26 | | | | 8.34 | | | | 5,044,678 | | | | 410,063 | | | | 7.05 | | | | 8.13 | | | | 6,943,182 | | | | 614,123 | | | | 7.76 | | | | 8.84 | |
| Foreign Currency | | | 8,804,258 | | | | 543,899 | | | | 6.18 | | | | 6.18 | | | | 10,512,888 | | | | 655,911 | | | | 6.24 | | | | 6.24 | | | | 13,391,099 | | | | 786,211 | | | | 5.87 | | | | 5.87 | |
| Total | | | 11,658,031 | | | | 782,003 | | | | 6.44 | | | | 6.71 | | | | 15,557,566 | | | | 1,065,974 | | | | 6.50 | | | | 6.85 | | | | 20,334,281 | | | | 1,400,334 | | | | 6.51 | | | | 6.89 | |
| (1) | Figures for total loans include past-due loans, but do not include accrued but unpaid interest on such past-due loans in the year in which such loans became past due. Accrued interest is included. |
Average Balance Sheets
Liabilities, Interest Paid and Average Interest Rates
| | | | |
| | | | | | | | | | |
| | | Average Balance | | | Interest Paid | | | Real Avg. Rate | | | Nominal Avg. Rate | | | Average Balance | | | Interest Paid | | | Real Avg. Rate | | | Nominal Avg. Rate | | | Average Balance | | | Interest Paid | | | Real Avg. Rate | | | Nominal Avg. Rate | |
| | | (U.S. Dollars in thousands, except percentages) | |
| LIABILITIES | | | | | | | | | | | | | | | | | | | | | | | | | | | | | | | | | | | | |
| Interest-bearing liabilities: | | | | | | | | | | | | | | | | | | | | | | | | | | | | | | | | | | | | |
| Demand deposits | | | | | | | | | | | | | | | | | | | | | | | | | | | | | | | | | | | | |
| Nuevos Soles (1) | | US$ | 776,964 | | | US$ | 8,631 | | | | 0.10 | % | | | 1.11 | % | | US$ | 1,120,416 | | | US$ | 12,761 | | | | 0.10 | % | | | 1.14 | % | | US$ | 1,685,905 | | | US$ | 22,986 | | | | 0.29 | % | | | 1.36 | % |
| Foreign Currency (1) | | | 1,512,284 | | | | 16,150 | | | | 1.07 | | | | 1.07 | | | | 2,206,983 | | | | 12,362 | | | | 0.56 | | | | 0.56 | | | | 2,603,193 | | | | 15,099 | | | | 0.58 | | | | 0.58 | |
| Total | | | 2,289,248 | | | | 24,781 | | | | 0.74 | | | | 1.08 | | | | 3,327,399 | | | | 25,123 | | | | 0.40 | | | | 0.76 | | | | 4,289,098 | | | | 38,085 | | | | 0.47 | | | | 0.89 | |
| Savings deposits | | | | | | | | | | | | | | | | | | | | | | | | | | | | | | | | | | | | | | | | | | | | | | | | |
| Nuevos Soles (1) | | | 518,859 | | | | 4,917 | | | | -0.06 | | | | 0.95 | | | | 711,641 | | | | 8,550 | | | | 0.16 | | | | 1.20 | | | | 1,143,032 | | | | 13,511 | | | | 0.11 | | | | 1.18 | |
| Foreign Currency (1) | | | 1,238,890 | | | | 7,919 | | | | 0.64 | | | | 0.64 | | | | 1,396,318 | | | | 11,319 | | | | 0.81 | | | | 0.81 | | | | 1,560,084 | | | | 13,654 | | | | 0.88 | | | | 0.88 | |
| Total | | | 1,757,749 | | | | 12,836 | | | | 0.43 | | | | 0.73 | | | | 2,107,959 | | | | 19,869 | | | | 0.59 | | | | 0.94 | | | | 2,703,116 | | | | 27,165 | | | | 0.55 | | | | 1.00 | |
| Time deposits | | | | | | | | | | | | | | | | | | | | | | | | | | | | | | | | | | | | | | | | | | | | | | | | |
| Nuevos Soles (1) | | | 709,208 | | | | 36,221 | | | | 4.05 | | | | 5.11 | | | | 1,440,081 | | | | 82,746 | | | | 4.66 | | | | 5.75 | | | | 2,659,712 | | | | 156,137 | | | | 4.75 | | | | 5.87 | |
| Foreign Currency (1) | | | 3,068,947 | | | | 124,344 | | | | 4.05 | | | | 4.05 | | | | 3,613,304 | | | | 180,741 | | | | 5.00 | | | | 5.00 | | | | 3,640,246 | | | | 154,719 | | | | 4.25 | | | | 4.25 | |
| Total | | | 3,778,155 | | | | 160,565 | | | | 4.05 | | | | 4.25 | | | | 5,053,385 | | | | 263,487 | | | | 4.90 | | | | 5.21 | | | | 6,299,958 | | | | 310,856 | | | | 4.46 | | | | 4.93 | |
| Due to banks and correspondents | | | | | | | | | | | | | | | | | | | | | | | | | | | | | | | | | | | | | | | | | | | | | | | | |
| Nuevos Soles | | | 249,212 | | | | 5,574 | | | | 1.21 | | | | 2.24 | | | | 153,258 | | | | 6,033 | | | | 2.87 | | | | 3.94 | | | | 190,227 | | | | 8,763 | | | | 3.50 | | | | 4.61 | |
| Foreign Currency | | | 865,365 | | | | 31,334 | | | | 3.62 | | | | 3.62 | | | | 1,411,710 | | | | 77,037 | | | | 5.46 | | | | 5.46 | | | | 2,341,164 | | | | 96,055 | | | | 4.10 | | | | 4.10 | |
| Total | | | 1,114,577 | | | | 36,908 | | | | 3.08 | | | | 3.31 | | | | 1,564,968 | | | | 83,070 | | | | 5.20 | | | | 5.31 | | | | 2,531,391 | | | | 104,818 | | | | 4.06 | | | | 4.14 | |
| Bonds | | | | | | | | | | | | | | | | | | | | | | | | | | | | | | | | | | | | | | | | | | | | | | | | |
| Nuevos Soles | | | 153,178 | | | | 11,041 | | | | 6.13 | | | | 7.21 | | | | 201,787 | | | | 12,954 | | | | 5.33 | | | | 6.42 | | | | 468,265 | | | | 30,864 | | | | 5.47 | | | | 6.59 | |
| Foreign Currency | | | 292,984 | | | | 14,242 | | | | 4.86 | | | | 4.86 | | | | 341,643 | | | | 20,638 | | | | 6.04 | | | | 6.04 | | | | 294,716 | | | | 20,892 | | | | 7.09 | | | | 7.09 | |
| Total | | | 446,162 | | | | 25,283 | | | | 5.30 | | | | 5.67 | | | | 543,430 | | | | 33,592 | | | | 5.78 | | | | 6.18 | | | | 762,981 | | | | 51,756 | | | | 6.09 | | | | 6.78 | |
| Total interest-bearing liabilities | | | | | | | | | | | | | | | | | | | | | | | | | | | | | | | | | | | | | | | | | | | | | | | | |
| Nuevos Soles | | | 2,407,421 | | | | 66,384 | | | | 1.73 | | | | 2.76 | | | | 3,627,183 | | | | 123,044 | | | | 2.33 | | | | 3.39 | | | | 6,147,141 | | | | 232,261 | | | | 2.68 | | | | 3.78 | |
| Foreign Currency | | | 6,978,470 | | | | 193,989 | | | | 2.78 | | | | 2.78 | | | | 8,969,958 | | | | 302,097 | | | | 3.37 | | | | 3.37 | | | | 10,439,403 | | | | 300,419 | | | | 2.88 | | | | 2.88 | |
| Total | | | 9,385,891 | | | | 260,373 | | | | 2.51 | | | | 2.77 | | | | 12,597,141 | | | | 425,141 | | | | 3.07 | | | | 3.37 | | | | 16,586,544 | | | | 532,680 | | | | 2.81 | | | | 3.21 | |
| Non-interest-bearing liabilities and net equity: | | | | | | | | | | | | | | | | | | | | | | | | | | | | | | | | | | | | | | | | | | | | | | | | |
| Other liabilities and loss from derivatives instruments and other interest expenses | | | | | | | | | | | | | | | | | | | | | | | | | | | | | | | | | | | | | | | | | | | | | | | | |
| Nuevos Soles | | | 56,016 | | | | 9,296 | | | | | | | | | | | | 157,062 | | | | 2,687 | | | | | | | | | | | | 489,502 | | | | 20,850 | | | | | | | | | |
| Foreign Currency | | | 862,715 | | | | 13,809 | | | | | | | | | | | | 1,123,751 | | | | 4,172 | | | | | | | | | | | | 1,363,623 | | | | 23,881 | | | | | | | | | |
| Total | | | 918,731 | | | | 23,105 | | | | | | | | | | | | 1,280,813 | | | | 6,859 | | | | | | | | | | | | 1,853,125 | | | | 44,731 | | | | | | | | | |
| Equity attributable to Credicorp equity holders | | | | | | | | | | | | | | | | | | | | | | | | | | | | | | | | | | | | | | | | | | | | | | | | |
| Nuevos Soles | | | | | | | | | | | | | | | | | | | | | | | | | | | | | | | | | | | | | | | | | | | | | | | | |
| Foreign Currency | | | 1,247,195 | | | | | | | | | | | | | | | | 1,547,283 | | | | | | | | | | | | | | | | 1,770,400 | | | | | | | | | | | | | |
| Total | | | 1,247,195 | | | | | | | | | | | | | | | | 1,547,283 | | | | | | | | | | | | | | | | 1,770,400 | | | | | | | | | | | | | |
| Minority Interest | | | | | | | | | | | | | | | | | | | | | | | | | | | | | | | | | | | | | | | | | | | | | | | | |
| Nuevos Soles | | | | | | | | | | | | | | | | | | | | | | | | | | | | | | | | | | | | | | | | | | | | | | | | |
| Foreign Currency | | | 106,214 | | | | | | | | | | | | | | | | 132,329 | | | | | | | | | | | | | | | | 124,212 | | | | | | | | | | | | | |
| Total | | | 106,214 | | | | | | | | | | | | | | | | 132,329 | | | | | | | | | | | | | | | | 124,212 | | | | | | | | | | | | | |
| Total non-interest-bearing liabilities and equity | | | | | | | | | | | | | | | | | | | | | | | | | | | | | | | | | | | | | | | | | | | | | | | | |
| Nuevos Soles | | | 56,016 | | | | 9,296 | | | | | | | | | | | | 157,062 | | | | 2,687 | | | | | | | | | | | | 489,502 | | | | 20,850 | | | | | | | | | |
| Foreign Currency | | | 2,216,124 | | | | 13,809 | | | | | | | | | | | | 2,803,363 | | | | 4,172 | | | | | | | | | | | | 3,258,235 | | | | 23,881 | | | | | | | | | |
| Total | | | 2,272,140 | | | | 23,105 | | | | | | | | | | | | 2,960,425 | | | | 6,859 | | | | | | | | | | | | 3,747,737 | | | | 44,731 | | | | | | | | | |
| Total average liabilities and equity | | | | | | | | | | | | | | | | | | | | | | | | | | | | | | | | | | | | | | | | | | | | | | | | |
| Nuevos Soles | | | 2,463,437 | | | | 75,680 | | | | 2.04 | | | | 3.07 | | | | 3,784,245 | | | | 125,731 | | | | 2.26 | | | | 3.32 | | | | 6,636,643 | | | | 253,111 | | | | 2.72 | | | | 3.81 | |
| Foreign Currency | | | 9,194,594 | | | | 207,798 | | | | 2.26 | | | | 2.26 | | | | 11,773,321 | | | | 306,269 | | | | 2.60 | | | | 2.60 | | | | 13,697,638 | | | | 324,300 | | | | 2.37 | | | | 2.37 | |
| Total | | | 11,658,031 | | | | 283,478 | | | | 2.21 | | | | 2.43 | | | | 15,557,566 | | | | 432,000 | | | | 2.52 | | | | 2.78 | | | | 20,334,281 | | | | 577,411 | | | | 2.48 | | | | 2.84 | |
(1) Includes the amount paid to Central Bank for the deposit insurance fund.
Changes in Net Interest Income and Expense: Volume and Rate Analysis
| | | 2007/2006 | | | 2008/2007 | |
| | | Increase/(Decrease) due to changes in: | | | Increase/(Decrease) due to changes in: | |
| | | Volume | | | Rate | | | Net Change | | | Volume | | | Rate | | | Net Change | |
| | | (U.S. Dollars in thousands) | |
| Interest Income: | | | | | | | | | | | | | | | | | | |
| Interest-earning deposits in Central Bank | | | | | | | | | | | | | | | | | | |
| Nuevos Soles | | | 38 | | | | 144 | | | | 182 | | | | 4,194 | | | | 5,522 | | | | 9,716 | |
| Foreign Currency | | | (10,998 | ) | | | 767 | | | | (10,231 | ) | | | 10,329 | | | | (29,052 | ) | | | (18,723 | ) |
| Total | | | (10,960 | ) | | | 911 | | | | (10,049 | ) | | | 14,523 | | | | (23,530 | ) | | | (9,007 | ) |
| Deposits in other banks | | | | | | | | | | | | | | | | | | | | | | | | |
| Nuevos Soles | | | (538 | ) | | | - | | | | (538 | ) | | | 1,560 | | | | 37 | | | | 1,597 | |
| Foreign Currency | | | 14,371 | | | | 8,147 | | | | 22,518 | | | | (12,873 | ) | | | (14,403 | ) | | | (27,276 | ) |
| Total | | | 13,833 | | | | 8,147 | | | | 21,980 | | | | (11,313 | ) | | | (14,366 | ) | | | (25,679 | ) |
| Investment securities | | | | | | | | | | | | | | | | | | | | | | | | |
| Nuevos Soles | | | 57,053 | | | | 31,059 | | | | 88,112 | | | | 22,418 | | | | 32,541 | | | | 54,959 | |
| Foreign Currency | | | 29,241 | | | | (21,296 | ) | | | 7,945 | | | | 53,786 | | | | (36,655 | ) | | | 17,131 | |
| Total | | | 86,294 | | | | 9,763 | | | | 96,057 | | | | 76,204 | | | | (4,114 | ) | | | 72,090 | |
Total loans(1) | | | | | | | | | | | | | | | | | | | | | | | | |
| Nuevos Soles | | | 86,585 | | | | (2,652 | ) | | | 83,933 | | | | 141,243 | | | | (3,250 | ) | | | 137,993 | |
| Foreign Currency | | | 87,245 | | | | (7,377 | ) | | | 79,868 | | | | 123,302 | | | | 1,174 | | | | 124,476 | |
| Total | | | 173,830 | | | | (10,029 | ) | | | 163,801 | | | | 264,545 | | | | (2,076 | ) | | | 262,469 | |
| Total dividend-earning assets | | | | | | | | | | | | | | | | | | | | | | | | |
| Nuevos Soles | | | 4,974 | | | | (5,141 | ) | | | (167 | ) | | | (1,137 | ) | | | 1,805 | | | | 668 | |
| Foreign Currency | | | 251 | | | | (142 | ) | | | 109 | | | | (280 | ) | | | 2,743 | | | | 2,463 | |
| Total | | | 5,225 | | | | (5,283 | ) | | | (58 | ) | | | (1,417 | ) | | | 4,548 | | | | 3,131 | |
| Total interest-earning assets | | | | | | | | | | | | | | | | | | | | | | | | |
| Nuevos Soles | | | 176,829 | | | | (5,307 | ) | | | 171,522 | | | | 150,441 | | | | 54,492 | | | | 204,933 | |
| Foreign Currency | | | 97,662 | | | | 2,547 | | | | 100,209 | | | | 179,191 | | | | (81,120 | ) | | | 98,071 | |
| Total | | | 274,491 | | | | (2,760 | ) | | | 271,731 | | | | 329,632 | | | | (26,628 | ) | | | 303,004 | |
| | 2007/2006 | | | 2008/2007 | |
| | | Increase/(Decrease) due to changes in: | | | Increase/(Decrease) due to changes in: | |
| | | Volume | | | Rate | | | Net Change | | | Volume | | | Rate | | | Net Change | |
| | | (U.S. Dollars in thousands) | |
| | | | | | | | | | | | | | | | | | | | | | | | | |
| Interest Expense: | | | | | | | | | | | | | | | | | | | | | | | | |
| Demand deposits | | | | | | | | | | | | | | | | | | | | | | | | |
| Nuevos Soles | | | 3,815 | | | | 315 | | | | 4,130 | | | | 6,441 | | | | 3,784 | | | | 10,225 | |
| Foreign Currency | | | 7,419 | | | | (11,207 | ) | | | (3,788 | ) | | | 2,219 | | | | 518 | | | | 2,737 | |
| Total | | | 11,234 | | | | (10,892 | ) | | | 342 | | | | 8,660 | | | | 4,302 | | | | 12,962 | |
| Savings deposits | | | | | | | | | | | | | | | | | | | | | | | | |
| Nuevos Soles | | | 1,827 | | | | 1,806 | | | | 3,633 | | | | 5,183 | | | | (222 | ) | | | 4,961 | |
| Foreign Currency | | | 1,006 | | | | 2,394 | | | | 3,400 | | | | 1,328 | | | | 1,007 | | | | 2,335 | |
| Total | | | 2,833 | | | | 4,200 | | | | 7,033 | | | | 6,511 | | | | 785 | | | | 7,296 | |
| Time deposits | | | | | | | | | | | | | | | | | | | | | | | | |
| Nuevos Soles | | | 37,327 | | | | 9,198 | | | | 46,525 | | | | 70,079 | | | | 3,312 | | | | 73,391 | |
| Foreign Currency | | | 22,056 | | | | 34,341 | | | | 56,397 | | | | 1,348 | | | | (27,370 | ) | | | (26,022 | ) |
| Total | | | 59,383 | | | | 43,539 | | | | 102,922 | | | | 71,427 | | | | (24,058 | ) | | | 47,369 | |
| Due to banks and correspondents and issued bonds | | | | | | | | | | | | | | | | | | | | | | | | |
| Nuevos Soles | | | (2,146 | ) | | | 2,605 | | | | 459 | | | | 1,455 | | | | 1,275 | | | | 2,730 | |
| Foreign Currency | | | 19,783 | | | | 25,920 | | | | 45,703 | | | | 50,720 | | | | (31,702 | ) | | | 19,018 | |
| Total | | | 17,637 | | | | 28,525 | | | | 46,162 | | | | 52,175 | | | | (30,427 | ) | | | 21,748 | |
| Bonds | | | | | | | | | | | | | | | | | | | | | | | | |
| Nuevos Soles | | | 3,504 | | | | (1,591 | ) | | | 1,913 | | | | 17,107 | | | | 803 | | | | 17,910 | |
| Foreign Currency | | | 2,365 | | | | 4,031 | | | | 6,396 | | | | (2,835 | ) | | | 3,089 | | | | 254 | |
| Total | | | 5,869 | | | | 2,440 | | | | 8,309 | | | | 14,272 | | | | 3,892 | | | | 18,164 | |
| Total interest-bearing liabilities | | | | | | | | | | | | | | | | | | | | | | | | |
| Nuevos Soles | | | 33,635 | | | | 23,025 | | | | 56,660 | | | | 85,484 | | | | 23,733 | | | | 109,217 | |
| Foreign Currency | | | 55,360 | | | | 52,748 | | | | 108,108 | | | | 49,489 | | | | (51,167 | ) | | | (1,678 | ) |
| Total | | | 88,995 | | | | 75,773 | | | | 164,768 | | | | 134,973 | | | | (27,434 | ) | | | 107,539 | |
| (1) | Figures for total loans include past-due loans, but do not include accrued but unpaid interest on such past-due loans in the year in which such loans became past due. Accrued interest is included. |
Interest-Earning Assets, Net Interest Margin and Yield Spread
The following table shows for each of the periods indicated, by currency, the levels of average interest-earning assets, net interest income, gross yield, net interest margin and yield spread, all on a nominal basis:
| | | Year ended December 31, | |
| | | 2006 | | | 2007 | | | 2008 | |
| | | (U.S. Dollars in thousands, except percentages) | |
| Average interest-earning assets | | | | | | | | | |
| Nuevos Soles | | | 2,468,974 | | | | 4,315,200 | | | | 5,906,348 | |
| Foreign Currency | | | 8,279,132 | | | | 9,776,665 | | | | 12,513,405 | |
| Total | | | 10,748,106 | | | | 14,091,865 | | | | 18,419,753 | |
| Net interest income | | | | | | | | | | | | |
| Nuevos Soles | | | 170,091 | | | | 284,953 | | | | 380,669 | |
| Foreign Currency | | | 345,939 | | | | 338,040 | | | | 437,789 | |
| Total | | | 516,030 | | | | 622,993 | | | | 818,458 | |
| Gross yield (1) | | | | | | | | | | | | |
| Nuevos Soles | | | 9.58 | % | | | 9.45 | % | | | 10.38 | % |
| Foreign Currency | | | 6.52 | % | | | 6.55 | % | | | 5.90 | % |
| Weighted-average rate | | | 7.22 | % | | | 7.44 | % | | | 7.34 | % |
| Net interest margin (2) | | | | | | | | | | | | |
| Nuevos Soles | | | 6.89 | % | | | 6.60 | % | | | 6.45 | % |
| Foreign Currency | | | 4.18 | % | | | 3.46 | % | | | 3.50 | % |
| Weighted-average rate | | | 4.80 | % | | | 4.42 | % | | | 4.44 | % |
| Yield spread (3) | | | | | | | | | | | | |
| Nuevos Soles | | | 6.82 | % | | | 6.06 | % | | | 6.60 | % |
| Foreign Currency | | | 3.74 | % | | | 3.18 | % | | | 3.02 | % |
| Weighted-average rate | | | 4.45 | % | | | 4.06 | % | | | 4.12 | % |
| | (1) | Gross yield is interest income divided by average interest-earning assets. |
| | (2) | Net interest margin represents net interest income divided by average interest-earning assets. |
| | (3) | Yield spread, on a nominal basis, represents the difference between gross yield on average interest-earning assets and average cost of interest-bearing liabilities. |
Interest-Earning Deposits With Other Banks
The following table shows the short-term funds deposited with other banks. These deposits broken down by currency as of the dates indicated. Deposits held in countries other than Peru are denominated in several currencies; however, the substantial majority of these deposits are denominated in U.S. Dollars. These currencies were converted to U.S. Dollars using the applicable SBS exchange rate as of the date of relevant balance.
| | | Year ended December 31, | |
| | | 2006 | | | 2007 | | | 2008 | |
| | | (U.S. Dollars in thousands) | |
| | | | | | | | | | |
| Nuevo Sol-denominated: | | | | | | | | | |
| Peruvian Central Bank | | US$ | 37,547 | | | US$ | - | | | US$ | 1,601,574 | |
| Commercial banks | | | 55,819 | | | | 41,826 | | | | 36,184 | |
| Total Nuevo Sol-denominated | | US$ | 93,366 | | | US$ | 41,826 | | | US$ | 1,637,758 | |
| Foreign Currency-denominated: | | | | | | | | | | | | |
| Peruvian Central Bank (U.S. Dollars) | | US$ | 1,105,921 | | | US$ | 1,000,000 | | | US$ | - | |
| U.S. Dollars, other | | | 739,028 | | | | 1,360,649 | | | | 1,030,665 | |
| Other | | | 55,506 | | | | 50,472 | | | | 40,332 | |
| Total Foreign Currency-denominated | | US$ | 1,900,455 | | | US$ | 2,411,121 | | | US$ | 1,070,997 | |
| Total | | US$ | 1,993,821 | | | US$ | 2,452,947 | | | US$ | 2,708,755 | |
The following table shows the fair value of our trading and available-for-sale investment securities by type at the dates indicated (see Note 5 to the Credicorp Consolidated Financial Statements):
| | | On December 31, | |
| | | 2006 | | | 2007 | | | 2008 | |
| | | (U.S. Dollars in Thousands) | |
| | | | | | | | | | |
| Nuevo Sol-denominated: | | | | | | | | | |
| Peruvian government bonds | | US$ | 156,890 | | | US$ | 274,391 | | | US$ | 244,037 | |
| Equity securities | | | 148,333 | | | | 227,751 | | | | 120,966 | |
| Bonds | | | 74,010 | | | | 110,916 | | | | 115,232 | |
| Peruvian Central Bank certif. notes | | | 1,277,613 | | | | 2,407,005 | | | | 1,138,214 | |
| Other investments | | | 264,112 | | | | 132,788 | | | | 117,642 | |
| Total Nuevo Sol-denominated | | | 1,920,958 | | | | 3,152,851 | | | | 1,736,091 | |
| Foreign Currency-denominated: | | | | | | | | | | | | |
| Equity securities | | US$ | 102,543 | | | US$ | 118,313 | | | US$ | 96,820 | |
| Bonds | | | 1,114,211 | | | | 1,198,073 | | | | 1,032,482 | |
| Investment in Peruvian Government Bonds | | | 268,235 | | | | 362,603 | | | | 563,014 | |
| Peruvian Central Bank certif. notes | | | - | | | | - | | | | 1,070,728 | |
| Other investment | | | 61,634 | | | | 406,262 | | | | 452,444 | |
| Total Foreign Currency-denominated | | US$ | 1,546,623 | | | US$ | 2,085,251 | | | US$ | 3,215,488 | |
| Total securities holdings: | | US$ | 3,467,581 | | | US$ | 5,238,102 | | | US$ | 4,951,579 | |
The allowance for decline in value of marketable securities is debited from the value of each individual security.
The weighted-average yield on our Nuevo Sol-denominated interest-earning investment securities was 5.1% in 2006, 6.5% in 2007 and 7.9% in 2008. The weighted-average yield on our foreign currency-denominated portfolio was 5.4% in 2006, 4.4% 2007 and 3.3% in 2008. The total weighted-average yield of our investment securities was 5.3% in 2006, 5.4% in 2007 and 5.2% in 2008.
The weighted-average yield on our Nuevo Sol-denominated dividend-earning assets was 5.2% in 2006, 2.8% in 2007 and 3.8% in 2008. The weighted-average yield on our foreign currency-denominated portfolio was 2.7% in 2006, 2.6% in 2007 and 5.2% in 2008. The total weighted-average yield of our dividend-earning assets was 4.0% in 2006, 2.7% in 2007 and 4.3% in 2008.
The following table shows the maturities of our trading and available-for-sale investment securities by type on December 31, 2008:
| | | Within 1 year | | | After 1 year but within 3 years | | | Maturing after 3 years but within 5 years | | | Maturing after 5 years but within 10 years | | | After 10 years | | | Total | |
| | | (U.S. Dollars in thousands) | |
Nuevo Sol-denominated: (1) | | | | | | | | | | | | | | | | | | |
| Peruvian government bonds | | US$ | 2,007 | | | US$ | 43,077 | | | US$ | 4,130 | | | US$ | 96,939 | | | US$ | 97,884 | | | US$ | 244,037 | |
| Equity securities (1) | | | 120,966 | | | | - | | | | - | | | | - | | | | - | | | | 120,966 | |
| Bonds and debentures | | | 13,487 | | | | 15,025 | | | | 7,764 | | | | 20,305 | | | | 58,651 | | | | 115,232 | |
| Peruvian Central Bank certif. notes | | | 1,127,130 | | | | 11,084 | | | | - | | | | - | | | | - | | | | 1,138,214 | |
| Other investments | | | 88,010 | | | | 5,039 | | | | 2,332 | | | | 15,512 | | | | 6,749 | | | | 117,642 | |
| Total Nuevo Sol-denominated | | US$ | 1,351,600 | | | US$ | 74,225 | | | US$ | 14,226 | | | US$ | 132,756 | | | US$ | 163,284 | | | US$ | 1,736,091 | |
Foreign Currency-denominated: (1) | | | | | | | | | | | | | | | | | | | | | | | | |
| Peruvian government bonds | | | 9,868 | | | | - | | | | 102,838 | | | | 304,620 | | | | 145,688 | | | | 563,014 | |
| Equity securities | | | 96,820 | | | | - | | | | - | | | | - | | | | - | | | | 96,820 | |
| Bonds | | | 259,746 | | | | 198,970 | | | | 139,705 | | | | 139,336 | | | | 294,725 | | | | 1,032,482 | |
| Peruvian Central Bank certif. notes | | | 1,070,728 | | | | - | | | | - | | | | - | | | | - | | | | 1,070,728 | |
| Other investments | | | 434,714 | | | | 6,787 | | | | 2,109 | | | | 5,272 | | | | 3,562 | | | | 452,444 | |
| Total Foreign Currency-denominated | | US$ | 1,871,876 | | | US$ | 205,757 | | | US$ | 244,652 | | | US$ | 449,228 | | | US$ | 443,975 | | | US$ | 3,215,488 | |
| Total securities holdings: | | US$ | 3,223,476 | | | US$ | 279,982 | | | US$ | 258,878 | | | US$ | 581,984 | | | US$ | 607,259 | | | US$ | 4,951,579 | |
| Weighted-average yield | | | | | | | | | | | | | | | | | | | | | | | 4.66 | % |
| (1) | Equity securities in our account are categorized as maturing within one year. |
Maturities of our investments securities classified by trading and available-for-sale, as of December 31, 2008 are described in “Item 11. Quantitative and Qualitative Disclosures about Market Risk.”
Our management has determined that the unrealized losses as of December 31, 2008 and 2007 are temporary. Management intends to and is able to hold each investment for a period of time that is sufficient to allow for an anticipated recovery in fair value. This holding period will last until the earlier of the investment’s anticipated recovery or maturity.
For equity investments (shares), our management has considered the following criteria in determining whether a loss is temporary:
| | · | The length of time and the extent to which fair value has been below cost; |
| | · | The severity of the impairment; |
| | · | The cause of the impairment and the financial condition and near-term prospects of the issuer; and |
| | · | Activity in the market of the issuer which may indicate adverse credit conditions. |
For debt investments (fixed maturity), our management has considered the following criteria in determining whether a loss is temporary:
| | · | We assess the probability that we will receive all amounts due (principal and interest) under the contract of the security. We consider a number of factors in identifying a credit-impaired security, including: (i) the nature of the security and the underlying collateral, (ii) the amount of subordination or credit enhancement supporting the security, (iii) the published credit rating and (iv) other analyses of the probable cash flows from the security. If recovery of all amounts due is not likely, we determine that a credit impairment exists and record unrealized loss directly in our consolidated income statement. The recorded unrealized loss recorded in income represents the security’s decline in fair value, which includes the decline due to forecasted cash flow shortfalls as well as general market spread widening. |
| | · | For securities with unrealized losses not identified as a credit impairment, our management determines whether it has the intent and ability to hold the security for a period of time that will allow for an anticipated recovery in the security’s amortized cost. Our management estimates a security’s forecasted recovery period using current estimates of volatility in market interest rates (including liquidity and risk premiums). Management’s determination regarding its intent and ability to hold investments considers a number of factors, including (i) a quantitative estimate of the expected recovery period (which may extend to maturity), (ii) the severity of the impairment and (iii) its strategy with respect to the security or portfolio. If our management does not have the intent and ability to hold the security for a sufficient time period, we record the unrealized loss directly in the consolidated income statement. |
Loans by Type of Loan
The following table shows our loans by type of loan, at the dates indicated:
| | | On December 31, | |
| | | 2004 | | | 2005 | | | 2006 | | | 2007 | | | 2008 | |
| | | (U.S. Dollars in thousands) | |
| Loans | | US$ | 3,507,831 | | | US$ | 3,865,643 | | | US$ | 4,662,730 | | | US$ | 6,520,116 | | | US$ | 8,179,453 | |
| Leasing transactions | | | 424,902 | | | | 564,575 | | | | 675,804 | | | | 1,118,301 | | | | 1,792,827 | |
| Discounted notes | | | 183,519 | | | | 213,232 | | | | 256,534 | | | | 325,047 | | | | 368,648 | |
| Factoring | | | 58,116 | | | | 87,757 | | | | 89,171 | | | | 109,928 | | | | 124,537 | |
| Advances and overdrafts | | | 48,506 | | | | 49,283 | | | | 84,262 | | | | 127,486 | | | | 102,687 | |
| Refinanced loans | | | 243,892 | | | | 175,211 | | | | 126,006 | | | | 88,451 | | | | 55,179 | |
| Past-due loans | | | 159,057 | | | | 95,769 | | | | 76,770 | | | | 61,488 | | | | 82,867 | |
| Unearned interest | | | (66,805 | ) | | | (78,495 | ) | | | (93,916 | ) | | | (166,972 | ) | | | (249,914 | ) |
| Total loans: | | US$ | 4,559,018 | | | US$ | 4,972,975 | | | US$ | 5,877,361 | | | US$ | 8,183,845 | | | US$ | 10,456,284 | |
| Total past-due loans amounts | | | (159,057 | ) | | | (95,769 | ) | | | (76,770 | ) | | | (61,488 | ) | | | (82,867 | ) |
| Total performing loans | | US$ | 4,399,961 | | | US$ | 4,877,206 | | | US$ | 5,800,591 | | | US$ | 8,122,357 | | | US$ | 10,373,417 | |
The categorization of the loan portfolio as set forth in the table above is based on the regulations of the SBS, which we have applied to loans generated by BCP and ASHC. Pursuant to the guidelines of the SBS, we categorize loans as follows:
| | · | Loans: Basic term loans documented by promissory notes and other extensions of credit, such as mortgage loans, credit cards and other consumer loans in various forms, including trade finance loans to importers and exporters on specialized terms adapted to the needs of the international trade transaction. |
| | · | Leasing Transactions: Transactions that involve our acquisition of an asset and the leasing of that asset to our client. |
| | · | Discounted Notes: Loans discounted at the outset (the client signs a promissory note or other evidence of indebtedness for the principal amount payable at a future date). Discounted loans also include discounting of drafts, where we make a loan supported by a draft signed by one party and discounted by another party, with recourse to both parties. |
| | · | Factoring: The sale of title of a company’s accounts receivables to a bank (or financial company). The receivables are sold without recourse and the bank cannot turn to the seller in the event that the accounts prove uncollectible. Factoring involves the receipt of funds by the seller from the bank prior to the average maturity date, based on the invoice amount of the receivable, less cash discounts, less an allowance for estimated claims and returns, among other items. |
| | · | Advances and Overdrafts: Extensions of credit to clients by way of an overdraft facility in the client’s checking account. This category also includes secured short-term advances. |
| | · | Refinanced Loans: Loans that were refinanced because the client was unable to pay at maturity. A loan is categorized as a refinanced loan when a debtor is experiencing payment problems, unless the debtor is current on all interest payments and pays down at least 20% of the principal amount of the original loan. We have distinguished a sub-group titled “Restructured Loans,” which is defined as loans extended under the bankruptcy protection procedures established in the Equity Restructuring Law. |
| | · | Past-Due Loans: Includes overdue loans. See “—Past-Due Loan Portfolio” for further detail. |
Loans by Economic Activity
The following table shows our total loan portfolio composition, net of unearned interest, based on the borrower’s principal economic activity:
| | | At December 31, | |
| | | 2004 | | | 2005 | | | 2006 | |
| | | (U.S. Dollars in thousands, except percentages) | |
| | | Amount | | | % Total | | | Amount | | | % Total | | | Amount | | | % Total | |
| Economic Activity | | | | | | | | | | | | | | | | | | |
| Manufacturing | | US$ | 1,376,874 | | | | 30.20 | % | | US$ | 1,430,559 | | | | 28.77 | % | | US$ | 1,624,765 | | | | 27.64 | % |
| Consumer Loans (1) | | | 1,187,378 | | | | 26.04 | | | | 1,364,910 | | | | 27.45 | | | | 1,729,682 | | | | 29.43 | |
| Commerce | | | 523,574 | | | | 11.48 | | | | 625,908 | | | | 12.59 | | | | 686,291 | | | | 11.68 | |
| Realty Business and Leasing Services | | | 224,745 | | | | 4.93 | | | | 216,095 | | | | 4.35 | | | | 236,445 | | | | 4.02 | |
| Mining | | | 194,022 | | | | 4.26 | | | | 223,156 | | | | 4.49 | | | | 303,238 | | | | 5.16 | |
| Communication, Storage and Transportation | | | 181,018 | | | | 3.97 | | | | 210,002 | | | | 4.22 | | | | 255,730 | | | | 4.35 | |
| Electricity, Gas and Water | | | 248,571 | | | | 5.45 | | | | 192,096 | | | | 3.86 | | | | 256,541 | | | | 4.36 | |
| Agriculture | | | 160,167 | | | | 3.51 | | | | 153,410 | | | | 3.08 | | | | 150,020 | | | | 2.55 | |
| Fishing | | | 68,604 | | | | 1.50 | | | | 117,104 | | | | 2.35 | | | | 152,538 | | | | 2.60 | |
| Financial Services | | | 90,042 | | | | 1.98 | | | | 105,484 | | | | 2.12 | | | | 163,946 | | | | 2.79 | |
| Education, Health and Other Services | | | 62,341 | | | | 1.37 | | | | 69,468 | | | | 1.40 | | | | 75,376 | | | | 1.28 | |
| Construction | | | 72,879 | | | | 1.60 | | | | 68,217 | | | | 1.37 | | | | 74,482 | | | | 1.27 | |
| Others (2) | | | 235,608 | | | | 5.17 | | | | 275,061 | | | | 5.53 | | | | 262,223 | | | | 4.46 | |
| Sub total | | | 4,625,823 | | | | 101.46 | | | | 5,051,470 | | | | 101.58 | | | | 5,971,277 | | | | 101.59 | |
| Unearned interest | | | (66,805 | ) | | | -1.46 | | | | (78,495 | ) | | | -1.58 | | | | (93,916 | ) | | | -1.59 | |
| Total | | US$ | 4,559,018 | | | | 100.00 | % | | US$ | 4,972,975 | | | | 100.00 | % | | US$ | 5,877,361 | | | | 100.00 | % |
| (1) | Includes credit card and mortgage loans, other consumer loans and small business. |
| (2) | Includes personal banking and small business loans and other sectors. |
| | | At December 31, | |
| | | 2007 | | | 2008 | |
| | | (U.S. Dollars in thousands, except percentages) | |
| | | Amount | | | % Total | | | Amount | | | % Total | |
| Economic Activity | | | | | | | | | | | | |
| Manufacturing | | US$ | 2,204,481 | | | | 26.94 | % | | US$ | 2,535,326 | | | | 24.25 | % |
| Consumer Loans (1) | | | 2,480,916 | | | | 30.31 | | | | 3,146,698 | | | | 30.09 | |
| Commerce | | | 884,253 | | | | 10.80 | | | | 1,344,921 | | | | 12.86 | |
| Realty Business and Leasing Services | | | 387,180 | | | | 4.73 | | | | 488,202 | | | | 4.67 | |
| Mining | | | 463,577 | | | | 5.66 | | | | 675,460 | | | | 6.46 | |
| Communication, Storage and Transportation | | | 394,986 | | | | 4.83 | | | | 515,412 | | | | 4.93 | |
| Electricity, Gas and Water | | | 341,718 | | | | 4.18 | | | | 546,014 | | | | 5.22 | |
| Agriculture | | | 179,509 | | | | 2.19 | | | | 228,623 | | | | 2.19 | |
| Fishing | | | 134,235 | | | | 1.64 | | | | 77,060 | | | | 0.74 | |
| Financial Services | | | 219,850 | | | | 2.69 | | | | 439,234 | | | | 4.20 | |
| Education, Health and Other Services | | | 106,423 | | | | 1.30 | | | | 128,527 | | | | 1.23 | |
| Construction | | | 201,298 | | | | 2.46 | | | | 229,667 | | | | 2.20 | |
| Others (2) | | | 352,391 | | | | 4.31 | | | | 351,054 | | | | 3.36 | |
| Sub total | | | 8,350,817 | | | | 102.04 | | | | 10,706,198 | | | | 102.40 | |
| Unearned interest | | | (166,972 | ) | | | -2.04 | | | | (249,914 | ) | | | -2.40 | |
| Total | | US$ | 8,183,845 | | | | 100.00 | % | | US$ | 10,456,284 | | | | 100.00 | % |
| (1) | Includes credit card and mortgage loans, other consumer loans and small business. |
| (2) | Includes personal banking and small business loans and other sectors. |
As of December 31, 2008, 68.5% of the loan portfolio was concentrated in Lima and 93.10% was concentrated in Peru. An additional 4.4% of the loan portfolio was concentrated in Bolivia.
Concentrations of Loan Portfolio and Lending Limits
Our loans and other contingent credits to the 20 customers (considered as economic groups) to which we had the largest exposure as of December 31, 2008 were US$2,473.1 million. Of this amount, US$2,348.5 million were outstanding loans which representing 22.95% of the total loan portfolio. See “—(11) Supervision and Regulation—(ii) BCP—Lending Activities” for the definition of “economic group.” Our total loans and other contingent credits outstanding to these customers ranged from US$215.1 million to US$82.5 million, including 18 customers with over US$91.0 million. Total loans and other contingent credits outstanding to our 20 largest customers were ranked in the following risk categories as of December 31, 2008: Class A (normal)—95.0%; Class B (potential problems)—5.0%; Class C (substandard)—0%; Class D (doubtful)—0%; and Class E (loss)—0%. See “—Classification of the Loan Portfolio.”
BCP’s loans to a single borrower are subject to lending limits imposed by Law 26702. See “—(11) Supervision and Regulation—(ii) BCP—Lending Activities.” The lending limits of Law 26702 depend on the nature of the borrower involved and the type of collateral received. The sum of BCP’s loans to and deposits in either another Peruvian universal bank or Peruvian financial institution, plus any guarantees of third party performance received by BCP from such institution, may not exceed 30% of BCP’s regulatory capital (as defined by the SBS). The sum of BCP’s loans to and deposits in non-Peruvian financial institutions, plus any guarantees of third party performance received by BCP from such institutions, are limited to 5%, 10% or 30% of BCP’s regulatory capital, depending upon the governmental supervision to which the institution is subject and upon whether it is recognized by the Central Bank as an international bank of prime credit quality. The limits on lending to non-Peruvian financial institutions increase to 50% of BCP’s regulatory capital if the amount by which such loans exceed the 5%, 10% or 30% limits is backed by certain letters of credit.
BCP’s loans to directors and employees and their relatives have a global limit of 7% of capital stock and reserves and an individual limit of 5% of such global limit.
Loans to non-Peruvian individuals or companies that are not financial institutions have a limit of 5% of BCP’s regulatory capital. However, this limit increases to 10% if the additional 5% is guaranteed by a mortgage or certain publicly-traded securities. The limit rises to 30% if the additional amount is guaranteed by certain banks or by cash deposits in BCP. Lending on an unsecured basis to individuals or companies residing in Peru that are not financial institutions is limited to 10% of BCP’s regulatory capital. This limit rises to 15% if the additional 5% is guaranteed by a mortgage, certain securities, equipment or other collateral and to 20% if the additional amount is either backed by certain debt instruments guaranteed by other local banks or a foreign bank determined by the Central Bank of prime credit quality, or by other highly liquid securities at market value. Finally, the single borrower lending limit for loans backed by a cash deposit at BCP or by debt obligations of the Central Bank is 30% of BCP’s regulatory capital.
With an unconsolidated regulatory capital of S/.4,092.0 million (US$1,303.2 million) on December 31, 2008, BCP’s legal lending limits vary from S/.409.2 million (US$130.3 million) to S/.2,046.0 million (US$651.6 million). Our consolidated lending limits, based on its regulatory capital on a consolidated basis of US$1,604.7 million on December 31, 2008, range from US$80.2 million to US$802.4 million. As of December 31, 2008, BCP was in compliance with Law 26702 lending limits.
As of December 31, 2008, we complied with the applicable legal lending limits in each of the jurisdictions in which we operate. These limits are calculated quarterly based on our consolidated equity plus reserves for impaired loans not specifically identified at quarter-end. A limited number of exceptions to our internal limits have been authorized by our board of directors from time to time, based on the credit quality of the borrower, the term of the loan, and the amount and quality of collateral that we have taken. We may, in appropriate and limited circumstances, increase or choose to exceed this limit in the future.
We may experience an adverse impact on our financial condition and results of operations if (i) customers to which we have as significant credit exposure are not able to meet their obligations to us, and any related collateral is not sufficient to cover these obligations, or (ii) a reclassification of one or more of these loans or other contingent credits results in an increase in provisions for loan losses.
Loan Portfolio Denomination
The following table presents our Nuevo Sol and foreign currency-denominated loan portfolio at the dates indicated:
| | | At December 31, |
| | | 2004 | | | 2005 | | 2006 |
| | | (U.S. Dollars in thousands, except percentages) |
| Total loan portfolio: | | | | | | | | | | | | | | | | |
| Nuevo Sol-denominated | | US$ | 662,058 | | | | 14.52 | % | | US$ | 1,032,481 | | | | 20.76 | % | | US$ | 1,503,306 | | | | 25.58 | % |
| Foreign Currency-denominated | | | 3,896,960 | | | | 85.48 | % | | | 3,940,494 | | | | 79.24 | % | | | 4,374,055 | | | | 74.42 | % |
| Total loans (1) | | US$ | 4,559,018 | | | | 100.00 | % | | US$ | 4,972,975 | | | | 100.00 | % | | US$ | 5,877,361 | | | | 100.00 | % |
| | | At December 31, | |
| | | 2007 | | | 2008 | |
| | | (U.S. Dollars in thousands, except percentages) | |
| Total loan portfolio: | | | | | | | | | | | | |
| Nuevo Sol-denominated | | US$ | 2,461,787 | | | | 30.08 | % | | US$ | 3,351,720 | | | | 32.05 | % |
| Foreign Currency-denominated | | | 5,722,058 | | | | 69.92 | % | | | 7,104,564 | | | | 67.95 | % |
| Total loans (1) | | US$ | 8,183,845 | | | | 100.00 | % | | US$ | 10,456,284 | | | | 100.00 | % |
| (1) | Net of unearned interest. |
Maturity Composition of the Performing Loan Portfolio
The following table sets forth an analysis of our performing loan portfolio on December 31, 2008, by type and by time remaining to maturity. Loans are stated before deduction of the reserves for loan losses.
| | | Maturing | |
| | | Amount at December 31, 2008 | | | Within 3 months | | | After 3 months but within 12 months | | | After 1 year but within 3 years | | | After 3 years but within 5 years | | | After 5 years | |
| | | (U.S. Dollars in thousands, except percentages) | |
| Loans | | US$ | 8,179,453 | | | US$ | 2,774,294 | | | US$ | 1,905,676 | | | US$ | 1,120,693 | | | US$ | 812,141 | | | US$ | 1,566,649 | |
| Leasing transactions | | | 1,792,827 | | | | 334,072 | | | | 680,704 | | | | 515,639 | | | | 211,646 | | | | 50,766 | |
| Discounted notes | | | 368,648 | | | | 354,263 | | | | 14,294 | | | | 91 | | | | - | | | | - | |
| Refinanced loans | | | 55,179 | | | | 5,623 | | | | 11,047 | | | | 12,398 | | | | 9,588 | | | | 16,523 | |
| Factoring | | | 124,537 | | | | 124,300 | | | | 237 | | | | - | | | | - | | | | - | |
| Advances and overdrafts | | | 102,687 | | | | 102,687 | | | | - | | | | - | | | | - | | | | - | |
| Total . | | US$ | 10,623,331 | | | US$ | 3,695,239 | | | US$ | 2,611,958 | | | US$ | 1,648,821 | | | US$ | 1,033,375 | | | US$ | 1,633,938 | |
| % of total performing loan portfolio | | | 100.00 | % | | | 34.78 | % | | | 24.59 | % | | | 15.52 | % | | | 9.73 | % | | | 15.38 | % |
Interest Rate Sensitivity of the Loan Portfolio
The following table sets forth the interest rate sensitivity of our loan portfolio on December 31, 2008, by currency and by the time remaining to maturity over one year:
| | | Amount at December 31, 2008 | | | Maturing after 1 year | |
| | | (U.S. Dollars in thousands) | |
| Variable Rate | | | | | | |
| Nuevo Sol-denominated | | US$ | 429,827 | | | US$ | 410,012 | |
| Foreign Currency-denominated | | | 929,362 | | | | 524,076 | |
| Total | | | 1,359,189 | | | | 934,088 | |
| | | | | | | | | |
Fixed Rate (2) | | | | | | | | |
| Nuevo Sol-denominated | | | 2,943,070 | | | | 793,303 | |
| Foreign Currency-denominated | | | 6,154,025 | | | | 2,480,484 | |
| Total | | | 9,097,095 | | | | 3,273,787 | |
| | | | | | | | | |
| Total (1) | | US$ | 10,456,284 | | | US$ | 4,207,875 | |
| (1) | Net of unearned interest. |
| (2) | Most of the financial products with fixed rates can be switched to variable rates according to market conditions as specified on the contracts with clients. |
Classification of the Loan Portfolio
We classify BCP’s loan portfolio (which includes the loan portfolio of BCB) and ASHC’s loan portfolio in accordance with SBS regulations. According to SBS Resolution No. 808-2003, banks must classify all loans and other credits into one of four categories based upon the purpose of the loan. These categories are commercial, micro-business, consumer and residential mortgage. Commercial loans are generally those that finance the production and sale of goods and services, including commercial leases, as well as credit card debt on cards held by business entities. Micro-business loans, which are exclusively targeted for the production and sale of goods and services, are made to individuals or companies with no more than S/.300,000 in total loans received from the financial system (excluding mortgage loans). Consumer loans are generally loans granted to individuals, including credit card transactions, overdrafts on personal demand deposit accounts, leases, and financing goods or services not related to a business activity. Residential mortgage loans are all loans to individuals for the purchase, construction, remodeling, subdivision or improvement of the individual’s own home, in each case backed by a mortgage. Mortgage loans made to directors and employees of a company are also considered residential mortgage loans. Mortgage-backed loans are considered commercial loans. The classification of the loan determines the amount the bank is required to reserve should the borrower fail to make payments as they become due.
Regulations promulgated by the SBS also require Peruvian banks to classify all loans into one of five other categories depending upon each loan’s degree of risk of nonpayment. We review our loan portfolio on a continuing basis, while the SBS reviews our portfolio as it deems necessary or prudent. In compliance with SBS guidelines, we classify our loans based upon risk of nonpayment by assessing the following factors: (i) the payment history of the particular loans, (ii) the history of our dealings with the borrower, (iii) the borrower’s management, (iv) the borrower’s operating history, (v) the borrower’s repayment capability, (vi) the borrower’s availability of funds, (vii) status of any collateral or guarantee, (viii) the borrower’s financial statements, (iv) the general risk of the sector in which the borrower operates, (x) the borrower’s risk classification made by other financial institutions and (xi) other relevant factors. The classification of the loan determines the amount of the required loan loss provision.
The following table sets forth a breakdown of the loan portfolio by class as of December 31 of each of the last five years:
| | | At December 31, | |
| | | 2004 | | | 2005 | | | 2006 | | | 2007 | | | 2008 | |
| | | (U.S. Dollars in thousands) | |
| Commercial loans | | US$ | 3,625,678 | | | US$ | 3,771,488 | | | US$ | 4,390,547 | | | US$ | 6,055,206 | | | US$ | 7,808,671 | |
| Consumer loans | | | 283,410 | | | | 356,595 | | | | 506,184 | | | | 874,804 | | | | 1,162,399 | |
| Residential mortgage loans | | | 649,930 | | | | 844,892 | | | | 980,630 | | | | 1,253,835 | | | | 1,485,214 | |
| Total performing loans (1) | | US$ | 4,559,018 | | | US$ | 4,972,975 | | | US$ | 5,877,361 | | | US$ | 8,183,845 | | | US$ | 10,456,284 | |
| (1) | Net of unearned interest. |
We employ a range of policies and practices to mitigate credit risk. Our most traditional practice is taking security for funds advances. We implement guidelines on the acceptability of specific classes of collateral or credit risk mitigation. The principal collateral types for loans and advances are mortgages over residential properties, liens over business assets (such as premises, inventory and accounts receivable), and liens over financial instruments (such as debt securities and equities).
Longer-term finance and lending to corporate entities are generally secured, while revolving individual credit facilities are generally unsecured. In addition, in order to minimize credit loss, we will seek additional collateral from a counterparty as soon as impairment indicators rise.
We determine what collateral we will hold as security for financial assets (other than loans) according to the nature of the instrument. Debt securities, treasury and other eligible bills are generally unsecured, with the exception of asset-backed securities and similar instruments, which are secured by portfolios of financial instruments.
Our management monitors the market value of collateral, requests additional collateral in accordance with the underlying agreement, and monitors the market value of the additional collateral obtained during its review of the adequacy of the allowance for impairment losses. Our policy is to dispose of repossessed properties in an orderly manner. We use the proceeds to reduce or repay the outstanding claim. In general, we do not use repossessed properties for our own business.
We classify our loan portfolio into one of five risk categories, depending upon the degree of risk of non-payment of each debtor. These categories are: (i) normal, (ii) potential problems, (iii) substandard, (iv) doubtful and (v) loss, and have the following characteristics:
Normal (Class A): Debtors of commercial loans that fall into this category have complied on a timely basis with their obligations and at the time of evaluation do not present any reason for doubt with respect to repayment of interest and principal on the agreed dates. There is no reason to believe that the status will change before the next evaluation. Before we place a loan in Class A, we must have a clear understanding of the use of the funds and the origin of the cash flows to be used by the debtor to repay the loan. Consumer loans warrant Class A classification if payments are current or up to eight days past due. Residential mortgage loans warrant Class A classification if payments are current or up to 30 days past due.
Potential problems (Class B): Debtors of commercial loans included in this category evaluation demonstrate certain deficiencies at the time of evaluation, which, if not corrected in a timely manner, imply risks regarding the recovery of the loan. Common characteristics of loans or credits in this category include: (i) delays in loan payments which are promptly covered, (ii) a general lack of information required to analyze the credit, (iii) out-of-date financial information, (iv) temporary economic or financial imbalances on the part of the debtor which could affect its ability to repay the loan, (v) market conditions that could affect the economic sector in which the debtor is active, (vi) material overdue debts or pending judicial collection actions initiated by other financial institutions, (v) noncompliance with originally contracted conditions, (vi) conflicts of interest within the client, (vii) labor problems, (viii) unfavorable credit history, (ix) noncompliance with its own internal policies regarding concentration of suppliers or customers, and (x) low inventory turnover ratios or large inventories that are subject to competitive challenges or technological obsolescence. Consumer loans are categorized as Class B if payments are between nine and 30 days late. Residential mortgage loans become Class B when payments are between 31 and 90 days late.
Substandard (Class C): Debtors of commercial loans included in this category demonstrate serious financial weakness. They often have operating results or available income insufficient to cover financial obligations on agreed-upon terms, with no reasonable short-term prospects for strengthening their financial capacity. Debtors demonstrating the same deficiencies that warrant classification as Class B warrant classification as Class C if those deficiencies are such that if they are not corrected in the near term, they could impede the recovery of principal and interest on the loan on the originally agreed-upon terms. In addition, commercial loans are classified in this category when payments are between 61 and 120 days late. If payments on a consumer loan are between 31 and 60 days late, such loans are classified as Class C. Residential mortgage loans are classified as Class C when payments are between 91 and 120 days late.
Doubtful (Class D): Debtors of commercial loans included in this category show characteristics that make doubtful the recovery of the loan. Although the loan recovery is doubtful, if there is a reasonable possibility that in the near future the creditworthiness of the debtor might improve, it is appropriate to categorize the loan as Class D. These loans are distinguished from Class E loans by the requirement that the debtor remain in operation, generate cash flow, and make payments on the loan, even if the payments are at a rate less than that required by the contract. In addition, commercial loans are classified in this category when payments are between 121 and 365 days late. Consumer loans are categorized as Class D if payments are between 61 and 120 days late. Residential mortgage loans are Class D when payments are between 121 and 365 days late.
Loss credits (Class E): Commercial loans or credits fall into this category if they are considered unrecoverable or for any other reason they should not appear on our books as an asset based on the originally contracted terms. In addition, commercial loans are classified in this category when payments are more than 365 days late. Consumer loans are categorized as Class E if payments are more than 120 days late. Residential mortgage loans are Class E when payments are more than 365 days late.
We review our loan portfolio on a continuing basis in order to assess the completion and accuracy of our grades.
All loans considered impaired (the ones classified as substandard, doubtful and loss) are analyzed by our management, which addresses impairment in two areas—individually assessed allowances and collectively assessed allowances—as follows:
Individually Assessed Allowance
We determine the allowances appropriate for each individually significant loan or advance on an individual basis. In determining allowance amounts, we consider items such as (i) the sustainability of the counterparty’s business plan, (ii) its ability to improve performance once a financial difficulty has arisen, (iii) projected receipts and the expected dividend payout should bankruptcy ensue, (iv) the availability of other financial support and the realizable value of collateral, and (v) the timing of the expected cash flows. Impairment losses are evaluated at each reporting date, unless unforeseen circumstances require more careful attention.
Collectively Assessed Allowance
We assess allowances collectively for (i) losses on loans and advances that are not individually significant (including consumer and residential mortgages) and (ii) individually significant loans and advances where there is not yet objective evidence of individual impairment (included in classes A and B). We evaluate allowances on each reporting date. Each portfolio receives a separate review.
Our collective assessment takes account of impairment that is likely to be present in the portfolio even though there is not yet objective evidence of the impairment in an individual assessment. We estimate impairment losses by considering the following information: (i) historical losses on the portfolio, (ii) current economic conditions, (iii) the approximate delay between the time a loss is likely to have been incurred and the time it will be identified as requiring an individually assessed impairment allowance and (iv) expected receipts and recoveries once impaired. Local management is responsible for deciding the length of this period, which can extend for as long as one year. The impairment allowance is then reviewed by credit management to ensure alignment with our overall policy.
We assess financial guarantees and letter of credit, as well as provision made, in similar manners as for loans.
In situations of borrowers in countries where there is an increased risk of difficulties in servicing external debt, we assess the political and economic situation, and an additional country risk provision is provided.
When we determine that a loan is uncollectible, it is written off against the related provision for loan impairment. We write off these loans after all the necessary procedures have been completed and the amount of the loss has been determined. Subsequent recoveries of amounts previously written off decrease the amount of the provision for loan impairment in our consolidated income statements.
The following table shows our direct loan portfolio at the dates indicated:
| | | At December 31, | |
| | | 2004 | | | 2005 | | | 2006 | |
| | | (U.S. Dollars in thousands, except percentages) | |
| Level of Risk | | | |
| Classification | | Amount | | | % Total | | | Amount | | | % Total | | | Amount | | | % Total | |
| A: Normal | | US$ | 3,719,973 | | | | 81.6 | % | | US$ | 4,273,719 | | | | 85.9 | % | | US$ | 5,296,653 | | | | 90.1 | % |
| B: Potential Problems | | US$ | 336,619 | | | | 7.4 | % | | US$ | 397,387 | | | | 8.0 | % | | US$ | 337,497 | | | | 5.7 | % |
| C: Substandard | | US$ | 195,062 | | | | 4.3 | % | | US$ | 82,858 | | | | 1.7 | % | | US$ | 62,192 | | | | 1.1 | % |
| D: Doubtful | | US$ | 184,206 | | | | 4.0 | % | | US$ | 146,898 | | | | 3.0 | % | | US$ | 122,215 | | | | 2.1 | % |
| E: Loss | | US$ | 123,158 | | | | 2.7 | % | | US$ | 72,113 | | | | 1.4 | % | | US$ | 58,804 | | | | 1.0 | % |
| Total (1) | | US$ | 4,559,018 | | | | 100.0 | % | | US$ | 4,972,975 | | | | 100.0 | % | | US$ | 5,877,361 | | | | 100.0 | % |
| C+D+E | | US$ | 502,426 | | | | 11.0 | % | | US$ | 301,869 | | | | 6.1 | % | | US$ | 243,211 | | | | 4.2 | % |
| | | At December 31, | |
| | | 2007 | | | 2008 | |
| | | (U.S. Dollars in thousands, except percentages) | |
| Level of Risk | | | |
| Classification | | Amount | | | % Total | | | Amount | | | % Total | |
| A: Normal | | US$ | 7,602,347 | | | | 92.9 | % | | US$ | 9,991,559 | | | | 95.5 | % |
| B: Potential Problems | | US$ | 371,119 | | | | 4.5 | % | | US$ | 264,890 | | | | 2.5 | % |
| C: Substandard | | US$ | 71,340 | | | | 0.9 | % | | US$ | 70,268 | | | | 0.7 | % |
| D: Doubtful | | US$ | 88,540 | | | | 1.1 | % | | US$ | 79,394 | | | | 0.8 | % |
| E: Loss | | US$ | 50,499 | | | | 0.6 | % | | US$ | 50,173 | | | | 0.5 | % |
| Total (1) | | US$ | 8,183,845 | | | | 100.0 | % | | US$ | 10,456,284 | | | | 100.0 | % |
| C+D+E | | US$ | 210,379 | | | | 2.6 | % | | US$ | 199,835 | | | | 2.0 | % |
(1) Net of unearned interest.
All of our Class E loans and substantially all of our Class D loans are past due. Class C loans, although generally not past due, have demonstrated credit deterioration such that management has serious doubts as to the ability of the borrower to comply with the present loan repayment terms. The majority of our Class C loans are to companies in the Peruvian manufacturing sector and, to a lesser extent, the agricultural sector. Our manufacturing sector loans are primarily secured by warrants and liens on goods or by mortgages, whereas our agricultural loans tend to be secured by trade bills and marketable securities. The Class C loans reflect the financial weakness of the individual borrower rather than any trend in the Peruvian manufacturing or agricultural industries in general.
Classification of the Loan Portfolio Based on the Borrower’s Payment Performance
We consider loans to be past due depending on their type. BCP considers loans past due for consumer mortgage and leasing loans, and loans to micro-businesses after 90 days. Beginning January 1, 2001, the SBS issued accounting rules requiring Peruvian banks to consider overdrafts past due after 30 days. ASHC considers past due all overdue loans except for consumer loans, which are considered past due when the scheduled principal and/or interest payments are overdue for more than 90 days. BCB considers loans past due after 30 days. For IFRS 7 disclosure requirements on past-due loans, see Note 29.1 to the Credicorp Consolidated Financial Statements.
Interest income is suspended when collection of loans becomes doubtful, such as when overdue by more than 90 days. Also, when a borrower or securities’ issuer defaults, if earlier than 90 days, the income is excluded from interest income until it is received. Uncollected income on these loans is reversed against income. When management determines that the debtor’s financial condition has improved, we reestablish recording of interest on an accrual basis. Therefore, we do not accrue interest on past-due loans. Instead, interest on past-due loans is recognized only when and to the extent received.
Over the past five years, we have recognized interest income on these loans of US$6.2 million in 2004, US$5.5 million in 2005, US$4.8 million in 2006, US$3.6 million in 2007 and US$5.2 million in 2008. With the exception of discounted notes and overdrafts, accrued but unpaid interest is reversed for past-due loans.
The following table sets forth the repayment status of our loan portfolio as of December 31 of each of the last five years:
| | | At December 31, | |
| | | 2004 | | | 2005 | | | 2006 | | | 2007 | | | 2008 | |
| | | (U.S. Dollars in thousands, except percentages) | |
| Current | | US$ | 4,399,961 | | | US$ | 4,877,206 | | | US$ | 5,800,591 | | | US$ | 8,122,357 | | | US$ | 10,373,417 | |
| Past due: | | | | | | | | | | | | | | | | | | | | |
| Overdue 16 - 119 days | | | 11,572 | | | | 10,860 | | | | 20,655 | | | | 20,825 | | | | 34,955 | |
| Overdue 120 days or more | | | 147,485 | | | | 84,909 | | | | 56,115 | | | | 40,663 | | | | 47,912 | |
| Subtotal | | US$ | 159,057 | | | US$ | 95,769 | | | US$ | 76,770 | | | US$ | 61,488 | | | US$ | 82,867 | |
| Total loans | | US$ | 4,559,018 | | | US$ | 4,972,975 | | | US$ | 5,877,361 | | | US$ | 8,183,845 | | | US$ | 10,456,284 | |
| Past-due loan amounts as % of total loans | | | 3.49 | % | | | 1.93 | % | | | 1.31 | % | | | 0.75 | % | | | 0.79 | % |
With respect to consumer, mortgage and leasing loans, BCP (in accordance with SBS regulations) only recognizes payments as past-due installments if the loan is less than 90 days past due. The entire amount of these loans will be considered past due if any amount is past due more than 90 days. For IFRS 7 disclosure requirements on past-due loans, see Note 29.1 to the Credicorp Consolidated Financial Statements.
Past-Due Loan Portfolio
The following table analyzes our past-due loan portfolio by type of loan at the dates indicated:
| | | At December 31, | |
| | | 2004 | | | 2005 | | | 2006 | | | 2007 | | | 2008 | |
| | | (U.S. Dollars in thousands) | |
| Past-due loan amounts: | | | | | | | | | | | | | | | | | | | | |
| Loans | | US$ | 85,467 | | | US$ | 63,889 | | | US$ | 57,345 | | | US$ | 48,088 | | | US$ | 65,947 | |
| Discounted notes | | | 776 | | | | 1,124 | | | | 596 | | | | 636 | | | | 1,242 | |
| Advances and overdrafts in demand deposits | | | 4,157 | | | | 3,412 | | | | 1,844 | | | | 3,974 | | | | 2,112 | |
| Leasing transactions | | | 9,387 | | | | 6,412 | | | | 5,237 | | | | 2,110 | | | | 3,468 | |
| Refinanced loans | | | 59,270 | | | | 20,932 | | | | 11,748 | | | | 6,680 | | | | 10,098 | |
| Total past-due portfolio | | US$ | 159,057 | | | US$ | 95,769 | | | US$ | 76,770 | | | US$ | 61,488 | | | US$ | 82,867 | |
| Less: Reserves for loanlosses (1) | | US$ | 271,873 | | | US$ | 218,636 | | | US$ | 210,586 | | | US$ | 229,700 | | | US$ | 248,063 | |
| Total past-due portfolio net of reserves | | US$ | (112,816 | ) | | US$ | (122,867 | ) | | US$ | (133,816 | ) | | US$ | (168,212 | ) | | US$ | (165,196 | ) |
| (1) | Includes reserves for indirect credits (see “—Loan Loss Reserves”). |
We recognize interest on past-due loans and loans in legal collection when these loans are collected. The interest income that would have been recorded for these credits in accordance with the terms of the original contract amount is approximately US$17.0 million and US$18.7 million as of December 31, 2008 and 2007, respectively.
Loan Loss Reserves
The following table shows the changes in our reserves for loan losses and movements at the dates indicated:
| | | Year ended December 31, | |
| | | 2004 | | | 2005 | | | 2006 | | | 2007 | | | 2008 | |
| | | (U.S. Dollars in thousands) | |
| Reserves for loan losses at the beginning of the year | | US$ | 326,677 | | | US$ | 271,873 | | | US$ | 218,636 | | | US$ | 210,586 | | | US$ | 229,700 | |
| Additional provisions (reversals) | | | 16,131 | | | | (6,356 | ) | | | (4,243 | ) | | | 28,439 | | | | 48,760 | |
| Acquisitions and transfers | | | - | | | | (9,024 | ) | | | - | | | | - | | | | - | |
| Recoveries of write-offs | | | 32,287 | | | | 35,032 | | | | 44,284 | | | | 34,084 | | | | 31,279 | |
| Write-offs | | | (105,267 | ) | | | (71,405 | ) | | | (49,859 | ) | | | (47,266 | ) | | | (59,308 | ) |
| Monetary correction and other | | | 2,045 | | | | (1,484 | ) | | | 1,768 | | | | 3,857 | | | | (2,368 | ) |
| Total reserves for loan losses at the end of the year | | US$ | 271,873 | | | US$ | 218,636 | | | US$ | 210,586 | | | US$ | 229,700 | | | US$ | 248,063 | |
For a discussion of the risk elements in the loan portfolio and the factors considered in determining the amount of specific reserves, see “—Classification of the Loan Portfolio.” Also, as required by IFRS 7, the balance of the reserve for loan losses for the years 2006, 2007 and 2008 are included in Note 6(d) to the Credicorp Consolidated Financial Statements.
Our reserves for loan losses as of December 31, 2008 include US$224.3 million of reserves for credit losses and US$23.7 million of reserves for indirect or contingent credit losses (US$211.3 million and US$18.4 million as of December 31, 2007, respectively). Our reserves for indirect credit losses are included in the “Other liabilities” caption of our consolidated balance sheet (see Notes 6(d) and 11(a) to the Credicorp Consolidated Financial Statements).
The charge-off process is performed with prior approval of our board of directors and of the SBS, which is considered on a case-by-case basis.
We sell certain of our fully provisioned past-due loans to wholly-owned subsidiaries (Soluciónes en Procesamiento) for a nominal amount with the same effect as if the loans had been charged off. Accordingly, we believe that our past-due loan amounts are not materially different from what they would be if we were permitted to charge-off loans prior to demonstrating the absolute non-collectability of the loan. In addition, BCP sells employees’ mortgages loans to its subsidiary Financiera de Crédito Solución.
Allocation of Loan Loss Reserves
The following table sets forth the amounts of our reserves for loan losses attributable to commercial, consumer and residential mortgage loans at the dates indicated (see also Note 6(d) to the Credicorp Consolidated Financial Statements):
| | | At December 31, | |
| | | 2004 | | | 2005 | | | 2006 | | | 2007 | | | 2008 | |
| | | (U.S. Dollars in thousands) | |
| Commercial loans | | US$ | 236,419 | | | US$ | 195,699 | | | US$ | 183,374 | | | US$ | 184,584 | | | US$ | 153,608 | |
| Consumer loans | | | 14,079 | | | | 14,409 | | | | 17,959 | | | | 30,662 | | | | 72,087 | |
| Residential mortgage loans | | | 21,375 | | | | 8,528 | | | | 9,253 | | | | 14,454 | | | | 22,368 | |
| Total reserves | | US$ | 271,873 | | | US$ | 218,636 | | | US$ | 210,586 | | | US$ | 229,700 | | | US$ | 248,063 | |
| | The following table presents the components of our deposit base at the dates indicated: |
| | | At December 31, | |
| | | 2006 | | | 2007 | | | 2008 | |
| | | (U.S. Dollars in thousands) | |
| Demand deposits: | | | | | | | | | |
| Nuevo Sol-denominated | | US$ | 996,246 | | | US$ | 1,457,155 | | | US$ | 1,735,869 | |
| Foreign Currency-denominated | | | 1,796,187 | | | | 2,507,346 | | | | 3,136,408 | |
| Total | | US$ | 2,792,433 | | | US$ | 3,964,501 | | | US$ | 4,872,277 | |
| Savings deposits: | | | | | | | | | | | | |
| Nuevo Sol-denominated | | US$ | 610,292 | | | US$ | 877,205 | | | US$ | 1,193,639 | |
| Foreign Currency-denominated | | | 1,341,686 | | | | 1,503,699 | | | | 1,775,100 | |
| Total | | US$ | 1,951,978 | | | US$ | 2,380,904 | | | US$ | 2,968,739 | |
| Time deposits: | | | | | | | | | | | | |
| Nuevo Sol-denominated | | US$ | 862,901 | | | US$ | 1,391,008 | | | US$ | 1,768,893 | |
| Foreign Currency-denominated | | | 2,355,256 | | | | 2,576,856 | | | | 3,087,219 | |
| Total | | US$ | 3,218,157 | | | US$ | 3,967,864 | | | US$ | 4,856,112 | |
| Foreign Currency Bank Certificates | | | | | | | | | | | | |
| Foreign Currency-denominated | | US$ | 61,539 | | | US$ | 90,119 | | | US$ | 140,013 | |
| Severance Indemnity Deposits (CTS): | | | | | | | | | | | | |
| Nuevo Sol-denominated | | US$ | 103,282 | | | US$ | 149,308 | | | US$ | 229,716 | |
| Foreign Currency-denominated | | | 671,745 | | | | 746,975 | | | | 810,171 | |
| Total | | US$ | 775,027 | | | US$ | 896,283 | | | US$ | 1,039,887 | |
| Total deposits: | | | | | | | | | | | | |
| Nuevo Sol-denominated | | US$ | 2,572,721 | | | US$ | 3,874,676 | | | US$ | 4,928,117 | |
| Foreign Currency-denominated | | | 6,226,413 | | | | 7,424,995 | | | | 8,948,911 | |
| Total | | US$ | 8,799,134 | | | US$ | 11,299,671 | | | US$ | 13,877,028 | |
The following table sets forth information regarding the maturity of our time deposits in denominations of US$100,000 or more on December 31, 2008:
| | | At December 31, 2008 | |
| | | (U.S. Dollars in thousands) | |
| Certificates of deposit: | | | |
| Maturing within 30 days | | US$ | 4,059 | |
| Maturing after 30 but within 60 days | | | 4,750 | |
| Maturing after 60 but within 90 days | | | 4,016 | |
| Maturing after 90 but within 180 days | | | 7,435 | |
| Maturing after 180 but within 360 days | | | 2,119 | |
| Maturing after 360 days | | | 24,399 | |
| Total certificates of deposits | | US$ | 46,778 | |
| Time deposits: | | | | |
| Maturing within 30 days | | US$ | 1,749,459 | |
| Maturing after 30 but within 60 days | | | 449,523 | |
| Maturing after 60 but within 90 days | | | 361,217 | |
| Maturing after 90 but within 180 days | | | 369,038 | |
| Maturing after 180 but within 360 days | | | 659,103 | |
| Maturing after 360 days | | | 230,443 | |
| Total time deposits | | US$ | 3,818,783 | |
| Total | | US$ | 3,865,561 | |
(v) Return on Equity and Assets
| | | At December 31, | |
| | | 2006 | | | 2007 | | | 2008 | |
| | | | | | | | | | |
| Return on assets (1) | | | 1.92 | % | | | 2.29 | % | | | 1.86 | % |
| Return on equity (2) | | | 18.47 | % | | | 22.87 | % | | | 22.31 | % |
| Dividend payout ratio (3) | | | 45.08 | % | | | 34.11 | % | | | 33.44 | % |
| Equity to assets ratio (4) | | | 11.61 | % | | | 10.80 | % | | | 9.32 | % |
| Shareholders’ equity to assets ratio (5) | | | 10.70 | % | | | 9.95 | % | | | 8.71 | % |
_______________________
| (1) | Net income attributable to our equity holders as a percentage of average total assets, computed as the average of period beginning and period ending balances. |
| (2) | Net income attributable to our equity holders as a percentage of average net equity attributable to our equity holders, computed as the average of monthly balances. |
| (3) | Dividends declared per share divided by net income attributable to our equity holders per share. |
| (4) | Average equity attributable to our equity holders divided by average total assets, both averages computed as the average of month-ending balances. |
| (5) | Average equity attributable to our equity shareholders divided by average total assets, both averages computed as the average of month-ending balances. |
(vi) Short-Term Borrowings
Our short-term borrowings, other than deposits, amounted to US$360.8 million and US$878.2 million and US$601.5 million as of December 31, 2006, 2007 and 2008, respectively. Our average balances of borrowed amounts decreased in 2008 due to receiving smaller promotional credit lines. As of December 31, 2006, 2007 and 2008, no BCRP-Repo transactions exist in the outstanding balance.
The following table sets forth our short-term borrowings:
| | | At December 31, | |
| | | 2006 | | | 2007 | | | 2008 | |
| | | (U.S. Dollars in thousands) | |
| | | | | | | | | | |
| Year-end balance | | | 360,801 | | | | 878,183 | | | | 601,464 | |
| Average balance | | | 479,657 | | | | 742,310 | | | | 935,460 | |
| Maximum quarter-end balance | | | 792,609 | | | | 1,105,704 | | | | 1,197,637 | |
| Weighted-average nominal year-end interest rate | | | 5.00 | % | | | 4.70 | % | | | 4.47 | % |
| Weighted-average nominal interest rate | | | 4.81 | % | | | 4.72 | % | | | 4.22 | % |
___________________
| (C) | Organizational Structure |
Historically, there has been substantial overlap among the shareholders of BCP, ASHC and PPS. However, due to reasons related to the regulatory, political and economic environment in Peru, they have been managed independently from one another. We were formed in 1995 by the management of BCP for the purpose of acquiring, through an exchange offer, the common shares of BCP, ASHC and PPS. In an exchange offer in October 1995, we acquired 90.1% of BCP (391,973,951 shares), 98.2% of ASHC (39,346,169 shares), and 75.8% of PPS (5,537,474 shares) in exchange for 60,815,152 of our common shares at a ratio of 0.10401, 0.33708 and 1.2249 of our common shares per common share of BCP, ASHC and PPS, respectively. Our common shares commenced trading on the New York Stock Exchange immediately upon consummation of the exchange offer, with a closing price on that day of US$11.61 (adjusted to reflect stock dividends through May 1999).
On March 19, 1996, we acquired the remaining 1.8% of the outstanding shares of ASHC (702,674 shares) in exchange for 237,859 of our common shares at a ratio of 0.33708 of our common shares per common share of ASHC. This acquisition was completed pursuant to an exchange offer with the same terms as the October 1995 exchange offer (see above). The closing price of our common shares on the New York Stock Exchange on the date that exchange offer was completed was US$10.98 (adjusted to reflect stock dividends). See “Item 9. The Offer and Listing—(A) Offer and Listing Details—Price History of Credicorp’s Stock” and “Item 8. Financial Information—Consolidated Statements and Other Financial Information—Dividend Policy.”
Our management consists of certain principal executive officers of BCP, ASHC and PPS. It believes that a unified financial group with a coordinated strategy is best able to take advantage of growth in the Peruvian economy and deregulation of the financial services sector as well as to achieve synergies from cross-selling financial services and products (e.g., through BCP’s extensive branch network). Through our subsidiaries, we are the largest Peruvian provider of financial services in Peru.
BCP began operations in 1889 as Banco Italiano and later changed its name to Banco de Crédito del Perú in 1941. BCP has been the largest commercial bank in Peru since the 1920s. Members of the Romero family have been shareholders of BCP since 1918 and became the controlling shareholders in 1979. Mr. Dionisio Romero, our former Chairman of the Board and Chief Executive Officer, was a member of the Board of Directors of BCP from 1966 to 1987, becoming BCP’s Chairman in 1979. In response to former President Alan García’s 1987 attempt to nationalize the Peruvian banking industry, the majority shareholders of BCP, including Mr. Romero, sold a controlling interest in BCP and transferred management to its employees. This sale successfully prevented the government from gaining control of BCP. Upon the election of Alberto Fujimori as President of Peru in 1990 and the introduction of market reforms, the Romero family reestablished its shareholding in BCP and Mr. Romero and several former key managers of BCP returned to BCP. See “—(9) Peruvian Government and Economy—(i) Peruvian Government.” Members of the Romero family exchanged their BCP shares in the October 1995 exchange offer, and now hold 15.85% of our common shares. As of December 31, 2008, we hold 97.41% of BCP’s total shares. See “Item 7. Major Shareholders and Related Party Transactions—(A) Major Shareholders.”
ASHC was incorporated in the Cayman Islands in December 1981 as a wholly-owned subsidiary of BCP, under the name Crédito del Perú Holding Corporation, or BCP International. It became the first Peruvian bank to establish an offshore banking presence to serve its Peruvian customers. In 1983, BCP distributed the shares of BCP International to the BCP’s shareholders as dividends to protect its privately held status in the event that BCP was nationalized. BCP International established its first physical presence offshore (previously having been operated through BCP’s corporate offices) by opening an office in Panama in 1984, and opening an agency in Miami in 1986. Also in 1986, BCP International changed its name to ASCH. As a result of the attempted expropriation by the government in 1987, ASHC’s operations and management were made independent of BCP. In 2002, ASHC closed its Miami agency at the same time that BCP opened its Miami agency. Also, Credicorp Securities was established in Miami as our wholly-owned subsidiary and began operating in early 2003 serviced by former ASHC personnel.
We own 75.97% of PPS, which was formed in 1992 as a result of a merger between El Pacífico Compañía de Seguros y Reaseguros S.A. and Compañía de Seguros y Reaseguros Peruano-Suiza S.A. PPS is the second largest Peruvian insurance company in terms of premiums sold and health fees. PPS’s major subsidiaries are Pacífico Vida, which specializes in life and pension fund insurance, and Pacífico Salud, which provides health insurance as an alternative to public social security.
We own 100% of Grupo Crédito S.A., which is the principal shareholder in Prima AFP. We also hold equity shares in Peruvian electric utilities and other non-financial companies.
BCB (formerly Banco Popular S.A., Bolivia) is another one of our subsidiaries. BCB was acquired by BCP for US$6.2 million in November 1993. Since we transferred to BCP a 55.79% stake in November 2001, we have directly held 2.7% of BCB’s equity while holding the rest through BCP. In December 2002, BCP acquired BSCH-Perú, which was merged into BCP on February 28, 2003.
During 2003, BCP converted BCOL, its offshore bank in the Bahamas, into a vehicle to conduct investments, and then sold it to ASHC. ASHC subsequently consolidated BCOL into its operations during 2004. BCOL’s business, which is receiving offshore U.S. Dollar deposits and making U.S. Dollar-denominated loans to large Peruvian customers, has been taken over by both BCP’s Panama branch and by ASHC.
Credileasing conducts lease financing operations by specializing in consumer and micro-business lending. It began its operations July 1996 by taking over the operations previously managed by Financiera de Crédito (which became Solución). BCP will absorb Credileasing on July 1, 2009.
Solución was spun off into two companies. The first company retained only cash and equity. The second company became a wholly-owned subsidiary of BCP in March 2003 as a result of BCP acquiring the remaining 45% of Solución’s equity interests. That company was then merged into BCP’s Peruvian banking operations in March 2004.
In March 2005, we sold Banco Tequendama to a Colombian bank (although the effective date of the sale was January 1, 2005). We did not record any significant gain as a result of the sale. On December 31, 2004, Banco Tequendama had US$306.7 million in loans and US$290.5 million in deposits. We had acquired Banco Tequendama January 1997 from the Fondo de Garantía de Depósitos y Protección Bancaria, or FOGADE, the Venezuelan government entity responsible for the re-privatization of government-seized assets in connection with the widespread Venezuelan banking problems that began in 1994. We, along with FOGADE and FOGADE’s financial adviser, were sued in Aruba by the former owners of Banco Tequendama, who were seeking compensation for damages. The Judge in the Court of first instance in Aruba dismissed the claim. Although the plaintiff appealed, in April 2004 the Court of Appeals in Aruba rejected all of the plaintiff’s claims. The lawsuit followed a previous unsuccessful lawsuit brought by these former owners in Colombia.
On August 24, 2006, through our subsidiary Prima AFP, we acquired from Grupo Santander Perú S.A. 99.97% of the capital stock of AFP Unión Vida S.A., a pension fund management company that operates in Peru. We also made a tender offer to the minority shareholders in order to acquire the remaining 0.03% of the capital stock. The total purchase price amounted to approximately US$141.5 million. At the September 6, 2006 general shareholder’s meeting of Prima AFP, the merger with AFP Unión Vida S.A. was approved, with an effective date of December 1, 2006.
| (D) | Property, Plants and Equipment |
On December 31, 2008, we had 435 branches, representative and similar offices, of which 330 were branch offices of BCP in Peru. Our principal properties include the headquarters of BCP, at Calle Centenario 156, La Molina, Lima 12, Perú, and the headquarters of PPS at Juan de Arona 830, Lima, Perú. We lease approximately 319 of these properties and own the rest. There are no material encumbrances on any of our properties.
ITEM 4A. | UNRESOLVED STAFF COMMENTS |
Not applicable.
ITEM 5. | OPERATING AND FINANCIAL REVIEW AND PROSPECTS |
(1) Critical Accounting Policies
Our accounting policies are integral to the understanding of our results of operations and financial condition. The accounting policies are described in Note 3 to the Credicorp Consolidated Financial Statements (Significant Accounting Policies to the Credicorp Consolidated Financial Statements) and are prepared in accordance with IFRS.
Foreign Currency Translation
We consider the U.S. Dollar as our functional and presentation currency because it reflects the economic substance of the underlying events and circumstances relevant to us and our subsidiaries with respect to our main operations and transactions in the countries where we operate. Examples include loans granted, financing obtained, sale of insurance premiums, and interest income and expense. Also, an important percentage of our wages and purchases are established and settled in U.S. Dollars.
The financial statements of each of our subsidiaries are measured using the currency of the country in which each entity operates. The currencies are translated into U.S. Dollars (functional and presentation currency) as follows:
| | · | Monetary assets and liabilities are translated at the free market exchange rate as of the date of the consolidated balance sheet; |
| | · | Non-monetary accounts are translated at the free market exchange rate prevailing at the transaction date; and |
| | · | Income and expenses, except for those related to non-monetary assets which are translated at the free market exchange rate prevailing at the transaction date, are translated monthly at the average monthly exchange rate. |
All resulting translation differences are recognized in our consolidated income statement.
Income and Expense Recognition from Banking Activities
We recognize interest income and expense for all interest-bearing financial instruments, including those related to financial instruments classified as held for trading or designated at fair value through profit or loss, within “Interest and dividend income” and “Interest expense” in the consolidated statements of income using the effective interest rate, which is the rate that discounts estimated future cash payments or receipts through the expected life of the financial instrument or a shorter period, where appropriate, to the net carrying amount of the financial asset or financial liability.
We suspend interest income when collection of loans becomes doubtful, i.e., when loans are overdue more than 90 days or when the borrower or securities’ issuer defaults, if earlier than 90 days. We exclude such income from interest income until collected. We reverse uncollected income on such loans against income. When our management determines that the debtor’s financial condition has improved, we reestablish the recording of interest thereon on an accrual basis.
Interest income includes coupons earned on fixed income investment and trading securities and the accrued discount and premium on financial instruments. We recognize dividends as income when they are declared.
We recognize fees and commission income on an accrual basis when earned. Contingent credit fees for loans that are likely to be drawn down and other credit related fees are deferred (together with any direct incremental costs) and recognized as an adjustment to the effective interest rate on the loan.
We recognize all other revenues and expenses on an accrual basis as earned or incurred.
Recognition of Income and Expenses of Insurance Activities
Gross Premiums: We recognize gross recurring premiums on life contracts as revenue when payable by the policyholder. For single premium business, we recognize revenue on the date on which the policy is effective.
Gross general insurance written premiums comprise the total premiums receivable for the whole period of coverage provided by contracts entered into during the accounting period, and we recognize such premiums on the date on which the policy is effective. Premiums include any adjustments arising in the accounting period for premiums receivable with respect to business written in prior accounting periods.
Unearned premiums are the portion of premiums written in a year that relate to periods of risk after the consolidated balance sheet date. Unearned premiums are calculated on a daily pro rata basis. We defer the portion attributable to subsequent periods as a provision for unearned premiums.
Reinsurance Premiums
We recognize gross reinsurance premiums on life contracts as an expense when payable or on the date on which the policy is effective.
Gross general reinsurance premiums written comprise the total premiums payable for the whole period of coverage provided by contracts entered into the accounting period and we recognize such premiums on the effective date of the policy. Premiums include any adjustments arising in the accounting period with respect to reinsurance contracts commencing in prior accounting periods.
Unearned reinsurance premiums are the portion of premiums written in a year that relate to periods of risk after the consolidated balance sheet date. We defer unearned reinsurance premiums over the term of the underlying direct insurance policies for risks attaching contracts and over the term of the reinsurance contract for losses occurring contracts.
Fees and Commission Income
We charge insurance contract policyholders for policy administration services, investment management services, surrenders and other contract fees. We recognize these fees as revenue over the period in which the related services are performed. If the fees are for services provided in future periods, then we defer and recognize such fees over those future periods.
Benefits, Claims and Expenses Recognition
Gross Benefits and Claims: Gross benefits and claims for life insurance contracts include the cost of all claims arising during the year including internal and external claims handling costs that are directly related to the processing and settlement of claims. We record death claims and surrenders on the basis of notifications received. We record maturities and annuity payments when due.
General insurance and health claims include all claims occurring during the year, whether reported or not, related internal and external claims handling costs that are directly related to the processing and settlement of claims, a reduction for the value of salvage and other recoveries, and any adjustments to claims outstanding from previous years.
Reinsurance Claims: We recognize reinsurance claims simultaneously upon our recognition of the related gross insurance claim according to the terms of the relevant contract.
Financial Instruments: Initial Recognition and Subsequent Measurement
We record on the trade date purchases or sales of financial assets that require delivery of assets within the time frame generally established by regulation or convention in the marketplace, i.e., the date that we commit to purchase or sell the asset. We recognize derivatives on a trade date basis.
The classification of financial instruments at initial recognition depends on the purpose for which the financial instruments were acquired and their characteristics. We measure all financial instruments initially at their fair value plus, in the case of financial assets and financial liabilities not at fair value through profit or loss, any directly attributable incremental cost of acquisition or issue.
We classify our financial instruments in one of the following categories as defined by IAS 39: (i) financial assets and financial liabilities at fair value through profit or loss, (ii) loans and receivables, (iii) available-for-sale financial investments and (iv) other financial liabilities. Management defines the classification of its financial instruments at initial recognition.
Financial Assets and Financial Liabilities at Fair Value Through Profit or Loss: This category has two sub-categories: financial assets held for trading and financial assets and liabilities designated at fair value through profit or loss at inception. We classify a financial asset as held for trading if it is acquired or incurred principally for the purpose of selling or repurchasing in the near term or if it is part of a portfolio of identified financial instruments that are managed together and for which there is evidence of a recent actual pattern of short-term profit-taking. We also categorize derivatives as held for trading unless they are designated as hedging instruments. Financial assets and financial liabilities are designated at fair value through profit or loss when the following criteria are met:
| | · | The designation eliminates or significantly reduces the inconsistent treatment that would otherwise arise from measuring the assets or liabilities or recognizing gains or losses on them on a different basis; or |
| | · | The assets and liabilities are part of a group of financial assets, financial liabilities or both which are managed and in which their performance is evaluated on a fair value basis, in accordance with a documented risk management or investment strategy; or |
| | · | The financial instrument contains an embedded derivative, unless the embedded derivative does not significantly modify the cash flows; or it is clear, with little or no analysis, that it would not be separately recorded. |
We record changes in fair value in the consolidated statements of income caption “Net gain on financial assets and liabilities designated at fair value through profit or loss.” Interest earned or incurred is accrued in the consolidated statements of income in the captions “Interest and dividend income” or “Interest expense,” respectively, according to the terms of the contract. We record dividend income when the right to the payment has been established.
Loans and Receivables: Loans and receivables are non-derivative financial assets with fixed or determinable payments that are not quoted in an active market, other than (i) those that the entity intend to sell immediately or in the short term, (ii) those that the entity upon initial recognition designates as available for sale or (iii) those for which the holder may not recover substantially all of its initial investment, other than because of credit deterioration.
After initial measurement, loans and receivables are subsequently measured at amortized cost using the effective interest rate method, less any allowance for impairment. We calculate amortized cost by considering any discount or premium on acquisition and fees and costs that are an integral part of the effective interest rate. We recognize impairment losses in the consolidated statements of income in the caption “Provision for loan losses, net of recoveries.”
We record direct loans when disbursements of funds are made to the clients. We record indirect (off-balance sheet) loans when documents supporting such facilities are issued. Likewise, we consider as refinanced or restructured those loans that change their payment schedules due to difficulties in the debtor’s ability to repay the loan.
We establish an allowance for loan losses if there is objective evidence that we will not be able to collect all amounts due according to the original contractual terms of the loan. The allowance for loan losses is established based on the internal risk classification and considering any guarantees and collaterals received.
Available-for-Sale Financial Investments: Available-for-sale financial investments are those which are designated as such (to be held for an indefinite period, which may be sold in response to liquidity needs or changes in the interest rates, exchange rates or equity price), or do not qualify to be classified as designated at fair value through profit or loss, held-to-maturity loans or receivables.
After initial measurement, we subsequently measure available-for-sale financial investments at fair value. We recognize unrealized gains and losses directly in equity in the caption “Other reserves” on the consolidated balance sheets, net of its corresponding deferred tax and minority interest. When an available-for-sale financial investment is disposed of, the cumulative gain or loss previously recognized in equity is recognized in the consolidated statements of income in the caption “Net gain on sale of securities” using the average cost basis. We recognize interest and dividends earned in the consolidated statements of income in the caption “Interest and dividend income.” We report interest earned as interest income using the effective interest rate, and we recognize dividends earned when right to collection has been established.
Estimated fair values are based primarily on quoted prices or, if quoted market prices are not available, discounted expected cash flows using market rates commensurate with the credit quality and maturity of the investment.
We recognize losses arising from impairment in the consolidated statements of income and such losses are removed from the equity in the caption “Other reserves” in the consolidated balance sheets.
Other Financial Liabilities: After initial measurement, we subsequently measure other financial liabilities at amortized cost using the effective interest rate method. We calculate amortized cost by taking into account any issuance discount or premium and costs that are an integral part of the effective interest rate.
Derecognition of Financial Assets and Financial Liabilities
We derecognize a financial asset (or, where applicable, a part of a financial asset or part of a group of similar financial assets) where: (i) the rights to receive cash flows from the asset have expired, or we have transferred our rights to receive cash flows from the asset or have assumed an obligation to pay the received cash flows in full without material delay to a third party under a “pass-through” arrangement; and (ii) either we have transferred substantially all the risks and rewards of the asset, or we have neither transferred nor retained substantially all the risks and rewards of the asset, but have transferred control of the asset.
We derecognize a financial liability when the obligation under the liability is discharged, cancelled or expires. Where an existing financial liability is replaced by another from the same lender on substantially different terms, or the terms of an existing liability are substantially modified, such an exchange or modification is treated as a derecognition of the original liability and the recognition of a new liability, and the difference in the respective carrying amounts is recognized in profit or loss.
Impairment of Financial Assets
We assess at each consolidated balance sheet date whether there is any objective evidence that a financial asset or a group of financial assets is impaired. A financial asset or a group of financial assets is deemed to be impaired if, and only if, there is objective evidence of impairment as a result of one or more events that has occurred after the initial recognition of the asset (an incurred loss event) and that loss event (or events) has an impact on the estimated future cash flows of the financial asset or the group of financial assets that can be reliably estimated. Evidence of impairment may include (i) indications that the borrower or a group of borrowers is experiencing significant financial difficulty, default or delinquency in interest or principal payments, (ii) the probability that they will enter bankruptcy proceedings or another legal reorganization process and (iii) where observable data indicate that there is a measurable decrease in the estimated future cash flows, such as changes in arrears or economic conditions that correlate with defaults. The criteria used for each category of financial assets are as described below:
Loans and Receivables: For loans and receivables that are carried at amortized cost, we first assess whether objective evidence of impairment exists for financial assets that are individually significant, or collectively, for financial assets that are not individually significant. If we determine that no objective evidence of impairment exists for an individually assessed financial asset, whether significant or not, we include the asset in a group of financial assets with similar credit risk characteristics and collectively assesses them for impairment. Assets that are individually assessed for impairment and for which an impairment loss is, or continues to be, recognized are not included in a collective assessment of impairment.
If there is objective evidence that an impairment loss has been incurred, the amount of the loss is measured as the difference between the asset carrying amount and the present value of estimated future cash flows. The carrying amount of the asset is reduced through the use of an allowance account and the amount of the loss is recognized in the consolidated statements of income. Interest income, if applicable, is accrued on the reduced carrying amount based on the original effective interest rate of the asset. A loan, together with its associated allowanc, is written off when there is no realistic prospect of future recovery and all collateral has been realized or has been transferred to us. If, in a subsequent year, the amount of the estimated impairment loss increases or decreases because of an event occurring after the impairment was recognized, the previously recognized impairment loss is increased or reduced by adjusting the allowance account. If a future write-off is later recovered, the recovery is recognized in the consolidated statements of income, as a credit to the caption “Provision for loan losses, net of recoveries.”
The present value of the estimated future cash flows is discounted at the financial asset’s original effective interest rate. If a loan has a variable interest rate, the discount rate for measuring any impairment loss is the current effective interest rate. The calculation of the present value of the estimated future cash flows of a collateralized financial asset reflects the cash flows that may result from foreclosure less costs for obtaining and selling the collateral, whether or not foreclosure is probable.
For a collective evaluation impairment, financial assets are grouped considering our internal credit grading system, which considers credit risk characteristics such as asset type, industry, geographical location, collateral type and past-due status.
We estimate future cash flows from a group of financial assets that are collectively evaluated for impairment on the basis of historical loss experience for assets with credit risk characteristics similar to those in the group. We adjust historical loss experience on the basis of current observable data to reflect the effects of current conditions that did not affect the years on which the historical loss experience is based and to remove the effects of conditions in the historical period that do not currently exist. The methodology and assumptions used are reviewed regularly to reduce any differences between loss estimates and actual loss experience.
Available-for-Sale Financial Investments: For available-for-sale financial investments, we assess at each consolidated balance sheet date whether there is objective evidence that an investment or a group of investments is impaired.
In the case of equity investments, objective evidence would include a significant or prolonged decline in the fair value of the investment below its cost. Where there is evidence of impairment, the cumulative loss (measured as the difference between the acquisition cost and the current fair value, less any previously recognized impairment loss) is removed from equity and recognized in the consolidated statements of income. Impairment losses on equity investments are not reversed through the consolidated statements of income; increases in their fair value after impairment are recognized directly in equity.
In the case of debt instruments, we assess impairment based on the same criteria as financial assets carried at amortized cost (loans and receivables). We assess future interest income based on the reduced carrying amount and it is accrued using the interest rate used to discount the future cash flows for the purpose of measuring the impairment loss. We record interest income as part of “Interest and dividend income” in the consolidated statements of income. If, in a subsequent year, the fair value of a debt instrument increases and the increase can be objectively related to an event occurring after the impairment loss was recognized in the consolidated statements of income, we reverse the impairment loss through the consolidated statements of income.
Renegotiated Loans: Where possible, we seek to refinance or restructure loans rather than to take possession of collateral. This may involve extending the payment arrangements and the agreement of new loan conditions. Once the terms have been renegotiated, the loan is no longer considered past due. Management continuously reviews refinanced and restructured loans to ensure that all criteria are met and that future payments are likely to occur. Renegotiated loans continue to be subject to an individual or collective impairment assessment, calculated using the loan’s original effective interest rate.
Leases
Operating Leases: Leases in which a significant portion of the risks and benefits of the asset are held by the lessor are classified as operating leases. Under this concept, we mainly lease offices for BCP branches.
When an operating lease is terminated before the lease period has expired, we recognize any penalty payment made to the lessor as an expense in the period in which termination takes place.
Finance Leases: We recognize finance leases as loans that are granted at the present value of the lease collections. We recognize the difference between the gross receivable amount and the present value of the loan as unearned interest. We recognize lease income over the term of the lease agreement using the effective interest method, which reflects a constant periodic rate of return.
Goodwill
Goodwill represents the excess of the acquisition cost of a subsidiary over the fair value of the net identifiable assets of the acquired subsidiary at the date of acquisition. We test goodwill annually for impairment to assess whether the carrying amount is fully recoverable. We recognize an impairment loss if the carrying amount exceeds the recoverable amount. Goodwill is allocated to cash-generating units for impairment testing purposes.
Impairment of Non-Financial Assets
We assess at each reporting date, or more frequently if events or changes in circumstances indicate that the carrying value may be impaired, whether there is an indication that a non-financial asset may be impaired. If any such indication exists, we estimate the asset’s recoverable amount. Where the carrying amount of an asset (or cash-generating unit) exceeds its recoverable amount, the asset (or cash-generating unit) is considered impaired and is written down to its recoverable amount.
For non-financial assets, excluding goodwill, an assessment is made at each reporting date as to whether there is any indication that previously recognized impairment losses may no longer exist or may have decreased. If such indication exists, we estimate the recoverable amount. We reverse a previously recognized impairment loss only if there has been a change in the estimates used to determine the asset’s recoverable amount since the last impairment loss was recognized. If that is the case, we increase the carrying amount of the asset to its recoverable amount. Impairment losses relating to goodwill cannot be reversed for subsequent increases in its recoverable amount in future periods.
Income Tax and Workers’ Profit-Sharing
We compute income tax and workers’ profit-sharing based on our individual financial statements and those of each one of our subsidiaries.
Deferred income tax and deferred workers’ profit-sharing reflect the effects of temporary differences between the carrying amounts of assets and liabilities for accounting purposes and the amounts determined for tax purposes. We measure deferred assets and liabilities using the tax rates expected to be applied to taxable income in the years in which temporary differences are expected to be recovered or eliminated. The measurement of deferred assets and deferred liabilities reflects the tax consequences that arise from the manner in which we and our subsidiaries expect, at the consolidated balance sheet date, to recover or settle the carrying amount of such assets and liabilities.
We recognize deferred tax assets and liabilities regardless of when the timing differences are likely to reverse. We recognize deferred tax assets when it is more likely than not that future taxable profit will be available against which the temporary difference can be utilized. At the consolidated balance sheet date, we and our subsidiaries assess unrecognized deferred assets and the carrying amount of recognized deferred assets.
We and our subsidiaries determine the deferred income tax considering the tax rate applicable to their undistributed earnings. We record any additional tax on dividends distribution on the date a liability is recognized.
Stock Appreciation Rights
We have granted supplementary profit-sharing participation to certain executives and employees who have at least one year of service in us or any of our subsidiaries, in the form of stock appreciation rights (or SARs) over a certain number of our shares. Such SARs options are granted at the market price of our shares on the date of the grant and are exercisable at that price, allowing the employee to obtain a gain from the difference between the fixed exercise price of the share at the date of execution and the market price. See Note 18 to the Credicorp Consolidated Financial Statements.
The recorded expense in each year is the estimated market value of the rights that can be exercised by the beneficiaries at the consolidated balance sheet date. When we change the price or the terms of the SARs, we record the additional compensation expense for an amount equal to the difference between the new exercise price and the market price of the underlying shares.
Derivative Financial Instruments
Trading: Part of the transactions with derivatives, while providing effective economic hedges under our risk management positions, do not qualify for hedge accounting under the specific rules of IAS 39 and are therefore treated as trading derivatives.
We initially recognize derivative financial instruments in the consolidated balance sheet at cost, and they are subsequently re-measured at their fair value. We estimate fair values based on the market exchange and interest rates. All derivatives are carried as assets when fair value is positive and as liabilities when fair value is negative. We record gains and losses for changes in their fair value in the consolidated statements of income.
Hedge: We use derivative instruments to manage exposure to interest rates and foreign currency. In order to manage particular risks, we apply hedge accounting for transactions which meet the specified criteria.
At the inception of the hedge relationship, we formally document the relationship between the hedged item and the hedging instrument, including the nature of the risk, the objective and strategy for undertaking the hedge and the method that will be used to assess the effectiveness of the hedging relationship.
Also, at the inception of the hedge relationship, a formal assessment is undertaken to ensure the hedging instrument is expected to be highly effective in offsetting the designated risk in the hedged item. Hedges are formally assessed at each reporting date. We regard a hedge as highly effective if the changes in fair value or cash flows attributable to the hedged risk during the period for which the hedge is designated is expected to offset in a range between 80% and 125%.
As part of our risk management, we use derivative instruments for hedging purposes in order to reduce our exposure to market risk of certain liabilities. The accounting treatment is established according to the nature of the item hedged and compliance with the hedge criteria.
For designated and qualifying cash flow hedges, we initially recognize the effective portion of the gain or loss on the hedging instrument directly in equity in the caption “Other reserves” in the consolidated balance sheet. We recognize the ineffective portion of the gain or loss on the hedging instrument in the consolidated statements of income in the captions “Interest and dividend income” or “Interest expense,” as appropriate. When the hedged cash flow affects the consolidated statements of income, the gain or loss on the hedging instrument is recycled in the corresponding income or expense line of the consolidated statements of income.
For designated and qualifying fair value hedges, we recognize the change in the fair value of a hedging derivative in the consolidated statements of income in the captions “Interest and dividend income” or “Interest expense,” as appropriate. We record changes in the fair value of the hedged item attributable to the risk hedged as part of the carrying value of the hedged item and recognized in the consolidated statements of income. If the hedging instrument expires or is sold, terminated or exercised, or where the hedge no longer meets the criteria for hedge accounting, we terminate the hedge relationship.
Embedded Derivatives: Certain derivatives embedded in other financial instruments are treated as separate derivatives when their economic characteristics and risks are not closely related to those of the primary contract and the primary contract is not carried at fair value through profit or loss. We measure these embedded derivatives at fair value with changes in fair value recognized in the consolidated statements of income, unless we choose to designate the hybrid contracts at fair value through profit and loss.
We have certificates indexed to our share price that will be settled in cash and credit-linked notes obtained to provide financial instruments on the same basis to clients. We classified these instruments at inception “financial assets designated at fair value” on the consolidated balance sheets.
| (2) | Historical Discussion and Analysis |
The following discussion is based upon information contained in our Consolidated Financial Statements and should be read in conjunction therewith. The discussion in this section regarding interest rates is based on nominal interest rates.
For a comparison of nominal interest rates with real interest rates, see “Item 4. Information on the Company—(B) Business Overview—(12) Selected Statistical Information—(i) Average Balance Sheets and Income from Interest-Earning Assets—Real Average Interest Rates.”
The financial information and discussion and analysis presented below for 2006, 2007 and 2008 reflect the financial position and results of operations for 2006, 2007 and 2008 of our subsidiaries. See “Item 3. Key Information—(A) Selected Financial Data.”
On December 31, 2008, approximately 64.4% of our deposits and 68% of our loans were U.S. Dollar-denominated. Despite these high proportions, U.S. Dollar-denominated deposits and loans have decreased from the previous year (65.7% and 69.5%, respectively) due to a reduction in the rate of inflation. Nevertheless, we expect the majority of our deposits and loans to continue to be denominated in U.S. Dollars.
Results of Operations for the Three Years Ended December 31, 2008
The following table sets forth, for the years 2006, 2007 and 2008, the principal components of our net income:
| | | Year ended December 31, | |
| | | 2006 | | | 2007 | | | 2008 | |
| | | (U.S. Dollars in thousands) | |
| Interest income | | US$ | 782,002 | | | US$ | 1,065,974 | | | US$ | 1,400,334 | |
| Interest expense | | | (283,478 | ) | | | (432,000 | ) | | | (577,411 | ) |
| Net interest income | | US$ | 498,524 | | | US$ | 633,974 | | | US$ | 822,923 | |
| Provision for loan losses | | | 4,243 | | | | (28,439 | ) | | | (48,760 | ) |
| Net interest income after Provision | | US$ | 502,767 | | | US$ | 605,535 | | | US$ | 774,163 | |
| Noninterest income | | | 338,894 | | | | 522,937 | | | | 592,564 | |
| Insurance premiums earned net of claims on insurance activities | | | 64,739 | | | | 58,672 | | | | 51,993 | |
| Other expenses | | | (585,058 | ) | | | (747,089 | ) | | | (922,299 | ) |
| Merger costs | | | (5,706 | ) | | | - | | | | - | |
| Income before translation result and income tax | | US$ | 315,636 | | | US$ | 440,055 | | | US$ | 496,421 | |
| Translation result (loss) gain | | US$ | 15,216 | | | US$ | 34,627 | | | US$ | (17,650 | ) |
| Income tax | | | (83,587 | ) | | | (102,287 | ) | | | (109,508 | ) |
| Net income | | US$ | 247,265 | | | US$ | 372,395 | | | US$ | 369,263 | |
| Net income attributable to: | | | | | | | | | | | | |
| Equity holders | | | 230,013 | | | | 350,735 | | | | 357,756 | |
| Minority interests | | | 17,252 | | | | 21,660 | | | | 11,507 | |
| Net income | | US$ | 247,265 | | | US$ | 372,395 | | | US$ | 369,263 | |
Net income attributable to our equity holders increased from US$350.7 million in 2007 to US$357.8 million in 2008. Our net income decreased from 2007 to 2008 due to the charges of US$181.6 million, which included (i) US$60.4 million to impair a deteriorated investment portfolio caused by declining stock prices, (ii) US$36.4 million for a provision by ASHC for potential losses and contingencies related to an ASHC-managed fund that had been invested with Bernard L. Madoff Investment Securities LLC, or Madoff Securities, on behalf of its clients, (iii) US$67.1 million of expense to hedge SARs Program and (iv) US$17.7 million from an exchange loss caused by the depreciation of the Nuevo Sol against the U.S. Dollar.
On the other hand, other expenses increased 23.5% in 2008 to US$922.3 million, principally as a result of (i) a net loss on financial assets and liabilities designated at fair value through profit or loss in the amount of US$67.1 million, (ii) provisions related to Bernard L. Madoff Investments Securities LLC in the amount of US$36.4 million, (iii) impairment losses on available for sale investments of US$60.4 million and (iv) higher Administrative, general and tax expenses of US$62.3 million, all of which was net of a decrease in salaries and stock appreciation rights of US$6.1 million and US$37.7 million, respectively.
Net Interest Income
Net interest income represents the difference between interest income on interest-earning assets and the interest paid on interest-bearing liabilities. The following table sets forth the components of net interest income:
| | | Year ended December 31, | |
| | | 2006 | | | 2007 | | | 2008 | |
| | | (U.S. Dollars in thousands) | |
| Interest income: | | | | | | | | | |
| Loans | | US$ | 537,670 | | | US$ | 701,471 | | | US$ | 963,940 | |
| Deposits in banks | | | 36,916 | | | | 58,896 | | | | 33,217 | |
| Deposits in Central Bank | | | 56,970 | | | | 46,921 | | | | 37,914 | |
| Investment securities and others | | | 135,705 | | | | 231,763 | | | | 303,853 | |
| Dividends | | | 9,141 | | | | 9,083 | | | | 12,214 | |
| Gain from derivatives instruments and other interest income | | | 5,600 | | | | 17,840 | | | | 49,196 | |
| Total interest income | | US$ | 782,002 | | | US$ | 1,065,974 | | | US$ | 1,400,334 | |
| | | | | | | | | | | | | |
| Interest expense: | | | | | | | | | | | | |
| Saving deposits | | US$ | 12,836 | | | US$ | 19,869 | | | US$ | 27,165 | |
| Time deposits | | | 160,565 | | | | 263,487 | | | | 310,856 | |
| Issued bonds | | | 25,283 | | | | 33,592 | | | | 51,756 | |
| Borrowing from other financial institutions and others | | | 36,908 | | | | 83,070 | | | | 104,818 | |
| Demand deposits | | | 24,781 | | | | 25,123 | | | | 38,085 | |
| Loss from derivatives instruments and other interest expenses | | | 23,105 | | | | 6,859 | | | | 44,731 | |
| Total interest expense | | US$ | 283,478 | | | US$ | 432,000 | | | US$ | 577,411 | |
| Net interest income | | US$ | 498,524 | | | US$ | 633,974 | | | US$ | 822,923 | |
Our net interest income increased 29.8% in 2008 compared to 2007, and increased 27.2% in 2007 compared to 2006.
Interest Income: Interest income increased 31.4% in 2008 compared to 2007, after increasing 36.3% in 2007 compared to 2006. The increase in 2008 was principally due to higher average volume in loans and investments available for sale. Loan increase was mainly related to retail and corporate banking growth, while investments securities increase was due to gains related to BCRP certificates of deposit.
Our average nominal interest rates earned on loans increased to 10.1% in 2008 from 10.0% in 2007 and from 9.9% in 2006. The average nominal interest rate for foreign currency-denominated loans decreased from 8.8% in 2006 to 8.6% in 2007 and 2008. Interest rates for Nuevo Sol-denominated loans decreased from 13.7% in 2006 to 13.5% in 2007 and further to 13.4% in 2008.
The average balance of our foreign currency-denominated loan portfolio increased 28.1% to US$6,534.0 million in 2008 from US$5,101.4 million in 2007, which in turn increased 24.3% from US$4,104.5 million in 2006. The average balance of our Nuevo Sol-denominated loan portfolio increased 48.5% from US$1,307.8 million in 2006 to US$1,942.3 million in 2007, and by 53.8% to US$2,987.7 million in 2008. Our excess liquidity has continued through 2008. During 2008, an increasing proportion of loans went to commerce, mortgage, manufacturing and financial intermediation sectors presenting higher risk, but these sectors also yielded higher margins. See “Item 4. Information on the Company—(B) Business Overview—(12) Selected Statistical Information.”
Interest Expense: Interest expense increased in 2008 by 33.7% compared to 2007, and by 52.4% in 2007 compared to 2006. Higher interest expense in 2008 and 2007 was principally due to increases in the volume of deposits and variable market rates on deposits. Average nominal interest rates paid on foreign currency-denominated deposits increased from 2.6% in 2006 to 2.8% in 2007, and decreased to 2.3% in 2008, attracting higher volumes of deposits. Average nominal interest paid on Nuevo Sol-denominated deposits increased from 2.5% in 2006 to 3.2% in 2007, and further to 3.5% in 2008. This rate increase was a commercial decision to raise interest rates during the end of year campaigns. See “Item 4. Information on the Company—(B) Business Overview—(8) Competition” and “—(12) Selected Statistical Information.”
Our average foreign currency-denominated deposits increased 8.1% to US$7,803.5 million in 2008 from US$7,216.6 million in 2007, which in turn increased 24.0% from US$5,820.2 million in 2006. Our average Nuevo Sol-denominated deposits increased 67.7% in 2008 to US$5,488.6 million from US$3,272.1 million in 2007, which in turn increased 63.2% from US$2,005.0 million in 2006. See “Item 4. Information on the Company—(B) Business Overview—(12) Selected Statistical Information.”
Net Interest Margin: Our net interest margin (net interest income divided by average interest-earning assets) stayed at 4.4% in 2008 compared to 2007, which decreased from 4.8% in 2006 as in 2007 returns declined on interest-earning assets (mainly securities and Nuevo Sol-denominated loans) while funding costs remained relatively unchanged. See “Item 4. Information on the Company—(B) Business Overview—(12) Selected Statistical Information.”
Provision for Loan Losses
We classify all of our loans and other credits by risk category. We establish our loan loss reserves based on criteria established by IAS 39 (see “Item 4. Information on the Company—(B) Business Overview—(12) Selected Statistical Information—(iii) Loan Portfolio—Classification of the Loan Portfolio”). We do not anticipate that the expansion of our loan portfolio or the consolidation of the activities of our subsidiaries will necessitate a change in our reserve policy.
The following table sets forth the changes in our reserve for loan losses:
| | | Year ended December 31 | |
| | | 2004 | | | 2005 | | | 2006 | | | 2007 | | | 2008 | |
| | | (U.S. Dollars in thousands) | |
| Reserves for loan losses at the beginning of the year | | US$ | 326,677 | | | US$ | 271,873 | | | US$ | 218,636 | | | US$ | 210,586 | | | US$ | 229,700 | |
| Additional provisions (reversals) | | | 16,131 | | | | (6,356 | ) | | | (4,243 | ) | | | 28,439 | | | | 48,760 | |
| Acquisitions and sales | | | - | | | | (9,024 | ) | | | - | | | | - | | | | - | |
| Recoveries of write-offs | | | 32,287 | | | | 35,032 | | | | 44,284 | | | | 34,084 | | | | 31,279 | |
| Write-offs | | | (105,267 | ) | | | (71,405 | ) | | | (49,859 | ) | | | (47,266 | ) | | | (60,224 | ) |
| Monetary correction and other | | | 2,045 | | | | (1,484 | ) | | | 1,768 | | | | 3,857 | | | | (1,452 | ) |
| Reserves for loan losses at the end of the year | | US$ | 271,873 | | | US$ | 218,636 | | | US$ | 210,586 | | | US$ | 229,700 | | | US$ | 248,063 | |
We recorded US$48.8 million of loan loss provision in 2008, and US$28.4 million in 2007. Total write-offs amounted to US$60.2 million in 2008 and US$47.3 million in 2007. Total recoveries of write-offs reached US$31.3 million in 2008 and US$34.1 million in 2007, decreasing 8.2% in 2007. Provision expense in 2008 included US$7.5 million required by BCB (compared to US$3.5 million in 2007). Provisions made in 2008 were mainly related to consumer loans. Balance of recoveries of previously charged-off accounts in 2008 amounted to US$31.3 million (compared to US$34.1 million in 2007). The middle market and small business sectors continued to require a majority of the provisions made during 2008 and 2007. Provisions net of recoveries for middle market and small businesses were US$29.1 million in 2008 and US$13.4 million in 2007 (see also Note 6 to the Consolidated Financial Statements).
Total reserves, which amounted to US$248.1 million in 2008, include the allowance for direct and indirect credits of approximately US$224.3 million and US$23.7 million, respectively.
Non-Interest Income
The following table reflects the components of our non-interest income:
| | | Year ended December 31, | |
| | | 2006 | | | 2007 | | | 2008 | |
| | | (U.S. Dollars in thousands) | |
| Fees and commissions from banking services | | US$ | 243,778 | | | US$ | 324,761 | | | US$ | 394,247 | |
| Net gains from sales of securities | | | 27,281 | | | | 46,376 | | | | 51,936 | |
| Net gains on foreign exchange transactions | | | 41,638 | | | | 61,778 | | | | 108,709 | |
| Other income | | | 26,197 | | | | 90,022 | | | | 37,672 | |
| Total non-interest income | | US$ | 338,894 | | | US$ | 522,937 | | | US$ | 592,564 | |
Our non-interest income, without including net premiums earned, increased 13.3% to US$592.6 million in 2008 from US$522.9 million in 2007, which in turn increased 54.3% from US$338.9 million in 2006. The revenue increase in 2008 was principally due to an increase in fees and commissions from banking services, net gains on foreign exchange transactions, and other gains.
Fees and commissions income from banking services increased 21.4% to US$394.2 million in 2008 from US$324.8 million in 2007, following a 33.2% increase in 2007 from US$243.8 million in 2006. The increase in fees and commissions income from banking services in 2008 was principally due to growth in account maintenance, funds administration and commissions for collection, while the increase in 2007 was due to growth in account maintenance, money transfers and funds administration commissions for collections, and the increase in 2006 was due to growth in credit card fees, funds transfer fees and collections.
Net gains from sales of securities increased 12.0% to US$51.9 million in 2008 from US$46.4 million in 2007, following an increase from US$27.3 million in 2006. The increase in 2008 was principally due to gains from market value fluctuation on sales of investments.
Net gains on foreign exchange transactions increased 75.9% to US$108.7 million in 2008 from US$61.8 million in 2007, which in turn increased 48.4% from US$41.6 million in 2006. Net gains from foreign exchange transactions are not attributable to proprietary trading on our part. Higher gains in 2008 and 2007 were principally due to an increase in trading volume. This increase is caused by the constant growth of Peruvian economy and strengthened Nuevo Sol, as well as an effect of increasing the quantity of branches and Internet transactions.
Other income decreased 58.2% to US$37.7 million in 2008 from US$90.0 million in 2007, after increasing 243.6% from US$26.2 million in 2006. Other income principally consists of valuation of assets and liabilities designated at fair value, sales of seized assets, recoveries of other accounts receivable and other assets and other income. The decrease in other income in 2008 was principally due to the loss resulting from the difference between cost and estimated market value of the certificates indexed to the performance of Credicorp Ltd. (BAP) shares in connection with the SARs program, which was included in other expenses and amounted to approximately US$67.1 million. Conversely, the difference produced a gain of US$65.1 million as of December 31, 2007 that was registered within other income. See Note 7(b) to the Credicorp Consolidated Financial Statements.
Insurance Premiums and Claims on Insurance Activities
The following table reflects the premiums earned and claims incurred in connection with our insurance activities:
| | | Year ended December 31, | |
| | | 2006 | | | 2007 | | | 2008 | |
| | | (U.S. Dollars in thousands) | |
| Net premiums earned | | US$ | 251,261 | | | US$ | 297,272 | | | US$ | 393,903 | |
| Net claims incurred | | | (46,587 | ) | | | (67,689 | ) | | | (101,890 | ) |
| Increase in costs for future benefits for life and health policies | | | (139,935 | ) | | | (170,911 | ) | | | (240,020 | ) |
| Total net premiums and claims | | US$ | 64,739 | | | US$ | 58,672 | | | US$ | 51,993 | |
Total Net premiums and net claims in 2008 were significantly lower than those reported in 2007. See “Item 4. Information on the Company—(B) Business Overview—(6) Pacífico Peruano Suiza.” Net premiums increased by 32.5% to US$393.9 million in 2008 from US$297.3 million in 2007.
Gross premiums (including premium transfer and reserve adjustments) increased 26% to US$587.6 million in 2008 from US$467.2 million in 2007. Premiums for general insurance lines, which accounted for 50.5% of total premiums, increased 23.5% in 2008, mainly due to automobiles which represented 22% of general insurance premiums in 2008 (15.3% in 2007) and which increased 80% from 2007. Other property and casualty premiums, which represented 56.8% (64.2% in 2007), increased 9.2% from 2007, and medical assistance which represented 16.4% (17.1% in 2007), increased 18.5% from 2007. It is important to mention the increase of the mandatory automobile line, SOAT, which represented 4.5% (3.4% in 2007) and increased 62.2% from 2007.
Total direct premiums increased 31.8% from 2007, mainly due to a better performance in the life products which represented 23.7% of life insurance premiums (23.7% in 2007) and which increased 31.3% from 2007. The pension fund products, which represented 19.8% of life insurance premiums (19.6% in 2007), increased by 33% from 2007. In addition, credit life increased by 102% from 2007.
Health insurance lines (19.8% of total premiums in 2008) increased by 27.4% from 2007, mainly due to a 28.2% increase in regular insurance premiums which represented 88.2% of health insurance premiums (87.7% in 2007).
During 2008, net claims on insurance activities increased by 43.3% to US$341.9 million from US$238.6 million in 2007, mainly as a consequence of the business growth and the increase in the net loss ratio on property and casualty, health and life insurance businesses.
Other Expenses
The following table reflects the components of our other expenses:
| | | Year ended December 31, | |
| | | 2006 | | | 2007 | | | 2008 | |
| | | (U.S. Dollars in thousands) | |
| Salaries and employee benefits | | US$ | 303,332 | | | US$ | 409,037 | | | US$ | 365,201 | |
| General and administrative | | | 172,304 | | | | 206,966 | | | | 269,291 | |
| Depreciation and amortization | | | 50,317 | | | | 51,013 | | | | 57,369 | |
| Provision for assets seized | | | 6,387 | | | | 3,057 | | | | 1,067 | |
| Other | | | 52,718 | �� | | | 77,016 | | | | 229,371 | |
| Merger costs | | | 5,706 | | | | - | | | | - | |
| Total other expenses and merger costs | | US$ | 590,764 | | | US$ | 747,089 | | | US$ | 922,299 | |
Personnel expenses decreased 10.7% in 2008 from 2007, after a 34.8% increase in 2007 from 2006. The number of our personnel increased to 19,896 employees in 2008 from 16,160 in 2007, and from 15,002 in 2006. Considering only BCP, the number of personnel increased to 15,969 employees in 2008 from 12,667 in 2007, and from 10,769 in 2006. The decrease in personnel expenses during 2008 was principally due to decreases in salaries and stock appreciation rights (see Note 18 to the Credicorp Consolidated Financial Statements). Certain salaries are based on local currency, and therefore a devaluation of Nuevo Soles results in a lower amount when translated into U.S. Dollars.
Our general and administrative expenses (which include taxes other than income taxes) increased 30.1% in 2008 compared to 2007, after increasing 20.1% compared to 2006. Higher expenses in 2007 were principally the result of increases in systems, marketing and transportation, as part of the bank’s efforts to broaden its network. Higher expenses were also incurred in 2008 from increases in marketing expenses for ad campaigns and customer loyalty-building programs, system expenses such as licenses and projects, and transportation expenses.
Provision for seized assets decreased 65.1% to US$1.1 million in 2008 from US$3.1 million in 2007. This decrease was due to higher rotation in seizing and sales of assets. The decrease in provision is directly related to a higher volume of seized assets sales.
Other expenses increased 197.8% to US$229.4 million in 2008, after an increase of 46.1% in 2007, compared to 2006. Other expenses increased during 2008 principally due to commissions in insurance (US$39.4 million in 2008 compared to US$29.1 million in 2007) and provision for diverse risks (US$37.5 million in 2008 compared to US$8.1 million in 2007), which primarily included a provision related to Bernard L. Madoff Investments Securities LLC of US$36.4 million and a provision for devaluation of financial assets (specifically, in the indexed certificates issued by Citigroup).
Translation Result
The translation result reflects exposure to devaluation of net monetary positions in Nuevo Soles. We recognized a US$17.7 million translation loss in 2008, a US$34.6 million translation gain in 2007 and a US$15.2 million translation gain in 2006. In 2008, translation losses were mainly due to losses recorded from exposure to the Nuevo Sol which weakened against the U.S. Dollar.
Income Taxes
We are not subject to income taxes or taxes on capital gains, capital transfers or equity or estates duty under Bermuda law; however, certain of our subsidiaries are subject to income tax and taxes on dividends paid to us, depending on the legislation applicable to the jurisdictions in which they generate income.
At the present time there is no income or other tax of Bermuda imposed by withholding or otherwise on any payment to be made by Credicorp and there is no Bermuda income or profits tax, withholding tax, capital gains tax, capital transfer tax, estate duty or inheritance tax payable by Credicorp. Credicorp has obtained an assurance from the Minister of Finance of Bermuda under the Exempted Undertakings Tax Protection Act 1966 that, in the event that any legislation is enacted in Bermuda imposing any tax computed on profits or income, or computed on any capital asset, gain or appreciation or any tax in the nature of estate duty or inheritance tax, such tax shall not, until March 28, 2016, be applicable to Credicorp or to any of Credicorp’s operations or other obligations except insofar as such tax applies to persons ordinarily resident in Bermuda or to any taxes payable by Credicorp in respect of real property or leasehold interests in Bermuda held by Credicorp.
Our Peruvian subsidiaries, including BCP, are subject to corporate taxation on income under the Peruvian tax law. The statutory income tax rate payable in Peru since 2004 is 30% of taxable income, which includes the result of exposure to inflation. An additional 4.1% withholding tax is applied on dividends, which we register as income tax based on the liquid amount received from BCP and PPS.
Banks for fiscal years 1998 and 1999 were subject to an extraordinary tax on net assets which was calculated based on 50% of assets (net of depreciation, reserve for loan losses and common stock investments in Peruvian corporations) as of December 31 of the relevant fiscal year. Amounts required to be held by BCP in the Central Bank as reserve deposits could be deducted from the asset calculation for determination of the alternative minimum tax and the extraordinary tax. Starting in 2003, and applying rates on substantially the same net assets, a procedure is applied to make advance payments of the income tax liability corresponding to the ongoing fiscal year. Both the asset based taxes and the advance payment procedure are payable even if no tax liability results in the tax year in question. The advanced payment procedure was repealed in December 2004 and replaced by a temporary net assets tax of 0.6%, with substantially the same effect.
Peruvian tax legislation is applicable to legal entities established in Peru, and on an individual (not consolidated) basis. Our non-Peruvian subsidiaries are not subject to taxation in Peru and their assets are not included in the calculation of the Peruvian extraordinary tax on net assets.
ASHC is not subject to taxation in Panama since its operations are undertaken offshore. The Cayman Islands currently have no income, corporation or capital gains tax and no estate, duty, inheritance or gift tax. Prior to 1995, there was no corporate income tax in Bolivia. Although there is corporate income tax in Bolivia, due to BCB’s ability to offset taxes paid other than income taxes from any income tax liability, no Bolivian income taxes have been payable.
Tax expense paid by the subsidiaries increased to US$109.5 million in 2008 from US$102.3 million in 2007, which increased from US$83.6 million in 2006. Income tax growth in these periods reflects increases in our taxable income. Since 1994, we have paid the Peruvian income tax at the statutory rate. The effective tax rates in 2006, 2007 and 2008 were 25.26%, 21.55%, and 22.87%, respectively.
Total Assets
As of December 31, 2008, we had total assets of US$20.8 billion, increasing 17.6% compared to total assets of US$17.7 billion as of December 31, 2007, as a result of the net effect of cash and due from (i) banks increasing 22.5% due to higher amounts maintained with BCRP in US$0.4 million, (ii) investments decreasing 5.4% due to market volatility and (iii) loans, net of provisions, increasing 28.4% due to corporate banking growth. From December 31, 2007 through December 31, 2008, the Peruvian financial system grew 33.1% in terms of deposits and 37.0% in terms of total loans, comparing balances translated to U.S. Dollars, while GDP grew 7.6%. The ratio of financial intermediation, as measured by the sum of currency in circulation, bank deposits and other bank obligations to the public, divided by GDP, was 22.6% in 2006, which decreased to 21.7% in 2007 and increased to 27.7% in 2008 (which is the highest peak since the early 1970s).
Improved finances among companies and individuals supported by a favorable economic environment and sustained increases in loan placements resulted in significant improvements in loan portfolio quality in recent years, further accelerating the decrease in delinquency rates, which decreased from 1.3% in 2006 to 1.1% in 2007 and further to 0.8% in 2008. BCP’s coverage ratios also improved significantly in recent years from 249.5% in 2006 to 351.8% in 2007, but decreased to 271.9% in 2008, which is still higher as compared to the Peruvian banking system.
As of December 31, 2008, our total loans were US$10,546.4 million, which represented 50.7% of total assets, and net of reserves for loan losses, loans were US$10,322.0 million. As of December 31, 2007, our total loans were US$8,250.8 million, which represented 46.6% of total assets, and net of reserves for loan losses, loans were US$8,039.5 million. Our total loans increased from December 31, 2007 to December 31, 2008 by 27.8%, and net of loan loss reserves increased by 28.3% in the same period.
Our total deposits with the Central Bank increased from US$1,798.5 million as of December 31, 2007 to US$1,953.0 million as of December 31, 2008. Our securities holdings (which include marketable securities and investments) decreased 5.4% to US$4,995.2 million on December 31, 2008 from US$5,279.6 million on December 31, 2007. The securities portfolio decrease in 2008 was principally due to fewer investments in Central Bank certificates and corporate, leasing and subordinated bonds.
Total Liabilities
As of December 31, 2008, we had total liabilities of US$19.0 billion, a 19.7% increase from total liabilities of US$15.9 billion as of December 31, 2007. As of December 31, 2008, we had total deposits of US$13,950.4 million, a 22.9% increase from total deposits of US$11,350.7 million on December 31, 2007. We believe that our extensive branch network and reputation in the Peruvian market have allowed us to compete effectively, attracting higher volumes in saving deposits and severance deposits in 2008.
We have structured our funding strategy around maintaining a diversified deposit base. During 2008, demand deposits grew by 41.9% and time deposits by 22.4%, while saving deposits increased by 24.7%. As of December 31, 2008, we, through BCP unconsolidated, had 42.2% of total savings deposits in the Peruvian banking system, 45.3% of demand deposits and 36.5% of total deposits, the highest of any Peruvian bank in all three categories. An important characteristic of our deposit base is that, as of December 31, 2008, it included 51.9% of the entire Peruvian banking system’s CTS deposits, decreasing from 53.0% as of December 31, 2007. We believe that we have traditionally attracted a high percentage of the savings and CTS deposit market because of our reputation as a sound institution, an extensive branch network and the quality of our service. The decrease is due to the fact that new financial institutions have taken a small market share from BCP for this type of deposit. Our core deposits (i.e., savings, CTS and demand deposits) accounted for 64.0% of our total deposits as of December 31, 2008.
| (B) | Liquidity and Capital Resources |
Regulatory Capital and Capital Adequacy Ratios
| | | As of December 31, | |
| | | 2006 | | | 2007 | | | 2008 | |
| | | (U.S. Dollars in thousands, except percentages) | |
| Capital stock | | | 539,498 | | | | 539,498 | | | | 539,498 | |
| Legal and other reserves | | | 479,902 | | | | 587,218 | | | | 770,216 | |
| Capital stock, reserves and retained earnings of minority interest | | | 37,281 | | | | 38,929 | | | | 45,894 | |
| Accepted provisions for loan losses | | | 58,562 | | | | 82,261 | | | | 104,635 | |
| Subordinated debt | | | 140,086 | | | | 294,648 | | | | 278,688 | |
| Total | | | 1,255,329 | | | | 1,542,554 | | | | 1,738,931 | |
| Less: investment in multilateral organizations, banks and insurance companies and goodwill | | | (118,917 | ) | | | (122,387 | ) | | | (134,216 | ) |
| Total Regulatory Capital (1) | | | 1,136,412 | | | | 1,420,167 | | | | 1,604,715 | |
| Financial Entities Capital Ratio Regulatory Capital attributable to Financial Entities (1) | | | 871,377 | | | | 1,320,068 | | | | 1,520,318 | |
| Risk-Weighted Assets From Financial Entities (3) | | | 7,273,023 | | | | 10,313,188 | | | | 12,335,063 | |
| Capital Ratio for Financial Entities (1) / (3) | | | 11.98 | % | | | 12.80 | % | | | 12.33 | % |
| Minimum Regulatory Capital Required (MRCR)(2) | | | | | | | | | | | | |
| MRCR for Financial Entities (3) | | | 690,045 | | | | 890,643 | | | | 1,122,464 | |
| MRCR for Insurance Entities (3) | | | 100,477 | | | | 112,261 | | | | 137,766 | |
| MRCR for Other Entities (3) | | | 60,437 | | | | 66,849 | | | | 80,921 | |
| Total Minimum Regulatory Capital Required | | | 850,959 | | | | 1,069,753 | | | | 1,341,151 | |
| Regulatory capital as percentage of Minimum Regulatory Capital Required | | | 133.54 | % | | | 132.76 | % | | | 119.65 | % |
____________________________
| (1) | Total Regulatory Capital and Financial Entities Regulatory Capital is prepared under the guidelines of the BIS I Accord (by the Basel Committee) as adopted by the SBS. |
| (2) | The Minimum Regulatory Capital Required, or MRCR, is prepared under the guidelines of the BIS I Accord (by the Basel Committee) as adopted by the SBS, and must not exceed from the Total Regulatory Capital calculated. The consolidated MRCR is calculated by the addition of the MRCR of each one of the entities. |
| (3) | Peruvian financial entities (BCP, Credileasing and Solución) have a MRCR of 9.09% of the Risk-Weighted Assets (or RWA). For ASB (Panama), the MRCR is 8% of the RWA. For ASHC (Cayman Islands), the MRCR is 15% of the RWA. For BCB (Bolivia), the MRCR is 10% of the RWA. For the insurance companies, MRCR is calculated on the basis of the solvency margin, the guarantee funds and the credit risk. Other entities, with no MRCR, must be considered by the sum of the capital, reserves and retained earnings. |
Liquidity Risk
We manage our assets and liabilities to ensure that we have sufficient liquidity to meet our present and future financial obligations and to be able to take advantage of appropriate business opportunities as they arise. Liquidity risk represents the potential for loss as a result of limitations on our ability to adjust future cash flows to meet the needs of depositors and borrowers and to fund operations on a timely and cost-effective basis. Financial obligations arise from withdrawals of deposits, repayment on maturity of purchased funds, extensions of loans or other forms of credit, and working capital needs.
The growth of our deposit base over the past years has enabled us to significantly increase our lending activity. BCP is subject to SBS Resolution No. 472-2001, enacted in June 2001, which made its market risk area responsible for liquidity management, and by which minimum liquidity ratios were established. The ratio of liquid assets as a percentage of short-term liabilities, as strictly defined by the SBS, must exceed 8% for Nuevos Soles-based transactions, and 20% for foreign exchange-based transactions. BCP’s average daily ratios during the month of December 2008 were 33.96% and 59.55% for Nuevos Soles and foreign exchange-based transactions, respectively, demonstrating our continuing excess liquidity. We have never defaulted on any of our debt or been forced to reschedule any of our obligations. Even during the early 1980s, when the government of Peru and many Peruvian companies and banks were forced to restructure their debt as a result of the Latin American debt crisis and government restrictions, BCP and PPS complied with all of their payment obligations.
The capability of replacing interest-bearing deposits at their maturity is a key factor in determining liquidity requirements, as well as the exposure to interest and exchange rate risks. Our principal source of funding is customer deposits with BCP’s Retail Banking Group and ASHC’s Private Banking Group, and premiums and amounts earned on invested assets at PPS. We believe that funds from our deposit-taking operations generally will continue to meet our liquidity needs for the foreseeable future.
BCP’s Retail Banking Group has developed a diversified and stable deposit base and its Private Banking Group has developed a stable deposit base that, in each case, provides us with a low-cost source of funding. This deposit base has traditionally been one of our greatest strengths. The deposit gathering strategy has focused on products considered as BCP’s core deposits: demand deposits, savings, time deposits and CTS deposits. Other sources of funds and liquidity, which are mostly short- and long-term borrowings from correspondent banks and other financial institutions, issued bonds, and subordinated debt, are of a considerably lower significance compared to our core deposits. See Notes 12 and 13 to the Credicorp Consolidated Financial Statements.
During 2008, our loans grew significantly, compared with a smaller increase in deposits. Therefore, capital markets and external banks contributed to the funding of the bank’s operations. Foreign banks’ short-term funding expanded significantly and was allocated to foreign exchange operations, working capital and derivative hedging. Important funding operations were carried out during 2008 in the local and foreign markets. In the local markets there was an issuance of US$83.5 million and an issuance of S/.555.2 million in domestic currency. In the international market, US$300 million worth of securitized notes were issued. All of the above issues were successful despite incipient signs of volatility and the deterioration in the international market.
Treasury monetary surpluses are invested in a variety of financial instruments in Peru and in the main international financial markets. Good credit quality, adequate liquidity levels and high returns are always sought through diversification. During 2008, our investments were focused principally on instruments denominated in Nuevos Soles and U.S. Dollar-denominated Peruvian government bonds, which turned our treasury into the principal investor in these instruments in Peru.
The following table presents our core deposits, other deposits and other sources of funds:
| | | At December 31, | |
| | | 2006 | | | 2007 | | | 2008 | |
| | | (U.S. Dollars in thousands) | |
| Core Deposits: | | | | | | | | | |
| Demand deposits | | US$ | 2,792,433 | | | US$ | 3,964,501 | | | US$ | 4,872,277 | |
| Savings deposits | | | 1,951,978 | | | | 2,380,904 | | | | 2,968,739 | |
| Severance indemnity deposits | | | 775,027 | | | | 896,283 | | | | 1,039,887 | |
| Total core deposits | | US$ | 5,519,438 | | | US$ | 7,241,688 | | | US$ | 8,880,902 | |
| Other Deposits: | | | | | | | | | | | | |
| Time deposits | | | 3,218,157 | | | | 3,967,864 | | | | 4,856,112 | |
| Bank certificates | | | 61,539 | | | | 90,119 | | | | 140,013 | |
| Total deposits | | US$ | 8,799,134 | | | US$ | 11,299,671 | | | US$ | 13,877,028 | |
| Due to banks and correspondents | | US$ | 936,534 | | | US$ | 2,314,418 | | | US$ | 2,316,594 | |
| Issued bonds | | | 508,493 | | | | 694,982 | | | | 777,390 | |
| Total sources of funds | | US$ | 10,244,161 | | | US$ | 14,309,071 | | | US$ | 16,971,012 | |
| Core deposits as a percent of total deposits | | | 62.7 | % | | | 64.1 | % | | | 64.0 | % |
| Core deposits as a percent of total sources of liquid funds | | | 53.9 | % | | | 50.6 | % | | | 52.3 | % |
BCP is required to keep deposits with the Central Bank as legal reserves, determined as a percentage of the deposits and other liabilities owed to its clients. The requirement is currently approximately 6.0% of Nuevos Sol-denominated deposits and U.S. Dollar-denominated deposits, and an additional reserve requirement of 30% for the U.S. Dollar-denominated deposits. See “Item 4. Information on the Company—(B) Business Overview—(11) Supervision and Regulation—(ii) BCP—Central Bank Reserve Requirements.” Legal reserves are meant to ensure the availability of liquid funds to cover withdrawals of deposits. Additionally, we have significant investments of excess liquid funds in short-term Central Bank certificates of deposits.
The following table presents our deposits at the Central Bank and our investments in Central Bank certificates:
| | | At December 31, | |
| | | 2006 | | | 2007 | | | 2008 | |
| | | (U.S. Dollars in thousands) | |
| Funds at Central Bank | | | | | | | | | |
| Deposits | | US$ | 1,405,853 | | | US$ | 1,798,581 | | | US$ | 1,952,952 | |
| Certificates of deposits | | US$ | 1,110,002 | | | US$ | 2,164,188 | | | US$ | 1,914,707 | |
| BCRP-Repo Transactions | | US$ | 167,611 | | | US$ | 242,817 | | | US$ | 294,235 | |
| Total funds at Central Bank | | US$ | 2,683,466 | | | US$ | 4,205,586 | | | US$ | 4,161,894 | |
| Total funds at Central Bank of Perú as a percent of total deposits | | | 30.5 | % | | | 37.2 | % | | | 30.0 | % |
BCP at times has accessed Peru’s short-term interbank deposit market, although it is generally a lender in this market. The Central Bank’s discount window, which makes short-term loans to banks at premium rates, is also available as a short-term funding source, but has been used infrequently by BCP. ASHC also has the ability to borrow from correspondent banks on an overnight basis at rates tied to the federal funds rate as well as funding lines from international financial institutions.
On December 31, 2008, we had uncommitted credit lines with various banks, including long-term facilities that are mainly used for project financing, of which no significant amount was drawn down. The long-term facilities include funding from COFIDE, Corporación Andina de Fomento (or CAF), syndicated loans, and other international lenders. The transactions relating to these credit lines include import and export transactions and average annual rates (including Libor) vary from 3.11% to 7.77%. As of December 31, 2008, we maintain US$1,150.7 million in such credit lines, secured by the collection of BCP (including its foreign branches) future inflows from electronic messages sent through the Society for Worldwide Interbank Financial Telecommunications (SWIFT) network and utilized within the network to instruct correspondent banks to make a payment of a certain amount to a beneficiary that is not a financial institution. These funds have maturities of up to seven years. See Note 13(a) and (b) to the Credicorp Consolidated Financial Statements. As of December 31, 2008, borrowed funds due to banks and correspondents amounted to US$2,330.7 million (includes US$1,150.7 million and US$1,180.0 million, respectively) as compared to US$2,323.7 million in 2007 (includes US$870 million and US$1,453 million, respectively) and US$941.6 million in 2006 (US$571 million and US$371 million, respectively).
In addition, mortgage loans may be funded by mortgage funding notes and, since 2001, mortgage bonds that are sold by BCP in the market. Mortgage funding notes are instruments sold by BCP with payment terms that are matched to the related mortgage loans, thereby reducing BCP’s exposure to interest rate fluctuations and inflation. Mortgage bonds are mainly U.S. Dollar-denominated and have been issued with ten-year terms, with collateral established by real estate acquired through funded home mortgage loans. As of December 31, 2008, BCP had US$15.3 million of outstanding mortgage bonds and notes (US$20.7 million in 2007 and US$23.6 million in 2006). A source of funds specific to leasing operations are leasing bonds issued by lease financing companies, the terms of which are specified in the Peruvian leasing regulations. As of December 31, 2008, BCP had US$217.9 million of outstanding leasing bonds (US$167.3 million in 2007 and US$178.0 million in 2006). These bonds have maturities up to ten years and bear higher interest than 360-day time deposits (6.87% versus 5.50%). See Note 15 to the Credicorp Consolidated Financial Statements for a detailed breakdown of our issued bonds.
The following table presents our issued bonds:
| | | Years ended December 31, | |
| | | 2006 | | | 2007 | | | 2008 | |
| | | (U.S. Dollars in millions) | |
| Issued bonds | | | | | | | | | |
| Corporate bonds | | US$ | 47.2 | | | US$ | 50.1 | | | US$ | 130.6 | |
| Leasing bonds | | | 0.0 | | | | 39.6 | | | | 228.4 | |
| Subordinated bonds | | | 0.0 | | | | 5.0 | | | | 0.0 | |
| Subordinated debt | | | 120.0 | | | | 161.3 | | | | 0.0 | |
| Total issuance | | US$ | 167.2 | | | US$ | 256.0 | | | US$ | 359.0 | |
In November 2006 and October 2007, BCP, through its Panama branch, issued on the international market subordinated negotiable certificates notes in an aggregate amount of US$120.0 million due 2021 and US$161.3 million due 2022. These notes accrue at a fixed annual interest rate of 6.95% and 7.17%, respectively, for the first 10 years with interest payments every six months. After the first 10 years, the interest rate will change to a variable interest rate of Libor plus 2.79% and as established by the market interest rate of the Peruvian government-issued sovereign bonds maturing in 2037 plus 150 basis points, respectively, with quarterly and semi-annual payments. At the end of the first 10 years, the Bank may redeem 100% of the debt without penalty. These subordinated debt certificates include certain financial and operating covenants. In our management’s opinion, BCP is not in violation of any of these covenants as of the date of the consolidated balance sheet date.
Among the policies that we follow to ensure sufficient liquidity are the active management of interest rates and the active monitoring of market trends, in order to identify and provide for changes in the supply of deposits or the demand for loans.
The principal sources of funds for PPS’s insurance operations are premiums and amounts earned on invested assets. The major uses of these funds are the payment of policyholder claims, benefits and related expenses, reinsurance costs, commissions and other operating costs. In general, PPS’s insurance operations generate substantial cash flow because most premiums are received in advance of the time when claim payments are required. Positive operating cash flows, along with that portion of the investment portfolio that is held in cash and highly liquid securities, historically have met the liquidity requirements of PPS’s insurance operations.
| (C) | Research and Development, Patents and Licenses, Etc. |
Not applicable.
We expect that 2009 will continue the positive economic trend; however, the international environment suggests some increase in uncertainty. In particular, we expect that financial income will increase, mainly as a result of prioritizing retail operations with individuals and small companies, as well as improving strategies followed in 2008. In addition, credit risk is expected to remain low despite planned positive loan evolution and higher provision. Furthermore, we plan to invest mainly in systems in order to improve our bank’s network to serve clients and optimize processes. See “Item 4. Information on the Company—(B) Business Overview—(1) Introduction – Review of 2008 and “—(2) Strategy.”
In Bolivia, we expect that BCB will maintain its profitability although the political and economic environment, which involves a high level of uncertainty, is an important factor in this expectation.
We expect that in 2009, ASHC will maintain its low-risk investment strategy and will reverse its negative financial results of 2008. We expect continued growth of the assets under management, given the high quality service we offer.
In our insurance business, we expect to raise the profitability of each product branch, especially in the retail business. The insurance business continues to grow, although the industry experienced a significant increase in casualties which affected different insurance business and led to continuing weak results. PPS has completed the re-composition of its risk portfolio, favoring the retail business of property and casualty insurance which offers more retention, diversification and predictability of risk, thereby allowing better retention levels and leading to improved performance in 2009.
| (E) | Off-Balance Sheet Arrangements |
We record various contractual obligations as liabilities in our financial statements. We do not recognize other contractual arrangements, such as contingent credits contracts, as liabilities in our financial statements. These other contractual arrangements are required to be registered in off-balance sheet accounts. We enter into these off-balance sheet arrangements in the ordinary course of business in order to provide support to our clients and hedge some risks in our balance sheet and use guarantees, letters of credit, derivatives and swaps.
The following table reflects our off-balance sheet arrangements as of December 31, 2006, 2007 and 2008:
| | | Year ended December 31, | |
| | | 2006 | | | 2007 | | | 2008 | |
| | | (U.S. Dollars in thousands) | |
| Contingent Credits | | | | | | | | | |
| Guarantees and stand by letters | | US$ | 1,204,500 | | | US$ | 1,133,476 | | | US$ | 1,506,506 | |
| Import and export letters of credit | | | 250,876 | | | | 431,049 | | | | 249,396 | |
| Sub Total | | | 1,455,376 | | | | 1,564,525 | | | | 1,755,902 | |
| Responsibilities under credit line agreements | | | 814,746 | | | | 1,082,115 | | | | 1,234,964 | |
| Financial derivative contracts (notional amount), net | | | (30,970 | ) | | | (331,117 | ) | | | 627,600 | |
| Swap contracts (notional amount) | | | 543,041 | | | | 1,446,813 | | | | 2,670,332 | |
| Total | | US$ | 2,782,193 | | | US$ | 3,762,336 | | | US$ | 6,288,798 | |
In the normal course of its business, our banking subsidiaries are party to transactions with off-balance sheet risk. These transactions expose them to credit risk in addition to the amounts recognized in the consolidated balance sheets.
Credit risk for off-balance sheet financial instruments is defined as the possibility of sustaining a loss because any other party to a financial instrument fails to perform in accordance with the terms of the contract. The exposures to losses are represented by the contractual amount specified in the related contracts. We apply the same credit policies in making commitments and conditional obligations as we do for on-balance sheet instruments (see note 6(a) to the Credicorp Consolidated Financial Statement), including the requirement to obtain collateral when necessary. The collateral held varies, but may include deposits in financial institutions, securities or other assets. Many of the contingent transactions are expected to expire without any performance being required. Therefore the total committed amounts do not necessarily represent future cash requirements.
We have currency-forwards derivatives. Currency-forwards are commitments to buy or sell currency at a future date at a contracted price. Risk arises from the possibility that the counterparty to the transaction will not perform as agreed and from the changes in the prices of the underlying currencies. As of December 31, 2008 and 2007, the nominal amounts for forward currency purchase and sale agreements were approximately US$2,478.2 million and US$2,210.2 million, respectively, which in general have maturities of less than a year.
These agreements are entered into to satisfy client requirements and are recognized in the consolidated financial statements at their fair value. As of December 31, 2008, the forward contracts net position is an oversell of U.S. Dollars of approximately US$627.6 million (overbuy of approximately US$331.1 million as of December 31, 2007).
Interest rate and currency swaps are derivatives contracts, where counterparties exchange variable interest rates for fixed interest rates or different currencies, respectively, in the terms and conditions established at the contract inception. The risk arises each time the projected level of the variable rate during the term of the contract is higher than the swap rate, as well as from non-compliance with contractual terms by one of the parties. As of December 31, 2008, the notional amount of open interest rate and currency swap contracts was approximately US$2,353.3 million (approximately US$1,396.4 million as of December 31, 2007).
Cross-currency swap derivative contracts involve the exchange of interest payments based on two different currency principal balances and referenced interest rates. They generally also include the exchange of principal amounts at the start and/or end of the contract. As of December 31, 2008, the notional amount of cross-currency swap contracts were approximately US$317.0 million (approximately US$50.4 million as of December 31, 2007).
As of December 31, 2008, the fair values of the asset and liability forward-exchange contracts and interest rate and cross-currency swaps amounted approximately to US$79.3 million and US$256.8 million, respectively (approximately US$45.8 million and US$69.7 million as of December 31, 2007) and are included under the caption “Other assets and other liabilities” of the consolidated balance sheets, respectively. See Note 11(b) to the Credicorp Consolidated Financial Statements.
Responsibilities under credit lines agreements include credit lines and other consumer loans facilities (credit card) and are cancelable upon notification to the client.
| (F) | Tabular Disclosure of Contractual Obligations |
We enter into various contractual obligations that may require future cash payments. The following table summarizes our contractual obligations by remaining maturity as of December 31, 2008. See “Item 4. Information on the Company—(B) Business Overview—(1) Introduction – Review of 2008.”
| | | | | | Payments due by period | |
| | | Total at December 31, 2008 | | | Less than 1 year | | | 1–3 years | | | 3–5 years | | | More than 5 years | |
| | | (U.S. Dollars in thousands) | |
| Borrowed funds | | US$ | 2,167,647 | | | US$ | 583,859 | | | US$ | 813,937 | | | US$ | 362,374 | | | US$ | 407,477 | |
| Promotional credit lines | | | 109,730 | | | | 66,615 | | | | 5,643 | | | | 6,468 | | | | 31,004 | |
| Interbank funds | | | 39,217 | | | | 39,217 | | | | 0 | | | | 0 | | | | 0 | |
| Time deposits | | | 4,856,112 | | | | 4,617,287 | | | | 147,008 | | | | 51,876 | | | | 39,941 | |
| Operating lease obligations | | | 119,971 | | | | 20,638 | | | | 30,619 | | | | 24,669 | | | | 44,045 | |
| Total | | US$ | 7,292,677 | | | US$ | 5,327,616 | | | US$ | 997,207 | | | US$ | 445,387 | | | US$ | 522,467 | |
Borrowed funds include US$1,150.7 million secured by the collection of BCP’s (including its foreign branches) future inflows from electronic messages sent through the Society for Worldwide Interbank Financial Telecommunications network and utilized within the network to instruct correspondent banks to make a payment of a certain amount to a beneficiary that is not a financial institution.
Borrowed funds also include US$410.0 million obtained from diverse international financial entities, with maturity due within three years and an interest rate of Libor plus 0.70% during the first year, Libor plus 0.75% during the second year and Libor plus 0.85% during the third year. The syndicated loan, subject to variable interest rate risk, has been hedged through interest rate swap operations for a notional amount of US$410.0 million with the same maturities.
Loans obtained include the obligation to comply with certain covenants which, in our management’s opinion, are being fulfilled at the consolidated balance sheet dates.
BCP has signed an insurance policy with AMBAC Assurance Corporation, which guarantees the timely payment of scheduled principal and certain accrued interest of all of the 2006 and 2007 issuances.
Some of international funds include standard covenants related to financial ratios, use of funds and other administrative matters. In our management’s opinion, these covenants do not limit our operations and we have fully complied with them as of the consolidated balance sheet dates.
Promotional credit lines include standard covenants related to financial ratios, use of funds and other administrative matters. In our management’s opinion, these covenants do not limit our operations and we have fully complied with them as of the consolidated balance sheet dates.
As of December 31, 2007 and 2008, in our management’s opinion our deposits and obligations are widely diversified with no significant concentrations.
| ITEM 6. | DIRECTORS, SENIOR MANAGEMENT AND EMPLOYEES |
| (A) | Directors and Senior Management |
Board of Directors
The following table sets forth our current directors:
| Name | | Position | | Years served as a Director(1) |
| Dionisio Romero Paoletti | | Chairman | | 5(2) |
| Raimundo Morales | | Vice Chairman | | 1 |
| Fernando Fort | | Director | | 27 |
| Reynaldo Llosa | | Director | | 26 |
| Juan Carlos Verme | | Director | | 19 |
| Luis Enrique Yarur | | Director | | 13 |
| Felipe Ortiz de Zevallos | | Director | | 4 |
| Germán Suárez | | Director | | 4 |
| (1) | Of Credicorp, our subsidiaries and their predecessors as of December 31, 2008. |
| (2) | Mr. Dionisio Romero Seminario decided to retire and resigned from his position in Credicorp and all its subsidiaries. Mr. Dionisio Romero Paoletti was appointed as our new Chairman by the Board in its session of March 2009. |
Dionisio Romero Paoletti is the Chairman of the Board of Directors. He is an economist from Brown University with a Master’s degree in Business Administration from Stanford University. Mr. Romero P. has served as a board member of Banco de Crédito since 2003 and was appointed Vice Chairman in 2008. Mr. Romero P. has also been the Chairman of Grupo Romero’s companies and has been Vice Chairman of the Board of Inversiones Centenario and Director of Cementos Pacasmayo since March 2005. Mr. Romero P. was appointed as Chairman of our Board and of the Board of Banco de Crédito in March 2009. He is the son of Mr. Dionisio Romero Seminario.
Raimundo Morales has been the Vice Chairman of the Board of Directors since April 2008. Prior to being elected to the Board of Directors, he served as our Chief Operating Officer and General Manager of BCP, having joined BCP in 1980. Previously, Mr. Morales held various positions during his ten years at Wells Fargo Bank in its San Francisco, São Paulo, Caracas, Miami and Buenos Aires offices. His last position was Vice President for the Southern Region of Wells Fargo. From 1980 to 1987, Mr. Morales was Executive Vice President in charge of BCP’s Wholesale Banking Group. From 1987 to 1990, he was the General Manager of ASB in Miami. He rejoined BCP as the General Manager in 1990. Mr. Morales received his Master’s degree in Finance from the Wharton School of Business in the United States.
Fernando Fort is a lawyer and partner at the law firm of Fort Bertorini Godoy Pollari & Carcelen Abogados S.A. Mr. Fort served as a director of Banco de Crédito del Perú from 1979 to 1987 and from March 1990 to the present. Since March 2009, he has served on our Board of Directors and on the board of directors of ASB, BCB and BCP’s subsidiaries. Mr. Fort also serves as a director on the Board of Inversiones Centenario and the boards of various other companies.
Reynaldo Llosa is a business manager and since August 1995 has been a director on our Board of Directors and on the boards of ASB, BCB and BCP’s subsidiaries. He has also been a director of BCP from 1980 to October 1987 and from March 1990 to the present. Mr. Llosa is the Main Partner and General Manager of F.N. Jones S.R. Ltda. and serves as a director on the boards of various other companies.
Juan Carlos Verme is a businessman and has served on the Board of Directors since August 1995. He has served on the board directors of BCP since March 1990 and is also on the board of directors of ASB, BCB and BCP’s subsidiaries. Mr. Verme is Chairman of Inversiones Centenario and also serves as a director on the boards of various other companies. He is a director of the Asamblea General de Asociados del Patronato del Museo de Arte de Lima.
Luis Enrique Yarur is a businessman with an undergraduate degree in law and graduate degrees in economics and management. He has served on the Board of Directors since October 2002 as well as the board of directors of BCP since February 1995. Mr. Yarur is Chairman of the Board of Empresas Juan Yarur S. A. C., Banco de Crédito e Inversiones, of Chile, and member of the boards of various other Chilean companies. He is Vice-President of the Asociación de Bancos e Instituciones Financieras A. G., a member of the International Advisory Board IESE, España and director of the Bolsa de Comercio de Santiago.
Felipe Ortiz de Zevallos is an industrial engineer with a Master’s degree in Management Science from Rochester University and a degree in Management from Harvard Business School. Mr. Ortiz de Zevallos has served on the Board of Directors since March 2005. He also serves as a director on the boards of various other companies, among which are Grupo Apoyo (where he is the Chairman), Compañía de Minas Buenaventura S.A. and Universia. From September 2006 until March 2009, Felipe Ortiz de Zevallos was Peru’s Ambassador to the United States. Until he was appointed as Peru’s Ambassador to the United States, Mr. Zevallos served as the President of Universidad del Pacífico in Lima (elected for the period 2004-2009).
Germán Suárez is an economist with a Master’s degree in Economics from Columbia University. Mr. Suárez was elected to the Board of Directors in March 2005. Mr. Suárez was President and Chairman of the Board of Banco Central de Reserva del Perú from 1992 to 2001, and serves as a director on the boards of various other companies, including Compañía de Minas Buenaventura S.A.
Dawna L. Ferguson is our Secretary, and Fernando Palao is our Assistant Secretary. Our Resident Representative in Bermuda is Nicholas G. Trollope.
Executive Officers
Pursuant to our bye-laws, the Board of Directors has the power to delegate its power over day-to-day management to one or more directors, officers, employees or agents. The following table sets forth information concerning our principal executive officers.
| Name | | Position | | Years served as an Officer(1) | |
| Dionisio Romero Paoletti | | Chief Executive Officer | | | 0(2) | |
| Walter Bayly | | Chief Operating Officer | | | 16 | |
| Alvaro Correa | | Chief Financial and Accounting Officer | | | 12 | |
| David Saettone | | Senior Vice President, Insurance | | | 11 | |
| (1) | Of Credicorp, our subsidiaries and their predecessors as of December 31, 2008. |
| (2) | Mr. Dionisio Romero Seminario resigned from his position as CEO in March 2009 and Mr. Dionisio Romero Paoletti was appointed by the Board as the new CEO. |
Walter Bayly was named our Chief Operating Officer and the General Manager of BCP in October 2007, effective April 2008. Since April 2004, he was our Chief Financial and Accounting Officer and the Executive Vice President of Planning and Finance of BCP. Previously, Mr. Bayly held various other management positions within BCP, which included managing the Wholesale Banking Group as well as other areas of BCP. Mr. Bayly joined BCP in 1993, after three years at Casa Bolsa México where he was Partner and Managing Director in Corporate Finance. Prior to that, for ten years he was with Citibank in Lima, New York, México, and Caracas, where he worked primarily in the corporate finance and loan syndication groups. Mr. Bayly received a Bachelor’s degree in Business Administration from Universidad del Pacífico in Lima, Peru, and a Master’s degree in Management from Arthur D. Little Management in Cambridge, Massachusetts.
Alvaro Correa has been our Chief Financial and Accounting Officer since October 2007 and the Executive Vice President of Planning and Finance of BCP since April 2008. Mr. Correa is an industrial engineer from the Pontificia Universidad Católica del Perú. He also holds a Master’s degree in Business Administration from Harvard Business School. In 1997, he joined BCP as Retail Risk Manager, serving later as IT Solution Manager under the Systems and Organization Division. Mr. Correa then served as General Manager of ASB, Credicorp Securities and BCP’s Miami agency for the last three years.
David Saettone is our Senior Vice President of Insurance and the General Manager of PPS. He is an economist with a Master’s degree and Ph.D from Princeton University. He was the General Manager of BCB and Chief of the Gabinete de Asesores y Unidad de Coordinación de Préstamos Sectoriales of the Economy and Finance Office, Perú. Mr. Saettone was also Manager of the BCP’s Corporate Finance Area.
The aggregate amount of compensation we paid to all directors and executive officers (including our executive officers listed above and four additional executive officers of BCP) for 2008 was US$42.5 million. We do not disclose to our shareholders or otherwise make available to the public information as to the compensation of its individual directors or executive officers.
As indicated in note 3(w) to the Credicorp Consolidated Financial Statements, we have granted stock appreciation rights (SARs) to certain key executives and employees who have at least one year service to us or any of our subsidiaries. At the grant date and in each one of the subsequent three years, the granted SARs may be exercised up to 25% of all SARs granted in the plan. The SARs expire after eight years.
| Year | | Number of outstanding SARs granted | | | Exercise price in US$ | |
| 2000 | | | 509,000 | | | | 8.50 | |
| 2001 | | | 555,000 | | | | 5.30 | |
| 2002 | | | 558,750 | | | | 6.98 | |
| 2003 | | | 562,500 | | | | 8.17 | |
| 2004 | | | 570,000 | | | | 10.99 | |
| 2005 | | | 585,000 | | | | 16.00 | |
| 2006 | | | 621,000 | | | | 25.32 | |
| 2007 | | | 689,500 | | | | 48.50 | |
| 2008 | | | 665,500 | | | | 72.04 | |
We assume the payment of the related income tax on behalf of our executives and employees, which corresponds to 30% of the benefit. We estimate this income tax over the basis of the liability recorded for the vested benefits.
The liabilities recorded for this plan, including the above-mentioned income tax, are included in the consolidated balance sheet caption “Other liabilities – Payroll taxes, salaries and other personnel expenses.” See Note 11(a) to the Credicorp Consolidated Financial Statements. The expenses are recorded in the consolidated income statement caption “Personnel expenses.” In 2006, 2007 and 2008, SARs prices were modified and informed to our executives and employees.
During 2006, 2007 and 2008, we signed several contracts with Citigroup by which it acquired certificates linked to the yield of our shares See Note 7(b) to the Credicorp Consolidated Financial Statements.
The following table sets forth the movement of the SARs for the periods indicated:
| | | 2008 | | | 2007 | |
| | | Outstanding SARs | | | Vested SARs | | | Outstanding SARs | | | Vested SARs | |
| | | Number | | | Number | | | Amount | | | Number | | | Number | | | Amount | |
| | | | | | | | | US$(000) | | | | | | | | | US$(000) | |
Balance as of January 1st | | | 2,134,650 | | | | 1,537,119 | | | | 89,602 | | | | 1,858,350 | | | | 1,301,928 | | | | 38,761 | |
| Granted and vested | | | 665,500 | | | | 576,874 | | | | 9,498 | | | | 689,500 | | | | 647,610 | | | | 22,248 | |
| Exercised | | | (496,175 | ) | | | (496,175 | ) | | | (19,734 | ) | | | (410,700 | ) | | | (410,700 | ) | | | (18,801 | ) |
| Decrease | | | (88,750 | ) | | | - | | | | - | | | | (2,500 | ) | | | (1,719 | ) | | | (88 | ) |
| Increase in the option fair value | | | - | | | | - | | | | (36,379 | ) | | | - | | | | - | | | | 47,482 | |
| Balance as of December 31 | | | 2,215,225 | | | | 1,617,818 | | | | 42,987 | | | | 2,134,650 | | | | 1,537,119 | | | | 89,602 | |
The following table sets forth the number of SARs vested and the price of such SARs for the periods indicated:
| | Number of outstanding SARs as of December 31, 2008 | | | Number of vested SARs as of December 31 | | | | |
| | | | | | 2008 | | | 2007 | | | 2008 | | | 2007 | |
| | | | | | | | | | | | US$ | | | US$ | |
| 2000 | | | - | | | | - | | | | 49,750 | | | | 8.00 | | | | 8.50 | |
| 2001 | | | 60,000 | | | | 60,000 | | | | 73,000 | | | | 4.80 | | | | 5.30 | |
| 2002 | | | 60,000 | | | | 60,000 | | | | 92,500 | | | | 6.48 | | | | 6.98 | |
| 2003 | | | 134,900 | | | | 134,900 | | | | 151,900 | | | | 7.67 | | | | 8.17 | |
| 2004 | | | 185,950 | | | | 185,950 | | | | 237,700 | | | | 10.49 | | | | 10.99 | |
| 2005 | | | 241,700 | | | | 241,700 | | | | 349,813 | | | | 15.50 | | | | 16.00 | |
| 2006 | | | 362,800 | | | | 327,784 | | | | 310,800 | | | | 24.82 | | | | 25.32 | |
| 2007 | | | 513,125 | | | | 320,859 | | | | 271,656 | | | | 48.00 | | | | 48.50 | |
| 2008 | | | 656,750 | | | | 286,625 | | | | - | | | | 72.04 | | | | - | |
| Total | | | 2,215,225 | | | | 1,617,818 | | | | 1,537,119 | | | | | | | | | |
On April, 2009, we implemented a new share base payment plan for certain key executives and employees. Under the new plan, Credicorp shares will be granted to certain key executives and employees who have at least one year of service to us or any of our subsidiaries. Beginning on April 28, 2009, and in each of the subsequent three years thereafter, granted shares will be vested up to 33.3% of all granted shares. We also determined that SARs granted until December 2008 under the prior SARs program (as explained above) will remain in force, with certain modifications, until those SARs expire.
Our management is the responsibility of the Board of Directors, which, pursuant to our bye-laws, is composed of eight persons. Directors need not be shareholders. Directors are elected and their remuneration is determined at Annual General Shareholders’ Meetings. Directors hold office for three-year terms. The date of expiration of the current Board of Directors is March 31, 2011. Our current directors have no benefits in addition to the remuneration agreed at the Annual General Shareholders’ Meetings. They also do not have any benefits that could be enjoyed at the termination of their service terms.
Pursuant to our bye-laws, the number of directors required to constitute a quorum is a majority of the directors. A quorum must exist throughout any meeting of directors. A director can appoint another director to act as his representative at a meeting of the Board of Directors. The Board of Directors may act by the unanimous written consent of all directors.
Our Audit Committee is responsible for assisting in the recommendation of independent auditors to be appointed at the Annual General Shareholders’ Meeting and reviewing the scope of internal and external audits. The Audit Committee also reviews compliance with internal control systems, reviews our annual and quarterly financial statements before their presentation to regulatory bodies and maintains the integrity of the preparation of audits. From March 2008 to March 2009 the members of the Audit Committee were Mr. Reynaldo Llosa (Chairman) and Mr. Germán Suárez (financial expert), who designated Mr. Benedicto Cigüeñas and Mr. Luis Nicolini as advisors. In March 2009, Mr. Nicolini left his role as advisor.
Our Audit Committee has also been assigned by the Board of Directors to oversee the internal audit departments at BCP and PPS. As permitted by SBS Resolution No. 1041-99, BCP’s internal audit department has responsibility over all financial activities of its subsidiaries.
On December 31, 2008, we had 15,478 full time employees, distributed as set forth in the following table:
| | | | |
| | | 2006 | | | 2007 | | | 2008 | |
| | | (Full-time employees) | |
| BCP | | | 8,243 | | | | 9,593 | | | | 11,654 | |
| PPS | | | 1,159 | | | | 1,665 | | | | 2,306 | |
| ASHC | | | 61 | | | | 65 | | | | 73 | |
| Prima AFP | | | 1,729 | | | | 1,464 | | | | 1,015 | |
| Others | | | 340 | | | | 350 | | | | 430 | |
| Total Credicorp | | | 11,532 | | | | 13,137 | | | | 15,478 | |
All bank employees in Peru are given the option of belonging to an employee union. These employee unions are collectively represented by the Federación de Empleados Bancarios (the Federation of Banking Employees or FEB). In order to negotiate a collective agreement on behalf of its members, FEB must have as members over 50% of all Peruvian banking employees. Because the representation of banking employees members of FEB declined to below 50%, the most recent collective bargaining agreement, which expired on June 30, 1995, was not renewed.
BCP was granted permission by the Peruvian Ministry of Labor to cancel the registration of BCP’s union in 1996 due to limited participation. As of December 31, 2008, no BCP employees belonged to a union. The last strike by union employees occurred in 1991 and did not interfere with BCP’s operations.
As of February 13, 2009, the Romero family (as then represented by Mr. Dionisio Romero Seminario) owned 14.96 million (15.85%) of our common shares, and Mr. Luis Yarur owned approximately 1.629 million (1.73%) of our common shares. None of our other directors or executive officers beneficially own more than 1% of our common shares. See “Item 7. Major Shareholders and Related Party Transactions—(A) Major Shareholders.” Other members of the Board of Directors that own our common shares are Mr. Raimundo Morales, Mr. Fernando Fort, Mr. Reynaldo Llosa, Mr. Juan Carlos Verme, Mr. Felipe Ortiz de Zevallos and Mr. Germán Suárez. Each of these directors own less than 1% of our total outstanding common shares.
ITEM 7. | MAJOR SHAREHOLDERS AND RELATED PARTY TRANSACTIONS |
As of December 31, 2008, we had issued 94,382,317 common shares, of which 14,620,845 were held by ASHC. Under Bermuda law, ASHC has the right to vote the common shares it owns. In order to restructure long term holdings, substantially all of our common shares held by BCP and PPS were transferred to ASHC in April 2004.
The table below provides details about the percentage of our common shares owned by holders of 5% or more of our total common shares, as of February 13, 2009.
| Owner | | Common Shares | | | Percent of Class (1) | |
| Romero family (2) | | | 14,958,465 | | | | 15.85 | % |
| Atlantic Security Holding Corporation | | | 14,620,845 | | | | 15.49 | % |
| Prima AFP | | | 6,272,873 | | | | 6.65 | % |
| AFP Integra | | | 5,646,824 | | | | 5.98 | % |
| (1) | As a percentage of issued and outstanding shares (including shares held by ASHC). |
| (2) | Includes common shares directly or indirectly owned by Dionisio Romero Paoletti and his family or companies owned or controlled by him. Mr. Romero P. is the Chairman and Chief Executive Officer. |
Approximately 19.87% of our total issued and outstanding common shares are currently held in 3,005 individual accounts with Cavali, a Peruvian securities clearing company.
As of April 30, 2008, 79,761,472 of our common shares (excluding the 14,620,845 shares held by ASHC) were outstanding, of which approximately 62.71% were held in the United States. There were approximately 56 registered holders of our common shares in the United States. Because certain of these common shares were held by brokers or other nominees and due to the impracticability of obtaining accurate residence information for all beneficial shareholders, the number of holders of record or registered holders of the United States is not representative of the number of beneficial holders or of the residence of beneficial holders. We are not directly or indirectly controlled by another corporation or by any foreign government.
(B) | Related Party Transactions |
Under Bermuda law, we are not subject to any restrictions on transactions with affiliates, other than such restrictions as are applicable to Bermuda companies generally. Our bye-laws provide that a director may not vote with respect to any contract or proposed contract or arrangement in which that director has an interest or a conflict of interest. We have not engaged in any transactions with related parties except through our subsidiaries.
Our consolidated financial statements as of December 31, 2006, 2007 and 2008 include transactions with related parties. For our 2006, 2007 and 2008 consolidated financial statements, we define related parties as (i) related companies, (ii) our board of directors, (iii) our key executives (defined as the management of our holdings) and (iv) enterprises that are controlled by these individuals or entities through majority shareholding or their role as chairman or principal executive officer in those companies.
The following table shows our main transactions with related companies as of December 31, 2006, 2007 and 2008.
| | Related companies | |
| | | 2006 | | | 2007 | | | 2008 | |
| | | US$(000) | | | US$(000) | | | US$(000) | |
| Direct loans | | | 70,636 | | | | 94,102 | | | | 143,855 | |
| Investments available-for-sale | | | 62,125 | | | | 90,396 | | | | 63,782 | |
| Deposits | | | 25,074 | | | | 31,689 | | | | 34,669 | |
| Contingent credits | | | 13,925 | | | | 14,026 | | | | 23,574 | |
| Interest income related to loans | | | 2,097 | | | | 2,288 | | | | 2,889 | |
| Interest expense related to deposits | | | 1,505 | | | | 2,009 | | | | 2,669 | |
| Trading securities | | | - | | | | 1,673 | | | | 1 | |
| Derivatives at fair value | | | 179 | | | | 386 | | | | 4,179 | |
| Other income | | | 953 | | | | 1,192 | | | | 2,533 | |
We made these loans, contingent operations and derivative contracts with related parties in the ordinary course of business and in accordance with the normal market terms available to other customers. Outstanding loan balances at the year-end are granted by collateral given by the related party. The loans to related companies as of December 31, 2008 have maturity dates ranging between February 2009 and July 2017 and an accrued annual interest average of 7.98% (and as of December 31, 2007 had a maturity between January 2008 and September 2017 and an accrued annual interest average of 6.79%). As of December 31, 2008, the provision for doubtful debts due to related parties amounted to US$1.2 million (US$0.2 million as of December 31, 2007 and US$0.1 million as of December 31, 2006). This amount is established based on an assessment performed on a continuous basis on the financial position of the related party and the market in which it operates.
As of December 31, 2006, 2007 and 2008, our directors, officers and employees had been involved, directly and indirectly, in credit transactions with certain subsidiaries, as permitted by Peruvian Law No. 26702. This law regulates and limits certain transactions with employees, directors and officers of banks and insurance companies in Peru. As of December 31, 2006, 2007 and 2008, our direct loans to employees, directors and key management amounted to US$59.5 million, US$85.1 million and US$116.3 million, respectively. These loans are paid monthly and earn interest at rates that are similar to market rates for comparable loans.
We do not grant directors or key personnel loans that are guaranteed with our shares or shares of our other companies.
Our key executives’ compensation as of December 31, 2006, 2007 and 2008 was comprised of the following:
| | | 2006 | | | 2007 | | | 2008 | |
| | | US$(000) | | | US$(000) | | | US$(000) | |
| Stock appreciation rights | | | 23,206 | | | | 27,113 | | | | 27,362 | |
| Salaries | | | 4,824 | | | | 5,535 | | | | 5,625 | |
| Director compensation | | | 1,173 | | | | 1,162 | | | | 1,303 | |
| Other | | | 6,962 | | | | 12,947 | | | | 8,209 | |
| Total | | | 36,165 | | | | 46,757 | | | | 42,499 | |
Our key executives’ compensation comprises all the payments received by them, including the taxes that we assumed.
(C) | Interests of Experts and Counsel |
Not applicable.
ITEM 8. | FINANCIAL INFORMATION |
(A) | Consolidated Statements and Other Financial Information |
Consolidated Financial Statements
See “Item 18. Financial Statements.”
Legal Proceedings
We, along with our subsidiaries, are involved in certain legal proceedings incidental to the normal conduct of our businesses. We do not believe that any potential liabilities resulting from such proceedings would have a material adverse effect on our financial condition or results of operation, or that of any of our subsidiaries.
Government Investigations
We, along with our subsidiaries, are not involved in government investigations.
Pursuant to Bermuda law, we may declare and pay dividends from time to time so long as after the payment of the dividends, (i) we are able to pay our liabilities as they become due and (ii) the realizable value of our assets would not be less than the aggregate of our liabilities and issued share capital and share premium accounts. There can be no assurance that any dividends will be paid or as to the amount of dividends, if any, to be paid, although we currently intend to declare and pay dividends annually and our board of directors currently expects to authorize the payment of an annual dividend to the shareholders of no less than 25% of our consolidated net profits. However, our payment of dividends is subject to Bermuda law and to the discretion of our board of directors. The Board’s decision will depend upon (i) general business conditions, (ii) our financial performance, (iii) the availability of dividends from our subsidiaries and restrictions on their payment, and (iv) other factors that the Board may deem relevant.
We will rely almost exclusively on dividends from our subsidiaries for the payment of dividends to holders of our common shares and for our corporate expenses. Subject to certain reserve and capital adequacy requirements under applicable banking and insurance regulations, we are able to cause our subsidiaries to declare dividends. To the extent our subsidiar ies do not have funds available or are otherwise restricted from paying us dividends, our ability to pay dividends on our common shares will be adversely affected. Currently, there are no restrictions on the ability of BCP, ASHC, PPS, or any of our other subsidiaries to pay dividends abroad. In addition, BCP and PPS intend to declare and pay dividends in Nuevos Soles, while we intend to declare and pay dividends in U.S. Dollars. If the value of the Nuevo Sol falls relative to the U.S. Dollar between the date of declaration and the date of payment of dividends, the value of the dividends we pay would be adversely affected. See “Item 3. Key Information—(A) Selected Financial Data—Exchange Rates.”
The following table shows cash and stock dividends that we paid in the periods indicated:
| | Number of Shares Entitled to Dividends | | | | | | | |
| 1999 | | | 94,382,317 | | | US$ | 0.20 | | | | 0.00 | |
| 2000 | | | 94,382,317 | | | US$ | 0.10 | | | | 0.00 | |
| 2001 | | | 94,382,317 | | | US$ | 0.10 | | | | 0.00 | |
| 2002 | | | 94,382,317 | | | US$ | 0.40 | | | | 0.00 | |
| 2003 | | | 94,382,317 | | | US$ | 0.30 | | | | 0.00 | |
| 2004 | | | 94,382,317 | | | US$ | 0.40 | | | | 0.00 | |
| 2005 | | | 94,382,317 | | | US$ | 0.80 | | | | 0.00 | |
| 2006 | | | 94,382,317 | | | US$ | 1.10 | | | | 0.00 | |
| 2007 | | | 94,382,317 | | | US$ | 1.30 | | | | 0.00 | |
| 2008 | | | 94,382,317 | | | US$ | 1.50 | | | | 0.00 | |
On February 27, 2009, our board of directors declared a cash dividend of US$1.50 per common share held at the close of business on April 20, 2009. This dividend was distributed on May 13, 2009 and approved at the Annual General Shareholders’ Meeting held on March 31, 2009.
ITEM 9. THE OFFER AND LISTING
(A) | Offer and Listing Details |
Price History of Credicorp’s Stock
Our common shares have been traded on the New York Stock Exchange since October 25, 1995 under the symbol BAP. Our common shares also traded on the Lima Stock Exchange. They are quoted in U.S. Dollars on both the New York Stock Exchange and the Lima Stock Exchange. The table below sets forth, for the periods indicated, the reported high and low closing prices and average daily trading volume for our common shares on the New York Stock Exchange.
| | | | | | | | | | |
| 2004 | | US$ | 15.87 | | | US$ | 12.00 | | | | 22,184 | |
| 2005 | | US$ | 28.81 | | | US$ | 14.41 | | | | 82,338 | |
| 2006 | | US$ | 45.42 | | | US$ | 21.88 | | | | 176,388 | |
| 2007 | | US$ | 76.81 | | | US$ | 38.04 | | | | 279,602 | |
| 2008 | | US$ | 86.19 | | | US$ | 30.23 | | | | 399,661 | |
| | | | | | | | | | | | | |
| 2007 | | | | | | | | | | | | |
| First quarter | | US$ | 51.68 | | | US$ | 38.80 | | | | 283,922 | |
| Second quarter | | US$ | 61.95 | | | US$ | 47.92 | | | | 277,383 | |
| Third quarter | | US$ | 66.39 | | | US$ | 55.50 | | | | 303,425 | |
| Fourth quarter | | US$ | 76.81 | | | US$ | 65.14 | | | | 244,437 | |
| 2008 | | | | | | | | | | | | |
| First quarter | | US$ | 80.25 | | | US$ | 69.99 | | | | 366,249 | |
| Second quarter | | US$ | 86.19 | | | US$ | 75.01 | | | | 340,571 | |
| Third quarter | | US$ | 81.33 | | | US$ | 55.64 | | | | 421,241 | |
| Fourth quarter | | US$ | 60.68 | | | US$ | 30.23 | | | | 469,019 | |
| 2009 | | | | | | | | | | | | |
| First quarter | | US$ | 53.02 | | | US$ | 34.58 | | | | 503,904 | |
| Second quarter (through June 26) | | US$ | 62.73 | | | US$ | 47.66 | | | | 415,646 | |
Source : Bloomberg
The table below sets forth, for the periods indicated, the reported high and low closing prices and average daily trading volume for our common shares on the Lima Stock Exchange.
| | | | | | | | | | |
| | | (U.S. Dollars) | |
| 2004 | | | 15.70 | | | | 12.08 | | | | 21,564 | |
| 2005 | | | 28.99 | | | | 14.33 | | | | 15,744 | |
| 2006 | | | 45.58 | | | | 38.27 | | | | 16,950 | |
| 2007 | | | 76.48 | | | | 38.24 | | | | 22,553 | |
| 2008 | | | 86.00 | | | | 31.01 | | | | 15,386 | |
| | | | | | | | | | | | | |
| 2007 | | | | | | | | | | | | |
| First quarter | | | 51.68 | | | | 39.00 | | | | 14,553 | |
| Second quarter | | | 61.80 | | | | 47.93 | | | | 42,703 | |
| Third quarter | | | 65.99 | | | | 54.91 | | | | 19,282 | |
| Fourth quarter | | | 76.48 | | | | 65.20 | | | | 18,934 | |
| 2008 | | | | | | | | | | | | |
| First quarter | | | 80.12 | | | | 70.00 | | | | 10,460 | |
| Second quarter | | | 84.80 | | | | 73.54 | | | | 12,763 | |
| Third quarter | | | 81.50 | | | | 56.20 | | | | 17,033 | |
| Fourth quarter | | | 60.40 | | | | 31.01 | | | | 20,598 | |
| 2009 | | | | | | | | | | | | |
| First quarter | | | 53.10 | | | | 34.90 | | | | 16,530 | |
| Second quarter (through June 26) | | | 62.80 | | | | 47.63 | | | | 12,704 | |
Source: Bloomberg
The table below sets forth, for the indicated months, the reported high and low closing prices for our common shares on the New York Stock Exchange.
| | | | | | | |
| | | (U.S. Dollars) | |
| 2008 | | | | | | |
| December | | | 49.96 | | | | 39.70 | |
| 2009 | | | | | | | | |
| January | | | 53.02 | | | | 41.30 | |
| February | | | 40.89 | | | | 36.51 | |
| March | | | 47.53 | | | | 34.58 | |
| April | | | 52.99 | | | | 47.66 | |
| May | | | 60.22 | | | | 50.03 | |
| June (through June 26) | | | 62.73 | | | | 57.40 | |
Source: Bloomberg
The table below sets forth, for the indicated months, the reported high and low closing prices for our common shares on the Lima Stock Exchange.
| | | | | | | |
| | | (U.S. Dollars) | |
| 2008 | | | | | | |
| December | | | 50.19 | | | | 39.25 | |
| 2009 | | | | | | | | |
| January | | | 53.10 | | | | 41.50 | |
| February | | | 40.50 | | | | 36.30 | |
| March | | | 47.37 | | | | 34.90 | |
| April | | | 53.40 | | | | 47.63 | |
| May | | | 59.69 | | | | 50.20 | |
| June (through June 26) | | | 62.80 | | | | 56.40 | |
Source: Bloomberg
On June 26, 2009, the last sale price of our common shares on the New York Stock Exchange was US$58.79 per share. On June 26, 2009, the closing price of our common shares on the Lima Stock Exchange was US$58.39.
Not applicable.
The Lima Stock Exchange
As of December 2008, there were 257 companies listed on the Bolsa de Valores de Lima (Lima Stock Exchange). The Lima Stock Exchange is Peru’s only securities exchange and was established in 1970. Trading on the Lima Stock Exchange is primarily done on an electronic trading system that became operational in August 1995. Trading hours are Monday through Friday as follows: 9:00 a.m.-9:30 a.m. (pre-market ordering); 9:30 a.m.-1:30 p.m. (trading); and 1:30 p.m.-2:00 p.m. (after market sales). Equity securities may also be traded in an open outcry auction floor session, which was the exclusive method of trading equity securities prior to the introduction of electronic trading. Nearly 100% of transactions currently take place on the electronic system.
Transactions during both open outcry and electronic sessions are executed through brokerage firms and stock brokers on behalf of their clients. Brokers submit their orders in strict accordance with written instructions, following the chronological order of the receipt. The orders specify the type of security ordered or offered as well as the amounts and the price of the sale or purchase. In general, share prices are permitted to increase or decrease up to 15% for Peruvian companies, and 30% for foreign companies, within a single trading day.
The Peruvian stock market capitalization increased, in U.S. Dollar terms, by 25.0% in 2004, 80.0% in 2005, 65.8% in 2006 and 80.3% in 2007, and decreased 47.12% in 2008. Volume in the Peruvian market is highly concentrated, with the ten most actively traded companies representing approximately 50.7% of total traded value of equity securities during 2007. Total traded volume was US$2.5 billion in 2004, which increased to US$3.6 billion in 2005, US$6.3 billion in 2006, and to US$12.4 billion in 2007, and decreased to US$5.1 billion in 2008. Average daily traded volume was US$9.9 million in 2004, which increased to US$14.5 million in 2005, US$25.1 million in 2006, and US$49.6 million in 2007, and decreased to US$19.8 million in 2008.
The Indice General de la Bolsa de Valores de Lima (the General Index of the Lima Stock Exchange or IGBVL) increased, in terms of U.S. Dollars, 60.5% in 2004, 24.6% in 2005, 186.9% in 2006, and 45.6% in 2007, and decreased 61.5% in 2008.
The Securities Market Law (Legislative Decree 861) addresses matters such as transparency and disclosure, takeovers and corporate actions, capital market instruments and operations, the securities markets and broker-dealers, and risk rating agencies. CONASEV, a public entity reporting to Peru’s Ministry of Economy and Finance, was given additional responsibilities relating to the supervision, regulation and development of the securities market, while a self-regulatory status was established for the Lima Stock Exchange and its member firms. Additionally, a unified system of guarantees and capital requirements was established for the Lima Stock Exchange and its member firms.
CONASEV is governed by a nine-member board appointed by the government. CONASEV has broad regulatory powers. These powers include the supervision of (i) all companies incorporated in Peru, (ii) Peruvian branches or agencies of foreign corporations, (iii) the process of admission of members to the Lima Stock Exchange, (iv) the authorization for the creation of exchanges and (v) the approval of the registration of offerings of securities.
CONASEV supervises the securities markets and the dissemination of information to investors. It also (i) governs the operations of the Public Registry of Securities and Brokers, (ii) regulates mutual funds and their management companies, (iii) monitors compliance with accounting regulations by companies under its supervision as well as the accuracy of financial statements and (iv) registers and supervises auditors providing accounting services to those companies under CONASEV’s supervision.
On August 22, 1995, CONASEV approved regulations governing the public offering of securities in Peru by entities organized outside of Peru and, for the first time, authorized foreign companies to be listed on the Lima Stock Exchange. On October 25, 1995, we became the first non-Peruvian company to list our shares on the Lima Stock Exchange. See “Item 4. Information on the Company—(B) Business Overview—(11) Supervision and Regulation.”
Pursuant to the Securities Market Law, a guarantee fund must be maintained by the Lima Stock Exchange and funded by its member firms. The actual contributions to be made by the 21 member firms of the Lima Stock Exchange are based on volume traded over the exchange. At present, the fund has approximately S/.25 million (US$8.79 million), which exceeds the target set by the regulations based on the exchange’s total traded volume. In addition to the guarantee fund managed by the Lima Stock Exchange, each member firm is required to maintain a guarantee for operations carried outside the exchange in favor of CONASEV. The manner in which such guarantees are generally established is through stand-by letters of credit issued by local banks.
Not applicable.
Not applicable.
Not applicable.
ITEM 10. | ADDITIONAL INFORMATION |
Not applicable.
(B) | Memorandum and Articles of Association |
“Item 10. Additional Information—Memorandum and Articles of Incorporation” from our Annual Report on Form 20-F dated June 27, 2003 is incorporated herein by reference.
At our Annual General Shareholders’ Meeting held on March 31, 2005, an amendment to our bye-laws was adopted whereby our number of directors was increased from six to eight. In addition, the classification of directors and the staggering of their terms was also removed and replaced with three-year terms to be served until the end of the Annual General Shareholders’ Meeting for the year in which their respective terms expire. The main reasons for these amendments were to give more stability to our administration and to give AFPs, whose ownership of our common shares has steadily increased (see “Item 7. Major Shareholders and Related Party Transactions—(A) Major Shareholders”), direct representation on our board of directors. Directors were elected to the two newly created directorships to represent the pension funds.
As of the date hereof, we have not, nor have our subsidiaries, entered into any material contracts.
We have been designated as a non-resident for Bermuda exchange control purposes, and therefore, there are no restrictions on our ability to transfer non-Bermuda funds in and out of Bermuda or to pay dividends to United States residents who are holders of our common shares.
We rely almost exclusively on dividends from BCP, ASHC, PPS and our other subsidiaries for the payment of dividends to holders of our common shares. To the extent our subsidiaries are restricted by law from paying us dividends, our ability to pay dividends on our common shares will be adversely affected.
In addition, we present our financial statements and pay dividends in U.S. Dollars. BCP and PPS prepare their financial statements and pay dividends in Nuevos Soles. The Peruvian currency has been devalued numerous times during the past two decades. If the value of the Nuevo Sol falls relative to the U.S. Dollar between the date of declaration and the date of payment of dividends, the value of the dividends we receive from our subsidiaries would be adversely affected.
Although substantially all of the customers of BCP, ASHC and PPS are located in Peru, as of December 31, 2008, approximately 66% of BCP’s loan portfolio, 100% of ASHC’s loan portfolio and 84.0% of PPS’s premiums were denominated in U.S. Dollars. Most of the borrowers or insureds of these three company use Nuevo Soles. Therefore, a devaluation of the Nuevo Sol would therefore have the effect of increasing the cost to the borrower in repaying its loans or the insured in making premium payments. As a result, a devaluation could lead to increased nonperforming loans or unpaid premiums for BCP, ASHC and PPS.
Among the economic circumstances that could lead to a devaluation would be a decline in Peruvian foreign reserves to inadequate levels. Although the current level of Peru’s foreign reserves compares favorably with those of other Latin American countries, there can be no assurance that Peru will be able to maintain adequate foreign reserves to meet its foreign currency-denominated obligations or that Peru will not devalue its currency should its foreign reserves decline. See “Item 4. Information on the Company—(B) Business Overview—(9) Peruvian Government and Economy.”
Since March 1991, there have been no exchange controls in Peru and all foreign exchange transactions are based on free market exchange rates. Additionally, during the last two decades, the Peruvian currency has experienced a significant number of large devaluations. Peru has consequently adopted and operated under various exchange rate control practices and exchange rate determination policies, ranging from strict control over exchange rates to market determination of rates. Current Peruvian regulations on foreign investment allow the foreign holders of equity shares of Peruvian companies to receive and repatriate 100% of the cash dividends distributed by the company. These investors are allowed to purchase foreign exchange at free market exchange rates through any member of the Peruvian banking system.
At the present time, there is no Bermuda income or profits tax, withholding tax, capital gains tax, capital transfer tax, estate duty or inheritance tax payable that we must pay or our shareholders must pay with respect to their shares. We have obtained an assurance from the Minister of Finance of Bermuda under the Exempted Undertakings Tax Protection Act 1966 that, in the event that any legislation is enacted in Bermuda imposing any tax computed on profits or income, or computed on any capital asset, gain or appreciation or any tax in the nature of estate duty or inheritance tax, such tax shall not, until March 28, 2016, be applicable to us or to any of our operations or to our shares, debentures or other obligations. This assurance, however, does not cover any tax applicable to persons ordinarily resident in Bermuda or to any taxes that we must pay with respect to real property that we own or lease in Bermuda.
As an exempted company, we are liable to pay in Bermuda an annual government fee based upon our authorized share capital and the premium on our issued common shares, which amounted to the approximate equivalent of US$17,830 in 2008.
(F) | Dividends and Paying Agents |
Not applicable.
Not applicable.
The documents referred to in this Annual Report are available for inspection at our registered office.
(I) | Subsidiary Information |
Not applicable.
ITEM 11. QUANTITATIVE AND QUALITATIVE DISCLOSURES ABOUT MARKET RISK
By their nature, our activities principally involve the use of financial instruments, including derivatives. We accept deposits from customers at both fixed and floating rates, for various periods, and seek to earn above-average interest margins by investing these funds in high quality assets. We seek to increase these margins by consolidating our short-term funds and lending for longer periods at higher rates, while maintaining sufficient liquidity to meet all claims that might come due.
We also seek to raise our interest margins by obtaining above-average market margins, net of allowances, through lending to commercial and retail borrowers with a range of credit products. These exposures involve not just on-balance sheet loans and advances; we also enter into guarantees and other commitments such as letters of credit and performance.
We also trade in financial instruments, taking positions in traded and over-the-counter instruments, including derivatives, in order to take advantage of short-term market movements in equities, bonds, currency and interest rates.
In this sense, risk is inherent in our activities but is managed through a process of ongoing identification, measurement and monitoring, subject to risk limits and other controls. This process of risk management is critical to our continuing profitability and each individual within our company is accountable for the risk exposures relating to his or her responsibilities. We are exposed to operating risk, credit risk, liquidity risk and market risk. Market risk is subdivided into trading and non-trading risks.
Our independent risk control process does not include business risks such as changes in the environment, technology and industry, which are monitored through our strategic planning process.
Risk Management Structure
Our board of directors and the board of directors of each of our subsidiaries are ultimately responsible for identifying and controlling risks. However, there are separate independent bodies in the major subsidiaries (BCP, PPS and ASHC) responsible for managing and monitoring risks, as further explained below:
Board of Directors: The board of directors of each major subsidiary is responsible for the overall risk management approach and responsible for the approval of the policies and strategies currently in place. They provide written principles for overall risk management, as well as written policies covering specific areas, such as foreign exchange risk, interest rate risk, credit risk, use of derivative financial instruments and non-derivative financial instruments.
Risk Management Committee: The risk management committee of each major subsidiary is responsible for the strategy used for mitigating risks as well as setting forth the overall principles, policies and limits for the different types of risks. They are also responsible for monitoring fundamental risk issues and manages and monitors relevant risk decisions.
Risk Management Department: The risk management department of each major subsidiary is responsible for developing, implementing and improving, on a continuous basis, our risk management infrastructure by adopting and incorporating global best practices and following established policies.
Internal Audit: Risk management processes throughout our organization are monitored by the internal audit function, which examines both the adequacy of the procedures and our compliance with such procedures. Internal Audit discusses the results of all assessments with our management, and reports its findings and recommendations to our audit committee and board of directors.
Treasury and Foreign Exchange Departments: Our treasury department is responsible for managing our assets, liabilities and overall financial structure. It is also primarily responsible for our management of funding and liquidity risks, as well as investment, forward and spot portfolios, assuming the related liquidity, interest rate and exchange rate risks, according to the policies and limits currently in effect.
Risk Measurement and Reporting Systems
Our risks are measured using a method which reflects both the expected loss likely to arise in normal circumstances and unexpected losses, which are an estimate of the ultimate actual loss based on statistical models. The models make use of probabilities derived from historical experience, adjusted to reflect the economic environment. We also run worse case scenarios that would arise in the event of an occurrence of an unlikely and extreme event.
Monitoring and controlling risks are primarily performed based on limits that we establish. These limits reflect our business strategy and market environment as well as the level of risk that we are willing to accept. In addition, we monitor and measure our overall risk bearing capacity in relation to our aggregate risk exposure across all risk types and activities.
Information compiled from all of our subsidiaries is examined and processed in order to analyze, control and identify early risks. This information is presented and explained to our board of directors, risk management committee, and all of our other relevant members. The report includes aggregate credit exposure, credit metric forecasts, hold limit exceptions, Value at Risk (or VaR), liquidity ratios and risk profile changes. Our senior management periodically assesses the fair value of the investments and the appropriateness of the allowance for credit losses.
Risk Mitigation
As part of our overall risk management, we use derivatives and other instruments to manage exposures resulting from changes in interest rates, foreign currencies, equity risk and credit risk.
The risk profile is assessed before entering into hedge transactions, which are authorized by the appropriate level of seniority within our organization. The effectiveness of hedges is assessed by our risk management department (based on economic considerations rather than IFRS hedge accounting regulations). Each month we monitor the effectiveness of all hedge relationships by the unit. In situations of ineffectiveness, we will enter into a new hedge relationship to mitigate risk on a continuous basis.
We actively use collateral to reduce our credit risks.
Excessive Risk Concentration
Concentrations arise when a number of counterparties are engaged in similar business activities, or activities in the same geographic region, or have similar economic, political or other conditions. Concentrations indicate the relative sensitivity of our performance to developments affecting a particular industry or geographical location.
In order to avoid excessive concentrations of risk, our policies and procedures include specific guidelines to focus on maintaining a diversified portfolio. Identified concentrations of credit risks are controlled and managed accordingly.
Market Risk
We have specific risk management policies and procedures that structure and delineate exposures to credit risks, market risk, liquidity and, more recently, operational risks (See “Item 4. Information on the Company—(B) Business Overview—(11) Supervision and Regulation—(ii) BCP—Management of Operational Risk”).
We take on exposure to market risks, which is the risk that the fair value or future cash flows of a financial instrument will fluctuate because of changes in market prices. Market risks arise from open positions in interest rates, currency, commodities and equity products, all of which are exposed to general and specific market movements and changes in the level of price volatility such as interest rates, credit spreads, foreign exchange rates and equity prices. Due to the nature of our current activities, commodity price risk is not applicable.
We separate exposure to market risk into two groups: (i) that which arises from value fluctuation of trading portfolios due to movements of market rates or prices (i.e., trading book) and (ii) that which arises from changes in the structural positions of non-trading portfolios due to movements of interest rates, prices and foreign exchange ratios (i.e., ALM Book).
Trading portfolios include those liquid positions arising from market-making transactions where we act as principal with clients or with the market. Non-trading portfolios consist of relatively illiquid positions, mainly banking assets and liabilities (deposits and loans) and nontrading investments (available-for-sale).
We manage the risks that trading portfolios face through VaR historical simulation techniques, and manage non-trading portfolios using asset liability management (or ALM).
Trading Book
The trading book is made up of liquid investment instruments. The trading book is characterized by liquid positions in equities, bonds, foreign currencies and derivatives. Some limits have been set in order to control and monitor the risks undertaken. These risks arise from the size of the positions and/or from the volatility of the risk factors embedded in each financial instrument. Regular reports are prepared for our risk management committees and top management. The major measurement technique used to measure and control market risk is VaR.
We apply VaR to our trading portfolios to estimate the market risk of positions held and the maximum losses that are expected, based upon a number of assumptions of various changes in market conditions. Our risk management committee sets limits on the level of risk that may be accepted and reviews such levels daily.
VaR is a statistically-based estimate of the potential loss on the current portfolio from adverse market movements. It expresses the “maximum” amount that we might lose, but only to a certain level of confidence (99%). As a result, there is a specified statistical probability (1%) that actual loss could be greater than the VaR estimate. The VaR model assumes a certain “holding period” until positions can be closed (1 day - 10 days). The time horizon used to calculate VaR is one day. However, the one-day VaR is increased to a 10-day time frame and calculated multiplying the one-day VaR by the square root of 10, the results of which are presented in the tables below. The assessment of past movements has been based on historical one-year data. We apply these historical changes in rates directly to our current positions (a method known as historical simulation).
The use of this approach does not prevent losses outside of these limits in the event of more significant market movements.
As of December 31, 2007 and 2008, our VaR by type of asset was as follows:
| | | 2008 | | | 2007 | |
| | | US$(000) | | | US$(000) | |
| Equity securities | | | 55 | | | | 5,211 | |
| Mutual funds | | | 1,034 | | | | - | |
| Fixed income | | | 1,116 | | | | 567 | |
| Derivatives | | | - | | | | 626 | |
| Consolidated VaR by type of asset | | | 1,604 | | | | 5,261 | |
As of December 31, 2007 and 2008, our VaR by risk type is as follows:
| | | 2008 | | | 2007 | |
| | | US$(000) | | | US$(000) | |
| Foreign exchange risk | | | 579 | | | | 133 | |
| Interest rate risk | | | 1,063 | | | | 514 | |
| Equity risk | | | 850 | | | | 4,879 | |
| Consolidated VaR by risk type | | | 1,604 | | | | 5,261 | |
ALM Book
The management of the risks associated with long-term and structural positions is called “Asset and Liability Management”, or ALM. Non-trading portfolios which comprise the ALM Book are exposed to different sensitivities that can bring about a deterioration in the value of the assets compared to its liabilities and therefore a reduction of its net worth.
Interest rate risk arises from the possibility that changes in interest rates will affect future cash flows or the fair value of financial instruments. Cash flow interest rate risk is the risk that the future cash flows of a financial instrument will fluctuate because of changes in market interest rates. Fair value interest rate risk is the risk that the value of a financial instrument will fluctuate because of changes in market interest rates. We take on exposure to the effects of fluctuations in the prevailing levels of market interest rates on both our fair value and cash flow risks. Interest margins may increase as a result of such changes but may also decrease in the event that unexpected movements arise. Our board of directors sets limits on the level of mismatch of interest rate re-pricing that may be undertaken, which is monitored daily by our treasury department.
Re-pricing Gap
Gap analysis comprises aggregating re-pricing timeframes into buckets and checking if each bucket nets to zero. Different bucketing schemes might be used. An interest rate gap is simply a positive or negative net re-pricing timeframe for one of the buckets.
The table below summarizes our exposure to interest rate risks. It includes our financial instruments at carrying amounts, categorized by the earlier of contractual re-pricing or maturity dates:
| | | As of December 31, 2008 | |
| | | Up to 1 month | | | 1 to 3 months | | | 3 to 12 months | | | 1 to 5 years | | | More than 5 years | | | Non-interest bearing | | | Total | |
| | | US$(000) | | | US$(000) | | | US$(000) | | | US$(000) | | | US$(000) | | | US$(000) | | | US$(000) | |
| Assets | | | | | | | | | | | | | | | | | | | | | |
| Cash and due from banks | | | 2,455,413 | | | | 196,588 | | | | 46,536 | | | | 10,218 | | | | - | | | | 1,057,416 | | | | 3,766,171 | |
| Investments | | | 818,153 | | | | 1,208,593 | | | | 989,125 | | | | 543,549 | | | | 1,141,155 | | | | 294,577 | | | | 4,995,152 | |
| Loans | | | 2,038,457 | | | | 2,412,234 | | | | 2,274,854 | | | | 2,992,480 | | | | 604,016 | | | | - | | | | 10,322,041 | |
| Assets designated at fair value through profit and loss | | | - | | | | - | | | | - | | | | - | | | | - | | | | 129,631 | | | | 129,631 | |
| Premiums and other policies receivables | | | - | | | | - | | | | - | | | | - | | | | - | | | | 111,561 | | | | 111,561 | |
| Accounts receivable from re-insurers and co-insurers | | | - | | | | - | | | | - | | | | - | | | | - | | | | 165,144 | | | | 165,144 | |
| Other assets | | | - | | | | - | | | | - | | | | - | | | | - | | | | 1,331,369 | | | | 1,331,369 | |
| Total assets | | | 5,312,023 | | | | 3,817,415 | | | | 3,310,515 | | | | 3,546,247 | | | | 1,745,171 | | | | 3,089,698 | | | | 20,821,069 | |
| | | | | | | | | | | | | | | | | | | | | | | | | | | | | |
| Liabilities | | | | | | | | | | | | | | | | | | | | | | | | | | | | |
| Deposits and obligations | | | 4,114,430 | | | | 3,268,610 | | | | 2,991,905 | | | | 321,984 | | | | 39,979 | | | | 3,213,529 | | | | 13,950,437 | |
| Due to banks and correspondents | | | 178,539 | | | | 745,155 | | | | 197,935 | | | | 11,705 | | | | 32,544 | | | | 14,113 | | | | 1,179,991 | |
| Liabilities designated at fair value through profit or loss | | | - | | | | - | | | | - | | | | - | | | | - | | | | 55,841 | | | | 55,841 | |
| Technical, insurance claims reserves and reserves for unearned premiums | | | 31,254 | | | | 19,357 | | | | 86,935 | | | | 148,437 | | | | 331,697 | | | | 350,090 | | | | 967,770 | |
| Borrowed funds | | | 1,008,997 | | | | 2,474 | | | | 11,762 | | | | 81,871 | | | | 45,612 | | | | - | | | | 1,150,716 | |
| Bonds and subordinated notes issued | | | 817 | | | | - | | | | 63,208 | | | | 284,577 | | | | 428,788 | | | | 7,840 | | | | 785,230 | |
| Other liabilities | | | - | | | | - | | | | - | | | | - | | | | - | | | | 934,979 | | | | 934,979 | |
| Equity | | | - | | | | - | | | | - | | | | - | | | | - | | | | 1,796,105 | | | | 1,796,105 | |
| Total liabilities and equity | | | 5,334,037 | | | | 4,035,596 | | | | 3,351,745 | | | | 848,574 | | | | 878,620 | | | | 6,372,497 | | | | 20,821,069 | |
| Off-Balance sheet items | | | | | | | | | | | | | | | | | | | | | | | | | | | | |
| Derivatives assets | | | 2,444,863 | | | | 1,267,306 | | | | 577,445 | | | | 458,944 | | | | 286,646 | | | | - | | | | 5,035,204 | |
| Derivatives liabilities | | | 1,582,377 | | | | 770,950 | | | | 816,213 | | | | 1,438,652 | | | | 427,012 | | | | - | | | | 5,035,204 | |
| | | | 862,486 | | | | 496,356 | | | | (238,768 | ) | | | (979,708 | ) | | | (140,366 | ) | | | - | | | | - | |
| Marginal gap | | | 840,472 | | | | 278,175 | | | | (279,998 | ) | | | 1,717,965 | | | | 726,185 | | | | (3,282,799 | ) | | | - | |
| Accumulated gap | | | 840,472 | | | | 1,118,647 | | | | 838,649 | | | | 2,556,614 | | | | 3,282,799 | | | | - | | | | - | |
| | | As of December 31, 2007 | |
| | | Up to 1 month | | | 1 to 3 months | | | 3 to 12 months | | | 1 to 5 years | | | More than 5 years | | | Non-interest bearing | | | Total | |
| | | US$(000) | | | US$(000) | | | US$(000) | | | US$(000) | | | US$(000) | | | US$(000) | | | US$(000) | |
| Assets | | | | | | | | | | | | | | | | | | | | | |
| Cash and due from banks | | | 2,331,637 | | | | 31,074 | | | | 48,172 | | | | 42,045 | | | | 19 | | | | 620,918 | | | | 3,073,865 | |
| Investments | | | 567,613 | | | | 680,272 | | | | 1,974,368 | | | | 837,269 | | | | 842,317 | | | | 377,797 | | | | 5,279,636 | |
| Loans | | | 2,078,657 | | | | 2,294,056 | | | | 1,499,311 | | | | 2,051,629 | | | | 115,847 | | | | - | | | | 8,039,500 | |
| Assets designated at fair value through profit and loss | | | - | | | | - | | | | 50,561 | | | | - | | | | - | | | | 162,592 | | | | 213,153 | |
| Premiums and other policies receivables | | | - | | | | - | | | | - | | | | - | | | | - | | | | 85,495 | | | | 85,495 | |
| Accounts receivable from re-insurers and co-insurers | | | - | | | | - | | | | - | | | | - | | | | - | | | | 116,141 | | | | 116,141 | |
| Other assets | | | - | | | | - | | | | - | | | | - | | | | - | | | | 898,108 | | | | 898,108 | |
| Total assets | | | 4,977,907 | | | | 3,005,402 | | | | 3,572,412 | | | | 2,930,943 | | | | 958,183 | | | | 2,261,051 | | | | 17,705,898 | |
| Liabilities | | | | | | | | | | | | | | | | | | | | | | | | | | | | |
| Deposits and obligations | | | 3,358,599 | | | | 3,089,841 | | | | 1,709,965 | | | | 263,913 | | | | 2,088 | | | | 2,926,308 | | | | 11,350,714 | |
| Financial liabilities designated at fair value through profit and loss | | | - | | | | - | | | | 50,561 | | | | - | | | | - | | | | - | | | | 50,561 | |
| Due to banks and correspondents | | | 484,560 | | | | 437,345 | | | | 303,506 | | | | 198,357 | | | | 21,296 | | | | 8,197 | | | | 1,453,261 | |
| Accounts payable to re-insurers and co-insurers | | | - | | | | - | | | | - | | | | - | | | | - | | | | 21,914 | | | | 21,914 | |
| Technical, insurance claims reserves and reserves for unearned premiums | | | 1,626 | | | | 4,878 | | | | 14,634 | | | | 95,017 | | | | 305,039 | | | | 394,333 | | | | 815,527 | |
| Borrowed funds | | | - | | | | 870,404 | | | | - | | | | - | | | | - | | | | - | | | | 870,404 | |
| Bonds and subordinated notes issued | | | 101,521 | | | | 34,520 | | | | 54,546 | | | | 176,924 | | | | 328,147 | | | | 6,640 | | | | 702,298 | |
| Other liabilities | | | - | | | | - | | | | 8,275 | | | | - | | | | - | | | | 617,671 | | | | 625,946 | |
| Equity | | | - | | | | - | | | | - | | | | - | | | | - | | | | 1,815,273 | | | | 1,815,273 | |
| Total liabilities and equity | | | 3,946,306 | | | | 4,436,988 | | | | 2,141,487 | | | | 734,211 | | | | 656,570 | | | | 5,790,336 | | | | 17,705,898 | |
| Off-Balance sheet items | | | | | | | | | | | | | | | | | | | | | | | | | | | | |
| Derivatives assets | | | 1,746,686 | | | | 724,850 | | | | 719,635 | | | | 349,552 | | | | 116,269 | | | | - | | | | 3,656,992 | |
| Derivatives liabilities | | | 967,415 | | | | 617,771 | | | | 801,599 | | | | 806,626 | | | | 463,581 | | | | - | | | | 3,656,992 | |
| | | | 779,271 | | | | 107,079 | | | | (81,964 | ) | | | (457,074 | ) | | | (347,312 | ) | | | - | | | | - | |
| Marginal gap | | | 1,810,872 | | | | (1,324,507 | ) | | | 1,348,961 | | | | 1,739,658 | | | | (45,699 | ) | | | (3,529,285 | ) | | | - | |
| Accumulated gap | | | 1,810,872 | | | | 486,365 | | | | 1,835,326 | | | | 3,574,984 | | | | 3,529,285 | | | | - | | | | - | |
Sensitivity to Changes in Interest Rates
The following table presents the sensitivity to a reasonable possible change in interest rates, with all other variables held constant, of our consolidated income statement and consolidated statements of change in equity, before income tax and minority interest.
The sensitivity of the consolidated income statement is the effect of the assumed changes in interest rates on the net interest income for one year before income tax and minority interest, based on the floating rate non-trading financial assets and financial liabilities held at December 31, 2007 and 2008, including the effect of derivatives instruments. The sensitivity of equity is calculated by revaluing fixed rate available-for-sale financial assets, before income tax and minority interest, including the effect of any associated hedges, and derivatives instruments designated as cash flow hedges, as of December 31, 2007 and 2008 for the effects of the assumed changes in interest rates:
| | | As of December 31, 2008 | |
| Currency | | Changes in basis points | | | Sensitivity of net income | | | Sensitivity of Equity | |
| | | | | | US$(000) | | | US$(000) | |
| U.S. Dollar | | +/- | 50 | | | +/- | 6,842 | | | -/+ | 16,709 | |
| U.S. Dollar | | +/- | 100 | | | +/- | 13,684 | | | -/+ | 33,417 | |
| U.S. Dollar | | +/- | 200 | | | +/- | 27,368 | | | -/+ | 66,834 | |
| U.S. Dollar | | +/- | 300 | | | +/- | 41,052 | | | -/+ | 100,251 | |
| Peruvian Currency | | +/- | 50 | | | -/+ | 12,227 | | | -/+ | 16,791 | |
| Peruvian Currency | | +/- | 100 | | | -/+ | 24,454 | | | -/+ | 33,581 | |
| Peruvian Currency | | +/- | 200 | | | -/+ | 48,908 | | | -/+ | 67,162 | |
| Peruvian Currency | | +/- | 300 | | | -/+ | 73,362 | | | -/+ | 100,743 | |
The interest rate sensitivities set out in the table above are illustrative only and are based on simplified scenarios. The figures represent the effect of the pro-forma movements in the net interest income based on the projected yield curve scenarios and our current interest rate risk profile. This effect, however, does not incorporate actions that would be taken by our management to mitigate the impact of this interest rate risk. In addition, we seek proactively to change the interest rate risk profile to minimize losses and optimize net revenues.
The projections above also assume that interest rate of all maturities move by the same amount and, therefore, do not reflect the potential impact on net interest income of some rates changing while others remain unchanged. The projections make other simplifying assumptions too, including that all positions run to maturity.
Available-for-sale equity securities and mutual funds are not considered as part of the investment securities for sensitivity calculation purposes. However, a 10, 30 and 50 percent for equity and 10, 20 and 30 percent for mutual funds changes in market prices is conducted to these price-sensitivity securities and the expected unrealized gain or loss, before income tax, is presented below:
| Market price sensitivity | | Changes in market prices | | | As of December 31, 2008 | |
| | | % | | | US$(000) | |
| | | | | | | |
| Equity securities | | ± | 10 | | | ± | 21,762 | |
| Equity securities | | ± | 30 | | | ± | 65,285 | |
| Equity securities | | ± | 50 | | | ± | 108,809 | |
| Mutual funds | | ± | 10 | | | ± | 13,132 | |
| Mutual funds | | ± | 20 | | | ± | 26,264 | |
| Mutual funds | | ± | 30 | | | ± | 39,397 | |
We are exposed to foreign currency exchange rates on our financial position and cash flows. Management sets limits on the level of exposure by currency and in total for both overnight and intra-day positions, which are monitored daily.
Foreign currency transactions are made at the free market exchange rates of the countries where our subsidiaries are established. As of December 31, 2008 and 2007, our assets and liabilities by currencies were as follows:
| 2008 | | U.S. Dollars | | | Peruvian currency | | | Other currencies | | | Total | |
| | | US$(000) | | | US$(000) | | | US$(000) | | | US$(000) | |
| Monetary assets - | | | | | | | | | | | | |
| Cash and due from banks | | | 3,156,279 | | | | 495,550 | | | | 114,342 | | | | 3,766,171 | |
| Trading securities | | | 23,220 | | | | 11,523 | | | | 1,341 | | | | 36,084 | |
| Available-for-sale investments | | | 2,897,658 | | | | 1,736,160 | | | | 325,250 | | | | 4,959,068 | |
| Loans, net | | | 6,930,125 | | | | 3,298,579 | | | | 93,337 | | | | 10,322,041 | |
| Financial assets designated to fair value through profit and loss | | | 129,631 | | | | - | | | | - | | | | 129,631 | |
| Other assets | | | 594,107 | | | | 255,476 | | | | 12,383 | | | | 861,966 | |
| | | | 13,731,020 | | | | 5,797,288 | | | | 546,653 | | | | 20,074,961 | |
| Monetary liabilities - | | | | | | | | | | | | | | | | |
| Deposits and obligations | | | (8,614,042 | ) | | | (4,963,932 | ) | | | (372,463 | ) | | | (13,950,437 | ) |
| Due to bank and correspondents and borrowed funds | | | (2,189,114 | ) | | | (140,155 | ) | | | (1,438 | ) | | | (2,330,707 | ) |
| Financial liabilities designated at fair value through profits and loss | | | - | | | | - | | | | - | | | | - | |
| Bonds and subordinated notes issued | | | (311,860 | ) | | | (473,370 | ) | | | - | | | | (785,230 | ) |
| Other liabilities | | | (1,425,817 | ) | | | (508,063 | ) | | | (24,710 | ) | | | (1,958,590 | ) |
| | | | (12,540,833 | ) | | | (6,085,520 | ) | | | (398,611 | ) | | | (19,024,964 | ) |
| | | | 1,190,187 | | | | (288,232 | ) | | | 148,042 | | | | 1,049,997 | |
| Forwards position, net | | | (627,600 | ) | | | 591,628 | | | | 35,972 | | | | - | |
| Currency swaps position, net | | | 31,458 | | | | (31,458 | ) | | | - | | | | - | |
| Cross-currency swaps position, net and interest rate swaps position, net | | | (277,347 | ) | | | 277,347 | | | | - | | | | - | |
| Net monetary position | | | 316,698 | | | | 549,285 | | | | 184,014 | | | | 1,049,997 | |
| 2007 | | U.S. Dollars | | | Peruvian currency | | | Other currencies | | | Total | |
| | | US$(000) | | | US$(000) | | | US$(000) | | | US$(000) | |
| Monetary assets - | | | | | | | | | | | | |
| Cash and due from banks | | | 2,644,858 | | | | 311,828 | | | | 117,179 | | | | 3,073,865 | |
| Trading securities | | | 38,647 | | | | 11,463 | | | | 885 | | | | 50,995 | |
| Available-for-sale investments | | | 1,934,672 | | | | 3,129,351 | | | | 164,618 | | | | 5,228,641 | |
| Loans, net | | | 5,555,864 | | | | 2,450,297 | | | | 33,339 | | | | 8,039,500 | |
| Financial assets designated to fair value through profit and loss | | | 213,153 | | | | - | | | | - | | | | 213,153 | |
| Other assets | | | 261,102 | | | | 299,695 | | | | 9,745 | | | | 570,542 | |
| | | | 10,648,296 | | | | 6,202,634 | | | | 325,766 | | | | 17,176,696 | |
| Monetary liabilities - | | | | | | | | | | | | | | | | |
| Deposits and obligations | | | (7,173,362 | ) | | | (3,892,138 | ) | | | (285,214 | ) | | | (11,350,714 | ) |
| Due to bank and correspondents and borrowed funds | | | (2,071,882 | ) | | | (248,362 | ) | | | (3,421 | ) | | | (2,323,665 | ) |
| Financial liabilities designated at fair value through profits and loss | | | (50,561 | ) | | | - | | | | - | | | | (50,561 | ) |
| Bonds and subordinated notes issued | | | (329,567 | ) | | | (372,731 | ) | | | - | | | | (702,298 | ) |
| Other liabilities | | | (1,040,178 | ) | | | (434,353 | ) | | | 11,144 | | | | (1,463,387 | ) |
| | | | (10,665,550 | ) | | | (4,947,584 | ) | | | (277,491 | ) | | | (15,890,625 | ) |
| | | | (17,254 | ) | | | 1,255,050 | | | | 48,275 | | | | 1,286,071 | |
| Forwards position, net | | | 331,117 | | | | (273,971 | ) | | | (57,146 | ) | | | - | |
| Currency swaps position, net | | | 7,227 | | | | (7,227 | ) | | | - | | | | - | |
| Cross-currency swaps position, net and interest rate swaps position, net | | | (50,420 | ) | | | 50,420 | | | | - | | | | - | |
| Net monetary position | | | 270,670 | | | | 1,024,272 | | | | (8,871 | ) | | | 1,286,071 | |
We manage foreign exchange risk by monitoring and controlling the position values due to changes in exchange rates. We measure our performance in U.S. Dollars, so if the net foreign exchange position (e.g., Peruvian currency) is an asset, any depreciation of the U.S. Dollar with respect to this currency would affect our consolidated balance sheet positively. The current position in a foreign currency comprises exchange rate-linked assets and liabilities in that currency. An institution’s open position in individual currencies comprises assets, liabilities and off-balance sheet items denominated in the respective foreign currency for which the institution itself bears the risk. Any appreciation/depreciation of the foreign exchange would affect the consolidated income statement.
Our net foreign exchange balance is the sum of our positive open non-U.S. Dollar positions (net long position) less the sum of our negative open non-U.S. Dollar positions (net short position); any devaluation/revaluation of the foreign exchange position would affect our consolidated income statement. A currency mismatch would leave our consolidated balance sheet vulnerable to a fluctuation of the foreign currency (exchange rate shock).
The table below shows the sensitivity analysis of the Peruvian currency, the currency to which we had significant exposure as of December 31, 2007 and 2008 on our non-trading monetary assets and liabilities and our forecast cash flows. The analysis calculates the effect of a reasonably possible movement of the currency rate against the U.S. Dollar, with all other variables held constant on the consolidated income statement, before income tax. A negative amount in the table reflects a potential net reduction in consolidated income statement, while a positive amount reflects a net potential increase:
| Sensitivity Analysis | | Change in Currency Rates | | | 2008 | |
| | | % | | | US$(000) | |
| Devaluation - | | | | | | |
| Peruvian Currency | | | 5 | | | | (28,910 | ) |
| Peruvian Currency | | | 10 | | | | (61,032 | ) |
| Revaluation - | | | | | | | | |
| Peruvian Currency | | | 5 | | | | 26,156 | |
| Peruvian Currency | | | 10 | | | | 49,935 | |
ITEM 12. | DESCRIPTION OF SECURITIES OTHER THAN EQUITY SECURITIES |
Not applicable.
PART II
ITEM 13. | DEFAULTS, DIVIDEND ARREARAGES AND DELINQUENCIES |
We, along with our subsidiaries, have never defaulted on any of our debt or been forced to reschedule any of our obligations.
(B) | Dividend Arrearages and Delinquencies |
None.
| ITEM 14. | MATERIAL MODIFICATIONS TO THE RIGHTS OF SECURITY HOLDERS AND USE OF PROCEEDS |
None.
ITEM 15. | CONTROLS AND PROCEDURES |
(A) | Disclosure Controls and Procedures |
Our management, with the participation of and under the supervision of our principal executive officer and principal financial officer, has evaluated the effectiveness of the design and operation of our disclosure controls and procedures (as defined in Exchange Act Rules 13a-15(e) and 15d-15(e)) as of December 31, 2008. Based on this evaluation, our management, principal executive officer and principal financial officer have concluded that our disclosure controls and procedures are effective in ensuring that information that we are required to disclose in reports that we file or submit under the Exchange Act is recorded, processed, summarized and reported within the time periods specified in U.S. Securities and Exchange Commission (SEC) rules and forms.
(B) | Management’s Annual Report on Internal Control over Financial Reporting |
Our Board of Directors and management are responsible for establishing and maintaining adequate internal control over financial reporting. Our internal control over financial reporting is designed to provide reasonable assurance regarding the preparation and fair presentation of published financial statements in accordance with International Financial Reporting Standards, or IFRS, as issued by the International Accounting Standards Board, the IASB.
Our internal control over financial reporting includes those policies and procedures that:
| | · | Pertain to the maintenance of records that, in reasonable detail, accurately and fairly reflect transactions and dispositions of assets; |
| | · | Provide reasonable assurance that transactions are recorded as necessary to permit preparation and fair presentation of financial statements, and our receipts and expenditures of the company are being made only in accordance with authorizations of our management; and |
| | · | Provide reasonable assurance regarding prevention or timely detection of unauthorized acquisition, use or disposition of our assets that could have a material effect on our financial statements. |
Because of its inherent limitations, internal control over financial reporting may not prevent or detect misstatements. Also, projections of any evaluation of effectiveness to future periods are subject to the risk that controls may become inadequate because of changes in conditions, or that the degree of compliance with the policies or procedures may deteriorate.
Our management assessed the effectiveness of our internal control over financial reporting as of December 31, 2008 based on the criteria set forth by the Committee of Sponsoring Organizations of the Treadway Commission (“COSO”), in Internal Control-Integrated Framework. Based on this assessment, management believes that, as of December 31, 2008, our internal control over financial reporting was effective. Our management also found no material weaknesses in our internal control over financial reporting and therefore no corrective actions were taken.
The effectiveness of our internal control over financial reporting as of December 31, 2008 has been audited by Medina, Zaldívar, Paredes & Asociados (member firm of Ernst & Young Global), our independent registered public accounting firm, as stated in their report included herein, and it has expressed an unqualified opinion on the effectiveness of our internal control over financial reporting as of December 31, 2008.
| By: | /s/ DIONISIO ROMERO P. | | By: | /s/ ALVARO CORREA |
| Name: | Dionisio Romero | | Name: | Alvaro Correa |
| Title: | Chief Executive Officer | | Title: | Chief Financial and Accounting Officer |
| | | |
| June 30, 2009 | | |
(C) | Attestation Report of the Registered Public Accounting Firm |
Report of Independent Registered Public Accounting Firm on Internal Control Over Financial Reporting
To the Shareholders and Board of Directors of Credicorp Ltd.
We have audited Credicorp Ltd. and Subsidiaries's (hereinafter “Credicorp”) internal control over financial reporting as of December 31, 2008, based on criteria established in Internal Control- Integrated Framework issued by the Committee of Sponsoring Organizations of the Treadway Commission (the COSO criteria). Credicorp's Management is responsible for maintaining effective internal control over financial reporting, and for its assessment of the effectiveness of internal control over financial reporting included in the accompanying Management’s Report on Internal Control Over Financial Reporting. Our responsibility is to express an opinion on Credicorp's internal control over financial reporting based on our audit.
We conducted our audit in accordance with the standards of the Public Company Accounting Oversight Board (United States of America). Those standards require that we plan and perform the audit to obtain reasonable assurance about whether effective internal control over financial reporting was maintained in all material respects. Our audit included obtaining an understanding of internal control over financial reporting, assessing the risk that a material weakness exists, testing and evaluating the design and operating effectiveness of internal control based on the assessed risk, and performing such other procedures as we considered necessary in the circumstances. We believe that our audit provides a reasonable basis for our opinion.
A company’s internal control over financial reporting is a process designed to provide reasonable assurance regarding the reliability of financial reporting and the preparation of financial statements for external purposes in accordance with generally accepted accounting principles. A company’s internal control over financial reporting includes those policies and procedures that (1) pertain to the maintenance of records that, in reasonable detail, accurately and fairly reflect the transactions and dispositions of the assets of the company; (2) provide reasonable assurance that transactions are recorded as necessary to permit preparation of financial statements in accordance with generally accepted accounting principles, and that receipts and expenditures of the company are being made only in accordance with authorizations of management and directors of the company; and (3) provide reasonable assurance regarding prevention or timely detection of unauthorized acquisition, use, or disposition of the company’s assets that could have a material effect on the financial statements.

Report of Independent Registered Public Accounting Firm on Internal Control Over Financial Reporting (continued)
Because of its inherent limitations, internal control over financial reporting may not prevent or detect misstatements. Also, projections of any evaluation of effectiveness to future periods are subject to the risk that controls may become inadequate because of change in conditions, or that the degree of compliance with the policies or procedures may deteriorate.
In our opinion, Credicorp maintained, in all material respects, effective internal control over financial reporting as of December 31, 2008, based on the COSO criteria.
We have also audited, in accordance with the standards of the Public Company Accounting Oversight Board (United States of America), the consolidated balance sheets of Credicorp Ltd and its Subsidiaries as of December 31, 2008 and 2007, and the related consolidated statements of income, shareholders’ equity and cash flows for each of the three years in the period ended December 31, 2008 and notes thereto; and our report dated June 25, 2009, expresses an unqualified opinion thereon.
| | | |
| Lima, Peru, | | |
| June 25, 2009 | | |
| | |  |
| | | |
| Countersigned by: | | |
| | | |
| | | |
 | | |
| Cristian Emmerich | | |
| C.P.C. Register Nº19-289 | | |
(D) | Changes in Internal Control over Financial Reporting |
During the period covered by this Annual Report, no changes were made to our internal controls over financial reporting that have materially affected, or are likely to materially affect, internal controls over financial reporting.
| ITEM 16A. | AUDIT COMMITTEE FINANCIAL EXPERT |
In its session held on March 31, 2009, our board of directors elected Germán Suárez, Reynaldo Llosa and Benedicto Cigüeñas as members of the Audit Committee. The Board elected Mr. Reynaldo Llosa as the Chairman, Mr. Suárez as the Audit Committee Financial Expert, as that term is defined in the instructions to Item 16A of Form 20-F, and Mr. Cigüeñas as a non-member advisor. Our Board of Directors also determined that Mr. Suárez is “independent” as defined in Rule 10A-3 under the Exchange Act and in Section 303A.02 of The NYSE Listed Company Manual. Mr. Suárez is an economist, and received his Masters degree in economics from Columbia University. Mr. Suárez became a director on March 31, 2005. Mr. Suárez was President and Chairman of the Board of Banco Central de Reserva del Perú from 1992 to 2001, and serves as director on the board of directors of various other companies, among which are Compañía de Minas Buenaventura S.A. and Refinería La Pampilla.
We have adopted a code of ethics (Código de Etica) that is applicable to our board of directors, including our chief executive officer, chief financial and accounting officer, and our other principal executive officers, as well as to all other employees. In addition, we have adopted a code of ethics for professionals with financial responsibility (Código de Etica Para Profesionales con Responsibilidad Financiera) applicable to employees with financial management responsibilities. Our code of ethics and code of ethics for professionals with financial responsibility are available on the corporate governance section of its web site at http://www.credicorpnet.com.
ITEM 16C. | PRINCIPAL ACCOUNTANT FEES AND SERVICES |
The following table sets forth for each of the years indicated the fees paid to our independent auditor, Medina, Zaldívar, Paredes & Asociados, members of Ernst & Young Global, for the audit of our financial statements for the years ended December 31, 2006, 2007 and 2008, respectively. The Audit Committee recommends the appointment of the independent auditor every fiscal year, and the auditor is appointed at the Annual General Shareholders’ Meeting.
At our Annual General Shareholder’s Meeting held on March 31, 2009, Medina, Zaldívar, Paredes y Asociados, members of Ernst & Young Global, were designated as our external auditors for a five-year period that begins in the financial year 2009. This designation was made in accordance with the proposal and recommendation of the Audit Committee and authorization by the Board of Directors. The Board has delegated the duty of approving auditor’s fees to the Audit Committee. The designation of our external auditors was made pursuant to an open tender in which KPMG, Deloitte, PricewaterhouseCoopers and Ernst & Young participated.
| | | | |
| | | 2006 | | | 2007 | | | 2008 | |
| | | (U.S. Dollars in thousands) | |
| | | | | | | | | | |
| Audit | | US$ | 1,779 | | | US$ | 2,264 | | | US$ | 2,005 | |
| Audit – Related | | | 61 | | | | - | | | | - | |
| Tax | | | 15 | | | | 28 | | | | 31 | |
| All Other | | | 29 | | | | 32 | | | | 203 | |
| Total | | US$ | 1,884 | | | US$ | 2,323 | | | US$ | 2,239 | |
Audit Fees correspond to audit services performed (i) in the review of our consolidated financial statements, (ii) to establish the procedures that the independent auditor needs to perform in order to form an opinion about our consolidated financial statements and (iii) to comply with the statutory requirements applicable to our subsidiaries. Audit fees also include expenses related to the audit work in connection to reviews of interim financial information. All fees were approved by the Audit Committee.
Audit-Related Fees relate to services that are similar to the execution of an audit or a review of our financial statements and which are traditionally performed by the independent auditor. Such audit-related services include assistance in the understanding of new accounting and financial rules established by regulatory entities, audit related procedures on accounting matters previously agreed with our management, and special audit reviews of internal control procedures. There were no audit-related fees during 2008.
Tax Fees relate to tax services, which include all services performed by our independent auditor’s tax personnel, except those services specifically related to the review of our financial statements. These services consisted principally of tax compliance and advisory services approved by our Audit Committee.
All Other Fees include mainly expenses related to derivative operations consultancy and training courses prepared by the independent auditors for the accounting and risk department of BCP.
Audit Committee Pre-Approval Policies and Procedures
Our Audit Committee must approve all of the services the independent auditors provide as part of its responsibility in supervising their work. There are two types of approvals. The Audit Committee grants a “general approval” in advance to a list of services that the independent auditor may provide without further approval required by the Audit Committee. A general approval is valid for 12 months from the date of approval unless the Audit Committee determines a different period of validity should apply. The Audit Committee also grants “specific approval” for services that do not have general approval on a case-by-case basis. All of the services that do not have general approval need specific approval from the Audit Committee before any agreement is signed with the independent auditor to provide such services. Any service that exceeds approved costs or budgets will need specific approval from the Audit Committee. When considering granting any type of approval, the Audit Committee considers whether the requested services are consistent with the SEC’s rules regarding the independence of the independent auditors.
Our Audit Committee supervises the execution of the independent audit services as necessary. It approves, when necessary, any modification in the terms, conditions, fees and extent of the audit services. The Audit Committee may give a general approval for other audit services where the independent auditor is in the best position to provide those services. Such services typically include: audit services required by regulations, financial audits for our subsidiaries or affiliates, and services associated with the presentation of documents to the SEC or other documents published in relation to the trading of our shares.
The Audit Committee may award a general approval to audit-related services if its members consider that these services do not negatively affect the integrity of the independent auditor and are consistent with the rules of the SEC.
Following the rules promulgated by the SEC, our Audit Committee requires that all tax services provided by the independent auditors be subject to its approval. The Audit Committee may grant a specific approval to other services provided by the independent auditor so long as they do not impair the integrity of the independent auditor and are allowed by rules issued by the SEC concerning auditor independence.
ITEM 16D. | EXEMPTIONS FROM THE LISTING STANDARDS FOR AUDIT COMMITTEES |
Not applicable.
ITEM 16E. | PURCHASES OF EQUITY SECURITIES BY THE ISSUER AND AFFILIATED PURCHASERS |
During 2008, we did not make any purchase of Credicorp shares for our own portfolio. Our affiliates, Prima AFP, Atlantic Security Bank, Credifondo and Credibolsa did make purchases in open-market transactions on behalf of our clients as part of their core businesses.
ITEM 16F. | CHANGE IN REGISTRANT’S CERTIFYING ACCOUNTANT |
Not applicable.
ITEM 16G. | CORPORATE GOVERNANCE |
The NYSE’s corporate governance rules, codified in Section 303A of the NYSE’s Listed Company Manual, apply, with certain limited exceptions, in full to companies listing common equity securities. Among the corporate governance issues addressed by Section 303A are the following:
• director independence;
• the role of non-management directors;
• nominating/corporate governance committee;
• compensation committees;
• audit committees;
• disclosure of corporate governance guidelines, including those in relation to (i) director qualification standards, (ii) director responsibilities, (iii) director access to management and, as necessary and appropriate, independent advisors, (iv) director compensation, (v) director orientation and continuing education, (vi) management succession and (vii) annual performance evaluation of the board of directors;
• code of business conduct and ethics for directors, officers and employees addressing, at a minimum, (i) conflicts of interest, (ii) corporate opportunities, (iii) confidentiality, (iv) fair dealing, (v) protection and proper use of company assets, (v) compliance with laws, rules and regulations (including insider trading laws) and (vi) encouraging the reporting of any illegal or unethical behavior;
• disclosure by foreign private issuers of differences between their corporate governance practices and those of U.S. domestic companies under NYSE’s listing standards;
• certification of compliance with the NYSE’s corporate governance standards and disclosure of violations of Section 303A; and
• NYSE actions resulting from violations of the NYSE’s listing standards.
Bermuda Law – Corporate Governance
We are a company incorporated under the laws of Bermuda and are subject to Bermuda laws related to corporate governance. Under Bermuda law, there are no requirements with respect to the independence of our Board of Directors, meetings of non-management directors, the establishment and composition of certain committees or the adoption and disclosure of corporate governance guidelines or codes of business conduct and ethics. Certain Bermuda common law and statutory provisions, however, relate to duties and obligations of a company and its directors that are similar to some of the duties and obligations arising from the provisions of Section 303A.
Fiduciary Duties and Duties of Skill and Care Under Bermuda Law
Under section 97(1) of the Companies Act 1981 of Bermuda, as amended (the “Companies Act”), every director and officer of a company must act honestly and in good faith with a view to the best interests of the company (often referred to as a “fiduciary duty”) and must exercise the care, diligence and skill that a reasonably prudent person would exercise in comparable circumstances (often referred to as a “duty of skill and care”).
Fiduciary Duty
Under the common law, the fiduciary duty of directors has four aspects which may be briefly summarized as follows:
• A duty to act honestly and in good faith. A director has a duty to act honestly and in good faith in what he considers are the best interests of the company and not for any collateral purpose. The courts allow the director wide discretion in determining this, interfering only if no reasonable director could have believed that a course of action was in the best interests of the company. However, a director acting honestly, but not in the best interests of the company, is in breach of such duty.
• A duty to exercise powers for a proper purpose. Directors must act within the powers set out in the company’s memorandum of association and bye-laws and exercise their powers in the company’s interests and for the purposes for which those powers were conferred. Even if the directors are acting in good faith in the interests of the company as a whole, they must still use their powers for the purposes for which they were intended. For example, in general directors are not allowed to exercise their powers in such a way as to prevent a majority of the members from exercising their rights.
• A duty to avoid conflicts of interest. A director must not put himself in a position where there is an actual or potential conflict between a personal interest and his duty to the company. However, a director may enter into a contract where a conflict of interest might arise if the bye-laws allow it or the company gives its approval in a general meeting. Our bye-laws do not prohibit a director from entering into a contract where a conflict of interest may arise, but they do prohibit a director from voting in respect of any contract or proposed contract or arrangement in which such director is interested or with which such director has a conflict of interest. In addition, section 97(4) of the Companies Act requires our directors and officers to disclose at the first opportunity any interest in a material contract, proposed material contract or person that is a party to a material contract or proposed material contract with us or any of our subsidiaries.
• A duty not to appropriate, divert or personally profit from corporate opportunities. Unless the bye-laws specifically provide otherwise, a director’s fiduciary position precludes him from appropriating, diverting or taking a personal profit from any opportunities that result from the directorship. Our bye-laws do provide an exception to this rule. They provide that any director, any director’s firm or partner or any company with whom any director is associated may act for us in a professional capacity, and such director, such director’s firm or partner or such company shall be entitled to remuneration for professional services as if such director were not a director, provided that a director, a director’s firm or partner or such company shall not act as our auditor.
Duty of Skill and Care
Under the common law, the duty of skill and care has three aspects which may be briefly summarized as follows:
• Degree of Skill. A director need not exhibit in the performance of his duties a greater degree of skill than may reasonably be expected from a person of like knowledge and experience.
A director is not expected to exercise a level of skill he does not have. The level of skill required of a director is subjective, in that the director is not expected, merely by virtue of the office, to possess any particular skills. Performance must be judged by the way the director applies any skills which he actually has. However, directors ought to acquire and maintain a sufficient knowledge and understanding of the company’s business to enable them to properly discharge their duties as directors.
• Attention to the Business. A director must diligently attend to the affairs of the company. In the performance of this duty, a director must at a minimum display the reasonable care an ordinary person would be expected to take in the same circumstances on his own behalf. Mere errors of judgment have been held not to breach the duty of skill and care. A director, as such, is not bound to give continuous attention to the affairs of the company, as his or her duties are of an intermittent nature.
• Reliance on Others. A director is not liable for the acts of co-directors or other company officers solely by virtue of the position. A director is entitled to rely on his co-directors or company officers as well as subordinates who are expressly put in charge of attending to the detail of management, provided such reliance is honest and reasonable (although a director cannot absolve himself entirely of responsibility by delegation to others). As a general rule, before delegating responsibility to others, the directors in question should satisfy themselves that the delegates have the requisite skills to discharge the functions delegated to them. In addition, the directors must ensure that there is set up an adequate system of monitoring such delegates (e.g., managers). The directors must, on a regular basis, ensure that their delegates have fulfilled their obligations. The directors should require a regular flow of information from the delegates to ensure that they are carrying out their duties satisfactorily. In addition, section 97(5A) of the Companies Act provides that a director shall not have breached the fiduciary duty or duty of skill and care required by section 97(1) if he relies in good faith upon financial statements of the company represented to him by another director or officer of the company or a report of an attorney, accountant, engineer, appraiser or other person whose profession lends credibility to a statement made by him.
Other Statutory Duties and Obligations
The Companies Act imposes certain specific duties and obligations on companies and directors, both directly and indirectly, including duties and obligations with respect to (i) loans to directors and related persons, (ii) limits on indemnities for directors and officers and (iii) the keeping of proper books of account.
Loans to Directors and Related Persons
It is not lawful for a company to make a loan or to enter into a guarantee or provide security in connection with a loan to a director or certain persons related to a director without the consent of the members of the company holding in the aggregate not less than 90% of the total voting rights of all the members having the right to vote at any meeting of the members of the company, except in certain specific circumstances.
Limits on Indemnity for Directors
Section 98 of the Companies Act provides generally that a Bermuda company may indemnify its directors, officers and auditors against any liability which by virtue of any rule of law would otherwise be imposed on them in respect of any negligence, default, breach of duty or breach of trust, except in cases where such liability arises from fraud or dishonesty of which such director, officer or auditor may be guilty in relation to the company or any of its subsidiaries. Any provision, whether contained in the bye-laws of a company, or in any contract or arrangement between the company and one of its directors, which would exempt such director from, or indemnify him against, any liability that would otherwise attach to him in respect of his fraud or dishonesty in relation to the company will be void. Section 98 further provides that a Bermuda company may indemnify its directors, officers and auditors against any liability incurred by them in defending any proceedings, whether civil or criminal, in which judgment is awarded in their favor or in which they are acquitted or granted relief by the Supreme Court of Bermuda pursuant to section 281 of the Companies Act. In the event that an allegation of fraud or dishonesty is made out, the director is obliged to disgorge any money provided for his defense.
Books of Account
It is the duty of the directors to cause to be kept proper books of account with respect to all sums of money received and expended by the company and the matters in respect of which the receipts and expenditures take place, all sales and purchases by the company, and the assets and liabilities of the company.
Peruvian Law – Corporate Governance
Although we are a holding company whose principal subsidiaries (BCP and PPS) are incorporated under and subject to the laws of Peru, we are registered in Peru as a foreign issuer and are consequently only subject to Peruvian regulations applicable to foreign issuers. There are no corporate governance provisions under Peruvian law applicable to us that are similar to the provisions of Section 303A.
PART III
ITEM 17. | FINANCIAL STATEMENTS |
Not applicable.
ITEM 18. | FINANCIAL STATEMENTS |
Credicorp Consolidated Financial Statements and the report of the independent public accounting firm in connection therewith are filed as part of this Annual Report on Form 20-F, as noted below:
| | | Page |
| Index to Credicorp Consolidated Financial Statements | | F-2 |
| Report of Medina, Zaldívar, Paredes & Asociados, members of Ernst & Young Global, Independent Public Accountants | | F-3 |
| Consolidated Balance Sheets as of December 31, 2008 and 2007 | | F-5 |
| Consolidated Statements of Income for the Three Years in the Period Ended December 31, 2008 | | F-6 |
| Consolidated Statements of Changes in Equity for the Three Years in the Period Ended December 31, 2008 | | F-8 |
| Consolidated Statements of Cash Flow for the Three Years in the Period Ended December 31, 2008 | | F-9 |
| Notes to Consolidated Financial Statements | | F-11 |
All supplementary schedules relating to the registrant are omitted because they are not required or because the required information, where material, is contained in the consolidated financial statements or notes thereto.
| (a) Index to Exhibits |
| | | |
| 1.1 | | Bye-laws of Credicorp Ltd., incorporated herein by reference to Exhibit 1.1 to Credicorp’s Annual Report on Form 20-F dated June 30, 2005 |
| | | |
| 1.2 | | Memorandum of Association of Credicorp Ltd., incorporated herein by reference to Exhibit 1.2 to Credicorp’s Annual Report on Form 20-F dated June 27, 2003 |
| | | |
| 8 | | List of Subsidiaries, incorporated herein by reference to Exhibit 8 to Credicorp’s Annual Report on Form 20-F dated June 27, 2003 |
| | | |
| 12.1 | | Certification by the Chief Executive Officer Pursuant to Section 302 of the U.S. Sarbanes-Oxley Act of 2002 |
| | | |
| 12.2 | | Certification by the Chief Financial and Accounting Officer Pursuant to Section 302 of the U.S. Sarbanes-Oxley Act of 2002 |
| | | |
| 13.1 | | Certification by the Chief Executive Officer Pursuant to Section 906 of the U.S. Sarbanes-Oxley Act of 2002 |
| | | |
| 13.2 | | Certification by the Chief Financial and Accounting Officer Pursuant to Section 906 of the U.S. Sarbanes-Oxley Act of 2002 |
SIGNATURES
The registrant hereby certifies that it meets all of the requirements for filing on Form 20-F and that it has duly caused and authorized the undersigned to sign this Annual Report on its behalf.
CREDICORP LTD.
| By: | /s/ ALVARO CORREA |
| Name: | Alvaro Correa |
| Title: | Chief Financial and Accounting Officer |
Dated: June 30, 2009
EXHIBIT INDEX
| 1.1 | | Bye-laws of Credicorp Ltd., incorporated herein by reference to Exhibit 1.1 to Credicorp’s Annual Report on Form 20-F dated June 30, 2005 |
| | | |
| 1.2 | | Memorandum of Association of Credicorp Ltd., incorporated herein by reference to Exhibit 1.2 to Credicorp’s Annual Report on Form 20-F dated June 27, 2003 |
| | | |
| 8 | | List of Subsidiaries, incorporated herein by reference to Exhibit 8 to Credicorp’s Annual Report on Form 20-F dated June 27, 2003 |
| | | |
| 12.1 | | Certification by the Chief Executive Officer Pursuant to Section 302 of the U.S. Sarbanes-Oxley Act of 2002 |
| | | |
| 12.2 | | Certification by the Chief Financial and Accounting Officer Pursuant to Section 302 of the U.S. Sarbanes-Oxley Act of 2002 |
| | | |
| 13.1 | | Certification by the Chief Executive Officer Pursuant to Section 906 of the U.S. Sarbanes-Oxley Act of 2002 |
| | | |
| 13.2 | | Certification by the Chief Financial and Accounting Officer Pursuant to Section 906 of the U.S. Sarbanes-Oxley Act of 2002 |
| | | |
| | Credicorp Ltd. and Subsidiaries | |
| | | |
| | Consolidated financial statements as of December 31, 2008 and 2007 together with the Report of Independent Registered Public Accounting Firm | |
| | | |
Credicorp Ltd. and Subsidiaries
Consolidated financial statements as of December 31, 2008 and 2007
Content
| Report of Independent Registered Public Accounting Firm | F-3 |
| Consolidated financial statements | |
| Consolidated balance sheets | F-5 |
| Consolidated statements of income | F-6 |
| Consolidated statements of changes in equity | F-8 |
| Consolidated statements of cash flows | F-9 |
| Notes to the consolidated financial statements | F-11 |
Report of Independent Registered Public Accounting Firm
To the shareholders and Board of Directors of Credicorp Ltd.
We have audited the accompanying consolidated balance sheets of Credicorp Ltd. and Subsidiaries as of December 31, 2008 and 2007, and the related consolidated statements of income, shareholders’ equity, and cash flows for each of the three years in the period ended December 31, 2008. These consolidated financial statements are the responsibility of the Company’s management. Our responsibility is to express an opinion on these consolidated financial statements based on our audits.
We conducted our audits in accordance with the standards of the Public Company Accounting Oversight Board (United States of America). Those standards require that we plan and perform the audit to obtain reasonable assurance about whether the consolidated financial statements are free of material misstatement. Our audits include examining, on a test basis, evidence supporting the amounts and disclosures in the financial statements. An audit also includes assessing the accounting principles used and significant estimates made by management, as well as evaluating the overall financial statement presentation. We believe that our audits provide a reasonable basis for our opinion.
In our opinion, the financial statements referred to above present fairly, in all material respects, the consolidated financial position of Credicorp Ltd. and Subsidiaries at December 31, 2008 and 2007, and the consolidated results of their operations and their cash flows for each of the three years in the period ended December 31, 2008 in conformity with International Financial Reporting Standards as issued by the International Accounting Standards Board.
Report of Independent Registered Public Accounting Firm (continued)
We have also audited, in accordance with the standards of the Public Company Accounting Oversight Board (United States of America), the effectiveness of Credicorp Ltd and subsidiaries’ internal control over financial reporting as of December 31, 2008, based on criteria established in Internal Control-Integrated Framework issued by the Committee of Sponsoring Organizations of the Treadway Commission and our report dated June 25, 2009, expressed an unqualified opinion thereon.
Countersigned by:
Cristian Emmerich
C.P.C. Register Nº19-289
Credicorp Ltd. and Subsidiaries
Consolidated balance sheets
As of December 31, 2008 and 2007
| | | Note | | | 2008 | | | 2007 | |
| | | | | | US$(000) | | | US$(000) | |
| | | | | | | | | | |
| Assets | | | | | | | | | |
| Cash and due from banks: | | 4 | | | | | | | |
| Non-interest bearing | | | | | | | 1,057,416 | | | | 620,918 | |
| Interest bearing | | | | | | | 2,708,755 | | | | 2,452,947 | |
| | | | | | | | 3,766,171 | | | | 3,073,865 | |
| | | | | | | | | | | | | |
| Investments: | | | | | | | | | | | | |
| Trading securities | | | | | | | 36,084 | | | | 50,995 | |
| Investments available-for-sale | | 5 | | | | 4,959,068 | | | | 5,228,641 | |
| | | | | | | | 4,995,152 | | | | 5,279,636 | |
| | | | | | | | | | | | | |
| Loans, net: | | 6 | | | | | | | | | |
| Loans, net of unearned income | | | | | | | 10,546,378 | | | | 8,250,819 | |
| Allowance for loan losses | | | | | | | (224,337 | ) | | | (211,319 | ) |
| | | | | | | | 10,322,041 | | | | 8,039,500 | |
| | | | | | | | | | | | | |
| Financial assets designated at fair value through profit or loss | | 7 | | | | 129,631 | | | | 213,153 | |
| Premiums and other policies receivable | | 8 | | | | 111,561 | | | | 85,495 | |
| Accounts receivable from reinsurers and coinsurers | | 8 | | | | 165,144 | | | | 116,141 | |
| Property, furniture and equipment, net | | 9 | | | | 329,458 | | | | 274,935 | |
| Due from customers on acceptances | | | | | | | 232,580 | | | | 35,901 | |
| Seized assets, net | | | | | | | 11,454 | | | | 19,615 | |
| Intangible assets and goodwill, net | | 10 | | | | 246,957 | | | | 227,272 | |
| Other assets | | 11 | | | | 510,920 | | | | 340,385 | |
| | | | | | | | | | | | | |
| Total assets | | | | | | | 20,821,069 | | | | 17,705,898 | |
| | | Note | | | 2008 | | | 2007 | |
| | | | | | US$(000) | | | US$(000) | |
| | | | | | | | | | |
| Liabilities and equity | | | | | | | | | |
| Deposits and obligations: | | 12 | | | | | | | |
| Non-interest bearing | | | | | | | 3,213,529 | | | | 2,926,308 | |
| Interest bearing | | | | | | | 10,736,908 | | | | 8,424,406 | |
| | | | | | | | 13,950,437 | | | | 11,350,714 | |
| Financial liabilities designated at fair value through profit or loss | | 7 | | | | - | | | | 50,561 | |
| Due to banks and correspondents | | 13(a) | | | | 1,179,991 | | | | 1,453,261 | |
| Bankers’ acceptances outstanding | | | | | | | 232,580 | | | | 35,901 | |
| Accounts payable to reinsurers and coinsurers | | 8 | | | | 55,841 | | | | 33,963 | |
| Technical reserves, insurance claims reserves and reserves for unearned premiums | | 14 | | | | 967,770 | | | | 803,478 | |
| Borrowed funds | | 13(b) | | | | 1,150,716 | | | | 870,404 | |
| Bonds and subordinated notes issued | | 15 | | | | 785,230 | | | | 702,298 | |
| Other liabilities | | 11 | | | | 702,399 | | | | 590,045 | |
| Total liabilities | | | | | | | 19,024,964 | | | | 15,890,625 | |
| Equity | | 16 | | | | | | | | | |
| Capital and reserves attributable to Credicorp’s equity holders: | | | | | | | | | | | | |
| Capital stock | | | | | | | 471,912 | | | | 471,912 | |
| Treasury stock | | | | | | | (73,107 | ) | | | (73,107 | ) |
| Capital surplus | | | | | | | 140,693 | | | | 140,693 | |
| Reserves | | | | | | | 815,387 | | | | 587,218 | |
| Other reserves | | | | | | | (45,393 | ) | | | 179,550 | |
| Retained earnings | | | | | | | 379,680 | | | | 369,743 | |
| | | | | | | | 1,689,172 | | | | 1,676,009 | |
| Minority interest | | | | | | | 106,933 | | | | 139,264 | |
| Total equity | | | | | | | 1,796,105 | | | | 1,815,273 | |
| Total liabilities and equity | | | | | | | 20,821,069 | | | | 17,705,898 | |
The accompanying notes are an integral part of these consolidated balance sheets.
Credicorp Ltd. and Subsidiaries
Consolidated statements of income
For the years ended December 31, 2008, 2007 and 2006
| | | Note | | | 2008 | | | 2007 | | | 2006 | |
| | | | | | US$(000) | | | US$(000) | | | US$(000) | |
| | | | | | | | | | | | | |
| Interest and dividend income | | 20 | | | | 1,400,334 | | | | 1,065,974 | | | | 782,002 | |
| Interest expense | | 20 | | | | (577,411 | ) | | | (432,000 | ) | | | (283,478 | ) |
| Net interest and dividend income | | | | | | | 822,923 | | | | 633,974 | | | | 498,524 | |
| | | | | | | | | | | | | | | | | |
| Provision for loan losses, net of recoveries | | 6(d) | | | | (48,760 | ) | | | (28,439 | ) | | | 4,243 | |
| Net interest and dividend income after provision for loan losses | | | | | | | 774,163 | | | | 605,535 | | | | 502,767 | |
| Other income | | | | | | | | | | | | | | | | |
| Banking services commissions | | 21 | | | | 394,247 | | | | 324,761 | | | | 243,778 | |
| Net gain on foreign exchange transactions | | | | | | | 108,709 | | | | 61,778 | | | | 41,638 | |
| Net gain on sale of securities | | | | | | | 51,936 | | | | 46,376 | | | | 27,281 | |
| Net gain on financial assets and liabilities designated at fair value through profit or loss | | 7(b) | | | | - | | | | 65,088 | | | | 3,521 | |
| Other | | 24 | | | | 37,672 | | | | 24,934 | | | | 22,676 | |
| Total other income | | | | | | | 592,564 | | | | 522,937 | | | | 338,894 | |
| | | | | | | | | | | | | | | | | |
| Insurance premiums and claims | | | | | | | | | | | | | | | | |
| Net premiums earned | | 22 | | | | 393,903 | | | | 297,272 | | | | 251,261 | |
| Net claims incurred for life, property and casualty and health insurance contracts | | 23 | | | | (341,910 | ) | | | (238,600 | ) | | | (186,522 | ) |
| Total premiums earned less claims | | | | | | | 51,993 | | | | 58,672 | | | | 64,739 | |
Consolidated statements of income (continued)
| | | Note | | | 2008 | | | 2007 | | | 2006 | |
| | | | | | US$(000) | | | US$(000) | | | US$(000) | |
| | | | | | | | | | | | | |
| Other expenses | | | | | | | | | | | | |
| Salaries and employees benefits | | | | | | (365,201 | ) | | | (409,037 | ) | | | (303,332 | ) |
| Administrative expenses | | | | | | (269,291 | ) | | | (206,966 | ) | | | (172,304 | ) |
| Net loss on financial assets and liabilities designated at fair value through profit or loss | | 7(b) | | | | (67,060 | ) | | | - | | | | - | |
| Depreciation and amortization | | 9(a) and 10(a) | | | | (57,369 | ) | | | (51,013 | ) | | | (50,317 | ) |
| Provision for seized assets | | | | | | | (1,067 | ) | | | (3,057 | ) | | | (6,387 | ) |
| Merger expenses | | | | | | | - | | | | - | | | | (5,706 | ) |
| Impairment loss on available-for-sale investments | | 5(c) | | | | (60,435 | ) | | | (5,017 | ) | | | - | |
| Other | | 24 | | | | (101,876 | ) | | | (71,999 | ) | | | (52,718 | ) |
| Total other expenses | | | | | | | (922,299 | ) | | | (747,089 | ) | | | (590,764 | ) |
| | | | | | | | | | | | | | | | | |
| Income before translation result and income tax | | | | | | | 496,421 | | | | 440,055 | | | | 315,636 | |
| | | | | | | | | | | | | | | | | |
| Translation result | | | | | | | (17,650 | ) | | | 34,627 | | | | 15,216 | |
| Income tax | | 17(b) | | | | (109,508 | ) | | | (102,287 | ) | | | (83,587 | ) |
| Net income | | | | | | | 369,263 | | | | 372,395 | | | | 247,265 | |
| | | | | | | | | | | | | | | | | |
| Attributable to: | | | | | | | | | | | | | | | | |
| Equityholders of Credicorp Ltd. | | | | | | | 357,756 | | | | 350,735 | | | | 230,013 | |
| Minority interest | | | | | | | 11,507 | | | | 21,660 | | | | 17,252 | |
| | | | | | | | 369,263 | | | | 372,395 | | | | 247,265 | |
| Basic and diluted earnings per share for net income attributable to equity holders of Credicorp Ltd. (in United States dollars) | | 25 | | | | 4.49 | | | | 4.40 | | | | 2.88 | |
The accompanying notes are an integral part of these consolidated financial statements.
Credicorp Ltd. and Subsidiaries
Consolidated statements of changes in equity
For the years ended December 31, 2008, 2007 and 2006
| | | Attributable to Credicorp´s equity holders | | | | | | | |
| | | Number of shares issued, note 25 | | | Capital stock | | | Treasury stock | | | Capital surplus | | | Reserves | | | Other reserves | | | Retained earnings | | | Total | | | Minority interest | | | Total net equity | |
| | | (In thousands of units) | | | US$(000) | | | US$(000) | | | US$(000) | | | US$(000) | | | US$(000) | | | US$(000) | | | US$(000) | | | US$(000) | | | US$(000) | |
| | | | | | | | | | | | | | | | | | | | | | | | | | | | | | | |
Balances as of January 1st, 2006 | | | 94,382 | | | | 471,912 | | | | (73,107 | ) | | | 140,693 | | | | 269,527 | | | | 83,302 | | | | 298,113 | | | | 1,190,440 | | | | 101,515 | | | | 1,291,955 | |
| Changes in equity for 2006 - | | | | | | | | | | | | | | | | | | | | | | | | | | | | | | | | | | | | | | | | |
| Net unrealized gain from investments available-for-sale, note 5(c) and 16(c) | | | - | | | | - | | | | - | | | | - | | | | - | | | | 69,411 | | | | - | | | | 69,411 | | | | 20,728 | | | | 90,139 | |
| Transfer of net realized gain from investments available-for-sale to the income statement, net of realized loss, note 5(c) and 16(c) | | | - | | | | - | | | | - | | | | - | | | | - | | | | (6,620 | ) | | | - | | | | (6,620 | ) | | | (379 | ) | | | (6,999 | ) |
| Net gain on cash flow hedge, note 16(c) | | | - | | | | - | | | | - | | | | - | | | | - | | | | 1,316 | | | | - | | | | 1,316 | | | | - | | | | 1,316 | |
| Income for the year recognized directly in equity | | | - | | | | - | | | | - | | | | - | | | | - | | | | 64,107 | | | | - | | | | 64,107 | | | | 20,349 | | | | 84,456 | |
| Net income | | | - | | | | - | | | | - | | | | - | | | | - | | | | - | | | | 230,013 | | | | 230,013 | | | | 17,252 | | | | 247,265 | |
| Total recognized income for the period | | | - | | | | - | | | | - | | | | - | | | | - | | | | 64,107 | | | | 230,013 | | | | 294,120 | | | | 37,601 | | | | 331,721 | |
| Transfer of retained earnings to reserves, note 16(c) | | | - | | | | - | | | | - | | | | - | | | | 210,375 | | | | - | | | | (210,375 | ) | | | - | | | | - | | | | - | |
| Cash dividends, note 16(d) | | | - | | | | - | | | | - | | | | - | | | | - | | | | - | | | | (87,738 | ) | | | (87,738 | ) | | | - | | | | (87,738 | ) |
| Dividends of subsidiaries and other | | | - | | | | - | | | | - | | | | - | | | | - | | | | - | | | | - | | | | - | | | | (2,170 | ) | | | (2,170 | ) |
| Balances as of December 31, 2006 carried forward | | | 94,382 | | | | 471,912 | | | | (73,107 | ) | | | 140,693 | | | | 479,902 | | | | 147,409 | | | | 230,013 | | | | 1,396,822 | | | | 136,946 | | | | 1,533,768 | |
| Changes in equity for 2007 - | | | | | | | | | | | | | | | | | | | | | | | | | | | | | | | | | | | | | | | | |
| Net unrealized gain from investments available-for-sale, note 5(c) and 16(c) | | | - | | | | - | | | | - | | | | - | | | | - | | | | 85,129 | | | | - | | | | 85,129 | | | | (426 | ) | | | 84,703 | |
| Transfer of net realized gain from investments available-for-sale to the income statement, net of realized loss, note 5(c) and 16(c) | | | - | | | | - | | | | - | | | | - | | | | - | | | | (12,617 | ) | | | - | | | | (12,617 | ) | | | - | | | | (12,617 | ) |
| Net loss on cash flow hedge, note 16(c) and 11(b)(ii) | | | - | | | | - | | | | - | | | | - | | | | - | | | | (40,371 | ) | | | - | | | | (40,371 | ) | | | - | | | | (40,371 | ) |
| Income for the year recognized directly in equity | | | - | | | | - | | | | - | | | | - | | | | - | | | | 32,141 | | | | - | | | | 32,141 | | | | (426 | ) | | | 31,715 | |
| Net income | | | - | | | | - | | | | - | | | | - | | | | - | | | | - | | | | 350,735 | | | | 350,735 | | | | 21,660 | | | | 372,395 | |
| Total recognized income for the period | | | - | | | | - | | | | - | | | | - | | | | - | | | | 32,141 | | | | 350,735 | | | | 382,876 | | | | 21,234 | | | | 404,110 | |
| Transfer of retained earnings to reserves, note 16(c) | | | - | | | | - | | | | - | | | | - | | | | 107,316 | | | | - | | | | (107,316 | ) | | | - | | | | - | | | | - | |
| Cash dividends, note 16(d) | | | - | | | | - | | | | - | | | | - | | | | - | | | | - | | | | (103,690 | ) | | | (103,690 | ) | | | - | | | | (103,690 | ) |
| Dividends of subsidiaries and other | | | - | | | | - | | | | - | | | | - | | | | - | | | | - | | | | 1 | | | | 1 | | | | (18,916 | ) | | | (18,915 | ) |
| Balances as of December 31, 2007 carried forward | | | 94,382 | | | | 471,912 | | | | (73,107 | ) | | | 140,693 | | | | 587,218 | | | | 179,550 | | | | 369,743 | | | | 1,676,009 | | | | 139,264 | | | | 1,815,273 | |
| | | | | | | | | | | | | | | | | | | | | | | | | | | | | | | | | | | | | | | | | |
| Changes in equity for 2008- | | | | | | | | | | | | | | | | | | | | | | | | | | | | | | | | | | | | | | | | |
| Net unrealized loss from investments available-for-sale, note 5(c) and 16(c) | | | - | | | | - | | | | - | | | | - | | | | - | | | | (164,302 | ) | | | - | | | | (164,302 | ) | | | (32,876 | ) | | | (197,178 | ) |
| Transfer of net realized gain from investments available-for-sale to the income statement, net of realized loss and impairment, note 5(c) and 16(c) | | | - | | | | - | | | | - | | | | - | | | | - | | | | 20,048 | | | | - | | | | 20,048 | | | | - | | | | 20,048 | |
| Net loss on cash flow hedge, note 16(c) and 11(b)(ii) | | | - | | | | - | | | | - | | | | - | | | | - | | | | (80,689 | ) | | | - | | | | (80,689 | ) | | | (604 | ) | | | (81,293 | ) |
| Net loss for the year recognized directly in equity | | | - | | | | - | | | | - | | | | - | | | | - | | | | (224,943 | ) | | | - | | | | (224,943 | ) | | | (33,480 | ) | | | (258,423 | ) |
| Net income | | | - | | | | - | | | | - | | | | - | | | | - | | | | - | | | | 357,756 | | | | 357,756 | | | | 11,507 | | | | 369,263 | |
| Total recognized income for the period | | | - | | | | - | | | | - | | | | - | | | | - | | | | (224,943 | ) | | | 357,756 | | | | 132,813 | | | | (21,973 | ) | | | 110,840 | |
| Transfers of retained earnings to reserves, note 16(c) | | | - | | | | - | | | | - | | | | - | | | | 228,169 | | | | - | | | | (228,169 | ) | | | - | | | | - | | | | - | |
| Cash dividends, note 16(d) | | | - | | | | - | | | | - | | | | - | | | | - | | | | - | | | | (119,648 | ) | | | (119,648 | ) | | | - | | | | (119,648 | ) |
| Dividends of subsidiaries and other | | | - | | | | - | | | | - | | | | - | | | | - | | | | - | | | | (2 | ) | | | (2 | ) | | | (10,358 | ) | | | (10,360 | ) |
| Balances as of December 31, 2008 | | | 94,382 | | | | 471,912 | | | | (73,107 | ) | | | 140,693 | | | | 815,387 | | | | (45,393 | ) | | | 379,680 | | | | 1,689,172 | | | | 106,933 | | | | 1,796,105 | |
The accompanying notes are an integral part of these consolidated financial statements.
Credicorp Ltd. and Subsidiaries
Consolidated statements of cash flows
For the years ended December 2008, 2007 and 2006
| | | 2008 | | | 2007 | | | 2006 | |
| | | US$(000) | | | US$(000) | | | US$(000) | |
| | | | | | | | | | |
| Cash flows from operating activities | | | | | | | | | |
| Net income | | | 369,263 | | | | 372,395 | | | | 247,265 | |
| Add (deduct) | | | | | | | | | | | | |
| Provision (recoveries) for loan losses | | | 48,760 | | | | 28,439 | | | | (4,243 | ) |
| Depreciation and amortization | | | 57,369 | | | | 51,013 | | | | 50,317 | |
| Provision for seized assets | | | 1,067 | | | | 3,057 | | | | 6,387 | |
| Provision for sundry risks, note 24 | | | 37,549 | | | | 8,096 | | | | 6,461 | |
| Deferred income tax, note 17(b) | | | (4,394 | ) | | | (14,921 | ) | | | (4,786 | ) |
| Net gain on sales of securities available-for-sale | | | (51,936 | ) | | | (46,376 | ) | | | (27,281 | ) |
| Impairment loss on available-for-sale investments | | | 60,435 | | | | 5,017 | | | | - | |
| Net loss (gain) on financial assets and liabilities designated at fair value through profit and loss | | | 67,060 | | | | (65,088 | ) | | | (3,521 | ) |
| Gain on sales of property, furniture and equipment | | | (979 | ) | | | (42 | ) | | | (169 | ) |
| Translation result | | | 17,650 | | | | (34,627 | ) | | | (15,216 | ) |
| Purchase (sale) of trading securities, net | | | 14,911 | | | | (5,859 | ) | | | 15,649 | |
| Net changes in assets and liabilities: | | | | | | | | | | | | |
| Increase in loans | | | (2,339,675 | ) | | | (2,172,418 | ) | | | (871,970 | ) |
| Increase in other assets | | | (463,273 | ) | | | (404,175 | ) | | | (100,570 | ) |
| Increase in deposits and obligations | | | 2,614,020 | | | | 2,269,568 | | | | 1,632,960 | |
| (Decrease) increase in due to banks and correspondents | | | (274,714 | ) | | | 875,447 | | | | (455,381 | ) |
| Increase in other liabilities | | | 299,106 | | | | 470,963 | | | | 114,717 | |
| Net cash provided by operating activities | | | 452,219 | | | | 1,340,489 | | | | 590,619 | |
| | | | | | | | | | | | | |
| Cash flows from investing activities | | | | | | | | | | | | |
| Acquisition of subsidiaries net of cash received, note 2 | | | - | | | | - | | | | (140,085 | ) |
| Net sale (purchase) of investments available-for-sale | | | 125,416 | | | | (1,541,621 | ) | | | (433,702 | ) |
| Purchase of property, furniture and equipment | | | (91,353 | ) | | | (53,901 | ) | | | (43,973 | ) |
| Sales of property, furniture and equipment | | | 1,775 | | | | 951 | | | | 7,546 | |
| Net cash provided (used in) investing activities | | | 35,838 | | | | (1,594,571 | ) | | | (610,214 | ) |
Consolidated statements of cash flow (continued)
| | | 2008 | | | 2007 | | | 2006 | |
| | | US$(000) | | | US$(000) | | | US$(000) | |
| | | | | | | | | | |
| Cash flows from financing activities | | | | | | | | | |
| Issuance of bonds and subordinated debt | | | 257,509 | | | | 256,014 | | | | 167,247 | |
| Redemption of bonds and subordinated debt | | | (190,402 | ) | | | (75,728 | ) | | | (91,925 | ) |
| Increase in borrowed funds | | | 300,000 | | | | 499,792 | | | | 90,612 | |
| Payments of borrowed funds | | | (19,688 | ) | | | - | | | | - | |
| Cash dividends | | | (119,648 | ) | | | (103,690 | ) | | | (87,738 | ) |
| Net cash provided by financing activities | | | 227,771 | | | | 576,388 | | | | 78,196 | |
| Translation (loss) gain on cash and cash equivalents | | | (23,522 | ) | | | 18,029 | | | | 14,114 | |
| | | | | | | | | | | | | |
| Net increase in cash and cash equivalents | | | 692,306 | | | | 340,335 | | | | 72,715 | |
| | | | | | | | | | | | | |
| Cash and cash equivalents at the beginning of the year | | | 3,073,865 | | | | 2,733,530 | | | | 2,660,815 | |
| | | | | | | | | | | | | |
| Cash and cash equivalents at the end of the year | | | 3,766,171 | | | | 3,073,865 | | | | 2,733,530 | |
| | | | | | | | | | | | | |
| Supplementary cash flows information: | | | | | | | | | | | | |
| Cash paid during the year for - | | | | | | | | | | | | |
| Interest | | | 549,655 | | | | 415,157 | | | | 265,838 | |
| Income tax | | | 124,754 | | | | 86,754 | | | | 96,284 | |
| Cash received during the year for - | | | | | | | | | | | | |
| Interest | | | 1,378,633 | | | | 1,106,972 | | | | 810,266 | |
The accompanying notes are an integral part of these consolidated financial statements.
Credicorp Ltd. and Subsidiaries
Notes to the consolidated financial statements
As of December 31, 2008 and 2007
Credicorp Ltd. (hereinafter “Credicorp” or “the Group”) is a limited liability company incorporated in Bermuda in 1995 to act as a holding company and to coordinate the policies and administration of its subsidiaries. It is also engaged in investing activities.
Credicorp Ltd., through its banking and non-banking subsidiaries, provides a wide range of financial services and products throughout Peru and in certain international markets. Its major subsidiary is Banco de Crédito del Perú (hereinafter “BCP” or the “Bank”), a Peruvian universal bank. Credicorp’s address is Clarendon House 2 Church Street Hamilton, Bermuda; likewise, administration offices of its representative in Peru are located in Calle Centenario Nº156, La Molina, Lima, Peru.
Credicorp is listed in Lima and New York stock exchanges.
The consolidated financial statements as of and for the year ended December 31, 2007 were approved in the General Shareholders’ Meeting dated on March, 28, 2008. The accompanying consolidated financial statements as of and for the year ended December 31, 2008, were approved by the Board of Directors Meeting of February 27, 2009 and by the General Shareholders’ Meeting of March 31, 2009, without modifications.
| 2. | Acquisition of AFP Unión Vida S.A. |
On August 24, 2006, Credicorp, through its subsidiary Prima AFP, acquired for approximately US$141.5 million AFP Unión Vida S.A. (a private pension fund management company operating in Peru) from Grupo Santander Perú S.A.
At the General Shareholder’s Meeting of Prima AFP, held on September 6, 2006, the merger with AFP Unión Vida S.A. was approved, with effective date December 1, 2006.
Notes to the consolidated financial statements (continued)
The acquisition of AFP Unión Vida S.A. was recorded using the purchase method, as required by IFRS 3, “Business Combinations”. Assets and liabilities were recorded at their estimated market values at the acquisition date, including the identified intangible assets acquired. Book value and fair values of the identified assets and liabilities at their acquisition date were as follows:
| | | Book value of the entity acquired | | | Fair value recognition | | | Fair value of the entity acquired | |
| | | US$(000) | | | US$(000) | | | US$(000) | |
| | | | | | | | | | |
| Assets - | | | | | | | | | |
| Cash and cash equivalents | | | 1,428 | | | | - | | | | 1,428 | |
| Restricted mutual fund | | | 32,265 | | | | - | | | | 32,265 | |
| Client relationships, note 10(a) | | | - | | | | 88,378 | | | | 88,378 | |
| Other Intangibles | | | 3,424 | | | | 9,603 | | | | 13,027 | |
| Property, furniture and equipment | | | 2,060 | | | | - | | | | 2,060 | |
| Goodwill | | | - | | | | 49,047 | | | | 49,047 | |
| Other assets | | | 5,605 | | | | - | | | | 5,605 | |
| | | | | | | | | | | | | |
| Liabilities - | | | | | | | | | | | | |
| Trade accounts payable | | | 4,688 | | | | - | | | | 4,688 | |
| Other accounts payable | | | 5,352 | | | | - | | | | 5,352 | |
| Other liabilities | | | 7,433 | | | | 32,824 | | | | 40,257 | |
| Net acquired assets | | | 27,309 | | | | 114,204 | | | | 141,513 | |
On January 2007, the arbitration proceeding between Credicorp and Grupo Santander Peru S.A. ended; as a result Credicorp received a reimbursement of approximately US$4.5 million, which was recorded as a reduction of goodwill, note 10(b).
| 3. | Significant accounting policies |
Significant accounting principles used in the preparation of Credicorp’s consolidated financial statements are set out below and were consistently applied to all of the years presented, unless otherwise stated.
| (a) | Basis of presentation and use of estimates - - |
The consolidated financial statements were prepared in accordance with International Financial Reporting Standards (IFRS) as issued by the International Accounting Standards Board (IASB). The consolidated financial statements were prepared on a historical cost basis, except for available-for-sale investments, derivative financial instruments, the share based compensation and financial assets and financial liabilities designated at fair value through profit or loss, which were measured at fair value. The consolidated financial statements are presented in United States dollar (US$), and all values are rounded to the nearest US$ thousand, except when otherwise indicated.
Notes to the consolidated financial statements (continued)
The preparation of the consolidated financial statements in conformity with IFRS requires Management to make estimates and assumptions that affect the reported amounts of assets, liabilities, revenues and expenses and the disclosure of significant events in notes to the consolidated financial statements.
Estimates and judgments are continually evaluated and are based on historical experience and other factors, including expectations of future events that are believed to be reasonable under the current circumstances. Actual results could differ from those estimates. The most significant estimates comprised in the accompanying consolidated financial statements are related to the computation of the allowance for loan losses, the measurement of financial instruments, the technical reserves for claims and premiums, the provision for seized assets and the valuation of derivatives. The accounting criteria used for each of these items are described in this note.
The accounting policies adopted are consistent with those of the previous year, except that the Group has adopted those new IFRS and revised IAS mandatory for years beginning on or after January 1, 2008. The adoption of the new and revised standards did not have a significant effect on the accompanying consolidated financial statements; therefore, it has not been necessary to amend the comparative figures. In summary:
| - | IAS 39, “Financial Instruments: Recognition and Measurement” and IFRS 7, “Financial Instruments: Disclosures” – “Reclassification of Financial Assets” (Amendment). This amendment allows reclassifications of certain financial instruments out of held for trading and available for sale categories since July 1, 2008. Due to the fact that Credicorp did not reclassify any of its financial instruments, this standard does not have any impact on the Group’s consolidated financial statements. |
| - | IFRIC 11, IFRS 2 – “Group and Treasury Share Transactions”, this interpretation requirements arrangements whereby an employee is granted rights to an entity´s equity instruments to be accounted for as an equity-settled scheme, even if the entity buys the instruments from another party, or the shareholders provide the equity instruments needed. The Group has no transactions to be considered under this interpretation. |
| - | IFRIC 12, “Service Concession Arrangements”, this interpretation applies to service concession operators and explains how to account for the obligations undertaken and rights received in service concession arrangements. No member of the Group is an operator and, therefore, this interpretation has no impact on the Group. |
| | | |
| - | IFRIC 14 - IAS 19, “The Limit on a Defined Benefit Asset, Minimum Funding Requirements and their Interaction”, addresses how to assess the limit, under IAS 19 “Employee Benefits”, on the amount of the surplus that can be recognized as an asset particularly when a minimum funding requirement exists. This standard does not have any impact on the Group’s consolidated financial statements. |
Notes to the consolidated financial statements (continued)
Subsidiaries are all entities (including special purpose entities) in which the Group has the power to govern their financial and operating policies. This situation is generally evidenced by controlling more than one half of the voting rights.
Subsidiaries are fully consolidated from the date on which effective control is transferred to the Group and are no longer consolidated from the date control ceases. The consolidated financial statements include the assets, liabilities, income and expenses of Credicorp and its Subsidiaries. Transactions between the Group’s entities, including balances, gains or losses are eliminated.
Acquisition of a subsidiary is recorded using the purchase method of accounting. The cost of an acquisition is measured as the fair value of the assets received, equity instruments issued and liabilities incurred or assumed at the date of acquisition, plus directly attributable cost. The excess of the cost of acquisition over the fair value of the Group’s share of the identifiable net assets and intangible assets acquired is recorded as goodwill.
Assets in custody or managed by the Group, such as investment funds and private pension funds (AFP funds), are not part of the consolidated financial statement of the Group, note 3(z).
Net equity and net income attributable to the minority interest are shown separately on the consolidated balance sheets and the consolidated statements of income, respectively.
Associates:
An associate is an entity over which the Group has significant influence but not control. Investments in these entities represent shareholding between 20 and 50 percent of the voting rights; and are recognized initially at cost and then are accounted for by the “equity method”. The Group does not have significant investments in associates; therefore, they are included in the caption “Other assets” in the consolidated balance sheets; gains resulting from the use of the equity method of accounting are included in the caption “Other income” of the consolidated income statement.
Minority interest:
Transactions with minority interests are treated as transactions with third parties. Disposals of minority interests result in gains or losses which are recorded in the consolidated income statement. Purchases from minority interests result in goodwill, which is the difference between any consideration paid and the carrying value of the subsidiary’s net assets.
Notes to the consolidated financial statements (continued)
As of December 31, 2008 and 2007, the following entities comprise the Group (individual financial statements data is presented in accordance with IFRS and before eliminations for consolidation purposes, except for the elimination of Credicorp´s treasury stock and its related dividends):
| Entity | | Percentage of participation (direct and indirect) | | | Assets | | | Liabilities | | | Equity | | | Net income (loss) | |
| | | 2008 | | | 2007 | | | 2008 | | | 2007 | | | 2008 | | | 2007 | | | 2008 | | | 2007 | | | 2008 | | | 2007 | |
| | | % | | | % | | | US$(000) | | | US$(000) | | | US$(000) | | | US$(000) | | | US$(000) | | | US$(000) | | | US$(000) | | | US$(000) | |
| | | | | | | | | | | | | | | | | | | | | | | | | | | | | | | |
| Banco de Crédito del Perú and Subsidiaries (i) | | | 97.41 | | | | 97.33 | | | | 18,514,133 | | | | 15,171,338 | | | | 17,112,683 | | | | 14,038,774 | | | | 1,401,450 | | | | 1,132,564 | | | | 423,529 | | | | 331,652 | |
| Atlantic Security Holding Corporation and Subsidiaries (ii) | | | 100.00 | | | | 100.00 | | | | 1,453,915 | | | | 1,738,697 | | | | 1,360,471 | | | | 1,401,237 | | | | 93,444 | | | | 337,460 | | | | (50,395 | ) | | | 20,537 | |
| El Pacífico Peruano-Suiza Compañía de Seguros y Reaseguros and Subsidiaries (iii) | | | 75.74 | | | | 75.74 | | | | 1,307,547 | | | | 1,197,943 | | | | 1,155,405 | | | | 932,765 | | | | 152,142 | | | | 265,178 | | | | (20,994 | ) | | | 21,979 | |
| Grupo Crédito S.A. and Subsidiaries (iv) | | | 100.00 | | | | 100.00 | | | | 335,854 | | | | 389,577 | | | | 101,748 | | | | 125,089 | | | | 234,106 | | | | 264,488 | | | | 18,271 | | | | 7,662 | |
| CCR Inc. (v) | | | 99.99 | | | | 99.99 | | | | 1,152,336 | | | | 879,997 | | | | 1,247,465 | | | | 917,655 | | | | (95,129 | ) | | | (37,658 | ) | | | 138 | | | | (4 | ) |
| Credicorp Securities Inc. (vi) | | | 99.99 | | | | 99.99 | | | | 2,851 | | | | 2,047 | | | | 470 | | | | 215 | | | | 2,381 | | | | 1,832 | | | | 549 | | | | 347 | |
| (i) | Banco de Crédito (BCP) is a universal bank incorporated in Peru in 1889. Its activities are supervised by the Superintendence of Banking, Insurance and AFP (the Peruvian banking, insurance and AFP authority, hereafter the SBS for its Spanish acronym). During 2008 and 2007, Credicorp acquired 0.08 percent and 0.09 percent of BCP shares, respectively, owned by minority interest. |
| (ii) | Atlantic Security Holding Corporation (ASHC) is incorporated in the Cayman Islands; its main activity is to invest in capital stock. Its most significant subsidiary is Atlantic Security Bank (ASB), which is incorporated in the Cayman Islands, began operations on December 1981, and operates through branches and offices in Grand Cayman and the Republic of Panama; its main activity is private and institutional banking services and trustee administration. |
| (iii) | El Pacífico Peruano-Suiza Compañía de Seguros y Reaseguros (PPS) is incorporated in Peru, provides property, casualty, life, health and personal insurance. Its main subsidiaries are El Pacífico Vida Compañía de Seguros y Reaseguros S.A. and Pacífico S.A. Entidad Prestadora de Salud (EPS), holding 61.99 percent and 100.00 percent, respectively, of their capital stock. PPS and its subsidiaries activities are supervised by the SBS. |
| (iv) | Grupo Crédito S.A. is incorporated in Peru, its main activity is to invest in listed and not listed securities in Peru. Its main subsidiary is Prima AFP, a private pension fund administrator incorporated on March, 2005, whose activities are supervised by the SBS. As of December 31, 2008, Prima AFP total assets, liabilities and net income amounted to US$225.6, US$96.3, and U$11.2 million, respectively (US$246.4 million, US$116.8 million and US$3.0 million, respectively, as of December 31, 2007). |
| (v) | CCR Inc., is a special purposes entity incorporated in Bahamas in 2001, whose main activity is to manage certain loans granted to BCP by foreign financial entities, note 13(b). These loans are collateralized by transactions performed by BCP. As of December 31, 2008 and 2007, the negative equity is generated by unrealized losses of cash flow hedge derivatives, as it is explained in note 16(c) and 11(b)(ii). |
| (vi) | Credicorp Securities Inc., is incorporated in the United States of America and began operations on January, 2003; it provides securities brokerage services mainly to retail customers in Latin America. |
Notes to the consolidated financial statements (continued)
| (c) | Foreign currency translation - |
The Group considers that its functional and presentation currency is the United States Dollar (U.S. Dollar or US$), because it reflects the economic substance of the underlying events and circumstances relevant to the Group; insofar as its main operations and/or transactions in the different countries where the Group operates; such as: loans granted, financing obtained, sale of insurance premiums, interest income and expense, and that an important percentage of wages and purchases are established and settled in U.S. Dollars.
Financial statements of each of Credicorp’s subsidiaries are measured using the currency of the country in which each entity operates and are translated into U.S. Dollars (functional and presentation currency) as follows:
| - | Monetary assets and liabilities are translated at the free market exchange rate at the date of the consolidated balance sheet. |
| - | Non-monetary accounts are translated at the free market exchange rate prevailing at the transaction date. |
| - | Income and expenses, except for those related to non-monetary assets which are translated at the free market exchange rate prevailing at the transaction date, are translated monthly at the average monthly exchange rate. |
All resulting translation differences are recognized in the consolidated income statement.
| (d) | Income and expense recognition from banking activities - |
Interest income and expense for all interest-bearing financial instruments, including those related to financial instruments classified as held for trading or designated at fair value through profit or loss, are recognized within “Interest and dividend income” and “Interest expense” in the consolidated income statement using the effective interest rate, which is the rate that discounts estimated future cash payments or receipts through the expected life of the financial instrument or a shorter period, where appropriate, to the net carrying amount of the financial asset or financial liability.
Interest income is suspended when collection of loans become doubtful, i.e. when loans are overdue more than 90 days or when the borrower or securities’ issuer defaults, if earlier than 90 days; such income is excluded from interest income until collected. Uncollected income on such loans is reversed against income. When Management determines that the debtor’s financial condition has improved, the recording of interest thereon is reestablished on an accrual basis.
Interest income includes coupons earned on fixed income investment and trading securities and the accrued discount and premium on financial instruments. Dividends are recognized as income when they are declared.
Notes to the consolidated financial statements (continued)
Fees and commission income are recognized on an accrual basis when earned. Contingent credit fees for loans that are likely to be drawn down and other credit related fees are deferred (together with any direct incremental costs) and recognized as an adjustment to the effective interest rate on the loan.
All other revenues and expenses are recognized on an accrual basis.
| (e) | Insurance activities - |
Product classification:
Insurance contracts are those contracts when the Group (the insurer) has accepted significant insurance risk from another party (the policyholders) by agreeing to compensate the policyholders if a specified uncertain future event (the insured event) adversely affects the policyholders. This definition also includes reinsurance contracts that the Group holds. As a general guideline, the Group determines whether it has significant insurance risk, by comparing benefits paid with benefits payable if the insured event did not occur. Insurance contracts can also transfer financial risk.
Once a contract has been classified as an insurance contract, it remains an insurance contract for the remainder of its lifetime, even if the insurance risk reduces significantly during this period, unless all rights and obligations are extinguished or expire. Investment contracts can however be reclassified as insurance contracts after inception if insurance risk becomes significant.
Reinsurance:
The Group cedes insurance risk in the normal course of business for all of its businesses. Reinsurance assets represent balances due from reinsurance companies. Amounts recoverable from reinsurers are estimated in a manner consistent with the outstanding claims provision or settled claims associated with the reinsurer’s policies and are in accordance with the related reinsurance contract.
Reinsurance assets are reviewed for impairment at each reporting date or more frequently when an indication of impairment arises during the reporting year. Impairment occurs when there is objective evidence as a result of an event that occurred after initial recognition of the reinsurance asset that the Group may not receive all outstanding amounts due under the terms of the contract and the event has a reliably measureable impact on the amounts that the Group will receive from the reinsurer. The impairment loss is recorded in the consolidated income statement.
Gains or losses on buying reinsurance are recognized in the consolidated income statement immediately at the date of purchase and are not amortized.
Ceded reinsurance arrangements do not relieve the Group from its obligations to policyholders.
The Group also assumes reinsurance risk in the normal course of business for non-life insurance contracts when applicable. Premiums and claims on assumed reinsurance are recognized as revenue or expenses in the same manner as they would be if the reinsurance were considered direct business, taking into account the product classification of the reinsured business.
Notes to the consolidated financial statements (continued)
Reinsurance liabilities represent balances due to reinsurance companies. Amounts payable are estimated in a manner consistent with the related reinsurance contract.
Premiums and claims are presented on a gross basis for both ceded and assumed reinsurance.
Reinsurance assets or liabilities are derecognized when the contractual rights are extinguished or expire or when the contract is transferred to another party.
Reinsurance contracts that do not transfer significant insurance risk are accounted for directly through the consolidated balance sheet. These are deposit assets or financial liabilities that are recognized based on the consideration paid or received less any explicit identified premiums or fees to be retained by the reinsured. Investment income on these contracts is accounted for using the effective interest rate method when accrued.
Deferred acquisition costs (DAC):
Those direct and indirect costs incurred during the financial period arising from the writing or renewing of insurance contracts, are deferred to the extent that these costs are recoverable out of future premiums. All other acquisition costs are recognized as an expense when incurred.
Subsequent to initial recognition, these costs are amortized on a straight line basis based on the term of expected future premiums, which typically varies between 5 and 11 years for life insurance contracts and is normally 1 year for non-life insurance contracts. Amortization is recorded in the consolidated income statement.
Changes in the expected useful life or the expected pattern of consumption of future economic benefits embodied in the asset are accounted for by changing the amortization period and are treated as a change in an accounting estimate.
An impairment review is performed at each reporting date or more frequently when an indication of impairment arises. When the recoverable amounts is less than the carrying value an impairment loss is recognized in the consolidated income statement. DAC is also considered in the liability adequacy test for each reporting period.
DAC are derecognized when the related contracts are either settled or disposed of.
Reinsurance commissions:
Commissions receivable on outwards reinsurance contracts are deferred and amortized on a straight line basis over the term of the expected premiums payable.
Notes to the consolidated financial statements (continued)
Insurance contract liabilities:
| (i) | Life insurance contracts liabilities |
Life insurance liabilities are recognized when contracts are entered into and premiums are charged. These liabilities are measured by using the net premium method. The liability is determined as the sum of the discounted value of the expected future benefits, claims handling and policy administration expenses, policyholder options and guarantees and investment income from assets backing such liabilities, which are directly related to the contract, less the discounted value of the expected theoretical premiums that would be required to meet the future cash outflows based on the valuation assumptions used. The liability is either based on current assumptions or calculated using the assumptions established at the time the contract was issued, in which case a margin for risk and adverse deviation is generally included. A separate reserve for longevity may be established and included in the measurement of the liability. Furthermore, the liability for life insurance contracts comprises the provision for unearned premiums and unexpired risks, as well as for claims outstanding, which includes an estimate of the incurred claims that have not yet been reported to the Group. Adjustments to the liabilities at each reporting date are recorded in the consolidated income statement. Profits originated from margins of adverse deviations on run-off contracts, are recognized in the consolidated income statement over the life of the contract, whereas losses are fully recognized in the consolidated income statement during the first year of run-off. The liability is derecognized when the contract expires, is discharged or is cancelled.
At each reporting date, an assessment is made of whether the recognized life insurance liabilities are adequate, net of related DAC, by using an existing liability adequacy test as laid out under IFRS 4.
| (ii) | Non-life insurance (which comprises general insurance and healthcare) contract liabilities |
Non-life insurance contract liabilities are recognized when contracts are entered into and premiums are charged. These liabilities are known as the outstanding claims provision, which are based on the estimated ultimate cost of all claims incurred but not settled at the consolidated balance sheet date, whether reported or not, together with related claims handling costs and reduction for the expected value of salvage and other recoveries. Delays can be experienced in the notification and settlement of certain types of claims, therefore the ultimate cost of these cannot be known with certainty at the consolidated balance sheet date. Incurred but non-reported claims (hereafter “IBNR”) are estimated and included in the provision (liabilities). IBNR reserves as of December 31, 2008 and 2007, were determined on the basis of the Bornhuetter - Ferguson methodology – BF (a generally accepted actuarial method), which considers a statistical analysis of the recorded loss history, the use of projection methods and, when appropriate, qualitative factors that reflect present conditions or trends that could affect historical data. No provision for equalization or catastrophe reserves is recognized. The liabilities are derecognized when the contract expires, is discharged or is cancelled.
The provision for unearned premiums represents premiums received for risks that have not yet expired. Generally the reserve is released over the term of the contract and is recognized as premium income.
Notes to the consolidated financial statements (continued)
At each reporting date the Group reviews its unexpired risk and a liability adequacy test is performed as laid out under IFRS 4 to determine whether there is any overall excess of expected claims and DAC over unearned premiums. This calculation uses current estimates of future contractual cash flows after taking account of the investment return expected to arise on assets relating to the relevant nonlife insurance technical provisions. If these estimates show that the carrying amount of the unearned premiums (less related deferred acquisition costs) is inadequate the deficiency is recognized in the consolidated income statement by setting up a provision for liability adequacy.
Income recognition:
Gross recurring premiums on life contracts are recognized as revenue when payable by the policyholder. For single premium business revenue is recognized on the date on which the policy is effective.
Gross general insurance written premiums comprise the total premiums receivable for the whole period of cover provided by contracts entered into during the accounting period and are recognized on the date on which the policy incepts. Premiums include any adjustments arising in the accounting period for premiums receivable in respect of business written in prior accounting periods.
Unearned premiums are those proportions of premiums written in a year that relate to periods of risk after the consolidated balance sheet date. Unearned premiums are calculated on a daily pro rata basis. The proportion attributable to subsequent periods is deferred as a provision for unearned premiums.
Notes to the consolidated financial statements (continued)
Gross reinsurance premiums on life contracts are recognized as an expense when payable or on the date on which the policy is effective.
Gross general reinsurance premiums written comprise the total premiums payable for the whole cover provided by contracts entered into the period and are recognized on the date on which the policy incepts. Premiums include any adjustments arising in the accounting period in respect of reinsurance contracts incepting in prior accounting periods.
Unearned reinsurance premiums are those proportions of premiums written in a year that relate to periods of risk after the consolidated balance sheet date. Unearned reinsurance premiums are deferred over the term of the underlying direct insurance policies for risks-attaching contracts and over the term of the reinsurance contract for losses-occurring contracts.
| (iii) | Fees and commission income |
Insurance contract policyholders are charged for policy administration services, investment
management services, surrenders and other contract fees. These fees are recognized as revenue over the period in which the related services are performed. If the fees are for services provided in future periods then they are deferred and recognized over those future periods.
Benefits, claims and expenses recognition:
| (i) | Gross benefits and claims |
Gross benefits and claims for life insurance contracts include the cost of all claims arising during the year including internal and external claims handling costs that are directly related to the processing and settlement of claims. Death claims and surrenders are recorded on the basis of notifications received. Maturities and annuity payments are recorded when due.
General insurance and health claims includes all claims occurring during the year, whether reported or not, related internal and external claims handling costs that are directly related to the processing and settlement of claims, a reduction for the value of salvage and other recoveries, and any adjustments to claims outstanding from previous years.
Reinsurance claims are recognized when the related gross insurance claim is recognized according to the terms of the relevant contract.
Notes to the consolidated financial statements (continued)
| (f) | Financial Instruments: Initial recognition and subsequent measurement - |
Purchases or sales of financial assets that require delivery of assets within the time frame generally established by regulation or convention in the marketplace are recorded on the trade date, i.e. the date that the Group commits to purchase or sell the asset. Derivatives are recognized on a trade date basis.
The classification of financial instruments at initial recognition depends on the purpose for which the financial instruments were acquired and their characteristics. All financial instruments are measured initially at their fair value plus, in the case of financial assets and financial liabilities not at fair value through profit or loss, any directly attributable incremental cost of acquisition or issue.
The Group classifies its financial instruments in one of the categories defined by IAS 39: financial assets and financial liabilities at fair value through profit or loss; loans and receivables; available-for-sale financial investments and other financial liabilities. Management defines the classification of its financial instruments at initial recognition.
| (i) | Financial assets and financial liabilities at fair value through profit or loss: |
This category has two sub-categories: financial assets held for trading and financial assets and liabilities designated at fair value through profit or loss at inception. A financial asset is classified as held for trading if it is acquired or incurred principally for the purpose of selling or repurchasing in the near term or if it is part of a portfolio of identified financial instruments that are managed together and for which there is evidence of a recent actual pattern of short-term profit-taking. Derivatives are also categorized as held for trading unless they are designated as hedging instruments. Financial assets and financial liabilities are designated at fair value through profit or loss when the following criteria are met:
| - | The designation eliminates or significantly reduces the inconsistent treatment that would otherwise arise from measuring the assets or liabilities or recognizing gains or losses on them on a different basis; or |
| - | The assets and liabilities are part of a group of financial assets, financial liabilities or both which are managed and their performance evaluated on a fair value basis, in accordance with a documented risk management or investment strategy; or |
| - | The financial instrument contains an embedded derivative, unless the embedded derivative does not significantly modify the cash flows or it is clear, with little or no analysis, that it would not be separately recorded. |
Changes in fair value are recorded in the consolidated income statement caption “Net gain on financial assets and liabilities designated at fair value through profit and loss”. Interest earned or incurred is accrued in the consolidated income statement in the captions “Interest and dividend income” or “Interest expense”, respectively, according to the terms of the contract. Dividend income is recorded when the right to the payment has been established.
Notes to the consolidated financial statements (continued)
| (ii) | Loans and receivables: |
Loans and receivables are non-derivative financial assets with fixed or determinable payments that are not quoted in an active market, other than: those that the entity intend to sell immediately or in the short term, those that the entity upon initial recognition designates as available for sale; or those for which the holder may not recover substantially all of its initial investment, other than because of credit deterioration.
After initial measurement, loans and receivables are subsequently measured at amortized cost using the effective interest rate method, less any allowance for impairment. Amortized cost is calculated considering any discount or premium on acquisition and fees and costs that are an integral part of the effective interest rate. Impairment losses are recognized in the consolidated income statement in the caption “Provision for loan losses”.
Direct loans are recorded when disbursement of funds to the clients are made. Indirect (off-balance sheet) loans are recorded when documents supporting such facilities are issued. Likewise, Credicorp considers as refinanced or restructured those loans that change their payment schedules due to difficulties in the debtor’s ability to repay the loan.
An allowance for loan losses is established if there is objective evidence that the Group will not be able to collect all amounts due according to the original contractual terms of the loan. The allowance for loan losses is established based in the internal risk classification and considering any guarantees and collaterals received, note 3(i) and 29.1.
| (iii) | Available-for-sale financial investments: |
Available-for-sale financial investments are those which are designated as such (to be held for an indefinite period, which may be sold in response to liquidity needs or changes in the interest rates, exchange rates or equity price); or do not qualify to be classified as designated at fair value through profit or loss, held-to-maturity, loans or receivables.
After initial measurement, available-for-sale financial investments are subsequently measured at fair value. Unrealized gains and losses are recognized directly in equity in “Other reserves”, net of its corresponding deferred tax and minority interest. When an available-for-sale financial investment is disposed of, the cumulative gain or loss previously recognized in equity is recognized in the consolidated income statement in the caption “Net gain on sales of securities” considering the average cost basis. Interest and dividends
earned are recognized in the consolidated income statement in the caption “Interest and dividend income”. Interest earned is reported as interest income using the effective interest rate and dividends earned are recognized when collection rights are established.
Notes to the consolidated financial statements (continued)
Estimated fair values are based primarily on quoted prices or, if quoted market prices are not available, discounted expected cash flows using market rates commensurate with the credit quality and maturity of the investment.
Losses arising from impairment (see note 3(i) below) are recognized in the consolidated income statement and removed from the equity caption “Other reserves”.
| (iv) | Other financial liabilities: |
After initial measurement, other financial liabilities are subsequently measured at amortized cost using the effective interest rate method. Amortized cost is calculated by taking into account any issuance discount or premium and costs that are an integral part of the effective interest rate.
| (g) | Derecognition of financial assets and financial liabilities - - |
Financial assets:
A financial asset (or, where applicable a part of a financial asset or a part of a group of similar financial assets) is derecognized when: (i) the rights to receive cash flows from the asset have expired; or (ii) the Group has transferred its rights to receive cash flows from the asset or has assumed an obligation to pay the received cash flows in full without material delay to a third party under a “pass-through” arrangement; and (iii) either the Group has transferred substantially all the risks and rewards of the asset, or the Group has neither transferred nor retained substantially all the risks and rewards of the asset, but has transferred control of the asset.
Financial liabilities:
A financial liability is derecognized when the obligation under the liability is discharged, cancelled or expires. When an existing financial liability is replaced by another from the same lender on substantially different terms, or the terms of an existing liability are substantially modified, such an exchange or modification is treated as a derecognition of the original liability and the recognition of a new liability, and the difference in the respective carrying amounts is recognized as profit or loss.
| (h) | Offsetting financial instruments - |
Financial assets and liabilities are offset and the net amount is reported in the consolidated balance sheet when there is a legally enforceable right to offset the recognized amounts and Management has the intention to settle on a net basis, or realize the assets and settle the liability simultaneously.
Notes to the consolidated financial statements (continued)
| (i) | Impairment of financial assets - |
The Group assesses at each consolidated balance sheet date whether there is any objective evidence that a financial asset or a group of financial assets is impaired. A financial asset or a group of financial assets is deemed to be impaired if, and only if, there is objective evidence of impairment as a result of one or more events that has occurred after the initial recognition of the asset (an incurred loss event) and that loss event (or events) has an impact on the estimated future cash flows of the financial asset or the group of financial assets that can be reliably estimated. Evidence of impairment may include indications that the borrower or a group of borrowers is experiencing significant financial difficulty, default or delinquency in interest or principal payments, the probability that they will go bankrupt or other legal financial reorganization process and where observable data indicate that there is a measurable decrease in the estimated future cash flows, such as changes in arrears or economic conditions that correlate with defaults. The criteria used for each category of financial assets is as follows:
| (i) | Loans and receivables: |
For loans and receivables that are carried at amortized cost, the Group first assesses whether objective evidence of impairment exists for financial assets that are individually significant, or collectively, for financial assets that are not individually significant. If the Group determines that no objective evidence of impairment exists for an individually assessed financial asset, whether significant or not, it includes the asset in a group of financial assets with similar credit risk characteristics and collectively assesses them for impairment. Assets that are individually assessed for impairment and for which an impairment loss is, or continues to be, recognized are not included in a collective assessment of impairment.
If there is objective evidence that an impairment loss has been incurred, the amount of the loss is measured as the difference between the asset carrying amount and the present value of estimated future cash flows. The carrying amount of the asset is reduced through the use of an allowance account and the amount of the loss is recognized in the consolidated statement of income. Interest income, if applicable, is accrued on the reduced carrying amount based on the original effective interest rate of the asset. A loan, together with its associated allowance is written off when there is no realistic prospect of future recovery and all collateral has been realized or has been transferred to the Group. If, in a subsequent year, the amount of the estimated impairment loss increases or decreases because of an event occurring after the impairment was recognized, the previously recognized impairment loss is increased or reduced by adjusting the allowance account. If a future write-off is later recovered, the recovery is recognized in the consolidated income statements, as a credit to the caption “Provision for loan losses”.
Notes to the consolidated financial statements (continued)
The present value of the estimated future cash flows is discounted at the financial asset’s original effective interest rate. If a loan has a variable interest rate, the discount rate for measuring any impairment loss is the current effective interest rate. The calculation of the present value of the estimated future cash flows of a collateralized financial asset reflects the cash flows that may result from foreclosure less costs for obtaining and selling the collateral, whether or not foreclosure is probable.
For a collective evaluation impairment, financial assets are grouped considering the Group’s internal credit grading system, which considers credit risk characteristics; i.e. asset type, industry, geographical location, collateral type and past-due status.
Future cash flows from a group of financial assets that are collectively evaluated for impairment are estimated on the basis of historical loss experience for assets with similar credit risk characteristics to those in the group. Historical loss experience is adjusted on the basis of current observable data to reflect the effects of current conditions that did not affect the years on which the historical loss experience is based and to remove the effects of conditions in the historical period that do not currently exists. The methodology and assumptions used are reviewed regularly to reduce any differences between loss estimates and actual loss experience.
| (ii) | Available-for-sale financial investments: |
For available-for-sale financial investments, the Group assesses at each consolidated balance sheet date whether there is objective evidence that an investment or a group of investments is impaired.
In the case of equity investments, objective evidence would include a significant or prolonged decline in the fair value of the investment below its cost. Where there is evidence of impairment, the cumulative loss (measured as the difference between the acquisition cost and the current fair value, less any previously recognized impairment loss) is removed from equity and recognized in the consolidated income statement. Impairment losses on equity investments are not reversed through the consolidated income statement; increases in their fair value after impairment are recognized directly in equity.
In the case of debt instruments, impairment is assessed based on the same criteria as financial assets carried at amortized cost (loans and receivables). Future interest income is based on the reduced carrying amount and is accrued using the interest rate used to discount the future cash flows for the purpose of measuring the impairment loss. Interest income is recorded as part of “Interest and dividend income”. If, in a subsequent year, the fair value of a debt instrument increases and the increase can be objectively related to an event occurring after the impairment loss was recognized in the consolidated income statement, the impairment loss is reversed through the consolidated income statement.
Where possible, the Group seeks to refinance or restructure loans rather than to take possession of collateral. This may involve extending the payment arrangements and the agreement of new loan conditions. Once the terms have been renegotiated, the loan is no longer considered past due. Management continuously reviews refinanced and restructured loans to ensure that all criteria are met and that future payments are likely to occur. Renegotiated loans continue to be subject to an individual or collective impairment assessment, calculated using the loan’s original effective interest rate.
Notes to the consolidated financial statements (continued)
Operating leases:
Leases in which a significant portion of the risks and benefits of the asset are hold by the lessor are classified as operating leases. Under this concept the Group has mainly leases used as BCP’s branches.
When an operating lease is terminated before the lease period has expired, any penalty payment to the lessor is recognized as an expense in the period in which termination takes place.
Finance leases:
Finance leases are recognized as granted loans at the present value of the lease collections. The difference between the gross receivable amount and the present value of the loan is recognized as unearned interest. Lease income is recognized over the term of the lease agreement using the effective interest method, which reflects a constant periodic rate of return.
| (k) | Property, furniture and equipment - |
Land and buildings comprise mainly branches and offices. All property, furniture and equipment are stated at historical acquisition cost less depreciation and impairment, if applicable. Historical acquisition costs include expenditures that are directly attributable to the acquired property, furniture or equipment. Maintenance and repair costs are charged to the consolidated income statement, and significant renewals and improvements are capitalized when it is probable that future economic benefits, in excess of the originally assessed standard of performance, will flow from the use of the acquired property, furniture or equipment.
Land is not depreciated. Depreciation of other assets in this caption is calculated using the straight-line method over their estimated useful lives, as follows:
Notes to the consolidated financial statements (continued)
| | | Years | |
| | | | |
| Buildings and other construction | | | 33 | |
| | | | | |
| Installations | | | 10 | |
| | | | | |
| Furniture and fixtures | | | 10 | |
| | | | | |
| Computer hardware | | | 4 | |
| | | | | |
| Vehicles and equipment | | | 5 | |
Asset’s residual value, useful life and the selected depreciation method are periodically reviewed to ensure that they are consistent with actual economic benefits and life expectations.
Seized assets are recorded at the lower of cost or estimated market value, which is obtained from valuations made by independent appraisals. Reductions in book values are recorded in the consolidated statements of income.
Comprise internal developed and acquired software licenses used by the Group. Acquired software licenses are measured on initial recognition at cost. These intangible assets are amortized using the straight-line method over their estimated useful life (between 3 and 5 years).
Intangible assets identified as a consequence of the acquisition of AFP Unión Vida, note 2, “client relationships” and other intangible assets, are recognized on the consolidated balance sheet at their fair values determined on the acquisition date and are amortized using the straight line method over their estimated useful life; 20 years for “client relationships” and 5 years for other identified intangible assets.
Goodwill represents the excess of the acquisition cost of a subsidiary over the fair value of the net identifiable assets of the acquired subsidiary at the date of acquisition. Goodwill is tested annually for impairment to assess whether the carrying amount is fully recoverable. An impairment loss is recognized if the carrying amount exceeds the recoverable amount. Goodwill is allocated to cash-generating units for impairment testing purposes. See also paragraph (o) below.
| (o) | Impairment of non-financial assets - |
The Group assesses at each reporting date or more frequently if events or changes in circumstances indicate that the carrying value may be impaired, whether there is an indication that a non-financial asset may be impaired. If any such indication exists, the Group estimates the asset’s recoverable amount. Where the carrying amount of an asset (or cash-generating unit) exceeds its recoverable amount, the asset (or cash-generating unit) is considered impaired and is written down to its recoverable amount.
Notes to the consolidated financial statements (continued)
For non-financial assets, excluding goodwill, an assessment is made at each reporting date as to whether there is any indication that previously recognized impairment losses may no longer exist or may have decreased. If such indication exists, the recoverable amount is estimated. A previously recognized impairment loss is reversed only if there has been a change in the estimates used to determine the asset’s recoverable amount since the last impairment loss was recognized; if that is the case, the carrying amount of the asset is increased to its recoverable amount. Impairment losses relating to goodwill cannot be reversed for subsequent increases in its recoverable amount in future periods.
| (p) | Due from customers on acceptances - - |
Due from customers on acceptances corresponds to accounts receivable from customers for import and export transactions, whose obligations have been accepted by the banks. The obligations that must be assumed by the Group for such transactions are recorded as liabilities.
| (q) | Financial guarantees - |
In the ordinary course of business, the Group grants financial guarantees, such as letters of credit, guarantees and acceptances. Financial guarantees are initially recognized in the consolidated financial statements at fair value, in “Other liabilities”, being the premium received. Subsequent to initial recognition, the Group’s liability under each guarantee is measured at the higher of the amortized premium and the best estimate of expenditure required to settle any financial obligation arising as a result of the financial guarantee.
Any increase in the liability relating to a financial guarantee is included in the consolidated statement of income. The premium received is recognized in the consolidated statement of income in the caption “Banking services commissions” on a straight line basis over the life of the granted financial guarantee.
| (r) | Defined contribution pension plan - |
The Group only operates a defined contribution pension plan. The contribution payable to a defined contribution pension plan is in proportion to the services rendered to the Group by the employees and; it is recorded as an expense in the caption “Salaries and employees benefits” of the consolidated income statement. Unpaid contributions are recorded as a liability.
Provisions for legal claims are recognized when the Group has a present (legal) or constructive obligation as a result of past events, it is probable that an outflow of resources will be required to settle the obligation; and the amount has been reliably estimated. The amount recorded as a provision is equal to the present value of future payments expected to be needed to settle the obligation.
Notes to the consolidated financial statements (continued)
Contingent liabilities are not recognized in the consolidated financial statements. They are disclosed in notes unless the possibility of an outflow of resources is remote.
| (u) | Income tax and workers’ profit sharing - - |
Income tax and workers’ profit sharing are computed based on individual financial statements of Credicorp and each one of its Subsidiaries.
Deferred income tax and deferred workers’ profit sharing reflect the effects of temporary differences between the carrying amounts of assets and liabilities for accounting purposes and the amounts determined for tax purposes. Deferred assets and liabilities are measured using the tax rates expected to be applied to taxable income in the years in which temporary differences are expected to be recovered or eliminated. The measurement of deferred assets and deferred liabilities reflects the tax consequences that arise from the manner in which Credicorp and its Subsidiaries expect, at the consolidated balance sheet date, to recover or settle the carrying amount of its assets and liabilities.
Deferred tax assets and liabilities are recognized regardless of when the timing differences are likely to reverse. Deferred tax assets are recognized when it is more likely than not that future taxable profit will be available against which the temporary difference can be utilized. At the consolidated balance sheet date, Credicorp and its Subsidiaries assess unrecognized deferred assets and the carrying amount of recognized deferred assets.
Credicorp and its Subsidiaries determine the deferred income tax considering the tax rate applicable to its undistributed earnings; any additional tax on dividends distribution is recorded on the date a liability is recognized.
Basic and diluted earnings per share are calculated by dividing the net profit attributable to Credicorp’s equity holders by the weighted average number of ordinary shares outstanding during the year, excluding the average number of ordinary shares purchased and held as treasury stock. For the years ending December 31, 2008, 2007 and 2006 Credicorp has no financial instruments with dilutive effects. Therefore, basic and diluted earnings per share are the same for all years presented.
| (w) | Stock appreciation rights - |
The Group has granted supplementary profit sharing participation to certain executives and employees who have at least one year of service in Credicorp or any of its Subsidiaries, in the form of stock appreciation rights (SARs) over a certain number of Credicorp’s shares. Such SARs options are granted at the market price of the shares of Credicorp on the date of the grant and are exercisable at that price, allowing the employee to obtain a gain from the difference between the fixed exercise price of the share at the date of execution and the market price, note 18.
Notes to the consolidated financial statements (continued)
The recorded expense in each year is the estimated market value of the rights that can be exercised by the beneficiaries at the consolidated balance sheets date. When Credicorp changes the price or the terms of the SARs, the additional compensation expense is recorded for an amount equal to the difference between the new exercise price and the market price of the underlying shares.
| (x) | Derivative financial instruments - |
Part of transactions with derivatives, while providing effective economic hedges under Group’s risk management positions, do not qualify for hedge accounting under the specific rules of IAS 39 and are, therefore, treated as trading derivatives.
Derivative financial instruments are initially recognized in the consolidated balance sheet at cost and subsequently are re-measured at their fair value. Fair values are estimated based on the market exchange and interest rates. All derivatives are carried as assets when fair value is positive and as liabilities when fair value is negative. Gain and losses for changes in their fair value are recorded in the consolidated income statement.
The Group uses derivative instruments to manage exposures to interest rate and foreign currency. In order to manage particular risks, the Group applies hedge accounting for transactions which meet the specified criteria.
At inception of the hedge relationship, the Group formally documents the relationship between the hedged item and the hedging instrument, including the nature of the risk, the objective and strategy for undertaking the hedge and the method that will be used to assess the effectiveness of the hedging relationship.
Also, at the inception of the hedge relationship, a formal assessment is undertaken to ensure the hedging instrument is expected to be highly effective in offsetting the designated risk in the hedged item. Hedges are formally assessed at each reporting date. A hedge is regarded as highly effective if the change in fair value or cash flows attributable to the hedged risk during the period for which the hedge is designated is expected to offset in a range between 80 percent and 125 percent.
As part of its risk management, the Group uses derivative instruments for hedging purposes in order to reduce its exposure to market risk of certain liabilities. The accounting treatment is established according to the nature of the item hedged and compliance with the hedge criteria.
For designated and qualifying cash flow hedges, the effective portion of the gain or loss on the hedging instrument is initially recognized directly in equity in “Other reserves”. The ineffective portion of the gain or loss on the hedging instrument is recognized in the consolidated income statement in the captions “Interest and dividend income” or “Interest expense”, as appropriate. When the hedged cash flow affects the consolidated income statement, the gain or loss on the hedging instrument is recycled in the corresponding income or expense line of the consolidated income statement.
Notes to the consolidated financial statements (continued)
For designated and qualifying fair value hedges, the change in the fair value of a hedging derivative is recognized in the consolidated income statement in the captions “Interest and dividend income” or “Interest expense”, as appropriate. Changes in the fair value of the hedged item attributable to the risk hedged are recorded as part of the carrying value of the hedged item and recognized in the consolidated income statement. If the hedging instrument expires or is sold, terminated or exercised, or where the hedge no longer meets the criteria for hedge accounting, the hedge relationship is terminated.
Embedded derivates:
Certain derivatives embedded in other financial instruments are treated as separate derivatives when their economic characteristics and risks are not closely related to those of the host contract and the host contract is not carried at fair value through profit or loss. These embedded derivatives are measured at fair value with changes in fair value recognized in the consolidated income statement, unless the Group chooses to designate the hybrid contracts at fair value through profit and loss.
The Group has certificates indexed to Credicorp Ltd. share price that will be settled in cash and credit linked notes obtained to provide financial instruments in the same basis to its clients. These instruments have been classified at inception by the Group as “financial instrument at fair value though profit or loss”, note 7.
The Group considers as a business segment a group of assets and operations engaged in providing products or services that are subject to risks and returns that are different from those of other business segments. A geographical segment is engaged in providing products or services within a particular economic environment that are subject to risks and return that are different from those of segments operating in other economic environment, note 26.
| (z) | Fiduciary activities, management of funds and pension funds - |
The Group provides custody, trustee, investment management and advisory services to third parties that result in the holding of assets on their behalf. These assets and income arising thereon are excluded from these consolidated financial statements, as they are not assets of the Group, note 29.8.
Commissions generated for these activities are included in the caption “Other income” of the consolidated statements of income.
| (aa) | Sale and repurchase agreements - |
Securities sold subject to repurchase agreements (‘Repos’) are presented as pledged assets when the counterparty has the right to sell or repledge the collateral; the counterparty liability is included in the caption “Due to banks and correspondents” or “Deposits and obligations”, as appropriate, in the consolidated balance sheets.
The difference between sale and repurchase price is considered as interest and accrued over the life of the related agreement using the effective interest method.
Notes to the consolidated financial statements (continued)
| (ab) | Cash and cash equivalents - |
For the purposes of the consolidated cash flow statement, cash and cash equivalents comprise balances of cash and balances with central banks, overnight deposits and amounts due from banks with original maturities of three months or less.
When it is necessary, the comparative figures have been reclassified to conform to the current year presentation. The main reclassifications to the report as of December 31, 2007 and for the two years ended December 31, 2007 are the following:
| (i) | For the year 2007, the “Impairment loss on available-for-sale investments” amounting to US$5.0 million was shown as part of the caption “Net gain on sale of securities”; as of December 31, 2008, this concept is shown separately in the consolidated income statement. |
| (ii) | For the year 2006, the “Net gain on financial assets and liabilities designated at fair value through profit or loss” amounting to US$3.5 million was shown as part of the caption “Other income”; as of December 31, 2007, this concept is shown separately in the consolidated income statement. |
| (iii) | For the year 2006, the “Interest and dividend Income” and the “Interest expense” were shown in detail on the face of consolidated income statement. For the year 2007 they are shown as part of note 20 to the consolidated income statement. |
Management considers that these reclassifications result in a better presentation of the Group’s activities.
Notes to the consolidated financial statements (continued)
| (ad) | Recently issued International Financial Reporting Standards but not yet effective - |
The Group decided not to early adopt the following standards and interpretations that were issued but not effective as December 31, 2008:
| - | IFRS 8 “Operating Segments”, effective for periods beginning on or after January 1, 2009, IFRS 8 replaces IAS 14 “Segment Reporting” and adopts a full management approach identifying, measuring and disclosing the results of its operating segments. The standard is only applicable to entities that have debt or equity instruments that are traded in a public market (as opposed to a “public securities market” as required by IAS 14) or that files (or is in the process of filing) its financial statements with a securities commission or similar party. |
| - | IAS 23 (Amendment) “Borrowing Costs”, effective for periods beginning on or after January 1, 2009. The revised standard eliminates the option of expensing all borrowing costs and requires borrowing costs to be capitalized if they are directly attributable to the acquisition, construction or production of a qualifying asset. |
| - | IFRIC 13, “Customer Loyalty Programmes”, effective for periods beginning on or after July 1, 2008. The interpretation requires loyalty award credits granted to customers in connection with a sales transaction to be accounted for as a separate component of the sales transaction. |
| - | IFRS 3 (Revised) “Business Combination and Consolidation” and IAS 27 (Revised) “Separated Financial Statements Consolidation”, effective modifications for periods beginning on or after July 1, 2009. The Standard establishes that its application is not retroactive; therefore, it will not have any effect on the Group’s consolidated financial statements. |
| - | IFRS 2, “Share-based payments - Vesting conditions and cancellations”, effective for periods beginning on or after January 1, 2009. The Standard restricts the definition of “vesting condition” to a condition that includes an explicit or implicit requirement to provide services. |
| - | IAS 1 (Revised) “Presentation of financial statements”, effective for periods beginning on or after January 1, 2009. The Standard separates owner and non owner-changes in equity. In addition, the Standard introduces the statement of comprehensive income. |
| - | IAS 32 (Revised) and IAS 1 “Puttable Financial Instruments” (Revised), effective for periods beginning on or after January 1, 2009. The revisions provide a limited scope exception for puttable instruments to be classified as equity if they meet a number of specified features. |
| - | IFRIC 15, “Agreement for the Construction of Real State”, effective for annual periods beginning on or after January 1, 2009. The interpretation is to be applied retrospectively. It clarifies when and how revenue and related expenses from the sale of a real estate unit should be recognized if an agreement between a developer and a buyer is reached before the construction of the real estate is completed. |
Notes to the consolidated financial statements (continued)
| - | IFRIC 16, “Hedges of a Net Investment in a Foreign Operation”, effective for periods beginning on or after October 1, 2008. The interpretation is to be applied prospectively. This interpretation provides guidance in respect to hedges of foreign currency gains and losses on a net investment in a foreign operation. |
| - | IAS 39 “Financial Instruments: Recognition and Measurement – Eligible Hedged Items”, effective for periods beginning on or after July 1, 2009, the amendment addresses the designation of a one-sided risk in a hedged item, and the designation of inflation as a hedged risk or portion in particular situations. |
| - | IFRIC 17, “Distributions of Non-Cash Assets to owners”, effective for periods beginning on or after July 1, 2009. Early application is permitted. This interpretation provides guidance in the accounting treatment of distribution of - non cash assets to owners. |
| - | IFRIC 18, “Transfer of assets from customers”, effective for periods beginning on or after July 1, 2009. This interpretation clarifies the requirements of IFRS for agreements in which an entity receives from a customer an item of property, plant and equipment that the entity must then use either to connect the customer to a network or to provide the customer with ongoing access to a supply of goods or services. |
| - | IFRIC 9 “Reassessment of embedded derivatives and IAS 39 Financial Instruments: Recognition and Measurement - Embedded Derivatives” (Amendments), effective for annual periods ending on or after June 30, 2009. The amendments require that entities must assess whether to separate an embedded derivative from a host contract in the case where the entity reclassifies a hybrid financial asset out of the fair value through profit or loss category; and the assessment to be made either when the entity first became party to the contract or when a change in the terms of the contract significantly modifies expected cash flows. |
| - | IFRS 7 “Financial Instruments: Disclosures” (Amendments), effective for annual periods beginning on or after January 1, 2009. The amendments are intended to enhance disclosures about fair value measurement and liquidity risk. Entities will be required to use a 3-level hierarchy of disclosures for financial instruments recorded at fair value. |
The Group does not expect significant implications of these standards or interpretations in its consolidated financial statements once adopted.
| 4. | Cash and due from banks |
| | (a) | This item is made up as follows: |
| | | 2008 | | | 2007 | |
| | | US$(000) | | | US$(000) | |
| | | | | | | |
| Cash and clearing | | | 625,954 | | | | 548,298 | |
| Deposits in Peruvian Central Bank - BCRP | | | 1,952,952 | | | | 1,798,581 | |
| Deposits in banks | | | 1,184,729 | | | | 720,992 | |
| | | | 3,763,635 | | | | 3,067,871 | |
| Accrued interest | | | 2,536 | | | | 5,994 | |
| | | | | | | | | |
| Total | | | 3,766,171 | | | | 3,073,865 | |
Notes to the consolidated financial statements (continued)
| | (b) | As of December 31, 2008 and 2007, cash and due from banks balances include approximately US$2,488.7 and US$1,191.2 million, respectively, mainly from Banco de Crédito del Perú (BCP), which represent the legal reserve that Peruvian banks must maintain for its obligations with the public. These funds are deposited in BCP’s vaults and in the BCRP, and are within the limits established by prevailing legislation. As of December 31, 2007 the balance of this caption also includes US$1,000 million, relating to an overnight operation deposited in the BCRP, this operation earned interest at an effective rate of 4.45 percent and had a 2 days maturity. |
The legal reserve funds maintained with BCRP are not interest-bearing, except for the part of the mandatory reserve in U.S. Dollars that exceeds the minimum legal reserve. As of December 31, 2008, this excess amounts to approximately US$1,601.6 million and bears interest in U.S. Dollars at an average annual interest rate of 0.4 percent (approximately US$1,222.5 million and 3.5 percent, respectively as of December 31, 2007).
Notes to the consolidated financial statements (continued)
| 5. | Investments available-for-sale |
| | (a) | This item is made up as follows: |
| | | 2008 | | | 2007 | |
| | | | | | Unrealized gross amount | | | | | | | | | Unrealized gross amount | | | | |
| | | Amortized cost | | | Gains | | | Losses (b) | | | Estimated fair value | | | Amortized cost | | | Gains | | | Losses (b) | | | Estimated fair value | |
| | | US$(000) | | | US$(000) | | | US$(000) | | | US$(000) | | | US$(000) | | | US$(000) | | | US$(000) | | | US$(000) | |
| | | | | | | | | | | | | | | | | | | | | | | | | |
| Fixed maturity - | | | | | | | | | | | | | | | | | | | | | | | | |
| BCRP certificates of deposit (d) | | | 2,209,460 | | | | 2,939 | | | | (3,457 | ) | | | 2,208,942 | | | | 2,410,062 | | | | 224 | | | | (3,281 | ) | | | 2,407,005 | |
| Corporate, leasing and subordinated bonds (e) | | | 950,322 | | | | 16,015 | | | | (58,109 | ) | | | 908,228 | | | | 945,794 | | | | 17,028 | | | | (8,380 | ) | | | 954,442 | |
| Government’s treasury bonds (f) | | | 833,729 | | | | 57,678 | | | | (10,231 | ) | | | 881,176 | | | | 670,717 | | | | 59,316 | | | | (403 | ) | | | 729,630 | |
| Central Bank of Bolivia certificates of deposit (g) | | | 217,516 | | | | 115 | | | | (81 | ) | | | 217,550 | | | | 121,706 | | | | 38 | | | | (96 | ) | | | 121,648 | |
| Participations in mutual funds | | | 97,234 | | | | 2,189 | | | | (2,479 | ) | | | 96,944 | | | | 145,182 | | | | 3,652 | | | | - | | | | 148,834 | |
| Collateralized mortgage obligations (CMO) (h) | | | 96,256 | | | | 46 | | | | (22,375 | ) | | | 73,927 | | | | 106,245 | | | | 597 | | | | (1,092 | ) | | | 105,750 | |
| US Government – Agencies and Sponsored Enterprises (i) | | | 41,000 | | | | 3,718 | | | | (67 | ) | | | 44,651 | | | | 86,337 | | | | 2,337 | | | | (427 | ) | | | 88,247 | |
| Restricted mutual funds (j) | | | 49,775 | | | | 1,887 | | | | - | | | | 51,662 | | | | 47,347 | | | | 18,255 | | | | - | | | | 65,602 | |
| Participation in RAL’s funds (k) | | | 73,268 | | | | - | | | | - | | | | 73,268 | | | | 56,641 | | | | - | | | | - | | | | 56,641 | |
| Negotiable certificates of deposit | | | 41,628 | | | | 1,003 | | | | (76 | ) | | | 42,555 | | | | 53,236 | | | | 1,850 | | | | (1 | ) | | | 55,085 | |
| Hedge funds | | | 31,742 | | | | 2,920 | | | | (284 | ) | | | 34,378 | | | | 41,129 | | | | 8,557 | | | | (113 | ) | | | 49,573 | |
| Corporación Andina de Fomento and Corporación Financiera de Desarrollo bonds | | | 34,799 | | | | 116 | | | | (587 | ) | | | 34,328 | | | | 45,136 | | | | 143 | | | | - | | | | 45,279 | |
| Commercial papers | | | 11,203 | | | | 3 | | | | (96 | ) | | | 11,110 | | | | 15,585 | | | | 27 | | | | (9 | ) | | | 15,603 | |
| Other | | | 20,104 | | | | 2 | | | | (674 | ) | | | 19,432 | | | | 21,860 | | | | 1,348 | | | | (21 | ) | | | 23,187 | |
| | | | 4,708,036 | | | | 88,631 | | | | (98,516 | ) | | | 4,698,151 | | | | 4,766,977 | | | | 113,372 | | | | (13,823 | ) | | | 4,866,526 | |
| | | | | | | | | | | | | | | | | | | | | | | | | | | | | | | | | |
| Shares - | | | | | | | | | | | | | | | | | | | | | | | | | | | | | | | | |
| Listed securities (l) | | | 106,521 | | | | 109,032 | | | | (5,936 | ) | | | 209,617 | | | | 107,332 | | | | 167,578 | | | | (1,701 | ) | | | 273,209 | |
| Not-listed securities | | | 6,242 | | | | 1,761 | | | | (3 | ) | | | 8,000 | | | | 19,568 | | | | 28,343 | | | | (3 | ) | | | 47,908 | |
| | | | 112,763 | | | | 110,793 | | | | (5,939 | ) | | | 217,617 | | | | 126,900 | | | | 195,921 | | | | (1,704 | ) | | | 321,117 | |
| | | | | | | | | | | | | | | | | | | | | | | | | | | | | | | | | |
| | | | 4,820,799 | | | | 199,424 | | | | (104,455 | ) | | | 4,915,768 | | | | 4,893,877 | | | | 309,293 | | | | (15,527 | ) | | | 5,187,643 | |
| | | | | | | | | | | | | | | | | | | | | | | | | | | | | | | | | |
| Accrued interest | | | | | | | | | | | | | | | 43,300 | | | | | | | | | | | | | | | | 40,998 | |
| | | | | | | | | | | | | | | | | | | | | | | | | | | | | | | | | |
| Total | | | | | | | | | | | | | | | 4,959,068 | | | | | | | | | | | | | | | | 5,228,641 | |
Notes to the consolidated financial statements (continued)
| (b) | Credicorp’s Management has determined that the unrealized losses as of December 31, 2008 and 2007 are of temporary nature. Management intents and has the ability to hold each investment for a period of time sufficient to allow for an anticipated recovery in fair value, until the earlier of its anticipated recovery or maturity. |
Credicorp’s Management has considered the following criteria in determining whether a loss is temporary or not for equity investments (shares):
| - | The length of time and the extent to which fair value has been below cost; |
| - | The severity of the impairment; |
| - | The cause of the impairment and the financial condition and near-term prospects of the issuer; and |
| - | Activity in the market of the issuer which may indicate adverse credit conditions. |
Credicorp’s Management has considered the following criteria in determining whether a loss is temporary or not for debt investments (fixed maturity):
| - | Assess whether it is probable that the Group will receive all amounts due according to the contractual terms of the security (principal and interest). The identification of credit-impaired securities considers a number of factors, including the nature of the security and the underlying collateral, the amount of subordination or credit enhancement supporting the security, published credit rating and other information, and other evidential analyses of the probable cash flows from the security. If recovery of all amounts due is not probable, a “credit impairment” is deemed to exist, and the unrealized loss is recorded directly in the consolidated income statement. This unrealized loss recorded in income represents the security’s decline in fair value, including the decline due to forecasted cash flow shortfalls as well as general market spread widening. |
| - | For securities with unrealized losses but not identified as impairment, Credicorp’s Management determines whether it has the positive intent and ability to hold each investment for a period of time sufficient to allow for an anticipated recovery in its amortized cost. Credicorp’s Management estimates the forecasted recovery period using current estimates of volatility in market interest rates (including liquidity and risk premiums). Management’s assertion regarding its intent and ability to hold investments considers a number of factors, including a quantitative estimate of the expected recovery period and the length of that period (which may extend to maturity), the severity of the impairment, and Credicorp’s Management intended strategy with respect to the identified security or portfolio. If Credicorp’s Management does not have the intent and ability to hold the security for a sufficient time period, the unrealized loss is recorded directly in the consolidated income statement. |
| (c) | For the year ended December 31, 2008, as a result of the impairment assessment of its investments available-for-sale, the Group recorded an gross impairment amounting to US$60.4 million, US$55.7 million net of deferred taxes and minority interest (US$5.0 million of impairment gross and net of deferred taxes and minority interest as of December 31, 2007), which is presented in the consolidated income statement caption “Impairment losses on available-for-sale investments”. |
Notes to the consolidated financial statements (continued)
The movement of “Other reserves” in consolidated equity includes mainly the net change in the realized and unrealized gains and losses, net of deferred taxes, and the recorded impairment. This caption is as follows:
| | | 2008 | | | 2007 | | | 2006 | |
| | | US$(000) | | | US$(000) | | | US$(000) | |
| | | | | | | | | | |
| Unrealized gains (loss), net of taxes and minority interest, note 16(c) | | | (164,302 | ) | | | 85,129 | | | | 69,411 | |
| Realized gains, net of taxes and minority interest, note 16(c) | | | 35,684 | | | | 17,634 | | | | 6,620 | |
| Impairment on investments, net of taxes and minority interest note 16(c) | | | (55,732 | ) | | | (5,017 | ) | | | - | |
| (d) | BCRP certificates of deposit are discounted Nuevo Sol instruments with maturities due within one year and are acquired in public auctions. Annual effective interest rates in Peruvian currency range between 6.55 and 7.06 percent as of December 31, 2008 (between 4.93 and 6.01 annual percent as of December 31, 2007). |
As of December 31, 2008, this amount includes BCRP certificates of deposit in US$ Dollars amounting to US$1,070.7 million, with maturities between January and April 2009. These certificates accrue interests at annual effective rates that range between 0.34 and 1.55 percent.
As of December 31, 2008 and 2007, the Group has entered into BCRP - Repo transactions in Peruvian currency with its clients using these securities, for approximately US$294.2 and US$242.8 million, respectively. As of December 31, 2008, these operations earn an annual effective interest rate between 6.75 and 7.00 percent and with maturities between February 2009 and November 2009 (between 5.04 and 6.00 percent and with maturities between January 2008 and December 2009 as of December 31, 2007).
| (e) | As of December 31, 2008, comprise corporate bonds for US$900.4 million, leasing bonds for US$5.8 million and subordinated bonds for US$2.0 million (US$947.9, US$4.3 and US$2.2 million, respectively, as of December 31, 2007), with maturities between January 2009 and November 2066 (between January 2008 and November 2066 as of December 31, 2007). These bonds accrue interests at annual effective rates that range between 2.81 and 8.8 percent for the bonds denominated in Peruvian currency (between 2.79 and 6.87 percent as of December 31, 2007), and between 1.58 and 18.4 percent for the bonds denominated in U.S. Dollars (between 3.13 and 15.63 percent as of December 31, 2007). The unrealized losses on these investments as of December 31, 2008, correspond to 178 items of which the highest individual unrealized loss amounts to approximately US$2.0 million. |
| (f) | Includes principally debt instruments for US$795.2, US$67.7 and US$4.9 million issued by the Peruvian Government, the Colombian Government and the Government of El Salvador, respectively, as of December 31, 2008 (US$616.1, US$85.4 and US$11.1 million, respectively, as of December 31, 2007). Their maturities are between January 2009 and August 2046 (between January 2008 and August 2046 as of December 31, 2007) and earned interests at annual effective rates that range between 2.85 and 9.15 percent (between 3.28 and 9.13 percent as of December 31, 2007). |
Notes to the consolidated financial statements (continued)
As of December 31, 2007, the Group had Repo transactions in U.S. Dollars with its clients using Peruvian Government bonds and Colombian Government bonds for approximately US$38.9 million and US$59.3 million, respectively. Such transactions had maturities between October 2008 and December 2008 and accrued interest at annual effective rates that were between 5.35 and 6.00 percent, respectively.
| (g) | As of December 31, 2008 and 2007, certificates of deposit issued by the Central Bank of Bolivia are denominated in Pesos Bolivianos, had maturities between January and July 2009 and between January and October 2008, respectively, and accrued interest at annual effective rates that ranges between 7.4 and 11.5 percent and between 1.8 and 8.5 percent, respectively. |
| (h) | Collaterized mortgage obligations are not related with “sub prime mortgages”, they correspond to senior tranches and have maturities between December 2015 and January 2047 (between May 2033 and January 2047 as of December 31, 2007) and accrues interest at annual effective rates that ranges between 3.8 and 14.2 percent (between 3.5 and 6.7 percent as of December 31, 2007). The unrealized losses on these instruments as of December 31, 2008 correspond to 23 items of which the highest individual unrealized loss amounts to approximately US$1.5 million. |
| (i) | Corresponds to debt instruments issued by US Government – Agencies and Sponsored Enterprises. Their maturities are between April 2009 and August 2038 (between July 2008 and August 2038 as of December 31, 2007) and earned interest at annual effective rates between 4.1 and 6.3 percent (between 4.1 and 6.8 percent as of December 31, 2007). |
| (j) | Restricted mutual funds comprise participation quotas on the private pension funds managed by the Group as required by Peruvian regulations. They have a restricted disposal and their profitability is the same as the one obtained by the private pension funds managed. |
| (k) | The participation quotas in the Fund “Requirement of Cash Assets” (RAL for its Spanish acronym) are denominated in Pesos Bolivianos and comprise investments made by the Group in the Central Bank of Bolivia as collateral for the deposits maintained with the public. Such fund has restrictions for its use and it is required for all the banks established in Bolivia. The fund accrues interest at an average annual effective rate of 5.48 and 5.42 percent as of December 31, 2008 and 2007, respectively. |
| (l) | As December 31, 2008, the unrealized gains on listed securities arises mainly from shares in Banco de Crédito e Inversiones de Chile - BCI Chile, Inversiones Centenario S.A. and Alicorp S.A.A., which amounted to US$18.2, US$28.8 and US$8.8 million, respectively (US$61.3, US$31.2 and US$29.0 million, respectively, as of December 31, 2007). |
| (m) | Amortized cost and estimated fair value of investments available-for-sale classified by maturity are as follows: |
Notes to the consolidated financial statements (continued)
| | | 2008 | | | 2007 | |
| | | Amortized cost | | | Fair value | | | Amortized cost | | | Fair value | |
| | | US$(000) | | | US$(000) | | | US$(000) | | | US$(000) | |
| | | | | | | | | | | | | |
| Up to 3 months | | | 2,021,269 | | | | 2,023,679 | | | | 798,053 | | | | 828,839 | |
| From 3 months to 1 year | | | 950,458 | | | | 946,369 | | | | 1,961,129 | | | | 1,959,497 | |
| From 1 to 3 years | | | 285,044 | | | | 279,982 | | | | 922,822 | | | | 925,330 | |
| From 3 to 5 years | | | 262,872 | | | | 258,878 | | | | 170,413 | | | | 175,532 | |
| Over 5 years | | | 1,188,393 | | | | 1,189,243 | | | | 914,560 | | | | 977,328 | |
| Without maturity (shares) | | | 112,763 | | | | 217,617 | | | | 126,900 | | | | 321,117 | |
| | | | | | | | | | | | | | | | | |
| Total | | | 4,820,799 | | | | 4,915,768 | | | | 4,893,877 | | | | 5,187,643 | |
Notes to the consolidated financial statements (continued)
| (a) | This item is made up as follows: |
| | | 2008 | | | 2007 | |
| | | US$(000) | | | US$(000) | |
| Direct loans - | | | | | | |
| Loans | | | 7,324,485 | | | | 5,842,934 | |
| Leasing receivables | | | 1,792,827 | | | | 1,118,301 | |
| Credit card receivables | | | 854,968 | | | | 677,182 | |
| Discounted notes | | | 368,648 | | | | 325,047 | |
| Advances and overdrafts | | | 102,687 | | | | 127,486 | |
| Factoring receivables | | | 124,537 | | | | 109,928 | |
| Refinanced and restructured loans | | | 55,179 | | | | 88,451 | |
| Past due and under legal collection loans | | | 82,867 | | | | 61,488 | |
| | | | 10,706,198 | | | | 8,350,817 | |
| Add (less) - | | | | | | | | |
| Accrued interest | | | 90,094 | | | | 66,974 | |
| Unearned interest | | | (249,914 | ) | | | (166,972 | ) |
| Allowance for loan losses (d) | | | (224,337 | ) | | | (211,319 | ) |
| | | | | | | | | |
| Total direct loans, net | | | 10,322,041 | | | | 8,039,500 | |
| | | | | | | | | |
| Indirect loans, note 19(a) | | | 1,755,902 | | | | 1,564,525 | |
| (b) | Loans by class, are as follows: |
| | | 2008 | | | 2007 | |
| | | US$(000) | | | US$(000) | |
| | | | | | | |
| Commercial loans | | | 8,058,585 | | | | 6,222,178 | |
| Residential mortgage loans | | | 1,485,214 | | | | 1,253,835 | |
| Consumer loans | | | 1,162,399 | | | | 874,804 | |
| | | | | | | | | |
| Total | | | 10,706,198 | | | | 8,350,817 | |
| (c) | Interest rates on loans are set considering the rates prevailing in the markets where the Group’s subsidiaries operate. |
Notes to the consolidated financial statements (continued)
| | (d) | The movement in the allowance for loan losses (direct and indirect loans) is shown below: |
| | | 2008 | |
| | | Commercial loans | | | Residential mortgage loans | | | Consumer loans | | | Total | |
| | | US$(000) | | | US$(000) | | | US$(000) | | | US$(000) | |
| | | | | | | | | | | | | |
| Beginning balances | | | 184,584 | | | | 14,454 | | | | 30,662 | | | | 229,700 | |
| Provision (recoveries) | | | (10,667 | ) | | | 16,024 | | | | 43,403 | | | | 48,760 | |
| Recoveries of written-off loans | | | 19,956 | | | | 808 | | | | 10,515 | | | | 31,279 | |
| Loan portfolio written-off | | | (31,595 | ) | | | (291 | ) | | | (27,422 | ) | | | (59,308 | ) |
| Translation result | | | (1,108 | ) | | | (163 | ) | | | (1,097 | ) | | | (2,368 | ) |
| | | | | | | | | | | | | | | | | |
| Ending balances (*) | | | 161,170 | | | | 30,832 | | | | 56,061 | | | | 248,063 | |
| | | 2007 | |
| | | Commercial loans | | | Residential mortgage loans | | | Consumer loans | | | Total | |
| | | US$(000) | | | US$(000) | | | US$(000) | | | US$(000) | |
| | | | | | | | | | | | | |
| Beginning balances | | | 183,374 | | | | 9,253 | | | | 17,959 | | | | 210,586 | |
| Provision (recoveries) | | | (5,591 | ) | | | 4,884 | | | | 29,146 | | | | 28,439 | |
| Recoveries of written-off loans | | | 26,016 | | | | 2,587 | | | | 5,481 | | | | 34,084 | |
| Loan portfolio written-off | | | (22,079 | ) | | | (2,395 | ) | | | (22,792 | ) | | | (47,266 | ) |
| Translation result | | | 2,864 | | | | 125 | | | | 868 | | | | 3,857 | |
| | | | | | | | | | | | | | | | | |
| Ending balances (*) | | | 184,584 | | | | 14,454 | | | | 30,662 | | | | 229,700 | |
| | | 2006 | |
| | | Commercial loans | | | Residential mortgage loans | | | Consumer loans | | | Total | |
| | | US$(000) | | | US$(000) | | | US$(000) | | | US$(000) | |
| | | | | | | | | | | | | |
| Beginning balances | | | 196,059 | | | | 8,528 | | | | 14,049 | | | | 218,636 | |
| Provision (recoveries) | | | (19,118 | ) | | | 1,202 | | | | 13,673 | | | | (4,243 | ) |
| Recoveries of written-off loans | | | 31,546 | | | | 1,064 | | | | 11,674 | | | | 44,284 | |
| Loan portfolio written-off | | | (25,971 | ) | | | (2,447 | ) | | | (21,441 | ) | | | (49,859 | ) |
| Translation result | | | 858 | | | | 906 | | | | 4 | | | | 1,768 | |
| | | | | | | | | | | | | | | | | |
| Ending balances (*) | | | 183,374 | | | | 9,253 | | | | 17,959 | | | | 210,586 | |
Notes to the consolidated financial statements (continued)
| | (*) | The movement in the allowance for loan losses includes the allowance for direct and indirect loans for approximately US$224.3 and US$23.7 million, respectively, as of December 31, 2008 (approximately US$211.3 and US$18.4 million; and US$190.3 and US$20.3 million, as of December 31, 2007 and 2006, respectively). The allowance for indirect loan losses is included in the “Other liabilities” caption of the consolidated balance sheets, note 11(a). |
In Management’s opinion, the allowance for loan losses recorded as of December 31, 2008 and 2007 and 2006 has been established in accordance with IAS 39 and is sufficient to cover the losses on the loan portfolio, note 3(i).
| | (e) | Part of the loan portfolio is collateralized with guarantees received from clients, which mainly consist of mortgages, trust assignments, financial instruments and industrial and mercantile pledges. |
| | (f) | Interest on past due and under legal collection loans are recognized when collected. |
Interest income that would have been recorded for these credits in accordance with the terms of the original contract amount approximately to US$17.0, US$18.7 and US$28.1 million as of December 31, 2008, 2007 and 2006, respectively.
| | (g) | As of December 31, 2008 and 2007, the direct gross loan portfolio classified by maturity, based on the remaining period to repayment date is as follows: |
| | | 2008 | | | 2007 | |
| | | US$(000) | | | US$(000) | |
| | | | | | | |
| Outstanding loans - | | | | | | |
| Up to 1 year | | | 6,307,197 | | | | 4,980,021 | |
| From 1 to 3 years | | | 1,648,821 | | | | 1,443,070 | |
| From 3 to 5 years | | | 1,033,375 | | | | 666,670 | |
| Over 5 years | | | 1,633,938 | | | | 1,199,568 | |
| | | | | | | | | |
| Past due loans - | | | | | | | | |
| Up to 4 months | | | 34,955 | | | | 20,825 | |
| Over 4 months | | | 22,569 | | | | 20,122 | |
| Under legal collection loans | | | 25,343 | | | | 20,541 | |
| | | | | | | | | |
| Total | | | 10,706,198 | | | | 8,350,817 | |
Notes to the consolidated financial statements (continued)
| 7. | Financial assets and financial liabilities designated at fair value through profit or loss |
| | (a) | This item is made up as follows: |
| | | Assets | | | Liabilities | |
| | | 2008 | | | 2007 | | | 2008 | | | 2007 | |
| | | US$(000) | | | US$(000) | | | US$(000) | | | US$(000) | |
| | | | | | | | | | | | | |
| Citigroup indexed certificates (b) | | | 129,631 | | | | 162,592 | | | | - | | | | - | |
| Credit linked notes (c) | | | - | | | | 50,561 | | | | - | | | | 50,561 | |
| | | | | | | | | | | | | | | | | |
| | | | 129,631 | | | | 213,153 | | | | - | | | | 50,561 | |
| | (b) | In connection with the liabilities that result from Credicorp´s stock appreciation rights (SARs), (note 18), BCP signed several contracts with Citigroup Global Markets Holdings Inc., Citigroup Capital Limited and Citigroup Capital Market Inc. |
These contracts consist of the purchase of up to 3,252,035 certificates indexed to the performance of Credicorp Ltd. (BAP) shares, in the form of “warrants”, issued by Citigroup, which are equivalent to the same number of shares of Credicorp Ltd. These certificates are cash settled and, at their maturity, they pay an amount equal to the final settlement price minus the strike price (US$ 0.0000001) plus the accrued dividends, less the annual fee multiplied by the number of warrants underlying the certificate. The final settlement price is equivalent to the daily volume-weighted average of the per share price for BAP shares on each business day, on which Citigroup or any of its affiliates effects any transactions with respect to BAP shares in order to unwind its position established and maintained to hedge its price and market risk with respect to the issued certificates.
The program has a maturity of 5 years but can be settled at anytime before its maturity, partially or totally. As of December 31, 2008 and 2007, the Group had acquired 2,487,414 and 2,097,414 certificates, respectively, at a total cost of US$129.1 and US$94.9 million, respectively (US$51.9 and US$45.3 per certificate on average, respectively). At those dates, the estimated market value amounted to US$129.6 million and US$162.6 million, respectively (US$52.1 and US$77.5 per certificate on average, as of December 31, 2008 and 2007, respectively). The loss resulting from the difference between cost and estimated market value amounting to approximately US$67.1 million (gain of US$65.1 million as of December 31, 2007) that has been recorded in the caption “Net (loss) gain on financial assets and liabilities designated at fair value through profit and loss” of the consolidated statement of income, according to the accounting principles described in note 3(x).
Notes to the consolidated financial statements (continued)
| | (c) | During 2007, the Group acquired debt instruments in the form of "Credit linked notes”, which were issued by Bear Stearns Global Asset Holdings Ltd. and were linked to debt instruments issued by the Republic of Peru or any successor of this (credit default swap); these instruments were acquired for the purpose of providing financial instruments with the same terms, risk and benefits to certain clients. |
During the first quarter of 2008 and before their maturity, said instruments were liquidated at their estimated market value. This transaction did not have a material effect on the Group’s net consolidated income.
| 8. | Receivable and payable accounts from insurance contracts |
| | (a) | This item is made up as follows: |
| | | 2008 | | | 2007 | |
| | | US$(000) | | | US$(000) | |
| | | | | | | |
| Assets- | | | | | | |
| Premiums and other policies receivable (b) | | | 111,561 | | | | 85,495 | |
| Accounts receivable from reinsurers and coinsurers (c) | | | 165,144 | | | | 116,141 | |
| | | | | | | | | |
| Total | | | 276,705 | | | | 201,636 | |
| | | | | | | | | |
| Liabilities- | | | | | | | | |
| Accounts payable to reinsurers and coinsurers (c) | | | 55,841 | | | | 33,963 | |
| | (b) | Premiums and other polices receivable correspond to: |
| | | 2008 | | | 2007 | |
| | | US$(000) | | | US$(000) | |
| | | | | | | |
| General insurance | | | 81,489 | | | | 73,524 | |
| Life insurance | | | 5,982 | | | | 4,857 | |
| Health insurance | | | 24,090 | | | | 7,114 | |
| | | | | | | | | |
| | | | 111,561 | | | | 85,495 | |
Notes to the consolidated financial statements (continued)
These accounts receivable are primarily due in a current period and have no collaterals; their aging is as follows:
| | | 2008 | | | 2007 | |
| | | US$(000) | | | US$(000) | |
| | | | | | | |
| Non past due accounts receivable | | | 89,371 | | | | 71,830 | |
| | | | | | | | | |
| Past due accounts receivable | | | | | | | | |
| Up to 30 days | | | 14,375 | | | | 6,793 | |
| From 31 to 60 days | | | 6,309 | | | | 2,016 | |
| From 61 to 90 days | | | 1,197 | | | | 1,748 | |
| More than 90 days | | | 309 | | | | 3,108 | |
| | | | | | | | | |
| | | | 111,561 | | | | 85,495 | |
| | (c) | The movements of accounts receivable and payable to reinsurers and coinsurers are as follows: |
| | | 2008 | | | 2007 | |
| | | US$(000) | | | US$(000) | |
| | | | | | | |
| Beginning balances | | | 116,141 | | | | 35,181 | |
| Reported claims of premiums ceded | | | 64,787 | | | | 86,458 | |
| Premiums ceded unearned during the year | | | 1,054 | | | | (14,538 | ) |
| Premiums assumed | | | 22,664 | | | | 15,811 | |
| Settled claims of premiums ceded | | | 14,885 | | | | 14,213 | |
| Collections and other | | | (54,387 | ) | | | (20,984 | ) |
| | | | | | | | | |
| Ending balances | | | 165,144 | | | | 116,141 | |
Accounts receivable as of December 31, 2008 and 2007, include US$32.0 million and US$30.9 million, respectively which correspond to the unearned portion of the ceded premiums to the reinsurers.
Notes to the consolidated financial statements (continued)
Accounts payable:
| | | 2008 | | | 2007 | |
| | | US$(000) | | | US$(000) | |
| | | | | | | |
| Beginning balances | | | 33,963 | | | | 25,134 | |
| Premiums ceded to reinsurers by facultative contracts | | | 84,301 | | | | 53,180 | |
| Coinsurance granted | | | 2,531 | | | | 8,153 | |
| Payments and other | | | (64,954 | ) | | | (52,504 | ) |
| | | | | | | | | |
| Ending balances | | | 55,841 | | | | 33,963 | |
Accounts payable to reinsurers are primarily related to the proportional facultative contracts for ceded premiums, automatic non-proportional contracts (excess of loss) and reinstallation premiums. For facultative contracts the Group transfers to the reinsurers a percentage or an amount of an insurance contract or individual risk, based on the premium and the covered period. The net movement of the accounts payable of non proportioned contracts (excess of loss) as well as installation premiums of the years 2008 and 2007 are included in the concept “Payments and other” for US$26.4 million and U$16.3 million, respectively.
Notes to the consolidated financial statements (continued)
| 9. | Property, furniture and equipment, net |
| | (a) | The movement of property, furniture and equipment and accumulated depreciation, for the years ended December 31, 2008 and 2007, is as follows: |
| | | Land | | | Buildings and other construction | | | Installations | | | Furniture and fixtures | | | Computer hardware | | | Vehicles and equipment | | | Work in progress | | | 2008 | | | 2007 | |
| | | US$(000) | | | US$(000) | | | US$(000) | | | US$(000) | | | US$(000) | | | US$(000) | | | US$(000) | | | US$(000) | | | US$(000) | |
| | | | | | | | | | | | | | | | | | | | | | | | | | | | |
| Cost - | | | | | | | | | | | | | | | | | | | | | | | | | | | |
Balance as of January 1st | | | 37,289 | | | | 263,241 | | | | 99,624 | | | | 73,537 | | | | 197,132 | | | | 20,637 | | | | 17,023 | | | | 708,483 | | | | 659,334 | |
| Additions | | | 1,285 | | | | 3,289 | | | | 7,884 | | | | 8,800 | | | | 33,717 | | | | 8,946 | | | | 27,432 | | | | 91,353 | | | | 53,901 | |
| Transfer | | | - | | | | 11,959 | | | | 3,737 | | | | - | | | | - | | | | - | | | | (15,696 | ) | | | - | | | | - | |
| Sales and other | | | (207 | ) | | | (664 | ) | | | (487 | ) | | | (1,238 | ) | | | (11,737 | ) | | | (517 | ) | | | 7 | | | | (14,843 | ) | | | (4,752 | ) |
| Balance as of December 31 | | | 38,367 | | | | 277,825 | | | | 110,758 | | | | 81,099 | | | | 219,112 | | | | 29,066 | | | | 28,766 | | | | 784,993 | | | | 708,483 | |
| | | | | | | | | | | | | | | | | | | | | | | | | | | | | | | | | | | | | |
| Accumulated depreciation - | | | | | | | | | | | | | | | | | | | | | | | | | | | | | | | | | | | | |
Balance as of January 1st | | | - | | | | 140,046 | | | | 63,813 | | | | 58,429 | | | | 163,581 | | | | 7,679 | | | | - | | | | 433,548 | | | | 403,856 | |
| Depreciation for the year | | | - | | | | 6,568 | | | | 6,707 | | | | 3,308 | | | | 17,095 | | | | 2,356 | | | | - | | | | 36,034 | | | | 33,535 | |
| Sales and other | | | - | | | | (664 | ) | | | (404 | ) | | | (1,222 | ) | | | (11,278 | ) | | | (479 | ) | | | - | | | | (14,047 | ) | | | (3,843 | ) |
| Balance as of December 31 | | | - | | | | 145,950 | | | | 70,116 | | | | 60,515 | | | | 169,398 | | | | 9,556 | | | | - | | | | 455,535 | | | | 433,548 | |
| | | | | | | | | | | | | | | | | | | | | | | | | | | | | | | | | | | | | |
| Net book value | | | 38,367 | | | | 131,875 | | | | 40,642 | | | | 20,584 | | | | 49,714 | | | | 19,510 | | | | 28,766 | | | | 329,458 | | | | 274,935 | |
| | (b) | Banks, financial institutions and insurance entities operating in Peru are not allowed to pledge their fixed assets. |
| | (c) | As of December 31, 2008, Credicorp and its Subsidiaries have property available for sale for approximately US$25.0 million, net of its accumulated depreciation amounting to approximately US$8.8 million (US$24.4 and US$7.3 million, respectively, as of December 31, 2007). |
| | (d) | Management periodically reviews the residual value, useful life and method of depreciation of the Group’s property, furniture and equipment to ensure that they are consistent with their actual economic benefits and life expectations. In Management’s opinion, as of December 31, 2008 and 2007 there is no evidence of impairment of the Group’s property, furniture and equipment. |
Notes to the consolidated financial statements (continued)
| 10. | Intangibles assets and goodwill, net |
The movement of intangible assets for the years ended December 31, 2008 and 2007 is as follows:
| Description | | Client Relationships (note 2) | | | Software | | | Developments | | | Other | | | 2008 | | | 2007 | |
| | | US$(000) | | | US$(000) | | | US$(000) | | | US$(000) | | | US$(000) | | | US$(000) | |
| | | | | | | | | | | | | | | | | | | |
| Cost - | | | | | | | | | | | | | | | | | | |
Balance as of January 1st | | | 88,378 | | | | 48,187 | | | | 41,421 | | | | 9,251 | | | | 187,237 | | | | 172,025 | |
| Additions | | | - | | | | 21,404 | | | | 14,297 | | | | 3,560 | | | | 39,261 | | | | 30,404 | |
| Retirements | | | - | | | | (431 | ) | | | (792 | ) | | | (1,213 | ) | | | (2,436 | ) | | | (15,192 | ) |
| Balance as of December 31 | | | 88,378 | | | | 69,160 | | | | 54,926 | | | | 11,598 | | | | 224,062 | | | | 187,237 | |
| | | | | | | | | | | | | | | | | | | | | | | | | |
| Accumulated amortization - | | | | | | | | | | | | | | | | | | | | | | | | |
Balance as of January 1st | | | 5,017 | | | | 19,933 | | | | 16,542 | | | | 6,060 | | | | 47,552 | | | | 45,220 | |
| Amortization of the year | | | 4,419 | | | | 9,980 | | | | 5,627 | | | | 1,309 | | | | 21,335 | | | | 17,478 | |
| Retirements | | | - | | | | (430 | ) | | | (708 | ) | | | (30 | ) | | | (1,168 | ) | | | (15,146 | ) |
| Balance as of December 31 | | | 9,436 | | | | 29,483 | | | | 21,461 | | | | 7,339 | | | | 67,719 | | | | 47,552 | |
| | | | | | | | | | | | | | | | | | | | | | | | | |
| Net book value | | | 78,942 | | | | 39,677 | | | | 33,465 | | | | 4,259 | | | | 156,343 | | | | 139,685 | |
During the year ended December 31, 2008 and 2007, Credicorp has capitalized disbursements related to the implementation and development of sundry computer systems in BCP (mainly SAP-ERP and SERIVA, an integrated system for capital markets operations).
Notes to the consolidated financial statements (continued)
This item is made up as follows:
| | | 2008 | | | 2007 | |
| | | US$(000) | | | US$(000) | |
| | | | | | | |
| Goodwill - | | | | | | |
| Prima AFP (AFP Unión Vida S.A.), note 2 | | | 44,594 | | | | 44,594 | |
| Banco de Crédito del Perú | | | 18,609 | | | | 15,582 | |
| El Pacífico Peruano – Suiza Compañía de Seguros y Reaseguros | | | 13,007 | | | | 13,007 | |
| Atlantic Security Holding Corporation | | | 10,660 | | | | 10,660 | |
| Coporación Novasalud Perú S.A. EPS | | | 3,744 | | | | 3,744 | |
| | | | | | | | | |
| Book value, net | | | 90,614 | | | | 87,587 | |
| | Management annually assesses goodwill to identify any impairment; assumptions used are consistent with previous years. As of December 31, 2008 and 2007, Management concluded that there is no impairment in the recorded goodwill. |
The movement of goodwill for the years ended December 31, 2008, 2007 and 2006 is as follows:
| | | 2008 | | | 2007 | | | 2006 | |
| | | US$(000) | | | US$(000) | | | US$(000) | |
| Cost - | | | | | | | | | |
| Opening balance | | | 87,587 | | | | 88,842 | | | | 33,557 | |
| Acquisition, notes 2 and 3(b) | | | 3,027 | | | | 3,282 | | | | 56,285 | |
| Decreases | | | - | | | | (4,537 | ) | | | (1,000 | ) |
| | | | | | | | | | | | | |
| Final balance | | | 90,614 | | | | 87,587 | | | | 88,842 | |
Notes to the consolidated financial statements (continued)
| 11. | Other assets and other liabilities |
| | (a) | These items are made up as follows: |
| | | 2008 | | | 2007 | |
| | | US$(000) | | | US$(000) | |
| | | | | | | |
| Other assets - | | | | | | |
| Financial instruments: | | | | | | |
| Value added tax credit | | | 124,880 | | | | 55,989 | |
| Derivatives receivable (b) | | | 79,275 | | | | 45,843 | |
| Accounts receivable | | | 56,886 | | | | 47,653 | |
| Operations in process (c) | | | 38,282 | | | | 35,786 | |
| Income tax prepayments, net | | | 27,417 | | | | 12,397 | |
| | | | 326,740 | | | | 197,668 | |
| Non-financial instruments: | | | | | | | | |
| Deferred income tax asset, note 17(c) | | | 67,173 | | | | 66,856 | |
| Prepaid expenses | | | 56,252 | | | | 24,468 | |
| Deferred fees | | | 36,526 | | | | 30,634 | |
| Investments in associates | | | 8,474 | | | | 4,599 | |
| Other | | | 15,755 | | | | 16,160 | |
| | | | 184,180 | | | | 142,717 | |
| Total | | | 510,920 | | | | 340,385 | |
| | | | | | | | | |
| Other liabilities - | | | | | | | | |
| Financial instruments: | | | | | | | | |
| Derivatives payable (b) | | | 256,792 | | | | 69,662 | |
| Accounts payable | | | 126,421 | | | | 122,029 | |
| Payroll, taxes, salaries and other personnel expenses | | | 126,295 | | | | 181,223 | |
| Operations in process (c) | | | 36,996 | | | | 36,063 | |
| Contributions | | | 4,882 | | | | 31,618 | |
| Allowance for indirect loan losses, note 6(d) | | | 23,726 | | | | 18,381 | |
| | | | 575,112 | | | | 458,976 | |
| Non-financial instruments: | | | | | | | | |
| Deferred income tax liability, note 17(c) | | | 66,133 | | | | 89,825 | |
| Provision for sundry risks (d) | | | 47,512 | | | | 24,038 | |
| Other | | | 13,642 | | | | 17,206 | |
| | | | 127,287 | | | | 131,069 | |
| Total | | | 702,399 | | | | 590,045 | |
Notes to the consolidated financial statements (continued)
| | (b) | The table below presents the fair value of derivative financial instruments, recorded as an asset or a liability, together with their notional amounts. The notional amount, recorded gross, is the amount of a derivative’s underlying asset and is the basis upon which changes in the value of derivatives are measured. The notional amounts indicate the volume of transactions outstanding at year end and are not indicative of market risk nor credit risk, note 19(c). |
| | | 2008 | |
| | | Assets | | | Liabilities | | | Notional amount | |
| | | US$(000) | | | US$(000) | | | US$(000) | |
| | | | | | | | | | |
| Derivatives held for trading (i) - | | | | | | | | | |
| Forward exchange contracts | | | 33,427 | | | | 49,979 | | | | 2,478,234 | |
| Interest rate swaps | | | 32,918 | | | | 38,181 | | | | 763,126 | |
| Currency swaps | | | 12,904 | | | | 9,675 | | | | 192,899 | |
| | | | | | | | | | | | | |
| Derivatives held as hedges - | | | | | | | | | | | | |
| Cash flow hedge(ii) : | | | | | | | | | | | | |
| Interest rate swaps, notes 13(a)(i)(*), 13(b) and 12(a) | | | - | | | | 112,978 | | | | 1,283,902 | |
| Cross currency swap | | | - | | | | 5,992 | | | | 39,696 | |
| Cross currency swap and Interest rate swaps (*) | | | 26 | | | | 19,389 | | | | 113,362 | |
| | | | | | | | | | | | �� | |
| Fair value hedge (iii) : | | | | | | | | | | | | |
| Cross currency swap | | | - | | | | 20,598 | | | | 163,985 | |
| | | | 79,275 | | | | 256,792 | | | | 5,035,204 | |
Notes to the consolidated financial statements (continued)
| | | 2007 | |
| | | Assets | | | Liabilities | | | Notional amount | |
| | | US$(000) | | | US$(000) | | | US$(000) | |
| | | | | | | | | | |
| Derivatives held for trading (i) - | | | | | | | | | |
| Forward exchange contracts | | | 36,546 | | | | 19,414 | | | | 2,210,179 | |
| Interest rate swaps | | | 9,297 | | | | 10,986 | | | | 581,841 | |
| Currency swaps | | | - | | | | 1,194 | | | | 118,552 | |
| | | | | | | | | | | | | |
| Derivatives held as hedges - | | | | | | | | | | | | |
| Cash flow hedge (ii) : | | | | | | | | | | | | |
| Interest rate swaps | | | - | | | | 37,433 | | | | 696,000 | |
| | | | | | | | | | | | | |
| Fair value hedge (iii) : | | | | | | | | | | | | |
| Cross currency swap | | | - | | | | 635 | | | | 50,420 | |
| | | | | | | | | | | | | |
| | | | 45,843 | | | | 69,662 | | | | 3,656,992 | |
| | (*) | On December 2007 and during the first months of 2008, the Group entered into three cross currency swaps (CCS) contracts which were initially designated as fair value hedges as they reduced the Group’s exposure to changes in the fair value of three fixed-rate corporate bonds issued in Peruvian currency, see note 15 (a)(i); arising from changes in the exchange rate and interest rates (Libor). |
During 2008, given the current international context, the Group entered into three interest rate swaps (IRS) contracts aimed at mitigating the inherent risks in having a variable interest rate (Libor) for the hedged corporate bonds indicated in the previous paragraph; fixing their respective interest rates. Therefore, in accordance with IAS 39, the initial designations of fair value hedges were revoked and the combined CCS and IRS were redesignated as cash flow hedges from the date of entering into the IRS contracts. In this sense, net loss on these cash flow hedges recognized directly in equity amounted to approximately US$5.8 million.
| | (i) | The Group’s derivative trading activities mainly relate to transactions with customers which are normally laid off with counterparties. The Group may also take positions with the expectation of profiting from favorable movements in prices, rates or indices. Also included under this caption are any derivatives which do not meet IAS 39 hedging requirements. |
Notes to the consolidated financial statements (continued)
| | (ii) | The Group is exposed to variability in future interest cash flows on non-trading assets and liabilities which bear interest at variable rates. The Group uses IRS and CCS as cash flow hedges of these interest rate risks. A schedule indicating as of December 31, 2008 the periods when the hedged cash flows are expected to occur and when they are expected to affect the consolidated income statement is as follows: |
| | | Up to 1 year | | | From 1 to 3 years | | | From 3 to 5 years | | | Over 5 years | |
| | | US$(000) | | | US$(000) | | | US$(000) | | | US$(000) | |
| | | | | | | | | | | | | |
| Cash outflows (liabilities) | | | (11,599 | ) | | | (522,086 | ) | | | (109,169 | ) | | | (71,401 | ) |
| | | | | | | | | | | | | | | | | |
| Income statement | | | (38,299 | ) | | | (48,481 | ) | | | (30,317 | ) | | | (13,926 | ) |
| | For the years 2008 and 2007, the unrealized loss arising from the cash flow hedges amounted to US$80.7 million and US$40.4 million, respectively, and is included in the “Other reserves” caption of the consolidated equity, see note 16(c). Likewise, the transfer of net loss on cash flow hedges to the consolidated income statement amounts to US$14.3 million for the year 2008 (net gain of US$1.0 million for the year 2007). |
| | As of December 31, 2008 and 2007 the accumulated balance of unrealized loss on cash flow hedges recorded in the caption “Other reserves” of the consolidated equity amounted to US$118.1 and US$37.4 million, respectively, see note 16(c). |
| | (iii) | The Group maintains CCS designated as fair value hedges because they reduce the exposure to changes in the fair value of fixed-rate subordinate and corporate bonds denominated in Peruvian currency, see note 15 (a)(ii); related to variations in the foreign currency exchange and interest rates (Libor). |
| | (c) | Operations in process include deposits received, loans disbursed, loans collected, funds transferred and other similar types of transactions, which are made at the end of the month and not reclassified to their final consolidated balance sheet account until the first days of the following month. These transactions do not affect the Group’s net income. |
Notes to the consolidated financial statements (continued)
| | (d) | The movement of the provision for sundry risks for the years ended on December 31, 2008, 2007 and 2006 is as follows: |
| | | 2008 | | | 2007 | | | 2006 | |
| | | US$(000) | | | US$(000) | | | US$(000) | |
| | | | | | | | | | |
| Beginning balance | | | 24,038 | | | | 17,179 | | | | 18,768 | |
| Provision (i), note 24 | | | 37,549 | | | | 8,096 | | | | 6,461 | |
| Decreases | | | (14,075 | ) | | | (1,237 | ) | | | (8,050 | ) |
| | | | | | | | | | | | | |
| Ending balance | | | 47,512 | | | | 24,038 | | | | 17,179 | |
| | (i) | The year 2008 provision include US$36.4 million related to the estimated liability arising from a fund managed by ASHC, which had invested with Bernard L. Madoff Investment Securities LLC (Madoff Securities) on behalf of its clients. In Management’s opinion, based in the information available up to date, it is not expected that any additional liability will be incurred. |
Due to the nature of its business, the Group has some pending legal claims for which it has recorded a provision when, in Management’s and its legal advisor’s opinion, they will result in an additional liability and such amount can be reliably estimated. Regarding any legal claim against the Group which has not been provided for, in Management’s and its legal advisor’s opinion, they will not have a material effect on the Group’s consolidated financial statements.
Notes to the consolidated financial statements (continued)
| | 12. | Deposits and obligations |
| | (a) | This item is made up as follows: |
| | | 2008 | | | 2007 | |
| | | US$(000) | | | US$(000) | |
| | | | | | | |
| Time deposits | | | 4,856,112 | | | | 3,967,864 | |
| Demand deposits | | | 4,578,247 | | | | 3,638,593 | |
| Saving deposits | | | 2,968,739 | | | | 2,380,904 | |
| Severance indemnity deposits | | | 1,039,887 | | | | 896,283 | |
| Client - Repurchase agreements | | | 294,030 | | | | 325,908 | |
| Bank’s negotiable certificates | | | 140,013 | | | | 90,119 | |
| | | | | | | | | |
| | | | 13,877,028 | | | | 11,299,671 | |
| | | | | | | | | |
| Interest payable | | | 73,409 | | | | 51,043 | |
| | | | | | | | | |
| Total | | | 13,950,437 | | | | 11,350,714 | |
The Group has established a policy to remunerate demand deposits and savings accounts according to an interest rate scale, based on their average balance; on the other hand balances that are lower than a specified amount, do not bear interest.
Interest rates are determined by the Group considering interest rates prevailing in the market in which each of Group’s subsidiaries operates. As of December 31, 2008, the Group has hedged time deposits with variable interest rates through interest rate swaps for a notional amount of US$177.9 million, see note 11(b).
Notes to the consolidated financial statements (continued)
| | (b) | The amounts of non-interest and interest bearing deposits and obligations are made up as follows: |
| | | 2008 | | | 2007 | |
| | | US$(000) | | | US$(000) | |
| Non-interest bearing deposits and obligations - | | | | | | |
| In Peru | | | 2,710,770 | | | | 2,257,840 | |
| In other countries | | | 502,759 | | | | 668,468 | |
| | | | 3,213,529 | | | | 2,926,308 | |
| Interest bearing deposits and obligations - | | | | | | | | |
| In Peru | | | 8,689,977 | | | | 6,591,815 | |
| In other countries | | | 1,973,522 | | | | 1,781,548 | |
| | | | 10,663,499 | | | | 8,373,363 | |
| | | | | | | | | |
| Total | | | 13,877,028 | | | | 11,299,671 | |
| | (c) | Time deposits balance classified by maturity is as follows: |
| | | 2008 | | | 2007 | |
| | | US$(000) | | | US$(000) | |
| | | | | | | |
| Up to 3 months | | | 3,039,029 | | | | 2,944,189 | |
| From 3 months to 1 year | | | 1,578,258 | | | | 699,479 | |
| From 1 to 3 years | | | 147,008 | | | | 254,750 | |
| From 3 to 5 years | | | 51,876 | | | | 30,743 | |
| More than 5 years | | | 39,941 | | | | 38,703 | |
| | | | | | | | | |
| Total | | | 4,856,112 | | | | 3,967,864 | |
As of December 31, 2008 and 2007, in Management’s opinion the Group’s deposits and obligations is widely diversified with no significant concentrations.
Notes to the consolidated financial statements (continued)
| 13. | Due to banks and correspondents and borrowed funds |
| | (a) | Due to bank and correspondents - |
This item is made up as follows:
| | | 2008 | | | 2007 | |
| | | US$(000) | | | US$(000) | |
| | | | | | | |
| International funds and others (i) | | | 1,016,932 | | | | 1,145,340 | |
| Promotional credit lines (ii) | | | 109,730 | | | | 196,204 | |
| Inter-bank funds | | | 39,216 | | | | 102,470 | |
| | | | 1,165,878 | | | | 1,444,014 | |
| Interest payable | | | 14,113 | | | | 9,247 | |
| | | | | | | | | |
| Total | | | 1,179,991 | | | | 1,453,261 | |
| | (i) | This item is made up as follows: |
| | | 2008 | | | 2007 | |
| | | US$(000) | | | US$(000) | |
| | | | | | | |
| Syndicated loan (*) | | | 410,000 | | | | 300,000 | |
| Corporación Andina de Fomento - CAF | | | 180,000 | | | | 150,000 | |
| Wachovia Bank | | | 60,326 | | | | 145,000 | |
| Dresdner Bank AG. Frankfurt | | | 45,000 | | | | 35,000 | |
| JP Morgan Chase & Co. | | | 32,000 | | | | 50,000 | |
| Bank of New York | | | 20,000 | | | | 30,000 | |
| Citibank N.A. | | | 20,000 | | | | 40,000 | |
| Commerz Bank | | | 20,000 | | | | 44,780 | |
| Banco Latinoamericano de Exportaciones - BLADEX | | | - | | | | 80,000 | |
| Other | | | 229,606 | | | | 270,560 | |
| | | | | | | | | |
| Total | | | 1,016,932 | | | | 1,145,340 | |
| | (*) | As of December 31, 2007, this amount was related to three loans of US$100 million each one, obtained from three financial entities. In March 2008, these loans were changed to a syndicated loan amounting to US$410.0 million obtained from diverse international financial entities, with maturity due within three years and an interest rate of Libor plus 0.70 percent during the first year, Libor plus 0.75 percent during the second year and Libor plus 0.85 percent during the third year. The syndicated loan, subject to variable interest rate risk, has been hedged through interest rate swap operations for a notional amount of US$410.0 million with the same maturities, see note 11(b). |
Notes to the consolidated financial statements (continued)
As of December 31, 2008, these loans have maturities between January 2009 and March 2011 (between January 2008 and February 2011 as of December 31, 2007) and their annual interest rate is between 3.11 and 7.77 percent (between 4.88 and 5.73 percent as of December 2007).
Some of these borrowings include standard covenants related to financial ratios, use of funds and other administrative matters, which, in Management’s opinion, do not limit the Group’s operations and it has fully complied with as of the consolidated balance sheet dates.
| | (ii) | Promotional credit lines represent loans granted to BCP by Corporación Financiera de Desarrollo (COFIDE) to promote the development of Peru, they have maturities between October 2009 and December 2028 and their annual interest rates are between 6.20 and 7.75 percent (between March 2008 and December 2027 and annual interest rate between 5.73 and 7.75 percent as of December 31, 2007). These credit lines are secured by a loan portfolio amounting to US$109.7 and US$196.2 million as of December 31, 2008 and 2007, respectively. |
Promotional credit lines include standard covenants related to financial ratios, use of funds and other administrative matters, which in Management’s opinion, do not limit the Group’s operations and it has fully complied with as of the consolidated balance sheet dates.
This item is made up as follows:
| | | Interest | | Maturity | | 2008 | | | 2007 | |
| | | % | | | | US$(000) | | | US$(000) | |
| | | | | | | | | | | |
CCR Inc. MT-100, Payment rights master Trust - | | | | | | | | | | |
| 2005 Serie A Floating Rate Certificates | | Libor 1m + 21 bps | | 10/10/2012 | | | 221,079 | | | | 230,000 | |
| 2005 Serie B Floating Rate Certificates | | Libor 1m + 60 bps | | 12/10/2009 | | | 37,918 | | | | 50,000 | |
| 2006 Serie A Floating Rate Certificates | | Libor 1m + 24 bps | | 10/03/2016 | | | 100,000 | | | | 90,404 | |
| 2007 Serie A Floating Rate Certificates | | Libor 1m + 28 bps | | 10/07/2017 | | | 350,000 | | | | 350,000 | |
| 2007 Serie B Floating Rate Certificates | | Libor 1m + 25 bps | | 10/07/2014 | | | 150,000 | | | | 150,000 | |
| 2008 Serie A Fixed Rate Certificates | | 6.27% | | 10/06/2015 | | | 141,719 | | | | - | |
| 2008 Serie B Floating Rate Certificates | | Libor 1m + 225 bps | | 10/12/2015 | | | 150,000 | | | | - | |
| | | | | | | | | | | | | | |
| Total | | | | | | | | 1,150,716 | | | | 870,404 | |
Notes to the consolidated financial statements (continued)
All issuances are secured by the collection of BCP’s (including its foreign branches) future inflows from electronic messages sent through the Society for Worldwide Interbank Financial Telecommunications network and utilized within the network to instruct correspondent banks to make a payment of a certain amount to a beneficiary that is not a financial institution.
Loans obtained include the obligation to comply with certain covenants which, in Management’s opinion, are being fulfilled at the consolidated balance sheet dates.
BCP has signed an insurance policy with AMBAC Assurance Corporation, which guarantees the timely payment of scheduled principal and certain accrued interest of all of the 2007 and 2006 issuances (Series A y B).
Series 2007 (A and B) and a portion of the loan (70 percent) of the 2005 total issuance (Series A and B), subject to variable interest rate risk, has been hedged through an interest rate swap operation, for a notional amount of US$500 million and US$196.0 million, respectively (see note 11(b)).
| | (c) | As of December 31, 2008 and 2007, maturities of due to bank and correspondents and borrowed funds are shown below, based on the remaining period to the repayment date: |
| Due to bank and correspondents | | 2008 | | | 2007 | |
| | | US$(000) | | | US$(000) | |
| | | | | | | |
| Up to 3 months | | | 369,483 | | | | 670,153 | |
| From 3 months to 1 year | | | 256,884 | | | | 307,170 | |
| From 1 to 3 years | | | 502,039 | | | | 338,802 | |
| From 3 to 5 years | | | 6,468 | | | | 105,694 | |
| More than 5 years | | | 31,004 | | | | 22,195 | |
| | | | | | | | | |
| Total | | | 1,165,878 | | | | 1,444,014 | |
| Borrowed funds | | 2008 | | | 2007 | |
| | | US$(000) | | | US$(000) | |
| | | | | | | |
| Up to 1 year | | | 63,324 | | | | 8,165 | |
| From 1 to 3 years | | | 317,541 | | | | 148,921 | |
| From 3 to 5 years | | | 362,374 | | | | 303,476 | |
| More than 5 years | | | 407,477 | | | | 409,842 | |
| | | | | | | | | |
| Total | | | 1,150,716 | | | | 870,404 | |
| | (d) | As of December 31, 2008 and 2007, credit lines granted by several local and foreign financial institutions and available for future operating activities or to settle capital commitments amounted to US$1,617.0 million (US$1,390.5 million as of December 31, 2007). |
Notes to the consolidated financial statements (continued)
| 14. | Technical reserves, insurance claims reserves and reserves for unearned premiums |
| | (a) | This item is made up as follows: |
| | | 2008 | |
| | | Technical reserves | | | Reserves for direct claims | | | Claims assumed | | | Total | |
| | | US$(000) | | | US$(000) | | | US$(000) | | | US$(000) | |
| | | | | | | | | | | | | |
| Life insurance | | | 553,127 | | | | 64,553 | | | | - | | | | 617,680 | |
| General insurance | | | 124,846 | | | | 137,297 | | | | 32,812 | | | | 294,955 | |
| Health insurance | | | 17,367 | | | | 37,741 | | | | 27 | | | | 55,135 | |
| | | | | | | | | | | | | | | | | |
| Total | | | 695,340 | | | | 239,591 | | | | 32,839 | | | | 967,770 | |
| | | 2007 | |
| | | Technical reserves | | | Reserves for direct claims | | | Claims assumed | | | Total | |
| | | US$(000) | | | US$(000) | | | US$(000) | | | US$(000) | |
| | | | | | | | | | | | | |
| Life insurance | | | 500,768 | | | | 50,046 | | | | - | | | | 550,814 | |
| General insurance | | | 97,646 | | | | 92,887 | | | | 21,257 | | | | 211,790 | |
| Health insurance | | | 15,766 | | | | 25,059 | | | | 49 | | | | 40,874 | |
| | | | | | | | | | | | | | | | | |
| Total | | | 614,180 | | | | 167,992 | | | | 21,306 | | | | 803,478 | |
Insurance claims reserves represent reported claims and an estimation for incurred and not reported claims (IBNR). Reported claims are adjusted on the basis of technical reports received from independent adjusters. Claims to be paid by the reinsurers and coinsurers are shown as ceded claims.
As of December 31, 2008, the reserves for direct claims include reserves for incurred and non-reported claims for the three types of risks that the Group manages; US$15.2 millions for life risks, US$4.7 millions for general risks and US$20.1 millions to health risks (US$14.9, US$3.1 and US$18.6 millions, respectively, as of December 31, 2007).
Notes to the consolidated financial statements (continued)
During 2008 and previous years, the differences between the estimations for the incurred and non-reported claims and the settled and pending liquidation claims have not been significant. In the case of general and health risks, retrospective analysis indicate that the amounts provisioned are greater than the settled claims and those pending liquidation by a percentage that does not exceed 10 percent of the provisioned amounts. Management believes that the estimated IBNR reserve is sufficient to cover any liability as of December 31, 2008 and 2007.
The movement for the years ended December 31, 2008 and 2007 of technical and insurance claims reserves is as follows:
| | (b) | Insurance claims reserves (direct and assumed): |
| | | 2008 | |
| | | Life insurance | | | General insurance | | | Health insurance | | | Total | |
| | | US$(000) | | | US$(000) | | | US$(000) | | | US$(000) | |
| | | | | | | | | | | | | |
| Initial balance | | | 50,046 | | | | 114,144 | | | | 25,108 | | | | 189,298 | |
| Claims | | | 88,059 | | | | 163,251 | | | | 155,387 | | | | 406,697 | |
| Payments | | | (72,676 | ) | | | (107,197 | ) | | | (141,470 | ) | | | (321,343 | ) |
| Translation result | | | (876 | ) | | | (89 | ) | | | (1,257 | ) | | | (2,222 | ) |
| | | | | | | | | | | | | | | | | |
| Final balance | | | 64,553 | | | | 170,109 | | | | 37,768 | | | | 272,430 | |
| | | 2007 | |
| | | Life insurance | | | General insurance | | | Health insurance | | | Total | |
| | | US$(000) | | | US$(000) | | | US$(000) | | | US$(000) | |
| | | | | | | | | | | | | |
| Initial balance | | | 42,726 | | | | 41,593 | | | | 19,061 | | | | 103,380 | |
| Claims | | | 63,744 | | | | 152,351 | | | | 108,767 | | | | 324,862 | |
| Payments | | | (57,626 | ) | | | (79,817 | ) | | | (103,061 | ) | | | (240,504 | ) |
| Translation result | | | 1,202 | | | | 17 | | | | 341 | | | | 1,560 | |
| | | | | | | | | | | | | | | | | |
| Final balance | | | 50,046 | | | | 114,144 | | | | 25,108 | | | | 189,298 | |
Notes to the consolidated financial statements (continued)
| | | 2008 | |
| | | Life insurance | | | General insurance | | | Health insurance | | | Total | |
| | | US$(000) | | | US$(000) | | | US$(000) | | | US$(000) | |
| | | | | | | | | | | | | |
| Initial balance | | | 500,768 | | | | 97,646 | | | | 15,766 | | | | 614,180 | |
| Accretion expenses and other | | | 14,808 | | | | - | | | | - | | | | 14,808 | |
| Unearned premium reserves and annual variation, net | | | 1,433 | | | | 27,200 | | | | 1,601 | | | | 30,234 | |
| Insurance subscriptions | | | 70,311 | | | | - | | | | - | | | | 70,311 | |
| Payments | | | (26,732 | ) | | | - | | | | - | | | | (26,732 | ) |
| Translation result | | | (7,461 | ) | | | - | | | | - | | | | (7,461 | ) |
| | | | | | | | | | | | | | | | | |
| Final balance | | | 553,127 | | | | 124,846 | | | | 17,367 | | | | 695,340 | |
| | | 2007 | |
| | | Life insurance | | | General insurance | | | Health insurance | | | Total | |
| | | US$(000) | | | US$(000) | | | US$(000) | | | US$(000) | |
| | | | | | | | | | | | | |
| Initial balance | | | 442,172 | | | | 67,640 | | | | 15,029 | | | | 524,841 | |
| Accretion expenses and other | | | 16,499 | | | | - | | | | - | | | | 16,499 | |
| Unearned premium reserves and annual variation, net | | | 220 | | | | 30,006 | | | | 737 | | | | 30,963 | |
| Insurance subscriptions | | | 78,342 | | | | - | | | | - | | | | 78,342 | |
| Payments | | | (26,868 | ) | | | - | | | | - | | | | (26,868 | ) |
| Translation result | | | (9,597 | ) | | | - | | | | - | | | | (9,597 | ) |
| | | | | | | | | | | | | | | | | |
| Final balance | | | 500,768 | | | | 97,646 | | | | 15,766 | | | | 614,180 | |
As of December 31, 2008 and 2007, no additional reserves were needed as a result of the liability adequacy test. The main assumptions used in estimation of annuities, disability and survivor reserves as of those dates, were the following:
| Modality | | Mortality Table | | Technical rates |
| Life Immediate Annuity | | RV–2004, B-85 and MI-85 | | 4.90% - 5.36% in US$ 3.32% in S/ |
| Dead an Disability Pension System Insurance | | B-85 and MI-85 | | Previsional regime 3.00% Definitive regime 2.14% in S/ Definitive regime 4.57% in US$ |
| Individual Life | | CSO 80 adjustable | | 4.00% - 5.00% |
The mortality tables used are those recommended by the Peruvian regulator (SBS).
Notes to the consolidated financial statements (continued)
The sensitivity of the estimates used by the Group to measure its insurance risks is represented primarily by the life insurance risks; the main variables as of December 31, 2008, are the interest rates and the mortality tables used. The Group has evaluated the changes of the reserves related to its most significant life insurance (Life immediate annuities) of +/- 100 bps of the interest rates and of +/- 5 bps of the mortality factors, being the results as follows:
| | | | | | Variation of the reserve | |
| Variables | | Amount of the reserve | | | Amount | | | Percentage | |
| | | US$(000) | | | US$(000) | | | % | |
| | | | | | | | | | |
| Portfolio in US$ - Basis amount | | | 309,132 | | | | | | | |
| Changes in interest rates: + 100 bps | | | 281,653 | | | | (27,479 | ) | | | (8.89 | ) |
| Changes in interest rates: - 100 bps | | | 341,705 | | | | 32,573 | | | | 10.54 | |
| Changes in Mortality tables to 105% | | | 305,679 | | | | (3,453 | ) | | | (1.12 | ) |
| Changes in Mortality tables to 95% | | | 312,773 | | | | 3,641 | | | | 1.18 | |
| | | | | | Variation of the reserve | |
| Variables | | Amount of the reserve | | | Amount | | | Percentage | |
| | | US$ (000) | | | US$ (000) | | | % | |
| | | | | | | | | | |
| Portfolio in S/ - Basis amount | | | 20,203 | | | | | | | |
| Changes in interest rates: + 100 bps | | | 18,012 | | | | (2,191 | ) | | | (10.84 | ) |
| Changes in interest rates: - 100 bps | | | 22,913 | | | | 2,710 | | | | 13.41 | |
| Changes in Mortality tables to 105% | | | 20,070 | | | | (133 | ) | | | (0.66 | ) |
| Changes in Mortality tables to 95% | | | 20,345 | | | | 142 | | | | 0.70 | |
Notes to the consolidated financial statements (continued)
| 15. | Bonds and subordinated notes issued |
| | (a) | This item is made up as follows: |
| | | Weighted average annual interest rate | | | | | | | | |
| | | 2008 | | | 2007 | | Maturity | | 2008 | | | 2007 | |
| | | % | | | % | | | | US$(000) | | | US$(000) | |
| Bonds - | | | | | | | | | | | | | |
| Corporate bonds (i) | | | 6.91 | | | | 6.59 | | Between November 2009 and July 2018 | | | 227,902 | | | | 127,331 | |
| Leasing bonds (i) | | | 6.87 | | | | 6.10 | | Between June 2009 and August 2018 | | | 217,863 | | | | 167,255 | |
| Subordinated bonds (i) | | | 6.71 | | | | 6.72 | | Between September 2009 and May 2027 | | | 61,074 | | | | 104,841 | |
| Mortgage bonds | | | 7.69 | | | | 7.70 | | Between May 2011 and April 2012 | | | 15,278 | | | | 20,744 | |
| | | | | | | | | | | | | 522,117 | | | | 420,171 | |
| | | | | | | | | | | | | | | | | | |
| Subordinated notes - | | | | | | | | | | | | | | | | | |
| Subordinated negotiable certificates notes | | | 6.95 | | | | 6.95 | | November 2021 | | | 117,512 | | | | 113,503 | |
| Subordinated notes (ii) | | | 7.17 | | | | 7.17 | | October 2022 | | | 137,761 | | | | 161,308 | |
| | | | | | | | | | | | | 777,390 | | | | 694,982 | |
| | | | | | | | | | | | | | | | | | |
| Interest payable | | | | | | | | | | | | 7,840 | | | | 7,316 | |
| | | | | | | | | | | | | | | | | | |
| Total | | | | | | | | | | | | 785,230 | | | | 702,298 | |
Notes to the consolidated financial statements (continued)
| (i) | During 2008 y 2007, the Group issued corporate and leasing bonds for the following amounts: |
| Issuance 2008 | | Amount | | Currency | | Maturity | | Rate | |
| | | US$(000) | | | | | | % | |
| | | | | | | | | | |
| Second Program of Corporate Bonds BCP | | | | | | | | | |
| First issuance - Series B(*) | | | 38,152 | | Nuevo sol | | 27/03/2015 | | | 6.81 | |
| Second issuance - Series A (*) | | | 25,932 | | Nuevo sol | | 18/04/2011 | | | 5.78 | |
| Third issuance - Series A | | | 47,770 | | Nuevo sol | | 12/06/2018 | | | 7.47 | |
| Third issuance - Series B | | | 15,924 | | Nuevo sol | | 10/07/2018 | | | 8.50 | |
| | | | 127,778 | | | | | | | | |
| | | | | | | | | | | | |
| Sixth Program of Leasing Bonds BCP | | | | | | | | | | | |
| Sixth issuance - Series A | | | 31,847 | | Nuevo sol | | 20/08/2018 | | | 8.72 | |
| | | | | | | | | | | | |
| Fourth Program of Leasing Bonds Credito Leasing | | | | | | | | | | | |
| Fourth issuance – Series A | | | 10,492 | | US Dollars | | 08/02/2011 | | | 5.47 | |
| Fourth issuance – Series B | | | 30,000 | | US Dollars | | 14/05/2011 | | | 6.25 | |
| Fourth issuance – Series C | | | 25,000 | | US Dollars | | 23/06/2011 | | | 6.25 | |
| Fourth issuance – Series D | | | 18,000 | | US Dollars | | 23/07/2011 | | | 6.25 | |
| | | | 83,492 | | | | | | | | |
| | | | | | | | | | | | |
| Fifth Program of Leasing Bonds Credito Leasing | | | | | | | | | | | |
| Fourth issuance – Series A | | | 12,739 | | Nuevo sol | | 28/02/2011 | | | 6.06 | |
| Fourth issuance – Series B | | | 1,653 | | Nuevo sol | | 14/05/2011 | | | 5.72 | |
| | | | 14,392 | | | | | | | | |
Notes to the consolidated financial statements (continued)
| Issuance 2007 | | Amount | | Currency | | Maturity | | Rate | |
| | | US$(000) | | | | | | (%) | |
| | | | | | | | | | |
| Second Program of Corporate Bonds BCP | | | | | | | | | |
| First issuance - Series A (*) | | | 48,849 | | Nuevo sol | | 19/12/2014 | | | 6.84 | |
| | | | | | | | | | | | |
| First Program of Leasing Bonds BCP | | | | | | | | | | | |
| Second issuance – Series A | | | 10,000 | | US Dollars | | 10/06/2009 | | | 5.41 | |
| Second issuance – Series B | | | 15,000 | | US Dollars | | 13/07/2009 | | | 5.75 | |
| Second issuance – Series C | | | 9,625 | | US Dollars | | 13/08/2009 | | | 5.72 | |
| Second issuance – Series A | | | 4,777 | | Nuevo sol | | 11/01/2010 | | | 6.06 | |
| | | | 39,402 | | | | | | | | |
| | (*) | As a result of the hedging strategy described in note 11(b)(*), these bonds were economically converted to US Dollars with fixed interest in US Dollar of 4.10, 4.02 and 4.41 percent, respectively, through CCS and IRS. |
During 2008, redeemed corporate, leasing and subordinate bonds amounted to US$23.9 million, US$84.8 million and US$40.3 million, respectively (US$18.8 million, US$55.0 million and US$5.5 million, respectively, during 2007).
| | Leasing and mortgages bonds are collateralized by the fixed assets financed by the Group. |
| (ii) | In October 2007, BCP through its Panama branch, issued Subordinated Notes for S/483.3 million in the international market with maturities on 2022. This debt accrues a fixed annual interest rate of 7.17 percent, for the first 10 years, with semi annual payments. After the first 10 years, in October 2017, interest rate will be the market interest rate for sovereign bonds issued by the Peruvian Government with maturity on 2037, plus 150 basis points, with semi annual payments. At those dates, BCP can redeem 100 percent of the notes, without penalties. This debt, subject to foreign exchange risk and interest rate risk, has been hedged through a CCS; as a result, the Subordinated Notes were changed to US$ Dollars and the fixed interest rate was changed to variable rate of Libor 6 months plus 99 basis points, note 11(b)(iii). |
| | This subordinated debt has certain financial and operating covenants which, in Management’s opinion, the Group is in compliance at the consolidated balance sheet date. |
Notes to the consolidated financial statements (continued)
| | (b) | Bonds and subordinated notes, classified by maturity are shown below: |
| | | 2008 | | | 2007 | |
| | | US$(000) | | | US$(000) | |
| | | | | | | |
| Up to 3 months | | | 1,717 | | | | 61,188 | |
| From 3 months to 1 year | | | 64,190 | | | | 85,968 | |
| From 1 to 3 years | | | 235,867 | | | | 154,953 | |
| From 3 to 5 years | | | 75,398 | | | | 68,007 | |
| Over 5 years | | | 400,218 | | | | 324,866 | |
| | | | | | | | | |
| Total | | | 777,390 | | | | 694,982 | |
As of December 31, 2008, 2007 and 2006, 94,382,317 shares of capital stock were issued at US$5 per share.
As of December 31, 2008, 2007 and 2006, treasury stock comprises the par value of 14,620,842 Credicorp’s shares owned by the Group’s companies. The difference between their acquisition cost (US$186.5 million) and their par value (US$73.1 million), is presented as a reduction of the “Capital surplus”.
In accordance with Peruvian regulation, a reserve of up to at least 35 percent of paid-in capital of the Group’s subsidiaries operating in Peru is required to be established through annual transfers of at least 10 percent of their net income. As of December 31, 2008, 2007 and 2006, these reserves amounted to approximately US$231.7, US$222.7 and US$214.8 million, respectively.
The Shareholders’ meetings held on March 28, 2008, February 28, 2007 and October 26, 2006 agreed to transfer from “Retained earnings” to “Other reserves” an amount of US$228.2, US$107.3 and US$210.4 million, respectively.
Notes to the consolidated financial statements (continued)
The caption “Other reserves” includes the unrealized net gain (loss) from available-for-sale investments and from derivatives instruments used as cash flows hedge net of its corresponding deferred tax and minority interest; its movement is as follows:
| | | Unrealized net gain (loss) of: | | | | |
| | | Available-for- sale investments | | | Derivatives instruments used as cash flow hedge | | | Total | |
| | | US$(000) | | | US$(000) | | | US$(000) | |
| | | | | | | | | | |
Balances as of January 1st, 2006 | | | 81,680 | | | | 1,622 | | | | 83,302 | |
| Net unrealized gain from available-for-sale investments, note 5(c) | | | 69,411 | | | | - | | | | 69,411 | |
| Transfer of net realized gain from investments available-for-sale to the income statement, net of realized loss, note 5(c) | | | (6,620 | ) | | | - | | | | (6,620 | ) |
| Net gain on cash flow hedge | | | - | | | | 1,316 | | | | 1,316 | |
| Balances as of December 31, 2006 | | | 144,471 | | | | 2,938 | | | | 147,409 | |
| | | | | | | | | | | | | |
| Net unrealized gain from available-for-sale investments note 5(c) | | | 85,129 | | | | - | | | | 85,129 | |
| Transfer of net realized gain from investments available-for-sale to the income statement, net of realized loss, note 5(c) | | | (17,634 | ) | | | - | | | | (17,634 | ) |
| Transfer of impairment on investment available-for-sale to income statement, note 5(c) | | | 5,017 | | | | - | | | | 5,017 | |
| Net loss on cash flow hedge, note 11(b)(ii) | | | - | | | | (40,371 | ) | | | (40,371 | ) |
| Balances as of December 31, 2007 | | | 216,983 | | | | (37,433 | ) | | | 179,550 | |
| | | | | | | | | | | | | |
| Net unrealized loss from available-for-sale investments note 5(c) | | | (164,302 | ) | | | - | | | | (164,302 | ) |
| Transfer of net realized gain from investments available-for-sale to the income statement, net of realized loss, note 5(c) | | | (35,684 | ) | | | - | | | | (35,684 | ) |
| Transfer of impairment on investment available-for-sale to income statement, note 5(c) | | | 55,732 | | | | - | | | | 55,732 | |
| Net loss on cash flow hedge, note 11(b)(ii) | | | - | | | | (80,689 | ) | | | (80,689 | ) |
| | | | | | | | | | | | | |
| Balances as of December 31, 2008 | | | 72,729 | | | | (118,122 | ) | | | (45,393 | ) |
Notes to the consolidated financial statements (continued)
| | (d) | Dividend distribution - |
During 2008, 2007 and 2006, Credicorp paid cash dividends, net of the effect of treasury shares, for approximately US$119.6, US$103.7 and US$87.7 million, respectively.
The Shareholders Meeting dated on March 31, 2009 agreed to declare a cash dividend of US$1.50 per Common Share for a total amount of approximately US$141.6 million, corresponding to the results of 2008, which was paid in cash on May 13, 2009.
In accordance with current Peruvian legislation, there is no restriction for overseas remittance of dividends or the repatriation of foreign investment. Dividends paid by the Peruvian subsidiaries to Credicorp are subject to a withholding tax of 4.1 percent.
| | (e) | Equity for legal purposes (Regulatory capital) - - |
As of December 31, 2008 and 2007, the regulatory capital for Credicorp’s subsidiaries engaged in financial and insurance activities in Peru calculated following SBS regulations amounted to approximately US$1,604.7 and US$1,420.2 million, respectively. On the other hand, the consolidated regulatory capital for Credicorp exceeds by approximately US$263.6 million the minimum regulatory capital required as of December 31, 2008 (approximately US$350.4 million as of December 31, 2007).
| | (a) | Credicorp is not subject to income tax or any taxes on capital gains, equity or property. Credicorp’s Peruvian subsidiaries are subject to corporate taxation on income under the Peruvian Tax system. The statutory Income Tax rate was 30 percent on taxable income after calculating the workers’ profit sharing, which in accordance with current legislation is determined using a 5 percent rate. |
ASHC and its Subsidiaries are not subject to taxes in the Cayman Islands or Panama. For the three years ended December 31, 2008, 2007 and 2006, no taxable income was generated from its operations in the United States of America.
Notes to the consolidated financial statements (continued)
The reconciliation between the statutory income tax rate and the effective tax rate for the Group is as follows:
| | | 2008 | | | 2007 | | | 2006 | |
| | | % | | | % | | | % | |
| | | | | | | | | | |
| Peruvian statutory income tax rate | | | 30.00 | | | | 30.00 | | | | 30.00 | |
| Increase (decrease) in the statutory tax rate due to: | | | | | | | | | | | | |
| (i) Increase arising from net income of subsidiaries not domiciled in Peru | | | 4.39 | | | | 0.46 | | | | 4.08 | |
| (ii) Non-taxable income, net | | | (14.90 | ) | | | (5.76 | ) | | | (4.86 | ) |
| (iii) Translation results not considered for tax purposes | | | 3.38 | | | | (3.15 | ) | | | (3.96 | ) |
| | | | | | | | | | | | | |
| Effective income tax rate | | | 22.87 | | | | 21.55 | | | | 25.26 | |
| | (b) | Income tax expense as of December 31, 2008, 2007 and 2006 comprises: |
| | | 2008 | | | 2007 | | | 2006 | |
| | | US$(000) | | | US$(000) | | | US$(000) | |
| | | | | | | | | | |
| Current - | | | | | | | | | |
| In Peru | | | 110,365 | | | | 114,496 | | | | 85,413 | |
| In other countries | | | 3,537 | | | | 2,712 | | | | 2,960 | |
| | | | 113,902 | | | | 117,208 | | | | 88,373 | |
| | | | | | | | | | | | | |
| Deferred - | | | | | | | | | | | | |
| In Peru | | | (4,394 | ) | | | (14,921 | ) | | | (4,786 | ) |
| | | | | | | | | | | | | |
| Total | | | 109,508 | | | | 102,287 | | | | 83,587 | |
The deferred income tax has been calculated on all temporary differences considering an income tax rate of 30 percent.
Notes to the consolidated financial statements (continued)
| | (c) | The following table presents a summary of the Group’s deferred income tax: |
| | | 2008 | | | 2007 | |
| | | US$(000) | | | US$(000) | |
| | | | | | | |
| Assets | | | | | | |
| Allowance for loan losses, net | | | 28,337 | | | | 21,985 | |
| Stock appreciation rights provision | | | 11,578 | | | | 24,001 | |
| Tax loss carry-forward -PPS | | | 6,013 | | | | 4,451 | |
| Reserve for sundry risks, net | | | 9,709 | | | | 8,853 | |
| Non-accrued interest | | | 1,713 | | | | 3,243 | |
| Other | | | 9,823 | | | | 4,323 | |
| Deferred income tax asset | | | 67,173 | | | | 66,856 | |
| | | | | | | | | |
| Liabilities | | | | | | | | |
| Intangibles assets, net | | | (23,128 | ) | | | (25,205 | ) |
| Unrealized net gains on investments | | | (18,809 | ) | | | (38,424 | ) |
| Deferred commissions | | | (6,926 | ) | | | (3,290 | ) |
| Gain for difference tax exchange | | | (5,502 | ) | | | (800 | ) |
| Leasing operations, net | | | (1,862 | ) | | | (1,250 | ) |
| Valuation of Citigroup Indexed certificates | | | (815 | ) | | | (18,131 | ) |
| Other | | | (9,091 | ) | | | (2,725 | ) |
| Deferred income tax liability | | | (66,133 | ) | | | (89,825 | ) |
| | | | | | | | | |
| Net deferred income tax asset (liability) | | | 1,040 | | | | (22,969 | ) |
Credicorp and its subsidiaries have recorded a deferred income tax as part of the equity caption “Other reserves” for US$19.6, US$10.1, and US$9.2 million, as of December 31, 2008, 2007 and 2006, respectively, related to the income tax effects of unrealized gains and losses on investments available for sale. Likewise, in 2006, the Group recognized the deferred tax liability arising from the acquisition of AFP Union Vida (Note 2) for approximately US$25.6 million.
Notes to the consolidated financial statements (continued)
| | (d) | The Peruvian Tax Authority has the right to review and, if necessary, amend the annual tax returns of the Peruvian subsidiaries up to four year after their filing. BCP’s tax returns for years 2001-2005 and PPS’s tax returns for years 2001-2006, were reviewed by the Tax Authority; no significant additional taxes arose from said reviews. Management of each subsidiary has filed an appeal in the applicable cases. |
Years 2006 to 2008 for BCP and 2007 to 2008 for PPS, are pending review. Any additional tax arising as a result of the Tax Authority review will be charged to income in the year when such additional tax is determined. At present, it is not possible to estimate the adjustments that the Tax Authority may determine; however, in Management’s opinion, it is not expected that any additional tax will be determined in amounts considered significant to the consolidated financial statements as of December 31, 2008 and 2007.
| 18. | Stock appreciation rights |
As indicated in note 3(w), Credicorp has granted stock appreciation rights (SARs) to certain key executives and employees who have at least one year service in Credicorp or any of its subsidiaries. At the grant date and in each one of the subsequent three years, the granted SARs may be exercised up to 25 percent of all SARs granted in the plan. The SARs expire after eight years.
The number of outstanding SARs and their exercise prices are as follows:
Year of Issuance | | Number of outstanding SARs issued as of December 31, 2008 | | | Number of Vested SARs as of December 31 | | | Exercise price | |
| | | | | | 2008 | | | 2007 | | | 2008 | | | 2007 | |
| | | | | | | | | | | | US$ | | | US$ | |
| | | | | | | | | | | | | | | | |
| 2000 | | | - | | | | - | | | | 49,750 | | | | 8.00 | | | | 8.50 | |
| 2001 | | | 60,000 | | | | 60,000 | | | | 73,000 | | | | 4.80 | | | | 5.30 | |
| 2002 | | | 60,000 | | | | 60,000 | | | | 92,500 | | | | 6.48 | | | | 6.98 | |
| 2003 | | | 134,900 | | | | 134,900 | | | | 151,900 | | | | 7.67 | | | | 8.17 | |
| 2004 | | | 185,950 | | | | 185,950 | | | | 237,700 | | | | 10.49 | | | | 10.99 | |
| 2005 | | | 241,700 | | | | 241,700 | | | | 349,813 | | | | 15.50 | | | | 16.00 | |
| 2006 | | | 362,800 | | | | 327,784 | | | | 310,800 | | | | 24.82 | | | | 25.32 | |
| 2007 | | | 513,125 | | | | 320,859 | | | | 271,656 | | | | 48.00 | | | | 48.50 | |
| 2008 | | | 656,750 | | | | 286,625 | | | | - | | | | 72.04 | | | | - | |
| | | | 2,215,225 | | | | 1,617,818 | | | | 1,537,119 | | | | | | | | | |
Notes to the consolidated financial statements (continued)
Credicorp’s Management has estimated the SARs´ fair value as of December 31, 2008 and 2007, using the binomial option pricing model, considering the following market information:
| Key assumptions | | 2008 | | | 2007 | |
| | | | | | | |
| Expected volatility | | | 34.98 | % | | | 32.70 | % |
| Risk free interest rate | | | 6.25 | % | | | 3.51 | % |
| Expected lifetime | | 4.84 years | | | 4.92 years | |
| Quoted price of Credicorp shares at year-end | | US$ | 49.96 | | | US$ | 76.30 | |
The movement of the SARs for the years ended December 31, 2008 and 2007 is as follows:
| | | 2008 | | | 2007 | |
| | | Outstanding SARs | | | Vested SARs | | | Outstanding SARs | | | Vested SARs | |
| | | Number | | | Number | | | Amount | | | Number | | | Number | | | Amount | |
| | | | | | | | | US$(000) | | | | | | | | | US$(000) | |
| | | | | | | | | | | | | | | | | | | |
Balance as of January 1st | | | 2,134,650 | | | | 1,537,119 | | | | 89,602 | | | | 1,858,350 | | | | 1,301,928 | | | | 38,761 | |
| Granted and vested | | | 665,500 | | | | 576,874 | | | | 9,498 | | | | 689,500 | | | | 647,610 | | | | 22,248 | |
| Exercised | | | (496,175 | ) | | | (496,175 | ) | | | (19,734 | ) | | | (410,700 | ) | | | (410,700 | ) | | | (18,801 | ) |
| Decrease | | | (88,750 | ) | | | - | | | | - | | | | (2,500 | ) | | | (1,719 | ) | | | (88 | ) |
| Increase (decrease) in the option fair value | | | - | | | | - | | | | (36,379 | ) | | | - | | | | - | | | | 47,482 | |
| | | | | | | | | | | | | | | | | | | | | | | | | |
| Balance as of December 31 | | | 2,215,225 | | | | 1,617,818 | | | | 42,987 | | | | 2,134,650 | | | | 1,537,119 | | | | 89,602 | |
Credicorp assumes the payment of the related income tax on behalf of its executives and employees, which corresponds to 30 percent of the benefit. Credicorp estimates said income tax over the basis of the liability recorded for the vested benefits.
The liabilities, including the above mentioned income tax, recorded for this plan are included in the consolidated balance sheet caption “Other liabilities – Payroll taxes, salaries and other personnel expenses”, note 11 (a), and the expenses in the consolidated income statement caption “Personnel expenses”. In 2008, 2007 and 2006, SARs prices were modified and informed to the Group’s executives and employees.
During 2008, 2007 and 2006, the Group signed several contracts with Citigroup by which it acquired certificates linked to the yield of Credicorp’s shares, see note 7(b).
On April, 2009, Credicorp implemented a new share base payment plan to certain key executives and employees. Under the new plan, Credicorp’s shares will be granted to certain key executives and employees who have at least one year service in Credicorp or any of its subsidiaries. At the grant date, being the grant date April 28, 2009, and in each of the subsequent three years, shares granted will be vesting up to 33.3 percent of all granted shares. Also, on April 2009, it was agreed that the above explained SARs program and the SARs granted until December 2008 remain in force, with certain modifications, until the SARs expire.
Notes to the consolidated financial statements (continued)
| 19. | Off-balance sheet accounts |
| | (a) | This item is made up as follows: |
| | | 2008 | | | 2007 | |
| | | US$(000) | | | US$(000) | |
| | | | | | | |
| Contingent credits (b)- | | | | | | |
| Guarantees and stand by letters | | | 1,506,506 | | | | 1,133,476 | |
| Import and export letters of credit | | | 249,396 | | | | 431,049 | |
| | | | 1,755,902 | | | | 1,564,525 | |
| | | | | | | | | |
| Responsibilities under credit lines agreements (d) | | | 1,234,964 | | | | 1,082,115 | |
| Forward currency contracts - sell (c) | | | 1,552,917 | | | | 939,531 | |
| Forward currency contracts - buy (c) | | | (925,317 | ) | | | (1,270,648 | ) |
| Swap contracts (c) | | | | | | | | |
| Interest rate swaps | | | 2,160,390 | | | | 1,277,841 | |
| Currency swaps | | | 192,899 | | | | 118,552 | |
| Cross currency swaps | | | 317,043 | | | | 50,420 | |
| | | | | | | | | |
| Total | | | 6,288,798 | | | | 3,762,336 | |
| | (b) | In the normal course of its business, the Group’s banking subsidiaries are party to transactions with off-balance sheet risk. These transactions expose them to credit risk in addition to the amounts recognized in the consolidated balance sheets. |
Credit risk for off-balance sheet financial instruments is defined as the possibility of sustaining a loss because any other party to a financial instrument fails to perform in accordance with the terms of the contract. The exposures to losses are represented by the contractual amount specified in the related contracts. The Group applies the same credit policies in making commitments and conditional obligations as it does for on-balance sheet instruments (note 6(a)), including the requirement to obtain collateral when it is deemed necessary. Collateral held varies, but may include deposits in financial institutions, securities or other assets. Many of the contingent transactions are expected to expire without any performance being required, therefore the total committed amounts do not necessarily represent future cash requirements.
Notes to the consolidated financial statements (continued)
| | (c) | As of December 31, 2008 and 2007, Credicorp has currency forwards derivatives. Currency forwards are commitments to buy or sell currency at a future date at a contracted price. Risk arises from the possibility that the counter-party to the transaction does not perform as agreed and from the changes in the prices of the underlying currencies. As of those dates, forward currency purchase and sale agreements nominal amounts were approximately US$2,478.2 million and US$2,210.2 million, respectively, which in general have maturities of less than a year. These agreements are entered into to satisfy client requirements and are recognized in the consolidated financial statements at their fair value. As of December 31, 2008, the forward contracts net position is an oversell of U.S. Dollars of approximately US$627.6 million (overbuy of approximately US$331.1 million as of December 31, 2007). |
Interest rate and currency swaps are derivatives contracts, where counter parties exchange variable interest rates for fixed interest rates or different currencies, respectively, in the terms and conditions established at the contract inception. The risk arises each time the projected level of the variable rate during the term of the contract is higher than the swap rate, as well as from non-compliance with contractual terms by one of the parties. As of December 31, 2008, the notional amount of open interest rate and currency swap contracts was approximately US$2,353.3 million (approximately US$1,396.4 million as of December 31, 2007).
Cross currency swap derivative contract involves the exchange of interest payments based on two different currency principal balances and reference interest rate, generally also includes the exchange of principal amounts at the start and / or end of the contract. As of December 31, 2008, the notional amount of cross currency swap contracts were approximately US$317.0 million (approximately US$50.4 million as of December 31, 2007).
As of December 31, 2008, the fair values of the asset and liability forward exchange contracts and interest rate and cross currency swaps amounted approximately to US$79.3 and US$256.8 million, respectively (approximately US$45.8 and US$69.7 million as of December 31, 2007) and are included under the caption “Other assets and other liabilities” of the consolidated balance sheets, respectively, note 11(b).
| | (d) | Responsibilities under credit lines agreements include credit lines and other consumer loans facilities (credit card) and are cancelable upon notification to the client. |
Notes to the consolidated financial statements (continued)
| 20. | Interest and dividend income and interest expenses |
These items are made up as follow:
| | | 2008 | | | 2007 | | | 2006 | |
| | | US$(000) | | | US$(000) | | | US$(000) | |
| | | | | | | | | | |
| Interest and dividend income | | | | | | | | | |
| Interest on loans | | | 963,940 | | | | 701,471 | | | | 537,671 | |
| Interest on due from banks | | | 75,266 | | | | 105,817 | | | | 93,886 | |
| Interest on trading securities | | | 1,168 | | | | 3,289 | | | | 2,913 | |
| Interest on investments available-for-sale | | | 298,549 | | | | 228,473 | | | | 132,792 | |
| Dividends from investments available-for-sale and trading securities | | | 12,214 | | | | 9,083 | | | | 9,140 | |
| Gain from hedging derivatives instruments | | | 15,794 | | | | 635 | | | | - | |
| Other interest income | | | 33,403 | | | | 17,206 | | | | 5,600 | |
| | | | | | | | | | | | | |
| Total | | | 1,400,334 | | | | 1,065,974 | | | | 782,002 | |
| | | | | | | | | | | | | |
| Interest expenses | | | | | | | | | | | | |
| Interest on deposits and obligations | | | (360,238 | ) | | | (295,750 | ) | | | (189,552 | ) |
| Interest on bonds and subordinated notes issued | | | (51,756 | ) | | | (33,592 | ) | | | (25,282 | ) |
| Interest on due to banks and correspondents and borrowed funds | | | (104,818 | ) | | | (83,070 | ) | | | (56,634 | ) |
| Loss from hedging derivatives instruments | | | (16,296 | ) | | | (635 | ) | | | - | |
| Other interest expenses | | | (44,303 | ) | | | (18,953 | ) | | | (12,010 | ) |
| | | | | | | | | | | | | |
| Total | | | (577,411 | ) | | | (432,000 | ) | | | (283,478 | ) |
During 2008, 2007 and 2006 the interest income accrued on impaired financial instrument recognized in the consolidated income statement amounted to US$4.7, US$3.5 and US$4.1 million, respectively.
Notes to the consolidated financial statements (continued)
| 21. | Banking services commissions |
This item is made up as follows:
| | | 2008 | | | 2007 | | | 2006 | |
| | | US$(000) | | | US$(000) | | | US$(000) | |
| | | | | | | | | | |
| Maintenance of accounts and transfers and credit and debit card services | | | 180,512 | | | | 152,626 | | | | 122,534 | |
| Funds management | | | 102,760 | | | | 83,726 | | | | 38,728 | |
| Contingent credits | | | 30,174 | | | | 23,819 | | | | 22,344 | |
| Collection services | | | 26,795 | | | | 27,163 | | | | 24,514 | |
| Commissions for banking services | | | 12,851 | | | | 9,468 | | | | 7,300 | |
| Brokerage and custody services | | | 10,075 | | | | 13,708 | | | | 7,793 | |
| Other | | | 31,080 | | | | 14,251 | | | | 20,565 | |
| | | | | | | | | | | | | |
| Total | | | 394,247 | | | | 324,761 | | | | 243,778 | |
This item is made up as follows:
| | | Gross premiums (*) | | | Premiums ceded to reinsurers, net (**) | | | Assumed from other companies, net | | | Net premiums earned | | | Percentage of assumed net premiums | |
| | | US$(000) | | | US$(000) | | | US$(000) | | | US$(000) | | | % | |
| | | | | | | | | | | | | | | | |
| 2008 | | | | | | | | | | | | | | | |
| Life insurance | | | 110,730 | | | | (2,484 | ) | | | 6 | | | | 108,252 | | | | - | |
| Health insurance | | | 169,410 | | | | (2,692 | ) | | | - | | | | 166,718 | | | | - | |
| General insurance | | | 218,563 | | | | (105,431 | ) | | | 5,801 | | | | 118,933 | | | | 4.88 | |
| | | | | | | | | | | | | | | | | | | | | |
| Total | | | 498,703 | | | | (110,607 | ) | | | 5,807 | | | | 393,903 | | | | 1.47 | |
| | | | | | | | | | | | | | | | | | | | | |
| 2007 | | | | | | | | | | | | | | | | | | | | |
| Life insurance | | | 89,598 | | | | (2,658 | ) | | | 1,408 | | | | 88,348 | | | | 1.59 | |
| Health insurance | | | 129,306 | | | | (2,488 | ) | | | 116 | | | | 126,934 | | | | 0.09 | |
| General insurance | | | 146,331 | | | | (71,759 | ) | | | 7,418 | | | | 81,990 | | | | 9.05 | |
| | | | | | | | | | | | | | | | | | | | | |
| Total | | | 365,235 | | | | (76,905 | ) | | | 8,942 | | | | 297,272 | | | | 3.01 | |
Notes to the consolidated financial statements (continued)
| | | Gross premiums (*) | | | Premiums ceded to reinsurers, net (**) | | | Assumed from other companies, net | | | Net premiums earned | | | Percentage of assumed net premiums | |
| | | US$(000) | | | US$(000) | | | US$(000) | | | US$(000) | | | % | |
| | | | | | | | | | | | | | | | |
| 2006 | | | | | | | | | | | | | | | |
| Life insurance | | | 66,477 | | | | (2,923 | ) | | | 1,228 | | | | 64,782 | | | | 1.90 | |
| Health insurance | | | 111,295 | | | | (2,377 | ) | | | 1,526 | | | | 110,444 | | | | 1.38 | |
| General insurance | | | 138,964 | | | | (64,767 | ) | | | 1,838 | | | | 76,035 | | | | 2.42 | |
| | | | | | | | | | | | | | | | | | | | | |
| Total | | | 316,736 | | | | (70,067 | ) | | | 4,592 | | | | 251,261 | | | | 1.83 | |
| (*) | Includes the annual variation of the technical and unearned premiums reserves. |
| (**) | “Premiums ceded to reinsurers, net” include: |
| | (i) | US$22.5 million for non- proportional automatic contracts (excess of loss) (US$17.5 million in the year 2007), |
| | (ii) | US$3.7 million for reinstallation premiums (US$6.1 million in the year 2007) and |
| | (iii) | US$84.3 million for facultative contracts (US$53.1 million in the year 2007). |
Notes to the consolidated financial statements (continued)
| 23. | Net claims incurred for life, general and health insurance contracts |
This item is made up as follows:
| | | 2008 | |
| | | Life insurance | | | General insurance | | | Health insurance | | | Total | |
| | | US$(000) | | | US$(000) | | | US$(000) | | | US$(000) | |
| | | | | | | | | | | | | |
| Gross insurance claims | | | 88,059 | | | | 163,251 | | | | 155,387 | | | | 406,697 | |
| Ceded claims | | | (1,693 | ) | | | (61,361 | ) | | | (1,733 | ) | | | (64,787 | ) |
| | | | | | | | | | | | | | | | | |
| Net insurance claims | | | 86,366 | | | | 101,890 | | | | 153,654 | | | | 341,910 | |
| | | 2007 | |
| | | Life insurance | | | General insurance | | | Health insurance | | | Total | |
| | | US$(000) | | | US$(000) | | | US$(000) | | | US$(000) | |
| | | | | | | | | | | | | |
| Gross insurance claims | | | 63,744 | | | | 152,351 | | | | 108,767 | | | | 324,862 | |
| Ceded claims | | | (52 | ) | | | (84,662 | ) | | | (1,548 | ) | | | (86,262 | ) |
| | | | | | | | | | | | | | | | | |
| Net insurance claims | | | 63,692 | | | | 67,689 | | | | 107,219 | | | | 238,600 | |
| | | 2006 | |
| | | Life insurance | | | General insurance | | | Health insurance | | | Total | |
| | | US$(000) | | | US$(000) | | | US$(000) | | | US$(000) | |
| | | | | | | | | | | | | |
| Gross insurance claims | | | 52,713 | | | | 60,285 | | | | 89,797 | | | | 202,795 | |
| Ceded claims | | | (823 | ) | | | (13,698 | ) | | | (1,752 | ) | | | (16,273 | ) |
| | | | | | | | | | | | | | | | | |
| Net insurance claims | | | 51,890 | | | | 46,587 | | | | 88,045 | | | | 186,522 | |
Notes to the consolidated financial statements (continued)
| 24. | Other income and expenses |
These items are made up as follow:
| | | 2008 | | | 2007 | | | 2006 | |
| | | US$(000) | | | US$(000) | | | US$(000) | |
| | | | | | | | | | |
| Other income | | | | | | | | | |
| Income from the sale of seized assets | | | 12,895 | | | | 10,689 | | | | 9,244 | |
| Real estate rental income | | | 7,743 | | | | 3,519 | | | | 3,031 | |
| Recoveries of other accounts receivable and other assets | | | 2,859 | | | | 3,113 | | | | 1,763 | |
| Other | | | 14,175 | | | | 7,613 | | | | 8,638 | |
| | | | | | | | | | | | | |
| Total other income | | | 37,672 | | | | 24,934 | | | | 22,676 | |
| | | | | | | | | | | | | |
| Other expenses | | | | | | | | | | | | |
| Commissions from insurance activities | | | 39,364 | | | | 29,135 | | | | 25,555 | |
| Provision for sundry risks, note 11(d) | | | 37,549 | | | | 8,096 | | | | 6,461 | |
| Sundry technical insurance expenses | | | 9,158 | | | | 21,929 | | | | 10,910 | |
| Provision for other accounts receivables | | | 3,288 | | | | 2,836 | | | | 3,163 | |
| Other | | | 12,517 | | | | 10,003 | | | | 6,629 | |
| | | | | | | | | | | | | |
| Total other expenses | | | 101,876 | | | | 71,999 | | | | 52,718 | |
Notes to the consolidated financial statements (continued)
The net earning per ordinary share has been determined over the net income attributable to equity holders of Credicorp as follows:
| | | 2008 | | | 2007 | | | 2006 | |
| | | | | | | | | | |
| Number of shares: | | | | | | | | | |
| Ordinary shares, note 16(a) | | | 94,382,317 | | | | 94,382,317 | | | | 94,382,317 | |
| Less - treasury shares, note 16(b) | | | (14,620,842 | ) | | | (14,620,842 | ) | | | (14,620,842 | ) |
| Weighted outstanding average number of ordinary shares | | | 79,761,475 | | | | 79,761,475 | | | | 79,761,475 | |
| | | | | | | | | | | | | |
| Net income attributable to equity holders of Credicorp (in thousands of U.S. dollars) | | | 357,756 | | | | 350,735 | | | | 230,013 | |
| | | | | | | | | | | | | |
| Basic and diluted earnings per share for net income attributable to equity holders of Credicorp (in U.S. Dollars) | | | 4.49 | | | | 4.40 | | | | 2.88 | |
Notes to the consolidated financial statements (continued)
Transactions between the business segments are realized on normal commercial terms and conditions. The following table presents the Group’s financial information by industry (primary segment) and geographical area (secondary segment) as of December 31, 2008, 2007 and 2006:
| | (i) | Business segments by industry (amount expressed in million of U.S. Dollars): |
| | | External income | | | Income from other segments | | | Eliminations | | | Total income (*) | | | Operating income (**) | | | Total assets | | | Fixed assets, net | | | Depreciation and amortization | | | Impairment of available-for-sale investments | | | Other provisions (***) | |
| | | | | | | | | | | | | | | | | | | | | | | | | | | | | | | |
| 2008 | | | | | | | | | | | | | | | | | | | | | | | | | | | | | | |
| Banking | | | 1,797 | | | | 83 | | | | (83 | ) | | | 1,797 | | | | 804 | | | | 19,168 | | | | 262 | | | | 44 | | | | 44 | | | | 54 | |
| Insurance | | | 469 | | | | 15 | | | | (15 | ) | | | 469 | | | | 118 | | | | 1,231 | | | | 56 | | | | 4 | | | | 11 | | | | - | |
| Pension funds | | | 71 | | | | 1 | | | | (1 | ) | | | 71 | | | | - | | | | 224 | | | | 11 | | | | 9 | | | | - | | | | - | |
| Brokerage and other | | | 50 | | | | 62 | | | | (62 | ) | | | 50 | | | | (47 | ) | | | 198 | | | | - | | | | - | | | | 5 | | | | (4 | ) |
| | | | | | | | | | | | | | | | | | | | | | | | | | | | | | | | | | | | | | | | | |
| Total consolidated | | | 2,387 | | | | 161 | | | | (161 | ) | | | 2,387 | | | | 875 | | | | 20,821 | | | | 329 | | | | 57 | | | | 60 | | | | 50 | |
| | | | | | | | | | | | | | | | | | | | | | | | | | | | | | | | | | | | | | | | | |
| 2007 | | | | | | | | | | | | | | | | | | | | | | | | | | | | | | | | | | | | | | | | |
| Banking | | | 1,407 | | | | 65 | | | | (65 | ) | | | 1,407 | | | | 614 | | | | 16,245 | | | | 218 | | | | 39 | | | | 5 | | | | 35 | |
| Insurance | | | 377 | | | | 13 | | | | (13 | ) | | | 377 | | | | 110 | | | | 1,138 | | | | 46 | | | | 4 | | | | - | | | | - | |
| Pension funds | | | 55 | | | | (4 | ) | | | 4 | | | | 55 | | | | (1 | ) | | | 244 | | | | 11 | | | | 8 | | | | - | | | | - | |
| Brokerage and other | | | 47 | | | | 7 | | | | (7 | ) | | | 47 | | | | (30 | ) | | | 79 | | | | - | | | | - | | | | - | | | | (4 | ) |
| | | | | | | | | | | | | | | | | | | | | | | | | | | | | | | | | | | | | | | | | |
| Total consolidated | | | 1,886 | | | | 81 | | | | (81 | ) | | | 1,886 | | | | 693 | | | | 17,706 | | | | 275 | | | | 51 | | | | 5 | | | | 31 | |
| | | | | | | | | | | | | | | | | | | | | | | | | | | | | | | | | | | | | | | | | |
| 2006 | | | | | | | | | | | | | | | | | | | | | | | | | | | | | | | | | | | | | | | | |
| Banking | | | 975 | | | | 24 | | | | (24 | ) | | | 975 | | | | 447 | | | | 11,090 | | | | 197 | | | | 36 | | | | - | | | | 2 | |
| Insurance | | | 316 | | | | 2 | | | | (2 | ) | | | 316 | | | | 115 | | | | 989 | | | | 47 | | | | 4 | | | | - | | | | - | |
| Pension funds | | | 23 | | | | - | | | | - | | | | 23 | | | | - | | | | 227 | | | | 11 | | | | 10 | | | | - | | | | - | |
| Brokerage and other | | | 58 | | | | 1 | | | | (1 | ) | | | 58 | | | | 1 | | | | 576 | | | | - | | | | - | | | | - | | | | - | |
| | | | | | | | | | | | | | | | | | | | | | | | | | | | | | | | | | | | | | | | | |
| Total consolidated | | | 1,372 | | | | 27 | | | | (27 | ) | | | 1,372 | | | | 563 | | | | 12,882 | | | | 255 | | | | 50 | | | | - | | | | 2 | |
Notes to the consolidated financial statements (continued)
| (ii) | Segment information by geographical area (amounts expressed in millions of U.S. Dollars): |
| | | 2008 | | | 2007 | | | 2006 | |
| | | Total income (*) | | | Operating income (**) | | | Total assets | | | Total income (*) | | | Operating income (**) | | | Total assets | | | Total income (*) | | | Operating income (**) | | | Total assets | |
| | | | | | | | | | | | | | | | | | | | | | | | | | | | |
| Peru | | | 2,035 | | | | 805 | | | | 16,081 | | | | 1,573 | | | | 625 | | | | 12,693 | | | | 1,152 | | | | 518 | | | | 9,655 | |
| Panama | | | 204 | | | | 19 | | | | 2,490 | | | | 107 | | | | 10 | | | | 2,506 | | | | 55 | | | | 7 | | | | 839 | |
| Cayman Islands | | | 24 | | | | (4 | ) | | | 1,088 | | | | 100 | | | | 19 | | | | 1,423 | | | | 81 | | | | 14 | | | | 1,364 | |
| Bolivia | | | 112 | | | | 52 | | | | 933 | | | | 78 | | | | 38 | | | | 815 | | | | 62 | | | | 28 | | | | 654 | |
| United States of America | | | 12 | | | | 3 | | | | 229 | | | | 28 | | | | 1 | | | | 269 | | | | 22 | | | | (4 | ) | | | 370 | |
| | | | | | | | | | | | | | | | | | | | | | | | | | | | | | | | | | | | | |
| Total consolidated | | | 2,387 | | | | 875 | | | | 20,821 | | | | 1,886 | | | | 693 | | | | 17,706 | | | | 1,372 | | | | 563 | | | | 12,882 | |
| (*) | Includes total interest and dividend income, other income and net premiums earned from insurance activities. |
| (**) | Operating income includes the net interest income from banking activities and the amount of the net premiums earned, less insurance claims. |
| (***) | Correspond to reserves for seized assets and the allowance for loan losses. |
Notes to the consolidated financial statements (continued)
| 27. | Transactions with related parties |
| (a) | The Group’s consolidated financial statements as of December 31, 2008 and 2007 include transactions with related companies, the Board of Directors, the Group’s key executives (defined as the management of Credicorp’s Holding) and enterprises which are controlled by these individuals through their majority shareholding or their role as chairman or CEO. |
| (b) | The following table shows the main transactions with related parties as of December 31, 2008 and 2007. |
| | | 2008 | | | 2007 | |
| | | US$(000) | | | US$(000) | |
| | | | | | | |
| Direct loans | | | 143,855 | | | | 94,102 | |
| Trading securities | | | 1 | | | | 1,673 | |
| Investments available-for-sale | | | 63,782 | | | | 90,396 | |
| Deposits | | | 34,669 | | | | 31,689 | |
| Contingent credits | | | 23,574 | | | | 14,026 | |
| Derivatives at fair value | | | 4,179 | | | | 386 | |
| Interest income related to loans – income | | | 2,889 | | | | 2,288 | |
| Interest expense related to deposits - expense | | | 2,669 | | | | 2,009 | |
| Other income | | | 2,533 | | | | 1,192 | |
| (c) | All transactions with related parties are made in accordance with normal market conditions available to other customers. As of December 31, 2008, direct loans to related companies are secured by collaterals, and had maturities between February 2009 and July 2017 and accrued an annual averages interest rate of 7.98 percent (as of December 31, 2007 had maturities between January 2008 and September 2017 and accrued an annual average interest rate of 6.79 percent). Likewise, as of December 31, 2008 and 2007, the Group maintains allowance for loan losses to related parties amount to approximately US$1.2 million, respectively. |
| (d) | As of December 31, 2008 and 2007, directors, officers and employees of the Group have been involved, directly and indirectly, in credit transactions with certain subsidiaries of the Group, as permitted by Peruvian Banking and Insurance Law Nº26702, which regulates and limits certain transactions with employees, directors and officers of a bank or an insurance company. As of December 31, 2008 and 2007, direct loans to employees, directors and key management amounts to US$116.3 and US$85.1 million, respectively and are paid monthly and earn interest at market rates. |
There are no loans to the Group’s directors and key personnel guaranteed with Credicorp or any of it Subsidiaries’ shares.
Notes to the consolidated financial statements (continued)
| (e) | The Group’s key executives compensation (including the related income taxes assumed by the Group) as of December 31, 2008, 2007 and 2006, comprised the following: |
| | | 2008 | | | 2007 | | | 2006 | |
| | | US$(000) | | | US$(000) | | | US$(000) | |
| | | | | | | | | | |
| Stock appreciation rights, note 18 | | | 27,362 | | | | 27,113 | | | | 23,206 | |
| Salaries | | | 5,625 | | | | 5,535 | | | | 4,824 | |
| Directors compensations | | | 1,303 | | | | 1,162 | | | | 1,173 | |
| Other | | | 8,209 | | | | 12,947 | | | | 6,962 | |
| | | | | | | | | | | | | |
| Total | | | 42,499 | | | | 46,757 | | | | 36,165 | |
| (f) | As of December 31, 2008 and 2007, the Group has participation in different mutual funds and hedge funds managed by certain Group’s subsidiaries, classified as trading securities and Investments available-for-sale for a total amount of US$94.7 million and US$133.8 million, respectively. |
Notes to the consolidated financial statements (continued)
| 28. | Financial instruments classification |
The following are the carrying amounts of the financial assets and liabilities captions in the consolidated balance sheets, by categories as defined under IAS 39:
| | | As of December 31, 2008 | | | As of December 31, 2007 | |
| | | Financial assets/liabilities designated at fair value | | | | | | | | | | | | | | | Financial assets/liabilities designated at fair value | | | | | | | | | | | | | |
| | | Held for trading | | | At inception | | | Loans and receivables | | | Investments available-for-sale | | | Liabilities at amortized cost | | | Total | | | Held for trading | | | At inception | | | Loans and receivables | | | Investments available-for-sale | | | Liabilities at amortized cost | | | Total | |
| | | US$(000) | | | US$(000) | | | US$(000) | | | US$(000) | | | US$(000) | | | US$(000) | | | US$(000) | | | US$(000) | | | US$(000) | | | US$(000) | | | US$(000) | | | US$(000) | |
| Assets | | | | | | | | | | | | | | | | | | | | | | | | | | | | | | | | | | | | |
| Cash and due from banks | | | - | | | | - | | | | 3,766,171 | | | | - | | | | - | | | | 3,766,171 | | | | - | | | | - | | | | 3,073,865 | | | | - | | | | - | | | | 3,073,865 | |
| Trading securities | | | 36,084 | | | | - | | | | - | | | | - | | | | - | | | | 36,084 | | | | 50,995 | | | | - | | | | - | | | | - | | | | - | | | | 50,995 | |
| Investments available-for-sale | | | - | | | | - | | | | - | | | | 4,959,068 | | | | - | | | | 4,959,068 | | | | - | | | | - | | | | - | | | | 5,228,641 | | | | - | | | | 5,228,641 | |
| Loans, net | | | - | | | | - | | | | 10,322,041 | | | | - | | | | - | | | | 10,322,041 | | | | - | | | | - | | | | 8,039,500 | | | | - | | | | - | | | | 8,039,500 | |
| Financial assets designated at fair value through profit or loss | | | - | | | | 129,631 | | | | - | | | | - | | | | - | | | | 129,631 | | | | - | | | | 213,153 | | | | - | | | | - | | | | - | | | | 213,153 | |
| Premiums and other policies receivable | | | - | | | | - | | | | 111,561 | | | | - | | | | - | | | | 111,561 | | | | - | | | | - | | | | 85,495 | | | | - | | | | - | | | | 85,495 | |
| Accounts receivable from reinsurers and coinsurers | | | - | | | | - | | | | 165,144 | | | | - | | | | - | | | | 165,144 | | | | - | | | | - | | | | 116,141 | | | | - | | | | - | | | | 116,141 | |
| Due from customers on acceptances | | | - | | | | - | | | | 232,580 | | | | - | | | | - | | | | 232,580 | | | | - | | | | - | | | | 35,901 | | | | - | | | | - | | | | 35,901 | |
| Other assets, note 11 | | | 79,275 | | | | - | | | | 247,465 | | | | - | | | | - | | | | 326,740 | | | | 45,843 | | | | - | | | | 151,825 | | | | - | | | | - | | | | 197,668 | |
| | | | | | | | | | | | | | | | | | | | | | | | | | | | | | | | | | | | | | | | | | | | | | | | | |
| | | | 115,359 | | | | 129,631 | | | | 14,844,962 | | | | 4,959,068 | | | | - | | | | 20,049,020 | | | | 96,838 | | | | 213,153 | | | | 11,502,727 | | | | 5,228,641 | | | | - | | | | 17,041,359 | |
| | | | | | | | | | | | | | | | | | | | | | | | | | | | | | | | | | | | | | | | | | | | | | | | | |
| Liabilities | | | | | | | | | | | | | | | | | | | | | | | | | | | | | | | | | | | | | | | | | | | | | | | | |
| Deposits and obligation | | | - | | | | - | | | | - | | | | - | | | | 13,950,437 | | | | 13,950,437 | | | | - | | | | - | | | | - | | | | - | | | | 11,350,714 | | | | 11,350,714 | |
| Financial liabilities designated at fair value through profit or loss | | | - | | | | - | | | | - | | | | - | | | | - | | | | - | | | | - | | | | 50,561 | | | | - | | | | - | | | | - | | | | 50,561 | |
| Due to banks and correspondents | | | - | | | | - | | | | - | | | | - | | | | 1,179,991 | | | | 1,179,991 | | | | - | | | | - | | | | - | | | | - | | | | 1,453,261 | | | | 1,453,261 | |
| Due from customers on acceptances | | | - | | | | - | | | | - | | | | - | | | | 232,580 | | | | 232,580 | | | | - | | | | - | | | | - | | | | - | | | | 35,901 | | | | 35,901 | |
| Accounts payable to reinsurers and coinsurers | | | - | | | | - | | | | - | | | | - | | | | 55,841 | | | | 55,841 | | | | - | | | | - | | | | - | | | | - | | | | 33,963 | | | | 33,963 | |
| Borrowed funds | | | - | | | | - | | | | - | | | | - | | | | 1,150,716 | | | | 1,150,716 | | | | - | | | | - | | | | - | | | | - | | | | 870,404 | | | | 870,404 | |
| Bonds and subordinated notes issued | | | - | | | | - | | | | - | | | | - | | | | 785,230 | | | | 785,230 | | | | - | | | | - | | | | - | | | | - | | | | 702,298 | | | | 702,298 | |
| Other liabilities, note 11 | | | 256,792 | | | | - | | | | - | | | | - | | | | 318,320 | | | | 575,112 | | | | 69,662 | | | | - | | | | - | | | | - | | | | 389,314 | | | | 458,976 | |
| | | | | | | | | | | | | | | | | | | | | | | | | | | | | | | | | | | | | | | | | | | | | | | | | |
| | | | 256,792 | | | | - | | | | - | | | | - | | | | 17,673,115 | | | | 17,929,907 | | | | 69,662 | | | | 50,561 | | | | - | | | | - | | | | 14,835,855 | | | | 14,956,078 | |
Notes to the consolidated financial statements (continued)
| 29. | Financial risk management |
By their nature, the Group’s activities involve principally the use of financial instruments, including derivatives. The Group accepts deposits from customers at both fixed and floating rates, for various periods, and seeks to earn above-average interest margins by investing these funds in high-quality assets. The Group seeks to increase these margins by consolidating short-term funds and lending for longer periods at higher rates, while maintaining sufficient liquidity to meet all claims that might fall due.
The Group also seeks to raise its interest margins by obtaining above-average market margins, net of allowances, through lending to commercial and retail borrowers with a range of credit products. Such exposures involve not just on-balance sheet loans and advances; the Group also enters into guarantees and other commitments such as letters of credit and performance.
The Group also trades in financial instruments where it takes positions in traded and over-the-counter instruments, including derivatives, to take advantage of short-term market movements in equities, bonds, currency and interest rates.
In this sense, risk is inherent in the Group’s activities but it is managed through a process of ongoing identification, measurement and monitoring, subject to risk limits and other controls. This process of risk management is critical to the Group’s continuing profitability and each individual within the Group is accountable for the risk exposures relating to his or her responsibilities. The Group is exposed to operating risk, credit risk, liquidity risk and market risk, the latter being subdivided into trading and non-trading risks.
The independent risk control process does not include business risks such as changes in the environment, technology and industry. They are monitored through the Group’s strategic planning process.
| (a) | Risk management structure- |
The Group’s Board of Directors and of each subsidiary is ultimately responsible for identifying and controlling risks; however, there are separate independent bodies in the major subsidiaries (BCP, PPS and ASHC) responsible for managing and monitoring risks, as further explained bellow:
The Board of Directors of each major subsidiary is responsible for the overall risk management approach and responsible for the approval of the policies and strategies currently in place. The Board provides written principles for overall risk management, as well as written policies covering specific areas, such as foreign exchange risk, interest rate risk, credit risk, use of derivative financial instruments and non-derivative financial instruments.
Notes to the consolidated financial statements (continued)
| (ii) | Risk Management Committee |
The Risk Management Committee of each major subsidiary is responsible for the strategy used for mitigating risks as well as setting forth the overall principles, policies and limits for the different types of risks; it is also responsible for monitoring fundamental risk issues and manages and monitors the relevant risk decisions.
| (iii) | Risk Management Department |
The Risk Management Department of each major subsidiary is responsible for developing, implementing and improving, on a continuous basis, the Group’s risk management infrastructure by adopting and incorporating global best practices and following established policies.
Risk management processes throughout the Group are monitored by the internal audit function, which examines both the adequacy of the procedures and the compliance of them. Internal Audit discusses the results of all assessments with Management, and reports its findings and recommendations to Credicorp’s Audit Committee and Board of Directors.
| (v) | Treasury and Foreign Exchange Departments |
Treasury Department is responsible for managing the Group’s assets and liabilities and the overall financial structure. It is also primarily responsible for the Group’s management of funding and liquidity risks; as well as the investment, forward and spot portfolios, assuming the related liquidity, interest rate and exchange rate risks, under the policies and limits currently effective.
| (b) | Risk measurement and reporting systems- |
The Group's risks are measured using a method which reflects both the expected loss likely to arise in normal circumstances and unexpected losses, which are an estimate of the ultimate actual loss based on statistical models. The models make use of probabilities derived from historical experience, adjusted to reflect the economic environment. The Group also runs worse case scenarios that would arise in the event that extreme events which are unlikely to occur do, in fact, occur.
Monitoring and controlling risks are primarily performed based on limits established by the Group. These limits reflect the business strategy and market environment of the Group as well as the level of risk that the Group is willing to accept. In addition, the Group monitors and measures the overall risk bearing capacity in relation to the aggregate risk exposure across all risk types and activities.
Notes to the consolidated financial statements (continued)
Information compiled from all the Group’s subsidiaries is examined and processed in order to analyze, control and identify early risks. This information is presented and explained to the Board of Directors, the Risk Management Committee, and all relevant members of the Group. The report includes aggregate credit exposure, credit metric forecasts, hold limit exceptions, VaR (Value at Risk), liquidity ratios and risk profile changes. Senior management assesses the fair value of the investments and the appropriateness of the allowance for credit losses periodically.
As part of its overall risk management, the Group uses derivatives and other instruments to manage exposures resulting from changes in interest rates, foreign currencies, equity risk and credit risk.
The risk profile is assessed before entering into hedge transactions, which are authorized by the appropriate level of seniority within the Group. The effectiveness of hedges is assessed by the Risk Management Department (based on economic considerations rather than the IFRS hedge accounting regulations). The effectiveness of all the hedge relationships is monitored by the unit monthly. In situations of ineffectiveness, the Group will enter into a new hedge relationship to mitigate risk on a continuous basis.
The Group actively uses collateral to reduce its credit risks.
| (d) | Excessive risk concentration- |
Concentrations arise when a number of counterparties are engaged in similar business activities, or activities in the same geographic region, or have similar economic, political or other conditions. Concentrations indicate the relative sensitivity of the Group’s performance to developments affecting a particular industry or geographical location.
In order to avoid excessive concentrations of risk, the Group’s policies and procedures include specific guidelines to focus on maintaining a diversified portfolio. Identified concentrations of credit risks are controlled and managed accordingly.
| (a) | The Group takes on exposure to credit risk, which is the risk that a counterparty will cause a financial loss by failing to discharge an obligation. Credit risk is the most important risk for the Group’s business; Management therefore carefully manages its exposure to credit risk. Credit exposures arise principally in lending activities that lead to loans, and investment activities that bring debt securities and other bills into the Group’s asset portfolio. There is also credit risk in off-balance sheet financial instruments, such as contingent credits, which expose the Group to similar risks to loans and these are mitigated by the same control processes and policies. Likewise, credit risk arising from derivative financial instruments is, at any time, limited to those with positive fair values, as recorded in the consolidated balance sheet. |
Notes to the consolidated financial statements (continued)
Impairment provisions are provided for losses that have been incurred at the consolidated balance sheet date. Significant changes in the economy or in the particular situation of an industry segment that represents a concentration in the Group’s portfolio could result in losses that are different from those provided for at the consolidated balance sheet date.
The Group structures the levels of credit risk it undertakes by placing limits on the amount of risk accepted in relation to one borrower or groups of borrowers, and to geographical and industry segments. Such risks are monitored on a revolving basis and subject to a frequent review. Limits in the level of credit risk by product, industry sector and by geographic segment are approved by the Board of Directors.
Exposure to credit risk is managed through regular analysis of the ability of borrowers and potential borrowers to meet interest and principal repayment obligations and by changing these lending limits where appropriate. Some other specific control and mitigation measures are outlined below:
The Group employs a range of policies and practices to mitigate credit risk. The most traditional of these is the taking of security for funds advances, which is common practice. The Group implements guidelines on the acceptability of specific classes of collateral or credit risk mitigation. The principal collateral types for loans and advances are mortgages over residential properties; liens over business assets such as premises, inventory and accounts receivable; liens over financial instruments such as debt securities and equities.
Longer-term finance and lending to corporate entities are generally secured; revolving individual credit facilities are generally unsecured. In addition, in order to minimize credit loss the Group will seek additional collateral from the counterparty as soon as impairment indicators arise.
Collateral held as security for financial assets other than loans is determined by the nature of the instrument. Debt securities, treasury and other eligible bills are generally unsecured, with the exception of asset-backed securities and similar instruments, which are secured by portfolios of financial instruments.
Management monitors the market value of collateral, requests additional collateral in accordance with the underlying agreement, and monitors the market value of collateral obtained during its review of the adequacy of the allowance for impairment losses. It is the Group’s policy to dispose of repossessed properties in an orderly manner. The proceeds are used to reduce or repay the outstanding claim. In general, the Group does not use repossessed properties for its business own.
Notes to the consolidated financial statements (continued)
The Group maintains strict control limits on net open derivative positions (i.e., the difference between purchase and sale contracts), by both amount and term. The amount subject to credit risk is limited to the current fair value of instruments that are favorable to the Group (i.e., an asset when fair value is positive), which in relation to derivatives is only a small fraction of the contract, or notional values used to express the volume of instruments outstanding. This credit risk exposure is managed as part of the overall lending limits with customers, together with potential exposures from market movements. Collateral or other security is not usually obtained for credit risk exposures on these instruments.
Settlement risk arises in any situation where a payment in cash, securities or equities is made in the expectation of a corresponding receipt in cash, securities or equities. Daily settlement limits are established for each counterparty to cover the aggregate of all settlement risk arising from the Group’s market transactions on any single day.
| (iii) | Credit-related commitments |
The primary purpose of these instruments is to ensure that funds are available to a customer as required. Guarantees and standby letters of credit have the same credit risk as loans. Documentary and commercial letters of credit - which are written undertakings by the Group on behalf of a customer authorizing a third party to draw drafts on the Group up to a stipulated amount under specific terms and conditions - are collateralized by the underlying shipments of goods to which they relate and therefore have less risk than a direct loan. The Group has no mandatory commitments to extend credit.
In order to manage credit risk, as part of the Risk Management Department of the Group, see note 29(a), there is a Risk Management Service Unit whose major functions are implementing methodologies and statistical models for measuring credit risk exposures, developing and applying methodologies for the calculation of risk-ratings, both at the corporate and business unit levels, performing analysis of credit concentrations, verifying that credit exposures are within the established limits and suggesting global risk exposures by economic sector, time term, among others.
Also, a Risk Assessment Committee has been established comprising 3 directors, the Chief Executive Officer, the Chief Financial Officer, the Deputy Chief Executive Officer and the Risk Management Department Manager. Each of the financial indicators prepared by the Risk Management Service Unit are analyzed by this committee on a quarterly basis to subsequently evaluate the policies, procedures and limits currently effective at the Group to ensure that an efficient and effective risk management is always in place.
Notes to the consolidated financial statements (continued)
At the same time, the Group has a Credit Division, which establishes the overall credit policies for each and all the businesses in which the Group decides to take part. These policies are set forth based on the guidelines established by the Board of Directors and keeping in mind the statutory financial laws and regulations. The main activities of this function are to establish the client credit standards and guidelines (evaluation, authorization and control), to follow the guidelines established by the Board of Directors and General Management as well as those established by governmental regulatory bodies, to review and authorize credit applications, up to the limit within the scope of its responsibilities and to submit to upper hierarchies those credit applications exceeding the established limits, to monitor credit-granting activities within the different autonomous bodies, among others.
| (b) | The maximum exposure to credit risk as of December 31, 2008 and 2007, before the effect of mitigation through any collateral, is the book value of each class of financial assets mentioned in note 29.7 and the contingent credits detailed in note 19(a). |
Management is confident in its ability to continue to control and sustain minimal exposure of credit risk to the Group resulting from both its loan portfolio and investments based on the following:
| - | 98 percent of the loans portfolio is categorized in the top two grades of the internal rating system as of December 31, 2008 (97 percent as of December 31, 2007); |
| - | 95 percent of the loan portfolio is considered to be neither past due nor impaired as of December 31, 2008 (94 percent as of December 31, 2007); |
| - | 83 percent of the investments have at least investment grade credit rating (BBB- or higher) or are debt securities issued by Banco Central de Reserva del Peru - BCRP (not rated) as of December 31, 2008 (75 percent as of December 31, 2007); and |
| - | 17 percent and 52 percent of the cash and due from banks represent amounts deposited in the Group’s vaults and in the BCRP (including overnight operations), respectively, as of December 31, 2008 (18 percent and 59 percent, respectively, as of December 31, 2007). |
| (c) | Credit risk management for loans - - |
Credicorp classifies its loan portfolio into one of five risk categories, depending upon the degree of risk of non-payment of each debtor. The grades used by Credicorp are: (i) normal, (ii) potential problems, (iii) substandard, (iv) doubtful and (v) loss, and have the following characteristics:
Normal (Class A): Debtors of commercial loans that fall into this category have complied on a timely basis with their obligations and at the time of evaluation do not present any reason for doubt with respect to repayment of interest and principal on the agreed dates, and there is no reason to believe that the status will change before the next evaluation. To place a loan in Class A, a clear understanding of the use to be made of the funds and the origin of the cash flows to be used by the debtor to repay the loan is required. Consumer loans warrant Class A classification if payments are current or up to eight days past-due. Residential mortgage loans warrant Class A classification if payments are current or up to thirty days past-due.
Notes to the consolidated financial statements (continued)
Potential problems (Class B): Debtors of commercial loans included in this category are those that at the time of the evaluation demonstrate certain deficiencies, which, if not corrected on a timely manner, imply risks with respect to the recovery of the loan. Certain common characteristics of loans or credits in the category include: delays in loan payments which are promptly covered, a general lack of information required to analyze the credit, out-of-date financial information, temporary economic or financial imbalances on the part of the debtor which could affect its ability to repay the loan, market conditions that could affect the economic sector in which the debtor is active, material overdue debts or pending judicial collection actions initiated by other financial institutions, noncompliance with originally contracted conditions, conflicts of interest within the client, labor problems; unfavorable credit history, noncompliance with its own internal policies of concentration of suppliers or customers, and low inventory turnover ratios or large inventories that are subject to competitive challenges or technological obsolescence. Consumer loans are categorized as Class B if payments are between 9 and 30 days late. Residential mortgage loans become Class B when payments are between 31 and 90 days late.
Substandard (Class C): Debtors of commercial loans included in this category demonstrate serious financial weakness, often with operating results or available income insufficient to cover financial obligations on agreed upon terms, with no reasonable short-term prospects for a strengthening of their financial capacity. Debtors demonstrating the same deficiencies that warrant classification as category B warrant classification as Class C if those deficiencies are such that if they are not corrected in the near term, they could impede the recovery of principal and interest on the loan on the originally agreed terms. In addition, commercial loans are classified in this category when payments are between 61 and 120 days late. If payments on a consumer loan are between 31 and 60 days late, such loans are classified as Class C. Residential mortgage loans are classified as Class C when payments are between 91 and 120 days late.
Doubtful (Class D): Debtors of commercial loans included in this category present characteristics that make doubtful the recovery of the loan. Although the loan recovery is doubtful, if there is a reasonable possibility that in the near future the creditworthiness of the debtor might improve, a Class D categorization is appropriate. These credits are distinguished from Class E credits by the requirement that the debtor remain in operation, generate cash flow, and make payments on the loan, albeit at a rate less than that specified in its contractual obligations. In addition, commercial loans are classified in this category when payments are between 121 and 365 days late. Consumer loans are categorized as Class D if payments are between 61 and 120 days late. Residential mortgage loans are Class D when payments are between 121 and 365 days late.
Loss credits (Class E): Commercial loans or credits which are considered unrecoverable or which for any other reason should not appear on Group’s books as an asset based on the originally contracted terms fall into this category. In addition, commercial loans are classified in this category when payments are more than 365 days late. Consumer loans are categorized as Class E if payments are more than 120 days late. Residential mortgage loans are Class E when payments are more than 365 days late.
The Group reviews its loan portfolio on a continuing basis in order to assess the completion and accuracy of its grades.
Notes to the consolidated financial statements (continued)
All loans considered impaired (the ones classified as substandard, doubtful and loss) are analyzed by the Group’s Management, which addresses impairment in two areas: individually assessed allowances and collectively assessed allowances, as follows:
| - | Individually assessed allowance - |
The Group determines the allowances appropriate for each individually significant loan or advance on an individual basis. Items considered when determining allowance amounts include the sustainability of the counterparty’s business plan, its ability to improve performance once a financial difficulty has arisen, projected receipts and the expected dividend payout should bankruptcy ensue, the availability of other financial support and the realizable value of collateral, and the timing of the expected cash flows. Impairment losses are evaluated at each reporting date, unless unforeseen circumstances require more careful attention.
The methodology and assumptions used for estimating future cash flows are reviewed regularly by the Group in order to reduce any differences between loss estimates and actual loss experience.
| - | Collectively assessed allowance - |
Allowances are assessed collectively for losses on loans and advances that are not individually significant (including consumer and residential mortgages) and for individually significant loans and advances where there is not yet objective evidence of individual impairment (included in categories A and B). Allowances are evaluated on each reporting date with each portfolio receiving a separate review.
The collective assessment takes account of impairment that is likely to be present in the portfolio even though there is not yet objective evidence of the impairment in an individual assessment. Impairment losses are estimated by taking into consideration of the following information: historical losses on the portfolio, current economic conditions, the approximate delay between the time a loss is likely to have been incurred and the time it will be identified as requiring an individually assessed impairment allowance, and expected receipts and recoveries once impaired. Local management is responsible for deciding the length of this period which can extend for as long as one year. The impairment allowance is then reviewed by credit management to ensure alignment with the Group’s overall policy.
Financial guarantees and letter of credit are assessed and provision made in similar manners as for loans.
In the case of borrowers in countries where there is an increased risk of difficulties in servicing external debt, an assessment of the political and economic situation is made, and an additional country risk provisions provided.
When a loan is uncollectible, it is written off against the related provision for loan impairment. Such loans are written off after all the necessary procedures have been completed and the amount of the loss has been determined. Subsequent recoveries of amounts previously written off decrease the amount of the provision for loan impairment in the consolidated income statements.
Notes to the consolidated financial statements (continued)
The following is a summary of the direct loans classified in three major groups: i) Loans neither past due nor impaired, comprising those direct loans having presently no delinquency characteristics and related to clients ranked as normal and potential problems; ii) Past due but not impaired loans comprising past due loans of clients classified as normal or with potential problems and iii) Impaired loans, or those past due loans of clients classified as substandard, doubtful and loss; presented net of the provision for loan losses for each of the loan grades:
| | | As of December 31, 2008 | |
| | | Commercial loans | | | Residential mortgage loans | | | Consumer loans | | | Total | | | % | |
| | | US$(000) | | | US$(000) | | | US$(000) | | | US$(000) | | | | |
| | | | | | | | | | | | | | | | |
| Neither past due nor impaired - | | | | | | | | | | | | | | | |
| Normal | | | 7,526,355 | | | | 1,350,793 | | | | 1,020,352 | | | | 9,897,500 | | | | 94 | |
| Potential problem | | | 214,040 | | | | 18,348 | | | | 8,932 | | | | 241,320 | | | | 2 | |
| | | | | | | | | | | | | | | | | | | | | |
| Past due but not impaired - | | | | | | | | | | | | | | | | | | | | |
| Normal | | | 186,887 | | | | 83,757 | | | | 78,629 | | | | 349,273 | | | | 3 | |
| Potential problem | | | 14,231 | | | | 387 | | | | 1,027 | | | | 15,645 | | | | - | |
| | | | | | | | | | | | | | | | | | | | | |
| Impaired - | | | | | | | | | | | | | | | | | | | | |
| Substandard | | | 41,570 | | | | 11,337 | | | | 18,982 | | | | 71,889 | | | | 1 | |
| Doubtful | | | 46,309 | | | | 12,630 | | | | 21,146 | | | | 80,085 | | | | 1 | |
| Loss | | | 29,193 | | | | 7,962 | | | | 13,331 | | | | 50,486 | | | | 1 | |
| Gross | | | 8,058,585 | | | | 1,485,214 | | | | 1,162,399 | | | | 10,706,198 | | | | 102 | |
| Less: Allowance for loan losses | | | 137,444 | | | | 30,832 | | | | 56,061 | | | | 224,337 | | | | 2 | |
| Total, net | | | 7,921,141 | | | | 1,454,382 | | | | 1,106,338 | | | | 10,481,861 | | | | 100 | |
Notes to the consolidated financial statements (continued)
| | | As of December 31, 2007 | |
| | | Commercial loans | | | Residential mortgage loans | | | Consumer loans | | | Total | | | % | |
| | | US$(000) | | | US$(000) | | | US$(000) | | | US$(000) | | | | |
| Neither past due nor impaired - | | | | | | | | | | | | | | | |
| Normal | | | 5,517,220 | | | | 1,138,912 | | | | 779,866 | | | | 7,435,998 | | | | 91 | |
| Potential problem | | | 347,186 | | | | 13,781 | | | | 7,463 | | | | 368,430 | | | | 5 | |
| | | | | | | | | | | | | | | | | | | | | |
| Past due but not impaired - | | | | | | | | | | | | | | | | | | | | |
| Normal | | | 204,766 | | | | 70,738 | | | | 52,379 | | | | 327,883 | | | | 4 | |
| Potential problem | | | 5,410 | | | | 318 | | | | 134 | | | | 5,862 | | | | - | |
| | | | | | | | | | | | | | | | | | | | | |
| Impaired - | | | | | | | | | | | | | | | | | | | | |
| Substandard | | | 49,535 | | | | 10,097 | | | | 11,733 | | | | 71,365 | | | | 1 | |
| Doubtful | | | 61,578 | | | | 12,552 | | | | 14,586 | | | | 88,716 | | | | 1 | |
| Loss | | | 36,483 | | | | 7,437 | | | | 8,643 | | | | 52,563 | | | | 1 | |
| Gross | | | 6,222,178 | | | | 1,253,835 | | | | 874,804 | | | | 8,350,817 | | | | 103 | |
| Less: Allowance for loan losses | | | 166,203 | | | | 14,454 | | | | 30,662 | | | | 211,319 | | | | 3 | |
| | | | | | | | | | | | | | | | | | | | | |
| Total, net | | | 6,055,975 | | | | 1,239,381 | | | | 844,142 | | | | 8,139,498 | | | | 100 | |
As of December 31, 2008 and 2007, loans that are neither past-due nor impaired whose terms have been renegotiated amounts to US$10.3 and US$19.7 million, respectively.
As of December 31, 2008 and 2007, loans amounting to approximately US$349.3 and US$327.9 million, respectively, were not impaired and were past due for less than 30 days.
Notes to the consolidated financial statements (continued)
The break down of the gross amount of impaired loans by class, along with the fair value of related collateral and the amounts of their allowance for loan losses, is as follows:
| | | As of December 31, 2008 | |
| | | Commercial loans | | | Residential mortgage loans | | | Consumer loans | | | Total | |
| | | US$(000) | | | US$(000) | | | US$(000) | | | US$(000) | |
| | | | | | | | | | | | | |
| Impaired loans | | | 117,072 | | | | 31,929 | | | | 53,459 | | | | 202,460 | |
| | | | | | | | | | | | | | | | | |
| Fair value of collateral | | | 49,254 | | | | 18,742 | | | | 4,386 | | | | 72,382 | |
| | | | | | | | | | | | | | | | | |
| Allowance for loan losses | | | 50,782 | | | | 11,395 | | | | 29,722 | | | | 91,899 | |
| | | As of December 31, 2007 | |
| | | Commercial loans | | | Residential mortgage loans | | | Consumer loans | | | Total | |
| | | US$(000) | | | US$(000) | | | US$(000) | | | US$(000) | |
| | | | | | | | | | | | | |
| Impaired loans | | | 147,596 | | | | 30,086 | | | | 34,962 | | | | 212,644 | |
| | | | | | | | | | | | | | | | | |
| Fair value of collateral | | | 59,957 | | | | 19,863 | | | | 3,914 | | | | 83,734 | |
| | | | | | | | | | | | | | | | | |
| Allowance for loan losses | | | 72,793 | | | | 6,238 | | | | 20,173 | | | | 99,204 | |
| (d) | Credit risk management on investments in trading securities and available-for-sale - |
The Group evaluates the credit risk identified of each of the financial instruments in these categories, stating the risk rating granted to them by a risk rating agency. For investments traded in Peru, the risk ratings use are those provided by Apoyo & Asociados Internacionales S.A.C. (a Peruvian rating agency authorized by the Peruvian government regulator and associated to Fitch Rating) and for investments traded abroad, the risk-ratings used are those provided by Standard & Poors. In the event any subsidiary use a risk-rating prepared by any other risk rating agency, such risk-ratings are standardized with those provided by the afore-mentioned institutions for consolidation purposes.
The following table shows the analysis of the risk-rating of available-for-sale investments, provided by the institutions referred to above. These financial instruments are mostly concentrated on the first risk ratings or are debt securities issued by Banco Central de Reserva del Peru – BCRP (not rated), as a way to reduce their impact on the consolidated financial statements of any eventual substantial loss that may arise from the impairment of the credit and general position of issuers. The exposure composition is as follows:
Notes to the consolidated financial statements (continued)
| | | As of December 31, 2008 | | | As of December 31, 2007 | |
| | | US$(000) | | | % | | | US$(000) | | | % | |
| | | | | | | | | | | | | |
| Instruments rated in Peru | | | | | | | | | | | | |
| AAA | | | 426,653 | | | | 8.6 | | | | 285,661 | | | | 5.5 | |
| AA- to AA+ | | | 36,486 | | | | 0.8 | | | | 35,943 | | | | 0.7 | |
| A to A+ | | | 18,346 | | | | 0.4 | | | | 13,306 | | | | 0.3 | |
| BBB- to BBB | | | - | | | | - | | | | 2,018 | | | | - | |
| BB- to BB+ | | | 1,858 | | | | - | | | | 2,214 | | | | - | |
| Lower than B- | | | - | | | | - | | | | - | | | | - | |
| Unrated (*) | | | 2,466,772 | | | | 49.7 | | | | 2,854,295 | | | | 54.6 | |
| | | | 2,950,115 | | | | 59.5 | | | | 3,193,437 | | | | 61.1 | |
| | | | | | | | | | | | | | | | | |
| Instruments rated abroad | | | | | | | | | | | | | | | | |
| AAA | | | 105,249 | | | | 2.1 | | | | 242,428 | | | | 4.6 | |
| AA- to AA+ | | | 128,714 | | | | 2.6 | | | | 132,907 | | | | 2.5 | |
| A to A+ | | | 410,118 | | | | 8.3 | | | | 234,455 | | | | 4.5 | |
| BBB- to BBB+ | | | 785,250 | | | | 15.8 | | | | 584,549 | | | | 11.2 | |
| BB- to BB+ | | | 325,861 | | | | 6.6 | | | | 539,816 | | | | 10.4 | |
| Lower than B- | | | 20,394 | | | | 0.4 | | | | 22,740 | | | | 0.4 | |
| Unrated (*) | | | 233,367 | | | | 4.7 | | | | 278,309 | | | | 5.3 | |
| | | | 2,008,953 | | | | 40.5 | | | | 2,035,204 | | | | 38.9 | |
| | | | | | | | | | | | | | | | | |
| Total | | | 4,959,068 | | | | 100.00 | | | | 5,228,641 | | | | 100.0 | |
| (*) | As of December 31, 2008, includes principally US$2,208.9 million, US$217.6 million and US$131.3 million of debt securities issued by BCRP, listed and non-listed equity securities and mutual funds, respectively (US$2,407.0 million, US$321.1 million and US$198.4 million as of December 31, 2007, respectively). |
As of December 31, 2008 and 2007, most of held for trading investments were financial instruments issued by the BCRP or had an investment grade rating.
Notes to the consolidated financial statements (continued)
The following table presents the summary of the various techniques used by the Group to measure the Investments available-for-sale recognized at fair value in percentage:
| | | 2008 | | | 2007 | |
| | | % | | | % | |
| | | | | | | |
| Quoted Market Price | | | 40.0 | | | | 39.4 | |
| Valuation Techniques - market observable inputs | | | 58.8 | | | | 58.6 | |
| Valuation Techniques - non-market observable inputs | | | 1.2 | | | | 2.0 | |
| | | | | | | | | |
| Total | | | 100.0 | | | | 100.0 | |
Notes to the consolidated financial statements (continued)
| | (e) | Concentration of financial instruments exposed to credit risk: |
As of December 31, 2008 and 2007, the financial instruments with exposure to the credit risk were distributed by the following economic sectors:
| | | 2008 | | | 2007 | |
| | | Designated at fair value through profit or loss | | | | | | | | | | | | Designated at fair value through profit or loss | | | | | | | | | | |
| | | Held for trading | | | At inception | | | Loans and receivables | | | Investments available-for-sale | | | Total | | | Held for trading | | | At inception | | | Loans and receivables | | | Investments available-for-sale | | | Total | |
| | | US$(000) | | | US$(000) | | | US$(000) | | | US$(000) | | | US$(000) | | | US$(000) | | | US$(000) | | | US$(000) | | | US$(000) | | | US$(000) | |
| | | | | | | | | | | | | | | | | | | | | | | | | | | | | | | |
| Financial services | | | 101,126 | | | | 129,631 | | | | 3,897,748 | | | | 3,245,159 | | | | 7,373,664 | | | | 49,901 | | | | 213,153 | | | | 3,303,821 | | | | 3,569,312 | | | | 7,136,187 | |
| Public administration and defense | | | 13,466 | | | | - | | | | 273,506 | | | | 932,227 | | | | 1,219,199 | | | | 22,161 | | | | - | | | | 73,533 | | | | 746,634 | | | | 842,328 | |
| Manufacturing | | | 44 | | | | - | | | | 2,536,277 | | | | 156,925 | | | | 2,693,246 | | | | 2,710 | | | | - | | | | 2,134,497 | | | | 199,874 | | | | 2,337,081 | |
| Commerce | | | 5 | | | | - | | | | 1,484,431 | | | | 64,595 | | | | 1,549,031 | | | | 520 | | | | - | | | | 861,701 | | | | 62,011 | | | | 924,232 | |
| Mortgage loans | | | - | | | | - | | | | 1,401,296 | | | | - | | | | 1,401,296 | | | | - | | | | - | | | | 1,079,955 | | | | - | | | | 1,079,955 | |
| Consumer loans | | | - | | | | - | | | | 1,126,301 | | | | - | | | | 1,126,301 | | | | - | | | | - | | | | 833,505 | | | | - | | | | 833,505 | |
| Electricity, gas and water | | | 523 | | | | - | | | | 556,937 | | | | 203,595 | | | | 761,055 | | | | 9,802 | | | | - | | | | 330,480 | | | | 207,014 | | | | 547,296 | |
| Communications, storage and transportation | | | - | | | | - | | | | 632,895 | | | | 117,103 | | | | 749,998 | | | | - | | | | - | | | | 387,911 | | | | 97,945 | | | | 485,856 | |
| Mining | | | 130 | | | | - | | | | 660,855 | | | | 78,416 | | | | 739,401 | | | | 11,737 | | | | - | | | | 448,570 | | | | 138,578 | | | | 598,885 | |
| Leaseholds and real estate activities | | | - | | | | - | | | | 608,651 | | | | 47,321 | | | | 655,972 | | | | - | | | | - | | | | 373,659 | | | | 159,063 | | | | 532,722 | |
| Micro-business loans | | | - | | | | - | | | | 619,680 | | | | - | | | | 619,680 | | | | - | | | | - | | | | 474,968 | | | | - | | | | 474,968 | |
| Community services | | | - | | | | - | | | | 247,144 | | | | - | | | | 247,144 | | | | - | | | | - | | | | 239,947 | | | | - | | | | 239,947 | |
| Construction | | | - | | | | - | | | | 236,163 | | | | 2,283 | | | | 238,446 | | | | - | | | | - | | | | 197,257 | | | | 3,914 | | | | 201,171 | |
| Agriculture | | | - | | | | - | | | | 224,417 | | | | 7,761 | | | | 232,178 | | | | - | | | | - | | | | 172,817 | | | | 5,550 | | | | 178,367 | |
| Education, health and other services | | | - | | | | - | | | | 127,670 | | | | 29,699 | | | | 157,369 | | | | - | | | | - | | | | 102,456 | | | | 4,514 | | | | 106,970 | |
| Fishing | | | 2 | | | | - | | | | 80,277 | | | | 159 | | | | 80,438 | | | | - | | | | - | | | | 131,483 | | | | - | | | | 131,483 | |
| Insurance activities | | | - | | | | - | | | | 27,430 | | | | - | | | | 27,430 | | | | - | | | | - | | | | 122,667 | | | | - | | | | 122,667 | |
| Other | | | 63 | | | | - | | | | 103,284 | | | | 73,825 | | | | 177,172 | | | | 7 | | | | - | | | | 233,500 | | | | 34,232 | | | | 267,739 | |
| | | | | | | | | | | | | | | | | | | | | | | | | | | | | | | | | | | | | | | | | |
| Total | | | 115,359 | | | | 129,631 | | | | 14,844,962 | | | | 4,959,068 | | | | 20,049,020 | | | | 96,838 | | | | 213,153 | | | | 11,502,727 | | | | 5,228,641 | | | | 17,041,359 | |
Notes to the consolidated financial statements (continued)
As of December 31, 2008 and 2007, the financial instruments with exposure to credit risk were distributed by the following geographical areas:
| | | 2008 | |
| | | Designated at fair value through profit or loss | | | | | | | | | | |
| | | Held for trading | | | At inception | | | Loans and receivables | | | Investments available-for-sale | | | Total | |
| | | US$(000) | | | US$(000) | | | US$(000) | | | US$(000) | | | US$(000) | |
| | | | | | | | | | | | | | | | |
| Peru | | | 113,015 | | | | - | | | | 12,565,873 | | | | 3,571,213 | | | | 16,250,101 | |
| United States of America | | | 109 | | | | 129,631 | | | | 871,859 | | | | 681,184 | | | | 1,682,783 | |
| Bolivia | | | 2,224 | | | | - | | | | 566,170 | | | | 309,530 | | | | 877,924 | |
| Europe | | | - | | | | - | | | | 307,533 | | | | 84,445 | | | | 391,978 | |
| Chile | | | - | | | | - | | | | 115,883 | | | | 90,587 | | | | 206,470 | |
| Colombia | | | - | | | | - | | | | 101,173 | | | | 72,178 | | | | 173,351 | |
| Other | | | 11 | | | | - | | | | 316,471 | | | | 149,931 | | | | 466,413 | |
| | | | | | | | | | | | | | | | | | | | | |
| Total | | | 115,359 | | | | 129,631 | | | | 14,844,962 | | | | 4,959,068 | | | | 20,049,020 | |
| | | 2007 | |
| | | Designated at fair value through profit or loss | | | | | | | | | | |
| | | Held for trading | | | At inception | | | Loans and receivables | | | Investments available-for-sale | | | Total | |
| | | US$(000) | | | US$(000) | | | US$(000) | | | US$(000) | | | US$(000) | |
| | | | | | | | | | | | | | | | |
| Peru | | | 70,189 | | | | - | | | | 10,048,500 | | | | 3,693,246 | | | | 13,811,935 | |
| United States of America | | | 49 | | | | 213,153 | | | | 591,202 | | | | 889,421 | | | | 1,693,825 | |
| Bolivia | | | 3,683 | | | | - | | | | 578,436 | | | | 192,896 | | | | 775,015 | |
| Europe | | | 13,690 | | | | - | | | | 93,141 | | | | 58,477 | | | | 165,308 | |
| Colombia | | | - | | | | - | | | | 59,471 | | | | 89,363 | | | | 148,834 | |
| Chile | | | - | | | | - | | | | 5,178 | | | | 124,557 | | | | 129,735 | |
| Other | | | 9,227 | | | | - | | | | 126,799 | | | | 180,681 | | | | 316,707 | |
| | | | | | | | | | | | | | | | | | | | | |
| Total | | | 96,838 | | | | 213,153 | | | | 11,502,727 | | | | 5,228,641 | | | | 17,041,359 | |
Notes to the consolidated financial statements (continued)
The Group takes on exposure to market risks, which is the risk that the fair value or future cash flows of a financial instrument will fluctuate because of changes in market prices. Market risks arise from open positions in interest rates, currency, commodities and equity products; all of which are exposed to general and specific market movements and changes in the level of volatility of prices such as interest rates, credit spreads, foreign exchange rates and equity prices. Due to the nature of the Group’s current activities, commodity price risk is not applicable.
The Group separates exposures to market risk into two groups: (i) those that arise from value fluctuation of trading portfolios due to movements of market rates or prices (Trading Book) and (ii) those that arise from changes in the structural positions of non-trading portfolios due to movements of the interest rates, prices and foreign exchange ratios (ALM Book).
Trading portfolios include those liquid positions arising from market-making transactions where the Group acts as principal with clients or with the market. Non-trading portfolios consist of relatively illiquid positions, mainly banking assets and liabilities (deposits and loans) and non-trading investments (available-for-sale).
The risks that trading portfolios face are managed through VaR historical simulation techniques; while non-trading portfolios are managed using Asset Liability Management (ALM).
The trading book is made up of liquid investment instruments. The trading book is characterized for having liquid positions in equities, bonds, foreign currencies and derivatives. Some limits have been set in order to control and monitor the risks undertaken. These risks arise from the size of the positions and/or from the volatility of the risk factors embedded in each financial instrument. Regular reports are prepared for the Risk Management Committees and top management. The major measurement technique used to measure and control market risk is Value at Risk (VaR).
The Group applies VaR to its trading portfolios to estimate the market risk of positions held and the maximum losses that are expected, based upon a number of assumptions for various changes in market conditions. The Risk Management Committee set limits on the level of risk that may be accepted and review of daily.
VaR is a statistically-based estimate of the potential loss on the current portfolio from adverse market movements. It expresses the “maximum” amount the Group might lose, but only to a certain level of confidence (99 percent). There is therefore a specified statistical probability (1 percent) that actual loss could be greater than the VaR estimate. The VaR model assumes a certain “holding period” until positions can be closed (1 day - 10 days). The time horizon used to calculate VaR is one day; however, the one-day VAR is amplified to a 10-day time frame and calculated multiplying the one-day VaR times the square root of 10 - results are presented in the tables below. The assessment of past movements has been based on historical one-year data. The Group applies these historical changes in rates directly to its current positions (a method known as historical simulation).
Notes to the consolidated financial statements (continued)
The use of this approach does not prevent losses outside of these limits in the event of more significant market movements.
As of December 31, 2008 and 2007, the Group’s VaR by type of asset was as follows:
| | | 2008 | | | 2007 | |
| | | US$(000) | | | US$(000) | |
| | | | | | | |
| Equity securities | | | 55 | | | | 5,211 | |
| Mutual funds | | | 1,034 | | | | - | |
| Fixed income | | | 1,116 | | | | 567 | |
| Derivatives | | | - | | | | 626 | |
| Consolidated VaR by type of asset | | | 1,604 | | | | 5,261 | |
As of December 31, 2008 and 2007, the Group’s VaR by risk type is as follows:
| | | 2008 | | | 2007 | |
| | | US$(000) | | | US$(000) | |
| | | | | | | |
| Foreign exchange risk | | | 579 | | | | 133 | |
| Interest rate risk | | | 1,063 | | | | 514 | |
| Equity risk | | | 850 | | | | 4,879 | |
| Consolidated VaR by risk type | | | 1,604 | | | | 5,261 | |
The management of the risks associated with long-term and structural positions is called Asset and Liability Management (ALM). Non-trading portfolios which comprise the ALM Book are exposed to different sensitivities that can bring about a deterioration in the value of the assets compared to its liabilities and hence to a reduction of its net worth.
Notes to the consolidated financial statements (continued)
Interest rate risk arises from the possibility that changes in interest rates will affect future cash flows or the fair values of financial instruments. Cash flow interest rate risk is the risk that the future cash flows of a financial instrument will fluctuate because of changes in market interest rates. Fair value interest rate risk is the risk that the value of a financial instrument will fluctuate because of changes in market interest rates. The Group takes on exposure to the effects of fluctuations in the prevailing levels of market interest rates on both its fair value and cash flow risks. Interest margins may increase as a result of such changes but may also decrease in the event that unexpected movements arise. The Board sets limits on the level of mismatch of interest rate re-pricing that may be undertaken, which is monitored daily by Treasury Department.
Re-pricing gap -
Gap analysis comprises aggregating re-pricing timeframes into buckets and checking if each bucket nets to zero. Different bucketing schemes might be used. An interest rate gap is simply a positive or negative net re-pricing timeframe for one of the buckets.
Notes to the consolidated financial statements (continued)
The table below summarizes the Group’s exposure to interest rate risks. It includes the Group’s financial instruments at carrying amounts, categorized by the earlier of contractual re-pricing or maturity dates:
| | | As of December 31, 2008 | |
| | | Up to 1 month | | | 1 to 3 months | | | 3 to 12 months | | | 1 to 5 years | | | More than 5 years | | | Non-interest bearing | | | Total | |
| | | US$(000) | | | US$(000) | | | US$(000) | | | US$(000) | | | US$(000) | | | US$(000) | | | US$(000) | |
| Assets | | | | | | | | | | | | | | | | | | | | | |
| Cash and due from banks | | | 2,455,413 | | | | 196,588 | | | | 46,536 | | | | 10,218 | | | | - | | | | 1,057,416 | | | | 3,766,171 | |
| Investments | | | 818,153 | | | | 1,208,593 | | | | 989,125 | | | | 543,549 | | | | 1,141,155 | | | | 294,577 | | | | 4,995,152 | |
| Loans | | | 2,038,457 | | | | 2,412,234 | | | | 2,274,854 | | | | 2,992,480 | | | | 604,016 | | | | - | | | | 10,322,041 | |
| Assets designated at fair value through profit or loss | | | - | | | | - | | | | - | | | | - | | | | - | | | | 129,631 | | | | 129,631 | |
| Premiums and other policies receivables | | | - | | | | - | | | | - | | | | - | | | | - | | | | 111,561 | | | | 111,561 | |
| Accounts receivable from reinsurers and coinsurers | | | - | | | | - | | | | - | | | | - | | | | - | | | | 165,144 | | | | 165,144 | |
| Other assets | | | - | | | | - | | | | - | | | | - | | | | - | | | | 1,331,369 | | | | 1,331,369 | |
| Total assets | | | 5,312,023 | | | | 3,817,415 | | | | 3,310,515 | | | | 3,546,247 | | | | 1,745,171 | | | | 3,089,698 | | | | 20,821,069 | |
| | | | | | | | | | | | | | | | | | | | | | | | | | | | | |
| Liabilities | | | | | | | | | | | | | | | | | | | | | | | | | | | | |
| Deposits and obligations | | | 4,114,430 | | | | 3,268,610 | | | | 2,991,905 | | | | 321,984 | | | | 39,979 | | | | 3,213,529 | | | | 13,950,437 | |
| Due to banks and correspondents | | | 178,539 | | | | 745,155 | | | | 197,935 | | | | 11,705 | | | | 32,544 | | | | 14,113 | | | | 1,179,991 | |
| Accounts payable to reinsurers and coinsurers | | | - | | | | - | | | | - | | | | - | | | | - | | | | 55,841 | | | | 55,841 | |
| Technical, insurance claims reserves and reserves for unearned premiums | | | 31,254 | | | | 19,357 | | | | 86,935 | | | | 148,437 | | | | 331,697 | | | | 350,090 | | | | 967,770 | |
| Borrowed funds | | | 1,008,997 | | | | 2,474 | | | | 11,762 | | | | 81,871 | | | | 45,612 | | | | - | | | | 1,150,716 | |
| Bonds and subordinated notes issued | | | 817 | | | | - | | | | 63,208 | | | | 284,577 | | | | 428,788 | | | | 7,840 | | | | 785,230 | |
| Other liabilities | | | - | | | | - | | | | - | | | | - | | | | - | | | | 934,979 | | | | 934,979 | |
| Equity | | | - | | | | - | | | | - | | | | - | | | | - | | | | 1,796,105 | | | | 1,796,105 | |
| Total liabilities and equity | | | 5,334,037 | | | | 4,035,596 | | | | 3,351,745 | | | | 848,574 | | | | 878,620 | | | | 6,372,497 | | | | 20,821,069 | |
| | | | | | | | | | | | | | | | | | | | | | | | | | | | | |
| Off-Balance sheet items | | | | | | | | | | | | | | | | | | | | | | | | | | | | |
| Derivatives assets | | | 2,444,863 | | | | 1,267,306 | | | | 577,445 | | | | 458,944 | | | | 286,646 | | | | - | | | | 5,035,204 | |
| Derivatives liabilities | | | 1,582,377 | | | | 770,950 | | | | 816,213 | | | | 1,438,652 | | | | 427,012 | | | | - | | | | 5,035,204 | |
| | | | 862,486 | | | | 496,356 | | | | (238,768 | ) | | | (979,708 | ) | | | (140,366 | ) | | | - | | | | - | |
| Marginal gap | | | 840,472 | | | | 278,175 | | | | (279,998 | ) | | | 1,717,965 | | | | 726,185 | | | | (3,282,799 | ) | | | - | |
| | | | | | | | | | | | | | | | | | | | | | | | | | | | | |
| Accumulated gap | | | 840,472 | | | | 1,118,647 | | | | 838,649 | | | | 2,556,614 | | | | 3,282,799 | | | | - | | | | - | |
Notes to the consolidated financial statements (continued)
| | | As of December 31, 2007 | |
| | | Up to 1 month | | | 1 to 3 months | | | 3 to 12 months | | | 1 to 5 years | | | More than 5 years | | | Non-interest bearing | | | Total | |
| | | US$(000) | | | US$(000) | | | US$(000) | | | US$(000) | | | US$(000) | | | US$(000) | | | US$(000) | |
| Assets | | | | | | | | | | | | | | | | | | | | | |
| Cash and due from banks | | | 2,331,637 | | | | 31,074 | | | | 48,172 | | | | 42,045 | | | | 19 | | | | 620,918 | | | | 3,073,865 | |
| Investments | | | 567,613 | | | | 680,272 | | | | 1,974,368 | | | | 837,269 | | | | 842,317 | | | | 377,797 | | | | 5,279,636 | |
| Loans | | | 2,078,657 | | | | 2,294,056 | | | | 1,499,311 | | | | 2,051,629 | | | | 115,847 | | | | - | | | | 8,039,500 | |
| Assets designated at fair value through profit or loss | | | - | | | | - | | | | 50,561 | | | | - | | | | - | | | | 162,592 | | | | 213,153 | |
| Premiums and other policies receivables | | | - | | | | - | | | | - | | | | - | | | | - | | | | 85,495 | | | | 85,495 | |
| Accounts receivable from reinsurers and coinsurers | | | - | | | | - | | | | - | | | | - | | | | - | | | | 116,141 | | | | 116,141 | |
| Other assets | | | - | | | | - | | | | - | | | | - | | | | - | | | | 898,108 | | | | 898,108 | |
| Total assets | | | 4,977,907 | | | | 3,005,402 | | | | 3,572,412 | | | | 2,930,943 | | | | 958,183 | | | | 2,261,051 | | | | 17,705,898 | |
| | | | | | | | | | | | | | | | | | | | | | | | | | | | | |
| Liabilities | | | | | | | | | | | | | | | | | | | | | | | | | | | | |
| Deposits and obligations | | | 3,358,599 | | | | 3,089,841 | | | | 1,709,965 | | | | 263,913 | | | | 2,088 | | | | 2,926,308 | | | | 11,350,714 | |
| Due to banks and correspondents | | | 484,560 | | | | 437,345 | | | | 303,506 | | | | 198,357 | | | | 21,296 | | | | 8,197 | | | | 1,453,261 | |
| Financial liabilities designated at fair value through profit or loss | | | - | | | | - | | | | 50,561 | | | | - | | | | - | | | | - | | | | 50,561 | |
| Accounts payable to reinsurers and coinsurers | | | - | | | | - | | | | - | | | | - | | | | - | | | | 33,963 | | | | 33,963 | |
| Technical, insurance claims reserves and reserves for unearned premiums | | | 1,626 | | | | 4,878 | | | | 14,634 | | | | 95,017 | | | | 305,039 | | | | 382,284 | | | | 803,478 | |
| Borrowed funds | | | - | | | | 870,404 | | | | - | | | | - | | | | - | | | | - | | | | 870,404 | |
| Bonds and subordinated notes issued | | | 101,521 | | | | 34,520 | | | | 54,546 | | | | 176,924 | | | | 328,147 | | | | 6,640 | | | | 702,298 | |
| Other liabilities | | | - | | | | - | | | | 8,275 | | | | - | | | | - | | | | 617,671 | | | | 625,946 | |
| Equity | | | - | | | | - | | | | - | | | | - | | | | - | | | | 1,815,273 | | | | 1,815,273 | |
| Total liabilities and equity | | | 3,946,306 | | | | 4,436,988 | | | | 2,141,487 | | | | 734,211 | | | | 656,570 | | | | 5,790,336 | | | | 17,705,898 | |
| | | | | | | | | | | | | | | | | | | | | | | | | | | | | |
| Off-Balance sheet items | | | | | | | | | | | | | | | | | | | | | | | | | | | | |
| Derivatives assets | | | 1,746,686 | | | | 724,850 | | | | 719,635 | | | | 349,552 | | | | 116,269 | | | | - | | | | 3,656,992 | |
| Derivatives liabilities | | | 967,415 | | | | 617,771 | | | | 801,599 | | | | 806,626 | | | | 463,581 | | | | - | | | | 3,656,992 | |
| | | | 779,271 | | | | 107,079 | | | | (81,964 | ) | | | (457,074 | ) | | | (347,312 | ) | | | - | | | | - | |
| Marginal gap | | | 1,810,872 | | | | (1,324,507 | ) | | | 1,348,961 | | | | 1,739,658 | | | | (45,699 | ) | | | (3,529,285 | ) | | | - | |
| | | | | | | | | | | | | | | | | | | | | | | | | | | | | |
| Accumulated gap | | | 1,810,872 | | | | 486,365 | | | | 1,835,326 | | | | 3,574,984 | | | | 3,529,285 | | | | - | | | | - | |
Notes to the consolidated financial statements (continued)
Sensitivity to changes in interest rates -
The following table presents the sensitivity to a reasonable possible change in interest rates, with all other variables held constant, of the Group’s consolidated income statement and consolidated statements of change in equity; before income tax and minority interest.
The sensitivity of the consolidated income statement is the effect of the assumed changes in interest rates on the net interest income for one year before income tax and minority interest, based on the floating rate non-trading financial assets and financial liabilities held at December 31, 2008 and 2007, including the effect of derivatives instruments. The sensitivity of equity is calculated by revaluing fixed rate available-for-sale financial assets, before income tax and minority interest, including the effect of any associated hedges, and derivatives instruments designated as cash flow hedges, as of December 31, 2008 and 2007 for the effects of the assumed changes in interest rates:
| | As of December 31, 2008 | |
| Currency | Changes in basis points | | Sensitivity of net income | | Sensitivity of Equity | |
| | | | | US$(000) | | US$(000) | |
| | | | | | | | |
| U.S. Dollar | +/- | 50 | | +/- | 6,842 | | -/+ | 16,709 | |
| U.S. Dollar | +/- | 100 | | +/- | 13,684 | | -/+ | 33,417 | |
| U.S. Dollar | +/- | 200 | | +/- | 27,368 | | -/+ | 66,834 | |
| U.S. Dollar | +/- | 300 | | +/- | 41,052 | | -/+ | 100,251 | |
| Peruvian Currency | +/- | 50 | | -/+ | 12,227 | | -/+ | 16,791 | |
| Peruvian Currency | +/- | 100 | | -/+ | 24,454 | | -/+ | 33,581 | |
| Peruvian Currency | +/- | 200 | | -/+ | 48,908 | | -/+ | 67,162 | |
| Peruvian Currency | +/- | 300 | | -/+ | 73,362 | | -/+ | 100,743 | |
| | As of December 31, 2007 | |
| Currency | Changes in basis points | | Sensitivity of net income | | Sensitivity of Equity | |
| | | | | US$(000) | | US$(000) | |
| | | | | | | | |
| U.S. Dollar | +/- | 50 | | +/- | 7,652 | | -/+ | 20,204 | |
| U.S. Dollar | +/- | 100 | | +/- | 15,305 | | -/+ | 40,408 | |
| U.S. Dollar | +/- | 200 | | +/- | 30,609 | | -/+ | 80,816 | |
| U.S. Dollar | +/- | 300 | | +/- | 45,914 | | -/+ | 121,224 | |
| Peruvian Currency | +/- | 50 | | -/+ | 4,335 | | -/+ | 20,705 | |
| Peruvian Currency | +/- | 100 | | -/+ | 8,670 | | -/+ | 41,409 | |
| Peruvian Currency | +/- | 200 | | -/+ | 17,340 | | -/+ | 82,818 | |
| Peruvian Currency | +/- | 300 | | -/+ | 26,010 | | -/+ | 124,227 | |
Notes to the consolidated financial statements (continued)
The interest rate sensitivities set out in the table above are illustrative only and are based on simplified scenarios. The figures represent the effect of the pro-forma movements in the net interest income based on the projected yield curve scenarios and the Group’s current interest rate risk profile. This effect, however, does not incorporate actions that would be taken by management to mitigate the impact of this interest rate risk. In addition, the Group seeks proactively to change the interest rate risk profile to minimize losses and optimize net revenues. The projections above also assume that interest rate of all maturities move by the same amount and, therefore, do not reflect the potential impact on net interest income of some rates changing while others remain unchanged. The projections make other simplifying assumptions too, including that all positions run to maturity.
Available-for-sale equity securities and mutual funds are not considered as part of the investment securities for sensitivity calculation purposes; however, a 10, 30 and 50 percent for equity and 10, 20 and 30 percent for mutual funds changes in market prices is conducted to these price-sensitivity securities and the expected unrealized gain or loss, before income tax, is presented below:
| Market price sensitivity | Changes in market prices | | As of December 31, 2008 | | As of December 31, 2007 | |
| | % | | US$(000) | | US$(000) | |
| | | | | | | | | | |
| Equity securities | +/- | 10 | | +/- | 21,762 | | +/- | 32,112 | |
| Equity securities | +/- | 30 | | +/- | 65,285 | | +/- | 96,335 | |
| Equity securities | +/- | 50 | | +/- | 108,809 | | +/- | 160,559 | |
| Mutual funds | +/- | 10 | | +/- | 13,132 | | +/- | 19,841 | |
| Mutual funds | +/- | 20 | | +/- | 26,264 | | +/- | 39,681 | |
| Mutual funds | +/- | 30 | | +/- | 39,397 | | +/- | 59,522 | |
Notes to the consolidated financial statements (continued)
| (ii) | Foreign exchange risk - |
The Group is exposed to foreign currency exchange rates on its financial position and cash flows. Management sets limits on the level of exposure by currency and in total for both overnight and intra-day positions, which are monitored daily.
Foreign currency transactions are made at the free market exchange rates of the countries where Credicorp’s Subsidiaries are established. As of December 31, 2008 and 2007, the Group’s assets and liabilities by currencies were as follows:
| | | 2008 | | | 2007 | |
| | | U.S. Dollars | | | Peruvian currency | | | Other currencies | | | Total | | | U.S. Dollars | | | Peruvian currency | | | Other currencies | | | Total | |
| | | US$(000) | | | US$(000) | | | US$(000) | | | US$(000) | | | US$(000) | | | US$(000) | | | US$(000) | | | US$(000) | |
| | | | | | | | | | | | | | | | | | | | | | | | | |
| Monetary assets - | | | | | | | | | | | | | | | | | | | | | | | | |
| Cash and due from banks | | | 3,156,279 | | | | 495,550 | | | | 114,342 | | | | 3,766,171 | | | | 2,644,858 | | | | 311,828 | | | | 117,179 | | | | 3,073,865 | |
| Trading securities | | | 23,220 | | | | 11,523 | | | | 1,341 | | | | 36,084 | | | | 38,647 | | | | 11,463 | | | | 885 | | | | 50,995 | |
| Available-for-sale investments | | | 2,897,658 | | | | 1,736,160 | | | | 325,250 | | | | 4,959,068 | | | | 1,934,672 | | | | 3,129,351 | | | | 164,618 | | | | 5,228,641 | |
| Loans, net | | | 6,930,125 | | | | 3,298,579 | | | | 93,337 | | | | 10,322,041 | | | | 5,555,864 | | | | 2,450,297 | | | | 33,339 | | | | 8,039,500 | |
| Financial assets designated to fair value through profit or loss | | | 129,631 | | | | - | | | | - | | | | 129,631 | | | | 213,153 | | | | - | | | | - | | | | 213,153 | |
| Other assets | | | 594,107 | | | | 255,476 | | | | 12,383 | | | | 861,966 | | | | 261,102 | | | | 299,695 | | | | 9,745 | | | | 570,542 | |
| | | | 13,731,020 | | | | 5,797,288 | | | | 546,653 | | | | 20,074,961 | | | | 10,648,296 | | | | 6,202,634 | | | | 325,766 | | | | 17,176,696 | |
| | | | | | | | | | | | | | | | | | | | | | | | | | | | | | | | | |
| Monetary liabilities - | | | | | | | | | | | | | | | | | | | | | | | | | | | | | | | | |
| Deposits and obligations | | | (8,614,042 | ) | | | (4,963,932 | ) | | | (372,463 | ) | | | (13,950,437 | ) | | | (7,173,362 | ) | | | (3,892,138 | ) | | | (285,214 | ) | | | (11,350,714 | ) |
| Due to bank and correspondents and borrowed funds | | | (2,189,114 | ) | | | (140,155 | ) | | | (1,438 | ) | | | (2,330,707 | ) | | | (2,071,882 | ) | | | (248,362 | ) | | | (3,421 | ) | | | (2,323,665 | ) |
| Financial liabilities designated at fair value through profits or loss | | | - | | | | - | | | | - | | | | - | | | | (50,561 | ) | | | - | | | | - | | | | (50,561 | ) |
| Bonds and subordinated notes issued | | | (311,860 | ) | | | (473,370 | ) | | | - | | | | (785,230 | ) | | | (329,567 | ) | | | (372,731 | ) | | | - | | | | (702,298 | ) |
| Other liabilities | | | (1,425,817 | ) | | | (508,063 | ) | | | (24,710 | ) | | | (1,958,590 | ) | | | (1,040,178 | ) | | | (434,353 | ) | | | 11,144 | | | | (1,463,387 | ) |
| | | | (12,540,833 | ) | | | (6,085,520 | ) | | | (398,611 | ) | | | (19,024,964 | ) | | | (10,665,550 | ) | | | (4,947,584 | ) | | | (277,491 | ) | | | (15,890,625 | ) |
| | | | | | | | | | | | | | | | | | | | | | | | | | | | | | | | | |
| | | | 1,190,187 | | | | (288,232 | ) | | | 148,042 | | | | 1,049,997 | | | | (17,254 | ) | | | 1,255,050 | | | | 48,275 | | | | 1,286,071 | |
| | | | | | | | | | | | | | | | | | | | | | | | | | | | | | | | | |
| Forwards position, net | | | (627,600 | ) | | | 591,628 | | | | 35,972 | | | | - | | | | 331,117 | | | | (273,971 | ) | | | (57,146 | ) | | | - | |
| Currrency swaps position, net | | | 31,458 | | | | (31,458 | ) | | | - | | | | - | | | | 7,227 | | | | (7,227 | ) | | | - | | | | - | |
| Cross currency swaps position, net and interest rate swaps position, net | | | (277,347 | ) | | | 277,347 | | | | - | | | | - | | | | (50,420 | ) | | | 50,420 | | | | - | | | | - | |
| | | | | | | | | | | | | | | | | | | | | | | | | | | | | | | | | |
| Net monetary position | | | 316,698 | | | | 549,285 | | | | 184,014 | | | | 1,049,997 | | | | 270,670 | | | | 1,024,272 | | | | (8,871 | ) | | | 1,286,071 | |
Notes to the consolidated financial statements (continued)
The Group manages foreign exchange risk by monitoring and controlling the position values due to changes in exchange rates. The Group measures its performance in U.S. Dollar, so if the net foreign exchange position (e.g. Peruvian currency) is an asset, any depreciation of the U.S. Dollar with respect to this currency would affect Group’s consolidated balance sheet positively. The current position in a foreign currency comprises exchange rate-linked assets and liabilities in that currency. An institution’s open position in individual currencies comprises assets, liabilities and off-balance sheet items denominated in the respective foreign currency for which the institution itself bears the risk; any appreciation/depreciation of the foreign exchange would affect the consolidated income statement.
The Group’s net foreign exchange balance is the sum of its positive open non-U.S. Dollar positions (net long position) less the sum of its negative open non-U.S. Dollar positions (net short position); and any devaluation/revaluation of the foreign exchange position would affect the consolidated income statement. A currency mismatch would leave Group’s consolidated balance sheet vulnerable to a fluctuation of the foreign currency (exchange rate shock).
The table below shows the sensitivity analysis of the Peruvian Currency, the currency to which the Group had significant exposure as of December 31, 2008 and 2007 on its non-trading monetary assets and liabilities and its forecast cash flows. The analysis calculates the effect of a reasonably possible movement of the currency rate against the U.S. Dollar, with all other variables held constant on the consolidated income statement, before income tax. A negative amount in the table reflects a potential net reduction in consolidated income statement, while a positive amount reflects a net potential increase:
| Sensitivity Analysis | | Change in currency rates | | | 2008 | | | 2007 | |
| | | % | | | US$(000) | | | US$(000) | |
| | | | | | | | | | |
| Devaluation - | | | | | | | | | |
| Peruvian Currency | | | 5 | | | | (28,910 | ) | | | (51,636 | ) |
| Peruvian Currency | | | 10 | | | | (61,032 | ) | | | (109,009 | ) |
| | | | | | | | | | | | | |
| Revaluation - | | | | | | | | | | | | |
| Peruvian Currency | | | 5 | | | | 26,156 | | | | 46,718 | |
| Peruvian Currency | | | 10 | | | | 49,935 | | | | 89,189 | |
Notes to the consolidated financial statements (continued)
Liquidity risk is the risk that the Group is unable to meet its payment obligations associated with its financial liabilities when they fall due and to replace funds when they are withdrawn. The consequence may be the failure to meet obligations to repay depositors, fulfill commitments to lend or meet other operating cash needs.
The Group is exposed to daily calls on its available cash resources from overnight deposits, current accounts, maturing deposits, loans draw-downs, guarantees and other calls. The Group does not maintain cash resources to meet all of these needs, as experience shows that a minimum level of reinvestment of maturing funds can be predicted with a high level of certainty. The Management of the Group’s subsidiaries sets limits on the minimum proportion of funds available to meet such calls and on the minimum level of inter-bank and other borrowing facilities that should be in place to cover withdrawals at unexpected levels of demands. Sources of liquidity are regularly reviewed by a separate team in Group Treasury Department to maintain a wide diversification by currency, geography, provider, product and term.
The matching and controlled mismatching of the maturities and interest rates of assets and liabilities is fundamental to the management of the Group. It is unusual for banks to be completely matched, as transacted business is often based on uncertain terms and of different types. An unmatched position potentially enhances profitability, but also increases the risk of losses.
The maturities of assets and liabilities and the ability to replace, at an acceptable cost, interest-bearing liabilities as they mature are important factors in assessing the liquidity of the Group and its exposure to changes in interest rates and exchange rates.
Liquidity requirements to support calls under guarantees and standby letters of credit are considerably less than the amount of the commitment, because the Group does not generally expect the third party to draw funds under the agreement. The total outstanding contractual amount of commitments to extend credit does not necessarily represent future cash requirements, as many of these commitments will expire or terminate without being funded.
A maturity mismatch, long-term illiquid assets against short-term liabilities, exposes a consolidated balance sheet to risks related both to rollover and to interest rates. If liquid assets do not cover maturing debts, a balance sheet is vulnerable to a rollover risk. Furthermore, a sharp increase in interest rates can dramatically increase the cost of rolling over short-term liabilities, leading to a rapid increase in debt service. The contractual-maturity gap report is useful in showing liquidity characteristics.
Notes to the consolidated financial statements (continued)
The table below presents the cash flows payable by the Group by remaining contractual maturities at the consolidated balance sheets dates. The amounts disclosed in the table are the contractual undiscounted cash flows:
| | | As of December 31, 2008 | | | As of December 31, 2007 | |
| | | Up to a month | | | From 1 to 3 months | | | From 3 to 12 months | | | From 1 to 5 years | | | Over 5 years | | | Total | | | Up to a month | | | From 1 to 3 months | | | From 3 to 12 months | | | From 1 to 5 years | | | Over 5 years | | | Total | |
| | | US$(000) | | | US$(000) | | | US$(000) | | | US$(000) | | | US$(000) | | | US$(000) | | | US$(000) | | | US$(000) | | | US$(000) | | | US$(000) | | | US$(000) | | | US$(000) | |
| | | | | | | | | | | | | | | | | | | | | | | | | | | | | | | | | | | | | |
| Deposits and obligations | | | 4,200,202 | | | | 1,573,685 | | | | 6,727,731 | | | | 1,485,233 | | | | 381,475 | | | | 14,368,326 | | | | 3,509,461 | | | | 1,785,348 | | | | 3,914,794 | | | | 2,602,403 | | | | 298,750 | | | | 12,110,756 | |
| Financials liabilities designated at fair value through profit and loss | | | - | | | | - | | | | - | | | | - | | | | - | | | | - | | | | 266 | | | | 534 | | | | 2,448 | | | | 65,063 | | | | - | | | | 68,311 | |
| Due to bank and correspondents and Borrowed funds | | | 222,667 | | | | 262,027 | | | | 355,464 | | | | 1,226,162 | | | | 564,212 | | | | 2,630,532 | | | | 274,279 | | | | 524,809 | | | | 486,328 | | | | 1,053,649 | | | | 529,040 | | | | 2,868,105 | |
| Accounts payable to reinsurer and coinsurers | | | 16,232 | | | | 13,663 | | | | 25,946 | | | | - | | | | - | | | | 55,841 | | | | 3,507 | | | | 10,840 | | | | 14,984 | | | | 4,632 | | | | - | | | | 33,963 | |
| Technical, insurance claims reserves and reserves for unearned premiums | | | 57,470 | | | | 117,509 | | | | 280,424 | | | | 200,023 | | | | 606,096 | | | | 1,261,522 | | | | 77,047 | | | | 100,991 | | | | 177,197 | | | | 160,618 | | | | 558,301 | | | | 1,074,154 | |
| Bonds and subordinates notes issued | | | 6,635 | | | | 5,883 | | | | 110,975 | | | | 444,563 | | | | 589,016 | | | | 1,157,072 | | | | 48,867 | | | | 43,071 | | | | 104,174 | | | | 315,911 | | | | 426,688 | | | | 938,711 | |
| Other liabilities | | | 122,619 | | | | 155,032 | | | | 379,563 | | | | 90,430 | | | | 60,048 | | | | 807,692 | | | | 30,464 | | | | 23,993 | | | | 367,922 | | | | 83,492 | | | | - | | | | 505,871 | |
| | | | | | | | | | | | | | | | | | | | | | | | | | | | | | | | | | | | | | | | | | | | | | | | | |
| Total liabilities | | | 4,625,825 | | | | 2,127,799 | | | | 7,880,103 | | | | 3,446,411 | | | | 2,200,847 | | | | 20,280,985 | | | | 3,943,891 | | | | 2,489,586 | | | | 5,067,847 | | | | 4,285,768 | | | | 1,812,779 | | | | 17,599,871 | |
The table below shows the contractual maturity of the Group’s contingent credits at the consolidated balance sheets dates:
| | | As of December 31, 2008 | | | As of December 31, 2007 | |
| | | Up to a month | | | From 1 to 3 months | | | From 3 to 12 months | | | From 1 to 5 years | | | Over 5 years | | | Total | | | Up to a month | | | From 1 to 3 months | | | From 1 to 12 months | | | From 1 to 5 years | | | Over 5 years | | | Total | |
| | | US$(000) | | | US$(000) | | | US$(000) | | | US$(000) | | | US$(000) | | | US$(000) | | | US$(000) | | | US$(000) | | | US$(000) | | | US$(000) | | | US$(000) | | | US$(000) | |
| | | | | | | | | | | | | | | | | | | | | | | | | | | | | | | | | | | | | |
| Contingent credits | | | 208,248 | | | | 541,900 | | | | 705,150 | | | | 279,693 | | | | 20,911 | | | | 1,755,902 | | | | 318,692 | | | | 253,054 | | | | 571,702 | | | | 402,443 | | | | 18,634 | | | | 1,564,525 | |
The Bank expects that not all of the contingent liabilities or commitments will be drawn before expiry of the commitments.
Notes to the consolidated financial statements (continued)
Operational risk is the risk of loss arising from systems failure, human error, fraud or external events. When controls fail to perform, operational risks can cause damage to reputation, have legal or regulatory implications, or lead to financial loss. The Group cannot expect to eliminate all operational risks, but through a control framework and by monitoring and responding to potential risks, the Group is able to manage the risks. Controls include effective segregation of duties, access, authorization and reconciliation procedures, staff education and assessment processes, including the use of Internal Audit.
| 29.5 | Risk of the insurance activity - |
The principal risk the Group faces under insurance contracts is that the actual claims and benefit payments or the timing thereof, differ from expectations. This is influenced by the frequency of claims, severity of claims, actual benefits paid and subsequent development of long-term claims. Therefore the objective of the Group is to ensure that sufficient reserves are available to cover these liabilities.
The above risk exposure is mitigated by diversification across a large portfolio of insurance contracts and geographical areas. The variability of risks is also improved by careful selection and implementation of underwriting strategy guidelines, as well as the use of reinsurance arrangements.
The Group purchases reinsurance as part of its risks mitigation program. Reinsurance ceded is placed on both a proportional and non-proportional basis. The majority of proportional reinsurance is quota-share reinsurance which is taken out to reduce the overall exposure of the Group to certain classes of business.
Non-proportional reinsurance is primarily excess-of-loss reinsurance designed to mitigate the Group’s net exposure to catastrophe losses. Retention limits for the excess-of-loss reinsurance vary by product line and geographical area.
Amounts recoverable from reinsurers are estimated in a manner consistent with the outstanding claims provision and are in accordance with the reinsurance contracts. Although the Group has reinsurance arrangements, it is not relieved of its direct obligations to its policyholders and thus a credit exposure exists with respect to ceded insurance, to the extent that any reinsurer is unable to meet its obligations assumed under such reinsurance agreements. The Group’s placement of reinsurance is diversified such that it is neither dependent on a single reinsurer nor are the operations of the Group substantially dependent upon any single reinsurance contract.
Life insurance contracts
Life insurance contracts offered by the Group include whole life, term assurance, unitised pensions, guaranteed annuity pensions, pure endowment pensions and mortgage endowments.
Whole life and term assurance are conventional regular premium products where lump sum benefits are payable on death or permanent disability. Few contracts have a surrender value.
Pensions are contracts where retirement benefits are expressed in the form of an annuity payable at retirement age. If death occurs before retirement, contracts generally return the value of the fund accumulated or premiums.
Notes to the consolidated financial statements (continued)
Guaranteed annuities are single premium products named “Rentas Vitalicias” which pay a specified payment to the policyholder whilst they and/or their spouse are still alive. Payments are generally either fixed or increased each year at a specified rate or at inflation rate.
Death benefits of endowment products are subject to a guaranteed minimum amount. The maturity value usually depends on the investment performance of the underlying assets.
The main risks that the Group is exposed to are as follows:
| | - | Mortality risk – risk of loss arising due to policyholder death experience being different than expected. |
| | - | Morbidity risk – risk of loss arising due to policyholder health experience being different than expected. |
| | - | Longevity risk – risk of loss arising due to the annuitant living longer than expected. |
| | - | Investment return risk – risk of loss arising from actual returns being different than expected. |
| | - | Expense risk – risk of loss arising from expense experience being different than expected. |
| | - | Policyholder decision risk – risk of loss arising due to policyholder experiences (lapses and surrenders) being different than expected. |
These risks do not vary significantly in relation to the location of the risk insured by the Group, type of risk insured or industry.
The Group’s underwriting strategy is designed to ensure that risks are well diversified in terms of type of risk and level of insured benefits. This is largely achieved through diversification across industry sectors and geography, the use of medical screening in order to ensure that pricing takes account of current health conditions and family medical history, regular review of actual claims experience and product pricing, as well as detailed claims handling procedures. Underwriting limits are in place to enforce appropriate risk selection criteria. For example, the Group has the right not to renew individual policies, it can impose deductibles and it has the right to reject the payment of fraudulent claims. Insurance contracts also entitle the Group to pursue third parties for payment of some or all costs. The Group further enforces a policy of actively managing and prompt pursuing of claims, in order to reduce its exposure to unpredictable future developments that can negatively impact the Group.
For contracts when death or disability is the insured risk, the significant factors that could increase the overall frequency of claims are epidemics, widespread changes in lifestyle and natural disasters, resulting in earlier or more claims than expected. Group wide reinsurance limits of US$50,000 on any single life insured and on all high risk individuals insured are in place.
Notes to the consolidated financial statements (continued)
For annuity contracts, the most significant factor is continuing improvement in medical science and social conditions that would increase longevity.
Management has made a sensitivity analysis of the estimates of the technical reserves, note 14(c).
Non-life insurance contracts (general insurance and healthcare)
The Group principally issues the following types of general insurance contracts: motor, household and commercial. Healthcare contracts provide medical expense cover to policyholders. Risks under non-life insurance policies usually covers 12 months.
For general insurance contracts the most significant risks arise from climate changes, natural disasters and other type of damages. For healthcare contracts the most significant risks arise from lifestyle changes, epidemics and medical science and technology improvements.
These risks do not vary significantly in relation to the location of the risk insured by the Group, type of risk insured or industry.
The above risks exposures are mitigated by diversification across a large portfolio of insurance contracts. The variability of risk is improved by careful selection and implementation of underwriting strategies, which are designed to ensure that risks are diversified in terms of risks type and level of insured benefits. This is largely achieved through diversification across industry sectors and geography. Further, strict claim review policies to assess all new and ongoing claims, regular detailed review of claims handling procedures and frequent investigation of possible fraudulent claims are all policies and procedures put in place to reduce the Group´s risk exposure. Also, the Group actively manages and promptly pursues claims, in order to reduce its exposure to unpredictable future developments that can negatively impact the Group.
The Group has also limited its exposure by imposing maximum claim amounts on certain contracts as well as the use of reinsurance arrangements in order to limit exposure to catastrophic events.
Notes to the consolidated financial statements (continued)
In the following paragraphs the Group has segregated some risk information related to its insurance business, which has been already included in the Group’s consolidated
risk information; in order to provide more specific insight about this particular business.
| | (a) | Interest risk of the insurance activity - |
The following tables show the re-pricing gap of the insurance activity based on the financial statements in accordance with IFRS for investments and Technical, insurance claims reserves and reserves for unearned premiums and after the eliminations for consolidation:
| | | 2008 | |
| | | Investments | | | Technical, insurance claims reserves and reserves for unearned premiums | |
| | | US$(000) | | | US$(000) | |
| | | | | | | |
| Up to 1 month | | | 7,873 | | | | 31,254 | |
| 1 to 3 months | | | 20,263 | | | | 19,357 | |
| 3 to 12 months | | | 44,850 | | | | 86,935 | |
| 1 to 5 years | | | 112,057 | | | | 148,437 | |
| More than 5 years | | | 558,328 | | | | 331,697 | |
| Non-interest bearing | | | 63,543 | | | | 350,090 | |
| | | | | | | | | |
| Total | | | 806,914 | | | | 967,770 | |
| | | 2007 | |
| | | Investments | | | Technical, insurance claims reserves and reserves for unearned premiums | |
| | | US$(000) | | | US$(000) | |
| | | | | | | |
| Up to 1 month | | | 4,295 | | | | 1,626 | |
| 1 to 3 months | | | 10,847 | | | | 4,878 | |
| 3 to 12 months | | | 11,630 | | | | 14,634 | |
| 1 to 5 years | | | 96,207 | | | | 95,017 | |
| More than 5 years | | | 513,714 | | | | 305,039 | |
| Non-interest bearing | | | 159,755 | | | | 382,284 | |
| | | | | | | | | |
| Total | | | 796,448 | | | | 803,478 | |
Notes to the consolidated financial statements (continued)
The others financial assets and liabilities are related to the balances presented in the consolidated balance sheets and include mainly accounts receivable from and payable to reinsurers and premiums and other policies receivables which are non-interest bearing , see also note 29.2 (b)(i).
The following tables demonstrate the sensitivity to a reasonably possible change in interest rates, with all other variables held constant, in consolidated income statement and consolidated equity of the insurance activity, before income tax:
| | As of December 31, 2008 | |
| Currency | Changes in basis points | | Sensitivity of net income | | Sensitivity of Equity | |
| | | | | US$(000) | | US$(000) | |
| | | | | | | | | | |
| U.S. Dollar | +/- | 50 | | -/+ | 201 | | -/+ | 6,734 | |
| U.S. Dollar | +/- | 100 | | -/+ | 402 | | -/+ | 13,468 | |
| U.S. Dollar | +/- | 200 | | -/+ | 805 | | -/+ | 26,935 | |
| U.S. Dollar | +/- | 300 | | -/+ | 1,207 | | -/+ | 40,403 | |
| Peruvian Currency | +/- | 50 | | +/- | 58 | | -/+ | 2,597 | |
| Peruvian Currency | +/- | 100 | | +/- | 117 | | -/+ | 5,193 | |
| Peruvian Currency | +/- | 200 | | +/- | 234 | | -/+ | 10,386 | |
| Peruvian Currency | +/- | 300 | | +/- | 351 | | -/+ | 15,579 | |
| | As of December 31, 2007 | |
| Currency | Changes in basis points | | Sensitivity of net income | | Sensitivity of Equity | |
| | | | | US$(000) | | US$(000) | |
| | | | | | | | | | |
| U.S. Dollar | +/- | 50 | | -/+ | 129 | | -/+ | 9,883 | |
| U.S. Dollar | +/- | 100 | | -/+ | 259 | | -/+ | 19,766 | |
| U.S. Dollar | +/- | 200 | | -/+ | 517 | | -/+ | 39,532 | |
| U.S. Dollar | +/- | 300 | | -/+ | 776 | | -/+ | 59,297 | |
| Peruvian Currency | +/- | 50 | | +/- | 50 | | -/+ | 1,533 | |
| Peruvian Currency | +/- | 100 | | +/- | 101 | | -/+ | 3,066 | |
| Peruvian Currency | +/- | 200 | | +/- | 201 | | -/+ | 6,132 | |
| Peruvian Currency | +/- | 300 | | +/- | 302 | | -/+ | 9,199 | |
The interest rate sensitivities set out in the table above are illustrative only and employ simplified scenarios. It should be noted that the effects may not be linear and therefore the results cannot be extrapolated. The sensitivities do not incorporate actions that could be taken by Management to mitigate the effect of the interest rate movements, nor any changes in policyholders´ behaviors.
Notes to the consolidated financial statements (continued)
| | (b) | Foreign exchange risk of the insurance activity - - |
As of December 31, 2008 and 2007, the insurance activity assets and liabilities by currencies after eliminations for consolidation were as follows:
| | | 2008 | |
| | | U.S. Dollars | | | Peruvian Currency | | | Total | |
| | | US$(000) | | | US$(000) | | | US$(000) | |
| | | | | | | | | | |
| Monetary assets | | | 876,823 | | | | 358,855 | | | | 1,235,678 | |
| Monetary liabilities | | | (851,685 | ) | | | (261,271 | ) | | | (1,112,956 | ) |
| | | | | | | | | | | | | |
| Net monetary position | | | 25,138 | | | | 97,584 | | | | 122,722 | |
| | | 2007 | |
| | | U.S. Dollars | | | Peruvian Currency | | | Total | |
| | | US$(000) | | | US$(000) | | | US$(000) | |
| | | | | | | | | | |
| Monetary assets | | | 800,899 | | | | 259,279 | | | | 1,060,178 | |
| Monetary liabilities | | | (636,170 | ) | | | (211,013 | ) | | | (847,183 | ) |
| | | | | | | | | | | | | |
| Net monetary position | | | 164,729 | | | | 48,266 | | | | 212,995 | |
The table below shows the sensitivity analysis of the peruvian currency as of December 31, 2008 and 2007 on the insurance activity non-trading monetary assets and liabilities and its forecasted cash flows. The analysis calculates the effect of a reasonably possible movement of the currency rate against the U.S. Dollar on the consolidated income statement, with all other variables held constant, before income tax. A negative amount in the table reflects a potential net reduction in consolidated income statement, while a positive amount reflects a net potential increase.
Notes to the consolidated financial statements (continued)
| Sensitivity Analysis | | Change in currency rates | | | 2008 | | | 2007 | |
| | | % | | | US$(000) | | | US$(000) | |
| | | | | | | | | | |
| Devaluation - | | | | | | | | | |
| Peruvian Currency | | | 5 | | | | 5,136 | | | | (2,540 | ) |
| Peruvian Currency | | | 10 | | | | 10,843 | | | | (5,363 | ) |
| | | | | | | | | | | | | |
| Revaluation - | | | | | | | | | | | | |
| Peruvian Currency | | | 5 | | | | (4,647 | ) | | | 2,298 | |
| Peruvian Currency | | | 10 | | | | (8,871 | ) | | | 4,388 | |
| | (c) | Liquidity risk of the insurance activity - |
The Group´s insurance companies are exposed to requirements of cash available, mainly for contracts of insurance claims of short term. The Group holds the available funds for covering its liabilities according to their maturity and estimated unexpected claims.
The Group´s insurance companies control liquidity risk through the exposure of the maturity of their liabilities. Therefore, the investment plan has been structured considering the maturities in order to manage the risk of fund requirements to cover insurance claims and others, in addition to the Group support.
The following table presents the undiscounted cash flows payable by the Group for technical, insurance claims reserves and reserves for unearned premiums by their remaining contractual maturities as of December 31, 2008, including interest payments:
| | | 2008 | | | 2007 | |
| | | US$(000) | | | US$(000) | |
| | | | | | | |
| Up to 1 month | | | 57,470 | | | | 77,047 | |
| From 1 to 3 months | | | 117,509 | | | | 100,991 | |
| From 3 to 12 months | | | 280,424 | | | | 177,197 | |
| From 1 to 5 years | | | 200,023 | | | | 160,618 | |
| Over 5 years | | | 606,096 | | | | 558,301 | |
| | | | | | | | | |
| Total | | | 1,261,522 | | | | 1,074,154 | |
Other non-derivative financial liabilities are related to the balances presented in the consolidated balance sheets and include mainly accounts payable to reinsurers and coinsurers and other liabilities with contractual maturities of less than one year, see also note 29.3.
Notes to the consolidated financial statements (continued)
| | (d) | Credit risk of the insurance activity - |
Credit risk is the risk that one party to a financial instrument will cause a financial loss to the other party by failing to discharge an obligation.
The following policies and procedures are in place to mitigate the Group’s exposure to credit risk:
| | - | The Group sets the maximum amounts and limits that may be advanced to corporate counterparties by reference to their long- term credit ratings. |
| | - | Credit risk from customer balances, will only persist during the grace period specified in the policy document or trust deed until the policy is paid up or terminated. Commissions paid to intermediaries are netted off against amounts receivable from them in order to reduce the risk of doubtful accounts. |
| | - | Reinsurance is placed with counterparties that have a good credit rating and concentration of risk is avoided by following guidelines in respect of counterparties’ limits which are set each year by the Board of Directors and are subject to regular reviews. At each reporting date, Management performs an assessment of creditworthiness of reinsurers and updates the reinsurance purchase strategy, ascertaining suitable allowance for impairment. |
| | - | A Group policy setting out the assessment and determination of what constitutes credit risk for the Group is in place, its compliance is monitored and exposures and breaches are reported to the Group risk committee. The policy is regularly reviewed for pertinence and for changes in the risk environment. |
The Group maintains an actively managed capital base to cover risks inherent in its business. The adequacy of the Group’s capital is monitored using, among other measures, the rules and ratios established by the SBS, the supervising authority of its major subsidiaries and for consolidation purposes.
The Group’s objectives when managing capital, which is a broader concept than the “Equity” on the face of the consolidated balance sheets, are: (i) to comply with the capital requirements set by the regulators of the banking markets where the entities within the Group operate; (ii) to safeguard the Group’s ability to continue as a going concern so that it can continue to provide returns for shareholders and benefits for other stakeholders; and (iii) to maintain a strong capital base to support the development of its business.
Notes to the consolidated financial statements (continued)
Capital adequacy and the use of regulatory capital are monitored daily by the Group’s Management, employing techniques based on the guidelines developed by the Basel Committee, as implemented by the SBS for supervisory purposes. The required information is filed with the SBS on a quarterly basis. The SBS requires each bank or banking group to: (a) hold the minimum level of the regulatory capital, and (b) maintain a ratio of total regulatory capital to the risk-weighted asset at maximum level of 11. On June 2008, through Legislative Decree 1028, the ratio indicated in (b) above was modified, requiring that starting July 1, 2011, the regulatory capital be at least 10 percent of the assets and contingent credits weighed by credit risk plus 10 times the required regulatory capital for operational and market risk (9.5 percent starting July 1, 2009 and 9.8 percent starting July 1, 2010). In addition, those individual banking subsidiaries or similar financial institutions not incorporated in Peru are directly regulated and supervised by their local banking supervisor, which may differ from country to country.
The risk-weighted assets are measured by means of a hierarchy of five risk weights classified according to the nature and reflecting an estimate of credit, market and other risks associated with each asset and counterparty, taking into account any eligible collateral or guarantees. A similar treatment is adopted for off-balance sheet exposure, with some adjustments to reflect the more contingent nature of the potential losses.
As of December 31, 2008 and 2007, the regulatory capital for the subsidiaries engaged in financial and insurance activities amounted to approximately US$1,649.9 and US$1,420.2 million, respectively. This regulatory capital has been determined in accordance with SBS regulations in force as of such dates. According to the SBS and the Administradoras Privadas de Fondos de Pensiones (AFP) regulations, the Group’s regulatory capital exceeds in approximately US$308.7 million the minimum regulatory capital required as of December 31, 2008 (approximately US$350.4 million as of December 31, 2007).
Fair value is defined as the amount for which an asset could be exchanged or a liability settled, between knowledgeable, willing parties in an arm’s length transaction, assuming an on-going enterprise.
When a financial instrument is traded in an active and liquid market, its quoted market price in an actual transaction provides the best evidence of its fair value. When a quoted market price is not available, or may not be indicative of the fair value of the instrument, to determine such fair value, the current market value of another instrument that is substantially similar, discounted cash flow analysis or other estimation techniques may be used, all of which are significantly affected by assumptions used. Although Management uses its best judgment in estimating the fair value of these financial instruments, there are inherent weaknesses in any estimation technique. As a result, the fair value may not be indicative of the net realizable or liquidation value.
Notes to the consolidated financial statements (continued)
The methodologies and assumptions used to determine fair values depend on the terms and risk characteristics of the various financial instruments and include the following:
| | (a) | Assets for which fair value approximates carrying value - For financial assets and financial liabilities that are liquid or having a short term maturity (less than three months) it is assumed that the carrying amounts approximate to their fair value. This assumption is also applied to demand deposits, savings accounts without a specific maturity and variable rate financial instruments. |
| | (b) | Fixed rate financial instruments - The fair value of fixed rate financial assets and liabilities carried at amortized cost are estimated by comparing market interest rates when they were first recognized with current market rates offered for similar financial instruments. The estimated fair value of fixed interest bearing deposits is based on discounted cash flows using prevailing money-market interest rates for debts with similar credit risk and maturity. For quoted debt issued the fair values are calculated based on quoted market prices. For those notes issued where quoted market prices are not available, a discounted cash flow model is used based on a current interest rate yield curve appropriate for the remaining term to maturity. |
| | (c) | Financial instrument recorded at fair value - The fair value for financial instruments traded in active markets at the consolidated balance sheets dates is based on their quoted market price or dealer price quotations (bid price for long positions and ask price for short positions), without any deduction for transaction costs. For all other financial instruments not listed in an active market, the fair value is determined by using appropriate valuation techniques. Valuation techniques include net present value techniques and comparison to similar instruments for which market observable prices exist. |
Notes to the consolidated financial statements (continued)
Based in the aforementioned, set out below is a comparison of the carrying amounts and fair values of the Group’s financial instruments that are carried in the consolidated balance sheets. The table does not include the fair values of non-financial assets and non-financial liabilities:
| | | 2008 | | | 2007 | |
| | | Book value | | | Fair value | | | Book value | | | Fair value | |
| | | US$(000) | | | US$(000) | | | US$(000) | | | US$(000) | |
| | | | | | | | | | | | | |
| Assets | | | | | | | | | | | | |
| Cash and due from banks | | | 3,766,171 | | | | 3,766,171 | | | | 3,073,865 | | | | 3,073,865 | |
| Trading securities | | | 36,084 | | | | 36,084 | | | | 50,995 | | | | 50,995 | |
| Investments available-for-sale | | | 4,959,068 | | | | 4,959,068 | | | | 5,228,641 | | | | 5,228,641 | |
| Loans, net | | | 10,322,041 | | | | 10,330,518 | | | | 8,039,500 | | | | 8,056,106 | |
| Financial assets designated at fair value through profit or loss | | | 129,631 | | | | 129,631 | | | | 213,153 | | | | 213,153 | |
| Premiums and other policies receivable | | | 111,561 | | | | 111,561 | | | | 85,495 | | | | 85,495 | |
| Accounts receivable from reinsurers and coinsurers | | | 165,144 | | | | 165,144 | | | | 116,141 | | | | 116,141 | |
| Due from customers on acceptances | | | 232,580 | | | | 232,580 | | | | 35,901 | | | | 35,901 | |
| Other assets | | | 326,740 | | | | 326,740 | | | | 197,668 | | | | 197,668 | |
| Total | | | 20,049,020 | | | | 20,057,497 | | | | 17,041,359 | | | | 17,057,965 | |
| | | | | | | | | | | | | | | | | |
| Liabilities | | | | | | | | | | | | | | | | |
| Deposits and obligation | | | 13,950,437 | | | | 13,950,437 | | | | 11,350,714 | | | | 11,350,714 | |
| Due to banks and correspondents | | | 1,179,991 | | | | 1,180,404 | | | | 1,453,261 | | | | 1,453,185 | |
| Banker’s acceptances outstanding | | | 232,580 | | | | 232,580 | | | | 35,901 | | | | 35,901 | |
| Accounts payable to reinsurers and coinsurers | | | 55,841 | | | | 55,841 | | | | 33,963 | | | | 33,963 | |
| Financial liabilities designated at fair value through profit or loss | | | - | | | | - | | | | 50,561 | | | | 50,561 | |
| Borrowed funds | | | 1,150,716 | | | | 1,153,108 | | | | 870,404 | | | | 870,404 | |
| Bonds and subordinated notes issued | | | 785,230 | | | | 773,652 | | | | 702,298 | | | | 716,609 | |
| Other liabilities | | | 575,112 | | | | 575,112 | | | | 458,976 | | | | 458,976 | |
| Total | | | 17,929,907 | | | | 17,921,134 | | | | 14,956,078 | | | | 14,970,313 | |
Notes to the consolidated financial statements (continued)
| 29.8 | Fiduciary activities, management of funds and pension funds - |
The Group provides custody, trustee, investment management and advisory services to third parties. The Group makes allocations and purchase and sale decisions in relation to a wide range of financial instruments. Those assets that are held in a fiduciary capacity are not included in these consolidated financial statements. These services give rise to the risk that the Group will be accused of poor administration or under-performance.
As of December 31, 2008 and 2007, the assigned value of the financial assets under administration (in U.S. Dollars million) is as follows:
| | | 2008 | | | 2007 | |
| | | | | | | |
| Investments funds | | | 1,394.6 | | | | 1,768.8 | |
| Pension Funds | | | 4,199.0 | | | | 5,939.0 | |
| Equity managed | | | 1,966.8 | | | | 2,740.7 | |
| | | | | | | | | |
| Total | | | 7,560.4 | | | | 10,448.5 | |
Ernst & Young
Assurance | Tax | Transactions | Advisory
Acerca de Ernst & Young
Ernst & Young es líder global en auditoría, impuestos, transacciones y servicios de asesoría. Cuenta con aproximadamente 500 profesionales en el Perú como parte de sus 130,000 profesionales alrededor del mundo, quienes comparten los mismos valores y un firme compromiso con la calidad.
Marcamos la diferencia ayudando a nuestra gente, clientes y comunidades a alcanzar su potencial.
Puede encontrar información adicional sobre Ernst & Young en www.ey.com
© 2009 Ernst & Young.
All Rights Reserved.
Ernst & Young is
a registered trademark.