SECURITIES AND EXCHANGE COMMISSION
Washington, D.C. 20549
FORM 6-K
Report of Foreign Private Issuer
Pursuant to Rule 13a-16 or 15d-16 of the
Securities Exchange Act of 1934
For the month of November 2009
CREDICORP LTD.
(Exact name of registrant as specified in its charter)
Clarendon House
Church Street
Hamilton HM 11 Bermuda
(Address of principal executive office)
Indicate by check mark whether the registrant files or will file annual reports under cover Form 20-F or Form 40-F.
Form 20-F x Form 40-F o
Indicate by check mark whether the registrant by furnishing the information contained in this Form is also thereby furnishing the information to the Commission pursuant to Rule 12g3-2(b) under the Securities Exchange Act of 1934.
Yes o No x
CREDICORP Ltd. reports Third Quarter 2009 Earnings Lima, Peru, November 5, 2009 - Credicorp (NYSE:BAP) announced today its unaudited results for the third quarter of 2009. These results are reported on a consolidated basis in accordance with IFRS in nominal U.S. Dollars. HIGHLIGHTS · Credicorp reported net earnings of US$ 121.7 million for 3Q09, 5.6% up from US$ 115.2 million in 2Q09, showing an improved ROAA of 2.34% (vs. 2.2% in 2Q09) and a 24% ROAE. · Following a strong contraction in lending activity in 1Q09, demand for financing remained sluggish throughout 2Q and 3Q, particularly in the USD denominated portfolio, while the local currency denominated loan book maintained its dynamism. Consequently, despite signs of recovered economic activity, our loan book moved only +0.7% QoQ, which is more attributable to currency exchange movements than to real lending growth. · In addition, NII dropped as declining interest rates made it very difficult to sustain profitability in our investment positions leading to a drop in yields on investments rather than in interest on loans, which remained flat. NII also dropped due to lower interest income generated through derivatives. All of this affected NIM, which dropped to 4.7% from 5.1% last Q. · Although non financial income shows an overall 4.6% drop QoQ, it also reveals that (i) traditional fee income has performed well and is up 8.4% QoQ; and (ii) income from FX transactions recovered (+52%) in a context of currency volatility. Thus, the drop responds to significantly lower gains in the sale of securities, which was boosted in 1H09 by the sale of a large position in global government bonds. · Our PDL ratio evolved better than expected, reaching a relatively low 1.55%. This allowed us to reduce provisioning levels while still ensuring a comfortable coverage ratio, which remains above 190%. · In this context, lower loan loss provisions and stronger income generation in our insurance business and other subsidiaries widely compensated for the lack of loan growth and a lower NII, leading to the reported improvement in quarterly bottom line results. · Further, a 2.8% QoQ increase in operating costs reveals a controlled evolution of costs that include the higher costs incurred due to network expansion. Increased earnings also impacted positively on the efficiency ratio, which reached 39.8%, down from 41% in 2Q09 and 44% in 1Q09. · Similarly, BCP’s operating results reflected sluggish performance in loan growth and dropping yields on investments. However, bottom line results still show significant improvement due to (i) better loan portfolio performance that led to lower loan loss provisions; (ii) a translation gain as the local currency strengthened and we took a wider Nuevos Soles position; and (iii) a lower tax provision. In this context, BCP reported a US$ 98.8 million contribution to Credicorp for 3Q09, up 15% QoQ. · BCP Bolivia performed well despite the economic and political environment in which it operates, and reported a net earnings contribution for 3Q09 of US$7.1 million, which was 3.7% higher QoQ. This recuperation was due to improvement in loan book quality, which led the bank to decrease provisions. The loan portfolio also remained flat this Q. · ASHC’s reported strong improvement in results this 3Q with an earnings contribution of US$ 8.4 million, up from US$ 3.4 million in 2Q09. This result reveals a very clear recovery in both interest income and fee income from its AuM business, as well as lower provisions and some realized gains as the markets recover. Market recuperation also led to a recovery in the unrealized gains/losses in the capital position, which moved from US$ -12.5 million to an unrealized gain of US$ 19.2 million. |

| · | PPS performed better than expected after implementing its new business strategy and reported significant gains of US$ 10.1 million, up from the US$ 9.7 million contribution for 2Q09. This continued improvement is the result of stronger premium income and significantly lower claims, which led to a combined ratio of only 89.7%. |
| · | Prima AFP reported an increase YoY in income through higher fees and growth in its collections base. Its contribution reached US$ 5.7 million, up from US$ 4.7 million last Q. |
| · | The good results achieved by all of Credicorp’s businesses meant that net earnings this 3Q09 were in line with our expectations, reflecting a significant 24% ROAE and 2.34% ROAA with a PDL ratio of 1.56% and an efficiency ratio of 40%. |
2
I. Credicorp Ltd.
Overview
Credicorp reported net earnings of US$ 121.7 million for 3Q09, up 5.6% from US$ 115.2 million in 2Q09. This is the result of a stable and solid banking business and sustained recovery at its subsidiaries, in a context where Peruvian economy recovers from the impact of the world recession and market uncertainties. This represents EPS of US$ 1.53, ROAE of 24% and ROAA of 2.34%.
Despite visible signs of economic recovery, the significant slowdown experienced in 1Q09 and 2Q09, affected our core banking business in 3Q09 through still subdued demand for loans. Consequently, our loan book remained basically flat with 0.7% volume growth QoQ, which is more a reflection of currency exchange movements than real volume growth. Therefore, interest income from our lending activity also remained fairly flat with increased interest income only evident in the high-margin retail book, which was in turn offset by lower income from the depressed portfolio and declining margins in the wholesale segment. However, total NII dropped 8.1% QoQ as interest yields for investments declined and lower interest gains were recorded on derivatives.
Nevertheless, lower provisions for loan losses provided some relief this 3Q09 as the PDL ratio levels out at the now reported 1.55%. In fact, provisions were 30% lower this quarter, enough to maintain coverage at 192%.
Gains in our FX-transactions and traditional fee income were actually up this 3Q by 52% and 8.4% QoQ, respectively. However, given that the large gains on the sale of securities reported in the first 2 quarters of the year were not repeated in 3Q09, total non-financial income dropped, but not as much as expected (-4.6%), since the absence of large trading gains was partially offset by improved performance in other non interest income as mentioned before.
The insurance business, however, was a bright spot in performance, providing a 25.6% increase in insurance-related operating income that contributed to improving Credicorp’s quarterly result.
Credicorp Ltd. | Quarter | Change % | Year ended | Change % | ||||||||||||||||||||||||||||
US$ thousands | 3Q09 | 2Q09 | 3Q08 | 3Q09/3Q08 | 3Q09/2Q09 | Sep-09 | Sep-08 | Sep-08 | ||||||||||||||||||||||||
| Net Interest income | 214,547 | 233,542 | 200,440 | 7.0 | % | -8.1 | % | 653,955 | 608,693 | 7.4 | % | |||||||||||||||||||||
| Total provisions, net of recoveries | (38,216 | ) | (54,708 | ) | (16,713 | ) | 128.7 | % | -30.1 | % | (119,348 | ) | (42,139 | ) | 183.2 | % | ||||||||||||||||
| Non financial income | 163,541 | 172,259 | 136,602 | 19.7 | % | -5.1 | % | 513,905 | 433,095 | 18.7 | % | |||||||||||||||||||||
| Insurance premiums and claims | 36,018 | 28,670 | 16,484 | 118.5 | % | 25.6 | % | 93,195 | 31,708 | 193.9 | % | |||||||||||||||||||||
| Operating expenses | (211,568 | ) | (205,795 | ) | (213,841 | ) | -1.1 | % | 2.8 | % | (638,575 | ) | (590,279 | ) | 8.2 | % | ||||||||||||||||
| Income before non-recuring items, translation results, employees´ profit sharing and income taxes | 164,322 | 173,968 | 122,971 | 33.6 | % | -5.5 | % | 503,132 | 441,077 | 14.1 | % | |||||||||||||||||||||
| Translation results | 12,046 | 3,958 | 6,979 | 72.6 | % | 204.4 | % | 11,296 | 14,164 | -20.2 | % | |||||||||||||||||||||
| Impairment | (945 | ) | (1,782 | ) | (5,733 | ) | -83.5 | % | -47.0 | % | (7,164 | ) | (9,418 | ) | -23.9 | % | ||||||||||||||||
| Provision Atlantic Blue Chip Fund and propietary exposure | ||||||||||||||||||||||||||||||||
| Employee's profit sharing and income taxes | (45,285 | ) | (52,307 | ) | (27,542 | ) | 64.4 | % | -13.4 | % | (135,801 | ) | (90,581 | ) | 49.9 | % | ||||||||||||||||
| Net income | 130,139 | 123,837 | 96,675 | 34.6 | % | 5.1 | % | 371,463 | 355,242 | 4.6 | % | |||||||||||||||||||||
| Minority Interest | 8,432 | 8,634 | 4,075 | 106.9 | % | -2.3 | % | 23,976 | 10,978 | 118.4 | % | |||||||||||||||||||||
| Net income attributed to Credicorp | 121,707 | 115,202 | 92,601 | 31.4 | % | 5.6 | % | 347,487 | 344,264 | 0.9 | % | |||||||||||||||||||||
Net income/share (US$) | 1.53 | 1.44 | 1.16 | 31.4 | % | 5.6 | % | 4.36 | 4.32 | 0.9 | % | |||||||||||||||||||||
| Total loans | 10,675,462 | 10,603,688 | 9,929,562 | 7.5 | % | 0.7 | % | 10,675,462 | 9,929,562 | 7.5 | % | |||||||||||||||||||||
| Deposits and Obligations | 13,672,287 | 13,708,039 | 13,043,454 | 4.8 | % | -0.3 | % | 13,672,287 | 13,043,454 | 4.8 | % | |||||||||||||||||||||
Net Shareholders' Equity | 2,130,102 | 1,932,760 | 1,793,786 | 18.7 | % | 10.2 | % | 2,130,102 | 1,793,786 | 18.7 | % | |||||||||||||||||||||
| Net interest margin | 4.7 | % | 5.1 | % | 4.3 | % | 4.8 | % | 4.4 | % | ||||||||||||||||||||||
| Efficiency ratio | 39.8 | % | 40.7 | % | 42.6 | % | 41.4 | % | 40.0 | % | ||||||||||||||||||||||
| Return on average shareholders' equity | 24.0 | % | 25.6 | % | 20.7 | % | 24.8 | % | 25.7 | % | ||||||||||||||||||||||
| PDL/Total loans | 1.6 | % | 1.4 | % | 0.8 | % | 1.6 | % | 0.8 | % | ||||||||||||||||||||||
| Coverage ratio of PDLs | 191.7 | % | 192.9 | % | 297.5 | % | 191.7 | % | 297.5 | % | ||||||||||||||||||||||
Employees | 19,269 | 19,757 | 19,317 | 19,269 | 19,317 | |||||||||||||||||||||||||||
3
Operating expenses remained at controlled levels showing a mere 2.8% variation QoQ since they already capture all increases related to last year’s network expansion and no further material expansions will be carried out this year. Despite this slight increase, Credicorp’s efficiency ratio also improved to 39.8%, from 40.7% in 2Q09. Nevertheless, we continue to focus on improving the future efficiency of our operations. Currently, we are introducing changes in both our branch and processing & operating models to increase operating efficiency, subsequently reducing costs.
After higher tax provisions in 2Q due to non-tax deductible FX-related losses on currency indexed instruments from the Central Bank (calculation based on Nuevo Sol local accounting), tax provisions this Q were 13.4% lower. This also contributed to improving bottom line results.
Overall and despite the somewhat flat performance of our lending business, lower taxes; lower provisions; a translation gain on an expanded local currency position; and improvements in performance at Credicorp’s non-banking businesses led to the excellent results for the quarter. In fact, in 3Q09 Credicorp reported its second highest quarterly earnings ever, second only to the US$ 178.0 million recorded in 1Q08, which included US$ 68.7 million of gains from translation results.
Looking at YTD numbers, Credicorp reveals its good performance showing a 14.9% expansion in operating income for US$ 496 million, which, given the higher tax provisions related to a non tax-deductible loss in investments, translated into a 4.6% increase in net income. This figure, after excluding minorities, and considering PPS’s strong participation in boosting income translates into income attributable to Credicorp that was 0.9% higher than the income attributable to Credicorp for the same period of 2008. Furthermore, NIM for the 9 month period improved compared to the same period a year ago, from 4.4% to 4.8%.
Credicorp – The Sum of Its Parts
Credicorp’s 3Q09 results reflect better performance at all its subsidiaries. Even though the effects of the economic recession are still visible in our banking business’ operating performance, characterized by a relatively flat loan book and lower interest income (mainly in its investment portfolio), Credicorp’s overall performance reflects improvements in the financial environment and subsequently recoveries in market valuations and lower provision requirements. Furthermore, improvement is evident in the performance of Credicorp’s non-banking businesses, as both the asset management business and the insurance business have significantly improved their contributions to overall results.
BCP continued experiencing sluggish demand for loans and its interest income generation was also affected by the low yields achieved in its investment portfolio. Furthermore, non-financial income was negatively affected given the absence of the extraordinary gains on the sale of the government bonds recorded in the 1H09. However, an improved financial and economic scenario led to a slowdown in loan deterioration that resulted in also lower provisions. Fee income was strong, and the improvement in gains from our FX-transactions was even stronger. These improvements, together with a translation gain based on a higher position in local currency, which was taken as the currency strengthened; and lower tax provisions, made up for our loan portfolio’s sluggish performance and resulted in BCP’s reported contribution to Credicorp of US$ 98.8 million vs. US$ 86.2 million in 2Q09, reflecting a solid 24% ROAE.
4
Earnings Contribution | Quarter | Change % | YTD | Change % | ||||||||||||||||||||||||||||
(US$ Thousands) | 3Q09 | 2Q09 | 3Q08 | 3Q09/3Q08 | 3Q09/2Q09 | Sep-09 | Sep-08 | Sep-09/Sep-08 | ||||||||||||||||||||||||
| Banco de Crédito BCP(1) | 98,826 | 86,246 | 90,659 | 9 | % | 15 | % | 283,983 | 327,992 | -13 | % | |||||||||||||||||||||
| BCB | 7,086 | 6,833 | 10,956 | -35 | % | 4 | % | 20,851 | 31,464 | -34 | % | |||||||||||||||||||||
| Atlantic | 8,444 | 3,399 | 4,205 | 101 | % | 148 | % | 14,860 | 15,073 | -1 | % | |||||||||||||||||||||
| PPS | 10,088 | 9,685 | (3,589 | ) | -381 | % | 4 | % | 25,003 | (8,461 | ) | -396 | % | |||||||||||||||||||
| Grupo Crédito (2) | 6,878 | 7,264 | 2,309 | 198 | % | -5 | % | 21,008 | 12,998 | 62 | % | |||||||||||||||||||||
| Prima | 5,661 | 4,667 | 1,705 | 232 | % | 21 | % | 16,574 | 9,766 | 70 | % | |||||||||||||||||||||
| Others | 1,217 | 2,597 | 604 | 102 | % | -53 | % | 4,434 | 3,232 | 37 | % | |||||||||||||||||||||
| Credicorp and Others (3) | (2,529 | ) | 8,608 | (983 | ) | 157 | % | -129 | % | 2,633 | (3,338 | ) | -179 | % | ||||||||||||||||||
| Credicorp Ltd. | (2,994 | ) | 8,140 | (1,607 | ) | 86 | % | -137 | % | 1,205 | (5,053 | ) | -124 | % | ||||||||||||||||||
| Otras | 465 | 468 | 624 | -25 | % | -1 | % | 1,428 | 1,715 | -17 | % | |||||||||||||||||||||
Net income attributable to Credicorp | 121,707 | 115,202 | 92,601 | 31 | % | 6 | % | 347,487 | 344,264 | 1 | % | |||||||||||||||||||||
(1) Includes Banco de Crédito de Bolivia.
(2) Includes Grupo Crédito, Servicorp and Prima AFP
(3) Includes taxes on BCP's and PPS's dividends, and other expenses at the holding company level.
BCP Bolivia, which is consolidated within BCP, reported a contribution of US$ 7.1million for 3Q09 vs. US$ 6.8 million for 2Q09. Although investment activity in Bolivia may still be stagnant, the bank’s results reflect a very good return on investment of 30.3%.
ASHC’s reported strongly improved results this 3Q09 with an earnings contribution of US$ 8.4 million, up from US$ 3.4 million in 2Q09. This result reveals a very clear recovery in both interest income and fee income from its AuM business, as well as lower provisions and some realized gains as the markets recover. In fact, the market recovery also led to a recovery in the unrealized gains/losses in the capital position, which moved from US$ -12.5 million to an unrealized gain of US$ 19.2 million.
PPS, experienced better-than-expected results following the implementation of its new business strategy and reported significant gains in its P&C and Life businesses, reaching a contribution of US$ 10.1 million up from the US$ 9.7 million contribution for 2Q09. This improvement continues to be driven by significantly better technical results and a focus on risk control and diversification, which translated this 3Q09 into stronger premium income and significantly lower claims as reflected by a combined ratio of only 89.7%. The continuing good results are the product of changes in the business model throughout 2008 - 2009, which focused on reducing risk retention levels and controlling operating costs.
Finally, and despite a recent and temporary law that stipulates that the additional salaries of July and December 2009 and 2010 are not subject to contributions into the fund, Prima AFP reported an 21% increase QoQ in its contribution to Credicorp reaching US$ 5.7 million for 3Q09. Thus, Prima’s earnings reflect a 15.8% ROE in 3Q09. Furthermore, this performance reflects also stability in the domestic labor market, where Prima maintains its dominant position, capturing important market shares (30.4% of FuM, 31.7% of collections and 43.8% of voluntary contributions to the funds).
The aforementioned improvements at Credicorp’s non-banking subsidiaries, as well as stable earnings generation at BCP despite a tough economic environment, resulted in strong 6% QoQ and 31% YoY growth in net earnings attributable to Credicorp, which reached a record level. The operating improvements were subsequently reflected in excellent financial ratios including: 24% ROAE, a 39.8% efficiency ratio, 4.7% NIM and, 1.56% PDLs with 192% PDL coverage.
5
II. Banco de Crédito – BCP - Consolidated
Overview 2Q09
BCP’s net income in 3Q09 was US$ 101.5 million, which exceeds figures for the first two quarters of the year and represents growth of 14.6% QoQ and 9.0% YoY. These growth rates reflect BCP’s ability to generate income despite low growth in banking activity.
Although our loan portfolio has yet to reflect the recovery seen this quarter in both the national and international economy, showing minimal growth that is more attributable to the exchange rate than a real increase in loan volumes, bottom line results improved in comparison to 2Q09. This was due to:
i) Deceleration in the growth of the past due loan portfolio, which led to a decrease in provisions that in turn offset a contraction in net interest income (NII) associated with lower income from derivatives;
ii) Translation gains- linked to an appreciation in local currency that enabled BCP to once again take advantage of its open position in Nuevo Soles- that contrast with losses recorded in the second quarter.
iii) Lower provisions for income tax, in contrast with 2Q09, when non-tax deductible FX-related losses on currency indexed instruments from the Central Bank generated a higher taxable income.
Core Earnings
Core Revenues | Quarter | Change % | Year to date | Change % | ||||||||||||||||||||||||||||
US$ 000 | 3Q09 | 2Q09 | 3Q08 | 3Q09/3Q08 | 3Q09/2Q09 | Sep-09 | Sep-08 | Sep-09/Sep-08 | ||||||||||||||||||||||||
| Net interest and dividend income | 197,262 | 209,460 | 178,288 | 10.6 | % | -5.8 | % | 592,883 | 539,257 | 9.9 | % | |||||||||||||||||||||
| Fee income, net | 93,348 | 87,620 | 87,042 | 7.2 | % | 6.5 | % | 258,521 | 252,017 | 2.6 | % | |||||||||||||||||||||
Net gain on foreign exchange transactions | 25,559 | 19,700 | 24,497 | 4.3 | % | 29.7 | % | 65,587 | 75,857 | -13.5 | % | |||||||||||||||||||||
Core Revenues | 316,169 | 316,780 | 289,827 | 9.1 | % | -0.2 | % | 916,991 | 867,131 | 5.8 | % | |||||||||||||||||||||
BCP’s core revenues for 3Q09 were US$ 316.2 million, which is similar to the result obtained in the previous quarter (US$ 316.8 million). Commission income and net gains on foreign exchange transactions had an excellent performance and increased 6.5% and 29.7% QoQ respectively. This evolution was however offset by lower NII, which contracted 5.8% QoQ. It is nevertheless relevant to note that such decrease in NII is not related to our lending business, but rather a result of some derivative positions.
Banking services commissions rose due to increased activity in the contingent portfolio (guarantees), savings accounts and credit cards. In parallel, relative volatility in the exchange rate, which reflected a 4.2% appreciation in the Nuevo Sol against the US Dollar in 3Q09, produced an increase in buy-sell transactions of foreign currency that led to higher gains on foreign exchange transactions.
6
Credicorp Ltd. | Quarter | Change % | Year ended | Change % | ||||||||||||||||||||||||||||
US$ thousands | 3Q09 | 2Q09 | 3Q08 | 3Q09/3Q08 | 3Q09/2Q09 | Sep-09 | Sep-08 | Sep-08 | ||||||||||||||||||||||||
| Net Interest income | 214,547 | 233,542 | 200,440 | 7.0 | % | -8.1 | % | 653,955 | 608,693 | 7.4 | % | |||||||||||||||||||||
| Total provisions, net of recoveries | (38,216 | ) | (54,708 | ) | (16,713 | ) | 128.7 | % | -30.1 | % | (119,348 | ) | (42,139 | ) | 183.2 | % | ||||||||||||||||
| Non financial income | 163,541 | 172,259 | 136,602 | 19.7 | % | -5.1 | % | 513,905 | 433,095 | 18.7 | % | |||||||||||||||||||||
| Insurance premiums and claims | 36,018 | 28,670 | 16,484 | 118.5 | % | 25.6 | % | 93,195 | 31,708 | 193.9 | % | |||||||||||||||||||||
| Operating expenses | (211,568 | ) | (205,795 | ) | (213,841 | ) | -1.1 | % | 2.8 | % | (638,575 | ) | (590,279 | ) | 8.2 | % | ||||||||||||||||
| Income before non-recuring items, translation results, employees´ profit sharing and income taxes | 164,322 | 173,968 | 122,971 | 33.6 | % | -5.5 | % | 503,132 | 441,077 | 14.1 | % | |||||||||||||||||||||
| Translation results | 12,046 | 3,958 | 6,979 | 72.6 | % | 204.4 | % | 11,296 | 14,164 | -20.2 | % | |||||||||||||||||||||
| Impairment | (945 | ) | (1,782 | ) | (5,733 | ) | -83.5 | % | -47.0 | % | (7,164 | ) | (9,418 | ) | -23.9 | % | ||||||||||||||||
| Provision Atlantic Blue Chip Fund and propietary exposure | ||||||||||||||||||||||||||||||||
| Employee's profit sharing and income taxes | (45,285 | ) | (52,307 | ) | (27,542 | ) | 64.4 | % | -13.4 | % | (135,801 | ) | (90,581 | ) | 49.9 | % | ||||||||||||||||
| Net income | 130,139 | 123,837 | 96,675 | 34.6 | % | 5.1 | % | 371,463 | 355,242 | 4.6 | % | |||||||||||||||||||||
| Minority Interest | 8,432 | 8,634 | 4,075 | 106.9 | % | -2.3 | % | 23,976 | 10,978 | 118.4 | % | |||||||||||||||||||||
| Net income attributed to Credicorp | 121,707 | 115,202 | 92,601 | 31.4 | % | 5.6 | % | 347,487 | 344,264 | 0.9 | % | |||||||||||||||||||||
Net income/share (US$) | 1.53 | 1.44 | 1.16 | 31.4 | % | 5.6 | % | 4.36 | 4.32 | 0.9 | % | |||||||||||||||||||||
| Total loans | 10,675,462 | 10,603,688 | 9,929,562 | 7.5 | % | 0.7 | % | 10,675,462 | 9,929,562 | 7.5 | % | |||||||||||||||||||||
| Deposits and Obligations | 13,672,287 | 13,708,039 | 13,043,454 | 4.8 | % | -0.3 | % | 13,672,287 | 13,043,454 | 4.8 | % | |||||||||||||||||||||
Net Shareholders' Equity | 2,130,102 | 1,932,760 | 1,793,786 | 18.7 | % | 10.2 | % | 2,130,102 | 1,793,786 | 18.7 | % | |||||||||||||||||||||
| Net interest margin | 4.7 | % | 5.1 | % | 4.3 | % | 4.8 | % | 4.4 | % | ||||||||||||||||||||||
| Efficiency ratio | 39.8 | % | 40.7 | % | 42.6 | % | 41.4 | % | 40.0 | % | ||||||||||||||||||||||
| Return on average shareholders' equity | 24.0 | % | 25.6 | % | 20.7 | % | 24.8 | % | 25.7 | % | ||||||||||||||||||||||
| PDL/Total loans | 1.6 | % | 1.4 | % | 0.8 | % | 1.6 | % | 0.8 | % | ||||||||||||||||||||||
| Coverage ratio of PDLs | 191.7 | % | 192.9 | % | 297.5 | % | 191.7 | % | 297.5 | % | ||||||||||||||||||||||
Employees | 19,269 | 19,757 | 19,317 | 19,269 | 19,317 | |||||||||||||||||||||||||||
The quarterly evolution of non-financial income shows a decline as was expected due to lower gains on sales of securities, which reached exceptional levels in 2Q09 due to gains realized on sales of sovereign and global bonds bought last year. Nevertheless, it is important to emphasize once again that this decline was mitigated by improvements in fee income and gains on foreign currency transactions.
Although total operating costs remained at levels similar to those seen in 2Q09, the costs included in the calculation of operating efficiency declined somewhat due to lower administrative expenses. This led to an improvement in the efficiency ratio, which reached 48.8% (vs. 49.7% in 2Q09).
In terms of portfolio quality, the delinquency rate at the end of 3Q09 was 1.56%. Although this figure is higher than the 1.39% recorded in 2Q09, a deceleration in growth of past due loans is evident, but not significantly reflected in the delinquency ratio because the loan portfolio has remained almost flat QoQ. Past due loan coverage was 191.8% in 3Q09, which is similar to last quarter’s figure (193.0%).
With regard to profitability, BCP recorded a ROAE of 27.1%, which was higher than the 25.7% reported in 2Q09.
Finally, it is important to note that the operating results YTD totaled US$ 405.5 million, similar to the US$ 408.4 million reported for the same period of 2008. This result is favorable considering the significant increases achieved both in net interest income (+9.9%) and non-financial income (+19.0%), which helped offset considerable growth in provisions (+ 168.0% resulting from the economic crisis) and operating expenses (+11.1% following the extraordinary network expansion of 2008).
7
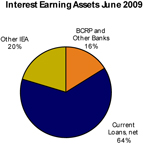
II.1 Interest Earning Assets (IEA)
The current lack of investment options offering attractive returns, a decreasing need to maintain high liquidity levels and a still weak demand for financing led to a 1.2% QoQ decrease in interest earning assets.
| Interest Earning Assets | Quarter | Change % | ||||||||||||||||||
| US$ 000 | 3Q09 | 2Q09 | 3Q08 | 3Q09/3Q08 | 3Q09/2Q09 | |||||||||||||||
| BCRP and other banks | 2,749,996 | 2,630,104 | 3,194,923 | -13.9 | % | 4.6 | % | |||||||||||||
| Interbank funds | 68,132 | 110,435 | 113,749 | -40.1 | % | -38.3 | % | |||||||||||||
| Trading securities | 89,718 | 39,579 | 32,468 | 176.3 | % | 126.7 | % | |||||||||||||
| Investment securities available for sale | 2,793,015 | 3,162,714 | 3,512,873 | -20.5 | % | -11.7 | % | |||||||||||||
| Current loans, net | 10,406,954 | 10,356,401 | 9,759,601 | 6.6 | % | 0.5 | % | |||||||||||||
| Total interest earning assets | 16,107,815 | 16,299,233 | 16,613,614 | -3.0 | % | -1.2 | % | |||||||||||||
Improved expectations for the recovery of international and local economies decreased BCP’s need to maintain high liquidity levels, particularly given that the current scenario offers almost no investment options with attractive returns. These factors led to a contraction in interest earning assets. Additionally, the most important asset - loan portfolio- still faces a weak demand for financing, which has meant that current loans have remained at levels similar to those seen last quarter.
 |  |
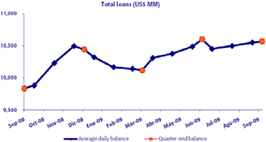
Loan Portfolio
BCP’s net loan balance was US$ 10,255 million at the end of 3Q09. This figure was similar to last quarter’s (US$ 10,356 million) but includes the effect of a 4.2% appreciation in the Nuevo Sol against the US Dollar. The chart below, which shows the evolution of end-of-quarter balances and the average daily balances for each month, demonstrates that there was a slight contraction in the average daily balance in July that begun to revert in August and September.
8
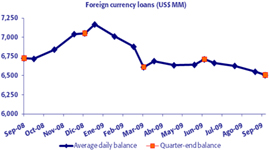
An analysis of the average daily balance on a per currency basis indicates that the phenomenon observed during the first half of the year is still in play. The average daily balance of the domestic currency denominated portfolio continues to grow although growth in 3Q09 was slightly lower (+2.4%) than that recorded in 2Q09 (+4.2%). On the other hand, the average daily balance of the foreign currency denominated portfolio contracted only 0.9%, reflecting a lower decrease than that seen in 2Q09 (-2.7%).
In terms of Nuevos Soles denominated loans, the QoQ expansion in average daily balances was due to growth in Retail Banking balances (+5.8%), which was attenuated by the decline registered in Wholesale Banking balances (-2.8%). The foreign currency denominated portfolio continues to reflect a decrease in activity, although less pronounced than in previous quarters, in both banking segments.
The YoY evolution shows that the average daily balance of the domestic currency denominated portfolio increased 29.7% due to 33.2% growth in Retail Banking and 23.2% growth in Wholesale Banking. Additionally, the average daily balance of the foreign currency denominated portfolio remained at levels similar to those seen in 3Q08.
Average Daily Balances
| Domestic Currency Loans (1) | Foreign Currency Loans (1) | |||||||||||||||||||||||||||||||||||||||
| Segments | (Nuevos Soles million) | (US$ million) | ||||||||||||||||||||||||||||||||||||||
3Q09 | 2Q09 | 3Q08 | YoY | QoQ | 3Q09 | 2Q09 | 3Q08 | YoY | QoQ | |||||||||||||||||||||||||||||||
| Wholesale Banking | 4,624.1 | 4,757.4 | 3,753.0 | 23.2 | % | -2.8 | % | 4,242.9 | 4,302.7 | 4,257.0 | -0.3 | % | -1.4 | % | ||||||||||||||||||||||||||
| - Corporate | 3,516.5 | 3,630.0 | 2,575.3 | 36.5 | % | -3.1 | % | 2,743.1 | 2,795.9 | 2,487.4 | 10.3 | % | -1.9 | % | ||||||||||||||||||||||||||
| - Middle Market | 1,107.5 | 1,127.4 | 1,177.7 | -6.0 | % | -1.8 | % | 1,499.7 | 1,506.8 | 1,769.7 | -15.3 | % | -0.5 | % | ||||||||||||||||||||||||||
| Retail Banking | 6,686.1 | 6,318.1 | 5,020.1 | 33.2 | % | 5.8 | % | 1,782.5 | 1,785.5 | 1,790.9 | -0.5 | % | -0.2 | % | ||||||||||||||||||||||||||
| - SME + Business | 2,269.4 | 2,196.4 | 1,703.7 | 33.2 | % | 3.3 | % | 550.6 | 551.6 | 578.8 | -4.9 | % | -0.2 | % | ||||||||||||||||||||||||||
| - Mortgages | 1,656.9 | 1,497.3 | 1,180.9 | 40.3 | % | 10.7 | % | 905.9 | 906.5 | 887.0 | 2.1 | % | -0.1 | % | ||||||||||||||||||||||||||
| - Consumer | 1,586.7 | 1,501.2 | 1,171.6 | 35.4 | % | 5.7 | % | 260.6 | 263.8 | 262.1 | -0.6 | % | -1.2 | % | ||||||||||||||||||||||||||
| - Credit Cards | 1,173.0 | 1,123.1 | 963.9 | 21.7 | % | 4.4 | % | 65.5 | 63.5 | 63.1 | 3.7 | % | 3.0 | % | ||||||||||||||||||||||||||
| Consolidated total loans (2) | 11,419 | 11,155 | 8,804 | 29.7 | % | 2.4 | % | 6,615 | 6,675 | 6,627 | -0.2 | % | -0.9 | % | ||||||||||||||||||||||||||
(1) Average daily balance
(2) Includes work out unit, other banking and BCP Bolivia
 |  |
9
Market Share
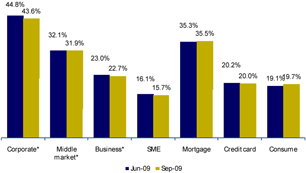
*As of August 2009
At the end of September, BCP reported a 32.2% share in the loan market. This level is the same as that obtained at the end of June 2009 and exceeds the 31.0% share achieved in September 2008. As such, the bank still leads the market and has also widened the gap between itself and its closest competitor.
By the end of August, the market shares of Corporate and Middle Market Banking declined somewhat, closing at 43.6% and 31.9%, respectively (44.8% and 32.1%, respectively, at the end of June 2009).
Within Retail Banking, shares per product maintained levels similar to those seen at the end of 2Q09.
Dollarization
Loans in domestic currency represented 38.0% of the portfolio, which is slightly higher than the 37.2% recorded at the end of 2Q09. This can be partially explained by the fact that the domestic currency denominated portfolio has continued expanding, conversely to the foreign currency denominated portfolio, but also because the Nuevo Sol appreciated 4.2% against the US Dollar during 3Q09.
10
II.2 Deposits and Mutual Funds
Market recovery and our customers’ search for higher returns produced a significant increase (+19.2%) in BCP mutual funds. A slight decline in BCP deposits is partially attributable to cancellation of deposits at maturity, primarily time deposits, reflecting customers’ decisions to migrate to investment products that offer more profitable alternatives.
| Deposits and Obligations | Quarter | Change % | ||||||||||||||||||
| US$ (000) | 3Q09 | 2Q09 | 3Q08 | 3Q09/3Q08 | 3Q09/2Q09 | |||||||||||||||
| Non-interest bearing deposits | 3,415,360 | 3,964,955 | 2,874,202 | 18.8 | % | -13.9 | % | |||||||||||||
| Demand deposits | 883,553 | 37,893 | 962,343 | -8.2 | % | 2231.7 | % | |||||||||||||
| Saving deposits | 3,387,339 | 3,162,394 | 2,748,290 | 23.3 | % | 7.1 | % | |||||||||||||
| Time deposits | 5,179,047 | 5,731,125 | 5,754,903 | -10.0 | % | -9.6 | % | |||||||||||||
| Severance indemnity deposits (CTS) | 1,012,534 | 1,058,723 | 928,891 | 9.0 | % | -4.4 | % | |||||||||||||
| Interest payable | 68,881 | 80,560 | 71,776 | -4.0 | % | -14.5 | % | |||||||||||||
| Total customer deposits | 13,946,714 | 14,035,650 | 13,340,405 | 4.5 | % | -0.6 | % | |||||||||||||
| Mutual funds in Perú | 1,779,085 | 1,492,380 | 2,010,590 | -11.5 | % | 19.2 | % | |||||||||||||
| Mutual funds in Bolivia | 156,339 | 155,613 | 100,141 | 56.1 | % | 0.5 | % | |||||||||||||
| Total customer funds | 15,882,138 | 15,683,643 | 15,451,136 | 2.8 | % | 1.3 | % | |||||||||||||
At the end of 3Q09, Credifondo‘s FuM totaled US$ 1,779 MM, which represents a 19.2% increase with regard to the US$ 1,492 million recorded at the end of 2Q09. This evolution was attributable not only to market recovery but also to the entry of new clients, who were attracted by the higher returns on mutual funds seen throughout this year. These individuals are encouraged by the improved economic outlook (one year after the crisis began). In this context, Credifondo was once again market leader in terms of total FuM and number of clients, with 43.1% and 37.0% market share, respectively. It is important to point out that Credifondo has the highest average investment per client in the market (16.5% above the market average).
Mutual funds’ favorable evolution partially explains the slight reduction in total deposits and mainly the drop in time deposits, which fell 9.6% QoQ. This decline was caused by the fact that customers decided to cancel time deposits at maturity due to lower market interest rates at renewal and migrate towards investment products such as mutual funds.
11
Market Share
At the end of 3Q09, BCP maintained its leadership in the deposits market with a 35.0% market share, similar to the 35.9% recorded at the end of 2Q09. This slight decline was the result of intense competition in the system, which led smaller banks to offer higher interest rates to capture deposits, and the clients’ decision to migrate towards investment products.
The table below shows market shares according to each type of deposit in domestic and foreign currency:
| Market share by type of deposit and currency | ||||||||||||||||
Demand deposits | Saving deposits | Time deposits | Severance indemnity | |||||||||||||
| LC | 39.1 | % | 35.9 | % | 23.9 | % | 39.1 | % | ||||||||
| FC | 42.8 | % | 41.7 | % | 36.4 | % | 56.3 | % | ||||||||
LC: Local Currency FC: Foreign Currency | ||||||||||||||||
Dollarization
Deposits remained stable during 3Q09 in both currencies. As such, an increase in domestic currency denominated deposits in total deposits is primarily attributable to the 4.2% appreciation in domestic currency against the US Dollar.
12
II.3 Net Interest Income
Although net financial income fell 5.8% QoQ, primarily due to lower income from derivatives, the results YTD evolved favorably (+ 9.9%) with regard to the same period last year. This was essentially due to growth in interest on loans (+13.5%) and lower interest expenses (-20.8%).
Net interest income | Quarter | Change % | Year to date | Variación % | ||||||||||||||||||||||||||||
US$ 000 | 3Q09 | 2Q09 | 3Q08 | 3Q09/3Q08 | 3Q09/2Q09 | Sep-09 | Sep-08 | Sep-09/Sep-08 | ||||||||||||||||||||||||
| Interest income | 292,292 | 314,832 | 322,921 | -9.5 | % | -7.2 | % | 909,494 | 939,001 | -3.1 | % | |||||||||||||||||||||
| Interest on loans | 260,705 | 263,588 | 246,814 | 5.6 | % | -1.1 | % | 783,044 | 689,639 | 13.5 | % | |||||||||||||||||||||
| Interest and dividends on investments | 384 | - | 2 | 19100 | % | 100.0 | % | 3,088 | 4,326 | -28.6 | % | |||||||||||||||||||||
| Interest on deposits with banks | 2,351 | 4,399 | 13,236 | -82.2 | % | -46.6 | % | 16,163 | 45,330 | -64.3 | % | |||||||||||||||||||||
| Interest on trading securities | 27,730 | 30,513 | 59,477 | -53.4 | % | -9.1 | % | 83,000 | 175,257 | -52.6 | % | |||||||||||||||||||||
| Other interest income | 1,122 | 16,332 | 3,392 | -66.9 | % | -93.1 | % | 24,199 | 24,449 | -1.0 | % | |||||||||||||||||||||
| Interest expense | 95,030 | 105,372 | 144,633 | -34.3 | % | -9.8 | % | 316,611 | 399,744 | -20.8 | % | |||||||||||||||||||||
| Interest on deposits | 61,505 | 75,416 | 103,790 | -40.7 | % | -18.4 | % | 220,103 | 292,127 | -24.7 | % | |||||||||||||||||||||
| Interest on borrowed funds | 4,746 | 6,445 | 17,400 | -72.7 | % | -26.4 | % | 21,244 | 49,727 | -57.3 | % | |||||||||||||||||||||
| Interest on bonds and subordinated note | 16,501 | 16,060 | 15,019 | 9.9 | % | 2.7 | % | 47,013 | 39,877 | 17.9 | % | |||||||||||||||||||||
Other interest expense | 12,278 | 7,451 | 8,424 | 45.8 | % | 64.8 | % | 28,251 | 18,013 | 56.8 | % | |||||||||||||||||||||
Net interest income | 197,262 | 209,460 | 178,288 | 10.6 | % | -5.8 | % | 592,883 | 539,257 | 9.9 | % | |||||||||||||||||||||
Average interest earning assets | 16,203,524 | 16,541,642 | 16,568,839 | -2.2 | % | -2.0 | % | |||||||||||||||||||||||||
Net interest margin* | 4.87 | % | 5.07 | % | 4.30 | % | ||||||||||||||||||||||||||
*Annualized
The 7.2% QoQ contraction in interest income was primarily the result of lower income from derivatives (other interest income), item that recorded income for US$ 16.2 million in 2Q09, which was mainly caused by higher valuation of forwards that was an effect of the reduction of 200 bps in the differential between local interest rate and international interest rate, an scenario that did not occur in 3Q09.
13
Lower interest expenses (-9.8% QoQ) were due to 18.4% reduction QoQ in the interests paid on deposits, which was primarily the product of lower interest rates in line with BCR’s lower reference rate, which reached a historic minimum of 1.25% in August of this year. The aforementioned was reinforced by deposit redistribution- reflecting an increase in low cost options such as demand and non-interest generating deposits and a decrease in higher cost alternatives and time deposits- that led to lower interest expenses.
In this scenario, the NIM fell from 5.07% in 2Q09 to 4.87% in 3Q09. However, loan portfolio NIM was basically flat, going from 7.8% in 2Q09 to 7.7% in 3Q09. This was primarily due to a minor reduction in interests on loans, which was the result of intense competition in Wholesale Banking.
Finally, it is important to emphasize that net financial income YTD evolved favorably, recording 9.9% growth mainly driven by a 13.5% increase in interest on loans and a 20.8% contraction in interest expenses.
II.4 Loan Provisions
An improvement in expectations for portfolio’s quality was reflected in a 28.0% and 7.8% reduction in provisions and charge offs, respectively. Although past due loans increased 13.1% QoQ, the growth rate was lower than that observed in 2Q09 (+25.6%). Nevertheless, as loans remained at levels similar to those seen in 2Q09, the delinquency rate was 1.56%.
| Provisión for loan losses | Quarter | Change % | ||||||||||||||||||
| US$ 000 | 3Q09 | 2Q09 | 3Q08 | 3Q09/3Q08 | 3Q09/2Q09 | |||||||||||||||
| Provisions | (44,080 | ) | (59,761 | ) | (24,040 | ) | 83.4 | % | -26.2 | % | ||||||||||
| Loan loss recoveries | 5,163 | 5,687 | 6,424 | -19.6 | % | -9.2 | % | |||||||||||||
| Total provisions, net of recoveries | (38,917 | ) | (54,074 | ) | (17,616 | ) | 120.9 | % | -28.0 | % | ||||||||||
| Total loans | 10,572,063 | 10,502,346 | 9,836,170 | 7.5 | % | 0.7 | % | |||||||||||||
| Reserve for loan losses (RLL) | 316,718 | 281,675 | 229,071 | 38.3 | % | 12.4 | % | |||||||||||||
| Charge-Off amount | 20,709 | 22,461 | 11,929 | 73.6 | % | -7.8 | % | |||||||||||||
| Past due loans (PDL) | 165,109 | 145,945 | 76,569 | 115.6 | % | 13.1 | % | |||||||||||||
| PDL/Total loans | 1.56 | % | 1.39 | % | 0.78 | % | ||||||||||||||
| Coverage | 191.82 | % | 193.00 | % | 299.17 | % | ||||||||||||||
Net provisions dropped 28.0% QoQ due primarily to lower provisions for Wholesale Banking and, to a lesser extent, to lower generic provisions in 3Q09. This was in line with improved expectations regarding the quality of the loan portfolio, which has been deteriorating at slower rate.
14
Past due portfolio have risen 13.4% QoQ due to an increase in overdue loans, particularly in Retail Banking SME segment. Nevertheless, the Wholesale Banking’s past due loans and consumer loans decreased around 20.4% and 15.1% respectively. This resulted in a 19 bps QoQ increase in the delinquency rate, which, at 1.56%, is below the system’s average.
II.5 Non Financial Income
The significant increase in net gains on foreign currency transactions (+29.7% QoQ) and a recovery in banking services commissions (+6.5% QoQ) attenuated the decline expected in gains on sales of securities (-72.5% QoQ). As such, non- financial income decreased 13.9% QoQ.
| Non financial income | Quarter | Change % | ||||||||||||||||||
| US$ 000 | 3Q09 | 2Q09 | 3Q08 | 3Q09/3Q08 | 3Q09/2Q09 | |||||||||||||||
| Fee income | 93,348 | 87,620 | 87,042 | 7.2 | % | 6.5 | % | |||||||||||||
| Net gain on foreign exchange transactions | 25,559 | 19,700 | 24,497 | 4.3 | % | 29.7 | % | |||||||||||||
| Net gain on sales of securities | 9,890 | 35,983 | (3,128 | ) | 416.2 | % | -72.5 | % | ||||||||||||
| Other income | 892 | 7,285 | 4,897 | -81.8 | % | -87.8 | % | |||||||||||||
| Total non financial income | 129,689 | 150,588 | 113,308 | 14.5 | % | -13.9 | % | |||||||||||||
During 3Q09, a recovery was observed in banking services commissions, which increased 6.5% QoQ and 7.2% YoY. Growth in fee income was recorded in most areas but was highest in Contingents (Guarantees, +US$ 2.4 million), Savings Accounts (+US$ 1.8 million) and Credit Cards (+US$ 1.3 million).
15
The exchange rate at the end of 2Q09 was S/. 3.010 per US dollar while the rate at the end of 3Q09 was S/.2.884 per US dollar. The relative high volatility in the exchange rate during the last quarter spurred an increase in foreign currency buy-sell transactions, which in turn generated 29.7% QoQ and 4.3% YoY growth in gains on foreign exchange operations.
Additionally, as expected, the level of gains on sales of securities recorded in 1Q09 and 2Q09 dropped given that the stock of sovereign and global bonds acquired in October 2008 ran out. As such, during 3Q09, net gains on sales of securities contracted 72.5% QoQ.
Other non financial income contracted 87.8% QoQ; this was due primarily to the fact that a US$ 5.7 million reversal made in 2Q09 (April) for annual profit sharing in 2008, which was reported as extraordinary income in 2Q09.
Finally, another important aspect of banking activity is related to the volume of transactions by distribution channels. During 3Q09, the average number of monthly transactions was 43.9 million, which represented an increase of 5.4% QoQ and 18.6% YoY. The channels that experienced the highest growth in transactions were: BCP Agents (+24.9% QoQ), Internet Banking (+5.5% QoQ), P.O.S. points of sale (+12.5% QoQ) and BCP ATMs (+1.9% QoQ). The increase in Mobile Banking (10.4% QoQ), which is a low cost channel that was introduced in 2009, is also noteworthy. This evolution is the result of BCP’s efforts to encourage the use of lower cost customer service channels in lieu of tellers. This last channel has begun to show a deceleration in growth, which was 3.1% QoQ versus 5% QoQ in the previous quarter.
| Quarter | Change % | |||||||||||||||||||
| N° of Transactions per channel | Average 3Q09 | Average 2Q09 | Average 3Q08 | 3Q09/3Q08 | 3Q09/2Q09 | |||||||||||||||
| Teller | 10,596,719 | 10,277,109 | 10,040,941 | 5.5 | % | 3.1 | % | |||||||||||||
| Internet Banking Via BCP | 9,770,583 | 9,257,727 | 8,598,560 | 13.6 | % | 5.5 | % | |||||||||||||
| ATMs Via BCP | 7,239,234 | 7,105,823 | 6,241,016 | 16.0 | % | 1.9 | % | |||||||||||||
| Agente BCP | 4,006,165 | 3,207,639 | 1,942,643 | 106.2 | % | 24.9 | % | |||||||||||||
| Telecrédito | 3,973,367 | 3,989,840 | 3,345,913 | 18.8 | % | -0.4 | % | |||||||||||||
| Points of Sale P.O.S. | 3,474,223 | 3,087,701 | 2,746,508 | 26.5 | % | 12.5 | % | |||||||||||||
| Balance Inquiries | 2,554,782 | 2,611,452 | 2,386,611 | 7.0 | % | -2.2 | % | |||||||||||||
| Telephone Banking | 1,470,293 | 1,389,107 | 1,174,645 | 25.2 | % | 5.8 | % | |||||||||||||
| Direct Debit | 408,430 | 365,878 | 308,098 | 32.6 | % | 11.6 | % | |||||||||||||
| Other ATMs network | 270,654 | 242,226 | 203,957 | 32.7 | % | 11.7 | % | |||||||||||||
| Mobile banking | 118,641 | 107,463 | - | - | 10.4 | % | ||||||||||||||
| Total transactions | 43,883,091 | 41,641,965 | 36,988,892 | 18.6 | % | 5.4 | % | |||||||||||||
In terms of distribution channels, the number of branches remained stable. This is part of a strategy to redesign branches and maximize their efficiency before engaging in further expansion. The number of ATMs also remained virtually unchanged. Nevertheless, a 7.6% QoQ increase was recorded in BCP Agents as part of the continuing effort to promote bank penetration.
16
| Balance as of | Change % | |||||||||||||||||||
| 3Q09 | 2Q09 | 3Q08 | 3Q09/3Q08 | 3Q09/2Q09 | ||||||||||||||||
| Branches | 330 | 336 | 310 | 6.5 | % | -1.8 | % | |||||||||||||
| ATMs | 951 | 950 | 843 | 12.8 | % | 0.1 | % | |||||||||||||
| Agentes BCP | 2,435 | 2,262 | 1,720 | 41.6 | % | 7.6 | % | |||||||||||||
| Total | 3,716 | 3,548 | 2,873 | 29.3 | % | 4.7 | % | |||||||||||||
II.6 Operating Costs and Efficiency
Despite the fact that operating expenses were similar to those registered in 2Q09, the efficiency ratio improved dropping from 49.7% to 48.8% QoQ. This improvement in efficiency was the product of lower administrative expenses (-7.3% QoQ), which contributed to a 1.9% QoQ reduction in the operating expenses considered in the operating efficiency calculation, which does not include the item “Others”.
| Operating expenses | Quarter | Change % | ||||||||||||||||||
| US$ 000 | 3Q09 | 2Q09 | 3Q08 | 3Q09/3Q08 | 3Q09/2Q09 | |||||||||||||||
| Salaries and employees benefits | 80,318 | 79,316 | 83,496 | -3.8 | % | 1.3 | % | |||||||||||||
| Administrative, general and tax expenses | 59,269 | 63,919 | 56,266 | 5.3 | % | -7.3 | % | |||||||||||||
| Depreciation and amortizacion | 14,712 | 14,088 | 11,800 | 24.7 | % | 4.4 | % | |||||||||||||
| Other expenses | 6,794 | 4,262 | 11,467 | -40.8 | % | 59.4 | % | |||||||||||||
| Total operating expenses | 161,093 | 161,585 | 163,029 | -1.2 | % | -0.3 | % | |||||||||||||
| Efficiency Ratio | 48.80 | % | 49.66 | % | 52.29 | % | ||||||||||||||
Although salaries and employee benefits increased 1.3% QoQ and expenses for depreciation and amortization expanded 4.4% QoQ, their effects were offset by a 7.3% contraction in administrative, general and tax expenses, which was mainly the result of a reduction in expenses in other subsidiaries (-74.2% QoQ)that is aligned with the policy to increase efficiency.
Additionally, “other operating expenses” increased 59.4% QoQ, primarily due higher provisions for the SAR program in a quarter where Credicorp’s share increased from US$ 58.2 to US$ 77.8.
The table below provides details on administrative expenses and their quarterly variations:
Administrative Expenses | Quarter | Change % | ||||||||||||||||||||||||||||||
US$ (000) | 3Q09 | % | 2Q09 | % | 3Q08 | % | 3Q09/3Q08 | 3Q09/2Q09 | ||||||||||||||||||||||||
| Systems | 7,463 | 12.6 | % | 7,853 | 12.3 | % | 5,054 | 9.0 | % | 47.7 | % | -5.0 | % | |||||||||||||||||||
| Marketing | 7,197 | 12.1 | % | 7,398 | 11.6 | % | 6,260 | 11.1 | % | 15.0 | % | -2.7 | % | |||||||||||||||||||
| Transportation | 6,500 | 11.0 | % | 3,186 | 5.0 | % | 3,169 | 5.6 | % | 105.1 | % | 104.0 | % | |||||||||||||||||||
| Consulting | 5,448 | 9.2 | % | 5,669 | 8.9 | % | 5,421 | 9.6 | % | 0.5 | % | -3.9 | % | |||||||||||||||||||
| Comunications | 3,312 | 5.6 | % | 3,262 | 5.1 | % | 2,843 | 5.1 | % | 16.5 | % | 1.5 | % | |||||||||||||||||||
| Maintenance | 3,052 | 5.1 | % | 3,238 | 5.1 | % | 2,403 | 4.3 | % | 27.0 | % | -5.7 | % | |||||||||||||||||||
| Other expenses | 18,210 | 30.7 | % | 19,495 | 30.5 | % | 17,537 | 31.2 | % | 3.8 | % | -6.6 | % | |||||||||||||||||||
| Property taxes and others | 5,937 | 10.0 | % | 5,496 | 8.6 | % | 5,290 | 9.4 | % | 12.2 | % | 8.0 | % | |||||||||||||||||||
| Other subsidiaries and eliminations, net | 2,150 | 3.6 | % | 8,322 | 13.0 | % | 8,287 | 14.7 | % | -74.1 | % | -74.2 | % | |||||||||||||||||||
Total Administrative Expenses | 59,269 | 100.0 | % | 63,919 | 100.0 | % | 56,266 | 100.0 | % | 5.3 | % | -7.3 | % | |||||||||||||||||||
17
II.7 Shareholders’ Equity and Regulatory Capital
At the end of 3Q09, net shareholders’ equity increased due to higher unrealized gains and growth in quarterly income. Additionally, under the Basel II framework, (in effect as of July 2009), the BIS ratio rose to 14.5% at the end of 3Q09, which was higher but not comparable to the 13.5% ratio reported in 2Q09 under the Basel I framework.
| Shareholders' equity | Quarter | Change % | ||||||||||||||||||
| US$ 000 | 3Q09 | 2Q09 | 3Q08 | 3Q09/3Q08 | 3Q09/2Q09 | |||||||||||||||
| Capital stock | 667,250 | 667,250 | 439,474 | 51.8 | % | 0.0 | % | |||||||||||||
| Reserves | 388,275 | 388,275 | 388,062 | 0.1 | % | 0.0 | % | |||||||||||||
| Unrealized Gains and Losses | 94,797 | 82,809 | 43,352 | 118.7 | % | 14.5 | % | |||||||||||||
| Retained Earnings | 115,922 | 115,922 | 111,994 | 3.5 | % | 0.0 | % | |||||||||||||
| Income for the year | 289,980 | 188,524 | 336,897 | -13.9 | % | 53.8 | % | |||||||||||||
| Total shareholders' equity | 1,556,224 | 1,442,780 | 1,319,779 | 17.9 | % | 7.9 | % | |||||||||||||
| Return on average equity (ROAE) | 27.06 | % | 25.71 | % | 28.93 | % | ||||||||||||||
At the end of 3Q09, net shareholders’ equity grew 7.9% QoQ and 17.9% YoY. This increase can be explained by the 53.8% QoQ growth in earnings and the 14.5% QoQ increase in unrealized gains, which were the product of a recovery in the values of available for sale securities. In this scenario, net income grew 14.6% QoQ. This fact, coupled with an increase in net equity, generated a higher ROAE, which went from 25.7% in 2Q09 to 27.1% in 3Q09.
| Regulatory Capital and Capital Adequancy Ratios | Balance as of | Change % | ||||||||||||||||||
| US$ (000) | Sep-09 | Jun-09 | Sep-08 | Sep 09/ Sep 08 | Sep 09/ Jun 09 | |||||||||||||||
| Capital Stock, net | 772,638 | 740,295 | 506,817 | 52.4 | % | 4.4 | % | |||||||||||||
| Legal and Other capital reserves | 460,838 | 441,547 | 446,365 | 3.2 | % | 4.4 | % | |||||||||||||
| Net income capitalized | 114,234 | 109,452 | 134,409 | -15.0 | % | 4.4 | % | |||||||||||||
| Subsidiaries non capitalized net income | 58,261 | n.a. | n.a. | - | - | |||||||||||||||
| Investment in subsidiaries and others | 233,172 | 235,827 | 194,526 | 19.9 | % | -1.1 | % | |||||||||||||
| Goodwill | - | - | 8,320 | -100.0 | % | - | ||||||||||||||
| Generic Contingency loss reserves | 133,804 | 110,012 | 103,338 | 29.5 | % | 21.6 | % | |||||||||||||
| Subordinated Debt | 432,418 | 399,364 | 289,099 | 49.6 | % | 8.3 | % | |||||||||||||
| Unrealized profit (loss) | n.a. | 21,392 | - | - | - | |||||||||||||||
| Non realized acumulated losses (if it exceeds BCP acumulated net income) | - | n.a. | n.a. | - | - | |||||||||||||||
| Total Regulatory Capital | 1,739,021 | 1,586,234 | 1,277,182 | 36.2 | % | 9.6 | % | |||||||||||||
Tier 1 (1) | 1,289,384 | 1,194,772 | 982,008 | 31.3 | % | 7.9 | % | |||||||||||||
Tier 2 (2) | 449,636 | 391,462 | 295,174 | 52.3 | % | 14.9 | % | |||||||||||||
| Risk-weighted assets | 11,130,078 | 10,975,936 | 10,277,314 | 8.3 | % | 1.4 | % | |||||||||||||
| Market risk | 85,231 | 71,129 | 13,744 | 520.1 | % | 19.8 | % | |||||||||||||
| Operational risk | 41,987 | n.a | n.a | - | - | |||||||||||||||
| Capital ratios | ||||||||||||||||||||
BIS ratio (3) | 14.46 | % | 13.49 | % | 12.25 | % | ||||||||||||||
| Risk-weighted assets / Regulatory Capital | 6.91 | 7.41 | 8.17 | |||||||||||||||||
n.a.: no appicable
Old methodology
(1) Tier 1 = Capital + Reserves + Net Income capitalized - Goodwill - (0.5 x Inverstment in Subsidiaries)
(2) Tier 2 = Subordinated Debt + Generic Contigency loss reserves - (0.5 x Investment in subsidiaries)
(3) Risk-weighted assets = Minimum requirement for credit risk + Minimum requirement for market risk * 11
New methodology
(1) Tier 1 = Capital + Reserves + Net Income capitalized + Non capitalized net income in subsidiaries - Goodwill - Acumulated losses non realized - (0.5 x Inverstment in Subsidiaries)
(2) Tier 2 = Subordinated Debt + Generic Contigency loss reserves - (0.5 x Investment in subsidiaries)
(3) Risk-weighted assets = Minimum requirement for credit risk * 0.96 + Minimum requirement market risk * 10.5 + Minimum requirement for operational risk * 10.5
18
At the end of 2Q09, risk weighted assets were calculated according to the Basel I agreement. As of July 1 2009, the calculation has been based on the methodology defined following the Basel II accord. BCP has made considerable efforts to adapt the calculation of regulatory capital to meet Basel II requirements. In this way, we will be able to make a more precise estimate of capital requirements according to risk type.
In terms of credit risk, BCP has utilized the standard method to calculate risk weighted assets. This approach constitutes an improvement because it utilizes ratings developed by external classifiers. BCP has also made considerable progress in efforts to improve internal models for capital estimates.
To calculate market risk, BCP also uses the standard method. This model utilizes external parameters to cover losses due to adverse shifts in interest rates, share prices and commodity prices. Progress has also been made in efforts to develop internal models that are capable of producing more accurate risk estimates. For this purpose, BCP has adopted the “Value at Risk” methodology.
Finally, in terms of operating risk, BCP has been authorized by the regulatory entity (SBS) to use the standard alternative method to calculate regulatory capital. This decision should be ratified by SBS in July 2010.
19
III. Banco de Crédito de Bolivia
III.1 Bolivian Financial System
The total loan volume in the Bolivian banking system at the end of September 2009 was US$ 3,762 million, 2.2% higher than the US$ 3,681 million recorded at the end of 2Q09 and 7.1% higher than the figure reported in 3Q08. Loan quality in the banking system demonstrated slight improvement with regard to September 2008, when the past due loan ratio reached 5%. In June 2009 the ratio dropped to 4.4% and finally hit 4.2% by the end of September 2009. Additionally, the banking system’s coverage ratio reached 156.7% in September 2009 vs 154.2% in June 2009 and 111.3% in September 2008.
Deposits in the Bolivian banking system grew 6.8% QoQ and 23.3% YoY, reaching a balance of US$ 5,429 million at the end of September 2009. QoQ growth is attributable to demand deposits, savings deposits, and time deposits, which grew 13.3%, 9.3% and 0.3% respectively.
III.2 BCP Bolivia
Results
In 3Q09, BCP Bolivia obtained a net income of US$ 7.1 million, demonstrating a 3.7% increase QoQ and a 35.3% contraction YoY. QoQ growth is due to a drop in loan provisions (-43.8% QoQ) and lower interest expenses (-28.3% QoQ). The YoY decline in net income is attributable to a reduction in financial income (-21.1% YoY), which contracted due to a reduction in net interest income (-16.4% YoY) and an increase in loan provisions (+83.1% YoY). The latter is the result of the new cyclical loan provisions and the regulatory entity’s requirement to increase provisions for the foreign currency portfolio.
In light of the international crisis, BCP Bolivia has decided to maintain a conservative credit risk management strategy. As a result, in 3Q09, the bank reported a past due loan ratio of 2.3% (2.2 % in 2Q09 and 2.0% in 3Q08) and a coverage ratio of 241.3% (230.5% in 2Q09 and 185.0% in 3Q08). These indicators show that BCP Bolivia’s performance exceeded that of the Bolivian banking system, which reported ratios of 4.2% and 157.0% respectively. BCP Bolivia’s ROAE for 3Q09 was 30.3%, slightly below the 30.9% reported for 2Q09 and significantly lower than the 51.1% recorded in September 2008.
Assets and Liabilities
Total loans at the end of September 2009 were US$ 470.8 million, 0.2% higher than the US$ 469.9 million recorded at the end of June 2009 and 5.8% below those of 3Q08. The YoY decline in loans reflects the fact that expectations remain low with regard to the future economic activity, particularly in terms of lower GDP growth and negative CPI growth rates. Nevertheless, the positive evolution seen over the last quarter indicates that recovery is on the horizon.
In 3Q09, Retail Banking showed a 2.2% increase QoQ and a 4.5% rise YoY. This has a significant impact on the bank’s results given that Retail Banking accounts for 53.9% of the bank’s total portfolio and generates higher margins than any other segment. Wholesale Banking represents 41.1% of the total portfolio and its returns are lower than the Retail segment’s.
20
In terms of Retail Banking, the product that experienced the highest QoQ growth was Individual Cash Loans (12.7%), which represents 13.5% of the Retail portfolio. Mortgage loans, which account for 47.5% of the Retail Banking portfolio, did not experience significant QoQ growth; however, it grew 1.5% YoY.
With regard to liabilities, BCP Bolivia experienced 6.1% QoQ and 23.8% YoY growth in deposits. During 3Q09, saving deposits stood out growing 18.9% QoQ and 35.2% YoY, followed by time deposits, which rose 3.9% QoQ and 18.3% YoY.
Shareholder’s equity grew 10.5% QoQ due to an increase in net income of the period (+51.5% TaT), and 3.3% YoY.
Finally, BCP Bolivia has an 11.8% market share in loans and 14.2% of total deposits. As such, the bank is ranked fourth in terms of loans and third in deposits in the Bolivian Banking system.
| Banco de Crédito de Bolivia | Quarter | Change % | ||||||||||||||||||
| US$ Thousands | 3Q09 | 2Q09 | 3Q08 | 3Q09/3Q08 | 3Q09/2Q09 | |||||||||||||||
| Net financial income | 11,612 | 13,012 | 13,883 | -16.4 | % | -10.8 | % | |||||||||||||
| Total provision, net of recoveries | -1,163 | -2,070 | -635 | 83.1 | % | -43.8 | % | |||||||||||||
| Non financial income | 8,950 | 9,045 | 10,451 | -14.4 | % | -1.0 | % | |||||||||||||
| Operating expenses | -11,644 | -12,345 | -12,269 | -5.1 | % | -5.7 | % | |||||||||||||
| Income taxes | -729 | -856 | -1,211 | -39.8 | % | -14.8 | % | |||||||||||||
| Net income | 7,085 | 6,833 | 10,956 | -35.3 | % | 3.7 | % | |||||||||||||
| Total loans | 470,770 | 469,942 | 499,835 | -5.8 | % | 0.2 | % | |||||||||||||
| Past due loans | 10,680 | 10,300 | 9,925 | 7.6 | % | 3.7 | % | |||||||||||||
| Total provisions | -24,002 | -23,744 | -18,365 | 30.7 | % | 1.1 | % | |||||||||||||
| Total assets | 1,120,139 | 1,059,826 | 956,049 | 17.2 | % | 5.7 | % | |||||||||||||
| Deposits | 968,629 | 912,778 | 782,734 | 23.8 | % | 6.1 | % | |||||||||||||
| Net shareholders' equity | 101,078 | 91,494 | 97,851 | 3.3 | % | 10.5 | % | |||||||||||||
| PDL/Total loans | 2.3 | % | 2.2 | % | 2.0 | % | ||||||||||||||
| Coverage ratio of PDLs | 192.8 | % | 230.5 | % | 185.0 | % | ||||||||||||||
| ROAE* | 30.3 | % | 31.0 | % | 51.1 | % | ||||||||||||||
| Branches | 65 | 65 | 63 | |||||||||||||||||
| ATMs | 172 | 186 | 181 | |||||||||||||||||
| Employees | 1,522 | 1,518 | 1,553 | |||||||||||||||||
* ROAE: (Acumulated net income/Average monthly equity (from dec. 08 to date))/(number of months)*12
21
IV. Atlantic Security Holding Corporation
ASHC | Quarter | Change % | ||||||||||||||||||
(US$ Million) | 3Q 2009 | 2Q 2009 | 3Q 2008 | 3Q09 / 3Q08 | 3Q09 / 2Q09 | |||||||||||||||
| Net interest income | 7.5 | 6.5 | 6.3 | 19.2 | 15.5 | |||||||||||||||
| Dividend income | 0.1 | 22.0 | 0.0 | 688.4 | 100.0 | |||||||||||||||
| Fees and commissions from services | 1.5 | 1.1 | 2.2 | -29.7 | 37.5 | |||||||||||||||
| Net gains on foreign exchange transactions | 0.1 | 0.2 | -0.4 | 137.0 | -23.8 | |||||||||||||||
| Core Revenues | 9.3 | 29.8 | 8.1 | 14.8 | -68.8 | |||||||||||||||
| Impairment provisions, net of recoveries | -0.9 | -3.0 | -5.7 | 83.5 | 68.8 | |||||||||||||||
| Net gains from sale of securities | 1.6 | 0.3 | 1.5 | 6.9 | 387.9 | |||||||||||||||
| Other income | 0.5 | 0.1 | 2.5 | -78.7 | 606.1 | |||||||||||||||
| Operating expenses | -2.0 | -1.8 | -2.1 | -5.8 | 9.6 | |||||||||||||||
| Net income | 8.4 | 25.3 | 4.2 | 100.8 | -66.7 | |||||||||||||||
| Net income/share | 0.1 | 0.3 | 0.1 | 56.2 | -66.7 | |||||||||||||||
| Total loans | 134.3 | 138.0 | 151.6 | -11.5 | -2.7 | |||||||||||||||
| Total investments available for sale | 825.2 | 666.5 | 671.8 | 22.8 | 23.8 | |||||||||||||||
| Total asset | 1,508.4 | 1,558.9 | 1,325.5 | 13.8 | -3.2 | |||||||||||||||
| Total deposits | 1,247.7 | 1,329.8 | 1,131.1 | 10.3 | -6.2 | |||||||||||||||
| Shareholder's equity | 218.6 | 178.4 | 180.0 | 21.5 | 22.5 | |||||||||||||||
| Net interest margin | 2.12 | % | 1.79 | % | 2.06 | % | ||||||||||||||
| Efficiency ratio | 17.7 | % | 6.1 | % | 17.7 | % | ||||||||||||||
| Return on average equity | 17.0 | % | 68.1 | % | 8.9 | % | ||||||||||||||
| PDL / Total loans | 0.00 | 0.00 | 0.00 | |||||||||||||||||
| Cover ratio | 1.0 | % | 1.0 | % | 0.9 | % | ||||||||||||||
| BIS ratio | 18.20 | % | 17.94 | % | 16.84 | % | ||||||||||||||
Atlantic Security Holding Corporation’s performance (ASHC) during the third quarter of the year has been favorable and indicates that business is recovering, in line with market evolution. In this scenario, ASHC’s net earnings grew to US$ 8.4 million, which represents a 155.6% increase in comparison with the net profit of 2Q09 (US$ 3.3 million) after adjusting for Credicorp dividend payments to ASHC. These results are attributable to higher income from interest and commissions, lower provisions as well as higher realized earnings.
Total income in 3Q09 reached US$ 9.3 million, which exceeds the US$ 7.8 million registered in 2Q09, figure that excludes dividend income from Credicorp LTd. for US$ 22.0 million, which represented a 19% increase QoQ and a 14.8% increase YoY. The aforementioned increase in total income is due primarily to:(i) higher financial margins stemming from the investment of balances accumulated up to 2Q09; and (ii) a slight increase in fee income due primarily to higher commissions for product placement and management, both of which began to recover following an overall improvement in managed funds’ market values and yields (both of which are used to calculate income).
Recovery in the asset management business is mainly attributable to our clients’ decision to migrate from time deposits to investment products due to a low interest rate environment. This context has led investors to seek higher yields than those offered by time deposits.
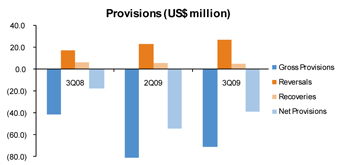
ASCH’s positive results have also been influenced by lower impairment for the investment portfolio in 3Q09 which totaled US$ 0.9 million. This figure represents a 68.8% decline with regard to 2Q09’s and is 83% lower than figures for 3Q08. This reflects the market evolution, since at the close of 2008 and during the first two quarters of 2009, the market turmoil led to asset impairment to cover potential losses that may result from default by instrument issuers tied to the investment portfolio. However, provision levels for the third quarter have now declined due to significant improvement in market value of securities in the international markets. This has helped reverse the unrealized losses accumulated to 2Q09 for US$ 12.5 million. As such, ASCH obtained unrealized earnings for US$ 19.2 million, which were reported as shareholders’ equity.
22
The following table shows the quarter-to-quarter evolution for unrealized losses and earnings in 2009. These figures represent amounts reported since the close of the 2008 fiscal year, when unrealized losses were US$ 46.7 million. As we have already mentioned, this change is due to lower impairment during the first three quarters of 2009 and, mainly to a significant correction in market prices for the portfolio in general during 2Q09.
| 1Q09 | 2Q09 | 3Q09 | Unrealized Gains (Losses) | |||||||||||||
| Opening balance | (46.7 | ) | ||||||||||||||
| Provisions for deterioration of portfolio | 3.0 | (0.3 | ) | (1.0 | ) | 1.7 | ||||||||||
Apreciation / (Devaluation) of market value | (2.9 | ) | 34.4 | 32.7 | 64.2 | |||||||||||
| Closing balance | 19.2 | |||||||||||||||
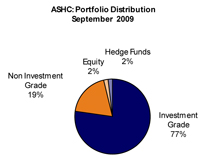
A significant portion (78%) of the investment portfolio is concentrated in investment grade instruments, which is evidence of the portfolio’s good risk profile. This structure is in accordance with the company’s investment strategy, which is focused on obtaining yields from interest income as opposed to making profits through trading. As such, once the portfolio’s value begins to recover, we hope to recuperate a significant portion of these reserves.
Earnings on securities sales were US$ 1.6 million, reflecting a 100% increase QoQ and a 7% rise YoY.
The efficiency ratio improved QoQ, reaching 17.7% in 3Q09 vs. 22.5% in 2Q09 (efficiency ratio excluding dividend income). Improvement in this indicator is primarily due to higher income.
The total assets level dropped 3.2% QoQ but increased 13.8% YoY. This decline in assets is due to a migration from deposits to managed funds. This reflects a renewed confidence in investment options due to market corrections and a resurging interest in more profitable products.
Interest Earning Assets
Interest generating assets reached US$ 1,399 million, which represents a 3.1% QoQ decrease, primarily due to lower levels in Cash and Banks, which recorded a 30.4% QoQ decrease due to a process that began in 3Q09 to reinvest accumulated cash balances. This decrease was partially offset by a 24.8% YoY increase in investments.
| INTEREST EARNING ASSETS* | Quarter | Change % | ||||||||||||||||||
| (US$ Million) | 3Q 2009 | 2Q 2009 | 3Q 2008 | 3Q09 / 3Q08 | 3Q09 / 2Q09 | |||||||||||||||
| Due from banks | 458 | 659 | 422 | 8.5 | % | -30.4 | % | |||||||||||||
| Loans | 134 | 138 | 152 | -11.5 | % | -2.7 | % | |||||||||||||
| Investments | 807 | 646 | 626 | 28.7 | % | 24.8 | % | |||||||||||||
| Total interest-earning assets | 1,399 | 1,443 | 1,200 | 16.6 | % | -3.1 | % | |||||||||||||
(*) Excludes investments in equities and mutual funds.
23
 |  |
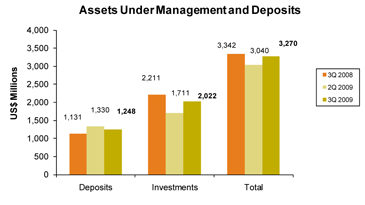
Asset Management Business
The total of deposits and AuM, which include investments such as proprietary mutual funds and financial instruments in custody, increased 7.5% QoQ but is still below the levels recorded in 3Q08 (drop of 2.2% YoY).
AuM grew 18.2% QoQ due to an overall improvement in the market that led to an increase in the market value of the bank’s managed funds and securities in custody on behalf of customers, which is in line with market value gains in the proprietary fund. Unlike reports for previous quarters, 3Q09 reported market gains and new customer contributions relative to fund shares and direct investment. This indicates that customer confidence in the products managed by the company is on the rise.
24
V. Prima AFP
V.1 Market Outlook
During 3Q09, the financial markets continued a recovery trend that began two quarters ago. In this context, the fund managed by the private pension system increased 17.8% QoQ. As of September 2009, the total portfolio managed by the system was US$ 23.2 billion while at the end of June, the managed portfolio was US$ 19.7 billion. This increase can be partially explained by the fact that local currency appreciated 4.2% against US dollar during 3Q09.
Prima’s market operations continued to focus (as has been the case since the beginning of the year) on capturing new affiliates and decreasing the intensity of transfers. As such, between July and September, the private pension system obtained close to 11,400 transfers, which represents a 20% decline (approx.) in comparison to the 14,165 transfers reported in 2Q09. Additionally, the number of new affiliates for 3Q09 was 51,700, which constituted an increase of 11% QoQ. Thus far this year, the total number of affiliates in the private system is 4.4 million.
In terms of financial results for the third quarter, the private system recorded US$ 64.1 million in revenues, which is 1.1% higher than the figure obtained in the previous quarter. The contraction of 8.3% YoY is explained by the fact that revenues of 3Q08 included the effects of double collections for the additional salary paid in July while the figures for 3Q09 do not contemplate the same effect, because the central government, as part of its economic incentive program, decided that the extra salaries paid in July and December of 2009 and 2010 would not be subject to private pension contributions
Operating expenses fell 15.9% QoQ, reaching US$ 38.8 million in 3Q09. As a result, operating earnings were US$ 25.3 million, which reflects a 10.7% increase QoQ and a 6.4% increase YoY (despite the fact that there was no double collection).
After discounting other income and expenses and considering earnings on legal reserves (US$23.5 million), the system’s net income was US$41.5 million. This represents a 17.7% increase over figures recorded for 2Q09. It is important to remember that net earnings in 3Q08 were considerably affected by legal reserve losses during this period.
Private Pension Fund System: Main Indicators
| At the end of the period: | 3Q09 | 2Q09 | 3Q08 | |||||||||
| Affiliates (thousands) | 4,416 | 4,373 | 4,260 | |||||||||
| % Change (1) | 1.0 | % | 0.8 | % | 1.2 | % | ||||||
| Sales force | 1,129 | 1,172 | 1,942 | |||||||||
| Funds under management (US$ mm) | 23,202 | 19,693 | 17,969 | |||||||||
| % Change (1) | 17.8 | % | 18.0 | % | -15.6 | % | ||||||
| Income (US$ mm) (2) | 64.1 | 63.4 | 69.9 | |||||||||
| Operating Expenses (US$ mm) | 38.8 | 40.6 | 46.2 | |||||||||
| Operating income (US$ mm) | 25.3 | 22.8 | 23.8 | |||||||||
| Net Income (US$ mm) (3) | 41.5 | 35.3 | -16.2 |
Source: Conasev, Superintendecia de Banca, Seguros y AFP
(1) Variation with respect to the last quarter
(2) Income from first quarter includes a double collection month
(3) In Peruvian accounting, unlike IFRS, legal reserves are included in the income statement.
There is no infomation for results adjusted to international financial reporting standards for the Total System.
25
V.2 Prima AFP
Commercial activities at PRIMA during 3Q09 were focused primarily on capturing new affiliates and to a lesser extent on obtaining transfers, which was consistent with behavior seen throughout the system. In this context, the level of recruitment was similar to that seen in the previous period. In terms of transfers, a decline was reported with regard to last quarter’s figures. This contraction is in line with evolution in the sales force.
PRIMA has maintained its leadership in the system in terms of collections, obtaining a 31.7% market share on average during 3Q09. Both in PRIMA and throughout the system, an increase was seen in voluntary contributions during September. This increase is attributable to the recovery of the financial markets over the last few months.
PRIMA AFP: Quarterly main indicators and market share
PRIMA 3T09 | System 3Q09 | Share 3Q09 % | PRIMA 2Q09 | System 2Q09 | Share 2Q09 % | |||||||||||||||||||
| Affiliates | 1,068,689 | 4,416,403 | 24.2 | % | 1,058,479 | 4,373,366 | 24.2 | % | ||||||||||||||||
| New affiliations (1) | 11,310 | 51,700 | 21.9 | % | 11,743 | 46,376 | 25.3 | % | ||||||||||||||||
| Funds under management US$ mm | 7,062 | 23,202 | 30.4 | % | 5,980 | 19,693 | 30.4 | % | ||||||||||||||||
| Collections US$ mm (1) | 123 | 388 | 31.7 | % | 120 | 377 | 31.7 | % | ||||||||||||||||
| Voluntary Contributions US$ mm | 84 | 191 | 43.8 | % | 71 | 161 | 43.8 | % | ||||||||||||||||
| RAM US$ mm (2) | 369 | 1,167 | 31.6 | % | 356 | 1,131 | 31.5 | % | ||||||||||||||||
Source: Superintendencia de Banca, Seguros and AFP
(1) Accumulated to the Quarter.
(2) PRIMA AFP Forecast. Monthly remuneration of affiliates, earnings base calculation estimated by PRIMA on average earning during the last 4 months excluding double collection effect, special collections and voluntary contributions fees.
Commercial Results
During the third quarter, the number of affiliations and inbound transfers was around 14,400, which can be disaggregated into approximately 11,300 affiliations and 3,040 transfers. Both figures represent a variation of -3.7% and -7.2% with regard to the previous quarter. The lower number of transfers is in line with the commercial policy in PRIMA since the beginning of the year and coincides with a contraction in the sales force. It is important to mention that, in terms of RAM (monthly remuneration of affiliates) level, transfers (entries and exits) produced a positive net result for the company. PRIMA increased its share of RAM market in 3Q09, reaching 31.6% (compared to 31.5% in 2Q09).
As of September 2009, the portfolio managed by PRIMA was US$ 7,062 million, which represents 30.4% of the total amount of funds managed by the system. This percentage is similar to that seen in 2Q09.
Investments
During the third quarter, the financial markets continued a recovery trend that began in the first half of the year. In this context, YoY profitability (September 2009/ September 2008) was 10. 8%, 12.6% and 5.7% for funds 1, 2 and 3, respectively.
26
Given that pension funds constitute a long-term investment, it is best to observe profitability over a longer period (which smoothes out short-term fluctuations). From this perspective, the profitability for the period from September 2006 to September 2009 (3 years) was 26.7%, 37.7% and 49.3% for funds 1, 2 and 3, respectively. If we extend the period of analysis even further, this time reaching back to the start-up date for system operations, the annualized nominal yield achieved for fund 2 by all operators in the pension system was 14.6% on average.
The following chart provides a breakdown of the portfolio administered by PRIMA and its market share in each fund.
PRIMA AFP: Funds under management as of June 2009
| Sep-09 | Share % | Jun-09 | Share % | |||||||||||||
| Fund 1 | 575 | 8.1 | % | 542 | 9.1 | % | ||||||||||
| Fund 2 | 4,756 | 67.4 | % | 4,046 | 67.7 | % | ||||||||||
| Fund 3 | 1,730 | 24.5 | % | 1,392 | 23.3 | % | ||||||||||
| Total US$ mm | 7,062 | 100 | % | 5,980 | 100 | % | ||||||||||
Source: Superintendencia de Banca, Seguros and AFP
Financial Results
Revenues
In the third quarter of 2009, PRIMA obtained US$ 18.9 million in revenues, which represents a 1.3% QoQ increase and a 3.2% YoY decrease. This YoY decline in earnings is due to the fact that there was no double collection in August 2009 and as such, no commissions were applied to the additional salary received in July. Nevertheless, the reduction in earnings in comparison to 3Q08 was partially offset by PRIMA’s decision to charge a 1.75% management fee.
PRIMA maintains its market leadership in RAM, which is the sum of total remunerations of all contributing members. This means that PRIMA’s base of remunerations, against which administration fee is charged, is the highest in the system. This explains why PRIMA, despite having the lowest commissions in the system, and a market share in affiliations of only 24%, has the strongest market share in collections (32%) and therefore, higher earnings than any other operator.
PRIMA AFP: Estimate of base to calculate earnings -US$ mm
| PRIMA Sep-09 | SYSTEM Sep-09 | Share. % | ||||||||||
| Income (1) | 6.4 | 21.2 | 30.1 | % | ||||||||
| Administrative Fees (2) | 1.75 | % | n.a. | |||||||||
| RAM base (3) | 369 | 1,167 | 31.6 | % | ||||||||
PRIMA AFP estimates. In accordance to local public infomation, (CONASEV)
(1) Average income from the last four months, excluding special collections and voluntary contribution fees
(2) Administrative fee 1.75% effective since January 2009
(3) RAM: Monthly remuneration of affiliates, base to income calculation.
Expenditures
During the third quarter, PRIMA maintained spending at levels similar to those seen in the first half of the year. In this context, administrative and sales expenses increased slightly due to higher expenses related to the portfolio management.
27
An increase in administrative expenses generated a 2.9% QoQ decrease in the operating result. The operating income includes amortization charges on intangible assets (obtained from the merger with Unión Vida) as well as the depreciation and amortization of the company’s real estate and IT assets, which in total, reached US$ 2.3 million.
Local currency appreciated 4.2% during 3Q09. Therefore, the effect of currency translation for the quarter and a differed liability adjustment generated a loss of US$ 0.4 million.
Net Earnings
PRIMA’s net income, after employee profit sharing and taxes, was US$ 5.7 million. This figure was 21.4% higher than the result obtained in 2Q09.
As of September 2009, PRIMA reported assets of US$ 241.2 million, equity worth of US$ 155.2 million and liabilities for US$ 86.0 million.
The main financial indicators are included in the chart below.
PRIMA AFP: Main financial indicators (US$ thousand) (1)
| 3Q09 | 2Q09 | 3Q08 | ||||||||||
| Income from commissions | 18,972 | 18,728 | 19,591 | |||||||||
| Administrative and sale expenses | (8,718 | ) | (8,230 | ) | (11,493 | ) | ||||||
| Depreciation and amortization | (2,344 | ) | (2,347 | ) | (2,310 | ) | ||||||
| Net operating income | 7,910 | 8,151 | 5,788 | |||||||||
| Other income and expenses, net | (1,035 | ) | (958 | ) | (844 | ) | ||||||
| Employee profit sharing and Income tax | (749 | ) | (2,224 | ) | (1,695 | ) | ||||||
| Net income before translation results | 6,126 | 4,969 | 3,249 | |||||||||
| Translations results and deferred liabilities | (462 | ) | (305 | ) | (1,545 | ) | ||||||
| Net income (losses) | 5,664 | 4,664 | 1,704 | |||||||||
| Total assets | 241,161 | 229,305 | 237,950 | |||||||||
| Total liabilities | 86,011 | 86,481 | 106,382 | |||||||||
| Equity | 155,150 | 142,824 | 131,568 |
(1) IFRS
28
VI. EL Pacífico Peruano Suiza and Subsidiaries
VI.1 Pacífico Group
Pacífico Group Insurers, which is comprised of general insurance (PPS), life insurance (PV) and health insurance (EPS), obtained net earnings for US$ 13.3 million in 3Q09. This figure exceeded the US$ 12.7 million registered in 2Q09.
The technical result for 3Q09 evolved favorably, which can be explained by higher net realized gains in general insurance (PPS) with regard to 2Q09 as well lower claims in this segment, which went from 64.% in 2Q09 to 51.2% in 3Q09.
The quarterly result also recorded earnings for US$ 20.6 million in financial income. This was similar to the US$ 20.1 million result obtained in 2Q09, which was primarily due to dividends and income from sales of PPS securities.
General expenses this quarter were US$ 22.9 million, which represents an increase over the US$19.1 million recorded in 2Q09, primarily due to Provisions for Accounts Receivable- Reinsurers.
Income tax and Shares increased to US$ 6.3 million from the US$2.5 million registered in 2Q09, primarily due to taxes on the PV portfolio relative to an appreciation of local currency against the US dollar.
Credicorp’s contribution of US$ 10.1 million in 3Q09 exceeds the figure obtained in 2Q09 and represents an improvement over the loss of US$ -3.6 million seen in 3Q08.
| US$ Thousand | Net Earnings * | Adjustment for | Total Contribution to | ||||||||||||||||||||||
| Period | PPS | PV | EPS | PGA | Consolidation | BAP | |||||||||||||||||||
| 3Q08 | (2,537 | ) | 4,569 | (900 | ) | 1,221 | (4,810 | ) | (3,589 | ) | |||||||||||||||
| 4Q08 | (9,253 | ) | 1,156 | (1,731 | ) | (9,824 | ) | 2,384 | (7,440 | ) | |||||||||||||||
| 1Q09 | 1,852 | 4,281 | 805 | 6,884 | (6,884 | ) | 5,230 | ||||||||||||||||||
| 2Q09 | 5,730 | 5,347 | 1,684 | 12,748 | 3,063 | 9,685 | |||||||||||||||||||
| 3T09 | 9,530 | 4,263 | (540 | ) | 13,277 | (3,190 | ) | 10,088 | |||||||||||||||||
| Var % 3Q09 / 2Q09 | 66.3 | % | -20.3 | % | -132.1 | % | 4.2 | % | n.a. | 4.2 | % | ||||||||||||||
| Var % 3Q09 / 3Q08 | 475.7 | % | -6.7 | % | n.a. | 987.6 | % | n.a. | 381.1 | % | |||||||||||||||
* Including minority interest
29
VI.2 Pacífico General P&C Insurance (PPS)
Net earnings in 3Q09 were US$ 9.5 million, 66.3% higher than earnings obtained in 2Q09. This difference is primarily attributable to: i) the net premium in 3Q09 was US$50.3 million, compared to US$ 46.2 million in 2Q09 and, ii) lower claims during the quarter (US$ 25.8 million) due to a reduction in the claims rate, which went from 64.0% in 2Q09 to 51.2% in 3Q09.
This favorable technical result is due to a reduction in claims in the Car and Mandatory Car and General Insurance (RRGG) lines, which was offset, in part, by higher claims in the Medical Assistance line.
Technical Results by Business Unit
| 3Q09 | 2Q09 | 3Q08 | ||||||||||||||||||||||||||||||||||||||||||||||
| US$ millon | Vehicles | Assistance | P&C | TOTAL | Vehicles | Assistance | P&C | TOTAL | Vehicles | Assistance | P&C | TOTAL | ||||||||||||||||||||||||||||||||||||
| & SOAT | PPS | & SOAT | PPS | & SOAT | PPS | |||||||||||||||||||||||||||||||||||||||||||
| Net Premiums Earned | 20.3 | 13.8 | 16.2 | 50.3 | 19.2 | 13.1 | 13.8 | 46.2 | 17.2 | 11.4 | 17.1 | 45.7 | ||||||||||||||||||||||||||||||||||||
| Technical Results | 7.3 | 1.5 | 9.3 | 18.1 | 3.7 | 2.5 | 3.5 | 9.7 | (2.3 | ) | (1.1 | ) | 1.5 | (1.9 | ) | |||||||||||||||||||||||||||||||||
| Net claims / Earned Net Premiums | 45.5 | % | 81.2 | % | 32.9 | % | 51.2 | % | 60.5 | % | 73.5 | % | 60.0 | % | 64.0 | % | 87.1 | % | 99.2 | % | 74.4 | % | 85.4 | % | ||||||||||||||||||||||||
| Technical Results / Earned net Premiums | 36.2 | % | 10.7 | % | 57.1 | % | 36.0 | % | 19.1 | % | 18.9 | % | 25.4 | % | 20.9 | % | -13.6 | % | -9.4 | % | 8.7 | % | -4.2 | % | ||||||||||||||||||||||||
The technical result in Car and Mandatory Car was US$ 7.3 million in 3Q09, showing significant improvement over the US$ 3.7 million obtained in 2Q09.
The US$ 6.5 million technical result for Cars in 3Q09, which exceeds the figure recorded for the previous quarter, was mainly the result of lower claims, which went from 60.1% in 2Q09 to 44.1% in 3Q09. This drop can be explained by a decline in the mean costs of claims as well as fewer losses due to vehicle theft. These improvements are the fruit of management’s on-going efforts (as of mid 2008) to improve the portfolio’s risk profile.
The Mandatory Car line (SOAT) obtained a technical result of US$ 0.8 million in 3Q09, which exceeds earnings for US$ 0.6 million in 2Q09. An improvement in this line’s result is mainly due to a reduction in claims, which is attributable to improved portfolio selection processes.
The Medical Assistance line achieved a technical result of US$ 1.5 million in 3Q09, demonstrating a drop with regard to 2Q09’s figures. This can be explained by an increase in claims, which is attributable to a habitual increase in claims during the winter months. The claims rate in 3Q09 was 81.2% versus 73.5% in 2Q09.
General Insurance (RRGG) achieved a technical result of US$ 9.3 million in 3Q09, which represents a significant improvement over the US$ 3.5 million obtained in 2Q09. This growth can be explained by an increase in the net premium and a significant reduction in the claims rate, which dropped to 32.9% in 3Q09 (versus 60.0% in 2Q09). This decline in claims is basically due to improved underwriting.
In terms of net financial income, PPS obtained earnings of US$ 6.7 million in 3Q09 in comparison to US$ 6.1 million recorded in 2Q09. This difference is basically due to capital gains on securities trading operations.
In summary, with regard to the 3Q09 result in general insurance (PPS), it is important to point out that income from net insurance premiums reached US$ 50.3 million while total operating costs were US$ 45.1 million. Based on these results this quarter’s combined ratio was 89.7%. Of this total, 51.2 points correspond to costs or expenses for net claims (claims rate), 12.8 points are relative to acquisition costs and the remainder belongs to general or administrative expenses. The combined ratio of 89.7% achieved in 3Q09 is below the 99.9% that Pacifico General Insurance has proposed as a goal for 2009.
30
VI.3 Pacífico Vida
Pacifico Vida obtained profit before minority interests of US$ 6.9 million in 3Q09, which was lower than the figure of US$ 8.6 million achieved in 2Q09. Lower earnings this quarter are attributable to higher income taxes due to an increase in taxable earnings, which does not include losses due to downward fluctuations in the exchange rate.
The technical result achieved in 3Q09 of US$ 2.9 million exceeds 2Q09’s result of US$ 2 million. This is due primarily to lower acquisition costs in the third quarter, which went from 30.6% in 2Q09 to 27.8% in 3Q09
| Products | Total Premiums | Change % | ||||||||||||||||||
| (US$ millions) | 3Q09 | 2Q09 | 3Q08 | 3Q09 / 2Q09 | 3Q09 / 3Q08 | |||||||||||||||
| Individual life | 12.7 | 12.0 | 11.1 | 5.6 | % | 14.4 | % | |||||||||||||
| Individual annuity | 10.3 | 9.6 | 9.4 | 7.6 | % | 10.0 | % | |||||||||||||
| Disability & survivor (Pension) | 8.2 | 7.7 | 9.3 | 6.2 | % | -12.7 | % | |||||||||||||
| Credit Life | 5.9 | 5.4 | 5.4 | 8.5 | % | 8.4 | % | |||||||||||||
| Personal accidents | 2.8 | 2.7 | 2.5 | 3.4 | % | 8.3 | % | |||||||||||||
| Group life (Law) | 2.1 | 2.3 | 2.1 | -7.8 | % | 1.3 | % | |||||||||||||
| Group life | 3.7 | 3.8 | 2.9 | -3.8 | % | 25.7 | % | |||||||||||||
| Limited workers compensation | 2.3 | 2.3 | 2.7 | -1.0 | % | -15.8 | % | |||||||||||||
| TOTAL | 47.8 | 45.7 | 45.4 | 4.5 | % | 5.2 | % | |||||||||||||
Net financial income in the third quarter was US$ 13.8 million, which was similar to levels seen in 2Q09.
General expenses in 3Q09 increased 5.3% over last quarter’s figures to reach a total of US$ 7.3 million.
After excluding minority interest for the US$ 2.6 million corresponding to AIG, net earnings for the life segment in 3Q09 weighed in at US$ 4.3 million.
VI.4 Pacífico Health (EPS)
The health line reported a loss of US$ 0.5 million in 3Q09.
EPS’s technical result dropped during the third quarter to US$ 1.7 million after having reached US$ 3.3 million in 2Q09. This is mainly attributable to an increase in the frequency of health claims and services due to the winter season (when claims of this nature tend to rise)
Finally, it is important to mention that quarterly earnings were affected by a translation result of US$ 0.4 million, which contrasts with the US$0.8 million result obtained in 2Q09.
31
VII. Economic Outlook
Economic Activity
During 3Q09, economic activity remained at virtually the same level as that seen in 3Q08. This is due primarily to the adverse effects of the global recession, which has caused the manufacturing sector to contract at an annual rate close to 10%. Nevertheless, if we extract the seasonal effect, the lowest level of economic activity was seen in June. After this point, and despite the fact that growth was negative in July and August, a recovery trend has been evident.
Other sectors have also been affected. The commercial sector is suffering the effects of a decline in imports and the electricity sector has been negatively impacted by slower economic growth. Construction has recovered from the contraction recorded in 2Q09 and has grown 6.0% in annual terms. In 2009, and despite delays in execution, the primary driver of economic growth has been public investment mainly through the construction sector which has maintained as the sector with the highest growth rate. Gross private investment will close the year with the first decline seen since 2001. In this scenario, the country’s GDP is expected to grow around 1.5% during 2009.
In 2010, and despite the fact that private consumption and investment will begin to recover, the public sector will continue to be the axis for growth. Private investment is expected to grow, particularly in the mining sector mainly due to higher dynamism in external demand. The hydrocarbon sector and construction will expand at a higher pace due to improvements in domestic demand. The Central Bank estimates that the flows from the primary investment projects denominated in US dollars will increase 23.4% from US$ 7,762 MM this year to US$ 9,575 MM in 2010. In terms of productive sectors, construction will continue to be the most dynamic, driven by public infrastructure projects and the demand for housing in the private sector. In addition, the global economic recovery is expected to help reverse the decline seen in the manufacturing sector this year. Consequently, a 4.5% growth rate is expected in the Peruvian economy in 2010.
Gross Domestic Product and Internal Demand
(Annualized percentage variation)

Source: INEI
External Sector
As a result of the accelerated recovery in export prices, which exceeded the recovery of import prices, the country currently has a surplus trade balance. This scenario is expected to continue over the next few months. Nevertheless, in annual terms, exports during the first eight months of 2009 demonstrated an accumulated decline of 28.2% (traditional: -29.6%, non traditional: -23.1%) whereas imports contracted 30.8% (inputs: -40.3%, capital goods: -23.2%, consumer goods: -13.2%).
32
Although the recovery in mineral export prices generated a deficit in the investment income account (due to earnings remittances made by international mining companies to their parent company) that subsequently increased the deficit in the current account balance, which was mitigated by the growth in financial flows that in turn led to a recovery of international reserves. At the end of September, international reserves had accumulated a US$ 934 MM increase (which is actually US$ 2,847 MM if we consider the minimum reserves level, reached in February). As of September 20, total international reserves were US$ 32,130 MM.
In 2010, if the global economy continues to consolidate its recovery, Peru will continue to receive positive net foreign currency flows given that it is perceived as one of the emerging countries in the region with the best macroeconomic fundamentals.
Exports and Imports
(Annualized percentage variation)
Source: BCRP
Prices and Exchange Rate
As of September 2009, annual inflation was 1.2% while accumulated inflation was 0.0%. Inflationary pressures were low and wholesale prices demonstrated an annual contraction of 6.2%; no change is expected over the next few months. This may be a reflection of a severe downturn in domestic demand, which could be even deeper than the contraction in domestic production, and the appreciation of the Nuevo Sol, which reduces the price of imported goods in Nuevos Soles.
End-of-the-year inflation is expected to fall below 1.00%, which is the Central Bank’s minimum inflation goal. Next year, expectations are aligned at 2.0% and prices are likely to increase as domestic demand becomes more dynamic, which is expected to happen in 2010.
The Nuevo Sol has continued an appreciation trend that began in February, which is a reflection of the worldwide depreciation of the US dollar, driving flows to emerging markets. The US dollar will eventually bounce back and although depreciation is expected to continue for several months, this process is expected to be moderate. This will translate into moderate expectations for the revaluation of the Nuevo Sol and the exchange rate is expected to reach a level of S/. 2.88 at the end of the year and S/. 2.83 at the end of 2010. Nevertheless, experience over the last few months shows that the exchange rate may fluctuate, requiring the Central Bank to intervene to mitigate volatility. As such, expectations for both projections have a downward bias. These projections are for a baseline scenario with no political upheaval, which is expected to be the case in 2010 despite municipal and regional elections.
33
Consumer Price Index
Exchange Rate Volatility
(Annual percentage variation)
(STD/last 30 days average)
Fiscal Sector
By the end of August, central government tax income had increased by 1.9% with regard to figures for the first eight months of 2008. This result was generated by important VAT collections, which were offset by a 3.9% decline in income tax collections (which is primarily the result of lower income at mining companies due to declining metal prices).
In a context of lower fiscal income and increased spending (both consumer and public investment related), which follows three consecutive years of fiscal surplus, 2009 will close the year with a deficit equivalent to 2.0% of the GDP. Next year, although income is expected to evolve favorably due to an improvement in domestic demand, production and a recovery – at least partial – in the main exportable products prices, projections indicate that it may be offset by higher spending at the regional and local government level due to the election year. Consequently, the deficit may be equivalent to 1.5% of GDP in 2010.
34
Fiscal Income of the Central Government
(Annual percentage variation)
35
Banking System
According to information from Central Bank to September 15th, the loan portfolio of financial institutions, expressed in US dollars, grew 11% in annual terms (26.6% at the close of 2008). Although a slowdown is apparent in the annual loan growth rate, it is important to emphasize that loan growth remained relatively stable, even during the first half of the year when the economy showed signs of deceleration. The most dynamic loan segment has been mortgage loans (with annual growth to August of 26.5%), followed by commercial loans (12.8%). In addition, consumer loans declined 0.9%, influenced by a loan portfolio transfer from the Banco del Trabajo to Crediscotia.
Deposits showed annual growth in US dollars of 17.7%, led by savings deposits (+19.5%). Demand deposits increased 15.9% while time deposits grew 9.7%.
Loan dollarization in the banking system reached 52.2% in August (55.5% at the end of last year) while deposit dollarization weighed in at 50.0% (55.8% at the end of 2008).
Finally, interest rates have shown a downward trend over the last few months, in line with a significant decrease in BCR’s reference rate, which was implemented to drive loan growth and help reactivate the economy. As such, TAMAN (active interest rate in national currency) closed the month of September at 20.2% (23.0% at the end of 2008 and 20.7% at the end of 2Q09. The TIPMEX (passive interest rate in foreign currency) went from 1.4% to 1.2% during the third quarter while the TIPMN (passive interest rate in national currency) fell from 3.0% to 2.0% in 3Q09 (3.8% at the end of 2008).
Main Financial Indicators
| 2007 | 2008 | 2009 | ||||||||||||||||||||||||||||||
| Year | IQ | IIQ | IIIQ | IVQ | Year | IQ | IIQ | |||||||||||||||||||||||||
| GDP (US$ MM) | 107,504 | 30,296 | 34,825 | 32,558 | 30,027 | 127,707 | 27,954 | 32,092 | ||||||||||||||||||||||||
| Real GDP (var. %) | 8.9 | 10.3 | 11.8 | 10.9 | 6.5 | 9.8 | 1.8 | -1.1 | ||||||||||||||||||||||||
| GDP per-capita (US$) | 3,873 | 4,334 | 4,967 | 4,616 | 4,219 | 4,534 | 3,893 | 4,430 | ||||||||||||||||||||||||
| Domestic demand (var. %) | 11.8 | 11.9 | 14.6 | 13.7 | 9.1 | 12.3 | -0.9 | -5.5 | ||||||||||||||||||||||||
| Consumption (var. %) | 8.3 | 8.4 | 9.4 | 9.2 | 8.0 | 8.7 | 3.8 | 1.9 | ||||||||||||||||||||||||
| Private investment (var. %) | 22.6 | 23.7 | 37.1 | 31.8 | 21.2 | 28.1 | 3.9 | -16.2 | ||||||||||||||||||||||||
| CPI (annual change, %) | 3.9 | 5.5 | 5.7 | 6.2 | 6.7 | 6.7 | 4.8 | 3.4 | ||||||||||||||||||||||||
| Exchange rate, eop (S/. per US$) | 3.00 | 2.74 | 2.97 | 2.98 | 3.14 | 3.14 | 3.16 | 3.01 | ||||||||||||||||||||||||
| Devaluation (annual change, %) | -6.1 | -13.8 | -6.4 | -3.6 | 4.7 | 4.7 | 15.2 | 1.5 | ||||||||||||||||||||||||
| Exchange rate, average (S/. per US$) | 3.12 | 2.89 | 2.81 | 2.90 | 3.09 | 2.92 | 3.18 | 3.02 | ||||||||||||||||||||||||
| Non-financial Public Sector (% of GDP) | 3.1 | 4.3 | 5.4 | 1.4 | -2.7 | 2.1 | 2.3 | 1.2 | ||||||||||||||||||||||||
| Central Gonvernment current revenues (% of GPD) | 18.1 | 18.0 | 19.4 | 18.4 | 17.0 | 18.2 | 16.3 | 16.2 | ||||||||||||||||||||||||
| Tax Income (% of GDP) | 15.6 | 15.4 | 16.4 | 15.7 | 14.9 | 15.6 | 14.5 | 13.6 | ||||||||||||||||||||||||
| Non Tax Income (% of GDP) | 2.5 | 2.5 | 3.0 | 2.7 | 2.1 | 2.6 | 1.8 | 2.6 | ||||||||||||||||||||||||
| Current expenditures (% of GDP) | 12.6 | 10.4 | 10.5 | 16.1 | 12.4 | 12.4 | 11.8 | 10.7 | ||||||||||||||||||||||||
| Capital expenditures (% of GDPI) | 2.1 | 1.1 | 1.7 | 2.5 | 4.2 | 2.4 | 1.9 | 3.7 | ||||||||||||||||||||||||
| Trade Balance (US$ MM) | 8,287 | 1,505 | 920 | 838 | -173 | 3,090 | 499 | 1,229 | ||||||||||||||||||||||||
| Exports (US$ MM) | 27,882 | 7,771 | 8,470 | 8,814 | 6,474 | 31,529 | 5,382 | 6,054 | ||||||||||||||||||||||||
| Imports (US$ MM) | 19,595 | 6,265 | 7,550 | 7,976 | 6,648 | 28,439 | 4,882 | 4,825 | ||||||||||||||||||||||||
| Current Account Balance (US$ MM) | 1,220 | -846 | -1,578 | -994 | -759 | -4,177 | -410 | 36 | ||||||||||||||||||||||||
| Current Account Balance (% of GDP) | 1.1 | -2.8 | -4.5 | -3.1 | -2.5 | -3.3 | -1.5 | 0.1 | ||||||||||||||||||||||||
36
Company Description:
Credicorp Ltd. (NYSE: BAP) is the leading financial services holding company in Peru. It primarily operates via its four principal Subsidiaries: Banco de Credito del Peru (BCP), Atlantic Security Holding Corporation (ASHC), El Pacífico-Peruano Suiza Compañía de Seguros y Reaseguros (PPS) and Grupo Credito. Credicorp is engaged principally in commercial banking (including trade finance, corporate finance and leasing services), insurance (including commercial property, transportation and marine hull, automobile, life, health and pension fund underwriting insurance) and investment banking (including brokerage services, asset management, trust, custody and securitization services, trading and investment). BCP is the Company's primary subsidiary.
Safe Harbor for Forward-Looking Statements
This material includes “forward-looking statements” within the meaning of Section 21E of the Securities Exchange Act of 1934. All statements other than statements of historical information provided herein are forward-looking and may contain information about financial results, economic conditions, trends and known uncertainties.
The Company cautions readers that actual results could differ materially from those expected by the Company, depending on the outcome of certain factors, including, without limitation: (1) adverse changes in the Peruvian economy with respect to the rates of inflation, economic growth, currency devaluation, and other factors, (2) adverse changes in the Peruvian political situation, including, without limitation, the reversal of market-oriented reforms and economic recovery measures, or the failure of such measures and reforms to achieve their goals, and (3) adverse changes in the markets in which the Company operates, including increased competition, decreased demand for financial services, and other factors. Readers are cautioned not to place undue reliance on these forward-looking statements, which speak only as of the date hereof.
The Company undertakes no obligation to release publicly the result of any revisions to these forward-looking statements which may be made to reflect events or circumstances after the date hereof, including, without limitation, changes in the Company’s business strategy or planned capital expenditures, or to reflect the occurrence of unanticipated events.
37
CREDICORP LTD. AND SUBSIDIARIES
CONSOLIDATED BALANCE SHEETS
(In US$ thousands, IFRS)
| As of | Sep-09/ | Sep-09/ | ||||||||||||||||||
| Sep-09 | Jun-09 | Sep-08 | Sep-08 | Sep-09 | ||||||||||||||||
| Assets | ||||||||||||||||||||
| Cash and due from banks | ||||||||||||||||||||
| Non-interest bearing | 754,875 | 730,266 | 591,053 | 27.7 | % | 3.4 | % | |||||||||||||
| Interest bearing | 2,732,677 | 2,776,593 | 3,365,197 | -18.8 | % | -1.6 | % | |||||||||||||
| Total cash and due from banks | 3,487,551 | 3,506,859 | 3,956,250 | -11.8 | % | -0.6 | % | |||||||||||||
| Marketable securities, net | 89,718 | 39,579 | 32,468 | 176.3 | % | 126.7 | % | |||||||||||||
| Loans | 10,675,462 | 10,603,688 | 9,929,562 | 7.5 | % | 0.7 | % | |||||||||||||
| Current | 10,509,564 | 10,456,961 | 9,852,112 | 6.7 | % | 0.5 | % | |||||||||||||
| Past Due | 165,898 | 146,727 | 77,449 | 114.2 | % | 13.1 | % | |||||||||||||
| Less - Reserve for possible loan losses | (318,094 | ) | (283,051 | ) | (230,390 | ) | 38.1 | % | 12.4 | % | ||||||||||
| Loans, net | 10,357,368 | 10,320,637 | 9,699,172 | 6.8 | % | 0.4 | % | |||||||||||||
| Investments securities available for sale | 4,828,806 | 4,910,272 | 5,209,636 | -7.3 | % | -1.7 | % | |||||||||||||
| Reinsurance assets | 135,688 | 186,983 | 150,936 | -10.1 | % | -27.4 | % | |||||||||||||
| Premiums and other policyholder receivables | 109,669 | 107,336 | 110,790 | -1.0 | % | 2.2 | % | |||||||||||||
| Property, plant and equipment, net | 323,233 | 324,279 | 312,653 | 3.4 | % | -0.3 | % | |||||||||||||
| Due from customers on acceptances | 63,901 | 159,407 | 217,302 | -70.6 | % | -59.9 | % | |||||||||||||
| Other assets | 1,376,525 | 1,343,498 | 1,080,273 | 27.4 | % | 2.5 | % | |||||||||||||
| Total Assets | 20,772,459 | 20,898,850 | 20,769,479 | 0.0 | % | -0.6 | % | |||||||||||||
| Liabilities and shareholders' equity | ||||||||||||||||||||
| Deposits and Obligations | ||||||||||||||||||||
| Non-interest bearing | 3,462,195 | 4,008,297 | 2,757,069 | 25.6 | % | -13.6 | % | |||||||||||||
| Interest bearing | 10,210,091 | 9,699,742 | 10,286,385 | -0.7 | % | 5.3 | % | |||||||||||||
| Total deposits and Obligations | 13,672,287 | 13,708,039 | 13,043,454 | 4.8 | % | -0.3 | % | |||||||||||||
| Due to banks and correspondents | 1,713,177 | 1,976,787 | 2,805,330 | -38.9 | % | -13.3 | % | |||||||||||||
| Acceptances outstanding | 63,901 | 159,407 | 217,302 | -70.6 | % | -59.9 | % | |||||||||||||
| Reserves for property and casualty claims | 874,243 | 889,326 | 812,990 | 7.5 | % | -1.7 | % | |||||||||||||
| Reserve for unearned premiums | 140,907 | 140,962 | 149,725 | -5.9 | % | 0.0 | % | |||||||||||||
| Reinsurance payable | 38,832 | 36,272 | 50,056 | -22.4 | % | 7.1 | % | |||||||||||||
| Bonds and subordinated debt | 915,091 | 904,337 | 836,909 | 9.3 | % | 1.2 | % | |||||||||||||
| Other liabilities | 1,052,250 | 1,012,341 | 944,947 | 11.4 | % | 3.9 | % | |||||||||||||
| Minority interest | 171,670 | 138,619 | 114,981 | 49.3 | % | 23.8 | % | |||||||||||||
| Total liabilities | 18,642,357 | 18,966,090 | 18,975,693 | -1.8 | % | -1.7 | % | |||||||||||||
| Capital stock | 471,912 | 471,912 | 471,912 | 0.0 | % | 0.0 | % | |||||||||||||
| Treasury stock | (74,242 | ) | (73,107 | ) | (73,107 | ) | 1.6 | % | 1.6 | % | ||||||||||
| Capital surplus | 130,341 | 140,693 | 140,693 | -7.4 | % | -7.4 | % | |||||||||||||
| Reserves | 1,053,494 | 1,053,494 | 815,387 | 29.2 | % | 0.0 | % | |||||||||||||
| Unrealized gains | 179,179 | 92,057 | 72,713 | 146.4 | % | 94.6 | % | |||||||||||||
| Retained earnings | 369,418 | 247,711 | 366,189 | 0.9 | % | 49.1 | % | |||||||||||||
| Net Shareholder's equity | 2,130,102 | 1,932,760 | 1,793,786 | 18.7 | % | 10.2 | % | |||||||||||||
| Total liabilities and net shareholder's equity | 20,772,459 | 20,898,850 | 20,769,479 | 0 | % | -0.6 | % | |||||||||||||
| Contingent Credits | 7,752,352 | 6,573,382 | 6,335,325 | 22.4 | % | 17.9 | % | |||||||||||||
38
CREDICORP LTD. AND SUBSIDIARIES
QUARTERLY INCOME STATEMENT
(In US$ thousands, IFRS)
| Quarter | Change % | YTD | Change % | |||||||||||||||||||||||||||||
| 3Q09/ | 3Q09/ | Sep-09/ | ||||||||||||||||||||||||||||||
| 3Q09 | 2Q09 | 3Q08 | 3Q08 | 2Q09 | Sep-09 | Sep-08 | Sep-08 | |||||||||||||||||||||||||
| Interest income and expense | ||||||||||||||||||||||||||||||||
| Interest and dividend income | 313,956 | 343,031 | 350,362 | -10.4 | % | -8.5 | % | 982,895 | 1,028,166 | -4.4 | % | |||||||||||||||||||||
| Interest expense | (99,409 | ) | (109,489 | ) | (149,922 | ) | -33.7 | % | -9.2 | % | (328,940 | ) | (419,473 | ) | -21.6 | % | ||||||||||||||||
| Net interest income | 214,547 | 233,542 | 200,440 | 7.0 | % | -8.1 | % | 653,955 | 608,693 | 7.4 | % | |||||||||||||||||||||
| Provision for loan losses | (38,216 | ) | (54,708 | ) | (16,713 | ) | 128.7 | % | -30.1 | % | (119,348 | ) | (42,139 | ) | 183.2 | % | ||||||||||||||||
| Non financial income | ||||||||||||||||||||||||||||||||
| Fee income | 110,460 | 101,900 | 103,327 | 6.9 | % | 8.4 | % | 310,656 | 300,572 | 3.4 | % | |||||||||||||||||||||
| Net gain on foreign exchange transactions | 29,957 | 19,661 | 24,110 | 24.3 | % | 52.4 | % | 69,133 | 76,151 | -9.2 | % | |||||||||||||||||||||
| Net gain on sales of securities | 16,276 | 37,996 | (6,608 | ) | 346.3 | % | -57.2 | % | 100,150 | 23,707 | 322.4 | % | ||||||||||||||||||||
| Other | 5,903 | 10,920 | 10,040 | -41.2 | % | -45.9 | % | 26,802 | 23,247 | 15.3 | % | |||||||||||||||||||||
| Total non financial income, net | 162,596 | 170,477 | 130,869 | 24.2 | % | -4.6 | % | 506,741 | 423,677 | 19.6 | % | |||||||||||||||||||||
| Insurance premiums and claims | ||||||||||||||||||||||||||||||||
| Net premiums earned | 108,965 | 101,541 | 104,124 | 4.6 | % | 7.3 | % | 309,575 | 288,859 | 7.2 | % | |||||||||||||||||||||
| Net claims incurred | (13,522 | ) | (19,109 | ) | (26,710 | ) | -49.4 | % | -29.2 | % | (51,281 | ) | (77,455 | ) | -33.8 | % | ||||||||||||||||
| Increase in cost for life and health policies | (59,425 | ) | (53,762 | ) | (60,930 | ) | -2.5 | % | 10.5 | % | (165,099 | ) | (179,696 | ) | -8.1 | % | ||||||||||||||||
| Total other operating income, net | 36,018 | 28,670 | 16,484 | 118.5 | % | 25.6 | % | 93,195 | 31,708 | 193.9 | % | |||||||||||||||||||||
| Operating expenses | ||||||||||||||||||||||||||||||||
| Salaries and employees benefits | (95,765 | ) | (94,197 | ) | (101,259 | ) | -5.4 | % | 1.7 | % | (284,062 | ) | (280,691 | ) | 1.2 | % | ||||||||||||||||
| Administrative, general and tax expenses | (70,436 | ) | (73,894 | ) | (67,524 | ) | 4.3 | % | -4.7 | % | (219,104 | ) | (186,021 | ) | 17.8 | % | ||||||||||||||||
| Depreciation and amortization | (18,343 | ) | (17,701 | ) | (15,396 | ) | 19.1 | % | 3.6 | % | (53,332 | ) | (43,500 | ) | 22.6 | % | ||||||||||||||||
| Merger Expenses | - | - | - | 100.0 | % | 100.0 | % | - | - | |||||||||||||||||||||||
| Other | (27,025 | ) | (20,002 | ) | (29,662 | ) | -8.9 | % | 35.1 | % | (82,078 | ) | (80,067 | ) | 2.5 | % | ||||||||||||||||
| Total operating expenses | (211,568 | ) | (205,795 | ) | (213,841 | ) | -1.1 | % | 2.8 | % | (638,575 | ) | (590,279 | ) | 8.2 | % | ||||||||||||||||
| Income before translation results, employees' profit sharing and income taxes | 163,377 | 172,186 | 117,238 | 39.4 | % | -5.1 | % | 495,968 | 431,659 | 14.9 | % | |||||||||||||||||||||
| Translation result | 12,046 | 3,958 | 6,979 | 72.6 | % | 204.4 | % | 11,296 | 14,164 | -20.2 | % | |||||||||||||||||||||
| Translation result | 12,046 | 3,958 | 6,979 | 72.6 | % | 204.4 | % | 11,296 | 14,164 | -20.2 | % | |||||||||||||||||||||
| Impairment | (945 | ) | (1,782 | ) | (5,733 | ) | -83.5 | % | -47.0 | % | (7,164 | ) | (9,418 | ) | -23.9 | % | ||||||||||||||||
| Provision Atlantic Blue chip Fund propietary exposure | - | - | - | |||||||||||||||||||||||||||||
| Workers’ profit sharing | (5,747 | ) | (6,352 | ) | (3,301 | ) | 74.1 | % | -9.5 | % | (16,678 | ) | (10,585 | ) | 57.6 | % | ||||||||||||||||
| Income taxes | (39,538 | ) | (45,955 | ) | (24,241 | ) | 63.1 | % | -14.0 | % | (119,123 | ) | (79,996 | ) | 48.9 | % | ||||||||||||||||
| Net income | 130,139 | 123,837 | 96,675 | 34.6 | % | 5.1 | % | 371,463 | 355,242 | 4.6 | % | |||||||||||||||||||||
| Minority interest | 8,432 | 8,634 | 4,075 | 106.9 | % | -2.3 | % | 23,976 | 10,978 | 118.4 | % | |||||||||||||||||||||
| Net income attributed to Credicorp | 121,707 | 115,202 | 92,601 | 31.4 | % | 5.6 | % | 347,487 | 344,264 | 0.9 | % | |||||||||||||||||||||
39
CREDICORP LTD. AND SUBSIDIARIES
SELECTED FINANCIAL INDICATORS
| Quarter | YTD | |||||||||||||||||||
| 3Q09 | 2Q09 | 3Q08 | Sep-09 | Sep-08 | ||||||||||||||||
| Profitability | ||||||||||||||||||||
| Net income per common share (US$ per share)(1) | 1.53 | 1.44 | 1.16 | 4.36 | 4.32 | |||||||||||||||
| Net interest margin on interest earning assets (2) | 4.72 | % | 5.12 | % | 4.35 | % | 4.78 | % | 4.45 | % | ||||||||||
| Return on average total assets (2)(3) | 2.34 | % | 2.20 | % | 1.80 | % | 2.22 | % | 2.25 | % | ||||||||||
| Return on average shareholders' equity (2)(3) | 23.96 | % | 25.59 | % | 20.66 | % | 24.83 | % | 25.66 | % | ||||||||||
| No. of outstanding shares (millions)(4) | 79.76 | 79.76 | 79.76 | 79.76 | 79.76 | |||||||||||||||
| Quality of loan portfolio | ||||||||||||||||||||
| Past due loans as a percentage of total loans | 1.55 | % | 1.38 | % | 0.78 | % | 1.55 | % | 0.78 | % | ||||||||||
| Reserves for loan losses as a percentage of | ||||||||||||||||||||
| total past due loans | 191.74 | % | 192.91 | % | 297.47 | % | 191.74 | % | 297.47 | % | ||||||||||
| Reserves for loan losses as a percentage of | ||||||||||||||||||||
| total loans | 2.98 | % | 2.67 | % | 2.32 | % | 2.98 | % | 2.32 | % | ||||||||||
| Operating efficiency | ||||||||||||||||||||
| Oper. expense as a percent. of total income (5) | 39.78 | % | 40.69 | % | 42.63 | % | 41.43 | % | 40.04 | % | ||||||||||
| Oper. expense as a percent. of av. tot. assets(2)(3)(5) | 3.54 | % | 3.54 | % | 3.57 | % | 3.55 | % | 3.33 | % | ||||||||||
| Average balances (millions of US$) (3) | ||||||||||||||||||||
| Interest earning assets | 18,172.09 | 18,256.33 | 18,436.55 | 18,224.48 | 18,253.83 | |||||||||||||||
| Total Assets | 20,835.65 | 20,985.49 | 20,624.78 | 20,910.57 | 20,418.73 | |||||||||||||||
| Net equity | 2,031.43 | 1,800.46 | 1,792.43 | 1,915.94 | 1,806.65 | |||||||||||||||
(1) Based on Net Income attributed to BAP. Number of shares outstanding of 79.8 million in all periods.
(2) Ratios are annualized.
(3) Averages are determined as the average of period-beginning and period-ending balances.
(4) Net of treasury shares. The total number of shares was of 94.38 million.
(5) Total operating income includes net interest income, fee income, net gain on foreign exchange transactions and net premiums earned. Operating expense does not include Other expenses.
40
BANCO DE CREDITO DEL PERU AND SUBSIDIARIES
CONSOLIDATED BALANCE SHEET
(In US$ thousands, IFRS)
| As of | Change % | |||||||||||||||||||
| Sep-09 | Jun-09 | Sep-08 | Sep-09/Sep-08 | Sep-09/Jun-09 | ||||||||||||||||
| ASSETS | ||||||||||||||||||||
| Cash and due from banks | 3,368,733 | 3,316,964 | 3,871,243 | -13.0 | % | 1.6 | % | |||||||||||||
| Cash and BCRP | 2,757,898 | 2,604,482 | 3,029,179 | -9.0 | % | 5.9 | % | |||||||||||||
| Deposits in other Banks | 540,877 | 600,551 | 721,464 | -25.0 | % | -9.9 | % | |||||||||||||
| Interbanks | 68,132 | 110,435 | 113,749 | -40.1 | % | -38.3 | % | |||||||||||||
| Accrued interest on cash and due from banks | 1,826 | 1,496 | 6,851 | -73.3 | % | 22.1 | % | |||||||||||||
| Marketable securities, net | 89,718 | 39,579 | 32,468 | 176.3 | % | 126.7 | % | |||||||||||||
| Loans | ||||||||||||||||||||
| Current | 10,406,954 | 10,356,401 | 9,759,601 | 6.6 | % | 0.5 | % | |||||||||||||
| Past Due | 165,109 | 145,945 | 76,569 | 115.6 | % | 13.1 | % | |||||||||||||
| Less - Reserve for possible loan losses | (316,718 | ) | (281,675 | ) | (229,071 | ) | 38.3 | % | 12.4 | % | ||||||||||
| Loans, net | 10,255,345 | 10,220,671 | 9,607,099 | 6.7 | % | 0.3 | % | |||||||||||||
| Investment securities available for sale | 2,793,015 | 3,162,714 | 3,512,873 | -20.5 | % | -11.7 | % | |||||||||||||
| Property, plant and equipment, net | 257,201 | 257,565 | 252,008 | 2.1 | % | -0.1 | % | |||||||||||||
| Due from customers acceptances | 63,901 | 159,407 | 217,302 | -70.6 | % | -59.9 | % | |||||||||||||
| Other assets | 1,052,317 | 1,030,392 | 781,378 | 34.7 | % | 2.1 | % | |||||||||||||
| Total Assets | 17,880,230 | 18,187,292 | 18,274,371 | -2.2 | % | -1.7 | % | |||||||||||||
| LIABILITIES AND SHAREHOLDERS' EQUITY | ||||||||||||||||||||
| Deposits and obligations | 13,946,714 | 14,035,650 | 13,340,405 | 4.5 | % | -0.6 | % | |||||||||||||
| Demand deposits | 4,298,914 | 4,002,848 | 3,836,545 | 12.1 | % | 7.4 | % | |||||||||||||
| Saving deposits | 3,387,339 | 3,162,394 | 2,748,290 | 23.3 | % | 7.1 | % | |||||||||||||
| Time deposits | 5,179,047 | 5,731,125 | 5,754,903 | -10.0 | % | -9.6 | % | |||||||||||||
| Severance indemnity deposits (CTS) | 1,012,534 | 1,058,723 | 928,891 | 9.0 | % | -4.4 | % | |||||||||||||
| Interest payable | 68,880 | 80,560 | 71,776 | -4.0 | % | -14.5 | % | |||||||||||||
| Due to banks and correspondents | 603,152 | 845,945 | 1,778,253 | -66.1 | % | -28.7 | % | |||||||||||||
| Bonds and subordinated debt | 941,027 | 929,071 | 857,270 | 9.8 | % | 1.3 | % | |||||||||||||
| Acceptances outstanding | 63,901 | 159,407 | 217,302 | -70.6 | % | -59.9 | % | |||||||||||||
| Other liabilities | 765,086 | 770,704 | 757,480 | 1.0 | % | -0.7 | % | |||||||||||||
| Total liabilities | 16,319,880 | 16,740,777 | 16,950,710 | -3.7 | % | -2.5 | % | |||||||||||||
| NET SHAREHOLDERS' EQUITY | 1,556,224 | 1,442,780 | 1,319,779 | 17.9 | % | 7.9 | % | |||||||||||||
| Capital stock | 667,250 | 667,250 | 439,474 | 51.8 | % | 0.0 | % | |||||||||||||
| Reserves | 388,275 | 388,275 | 388,062 | 0.1 | % | 0.0 | % | |||||||||||||
| Unrealized Gains and Losses | 94,797 | 82,809 | 43,352 | 118.7 | % | 14.5 | % | |||||||||||||
| Retained Earnings | 115,922 | 115,922 | 111,994 | 3.5 | % | 0.0 | % | |||||||||||||
| Income for the year | 289,980 | 188,524 | 336,897 | -13.9 | % | 53.8 | % | |||||||||||||
| Minority interest | 4,126 | 3,735 | 3,882 | 6.3 | % | 10.5 | % | |||||||||||||
| TOTAL LIABILITIES and NET SHAREHOLDERS' EQUITY | 17,880,230 | 18,187,292 | 18,274,371 | -2.2 | % | -1.7 | % | |||||||||||||
| CONTINGENT CREDITS | 7,713,584 | 6,561,565 | 6,296,226 | 22.5 | % | 17.6 | % | |||||||||||||
41
BANCO DE CREDITO DEL PERU AND SUBSIDIARIES
QUARTERLY INCOME STATEMENT
(In US$ thousands, IFRS)
| Quarter | Change % | YTD | Change % | |||||||||||||||||||||||||||||
| 3Q09 | 2Q09 | 3Q08 | 3Q09/3Q08 | 3Q09/2Q09 | Set 09 | Set 08 | Set 09/Set 08 | |||||||||||||||||||||||||
| Interest income and expense | ||||||||||||||||||||||||||||||||
| Interest and dividend income | 292,292 | 314,832 | 322,921 | -9.5 | % | -7.2 | % | 909,494 | 939,001 | -3.1 | % | |||||||||||||||||||||
| Interest expense | (95,030 | ) | (105,372 | ) | (144,633 | ) | -34.3 | % | -9.8 | % | (316,611 | ) | (399,741 | ) | -20.8 | % | ||||||||||||||||
| Net interest and dividend income | 197,262 | 209,460 | 178,288 | 10.6 | % | -5.8 | % | 592,883 | 539,260 | 9.9 | % | |||||||||||||||||||||
| Provision for loan losses | (38,917 | ) | (54,074 | ) | (17,616 | ) | 120.9 | % | -28.0 | % | (120,171 | ) | (44,846 | ) | 168.0 | % | ||||||||||||||||
| Non financial income | ||||||||||||||||||||||||||||||||
| Banking services commissions | 93,348 | 87,620 | 87,042 | 7.2 | % | 6.5 | % | 258,521 | 252,017 | 2.6 | % | |||||||||||||||||||||
| Net gain on foreign exchange transactions | 25,559 | 19,700 | 24,497 | 4.3 | % | 29.7 | % | 65,587 | 75,857 | -13.5 | % | |||||||||||||||||||||
| Net gain on sales of securities | 9,890 | 35,983 | (3,128 | ) | -416.2 | % | -72.5 | % | 92,164 | 23,248 | 296.4 | % | ||||||||||||||||||||
| Other | 892 | 7,285 | 4,897 | -81.8 | % | -87.8 | % | 12,251 | 9,095 | 34.7 | % | |||||||||||||||||||||
| Total fees and income from services, net | 129,689 | 150,588 | 113,308 | 14.5 | % | -13.9 | % | 428,524 | 360,217 | 19.0 | % | |||||||||||||||||||||
| Operating expenses | ||||||||||||||||||||||||||||||||
| Salaries and employees benefits | (80,318 | ) | (79,316 | ) | (83,496 | ) | -3.8 | % | 1.3 | % | (238,983 | ) | (225,920 | ) | 5.8 | % | ||||||||||||||||
| Administrative expenses | (59,269 | ) | (63,919 | ) | (56,266 | ) | 5.3 | % | -7.3 | % | (186,741 | ) | (155,455 | ) | 20.1 | % | ||||||||||||||||
| Depreciation and amortization | (14,712 | ) | (14,088 | ) | (11,800 | ) | 24.7 | % | 4.4 | % | (42,556 | ) | (33,142 | ) | 28.4 | % | ||||||||||||||||
| Other | (6,794 | ) | (4,262 | ) | (11,467 | ) | -40.8 | % | 59.4 | % | (27,493 | ) | (31,707 | ) | -13.3 | % | ||||||||||||||||
| Total operating expenses | (161,093 | ) | (161,585 | ) | (163,029 | ) | -1.2 | % | -0.3 | % | (495,774 | ) | (446,224 | ) | 11.1 | % | ||||||||||||||||
| Income before translation results,workers' profit sharing and income taxes | 126,941 | 144,389 | 110,951 | 14.4 | % | -12.1 | % | 405,462 | 408,407 | -0.7 | % | |||||||||||||||||||||
| Translation result | 10,204 | (10,899 | ) | 8,701 | 17.3 | % | -193.6 | % | (4,955 | ) | 16,102 | -130.8 | % | |||||||||||||||||||
| Employees’ profit sharing | (4,842 | ) | (5,765 | ) | (2,947 | ) | 64.3 | % | -16.0 | % | (14,422 | ) | (10,493 | ) | 37.4 | % | ||||||||||||||||
| Income taxes | (30,558 | ) | (38,905 | ) | (23,176 | ) | 31.9 | % | -21.5 | % | (95,255 | ) | (75,836 | ) | 25.6 | % | ||||||||||||||||
| Minority Interest | (289 | ) | (278 | ) | (447 | ) | -35.3 | % | 4.0 | % | (850 | ) | (1,284 | ) | -33.8 | % | ||||||||||||||||
| Net income | 101,456 | 88,542 | 93,082 | 9.0 | % | 14.6 | % | 289,980 | 336,896 | -13.9 | % | |||||||||||||||||||||
42
BANCO DE CREDITO DEL PERU AND SUBSIDIARIES
SELECTED FINANCIAL INDICATORS
| Quarter | YTD | |||||||||||||||||||
| 3Q09 | 2Q09 | 3Q08 | Sep-09 | Sep-08 | ||||||||||||||||
| Profitability | ||||||||||||||||||||
| Net income per common share (US$ per share)(1) | 0.046 | 0.040 | 0.042 | 0.130 | 0.151 | |||||||||||||||
| Net interest margin on interest earning assets (2) | 4.87 | % | 5.07 | % | 4.30 | % | 4.79 | % | 4.53 | % | ||||||||||
| Return on average total assets (2)(3) | 2.25 | % | 1.93 | % | 2.05 | % | 2.12 | % | 2.52 | % | ||||||||||
| Return on average shareholders' equity (2)(3) | 27.06 | % | 25.71 | % | 28.93 | % | 26.91 | % | 34.75 | % | ||||||||||
| No. of outstanding shares (millions) | 2,228.29 | 2,228.29 | 2,228.29 | 2,228.29 | 2,228.29 | |||||||||||||||
| Quality of loan portfolio | ||||||||||||||||||||
| Past due loans as a percentage of total loans | 1.56 | % | 1.39 | % | 0.78 | % | 1.56 | % | 0.78 | % | ||||||||||
| Reserves for loan losses as a percentage of | ||||||||||||||||||||
| total past due loans | 191.82 | % | 193.00 | % | 299.17 | % | 191.82 | % | 299.17 | % | ||||||||||
| Reserves for loan losses as a percentage of | ||||||||||||||||||||
| total loans | 3.00 | % | 2.68 | % | 2.33 | % | 3.00 | % | 2.33 | % | ||||||||||
| Operating efficiency | ||||||||||||||||||||
| Oper. expense as a percent. of total income (4) | 48.80 | % | 49.66 | % | 52.29 | % | 51.07 | % | 47.80 | % | ||||||||||
| Oper. expense as a percent. of av. tot. assets(2)(3)(4) | 3.42 | % | 3.43 | % | 3.35 | % | 3.43 | % | 3.10 | % | ||||||||||
| Capital adequacy | ||||||||||||||||||||
| Total Regulatory Capital (US$Mn) | 1,739.0 | 1,586.0 | 1,277.2 | |||||||||||||||||
| 'Risk-weighted assets (US$Mn) | 1,289.4 | 1,195.0 | 982.0 | |||||||||||||||||
| Regulatory capital / risk-weighted assets (5) | 14.5 | % | 13.5 | % | 12.2 | % | ||||||||||||||
| Average balances (millions of US$) (3) | ||||||||||||||||||||
| Interest earning assets | 16,203.5 | 16,541.6 | 16,568.8 | 16,497.2 | 15,865.6 | |||||||||||||||
| Total Assets | 18,033.8 | 18,355.6 | 18,123.8 | 18,197.2 | 17,849.0 | |||||||||||||||
| Net equity | 1,499.5 | 1,377.4 | 1,287.0 | 1,437.0 | 1,292.5 | |||||||||||||||
(1) Shares outstanding of 2,228 million is used for all periods since shares have been issued only for capitalization of profits and inflation adjustment.
(2) Ratios are annualized.
(3) Averages are determined as the average of period-beginning and period-ending balances.
(4) Total operating income includes net interest income, fee income and net gain on foreign exchange transactions. Operating expense includes personnel expenses, administrative expenses and depreciation and amortization
(5) Risk-weighted assets include market risk assets
43
EL PACIFICO-PERUANO SUIZA Y SUBSIDIARIAS
(in thousand dollars)
Balance to and for the period of Three month ending | Change % | |||||||||||||||||||
| 30-Sep-09 | 30-Jun-09 | 30-Sep-08 | 3Q09/3Q08 | 3Q09/2Q09 | ||||||||||||||||
| 3Q09 | 2Q09 | 3Q08 | ||||||||||||||||||
| Results | ||||||||||||||||||||
| Total Premiums | 148,718 | 149,172 | 148,334 | 0.3 | % | -0.3 | % | |||||||||||||
| Ceded Premiums | 19,637 | 24,034 | 25,361 | -22.6 | % | -18.3 | % | |||||||||||||
| Adjusment of reserves | 16,341 | 19,482 | 15,973 | 2.3 | % | -16.1 | % | |||||||||||||
| Earned net premiums | 112,740 | 105,657 | 107,001 | 5.4 | % | 6.7 | % | |||||||||||||
| Direct claims | 57,091 | 78,405 | 104,371 | -45.3 | % | -27.2 | % | |||||||||||||
| Ceded claims | (15,856 | ) | 5,534 | 16,731 | -194.8 | % | -386.5 | % | ||||||||||||
| Net claims | 72,947 | 72,871 | 87,640 | -16.8 | % | 0.1 | % | |||||||||||||
| Direct commissions | 17,029 | 17,237 | 24,966 | -31.8 | % | -1.2 | % | |||||||||||||
| Commissions received | 2,420 | 2,401 | 1,738 | 39.2 | % | 0.8 | % | |||||||||||||
| Net commissions | 14,609 | 14,836 | 23,228 | -37.1 | % | -1.5 | % | |||||||||||||
| Technical expenses | 6,099 | 5,701 | (929 | ) | 756.5 | % | 7.0 | % | ||||||||||||
| Technical resolves | 3,549 | 2,638 | 2,503 | 41.8 | % | 34.6 | % | |||||||||||||
| Net technical expenses | 2,550 | 3,064 | (3,432 | ) | 174.3 | % | -16.8 | % | ||||||||||||
| Technical results | 22,634 | 14,886 | (436 | ) | 5295.0 | % | 52.1 | % | ||||||||||||
| Financial income | 15,774 | 15,490 | 17,128 | -7.9 | % | 1.8 | % | |||||||||||||
| Gains pn sale of real state and secutirities | 4,122 | 4,113 | 6,738 | -38.8 | % | 0.2 | % | |||||||||||||
| Renting (Net of expenses) | 1,136 | 877 | 720 | 57.7 | % | 29.5 | % | |||||||||||||
| (-) Financial expenses | 412 | 428 | 824 | -50.0 | % | -3.7 | % | |||||||||||||
| Financial income, net | 20,620 | 20,053 | 23,762 | -13.2 | % | 2.8 | % | |||||||||||||
| Salaries and benefits | 11,752 | 10,904 | 10,190 | 15.3 | % | 7.8 | % | |||||||||||||
| Administrative expenses | 11,117 | 8,198 | 10,776 | 3.2 | % | 35.6 | % | |||||||||||||
| Third party services | 4,531 | 4,300 | 4,515 | 0.4 | % | 5.4 | % | |||||||||||||
| Sundry management expenses | 1,602 | 1,753 | 1,756 | -8.8 | % | -8.6 | % | |||||||||||||
| Provisions | 1,751 | 1,248 | 1,230 | 42.3 | % | 40.3 | % | |||||||||||||
| Taxes | 1,382 | 1,166 | 1,358 | 1.7 | % | 18.5 | % | |||||||||||||
| Other expenses | 1,851 | (269 | ) | 1,917 | -3.4 | % | -788.0 | % | ||||||||||||
| General expenses | 22,869 | 19,102 | 20,966 | 9.1 | % | 19.7 | % | |||||||||||||
| Other income | (92 | ) | 9 | 90 | -203.0 | % | -1122.8 | % | ||||||||||||
| Traslations results | 1,879 | 2,724 | (154 | ) | 1316.5 | % | -31.0 | % | ||||||||||||
| Employee participations and income tax | (6,282 | ) | (2,544 | ) | 1,726 | 464.0 | % | 146.9 | % | |||||||||||
| Income before minority interest | 15,890 | 16,025 | 4,021 | 295.2 | % | -0.8 | % | |||||||||||||
| Minority interest | 2,613 | 3,277 | 2,800 | -6.7 | % | -20.3 | % | |||||||||||||
| Net income | 13,277 | 12,748 | 1,221 | 987.6 | % | 4.2 | % | |||||||||||||
| Balance (end of period) | ||||||||||||||||||||
| Total Assets | 1,476,861 | 1,399,945 | 1,303,089 | 13.3 | % | 5.5 | % | |||||||||||||
| Invesment on securities and real state (1) | 1,026,507 | 920,416 | 853,733 | 20.2 | % | 11.5 | % | |||||||||||||
| Technical reserves | 1,016,054 | 1,030,576 | 963,148 | 5.5 | % | -1.4 | % | |||||||||||||
| Net equity | 242,243 | 194,786 | 152,645 | 58.7 | % | 24.4 | % | |||||||||||||
| Ratios | ||||||||||||||||||||
| Ceded | 13.2 | % | 16.1 | % | 17.1 | % | ||||||||||||||
| Net claims/ earned net premiums | 64.7 | % | 69.0 | % | 81.9 | % | ||||||||||||||
| Commissions+technical expenses, net / earned net premiums | 15.2 | % | 16.9 | % | 18.5 | % | ||||||||||||||
| Technical results / earned net premiums | 20.1 | % | 14.1 | % | -0.4 | % | ||||||||||||||
| General expenses / earned net premiums | 20.3 | % | 18.1 | % | 19.6 | % | ||||||||||||||
| Return on equity (2)(3) | 26.6 | % | 32.4 | % | 2.9 | % | ||||||||||||||
| Return on total premiums | 8.9 | % | 8.5 | % | 0.8 | % | ||||||||||||||
| Net equity / Total Assets | 16.4 | % | 13.9 | % | 11.7 | % | ||||||||||||||
| Increase in technical reserves | 12.7 | % | 15.6 | % | 13.0 | % | ||||||||||||||
| General expenses / Assets (2)(3) | 6.5 | % | 5.7 | % | 6.7 | % | ||||||||||||||
| Combined ratio of PPS + PS (4) | 95.2 | % | 72.8 | % | 117.4 | % | ||||||||||||||
| Net claims / earned net premiums | 65.6 | % | 52.3 | % | 86.9 | % | ||||||||||||||
| General expenses and commissions / earned net premiums | 29.6 | % | 20.4 | % | 30.5 | % | ||||||||||||||
(1) Real state investment were excluded
(2) Annualized
(3) Average are determined as the average of period - begging and period ending
(4) Without consolidated adjusments
44
SIGNATURE
Pursuant to the requirements of the Securities Exchange Act of 1934, the registrant has duly caused this report to be signed on its behalf by the undersigned, thereunto duly authorized.
Date: November 6, 2009
| CREDICORP LTD. | ||
| By: | /s/ Giuliana Cuzquen | |
Giuliana Cuzquen Authorized Representative | ||