SECURITIES AND EXCHANGE COMMISSION
Washington, D.C. 20549
FORM 6-K
Report of Foreign Private Issuer
Pursuant to Rule 13a-16 or 15d-16 of the
Securities Exchange Act of 1934
For the month of May 2010
CREDICORP LTD.
(Exact name of registrant as specified in its charter)
Clarendon House
Church Street
Hamilton HM 11 Bermuda
(Address of principal executive office)
Indicate by check mark whether the registrant files or will file annual reports under cover Form 20-F or Form 40-F.
Form 20-F x Form 40-F o
Indicate by check mark whether the registrant by furnishing the information contained in this Form is also thereby furnishing the information to the Commission pursuant to Rule 12g3-2(b) under the Securities Exchange Act of 1934.
Yes o No x
SIGNATURE
Pursuant to the requirements of the Securities Exchange Act of 1934, the registrant has duly caused this report to be signed on its behalf by the undersigned, thereunto duly authorized.
Date: May 10, 2010
| CREDICORP LTD. | |||
| By: | /s/ Giuliana Cuzquen | ||
| Giuliana Cuzquen | |||
| Authorized Representative | |||
 | CREDICORP Ltd. First Quarter 2010 Results Lima, Peru, May 06, 2010 - Credicorp (NYSE:BAP) announced today its unaudited results for the first quarter of 2010. These results are reported on a consolidated basis in accordance with IFRS in nominal U.S. Dollars. HIGHLIGHTS · Credicorp reported a good start for the year with 1Q10 earnings of US$ 123.9 million, reflecting 12% YoY earnings growth and 1.3% QoQ. As expected, ROAA of 2.18% and a 21.54% ROAE were slightly lower and include the impact of strengthening our equity and maintaining a conservative asset & liability matching. · The strong recovery of economic activity in the Peruvian market is clearly reflected in the average daily balances of loans for the 1Q10, which were up 15.9% vs. 1Q09, and 6.7% vs. 4Q09. Nevertheless, given that last year’s loan growth happened basically at the very end of the year, loan book at each quarter-end reflects more modest growth of 2.9% QoQ. It is important to note that although retail volumes continued to increase, growth was slightly subdued in Q1. This contrasts with activity in the corporate sector, which was extremely dynamic. · Though NII grew 19.3% YoY, it increased 3.2% QoQ. This is lower than the average daily balances expansion given that a large portion of additional loan volume came from recovery in the corporate and middle market, segments with lower spreads. Therefore, the lower margin loan growth and the large liquidity positions resulting from LT funding raised last year, impacted NIMs slightly and resulted in NIM slipping from 5.0 % to 4.9%. · Fee income over the Q remained flat; though still 27.6% higher over the year, while FX income recovered strongly, increasing 9.4% QoQ and 30.4% YoY. Despite this good performance, the lack of income from the sale of securities, which was especially high 1H09, could not be fully compensated and total non-financial income dropped 3.6%. · A further increase in PDLs in 1Q10 was mainly the result of a seasonal increase of delinquencies, exacerbated by an internal problem with our newly implemented collection system. Therefore, our PDL ratio increased to 1.8% from 1.6% by the end of 2009, and provisions for loan losses remained at a relatively high level for the quarter, showing only a 2% drop from the previous Q. · The continuing good performance of the insurance business is reflected in the US$ 32.5 million in premiums net of claims, which is 14% higher YoY. As anticipated, this is lower compared to the previous quarter, since an unusually low claims rate led to the extraordinary result of 4Q09. · Operating costs reflect a remarkable drop of 8.6% for the quarter following the seasonally high year-end costs in 4Q09 and the significant efforts to reduce costs and increase efficiencies. This is especially noteworthy given that this 1Q also had to absorb significant redundancy costs related to some personnel reductions, which were part of efficiency improvement plans. · Consequently, operating income for Credicorp is 7.8% higher QoQ, but normalized taxes (vs. the low tax rate in 4Q09 due to tax provision reversals), reduced the growth of net income attributed to Credicorp to only 1.3% for the Q, though it is still 12% higher YoY. · BCP’s operating results also reflect an increase in average lending volumes in comparison to 4Q and lower operating costs and although provisions remain high and there were no gains on the sale of securities, 1Q10’s figures represent a 13.2% increase in operating income vs. 4Q09. Yet after a normalized tax rate, BCP’s contribution to Credicorp reached US$ 102 million, 5% lower than 4Q09’s net earnings, which were boosted by the extraordinary tax provision reversals recorded in 4Q09. · ASHC’s reported a steady and strong income generation, though slightly lower with regard to 4Q due to lower volume of IEA and some FX-losses on Euros. Thus, the earnings contribution reached US$ 13.4 million, down from US$ 14.9 million in 4Q09. · PPS continued performing better than expected and reported a contribution to Credicorp of US$ 8.5 million. It is important to emphasize that this result, although lower than the US$ 12.4 million contribution recorded in 4Q09- which reflected extraordinarily low claims rate and consequent provision reversals at the end of the year- is a reflection of sound insurance underwriting. More importantly, all risk and performance ratios are currently at low levels, reflecting the successful changes implemented in PPS’s business model. · Prima AFP performed above expectations this 1Q10 and reported a 41% increase in its contribution, which totaled US$ 5.9 million despite the regulatory changes that exempted the additional year-end salary from contributions into the fund. This robust income growth was achieved thanks to increased collections as the economy reactivates and tight cost control. · The good performances of all of Credicorp’s subsidiaries are evident in Credicorp’s operating results, which is why we would like to stress the robust 7.8% increase of these earnings over the quarter. |

I. Credicorp Ltd.
Overview
Credicorp was off to a good start this year following the clear signs of a dynamic recovery in economic activity. It reported 1Q10 earnings of US$ 123.9 million, reflecting earnings growth of 1.3% QoQ and 12% YoY and EPS of US$ 1.55. As expected, ROAA of 2.18% and a 21.54% ROAE were slightly lower and include the impact of strengthening our equity for future growth and a conservative gapping policy for our A&Ls.
The results achieved this Q start reflect economic recovery through the expansion in BCP’s average lending volumes, which reached 6.7% growth for the quarter (and 15.9% YoY). It is noteworthy that most of this growth stems from a reactivation of corporate and middle-market investment and working capital expansion. The retail segment had a more differentiated performance given that the mortgage business reflected significant growth (reaching 7.7% QoQ and 41% YoY), whereas the consumer sector showed more subdued performance due to the strong seasonality of consumer spending, which peaks mid and year-end.
Quarter-end balances however hide this performance and show a mere 2.9% loan growth at Credicorp and 2.1% at BCP.
This loan growth (mainly wholesale and mortgage books) has contributed to comparatively lower growth of interest income, which expanded 3.2% thanks to a further contraction of interest expenses. Therefore, the lower margins loan growth and the large liquidity positions resulting from funding raised last year to strengthen our regulatory capital base and keep low unmatched positions (from a tenor perspective) in our balance sheet and that generated a negative carry, impacted NIMs slightly and resulted in NIM slipping from 5.0 % to 4.9%.
A further increase in PDLs in 1Q10 was mainly the result of (i) a seasonal increase in delinquencies mainly in the SME segment following the Christmas campaigns and (ii) a further deterioration of already existing delinquencies, with both trends being strongly exacerbated by an internal problem with our collections system. It is reassuring, however, that the loans classified as “normal” in our portfolio remain stable at 94.0%. Nevertheless, our PDL ratio increased to 1.8% from 1.6% by the end of 2009 because of the way PD balances for further deteriorating loans are accounted for. Consequently, provisions for loan losses remained at a relatively high level for the quarter as the classification of bad loans deteriorated, showing only a 2% drop from the previous Q, to ensure a comfortable coverage ratio for the group of 177%.
After a strong 4Q09 increase of 14%, fee income performed well and remained basically flat this 1Q10, while income from FX transactions improved by 9.4% for the Q and 30% for the year. However, gains from the sale of securities, which boosted non-financial income in the 1H09, were low, leading to a drop in non-financial income of 3.6% QoQ.
The insurance business continued to perform well, which is reflected in the US$ 32.5 million in premiums net of claims which is 14% higher compared to the same period in 2009. However, and as anticipated, this figure is lower than the previous quarter’s. This is due to the fact that an unusually low claims rate led to the extraordinary result reported in 4Q09, whereas this quarter flooding in the highlands of Cuzco and Machu Picchu represented important claims for the insurance industry. In addition to better underwriting practices, which were evident this 1Q, the company has improved its investment portfolio management, enhancing profitability.
Operating costs reflect a remarkable drop of 8.6% for the quarter following the seasonally high year-end costs and the significant efforts to reduce costs and increase efficiencies. This is especially noteworthy given that this 1Q, results also had to absorb significant redundancy costs of approximately US$ 10 million due to personnel cutbacks, which were possible thanks to the efficiency improvement plans. This resulted in a 6.4% increase in personnel costs for the Q.
2
The reduction of operating costs is especially evident in administrative expenses, which dropped 16.3% QoQ.
| Credicorp Ltd. | Quarter | Change % | ||||||||||||||||||
| US$ thousands | 1Q10 | 4Q09 | 1Q09 | 1Q10 / 1Q09 | 1Q10 / 4Q09 | |||||||||||||||
| Net Interest income | 245,585 | 237,963 | 205,866 | 19.3 | % | 3.2 | % | |||||||||||||
| Total provisions, net of recoveries | (43,181 | ) | (44,044 | ) | (26,425 | ) | 63.4 | % | -2.0 | % | ||||||||||
| Non financial income | 167,808 | 174,124 | 173,668 | -3.4 | % | -3.6 | % | |||||||||||||
| Insurance premiums and claims | 32,487 | 45,029 | 28,507 | 14.0 | % | -27.9 | % | |||||||||||||
| Operating expenses | (237,698 | ) | (260,064 | ) | (221,212 | ) | 7.5 | % | -8.6 | % | ||||||||||
| Income before non-recurring items, translation results, employees´ profit sharing and income taxes | 165,002 | 153,008 | 160,405 | 2.9 | % | 7.8 | % | |||||||||||||
| Translation results | 12,059 | 1,075 | (4,708 | ) | -356.1 | % | 1022.1 | % | ||||||||||||
| Employees' profit sharing and income taxes | (44,902 | ) | (21,112 | ) | (38,209 | ) | 17.5 | % | 112.7 | % | ||||||||||
| Net income | 132,158 | 132,971 | 117,488 | 12.5 | % | -0.6 | % | |||||||||||||
| Minority Interest | 8,288 | 10,675 | 6,910 | 19.9 | % | -22.4 | % | |||||||||||||
| Net income attributed to Credicorp | 123,870 | 122,296 | 110,578 | 12.0 | % | 1.3 | % | |||||||||||||
| Net income/share (US$) | 1.55 | 1.53 | 1.39 | 12.0 | % | 1.3 | % | |||||||||||||
| Total loans | 11,922,859 | 11,585,635 | 10,119,759 | 17.8 | % | 2.9 | % | |||||||||||||
| Deposits and Obligations | 14,806,660 | 14,091,828 | 13,327,794 | 11.1 | % | 5.1 | % | |||||||||||||
| Net Shareholders' Equity | 2,284,552 | 2,316,856 | 1,668,154 | 37.0 | % | -1.4 | % | |||||||||||||
| Net interest margin | 4.9 | % | 5.1 | % | 4.5 | % | ||||||||||||||
| Efficiency ratio | 42.1 | % | 44.0 | % | 44.0 | % | ||||||||||||||
| Return on average shareholders' equity | 21.5 | % | 22.0 | % | 26.3 | % | ||||||||||||||
| PDL/Total loans | 1.81 | % | 1.59 | % | 1.16 | % | ||||||||||||||
| Coverage ratio of PDLs | 176.7 | % | 192.0 | % | 205.4 | % | ||||||||||||||
| Employees | 19,548 | 20,148 | 19,947 | |||||||||||||||||
Thus, income before non-recurring items, translation results, profit sharing and income taxes grew a strong 7.8% in 1Q10 alone, reflecting robust earnings generation at Credicorp for the period. The significant improvement in Credicorp’s operating results continued to be supported by the good performance of the non-banking businesses, i.e. the insurance and asset management businesses. However, bottom line results are not in line with this improved earnings generation and reveal the significant impact that variations in tax payments between quarters have had on net earnings. In fact, 4Q09 benefitted from the reversal of tax provisions due to tax issues that were eventually clarified with the regulators. This resulted in a very low tax rate for 4Q09, whereas this 1Q10, normalized taxes were applied. The result is a distortion in real income growth, which although flat for the Q, still shows 12.5% growth compared to the same period of 2009. Thus, net income attributed to Credicorp is up only 1.3% this 1Q10.
Credicorp – The Sum of Its Parts
Credicorp’s 1Q10 results once again reflect the good performance at all its subsidiaries. Furthermore, the recovery in economic activity has reactivated loan growth, further increased the good levels of income at the asset management subsidiaries and increased insurance activity.
BCP saw the reactivation of demand for loans through solid growth of average daily balances at BCP, which grew 6.7% QoQ and are hidden behind a 2.1% loan growth on book balances at the end of each period. This strong growth was accompanied by higher NII, which was not, however, in line with loan volume growth and expanded only 3.8% given that most of the growth in lending activity came from the wholesale and mortgage businesses, both with smaller margins. This, plus a conservative A&L management and resulting funding structure, led to a slight tightening of NIM from 5% to 4.9% as IEA grew at a higher pace than interest income generation. Though loan portfolio deterioration leveled off at the end of last year, and the percentage of good performing loans remained flat and at a high level (94.0%), further deterioration of already existent delinquent loans kept reserves at a relatively high level for the Q, dropping only 2% from the level of 4Q09. Non interest income was negatively affected by the absence of gains on the sale of securities, which had boosted results in 1H09. On the other hand, operating costs dropped a significant 6.4% despite absorbing substantial redundancy costs related to personnel reductions. This was in line with all other efficiency-improving efforts. All of these events led to a substantial 13.2% increase in BCP’s operating results, which reflect BCP’s recovered income generation capacity.
3
However, net income hides this excellent operating result given that the tax line reflects significant variations as explained before: a normalized tax rate this 1Q10 vs. an extraordinarily low tax rate in 4Q09 due to tax provision reversals that were clarified with the regulator by the end of 2009. Thus, BCP’s net income totaled US$ 102 million, which indicates a drop of 5.1% compared to 4Q09. This Q, BCP contributed US$ 99 million to Credicorp.
| Earnings Contribution | Quarter | Change % | ||||||||||||||||||
| (US$ Thousands) | 1Q10 | 4Q09 | 1Q09 | 1Q10/1Q09 | 1Q10/4Q09 | |||||||||||||||
| Banco de Crédito BCP(1) | 99,254 | 104,518 | 98,911 | 0 | % | -5 | % | |||||||||||||
| BCB | 5,610 | 9,521 | 8,518 | -34 | % | -41 | % | |||||||||||||
| Atlantic | 13,411 | 14,856 | 3,017 | 345 | % | -10 | % | |||||||||||||
| PPS | 8,492 | 12,372 | 5,230 | 62 | % | -31 | % | |||||||||||||
| Grupo Crédito (2) | 7,948 | 5,548 | 6,866 | 16 | % | 43 | % | |||||||||||||
| Prima | 5,946 | 4,224 | 6,246 | -5 | % | 41 | % | |||||||||||||
| Others | 2,002 | 1,324 | 620 | 223 | % | 51 | % | |||||||||||||
| Credicorp and Others (3) | (5,235 | ) | (14,996 | ) | (3,446 | ) | 52 | % | -65 | % | ||||||||||
| Credicorp Ltd. | (5,224 | ) | (14,992 | ) | (3,941 | ) | 33 | % | -65 | % | ||||||||||
| Otras | (11 | ) | (4 | ) | 495 | -102 | % | 191 | % | |||||||||||
| Net income attributable to Credicorp | 123,870 | 122,298 | 110,578 | 12 | % | 1 | % | |||||||||||||
(1) Includes Banco de Crédito de Bolivia. (2) Includes Grupo Crédito, Servicorp and Prima AFP (3) Includes taxes on BCP's and PPS's dividends, and other expenses at the holding company level. | ||||||||||||||||||||
BCP Bolvia’s earnings generation has contracted further. This is the result of the prevailing economic, political and regulatory environment, where excess liquidity could not be invested in once profitable CD’s, and loan growth is negligible. BCP Bolivia reported a contribution of US$ 5.6 million for 1Q10 vs. US$ 9.5 million for 4Q09 and US$ 8.5 million for 1Q09. Nevertheless, the retail business did show some growth, which in BCP Bolivia represents more than 50% of the loan portfolio. Overall, profitability has been cut, but the bank still generates a 25% ROAE.
ASHC’s reported improved results this 1Q10 with an earnings contribution of US$ 13.4 million, maintaining the good level of 4Q09 of US$ 14.9 million. The slight drop responds to lower fee income and some FX losses on a Euro position as well as less gains from the sale of securities, but the core business remains a solid and steady generator of income.
PPS obtained net earnings of US$ 12.1 million in 1Q10, and contributed US $ 8.5 million to Credicorp. Technical results are now at more normalized levels after the extremely low level of claims in 2009 and the consequent reversal of provisions for claims at the end of last year, which contributed to 4Q09’s extremely strong results. In fact, this year the insurance business started the year with already a significant casualty generated by the flooding in the highlands of Cuzco and Machu Picchu. Today, the recorded Net Earned Loss ratio for each business line is in line with expectations for a well-run insurance underwriting business: 40% for car insurance, 68% medical assistance and 63% for P&C. The life insurance business claims rate did increase from 70% to 75%, but the segment remains very profitable. The EPS business (packaged medical insurance) also reported better technical performance. Its NEL ratio dropped from 82.5% to 79%. In addition, the combined ratio for the insurance business is currently 96.4%. Though all risk management and operating performance ratios maintain healthy levels, lower net premiums earned in this 1Q also contributed to lower total technical results, showing a drop from US$29 million to US$ 17 million within the Q. This was compensated by stronger financial gains due to better asset management across the corporation, subsequent improvements in investment strategies and lower operating costs, which are in line with efforts across Credicorp to improve efficiencies and curb costs. Consequently, PPS contributed US$ 8.5 million to Credicorp. This is an excellent start to 2010.
4
Finally, in the first quarter of 2010, PRIMA’s income was US$ 20.5 million, representing 2.9% growth QoQ. This is attributable to an increase in the RAM (average income level per affiliate) level due to reactivation in the local economy and, to a lesser degree, to the fact that the local currency appreciated during the period (1.7%). Compared to 1Q09 (21.2 million), a 3.2% decline is evident. Nevertheless, this result is a combined effect of (i) lower income in January 2010 due to the government’s decision to exonerate additional salaries (paid in July and December) from pension fund contributions until December 2010 (ii) which was mitigated by a mild exchange rate appreciation in 1Q10 that slightly offset the impact of lower income. Operating expenses fell in comparison to the previous quarter due to lower expenses for advertising and marketing as well as lower provisions for administrative personnel. Thus, operating results show a 25% QoQ increase in income, which with flat other costs, led to a substantial 41% increase in Prima’s contribution to Credicorp, which reached US$ 5.9 million.
The significant quarterly difference of Credicorp Ltd.’s line which normally includes the provisions for withholding taxes on dividends paid to Credicorp, is explained by the extra-ordinary translation loss reported by Credicorp last 4Q09 on the dividends received from BCP. This 1Q10 reflects the normal provisions.
The good performance of all of Credicorp’s subsidiaries led to a significant increase of almost 8% in operating income (income before translation results, profit sharing and taxes). The further though slight appreciation of the local currency generated some translation gains, but the significant increase in taxes plus normalized profit sharing provisions for the year resulted in net earnings for the 1Q10 of US$ 123.9 million, in line with our expectations, but only 1.3% higher when compared to 4Q09. As previously explained, 4Q09 net earnings were boosted by tax provisions reversals and lower profit sharing provision in anticipation of final results, which distorts comparative net earnings growth analysis. Operating improvements were therefore not reflected in the financial ratios, which deteriorated slightly to 21.5% ROAE, 2.2% ROAA, 42.1% efficiency ratio, 4.9% NIM and 1.8% PDLs, with 177% PDL coverage.
5
II. Banco de Crédito – BCP - Consolidated
Overview 1Q10
BCP’s net operating income in 1Q10 totaled US$ 128.2 million. This represented significant growth of 13.2% QoQ, which reflects an increasing capacity to generate income. In terms of net income, the quarterly result reported a 5.1% decrease QoQ as a result of a normalized level of income tax provisions in 1Q10, which contrasted strongly with extraordinarily low provisions required in 4Q09 due to diverse tax effects, and which boosted net income in that period.
| Banco de Crédito and Subsidiaries | Quarter | Change % | ||||||||||||||||||
| US$ 000 | 1Q10 | 4Q09 | 1Q09 | 1Q10 / 1Q09 | 1Q10 / 4Q09 | |||||||||||||||
| Net Financial income | 219,175 | 211,233 | 186,161 | 17.7 | % | 3.8 | % | |||||||||||||
| Total provisions, net of recoveries | (43,445 | ) | (44,933 | ) | (27,180 | ) | 59.8 | % | -3.3 | % | ||||||||||
| Non financial income | 137,841 | 144,977 | 148,246 | -7.0 | % | -4.9 | % | |||||||||||||
| Operating expenses | (185,334 | ) | (197,956 | ) | (173,095 | ) | 7.1 | % | -6.4 | % | ||||||||||
| Income before non-recuring items, translation results, employees' profit sharing and income taxes | 128,237 | 113,321 | 134,132 | -4.4 | % | 13.2 | % | |||||||||||||
| Translation results | 11,680 | 12,609 | (4,260 | ) | -374.2 | % | -7.4 | % | ||||||||||||
| Employees profit sharing and income taxes | (37,746 | ) | (18,207 | ) | (29,607 | ) | 27.5 | % | 107.3 | % | ||||||||||
| Net income | 101,909 | 107,398 | 99,982 | 1.9 | % | -5.1 | % | |||||||||||||
| Net income/share (US$) | 0.046 | 0.048 | 0.045 | 1.8 | % | -5.2 | % | |||||||||||||
| Total loans | 11,852,548 | 11,577,303 | 10,031,099 | 18.2 | % | 2.4 | % | |||||||||||||
| Deposits and obligations | 13,777,327 | 14,465,809 | 13,608,169 | 1.2 | % | -4.8 | % | |||||||||||||
| Net Shareholders' equity | 1,578,484 | 1,675,533 | 1,312,090 | 20.3 | % | -5.8 | % | |||||||||||||
| Net financial margin | 4.9 | % | 5.0 | % | 4.5 | % | ||||||||||||||
| Efficiency ratio | 51.3 | % | 53.8 | % | 55.2 | % | ||||||||||||||
| Return on average equity | 25.1 | % | 26.6 | % | 29.5 | % | ||||||||||||||
| PDL/Total loans | 1.81 | % | 1.59 | % | 1.16 | % | ||||||||||||||
| Coverage ratio of PDLs | 176.9 | % | 192.3 | % | 206.6 | % | ||||||||||||||
| BIS ratio | 14.5 | % | 14.5 | % | 12.5 | % | ||||||||||||||
| Branches | 326 | 334 | 339 | |||||||||||||||||
| Agente BCP | 2,973 | 2,801 | 2,037 | |||||||||||||||||
| ATMs | 1,021 | 996 | 926 | |||||||||||||||||
| Employees | 16,103 | 16,748 | 16,628 | |||||||||||||||||
Improvements in operating performance in 1Q10 with regard to 4Q09 are attributable to:
i) A 3.8% increase QoQ in net interest income (NII) due to loan growth that led to higher interest income on loans, higher income from investment dividends as well as lower interest expense resulting from the rollout at the end of 2009 of a TD campaign that locked in high interest rates; and
ii) A 6.4% QoQ contraction in operating expenses due to a decrease in administrative expenses in almost every segment, as well as, other expenses.
However, strengthening our regulatory capital and our conservative A&L matching policies, inflict a cost which generates a negative carry reflected in the NII reported by BCP, understating NII growth of the core business.
Nevertheless, the aforementioned improvements in operating performance helped offset the 4.9% QoQ decrease in non financial income, which was primarily attributable to the fact that net gains on sales of securities were virtually non-existent in a context of gradual market stabilization and a lack of arbitrage opportunities. Furthermore, it is important to point out that income from banking services commissions have remained high, similar to the level in 4Q09, and gains on foreign exchange transactions grew 8.8% QoQ.
In terms of assets, it is important to note the 2.2% QoQ increase in net loans and 6.7% QoQ in average daily balances. This was primarily due to a 10.3% increase in the average daily balances of the Wholesale Banking portfolio, which recovered its dynamism. The Retail Banking portfolio continued to grow, albeit at a slower rate (2.4% QoQ in average daily balances).
6
This was basically attributable to high loan growth in 4Q09 in the SME segment and credit cards, which was associated to financing provided during the Christmas campaign and that was repaid during 1Q10.
In terms of portfolio quality, a slight deterioration was evident in the past due ratio, which increased from 1.59% to 1.81%. This increase, which will be explained in greater depth later on, was associated with an increase in the past due ratio in the SME segment, which in turn is mostly attributable to seasonality effects that could not be attenuated due to an operating problem in the collections process (problems in implementing the new application to manage collections).
Finally, the average return on shareholder’s equity was 25.1%, which was a satisfactory level. It is important to remember that even though the ROAE obtained in 1Q10 may be lower than that reported in 1Q09 (29.49%), this situation is the cost of (i) preparing the bank for future growth since our equity has grown through the capitalization of retained earnings and issue of subordinated and hybrid debt at the expense of income, and of (ii) a conservative A&L policy (low gapping in tenor and currency) which generates additional costs through a negative carry that affects our margins. Thus, net income has not grown at the same pace of our equity.
Core Earnings
| Core Revenues | Quarter | Change % | ||||||||||||||||||
| US$ 000 | 1Q10 | 4Q09 | 1Q09 | 1Q10 / 1Q09 | 1Q10 / 4Q09 | |||||||||||||||
| Net interest and dividend income | 219,175 | 211,233 | 186,161 | 17.7 | % | 3.8 | % | |||||||||||||
| Fee income, net | 107,223 | 109,546 | 77,553 | 38.3 | % | -2.1 | % | |||||||||||||
| Net gain on foreign exchange transactions | 25,503 | 23,430 | 20,328 | 25.5 | % | 8.8 | % | |||||||||||||
| Core Revenues | 351,901 | 344,209 | 284,042 | 23.9 | % | 2.2 | % | |||||||||||||
In 1Q10, BCP’s core earnings totaled US$ 351.9 million. This reflects a 2% increase compared to the figure registered in 4Q09, which represented the highest quarterly core earnings reported in 2009. Despite a slight drop in fees, the favorable quarterly performance can be explained by:
i) The increase in NII, which was attributable to higher interest income on loans and investment dividends, as well as lower interest expenses paid on deposits as older TDs with high locked-in rates rolled out at the end of last year resulting in significantly lower rates being applied to such funding this 1Q; and
ii) Higher gains on FX transactions, which reported an increase of 8.8% QoQ,
We should however bear in mind that the additional Tier 1 capital raised through the Hybrid bond issue, as well as senior LT debt raised to match long term assets, inflict a cost which generates a negative carry, and which is also reflected in the NII reported by BCP, understating NII growth of the core business.
Despite the latter, the YoY evolution of core earnings (+23.9%) revealed growth in all segments, which is in line with economic reactivation.
II.1 Interest Earning Assets (IEA)
At the end of the first quarter of 2010, interest earning assets grew 5.6% QoQ and 10.7% YoY, mainly through higher investment securities available for sale and an increase in current loans.
7
| Interest Earning Assets | Quarter | Change % | ||||||||||||||||||
| US$ 000 | 1Q10 | 4Q09 | 1Q09 | 1Q10 / 1Q09 | 1Q10 / 4Q09 | |||||||||||||||
| BCRP and other banks | 2,631,775 | 2,980,575 | 3,141,925 | -16.2 | % | -11.7 | % | |||||||||||||
| Interbank funds | 97,499 | 75,000 | 25,134 | 287.9 | % | 30.0 | % | |||||||||||||
| Trading securities | 109,326 | 70,318 | 29,973 | 264.7 | % | 55.5 | % | |||||||||||||
Securities available for sale | 4,053,210 | 3,026,542 | 3,672,154 | 10.4 | % | 33.9 | % | |||||||||||||
| Current Loans, net | 11,637,580 | 11,393,557 | 9,914,864 | 17.4 | % | 2.1 | % | |||||||||||||
| Total interest earning assets | 18,529,390 | 17,545,992 | 16,784,050 | 10.4 | % | 5.6 | % | |||||||||||||
Strong growth in deposits (demand deposits and savings) was reflected in 5.6% QoQ growth in interest earning assets. This growth is in turn distributed and is mostly concentrated in the 33.9% QoQ growth in securities available for sale and the 3.1% QoQ increase in current loans. The increase in investment securities available for sale was mainly the result of the decision to prioritize investments in BCR certificates of deposit to obtain tax free yields while keeping low risk level. Therefore,, the growth in investments in such certificates results from channeling into these most of the funds from the expansion of deposits and part of the deposits in BCR (BCRP and Other Banks), which decreased 11.7% QoQ.
Loans continued to constitute the main component of interest earning assets and demonstrated growth of 2.1% QoQ and 17.4% YoY, in terms of quarter-end balances.
Loan Portfolio
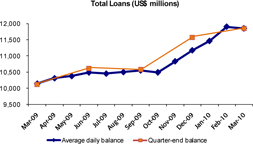
At the end of the first quarter, BCP’s net loans totaled US$ 11,472 million, which represented an increase of 2.2% QoQ and 17.1% YoY. Nevertheless, quarter-end balances hide the more pronounced dynamism in loan activity, which becomes evident when we analysis the average daily balances of each period, which grew 6.7% QoQ and 15.9% YoY. This significant growth is mostly associated with the expansion of Wholesale Banking Portfolio, specifically the Corporate and Middle-Market segments, which reported higher growth rates due primarily to an increase in medium and long term financing (US$ 197 million) and working capital (US$ 108 million), which is evidence that the country’s economy is recovering.
| TOTAL LOANS (1) | ||||||||||||||||||||
| (US$ million) | ||||||||||||||||||||
| 1Q10 | 4Q09 | 1Q09 | YoY | QoQ | ||||||||||||||||
| Wholesale Banking | 6,497.0 | 5,891.3 | 5,927.9 | 9.6 | % | 10.3 | % | |||||||||||||
| Corporate | 4,423.9 | 3,987.2 | 3,977.0 | 11.2 | % | 11.0 | % | |||||||||||||
| Middle Market | 2,073.1 | 1,904.0 | 1,950.9 | 6.3 | % | 8.9 | % | |||||||||||||
| Retail Banking | 4,384.4 | 4,280.5 | 3,700.8 | 18.5 | % | 2.4 | % | |||||||||||||
| SME + Business | 1,418.1 | 1,401.8 | 1,227.1 | 15.6 | % | 1.2 | % | |||||||||||||
| Mortgages | 1,610.1 | 1,551.8 | 1,345.6 | 19.7 | % | 3.8 | % | |||||||||||||
| Consumer | 840.7 | 828.8 | 719.4 | 16.9 | % | 1.4 | % | |||||||||||||
| Credit Cards | 515.5 | 498.1 | 408.8 | 26.1 | % | 3.5 | % | |||||||||||||
| Edyficar (2) | 288.7 | 254.4 | * | - | - | - | ||||||||||||||
| Others (3) | 661.0 | 661.0 | 583.1 | 13.4 | % | 0.0 | % | |||||||||||||
| Consolidated total loans | 11,830.7 | 11,087.2 | 10,211.8 | 15.9 | % | 6.7 | % | |||||||||||||
* Monthly-end balance as of Dec. 09. (1) Average daily balance (2) End-of-period balance: Mar. 10 = US$ 276.5 MM vs. Dec. 09 = US$ 254.4 MM. Growth: 8.7% QoQ. (3) Includes work out unit, other banking and BCP Bolivia. | ||||||||||||||||||||
The figure below shows the evolution of both quarter-end balances and each month’s average daily balances during 1Q10. It is evident that average daily balances experienced an upward trend during the months of January and February and registered a slight decline in the month of March.
8
If we analyze loan evolution by currency type, both the local currency and foreign currency portfolios grew (6.7% QoQ and 5.6% YoY, respectively). This contrasts with the evolution seen during the majority of 2009 when dynamism was reported in the local currency portfolio. Growth in both portfolios was led by Wholesale Banking portfolio; nevertheless, it is important to note that growth was evident in all segments of the local currency portfolio, while foreign currency loans continued decreasing in the retail segment.
Average Daily Balances
| Domestic Currency Loans (1) | Foreign Currency Loans (1) | |||||||||||||||||||||||||||||||||||||||
(Nuevos Soles million) | (US$ million) | |||||||||||||||||||||||||||||||||||||||
1Q10 | 4Q09 | 1Q09 | YoY | QoQ | 1Q10 | 4Q09 | 1Q09 | YoY | QoQ | |||||||||||||||||||||||||||||||
| Wholesale Banking | 5,245.1 | 4,706.6 | 4,638.7 | 13.1 | % | 11.4 | % | 4,655.2 | 4,263.3 | 4,475.8 | 4.0 | % | 9.2 | % | ||||||||||||||||||||||||||
| Corporate | 3,931.0 | 3,535.5 | 3,519.2 | 11.7 | % | 11.2 | % | 3,043.6 | 2,764.4 | 2,875.4 | 5.8 | % | 10.1 | % | ||||||||||||||||||||||||||
| Middle Market | 1,314.1 | 1,171.0 | 1,119.5 | 17.4 | % | 12.2 | % | 1,611.7 | 1,499.0 | 1,600.4 | 0.7 | % | 7.5 | % | ||||||||||||||||||||||||||
| Retail Banking | 7,455.2 | 7,172.3 | 6,020.5 | 23.8 | % | 3.9 | % | 1,766.6 | 1,799.7 | 1,816.1 | -2.7 | % | -1.8 | % | ||||||||||||||||||||||||||
| SME + Business | 2,519.9 | 2,442.1 | 2,092.7 | 20.4 | % | 3.2 | % | 533.3 | 557.1 | 572.0 | -6.8 | % | -4.3 | % | ||||||||||||||||||||||||||
| Mortgages | 1,966.5 | 1,826.3 | 1,394.6 | 41.0 | % | 7.7 | % | 919.6 | 920.2 | 909.0 | 1.2 | % | -0.1 | % | ||||||||||||||||||||||||||
| Consumer | 1,685.9 | 1,657.7 | 1,431.8 | 17.7 | % | 1.7 | % | 248.7 | 255.5 | 271.1 | -8.3 | % | -2.6 | % | ||||||||||||||||||||||||||
| Credit Cards | 1,282.9 | 1,246.3 | 1,101.5 | 16.5 | % | 2.9 | % | 65.0 | 67.0 | 63.9 | 1.7 | % | -3.0 | % | ||||||||||||||||||||||||||
| Edyficar (2) | 709.8 | 693.1 | * | - | - | - | 38.8 | 14.6 | * | - | - | - | ||||||||||||||||||||||||||||
| Others (3) | 157.2 | 138.7 | 50.2 | 213.1 | % | 13.3 | % | 605.8 | 611.9 | 567.4 | 6.8 | % | -1.0 | % | ||||||||||||||||||||||||||
| Consolidated total loans | 13,567.3 | 12,710.7 | 10,709.5 | 26.7 | % | 6.7 | % | 7,066.4 | 6,689.6 | 6,859.2 | 3.0 | % | 5.6 | % | ||||||||||||||||||||||||||
* Monthly-end balance as of Dec. 09. (1) Average daily balance (2) End-of-period balance in Domenstic currency: Mar. 10 = S/. 746.9 MM vs. Dec. 09 = S/. 693.1 MM. Growth: 7.8% QoQ. End-of-period balance in Foreign currency: Mar. 10 = US$ 13.6 MM vs. Dec. 09 = US$ 14.6 MM. Growth: -6.9 % QoQ. (3) Includes work out unit, other banking and BCP Bolivia. | ||||||||||||||||||||||||||||||||||||||||
The behavior of Retail Banking segments was also somewhat differentiated. While a continuous and strong expansion was evident in mortgage loans, growth in the consumer loans and credit card segments remained very subdued. This was due to the contraction in demand (due to global uncertainty) whose effects were still present in 1Q10, which is accentuated particularly after the high consumption levels reported in 4Q09 because of the Christmas campaign.
In the SME segment, lower growth is the direct effect of a post-Christmas campaign, because customers strive to repay significant financing obligations in January and February. This in turn offsets dynamism in other sectors.
The evolution of Edyficar’s portfolio remained highly dynamic, demonstrating 8.7% growth QoQ if we consider quarter-end balances.
9
Market Share
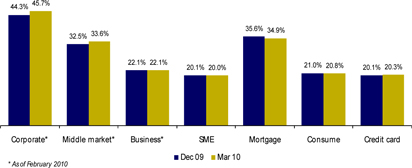
At the end of March, BCP consolidated (which includes Branches abroad, Edyficar and Solucion) continued to lead the loan market with a 31.1% share, which exceeds the 30.8% reported in 4Q09. At the end of February 2010, the shares of Corporate Banking and Middle-Market Banking in total loans continued to increase, registering levels of 45.7% and 33.6%, respectively. Within Retail Banking, each product’s shares were similar to those seen in 4Q09 standing out the market share in SME segment where BCP, including Edyficar, continued to lead the segment.
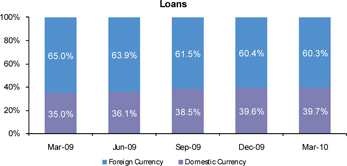
Dollarization
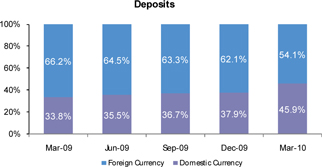
The loan portfolio in local currency represented 39.7% of the total portfolio, which is similar to the scenario seen at the end of 4Q09. As previously mentioned, the foreign currency portfolio has shown higher growth than that seen in 2009 and as such its share in total loans is comparable to that reported in December 2009.
II.2 Deposits and Mutual Funds
Improvements in market values and our customers’ desire for higher returns have resulted in a 6.4% increase in BCP’s mutual funds. A significant increase is also evident in lowest-cost deposits (non- interest bearing deposits and savings deposits).
10
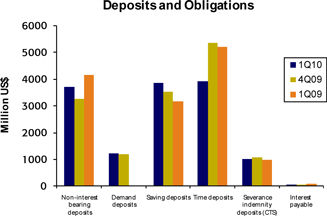
| Deposits and Obligations | Quarter ended | Change % | ||||||||||||||||||
| US$ (000) | 1Q10 | 4Q09 | 1Q09 | 1Q10 / 1Q09 | 1Q10 / 4Q09 | |||||||||||||||
| Non-interest bearing deposits | 3,707,286 | 3,261,009 | 4,147,227 | -10.6 | % | 13.7 | % | |||||||||||||
| Demand deposits | 1,225,445 | 1,179,634 | 17,006 | 7106.0 | % | 3.9 | % | |||||||||||||
| Saving deposits | 3,853,739 | 3,539,917 | 3,162,172 | 21.9 | % | 8.9 | % | |||||||||||||
| Time deposits | 3,927,540 | 5,361,410 | 5,217,625 | -24.7 | % | -26.7 | % | |||||||||||||
| Severance indemnity deposits (CTS) | 1,013,010 | 1,069,267 | 987,247 | 2.6 | % | -5.3 | % | |||||||||||||
| Interest payable | 50,307 | 54,572 | 76,892 | -34.6 | % | -7.8 | % | |||||||||||||
| Total customer deposits | 13,777,327 | 14,465,809 | 13,608,169 | 1.2 | % | -4.8 | % | |||||||||||||
| Mutual funds in Perú | 2,182,873 | 2,042,159 | 1,307,943 | 66.9 | % | 6.9 | % | |||||||||||||
| Mutual funds in Bolivia | 138,922 | 139,709 | 133,336 | 4.2 | % | -0.6 | % | |||||||||||||
| Total customer funds | 16,099,122 | 16,647,677 | 15,049,448 | 7.0 | % | -3.3 | % | |||||||||||||
The positive evolution of mutual funds is due to an overall improvement in market values and higher associated yields as well as our customers’ decision (individuals) to migrate from time deposits to investment products such as mutual funds, which was an effect of aggressive affiliation campaigns.
The 4.8% QoQ decline in total deposits was mainly attributable to modifications in the structure of securitized bond issuances made in previous years, which reflected changes in reporting requirements. Under the new structure, the position must be registered in due to banks and correspondents as opposed to booking it within time deposits, as was the case until 4Q09. If we exclude this effect, real growth in deposits would be approximately 5.7% QoQ. This growth was associated primarily with higher levels reported in interest-free deposits (+13.7% QoQ as corporate accumulated cash for their yearly tax payments), savings (+ 8.9% QoQ) and demand deposits (+3.9 % QoQ).
This evolution of funding sources makes it very evident that BCP possesses a strong capacity to capture funds, which has allowed it to maintain market leadership and favorable funding costs.
Market Share in Deposits
During the first quarter of the year, BCP maintained its leadership in both foreign and local currency deposits in all its products. In this context, BCP’s market share in total deposits was 33.4%. It is important to emphasize that the share in time deposits in foreign currency has fallen from 40.2% in 4Q09 to 28.6% in 1Q10 due to the aforementioned change in the structure of securitized bonds.
11
| Market share by type of deposit and currency | ||||||||||||||||
Demand deposits | Saving deposits | Time deposits | Severance indemnity | |||||||||||||
| LC | 40.7. | % | 37.3 | % | 23.4 | % | 37.5 | % | ||||||||
| FC | 43.8 | % | 41.6 | % | 28.6 | % | 55.9 | % | ||||||||
LC: Local Currency FC: Foreign Currency | ||||||||||||||||
Dollarization
At the end of 1Q10, a strong level of de-dollarization was evident in foreign currency deposits due to the aforementioned change in the structure of securitized bonds as well as an increase in confidence in the local currency, which appreciated 1.7% against the dollar in the first quarter of the year. In this context, the market share of local currency deposits increased significantly, going from 37.9% in 4Q09 to 45.9% in 1Q10.
II.3 Net Interest Income
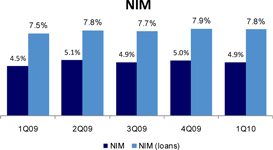
The NII grew 3.8% QoQ due to a 1.5% increase in interest income, which was strengthened by a 3.7% reduction in interest expenses. In this context, BCP obtained a NIM of 4.9%, which is similar to the 5.0% reported in 4Q09 and higher than the 4.5% registered in1Q09.
| Net interest income | Quarter | Change % | ||||||||||||||||||
| US$ 000 | 1Q10 | 4Q09 | 1Q09 | 1Q10/1Q09 | 1Q10/4Q09 | |||||||||||||||
| Interest income | 305,922 | 301,319 | 302,370 | 1.2 | % | 1.5 | % | |||||||||||||
| Interest on loans | 280,165 | 274,340 | 258,751 | 8.3 | % | 2.1 | % | |||||||||||||
| Interest and dividends on investments | 3,457 | 43 | 2,704 | 28 | % | 7939.5 | % | |||||||||||||
| Interest on deposits with banks | 1,788 | 2,327 | 4,698 | -61.9 | % | -23.2 | % | |||||||||||||
| Interest on trading securities | 19,838 | 22,008 | 29,472 | -32.7 | % | -9.9 | % | |||||||||||||
| Other interest income | 674 | 2,601 | 6,745 | -90.0 | % | -74.1 | % | |||||||||||||
| Interest expense | 86,747 | 90,086 | 116,209 | -25.4 | % | -3.7 | % | |||||||||||||
| Interest on deposits | 21,555 | 49,258 | 83,182 | -74.1 | % | -56.2 | % | |||||||||||||
| Interest on borrowed funds | 28,790 | 6,681 | 10,053 | 186.4 | % | 330.9 | % | |||||||||||||
| Interest on bonds and subordinated notes | 25,628 | 20,916 | 14,452 | 77.3 | % | 22.5 | % | |||||||||||||
| Other interest expense | 10,774 | 13,231 | 8,522 | 26.4 | % | -18.6 | % | |||||||||||||
| Net interest income | 219,175 | 211,233 | 186,161 | 17.7 | % | 3.8 | % | |||||||||||||
| Average interest earning assets | 18,037,691 | 16,826,904 | 16,746,466 | 7.7 | % | 7.2 | % | |||||||||||||
| Net interest margin* | 4.9 | % | 5.0 | % | 4.5 | % | ||||||||||||||
*Annualized
12
The quarterly evolution of NII shows 1.5% growth, which is attributable to:
i) A 2.1% increase in interest on loans due to an expansion in the loan portfolio (+2.1% in quarterly closing balances and +6.7% in average daily balances), mainly because of the higher growth in the Wholesale Banking portfolio;
ii) Dividend income from investments that are usually obtained in the first quarter each year; and
iii) The 3.7% contraction in interest expenses due to lower interest expense on deposits caused by lower time deposit levels.
It is helpful to clarify that lower interest on securities reflects a mere accounting change since starting 2010, this item includes hedging costs (interest rate swaps), which were registered in other interest expenses in previous years. If we consider the net effect, both accounts have maintained levels similar to those seen in 4Q09. Additionally, the significant reduction in interest spending on deposits and considerable increase in interest on borrowed funds were due to a modification in the structure of securitized bonds issued by BCP in previous years, which translated into a reduction of time deposits and an increase in debts to banks and correspondents.
It is however important to point out that the NII evolution was very satisfactory if we consider the significant increase in interest paid on bonds and subordinated notes, which is primarily attributable to (i) the hybrid bonds issuance to strengthen our regulatory capital and (ii) senior debt issued to reduce the gap in tenor of our A&L positions.
Finally, the total net interest margin and NIM on loans recorded levels similar to those seen in 4Q09, as is evident in the following chart.
II.4 Past Due Portfolio and Provisions for Loan Losses
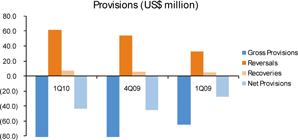
Net provisions reported a slight decline of 3.3% QoQ due to higher recoveries given that gross provisions maintained similar levels QoQ. Past due loans grew 17.0% QoQ due primarily to a seasonal effect on Retail Banking’s SME segment, and an operational problem in the collections system, which impeded efforts to offset such seasonality.
| Provision for loan losses | Quarter ended | Change % | ||||||||||||||||||
| US$ 000 | 1Q10 | 4Q09 | 1Q09 | 1Q10 / 1Q09 | 1Q10 / 4Q09 | |||||||||||||||
| Provisions | (50,507 | ) | (50,554 | ) | (32,026 | ) | 57.7 | % | -0.1 | % | ||||||||||
| Loan loss recoveries | 7,062 | 5,620 | 4,846 | 45.7 | % | 25.6 | % | |||||||||||||
| Total provisions, net of recoveries | (43,445 | ) | (44,933 | ) | (27,180 | ) | 59.8 | % | -3.3 | % | ||||||||||
| Total loans | 11,852,548 | 11,577,303 | 10,031,099 | 18.2 | % | 2.4 | % | |||||||||||||
| Reserve for loan losses (RLL) | 380,248 | 353,348 | 240,091 | 58.4 | % | 7.6 | % | |||||||||||||
| Charge-Off amount | 25,478 | 31,652 | 13,293 | 91.7 | % | -19.5 | % | |||||||||||||
| Past due loans (PDL) | 214,968 | 183,746 | 116,235 | 84.9 | % | 17.0 | % | |||||||||||||
| PDL/Total loans | 1.81 | % | 1.59 | % | 1.16 | % | ||||||||||||||
| Coverage | 176.9 | % | 192.3 | % | 206.6 | % | ||||||||||||||
13
Net provisions totaled US$ 43.4 million in 1Q10, which represented a 3.3% drop QoQ. This was primarily attributable to an increase in recoveries, which totaled US$7.1 million, a figure 25.6% higher than 4Q09’s. Nevertheless, it is important to point out that although gross provisions were similar to the levels recorded in 4Q09, there was a change in the composition given that provision requirements for the Wholesale Banking and Edyficar portfolios fell in comparison to 4Q09’s levels while Retail Banking’s requirements increased as provisions were upped mainly for micro business loans.
The past due loans experienced a 17.0% increase QoQ, which is basically attributable to higher levels in SME products, as it is shown in the figure below. This increase was due to: (i) a seasonal effect as the strongly increased financing provided during the Christmas campaign matures in the first quarter of the year; and (ii) an operational problem in implementing a new collections system, which reduced the effectiveness of collections efforts. Growth in past due loans is also affected by the distinct feature of BCP’s portfolio that a high percentage of loans is covered real guarantees creating a lag in write-offs.
PDL Ratio by Segment
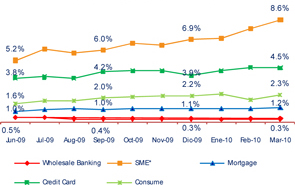
The aforementioned explained in some extent the increase in the past due ratio, though also the way in which past due balances for further deteriorating loans are accounted for had a negative impact on the PDL ratio, which went from 1.59% to 1.81% (1Q10 vs 4Q09). Regardless, these levels are still low, and the good quality of our portfolio is reassured by an unchanged ratio (94.0%) of loans classified as “normal” since December 2009.
II.5 Non Financial Income
Non financial income fell 4.9% QoQ, primarily due to a contraction (-98.2% QoQ) in net gains on sales of securities in an scenario of higher markets stability, which in turn meant that there were fewer opportunities to generate trading income.
14
Non financial income totaled US$ 137.8 million in 1Q10, which represents a contraction of 4.9% QoQ and 7.0% YoY. This was basically due to lower net gains on sales of securities. The quarterly evolution is attributable, in large part, to the gradual stabilization of international and local markets, which translates into fewer opportunities for trading. In relation to 1Q09’s level, it is important to remember that net gains on sales of securities included extraordinary high earnings on sovereign and global bond sales.
Net gains on FX transactions, on the other hand, reported an important increase of 8.8% product also of a recovery in commercial activity.
| Non financial income | Quarter | Change % | ||||||||||||||||||
| US$ 000 | 1Q10 | 4Q09 | 1Q09 | 1Q10 / 1Q09 | 1Q10/ 4Q09 | |||||||||||||||
| Fee income | 107,223 | 109,546 | 77,553 | 38.3 | % | -2.1 | % | |||||||||||||
| Net gain on foreign exchange transactions | 25,503 | 23,430 | 20,328 | 25.5 | % | 8.8 | % | |||||||||||||
| Net gain on sales of securities | 161 | 9,185 | 46,291 | -99.7 | % | -98.2 | % | |||||||||||||
| Other income | 4,954 | 2,816 | 4,074 | 21.6 | % | 75.9 | % | |||||||||||||
| Total non financial income | 137,841 | 144,977 | 148,246 | -7.0 | % | -4.9 | % | |||||||||||||
Furthermore, banking service commissions remained at the same favorable level seen last quarter, when historic highs for commissions were recorded in certain segments like those obtained from structuring corporate financing operations, which did not reach the record levels of commissions reported in 4Q09 that represented more than twice the quarterly average in 2009 for Corporate Finance. This explains the slight decline in total commission income with regard to 4Q09 (-2.1%). If we analyze the YoY evolution, a significant increase of 38.3% is evident. This is primarily due to 37.9% growth in Miscellaneous Accounts (basically Savings accounts +46.3% YoY and Credit Cards +68.0% YoY) and expansion in the Others segment, which includes a notable increase in commissions on Corporate Finances (+US$ 3.1 million) and a significant contribution (+US$ 5.6 millions) from our subsidiaries (Credifondo +US$ 4.3 million and Banco de Crédito de Bolivia +US$1.3 million).
| Banking Fee Income | Quarter | Change % | ||||||||||||||||||
| US$ 000 | 1Q10 | 4Q09 | 1Q09 | 1Q10 / 1Q09 | 1Q10 / 4Q09 | |||||||||||||||
| Miscellaneous accounts* | 27,800 | 26,591 | 20,164 | 37.9 | % | 4.5 | % | |||||||||||||
| Contingents | 6,395 | 5,611 | 4,559 | 40.3 | % | 14.0 | % | |||||||||||||
| Payments and collections | 13,859 | 14,025 | 11,522 | 20.3 | % | -1.2 | % | |||||||||||||
| Drafts and transfers | 6,500 | 6,883 | 5,560 | 16.9 | % | -5.6 | % | |||||||||||||
| Credit cards | 13,851 | 14,155 | 10,141 | 36.6 | % | -2.1 | % | |||||||||||||
| Others | 38,818 | 42,282 | 25,607 | 51.6 | % | -8.2 | % | |||||||||||||
| Total Fee Income | 107,223 | 109,546 | 77,553 | 38.3 | % | -2.1 | % | |||||||||||||
* Saving Accounts, Current Accounts and Debit Card.
The number of transactions contracted 5.5% with regard to 4Q09. Nevertheless, YoY comparison indicates a 15.3% increase. The quarterly evolution is partially attributable to the high activity during 4Q09 due to end-of-year campaigns. Growth YoY corresponds, to a large extent, to the 77.2% YoY increase in transactions through BCP Agents BCP (+2 million transactions) as well as more extensive use of the ATM network (18.9% increase YoY in the number of transactions). These results reflect BCP’s efforts to promote the use of cost-efficient channels.
15
| Quarter | Change % | |||||||||||||||||||
| N° of Transactions per channel | Average 1Q10 | Average 4Q09 | Average 1Q09 | 1Q10 / 1Q09 | 1Q10 / 4Q09 | |||||||||||||||
| Teller | 10,107,334 | 10,733,475 | 9,792,291 | 3.2 | % | -5.8 | % | |||||||||||||
| Internet Banking Via BCP | 9,632,114 | 10,466,538 | 8,937,239 | 7.8 | % | -8.0 | % | |||||||||||||
| ATMs Via BCP | 7,643,857 | 8,193,738 | 6,430,467 | 18.9 | % | -6.7 | % | |||||||||||||
| Agente BCP | 4,676,832 | 4,614,103 | 2,639,140 | 77.2 | % | 1.4 | % | |||||||||||||
| Telecrédito | 4,166,085 | 4,424,750 | 3,686,367 | 13.0 | % | -5.8 | % | |||||||||||||
| Points of Sale P.O.S. | 3,819,986 | 3,911,271 | 2,901,872 | 31.6 | % | -2.3 | % | |||||||||||||
| Balance Inquiries | 2,500,069 | 2,593,456 | 2,468,762 | 1.3 | % | -3.6 | % | |||||||||||||
| Telephone Banking | 1,421,835 | 1,641,981 | 1,354,645 | 5.0 | % | -13.4 | % | |||||||||||||
| Direct Debit | 366,097 | 401,154 | 400,771 | -8.7 | % | -8.7 | % | |||||||||||||
| Other ATMs network | 292,788 | 314,287 | 210,673 | 39.0 | % | -6.8 | % | |||||||||||||
| Mobile banking | 227,526 | 152,191 | 85,060 | 167.5 | % | 49.5 | % | |||||||||||||
| Total transactions | 44,854,522 | 47,446,943 | 38,907,287 | 15.3 | % | -5.5 | % | |||||||||||||
The network of service channels increased from 4,131 points of contact to 4,320. This is attributable to an increase in BCP Agents and ATMs, which is in line with the aforementioned strategy. A YoY comparison indicates that 30.8% of this growth corresponds to an increase in BCP Agents and ATMs (936 new BCP Agents and 95 additional ATMs). In both cases, there was a slight decline in the number of agencies. This is result of efforts to improve efficiency, which focus on closing certain points of contact that have not met profitability expectations to prioritize the expansion of more efficient channels. This evolution is a clear sign of BCP’s solid commitment to extend banking penetration.
| Balance as of | Change % | |||||||||||||||||||
| 1Q10 | 4Q09 | 1Q09 | 1Q10 / 1Q09 | 1Q10 / 4Q09 | ||||||||||||||||
| Branches | 326 | 334 | 339 | -3.8 | % | -2.4 | % | |||||||||||||
| ATMs | 1,021 | 996 | 926 | 10.3 | % | 2.5 | % | |||||||||||||
| Agentes BCP | 2,973 | 2,801 | 2,037 | 45.9 | % | 6.1 | % | |||||||||||||
| Total | 4,320 | 4,131 | 3,302 | 30.8 | % | 4.6 | % | |||||||||||||
II.6 Operating Costs and Efficiency
Operating expenses recorded a 6.4% decline QoQ due to lower administrative expenses (-17.4% QoQ); nevertheless, the efforts that have been made to reduce spending are not reflected in the annual comparison since expenses increased 7.1% mainly as a result of higher personnel spending to cover redundancy packages during 1Q10.
| Operating expenses | Quarter | Change % | ||||||||||||||||||
| US$ 000 | 1Q10 | 4Q09 | 1Q09 | 1Q10 / 1Q09 | 1Q10 / 4Q09 | |||||||||||||||
| Salaries and employee benefits | 98,445 | 89,486 | 79,349 | 24.1 | % | 10.0 | % | |||||||||||||
| Administrative, general and tax expenses | 65,785 | 79,622 | 63,553 | 3.5 | % | -17.4 | % | |||||||||||||
| Depreciation and amortization | 16,423 | 16,153 | 13,756 | 19.4 | % | 1.7 | % | |||||||||||||
| Other expenses | 4,680 | 12,695 | 16,437 | -71.5 | % | -63.1 | % | |||||||||||||
| Total operating expenses | 185,333 | 197,956 | 173,095 | 7.1 | % | -6.4 | % | |||||||||||||
| Efficiency Ratio | 51.3 | % | 53.8 | % | 55.2 | % | ||||||||||||||
The reduction in operating expenses with regard to 4Q09 demonstrates the initial results of a special effort to increase efficiency and curb expenses across Credicorp. This reduction was achieved primarily thanks to a 17.4% contraction in administrative expenses and a 63.1% decrease in Other expenses. In terms of administrative expenses, the decline was due to the lower spending for almost every component, particularly maintenance expenses (US$ -3.7 millions), marketing (US$ -3.0 millions) and consulting fees (US$ -3.0 million). The Others segment contracted due to lower provisions for the Stock Options program, which went from US$ 5.3 million in 4Q09 to US$ 2.7 million in 1Q10. This same contraction led to significant a drop in provisions for litigation, claims and other contingences, which went from US$ 3.9 million in 4Q09 to US$ 0.7 million. Finally, it is important to emphasize that the 10.0% increase QoQ in employee salaries and benefits expenses was due to extraordinary expenses associated with personnel reductions. These cuts, which were in line with efficiency targets, generated an expense of approximately US$10.5 million in 1Q10, higher than the level registered in 4Q09 (US$ 1.4 million).
16
The chart below provides details on administrative expenses and their quarterly variations:
Administrative Expenses | Quarter | Change % | ||||||||||||||||||||||||||||||
US$ (000) | 1Q10 | % | 4Q09 | % | 1Q09 | % | 1Q10 / 1Q09 | 1Q10 / 4Q09 | ||||||||||||||||||||||||
| Marketing | 5,308 | 8.1 | % | 8,351 | 10.5 | % | 4,725 | 7.4 | % | 12.3 | % | -36.4 | % | |||||||||||||||||||
| Systems | 9,351 | 14.2 | % | 11,152 | 14.0 | % | 10,896 | 17.1 | % | -14.2 | % | -16.1 | % | |||||||||||||||||||
| Transport | 5,945 | 9.0 | % | 7,344 | 9.2 | % | 4,537 | 7.1 | % | 31.0 | % | -19.0 | % | |||||||||||||||||||
| Maintenance | 2,675 | 4.1 | % | 6,342 | 8.0 | % | 2,205 | 3.5 | % | 21.3 | % | -57.8 | % | |||||||||||||||||||
| Communications | 3,612 | 5.5 | % | 3,575 | 4.5 | % | 2,873 | 4.5 | % | 25.7 | % | 1.0 | % | |||||||||||||||||||
| Consulting | 2,264 | 3.4 | % | 5,272 | 6.6 | % | 4,000 | 6.3 | % | -43.4 | % | -57.1 | % | |||||||||||||||||||
| Others | 19,969 | 30.4 | % | 21,458 | 26.9 | % | 18,710 | 29.4 | % | 6.7 | % | -6.9 | % | |||||||||||||||||||
| Taxes and contributions | 6,694 | 10.2 | % | 5,813 | 7.3 | % | 6,631 | 10.4 | % | 0.9 | % | 15.1 | % | |||||||||||||||||||
| Other subsidiaries and eliminations, net | 9,967 | 15.2 | % | 10,315 | 13.0 | % | 8,975 | 14.1 | % | 11.1 | % | -3.4 | % | |||||||||||||||||||
| Total Administrative Expenses | 65,785 | 100.0 | % | 79,622 | 100.0 | % | 63,553 | 100.0 | % | 3.5 | % | -17.4 | % | |||||||||||||||||||
II.7 Shareholders’ Equity and Regulatory Capital
At the end of 1Q10, BCP maintained a high level of regulatory capital. This was reflected in the BIS ratio of 14.48%, which was similar to the level recorded at the end of 4Q09 and higher than the legal minimum of 9.5%.
| Shareholders' equity | Quarter | Change % | ||||||||||||||||||
| US$ 000 | 1Q10 | 4Q09 | 1Q09 | 1Q10 / 1Q09 | 1Q10 / 4Q09 | |||||||||||||||
| Capital stock | 783,213 | 667,250 | 667,646 | 17.3 | % | 17.4 | % | |||||||||||||
| Reserves | 388,309 | 388,275 | 388,365 | 0.0 | % | 0.0 | % | |||||||||||||
| Unrealized gains and losses | 117,908 | 106,708 | 40,652 | 190.0 | % | 10.5 | % | |||||||||||||
| Retained earnings | 187,145 | 115,922 | 115,445 | 62.1 | % | 61.4 | % | |||||||||||||
| Income for the year | 101,909 | 397,378 | 99,982 | 1.9 | % | -74.4 | % | |||||||||||||
| Net shareholders' equity | 1,578,484 | 1,675,533 | 1,312,090 | 20.3 | % | -5.8 | % | |||||||||||||
| Return on average equity (ROAE) | 25.1 | % | 26.6 | % | 29.5 | % | ||||||||||||||
Net shareholders’ equity declined 5.8% QoQ. This was due primarily to the announcement of dividends that lowered accumulated earnings (typical in the early quarters of each year), which was offset by a capitalization of earnings for 2009 that was taken in 1Q10. Nevertheless, a 20.3% YoY increase is evident. This was the result of a 17.3% increase in capital shares relative to the aforementioned capitalization of earnings for 2009 as well as a recovery in the market values of investment securities available for sale, which generated a 190.0% increase YoY in unrealized earnings.
17
Regulatory Capital and Capital Adequacy Ratios | Balance as of | Change % | ||||||||||||||||||
US$ (000) | Mar 10 | Dec 09 | Mar 09 | Mar 10 / Mar 09 | Mar 10 / Dec 09 | |||||||||||||||
| Capital Stock | 900,295 | 771,034 | 704,931 | 27.7 | % | 16.8 | % | |||||||||||||
| Legal and Other capital reserves | 467,848 | 459,881 | 420,454 | 11.3 | % | 1.7 | % | |||||||||||||
| Accumulated earnings with capitalization agreement | - | 113,997 | - | - | - | |||||||||||||||
Loan loss reserves (1) | 155,317 | 148,355 | 104,450 | 48.7 | % | 4.7 | % | |||||||||||||
| Perpetual subordinated debt | 250,000 | 250,000 | - | - | 0.0 | % | ||||||||||||||
| Subordinated Debt | 447,115 | 426,264 | 342,634 | 30.5 | % | 4.9 | % | |||||||||||||
| Unrealized profit (loss) | - | - | 22,447 | - | - | |||||||||||||||
| Investment in subsidiaries and others, net of unrealized profit | (210,861 | ) | (226,319 | ) | (173,921 | ) | 21.2 | % | -6.8 | % | ||||||||||
| Goodwill | (42,972 | ) | (54,933 | ) | (8,290 | ) | 418.4 | % | -21.8 | % | ||||||||||
| Total Regulatory Capital | 1,966,742 | 1,888,278 | 1,412,706 | 39.2 | % | 4.2 | % | |||||||||||||
Tier 1 (2) | 1,511,418 | 1,449,953 | 1,052,583 | 43.6 | % | 4.2 | % | |||||||||||||
Tier 2 (3) + Tier 3 (4) | 455,323 | 438,325 | 360,124 | 26.4 | % | 3.9 | % | |||||||||||||
| Total risk-weighted assets | 13,578,861 | 13,007,788 | 11,348,225 | 19.7 | % | 4.4 | % | |||||||||||||
Market risk capital requirement (5) | 64,860 | 64,759 | 89,393 | -27.4 | % | 0.2 | % | |||||||||||||
Operational risk capital requirement (6) | 44,721 | 43,486 | - | - | 2.8 | % | ||||||||||||||
| Capital ratios | ||||||||||||||||||||
BIS ratio (7) (legal minimum = 9.5% since July 2009) | 14.5 | % | 14.5 | % | 12.5 | % | ||||||||||||||
| Risk-weighted assets / Regulatory Capital | 6.9 | 6.9 | 8.0 | |||||||||||||||||
(1) Until June 2009, loan loss reserves up to 1% of gross loans. Since July 2009, up to 1.25% of total risk-weighted assets.
(2) Tier 1 = Capital + Reserves + Accumulated earnings with capitalization agreement + Unrealized profit in subsidiaries - Goodwill - (0.5 x Inverstment in Subsidiaries)
+ Perpetual subordinated debt (maximum amount that can be included is 17.65% of Capital + Reserves + Accumulated earnings with capitalization agreement
+ Unrealized gains - Goodwill.
(3) Tier 2 = Subordinated debt + Loan loss reserves - (0.5 x Investment in subsidiaries)
(4) Tier 3 = Subordinated debt covering market risk only. Tier 3 exists since 1Q10.
(5) Since July 2009, it includes capital requirement to cover price and rate risk.
(6) Effective as of July 2009.
(7) Until June 2009, Risk-weighted assets = Credit risk-weighted assets + Capital requirement to cover market risk * 11. Since July 2009, Risk-weighted assets = Credit risk-weighted assets * 0.96 + Capital requirement to cover market risk * 10.5 + Capital requirement to cover operational risk * 10.5
BCP’s regulatory capital totaled US$ 1,967 million at the end of 1Q10. This represents a slight increase of 4.2% QoQ and is primarily due to an increase in subordinated debt that can be considered for regulatory capital calculation; an increase in unrealized earnings in subsidiaries; and a reduction of goodwill in subsidiaries. The YoY evolution is not applicable given that the calculation of regulatory capital in 1Q09 was based on the Basel I parameters, which were replaced by new Basel II guidelines as of July 2009. Nevertheless, it is important to emphasize that the differential is largely attributable to subordinated debt issuances conducted over the last twelve months.
Total risk-weighted assets reached US$ 13,579 million at the end of 1Q10. This figure was 4.4% higher than 4Q09’s result and is basically attributable to an increase in credit risk-weighted assets, which is in turn due to a 2.4% QoQ increase in gross loans. In this context, BCP obtained a BIS ratio of 14.48% in 1Q10, which mirrors 4Q09’s result and exceeds regulatory requirements.
18
III. Banco de Crédito de Bolivia
Results
In 1Q10, BCP Bolivia obtained net income of US$ 5.6 million, which represents a contraction of 40.9% QoQ and 35.0% YoY. The QoQ decrease is due primarily to a decline in net earnings on securities sales (-49.9% QoQ) and lower interest income (-18.6% QoQ) while the YoY decline is basically attributable to a contraction in other income (-63.5% YoY), interest income (-37.6 % YoY) and net earnings on FX transactions (-22.1% YoY). Interest income decline follows the significant drop in interest rates and reduction in investments in once profitable Central Bank CDs.
The bank’s conservative credit risk management strategy allowed it to obtain a past due ratio of 2.0% in 1Q10 (1.8% in 4Q09 and 2.3% 1Q09) and a coverage ratio of 234.6% (257.9% in 4Q10 and 210.8% in 1Q09). These indicators show that BCP Bolivia is one of the best performers in the Bolivian banking system, which reported ratios of 3.8% and 163.7% respectively at the end of 1Q10. BCP Bolivia’s ROAE was 25.0%, which is below the 30.4% obtained in December 2009 and the 31.7% reported at the end of March 2009.
Assets and Liabilities
Total loans at the end of March 2010 amounted to US$ 489.7 million, which is 1.7% higher than the US$ 481.3 million reported in December 2009 and 4.6% above the level reported in March 2009. Loan growth in the first quarter of the year is attributable to the fact that the bank adopted a more aggressive loan strategy due to good macroeconomic indicators. This approach differs from the prudent lending policy applied by the bank in the first half of last year.
Particularly noteworthy this quarter was the evolution of Retail Banking, which reported growth of 1.5% QoQ and 7.2% YoY. This increase has had a significant impact on the bank’s results, given that Retail Banking represents 53.7% of BCP Bolivia’s portfolio (Wholesale banking represents 42.2% while Special Accounts represents 4.1%) and generates the largest margins.
In Retail Banking, the product that demonstrated the highest QoQ growth was the commercial sector (7.4%), which represents 6.8% of the retail banking portfolio. The Home Mortgage segment, which accounts for 47.7% of the portfolio, reported growth of 4.6% QoQ and 5.3% YoY.
Investments, on the other hand, which were in the past concentrated in very profitable Central Bank CD, dropped as these were no longer available and interest rates dropped dramatically. This hurt the income generation and profitability of the Bolivian operation.
In terms of liabilities, BCP Bolivia’s deposits experienced a 1.8% decline QoQ and a 6.0% increase YoY. This QoQ drop is primarily attributable to a 10.3% decline in term deposits while YoY growth was due to a 17.3% increase in demand liability with regard to March 2009.
Shareholders’ equity declined 20.9% QoQ and 35.0% YoY due to dividend payments and lower earnings during this period.
Finally BCP Bolivia has a market share of 11.6% in loans and 12.5% in deposits, which situates the bank in fourth place in the Bolivian banking system with regard to these indicators. BCP Bolivia is positioning itself as an innovative and agile bank that is close to its customers, offering high quality service. It continues to focus on improving sales processes (quick, agile and good post-sale service) and strengthening and promoting the use of its on-line services.
19
| Banco de Crédito de Bolivia | Quarter | Change % | ||||||||||||||||||
| US$ millions | 1Q10 | 4Q09 | 1Q09 | 1Q10 / 1Q09 | 1Q10 / 4Q09 | |||||||||||||||
| Net financial income | 9.0 | 11.5 | 14.0 | -36.0 | % | -22.1 | % | |||||||||||||
| Total provision, net of recoveries | -0.3 | 0.9 | -2.1 | -86.8 | % | -129.9 | % | |||||||||||||
| Non financial income | 9.9 | 10.8 | 11.4 | -12.9 | % | -8.3 | % | |||||||||||||
| Operating expenses | -11.9 | -12.7 | -13.4 | -11.2 | % | -6.4 | % | |||||||||||||
| Translation result | 0.0 | 0.0 | -0.4 | -97.1 | % | -125.0 | % | |||||||||||||
| Income taxes | -1.1 | -1.0 | -0.9 | 18.3 | % | 13.1 | % | |||||||||||||
| Net income | 5.6 | 9.5 | 8.6 | -35.0 | % | -40.9 | % | |||||||||||||
| Total loans | 489.7 | 481.3 | 468.2 | 4.6 | % | 1.7 | % | |||||||||||||
| Past due loans | 9.6 | 8.7 | 10.8 | -10.7 | % | 11.4 | % | |||||||||||||
| Total provisions | -21.7 | -21.05 | -22.1 | -1.6 | % | 3.3 | % | |||||||||||||
| Total Investments | 249.6 | 305.42 | 400.0 | -37.6 | % | -18.3 | % | |||||||||||||
| Total assets | 1,062.2 | 1,097.8 | 1007.3 | 5.5 | % | -3.2 | % | |||||||||||||
| Deposits | 926.6 | 943.6 | 874.5 | 6.0 | % | -1.8 | % | |||||||||||||
| Net shareholders' equity | 85.7 | 108.3 | 84.8 | 1.1 | % | -20.9 | % | |||||||||||||
| PDL / Total loans | 1.98 | % | 1.81 | % | 2.33 | % | ||||||||||||||
| Coverage ratio of PDLs | 234.6 | % | 257.9 | % | 210.8 | % | ||||||||||||||
| ROAE* | 25.0 | % | 30.4 | % | 31.7 | % | ||||||||||||||
| Branches | 65 | 65 | 65 | |||||||||||||||||
| ATMs | 163 | 172 | 186 | |||||||||||||||||
| Employees | 1,416 | 1,518 | 1,536 | |||||||||||||||||
* ROAE: (Acumulated net income / average monthly equity (from dec. to date))/(number of months)*12
20
IV. Atlantic Security Holding Corporation
Quarterly Results
| ASHC | Quarter | Change % | ||||||||||||||||||
| (US$ million) | 1Q10 | 4Q09 | 1Q09 | 1Q10 / 1Q09 | 1Q10 / 4Q09 | |||||||||||||||
| Net interest income | 9.2 | 9.4 | 6.0 | 51.9 | -3.0 | |||||||||||||||
| Dividend income | 0.2 | 0.2 | 0.0 | 426.1 | 100.0 | |||||||||||||||
| Fees and commissions from services | 2.2 | 2.5 | 1.3 | 67.9 | -8.7 | |||||||||||||||
| Net gains on foreign exchange transactions | -0.2 | -0.1 | -0.8 | 74.9 | -172.5 | |||||||||||||||
| Core Revenues | 11.4 | 12.0 | 6.6 | 72.6 | -5.2 | |||||||||||||||
| Impairment provisions, net of recoveries | 0.0 | -2.3 | -4.4 | 100.0 | 100.0 | |||||||||||||||
| Net gains from sale of securities | 3.6 | 4.1 | 1.3 | 167.1 | -12.1 | |||||||||||||||
| Other income | 0.3 | 5.5 | 1.5 | -82.1 | -95.2 | |||||||||||||||
| Operating expenses | -1.8 | -2.2 | -1.8 | 2.7 | -18.8 | |||||||||||||||
| Net income | 13.4 | 17.1 | 3.2 | 316.0 | -21.4 | |||||||||||||||
| Net income / share | 0.1 | 0.2 | 0.0 | 223.6 | -21.4 | |||||||||||||||
| Contribution to Credicorp | 13.4 | 14.9 | 3.0 | 345 | % | -10 | % | |||||||||||||
| Total loans | 507.7 | 132.3 | 181.4 | 179.9 | 283.9 | |||||||||||||||
| Total investments available for sale | 752.9 | 779.3 | 617.2 | 22.0 | -3.4 | |||||||||||||||
| Total asset | 1,427.3 | 1,483.6 | 1,479.8 | -3.5 | -3.8 | |||||||||||||||
| Total deposits | 1,122.9 | 1,220.6 | 1,289.2 | -12.9 | -8.0 | |||||||||||||||
| Shareholder's equity | 207.1 | 239.8 | 119.0 | 74.1 | -13.6 | |||||||||||||||
| Net interest margin | 2.66 | % | 2.75 | % | 1.90 | % | ||||||||||||||
| Efficiency ratio | 11.9 | % | 10.3 | % | 18.7 | % | ||||||||||||||
| Return on average equity | 24.0 | % | 29.8 | % | 11.0 | % | ||||||||||||||
| PDL / Total loans | 0.0 | 0.0 | 0.0 | |||||||||||||||||
| Cover ratio | 0.2 | % | 0.8 | % | 0.1 | % | ||||||||||||||
| BIS ratio | 22.0 | % | 19.6 | % | 13.8 | % | ||||||||||||||
After an extraordinarily high income generation in the last Q of 2009, helped by significant provision reversals and gains in the sale of securities which had recovered their market value, this 1Q10 Atlantic Security Holding Corporation (ASHC) reported lower earnings though maintaining a very good performance. ASHC reported net earnings of US$13.4 million in 1Q10, which represented a 21.4% decrease QoQ but also a significant improvement YoY.
Total income in 1Q09 reached $11.4 million, which reflects a 5.2% decline QoQ and a 72.6% increase YoY. The QoQ drop is due to lower interest income attributable to a lower volume of interest earning assets, lower fees for trading services and small losses on FX transactions.
Fee income reached US$2.2 million in 1Q10, which represents an 8.7% decline QoQ and a 67.9% increase YoY. As previously indicated, the QoQ decline is primarily attributable to lower fees for trading services. This is due to the fact that a tax reform was implemented in 2010 that changed a number of aspects and incorporated a capital gains tax on instruments sold by Peruvian issuers regardless of the investor’s country of residence. As such, the tax is applicable to both local and foreign investors. Subsequently, clients have considerably reduced their demand for this type of transaction, which has eaten away at the fees that Atlantic Security Bank normally charges for this service. Nevertheless, an increase in new business loans and the favorable valuation of funds under management has allowed the bank to maintain steady levels for placement and management fees.
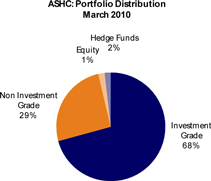
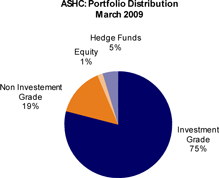
The process to set up provisions for the investment portfolio- which began in 2008 and continued at a somewhat slower pace in 2009- concluded in 1Q10. In this context, provision levels fell significantly due to considerable improvement in the international markets. This helped reverse unrealized losses and led to unrealized earnings of US$ 27.1 million in 1Q10. A significant portion of the investment portfolio remains concentrated in investment grade instruments (68%), which is evidence of the portfolio’s good risk profile.
21
Earnings on securities sales totaled US3.6 million, which represents a 12.1% decline QoQ and a 167% increase YoY.
The efficiency ratio went from 10.3% in 4Q09 to 11.9% in 1Q10. This was due to the fact that net profit in 4Q09 included the approximately US$5.5 million for reversals of excess provisions, which were reported as other income.
The total assets level reported decreases of 3.8% QoQ and 3.5% YoY, due partially to customers’ decisions to migrate from deposits to managed funds. This reflects clients’ renewed confidence in the markets and resurging interest in more profitable products.
Shareholders' equity fell 13.6% QoQ and increased 74.1% YoY. The quarterly variation is primarily attributable to declared dividends for US$49.8 million, which will be paid in May to CREDICORP Ltd. The YoY increase was related to the valuation of investment securities available for sale that reported an unrealized loss of US$ 46 million in 1Q09, which was reversed in 1Q10 and represented an unrealized gain of US$ 27 million.
Interest Earning Assets
The following table shows that interest earning assets totaled US$ 1.327 million, which represents a 3.7% decrease QoQ and 1.6% YoY. A significant portion of this decline in assets volume is attributable to our customers’ decision to migrate from deposits to ASCH structured products and the investment funds it offers and manages.
The most significant variation in interest earning assets is in the segment of Cash and Banks and Loans. This is due to the fact that the bank had US$ 400 million in deposits guaranteeing local loans at BCP until 4Q09, which were reclassified due to some uncertain tax treatment of such deposits and are now replaced by a loan booked at ASHC in favor of BCP.
Investments fell 2.7% QoQ as investments were liquidated to take advantage of market opportunities to generate high gains. On a YoY comparison, Investments increased 28.1%, reflecting the fact that prices began to recover in mid 2009.
| Interest Earning Assets* | Quarter | Change % | ||||||||||||||||||
| (US$ million) | 1Q10 | 4Q09 | 1Q09 | 1Q10 / 1Q09 | 1Q10 / 4Q09 | |||||||||||||||
| Due from banks | 77 | 483 | 588 | -86.9 | % | -84.1 | % | |||||||||||||
| Loans | 508 | 132 | 181 | 179.9 | % | 283.9 | % | |||||||||||||
| Investments | 742 | 763 | 579 | 28.1 | % | -2.7 | % | |||||||||||||
| Total interest-earning assets | 1,327 | 1,377 | 1,348 | -1.6 | % | -3.7 | % | |||||||||||||
(*) Excludes investments in equities and mutual funds.
A significant portion (68%) of the portfolio is comprised of investment grade instruments, which is in line with a prudent policy to concentrate investments in instruments with a good risk profile. It is however worth explaining that the growth of the non-investment grade portfolio results from the reclassification of about US$ 30 million of CMO’s previously registered as investment grade, and the investment of additional US$ 40 million in high yield instruments.
22
 |  |
Asset Administration
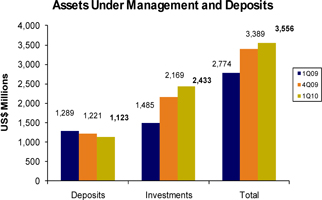
The total of deposits and AuM include investments such as proprietary mutual funds and financial instruments in custody increased 5% QoQ and 28% YoY
AuM grew 12% QoQ, continuing the upward trend that began two quarters ago due to overall market improvements and the fact that clients are regaining confidence in the markets. On the other hand, the YoY increase is attributable to a rebound in asset prices that began in 2Q09.
In 1Q10, funds continued to migrate from deposits to investment products as clients sought higher returns.
23
V. Prima AFP
PRIMA’S commercial activity continued to focus on new captures and limiting the number of transfers. In this context, the number of new affiliations during the first quarter of the year was higher than that achieved in the fourth quarter of 2009 while transfers remained stable.
In terms of collections, PRIMA continued to lead the system in 2010 with a 31.8% share. PRIMA also led the competition in terms of voluntary fund management and currently accounts for 42.4% of the system’s funds under management.
Quarterly main indicators and market share
PRIMA 1Q10 | System 1Q10 | Share 1Q10 % | PRIMA 4Q09 | System 4Q09 | Share 4Q09 % | |||||||||||||||||||
| Affiliates | 1,088,878 | 4,500,531 | 24.2 | % | 1,078,317 | 4,458,045 | 24.2 | % | ||||||||||||||||
| New affiliations (1) | 12,093 | 48,522 | 24.9 | % | 10,612 | 47,002 | 22.6 | % | ||||||||||||||||
| Funds under management US$ mm | 7,722 | 25,086 | 30.8 | % | 7,324 | 23,967 | 30.6 | % | ||||||||||||||||
| Collections US$ mm (1) | 136 | 428 | 31.8 | % | 132 | 412 | 32.2 | % | ||||||||||||||||
| Voluntary Contributions US$ mm (2) | 85 | 200 | 42.4 | % | 86 | 199 | 43.1 | % | ||||||||||||||||
| RAM US$ mm (3) | 395 | 1,231 | 32.1 | % | 374 | 1,174 | 31.8 | % | ||||||||||||||||
Source: Superintendencia de Banca, Seguros y AFP
(1) Accumulated to the Quarter.
(2) Available data as of February 2010.
(3) PRIMA AFP Estimates: average of aggregated income during the last 4 months excluding special collections and voluntary contributions fees.
Commercial Results
During the first quarter of the year, the number of affiliations and transfers was around 15,200. This figure reflects a QoQ increase and translates into 12,093 affiliations and approximately 3,100 transfers. In keeping with PRIMA’s commercial policy, the number of transfers was flat while the number of affiliations grew 14%. In terms of RAM, the net result of transfers and affiliations during the quarter produced a positive net balance for the company. It is also important to emphasize that thus far this year, the company’s RAM has been higher than current market averages. This has resulted in an increase in the company’s market share, which rose to 32.1% and enabled PRIMA to maintain a firm lead.
At the end of March 2010, PRIMA’s funds under management totaled US$ 7,722 million, representing 30.8% of the total managed by the private pension system. With this figure, PRIMA ranks second in terms of market share. It is important to note that the gap between first and second place continues to close and the differential in market share was a mere 0.3% at the end of March.
Investments
During the first months of 2010, the financial markets experienced a slight setback that was subsequently reflected in managed funds. Nevertheless, this trend reverted in March and 12-month profitability levels (March 2010/March 2009) were 12.42%, 31.13% and 51.19% for funds 1, 2 and 3 respectively.
Pension fund investments are long-term by nature. With this in mind, if we look at the 3-year period from March 2010 to March 2007, PRIMA’s accumulated profitability was 16.40%, 19.90% y 12.85% for funds 1, 2, and 3 respectively. Compared with the rest of the system, the company is ranked first in fund 2, second in fund 1 and third in fund 3. If we extend the period of analysis by stretching back to when operations began in March 2010, the private pension system has recorded a nominal annualized yield of 13.50% on average.
24
The following table shows the structure of Prima’s funds under management:
| Funds under management as of March 2010 | ||||||||||||||||
| Mar 10 | Share % | Dec 09 | Share % | |||||||||||||
| Fund 1 | 631 | 8.2 | % | 580 | 7.9 | % | ||||||||||
| Fund 2 | 5,154 | 66.7 | % | 4,933 | 67.4 | % | ||||||||||
| Fund 3 | 1,938 | 25.1 | % | 1,810 | 24.7 | % | ||||||||||
| Total US$ mm | 7,722 | 100 | % | 7,324 | 100 | % | ||||||||||
| Source: Superintendencia de Banca, Seguros y AFP | ||||||||||||||||
Financial Results
Income
In the first quarter of 2010, PRIMA’s income was US$ 20.5 million, representing 2.9% growth QoQ. This is attributable to an increase in the RAM level due to reactivation in the local economy and, to a lesser degree, to the fact that the local currency appreciated during the period (1.7%).
If we compare 1Q10’s income with that of 1Q09 (US$ 21.2 million), a 3.2% decline is evident. Nevertheless, this result is a combined effect of (i) lower income in January 2010 due to the government’s decision to exonerate additional salaries (paid in July and December) from pension fund contributions until December 2010, (ii) which was mitigated by an exchange rate appreciation in 1Q10 that offset the impact of lower income.
As previously mentioned, the company continued to lead the system in terms of RAM, which reflects the aggregate salaries of system affiliates and represents the basis for each company’s income.
| Estimate of base to calculate earnings - US$ mm | ||||||||||||
| PRIMA - Mar 2010 | System - Mar 2010 | Share % | ||||||||||
| Income (1) | 6.9 | 23.3 | 29.6 | % | ||||||||
| Administrative Fees | 1.75 | % | n.a. | |||||||||
| RAM base (2) | 395 | 1,231 | 32.1 | % | ||||||||
PRIMA AFP estimates. In accordance to local public infomation, (CONASEV) (1) Average income from the last four months, excluding special collections and voluntary contribution fees (2) RAM: average of aggregated income during the last 4 months excluding special collections and voluntary contributions fees. | ||||||||||||
Expenditures
During the first quarter of 2010, PRIMA’s operating expenses fell in comparison to the previous quarter due to lower expenses for advertising and marketing as well as lower provisions for administrative personnel.
At the operating level, a 25% QoQ increase in operating income is evident, which is attributable to higher income and lower expenses. The calculation of operating income includes charges for amortization of intangible assets (due to the merger with Unión Vida) as well as depreciation and amortization of real estate, equipment and systems. The total expense for depreciation and amortization this quarter was US$ 2.4 million.
Local currency strengthened throughout the quarter, which generated an exchange rate effect and a deferred liability adjustment of -US$ 220 thousand. PRIMA’s net income, after discounting provisions and employee profit sharing, was US$ 5.9 million. This represents a 40.8% increase QoQ.
At the end of March 2010, PRIMA reported US$ 245.9 million in assets, US$ 151.4 million in shareholder’s equity and US$ 94.5 million in liabilities.
25
The following table contains a summary of the main financial indicators:
| Change % | ||||||||||||||||||||
| Main financial indicators (US$ thousand) (1) | 1Q10 | 4Q09 | 1Q09 | 1Q10/1Q09 | 1Q10/4Q09 | |||||||||||||||
| Income from commissions | 20,494 | 19,904 | 21,187 | -3 | % | 3.0 | % | |||||||||||||
| Administrative and sale expenses | (8,826 | ) | (10,181 | ) | (8,549 | ) | 3 | % | -13.3 | % | ||||||||||
| Depreciation and amortization | (2,467 | ) | (2,363 | ) | (2,276 | ) | 8 | % | 4.4 | % | ||||||||||
| Net operating income | 9,201 | 7,360 | 10,363 | -11 | % | 25.0 | % | |||||||||||||
| Other income and expenses, net | (629 | ) | (906 | ) | (479 | ) | 31 | % | -30.5 | % | ||||||||||
| Employee profit sharing and Income tax | (2,405 | ) | (2,150 | ) | (3,544 | ) | -32 | % | 11.9 | % | ||||||||||
| Net income before translation results | 6,166 | 4,304 | 6,339 | -3 | % | 43.3 | % | |||||||||||||
| Translations results and deferred liabilities | (220 | ) | (82 | ) | (93 | ) | 137 | % | 167.8 | % | ||||||||||
| Net income | 5,946 | 4,222 | 6,246 | -5 | % | 40.8 | % | |||||||||||||
| Total assets | 245,996 | 249,771 | 224,720 | 9 | % | -1.5 | % | |||||||||||||
| Total liabilities | 94,573 | 84,543 | 90,900 | 4 | % | 11.9 | % | |||||||||||||
| Equity | 151,423 | 165,228 | 133,820 | 13 | % | -8.4 | % | |||||||||||||
| (1) IFRS | ||||||||||||||||||||
26
VI. El Pacífico Peruano Suiza and Subsidiaries
Grupo Pacifico
Pacifico Insurance Group, which is comprised of general insurance (PPS), life insurance (PV) and health insurance (EPS), obtained net income of US$ 12.1 million in 1Q10. This figure reveals a drop from the US$16.3 million obtained in 4Q09, which is attributable to: i) a decrease in the technical result, which went from US$28.9 million to US$17.2 million and ii) higher provisions for income tax due to the exchange rate differential in the life insurance business (PV) in 4Q09, which reduced taxes by approximately US$3.9 million. The aforementioned was offset by: i) higher net financial income, which increased from US$ 18.9 million to US$ 21.6 million and ii) lower general expenses, which went from US$ 31.4 million to US$ 22.9 million. In comparison to 1Q09, net income increased 75.7% due to improved technical results (US$ 17.2 million in comparison with US$ 13.4 million in 1Q09) and higher net financial income (US$ 21.6 million in comparison to US$ 16.0 million in 1Q09).
After a year of an unusually low casualty-rate, the technical result obtained in 1Q10 totaled US$ 17.1 million, which is 40.7% lower than the US$28.9 million obtained in 4Q09. This is due primarily to: i) comparatively higher claims in 1Q10 in general insurance (PPS), which reported 54.4% claims ratio versus an unusually low 35.6% in 4Q09, due to a release of provisions on claims from previous quarters in the Technical Lines and Transportation and ii) an increase in life insurance claims (PV), which registered 75.4% versus 69.6% in 4Q09; and iii) a reduction in the net earned premiums in general insurance (PPS) due to a drop in the number of accounts. This is attributable to an increase in prices to align them to the associated risk and a more selective risk management approach to improve portfolio quality.
Higher financial income was also a plus in comparison to 4Q09, and was due to higher interest and dividends as well as higher earnings on securities sales.
General expenses fell with regard to 4Q09, primarily due to lower provisions for uncollectible premiums and reinsurance. It is important to point out that the YoY increase is due to a large extent to the 10.1% appreciation in the Nuevo Sol against the US Dollar, given that almost all general expenses are denominated in soles.
In this context, the contribution in Credicorp totaled US$ 8.5 million in 1Q10, which represents a 31% decrease QoQ.
| US$ thousands | Net Earnings * | Adjustment for | Total Contribution | |||||||||||||||||||||
| Period | PPS | PV | EPS | PGA | Consolidation | to BAP | ||||||||||||||||||
| 1Q09 | 1,852 | 4,281 | 805 | 6,884 | (1,654 | ) | 5,230 | |||||||||||||||||
| 2Q09 | 5,730 | 5,347 | 1,684 | 12,748 | (3,063 | ) | 9,685 | |||||||||||||||||
| 3Q09 | 9,530 | 4,263 | (540 | ) | 13,277 | (3,189 | ) | 10,088 | ||||||||||||||||
| 4Q09 | 9,093 | 6,495 | 783 | 16,283 | (3,911 | ) | 12,372 | |||||||||||||||||
| 1Q10 | 5,774 | 4,810 | 1,673 | 12,095 | (3,603 | ) | 8,492 | |||||||||||||||||
| Var % 1Q10 / 4Q09 | -36 | % | -26 | % | 114 | % | -26 | % | n.a. | -31 | % | |||||||||||||
| Var % 1Q10 / 1Q09 | 212 | % | 12 | % | 108 | % | 76 | % | n.a. | 62 | % | |||||||||||||
| * Including minority interest | ||||||||||||||||||||||||
Pacífico General Insurance (PPS)
PPS’s Net income in 1Q10 reached US$ 5.8 million, which represents a drop compared to earnings of US$ 9.1 million in 4Q09, though a recovery compared to the US$1.9 million reported in 1Q09. This QoQ drop is due primarily to a lower technical result, which is in turn attributable to a release of provisions from previous periods in 4Q09 which improves the technical results for such Q and makes the comparison of real performance not very meaningful.
27
The recovery in PPS’s business is more evident comparing technical results with those a year ago, where the strong increase responds to : i) lower claims, which fell from 65.3% to 54.4% and ii) higher financial income due primarily to the sale of properties and securities.
Technical Results by Business Unit
1Q10 | 4Q09 | 1Q09 | ||||||||||||||||||||||||||||||||||||||||||||||
US$ millon | Vehicles & SOAT | Medical assistance | P&C | TOTAL PPS | Vehicles & SOAT | Medical assistance | P&C | TOTAL PPS | Vehicles & SOAT | Medical assistance | P&C | TOTAL PPS | ||||||||||||||||||||||||||||||||||||
| Net Premiums Earned | 19.8 | 14.7 | 10.6 | 45.1 | 20.4 | 15.0 | 17.0 | 52.4 | 18.6 | 11.7 | 13.7 | 44.1 | ||||||||||||||||||||||||||||||||||||
| Technical Results | 7.5 | 3.4 | 2.1 | 13.0 | 9.3 | 4.4 | 11.7 | 25.4 | 1.6 | 1.2 | 5.8 | 8.7 | ||||||||||||||||||||||||||||||||||||
| Net claims / Earned Net Premiums | 39.6 | % | 68.4 | % | 62.6 | % | 54.4 | % | 31.3 | % | 62.2 | % | 17.4 | % | 35.6 | % | 72.1 | % | 79.9 | % | 43.7 | % | 65.3 | % | ||||||||||||||||||||||||
| Technical Results / Earned net Premiums | 38.0 | % | 23.2 | % | 19.4 | % | 28.8 | % | 45.7 | % | 29.3 | % | 68.7 | % | 48.5 | % | 8.4 | % | 10.6 | % | 42.6 | % | 19.6 | % | ||||||||||||||||||||||||
· The technical result in Vehicle Insurance was US$ 7.5 million in 1Q10, which indicates a decrease with regard to the US$9.3 million obtained in 4Q09 due to a decrease in the direct premium and an increase in this line’s claims, which went from 31.3% in 4Q09 to 39.6% in 1Q10. It is important to point out that this line’s claims rate is significantly lower than the market’s, which is approximately 47%1.
· In terms of Medical Assistance, in 1Q10, the technical result was US$ 3.4 million, which represents a decline with regard to the US$ 4.4 million reported in 4Q09, when the line’s claims rate, which was 62.2%, fell considerably due to a release of IBNR reserves stemming from a drop in claims. With regard to 1Q09, net premiums earned increased 26% while the technical result over premiums earned went from 10.6% in 1Q09 to 23.2% in 1Q10, thanks to more efficient claims management and adjustments in premiums and conditions for certain products.
· Property and Casualty lines reported a technical result of US$2.1 million, which represents a significant decrease with regard to the US$ 11.7 million registered in 4Q09 and the US$ 5.8 million obtained in 1Q09. This is due to a decrease in net premiums earned and a higher claims level. The reduction in net premiums earned was primarily attributable to the US$2.8 million in reinstatement premiums paid on reinsurance contracts after railway lines in Cuzco were damaged by rains and mudslides in 1Q10. Net claims incurred increased to 62.6% in comparison with the 17.4% reported in 4Q09 and the 43.7% registered in 1Q09. This was due primarily to an increase in net claims in the Fire line due to a severe claim as well as lower net premiums earned stemming from the premium reinstatement previously mentioned. These effects were mitigated by an improvement in the Transportation line after stolen property was recovered and a reversal of provisions for claims from previous periods. It is also necessary to point out that the 17.4% claims rate reported in 4Q09 is atypical and is attributable to release of provisions for claims in prior quarters, primarily in the technical and transportation lines. In this context, the technical result in 1Q10 reached US$3.7 million in 1Q10.
In summary, with regard to 1Q10’s result in general insurance (PPS), it is important to mention the following: (i) income for net insurance premiums totaled US$ 45.1 million while (ii) the operation’s total costs reached US$ 44.3 million. These results lead to a (iii) combined ratio this quarter of 93.8%, of which 54.4 points correspond to costs or expenses for net claims, 16.8 points to business acquisition costs and the remaining 27.0 points to general or administrative expenses.
Pacífico Vida (PV)
Pacifico Vida obtained income, excluding minority interest, of US$ 7.8 million in 4Q09. This represents a decline with regard to the US$10.5 million obtained in 4Q09, which reflected an increase attributable to an income tax refund.
28
The technical result of US$ -0.8 million in 1Q10 is lower than the US$ 0.7 million in earnings obtained in 4Q09. This is due primarily to higher claims in the first quarter of the year, which increased from 69.9% in 4Q09 to 75.4% in 1Q10.
Pacífico Vida
(US$ MM)
| Products | Total Premiums | Change % | ||||||||||||||||||
| (US$ millions) | 1Q10 | 4Q09 | 1Q09 | 1Q09 | 4Q09 | |||||||||||||||
| Individual life | 13.7 | 13.2 | 11.6 | 13.7 | % | 3.3 | % | |||||||||||||
| Individual annuity | 14.2 | 9.9 | 10.6 | -6.9 | % | 43.6 | % | |||||||||||||
| Disability & survivor (Pension) | 10.7 | 8.8 | 7.3 | 20.1 | % | 21.5 | % | |||||||||||||
| Credit Life | 6.6 | 6.5 | 5.3 | 24.2 | % | 0.8 | % | |||||||||||||
| Personal accidents | 2.9 | 2.8 | 2.6 | 7.6 | % | 2.1 | % | |||||||||||||
| Group life (Law) | 2.8 | 2.1 | 2.4 | -12.2 | % | 32.6 | % | |||||||||||||
| Group life | 4.1 | 3.1 | 3.4 | -7.3 | % | 29.2 | % | |||||||||||||
| Limited workers compensation | 2.7 | 2.8 | 2.7 | 4.5 | % | -4.7 | % | |||||||||||||
| TOTAL | 57.6 | 49.3 | 45.9 | 7.4 | % | 16.7 | % | |||||||||||||
On the other hand, higher net financial income this quarter of US$ 14.8 million, compared with the US$12.6 million obtained in 4Q09, followed an increase in interest and dividend income.
In line with Credicorp’s generalized efforts to improve efficiencies and curb unnecessary costs, general expenses in 1Q10 fell 1.4% with regard to 4Q09 and totaled US$8.1 million.
After deducting minority interest for US$2.9 million corresponding to Alico, net earnings in the life segment totaled US$ 4.8 million in 1Q10.
Pacífico Salud (EPS)
During 1T10, Pacífico Salud reported a technical result of US$ 5.0 million, which is far higher than the US$ 3.0 million obtained in 4Q09 and the US$3.2 million reported in 1Q09. In 1Q10, the figure for net premiums earned topped 1Q09’s result by US$ 4.9 million, which represents a 17% increase. Consequently, net income in 1Q10 reached US$ 1.7 million, which is US$ 0.9 million higher than last quarter’s result and also tops the US$ 0.8 million recorded in 1Q09.
As was the case with PPS’s Medical Assistance business, the reduction in net claims incurred was fundamental. This indicator went from 82.5% in 1Q09 to 78.8% in 1Q10. These results show that the business continues to experience an upward trend that is grounded in technical premium adjustments, on-going negotiation with healthcare providers and efficient claims management.
29
VII. Economic Outlook
Economic Activity
It is estimated that the economy grew at an annual rate of 4.9% in 1Q10, which is the highest rate recorded in the last five quarters. Nevertheless, seasonally adjusted results appear to indicate mixed performance by sectors. As such, production levels have remained erratic (1% QoQ in 1Q10 vs. 3.9% QoQ in 4Q09), registering a 10% increase over the floor registered during the crisis.
A sector-by-sector analysis shows that the economy’s dynamism is not homogenous. For example, construction grew 13.8% in 1Q10 with regard to 1Q09 and commerce +7.3%, while fishing fell 13.6% and mining a mere -1.9%. It is important to point out that recovery in the manufacturing sector, which experienced a 7.7% decline in 2009, grew 4.9% YoY in 1Q09. This result was driven primarily by non-primary segments, which suggests that demand is recovering.
In terms of spending types, projections indicate that growth in 1Q10 was driven by both private investment and private consumption. This scenario is similar to that seen over the last few years with the exception of 2009. All other GDP components by spending type have also evolved positively.
The outlook for year-end indicates that private spending components will continue to recover their dynamism, in particular investment, which appears to be going through a good spell. The public sector will continue to play an important role in driving growth, particularly considering that presidential elections are set for next year and regional and local elections are scheduled to take place soon.
Private investment will grow, particularly in the mining and hydrocarbon sector and construction will expand more rapidly due to activity in the interior as commercial chains continue to penetrate the provinces.
In terms of productive sectors, construction is expected to remain the most dynamic due to stimulation from public infrastructure projects and private efforts. The gradual recovery of the world economy is expected to help manufacturing revert the decline experienced in 2009. In this context, the economy should grow 4.9% during 2010. It is important to note that this forecast may be revised up to 6.0% depending on the dynamism of private investment.
Gross Domestic Product and Internal Demand
(Annualized percentage variation)
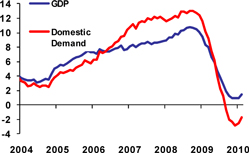
Source: INEI, BCR
External Sector
Paradoxically, while international trade dropped drastically in 2009, Peru’s trade balance maintained a surplus throughout the majority of 2009. This is due to the fact that the most significant impact was felt in imports, which were affected by a contraction in domestic demand. In this context, imports grew 19.3% YoY in 1Q10 due to strong growth in input imports (+49.8%), attributable to an increase in international prices. Nevertheless, imports of capital goods contracted 9.2% YoY in 1Q10.
30
Estimates indicate that exports in 1Q10 grew 47.7% YoY. This growth was led by traditional products as non-traditional products, which are generally sent to markets that have suffered considerably from the international recession, have felt the brunt of the decline.
In a still uncertain international context, emerging countries have demonstrated solid fundamentals. In this scenario, Peru’s international reserves at the end of 1Q10 totaled US$ 35,269 million, which represents a US$ 2,134 million increase over the figure at year-end 2009. In 2010, if the global economy consolidates its recovery, Peru will continue to receive positive net currency flows because it is seen as possessing some of the best macroeconomic fundamentals in the region. This process will be particularly evident in the first half of the year.
Exports and Imports
(3 month moving average annual % var.)
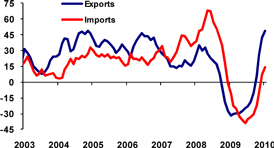
Source: BCR
Prices and Exchange Rate
At the end of 1Q10, annual inflation was 0.76%, which although higher than the figure at end of 2009 (0.25%), is in line with expectations. Core inflation has continued a downward trend that began in the early months of last year and was 1.77% in annualized terms. The evolution of inflation is consistent with an outlook in which wholesale prices, particularly for imported products, have continued to recover from the significant declines recorded last year. Nevertheless, upward pressures are moderate due to the fact that domestic demand remains slow and the existence of the fund to stabilize fuel prices.
Accumulated inflation in the first three months of the year, which recorded an annualized rate of 3.7%, is thought to be seasonally high (due to lower agricultural production) and will more than likely be moderate the rest of the year. Due to these developments, and in light of the fact that inflationary expectations have remained stable, it is highly likely that this year’s inflation will be very close to the Central Bank’s target goal (2.0% +/- 1%).
Although the dollar has strengthened internationally due to the fiscal crisis in Europe, it is important to point out the downward pressures on the exchange rate continue to be felt not only in Peru but also across emerging markets. In this context, the exchange rate at the end of 1Q10 was S/. 2.84, appreciating 1.7% with regard to figures at the end of 2009 (S/. 2.89). Downward pressures on the exchange rate have accentuated but the Central Bank has intervened to control appreciation and has mitigated corresponding effects. Thus far this year, the monetary authority has acquired more than US$ 2,650 million, which is more than twice the amount purchased in all of 2009 (US$ 1,256 million).
31
Consumer Price Index Exchange Rate
(Annual percentage variation) (Nuevos Soles for US$)
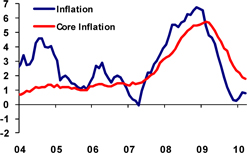 Source: INEI, BCR | 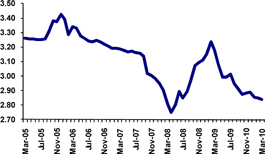 |
Fiscal Sector
In the month of February, the central government’s tax income increased at an annual rate of 15.6%, which consolidates the upward trend that began three months ago and in line with economic recovery. Nevertheless, the average rate over the last twelve months is still negative with regard to Income Tax and Value Added Tax.
Income may have recovered but it is unlikely that the fiscal deficit will remain moderate in 2010 (although financing the deficit poses no fiscal problems). In fact, the government recently exchanged debt instruments whose maturity is between 2012 and 2017 for a bond that matures in 2033. Keeping in mind that we are in a pre-electoral year and the fact that regional and local elections will also be held, the aforementioned indicates that the country’s fiscal accounts are solid. This year, the deficit should be equivalent to 1.6% of GDP, which is even lower than the figure recorded in 2009. This should occur despite continuous increases in public spending, particularly in capital spending, which, as a percentage of GDP, has recovered levels that haven’t been seen since the mid 1990s.
Tax Income of the Central Government
(Annualized in Nuevos Soles billions)
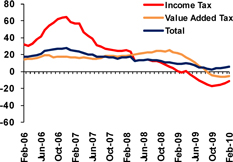
Source: Sunat
32
Banking System
According to information from the Central Bank, as of March 15th, loans in depository entities denominated in dollars grew 16.3% in annual terms (13.5% YoY at the end of 2009), which is in line with economic recovery and the corresponding lag in credit. In terms of the banking system as of February, SME loans were the most dynamic (growing 29.1% YoY) followed by mortgage loans (+21.6%). The average loan has grown 14.8% YoY and commercial loans were the least dynamic (+12.0%).
To the end of February, deposits grew at an annual rate of 17.2% (expressed in dollars), led by demand deposits (+27.8%) and followed by saving deposits (+25.6%). It is important to point out that time deposits are recovering and have demonstrated 8.6% YoY growth.
Loan dollarization in the banking system has shown a downward trend and reached 51.8% at the end of 1T10 (52.4% at the end of 2009 and 57.5% at the end of 2008) while deposits dollarization closed the quarter at 50.8% (56.1% at the end of 2009, 58.2% at the end of 2008). At the end of 1Q10, total savings in Peruvian financial system (banking deposits, Mutual Funds, collections of AFPs) demonstrated a dollarization level of 29.0% (32.3% at the end of 2009).
Finally, interest rates have remained low in a context in which monetary policy rates have remained stable in both the USA and Peru. Despite this, monetary stimulus is expected to be reverted anytime now. In this scenario, the TAMN at the end of 1Q10 was 19.5% (19.9% at the end of 2009 and 23.0% at the end of 2008) while the TAMEX was 8.3% (10.5% at the end of 2008 and 8.6% at the end of 2009). The TIPMEX fell from 0.9% at the end of 2009 to 0.8% at the end of 1Q10 (1.9% at the end of 2008) while the TIPMN went from 1.6% at the end of 2009 to 1.4% at the end of 1Q10 (3.8% at the end of 2008).
Main Financial Indicators
| 2007 | 2008 | 2009 | ||||||||||||||||||||||||||||||||||||||||||
Year | IQ | IIQ | IIIQ | IVQ | Year | IQ | IIQ | IIIQ | IVQ | Year | ||||||||||||||||||||||||||||||||||
| GDP (US$ MM) | 107,504 | 30,273 | 34,744 | 32,531 | 30,096 | 127,643 | 27,914 | 31,927 | 32,010 | 35,302 | 127,153 | |||||||||||||||||||||||||||||||||
| Real GDP (var. %) | 8.9 | 10.3 | 11.7 | 10.9 | 6.5 | 9.8 | 1.9 | -1.2 | -0.6 | 3.4 | 0.9 | |||||||||||||||||||||||||||||||||
| GDP per-capita (US$) | 3,873 | 4,331 | 4,956 | 4,612 | 4,229 | 4,532 | 3,888 | 4,407 | 4,379 | 4,786 | 4,365 | |||||||||||||||||||||||||||||||||
| Domestic demand (var. %) | 11.8 | 11.7 | 14.3 | 13.4 | 9.1 | 12.1 | -0.8 | -5.8 | -5.0 | 0.4 | -2.9 | |||||||||||||||||||||||||||||||||
| Consumption (var. %) | 8.3 | 8.4 | 9.3 | 9.2 | 8.0 | 8.7 | 4.1 | 1.6 | 1.0 | 2.8 | 2.4 | |||||||||||||||||||||||||||||||||
| Private investment (var. %) | 22.6 | 24.1 | 37.2 | 31.9 | 21.4 | 28.3 | 4.3 | -16.0 | -14.6 | -5.9 | -8.6 | |||||||||||||||||||||||||||||||||
| CPI (annual change, %) | 3.9 | 5.5 | 5.7 | 6.2 | 6.7 | 6.7 | 4.8 | 3.1 | 1.2 | 0.3 | 0.3 | |||||||||||||||||||||||||||||||||
| Exchange rate, eop (S/. per US$) | 3.00 | 2.74 | 2.97 | 2.98 | 3.14 | 3.14 | 3.16 | 3.01 | 2.88 | 2.89 | 2.89 | |||||||||||||||||||||||||||||||||
| Devaluation (annual change, %) | -6.1 | -13.8 | -6.4 | -3.6 | 4.7 | 4.7 | 15.2 | 1.5 | -3.1 | -8.0 | -8.0 | |||||||||||||||||||||||||||||||||
| Exchange rate, average (S/. per US$) | 3.12 | 2.89 | 2.81 | 2.90 | 3.09 | 2.92 | 3.18 | 3.02 | 2.96 | 2.89 | 3.01 | |||||||||||||||||||||||||||||||||
| Non-financial Public Sector (% of GDP) | 3.1 | 4.3 | 5.4 | 1.4 | -2.7 | 2.1 | 2.6 | 1.8 | -3.2 | -8.2 | -1.9 | |||||||||||||||||||||||||||||||||
| Central Gonvernment current revenues (% of GPD) | 18.1 | 18.0 | 19.5 | 18.4 | 16.9 | 18.2 | 16.5 | 16.7 | 15.3 | 15.2 | 15.9 | |||||||||||||||||||||||||||||||||
| Tax Income (% of GDP) | 15.6 | 15.5 | 16.5 | 15.7 | 14.8 | 15.6 | 14.6 | 14.1 | 13.0 | 13.4 | 13.8 | |||||||||||||||||||||||||||||||||
| Non Tax Income (% of GDP) | 2.5 | 2.5 | 3.1 | 2.7 | 2.1 | 2.6 | 1.9 | 2.6 | 2.2 | 1.8 | 2.1 | |||||||||||||||||||||||||||||||||
| Current expenditures (% of GDP) | 12.6 | 10.4 | 10.6 | 16.1 | 12.3 | 12.4 | 11.8 | 10.7 | 14.8 | 13.5 | 12.7 | |||||||||||||||||||||||||||||||||
| Capital expenditures (% of GDPI) | 2.1 | 1.1 | 1.7 | 2.5 | 4.2 | 2.4 | 1.9 | 3.8 | 3.6 | 5.9 | 3.9 | |||||||||||||||||||||||||||||||||
| Trade Balance (US$ MM) | 8,287 | 1,505 | 920 | 838 | -173 | 3,090 | 513 | 1,335 | 1,838 | 2,188 | 5,873 | |||||||||||||||||||||||||||||||||
| Exports (US$ MM) | 27,882 | 7,771 | 8,470 | 8,814 | 6,474 | 31,529 | 5,396 | 6,161 | 7,169 | 8,159 | 26,885 | |||||||||||||||||||||||||||||||||
| Imports (US$ MM) | 19,595 | 6,265 | 7,550 | 7,976 | 6,648 | 28,439 | 4,883 | 4,827 | 5,330 | 5,971 | 21,011 | |||||||||||||||||||||||||||||||||
| Current Account Balance (US$ MM) | 1,220 | -969 | -1,720 | -1,105 | -929 | -4,723 | -391 | 106 | 264 | 267 | 247 | |||||||||||||||||||||||||||||||||
| Current Account Balance (% of GDP) | 1.1 | -3.2 | -5.0 | -3.4 | -3.1 | -3.7 | -1.4 | 0.3 | 0.8 | 0.8 | 0.2 | |||||||||||||||||||||||||||||||||
Source: BCR, INEI, Estimated by BCP
33
Company Description:
Credicorp Ltd. (NYSE: BAP) is the leading financial services holding company in Peru. It primarily operates via its four principal Subsidiaries: Banco de Credito del Peru (BCP), Atlantic Security Holding Corporation (ASHC), El Pacífico-Peruano Suiza Compañía de Seguros y Reaseguros (PPS) and Grupo Credito. Credicorp is engaged principally in commercial banking (including trade finance, corporate finance and leasing services), insurance (including commercial property, transportation and marine hull, automobile, life, health and pension fund underwriting insurance) and investment banking (including brokerage services, asset management, trust, custody and securitization services, trading and investment). BCP is the Company's primary subsidiary.
Safe Harbor for Forward-Looking Statements
This material includes “forward-looking statements” within the meaning of Section 21E of the Securities Exchange Act of 1934. All statements other than statements of historical information provided herein are forward-looking and may contain information about financial results, economic conditions, trends and known uncertainties.
The Company cautions readers that actual results could differ materially from those expected by the Company, depending on the outcome of certain factors, including, without limitation: (1) adverse changes in the Peruvian economy with respect to the rates of inflation, economic growth, currency devaluation, and other factors, (2) adverse changes in the Peruvian political situation, including, without limitation, the reversal of market-oriented reforms and economic recovery measures, or the failure of such measures and reforms to achieve their goals, and (3) adverse changes in the markets in which the Company operates, including increased competition, decreased demand for financial services, and other factors. Readers are cautioned not to place undue reliance on these forward-looking statements, which speak only as of the date hereof.
The Company undertakes no obligation to release publicly the result of any revisions to these forward-looking statements which may be made to reflect events or circumstances after the date hereof, including, without limitation, changes in the Company’s business strategy or planned capital expenditures, or to reflect the occurrence of unanticipated events.
34
CREDICORP LTD. AND SUBSIDIARIES
CONSOLIDATED BALANCE SHEETS
(In US$ thousands, IFRS)
| As of | Change % | |||||||||||||||||||
Mar 10 | Dec 09 | Mar 09 | Mar 10 / Mar 09 | Mar 10 / Dec 09 | ||||||||||||||||
| Assets | ||||||||||||||||||||
| Cash and due from banks | ||||||||||||||||||||
| Non-interest bearing | 959,387 | 938,486 | 920,392 | 4.2 | % | 2.2 | % | |||||||||||||
| Interest bearing | 2,508,872 | 2,898,172 | 3,029,996 | -17.2 | % | -13.4 | % | |||||||||||||
| Total cash and due from banks | 3,468,259 | 3,836,658 | 3,950,387 | -12.2 | % | -9.6 | % | |||||||||||||
| Marketable securities, net | 109,326 | 70,774 | 29,973 | 264.7 | % | 54.5 | % | |||||||||||||
| Loans | 11,922,859 | 11,585,635 | 10,119,759 | 17.8 | % | 2.9 | % | |||||||||||||
| Current | 11,707,108 | 11,401,113 | 10,002,756 | 17.0 | % | 2.7 | % | |||||||||||||
| Past Due | 215,750 | 184,523 | 117,003 | 84.4 | % | 16.9 | % | |||||||||||||
| Less - Reserve for possible loan losses | (381,206 | ) | (354,355 | ) | (240,267 | ) | 58.7 | % | 7.6 | % | ||||||||||
| Loans, net | 11,541,653 | 11,231,281 | 9,879,492 | 16.8 | % | 2.8 | % | |||||||||||||
| Investments securities available for sale | 6,121,314 | 5,079,606 | 5,266,532 | 16.2 | % | 20.5 | % | |||||||||||||
| Reinsurance assets | 147,719 | 137,098 | 184,579 | -20.0 | % | 7.7 | % | |||||||||||||
| Premiums and other policyholder receivables | 98,527 | 121,338 | 98,693 | -0.2 | % | -18.8 | % | |||||||||||||
| Property, plant and equipment, net | 347,185 | 338,535 | 326,019 | 6.5 | % | 2.6 | % | |||||||||||||
| Due from customers on acceptances | 78,795 | 96,423 | 202,563 | -61.1 | % | -18.3 | % | |||||||||||||
| Other assets | 1,568,695 | 1,116,395 | 1,133,882 | 38.3 | % | 40.5 | % | |||||||||||||
| Total Assets | 23,481,472 | 22,028,107 | 21,072,120 | 11.4 | % | 6.6 | % | |||||||||||||
| Liabilities and shareholders' equity | ||||||||||||||||||||
| Deposits and Obligations | ||||||||||||||||||||
| Non-interest bearing | 3,820,384 | 3,297,995 | 4,213,305 | -9.3 | % | 15.8 | % | |||||||||||||
| Interest bearing | 10,986,276 | 10,793,833 | 9,114,489 | 20.5 | % | 1.8 | % | |||||||||||||
| Total deposits and Obligations | 14,806,660 | 14,091,828 | 13,327,794 | 11.1 | % | 5.1 | % | |||||||||||||
| Due to banks and correspondents | 2,557,479 | 2,256,659 | 2,768,068 | -7.6 | % | 13.3 | % | |||||||||||||
| Acceptances outstanding | 78,795 | 96,423 | 202,563 | -61.1 | % | -18.3 | % | |||||||||||||
| Reserves for property and casualty claims | 916,970 | 878,767 | 875,335 | 4.8 | % | 4.3 | % | |||||||||||||
| Reserve for unearned premiums | 138,553 | 140,024 | 137,985 | 0.4 | % | -1.1 | % | |||||||||||||
| Reinsurance payable | 33,999 | 48,009 | 39,722 | -14.4 | % | -29.2 | % | |||||||||||||
| Bonds and subordinated debt | 1,279,789 | 1,287,022 | 866,978 | 47.6 | % | -0.6 | % | |||||||||||||
| Other liabilities | 1,203,198 | 726,023 | 1,076,530 | 11.8 | % | 65.7 | % | |||||||||||||
| Minority interest | 181,477 | 186,496 | 108,990 | 66.5 | % | -2.7 | % | |||||||||||||
| Total Liabilities | 21,196,920 | 19,711,251 | 19,403,966 | 9.2 | % | 7.5 | % | |||||||||||||
| Capital stock | 471,912 | 471,912 | 471,912 | 0.0 | % | 0.0 | % | |||||||||||||
| Treasury stock | (75,090 | ) | (74,242 | ) | (73,107 | ) | 2.7 | % | 1.1 | % | ||||||||||
| Capital surplus | 116,186 | 130,341 | 140,693 | -17.4 | % | -10.9 | % | |||||||||||||
| Reserves | 1,385,098 | 1,059,344 | 1,053,494 | 31.5 | % | 30.8 | % | |||||||||||||
| Unrealized gains | 262,680 | 237,446 | (35,415 | ) | -841.7 | % | 10.6 | % | ||||||||||||
| Retained earnings | 123,765 | 492,055 | 110,578 | 11.9 | % | -74.8 | % | |||||||||||||
| Net Shareholder's equity | 2,284,552 | 2,316,856 | 1,668,154 | 37.0 | % | -1.4 | % | |||||||||||||
| Total liabilities and net shareholder's equity | 23,481,472 | 22,028,107 | 21,072,120 | 11 | % | 6.6 | % | |||||||||||||
| Contingent Credits | 2,662,856 | 2,528,135 | 1,766,059 | 50.8 | % | 5.3 | % | |||||||||||||
35
CREDICORP LTD. AND SUBSIDIARIES
QUARTERLY INCOME STATEMENT
(In US$ thousands, IFRS)
Quarter | Change % | |||||||||||||||||||
1Q10 | 4Q09 | 1Q09 | 1Q10 / 1Q09 | 1Q10 / 4Q09 | ||||||||||||||||
| Interest income and expense | ||||||||||||||||||||
| Interest and dividend income | 332,739 | 329,796 | 325,909 | 2.1 | % | 0.9 | % | |||||||||||||
| Interest expense | (87,153 | ) | (91,834 | ) | (120,043 | ) | -27.4 | % | -5.1 | % | ||||||||||
| Net interest income | 245,585 | 237,963 | 205,866 | 19.3 | % | 3.2 | % | |||||||||||||
| Provision for loan losses | (43,181 | ) | (44,044 | ) | (26,425 | ) | 63.4 | % | -2.0 | % | ||||||||||
| Non financial income | ||||||||||||||||||||
| Fee income | 125,430 | 126,163 | 98,295 | 27.6 | % | -0.6 | % | |||||||||||||
| Net gain on foreign exchange transactions | 25,439 | 23,256 | 19,516 | 30.4 | % | 9.4 | % | |||||||||||||
| Net gain on sales of securities | 7,022 | 10,956 | 45,878 | -84.7 | % | -35.9 | % | |||||||||||||
| Other | 9,917 | 13,749 | 9,980 | -0.6 | % | -27.9 | % | |||||||||||||
| Total non financial income, net | 167,808 | 174,124 | 173,668 | -3.4 | % | -3.6 | % | |||||||||||||
| Insurance premiums and claims | ||||||||||||||||||||
| Net premiums earned | 111,029 | 115,107 | 99,069 | 12.1 | % | -3.5 | % | |||||||||||||
| Net claims incurred | (13,624 | ) | (7,967 | ) | (18,650 | ) | -27.0 | % | 71.0 | % | ||||||||||
| Increase in cost for life and health policies | (64,919 | ) | (62,111 | ) | (51,912 | ) | 25.1 | % | 4.5 | % | ||||||||||
| Total other operating income, net | 32,487 | 45,029 | 28,507 | 14.0 | % | -27.9 | % | |||||||||||||
| Operating expenses | ||||||||||||||||||||
| Salaries and employees benefits | (115,196 | ) | (108,303 | ) | (94,100 | ) | 22.4 | % | 6.4 | % | ||||||||||
| Administrative, general and tax expenses | (78,001 | ) | (93,152 | ) | (74,773 | ) | 4.3 | % | -16.3 | % | ||||||||||
| Depreciation and amortization | (20,507 | ) | (19,890 | ) | (17,288 | ) | 18.6 | % | 3.1 | % | ||||||||||
| Merger expenses | - | - | - | 100.0 | % | 100.0 | % | |||||||||||||
| Other | (23,995 | ) | (38,719 | ) | (35,051 | ) | -31.5 | % | -38.0 | % | ||||||||||
| Total operating expenses | (237,698 | ) | (260,064 | ) | (221,212 | ) | 7.5 | % | -8.6 | % | ||||||||||
| Income before translation results, employees' profit sharing and income taxes | 165,002 | 153,008 | 160,405 | 2.9 | % | 7.8 | % | |||||||||||||
| Translation result | 12,059 | 1,075 | (4,708 | ) | -356.1 | % | 1022.1 | % | ||||||||||||
| Workers’ profit sharing | (5,474 | ) | (1,734 | ) | (4,579 | ) | 19.5 | % | 215.7 | % | ||||||||||
| Income taxes | (39,429 | ) | (19,378 | ) | (33,630 | ) | 17.2 | % | 103.5 | % | ||||||||||
| Net income | 132,158 | 132,971 | 117,488 | 12.5 | % | -0.6 | % | |||||||||||||
| Minority interest | 8,288 | 10,675 | 6,910 | 19.9 | % | -22.4 | % | |||||||||||||
| Net income attributed to Credicorp | 123,870 | 122,296 | 110,578 | 12.0 | % | 1.3 | % | |||||||||||||
36
CREDICORP LTD. AND SUBSIDIARIES
SELECTED FINANCIAL INDICATORS
| Quarter | ||||||||||||
| 1Q10 | 4Q09 | 1Q09 | ||||||||||
| Profitability | ||||||||||||
| Net income per common share (US$ per share)(1) | 1.55 | 1.53 | 1.39 | |||||||||
| Net interest margin on interest earning assets (2) | 4.9 | % | 5.1 | % | 4.5 | % | ||||||
| Return on average total assets (2)(3) | 2.2 | % | 2.3 | % | 2.1 | % | ||||||
| Return on average shareholders' equity (2)(3) | 21.5 | % | 22.0 | % | 26.3 | % | ||||||
| No. of outstanding shares (millions)(4) | 79.8 | 79.8 | 79.8 | |||||||||
| Quality of loan portfolio | ||||||||||||
| Past due loans as a percentage of total loans | 1.81 | % | 1.59 | % | 1.16 | % | ||||||
| Reserves for loan losses as a percentage of | ||||||||||||
| total past due loans | 176.7 | % | 192.0 | % | 205.4 | % | ||||||
| Reserves for loan losses as a percentage of | ||||||||||||
| total loans | 3.2 | % | 3.1 | % | 2.4 | % | ||||||
| Operating efficiency | ||||||||||||
| Oper. expense as a percent. of total income (5) | 42.1 | % | 44.0 | % | 44.0 | % | ||||||
| Oper. expense as a percent. of av. tot. assets(2)(3)(5) | 3.8 | % | 4.1 | % | 3.6 | % | ||||||
| Average balances (millions of US$) (3) | ||||||||||||
| Interest earning assets | 19,948.1 | 18,805.2 | 18,244.2 | |||||||||
| Total Assets | 22,754.8 | 21,400.3 | 20,946.6 | �� | ||||||||
| Net equity | 2,300.7 | 2,223.5 | 1,678.7 | |||||||||
(1) Based on Net Income attributed to BAP. Number of shares outstanding of 79.8 million in all periods.
(2) Ratios are annualized.
(3) Averages are determined as the average of period-beginning and period-ending balances.
(4) Net of treasury shares. The total number of shares was of 94.38 million.
(5) Total income includes net interest income, fee income, net gain on foreign exchange transactions and net premiums earned. Operating expense does not include Other expenses.
37
BANCO DE CREDITO DEL PERU AND SUBSIDIARIES
CONSOLIDATED BALANCE SHEET
(In US$ thousands, IFRS)
As of | Change % | |||||||||||||||||||
1Q10 | 4Q09 | 1Q09 | 1Q10 / 1Q09 | 1Q10 / 4Q09 | ||||||||||||||||
ASSETS | ||||||||||||||||||||
| Cash and due from banks | 3,395,676 | 3,724,635 | 3,735,010 | -9.1 | % | -8.8 | % | |||||||||||||
| Cash and BCRP | 2,761,952 | 2,964,509 | 2,959,967 | -6.7 | % | -6.8 | % | |||||||||||||
| Deposits in other Banks | 534,928 | 683,527 | 747,836 | -28.5 | % | -21.7 | % | |||||||||||||
| Interbanks | 97,499 | 75,000 | 25,134 | 287.9 | % | 30.0 | % | |||||||||||||
| Accrued interest on cash and due from banks | 1,297 | 1,599 | 2,073 | -37.4 | % | -18.9 | % | |||||||||||||
| Marketable securities, net | 109,326 | 70,318 | 29,973 | 264.7 | % | 55.5 | % | |||||||||||||
| Loans | ||||||||||||||||||||
| Current | 11,637,580 | 11,393,557 | 9,914,864 | 17.4 | % | 2.1 | % | |||||||||||||
| Past Due | 214,968 | 183,746 | 116,235 | 84.9 | % | 17.0 | % | |||||||||||||
| Less - Reserve for possible loan losses | (380,248 | ) | (353,348 | ) | (240,091 | ) | 58.4 | % | 7.6 | % | ||||||||||
| Loans, net | 11,472,300 | 11,223,955 | 9,791,008 | 17.2 | % | 2.2 | % | |||||||||||||
| Investment securities available for sale | 4,053,210 | 3,026,542 | 3,672,154 | 10.4 | % | 33.9 | % | |||||||||||||
| Property, plant and equipment, net | 281,627 | 278,202 | 259,043 | 8.7 | % | 1.2 | % | |||||||||||||
| Due from customers acceptances | 78,795 | 96,423 | 202,563 | -61.1 | % | -18.3 | % | |||||||||||||
| Other assets | 1,262,861 | 1,143,234 | 834,183 | 51.4 | % | 10.5 | % | |||||||||||||
| Total Assets | 20,653,795 | 19,563,309 | 18,523,934 | 11.5 | % | 5.6 | % | |||||||||||||
LIABILITIES AND SHAREHOLDER'S EQUITY | ||||||||||||||||||||
| Deposits and obligations | 13,777,327 | 14,465,809 | 13,608,169 | 1.2 | % | -4.8 | % | |||||||||||||
| Demand deposits | 4,932,731 | 4,440,643 | 4,164,233 | 18.5 | % | 11.1 | % | |||||||||||||
| Saving deposits | 3,853,739 | 3,539,917 | 3,162,172 | 21.9 | % | 8.9 | % | |||||||||||||
| Time deposits | 3,927,540 | 5,361,410 | 5,217,625 | -24.7 | % | -26.7 | % | |||||||||||||
| Severance indemnity deposits (CTS) | 1,013,010 | 1,069,267 | 987,247 | 2.6 | % | -5.3 | % | |||||||||||||
| Interest payable | 50,307 | 54,572 | 76,892 | -34.6 | % | -7.8 | % | |||||||||||||
| Due to banks and correspondents | 3,007,252 | 1,278,245 | 1,629,959 | 84.5 | % | 135.3 | % | |||||||||||||
| Bonds and subordinated debt | 1,225,968 | 1,228,901 | 876,708 | 39.8 | % | -0.2 | % | |||||||||||||
| Acceptances outstanding | 78,795 | 96,423 | 202,563 | -61.1 | % | -18.3 | % | |||||||||||||
| Other liabilities | 982,393 | 813,959 | 890,984 | 10.3 | % | 20.7 | % | |||||||||||||
| Total Liabilities | 19,071,735 | 17,883,337 | 17,208,383 | 10.8 | % | 6.6 | % | |||||||||||||
NET SHAREHOLDER'S EQUITY | 1,578,484 | 1,675,533 | 1,312,090 | 20.3 | % | -5.8 | % | |||||||||||||
| Capital stock | 783,213 | 667,250 | 667,646 | 17.3 | % | 17.4 | % | |||||||||||||
| Reserves | 388,309 | 388,275 | 388,365 | 0.0 | % | 0.0 | % | |||||||||||||
| Unrealized gains and losses | 117,908 | 106,708 | 40,652 | 190.0 | % | 10.5 | % | |||||||||||||
| Retained earnings | 187,145 | 115,922 | 115,445 | 62.1 | % | 61.4 | % | |||||||||||||
| Income for the year | 101,909 | 397,378 | 99,982 | 1.9 | % | -74.4 | % | |||||||||||||
| Minority interest | 3,576 | 4,439 | 3,461 | 3.3 | % | -19.4 | % | |||||||||||||
TOTAL LIABILITIES AND NET SHAREHOLDER'S EQUITY | 20,653,795 | 19,563,309 | 18,523,934 | 11.5 | % | 5.6 | % | |||||||||||||
CONTINGENT CREDITS | 8,786,376 | 7,780,722 | 6,219,698 | 41.3 | % | 12.9 | % | |||||||||||||
38
BANCO DE CREDITO DEL PERU AND SUBSIDIARIES
QUARTERLY INCOME STATEMENT
(In US$ thousands, IFRS)
Quarter | Change % | |||||||||||||||||||
1Q10 | 4Q09 | 1Q09 | 1Q10 / 1Q09 | 1Q10 / 4Q09 | ||||||||||||||||
| Interest income and expense | ||||||||||||||||||||
| Interest and dividend income | 305,922 | 301,319 | 302,370 | 1.2 | % | 1.5 | % | |||||||||||||
| Interest expense | (86,747 | ) | (90,086 | ) | (116,209 | ) | -25.4 | % | -3.7 | % | ||||||||||
| Net interest and dividend income | 219,175 | 211,233 | 186,161 | 17.7 | % | 3.8 | % | |||||||||||||
| Provision for loan losses | (43,445 | ) | (44,933 | ) | (27,180 | ) | 59.8 | % | -3.3 | % | ||||||||||
| Non financial income | ||||||||||||||||||||
| Banking services commissions | 107,223 | 109,546 | 77,553 | 38.3 | % | -2.1 | % | |||||||||||||
| Net gain on foreign exchange transactions | 25,503 | 23,430 | 20,328 | 25.5 | % | 8.8 | % | |||||||||||||
| Net gain on sales of securities | 161 | 9,185 | 46,291 | -99.7 | % | -98.2 | % | |||||||||||||
| Other | 4,954 | 2,816 | 4,074 | 21.6 | % | 75.9 | % | |||||||||||||
| Total fees and income from services, net | 137,841 | 144,977 | 148,246 | -7.0 | % | -4.9 | % | |||||||||||||
| Operating expenses | ||||||||||||||||||||
| Salaries and employees benefits | (98,445 | ) | (89,486 | ) | (79,349 | ) | 24.1 | % | 10.0 | % | ||||||||||
| Administrative expenses | (65,785 | ) | (79,622 | ) | (63,553 | ) | 3.5 | % | -17.4 | % | ||||||||||
| Depreciation and amortization | (16,423 | ) | (16,153 | ) | (13,756 | ) | 19.4 | % | 1.7 | % | ||||||||||
| Other | (4,680 | ) | (12,695 | ) | (16,437 | ) | -71.5 | % | -63.1 | % | ||||||||||
| Total operating expenses | (185,333 | ) | (197,956 | ) | (173,095 | ) | 7.1 | % | -6.4 | % | ||||||||||
| Income before translation results, workers' profit sharing and income taxes | 128,238 | 113,321 | 134,132 | -4.4 | % | 13.2 | % | |||||||||||||
| Translation result | 11,680 | 12,609 | (4,260 | ) | -374.2 | % | -7.4 | % | ||||||||||||
| Employees’ profit sharing | (4,840 | ) | (2,041 | ) | (3,815 | ) | 26.9 | % | 137.1 | % | ||||||||||
| Income taxes | (32,906 | ) | (16,166 | ) | (25,792 | ) | 27.6 | % | 103.6 | % | ||||||||||
| Minority Interest | (263 | ) | (325 | ) | (283 | ) | -7.4 | % | -19.4 | % | ||||||||||
| Net income | 101,909 | 107,398 | 99,982 | 1.9 | % | -5.1 | % | |||||||||||||
39
BANCO DE CREDITO DEL PERU AND SUBSIDIARIES
SELECTED FINANCIAL INDICATORS
| Quarter | ||||||||||||
| 1Q10 | 4Q09 | 1Q09 | ||||||||||
| Profitability | ||||||||||||
| Net income per common share (US$ per share)(1) | 0.046 | 0.048 | 0.045 | |||||||||
| Net interest margin on interest earning assets (2) | 4.9 | % | 5.0 | % | 4.5 | % | ||||||
| Return on average total assets (2)(3) | 2.0 | % | 2.3 | % | 2.2 | % | ||||||
| Return on average shareholders' equity (2)(3) | 25.8 | % | 26.6 | % | 29.5 | % | ||||||
| No. of outstanding shares (millions) | 2,228.3 | 2,228.3 | 2,228.3 | |||||||||
| Quality of loan portfolio | ||||||||||||
| Past due loans as a percentage of total loans | 1.81 | % | 1.59 | % | 1.16 | % | ||||||
| Reserves for loan losses as a percentage of | ||||||||||||
| total past due loans | 176.9 | % | 192.3 | % | 206.6 | % | ||||||
| Reserves for loan losses as a percentage of | ||||||||||||
| total loans | 3.2 | % | 3.1 | % | 2.4 | % | ||||||
| Operating efficiency | ||||||||||||
| Oper. expense as a percent. of total income (4) | 51.3 | % | 53.8 | % | 55.2 | % | ||||||
| Oper. expense as a percent. of av. tot. assets(2)(3)(4) | 3.6 | % | 4.0 | % | 3.4 | % | ||||||
| Capital adequacy | ||||||||||||
| Total Regulatory Capital (US$ millions) | 1,966.7 | 1,888.3 | 1,412.7 | |||||||||
| Tier I Capital (US$ millions) | 1,511.4 | 1,450.0 | 1,052.6 | |||||||||
| Regulatory capital / risk-weighted assets (5) | 14.5 | % | 14.5 | % | 12.4 | % | ||||||
| Average balances (millions of US$) (3) | ||||||||||||
| Interest earning assets | 18,037.7 | 16,826.9 | 16,746.5 | |||||||||
| Total Assets | 20,108.6 | 18,721.8 | 18,515.7 | |||||||||
| Net equity | 1,578.5 | 1,615.9 | 1,356.2 | |||||||||
(1) Shares outstanding of 2,228 million is used for all periods since shares have been issued only for capitalization of profits and inflation adjustment.
(2) Ratios are annualized.
(3) Averages are determined as the average of period-beginning and period-ending balances.
(4) Total income includes net interest income, fee income and net gain on foreign exchange transactions.
Operating expense includes personnel expenses, administrative expenses and depreciation and amortization
(5) Risk-weighted assets include market risk assets
40
EL PACIFICO - PERUANO SUIZA and SUBSIDIARIES
(in thousand dollars)
| Balance to and for the period of | ||||||||||||||||||||
Three month ending | ||||||||||||||||||||
31 Mar 09 | 31 Dec 09 | 31 Mar 10 | Change % | |||||||||||||||||
1Q09 | 4Q09 | 1Q10 | 1Q09 | 4Q09 | ||||||||||||||||
| Results | ||||||||||||||||||||
| Total Premiums | 138,237 | 172,697 | 155,626 | 12.6 | % | -9.9 | % | |||||||||||||
| Ceded Premiums | 23,104 | 34,968 | 25,268 | 9.4 | % | -27.7 | % | |||||||||||||
| Adjusment of reserves | 13,161 | 18,582 | 15,161 | 15.2 | % | -18.4 | % | |||||||||||||
| Earned net premiums | 101,972 | 119,146 | 115,197 | 13.0 | % | -3.3 | % | |||||||||||||
| Direct claims | 107,990 | 92,473 | 94,845 | -12.2 | % | 2.6 | % | |||||||||||||
| Ceded claims | 37,428 | 22,396 | 16,302 | -56.4 | % | -27.2 | % | |||||||||||||
| Net claims | 70,562 | 70,078 | 78,543 | 11.3 | % | 12.1 | % | |||||||||||||
| Direct commissions | 16,902 | 17,970 | 18,147 | 7.4 | % | 1.0 | % | |||||||||||||
| Commissions received | 2,349 | 2,395 | 2,419 | 3.0 | % | 1.0 | % | |||||||||||||
| Net commissions | 14,554 | 15,575 | 15,727 | 8.1 | % | 1.0 | % | |||||||||||||
| Technical expenses | 5,709 | 7,267 | 6,666 | 16.8 | % | -8.3 | % | |||||||||||||
| Technical resolves | 2,267 | 2,749 | 2,905 | 28.1 | % | 5.7 | % | |||||||||||||
| Net technical expenses | 3,443 | 4,518 | 3,761 | 9.3 | % | -16.7 | % | |||||||||||||
| Technical results | 13,414 | 28,976 | 17,166 | 28.0 | % | -40.8 | % | |||||||||||||
| Financial income | 14,164 | 16,043 | 17,798 | 25.7 | % | 10.9 | % | |||||||||||||
| Gains on sale of real state and secutirities | 1,675 | 2,262 | 3,083 | 84.1 | % | 36.3 | % | |||||||||||||
| Renting (Net of expenses) | 866 | 1,147 | 1,186 | 36.9 | % | 3.4 | % | |||||||||||||
| (-) Financial expenses | 685 | 493 | 474 | -30.7 | % | -3.8 | % | |||||||||||||
| Financial income, net | 16,020 | 18,960 | 21,593 | 34.8 | % | 13.9 | % | |||||||||||||
| Salaries and benefits | 9,799 | 14,258 | 13,012 | 32.8 | % | -8.7 | % | |||||||||||||
| Administrative expenses | 8,333 | 17,128 | 9,919 | 19.0 | % | -42.1 | % | |||||||||||||
| Third party services | 3,936 | 5,039 | 4,819 | 22.4 | % | -4.4 | % | |||||||||||||
| Sundry management expenses | 1,756 | 2,192 | 2,203 | 25.5 | % | 0.5 | % | |||||||||||||
| Provisions | 1,261 | 5,204 | 1,555 | 23.3 | % | -70.1 | % | |||||||||||||
| Taxes | 1,196 | 1,697 | 1,456 | 21.8 | % | -14.2 | % | |||||||||||||
| Other expenses | 185 | 2,997 | (113 | ) | -161.2 | % | -103.8 | % | ||||||||||||
| General expenses | 18,132 | 31,386 | 22,931 | 26.5 | % | -26.9 | % | |||||||||||||
| Other income | 916 | 945 | 211 | -77.0 | % | -77.7 | % | |||||||||||||
| Traslations results | (511 | ) | 382 | 1,005 | -296.7 | % | 163.2 | % | ||||||||||||
| Employee participations and income tax | 2,199 | (2,388 | ) | 2,000 | -9.1 | % | -183.7 | % | ||||||||||||
| Income before minority interest | 9,508 | 20,264 | 15,043 | 58.2 | % | -25.8 | % | |||||||||||||
| Minority interest | 2,624 | 3,981 | 2,948 | 12.4 | % | -25.9 | % | |||||||||||||
| Net income | 6,884 | 16,283 | 12,095 | 75.7 | % | -25.7 | % | |||||||||||||
| Balance (end of period) | ||||||||||||||||||||
| Total Assets | 1,323,292 | 1,498,255 | 1,520,168 | 14.9 | % | 1.5 | % | |||||||||||||
| Invesment on securities and real state (1) | 828,689 | 1,057,162 | 1,086,084 | 31.1 | % | 2.7 | % | |||||||||||||
| Technical reserves | 1,013,762 | 1,019,551 | 1,056,204 | 4.2 | % | 3.6 | % | |||||||||||||
| Net equity | 156,333 | 265,219 | 270,626 | 73.1 | % | 2.0 | % | |||||||||||||
| Ratios | ||||||||||||||||||||
| Ceded | 16.7 | % | 20.2 | % | 16.2 | % | ||||||||||||||
| Net claims/ earned net premiums | 69.2 | % | 58.8 | % | 68.2 | % | ||||||||||||||
| Commissions+technical expenses, net / earned net premiums | 17.6 | % | 16.9 | % | 16.9 | % | ||||||||||||||
| Technical results / earned net premiums | 13.2 | % | 24.3 | % | 14.9 | % | ||||||||||||||
| General expenses / earned net premiums | 17.8 | % | 26.3 | % | 19.9 | % | ||||||||||||||
| Return on equity (2)(3) | 19.5 | % | 6.4 | % | 19.3 | % | ||||||||||||||
| Return on total premiums | 5.0 | % | 9.4 | % | 7.8 | % | ||||||||||||||
| Net equity / Total Assets | 11.8 | % | 17.7 | % | 17.8 | % | ||||||||||||||
| Increase in technical reserves | 11.4 | % | 13.5 | % | 11.6 | % | ||||||||||||||
| General expenses / Assets (2)(3) | 5.6 | % | 2.1 | % | 6.2 | % | ||||||||||||||
| Combined ratio of PPS + PS (4) | 99.1 | % | 94.2 | % | 96.4 | % | ||||||||||||||
| Net claims / earned net premiums | 72.2 | % | 54.7 | % | 64.9 | % | ||||||||||||||
| General expenses and commissions / earned net premiums | 26.9 | % | 39.5 | % | 31.4 | % | ||||||||||||||
(1) Real state investment were excluded
(2) Annualized
(3) Average are determined as the average of period - begging and period ending
(4) Without consolidated adjusments
41