
Pericom Semiconductor: Enabling Serial Connectivity (NASDAQ: PSEM) Q4 Fiscal Year 2012 Earnings
2 This presentation will include remarks about future expectations, plans and prospects for Pericom which constitute forward-looking statements for purposes of the safe-harbor provisions under applicable federal securities laws.Such forward-looking statementsinclude the statements in the slide entitled”Q1 FY13 Business Outlook”, which sets forth expected revenues, gross margin and other financial results for the fiscal first quarter . Actual results may differ materially from our forward-looking statements, as a result of various important risks and uncertainties, including unexpected softness in demand for our products, price erosion for certain of our products, customer decisions to reduce inventory and other risks and uncertainties which are detailed and may be reviewed in the Company’s filings with the SEC. All forward-looking statements included in this presentation are made as of the date of this presentation, and Pericom expressly disclaims any obligation to update the information provided in this presentation, except as required by law. Weencourage you to review our most recent annual report on Form 10-Kand our most recent quarterly reporton Form 10-Q filed with theSECand, in particular the risk factor sections of those filings. Safe Harbor
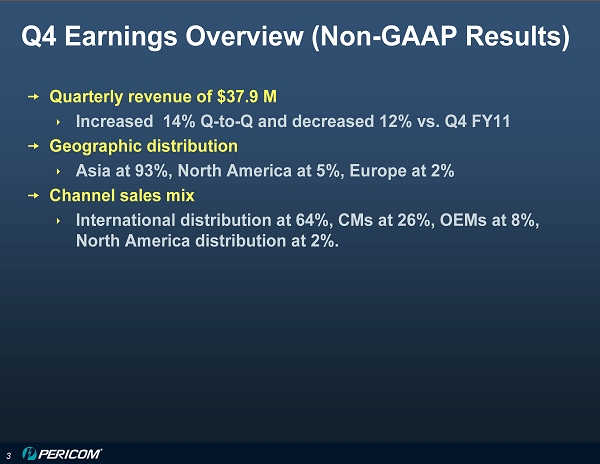
3 Quarterly revenue of $37.9 M Increased 14% Q-to-Q and decreased 12% vs. Q4 FY11 Geographic distribution Asia at 93%, North America at 5%, Europe at 2% Channel sales mix International distribution at 64%, CMs at 26%, OEMs at 8%, North America distribution at 2%. Q4 Earnings Overview (Non-GAAP Results)
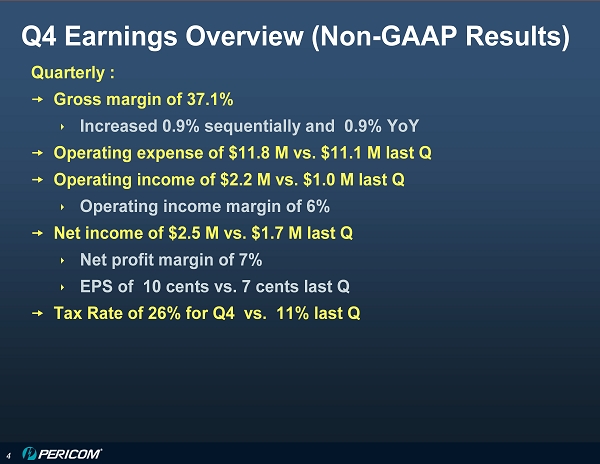
4 Quarterly : Gross margin of 37.1% Increased 0.9% sequentially and 0.9% YoY Operating expense of $11.8 M vs. $11.1 M last Q Operating income of $2.2 M vs. $1.0 M last Q Operating income margin of 6% Net income of $2.5 M vs. $1.7 M last Q Net profit margin of 7% EPS of 10 cents vs. 7 cents last Q Tax Rate of 26% for Q4 vs. 11% last Q Q4 Earnings Overview (Non-GAAP Results)
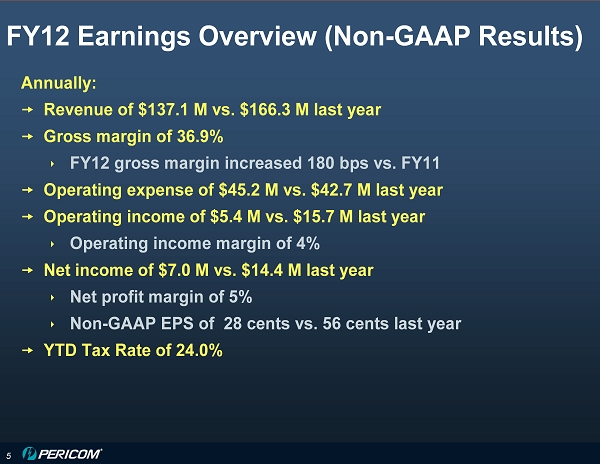
5 Annually: Revenue of $137.1 M vs. $166.3 M last year Gross margin of 36.9% FY12 gross margin increased 180 bps vs. FY11 Operating expense of $45.2 M vs. $42.7 M last year Operating income of $5.4 M vs. $15.7 M last year Operating income margin of 4% Net income of $7.0 M vs. $14.4 M last year Net profit margin of 5% Non-GAAP EPS of 28 cents vs. 56 cents last year YTD Tax Rate of 24.0% FY12 Earnings Overview (Non-GAAP Results)
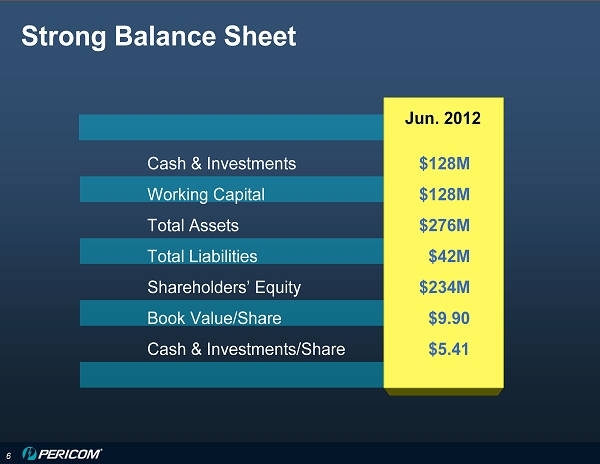
6 Cash & Investments $128M Working Capital $128M Total Assets $276M Total Liabilities $42M Shareholders’Equity $234M Book Value/Share $9.90 Cash & Investments/Share $5.41 Jun. 2012 Strong Balance Sheet
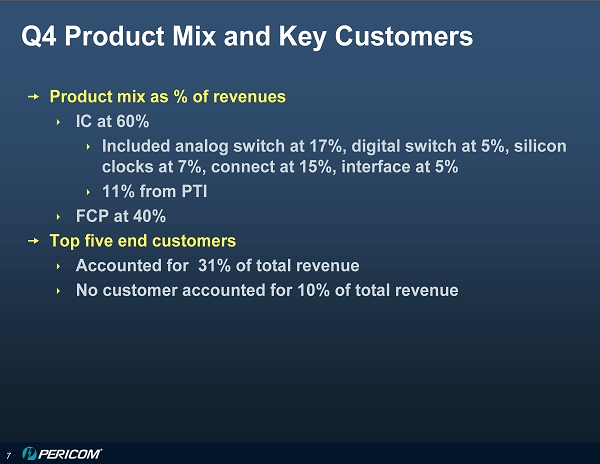
7 Product mix as % of revenues IC at 60% Included analog switch at 17%, digital switch at 5%, silicon clocks at 7%, connect at 15%, interface at 5% 11% from PTI FCP at 40% Top five end customers Accounted for 31% of total revenue No customer accounted for 10% of total revenue Q4 Product Mix and Key Customers
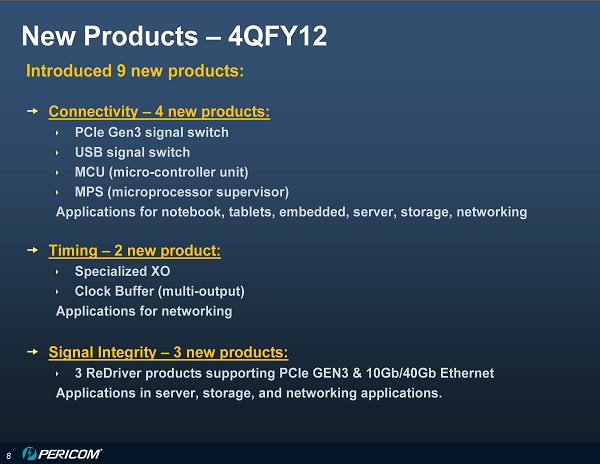
8 Introduced 9 new products: Connectivity –4 new products: PCIe Gen3 signal switch USB signal switch MCU (micro-controller unit) MPS (microprocessor supervisor) Applications for notebook, tablets, embedded, server, storage, networking Timing –2 new product: Specialized XO Clock Buffer (multi-output) Applications for networking Signal Integrity –3 new products: 3 ReDriver products supporting PCIe GEN3 & 10Gb/40Gb Ethernet Applications in server, storage, and networking applications. New Products –4QFY12
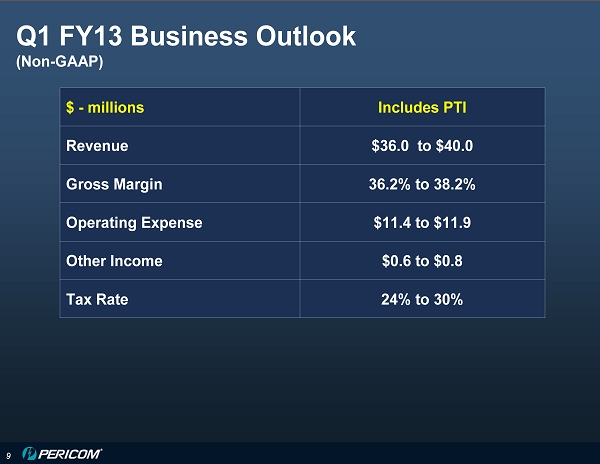
9 $ -millions Includes PTI Revenue $36.0 to $40.0 Gross Margin 36.2% to 38.2% Operating Expense $11.4 to $11.9 Other Income $0.6 to $0.8 Tax Rate 24% to 30% Q1 FY13 Business Outlook (Non-GAAP)

Pericom Semiconductor: Enabling Serial Connectivity (Nasdaq: PSEM) Fiscal 4Q12 Earnings Q & A