Searchable text section of graphics shown above
[LOGO]
[GRAPHIC]
Lehman Brothers High Yield & Syndicated Loan Conference
March 16th, 2005
[LOGO]
Forward-looking statement
Statements in this presentation that are not reported financial results or other historical information are “forward-looking statements” within the meaning of the Private Securities Litigation Reform Act of 1995. They include, for example, statements about our business outlook, assessment of market conditions, projected strategies, future plans, future sales, expectations about price levels for our major products and our major suppliers, predictions concerning inventory levels, capital spending and tax rates. These forward-looking statements are not guarantees of future performance. They are based on management’s expectations and assumptions that we believe are reasonable at the current time but involve a number of business risks and uncertainties, any of which could cause actual results to differ materially from those expressed in or implied by the forward-looking statements.
1
Company Overview
Blount International
2004 Sales (mm): | | $ | 693 | |
2004 EBITDA (mm) | | $ | 133 | |
Margin | | 19.2 | % |
Outdoor Products Group (“OPG”)
2004 Sales (mm): | | $ | 423 | |
2004 EBITDA (mm): | | $ | 116 | |
Margin | | 27.4 | % |
• Oregon Cutting Systems – Saw chain, bar & accessories, outdoor equipment parts
• ICS – Diamond cutting chain for concrete industry
Industrial Power & Equipment Group (“IPEG”)
2004 Sales (mm): | | $ | 221 | |
2004 EBITDA (mm): | | $ | 25 | |
Margin | | 11.3 | % |
• Forestry & Industrial Equipment – Timber harvesting equipment
• Gear Products –Rotational bearings, gear components
Lawnmower
2004 Sales (mm): | | $ | 50 | |
2004 EBITDA (mm): | | $ | 4 | |
Margin | | 8.0 | % |
• Dixon – ZTR® riding lawnmowers
2004 Revenues | | 2004 EBITDA |
| | |
[CHART] | | [CHART] |
Note: Segment EBITDA figures exclude corporate expenses.
2
Operating From a Strong Position
• Leading Market Positions
• Global leader in chainsaw chain & guide bars (57% and 52% estimated market shares, respectively, as of 2003)
• Approximately 60% of sales generated from products with number 1 market position
• Attractive “Razor-Blade” Business Model of OPG Segment
• Replacement sales comprise 74% of segment’s business
• High margin recurring revenue stream
• Strong Growth Potential
• Earnings leverage to economic recovery and rising pulp prices
• International expansion through existing footprint and Caterpillar alliance
• New product initiatives
• Bolt-on acquisitions
• Historical low-cost producer positioned for further margin improvements (e.g. China facility)
• Channel Breadth and Strong Customer Relationships
• Strong long-term relationships with both OEM’s and distributor/dealer channels
• Significant barrier to entry
• Experienced Management Team
• An average of over 25 years of industry experience
3
Company Overview
[LOGO] | | Sales (1) |
| |
| [CHART] |
| |
| Adjusted EBITDA and Margins (1) |
| |
| [CHART] |
(1) Pro forma for the sale of the Sporting Equipment Group.
4
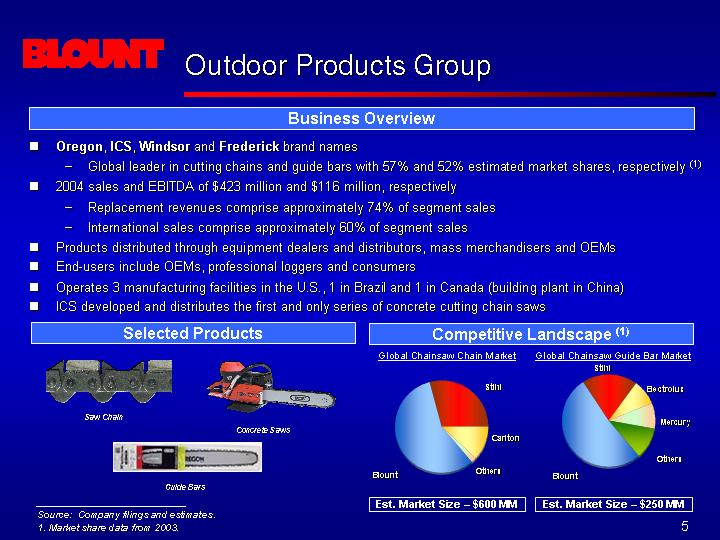
Outdoor Products Group
Business Overview
• Oregon, ICS, Windsor and Frederick brand names
• Global leader in cutting chains and guide bars with 57% and 52% estimated market shares, respectively (1)
• 2004 sales and EBITDA of $423 million and $116 million, respectively
• Replacement revenues comprise approximately 74% of segment sales
• International sales comprise approximately 60% of segment sales
• Products distributed through equipment dealers and distributors, mass merchandisers and OEMs
• End-users include OEMs, professional loggers and consumers
• Operates 3 manufacturing facilities in the U.S., 1 in Brazil and 1 in Canada (building plant in China)
• ICS developed and distributes the first and only series of concrete cutting chain saws
Selected Products
[GRAPHIC]
Saw Chain
[GRAPHIC]
Concrete Saws
[GRAPHIC]
Guide Bars
Competitive Landscape (1) |
| |
Global Chainsaw Chain Market | Global Chainsaw Guide Bar Market |
| |
[CHART] | [CHART] |
| |
Est Market Size – $600 MM | Est Market Size – $250 MM |
Source: Company filings and estimates.
(1) Market share data from 2003.
5
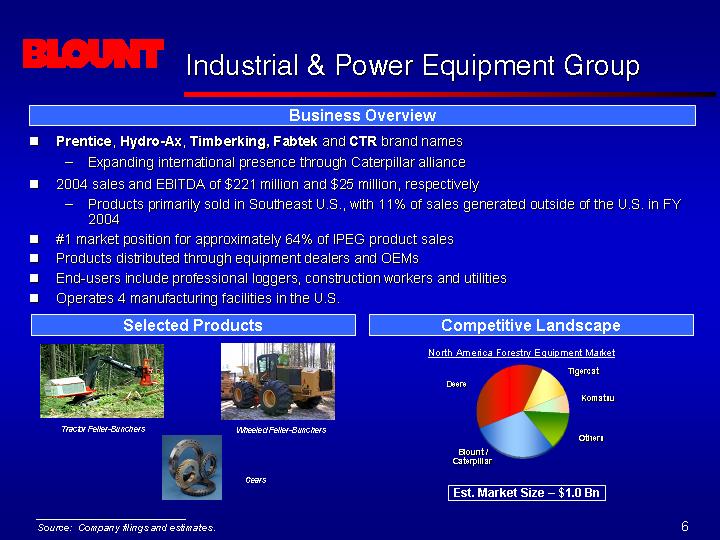
Industrial & Power Equipment Group
Business Overview
• Prentice, Hydro-Ax, Timberking, Fabtek and CTR brand names
• Expanding international presence through Caterpillar alliance
• 2004 sales and EBITDA of $221 million and $25 million, respectively
• Products primarily sold in Southeast U.S., with 11% of sales generated outside of the U.S. in FY 2004
• #1 market position for approximately 64% of IPEG product sales
• Products distributed through equipment dealers and OEMs
• End-users include professional loggers, construction workers and utilities
• Operates 4 manufacturing facilities in the U.S.
Selected Products
[GRAPHIC]
Tractor Feller-Bunchers
[GRAPHIC]
Wheeled Feller-Bunchers
[GRAPHIC]
Gears
Competitive Landscape
North America Forestry Equipment Market
[CHART]
Est. Market Size – $1.0 Bn
Source: Company filings and estimates.
6
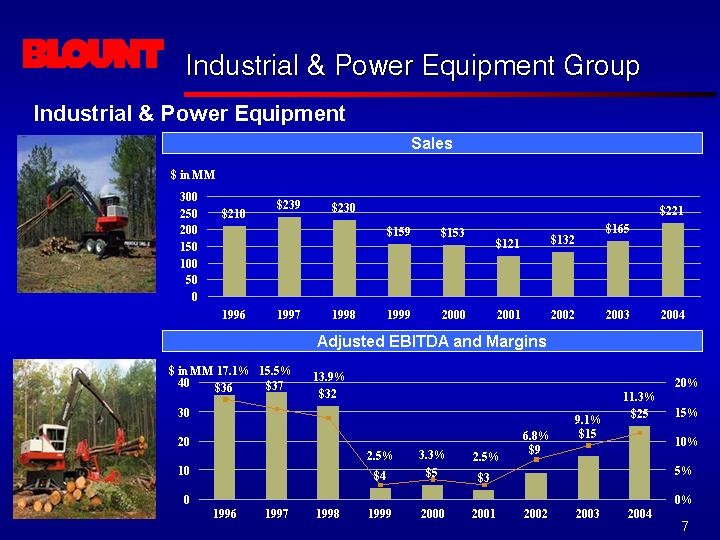
Industrial & Power Equipment
[GRAPHIC] | Sales |
|
[CHART] |
| |
[GRAPHIC] | Adjusted EBITDA and Margins |
|
[CHART] |
7
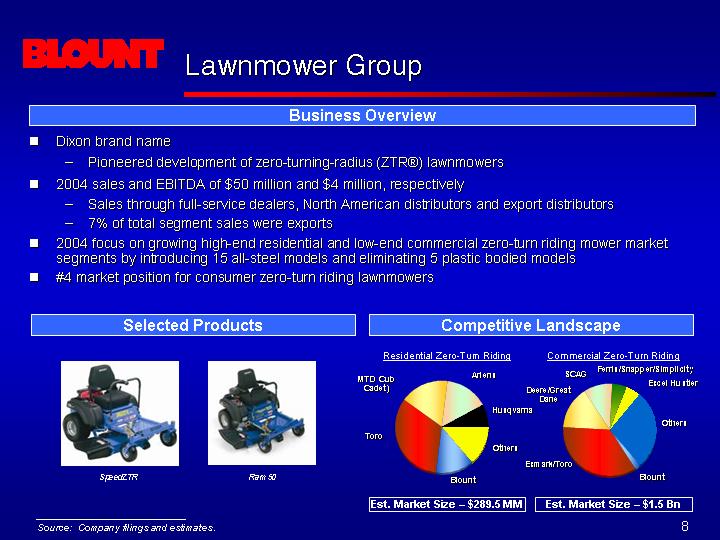
Lawnmower Group
Business Overview
• Dixon brand name
• Pioneered development of zero-turning-radius (ZTR®) lawnmowers
• 2004 sales and EBITDA of $50 million and $4 million, respectively
• Sales through full-service dealers, North American distributors and export distributors
• 7% of total segment sales were exports.
• 2004 focus on growing high-end residential and low-end commercial zero-turn riding mower market segments by introducing 15 all-steel models and eliminating 5 plastic bodied models
• #4 market position for consumer zero-turn riding lawnmowers
Selected Products
[GRAPHIC]
SpeedZTR
[GRAPHIC]
Ram 50
Competitive Landscape |
| |
Residential Zero-Turn Riding | Commercial Zero-Turn Riding |
| |
[CHART] | [CHART] |
| |
Est Market Size – $289.5 MM | Est Market Size – $1.5 Bn |
Source: Company filings and estimates.
8
Company Strategy
• Maintain leadership positions in selected end markets
• #1 position in saw chain, saw bars, certain automated forestry harvesting equipment and delimbing equipment (approximately 60% of total sales)
• Continue to develop new products
• Well-established track record of introducing new products into the marketplace
• Expand international presence
• Increased international sales from $188 million in 2001 to $285 million in 2004
• Leverage Caterpillar agreements
• Reduce costs and improve operating efficiencies
• Long history of practicing Total Quality Management (“TQM”) principles and achieving margins above the competition
• Example: Cost to produce 1 foot of saw chain is less today than it was in 1982
• Maintain balanced diversification with respect to geography, cyclicality, customer base, distribution channels and product lines
• Diversified between consumers, dealers/distributors and OEMs
9
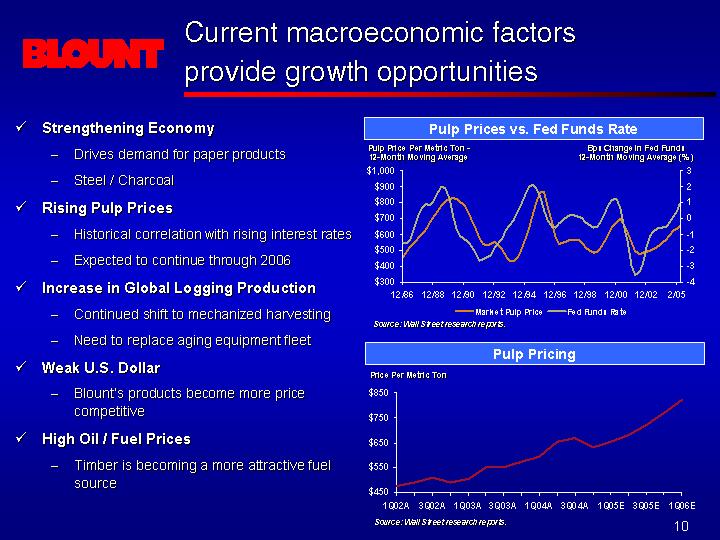
Current macroeconomic factors provide growth opportunities
• | Strengthening Economy |
| • | | Drives demand for paper products |
| • | | Steel / Charcoal |
• | Rising Pulp Prices |
| • | | Historical correlation with rising interest rates |
| • | | Expected to continue through 2006 |
• | Increase in Global Logging Production |
| • | | Continued shift to mechanized harvesting |
| • | | Need to replace aging equipment fleet |
• | Weak U.S. Dollar |
| • | | Blount’s products become more price competitive |
• | High Oil / Fuel Prices |
| • | | Timber is becoming a more attractive fuel source |
Pulp Prices vs. Fed Funds Rate
[CHART]
Source: Wall Street research reports.
Pulp Pricing
[CHART]
Source: Wall Street research reports.
10
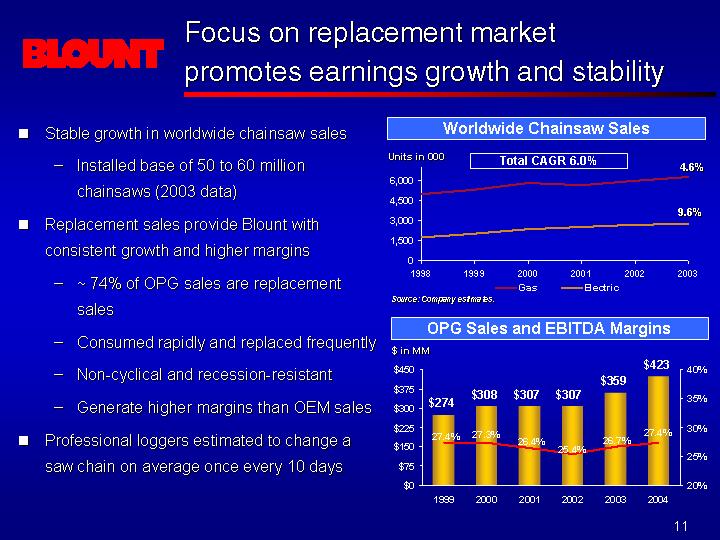
Focus on replacement market promotes earnings growth and stability
• | Stable growth in worldwide chainsaw sales |
| | • | Installed base of 50 to 60 million chainsaws (2003 data) |
• | Replacement sales provide Blount with consistent growth and higher margins |
| | • | ~ 74% of OPG sales are replacement sales |
| | • | Consumed rapidly and replaced frequently |
| | • | Non-cyclical and recession-resistant |
| | • | Generate higher margins than OEM sales |
• | Professional loggers estimated to change a saw chain on average once every 10 days |
Worldwide Chainsaw Sales
Total CAGR 6.0%
[CHART]
Source: Company estimates.
OPG Sales and EBITDA Margins
[CHART]
11
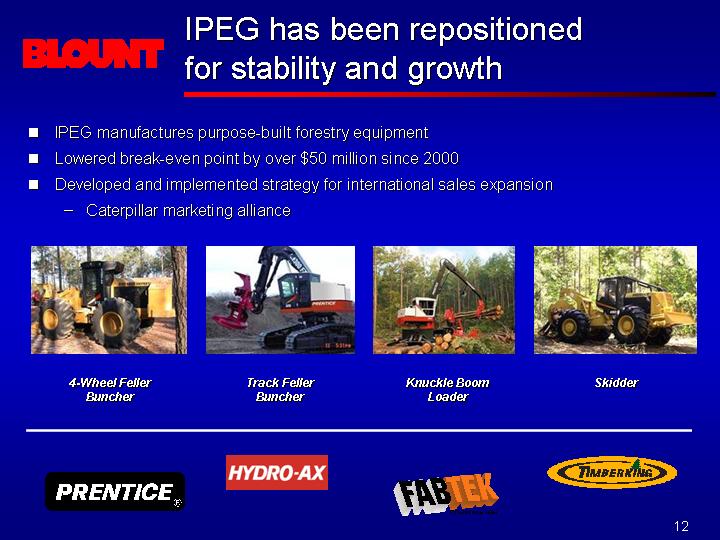
IPEG has been repositioned for stability and growth
• IPEG manufactures purpose-built forestry equipment
• Lowered break-even point by over $50 million since 2000
• Developed and implemented strategy for international sales expansion
• Caterpillar marketing alliance
[GRAPHIC] | | [GRAPHIC] | | [GRAPHIC] | | [GRAPHIC] |
| | | | | | |
4-Wheel Feller
Buncher | | Track Feller
Buncher | | Knuckle Boom
Loader | | Skidder |
[LOGO] | | [LOGO] | | [LOGO] | | [LOGO] |
12
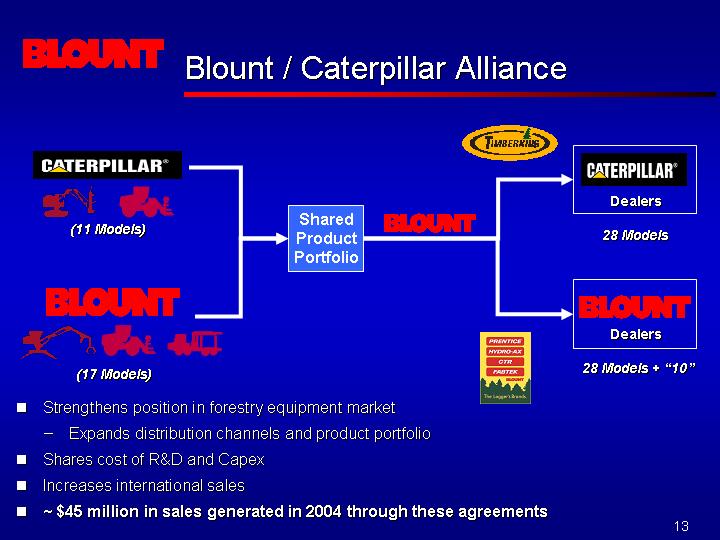
Blount / Caterpillar Alliance
| | | | [LOGO] | | |
| | | | | | |
[LOGO] | | | | | | [LOGO] |
[GRAPHIC] | | | | | | Dealers |
(11 Models) | | Shared | | | | 28 Models |
| | Product | | [LOGO] | | |
[LOGO] | | Portfolio | | | | [LOGO] |
[GRAPHIC] | | | | | | Dealers |
(17 Models) | | | | | | 28 Models + “10” |
| | | | | | |
| | | | [LOGO] | | |
• Strengthens position in forestry equipment market
• Expands distribution channels and product portfolio
• Shares cost of R&D and Capex
• Increases international sales
• ~ $45 million in sales generated in 2004 through these agreements
13
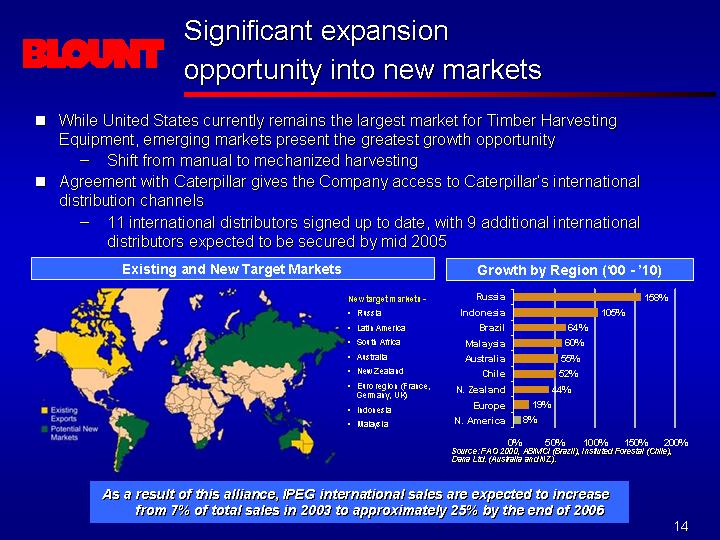
Significant expansion opportunity into new markets
• While United States currently remains the largest market for Timber Harvesting Equipment, emerging markets present the greatest growth opportunity
• Shift from manual to mechanized harvesting
• Agreement with Caterpillar gives the Company access to Caterpillar’s international distribution channels
• 11 international distributors signed up to date, with 9 additional international distributors expected to be secured by mid 2005
Existing and New Target Markets
[GRAPHIC]
New target markets -
• Russia
• Latin America
• South Africa
• Australia
• New Zealand
• Euro region (France, Germany, UK)
• Indonesia
• Malaysia
Growth by Region (‘00 -’10)
[CHART]
Source: FAO 2000, ABIMCI (Brazil), Instiuted Forestal (Chile), Dana Ltd. (Australia and NZ).
As a result of this alliance, IPEG international sales are expected to increase from 7% of total sales in 2003 to approximately 25% by the end of 2006
14
New product initiatives provide incremental growth opportunities
• | Long history of industry “firsts” | |
| • | First modern chainsaw chain in 1947 | |
| • | First zero-turn riding lawnmowers in 1974 | |
• | Strong R&D franchise | |
| • | More than 110 engineering professionals focused on R&D | |
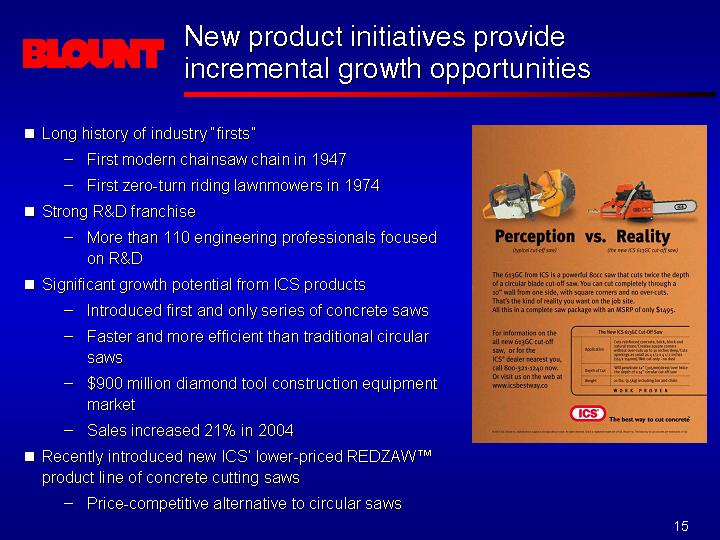
• | Significant growth potential from ICS products | [GRAPHIC] |
| • | Introduced first and only series of concrete saws | |
| • | Faster and more efficient than traditional circular saws | |
| • | $900 million diamond tool construction equipment market | |
| • | Sales increased 21% in 2004 | |
• | Recently introduced new ICS’ lower-priced REDZAW™ product line of concrete cutting saws | |
| • | Price-competitive alternative to circular saws | |
15
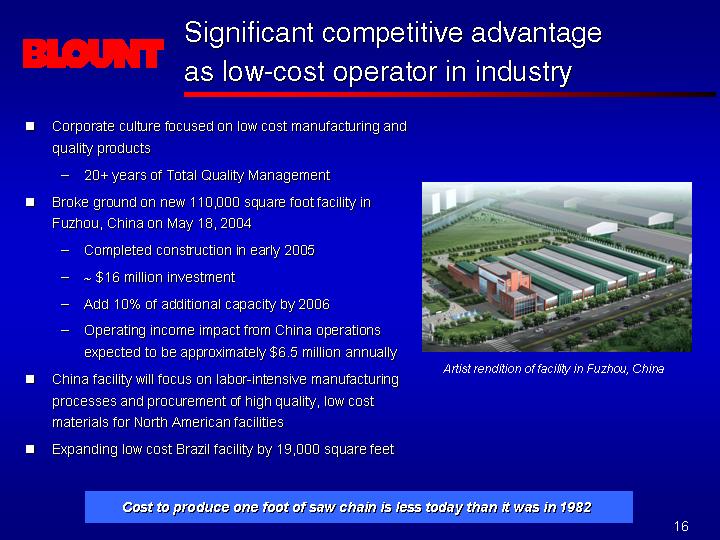
Significant competitive advantage as low-cost operator in industry
• | Corporate culture focused on low cost manufacturing and quality products | |
| • | 20+ years of Total Quality Management | |
• | Broke ground on new 110,000 square foot facility in Fuzhou, China on May 18, 2004 | |
| • | Completed construction in early 2005 | |
| • | ~ $16 million investment | [GRAPHIC] |
| • | Add 10% of additional capacity by 2006 | |
| • | Operating income impact from China operations expected to be approximately $6.5 million annually | Artist rendition of facility in Fuzhou, China |
• | China facility will focus on labor-intensive manufacturing processes and procurement of high quality, low cost materials for North American facilities | |
• | Expanding low cost Brazil facility by 19,000 square feet | |
Cost to produce one foot of saw chain is less today than it was in 1982
16
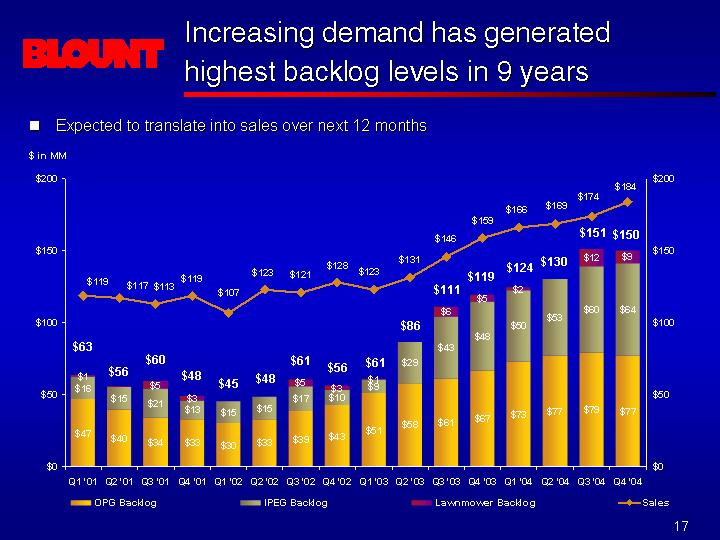
Increasing demand has generated highest backlog levels in 9 years
• Expected to translate into sales over next 12 months
[CHART]
17
Financial Overview
Financial Strategy
• | Continue to focus on delevering balance sheet |
| • | Utilize free cash flow to reduce debt |
| • | Potential non-core asset sales |
• | Steady revenue and EBITDA growth |
• | Continue to reduce costs and improve operating efficiencies |
| • | Start-up manufacturing facility in China |
| • | Leverage SAP ERP within Outdoor Products Group |
| • | Continued emphasis on TQM and lean manufacturing principles |
• | Invest in capital expenditures for capacity and productivity |
18
2004 Review
• | Top Line Growth |
| • | Strong revenue growth across all business segments |
| • | Consolidated revenue up 24% in 2004 |
| • | 2004 sales from CAT relationship ~ $45 million |
| • | Continued growth in IPEG International sales |
| | • | 11 international CAT distributors signed up to date; 9 more expected by mid ‘05 |
• | Improved Operating Margins |
| • | ~ 180 bps of consolidated EBITDA margin improvement in 2004 |
| • | Low cost Chinese facility being prepared for start-up in the first half of 2005 |
| • | Rising steel costs significantly offset by selling price increases |
• | Strengthened Balance Sheet |
| • | Significantly reduced leverage and interest costs in 2004 through August refinancing transactions |
| | • | Issuance of $138 million of primary equity |
| | • | Issuance of $175 million of 8 7/8% Senior Subordinated Notes |
| | • | Upsized bank loan to repay 13% Senior Subordinated Notes and 7% Senior Notes |
| • | Repriced term loan in December resulting in $1.8 million of annual interest expense savings |
Delivering Shareholder Value
19
Solid revenue growth over time
• Core OPG segment (61% of 2004 sales) has grown at 9.1% CAGR since 1999
[CHART]
Note: Pro forma for the sale of the Sporting Equipment Group in December 2001.
20
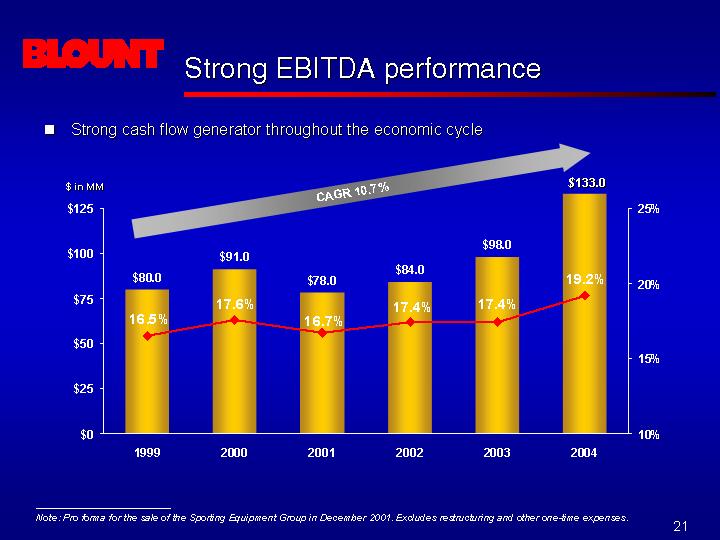
Strong EBITDA performance
• Strong cash flow generator throughout the economic cycle
[CHART]
Note: Pro forma for the sale of the Sporting Equipment Group in December 2001. Excludes restructuring and other one-time expenses.
21
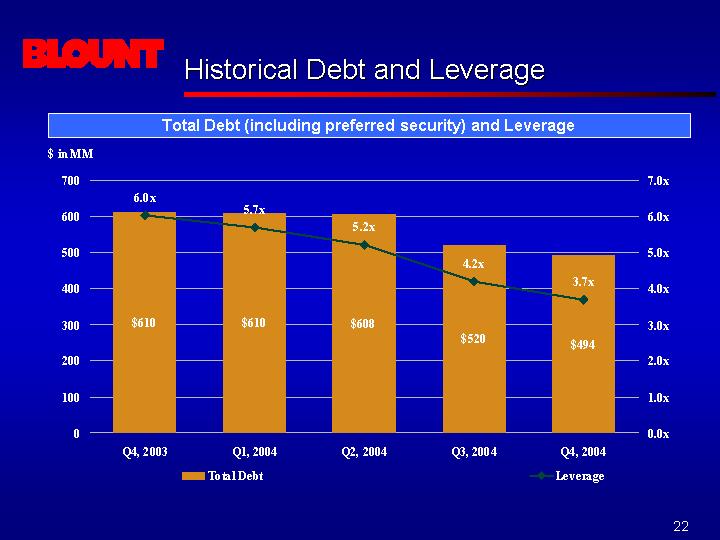
Historical Debt and Leverage
Total Debt (including preferred security) and Leverage
[CHART]
22
Management Goals
• | Over the past several years, Blount has been managed as a highly leveraged company |
| • | Focus on cashflows and debt service |
| • | Capital expenditures and acquisitions were restricted by bank covenants |
• | Given the turnaround in the Company’s end markets and the positive impact of the 2004 refinancing transactions, Management can now opportunistically focus on growing the business |
| • | Continued delevering of balance sheet |
| | • | Target credit statistics: < 3.0x Total Leverage |
| | • | Potential sale of non-core assets |
| • | Disciplined re-investment in the business |
| | • | Need for additional capacity |
| • | Bolt-on acquisitions, that would provide additional distribution channels, access to new markets and/or complementary products |
| | • | Opportunity to use equity as currency |
| • | Expand IPEG’s international market reach |
23
Guidance — Fiscal Year 2005
| | Guidance | | Commentary |
| | | | |
FY 2005E
Sales | | ~ $740 - $765 MM | | • | OPG expected to grow 6-8%, IPEG expected to grow 10-12%, and Lawnmower expected to grow 8-10% |
| | | | | |
FY 2005E | | ~ $121 - $125 MM | | • | 6-10% growth |
Operating Income | | | | • | Steel costs limiting profit growth |
| | | | | |
Cash Flow | | ~ $59 - $62 MM | | • | Capex investment of approximately $27 million; reduced debt with free cash flow |
24